Embed Size (px)
Citation preview
Air Traffic Management
Concept Baseline Definition
Prepared by
Boeing Commercial Airplane Group
NEXTOR Report # RR-97-3October 31, 1997
Aslaug Haraldsdottir, Principal Investigator
Monica S. Alcabin
Alvin H. Burgemeister
Charles G. Lindsey
Nigel J. Makins
Robert W. Schwab
Arek Shakarian
William D. Shontz
Marissa K. Singleton
Paul A. van Tulder
Anthony W. Warren
ii
Preface
This report documents research undertaken by the National Center of Excellence forAviation Operations Research, under Federal Aviation Administration Research GrantNumber 96-C-001. This document has not been reviewed by the Federal AviationAdministration (FAA). Any opinions expressed herein do not necessarily reflect those ofthe FAA or the U.S. Department of Transportation.
This document consists of the ATM Concept Baseline Definition, which incorporatesmaterial from the NAS Stakeholders Needs report prepared as a separate volume. TheNAS Stakeholders Needs report should be viewed as an adjunct to this volume, and isincluded as part of Boeing’s submission under NEXTOR Contract #DTFA03-97-00004,Subagreement #SA1636JB.
iii
Executive Summary
This report presents an operational concept for the U.S. National Airspace System (NAS)through the year 2015, including a transition path from the current system. This conceptwas developed by Boeing Commercial Airplane Group for NASA’s Advanced AirTransportation Technologies (AATT) program, under subcontract with NEXTOR(National Center of Excellence for Aviation Operations Research).
The operational concept presented here is aimed at driving research to support preliminarydesign decisions for the NAS, which will produce top level technical and human factorsrequirements to achieve the system mission. Detailed concept validation research mustthen be performed, where technology and human factors will be combined with economicevaluation of concept components to fully define the operational concept and architecture.Thus, the concept presented here, although well supported by rationale as to what mightbe feasible in the next two decades, must be subjected to critical analysis and validation.
A companion report presents the results of a survey of NAS stakeholder needs, conductedMay-August 1997, which details stakeholders’ concerns about terminal area capacity andaccess to airspace through 2015. Stakeholders also expressed the need to maintain orimprove safety in the NAS, and a need for increased emphasis on human factors research.
This report discusses the various factors that can force change in the NAS, and develops arationale for considering traffic growth as the primary driver for the ATM operationalconcept. The NAS mission goals are defined in terms of safety, capacity and efficiency,and a scenario is presented that predicts NAS traffic gridlock by 2006, where the terminalarea will be the primary choke point. If not averted, this will make current airline hubbingoperations infeasible, lead to escalation of operating costs and constrain economic growth.This scenario is used as the basis for the operational concept, and high density operationsare emphasized in the report.
Highlights of the concept evolution presented in this report are:
1. Airspace will be configured to support a certain density of operation, ranging fromhigh to low, through dynamic partitioning.
2. Access to airspace will be based on the required system performance for the airspaceoperation. A given aircraft will be qualified to a maximum Required SystemPerformance (RSP) level in which it can operate. RSP is developed by consideringATM-related safety through an analysis of collision risk for the overall separationassurance function.
3. A uniform CNS infrastructure performance is assumed to be provided throughout theNAS, except for Category II-III landing and surface operations.
4. High density separation services will be provided neither by procedural nor radarseparation, but by a new precision form of separation assurance. This will allowsystem throughput to be maximized where shared precision trajectory intent and auniversal time reference are assumed.
5. Low density separation services will be provided in other airspace, where user freedomto select and modify the flight trajectory is allowed.
iv
6. Separation responsibility will remain shared between air traffic services and flightcrews. In high density operations the airplane will provide a separation monitoringfunction.
The report discusses the human factors issues that lie at the heart of most of the proposedsystem modernization initiatives, and makes recommendations regarding the nature andextent of the human factors involvement in the system evolution. A detailed overview ofcurrent and emerging communication, navigation and surveillance technologies is includedin the report, along with an overview of aviation weather technology.
The current lack of consensus in the industry on the details of the NAS modernizationpath are discussed in the report. The need for a disciplined systems engineering approachto the NAS evolution is detailed, with a particular focus on preliminary design activity thatis essential to focus the effort on the critical mission needs. The report calls for acollaborative development and validation of the operational concept, and of the systemarchitecture, to ensure consideration of total system performance and minimize politicalrisk.
v
Table of Contents
1 Introduction..................................................................................................................1
1.1 Objectives..............................................................................................................1
1.2 Context..................................................................................................................2
1.3 Scope.....................................................................................................................2
1.4 Report Overview....................................................................................................3
2 The NAS ATM System Development Process...............................................................5
2.1 Air Traffic System Modernization Mandate............................................................5
2.2 Consensus Future System Development Needs.......................................................6
2.3 Systems Engineering and Preliminary Design..........................................................6
3 The ATM System Functional Structure.......................................................................26
3.1 Air Traffic Management Objectives......................................................................26
3.2 A Functional View of the Current Concept...........................................................28
3.3 A Functional View of the Proposed Concept........................................................35
3.4 Proposed CNS/ATM Technology Improvements..................................................42
3.5 Airspace and Airways...........................................................................................42
3.6 Airports ...............................................................................................................43
3.7 Flight Service Stations.........................................................................................44
4 Human Factors...........................................................................................................45
4.1 The Search For Greater Throughput And The Demands On The Human..............45
4.2 The Role Of Human Factors In Enabling Change.................................................45
4.3 Human Factors Issues Affecting Tactical Control.................................................48
5 Available and Emerging Technology...........................................................................55
5.1 Introduction.........................................................................................................55
5.2 Communication....................................................................................................65
5.3 Navigation...........................................................................................................75
5.4 Surveillance.........................................................................................................80
5.5 Aviation Weather.................................................................................................87
6 ATM Concept Baseline............................................................................................. 102
6.1 Concept Transition Methodology....................................................................... 102
6.2 Capacity Driven Concept Baseline...................................................................... 106
6.3 Concept Validation Needs.................................................................................. 114
vi
7 NAS Concept Evaluation.......................................................................................... 116
7.1 Global Scenarios................................................................................................ 116
7.2 Implications of Global Scenarios on System Transition Paths............................. 119
7.3 Comparison with the FAA and RTCA Operational Concepts.............................. 120
8 Conclusions and Recommendations........................................................................... 122
8.1 Conclusions....................................................................................................... 122
8.2 Recommendations.............................................................................................. 122
8.3 Research Needs to Support the 2015 Concept.................................................... 123
Acknowledgments....................................................................................................... 129
Bibliography................................................................................................................ 130
Appendix A. Technology Inventory............................................................................ 136
Appendix B. Global Scenario Issue Texts.................................................................... 149
Appendix C. Comparison of FAA 2005 and RTCA Users 2005 Operational Concepts 161
Appendix D. Transition Database................................................................................ 173
Appendix E. Constraints Model.................................................................................. 183
vii
List of Figures
2.1 System Development Process2.2 Requirements, Concepts, and Architecture2.3 World Airplane Capacity Requirements (1997-2016)2.4 User Needs Categories2.5 American Airlines NAS Study Validated with Actual Delay Data2.6 American Airlines NAS Study Results: Current NAS Delay Variance and Minutes2.7 American Airlines NAS Study Results: Average Air Delay per Flight2.8 Growth in Operations, Safety Rate & Frequency of Accidents (1980-2015)2.9 Hull Loss Accidents (1982-92) for U.S. and Canada vs. Latin America2.10 Primary System Agents2.11 System Performance and Separations2.12 The CAFT Analysis Process2.13 Distribution of Airport Delay by Weather and Duration2.14 Economic Modeling Process
3.1 The Air Traffic Management System3.2 Air Traffic Management System Functional Structure3.3 AOC and The Flight Planning Function3.4 CFMU and the Flow Planning Function3.5 Cockpit Crew and the Guidance and Navigation Function3.6 The Separation Assurance Loop3.7 Separation Standard and Performance Factors3.8 Dense Terminal Airspace and CNS/ATM Technologies3.9 Overview of Proposed CNS/ATM Technologies
5.1 Generic System Configuration for the Exchange of Air/Ground Information5.2 Voice Communication5.3 ACARS Communication5.4 FANS-1 Communication5.5 ATN Communication5.6 Interfacility Communication5.7 Navigation Functionality Overview5.8 Area Navigation Capabilities for Departure Procedures5.9 Reduced Separation Between Parallel Ocean Tracks5.10 Airport Surface Surveillance Evolution Path5.11 Terminal Area Surveillance Evolution Path5.12 En Route Surveillance Evolution Path5.13 Oceanic/Remote Area Surveillance Evolution Path5.14 Functional Areas of Aviation Weather5.15 Aviation Weather Observation Function5.16 Aviation Weather Analysis Function5.17 Aviation Weather Forecasting Function
viii
5.18 Aviation Weather Dissemination Function
6.1 Airspace Operating Phases6.2 Capacity and Efficiency as a Function of Airspace Operating Phases6.3 Final Approach Throughput Performance Factors6.4 CNS/ATM Transition Logic Diagram Template6.5 CNS/ATM Transition Logic for Flow Management6.6 CNS/ATM Transition Logic for En Route and Terminal Area6.7 CNS/ATM Transition Logic for the Arrival Transition Phase6.8 CNS/ATM Transition for the Final Approach and Initial Departure Phase6.9 CNS/ATM Transition for the Airport Surface
8.1 Preliminary Design Tools

ix
AcronymsAAS Advanced Automation SystemAATT Advanced Air Transportation TechnologyACARS ARINC Communications Addressing and Reporting SystemACP Actual Communication PerformanceADF Airline Dispatchers FederationADF Automated Direction FinderADS Automatic Dependent SurveillanceADS-B Automatic Dependent Surveillance-BroadcastAEEC Airlines Electronic Engineering CommitteeAERA Automated En Route ATCAFN ATS Facilities NotificationAFTN Aeronautical Fixed Telecommunication NetworkAGFS Aviation Gridded Forecast SystemAGL Above Ground LevelAIDC ATS Interfacility Data CommunicationAIV Aviation Impact VariablesALPA Air Line Pilots AssociationAMASS Airport Movement Area Safety SystemAMSS Aeronautical Mobile Satellite SystemANP Actual Navigation PerformanceAOC Airline Operational ControlAOPA Aircraft Owners and Pilots AssociationARSR Air Route Surveillance RadarARTCC Air Route Traffic Control CenterASAS Airborne Separation Assurance SystemsASDE Airport Surface Detection EquipmentASOS Automated Surface Observation SystemASR Airport Surveillance RadarATA Air Transport AssociationATC Air Traffic ControlATIS Automated Terminal Information SystemATM Air Traffic ManagementATN Aeronautical Telecommunication NetworkATS Air Transportation SystemATS Air Traffic ServicesATSMHS ATS Message Handling ServiceAVOSS Aviation Vortex Spacing SystemAWC Aviation Weather CenterAWIPS Advanced Weather Information Processing SystemsAWOS Automated Weather Observation SystemAWR Aviation Weather ResearchCAFT CNS/ATM Focused TeamCDM Collaborative Decision MakingCDTI Cockpit Display of Traffic Information
x
CDTW Cockpit Display of Traffic and Weather InformationCFIT Controlled Flight Into TerrainCFMU Central Flow Management UnitCMA Context Management ApplicationCNS Communication Navigation SurveillanceCONUS Continental United StatesCPC Controller/Pilot CommunicationsCPDLC Controller-Pilot Data Link CommunicationCSMA Collision Sense Multiple AccessCTAS Center-TRACON Automation SystemCWSU Center Weather Service UnitDGPS Differential Global Positioning SystemDH Decision HeightDME Distance Measuring EquipmentDOD Department of DefenseDOT Department of TransportationDSR Display System ReplacementEATCHIP European Air Traffic Control Harmonization and Integration
ProgrammeEATMS European Air Traffic Management SystemEGPWS Enhanced Ground Proximity Warning SystemETMS Enhanced Traffic Management SystemFAA Federal Aviation AdministrationFANS Future Air Navigation SystemFIR Flight Information RegionFMC Flight Management ComputerFMS Flight Management SystemFSL Forecast Systems Laboratory (NOAA)FSS Flight Service StationsGA General AviationGAMA General Aviation Manufacturers AssociationGDP Gross Domestic ProductGLS GPS Landing SystemGNSS Global Navigation Satellite SystemGPS Global Positioning SystemGPWS Ground Proximity Warning SystemHAI Helicopter Association InternationalIATA International Air Transport AssociationICAO International Civil Aviation OrganizationICP Installed Communication PerformanceIFR Instrument Flight RulesILS Instrument Landing SystemIMC Instrument Meteorological ConditionsIRS Inertial Reference SystemITWS Integrated Terminal Weather System
xi
KIAS Knots Indicated Air SpeedLAAS Local Area Augmentation SystemLAHSO Land and Hold Short OperationsLLWAS Low Level Wind Shear Avoidance SystemMAC Medium Access ControlMCP Mode Control PanelMDCRS Meteorological Data Collection and Reporting SystemMLS Microwave Landing SystemMMR Multi-Mode ReceiverMNPS Minimum Navigation Performance StandardMSAW Minimum Safe Altitude WarningMU Management UnitNADIN National Airspace Data Interchange NetworkNAS National Airspace SystemNASA National Aeronautics and Space AdministrationNATCA National Air Traffic Controllers AssociationNBAA National Business Aviation AssociationNCAR National Center for Atmospheric ResearchNCARC National Civil Aviation Review CommissionNCEP National Center for Environmental PredictionNDB Non-Directional BeaconNEXTOR National Center of Excellence for Aviation Operations ResearchNOAA National Oceanic and Atmospheric AdministrationNOTAM Notice to AirmenNRP National Route ProgramNWP Numerical Weather PredictionNWS National Weather ServiceOAG Official Airline GuideODAPS Oceanic Display and Planning SystemPDT Product Development Team (FAA)PRM Precision Runway MonitorPTT Push-To-TalkRAA Regional Airline AssociationRASS Radio Acoustic Sounding SystemsRCP Required Communication PerformanceRESCOMS Regional Scale Combined Observation and Modeling SystemsRGCSP Required General Concept of Separation Panel (ICAO)RMP Required Monitoring PerformanceRNAV Area NavigationRNP Required Navigation PerformanceRPM Revenue Passenger MilesRSP Required System PerformanceRTA Required Time of ArrivalRUC Rapid Update CycleRVR Runway Visual Range
xii
RVSM Reduced Vertical Separation MinimaRWP Radar Wind ProfilersSATCOM Satellite CommunicationsSELCAL Selective CallingSIDS Standard Instrument DeparturesSSR Secondary Surveillance RadarSTARS Standard Approach ProceduresSTARS Standard Terminal Replacement SystemSUA Special Use AirspaceTACAN Tactical Air NavigationTCAS Traffic Alert and Collision Avoidance SystemTDWR Terminal Doppler Weather RadarTIS Traffic Information ServicesTMA Terminal Maneuvering AreaTMU Traffic Management UnitTRACON Terminal Radar Approach ControlTWDL Two-Way Data LinkTWEB Transcribed Weather BroadcastVDR VHF Data RadioVHF Very High FrequencyVMC Visual Meteorological ConditionsVOR Very High Frequency Omnidirectional RangeWAAS Wide Area Augmentation SystemWARP Weather and Radar ProcessorWPDN Wind Profiler Demonstration Network
1
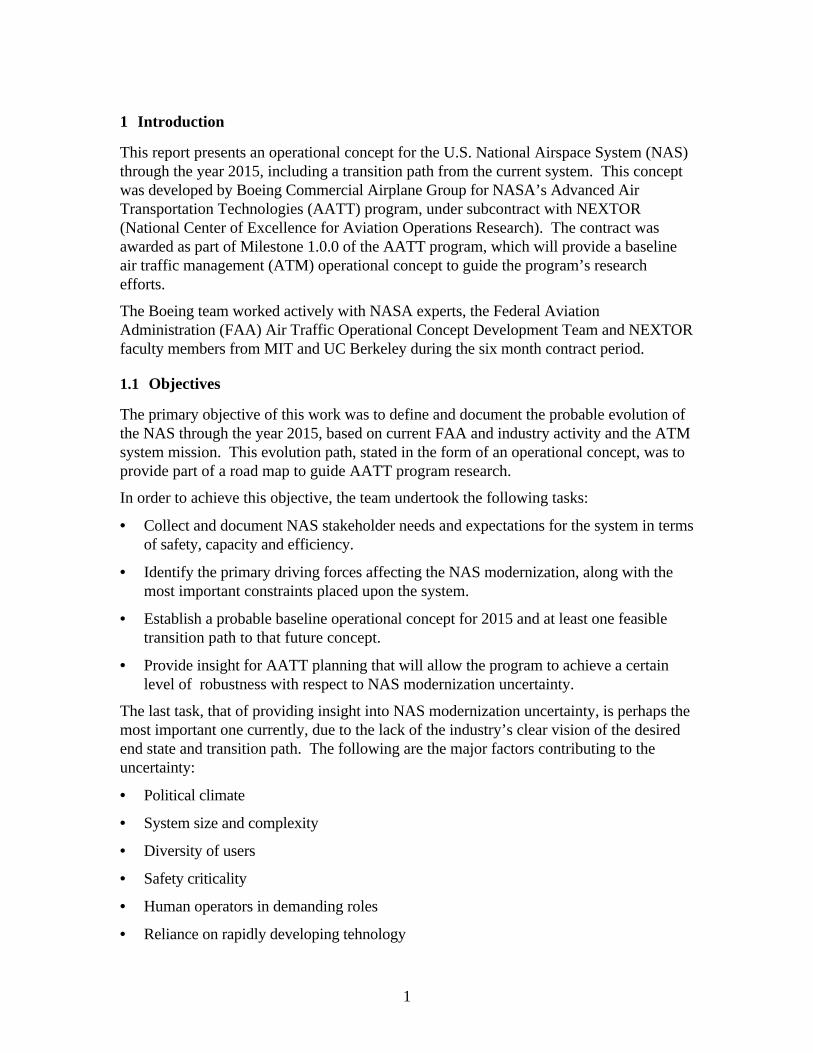
1 Introduction
This report presents an operational concept for the U.S. National Airspace System (NAS)through the year 2015, including a transition path from the current system. This conceptwas developed by Boeing Commercial Airplane Group for NASA’s Advanced AirTransportation Technologies (AATT) program, under subcontract with NEXTOR(National Center of Excellence for Aviation Operations Research). The contract wasawarded as part of Milestone 1.0.0 of the AATT program, which will provide a baselineair traffic management (ATM) operational concept to guide the program’s researchefforts.
The Boeing team worked actively with NASA experts, the Federal AviationAdministration (FAA) Air Traffic Operational Concept Development Team and NEXTORfaculty members from MIT and UC Berkeley during the six month contract period.
1.1 Objectives
The primary objective of this work was to define and document the probable evolution ofthe NAS through the year 2015, based on current FAA and industry activity and the ATMsystem mission. This evolution path, stated in the form of an operational concept, was toprovide part of a road map to guide AATT program research.
In order to achieve this objective, the team undertook the following tasks:
• Collect and document NAS stakeholder needs and expectations for the system in termsof safety, capacity and efficiency.
• Identify the primary driving forces affecting the NAS modernization, along with themost important constraints placed upon the system.
• Establish a probable baseline operational concept for 2015 and at least one feasibletransition path to that future concept.
• Provide insight for AATT planning that will allow the program to achieve a certainlevel of robustness with respect to NAS modernization uncertainty.
The last task, that of providing insight into NAS modernization uncertainty, is perhaps themost important one currently, due to the lack of the industry’s clear vision of the desiredend state and transition path. The following are the major factors contributing to theuncertainty:
• Political climate
• System size and complexity
• Diversity of users
• Safety criticality
• Human operators in demanding roles
• Reliance on rapidly developing tehnology
2
To cope with this uncertainty, the modernization must continue to be driven by a clearstatement of system mission and goals, and guided by an operational concept that strivesto achieve those goals.
1.2 Context
This work was performed with knowledge of a variety of related completed or ongoingefforts. The primary related activities were the following:
• FAA Air Traffic Operational Concept Definition team, formed in January 1997, andchartered with defining a concept for a target completion date of 2005.
• RTCA Task Force 3, whose Free Flight Report, published in 1995, along withongoing RTCA Free Flight follow-on work, includes the recent definition of anoperational concept for users of the NAS.
• FAA NAS Architecture Working Group had published Version 1.5 and 2.0 of thearchitecture through 2012 when the team started work, and industry comments on ithad been published as V2.5. Some preliminary data on V3.0 was made available to theteam, but considerable uncertainty still remains.
• The Flight 2000 initiative was launched in early 1997, and the team kept up-to-date onthe program as much as possible. Again, uncertainty remains regarding programfunding and details of the final program plan.
• Eurocontrol had published its European Air Traffic Management System (EATMS)Operational Concept V1.0, and the team had a number of other sources of informationavailable to keep abreast of developments in Europe. The pending changes in theEurocontrol charter seem likely to lead to an increased emphasis within theorganization on capacity issues in Europe’s terminal areas, and thus the U.S. andEuropean ATM concepts may see more convergence in the near future.
During this period the FAA budget constraints have continued to hamper the architecturedefinition efforts. This, along with substantial difficulties in FAA’s recent systemdevelopment and procurement efforts produce considerable volatility in the NASmodernization plan. Some of these difficulties can be traced to a lack of a clear businesscase for most of the current modernization initiatives, and a lack of consensus amongusers on many of the implementation details.
1.3 Scope
The operational concept presented here is aimed at driving research to support preliminarydesign decisions for the NAS, which will produce top level technical and human factorsrequirements to achieve the system mission. Detailed concept validation research mustthen be performed, where technology and human factors are combined with economicevaluation of concept components to fully define the operational concept and architecture.Thus, the concept presented here, although well supported by rationale as to what mightbe feasible in the next two decades, must be subjected to critical analysis and validation.This process will inevitably lead to concept refinement, perhaps enabled by currently
3
unknown technology, and thus the concept will evolve to continue to reflect the currentstate and the system mission.
This operational concept is for the Continental U.S. (CONUS) and the adjacent oceanicareas, with primary focus on the domestic radar environment where NASA’s researchefforts are concentrated. The focus is on services and functions directly involved withplanning and operating flights in the CONUS. System components such as the airportground side, airway facilities operation and airline operations are not treated in any detail.These are equally important to the operation of the total system, and must be consideredin their own right along with the ATM operational concept.
1.4 Report Overview
A capacity-driven operational concept developed by the team is summarized in Section6.2, with supporting detail on improvements needed in the various ATM functionspresented in Sections 3.3 and 3.4. An operational concept must be clearly driven by statedmission goals, and Section 2 presents the predicted traffic growth scenario that the teamchose as the primary driver for change in this operational concept.
Section 2 also discusses the current lack of consensus in the industry on the details of theNAS modernization path. Section 2.3 addresses the need for a disciplined systemsengineering approach to the NAS modernization, and in particular the current lack ofpreliminary design activity that is required to focus the effort on achieving the criticalmission needs.
Section 3 presents a view of the functional structure of the ATM system as it exists today,and the fundamental system objectives of capacity, safety and efficiency. The primarysystem functions are presented in the context of these objectives, using a representationthat illustrates the levels of flow planning in the system and of plan execution throughseparation assurance and navigation. Section 3.3 and 3.4 discuss the improvements thatthe team believes are needed in the system to achieve the capacity and safety objectivesstated in Section 2, with primary focus on the separation assurance function.
Sections 4 and 5 present the human factors issues and the technology performanceparameters that must be taken into account throughout the system development process.The concept presented here is aimed at safely increasing traffic density in the system, andthis will have a substantial impact on the separation assurance function, where safety ismaintained and where human operator performance is a key issue. Section 4 discusses thehuman factors issues in some detail, and Section 5 follows with an overview of the currentand emerging technologies available to support the concept.
Section 6 discusses the methodology that the team employed in synthesizing theoperational concept, which is then presented in the form of transition paths for the variousoperating phases in Section 6.2. Each step in the transition path is described briefly torelate technology to a proposed operational improvement. Section 6.3 details the conceptvalidation process that is needed to ensure that a concept fulfills the mission requirementsand to drive successful system design, build and installation.
4
Section 7 contains a discussion of various global scenarios that can affect the future NASoperational concept, and the potential implications on the system transition path. Inaddition, Section 7.3 gives a brief summary of how this operational concept compareswith the concepts developed by the FAA and RTCA earlier this year, with more detailpresented in Appendix C.
Conclusions and recommendations are presented in Section 8, including some fundamentalresearch directions the team believes must be addressed for an operational concept thatsatisfies the system mission through 2015.
The survey of NAS stakeholder needs that was conducted as part of this effort ispresented in a separate document. A summary of the findings of the stakeholder survey ispresented in Section 2, along with additional material that supports the stakeholders’general concern about traffic growth and the ability to operate efficiently in the NASthrough 2015.
5
2 The NAS ATM System Development Process
This section establishes the context for the development of an operational concept andfuture system architecture to achieve the long-range needs of the air transportationsystem. The argument advanced in this section is that the industry needs to move fromhistoric, reactive approaches to system modernization, and to begin the systematicdevelopment of a new NAS system using the principles of systems engineering. Theindustry needs to focus on the systems analysis or preliminary design phase of a systemdevelopment to exercise broad trade studies, to examine new concepts of operation inresponse to critical air transportation mission needs, to derive technical performancerequirements and evaluate human performance abilities in support of mission needs, and toprovide analysis tools for evaluating economic consequences of alternative transition pathsinto the future.
2.1 Air Traffic System Modernization Mandate
Increasingly, the industry is faced with a sense of urgency regarding the modernization ofthe air traffic control (ATC) system. The age of systems such as ARTS make it difficult tocontinue to acquire spare parts, while the personnel qualified to maintain these old systemsare retiring. At the same time, there is a lack of a mandate for change. The diverseinterests of the FAA’s users makes a consensus regarding the future needs of the systemdifficult. Michael S. Nolan (Nolan, 1994) describes the genesis of Project Beacon: “Itwas apparent that the air traffic control system in the United States had been constructedhaphazardly in response to situations instead of in anticipation of them.” This statementcharacterizes the state of system development as well today as in 1961.
The most recent systematic attempt at system modernization was the NAS Plan of 1981(U.S. FAA, 1981). The initiative of FAA’s administrator J. Lynn Helms planned asystematic upgrading of the navigation, communication, surveillance, weather and ATCinfrastructure. The driving premise for this modernization, and the economic justification,was based on the concept of remote maintenance, which would sharply reduce O&Mcosts. Unfortunately, many of the key elements of the NAS Plan failed to come tofruition. The microwave landing system (MLS) program, the Mode S data link, theAdvanced Automation System, the Oceanic Display and Planning System (ODAPS), allended in failure to achieve full operational usefulness. Where improvements wererealized, they were often less than completely successful. En route computers wereupgraded, but with no new software.
Today the FAA F&E organization is developing a new system architecture. The hope isthat this architecture will become the blueprint for modernization. But while there is muchdefinition of technology features of the new architecture, there is a lack of agreementabout the fundamental measures of what will constitute a successful air trafficinfrastructure, both for the near-term and twenty years into the future, across the range ofdiverse user needs.

6
2.2 Consensus Future System Development Needs
The FAA’s R,E&D Advisory Committee met in Washington in September (U.S. FAA,1997) to recommend research needs for the FAA to facilitate system modernization. Highpriority recommendations centered on the need for improved system developmentmethods with emphasis on systems engineering, software engineering and human factors.Other issues which received numerous citations included programmatic and managementconcerns, emphasis on information technologies, need to provide enhanced levels ofsystem capacity, safety and security. Finally, the group agreed that a key priority is theneed for credible investment analysis. The systems engineering, software engineering andhuman factors issues form the core of the discussion on system modernization, whichprovides the framework for the following discussions on concept of operations, humanfactors and technology assessment, and transition planning and system alternativesevaluation. These preliminary design activities are key to the establishment of a systemarchitecture and the associated research needs, which supports the needed airtransportation needs of capacity, safety and efficiency of operation for the next twentyyears.
Another issue central to the discussions of the R,E&D Advisory Committee was the lackof a mandate for system modernization. The airlines, military, general aviation (GA) andbusiness segment of the industry often disagree on specific technology decisions, as wellas policy issues. The concern is that the industry lacks agreement on the high levelobjectives of system modernization and the mission needs of the system, which shoulddrive the technical requirements, concept of operation and system architecture. Theapproach identified in this section focuses on the preliminary design phase of the systemdevelopment life cycle, and the need to clearly identify the long range mission needs of thesystem. It also examines tools and methods to allocate requirements to subsystems, assignfunctions to system agents and evaluate the performance objectives over the twenty yearlife of the system.
2.3 Systems Engineering and Preliminary Design
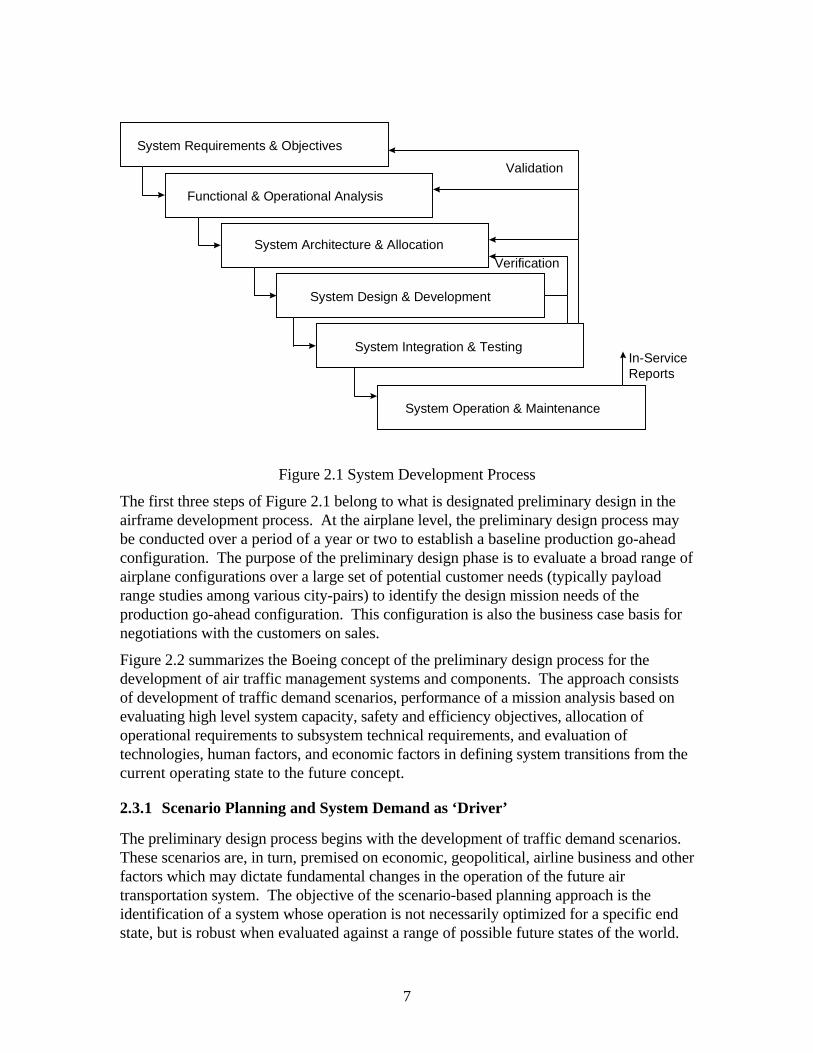
Figure 2.1 summarizes the system engineering steps which divide the life cycle of a majorsystem development into phases: definition of requirements and objectives, analysis offunctions and operations, definition of system architecture, design of the system andsubsystem elements, production of the system elements, integration of the system in thelaboratory of integration and validation testing, certification, and system operation andmaintenance. The discipline of the systems engineering process is vital to the successfulcompletion of an airplane development program, where a large team of thousands ofengineers must work a complex, real-time, human-in-the-loop, safety critical systemdevelopment to produce and certify a system integrating subsystems containing hundredsof thousands of line of code and a system architecture of data busses linking hundreds of‘Line Replaceable Units’ of differing criticality. The development of a major ATC systemupgrade may be an order of magnitude more complex, because it shares the safetycriticality and human-in-the-loop real-time nature of the airplane development, and furtherrequires that the existing system remain operational while supporting transition to the newsystem.
7
System Requirements & Objectives
Functional & Operational Analysis
System Architecture & Allocation
System Design & Development
System Integration & Testing
System Operation & Maintenance
Validation
Verification
In-ServiceReports
Figure 2.1 System Development Process
The first three steps of Figure 2.1 belong to what is designated preliminary design in theairframe development process. At the airplane level, the preliminary design process maybe conducted over a period of a year or two to establish a baseline production go-aheadconfiguration. The purpose of the preliminary design phase is to evaluate a broad range ofairplane configurations over a large set of potential customer needs (typically payloadrange studies among various city-pairs) to identify the design mission needs of theproduction go-ahead configuration. This configuration is also the business case basis fornegotiations with the customers on sales.
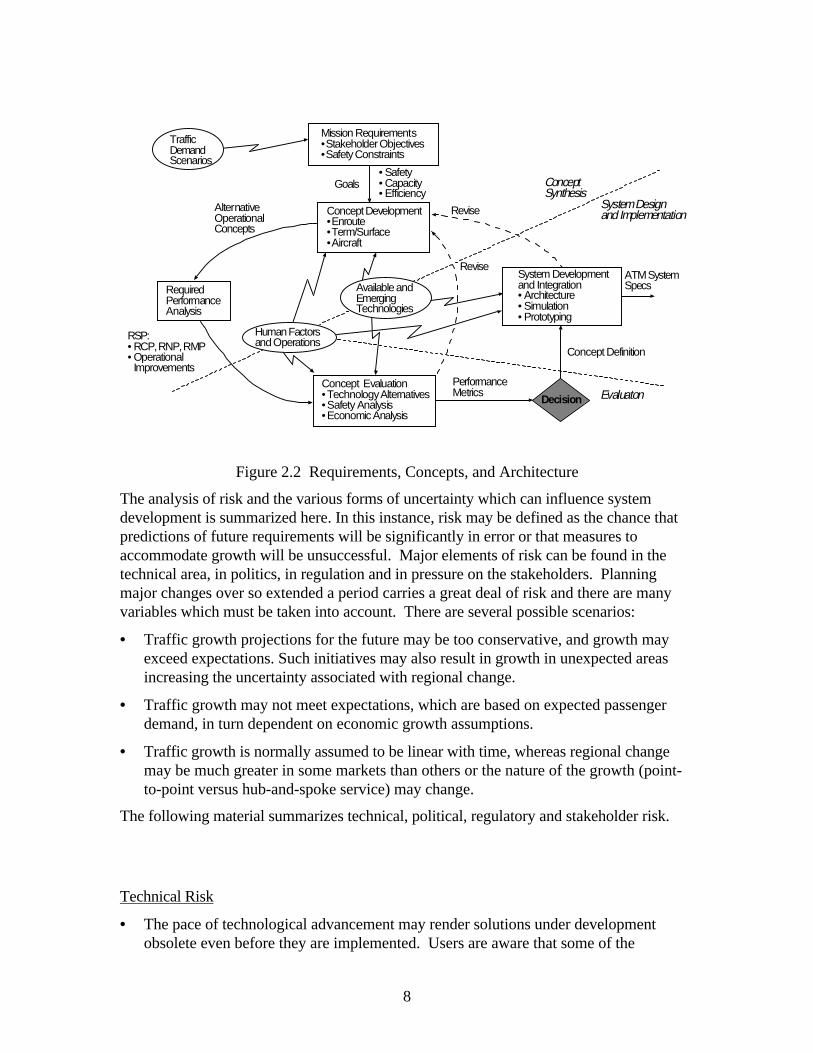
Figure 2.2 summarizes the Boeing concept of the preliminary design process for thedevelopment of air traffic management systems and components. The approach consistsof development of traffic demand scenarios, performance of a mission analysis based onevaluating high level system capacity, safety and efficiency objectives, allocation ofoperational requirements to subsystem technical requirements, and evaluation oftechnologies, human factors, and economic factors in defining system transitions from thecurrent operating state to the future concept.
2.3.1 Scenario Planning and System Demand as ‘Driver’
The preliminary design process begins with the development of traffic demand scenarios.These scenarios are, in turn, premised on economic, geopolitical, airline business and otherfactors which may dictate fundamental changes in the operation of the future airtransportation system. The objective of the scenario-based planning approach is theidentification of a system whose operation is not necessarily optimized for a specific endstate, but is robust when evaluated against a range of possible future states of the world.
8
Available andEmergingTechnologies
Decision
System Developmentand Integration• Architecture• Simulation• Prototyping
Concept Evaluation•Technology Alternatives•Safety Analysis•Economic Analysis
RequiredPerformanceAnalysis
Concept Development•Enroute•Term/Surface•Aircraft
Mission Requirements•Stakeholder Objectives•Safety Constraints
TrafficDemandScenarios
Human Factorsand Operations
• Safety• Capacity• Efficiency
Goals
AlternativeOperationalConcepts
RSP:• RCP, RNP, RMP• OperationalImprovements
PerformanceMetrics
Revise
ReviseATM SystemSpecs
Concept Definition
ConceptSynthesis
Evaluaton
System Designand Implementation
Figure 2.2 Requirements, Concepts, and Architecture
The analysis of risk and the various forms of uncertainty which can influence systemdevelopment is summarized here. In this instance, risk may be defined as the chance thatpredictions of future requirements will be significantly in error or that measures toaccommodate growth will be unsuccessful. Major elements of risk can be found in thetechnical area, in politics, in regulation and in pressure on the stakeholders. Planningmajor changes over so extended a period carries a great deal of risk and there are manyvariables which must be taken into account. There are several possible scenarios:
• Traffic growth projections for the future may be too conservative, and growth mayexceed expectations. Such initiatives may also result in growth in unexpected areasincreasing the uncertainty associated with regional change.
• Traffic growth may not meet expectations, which are based on expected passengerdemand, in turn dependent on economic growth assumptions.
• Traffic growth is normally assumed to be linear with time, whereas regional changemay be much greater in some markets than others or the nature of the growth (point-to-point versus hub-and-spoke service) may change.
The following material summarizes technical, political, regulatory and stakeholder risk.
Technical Risk
• The pace of technological advancement may render solutions under developmentobsolete even before they are implemented. Users are aware that some of the

9
technologies needed for initial transition steps may need to be replaced or augmentedif expected air transportation system (ATS) changes are to occur later, and benefits areto be realized. Users may delay implementation of enhancements, allowing delays togrow, in turn reducing demand.
• Future operational concepts rely on the benefits (ultimately financial) to be realizedthrough the use of technological and procedural changes, many of which are currentlytheoretical. Some of these postulated solutions may be shown to be impractical oreven impossible.
• The technological and operational solutions may work but expected benefitsmay not be realized.
• The solutions may be too costly, resulting in failure to achieve the critical massof users.
• It may prove to be impossible to make technological advances which meet thediverse requirements of users and regulators.
• The global aviation community may find it impossible to arrive at commontechnological and operational solutions resulting in excessive cost of fullimplementation.
• System and operating standards are developed, to a large degree, by volunteer bodieswhich meet only on an occasional basis. Such an approach results in slowdevelopment of standards and consequent delays in development of hardware,software and procedures.
• Telecommunications developments like video conferencing could find higheracceptance as alternatives to business travel, traditionally a source of high profits forairlines. Business aviation radio bands might also be taken over bytelecommunications interests.
Political Risk
• Sub-regional implementations of Future Air Navigation System (FANS) (e.g.FANSTAR) could spur the industry into a more aggressive approach to the transitionprocess.
• Restricted funding of Civil Aviation Authority or privatized service provider programsmight delay the airlines’ ability to realize benefits from new technologies, which wouldresult in increased delays and less growth.
• The funding of ground infrastructure improvement might be delayed or acceleratedchanging the economic benefit picture for users.
• The trend toward charging system users more directly for services will change airlineprofitability pictures and/or increase ticket prices or even discourage general aviationproliferation.
10
• National or international conflict discourages discretionary travel. Regions in whichmaximum traffic growth are expected (CIS, China, Africa) are the most volatilepolitically and thus more vulnerable to the effects of unrest.
• Changes in diplomatic relations between or among countries may accelerate or delayimplementation of more efficient routes.
• Ratification of bilateral agreements (or failure to ratify) may affect internationalfrequencies.
• Different technological or procedural solutions may be adopted by different countriesor blocs, resulting in escalated cost of compliance.
Regulatory Risk
• Communities located under flight paths or close to busy airports may take legal actionto block improvements to airports.
• New concepts of operations must be developed and accepted by regulatory agenciesbefore new technologies and operational procedures can be developed.
• Certification periods might be further stretched by unresponsive regulatory authorities,increasing costs and rendering solutions obsolete before implementation.
Stakeholder Risk
• It has been widely publicized that by the year 2015, if air transport safety standardscannot be improved there will be one hull loss globally per week. The perception ofworsening safety may mean that passengers will be less eager to fly.
• If system capacity cannot keep pace with demand, resulting delays may also reducepassenger demand.
• Labor action is likely to have only negative effects since it usually results in increasedairline costs and diminishes the traveling public’s confidence in the system.
• Oil prices directly and significantly affect airline costs and fluctuations in the pricesbeyond those expected could affect growth. Airlines could absorb increases, reducingprofits and thus delaying investment in technology, and/or increases could be passedon to passengers through increased ticket prices, reducing demand. Reduced pricescould also be passed on to passengers, increasing demand.
• Political unrest and forms of fundamentalism have been carried to the more stableareas of the world in the form of terrorism. The threat of terrorist action against theair transportation system (e.g. the recent revelation that GPS jammers are nowavailable on the open market), successful attacks or even suspicions that an attack hasoccurred (e.g. TWA Flight 800) have an immediate effect on passenger demand whichcan affect airline finances for years afterward.
• All users want to invest the minimum possible, at no risk, with a return on investment,within one to two years. It may not be possible to develop transitional steps whichallow these aims to be met.
11
• The goals of various users are so diverse that it may prove to be impossible to reachequitable solutions, resulting in dilution of benefits.
• Airlines may block improvements for competitive reasons.
Scenarios for evaluation of the mission must exercise as many of the key risk areas aspossible. Also, the transition evaluation process must address risk as a key element in theevaluation of system alternatives.
The development of a comprehensive set of future scenarios is beyond the scope of thecurrent contract activity, but this report presents an initial list of issues from which globalscenarios for evaluation can be synthesized. These scenario factors are summarized inAppendix B, Global Scenarios. From various government, industry, and privatedocumented studies, a sample or collage of texts was assembled from which a single worldscenario was constructed. In particular, this subtask broaches a range of general ATMissues, although by no means exhaustive, which highlight potential limitations, costs,constraints, and assumptions which may be of importance to the modus operandi of theenvisioned NAS future. To help the development of such a global scenario, six generalcategories were used:
1. Economics/Markets (E),
2. Organizational/Institutional/Operational (O),
3. Technological/Scientific (T),
4. Social/Political (S),
5. Environmental (ENV), and
6. Human-centered/System-centered (H).
A brief description of each broad category follows:
Economics/Markets (E)
This category reviews the best estimates and forecasts for future air traffic growth anddemand figures including a few corresponding issues associated with increased air traffic.
Organizational/Institutional/Operational (O)
Under this category a select sample of issues such as workload, organizational structureand culture, and operational considerations were collated.
Technological/Scientific (T)
The increasingly technoscientific NAS operational infrastructure introduces a number ofpotential pitfalls as well as promises. Issues related to widely utilized computer andinformation technology-based support and automation are captured by this category.
Social/Political (S)
In a growing global context of air traffic flows, this category aims to present some of thepotential political and social issues which may impact future operations.
12
Environmental (ENV)
This category focuses on possible constraints stemming from tougher future environmentalregulations.
Human-centered/System-centered (A)
The human/system related issues such as human-centered ATM design and structure arepresented under this category.
The above broad categories support a more specific issues list, itself composed of acollage of texts drawn from the various documented sources. This helps to structure thetop level issues in meaningful sets of issues which inform the scenario writing process. Itshould be noted that the list below is structured and generally ordered beginning at the topwith the broader, more external issues first (e.g. environmental, changing internationalrelationships, et. al.) following with more internal issues towards the bottom(e.g. airportcapacity, FAA organizational culture and workforce et. al.). This helps to continuouslycontextualize the many interrelated issues considered in this scenario. The 13 globalscenario issues are:
Issue # 1: Air traffic growth and demand: twenty year outlook
Issue # 2 : Some limitations of future ATM concepts
Issue # 3: Changing international relationships
Issue # 4: FAA funding reform
Issue # 5: Environmental considerations
Issue # 6: Air travel and alternatives
Issue # 7: GPS and satellite-based navigation
Issue # 8: ATC systems architecture
Issue # 9: Ground handling
Issue # 10: Airport capacity
Issue # 11: Management of special use airspace
Issue # 12: Airport safety
Issue # 13: FAA organizational culture and workforce
Section 7.1 presents the single global scenario and Appendix B contains the above issueslist as well as the referenced texts from which the scenario was constructed.
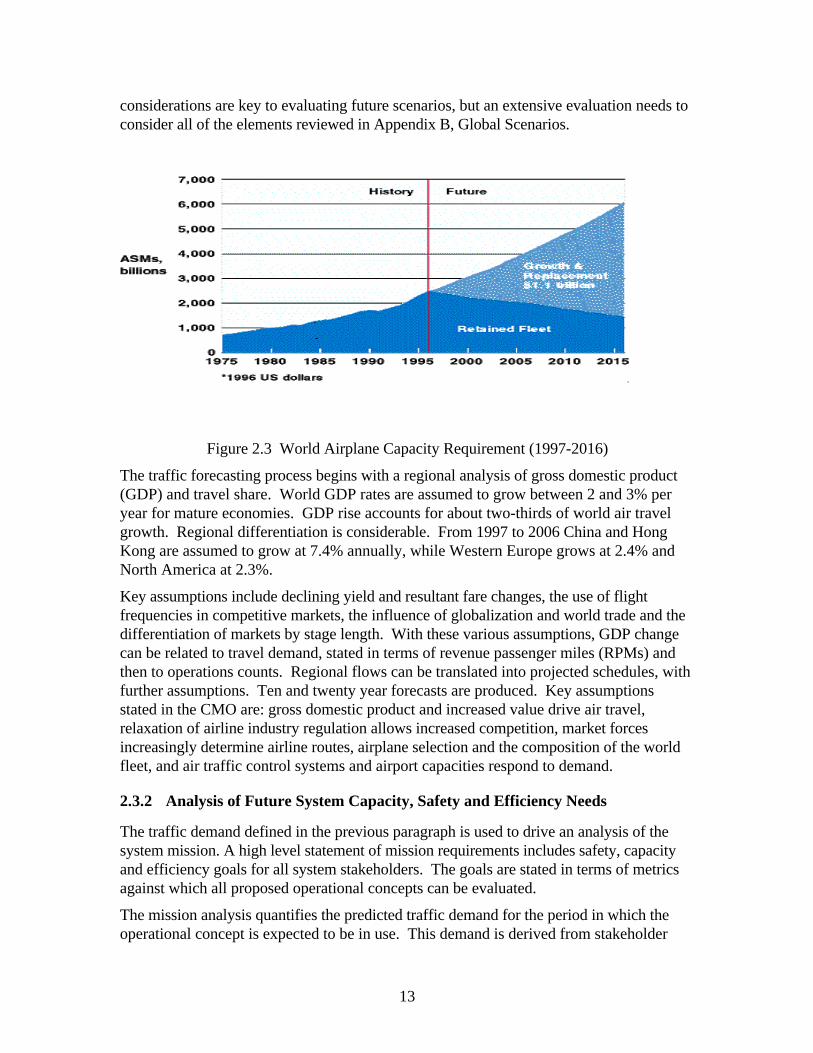
The approach in this section identifies traffic demand as the single most critical ‘driver’ offuture air traffic system needs. The approach relates the future capacity, safety andefficiency needs of the system to assumed traffic growth. The Boeing Current MarketOutlook (Boeing, 1997) summarizes the expected growth in air transport to the year2015 (Figure 2.3). The balance of this section focuses on economic issues and theirimpact on the demand scenarios for evaluation. The CMO indicates that about two-thirdsof world air travel growth is derived from economic growth. Thus economic
13
considerations are key to evaluating future scenarios, but an extensive evaluation needs toconsider all of the elements reviewed in Appendix B, Global Scenarios.
Figure 2.3 World Airplane Capacity Requirement (1997-2016)
The traffic forecasting process begins with a regional analysis of gross domestic product(GDP) and travel share. World GDP rates are assumed to grow between 2 and 3% peryear for mature economies. GDP rise accounts for about two-thirds of world air travelgrowth. Regional differentiation is considerable. From 1997 to 2006 China and HongKong are assumed to grow at 7.4% annually, while Western Europe grows at 2.4% andNorth America at 2.3%.
Key assumptions include declining yield and resultant fare changes, the use of flightfrequencies in competitive markets, the influence of globalization and world trade and thedifferentiation of markets by stage length. With these various assumptions, GDP changecan be related to travel demand, stated in terms of revenue passenger miles (RPMs) andthen to operations counts. Regional flows can be translated into projected schedules, withfurther assumptions. Ten and twenty year forecasts are produced. Key assumptionsstated in the CMO are: gross domestic product and increased value drive air travel,relaxation of airline industry regulation allows increased competition, market forcesincreasingly determine airline routes, airplane selection and the composition of the worldfleet, and air traffic control systems and airport capacities respond to demand.
2.3.2 Analysis of Future System Capacity, Safety and Efficiency Needs
The traffic demand defined in the previous paragraph is used to drive an analysis of thesystem mission. A high level statement of mission requirements includes safety, capacityand efficiency goals for all system stakeholders. The goals are stated in terms of metricsagainst which all proposed operational concepts can be evaluated.
The mission analysis quantifies the predicted traffic demand for the period in which theoperational concept is expected to be in use. This demand is derived from stakeholder
14
business objectives of growth (capacity), efficiency, affordability, and safety, identifyingand accounting for the possible effects of constraints that may limit the achievement of anyparticular objective. The stakeholders often have competing objectives, and a viableoperational concept will include a reasonable compromise among these objectives toreduce political risk to system implementation.
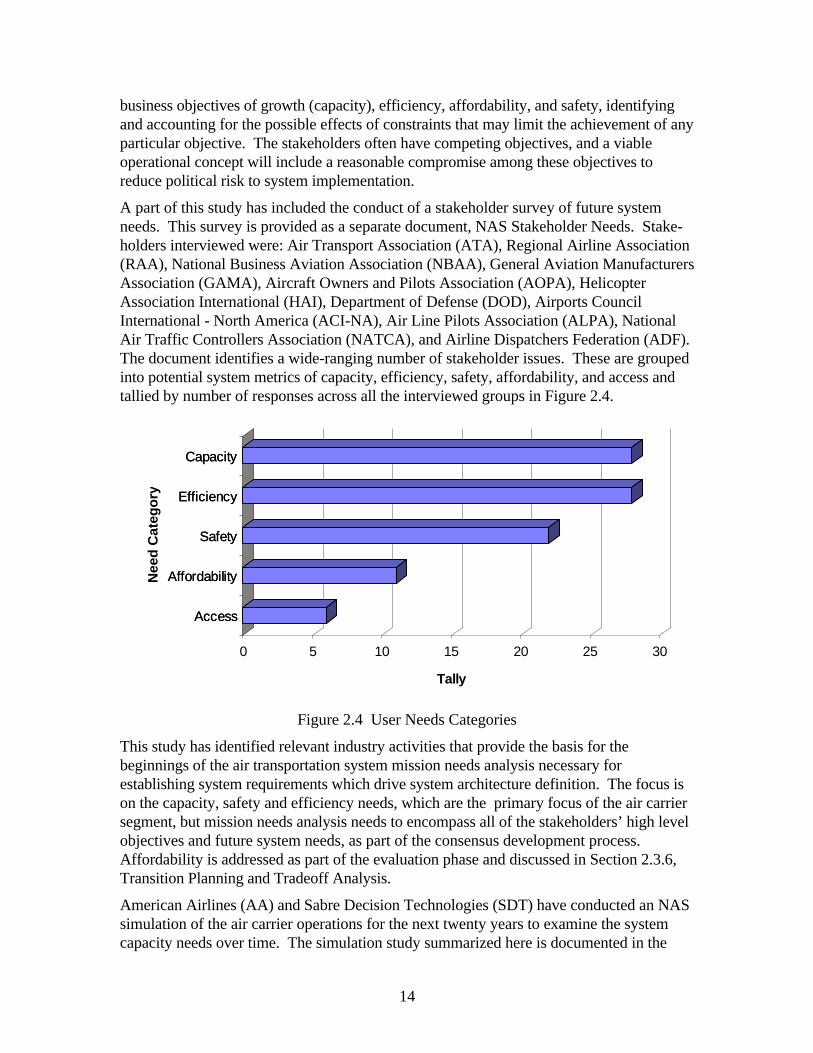
A part of this study has included the conduct of a stakeholder survey of future systemneeds. This survey is provided as a separate document, NAS Stakeholder Needs. Stake-holders interviewed were: Air Transport Association (ATA), Regional Airline Association(RAA), National Business Aviation Association (NBAA), General Aviation ManufacturersAssociation (GAMA), Aircraft Owners and Pilots Association (AOPA), HelicopterAssociation International (HAI), Department of Defense (DOD), Airports CouncilInternational - North America (ACI-NA), Air Line Pilots Association (ALPA), NationalAir Traffic Controllers Association (NATCA), and Airline Dispatchers Federation (ADF).The document identifies a wide-ranging number of stakeholder issues. These are groupedinto potential system metrics of capacity, efficiency, safety, affordability, and access andtallied by number of responses across all the interviewed groups in Figure 2.4.
Access
Affordability
Safety
Efficiency
Capacity
0 5 10 15 20 25 30
Tally
Access
Affordability
Safety
Efficiency
Capacity
Nee
d C
ateg
ory
Figure 2.4 User Needs Categories
This study has identified relevant industry activities that provide the basis for thebeginnings of the air transportation system mission needs analysis necessary forestablishing system requirements which drive system architecture definition. The focus ison the capacity, safety and efficiency needs, which are the primary focus of the air carriersegment, but mission needs analysis needs to encompass all of the stakeholders’ high levelobjectives and future system needs, as part of the consensus development process.Affordability is addressed as part of the evaluation phase and discussed in Section 2.3.6,Transition Planning and Tradeoff Analysis.
American Airlines (AA) and Sabre Decision Technologies (SDT) have conducted an NASsimulation of the air carrier operations for the next twenty years to examine the systemcapacity needs over time. The simulation study summarized here is documented in the
15
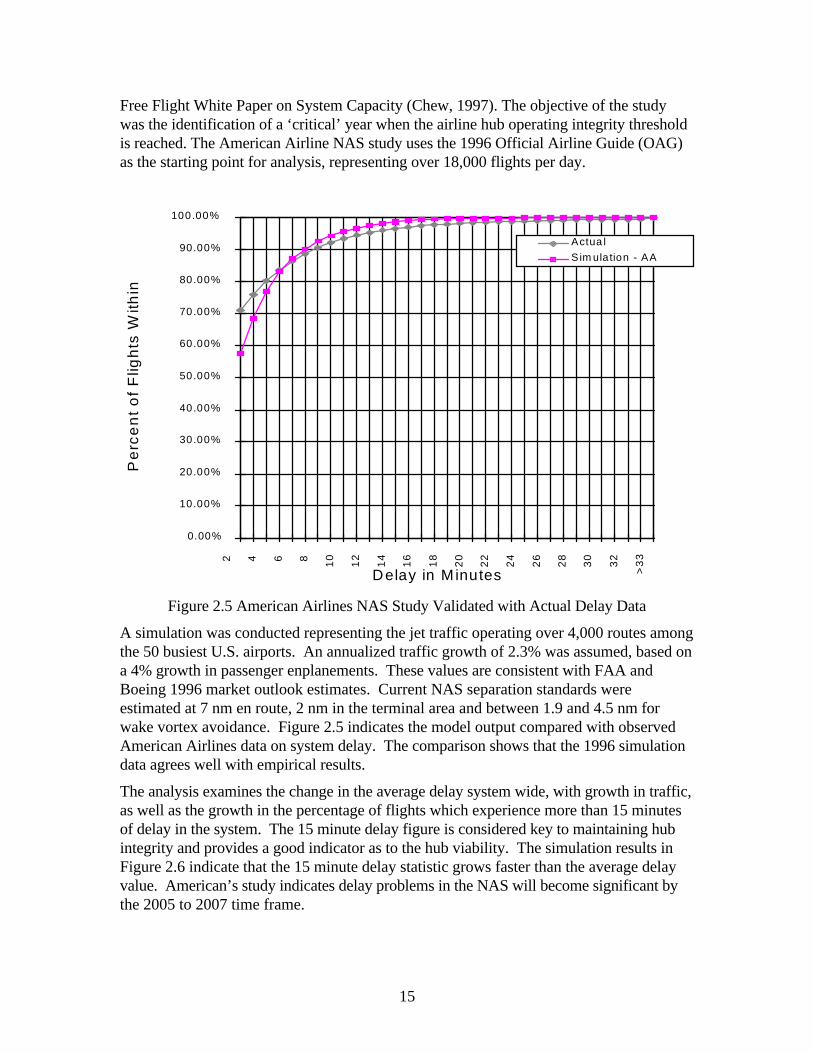
Free Flight White Paper on System Capacity (Chew, 1997). The objective of the studywas the identification of a ‘critical’ year when the airline hub operating integrity thresholdis reached. The American Airline NAS study uses the 1996 Official Airline Guide (OAG)as the starting point for analysis, representing over 18,000 flights per day.
0.00%
10.00%
20.00%
30.00%
40.00%
50.00%
60.00%
70.00%
80.00%
90.00%
100.00%2 4 6 8 10
12
14
16
18
20
22
24
26
28
30
32
>3
3
Delay in M inutes
Pe
rce
nt
of
Flig
hts
With
in
Actua l
S im ulation - AA
Figure 2.5 American Airlines NAS Study Validated with Actual Delay Data
A simulation was conducted representing the jet traffic operating over 4,000 routes amongthe 50 busiest U.S. airports. An annualized traffic growth of 2.3% was assumed, based ona 4% growth in passenger enplanements. These values are consistent with FAA andBoeing 1996 market outlook estimates. Current NAS separation standards wereestimated at 7 nm en route, 2 nm in the terminal area and between 1.9 and 4.5 nm forwake vortex avoidance. Figure 2.5 indicates the model output compared with observedAmerican Airlines data on system delay. The comparison shows that the 1996 simulationdata agrees well with empirical results.
The analysis examines the change in the average delay system wide, with growth in traffic,as well as the growth in the percentage of flights which experience more than 15 minutesof delay in the system. The 15 minute delay figure is considered key to maintaining hubintegrity and provides a good indicator as to the hub viability. The simulation results inFigure 2.6 indicate that the 15 minute delay statistic grows faster than the average delayvalue. American’s study indicates delay problems in the NAS will become significant bythe 2005 to 2007 time frame.
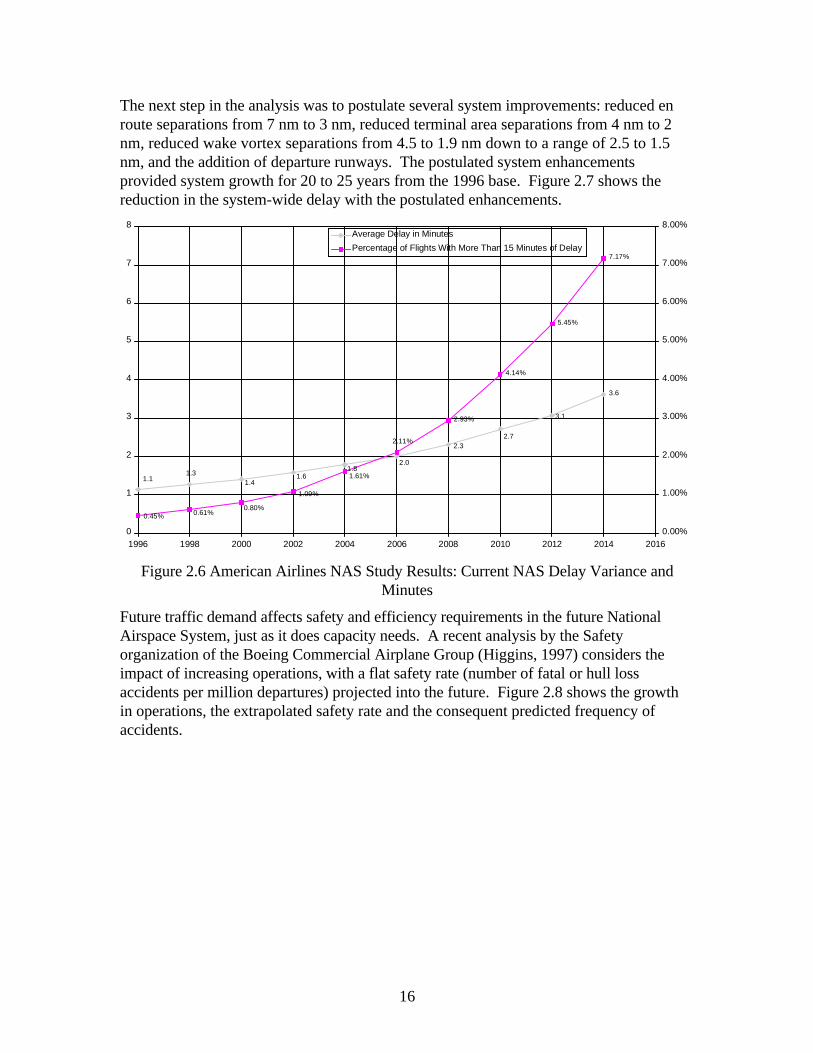
16
The next step in the analysis was to postulate several system improvements: reduced enroute separations from 7 nm to 3 nm, reduced terminal area separations from 4 nm to 2nm, reduced wake vortex separations from 4.5 to 1.9 nm down to a range of 2.5 to 1.5nm, and the addition of departure runways. The postulated system enhancementsprovided system growth for 20 to 25 years from the 1996 base. Figure 2.7 shows thereduction in the system-wide delay with the postulated enhancements.
3.6
3.1
2.72.3
2.01.8
1.61.4
1.31.1
2.93%
4.14%
5.45%
7.17%
1.09%
0.80%0.61%0.45%
1.61%
2.11%
0
1
2
3
4
5
6
7
8
1996 1998 2000 2002 2004 2006 2008 2010 2012 2014 20160.00%
1.00%
2.00%
3.00%
4.00%
5.00%
6.00%
7.00%
8.00%Average Delay in Minutes
Percentage of Flights With More Than 15 Minutes of Delay
Figure 2.6 American Airlines NAS Study Results: Current NAS Delay Variance andMinutes
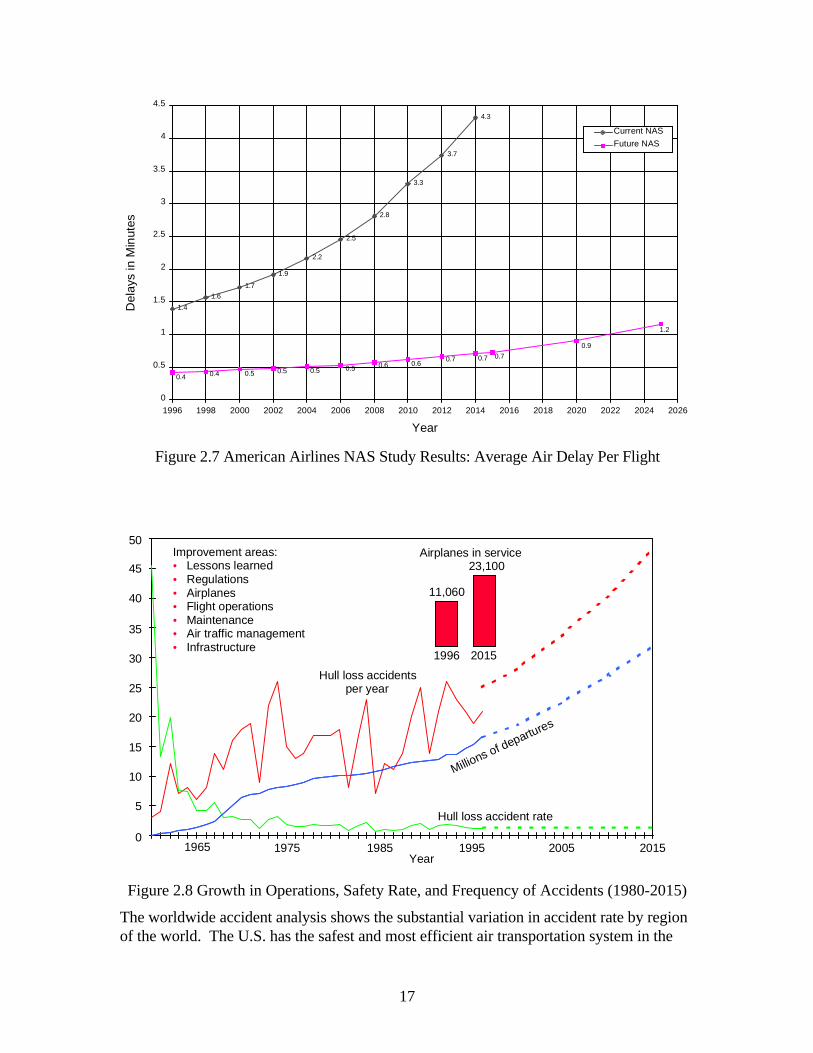
Future traffic demand affects safety and efficiency requirements in the future NationalAirspace System, just as it does capacity needs. A recent analysis by the Safetyorganization of the Boeing Commercial Airplane Group (Higgins, 1997) considers theimpact of increasing operations, with a flat safety rate (number of fatal or hull lossaccidents per million departures) projected into the future. Figure 2.8 shows the growthin operations, the extrapolated safety rate and the consequent predicted frequency ofaccidents.
17
1.4
1.6
1.7
1.9
2.2
2.5
2.8
3.3
3.7
4.3
1.2
0.9
0.70.70.70.60.60.50.50.50.50.40.4
0
0.5
1
1.5
2
2.5
3
3.5
4
4.5
1996 1998 2000 2002 2004 2006 2008 2010 2012 2014 2016 2018 2020 2022 2024 2026
Year
Del
ays
in M
inut
esCurrent NAS
Future NAS
Figure 2.7 American Airlines NAS Study Results: Average Air Delay Per Flight
1965 1975 1985 1995 2005 2015Year
50
45
40
35
30
25
20
15
10
5
0
Improvement areas:• Lessons learned• Regulations• Airplanes• Flight operations• Maintenance• Air traffic management• Infrastructure
Hull loss accidentsper year
Millions of departures
Hull loss accident rate
Airplanes in service
11,060
23,100
1996 2015
Figure 2.8 Growth in Operations, Safety Rate, and Frequency of Accidents (1980-2015)
The worldwide accident analysis shows the substantial variation in accident rate by regionof the world. The U.S. has the safest and most efficient air transportation system in the
18
world. By region of the world the civilian air transport accident rate (accidents per milliondepartures) is:
Africa 10.7Asia & Pacific Islands 2.6
China 4.2Japan 0.8
Europe 0.8Latin America and Caribbean 4.5Middle East 2.0Oceania 0.3USA & Canada 0.5
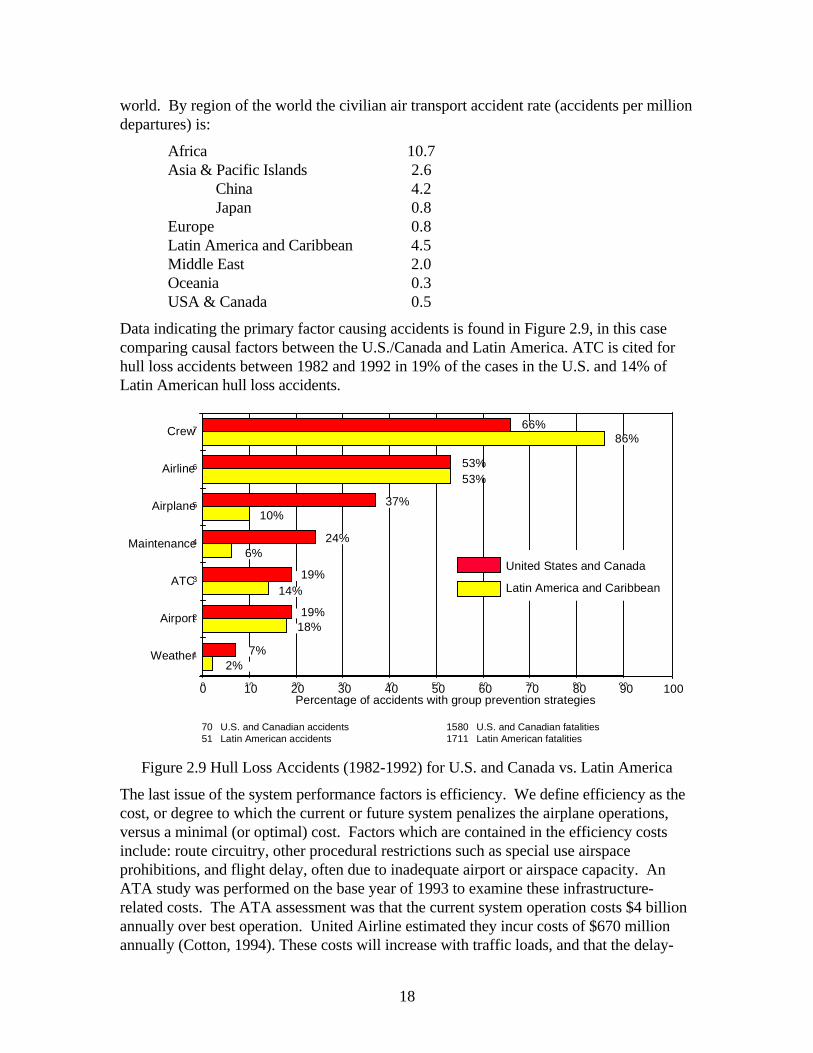
Data indicating the primary factor causing accidents is found in Figure 2.9, in this casecomparing causal factors between the U.S./Canada and Latin America. ATC is cited forhull loss accidents between 1982 and 1992 in 19% of the cases in the U.S. and 14% ofLatin American hull loss accidents.
0 10 20 30 40 50 60 70 80 90
1
2
3
4
5
6
7Crew
Airline
Airplane
Maintenance
ATC
Airport
Weather
66%86%
53%53%
37%10%
24%6%
19%14%
18%19%
7%2%
0 10 20 30 40 50 60 70 80 90 100Percentage of accidents with group prevention strategies
70 U.S. and Canadian accidents51 Latin American accidents
1580 U.S. and Canadian fatalities1711 Latin American fatalities
United States and Canada
Latin America and Caribbean
Figure 2.9 Hull Loss Accidents (1982-1992) for U.S. and Canada vs. Latin America
The last issue of the system performance factors is efficiency. We define efficiency as thecost, or degree to which the current or future system penalizes the airplane operations,versus a minimal (or optimal) cost. Factors which are contained in the efficiency costsinclude: route circuitry, other procedural restrictions such as special use airspaceprohibitions, and flight delay, often due to inadequate airport or airspace capacity. AnATA study was performed on the base year of 1993 to examine these infrastructure-related costs. The ATA assessment was that the current system operation costs $4 billionannually over best operation. United Airline estimated they incur costs of $670 millionannually (Cotton, 1994). These costs will increase with traffic loads, and that the delay-
19
related component will increase with exponential growth, especially as potential saturationis approached. A key cost avoidance issue is the magnitude of the unimproved systemuser costs in ten or twenty years.
The above analysis considered the operational costs in the current system against a close-to-ideal operation (no flight delays, no excess routing and other procedural restrictions,access to optimal flight levels). The inefficiency costs in the present system were thusquantified. Another issue which also needs to be addressed is the cost of servicesprovided by the FAA to the users of the system. In many parts of the world, user chargesfor ATC and navigation services are a recognized (and fast-growing) component of theairline direct operating cost structure. The International Air Transport Association(IATA) recently reported that a “concerted effort to improve operational efficiency,reflected in airline profits of US$4 billion on international scheduled services by IATAmembers last year. The same improvement ... is not reflected in airport and airspacemanagement operations. ... Pointing to a 36 percent improvement in capacity between1991 and 1995, coupled with a 30 rise in costs, the airlines say that airport charges haverisen by 48 per cent and en route charges 75 per cent.” (Jane’s Airport Review, 1997)
In the U.S., the ticket tax currently masks the impact of ATC system operational efficiencyon airline productivity. But changes in the funding basis for the agency, as recommendedin the National Civil Aviation Review Commission (NCARC) report (NCARC, 1997)portend a much higher level of user awareness and concern on the ATC systemeffectiveness.
2.3.3 Operational Concept: System Agents and Functional Allocation
Figure 2.10 summarizes at a high level the primary system agents involved in the dailyplanning and execution of flights in the system. The left side of the figure shows the airtraffic planning element, the Traffic Flow Management System, and its agent, the TrafficFlow Manager. The Traffic Flow Management System can be further partitioned into thenational level (Central Flow Control Facility at Washington Dulles), center level andairport level elements. These people and their system determine the daily scheduledemand for resources (airport and airspace) and restrict or constrain flight, as deemednecessary, consistent with safety of flight, controller workload, etc. The airline planningcounterpart is the dispatcher and the in-flight control agents, parts of the AirlineOperational Control (AOC) system.
On the flight execution side (right side of the figure), the sector controllers, planning andexecution, provide the separation assurance function of ATC between instrument flightrules (IFR) flights in the system. The execution controller is in very high frequency (VHF)radio contact with the flight crew, providing flight plan amendments, as necessary, forseparation assurance.
Section 3 describes, at a functional level, the complex interrelationships among theplanning and execution elements, and how the system efficiency, capacity (as measured bythroughput) and safety measures are supported. The system operational concept isfundamentally the assignment of roles and responsibilities to system agents and to theirautomation support systems. As the future mission needs of the air traffic system are
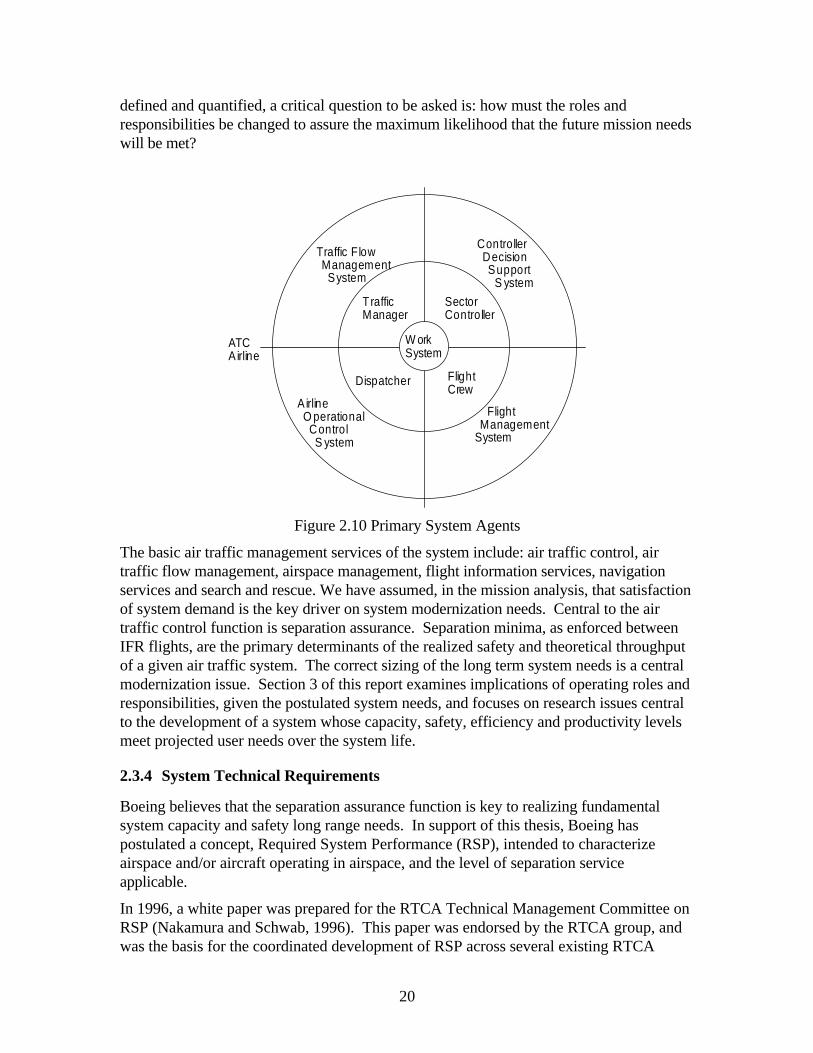
20
defined and quantified, a critical question to be asked is: how must the roles andresponsibilities be changed to assure the maximum likelihood that the future mission needswill be met?
Traffic Flow Management System
Controller Decision Support S ystem
Airline O perational Control S ystem
Flight ManagementSystem
Dispatcher FlightCrew
TrafficManager
SectorController
ATCAirline
W orkSystem
Figure 2.10 Primary System Agents
The basic air traffic management services of the system include: air traffic control, airtraffic flow management, airspace management, flight information services, navigationservices and search and rescue. We have assumed, in the mission analysis, that satisfactionof system demand is the key driver on system modernization needs. Central to the airtraffic control function is separation assurance. Separation minima, as enforced betweenIFR flights, are the primary determinants of the realized safety and theoretical throughputof a given air traffic system. The correct sizing of the long term system needs is a centralmodernization issue. Section 3 of this report examines implications of operating roles andresponsibilities, given the postulated system needs, and focuses on research issues centralto the development of a system whose capacity, safety, efficiency and productivity levelsmeet projected user needs over the system life.
2.3.4 System Technical Requirements
Boeing believes that the separation assurance function is key to realizing fundamentalsystem capacity and safety long range needs. In support of this thesis, Boeing haspostulated a concept, Required System Performance (RSP), intended to characterizeairspace and/or aircraft operating in airspace, and the level of separation serviceapplicable.
In 1996, a white paper was prepared for the RTCA Technical Management Committee onRSP (Nakamura and Schwab, 1996). This paper was endorsed by the RTCA group, andwas the basis for the coordinated development of RSP across several existing RTCA
21
Special Committees. The paper, with minor modifications, was also submitted to theInternational Civil Aviation Organization (ICAO) Separation Panel meeting later in 1996.The paper states that the definition of required air navigation system performance shouldencompass navigation, communications and monitoring (or surveillance) performance andprovide a related, high level characterization of the air navigation environment, RSP. Thethesis of the paper is that RSP is best characterized by the traditional airspace attribute ofseparation minima. The paper asserts that the concept of separation minima is the primaryairspace performance determinant.
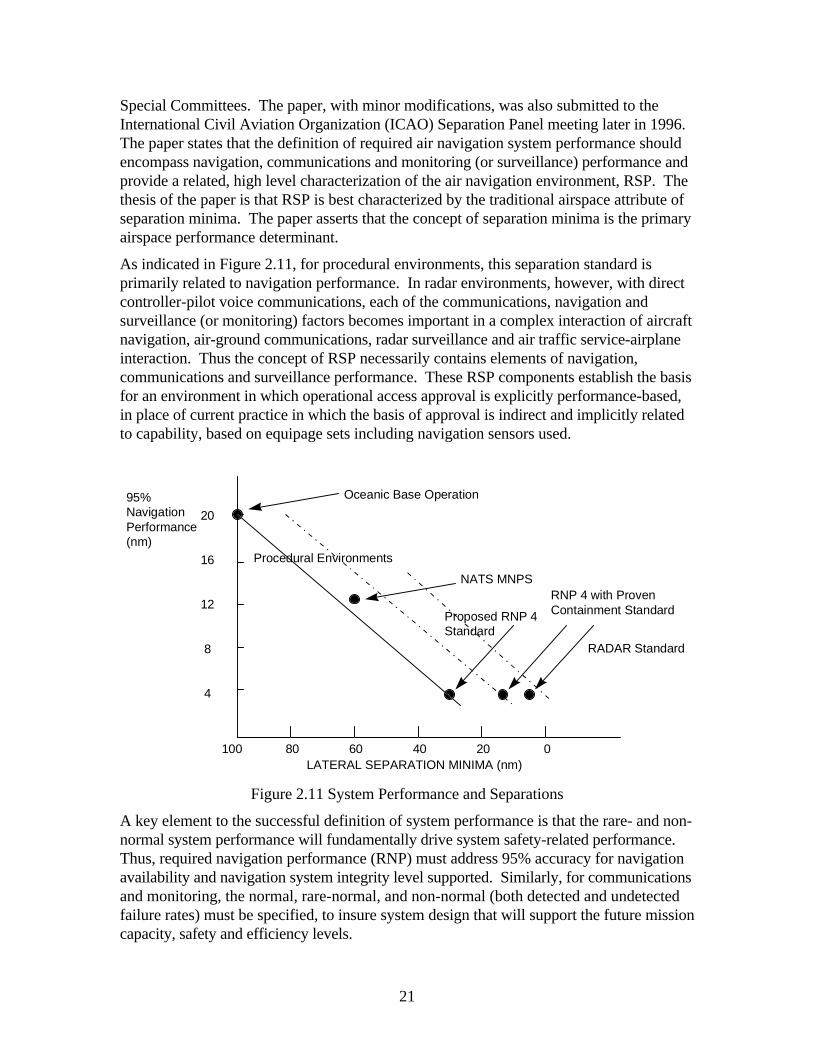
As indicated in Figure 2.11, for procedural environments, this separation standard isprimarily related to navigation performance. In radar environments, however, with directcontroller-pilot voice communications, each of the communications, navigation andsurveillance (or monitoring) factors becomes important in a complex interaction of aircraftnavigation, air-ground communications, radar surveillance and air traffic service-airplaneinteraction. Thus the concept of RSP necessarily contains elements of navigation,communications and surveillance performance. These RSP components establish the basisfor an environment in which operational access approval is explicitly performance-based,in place of current practice in which the basis of approval is indirect and implicitly relatedto capability, based on equipage sets including navigation sensors used.
20
16
12
8
4
95%NavigationPerformance(nm)
100 80 60 40 20 0LATERAL SEPARATION MINIMA (nm)
Oceanic Base Operation
NATS MNPS
Proposed RNP 4Standard
RNP 4 with ProvenContainment Standard
RADAR Standard
Procedural Environments
Figure 2.11 System Performance and Separations
A key element to the successful definition of system performance is that the rare- and non-normal system performance will fundamentally drive system safety-related performance.Thus, required navigation performance (RNP) must address 95% accuracy for navigationavailability and navigation system integrity level supported. Similarly, for communicationsand monitoring, the normal, rare-normal, and non-normal (both detected and undetectedfailure rates) must be specified, to insure system design that will support the future missioncapacity, safety and efficiency levels.
22
The RSP model described above relates the system level performance (capacity and safety)to the sub-system performance elements for communications, navigation and surveillance(CNS). Additionally, in an intervention ATC environment such as radar, models andsafety assessment techniques are needed to determine the impact of human performance,together with decision support performance and CNS element performance on systemperformance levels.
In Section 3 of this document, a first-cut system separation model is developed, identifyingthe separation functions into: detection, response and response frequency considerations.These provide the basis for the allocation of performance objectives to subsystemelements, and the quantification of expected safety and system throughput levels.
2.3.5 Technology and Human Factors Analysis
A vital issue to the development of a successful new air traffic system is ensuring thathuman performance capabilities and responsibilities are respected as new technologies aredeployed. The safety criticality of the system magnifies the importance of the need torespect human performance and capabilities. Especially, in the preliminary design phase ofprogram development, we lack tools and methods for examining the issues of functionsand task design and allocation, and thus are unable to clearly determine which are bestdone by humans and those activities which are best automated.
A number of issues explored in Section 4 of this report identify the need for developing acomprehensive, integrated description of human behavior (both physical and cognitive) inthe system; consideration of human performance capabilities and limitations, starting atconcept definition; the need for human factors support through implementation, includingeducation and training requirements for transition and maintenance of new systems; andthe need to consider the entire range of possible operating condition in assessing humanperformance. Specific domain issues include dependency on decision support systems;situational awareness; and intent. Other issues identified include the need for structurewhile maximizing throughput, and the problems with shared responsibility.
Current and planned technology elements are cataloged in Section 5. They are describedin terms of their potential application to air traffic services; their constituent performance,and their expected system level, installed performance. These technologies can becompared with the allocated technical requirements in order to trade-off the costs andbenefits of the alternatives.
2.3.6 Transition Planning and Tradeoff Analyses
A critical element of air traffic services planning is the determination of workable systemtransition steps. To assess the tradeoffs of technology and operational changes, it isnecessary to develop tools and methods which organize airspace changes into workabletransitions.
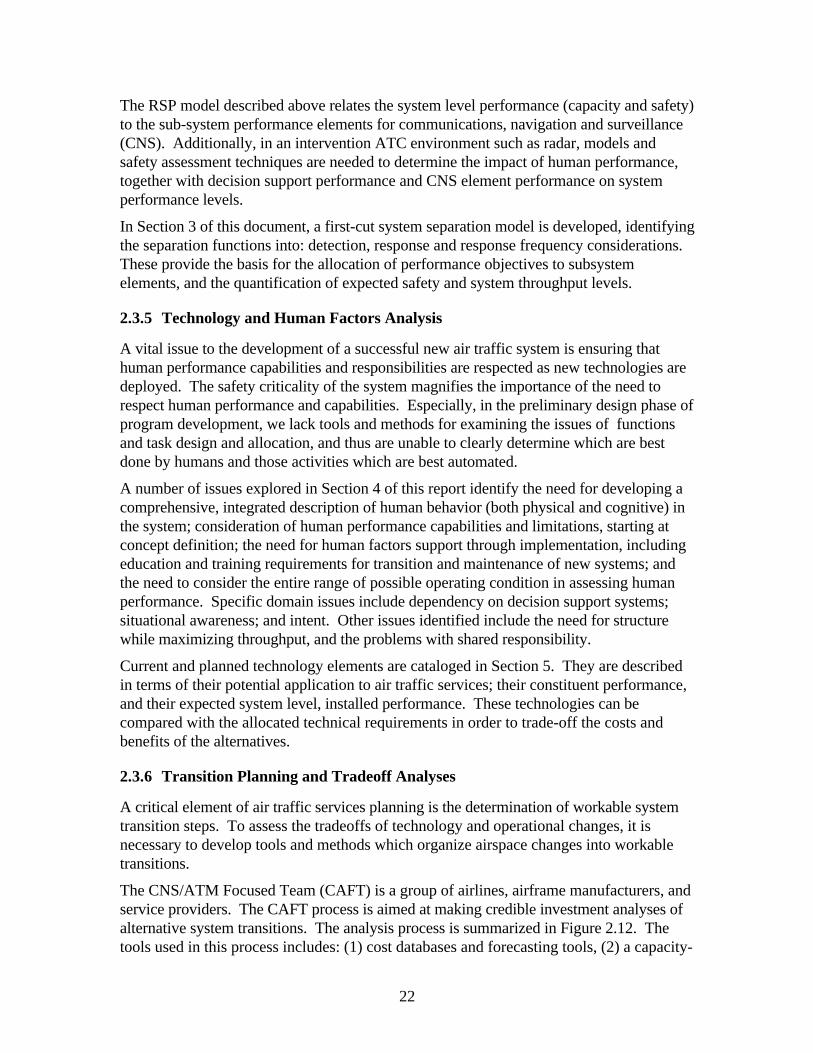
The CNS/ATM Focused Team (CAFT) is a group of airlines, airframe manufacturers, andservice providers. The CAFT process is aimed at making credible investment analyses ofalternative system transitions. The analysis process is summarized in Figure 2.12. Thetools used in this process includes: (1) cost databases and forecasting tools, (2) a capacity-
23
efficiency-constraints model that identifies key elements of the system affecting systemperformance, (3) transition logic diagrams linking operational improvements, technologysolutions, and benefit mechanisms in phased steps, and (4) economic modeling thatassesses the costs, benefits, and risks of the improvements to industry and all stakeholders.
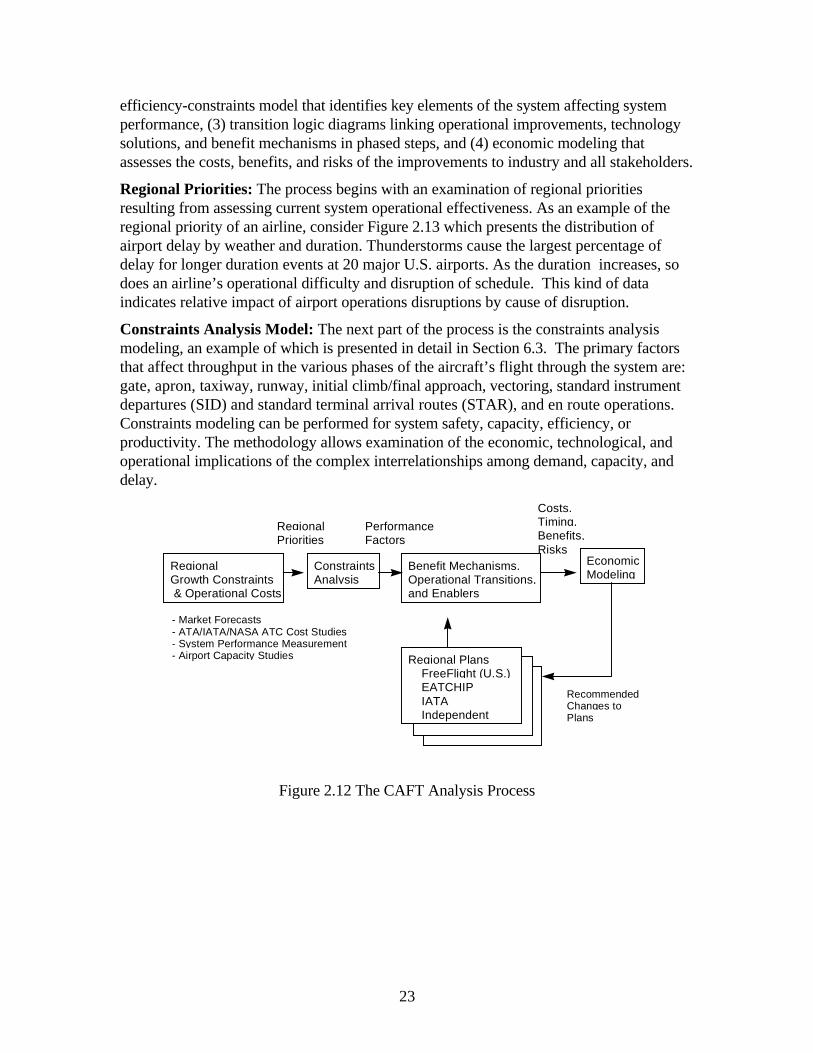
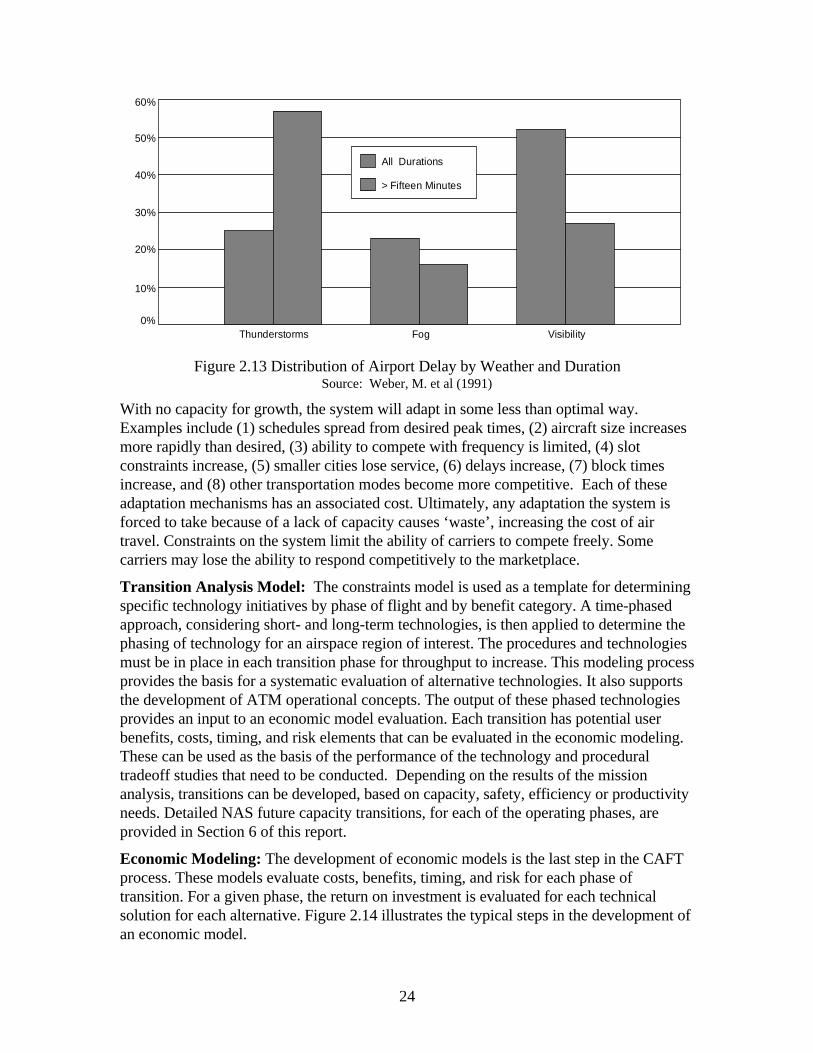
Regional Priorities: The process begins with an examination of regional prioritiesresulting from assessing current system operational effectiveness. As an example of theregional priority of an airline, consider Figure 2.13 which presents the distribution ofairport delay by weather and duration. Thunderstorms cause the largest percentage ofdelay for longer duration events at 20 major U.S. airports. As the duration increases, sodoes an airline’s operational difficulty and disruption of schedule. This kind of dataindicates relative impact of airport operations disruptions by cause of disruption.
Constraints Analysis Model: The next part of the process is the constraints analysismodeling, an example of which is presented in detail in Section 6.3. The primary factorsthat affect throughput in the various phases of the aircraft’s flight through the system are:gate, apron, taxiway, runway, initial climb/final approach, vectoring, standard instrumentdepartures (SID) and standard terminal arrival routes (STAR), and en route operations.Constraints modeling can be performed for system safety, capacity, efficiency, orproductivity. The methodology allows examination of the economic, technological, andoperational implications of the complex interrelationships among demand, capacity, anddelay.
EconomicModeling
Benefit Mechanisms,Operational Transitions,and Enablers
RegionalGrowth Constraints & Operational Costs
ConstraintsAnalysis
Regional Plans FreeFlight (U.S.) EATCHIP IATA Independent
Costs,Timing,Benefits,Risks
PerformanceFactors
RegionalPriorities
- Market Forecasts- ATA/IATA/NASA ATC Cost Studies- System Performance Measurement- Airport Capacity Studies
RecommendedChanges toPlans
Figure 2.12 The CAFT Analysis Process
24
60%
50%
40%
30%
20%
10%
0%Thunderstorms Fog Visibility
All Durations
> Fifteen Minutes
Figure 2.13 Distribution of Airport Delay by Weather and DurationSource: Weber, M. et al (1991)
With no capacity for growth, the system will adapt in some less than optimal way.Examples include (1) schedules spread from desired peak times, (2) aircraft size increasesmore rapidly than desired, (3) ability to compete with frequency is limited, (4) slotconstraints increase, (5) smaller cities lose service, (6) delays increase, (7) block timesincrease, and (8) other transportation modes become more competitive. Each of theseadaptation mechanisms has an associated cost. Ultimately, any adaptation the system isforced to take because of a lack of capacity causes ‘waste’, increasing the cost of airtravel. Constraints on the system limit the ability of carriers to compete freely. Somecarriers may lose the ability to respond competitively to the marketplace.
Transition Analysis Model: The constraints model is used as a template for determiningspecific technology initiatives by phase of flight and by benefit category. A time-phasedapproach, considering short- and long-term technologies, is then applied to determine thephasing of technology for an airspace region of interest. The procedures and technologiesmust be in place in each transition phase for throughput to increase. This modeling processprovides the basis for a systematic evaluation of alternative technologies. It also supportsthe development of ATM operational concepts. The output of these phased technologiesprovides an input to an economic model evaluation. Each transition has potential userbenefits, costs, timing, and risk elements that can be evaluated in the economic modeling.These can be used as the basis of the performance of the technology and proceduraltradeoff studies that need to be conducted. Depending on the results of the missionanalysis, transitions can be developed, based on capacity, safety, efficiency or productivityneeds. Detailed NAS future capacity transitions, for each of the operating phases, areprovided in Section 6 of this report.
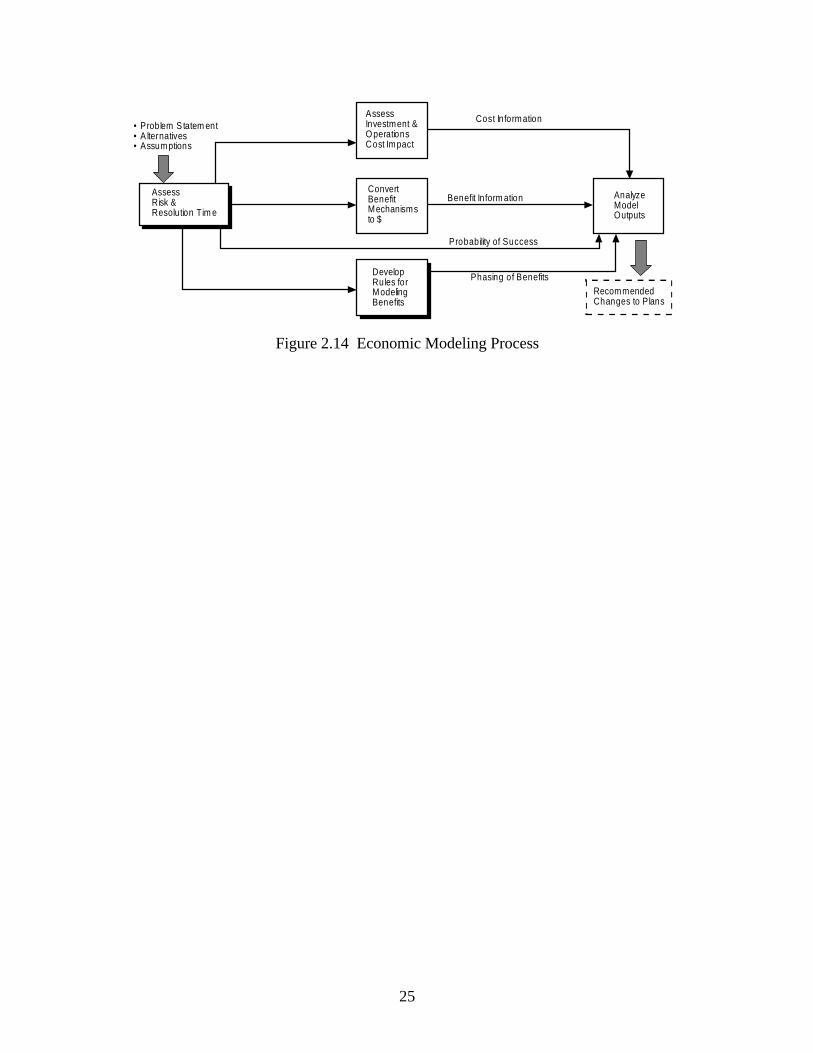
Economic Modeling: The development of economic models is the last step in the CAFTprocess. These models evaluate costs, benefits, timing, and risk for each phase oftransition. For a given phase, the return on investment is evaluated for each technicalsolution for each alternative. Figure 2.14 illustrates the typical steps in the development ofan economic model.
25
RecommendedChanges to Plans
AnalyzeModelOutputs
AssessInvestment &O perationsCost Impact
ConvertBenefitMechanismsto $
DevelopRules forModelingBenefits
AssessRisk &Resolution Tim e
Phasing of Benefits
Probability of Success
Benefit Inform ation
Cost Information• Problem S tatem ent• A lternatives• Assumptions
Figure 2.14 Economic Modeling Process
26
3 The ATM System Functional Structure
This section discusses the primary functions involved in air traffic management andpresents a framework through which their performance can be related to the systemmetrics of capacity, efficiency and safety. A top level functional structure for air trafficmanagement is presented in Section 3.2, along with a discussion of current roles andresponsibilities of system agents. Section 3.2 takes a close look at flow management andtraffic separation, and at the performance factors that combine to provide a safe minimumseparation standard for a given operation. Section 3.3 details the technical and operationalchanges that are likely to be needed to support the system capacity, efficiency and safetygoals for 2015. Section 3.4 presents an overview of the CNS/ATM technologies that arelikely to be needed to support the new operational concept. Section 3.5 discusses theairspace implications of the proposed operational improvements, Section 3.6 discussesairport impact, and Section 3.7 takes a brief look at Flight Service Stations.
3.1 Air Traffic Management Objectives
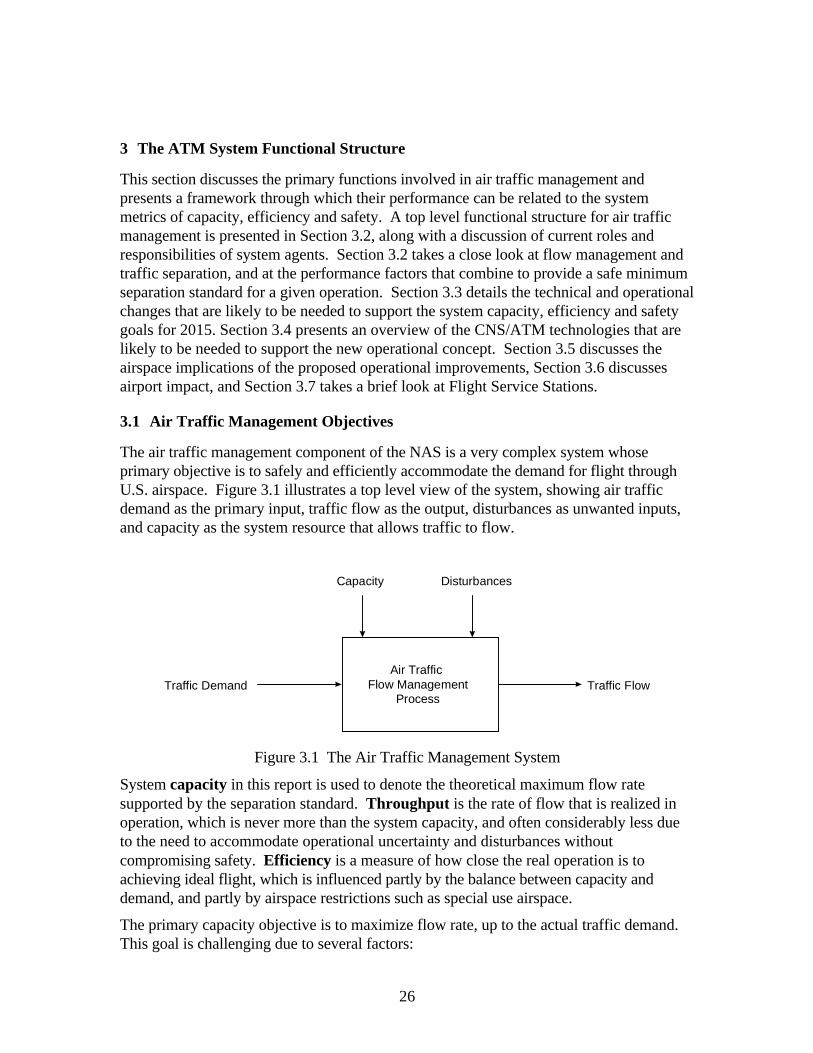
The air traffic management component of the NAS is a very complex system whoseprimary objective is to safely and efficiently accommodate the demand for flight throughU.S. airspace. Figure 3.1 illustrates a top level view of the system, showing air trafficdemand as the primary input, traffic flow as the output, disturbances as unwanted inputs,and capacity as the system resource that allows traffic to flow.
Air Traffic Flow Management
ProcessTraffic FlowTraffic Demand
DisturbancesCapacity
Figure 3.1 The Air Traffic Management System
System capacity in this report is used to denote the theoretical maximum flow ratesupported by the separation standard. Throughput is the rate of flow that is realized inoperation, which is never more than the system capacity, and often considerably less dueto the need to accommodate operational uncertainty and disturbances withoutcompromising safety. Efficiency is a measure of how close the real operation is toachieving ideal flight, which is influenced partly by the balance between capacity anddemand, and partly by airspace restrictions such as special use airspace.
The primary capacity objective is to maximize flow rate, up to the actual traffic demand.This goal is challenging due to several factors:
27
• The highly peaked nature of air traffic demand, caused by passenger desiredtravel times and airline hubbing operations
• The diversity of aircraft performance capabilities
• Competing objectives among system stakeholders
The primary safety objective of air traffic management is to assure safe separation betweenaircraft (and ground vehicles) on the airport surface and in the airspace. The systemefficiency objective is to minimize the cost of operating flights through the system, bothunder normal conditions, and in the face of disruptions due to weather or other causes.
3.1.1 Capacity and Safety
The capacity of the air traffic management system is fundamentally bounded by theseparation standards in effect for the airspace. Thompson (1997) reviews the history of thedevelopment of airspace separation standards and states that the standards for radarcontrolled airspace have evolved slowly and are not based on a formal model of collisionrisk. By contrast, the separation standards in MNPS airspace in the North Atlantic weredeveloped through use of a collision risk model developed by Reich (1966). Reich’smodel takes into account only the aircraft’s guidance and navigation error characteristics,due to the absence of air traffic surveillance in oceanic airspace. The model includes aparameter that defines collision risk, and the use of the model involves a decision to accepta certain value for this risk parameter.
System capacity, and therefore throughput, are bound up in the definition of separationstandards, and thus to accommodate the demand for growth in the NAS through 2015 it isfundamentally important that a rational approach to separation standards development beput in place. Risk management is at the heart of this process, which must find anacceptable balance between collision risk and airspace throughput through a cleardefinition of a collision risk parameter for controlled airspace.
The process of establishing separation standards must include a model of the nominalsystem performance, along with failure modes and effects, all of which combine to providea certain probability of spatial overlap of pairs of aircraft. The factors that contribute tothe performance of the separation assurance function are discussed in more detail inSection 3.2.6.
3.1.2 Throughput and Efficiency
It is important to consider the relationship between throughput and efficiency in thecurrent system. There is a need on part of system users to retain a certain level offlexibility in routing to achieve an efficient operation. But, when considering that currentseparation assurance methods are fundamentally based on a controller’s highly tunedknowledge of a sector and its fixed path geometry, it becomes apparent that flexibilitycould have a negative impact on airspace throughput. In addition, a controller handlesmore aircraft by assuming that pilots stick to their assigned trajectories with a highprobability.

28
Thus, in effect, flexibility is restricted in the system today to gain capacity and/orcontroller productivity. In the future system, it is conceivable that a better balance couldbe found between throughput and efficiency, but this balance will depend on limitations ofhuman and technology performance, of which the human performance is the more difficultissue. This is discussed in more detail in Section 4.3.3 from the human factors point ofview. To guide the design decisions regarding throughput and efficiency, the systemdevelopers must continue to keep in mind the fundamental system mission of providingsufficient traffic throughput.
3.2 A Functional View of the Current Concept
3.2.1 Throughput and Safety
System throughput is a measure of the realized flow through the system in a given timeperiod. Whereas separation standards are established through an analysis of collision risk,throughput is dependent on the controller’s ability to accommodate traffic demand in theface of uncertainty and disturbances. Periods when demand exceeds capacity in parts ofthe system can cause an increase in collision risk, and it is important to include functions inthe system that prevent such overload. In the NAS operation this is done through flowplanning, where a planning horizon of 24 hours is both feasible and appropriate given thedaily traffic demand cycle.
3.2.2 Levels of Flow Planning in the System
The traffic flow planning function is complicated by the fact that the system is subject to avariety of sources of uncertainty. The three most important ones for the daily plan are:
• Weather prediction uncertainty, which affect primarily the arrival phase offlights through airport arrival rates.
• Aircraft pushback readiness due to a variety of factors in aircraft turnaround atthe gate, which affects primarily the departure phase of flights.
• NAS equipment status, which can affect any phase of flight.
The uncertainty inherent in the daily flow plan often results in situations where the plan isout of phase with the unfolding situation, leading to possible overloads or wasted capacity.To deal with the uncertainty, the system could:
• Reduce the uncertainty level (difficult, but progress is being made)
• Provide plenty of room to safely absorb the uncertainty (wasteful)
• Modify the plan dynamically to manage the situation as it unfolds
The last option, to modify the plan dynamically, is what the NAS is evolving toward in aneffort to achieve an acceptable balance between throughput and safety. Thus the NASincludes several levels of planning:
• National and regional flow planning
• Facility-level flow planning
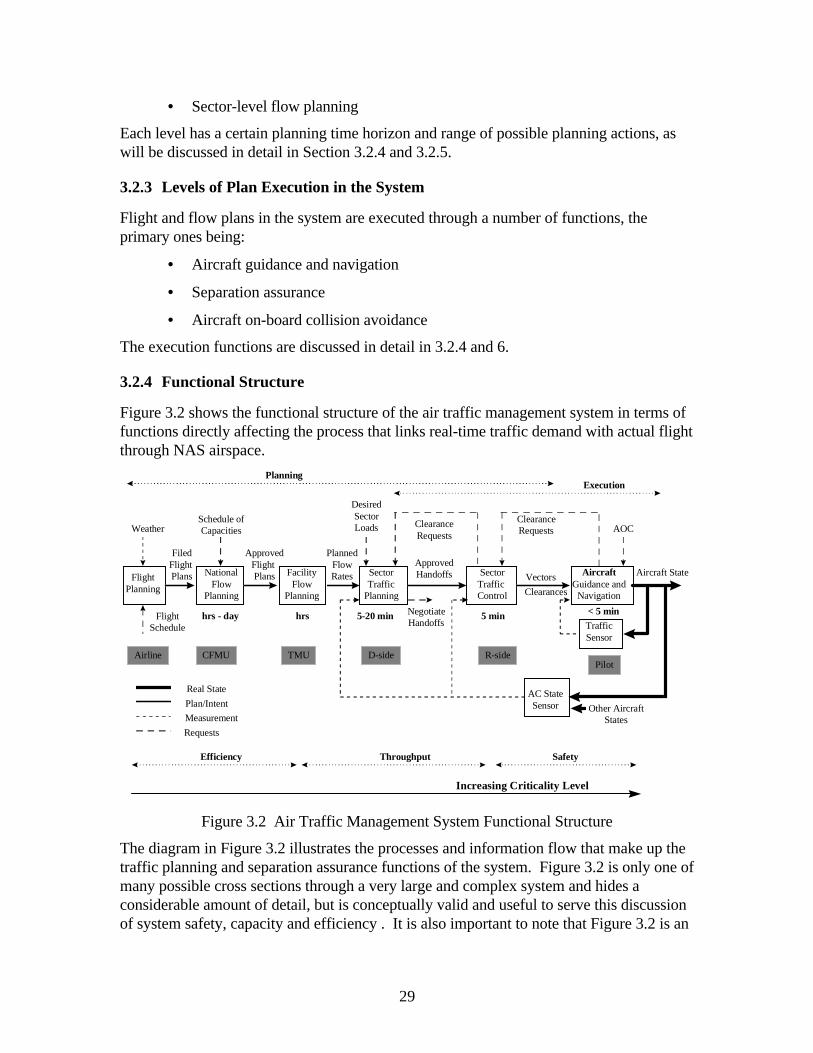
29
• Sector-level flow planning
Each level has a certain planning time horizon and range of possible planning actions, aswill be discussed in detail in Section 3.2.4 and 3.2.5.
3.2.3 Levels of Plan Execution in the System
Flight and flow plans in the system are executed through a number of functions, theprimary ones being:
• Aircraft guidance and navigation
• Separation assurance
• Aircraft on-board collision avoidance
The execution functions are discussed in detail in 3.2.4 and 6.
3.2.4 Functional Structure
Figure 3.2 shows the functional structure of the air traffic management system in terms offunctions directly affecting the process that links real-time traffic demand with actual flightthrough NAS airspace.
Aircraft StateAircraftGuidance andNavigation
AC StateSensor
SectorTraffic Control
TrafficSensor
Vectors
Clearances
SectorTraffic
Planning
NationalFlow
Planning
ApprovedFlight Plans
ApprovedHandoffs
DesiredSectorLoads
ClearanceRequests
Other AircraftStates
FlightPlanning
Weather
FlightSchedule
FiledFlight Plans
NegotiateHandoffs
Schedule ofCapacities
< 5 min5 min5-20 minhrs - day
FacilityFlow
Planning
hrs
ExecutionPlanning
Airline CFMU TMU D-side R-sidePilot
PlannedFlowRates
ClearanceRequests
Measurement
Real State
Plan/Intent
Requests
AOC
Efficiency Throughput
Increasing Criticality Level
Safety
Figure 3.2 Air Traffic Management System Functional Structure
The diagram in Figure 3.2 illustrates the processes and information flow that make up thetraffic planning and separation assurance functions of the system. Figure 3.2 is only one ofmany possible cross sections through a very large and complex system and hides aconsiderable amount of detail, but is conceptually valid and useful to serve this discussionof system safety, capacity and efficiency . It is also important to note that Figure 3.2 is an
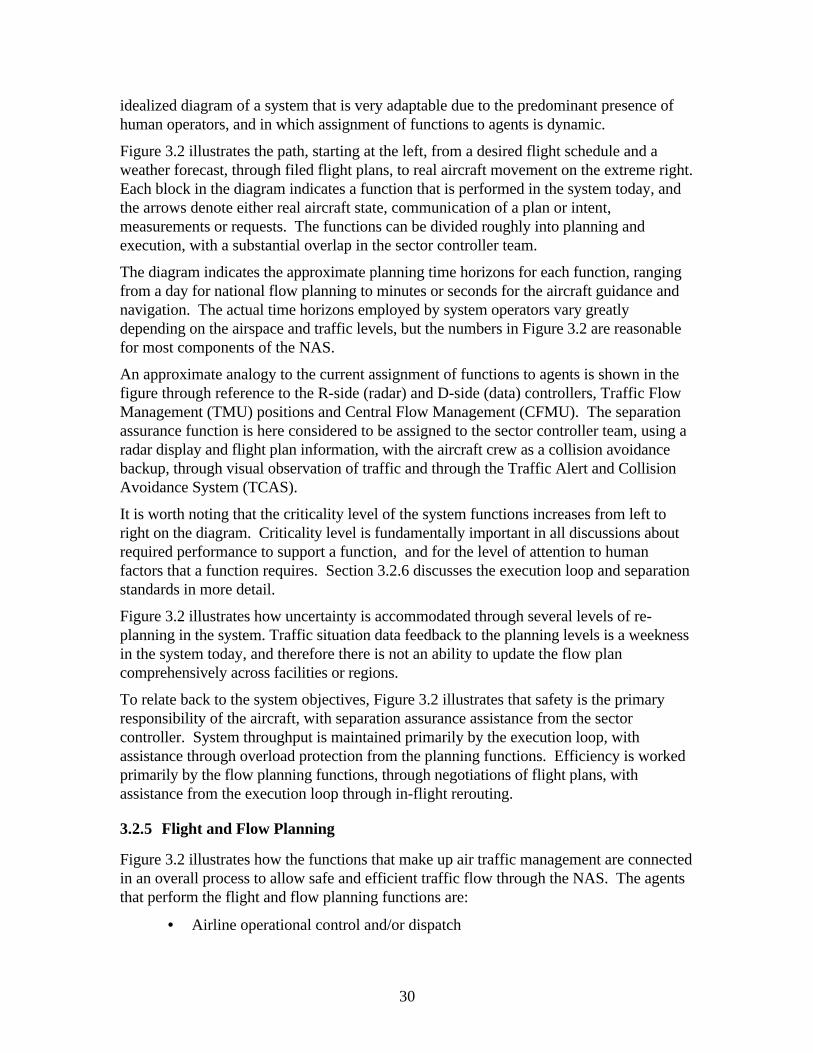
30
idealized diagram of a system that is very adaptable due to the predominant presence ofhuman operators, and in which assignment of functions to agents is dynamic.
Figure 3.2 illustrates the path, starting at the left, from a desired flight schedule and aweather forecast, through filed flight plans, to real aircraft movement on the extreme right.Each block in the diagram indicates a function that is performed in the system today, andthe arrows denote either real aircraft state, communication of a plan or intent,measurements or requests. The functions can be divided roughly into planning andexecution, with a substantial overlap in the sector controller team.
The diagram indicates the approximate planning time horizons for each function, rangingfrom a day for national flow planning to minutes or seconds for the aircraft guidance andnavigation. The actual time horizons employed by system operators vary greatlydepending on the airspace and traffic levels, but the numbers in Figure 3.2 are reasonablefor most components of the NAS.
An approximate analogy to the current assignment of functions to agents is shown in thefigure through reference to the R-side (radar) and D-side (data) controllers, Traffic FlowManagement (TMU) positions and Central Flow Management (CFMU). The separationassurance function is here considered to be assigned to the sector controller team, using aradar display and flight plan information, with the aircraft crew as a collision avoidancebackup, through visual observation of traffic and through the Traffic Alert and CollisionAvoidance System (TCAS).
It is worth noting that the criticality level of the system functions increases from left toright on the diagram. Criticality level is fundamentally important in all discussions aboutrequired performance to support a function, and for the level of attention to humanfactors that a function requires. Section 3.2.6 discusses the execution loop and separationstandards in more detail.
Figure 3.2 illustrates how uncertainty is accommodated through several levels of re-planning in the system. Traffic situation data feedback to the planning levels is a weeknessin the system today, and therefore there is not an ability to update the flow plancomprehensively across facilities or regions.
To relate back to the system objectives, Figure 3.2 illustrates that safety is the primaryresponsibility of the aircraft, with separation assurance assistance from the sectorcontroller. System throughput is maintained primarily by the execution loop, withassistance through overload protection from the planning functions. Efficiency is workedprimarily by the flow planning functions, through negotiations of flight plans, withassistance from the execution loop through in-flight rerouting.
3.2.5 Flight and Flow Planning
Figure 3.2 illustrates how the functions that make up air traffic management are connectedin an overall process to allow safe and efficient traffic flow through the NAS. The agentsthat perform the flight and flow planning functions are:
• Airline operational control and/or dispatch
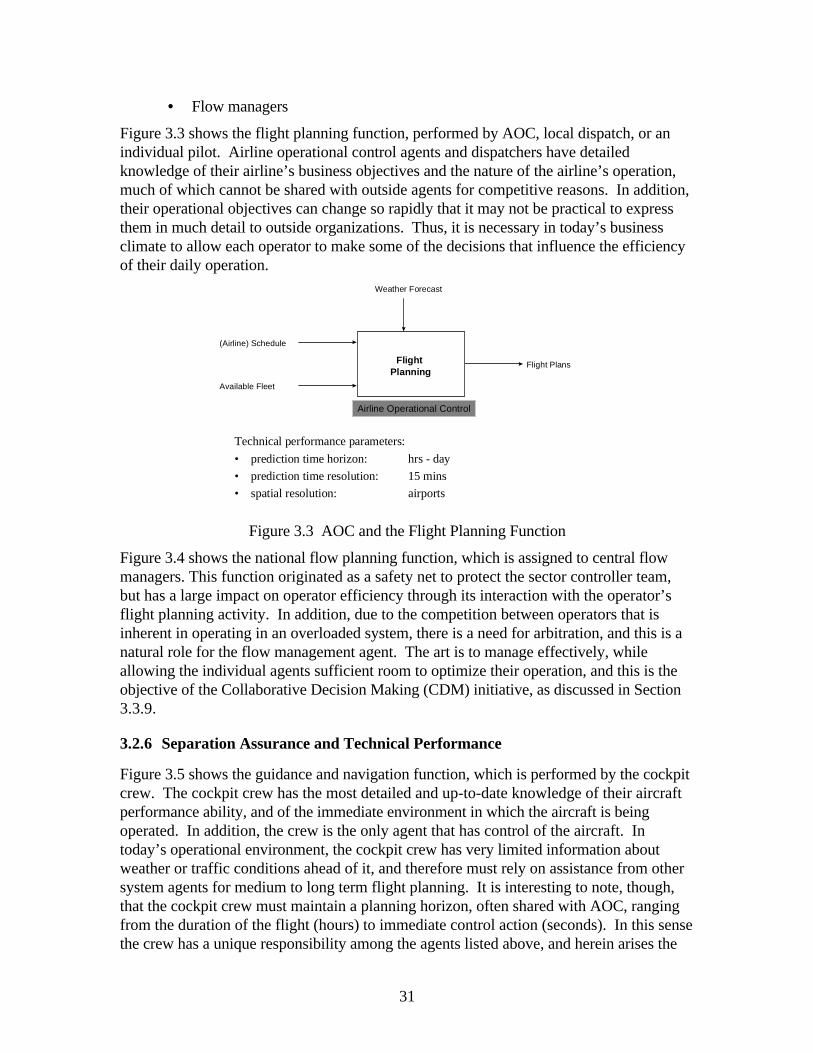
31
• Flow managers
Figure 3.3 shows the flight planning function, performed by AOC, local dispatch, or anindividual pilot. Airline operational control agents and dispatchers have detailedknowledge of their airline’s business objectives and the nature of the airline’s operation,much of which cannot be shared with outside agents for competitive reasons. In addition,their operational objectives can change so rapidly that it may not be practical to expressthem in much detail to outside organizations. Thus, it is necessary in today’s businessclimate to allow each operator to make some of the decisions that influence the efficiencyof their daily operation.
Technical performance parameters:
• prediction time horizon: hrs - day
• prediction time resolution: 15 mins
• spatial resolution: airports
Flight Planning
Flight Plans
(Airline) Schedule
Available Fleet
Weather Forecast
Airline Operational Control
Figure 3.3 AOC and the Flight Planning Function
Figure 3.4 shows the national flow planning function, which is assigned to central flowmanagers. This function originated as a safety net to protect the sector controller team,but has a large impact on operator efficiency through its interaction with the operator’sflight planning activity. In addition, due to the competition between operators that isinherent in operating in an overloaded system, there is a need for arbitration, and this is anatural role for the flow management agent. The art is to manage effectively, whileallowing the individual agents sufficient room to optimize their operation, and this is theobjective of the Collaborative Decision Making (CDM) initiative, as discussed in Section3.3.9.
3.2.6 Separation Assurance and Technical Performance
Figure 3.5 shows the guidance and navigation function, which is performed by the cockpitcrew. The cockpit crew has the most detailed and up-to-date knowledge of their aircraftperformance ability, and of the immediate environment in which the aircraft is beingoperated. In addition, the crew is the only agent that has control of the aircraft. Intoday’s operational environment, the cockpit crew has very limited information aboutweather or traffic conditions ahead of it, and therefore must rely on assistance from othersystem agents for medium to long term flight planning. It is interesting to note, though,that the cockpit crew must maintain a planning horizon, often shared with AOC, rangingfrom the duration of the flight (hours) to immediate control action (seconds). In this sensethe crew has a unique responsibility among the agents listed above, and herein arises the
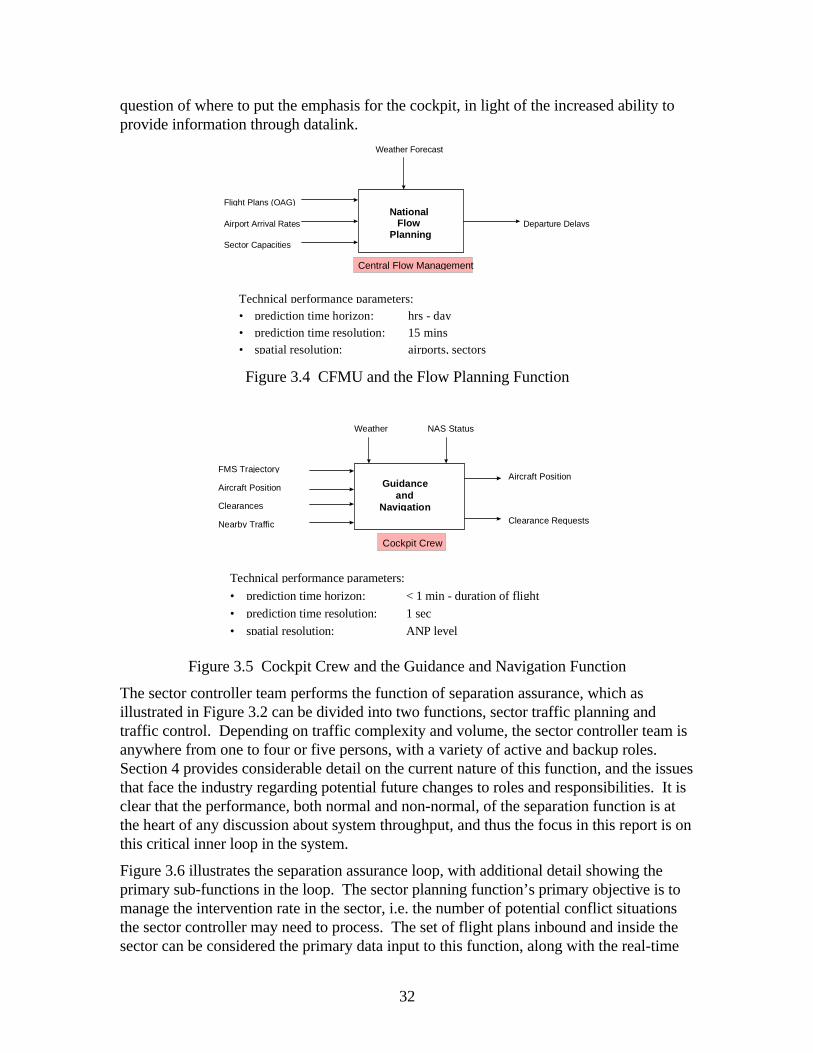
32
question of where to put the emphasis for the cockpit, in light of the increased ability toprovide information through datalink.
Technical performance parameters:
• prediction time horizon: hrs - day• prediction time resolution: 15 mins
• spatial resolution: airports, sectors
NationalFlow
Plannin gDeparture Delays
Flight Plans (OAG)
Airport Arrival Rates
Sector Capacities
Weather Forecast
Central Flow Management
Figure 3.4 CFMU and the Flow Planning Function
Technical performance parameters:
• prediction time horizon: < 1 min - duration of flight
• prediction time resolution: 1 sec
• spatial resolution: ANP level
Guidanceand
Navigation
Aircraft PositionAircraft Position
Nearby Traffic
Clearances
Clearance Requests
FMS Trajectory
Weather NAS Status
Cockpit Crew
Figure 3.5 Cockpit Crew and the Guidance and Navigation Function
The sector controller team performs the function of separation assurance, which asillustrated in Figure 3.2 can be divided into two functions, sector traffic planning andtraffic control. Depending on traffic complexity and volume, the sector controller team isanywhere from one to four or five persons, with a variety of active and backup roles.Section 4 provides considerable detail on the current nature of this function, and the issuesthat face the industry regarding potential future changes to roles and responsibilities. It isclear that the performance, both normal and non-normal, of the separation function is atthe heart of any discussion about system throughput, and thus the focus in this report is onthis critical inner loop in the system.
Figure 3.6 illustrates the separation assurance loop, with additional detail showing theprimary sub-functions in the loop. The sector planning function’s primary objective is tomanage the intervention rate in the sector, i.e. the number of potential conflict situationsthe sector controller may need to process. The set of flight plans inbound and inside thesector can be considered the primary data input to this function, along with the real-time
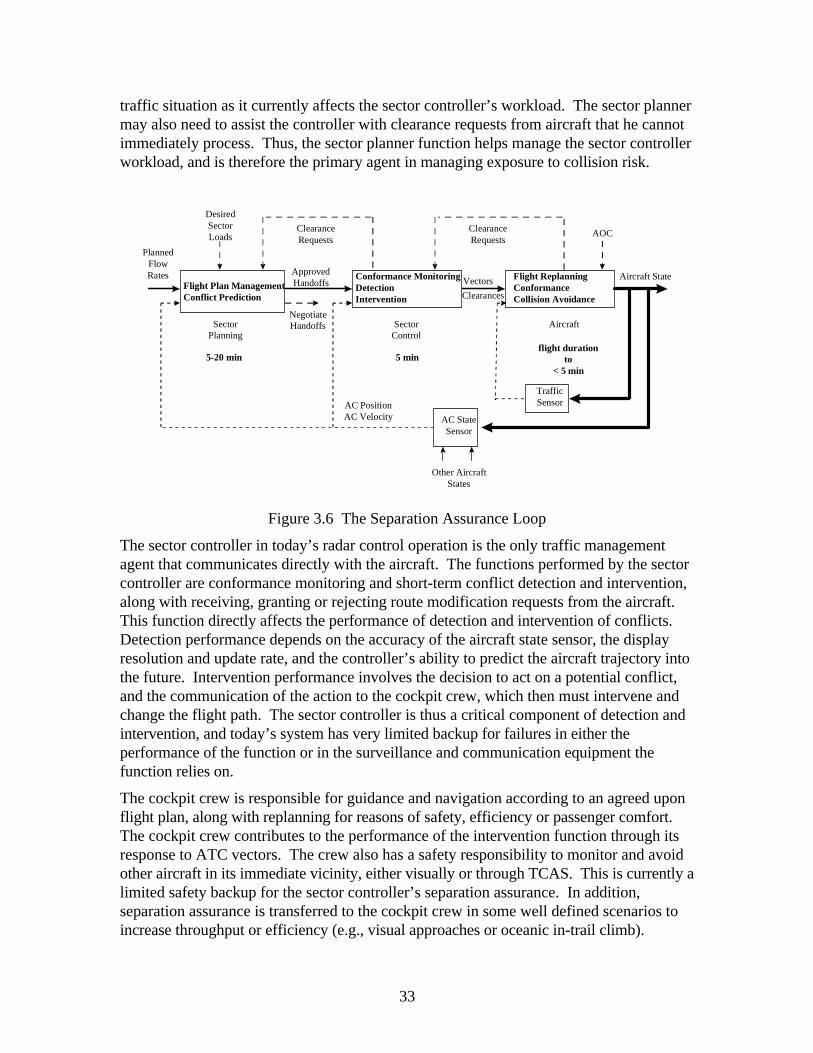
33
traffic situation as it currently affects the sector controller’s workload. The sector plannermay also need to assist the controller with clearance requests from aircraft that he cannotimmediately process. Thus, the sector planner function helps manage the sector controllerworkload, and is therefore the primary agent in managing exposure to collision risk.
Aircraft State
AircraftSectorControl
TrafficSensor
Vectors
Clearances
SectorPlanning
ApprovedHandoffs
ClearanceRequests
Other AircraftStates
NegotiateHandoffs
AC StateSensor
ClearanceRequests
AOC
DesiredSectorLoads
PlannedFlowRates Flight Replanning
ConformanceCollision Avoidance
Conformance MonitoringDetectionIntervention
Flight Plan ManagementConflict Prediction
AC PositionAC Velocity
5-20 min 5 minflight duration
to< 5 min
Figure 3.6 The Separation Assurance Loop
The sector controller in today’s radar control operation is the only traffic managementagent that communicates directly with the aircraft. The functions performed by the sectorcontroller are conformance monitoring and short-term conflict detection and intervention,along with receiving, granting or rejecting route modification requests from the aircraft.This function directly affects the performance of detection and intervention of conflicts.Detection performance depends on the accuracy of the aircraft state sensor, the displayresolution and update rate, and the controller’s ability to predict the aircraft trajectory intothe future. Intervention performance involves the decision to act on a potential conflict,and the communication of the action to the cockpit crew, which then must intervene andchange the flight path. The sector controller is thus a critical component of detection andintervention, and today’s system has very limited backup for failures in either theperformance of the function or in the surveillance and communication equipment thefunction relies on.
The cockpit crew is responsible for guidance and navigation according to an agreed uponflight plan, along with replanning for reasons of safety, efficiency or passenger comfort.The cockpit crew contributes to the performance of the intervention function through itsresponse to ATC vectors. The crew also has a safety responsibility to monitor and avoidother aircraft in its immediate vicinity, either visually or through TCAS. This is currently alimited safety backup for the sector controller’s separation assurance. In addition,separation assurance is transferred to the cockpit crew in some well defined scenarios toincrease throughput or efficiency (e.g., visual approaches or oceanic in-trail climb).
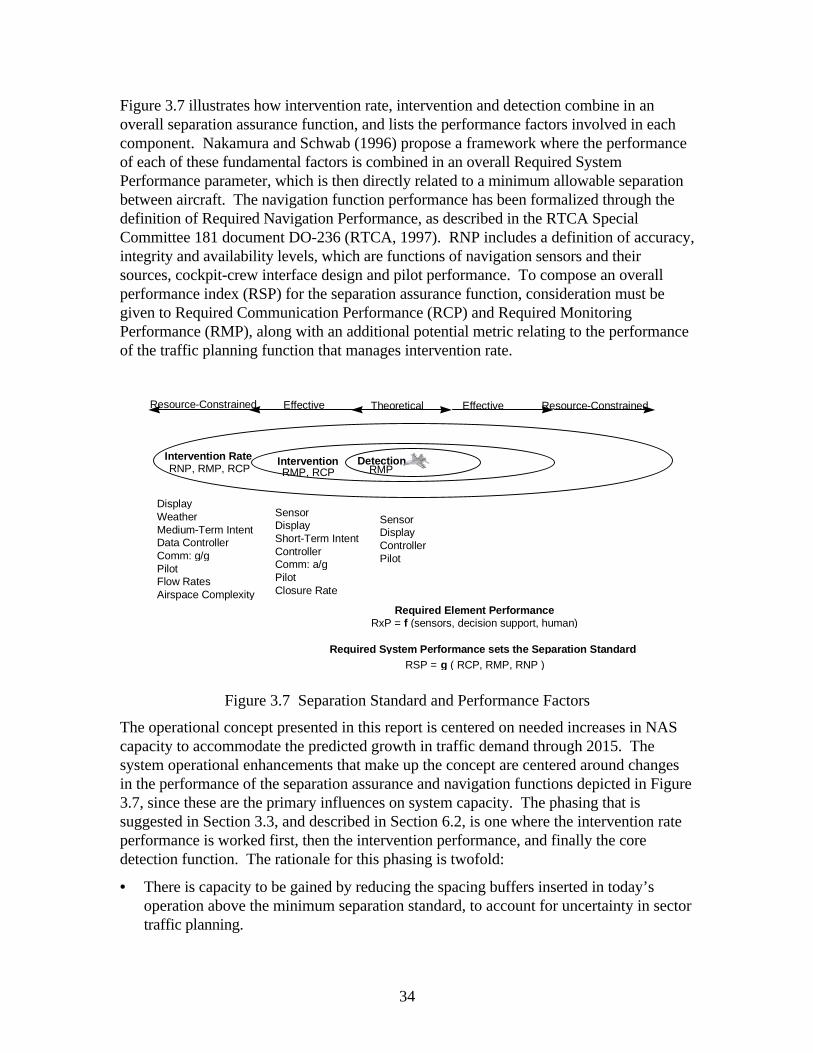
34
Figure 3.7 illustrates how intervention rate, intervention and detection combine in anoverall separation assurance function, and lists the performance factors involved in eachcomponent. Nakamura and Schwab (1996) propose a framework where the performanceof each of these fundamental factors is combined in an overall Required SystemPerformance parameter, which is then directly related to a minimum allowable separationbetween aircraft. The navigation function performance has been formalized through thedefinition of Required Navigation Performance, as described in the RTCA SpecialCommittee 181 document DO-236 (RTCA, 1997). RNP includes a definition of accuracy,integrity and availability levels, which are functions of navigation sensors and theirsources, cockpit-crew interface design and pilot performance. To compose an overallperformance index (RSP) for the separation assurance function, consideration must begiven to Required Communication Performance (RCP) and Required MonitoringPerformance (RMP), along with an additional potential metric relating to the performanceof the traffic planning function that manages intervention rate.
SensorDisplayShort-Term IntentControllerComm: a/gPilotClosure Rate
DisplayWeatherMedium-Term IntentData ControllerComm: g/gPilotFlow RatesAirspace Complexity
Required Element PerformanceRxP = f (sensors, decision support, human)
Required S ystem Performance sets the Se paration StandardRSP = g ( RCP, RMP, RNP )
SensorDisplayControllerPilot
Theoretical Effective Resource-ConstrainedEffective
Intervention Rate Intervention DetectionRNP, RMP, RCP RMP, RCP RMP
Resource-Constrained
Figure 3.7 Separation Standard and Performance Factors
The operational concept presented in this report is centered on needed increases in NAScapacity to accommodate the predicted growth in traffic demand through 2015. Thesystem operational enhancements that make up the concept are centered around changesin the performance of the separation assurance and navigation functions depicted in Figure3.7, since these are the primary influences on system capacity. The phasing that issuggested in Section 3.3, and described in Section 6.2, is one where the intervention rateperformance is worked first, then the intervention performance, and finally the coredetection function. The rationale for this phasing is twofold:
• There is capacity to be gained by reducing the spacing buffers inserted in today’soperation above the minimum separation standard, to account for uncertainty in sectortraffic planning.
35
• It is probable that the process of reducing separation standards from current radarseparations will be slow, and a great many interrelated factors will have to be worked.
Sections 4 and 5 detail the human factors and technology performance issues involved inthe system development process, and Section 8 contains a list of the primary researchtopics that the team has identified to support this concept.
3.3 A Functional View of the Proposed Concept
3.3.1 Airspace Characteristics: High Vs. Low Traffic Density
The operational concept presented here treats traffic density as the characteristic thatdetermines what operational improvements are suggested for a particular airspace. Giventhat this concept is primarily concerned with capacity improvements, high density airspaceis the primary concern here. Based on the discussion in Section 3.1.2 regarding capacityand routing flexibility, it will be assumed here that throughput has priority, and thatflexibility will be allowed to the extent that it does not detract from full utilization ofsystem capacity. Low density airspace allows more flexibility to optimize operatorefficiency, and thus the concept includes operational improvements to this end. If it isfound to be necessary to restrict traffic flexibility to maintain acceptable throughput, thenthis must be the overriding concern.
Traffic density in the NAS is highest in terminal areas around large airports, or wheremany airports are located in close proximity. Most en route airspace in the NAS can beconsidered low density from the point of view of installed CNS technologies. There are,however, areas such as the northeast corridor that have very high density en route traffic,complicated by climbing and descending traffic to airports below. Sections 3.3.2-8 detailthe operational improvements proposed in this concept for the range of airspace densityfound in the CONUS.
3.3.2 Throughput in Dense Terminal Airspace
For dense terminal airspace, capacity and throughput are the primary concern, and thediscussion in Section 3.2 is the basis for the concept. The operational enhancements thatare proposed in this concept are as follows, prioritized in the order in which they arepresented:
1. Reduce intervention rate, and the associated spacing buffers applied above thebasic separation minimum. This will be achieved through the followingimprovements:
1.1. Precision 4-dimensional (3-D space, plus time) guidance and navigation,based on area navigation (RNAV) capability, vertical guidance and acommon and accurate time source. This will effect an improvement intrajectory planning and conformance by suitably equipped aircraft, and thuscontribute to a lower intervention rate.
1.2. Precision sequencing and spacing of arriving and departing aircraft throughimprovements in the sector and/or facility planning functions. Inherent in
36
this improvement will be the same time source as onboard the aircraft,knowledge of key aircraft performance parameters and better windinformation. Automation aids to process this information and calculatetrajectory predictions will be required, along with tools to assist inoptimizing arrival and departure sequences.
1.3. Air/ground data link to exchange trajectory and weather information willbe required to take full advantage of navigation and sequencingcapabilities. Careful consideration must be given to who the agents in thedata link exchange should be, because the improved navigation, sequencingand spacing functions may allow much less reliance on ATC vectors, andthus the nature of the communications may be shifting away fromexecution and toward medium-term planning. Thus, it may be that AOCwill take on a more active role in decisions regarding aircraft sequencingpriority, and that the flow manager or sector planner will need tocommunicate directly with AOC or the aircraft through data link.
2. Improved intervention performance. This may allow further reduction in spacingbuffers, and will help set the stage for eventual reductions in separation standards.The following performance factors must be addressed:
2.1. More reliable clearance delivery. This refers to a lower error rate incommunicating clearances to aircraft, which may be achieved partlythrough the use of data link and partly through a lower intervention ratedue to improved planning and conformance described in item 1.1.
2.2. Improved intervention response time. This may be enabled by data link,given appropriate controller and crew interfaces that allow quickerexecution onboard, and where frequency congestion can be alleviated. Theimproved planning and conformance described in item 1 may also result inan a higher probability that the sector controller issues clearances in atimely manner.
2.3. More accurate prediction of time-to-go in a conflict situation. Theimprovements in trajectory prediction and conformance described in item 1,combined with automation that provides estimated time-to-go, may resultin lower false alarm rates and thus reduced spacing buffers.
3. Improved conflict detection, coupled with the improvements in items 1 and 2,should allow reductions in separation standards in dense terminal airspace. Thefollowing factors must be considered for improvement:
3.1. Tracking of radar surveillance data. Current NAS tracker has substantiallag in detecting aircraft maneuvers. Newer Kalman filter-based multiradartrackers could improve detection performance considerably.
3.2. Precision position and velocity information from on-board navigationsensors could further improve performance. In particular, an independentvelocity measurement would support improved short-term trajectoryprediction and reduce the lag in detecting maneuvers.
37
3.3. Event-based trajectory deviation reporting from the aircraft could allow areasonable compromise between position update frequency and the need todetect maneuvers or blunders in tightly space traffic scenarios.
3.4. Short-term conflict alerting tools for the sector controller would reduce theprobability of missed detection of true conflicts.
The improvements listed in items 1-3 above pertain primarily to the nominal systemperformance enhancements that may be required to support growth through 2015.Section 3.3.4 details the associated non-normal performance requirements from the pointof view of simultaneously maintaining or improving safety in dense terminal airspace.
3.3.3 Efficiency in Dense Terminal Airspace
It is conceivable that high throughput in terminal areas can be maintained with some roomfor operators to optimize efficiency. This points to the concept of dynamic planning forfleet and flight management, to improve individual or bank efficiency, which would bebased on the following operational improvements:
1. Hub schedule updates to maximize passenger throughput.
2. Trajectory negotiation and intent information sharing through data link.
3. Precision 4D navigation to maintain conformance with trajectory plan.
4. Precision sequencing and spacing to aid in maintaining throughput.
As discussed in more detail in Section 4, there are substantial unresolved issues regardingthe effect of trajectory flexibility and reliance on automation on human performance,particularly in non-normal conditions. The above list therefore would need to be subjectedto substantial concept validation studies before feasibility is proven.
3.3.4 Safety in Dense Terminal Airspace
The criticality of the detection and intervention functions will lead to a requirement forvery high availability and integrity levels, as traffic spacing is reduced in dense terminalareas. It is unlikely that the current functional and CNS architecture will be sufficient toachieve the total system certification and commissioning criteria associated with reducedseparations, and thus the following enhancements may be required:
1. Nominal performance parameters, such as accuracy and latency, will be improved asdetailed in 3.4.2-3.
2. Establish the level of criticality through risk analysis. It is clear that safetyimprovements through risk reduction with the lower separations will require higheravailability and integrity of the total system.
3. High availability of function may require independent redundancy in communication,navigation and surveillance, and in the separation assurance function element. Thismay imply independent voice and data link channels, independent navigation sourcesand two independent surveillance data sources.

38
4. High integrity of function may require an external monitor to detect failures. This,taken with item 3, points to the potential of the aircraft acting as the redundant backupfor the primary separation function, which resides with the sector controller team.
3.3.5 Separation Assurance and CNS/ATM Technologies
Figure 3.8 illustrates where some of the technologies under consideration for the NASwould be applied in the separation assurance loop for dense terminal airspace.
Aircraft StateAircraftGuidance andNavigation
SectorTraffic Control
TrafficSensor
ClearancesSectorTraffic
Planning
ApprovedTrajectories
NegotiateTrajectories
AC StateSensor
Other AircraftStates
ClearanceRequests
AOC
DesiredSectorLoads
PlannedFlowRates
Precision 4D Nav
Conflict AlertTime to Alarm
Sequencing AutomationTrajectory Planner
ADS-B, CDTI
Other AircraftStates
CPDLC
ADS-A, ADS-B
CPDLC
Vectors
Voice
ACARSAOC
DesiredHub
Schedule
Voice
Figure 3.8 Dense Terminal Airspace and CNS/ATM Technologies.
3.3.6 Efficiency in Low Density Airspace
In low density airspace, be it terminal area or en route, users should be allowed to flypreferred trajectories to the extent possible without compromising safety or throughput.This increased flexibility in trajectories will, however, carry with it:
1. Increased reliance on automation tools to predict and resolve traffic conflicts. Thisremains an open area for research and concept validation.
2. Substantial changes in traffic flow patterns both daily and hourly, therefore separationassurance agents need to move with the flow. In current operation sectors are split orcombined during the day as traffic loads change, but their geometry and the airwayswithin them remain fixed. As discussed in Section 4 this is a fundamental premise fortoday’s air traffic control methods. A complete airspace redesign for a facility or a
39
region takes on the order of years to complete, including training of controllers andreprogramming of automation equipment. Thus, dynamic flexible routing calls for anenormous change in the way separation assurance is performed.
3. Criticality of function will drive required performance levels and the feasiblearchitecture. The issues are identical to those discussed in 3.3.4, but must be appliedto a different set of automation tools.
3.3.7 Transition from Low to High Density Airspace
This operation refers primarily to the entry of aircraft into high density terminal airspacefrom low density en route areas, where routing flexibility is assumed. The primaryobjective must be the maximum throughput of the airport, with hub or individual flightefficiency as the secondary objective. The following operational characteristics aresuggested:
1. Structure is applied over a larger area as density increases, up to 200 nm radius ormore during peak traffic hours, and down to 10 nm radius during off peak hours.
2. Multiple terminal area entry points are defined, using reduced spacing based onimprovements discussed in Sections 3.3.2-5. This will help avoid long in-trail trafficpatterns that are wasteful of airspace and reduce opportunity for user preferences.
3. Data communication is used to negotiate trajectories into the terminal area, eitherbetween the aircraft and traffic planner, or AOC to traffic planner with uplink toaircraft through Controller-Pilot Data Link Communications (CPDLC).
4. Terminal area entry times are used to allocate arrival slots, and aircraft are responsibleto meet those times to ensure expedient handling.
5. Arrival and departure flows are coordinated.
3.3.8 Extended Terminal Areas
This refers to complex terminal areas with multiple airports, and even to entire regionssuch as the northeast corridor. The following characteristics are suggested:
1. Traffic flow planning is coordinated regionally across airports and en route centers.
2. Arrival and departure management is coordinated.
3. Airport configuration management is improved.
4. Surface routing and scheduling are coordinated with TMA plan.
5. Precision 4D navigation is applied.
6. Data link for 4D trajectory information exchange is in place.
7. Precision sequencing and spacing is performed.
8. Departure time uncertainty for short-haul flights must be accommodated in the plan.
40
3.3.9 National Flow Management
3.3.9.1 Planning for Operator Efficiency and Overload Protection
As illustrated in Figure 3.2, efficiency and overload protection are the dual objectives offlight and flow planning. The figure also illustrates how the system operation goes from aplan to execution, through a sequence of functions that must be coordinated to form aseamless and effective operation. Figure 3.2 illustrates how information and controlauthority flows through the system, and when considering overall system flowmanagement it is crucial to maintain a whole system view to ensure a sound systemdesign.
3.3.9.2 Time Horizons and Coordination
Flow planning is fundamentally concerned with balancing the need to plan ahead againstthe inherent uncertainty in predicting the future. From the aircraft’s point of view thereare two distinct periods involved in the flight:
• The period before departure, used for planning, checking and loading, subject toconsiderable uncertainty, but a wide range of decision options is available.
• The period while airborne, where safe flight is the primary concern, uncertainty level islow, and only a limited range of decision options remain.
Correspondingly, for flow managers to work effectively with flight planners, they shouldhave a wide range of routing and scheduling options available for aircraft prior todeparture, and it is reasonable to assume that this implies the function is at the nationallevel. However, as soon as the aircraft is ready for push-back, and can be fit into adeparture sequence, the primary concern of the corresponding flow planning function mustbe safe flight. There is still a need to replan flows to accommodate in-flight operationaluncertainty, but immediate flight safety must always be the priority.
The NAS currently operates its central flow planning function with a large level ofuncertainty due to lack of real-time schedule updates from Official Airline Guide (OAG)operators, and no predictive knowledge of any other flight plans. This leads to pooroverload protection, i.e. strains the separation assurance resources, and also leads toperiods of poor capacity utilization whith resources at times idle. Section 3.3.9.3discusses the requirements to achieve performance improvements through more completereal-time data flow. Section 3.3.9.4 discusses the efficiency gains that may be achievablethrough collaborative decision making during the flight planning phase.
The problem of accommodating in-flight operational uncertainty through replanninginvolves the following primary question:
• What is the extent of the replanning need (flight and hub optimization, anddisturbances due to weather, aircraft emergency, conflict resolution, etc.), after theinformation flow and decision making structure at the national level have beenoptimized?
41
The answer to this question is likely to vary, primarily due to weather phenomena, and sothe system may need to accommodate dynamically a range of options:
• A large level of replanning need implies a flow management mechanism with a largerscope (time and space), i.e. closer to a national or regional level. This might be causedby major weather phenomena moving through the system.
• A limited need for replanning could be handled in a more distributed manner, i.e. atfacility or sector level. This is likely to be the ‘normal day’ scenario, when severeweather is not a factor.
The frequency of occurrence, associated operational costs, or safety implications of theseoptions should determine the emphasis in the eventual system design. Section 8.3discusses the research efforts needed to perform the high level trades involved in theoverall flow management strategy.
3.3.9.3 Information Flow
The thrust of the current initiative to improve information flow between users and thecentral flow management facility is focused on the following four areas, as described in theoperational concept document for ATM-AOC information exchange (RTCA, 1997):
• Current operators, with published OAG schedules, will provide real-time scheduleupdates to central flow, including flight cancellations, diversions and other decisionsmade by the operator in response to major disruptions.
• Central flow management will include more users in the gate-hold program, in aneffort to reduce the uncertainty associated with non-OAG traffic demand in thesystem.
• Common weather forecast information will be made available for all users and flowmanagers, in an effort to build consensus on traffic initiatives.
• NAS status information will be made available to users, to the extent to which itaffects traffic flow through the system.
3.3.9.4 Collaborative Decision Making
This initiative, as described in the RTCA Task Force 3 Report on Free Flight (1995), isfocused on giving system users more freedom to make decisions in response to traffic flowrestrictions. This is essential to reduce the cost of major disruptions in system throughput.The primary components of the initiative are:
• Users manage response to delay, after an overall delay allocation from central flow.This involves the user allocating arrival/departure time to individual aircraft in theirfleet, or opting to re-route around congestion areas.
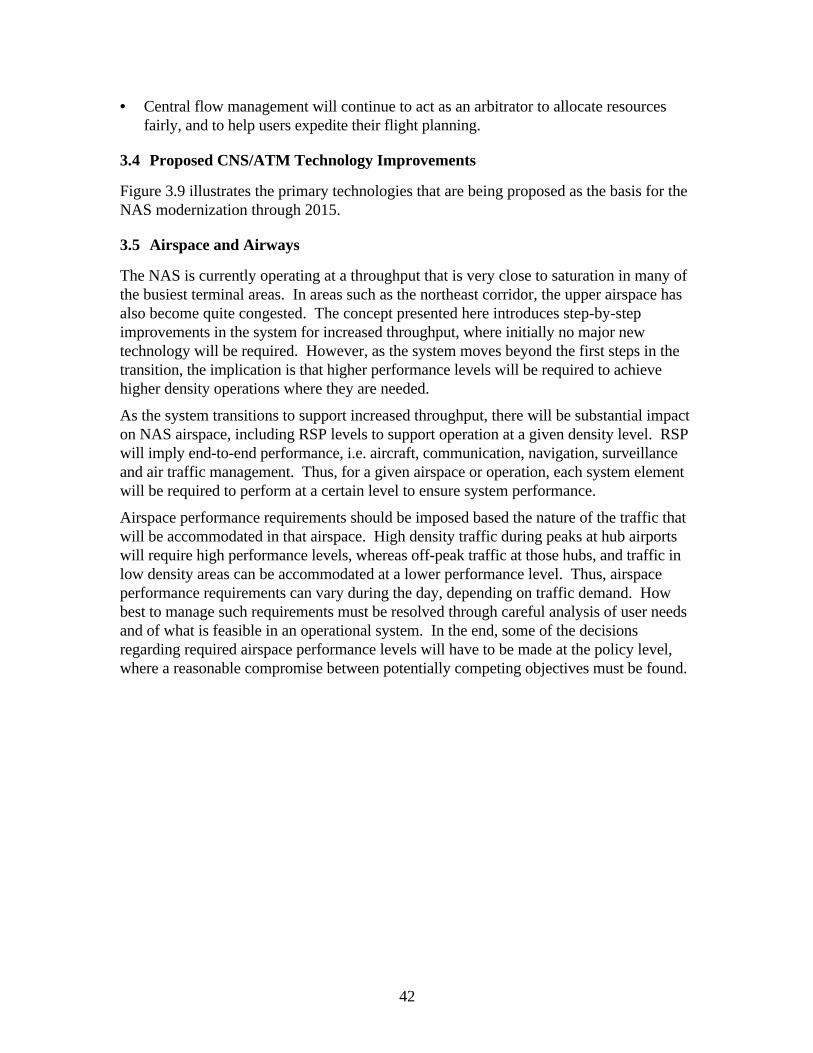
42
• Central flow management will continue to act as an arbitrator to allocate resourcesfairly, and to help users expedite their flight planning.
3.4 Proposed CNS/ATM Technology Improvements
Figure 3.9 illustrates the primary technologies that are being proposed as the basis for theNAS modernization through 2015.
3.5 Airspace and Airways
The NAS is currently operating at a throughput that is very close to saturation in many ofthe busiest terminal areas. In areas such as the northeast corridor, the upper airspace hasalso become quite congested. The concept presented here introduces step-by-stepimprovements in the system for increased throughput, where initially no major newtechnology will be required. However, as the system moves beyond the first steps in thetransition, the implication is that higher performance levels will be required to achievehigher density operations where they are needed.
As the system transitions to support increased throughput, there will be substantial impacton NAS airspace, including RSP levels to support operation at a given density level. RSPwill imply end-to-end performance, i.e. aircraft, communication, navigation, surveillanceand air traffic management. Thus, for a given airspace or operation, each system elementwill be required to perform at a certain level to ensure system performance.
Airspace performance requirements should be imposed based the nature of the traffic thatwill be accommodated in that airspace. High density traffic during peaks at hub airportswill require high performance levels, whereas off-peak traffic at those hubs, and traffic inlow density areas can be accommodated at a lower performance level. Thus, airspaceperformance requirements can vary during the day, depending on traffic demand. Howbest to manage such requirements must be resolved through careful analysis of user needsand of what is feasible in an operational system. In the end, some of the decisionsregarding required airspace performance levels will have to be made at the policy level,where a reasonable compromise between potentially competing objectives must be found.
43
Aircraft StateAircraftGuidance andNavigation
AC StateSensor
Traffic Control
TrafficSensor
Vectors
ClearancesSectorTraffic
Planning
NationalFlow
Planning
ApprovedFlight Plans
ApprovedHandoffs
DesiredSectorLoads
ClearanceRequests
Other AircraftStates
FlightPlanning
WeatherNAS Status
FlightSchedule
FiledFlight Plans
NegotiateHandoffs
Schedule ofCapacities
< 5 min5 min5-20 minhrs - day
FacilityFlow
Planning
hrs
ExecutionPlanning
PlannedFlowRates
CTASSMA
UPRURETCTASSMA
AOCNETCDM
ATNRadar Net
CPDLC
CPDLC
ADS-BCDTI
TrackerADS-AADS-B
AOC
CTAS
Voice
Voice
NASWIS
Delay Est.
ACARS
Figure 3.9 Overview of Proposed CNS/ATM Technologies
3.6 Airports
The throughput growth requirements presented in Section 2 imply a need for additionalrunways in the system, and it is likely that this will have to be met both at existing hubsand at other airports. As presented in the NAS Stakeholder Needs report thataccompanies this document, the system users are unanimous in their concern aboutcontinuing access to airports, given that it is becoming increasingly difficult to getapproval for any new runway construction.
Airport construction and operational cost is a fundamental issue where economic growthvs. shorter term business objectives must be carefully weighed. As detailed in the NASStakeholder Needs report, the NBAA expressed concern about continued economicalaccess to smaller airports, because their members see this as essential for the growth ofsmall business outside the major population centers.
Another issue of interest is the potential introduction of new types of air transport vehiclesinto the NAS. The current development of a civil tiltrotor aircraft is an example, where anew aircraft user class could potentially contribute to the growth in system capacity. Inthe case of the tiltrotor, one proposed scenario is that a portion of the current small jettransport market could be served with tiltrotor aircraft, that would operate independentlyinto and out of heliport facilities at hub airports. This might bring added throughputwithout the need for major new runway construction, but would instead require otherchanges in both airspace and airport facilities. The viability of this concept will ultimatelybe determined based on economics, where the seat-mile cost will drive the potentialmarket share, but some policy level decision may have to be made regarding the neededinfrastructure investment.
44
3.7 Flight Service Stations
The NAS Stakeholder Needs document details the concerns of the NAS users that rely onFlight Service Stations for information needed during flight planning. This concern isfocused on flight safety related to weather conditions, and to airspace access throughflight plan filing. It must be kept in mind that the safety concern is supported by existingdata on accident rates, and it is probable that improvements in content and presentation ofweather information at Flight Service Stations would reduce the accident rate in thissegment of the system. The cost is probably the primary issue here, and there is animmediate need for innovative economical solutions for this system component.

45
4 Human Factors
This section addresses some of the major thrusts in the role human factors must play inenabling increases to the throughput of the ATM system. The primary focus of Section 4is on human factors roles and issues in increasing throughput in the terminal area.However, the basic thrust of human factors involvement as well as the issues addressedapply throughout the ATM system. Section 4.1 frames the top level issues. Section 4.2describes areas where human factors involvement in the system research, development,design and implementation process should be improved. Section 4.3 raises some keyhuman factors issues that require research and development to avoid the unwanted side-effects that tend to develop from technically focused initiatives.
4.1 The Search For Greater Throughput And The Demands On The Human
Automation will always be beneficial?: the data obtained in experimentsemploying fine grained performance and workload measurements indicate thatmany ‘tools’ will not be used as predicted or even at all, especially under hightask loading conditions.
(Jorna, 1997)
The current ATM system is a large, complex, almost organic system with humaninteractions as the glue that holds it all together. Controllers and pilots manipulate andmanage complex subsystems in real time. They also manage the inherent risks, withinthese subsystems, through being adaptive and flexible in times of critical circumstances.These factors tend to make the development and design of new systems very complex.The fact that the system has both tightly coupled and loosely coupled components furthercomplicates the task of defining, designing, and implementing changes which will increasethe throughput of the system and protect safety levels. It is this need for increasedcapacity that is driving the need for change. If the American Airlines forecast (Chew,1997) of impending severe throughput limitations in terminal airspace is valid, then changemust occur in the entire system. Since humans play central roles within this system, it canbe reasoned that a major drive for increased throughput will also drive a requirement formajor changes in the roles of the humans in the system and consequently in the tasks theyperform.
Human factors input is a key element in determining the way that changes to the humanrole should best be managed in order to achieve increased capacity without suffering theunwanted side effects that could adversely affect safety.
4.2 The Role Of Human Factors In Enabling Change
Before actual changes can be discussed or determined it is essential to have an appropriateframework for the process of research, development, design and implementation itself.Combined with this system development process there is a need to identify andincorporate the right skills and knowledge into a team.

46
4.2.1 Baseline Data Of Human Roles
In order to have a reasonable level of confidence in the successful evolution towards asystem that achieves the capacity goals stated in Section 2, there is a need for acomprehensive, integrated description of human behavior (both physical and cognitive) inthe system. The description would serve as a baseline against which to compare proposedchanges to the system. Such a baseline provides by far the most cost effective way ofestimating potential impact of proposed change before the costly process of prototypedevelopment and testing is undertaken. The valuable framework that such a database canprovide should not be underestimated.
An excellent review of human factors research relevant to various aspects of air trafficcontrol has recently been published by the National Research council’s Panel on HumanFactors in Air Traffic Control (Wickens, 1997). Many of the references in this workprovide pieces of the puzzle of human behavior in the ATM system. The work of thePanel is probably the first comprehensive step in providing a knowledge base for humanbehavior in the ATM system. The next part of that team’s work should add greatly to aknowledge base.
The availability of both the database and knowledge base should provide a powerful toolfor focusing the development and assessment of decision support tools.
4.2.2 Involvement Of Human Factors From Concept Development Through FinalDesign
The role of human factors in system development must not be confined to that ofmodifying the results of earlier design decisions to ensure user acceptability. Failure toconsider human performance capabilities and limitations from the very beginning ofconcept definition can lead to inappropriate design and serious compromises in systemproductivity and even safety. Human factors specialists must be full members ofinterdisciplinary development and design teams from the start of the development cycle, sothat both the strengths and weaknesses of the human subsystem can be adequatelyaccommodated in the final design.
The design team should include the design engineers and end user personnel as well as thehuman factors specialists; the latter often play a mediating role between designer and user.The emphasis here on inclusion of end user personnel is important. However, there is aneed to ensure that the end users are well versed in the principles and skills used by theother team disciplines. These end users tend to become untypical because of theirinvolvement in the development process, thus there is a need for regular reviews involvingmore typical end users.
The multi-disciplinary design teams should work closely through the entire spectrum ofdevelopment tasks from concept development and function analysis/allocation throughpreliminary design and prototype development and system evaluation with specialemphasis on human performance testing. Section 4.2.3 discusses the involvement of theteam beyond this point, but it cannot be too strongly emphasized that human factorsspecialists should be full members of such teams from the beginning of their existence.
47
4.2.3 Human Factors Support For Implementation, Education, And Training
The involvement of human factors should continue beyond the design stage into theimplementation process. There is a tendency to allow modifications to the final design tobe made by the end user to facilitate implementation. This needs to be carefully controlledby involving human factors and end users together. It is very easy to lose some or much ofthe effectiveness of the original design concept through misinformed or uninformed finaldesign modifications choices which can lead to loss of efficiency, and possibly have safetyimplications.
New systems require fully developed implementation plans which include educating theusers on the logic, capabilities, and rationale of the new system operation as well as itsrole in the overall ATM system. The operators of a system will tend to look upon changesin system design as extensions or refinements of current practice and may fail tounderstand the need for new and different tasks and procedures to realize productivity andsafety. This need for education and training was one of the main conclusions of the PD1simulation report (Eurocontrol (1997), PHARE Development simulation 1). Theeducation process is in addition to the typical training that operators will receive with theintroduction of new equipment or procedures. The baseline data, described earlier inSection 4.2.1, will be invaluable in supporting the development of the implementation planfor new equipment and procedures.
Without a positive and proactive education and training program there is likely to beconsiderable transfer of old attitudes and working methods, often referred to as negativetransfer. In developing the implementation plan, very careful attention must be paid to thepotential for transfer of habits used to accomplish tasks under the old system which, ifapplied with the new system, would seriously compromise efficiency; but moreimportantly safety. Such negative transfer is most often evident when operators are underconsiderable stress. Again, the baseline database will provide an effective tool in theidentification of potential negative transfer.
4.2.4 Designing To Support Human Performance Across The Entire Range OfSystem Operating Conditions
The air traffic domain is comprised of many complex subsystems, it is subject to thevagaries of the weather, it is also operated by many different individual humans eachhaving their own slight differences in behavior as well as each being prone to error ormisjudgment. The net effect is a system with many minor disturbances and potentialexceptions, the majority of which never develop into reportable incidents - because of theinfluence of the adaptive human being. There are also the rare-normal and abnormalconditions which develop, but with much less frequency.
It is critical when designing decision support systems to include the capability to explicitlypresent to the operator the limits of the system with respect to operating conditions.The operator cannot be left to guess or assume system status and shortcomings underspecific conditions when asked to step in and perform manually what the system hasheretofore been accomplishing automatically. This issue will be treated in more detailwhen discussing the issue of decision support systems in Section 4.3.1.
48
Capturing the range of normal, rare-normal, and abnormal conditions is itself difficult.The baseline database must do this for the operations as they occur today. Controllers andother end users must be key members of the team which develops this database. In fact, anumber of end users from very different ATC environments should participate and reviewthe database to ensure adequate capture of operating conditions.
4.3 Human Factors Issues Affecting Tactical Control
This section identifies the major human factors issues that have an impact on the search forincreased capacity in the tactical domain of the air traffic management system.
The terminal and tower domains are probably the most dynamic parts of the air trafficcontrol environment. They are both time- and safety-critical, and the central role of thehuman in these domains is both skill- and practice-critical. These environments aremanaged by many individual controllers, all in the very exposed situation of having noimmediate support for their tasks. This is because in tower and terminal control there isnot usually a second controller working in close contact (like the ‘D’ side of en route).Thus the controller is a potential single point failure which, when combined with the singleVHF radio channel for communications, makes for a high level of risk in the event of afailure in either of these two subsystems. The pressure on the controllers and pilots in thisenvironment has a greater significance when taking into account the nature of terminal andtower operations. It is here that most rare-normal situations occur involving aircraftfailures, pilot errors or weather effects. This is also where separation standards are usedas the target separation distances to achieve maximum throughput. Allowing a little extraseparation reduces throughput, while a judgmental error the other way causes a loss in thesafety separation. In addition, there is always the potential for an aircraft to suffer someform of technical problem. The terminal and tower environments are thus very difficultdomains in which to implement change and the challenge must not be underestimated.
Sections 4.3.1 - 4 attempt to frame the specific human factor issues that affect increasingthroughput in the terminal airspace. These issues were raised earlier within Section 3.4.The issues of one section tend to be influenced by issues in other sections. This is thenature of the system, complex and interconnected with adaptive, reasoning humans in akey role.
4.3.1 Decision Support Systems
The term ‘decision support’ covers many different types and levels of computerizedsupport or guidance to the human operator. The main issues associated with decisionsupport are the growing dependency that tends to occur and the effect that the supportcould have on the ability to maintain situational awareness.
Whatever the nature of the support system, it is clear that controllers and pilots respond ina very similar way to other living organisms by developing a growing dependency on thesupport. This growing dependency has been described in various sources and has a majorimpact on the way that human roles should develop within air traffic control systems.
49
“System designers, regulators, and operators should recognize that over-reliance(on automation) happens and should understand its antecedent conditions andconsequences”
(Parasurman, 1997)
This dependency can be expected to grow not only as a function of time and confidencein the system, but it can also be expected to grow as a function of lack of knowledge ofhow the system functions without the presence of that support. Thus, new (relativelynaive) operators who do not have the same skill and experience base as the existingoperators, can be expected to display dependency quicker than operators who have thispre-support experience. Growing dependency has implications on how the system copeswith failures, errors and exceptions. Therefore it is essential that such dependency isaccounted for not only in the development, design and implementation stages but alsoduring the certification procedures where issues of availability, reliability and redundancyare raised.
The second issue to be raised about decision support systems is how they affect theoperator’s ability to maintain the necessary level of situational awareness. A key aspect ofsituational awareness is the ability to identify when intervention is necessary and thenintervene as required.
Controllers formulate a ‘tactical plan’ which is constantly being executed and modified inreal time. This tactical plan is their baseline for actions within their domain ofresponsibility. The plan demands that certain information is accessed and processed in atimely manner. If the necessary information is not available, then this absence is itself atrigger to change tactics. Thus triggers to tactical actions can be derived from the absenceor presence of information. This knowledge of what should be present, but is not, wouldhave to be explicit in the support tool design; lack of required information requires someform of ‘flag’.
The whole aspect of situational awareness, what it is, where it comes from, whatinformation is needed when (in order to support it), is still not adequately understood. Toplace decision support systems into such a domain of incomplete knowledge is an actionthat should be treated with great caution.
Most aspects of these two issues can be addressed using a series of questions about theproposed new process or tool:
• Has the level of expected dependency on the new support tool by new operators beenidentified?
• What is its availability - how often is it prone to fail?
• What is its reliability - what are the situations when its output is highly variable?
• What online checks are being made on its reliability - are these continuous or periodic?
• Is it the human operator that verifies the output? If so, is this operator capable ofmaking those reliability checks?
50
• What are the back-up procedures to take into account failure, degradation orinappropriate outputs?
• What verification procedures are used to ensure required availability of back-upsystems/procedures?
• Are these back-up systems and procedures available, online and well practiced?
• What is the certainty that any necessary human intervention skills are of theappropriate level of proficiency and availability - does this change with time andpopulation structure - how is this tested and how frequently?
There needs to be more research in the whole area of decision support tools, and how theyare subject to growing dependency and affect the maintenance of appropriate situationalawareness.
4.3.2 Intent
There are several issues surrounding the content and availability of intent information thathave an impact on the effectiveness of decision support systems and have majorimplications requiring human factors consideration.
The main issues are:
• Where is the knowledge of the intentions of each aircraft and of the tactical controller?Is it in the Flight Management Computer (FMC) or other computer or is it insomeone’s head?
• How accurate and reliable are these intentions?
• How long are they valid?
• How can these intentions be made available to the decision support system in order toallow it to function with the best quality data available?
• How can the system be kept updated or informed when disturbances occur thatdemand rapid re-planning on the part of both pilots and controller?
‘Intent’ is the description of how the future is most likely to unfold, and in it there is anattempt to shape the future. Thus intent involves elements of both prediction and pre-determination. Airborne technology has developed to a state that is allowing prediction ofthe future, from the individual aircraft’s point of view, to be realized with a fairly highdegree of certainty. This high level of certainty is the result of the FMC’s working toensure that predictions come true; the FMC ensures conformance; the future state(s) is/areconstraints that should be achieved.
Intent is not confined to the aircraft and its plan; it is also an important aspect of thecontroller’s method of managing a domain of responsibility. The controller’s intent is anextension forward in time of the dynamics of the current situation, identifying wheremodifications will be necessary to maintain safety and achieve pilots’ requested profiles.The air traffic control system functions principally through the action of the controllercombining all the individual pilot intents with his/her own intent into an overall plan,

51
arbitrating wherever intents conflict. The intent information then becomes a constraint towhich each pilot and the controller attempt to conform. Controllers that talk of ‘havingthe picture’ are referring to knowing not only both the current status and intent, but alsoof having a plan for the future. They are fully aware of the situation.
The controller’s intent currently tends to exist only in the head of the controller. Ground-based decision support systems need to have knowledge of the controller’s intent in orderto support the execution of the ‘tactical plan’. These issues are made more difficult toresolve within the terminal and tower domains by the nature of the operations in thosedomains. Terminal and tower are very time-critical and tend to have both a highmechanical task loading as well as a high cognitive loading. This places extreme demandson decision support systems for the terminal environment both in terms of task loadingand situational awareness.
Thus there are major issues surrounding the requirements for a better understanding ofregistering intent:
• How to get intent into the system
• How to ensure its validity
• How to update it or declare it invalid
There is another set of issues surrounding the possibility of using some decision supportsystem to create its own plan, thus resolving human input problems. The main issue in thisapproach is how to inform the operator about the system’s plan, (especially if the human isthe back-up system).
Decision support systems will have limited effect unless they have knowledge of both thepilots’ and controller’s intentions. It is the sharing of intention and then the formulation ofa plan that are key elements in achieving greater throughput whilst maintaining orimproving safety.
4.3.3 Using Structure To Maximize Throughput
The usual response of controllers, when the demand for throughput increases, is to imposesome structure as to how traffic flows through their domain of responsibility. This hasbeen raised as a possible strategy for maximizing throughput in Section 3.4.7. Theimposition of various restrictions, in a structured form, is an attempt to control thecomplexity which results from having many pilots each with different requirements. Astraffic load increases, the controller tends to move from a mode of processing individualrequests to one of restricting individual aircraft so that they fit into a certain structure.
A number of options are available:
1. The structure can be predetermined and accessible to the pilots for planning; e.g.,Airways, SID’s, STAR’s, or
2. It can be predetermined but not available to the pilots; e.g., letters of agreementbetween air traffic control facilities on the use of flight levels or routes, or
52
3. It can consist of predetermined actions based on group or individual experience andnot published anywhere, and can be as extreme as stopping all departures from aparticular airport if a sector becomes dangerously overloaded.
There are major differences in the controller’s cognitive workload between allowingaircraft to fly in a non-airways system, searching for conflicts as the traffic levels grow,using novel strategies for each situation, versus that of enforcing structure and limitingconflicts to particular, well-defined points where pre-determined strategies can be utilizedto resolve them.
The current strategy for reducing the cognitive workload on controllers when predictingconflicts is to restrict traffic to conform to a particular structure. In this way, the cognitiveload per aircraft can be reduced so that the overall level (resulting from the total traffic)remains at a manageable level.
The degree of detail on each aircraft’s passage through a domain of responsibility, whichthe controller must retain, can be reduced using this structuring technique. If all aircraftare on individual routes and profiles, then the removal of all structure and constraints fromthe ATC system may well reduce the actual incidence of conflicts. However, although theincidence of actual conflict may be reduced, there would probably be an increase in thecontroller’s cognitive load because of the demand for more detail on each individual flightin order to detect potential conflicts.
It is important to keep in mind that the primary role of the controller is to detect andresolve potential conflicts, before they become actual conflicts. The act of tactical planningand its constant revision reflect this responsibility. (See Section 6.4 for a discussion onhow to reduce the workload of searching for potential conflicts).
This issue is most obvious in terminal airspace where, due to the uncertainty of aircraftperformance in the vertical plane and the lack of good quality intent information currentlyavailable, there are many more potential conflicts than for aircraft in a more stable cruiseenvironment. This aspect of detecting potential conflicts and understanding the heuristicsfor determining what is a potential conflict are important aspects when establishing fasttime simulations to forecast the effects of different airspace organizations. It is thepotential conflict that creates workload for the controller, and in any situation whereaircraft are climbing and/or descending towards each other there is a need to manage theuncertainty of these potential conflicts by close monitoring and probably positiveintervention until the situation becomes certain.
How controllers assess and manage uncertainty needs to be clearly understood beforeschemes that involve removal or modification of some of the structures used to manageuncertainty are implemented. Human factors knowledge needs to be used in determiningthe impact of airspace structure on capacity, and the requirements for support for thecontroller’s cognitive workload in a system that has less structure than at present.
4.3.4 Sharing Responsibility
Responsibility for separation assurance is usually vested in the controller except for veryspecific situations (i.e. during visual meteorological conditions (VMC) when limited
53
aircraft-to-aircraft separation responsibility can be delegated to the pilots concerned).Controllers assess how all the aircraft are flowing through a sector or area ofresponsibility, working out where adding structure (perhaps in the form of temporaryrestrictions) will reduce the incidence of conflicts. When conflicts do occur, there is abalancing of the needs of the individual aircraft and an attempt to confine the side effectsof any resolution maneuver to as few aircraft as possible. The controller, in any conflictresolution strategy, balances the demands of each aircraft against the needs of all theaircraft that are implicated. As discussed in Section 4.3.2, controllers impose structureduring dense traffic scenarios in order to reduce the incidence of conflicts. This is astabilizing and throughput maximizing strategy. The controller acts as arbiter where thereis a conflict of interest, but does not have time to discuss the resolution strategy.
Is it possible to transfer separation assurance to the pilots in the terminal area to achieveVMC-type separation distances in instrument meteorological conditions (IMC) andthereby increase runway utilization?
The terminal area encompasses the most demanding phases of flight for pilots: approachand departure. Taking on the additional role of separation assurance would have thepotential of considerably increasing that workload in IMC. In the event of any on-boarddifficulty, pilot workload would rise, probably necessitating a reduction of overall tasks.It is also probable that in order to achieve the goal of safe and stable flight the first task tobe off-loaded would be the separation assurance task. The transfer of such a responsibilityback to the controller would have to be explicit in order for each party to be aware of theextent of changes in his/her responsibility. Such a sudden transfer at a time of already highpilot workload could also lead to a situation of higher than acceptable risk. The aircraft isalready experiencing difficulty, and the intent information required as input to any decisionsupport system may be rapidly changing without either the system or the controller beingaware of the extent of these changes. In additional, separation standards associated withairborne separation assurance concepts might be less than those which an unsupportedcontroller could sustain. Thus the controller is presented with a situation where theappropriate separation does not exist for ground-based separation. In this context, thesystem is potentially fail-dangerous.
By going through this type of failure mode analysis, it is clear that if separation assuranceis shared with the flight deck in order to achieve reduced separation standards, thenadequate redundancy must be provided to prevent the immediate reversion to control byan unsupported controller on the ground. This points to a need for consideration of somecritical human factors issues on the flight deck, not the least of which is a major potentialshift in pilot roles, tasks and operating procedures. There seems little likelihood that pilotswill be able to support aircraft-based separation in potentially high workload scenarioswithout the integration into the cockpit of major decision support systems. In such ascenario human factors issues which are raised, both in the cockpit and at the controller’sworkstation, should be examined without delay.
The other issue connected with the sharing of responsibility is that of ensuring that actionschosen by pilots as resolution strategies do not cause other conflicts. There is a need toconstrain the possible range of strategies commensurate with traffic conditions.

54
It is probable, in light traffic conditions, that certain conflicts could be delegated to pilotsto resolve without maneuver restriction. But in heavy traffic conditions, restrictions wouldneed to be imposed on available strategies in order to prevent a ripple effect on otheraircraft. Once again, unless significant information and suitable support systems areprovided to the pilot, the initiative for limiting maneuvers must be provided by someonewith an overview of the situation. It is likely that the controller must continue to providesuch oversight. In this case, the expectation of aircraft-based separation in anything butthe least dense traffic scenarios must be seriously questioned.
Any issue that affects the roles of pilots or controllers as well as the tasks they perform toexecute those roles needs to have the human factors issues carefully considered in order toprevent unwanted side effects.
55
5 Available and Emerging Technology
5.1 Introduction
5.1.1 System Performance
To achieve reduced airplane separations in part requires a formal definition of systemperformance that encompasses improved communications, navigation and surveillanceperformance. In addition, a formal characterization is required of the airspace environment(e.g., airspace configuration, traffic characteristics, available functionality, proceduresdefinitions) for both nominal and rare-normal performance (e.g., failure modes, temporaryconstraints such as weather, etc.).
Experience has shown the need for a formal definition of system performance. Forexample, more precise departure and approach paths and direct routings for improvedairspace operations were expected with the introduction of area navigation technologysuch as that introduced in the initial 757/67 aircraft fielded in 1982. A more completecharacterization of systems capabilities and features (i.e., the airplane operatingenvironment and air traffic infrastructure) since 1982 has led to incremental step benefits.Total system performance characterization of the primary variables enables the higher levelof performance and closer permitted separation.
The proposed definitions of the required performance components for navigation,communication and surveillance are summarized in the following paragraphs. RNP hasbeen adopted by the ICAO Required General Concept of Separation Panel (RGCSP) andAll-Weather Operations Panel (AWOP), implemented in the Boeing 737, 747, 777 models(757/767 will be certified in early 1998), and is ready for initial operational approval. RCPand Required Monitoring Performance (RMP) are in various stages of development.These performance definitions can be combined in many ways to support the reduction ofbuffer regions in airplane separation. However, the identification of Required SystemPerformance must find a practical set of CNS capabilities that address operational needs ina way that provides intended efficiency while maintaining or increasing safety. Toillustrate the objective of RSP, one can conceive a protection volume around the airplane,whose size depends on the dimensions of the combined communication, navigation,surveillance performance, and synthesizes into an RSP performance characterization.
5.1.2 Communication Performance
Airplane communication requirements for each phase of flight are a function of thecontroller-pilot communication needs. These vary greatly with traffic complexity anddensity, the weather conditions, the controller’s needs to issue clearances and vector theairplane or simply to establish contact with the crew.
Increased communication performance will be provided through air/ground data linkcommunications integrated into the Aeronautical Telecommunication Network (ATN) tocomplement the current voice communications means. This evolution to more datacommunications together with increased flexibility in the use of communication
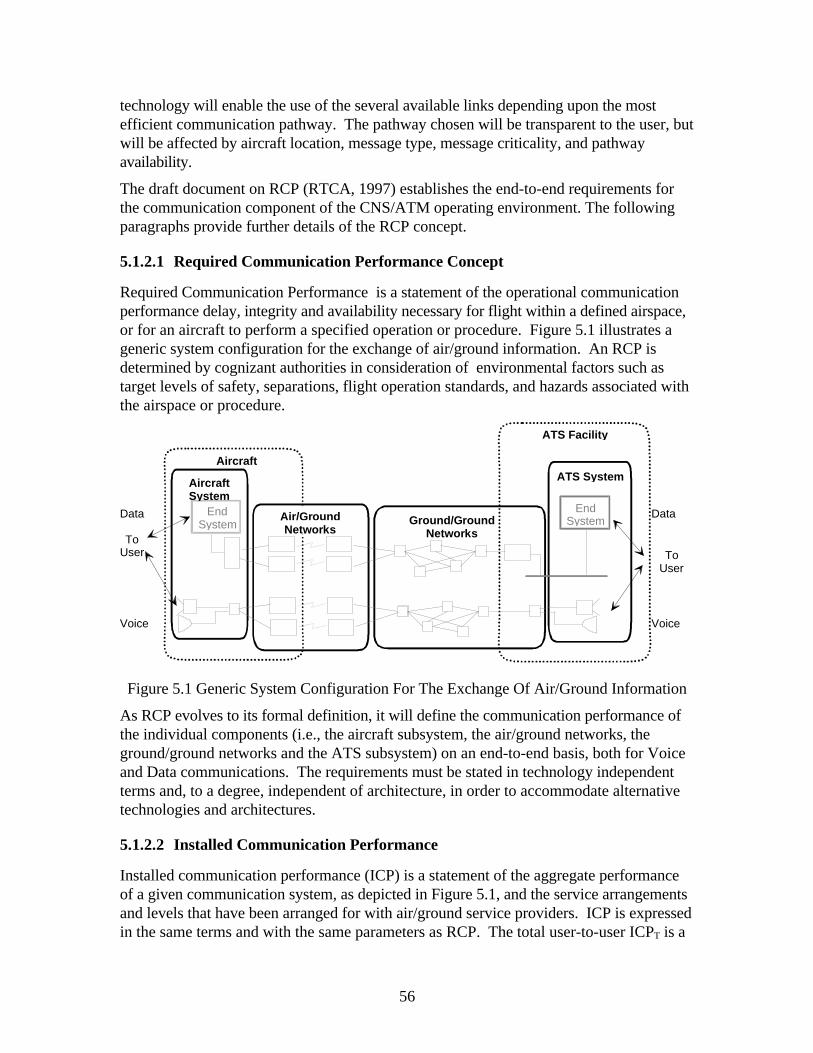
56
technology will enable the use of the several available links depending upon the mostefficient communication pathway. The pathway chosen will be transparent to the user, butwill be affected by aircraft location, message type, message criticality, and pathwayavailability.
The draft document on RCP (RTCA, 1997) establishes the end-to-end requirements forthe communication component of the CNS/ATM operating environment. The followingparagraphs provide further details of the RCP concept.
5.1.2.1 Required Communication Performance Concept
Required Communication Performance is a statement of the operational communicationperformance delay, integrity and availability necessary for flight within a defined airspace,or for an aircraft to perform a specified operation or procedure. Figure 5.1 illustrates ageneric system configuration for the exchange of air/ground information. An RCP isdetermined by cognizant authorities in consideration of environmental factors such astarget levels of safety, separations, flight operation standards, and hazards associated withthe airspace or procedure.
Aircraft
Ground/GroundNetworks
ATS Facilit y
ToUser To
User
EndSystem
EndSystem
AircraftSystem
ATS System
Air/GroundNetworks
Data
VoiceVoice
Data
Figure 5.1 Generic System Configuration For The Exchange Of Air/Ground Information
As RCP evolves to its formal definition, it will define the communication performance ofthe individual components (i.e., the aircraft subsystem, the air/ground networks, theground/ground networks and the ATS subsystem) on an end-to-end basis, both for Voiceand Data communications. The requirements must be stated in technology independentterms and, to a degree, independent of architecture, in order to accommodate alternativetechnologies and architectures.
5.1.2.2 Installed Communication Performance
Installed communication performance (ICP) is a statement of the aggregate performanceof a given communication system, as depicted in Figure 5.1, and the service arrangementsand levels that have been arranged for with air/ground service providers. ICP is expressedin the same terms and with the same parameters as RCP. The total user-to-user ICPT is a
57
function of all the ICPs of elements between the users (i.e., communications elementsbetween a pilot and a controller). Once ICPT is determined, it can be compared against aspecific RCP to determine if the RCP is met.
Determination of ICPT is part of the process of gaining operational approval for the givenRCP airspace or operation. ICP is inherently tied to one or more specific technologies. Itis the term used to describe the performance of the particular communication path ascertified by the cognizant authority. ICP can be associated with a given aircraft because itis strongly influenced by the aircraft’s equipage and the communication supportarrangements that have been made for it.
5.1.2.3 Actual Communication Performance
Actual communication performance (ACP) is an observation of the dynamic operationalcommunication capability of the same communication elements as was used for thedetermination of ICP. ACP is expressed in the same terms and parameters as are RCP andICP, but at a given instant may differ from the ICP of a particular path. ACP can bedetermined by monitoring the communication path or by monitoring the current conditionof the elements of the path. It is recognized that various cognizant authorities may wish tospecify the necessary reactions of the airspace manager and flight crew when ACP differsfrom ICP.
5.1.3 Navigation Performance
Airplane navigation requirements for each phase of flight are a function of airplaneseparation requirements. The separation of aircraft and obstacles also providesrequirements especially in the approach/landing phase. A high degree of confidence in theaircraft staying within a specified volume of airspace is needed to establish separationstandards. The dimensions of this volume are based on the probability of the aircraftnavigation system performance not exceeding a specified error. However, airplaneseparation criteria established by the FAA also account for the availability and limitationsof communications, and surveillance services, as well as operational factors (e.g., thecrew/autopilot’s use of the navigation information to control the airplane position) inaddition to navigation requirements.
The increased equipment accuracy and world wide coverage of new systems based onGlobal Positioning System (GPS) navigation will greatly improve operations because ofthe performance limitations of ground aids. This is achieved in large part by providingincreased integrity monitoring and more reliability. As navigation evolves to satellite basedaids, consideration of additional failure modes will have to be considered. These andpotentially more sophisticated crew alerting schemes will keep driving new requirementsas applications evolve. Cost considerations may become driving factors, but minimizingthe impact on crew interfaces as a fundamental design philosophy will help as will thepotential use of navigation technology developed for the mass market.
RTCA’s document DO-236, “Minimum Aviation System Performance Standards:Required Navigation Performance for Area Navigation” (RTCA, 1997) establishes therequirements for the airborne navigation component of the CNS/ATM operating
58
environment. These standards will be used by the service providers and users to obtainoperational benefits and may be used to varying degrees depending on the operatingenvironment. The following paragraphs provide further details of the RNP concept andthe examples in paragraph 5.3 illustrate potential or proposed applications of the RNPMASPS.
5.1.3.1 Required Navigation Performance Concept
RNP is a statement of the navigation performance accuracy, integrity, continuity andavailability necessary for operations within a defined airspace. Boeing’s implementationsof RNP focuses on horizontal applications and specify the accuracy, integrity andavailability of navigation signals and availability of navigation equipment requirements fora defined airspace (Leslie, R.S. (1996) and Tarlton, T. (1995)).
The RNP concept introduces the containment surfaces to define requirements beyondaccuracy and provide assurance of navigation performance. It defines a region around thedesired airplane path that can be defined, and that the probability that the airplane does notremain within that region can be bounded. The containment integrity and containmentcontinuity requirements define the allowable probabilities of certain types of failures forthe navigation system. In particular, the integrity requirement limits the probability of amalfunction of the navigation system which causes the cross-track component of the totalsystem error to exceed the cross-track containment limit associated with the current RNPwithout annunciation. The continuity requirement limits the probability of the loss offunction, which occurs when the system indicates that it is no longer able to meet thecontainment integrity requirement. The containment surface width is typically set at twotimes RNP (i.e., the airplane will be located within two times RNP of the FMC estimatedposition). The containment surface ties this performance measure to the airspaceenvironment and has direct operational implications for flight path, separation minima andobstacle clearance surfaces criteria.
5.1.3.2 Actual Navigation Performance
Actual Navigation Performance (ANP) is the actual estimated navigation system accuracywith associated integrity for the current FMC position. It is expressed in terms of nauticalmiles and represents a radius of a circle centered around the computed position where theprobability of the aircraft being inside the circle is 95%.
The computed accuracy, ANP, is displayed to the crew as ACTUAL (navigationperformance), and annunciation is provided if ANP (ACTUAL) does not comply with thecontainment integrity requirement of the current RNP.
5.1.4 Surveillance Performance
5.1.4.1 Required Monitoring Performance
59
A key concept in the definition of future ATM systems is that of Required MonitoringPerformance (RMP). The term ‘Monitoring Performance’ refers to capabilities of anairspace user to monitor other users and be monitored by other users to a level sufficientfor participation of the user in specified strategic and tactical operations requiringsurveillance, conflict assessment, separation assurance, conformance, and/or collisionavoidance functions. RMP is intended to characterize aircraft path prediction capabilityand received accuracy, integrity, continuity of service, and availability of a monitoringsystem for a given volume of airspace and/or phase of operation.
Aircraft path prediction is a key function for airspace management and monitoring.Aircraft path prediction capability is defined by a position uncertainty volume as a functionof prediction time over a specified look ahead interval. Monitoring integrity (assurance ofaccurate, reliable information), where there is availability of service, must be definedconsistent with desired airspace operations. Continuity of service and availability alsomust be defined consistent with desired airspace usage. Development of these concepts iscurrently in progress by various standards organizations.
5.1.4.2 Surveillance System Objectives
Surveillance is a key function for airspace management and supports both tacticalseparation assurance of aircraft and strategic planning of traffic flows. The primaryobjective of the surveillance function is to support the following types of airspacemanagement functions:
• Short Term Separation Assurance
The surveillance function provides current aircraft state information on controller displaysand as inputs to separation automation functions, i.e. the short term Conflict Alert systemfor detecting immediate path conflicts, and the Minimum Safe Altitude Warning (MSAW)system for detecting potential flight into terrain. In addition, future automation functionsmay require inputs for path lateral and vertical conformance monitoring and for automatedchecking of path intent versus path clearances.
• Medium Term Separation Assurance
The surveillance function currently provides state information for sector-based airspaceplanning and load management. In the future, additional automation functions such asMedium Term (~ 20 min. lookahead) Conflict Probe may be used to detect and resolvepotential airspace conflicts, enhancing the productivity of ATC centers. These automationfunctions will probably require enhanced surveillance in order to provide accurate andreliable path predictions for medium term lookahead periods.
• Medium Term Airspace Planning
In the future, the surveillance function must support medium term flow planning andairport arrival/departure management in congested hubs and other areas where trafficloads can lead to flow inefficiencies and saturation of airspace throughput. Automationtools such as the Center-TRACON Automation System (CTAS) arrival manager andproposed dynamic sectorization tools will require higher levels of surveillanceperformance if safety and capacity goals are to be achieved as traffic demand increases.
60
• Strategic/Long Term Planning and Flow Management
One of the goals for the future flow management system is to transition from a departuremanaged system to an arrival managed system of flow management. One enablingtechnology for strategic management of airport arrival slots is accurate 4D prediction offlight paths from takeoff to arrival at airport metering fixes. The surveillance functionsupports strategic flow management by providing accurate state and intent information forlong term path predictions. Similarly, en route traffic flow control automation such asdynamic sectorization requires accurate path predictions for sector load analysis and flowmanagement.
5.1.4.3 Current Radar-Based Surveillance System Performance
The current NAS uses a variety of radar systems to supply surveillance data for surface,terminal, and en route airspace management. On the airspace surface, current generationAirport Surface Detection Equipment (ASDE-3) primary radars are being installed atmajor hub airports to provide surface surveillance and incursion alerting. In the terminalairspace of most medium and large capacity airports, surveillance data is provided by anAirport Surveillance Radar (ASR) primary radar which provides position reporting on aperiodic scan basis, supplemented by a co-located Secondary Surveillance Radar (SSR)which provides aircraft identification, altitude, and backup position reporting. Smallerairports may only have access to an SSR radar, or may have no surveillance capabilityother than that provided by voice reporting and tower controllers. En route airspace usesa networked system of Air Route Surveillance Radars (ARSR) which provide continuousmonitoring of aircraft flying in domestic airspace above ~ 9,000 feet altitude. Each radaris networked to one or more Air Route Traffic Control Centers (ARTCC) to providecontinuous monitoring of aircraft across NAS managed airspace. Considerableredundancy is built into the en route surveillance system in that ARSR sensors arepositioned to achieve at least dual radar coverage throughout NAS managed airspace, andin addition a co-located SSR provides identification, altitude and position reporting alongwith that of the primary ARSR radars.
Current terminal area surveillance is provided by a mix of ASR -7,8,9 primary radars andAir Traffic Control Beacon Interrogator (ATCBI - 3,4,5) and Mode S secondary radars.The older generation analog ASR-7 radars are more than 30 years old and are beingreplaced by modern ASR-9 radars or the near term ASR-11 radar. The last-generationASR-8 radars are also analog radars which are being upgraded to ASR-8D digital radarsto perform surveillance equivalent to that of the current generation ASR-9 radars. TheATCBI-3,4,5 are older SSR radars which are being replaced by modern Mode S radars orthe near term ATCBI-6 which is a monopulse SSR with limited Mode S functionality.(The ASR-9s for major hub airports are paired with Mode S radars, and the ASR-11s willbe paired with ATCBI-6 secondary radars.) These radars are designed to support rangesof at least 60 nm around each airport, and to scan at a rate of about one report per fivesecond interval. The individual radars have a detection capability exceeding 98 percent,and a system availability exceeding 0.999 in low altitude terminal airspace. The modernradars have azimuth accuracies on the order of one milliradian rms, which means that theposition reports of aircraft within terminal range are accurate to 0.1 nm or better. By
61
contrast, the older radars have azimuth accuracies on the order of three milliradians whichmeans that the cross-range components of position reports have much greater uncertaintyand aircraft tracking is significantly less precise.
Current en route surveillance is provided by a mix of ARSR-1,2,3,4 primary radars withco-located ATCBI and Mode S secondary radars. The ARSR-1,2 radars are very oldanalog radars and must be decommissioned in the near term as they are very expensive tomaintain. The ARSR-4 radars are the current generation systems which are beingdeployed paired with Mode S secondaries along the U.S. coast lines and internationalborders, and the ARSR-3 radars will be given service life extensions to maintain serviceover the next 20 years. These radars are designed to provide line-of-sight (~ 250 nmrange) capability and to scan at a rate of about one report per 12 second interval. Thedetection probability and accuracies are similar to those of the terminal radars. This meansthat position reports at ranges on the order of 150 nm or more are considerably lessaccurate than those for terminal surveillance, and as a consequence of the report accuracyand lower data rate, en route tracking and data report quality are much lower for en routesurveillance. This is one of the reasons that horizontal separation standards are muchlarger in en route airspace.
NAS Surveillance System Limitations and Deficiencies
Surveillance system performance today is characterized by the radar sensors available, thetracking and data fusion software in the ATC centers, and the display automation used fortactical control. In the terminal area, the modern ASR and monopulse SSR sensorsproduce high quality position data for determining aircraft state and identity, and the olderless capable sensors are in the process of being replaced. Similarly, most of the processingand display limitations of the current ARTS system may be overcome with thereplacement STARS automation system. A primary architectural problem, however, is thelow connectivity of radars in the terminal area. This leads to an expensive system, sinceevery airport with ATC facilities needs a source of surveillance data. One of the goals ofthe future system is to reduce the number of radars in each urban area to provide dualsurveillance coverage of all major airports (for functional redundancy in case of systemfailures), and at least single coverage of other airports by networked distribution ofsurveillance data to ATC fusion nodes. These goals are annunciated in the NASArchitecture V2.0 (U.S. FAA,1996).
By contrast, current NAS en route surveillance is characterized by a number of problemareas. The accuracy and usefulness of aircraft state data is greatly limited by the use oflegacy tracking and display software. This results in fair to poor velocity estimates withconsiderable noise variations from scan to scan, and in large tracker lag errors (~ 30 to 60second lag errors during turn maneuvers). Moreover, the use of the ‘radar mosaic’concept for switching from one primary sensor source to another as the aircraft traversesacross mosaic boundaries leads to track state ‘jumping’ as the tracker shifts from onesensor source to another. In addition to these implementation problems, the currentsurveillance system does not provide flight path intent data for path conformancemonitoring, and provides only limited coverage at low altitudes and in mountainousterrain. The implementation problems of the current system can be largely overcome byuse of modern multi-sensor tracking and data fusion software, which compensates for
62
deterministic sensor errors such as azimuth bias errors, and enables dynamic blending ofthe most appropriate data for aircraft state estimation. (A surveillance ‘server’ concept isadvocated in NAS Architecture Versions 2.0-3.0, which would network multiple terminaland en route sensors into common data fusion nodes, and distribute the global track datato appropriate ATM facilities, requesting users, and to external fusion nodes.)
5.1.4.4 Surveillance System Performance Metrics
Within the regions where surveillance coverage is available, the primary metrics for thesurveillance function are accuracy, availability, integrity and latency. (Continuity offunction and reception probability are also of interest, but are usually treated within thescope of the above metrics.) Although individual sensors or subsystems may haveindividual or characteristic performance, it is the end system performance metrics whichare of significance for the users of surveillance data. For path prediction analysis, forexample, both position and velocity performance is significant for determining the overallprediction errors for a given lookahead period. We summarize these metrics and futurerequirements in this section.
Accuracy Metrics
The accuracy metrics in the current system are most often driven by user requirements forseparation assurance. In the terminal area, where this function involves vectoring andaltitude level-off controls, the greatest need is for relative accuracy measures, i.e.monitoring the current aircraft states versus the currently active clearance. Typicalrelative position accuracy of modern radars in the terminal area is under 0.1 nm and isadequate for current means of separation assurance. The future use of RNP routings onthe order of RNP-0.3 for SIDs, STARs, and non-precision approach, and the potential useof operational concepts to increase throughput may lead to requirements for substantiallyhigher accuracy and dynamic reporting of path intent. Part of this requirement will be forabsolute accuracy, since bias errors between the flight navigation system and thesurveillance system may appear as path conformance violations to ground controllers, andpart of this requirement will be for more precise velocity states for faster detection andresolution of route conformance and clearance errors.
The accuracy metrics for surveillance performance in transition and en route airspace aredriven by several needs including conflict detection, separation assurance and sector loadplanning. Operational concepts such as the use of medium term conflict probe will requiremuch better tracking than is available with current legacy systems. Earlier studies(Warren, 1996) have shown the need for much reduced lags in tracking of maneuveringaircraft, and in achieving steady state velocity errors on the order of 5 knots rms.Similarly, the use of operational concepts to achieve reduced separation standards, and thefuture use of RNP-1 routings may lead to requirements for substantially better trackingaccuracy than is achievable with currently fielded systems.
Availability Metrics
Since active surveillance is essential for safely separating aircraft at the separationstandards currently used in the NAS, the desired levels of system availability are on theorder of 0.99999 or better (RTCA, 1997, MASPS on Automatic Dependent Surveillance-
63
Broadcast (ADS-B), V6.0). Individual radar sensors can support availability on the orderof 0.999. However, to achieve the overall system level availability, dual surveillancecoverage is usually required. This is currently not a problem at high altitudes since dualradar coverage or better is available throughout the NAS. At low altitudes, and in theterminal maneuvering areas this requirement is difficult to achieve and an availability of0.999 is currently considered acceptable, except at the major hub airports. This level ofavailability is probably adequate for future systems, except that traffic growth may extendthe need for higher availability in more terminal areas. Continuity of function is oftenincluded in the availability metrics and in future system planning considerations.
Integrity Metrics
Integrity is usually measured in terms of undetected errors in surveillance system outputs.Desired system level integrity is on the order of one undetected error in 10 7 scans/outputreports. At the sensor level, clutter detections and fruit replies can lead to largespontaneous errors at much higher rates. The tracking and data fusion software typicallyprovides the added integrity to achieve the desired system level performance. Futuresystems will probably require equivalent integrity, although the use of multi-sensorprocessing and integrity checking could yield higher integrity than current systems.
Latency Metrics
Latency is a measure of the acceptable delay between successive surveillance reports onthe average or at a specified probability level. (For example, with en route radars theprobability of reception per scan is on the order of 98%, and the latency betweensuccessive scans is 12 seconds at the 98% probability level.) This metric is typicallyspecified by a stressing application such as separation assurance at a typical range betweenthe aircraft being tracked and the tracking sensor. For close range applications such asparallel approach monitoring and collision avoidance, a typical latency requirement is aone second report updating at a 95 to 99 percent probability of reception. For otherapplications latency requirements increase with separation range and size of minimumseparation standards, e.g. latency may be 15 minutes with ~95% reception probability foran oceanic ADS system supporting horizontal separation standards on the order of 30miles. This does not include transmission latency, which is a measure of the time delay inactually receiving the report at the data fusion center, or latency error, which is a measureof the time stamping error associated with a surveillance report. These metrics are alsouseful in quantifying system performance.
5.1.5 Aviation Weather Performance
Weather has a major impact on the safety, efficiency, and capacity of aviation operations.Accidents and incidents continue to be caused by adverse weather. Runway acceptancerates and other capacity metrics are reduced in IMC. According to some studies, 40-65percent of delays that affect U.S. domestic airlines are caused by adverse weather, atannual direct costs ranging from $4-5B per year (Evans, 1995). In addition, passengersare inconvenienced by flight delays and cancellations or diversions due to weather, and areuncomfortable when turbulence is encountered during a flight. The expected futuregrowth in air traffic will only exacerbate all these conditions, imposing constraints on the
64
ability of the airlines to meet growing demand while improving safety and efficiency.Boeing has recently launched an Aviation Weather Study to collect and documentinformation on the affect of aviation weather on the domestic and international ATMsystem (Lindsey, 1997). An important component of this effort is to develop anunderstanding of user requirements for aviation weather information, and then to assesshow well the current and planned aviation weather system will meet those needs. Section5.5 presents some of the preliminary findings from this project regarding the operationalaspects of current and future aviation weather technologies.
Recently, the National Research Council released a report describing the results of itsreview of the domestic aviation weather system (NRC, 1995). Some of the key findingsand recommendations from that study related to the performance of weather technologiesincluded:
• Some of the measurements provided by automated weather observing systems are notalways reliable, especially observations of ceiling and visibility measurements. Morehuman observers are needed at key facilities to ensure that erroneous data are notdisseminated to pilots and controllers.
• Aircraft observations of winds and temperatures provided by the Meteorological DataCollection and Reporting System have improved forecast accuracy, and its use shouldbe expanded and more carriers encouraged to participate.
• New weather technologies coming online now and in the near term are producingmuch larger data sets than previously available. New data management and analysistechnologies, such as the Aviation Gridded Forecast System, are needed to manageand distribute this information.
• The accuracy and timeliness of short-term ‘nowcasts’ and longer term forecasts ofweather conditions in the terminal area and en route environments need to beimproved. Additional research is required to improve current weather forecastingtools and to develop new technologies.
• Many of the negative impacts of weather on the aviation system are regional ratherthan global problems. Regional solutions should be sought where they will be mosteffective (Alaska is a key area identified by the NRC where this recommendationshould be followed).
• Interactive computer graphics workstations and graphical images depicting current andexpected weather conditions are becoming the tools of choice for analyzing anddisseminating weather information to users. Efforts are needed to standardize theinformation provided by these systems so that all users benefit from shared situationalawareness. Controllers in particular should be given critical weather information informats that improves their situational awareness without increasing their workload.Such information could significantly improve the efficiency of the air traffic controlsystem while improving safety standards at the same time.
• The limited capabilities of current cockpit displays and communications links are thelargest technical constraint on disseminating weather information to pilots. Research
65
is needed to develop cockpit display systems and communications systems that willprovide weather information to pilots in as an efficient and timely manner as possible.Human factors issues and crew workload considerations must be addressed early inthis process.
The NRC study addressed many areas of concern related to the aviation weather system,but it did not specifically investigate some of the near term and far term performancerequirements for aviation weather technologies to support CNS/ATM systems. Forexample, accurate 3D meteorological information will be needed for CTAS and conflictprobe trajectory calculations, and for the wake vortex separation prediction system beingdeveloped by NASA. The data sets needed for these tools will be generated from analysesof current surface and aloft conditions and forecasts of future conditions. The accuracy,precision, and completeness of the meteorological information must be quantified, and thesensitivity of CNS/ATM tools to errors in the data need to be determined. Information isalso needed on the amounts and types of additional data, especially upper-air data, thatwill be required to ensure the success of these technologies.
Most weather impacts on today’s ATM system are associated with bad weather, especiallyin the terminal area when adverse weather creates inefficiencies that lead to capacityreductions at the busiest airports. Thus, most aviation weather technology deploymentsalready made or planned for the near term focus on improving the quality and timeliness ofweather information for instrument meteorological conditions. However, for the far termthe focus will need to shift to improving the quality of aviation weather information underall weather conditions, including what would normally be considered fair weather, i.e.,visual meteorological conditions. This is because the day-to-day success of Free Flightand new CNS/ATM technologies like CTAS will depend in part on the quality of theobserved and predicted meteorological information that these technologies will need.
5.2 Communication
5.2.1 Air/Ground Communication
Air/ground communication provides for the transfer of information between the aircraftand a ground entity. The ground entity may be an air traffic control facility, an airlineoperations center or another source of required information, such as an airport whichprepares an Automated Terminal Information System (ATIS) message.
Air/air communication is a special case of air/ground communication. The primary use ofair/air communication is monitoring the party line of other air/ground communications.Certain operations, such as operations at uncontrolled airfields, require transmission-in-the-blind. That is, the pilot reports his position and intent to any and all aircraft near thatairport without addressing a specific aircraft or expecting a reply. In addition, flight crewsdirectly communicate between aircraft, such as in oceanic airspace.
Communication functionality may be described in three layers of service. TheApplication layer provides standard formats for efficient transfer of information. In voicecommunication, this consists of standard phrases and reporting procedures which haveevolved over time and are specified in documents such as FAA Order 7110.65, Air Traffic
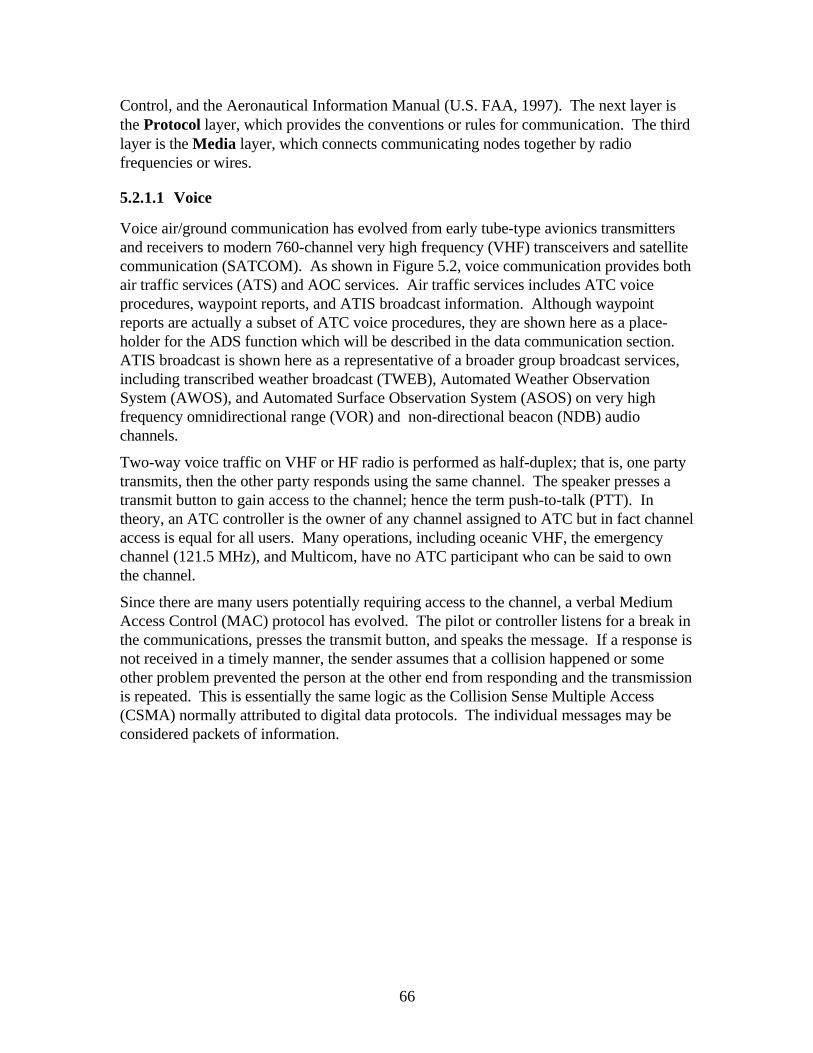
66
Control, and the Aeronautical Information Manual (U.S. FAA, 1997). The next layer isthe Protocol layer, which provides the conventions or rules for communication. The thirdlayer is the Media layer, which connects communicating nodes together by radiofrequencies or wires.
5.2.1.1 Voice
Voice air/ground communication has evolved from early tube-type avionics transmittersand receivers to modern 760-channel very high frequency (VHF) transceivers and satellitecommunication (SATCOM). As shown in Figure 5.2, voice communication provides bothair traffic services (ATS) and AOC services. Air traffic services includes ATC voiceprocedures, waypoint reports, and ATIS broadcast information. Although waypointreports are actually a subset of ATC voice procedures, they are shown here as a place-holder for the ADS function which will be described in the data communication section.ATIS broadcast is shown here as a representative of a broader group broadcast services,including transcribed weather broadcast (TWEB), Automated Weather ObservationSystem (AWOS), and Automated Surface Observation System (ASOS) on very highfrequency omnidirectional range (VOR) and non-directional beacon (NDB) audiochannels.
Two-way voice traffic on VHF or HF radio is performed as half-duplex; that is, one partytransmits, then the other party responds using the same channel. The speaker presses atransmit button to gain access to the channel; hence the term push-to-talk (PTT). Intheory, an ATC controller is the owner of any channel assigned to ATC but in fact channelaccess is equal for all users. Many operations, including oceanic VHF, the emergencychannel (121.5 MHz), and Multicom, have no ATC participant who can be said to ownthe channel.
Since there are many users potentially requiring access to the channel, a verbal MediumAccess Control (MAC) protocol has evolved. The pilot or controller listens for a break inthe communications, presses the transmit button, and speaks the message. If a response isnot received in a timely manner, the sender assumes that a collision happened or someother problem prevented the person at the other end from responding and the transmissionis repeated. This is essentially the same logic as the Collision Sense Multiple Access(CSMA) normally attributed to digital data protocols. The individual messages may beconsidered packets of information.
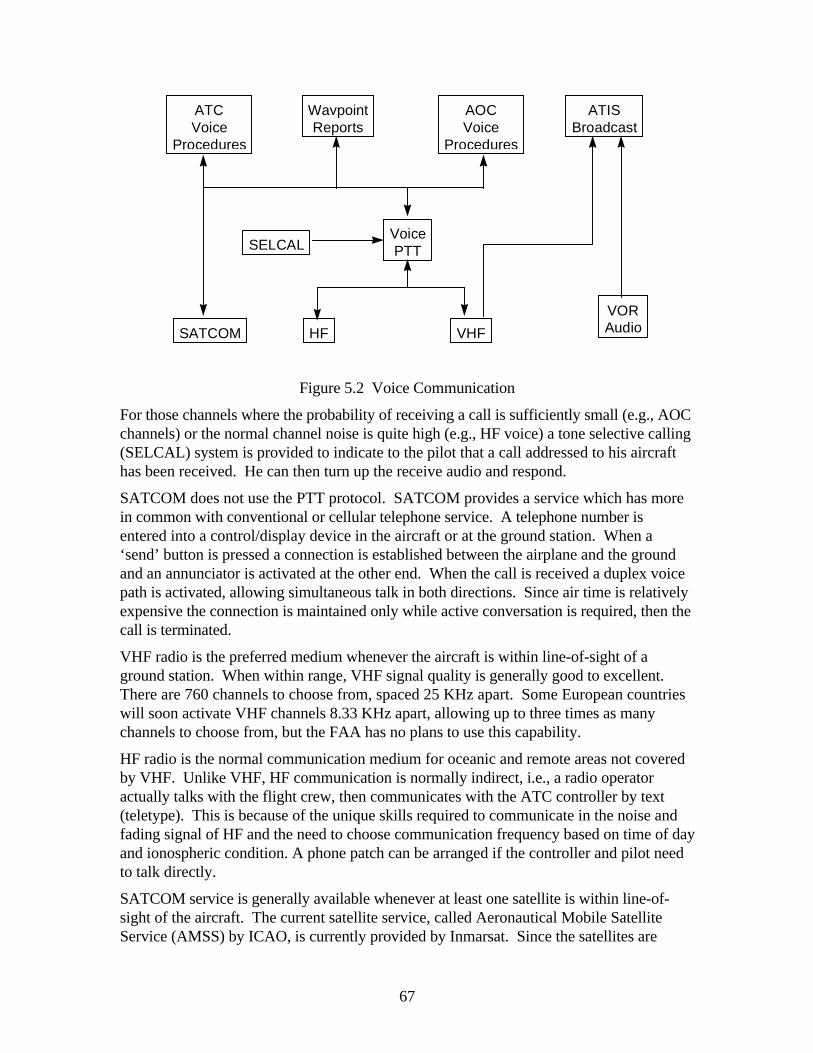
67
ATCVoice
Procedures
WaypointReports
AOCVoice
Procedures
ATISBroadcast
SELCALVoicePTT
SATCOM HF VHF
VORAudio
Figure 5.2 Voice Communication
For those channels where the probability of receiving a call is sufficiently small (e.g., AOCchannels) or the normal channel noise is quite high (e.g., HF voice) a tone selective calling(SELCAL) system is provided to indicate to the pilot that a call addressed to his aircrafthas been received. He can then turn up the receive audio and respond.
SATCOM does not use the PTT protocol. SATCOM provides a service which has morein common with conventional or cellular telephone service. A telephone number isentered into a control/display device in the aircraft or at the ground station. When a‘send’ button is pressed a connection is established between the airplane and the groundand an annunciator is activated at the other end. When the call is received a duplex voicepath is activated, allowing simultaneous talk in both directions. Since air time is relativelyexpensive the connection is maintained only while active conversation is required, then thecall is terminated.
VHF radio is the preferred medium whenever the aircraft is within line-of-sight of aground station. When within range, VHF signal quality is generally good to excellent.There are 760 channels to choose from, spaced 25 KHz apart. Some European countrieswill soon activate VHF channels 8.33 KHz apart, allowing up to three times as manychannels to choose from, but the FAA has no plans to use this capability.
HF radio is the normal communication medium for oceanic and remote areas not coveredby VHF. Unlike VHF, HF communication is normally indirect, i.e., a radio operatoractually talks with the flight crew, then communicates with the ATC controller by text(teletype). This is because of the unique skills required to communicate in the noise andfading signal of HF and the need to choose communication frequency based on time of dayand ionospheric condition. A phone patch can be arranged if the controller and pilot needto talk directly.
SATCOM service is generally available whenever at least one satellite is within line-of-sight of the aircraft. The current satellite service, called Aeronautical Mobile SatelliteService (AMSS) by ICAO, is currently provided by Inmarsat. Since the satellites are

68
geostationary, they orbit over the equator at an altitude such that they appear stationary toa ground observer. Therefore, the satellite appears near the horizon to an aircraft flying ata high latitude. There are four Inmarsat locations (Atlantic Ocean East, Atlantic OceanWest, Indian Ocean, and Pacific Ocean), so coverage extends nearest the poles directlynorth (or south) of each satellite location.
Voice broadcast is provided in the VHF communications band for ATIS, ASOS, andAWOS. TWEB is available on some VOR and NDB stations. Some countries alsoprovide ATIS on a VOR frequency instead of a VHF communications frequency.
5.2.1.2 ACARS
Voice communication can provide direct communication from a person’s brain, throughhis voice, to the brain of another person. Data communication, on the other hand, has thecapability to communicate from a computer to another computer. This allowscommunication of important data without human intervention. On the other hand, textmessages can be presented by the computer to the pilot and controller, which cancommunicate some information more efficiently and accurately than voice. Theadvantages are improved communication accuracy and a potential reduction in workload.
ARINC Communications Addressing and Reporting System (ACARS) was developed bythe airline industry nearly 20 years ago to support their AOC needs. Most of thecommunication requirements of the federal regulations are met by ACARS. TheOut/Off/On/In reports, which were the first messages of ACARS, have been supplementedby a wide variety of messages, conveying information both to and from the airplane. Forinstance, some airlines regularly send flight plans to their airplanes for direct loading intothe FMC. Onboard maintenance computers can automatically send reports to the groundat a specific point in the flight, in case of a detected fault, or in response to a groundrequest. The airlines are continuing to expand the functionality of ACARS with additionalmessage formats.
As seen in Figure 5.3, ACARS is also used for air traffic services communication. TheFAA provides pre-departure clearances for about 40 of the major airports. This is not adirect ATC-to-airplane service, but rather has used some existing capabilities to providethis service. ARINC receives the departure clearances from the FAA for contractingairlines and delivers them to the airline. The airline in turn forwards the clearance to thedesignated airplane. Although this is generally considered an ACARS service, the airlinecan use any appropriate means, such as delivering a printout to the cockpit, to get theclearance to the airplane. The FAA is in the process of installing digital ATIS in a numberof towers at major airports, which will allow the flight crew to request and receive thecurrent ATIS information by ACARS. Like pre-departure clearances, the FAA version ofATIS is unique to the FAA.
69
CPC WaypointReports
AOC ATIS & PDC(FAA)
ACARS
SATCOM HF VHF
ATIS&
PDC PDC = Pre-DepartureClearance
CPC = ControllerPilot Communications
ACARS = Aircraft CommunicationAddressing & Reporting System
Figure 5.3 ACARS Communication
The Airlines Electronic Engineering Committee (AEEC), who specified ACARS, hasdefined a series of ATC messages and recommended their use to the various authoritieswhich desire to provide air traffic services via ACARS. These messages, defined inARINC Specification 623 (ARINC, 1994), include departure clearances, ATIS, waypointposition reports (for oceanic use), and a series of simple controller/pilot communications(CPC). The CPC messages were added to the specification to support the NOWcommunications the FAA has been considering. A few European airports haveimplemented services using the pre-departure clearance and ATIS messages.
ACARS was developed in the era of teletype services and networks, which are based oncharacter-oriented protocols. As a result, all ACARS messages are restricted to thosewhich can be conveyed by upper-case alphabetic characters, numbers, and a very limitedset of punctuation marks. The air/ground message format is received by ARINC at itsprocessor in Annapolis and translated into the airline ground/ground protocol and thenforwarded to its destination. An uplink is similarly translated into the ACARS protocol.
ACARS was originally developed for use with VHF radio. The airplane installationincludes an ACARS Management Unit (MU), which is connected to a conventional VHFcommunications radio by audio lines, transmit and data mode discretes, and a tuning bus.Modulation is 2.4 Kbps minimum shift key, which can be achieved by normal AM doublesideband modulation of the radio frequency with the audio from a modem in the MU.Received signals can be similarly demodulated and sent to the modem as audio signals.
A new modulation standard for VHF ACARS has been proposed, which is differentiallyencoded 8-phase shift keying. The bit rate will be 31.5 Kbps. This modulation methodwill require direct digital modulation of the radio frequency signal, so the audio interfaceto an external modem will not be possible. A VHF Data Radio (VDR) has been specified,but is not yet in production, to provide the new modulation functionality. A digital databus will be used to connect the MU and the VDR.
70
The 2.4 Kbps and 31.5 Kbps described above are the raw bit rates in the signal-in-space.The available user bit rate is decreased by message overhead and is inversely proportionalto the number of stations sharing a VHF channel. A single channel (frequency) is usedacross most of the U.S. and up to three additional channels may be available in highdensity airport areas. Therefore, if 14 aircraft and two ground stations are within line-of-sight of each other on one frequency, the average long term bit rate for each will be 2400 /16 = 150 bps.
The ACARS specification has been expanded to provide SATCOM and HF mediaconnections. The VHF-unique protocol is stripped off and the remaining characters areencapsulated in a SATCOM or HF protocol data unit for transmission. The ACARS MU,the SATCOM data unit, and the HF data unit or radio are connected together with digitaldata busses.
The raw bit rate of 10.5 Kbps has been mentioned for SATCOM. Although this bit rate isavailable for providing a dedicated circuit for SATCOM voice, as described earlier, datalink protocols depend a packet service, which is multiplexed among multiple users. A bitrate of 300 bps is a more reasonable value.
HF data radio has automatically-selected bit rates of 300, 600, 1200, and 1800 bps. Thebit rate is chosen based on the channel real time propagation characteristics, such as noiseand fading. Experience has shown that the bit rate is normally 600 bps. An estimated tenaircraft can share a channel, providing an average bit rate of 60 bps per aircraft.
5.2.1.3 FANS-1
The set of data link services provided in a FANS-1 airplane is shown in Figure 5.4. TheACARS protocol and the air/ground media are identical to those described above.
Communication between the controller and the pilot is provided by Two-Way Data Link(TWDL), as described in RTCA Document DO-219 (RTCA,1993). This application hasbeen commonly called Controller-Pilot Data Link Communications (CPDLC) which, asdescribed below, is the formal name for the ATN application which provides theequivalent functionality.
Position and intent reporting is provided by the Automatic Dependent Surveillancefunction. Although there is an equivalent RTCA document, the specification produced byAEEC, ARINC 745, was used for this implementation (ARINC, 1993). The groundsystem requests a ‘contract’ with the aircraft, specifying the reporting period for basic andsupplemental data to be transmitted. The contract can also specify a set of events, such asaltitude deviation, which will also cause a report to be transmitted.
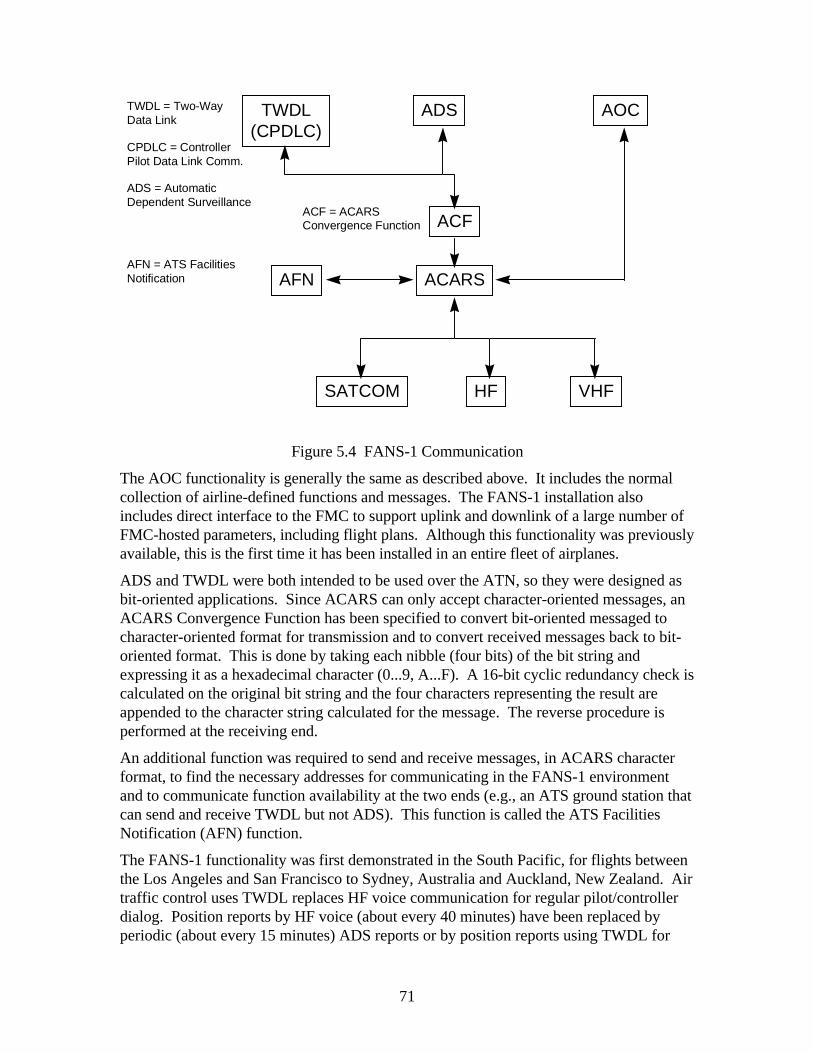
71
TWDL(CPDLC)
ADS AOC
ACARS
SATCOM HF VHF
AFN
CPDLC = ControllerPilot Data Link Comm.
ADS = Automatic Dependent Surveillance
TWDL = Two-WayData Link
AFN = ATS FacilitiesNotification
ACFACF = ACARSConvergence Function
Figure 5.4 FANS-1 Communication
The AOC functionality is generally the same as described above. It includes the normalcollection of airline-defined functions and messages. The FANS-1 installation alsoincludes direct interface to the FMC to support uplink and downlink of a large number ofFMC-hosted parameters, including flight plans. Although this functionality was previouslyavailable, this is the first time it has been installed in an entire fleet of airplanes.
ADS and TWDL were both intended to be used over the ATN, so they were designed asbit-oriented applications. Since ACARS can only accept character-oriented messages, anACARS Convergence Function has been specified to convert bit-oriented messaged tocharacter-oriented format for transmission and to convert received messages back to bit-oriented format. This is done by taking each nibble (four bits) of the bit string andexpressing it as a hexadecimal character (0...9, A...F). A 16-bit cyclic redundancy check iscalculated on the original bit string and the four characters representing the result areappended to the character string calculated for the message. The reverse procedure isperformed at the receiving end.
An additional function was required to send and receive messages, in ACARS characterformat, to find the necessary addresses for communicating in the FANS-1 environmentand to communicate function availability at the two ends (e.g., an ATS ground station thatcan send and receive TWDL but not ADS). This function is called the ATS FacilitiesNotification (AFN) function.
The FANS-1 functionality was first demonstrated in the South Pacific, for flights betweenthe Los Angeles and San Francisco to Sydney, Australia and Auckland, New Zealand. Airtraffic control uses TWDL replaces HF voice communication for regular pilot/controllerdialog. Position reports by HF voice (about every 40 minutes) have been replaced byperiodic (about every 15 minutes) ADS reports or by position reports using TWDL for
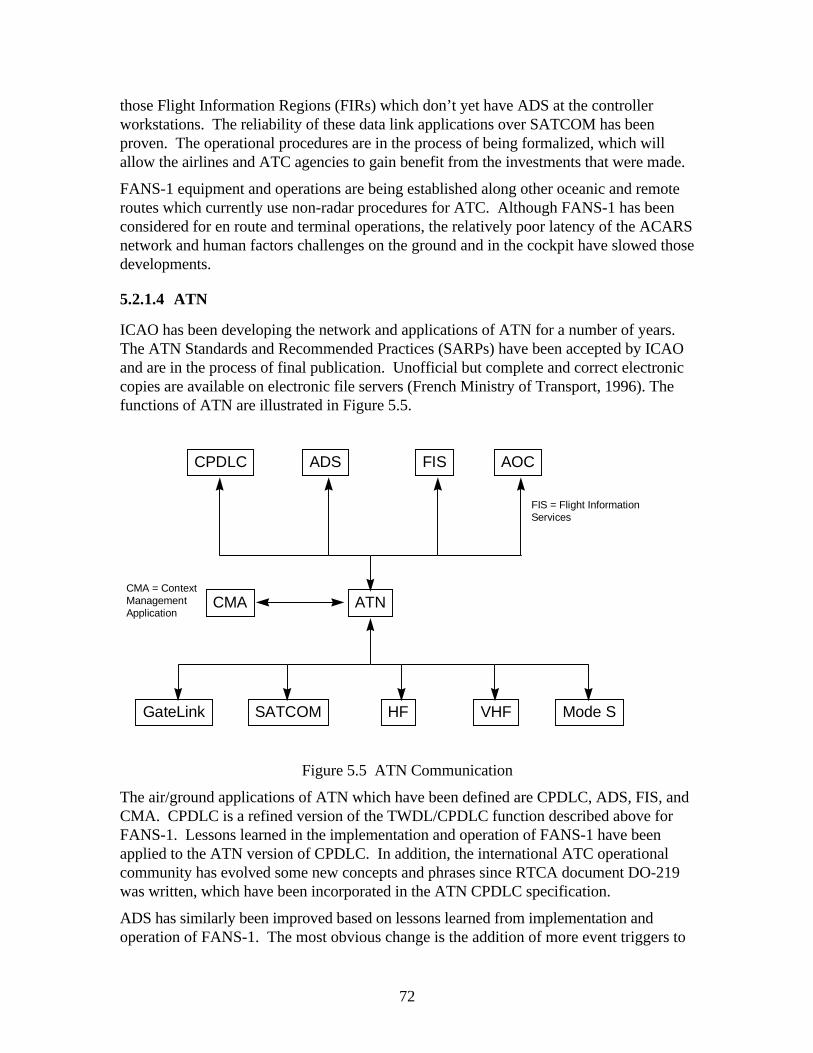
72
those Flight Information Regions (FIRs) which don’t yet have ADS at the controllerworkstations. The reliability of these data link applications over SATCOM has beenproven. The operational procedures are in the process of being formalized, which willallow the airlines and ATC agencies to gain benefit from the investments that were made.
FANS-1 equipment and operations are being established along other oceanic and remoteroutes which currently use non-radar procedures for ATC. Although FANS-1 has beenconsidered for en route and terminal operations, the relatively poor latency of the ACARSnetwork and human factors challenges on the ground and in the cockpit have slowed thosedevelopments.
5.2.1.4 ATN
ICAO has been developing the network and applications of ATN for a number of years.The ATN Standards and Recommended Practices (SARPs) have been accepted by ICAOand are in the process of final publication. Unofficial but complete and correct electroniccopies are available on electronic file servers (French Ministry of Transport, 1996). Thefunctions of ATN are illustrated in Figure 5.5.
CPDLC ADS AOC
ATN
SATCOM HF VHF
CMA
FIS
CMA = ContextManagement Application
FIS = Flight InformationServices
GateLink Mode S
Figure 5.5 ATN Communication
The air/ground applications of ATN which have been defined are CPDLC, ADS, FIS, andCMA. CPDLC is a refined version of the TWDL/CPDLC function described above forFANS-1. Lessons learned in the implementation and operation of FANS-1 have beenapplied to the ATN version of CPDLC. In addition, the international ATC operationalcommunity has evolved some new concepts and phrases since RTCA document DO-219was written, which have been incorporated in the ATN CPDLC specification.
ADS has similarly been improved based on lessons learned from implementation andoperation of FANS-1. The most obvious change is the addition of more event triggers to
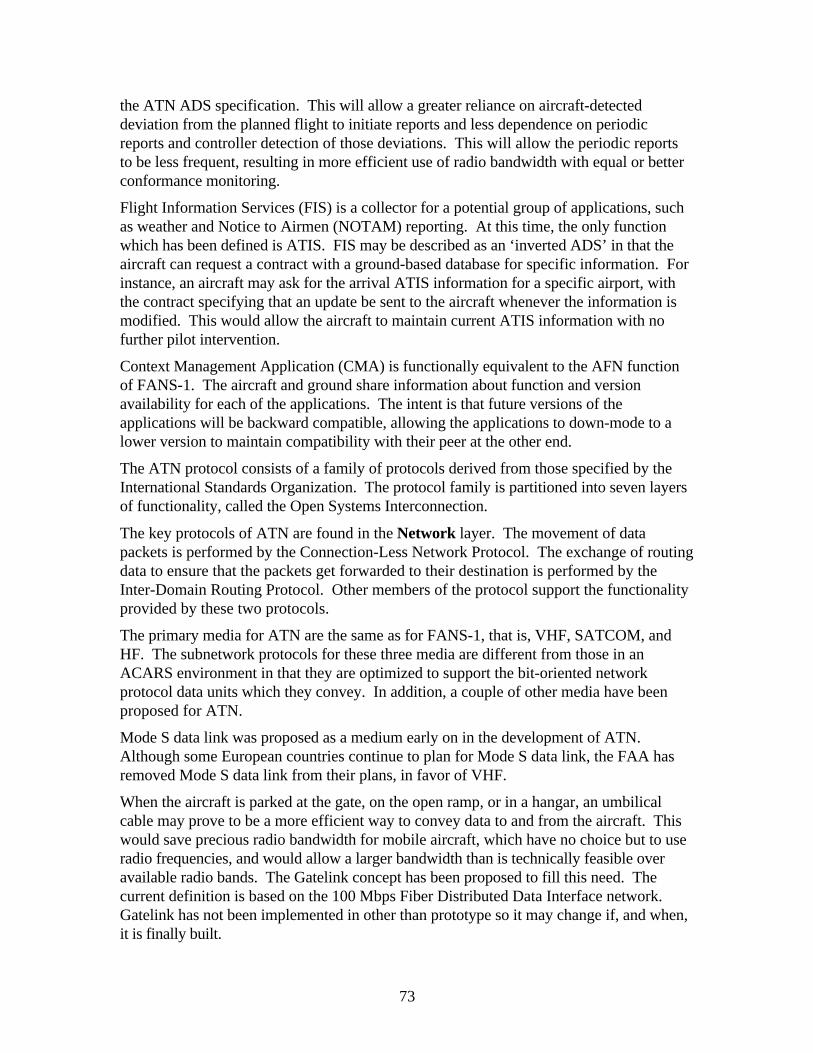
73
the ATN ADS specification. This will allow a greater reliance on aircraft-detecteddeviation from the planned flight to initiate reports and less dependence on periodicreports and controller detection of those deviations. This will allow the periodic reportsto be less frequent, resulting in more efficient use of radio bandwidth with equal or betterconformance monitoring.
Flight Information Services (FIS) is a collector for a potential group of applications, suchas weather and Notice to Airmen (NOTAM) reporting. At this time, the only functionwhich has been defined is ATIS. FIS may be described as an ‘inverted ADS’ in that theaircraft can request a contract with a ground-based database for specific information. Forinstance, an aircraft may ask for the arrival ATIS information for a specific airport, withthe contract specifying that an update be sent to the aircraft whenever the information ismodified. This would allow the aircraft to maintain current ATIS information with nofurther pilot intervention.
Context Management Application (CMA) is functionally equivalent to the AFN functionof FANS-1. The aircraft and ground share information about function and versionavailability for each of the applications. The intent is that future versions of theapplications will be backward compatible, allowing the applications to down-mode to alower version to maintain compatibility with their peer at the other end.
The ATN protocol consists of a family of protocols derived from those specified by theInternational Standards Organization. The protocol family is partitioned into seven layersof functionality, called the Open Systems Interconnection.
The key protocols of ATN are found in the Network layer. The movement of datapackets is performed by the Connection-Less Network Protocol. The exchange of routingdata to ensure that the packets get forwarded to their destination is performed by theInter-Domain Routing Protocol. Other members of the protocol support the functionalityprovided by these two protocols.
The primary media for ATN are the same as for FANS-1, that is, VHF, SATCOM, andHF. The subnetwork protocols for these three media are different from those in anACARS environment in that they are optimized to support the bit-oriented networkprotocol data units which they convey. In addition, a couple of other media have beenproposed for ATN.
Mode S data link was proposed as a medium early on in the development of ATN.Although some European countries continue to plan for Mode S data link, the FAA hasremoved Mode S data link from their plans, in favor of VHF.
When the aircraft is parked at the gate, on the open ramp, or in a hangar, an umbilicalcable may prove to be a more efficient way to convey data to and from the aircraft. Thiswould save precious radio bandwidth for mobile aircraft, which have no choice but to useradio frequencies, and would allow a larger bandwidth than is technically feasible overavailable radio bands. The Gatelink concept has been proposed to fill this need. Thecurrent definition is based on the 100 Mbps Fiber Distributed Data Interface network.Gatelink has not been implemented in other than prototype so it may change if, and when,it is finally built.
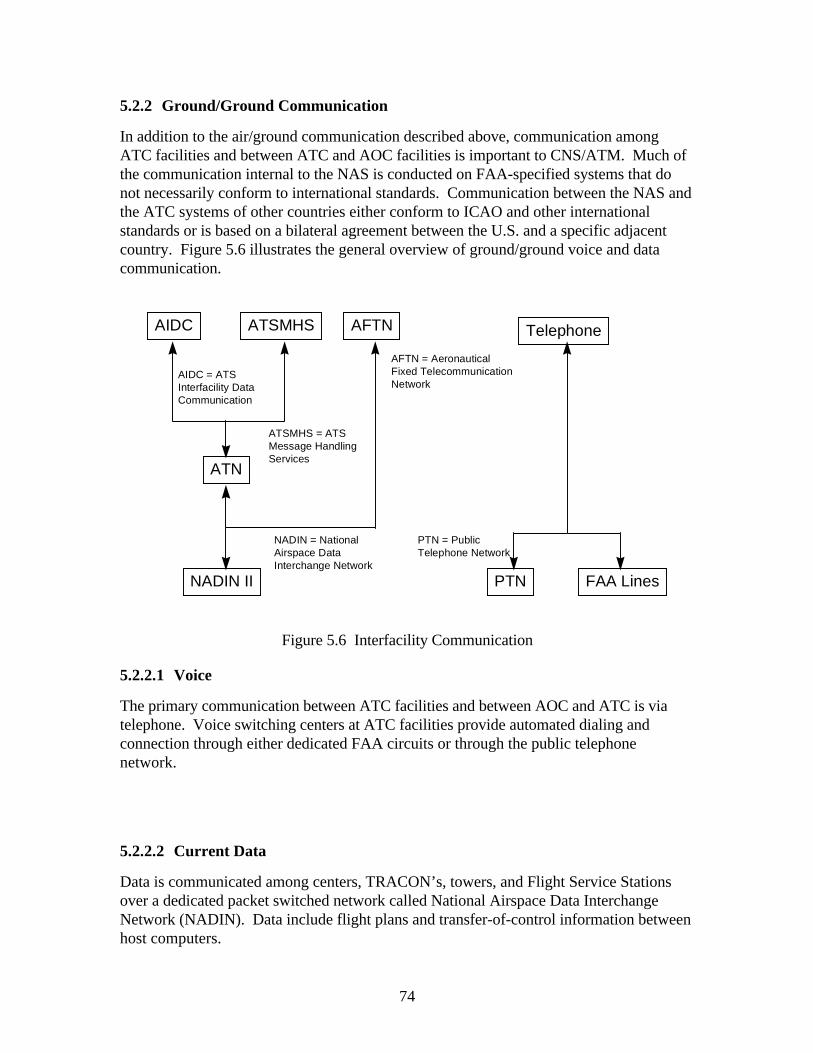
74
5.2.2 Ground/Ground Communication
In addition to the air/ground communication described above, communication amongATC facilities and between ATC and AOC facilities is important to CNS/ATM. Much ofthe communication internal to the NAS is conducted on FAA-specified systems that donot necessarily conform to international standards. Communication between the NAS andthe ATC systems of other countries either conform to ICAO and other internationalstandards or is based on a bilateral agreement between the U.S. and a specific adjacentcountry. Figure 5.6 illustrates the general overview of ground/ground voice and datacommunication.
AIDC ATSMHS
ATN
PTN
AFTN
NADIN II
Telephone
FAA Lines
AIDC = ATSInterfacility DataCommunication
ATSMHS = ATSMessage HandlingServices
AFTN = Aeronautical Fixed TelecommunicationNetwork
NADIN = NationalAirspace Data Interchange Network
PTN = Public Telephone Network
Figure 5.6 Interfacility Communication
5.2.2.1 Voice
The primary communication between ATC facilities and between AOC and ATC is viatelephone. Voice switching centers at ATC facilities provide automated dialing andconnection through either dedicated FAA circuits or through the public telephonenetwork.
5.2.2.2 Current Data
Data is communicated among centers, TRACON’s, towers, and Flight Service Stationsover a dedicated packet switched network called National Airspace Data InterchangeNetwork (NADIN). Data include flight plans and transfer-of-control information betweenhost computers.

75
The airlines and the FAA have recently established AOCNET to provide a means ofsending messages between the AOC center and the NAS primarily the central flow facility.
5.2.2.3 ATN
ATN provides not only air/ground communication but also ground/groundcommunication. Two applications have been developed for ground/ground service. ATSInterfacility Data Communication (AIDC) provides direct real-time messaging betweencontrollers, similar to CPDLC between pilots and controllers.
The second ATN ground/ground application is ATS Message Handling Service(ATSMHS). Based on the X.400 Message Handling Service (e-mail) developed by theInternational Telegraph and Telephone Consultative Committee, ATSMHS provides astore-and-forward messaging service that is appropriate for sending flight plans and otherinformation that is unnecessary to send in real time.
5.3 Navigation
5.3.1 Navigation Functionality
The navigation functionality provides position determination, flight plan management,guidance and control, display and system control, and fault configuration management.Navigation functionality may be described in three layers of services (see Figure 5.7). TheControls and Displays layer provides the interfaces between the flight crew and theairplane systems. These include:
1. The Mode Control Panel, which provides coordinated control of the FMC, FD/AP andaltitude alert functions
2. The Electronic Flight Instruments’ Primary Flight Displays, which displays the flightmode annunciation, and airspeed, attitude, altitude, vertical speed, and headingindications
3. The Horizontal Situation Indicator, which displays flight path orientation and guidancecues (bugs) on airspeed and Engine Pressure Ratio
4. The Control Display Unit, which enters the desired lateral and vertical flight planinformation into the FMC and displays the waypoints and path constraints storedwithin the navigation database.
The processor layer integrates data from the air data, inertial reference, radio navigation,engine and fuel sensors, navigation, performance and flight plan databases, and crew-entered data to navigate the airplane. The sensors layer provides the airplane state data(i.e., position, velocity, acceleration, attitude) and navigation and guidance information.This includes radio navigation sensors, such as Instrument Landing System (ILS) GlideSlope and Localizer receivers or equivalent Microwave Landing System (MLS), DistanceMeasuring Equipment (DME) or equivalent tactical air navigation (TACAN), GlobalPositioning System (GPS), Inertial Reference System (IRS), Very-high frequency OmniRange (VOR) receiver, Automated Direction Finder (ADF) and the air data sensors (pitotstatic and temperature probes, angle of attack, etc.).
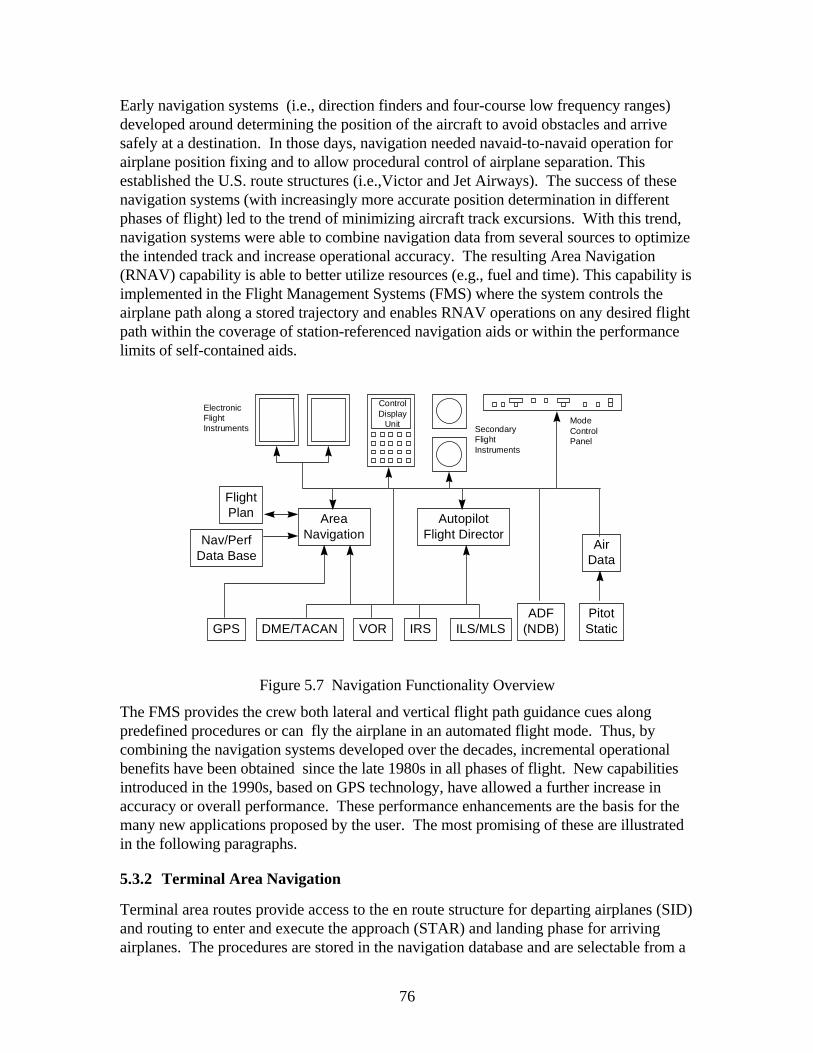
76
Early navigation systems (i.e., direction finders and four-course low frequency ranges)developed around determining the position of the aircraft to avoid obstacles and arrivesafely at a destination. In those days, navigation needed navaid-to-navaid operation forairplane position fixing and to allow procedural control of airplane separation. Thisestablished the U.S. route structures (i.e.,Victor and Jet Airways). The success of thesenavigation systems (with increasingly more accurate position determination in differentphases of flight) led to the trend of minimizing aircraft track excursions. With this trend,navigation systems were able to combine navigation data from several sources to optimizethe intended track and increase operational accuracy. The resulting Area Navigation(RNAV) capability is able to better utilize resources (e.g., fuel and time). This capability isimplemented in the Flight Management Systems (FMS) where the system controls theairplane path along a stored trajectory and enables RNAV operations on any desired flightpath within the coverage of station-referenced navigation aids or within the performancelimits of self-contained aids.
AreaNavigation
AirData
AutopilotFlight Director
FlightPlan
Nav/PerfData Base
DME/TACANGPS VOR IRS ILS/MLSADF
(NDB)PitotStatic
ElectronicFlightInstruments Secondary
FlightInstruments
ControlDisplay
Unit ModeControlPanel
Figure 5.7 Navigation Functionality Overview
The FMS provides the crew both lateral and vertical flight path guidance cues alongpredefined procedures or can fly the airplane in an automated flight mode. Thus, bycombining the navigation systems developed over the decades, incremental operationalbenefits have been obtained since the late 1980s in all phases of flight. New capabilitiesintroduced in the 1990s, based on GPS technology, have allowed a further increase inaccuracy or overall performance. These performance enhancements are the basis for themany new applications proposed by the user. The most promising of these are illustratedin the following paragraphs.
5.3.2 Terminal Area Navigation
Terminal area routes provide access to the en route structure for departing airplanes (SID)and routing to enter and execute the approach (STAR) and landing phase for arrivingairplanes. The procedures are stored in the navigation database and are selectable from a
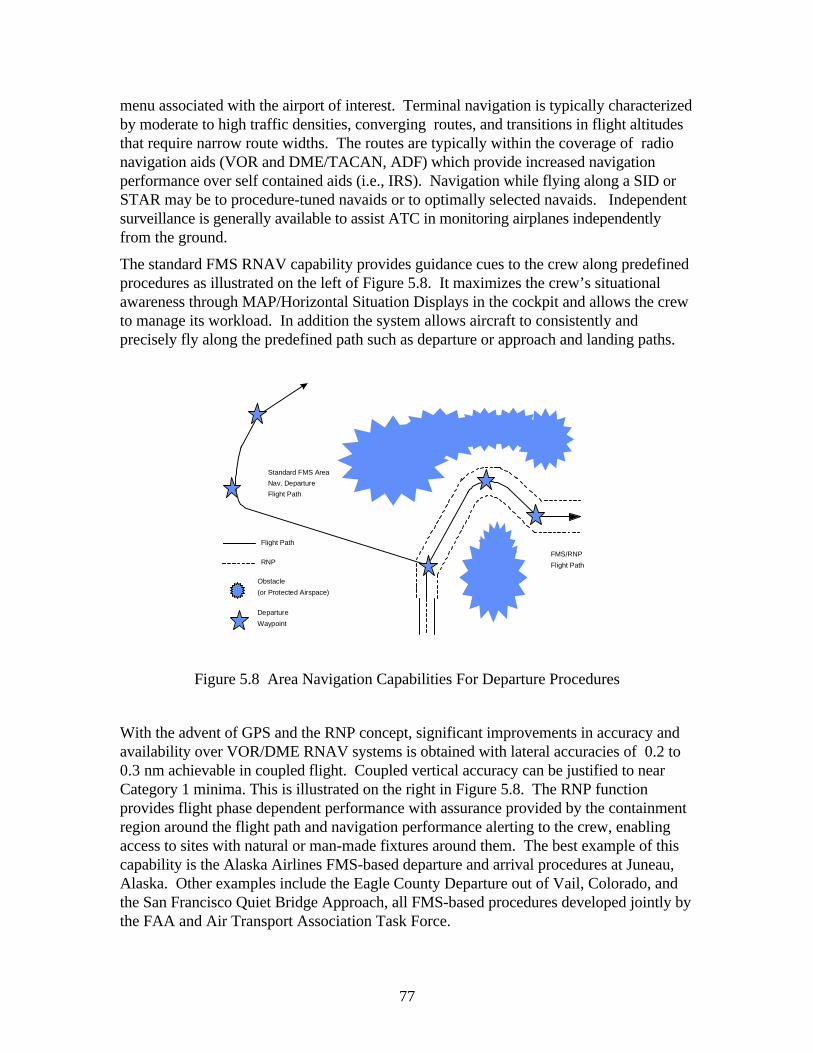
77
menu associated with the airport of interest. Terminal navigation is typically characterizedby moderate to high traffic densities, converging routes, and transitions in flight altitudesthat require narrow route widths. The routes are typically within the coverage of radionavigation aids (VOR and DME/TACAN, ADF) which provide increased navigationperformance over self contained aids (i.e., IRS). Navigation while flying along a SID orSTAR may be to procedure-tuned navaids or to optimally selected navaids. Independentsurveillance is generally available to assist ATC in monitoring airplanes independentlyfrom the ground.
The standard FMS RNAV capability provides guidance cues to the crew along predefinedprocedures as illustrated on the left of Figure 5.8. It maximizes the crew’s situationalawareness through MAP/Horizontal Situation Displays in the cockpit and allows the crewto manage its workload. In addition the system allows aircraft to consistently andprecisely fly along the predefined path such as departure or approach and landing paths.
FMS/RNP
Flight Path
Flight Path
RNP
Obstacle
(or Protected Airspace)
Departure
Waypoint
Standard FMS Area
Nav. Departure
Flight Path
Figure 5.8 Area Navigation Capabilities For Departure Procedures
With the advent of GPS and the RNP concept, significant improvements in accuracy andavailability over VOR/DME RNAV systems is obtained with lateral accuracies of 0.2 to0.3 nm achievable in coupled flight. Coupled vertical accuracy can be justified to nearCategory 1 minima. This is illustrated on the right in Figure 5.8. The RNP functionprovides flight phase dependent performance with assurance provided by the containmentregion around the flight path and navigation performance alerting to the crew, enablingaccess to sites with natural or man-made fixtures around them. The best example of thiscapability is the Alaska Airlines FMS-based departure and arrival procedures at Juneau,Alaska. Other examples include the Eagle County Departure out of Vail, Colorado, andthe San Francisco Quiet Bridge Approach, all FMS-based procedures developed jointly bythe FAA and Air Transport Association Task Force.
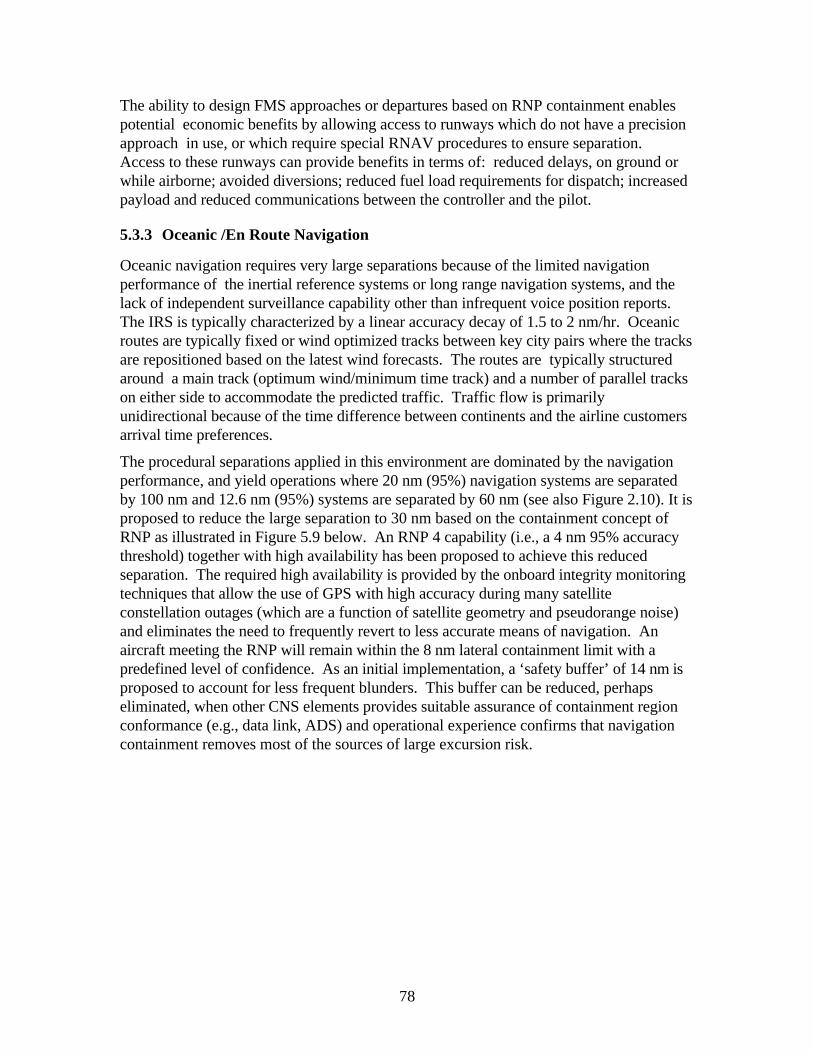
78
The ability to design FMS approaches or departures based on RNP containment enablespotential economic benefits by allowing access to runways which do not have a precisionapproach in use, or which require special RNAV procedures to ensure separation.Access to these runways can provide benefits in terms of: reduced delays, on ground orwhile airborne; avoided diversions; reduced fuel load requirements for dispatch; increasedpayload and reduced communications between the controller and the pilot.
5.3.3 Oceanic /En Route Navigation
Oceanic navigation requires very large separations because of the limited navigationperformance of the inertial reference systems or long range navigation systems, and thelack of independent surveillance capability other than infrequent voice position reports.The IRS is typically characterized by a linear accuracy decay of 1.5 to 2 nm/hr. Oceanicroutes are typically fixed or wind optimized tracks between key city pairs where the tracksare repositioned based on the latest wind forecasts. The routes are typically structuredaround a main track (optimum wind/minimum time track) and a number of parallel trackson either side to accommodate the predicted traffic. Traffic flow is primarilyunidirectional because of the time difference between continents and the airline customersarrival time preferences.
The procedural separations applied in this environment are dominated by the navigationperformance, and yield operations where 20 nm (95%) navigation systems are separatedby 100 nm and 12.6 nm (95%) systems are separated by 60 nm (see also Figure 2.10). It isproposed to reduce the large separation to 30 nm based on the containment concept ofRNP as illustrated in Figure 5.9 below. An RNP 4 capability (i.e., a 4 nm 95% accuracythreshold) together with high availability has been proposed to achieve this reducedseparation. The required high availability is provided by the onboard integrity monitoringtechniques that allow the use of GPS with high accuracy during many satelliteconstellation outages (which are a function of satellite geometry and pseudorange noise)and eliminates the need to frequently revert to less accurate means of navigation. Anaircraft meeting the RNP will remain within the 8 nm lateral containment limit with apredefined level of confidence. As an initial implementation, a ‘safety buffer’ of 14 nm isproposed to account for less frequent blunders. This buffer can be reduced, perhapseliminated, when other CNS elements provides suitable assurance of containment regionconformance (e.g., data link, ADS) and operational experience confirms that navigationcontainment removes most of the sources of large excursion risk.
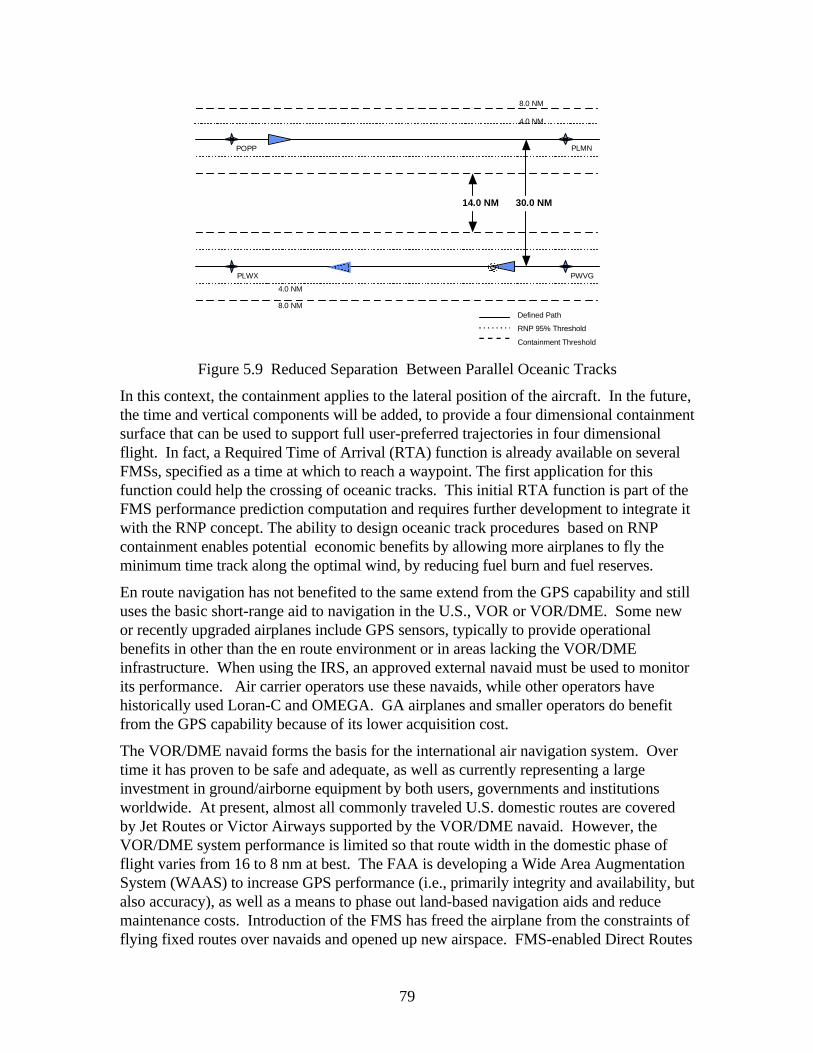
79
POPP PLMN
PLWX PWVG
30.0 NM14.0 NM
8.0 NM
4.0 NM
8.0 NM
4.0 NM
Defined Path
RNP 95% Threshold
Containment Threshold
Figure 5.9 Reduced Separation Between Parallel Oceanic Tracks
In this context, the containment applies to the lateral position of the aircraft. In the future,the time and vertical components will be added, to provide a four dimensional containmentsurface that can be used to support full user-preferred trajectories in four dimensionalflight. In fact, a Required Time of Arrival (RTA) function is already available on severalFMSs, specified as a time at which to reach a waypoint. The first application for thisfunction could help the crossing of oceanic tracks. This initial RTA function is part of theFMS performance prediction computation and requires further development to integrate itwith the RNP concept. The ability to design oceanic track procedures based on RNPcontainment enables potential economic benefits by allowing more airplanes to fly theminimum time track along the optimal wind, by reducing fuel burn and fuel reserves.
En route navigation has not benefited to the same extend from the GPS capability and stilluses the basic short-range aid to navigation in the U.S., VOR or VOR/DME. Some newor recently upgraded airplanes include GPS sensors, typically to provide operationalbenefits in other than the en route environment or in areas lacking the VOR/DMEinfrastructure. When using the IRS, an approved external navaid must be used to monitorits performance. Air carrier operators use these navaids, while other operators havehistorically used Loran-C and OMEGA. GA airplanes and smaller operators do benefitfrom the GPS capability because of its lower acquisition cost.
The VOR/DME navaid forms the basis for the international air navigation system. Overtime it has proven to be safe and adequate, as well as currently representing a largeinvestment in ground/airborne equipment by both users, governments and institutionsworldwide. At present, almost all commonly traveled U.S. domestic routes are coveredby Jet Routes or Victor Airways supported by the VOR/DME navaid. However, theVOR/DME system performance is limited so that route width in the domestic phase offlight varies from 16 to 8 nm at best. The FAA is developing a Wide Area AugmentationSystem (WAAS) to increase GPS performance (i.e., primarily integrity and availability, butalso accuracy), as well as a means to phase out land-based navigation aids and reducemaintenance costs. Introduction of the FMS has freed the airplane from the constraints offlying fixed routes over navaids and opened up new airspace. FMS-enabled Direct Routes
80
(i.e., Great Circle tracks) have been introduced progressively to save fuel and time byavoiding the inherent detours of fixed routes (e.g., National Route Program and randomroutes/User Preferred Trajectories). Fixed track routings have been retained where thetraffic distribution must be kept simple and/or the number of crossing points in a sectorkept well defined.
5.3.4 Landing and Surface Operations
The ILS navigation aids (i.e., localizer and glide slope) provides lateral (from 25 nm out)and vertical guidance (from 10 nm out) to the runway. Marker beacons or DME navaidsindicate the distance to the runway threshold. Precision Approach Minimums range fromCAT I to CAT III operations as a function of Decision Height (DH) and Runway VisualRange (RVR). CAT I requires 200 feet DH and 1800 to 2400 feet RVR minimadepending on lighting system and airplane speed category, CAT III requires a DH between0 and 50 feet and an RVR from not less than 700 feet (CAT IIIA) to not less than 150feet (CAT IIIB). The ILS performance is limited in some areas by FM frequencyinterference, in-band congestion, and siting limitations (an ILS site requires thesurrounding terrain to be flat so that signal characteristics are not distorted). Hence, theMicrowave Landing System was developed to the same performance requirements as ILS.The FAA’s MLS development contract ran into production problems in the late 1980s andwas later canceled. It has been replaced with the Local Area Augmentation System(LAAS) program which is a GPS-based landing system augmented with groundaugmentation aids. LAAS performance will include coverage for multiple runways orairports in a regions. Airplane avionics are being developed to carry a Multi-ModeReceiver (MMR) able to interface the crew controls and displays with one of severalreceivers, either ILS, MLS or GPS Landing System (GLS).
5.4 Surveillance
5.4.1 Summary of Surveillance Evolution
The current surveillance system is based on the use of redundant primary and secondary(beacon) radars. The role that ground based radars play may be gradually diminished asGPS-based ADS1 systems become available. The evolution to next generationsurveillance is complicated by interoperability and compatibility with current systems inuse. Two principles which limit available options for next generation systems are:
• Compatibility with current secondary radar systems, i.e. Mode A/ C/ S
• Interoperability with current TCAS collision avoidance systems and next generationCockpit Display of Traffic Information (CDTI)-based air/air surveillance and situationawareness
1 In this section ADS is referred to in a generic sense rather than as a specific implementation. In this sense,Mode-S Specific Services, Mode-S extended squitter broadcast and contract based ADS as defined by RTCADO-212 represent specific implementations of ADS technology.
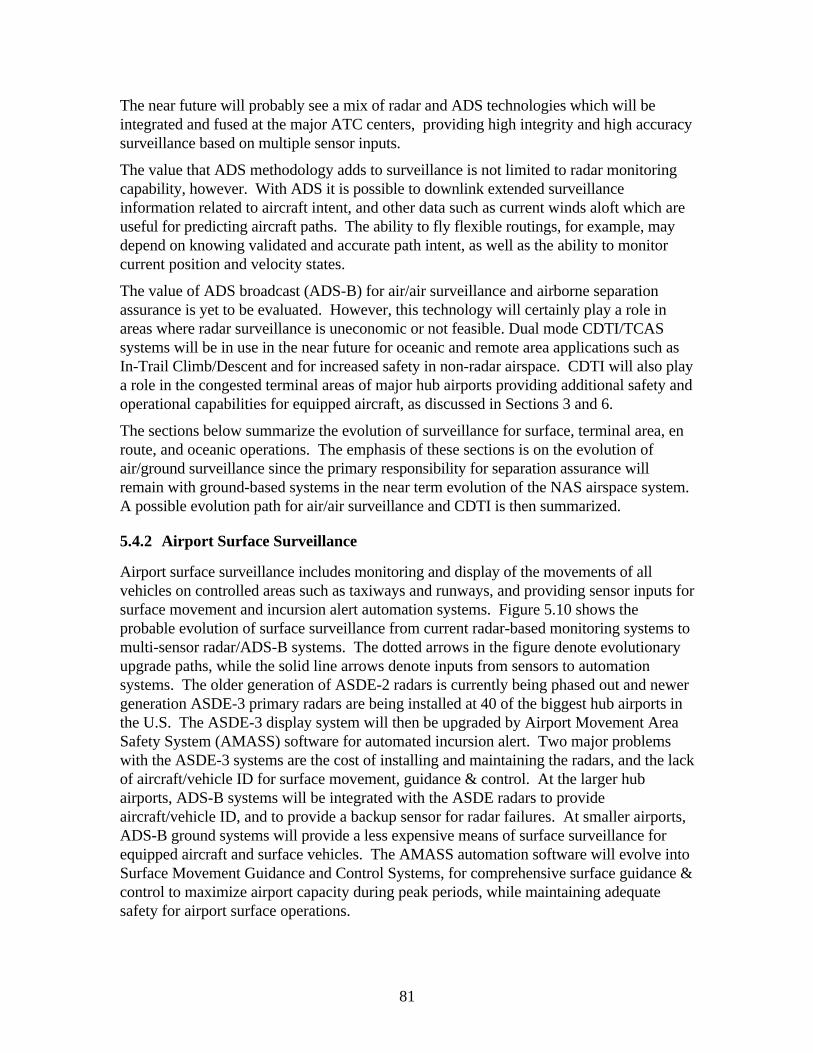
81
The near future will probably see a mix of radar and ADS technologies which will beintegrated and fused at the major ATC centers, providing high integrity and high accuracysurveillance based on multiple sensor inputs.
The value that ADS methodology adds to surveillance is not limited to radar monitoringcapability, however. With ADS it is possible to downlink extended surveillanceinformation related to aircraft intent, and other data such as current winds aloft which areuseful for predicting aircraft paths. The ability to fly flexible routings, for example, maydepend on knowing validated and accurate path intent, as well as the ability to monitorcurrent position and velocity states.
The value of ADS broadcast (ADS-B) for air/air surveillance and airborne separationassurance is yet to be evaluated. However, this technology will certainly play a role inareas where radar surveillance is uneconomic or not feasible. Dual mode CDTI/TCASsystems will be in use in the near future for oceanic and remote area applications such asIn-Trail Climb/Descent and for increased safety in non-radar airspace. CDTI will also playa role in the congested terminal areas of major hub airports providing additional safety andoperational capabilities for equipped aircraft, as discussed in Sections 3 and 6.
The sections below summarize the evolution of surveillance for surface, terminal area, enroute, and oceanic operations. The emphasis of these sections is on the evolution ofair/ground surveillance since the primary responsibility for separation assurance willremain with ground-based systems in the near term evolution of the NAS airspace system.A possible evolution path for air/air surveillance and CDTI is then summarized.
5.4.2 Airport Surface Surveillance
Airport surface surveillance includes monitoring and display of the movements of allvehicles on controlled areas such as taxiways and runways, and providing sensor inputs forsurface movement and incursion alert automation systems. Figure 5.10 shows theprobable evolution of surface surveillance from current radar-based monitoring systems tomulti-sensor radar/ADS-B systems. The dotted arrows in the figure denote evolutionaryupgrade paths, while the solid line arrows denote inputs from sensors to automationsystems. The older generation of ASDE-2 radars is currently being phased out and newergeneration ASDE-3 primary radars are being installed at 40 of the biggest hub airports inthe U.S. The ASDE-3 display system will then be upgraded by Airport Movement AreaSafety System (AMASS) software for automated incursion alert. Two major problemswith the ASDE-3 systems are the cost of installing and maintaining the radars, and the lackof aircraft/vehicle ID for surface movement, guidance & control. At the larger hubairports, ADS-B systems will be integrated with the ASDE radars to provideaircraft/vehicle ID, and to provide a backup sensor for radar failures. At smaller airports,ADS-B ground systems will provide a less expensive means of surface surveillance forequipped aircraft and surface vehicles. The AMASS automation software will evolve intoSurface Movement Guidance and Control Systems, for comprehensive surface guidance &control to maximize airport capacity during peak periods, while maintaining adequatesafety for airport surface operations.
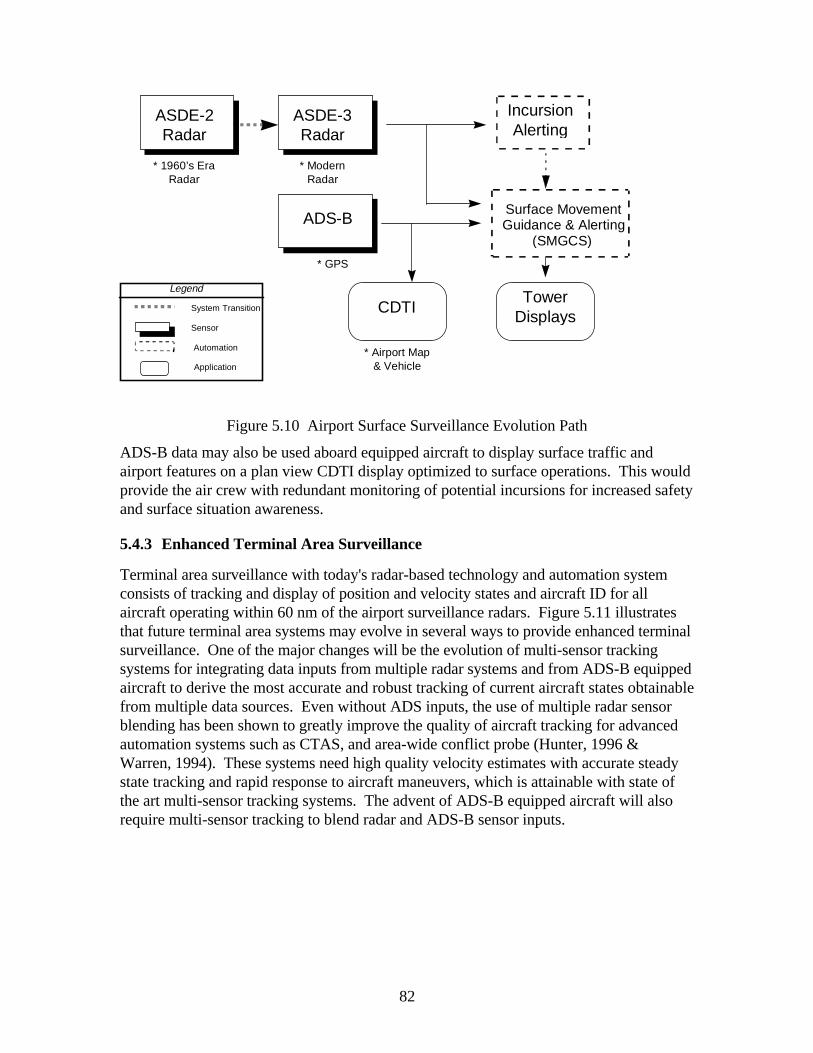
82
ASDE-2Radar
ASDE-3Radar
ADS-B
CDTI
IncursionAlerting
Surface MovementGuidance & Alerting
(SMGCS)
TowerDisplays
* 1960’s EraRadar
* ModernRadar
* GPS
* Airport Map& Vehicle
Legend
System Transition
Sensor
Automation
Application
Figure 5.10 Airport Surface Surveillance Evolution Path
ADS-B data may also be used aboard equipped aircraft to display surface traffic andairport features on a plan view CDTI display optimized to surface operations. This wouldprovide the air crew with redundant monitoring of potential incursions for increased safetyand surface situation awareness.
5.4.3 Enhanced Terminal Area Surveillance
Terminal area surveillance with today's radar-based technology and automation systemconsists of tracking and display of position and velocity states and aircraft ID for allaircraft operating within 60 nm of the airport surveillance radars. Figure 5.11 illustratesthat future terminal area systems may evolve in several ways to provide enhanced terminalsurveillance. One of the major changes will be the evolution of multi-sensor trackingsystems for integrating data inputs from multiple radar systems and from ADS-B equippedaircraft to derive the most accurate and robust tracking of current aircraft states obtainablefrom multiple data sources. Even without ADS inputs, the use of multiple radar sensorblending has been shown to greatly improve the quality of aircraft tracking for advancedautomation systems such as CTAS, and area-wide conflict probe (Hunter, 1996 &Warren, 1994). These systems need high quality velocity estimates with accurate steadystate tracking and rapid response to aircraft maneuvers, which is attainable with state ofthe art multi-sensor tracking systems. The advent of ADS-B equipped aircraft will alsorequire multi-sensor tracking to blend radar and ADS-B sensor inputs.
83
ASR/SSRRadar
ASR/SSRRadar
TerminalAutomation
ADS / ADS-B?ADS-BCDTI
Multi-SensorTracking
Short Term
Arrival/Departure
Path Predictions(20 min lookahead)
* 1990’s EraAutomation
* GPS Squitters* Winds Aloft* Future Waypoints* Event Reports
Separation Managers
Figure 5.11 Terminal Area Surveillance Evolution Path
A second major change is that surveillance will evolve to include any data inputs that canbe used for improved path predictions. This will include radar and ADS-B measurementsof current position and velocity, information on current flight plan and path intent, anddata related to winds aloft along the intended path. The current ADS systems for oceanicuse recognize the need for such extended surveillance, and explicitly include downlink ofwinds aloft and future waypoints for more accurate tactical and strategic path prediction.With current ground-based systems, 3-4 minute path predictions are generated for conflictalert, based on current estimates of aircraft position and velocity. Automation systemssuch as CTAS and regional conflict probe require 20-30 min. predictions of aircraft path,and thus require much more extensive data fusion of wind, tracker states, and path intentto achieve high quality path predictions. In this regard, ADS systems can play a uniquerole not feasible with current surveillance systems, i.e. transmitting aircraft intent,including the generation of event messages when path intent changes.
It is technically feasible to transmit extended surveillance data such as waypoint intentusing either ADS-B or ADS-A selective addressing. However, such data is unlikely to beof interest to the general population of air and ground users capable of receiving ADS-Bmessages. Thus, the current thinking is that extended surveillance data such as futurewaypoints and winds aloft will be obtained using selectively addressed ADS. In any event,the terminal areas of busy hubs need dynamic flight intent updating to support futureoperational concepts such as departure and arrival automation and dynamic selection ofSID and STAR routing options.
The use of ADS-B data for air/air surveillance and CDTI applications such as aids tovisual approaches and visual acquisition of traffic is also important for increased safety andcapacity in the future CNS/ATM system. Although separation assurance and flow
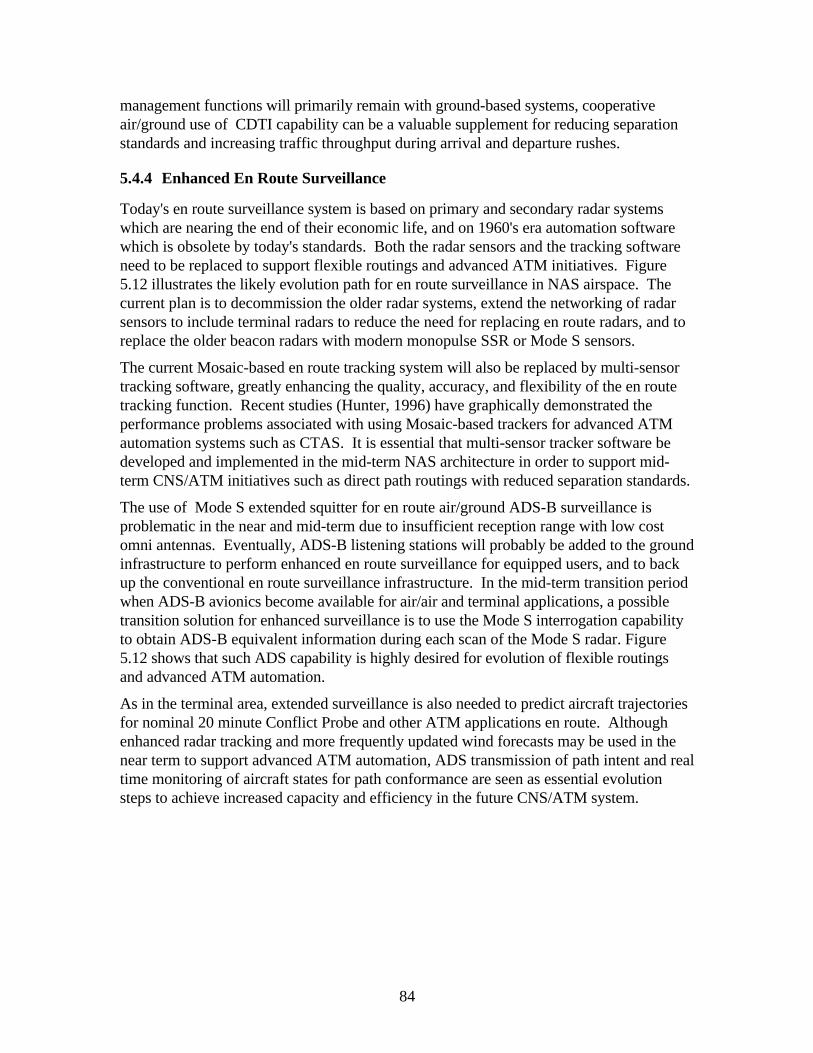
84
management functions will primarily remain with ground-based systems, cooperativeair/ground use of CDTI capability can be a valuable supplement for reducing separationstandards and increasing traffic throughput during arrival and departure rushes.
5.4.4 Enhanced En Route Surveillance
Today's en route surveillance system is based on primary and secondary radar systemswhich are nearing the end of their economic life, and on 1960's era automation softwarewhich is obsolete by today's standards. Both the radar sensors and the tracking softwareneed to be replaced to support flexible routings and advanced ATM initiatives. Figure5.12 illustrates the likely evolution path for en route surveillance in NAS airspace. Thecurrent plan is to decommission the older radar systems, extend the networking of radarsensors to include terminal radars to reduce the need for replacing en route radars, and toreplace the older beacon radars with modern monopulse SSR or Mode S sensors.
The current Mosaic-based en route tracking system will also be replaced by multi-sensortracking software, greatly enhancing the quality, accuracy, and flexibility of the en routetracking function. Recent studies (Hunter, 1996) have graphically demonstrated theperformance problems associated with using Mosaic-based trackers for advanced ATMautomation systems such as CTAS. It is essential that multi-sensor tracker software bedeveloped and implemented in the mid-term NAS architecture in order to support mid-term CNS/ATM initiatives such as direct path routings with reduced separation standards.
The use of Mode S extended squitter for en route air/ground ADS-B surveillance isproblematic in the near and mid-term due to insufficient reception range with low costomni antennas. Eventually, ADS-B listening stations will probably be added to the groundinfrastructure to perform enhanced en route surveillance for equipped users, and to backup the conventional en route surveillance infrastructure. In the mid-term transition periodwhen ADS-B avionics become available for air/air and terminal applications, a possibletransition solution for enhanced surveillance is to use the Mode S interrogation capabilityto obtain ADS-B equivalent information during each scan of the Mode S radar. Figure5.12 shows that such ADS capability is highly desired for evolution of flexible routingsand advanced ATM automation.
As in the terminal area, extended surveillance is also needed to predict aircraft trajectoriesfor nominal 20 minute Conflict Probe and other ATM applications en route. Althoughenhanced radar tracking and more frequently updated wind forecasts may be used in thenear term to support advanced ATM automation, ADS transmission of path intent and realtime monitoring of aircraft states for path conformance are seen as essential evolutionsteps to achieve increased capacity and efficiency in the future CNS/ATM system.
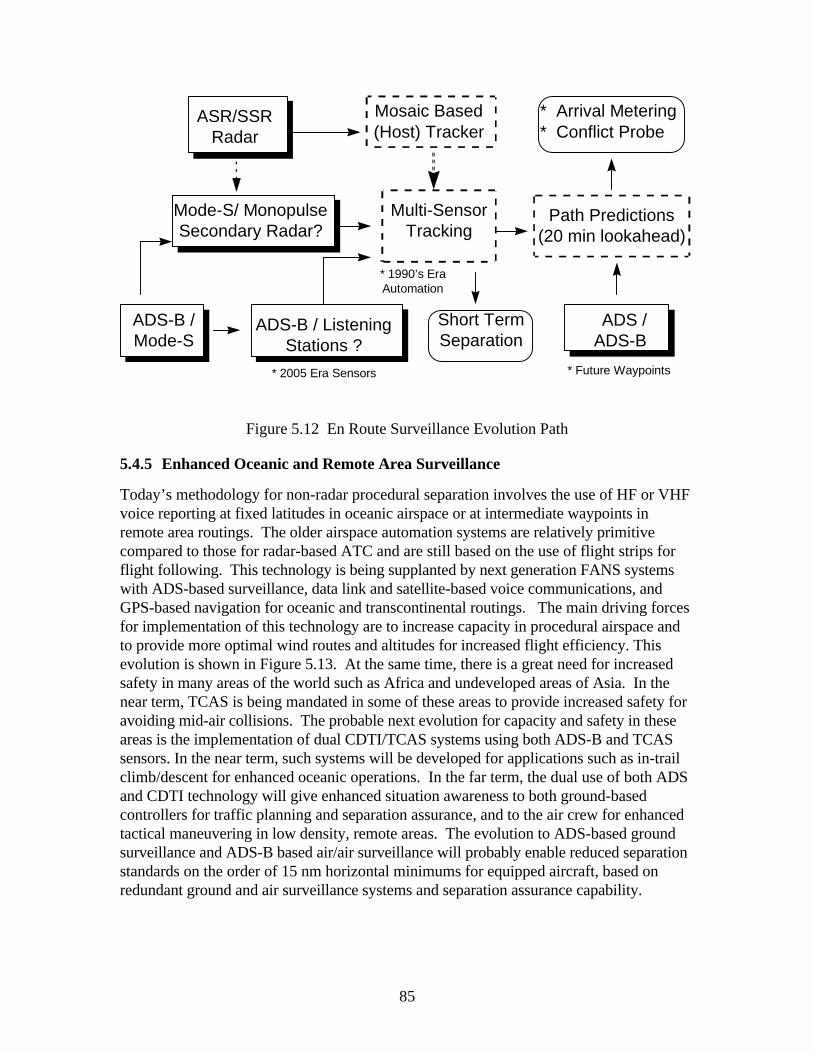
85
ASR/SSRRadar
Multi-SensorTracking
* 1990’s EraAutomation
Mode-S/ MonopulseSecondary Radar?
ADS-B / ListeningStations ?
ADS / ADS-B
ADS-B /Mode-S
Mosaic Based(Host) Tracker
Path Predictions(20 min lookahead)
* Arrival Metering* Conflict Probe
Short TermSeparation
* 2005 Era Sensors * Future Waypoints
Figure 5.12 En Route Surveillance Evolution Path
5.4.5 Enhanced Oceanic and Remote Area Surveillance
Today’s methodology for non-radar procedural separation involves the use of HF or VHFvoice reporting at fixed latitudes in oceanic airspace or at intermediate waypoints inremote area routings. The older airspace automation systems are relatively primitivecompared to those for radar-based ATC and are still based on the use of flight strips forflight following. This technology is being supplanted by next generation FANS systemswith ADS-based surveillance, data link and satellite-based voice communications, andGPS-based navigation for oceanic and transcontinental routings. The main driving forcesfor implementation of this technology are to increase capacity in procedural airspace andto provide more optimal wind routes and altitudes for increased flight efficiency. Thisevolution is shown in Figure 5.13. At the same time, there is a great need for increasedsafety in many areas of the world such as Africa and undeveloped areas of Asia. In thenear term, TCAS is being mandated in some of these areas to provide increased safety foravoiding mid-air collisions. The probable next evolution for capacity and safety in theseareas is the implementation of dual CDTI/TCAS systems using both ADS-B and TCASsensors. In the near term, such systems will be developed for applications such as in-trailclimb/descent for enhanced oceanic operations. In the far term, the dual use of both ADSand CDTI technology will give enhanced situation awareness to both ground-basedcontrollers for traffic planning and separation assurance, and to the air crew for enhancedtactical maneuvering in low density, remote areas. The evolution to ADS-based groundsurveillance and ADS-B based air/air surveillance will probably enable reduced separationstandards on the order of 15 nm horizontal minimums for equipped aircraft, based onredundant ground and air surveillance systems and separation assurance capability.
86
HF / VHFVoice Reporting
FIRSTGENERATION
OCEANICAUTOMATION
SEPARATION ASSURANCE
ADS / CPDLCDATALINK
ADS -B / TCASSENSOR
ENHANCEDOCEANIC
AUTOMATION FLIGHT PLANNING/REROUTING
CDTI / TCAS
PROBLEM RESOLUTION
* 1990’s EraAutomation
Figure 5.13 Oceanic/Remote Area Surveillance Evolution Path
The widespread use of ADS-B and CDTI technology for separation assurance may firstoccur in oceanic airspace. In essence, the oceanic centers would provide strategicplanning and separation services for such aircraft, and the flight crews of equipped aircraftwould provide short term separation services for limited tactical encounters such as trackcrossings. For reduced separation standards, both aircraft involved in an encounter willneed to be ADS or ADS-B equipped.
5.4.6 Enhanced Air/air Surveillance and CDTI Evolution
Although there are many potential applications for CDTI, a phased implementation ofADS-B/CDTI equipage is envisioned, since user benefits depend on the percentage ofADS-B equipped aircraft for each application. A few of the more noteworthy applicationsand their possible role in the evolution of CDTI are briefly described below.
The near term applications of CDTI are for proposed functions such as in-trail climb, in-trail stationkeeping, enhanced visual approaches, and on-board monitoring of closelyspaced parallel approaches. These functions may be viewed as extensions of existingTCAS avionics and display systems. However, the TCAS systems were designed forcollision avoidance and were never intended for such applications. From a userperspective, however, TCAS systems are expensive avionics which serve a limited, thoughimportant function. There is great interest in extending the functionality of suchequipment. One likely group of users transitioning to ADS-B may be the TCAS userswho have already invested in Mode S transponders, TCAS processors and cockpitdisplays. Moreover, widespread ADS-B equipage by TCAS users may justifydevelopment of increased performance TCAS systems with lower false alarm rates andmore accurate detection and display of intruder aircraft.
87
Another group of users which can benefit from ADS-B and CDTI equipage are the non-TCAS aircraft which fly in high density terminal airspace and need a lower cost system forconflict avoidance and visual acquisition of traffic. Although TCAS-I was originallyintended for such users, equipage costs have proved prohibitive for most GA and militaryusers. However, a transition problem exists for potential CDTI users since user equipagemay not be cost effective unless a substantial portion of the airspace population is visible.The likely transition solution is the implementation of Traffic Information Services (TIS)which would transmit ground-based surveillance data to airborne users. Eventually, asADS-B systems are mandated in such airspace, the TIS services can be replaced withADS-B surveillance as a primary source of CDTI input data.
The last application to be mentioned is the use of ADS-B and CDTI technology forcooperative Airborne Separation Assurance Systems (ASAS). The concept of operationis cooperative since responsibility for separation assurance is primarily a ground functionas in the current system, except that during limited time encounters between two aircraft,responsibility for monitoring and assuring safe separation can be transferred to properlyequipped and certified air crew. The motivation for this mode of operation is the ability tofly User Preferred Trajectories, including user specified routing, speed, and cruise altitudesfor most economic flight operations. Such operations may lead to an increased number ofencounters, however, compared with current operational procedures. Controllerworkload may be kept within acceptable bounds by transferring separation assurance tothe air crew, who can perform separation monitoring during close proximity encountersand activate conflict avoidance maneuvers whenever a potential loss of separation isdetected.
5.5 Aviation Weather
Operational aviation weather services are provided by the FAA, the National WeatherService (NWS), and the private sector. Research and development of aviation weathertechnologies is conducted by the FAA, the National Oceanic and AtmosphericAdministration (NOAA), NASA, the MIT Lincoln Laboratory, and the National Centerfor Atmospheric Research (NCAR). The operational and research functions performed bythese organizations can be broken down into four areas:
• Observations• Analysis• Forecasting• Dissemination
Figure 5.14 illustrates the functional relationships between these four areas. Observationsare used to prepare analyses of current weather, which in turn are used to prepareforecasts of expected conditions. Forecast products usually include gridded data fields,which must themselves be analyzed. Finally, the analysis and forecast products are passedto the users via the dissemination process.
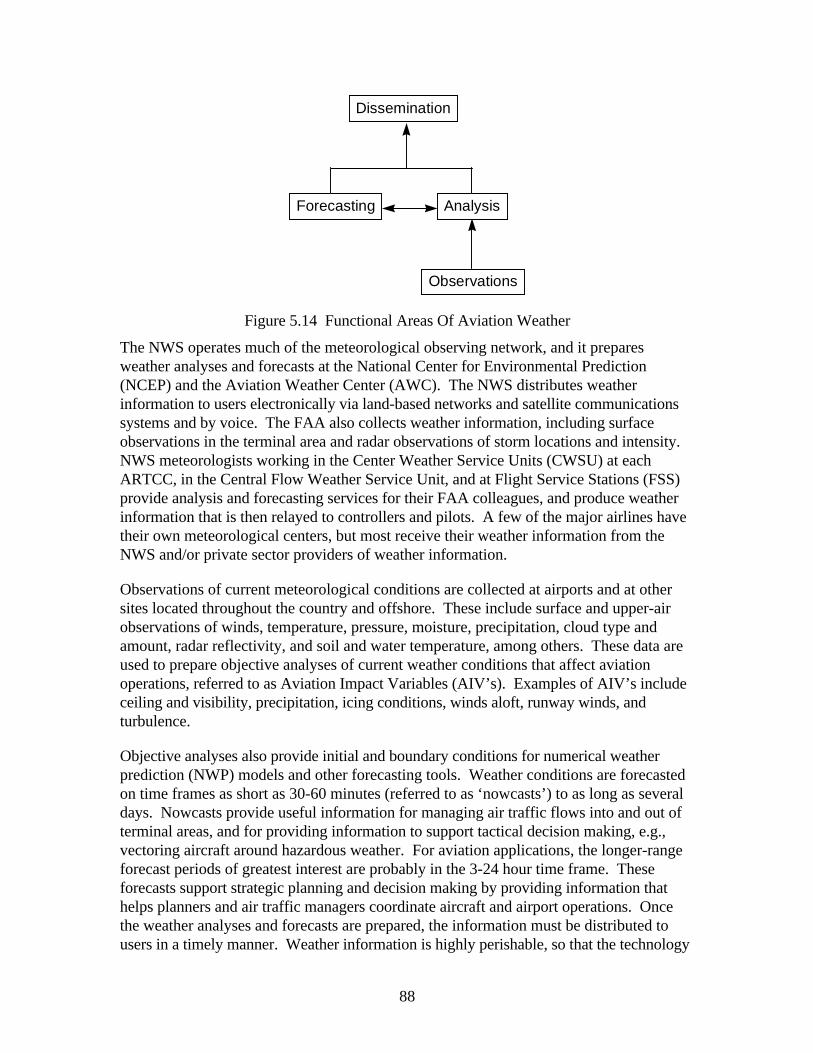
88
Dissemination
AnalysisForecasting
Observations
Figure 5.14 Functional Areas Of Aviation Weather
The NWS operates much of the meteorological observing network, and it preparesweather analyses and forecasts at the National Center for Environmental Prediction(NCEP) and the Aviation Weather Center (AWC). The NWS distributes weatherinformation to users electronically via land-based networks and satellite communicationssystems and by voice. The FAA also collects weather information, including surfaceobservations in the terminal area and radar observations of storm locations and intensity.NWS meteorologists working in the Center Weather Service Units (CWSU) at eachARTCC, in the Central Flow Weather Service Unit, and at Flight Service Stations (FSS)provide analysis and forecasting services for their FAA colleagues, and produce weatherinformation that is then relayed to controllers and pilots. A few of the major airlines havetheir own meteorological centers, but most receive their weather information from theNWS and/or private sector providers of weather information.
Observations of current meteorological conditions are collected at airports and at othersites located throughout the country and offshore. These include surface and upper-airobservations of winds, temperature, pressure, moisture, precipitation, cloud type andamount, radar reflectivity, and soil and water temperature, among others. These data areused to prepare objective analyses of current weather conditions that affect aviationoperations, referred to as Aviation Impact Variables (AIV’s). Examples of AIV’s includeceiling and visibility, precipitation, icing conditions, winds aloft, runway winds, andturbulence.
Objective analyses also provide initial and boundary conditions for numerical weatherprediction (NWP) models and other forecasting tools. Weather conditions are forecastedon time frames as short as 30-60 minutes (referred to as ‘nowcasts’) to as long as severaldays. Nowcasts provide useful information for managing air traffic flows into and out ofterminal areas, and for providing information to support tactical decision making, e.g.,vectoring aircraft around hazardous weather. For aviation applications, the longer-rangeforecast periods of greatest interest are probably in the 3-24 hour time frame. Theseforecasts support strategic planning and decision making by providing information thathelps planners and air traffic managers coordinate aircraft and airport operations. Oncethe weather analyses and forecasts are prepared, the information must be distributed tousers in a timely manner. Weather information is highly perishable, so that the technology
89
and human factor elements in all four of these areas must work together effectively andefficiently.
5.5.1 Observations
Weather observations for aviation applications are collected by the NWS, FAA, and theairlines themselves, via the Meteorological Data Collection and Reporting System(MDCRS). Meteorological data used in the aviation weather system can be broken downinto four broad categories, which include:
• Surface observations of present weather, such as winds, temperatures, pressure andaltimeter setting, atmospheric water vapor, precipitation, visibility, and cloud cover.
• Upper-air observations of winds, temperatures, pressure, and water vapor.
• Weather radar reflectivity data showing storm location, intensity, and motion; andDoppler radar observations of near-surface and upper-air winds.
• Visible and infrared satellite imagery of cloud location, motion, and temperature; andwater vapor imagery showing upper-air circulation patterns.
Historically, most operational aviation weather systems have been operated in a stand-alone mode, that is, there has been little or no integration of the data into systems thatdirectly supported aviation operations (the Low Level Wind Shear Avoidance System,LLWAS, is an exception). This paradigm is finally changing. The Lincoln Laboratory isdeveloping and testing algorithms to detect gust fronts and measure microburst intensitieswith Doppler radar, and to present this information to controllers along with otheraviation-related information via the Integrated Terminal Weather System (ITWS) (Evansand Ducot, 1997). Likewise, the Aviation Vortex Spacing System (AVOSS) program atNASA’s Langley Research Center is developing an operational wake vortex separationtool, which will likely require surface and upper-air meteorological data from a network ofsensors that are not currently being used at airports (Hinton, 1997). These kinds oftechnologies hold much promise for improving the safety, efficiency, and capacity of theATM system. They will also expand requirements for observations in the airport and enroute environments, and they will require research into instrument and systemperformance metrics, human factors engineering, and operator training issues.
Figure 5.15 identifies the major instrument systems used in the four categories ofobservations mentioned above. The following sections describe the different types ofweather observing systems currently in use or planned for the near term, and indicate areaswhere new technologies are needed to support weather requirements for the future ATMsystem.
5.5.1.1 Surface Observations
Surface measurements are made with a combination of in-situ and remote sensing systems.The NWS is completing its deployment of the Automated Surface Observing System(ASOS), and the FAA is completing the network of Automated Weather Observing
90
Systems (AWOS). These systems are complementary, but perform somewhat differentfunctions. The ASOS was intended to be a complete surface meteorological observingstation that would replace human observers. ASOS systems are deployed at airports butalso in a much broader weather observing network around the country. Problems haveemerged with some of the ASOS sensors, particularly the visibility package, which haveprevented the ASOS from achieving the goal to eliminate human observers. Workcontinues on these problems, but the likelihood of their success is not known at this time.Human observations of some critical aviation impact variables will likely be needed for theforeseeable future (National Research Council, 1995). The AWOS is designed strictly as aterminal weather information system. It was not intended to eliminate human observers,but it does provide certified observations of ceiling, visibility, altimeter setting, windspeed, and wind direction. It too has been criticized for providing misleading aviationweather information, especially ceiling observations.
Specific information on the performance of the sensors on the ASOS and AWOS was notavailable at the time of this writing. However, it is reasonable to expect that the accuracyof the sensors is adequate for most current and expected analytical and modelingapplications. The notable exception is that the visibility and present weather sensors havebeen criticized for giving inaccurate and misleading information under some circumstances(NRC, 1995). An important issue for the success of future improvements in aviationweather information is likely to be increasing the spatial density of measurements toprovide improved coverage of key weather parameters. When completed, the ASOSnetwork will consist of over 850 units and the AWOS network will consist of 160 unitslocated at airports that do not otherwise provide certified weather information. (Somestate governments have also purchased AWOS systems.) These two surface monitoringsystems will likely go forward for a decade or longer as the primary surface observingsystems used for aviation weather.
Other sources of surface data are used for aviation weather, primarily to support tacticaldecision making. For example, the FAA operates sensors that measure runway visualrange (RVR). Errors in automated RVR systems (and ASOS and AWOS visibilitymeasurements) deployed to date suggest that near term improvements in visibilitymeasurement technologies could improve the efficiency of airport operations. The FAAalso operates the LLWAS, a network of tower-mounted anemometers that is supposed todetect potentially hazardous wind shear and microburst conditions at the airport.However, concerns over the efficacy of LLWAS data have sometimes lead controllers toignore LLWAS warnings. This was apparently the case during the 1994 crash of a USAirMD-80 at Charlotte-Douglas airport (NRC, 1995) during a microburst event. In the nearterm, improvements in wind shear algorithms and/or the use of more Doppler radarinformation could improve safety conditions in the terminal area. There is also a nationalnetwork of lightning detection sensors that show where cloud-to-ground lightning strikesare occurring.

91
Observations
SatelliteWeatherRadar
TDWRNEXRAD
ASR-9
Upper-Air
Rawin
NEXRAD
MDCRS
TDWR
Profiler
Surface
ASOS AWOS
LLWAS
Figure 5.15 Aviation Weather Observation Function
5.5.1.2 Upper-Air Observations
Adequate upper-air meteorological data are critical to the aviation weather system, andthis is an area where additional resources and technology development in the near termand far term could produce significant improvements in aviation weather information. Theprimary source of upper-air data comes from the NWS’s network of rawinsondeobservations. Radio wind soundings are made by weather balloons that carry aloft a smallinstrument package called a radiosonde. The radiosonde measures atmospheric pressure,temperature, and moisture as it ascends, which are used to calculate altitude. Radiodirection finding techniques or navaid-based tracking systems follow the motion of theballoon, from which winds aloft are computed. The accuracy of the thermodynamicsensors is generally good (a few percent), while rms errors in winds aloft are typically 1-3m/s. Sounding systems expected to become available in the near term will use GPS totrack balloon position, which should improve the accuracy of altitude data and maysignificantly improve the quality of upper-air wind information. GPS radiosondes have notyet come into widespread use because of their cost relative to conventional radiosondes,but this situation is expected to improve over the next few years.
In the U.S., two soundings are made each day, one at 00 UTC (1900 EST) and the otherat 1200 UTC (0700 EST), at approximately 80 stations in the CONUS, Alaska, andHawaii. The data are used to analyze weather patterns on constant pressure surfaces andaloft winds at constant flight levels, and to initialize NWP models. The meteorologicalcommunity is virtually unanimous in its opinion that increasing the spatial and temporaldensity of upper-air data would significantly improve weather forecasts, but due to budgetconstraints there are no plans to expand the rawinsonde network. The current network isprobably just barely adequate to characterize synoptic-scale weather features (fronts,locations of high and low pressure centers, etc.), but much of the weather that affectsaviation occurs on the mesoscale, e.g., connective storms. The current rawinsonde
92
network does not provide adequate spatial or temporal resolution to monitor theatmospheric environment on this scale, and the accuracy of weather forecasts suffers as aresult. The absence of upper-air data in the oceanic domain also seriously degrades theperformance of NWP models, especially of forecasts issued for coastal areas and of aloftconditions expected during intercontinental flight operations.
To compensate for the lack of data coverage in inland areas, networks of Doppler radarsare being used to provide supplementary upper-air observations. Three categories ofradars are currently providing upper-air information. These include the WSR-88D(NEXRAD) Doppler weather radar, the Terminal Doppler Weather Radar (TDWR), andDoppler radar wind profilers (RWP), which can be equipped with radio acoustic soundingsystems (RASS) for temperature profiling. When fully deployed, the NWS and DOD willoperate a nationwide network of 138 NEXRAD radars, and the FAA will operate TDWRsin 34 terminal areas. Both of these radar systems measure near-surface winds in stormenvironments, and provide vertical profiles of winds in the clear air during periods whenhazardous weather conditions are not occurring.
The only operational RWP network providing upper-air data for aviation analysis andforecasting applications is the Wind Profiler Demonstration Network (WPDN) operatedby NOAA’s Forecast Systems Laboratory (FSL). This network of 404-MHz radarsprovides continuous measurements of upper-air winds through much of the troposphere.There are 32 profilers in the WPDN, most located in the midwest. The WPDN has beenoperational for almost a decade, but has been threatened with elimination because theradar frequency interferes with search and rescue satellite operations. Plans are beingconsidered to convert the WPDN to 449 MHz and to expand the network into theCaribbean and Alaska. In the near term, maintaining and expanding the WPDN wouldlikely benefit aviation weather information by providing enhanced spatial and temporalresolution of aloft winds. For example, RWP data in the TRACON area could improvethe quality of aircraft trajectories calculated by the CTAS system. In addition, there arenow some semi-permanent networks of so-called ‘boundary layer’ RWP and RASS thatoperate near 1 GHz and provide continuous observations of winds and temperatures in thefirst 1-3 km of the atmosphere. The usefulness of data from these instruments in aviationweather applications has not yet been explored to any degree. In the near term, the impactof RWP data from boundary layer profilers on CNS/ATM technologies like CTAS shouldbe investigated.
The quality of Doppler radar wind data has been the subject of several studies in recentyears. There is no way to determine the absolute accuracy of these instruments, since thedata can not be compared to absolutely known values or reference standards in the sameway that surface sensors can be checked. Based on recent intercomparison studies, theaccuracy of Doppler radar wind data is on the order of ±1.0 m/s on a vector componentbasis, with rms errors of about 2.0-2.5 m/s. The completeness of Doppler radar wind datadepends on atmospheric conditions. Higher temperatures and humidities generallyproduce good data recovery, while cold, dry conditions limit data availability. All threeDoppler radar system also suffer from contamination from biological targets, especiallymigrating birds (Wilzak et al., 1994). Migrating birds often appear in Doppler radar data
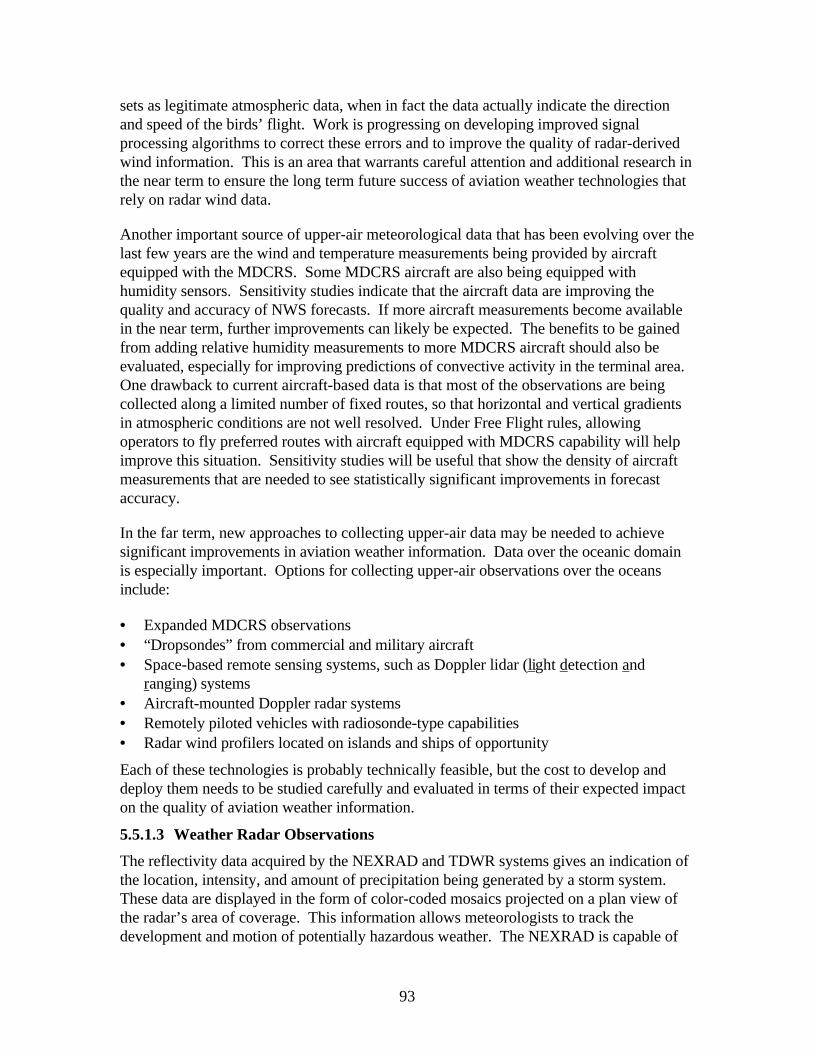
93
sets as legitimate atmospheric data, when in fact the data actually indicate the directionand speed of the birds’ flight. Work is progressing on developing improved signalprocessing algorithms to correct these errors and to improve the quality of radar-derivedwind information. This is an area that warrants careful attention and additional research inthe near term to ensure the long term future success of aviation weather technologies thatrely on radar wind data.
Another important source of upper-air meteorological data that has been evolving over thelast few years are the wind and temperature measurements being provided by aircraftequipped with the MDCRS. Some MDCRS aircraft are also being equipped withhumidity sensors. Sensitivity studies indicate that the aircraft data are improving thequality and accuracy of NWS forecasts. If more aircraft measurements become availablein the near term, further improvements can likely be expected. The benefits to be gainedfrom adding relative humidity measurements to more MDCRS aircraft should also beevaluated, especially for improving predictions of convective activity in the terminal area.One drawback to current aircraft-based data is that most of the observations are beingcollected along a limited number of fixed routes, so that horizontal and vertical gradientsin atmospheric conditions are not well resolved. Under Free Flight rules, allowingoperators to fly preferred routes with aircraft equipped with MDCRS capability will helpimprove this situation. Sensitivity studies will be useful that show the density of aircraftmeasurements that are needed to see statistically significant improvements in forecastaccuracy.
In the far term, new approaches to collecting upper-air data may be needed to achievesignificant improvements in aviation weather information. Data over the oceanic domainis especially important. Options for collecting upper-air observations over the oceansinclude:
• Expanded MDCRS observations• “Dropsondes” from commercial and military aircraft• Space-based remote sensing systems, such as Doppler lidar (light detection and
ranging) systems• Aircraft-mounted Doppler radar systems• Remotely piloted vehicles with radiosonde-type capabilities• Radar wind profilers located on islands and ships of opportunity
Each of these technologies is probably technically feasible, but the cost to develop anddeploy them needs to be studied carefully and evaluated in terms of their expected impacton the quality of aviation weather information.
5.5.1.3 Weather Radar Observations
The reflectivity data acquired by the NEXRAD and TDWR systems gives an indication ofthe location, intensity, and amount of precipitation being generated by a storm system.These data are displayed in the form of color-coded mosaics projected on a plan view ofthe radar’s area of coverage. This information allows meteorologists to track thedevelopment and motion of potentially hazardous weather. The NEXRAD is capable of
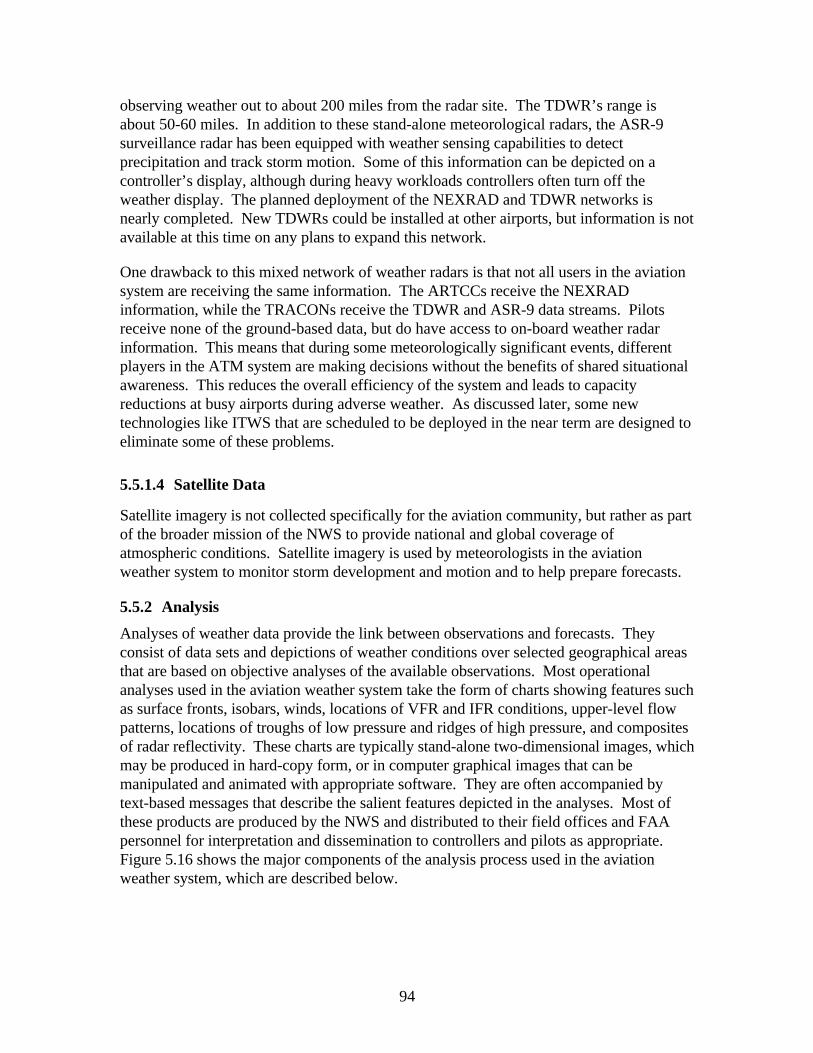
94
observing weather out to about 200 miles from the radar site. The TDWR’s range isabout 50-60 miles. In addition to these stand-alone meteorological radars, the ASR-9surveillance radar has been equipped with weather sensing capabilities to detectprecipitation and track storm motion. Some of this information can be depicted on acontroller’s display, although during heavy workloads controllers often turn off theweather display. The planned deployment of the NEXRAD and TDWR networks isnearly completed. New TDWRs could be installed at other airports, but information is notavailable at this time on any plans to expand this network.
One drawback to this mixed network of weather radars is that not all users in the aviationsystem are receiving the same information. The ARTCCs receive the NEXRADinformation, while the TRACONs receive the TDWR and ASR-9 data streams. Pilotsreceive none of the ground-based data, but do have access to on-board weather radarinformation. This means that during some meteorologically significant events, differentplayers in the ATM system are making decisions without the benefits of shared situationalawareness. This reduces the overall efficiency of the system and leads to capacityreductions at busy airports during adverse weather. As discussed later, some newtechnologies like ITWS that are scheduled to be deployed in the near term are designed toeliminate some of these problems.
5.5.1.4 Satellite Data
Satellite imagery is not collected specifically for the aviation community, but rather as partof the broader mission of the NWS to provide national and global coverage ofatmospheric conditions. Satellite imagery is used by meteorologists in the aviationweather system to monitor storm development and motion and to help prepare forecasts.
5.5.2 Analysis
Analyses of weather data provide the link between observations and forecasts. Theyconsist of data sets and depictions of weather conditions over selected geographical areasthat are based on objective analyses of the available observations. Most operationalanalyses used in the aviation weather system take the form of charts showing features suchas surface fronts, isobars, winds, locations of VFR and IFR conditions, upper-level flowpatterns, locations of troughs of low pressure and ridges of high pressure, and compositesof radar reflectivity. These charts are typically stand-alone two-dimensional images, whichmay be produced in hard-copy form, or in computer graphical images that can bemanipulated and animated with appropriate software. They are often accompanied bytext-based messages that describe the salient features depicted in the analyses. Most ofthese products are produced by the NWS and distributed to their field offices and FAApersonnel for interpretation and dissemination to controllers and pilots as appropriate.Figure 5.16 shows the major components of the analysis process used in the aviationweather system, which are described below.
95
AnalysisProducts
AWIPS/WFO-Advanced
RUC AGFS
WARP
Figure 5.16 Aviation Weather Analysis Function
The NWS has put a great deal of effort into developing a new generation of graphicalmeteorological workstations and associated sub-systems, referred to as the AdvancedWeather Information Processing System (AWIPS). AWIPS is behind schedule by a fewyears, mainly because of software problems. FSL is now working on a new version of thesoftware called ‘WFO-Advanced’, and the combined AWIPS/WFO-Advanced technologyis now expected to be deployed to NWS field offices over the next several years. Whenfinally implemented, AWIPS will allow meteorologists at NWS facilities to prepare multi-image, animated mosaics of current and forecasted weather conditions, and to prepareinteractive weather alerts and warnings that can be immediately distributed to other usersand to the public. Initial results from field tests of these systems have indicated that theywill significantly improve the quality and timeliness of weather reporting and forecasting.A full assessment of the performance of the AWIPS/WFO-Advanced systems cannot becompleted until more units are deployed and being used operationally.
The FAA is in the process of procuring its own version of a meteorological workstation,referred to as the Weather and Radar Processor (WARP). WARP is designed to replacethe Meteorologist Weather Processor in the ARTCC’s. It is currently scheduled to bedeployed in the CWSUs and in the CWFSU at the central flow facility by the end of 1997.WARP will allow a Center’s meteorologists to prepare mosaics of NEXRAD reflectivitydata and to overlay supporting weather information like lighting strike data, satelliteimagery, and gridded and graphical weather information. The system will allow CWSUstaff to prepare and distribute aviation weather products such as Center WeatherAdvisories and Hazardous Weather Area outlines. In its initial ‘Stage 0’ implementation,the WARP products will be available to CWSU and TMU personnel for briefing andplanning purposes. Future implementations of WARP (Stage 1, Stage 3), are designed toallow weather displays to be presented to controllers. As is the case for AWIPS, thistechnology ought to represent a significant step forward in the analysis and disseminationof aviation weather information, but more work is needed to understand systemperformance, human factors issues, and training requirements.
The role of the FAA weather operations staff in the centers and the TRACONs is tointerpret current weather information and forecasted conditions so that they can provide
96
guidance to traffic managers and controllers on potential weather impacts on aviationoperations. Most of the actual data management, analysis and forecasting of weatherconditions is the responsibility of the NWS’s Aviation Weather Center. To assist AWCmeteorologists, FSL and NWS have been developing the Aviation Gridded ForecastSystem (AGFS). The AGFS will consist of 3D gridded data sets of observed, analyzed,and forecasted weather conditions that affect aviation. The AGFS includes software toolsthat allow AWC meteorologists to prepare and distribute analyses of AIVs. Moreinformation is needed on how the AGFS will be integrated into the analysis andforecasting functions performed in the CWSUs and the TRACONs, and on the quality ofthe gridded fields. However, a tool such as the AGFS will be needed to help manage andprovide quality control to the increasingly complex meteorological information beingproduced by observing networks and analysis and forecasting tools.
5.5.3 Forecasting
The need for accurate forecasts of expected weather conditions in the terminal and enroute environments is becoming increasing acute as demand for system capacity increases.Most aviation forecasting services are provided by the NWS through the AviationWeather Center, although some of the larger airlines have their own teams ofmeteorologists who prepare forecasts for their areas of operation, and some private sectorfirms also provide forecasting services. Figure 5.17 shows the major components of theaviation weather forecasting system, which are described in this section.
ForecastProducts
AviationWeather Center
ITWS AVOSS
NCEPNWP Models
Figure 5.17 Aviation Weather Forecasting Function
NCEP operates a suite of numerical weather prediction models that produce forecasts ofgridded meteorological parameters that are analyzed to estimate the future locations ofstorm systems, areas of precipitation, surface and aloft winds, and other conditionsaffecting aviation operations. These models solve the so-called ‘primitive’ equationsdescribing the physics of the atmosphere, with varying degrees of sophistication in the useof numerical integration techniques, turbulence closure schemes, hydrostatic versus non-hydrostatic approximations, boundary conditions, horizontal and vertical resolution, andso forth. Short-term forecasts out to 48 hours are performed using the Eta model, while
97
longer-term domestic and international forecasts are made using codes such as the AVNand MRF prognostic models. Forecasts are usually issued in three to six hour intervals forperiods as short as three hours to as long as several days. AWC meteorologists use theseforecast products and other available information to prepare Terminal AerodromeForecasts for U.S. airports, and to prepare advisories and alerts for weather conditionsthat may adversely affect aviation operations (e.g., SIGMETS and convective SIGMETs).
In their present forms, models like the Eta and its counterparts are best suited forpredicting the movement of synoptic scale meteorological features that affect the weatherover regions larger than individual terminal areas and on time scales longer than arevaluable for many aircraft operations. Thus, while these models are useful for generallarge-scale weather prediction, they have not been optimized to meet the specific needs ofthe aviation weather system. The FAA, NASA, MIT-LL, NOAA, and NCAR have beenworking on several new technologies designed to provide aviation-specific forecasts.
FSL has developed an analysis and forecasting tool called the Mesoscale Analysis andPrediction System, which has been recently implemented at NCEP as the Rapid UpdateCycle (RUC). The RUC combines objective analyses and short-term (less than 12 hr.)prediction tools to prepare gridded data sets of surface and upper-air meteorologicalconditions that affect aviation operations. The RUC is run at NCEP every three hours ona 60-km grid covering the CONUS, and produces an analysis of current conditions and 3-hourly forecasts out to 12 hours. An experimental 40 km version is being tested, andplans call for going to finer horizontal resolutions in the future.
RUC products are currently being tested in new CNS/ATM and aviation weathertechnologies. For example, the current implementation of CTAS uses the 3D RUC windfields to calculate aircraft descent trajectories. An important issue for the successfulapplication of RUC data in CNS technologies like CTAS, Conflict Probe, and other flightmanagement systems is the need for good information on the accuracy and repeatability ofRUC variables (e.g., rms errors in upper-air wind analyses and forecasts). For example,some preliminary evaluations of RUC upper-air wind forecasts indicate that in the 0-1 hr.time frame rms errors in vector winds may be on the order of 2-3 m/s, increasing to 5-7m/s at the end of the RUC forecast period. Likewise, the sensitivity of CNS/ATMtechnologies to uncertainties in RUC variables needs to be examined. More information isalso needed on how RUC data sets will be incorporated into the AGFS.
The ITWS is an analysis and prediction tool that is currently being developed by MIT-LLfor use in the terminal area. The ITWS ingests the RUC gridded wind fields, TDWR andNEXRAD wind data, ASR-9 weather reflectivity data, MDCRS observations,ASOS/AWOS and LLWAS data, and other available information. It analyses these datato determine storm cell locations and movement, areas of precipitation, locations andintensities of gust fronts and microbursts, low-level winds affecting runway operations,locations of tornadoes, and other aviation impact variables. It predicts storm cellmovement and the locations of gust fronts at 10 minute and 20 minute intervals from theanalysis time. ITWS also produces three-dimensional gridded fields of winds on scalesvarying from 2 km near the terminal area to 60 km at the outer extent of the ITWS

98
domain, which generally extends to the outer boundaries of the TRACON and beyond intoCenter airspace.
ITWS test beds are currently being evaluated at several large airports, including Dallas-Fort Worth and Orlando. The FAA issued a contract in early 1997 to procure fourcommercial systems, with an option to expand ITWS installations to 34 terminal areas thatcover 45 of the busiest airports in the U.S. by early in the next century. Initial reports ofthe benefits of ITWS to users suggests that the technology can improve efficiency andincrease capacity during adverse weather (Evans and Ducot, 1997). Plans are alsounderway to test the ITWS gridded wind fields in the CTAS system. Analyses of theaccuracy and uncertainties in ITWS products and their contribution to uncertainties inCTAS trajectory calculations will be needed in the near term.
Another specialized analysis and prediction system under development is the AVOSSwake vortex separation tool. The AVOSS will ingest surface and upper-airmeteorological data from a network of surface and upper-air sensors deployed around theairport, and use these data to prepare predictions out to about 30 minutes of keymeteorological parameters that affect vortex decay and transport (e.g., vertical wind andtemperature profiles). These parameters will then be used to predict separationrequirements for aircraft pairs based on expected vortex intensity and location. NASA,MIT-LL, the Volpe Transportation Center, and other organizations are participating in theAVOSS program. Plans call for the first prototype operational system to be fielded in the2000-2001 time frame, with deployments of operational systems completed by later in thedecade. The AVOSS will be a complex technology that will require careful evaluation andtesting. More information is needed on the interaction of an operational AVOSS systemwith the ITWS technology and with other CNS/ATM technologies like CTAS and cockpitdisplays of traffic and weather information (CDTW) (see Section 5.5.4).
The FAA is funding research and development efforts in several areas related to weatherimpacts on aviation and the development of new aviation weather analysis and predictiontechnologies. An Aviation Weather Research (AWR) program has been initiated withinFAA’s Office of Air Traffic Systems development, which is organized into eight ProductDevelopment Teams (PDT). The research areas currently being explored by the AWRinclude:
• Inflight Icing• The AGFS• Turbulence• Convective Weather• Weather Support For Ground De-Icing Decision Making• Model Development And Enhancement• NEXRAD Improvements• Ceiling And Visibility
While some of these PDTs focus mainly on developing improved measurement methods,most are directed at developing tools to improve the short-term prediction of AIVs. For
99
example, the ceiling and visibility PDT is focused in part on developing and demonstratinga forecast tool that will predict the time of burn-off of the marine stratus layer at SanFrancisco International Airport. Such a tool would allow more efficient use of theairport’s closely spaced parallel runways and increase airport capacity by allowing parallelrunway operations to begin sooner in the day than they currently do. However, the statusof funding for some of these efforts is uncertain. For example, work on the ceiling andvisibility PDT may be discontinued in 1998.
In the far term, improvements in aviation weather forecasts in the terminal area are likelyto come from improved numerical weather prediction methods, with the models beingdriven by data collected from networks of surface and upper-air sensors deployed in theregion surrounding the airports. RESCOMS (Regional-Scale Combined Observation andModeling Systems) technologies should be investigated to determine the sensitivity ofmodel results to different densities of measurements and to uncertainties in observations.Model configurations and data requirements would be established based on themeteorological conditions that prevail in a terminal area. For example, RESCOMSforecasting in the coastal and complex terrain setting of southern California might be bestperformed by a hydrostatic NWP and a relatively dense network of surface and upper-airwind and temperature sensors. Conversely, at Dallas-Fort Worth a RESCOMS systemwould include ITWS technologies combined with a non-hydrostatic model able to simulateconvective storms. For en-route Free Flight operations, the RESCOMS concept could beextended to Center airspace by the addition of more MDCRS data combined with othersupplemental upper-air observations from networks of wind profilers or rawinsondes.
In the near term, improving the absolute accuracy of forecasts of complex weathersystems like convective storms is an ambitious task. For example, to be effective forstrategic planning, the location of convective cells need to predicted to within 1-2 milesand within tens of minutes of their actual position several hours in advance. Current andlikely near-term technologies will probably not meet this requirement. However,improvements in weather prediction in the near term may be able to provide sufficientlyaccurate estimates of the probability of such weather events to be useful in flight planningoperations. For example, American Airlines is supporting the development of aforecasting system to allow it to make proactive operational decisions based on thelikelihood of weather impacts at its hub airports (Qualley, 1997). The usefulness ofprobabilistic estimates of weather impacts on components of the aviation weather systemneeds to be explored in more detail.
5.5.4 Dissemination
Aviation weather information is currently disseminated in the form of alphanumeric textmessages, graphical depictions of weather patterns, and audio recordings of current andforecasted conditions. Communications systems for sending weather information to usersinclude dial-up and dedicated telephone lines, satellite broadcast, internet transmission,and radio broadcast of data and voice messages. For the aviation community, weatherinformation is available from the AWC, the Direct User Access Services Service system,manned and Automated Flight Service Stations, the CWSUs, and airline dispatch offices.
100
An important issue for users of aviation weather products is that the information they needmust be presented in a way that is timely, efficient, easy to comprehend, and that allowsdifferent users in different locations (controllers, pilots, airline dispatch, airport operators)to develop a shared situational awareness of the weather conditions affecting flightoperations. In the current ATM system, these objectives have often been difficult to meet.Traditional text-based messages are often difficult to decode and interpret, and do notprovide an integrated view of important weather conditions. TRACON and ARTCCcontrollers are presented with different types and amounts of weather information, andpilots have limited access to weather information other than that provided by theironboard sensors (radar, winds, temperature) and visual observations. This has lead toinefficiencies and capacity reductions at busy airports during adverse weather, which couldlikely have been mitigated if the dissemination process was more effective.
To address these issues, increasingly the trend for distributing aviation weatherinformation is through the use of interactive graphical images produced by computerworkstations. The AWIPS/WFO-Advanced and WARP technologies are intended to meetthis need. Likewise the ITWS system is designed to provide interactive computer-generated graphical images showing weather conditions and expected storm movement inthe terminal area. Figure 5.18 illustrates the various near term components of thedissemination system for aviation weather information. If successful, these technologiescan provide CWSU personnel and controllers with similar types of information so thatthey can make effective strategic and tactical decision and improve efficiency in theterminal area and en route environment. Several issues need to be addressed tounderstand if these technologies will be successful, including issues related to humanfactors engineering, and requirements for training programs.
An important area beginning to receive attention is the dissemination of weatherinformation to the cockpit. In the far term, there may be good reasons to get ATC out ofthe loop in disseminating weather information to pilots (NRC, 1995), and several types ofcockpit weather information systems are being investigated. For example, MIT-LL hasbeen testing the Terminal Weather Information for Pilots (TWIP) system, which providesa simple alphanumeric and graphical depiction of ITWS data products to pilots via theACARS system (Campbell et al., 1995). Anecdotal evidence indicates that pilots receivingTWIP messages during approaches to busy airports being impacted by convective weatherfind them very useful.
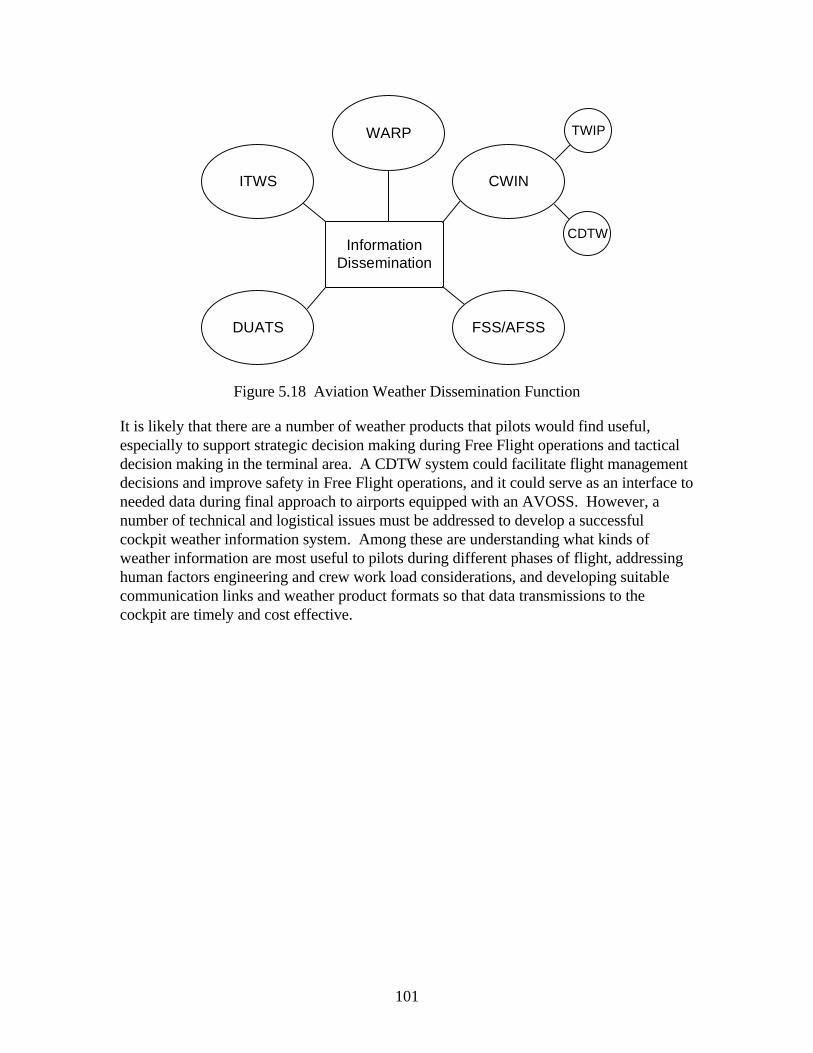
101
InformationDissemination
CDTW
ITWS
WARP
CWIN
DUATS FSS/AFSS
TWIP
Figure 5.18 Aviation Weather Dissemination Function
It is likely that there are a number of weather products that pilots would find useful,especially to support strategic decision making during Free Flight operations and tacticaldecision making in the terminal area. A CDTW system could facilitate flight managementdecisions and improve safety in Free Flight operations, and it could serve as an interface toneeded data during final approach to airports equipped with an AVOSS. However, anumber of technical and logistical issues must be addressed to develop a successfulcockpit weather information system. Among these are understanding what kinds ofweather information are most useful to pilots during different phases of flight, addressinghuman factors engineering and crew work load considerations, and developing suitablecommunication links and weather product formats so that data transmissions to thecockpit are timely and cost effective.
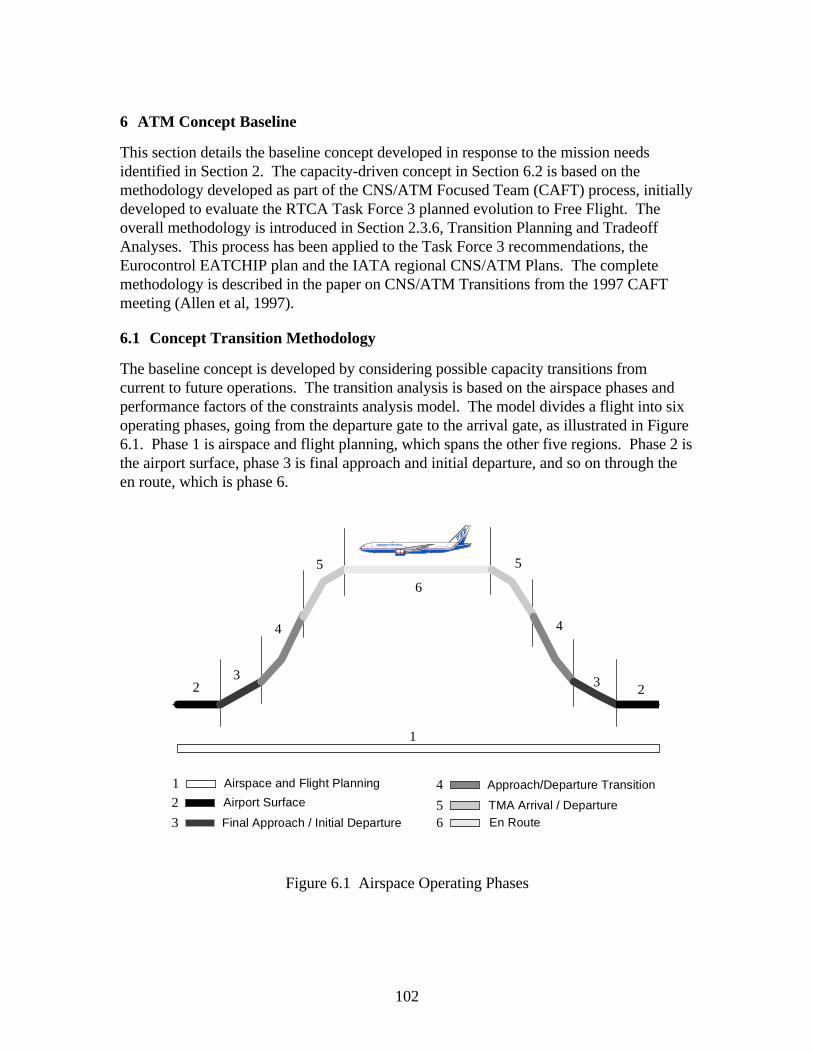
102
6 ATM Concept Baseline
This section details the baseline concept developed in response to the mission needsidentified in Section 2. The capacity-driven concept in Section 6.2 is based on themethodology developed as part of the CNS/ATM Focused Team (CAFT) process, initiallydeveloped to evaluate the RTCA Task Force 3 planned evolution to Free Flight. Theoverall methodology is introduced in Section 2.3.6, Transition Planning and TradeoffAnalyses. This process has been applied to the Task Force 3 recommendations, theEurocontrol EATCHIP plan and the IATA regional CNS/ATM Plans. The completemethodology is described in the paper on CNS/ATM Transitions from the 1997 CAFTmeeting (Allen et al, 1997).
6.1 Concept Transition Methodology
The baseline concept is developed by considering possible capacity transitions fromcurrent to future operations. The transition analysis is based on the airspace phases andperformance factors of the constraints analysis model. The model divides a flight into sixoperating phases, going from the departure gate to the arrival gate, as illustrated in Figure6.1. Phase 1 is airspace and flight planning, which spans the other five regions. Phase 2 isthe airport surface, phase 3 is final approach and initial departure, and so on through theen route, which is phase 6.
Final Approach / Initial Departure3 En Route6
6
5
4
32 2
3
5
4
Airport Surface2 TMA Arrival / Departure5
Approach/Departure Transition4Airspace and Flight Planning1
1
Figure 6.1 Airspace Operating Phases
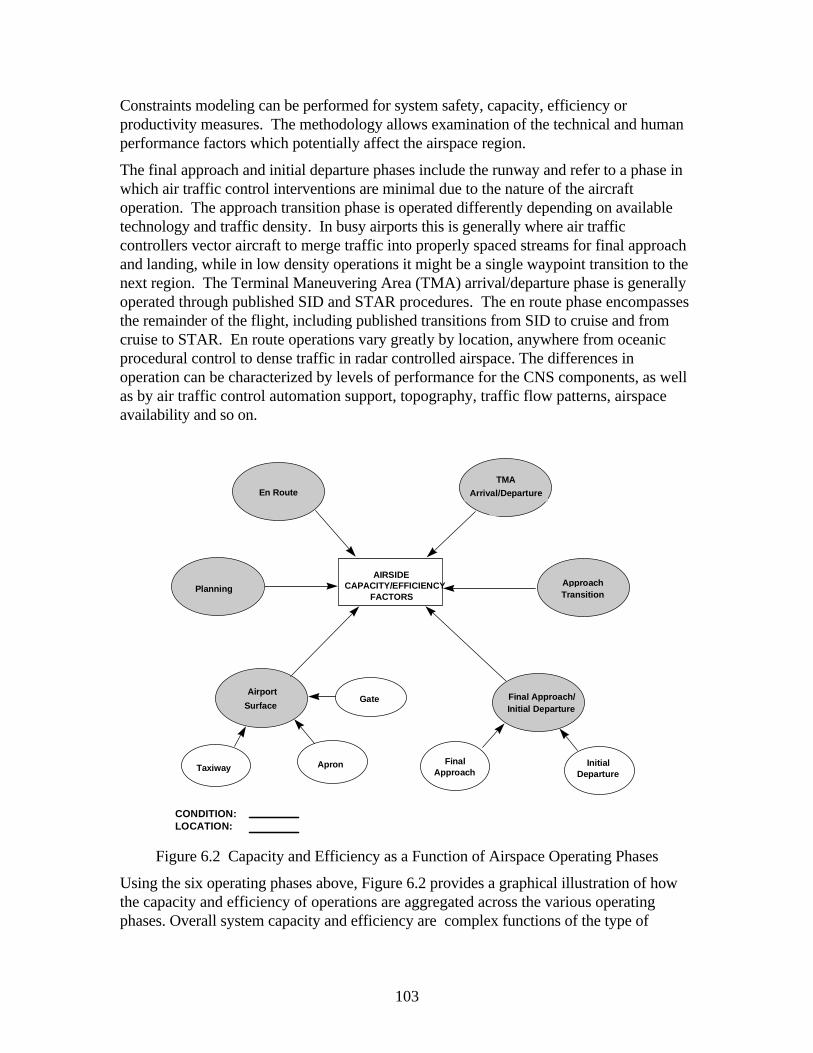
103
Constraints modeling can be performed for system safety, capacity, efficiency orproductivity measures. The methodology allows examination of the technical and humanperformance factors which potentially affect the airspace region.
The final approach and initial departure phases include the runway and refer to a phase inwhich air traffic control interventions are minimal due to the nature of the aircraftoperation. The approach transition phase is operated differently depending on availabletechnology and traffic density. In busy airports this is generally where air trafficcontrollers vector aircraft to merge traffic into properly spaced streams for final approachand landing, while in low density operations it might be a single waypoint transition to thenext region. The Terminal Maneuvering Area (TMA) arrival/departure phase is generallyoperated through published SID and STAR procedures. The en route phase encompassesthe remainder of the flight, including published transitions from SID to cruise and fromcruise to STAR. En route operations vary greatly by location, anywhere from oceanicprocedural control to dense traffic in radar controlled airspace. The differences inoperation can be characterized by levels of performance for the CNS components, as wellas by air traffic control automation support, topography, traffic flow patterns, airspaceavailability and so on.
AIRSIDECAPACITY/EFFICIENCY
FACTORS
ApproachTransition
TMA
Arrival/Departure
Airport
SurfaceFinal Approach/Initial Departure
FinalApproach
InitialDeparture
Taxiway
Gate
Apron
En Route
CONDITION:LOCATION:
Planning
Figure 6.2 Capacity and Efficiency as a Function of Airspace Operating Phases
Using the six operating phases above, Figure 6.2 provides a graphical illustration of howthe capacity and efficiency of operations are aggregated across the various operatingphases. Overall system capacity and efficiency are complex functions of the type of
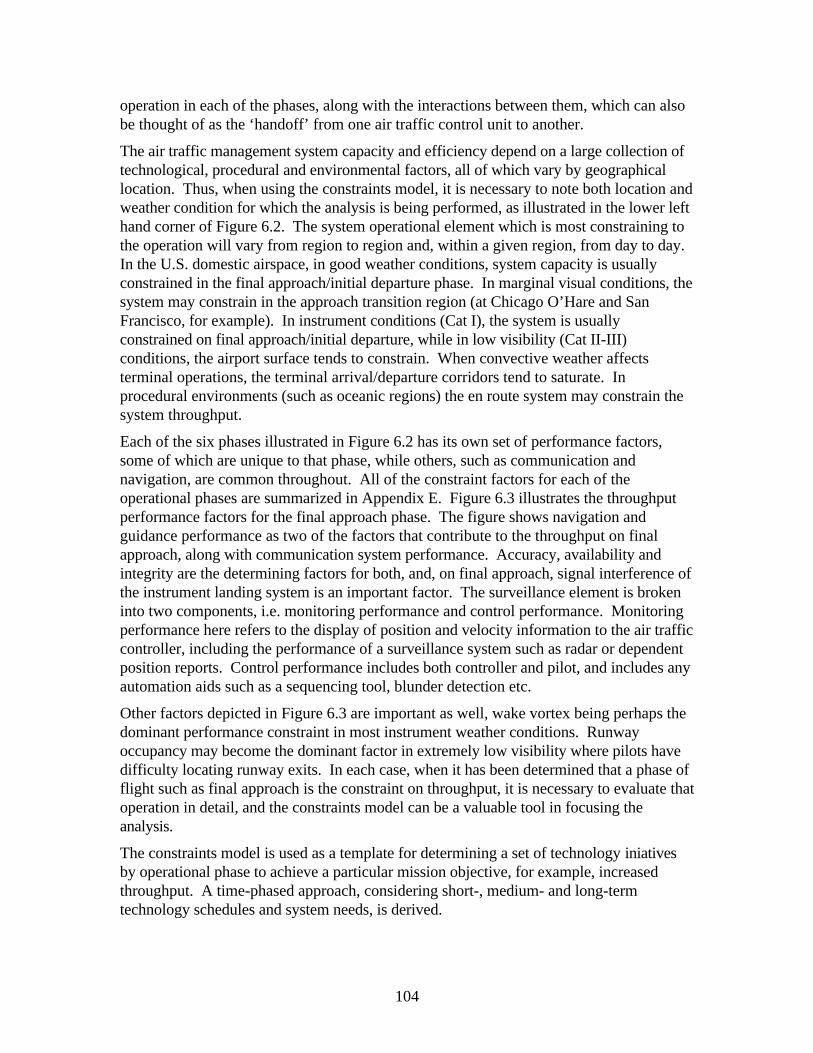
104
operation in each of the phases, along with the interactions between them, which can alsobe thought of as the ‘handoff’ from one air traffic control unit to another.
The air traffic management system capacity and efficiency depend on a large collection oftechnological, procedural and environmental factors, all of which vary by geographicallocation. Thus, when using the constraints model, it is necessary to note both location andweather condition for which the analysis is being performed, as illustrated in the lower lefthand corner of Figure 6.2. The system operational element which is most constraining tothe operation will vary from region to region and, within a given region, from day to day.In the U.S. domestic airspace, in good weather conditions, system capacity is usuallyconstrained in the final approach/initial departure phase. In marginal visual conditions, thesystem may constrain in the approach transition region (at Chicago O’Hare and SanFrancisco, for example). In instrument conditions (Cat I), the system is usuallyconstrained on final approach/initial departure, while in low visibility (Cat II-III)conditions, the airport surface tends to constrain. When convective weather affectsterminal operations, the terminal arrival/departure corridors tend to saturate. Inprocedural environments (such as oceanic regions) the en route system may constrain thesystem throughput.
Each of the six phases illustrated in Figure 6.2 has its own set of performance factors,some of which are unique to that phase, while others, such as communication andnavigation, are common throughout. All of the constraint factors for each of theoperational phases are summarized in Appendix E. Figure 6.3 illustrates the throughputperformance factors for the final approach phase. The figure shows navigation andguidance performance as two of the factors that contribute to the throughput on finalapproach, along with communication system performance. Accuracy, availability andintegrity are the determining factors for both, and, on final approach, signal interference ofthe instrument landing system is an important factor. The surveillance element is brokeninto two components, i.e. monitoring performance and control performance. Monitoringperformance here refers to the display of position and velocity information to the air trafficcontroller, including the performance of a surveillance system such as radar or dependentposition reports. Control performance includes both controller and pilot, and includes anyautomation aids such as a sequencing tool, blunder detection etc.
Other factors depicted in Figure 6.3 are important as well, wake vortex being perhaps thedominant performance constraint in most instrument weather conditions. Runwayoccupancy may become the dominant factor in extremely low visibility where pilots havedifficulty locating runway exits. In each case, when it has been determined that a phase offlight such as final approach is the constraint on throughput, it is necessary to evaluate thatoperation in detail, and the constraints model can be a valuable tool in focusing theanalysis.
The constraints model is used as a template for determining a set of technology iniativesby operational phase to achieve a particular mission objective, for example, increasedthroughput. A time-phased approach, considering short-, medium- and long-termtechnology schedules and system needs, is derived.
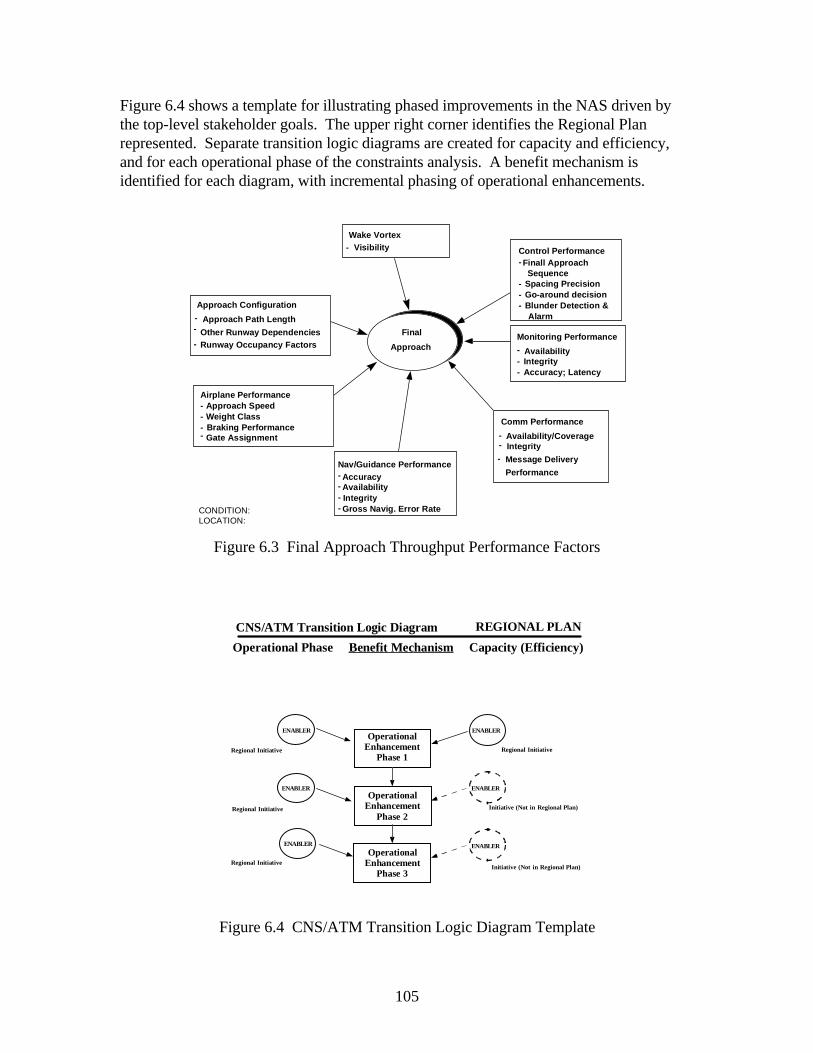
105
Figure 6.4 shows a template for illustrating phased improvements in the NAS driven bythe top-level stakeholder goals. The upper right corner identifies the Regional Planrepresented. Separate transition logic diagrams are created for capacity and efficiency,and for each operational phase of the constraints analysis. A benefit mechanism isidentified for each diagram, with incremental phasing of operational enhancements.
Wake Vortex- Visibility
Approach Configuration
--
-Other Runway DependenciesRunway Occupancy Factors
Nav/Guidance Performance-
Gross Navig. Error Rate
-Accuracy
-Availability
-Integrity
Comm Performance
- Availability/Coverage- Integrity- Message Delivery
Performance
Monitoring Performance
- Availability- Integrity- Accuracy; Latency
Control Performance-
Spacing Precision
Finall Approach Sequence
- Go-around decision- Blunder Detection & AlarmApproach Path Length
Final
Approach
CONDITION: LOCATION:
Airplane Performance-
Weight Class-Approach Speed
- Braking Performance
-
Gate Assignment-
Figure 6.3 Final Approach Throughput Performance Factors
CNS/ATM Transition Logic Diagram
Operational Phase Benefit Mechanism Capacity (Efficiency)
OperationalEnhancement
Phase 1
OperationalEnhancement
Phase 2
OperationalEnhancement
Phase 3
ENABLER
ENABLER
ENABLER
ENABLER
Regional Initiative
Regional Initiative
Regional Initiative
Regional Initiative
REGIONAL PLAN
ENABLER
ENABLER
Initiative (Not in Regional Plan)
Initiative (Not in Regional Plan)
Figure 6.4 CNS/ATM Transition Logic Diagram Template
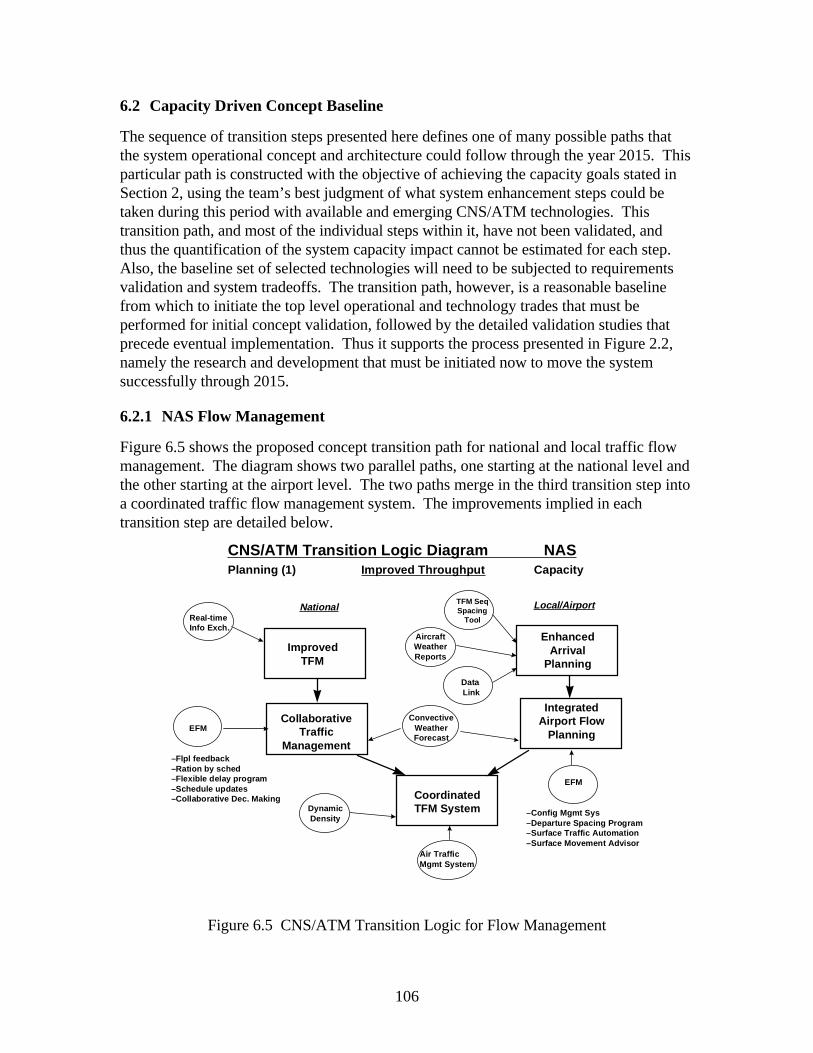
106
6.2 Capacity Driven Concept Baseline
The sequence of transition steps presented here defines one of many possible paths thatthe system operational concept and architecture could follow through the year 2015. Thisparticular path is constructed with the objective of achieving the capacity goals stated inSection 2, using the team’s best judgment of what system enhancement steps could betaken during this period with available and emerging CNS/ATM technologies. Thistransition path, and most of the individual steps within it, have not been validated, andthus the quantification of the system capacity impact cannot be estimated for each step.Also, the baseline set of selected technologies will need to be subjected to requirementsvalidation and system tradeoffs. The transition path, however, is a reasonable baselinefrom which to initiate the top level operational and technology trades that must beperformed for initial concept validation, followed by the detailed validation studies thatprecede eventual implementation. Thus it supports the process presented in Figure 2.2,namely the research and development that must be initiated now to move the systemsuccessfully through 2015.
6.2.1 NAS Flow Management
Figure 6.5 shows the proposed concept transition path for national and local traffic flowmanagement. The diagram shows two parallel paths, one starting at the national level andthe other starting at the airport level. The two paths merge in the third transition step intoa coordinated traffic flow management system. The improvements implied in eachtransition step are detailed below.
National
DynamicDensity
EFM
Real-time Info Exch.
–Flpl feedback–Ration by sched–Flexible delay program–Schedule updates–Collaborative Dec. Making
Air TrafficMgmt System
CNS/ATM Transition Logic Diagram NASPlanning (1) Improved Throughput Capacity
ImprovedTFM
CollaborativeTraffic
Management
EnhancedArrival
Planning
IntegratedAirport Flow
Planning
CoordinatedTFM System
Local/Airport
ConvectiveWeatherForecast
EFM
AircraftWeatherReports
TFM SeqSpacing
Tool
–Config Mgmt Sys–Departure Spacing Program–Surface Traffic Automation–Surface Movement Advisor
Data Link
Figure 6.5 CNS/ATM Transition Logic for Flow Management
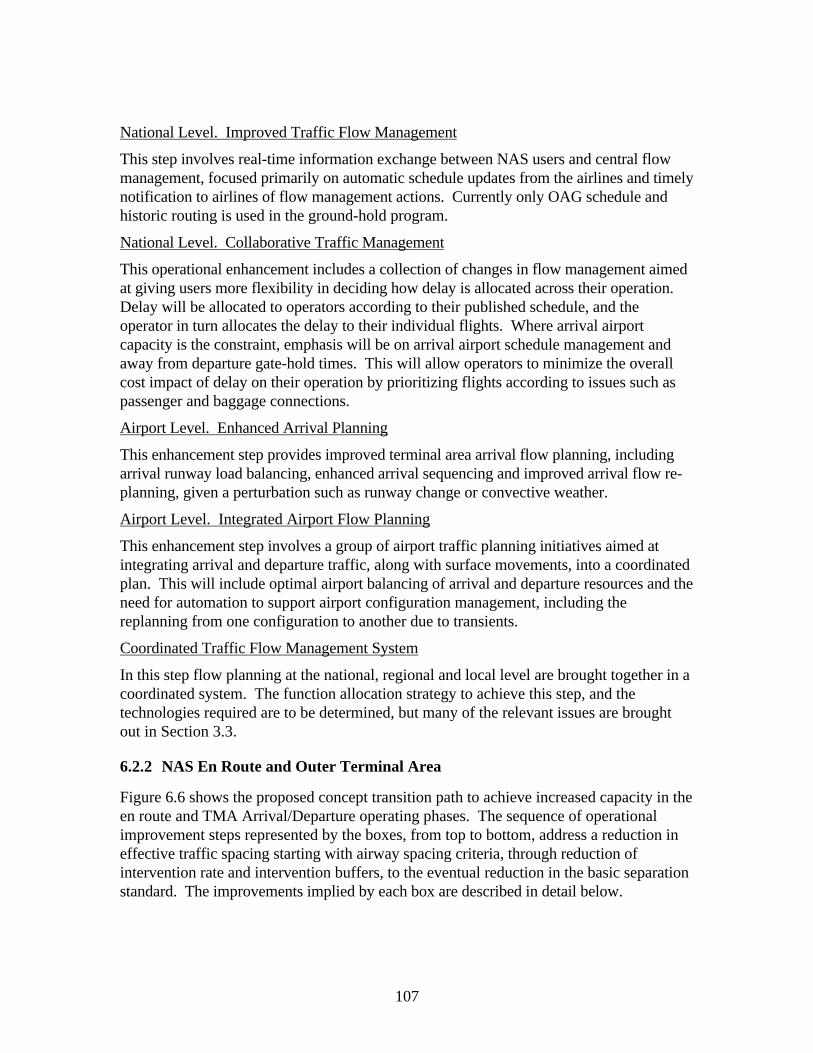
107
National Level. Improved Traffic Flow Management
This step involves real-time information exchange between NAS users and central flowmanagement, focused primarily on automatic schedule updates from the airlines and timelynotification to airlines of flow management actions. Currently only OAG schedule andhistoric routing is used in the ground-hold program.
National Level. Collaborative Traffic Management
This operational enhancement includes a collection of changes in flow management aimedat giving users more flexibility in deciding how delay is allocated across their operation.Delay will be allocated to operators according to their published schedule, and theoperator in turn allocates the delay to their individual flights. Where arrival airportcapacity is the constraint, emphasis will be on arrival airport schedule management andaway from departure gate-hold times. This will allow operators to minimize the overallcost impact of delay on their operation by prioritizing flights according to issues such aspassenger and baggage connections.
Airport Level. Enhanced Arrival Planning
This enhancement step provides improved terminal area arrival flow planning, includingarrival runway load balancing, enhanced arrival sequencing and improved arrival flow re-planning, given a perturbation such as runway change or convective weather.
Airport Level. Integrated Airport Flow Planning
This enhancement step involves a group of airport traffic planning initiatives aimed atintegrating arrival and departure traffic, along with surface movements, into a coordinatedplan. This will include optimal airport balancing of arrival and departure resources and theneed for automation to support airport configuration management, including thereplanning from one configuration to another due to transients.
Coordinated Traffic Flow Management System
In this step flow planning at the national, regional and local level are brought together in acoordinated system. The function allocation strategy to achieve this step, and thetechnologies required are to be determined, but many of the relevant issues are broughtout in Section 3.3.
6.2.2 NAS En Route and Outer Terminal Area
Figure 6.6 shows the proposed concept transition path to achieve increased capacity in theen route and TMA Arrival/Departure operating phases. The sequence of operationalimprovement steps represented by the boxes, from top to bottom, address a reduction ineffective traffic spacing starting with airway spacing criteria, through reduction ofintervention rate and intervention buffers, to the eventual reduction in the basic separationstandard. The improvements implied by each box are described in detail below.
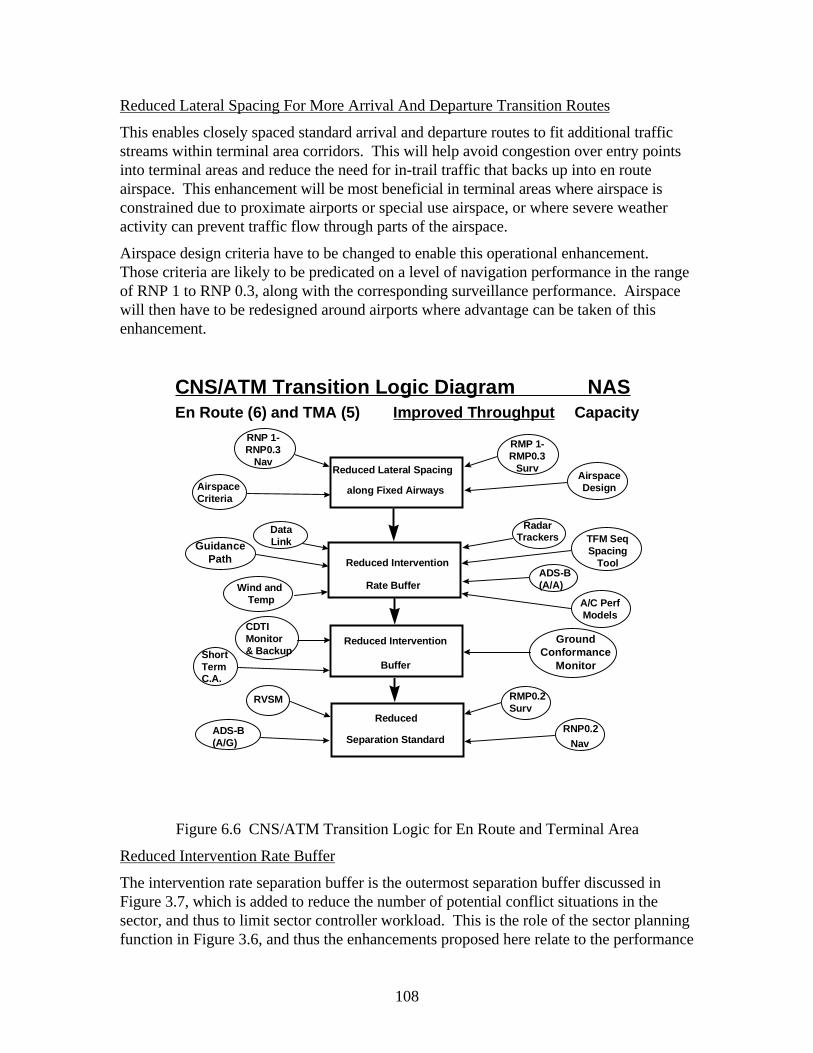
108
Reduced Lateral Spacing For More Arrival And Departure Transition Routes
This enables closely spaced standard arrival and departure routes to fit additional trafficstreams within terminal area corridors. This will help avoid congestion over entry pointsinto terminal areas and reduce the need for in-trail traffic that backs up into en routeairspace. This enhancement will be most beneficial in terminal areas where airspace isconstrained due to proximate airports or special use airspace, or where severe weatheractivity can prevent traffic flow through parts of the airspace.
Airspace design criteria have to be changed to enable this operational enhancement.Those criteria are likely to be predicated on a level of navigation performance in the rangeof RNP 1 to RNP 0.3, along with the corresponding surveillance performance. Airspacewill then have to be redesigned around airports where advantage can be taken of thisenhancement.
CNS/ATM Transition Logic Diagram NASEn Route (6) and TMA (5) Improved Throughput Capacity
Reduced Lateral Spacing
along Fixed Airways
Reduced Intervention
Rate Buffer
Reduced Intervention
Buffer
Reduced
Separation Standard
RNP 1-RNP0.3
NavAirspaceDesign
RMP 1-RMP0.3
Surv
CDTIMonitor& Backup
RVSM
RadarTrackers
Wind and Temp A/C Perf
Models
RNP0.2Nav
ADS-B(A/G)
ShortTermC.A.
TFM SeqSpacing
ToolADS-B(A/A)
GroundConformance
Monitor
AirspaceCriteria
GuidancePath
DataLink
RMP0.2Surv
Figure 6.6 CNS/ATM Transition Logic for En Route and Terminal Area
Reduced Intervention Rate Buffer
The intervention rate separation buffer is the outermost separation buffer discussed inFigure 3.7, which is added to reduce the number of potential conflict situations in thesector, and thus to limit sector controller workload. This is the role of the sector planningfunction in Figure 3.6, and thus the enhancements proposed here relate to the performance
109
of flight plan management and medium term conflict prediction functions. Improvementsin both the horizontal and vertical dimensions are included in this step, and theimplementation order is likely to be horizontal first because the technology is more maturefor horizontal than for vertical prediction accuracy, although the benefits of improvedvertical accuracy may be greater.
An improvement in medium term trajectory prediction will be needed to reduce theuncertainty that the controller has today when predicting conflicts. This improvement willbe enabled by tracker enhancements that provide higher accuracy and lower latency, betterwind and temperature information, and a medium term conflict probe. The terminal areawill benefit from automation for more accurate sequencing and spacing of climbing anddescending traffic, which will require accurate aircraft performance models. Data link willprobably be required to exchange weather information, aircraft performance parameters,and trajectory definition between the air and ground systems.
In addition to the above factors, a higher probability that the aircraft will follow itsintended path may be required, and this may involve implementation of 4D terminal areanavigation capability, and a common and accurate time source. Depending on the level ofcriticality of the function, there may be a requirement for cockpit traffic situationawareness through position broadcast, to provide redundancy of function.
Reduced Intervention Buffer
The intervention buffer is the spacing added above the minimum separation standard toaccount for the time required for the sector controller to detect a conflict, decide on aresolution, communicate it to the pilot, and for the pilot to act. This is the performance ofthe reaction loop around the sector controller and aircraft illustrated in Figure 3.6.
To reduce the intervention buffer it is postulated here that data link would improve thedelivery time and integrity of communications from controller to pilot. A ground-basedconformance monitor is assumed that would alert the controller to aircraft deviations fromintended trajectory, and a short term conflict alert function is also assumed. Criticalitylevel is expected to be high, which will likely require an independent monitor function inthe aircraft through CDTI.
Reduced Separation Standards
This refers to both vertical and horizontal separation. Reduced Vertical SeparationMimima (RVSM) in domestic airspace would likely be predicated on vertical pathfollowing performance similar to what is required currently in the North Atlantic.Horizontal separation is likely to require improvements in the surveillance sensors both foren route and terminal areas, and better navigation performance. The detailed requirementswill have to be worked out through research, starting with the development of a riskevaluation methodology that can be used to determine the influence of technology andhuman factors on collision risk in radar controlled airspace.
6.2.3 NAS Approach/Departure Transition
Figure 6.7 shows the proposed concept transition path to achieve increased capacity in theArrival/Departure transition operating phases. The sequence of operational improvement
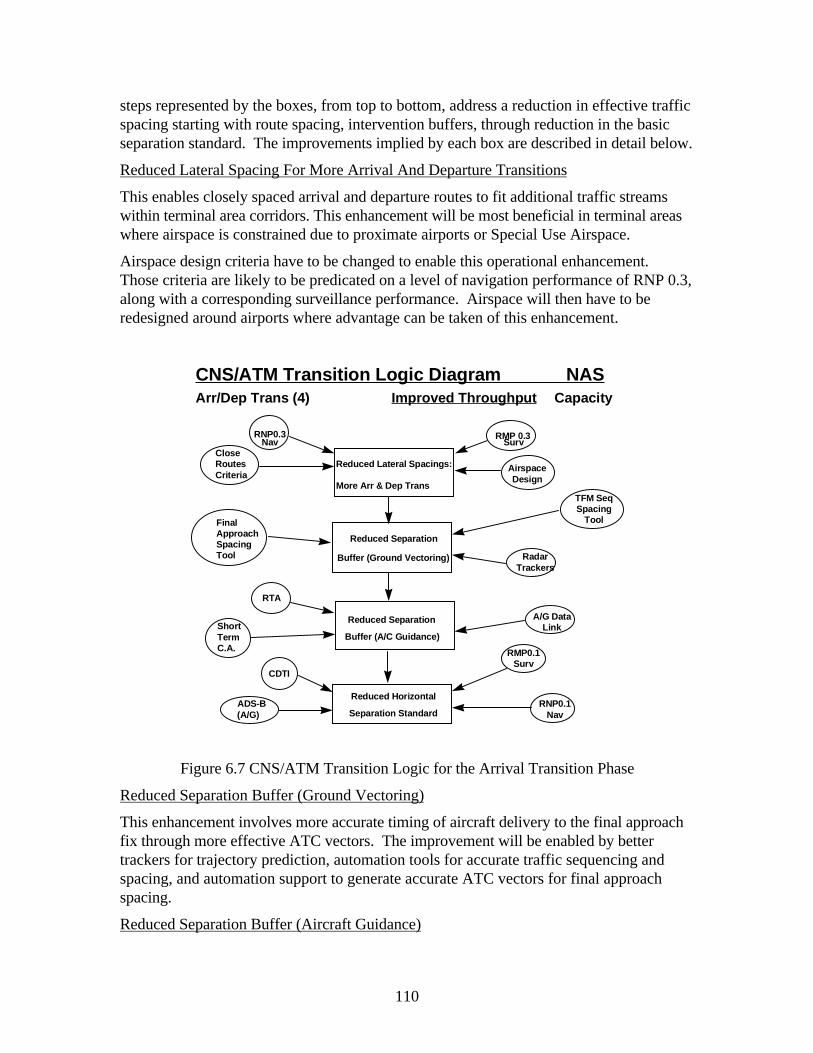
110
steps represented by the boxes, from top to bottom, address a reduction in effective trafficspacing starting with route spacing, intervention buffers, through reduction in the basicseparation standard. The improvements implied by each box are described in detail below.
Reduced Lateral Spacing For More Arrival And Departure Transitions
This enables closely spaced arrival and departure routes to fit additional traffic streamswithin terminal area corridors. This enhancement will be most beneficial in terminal areaswhere airspace is constrained due to proximate airports or Special Use Airspace.
Airspace design criteria have to be changed to enable this operational enhancement.Those criteria are likely to be predicated on a level of navigation performance of RNP 0.3,along with a corresponding surveillance performance. Airspace will then have to beredesigned around airports where advantage can be taken of this enhancement.
CNS/ATM Transition Logic Diagram NASArr/Dep Trans (4) Improved Throughput Capacity
Reduced Lateral Spacings:
More Arr & Dep Trans
Reduced Separation
Buffer (Ground Vectoring)
Buffer (A/C Guidance)
Reduced Horizontal
Separation Standard
RNP0.3Nav
AirspaceDesign
RMP 0.3Surv
CDTI
RadarTrackers
RNP0.1Nav
ADS-B(A/G)
FinalApproachSpacingTool
TFM SeqSpacing
Tool
CloseRoutesCriteria
A/G DataLink
Reduced Separation
RTA
ShortTermC.A. RMP0.1
Surv
Figure 6.7 CNS/ATM Transition Logic for the Arrival Transition Phase
Reduced Separation Buffer (Ground Vectoring)
This enhancement involves more accurate timing of aircraft delivery to the final approachfix through more effective ATC vectors. The improvement will be enabled by bettertrackers for trajectory prediction, automation tools for accurate traffic sequencing andspacing, and automation support to generate accurate ATC vectors for final approachspacing.
Reduced Separation Buffer (Aircraft Guidance)
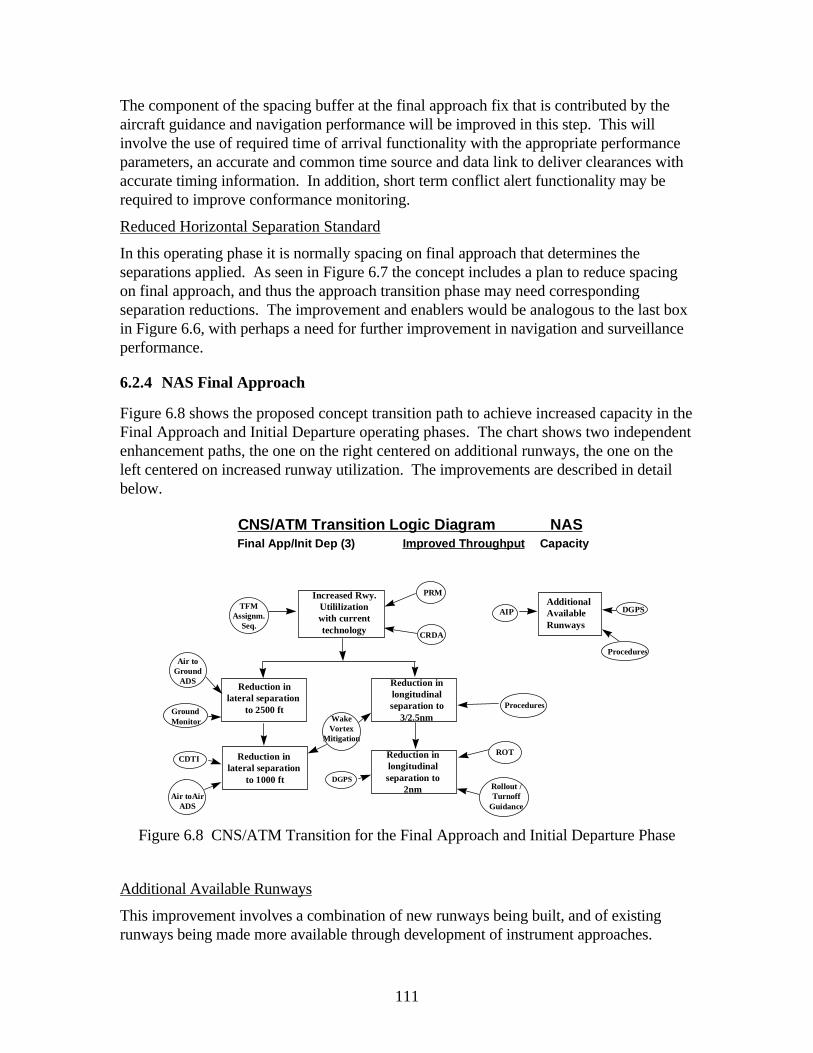
111
The component of the spacing buffer at the final approach fix that is contributed by theaircraft guidance and navigation performance will be improved in this step. This willinvolve the use of required time of arrival functionality with the appropriate performanceparameters, an accurate and common time source and data link to deliver clearances withaccurate timing information. In addition, short term conflict alert functionality may berequired to improve conformance monitoring.
Reduced Horizontal Separation Standard
In this operating phase it is normally spacing on final approach that determines theseparations applied. As seen in Figure 6.7 the concept includes a plan to reduce spacingon final approach, and thus the approach transition phase may need correspondingseparation reductions. The improvement and enablers would be analogous to the last boxin Figure 6.6, with perhaps a need for further improvement in navigation and surveillanceperformance.
6.2.4 NAS Final Approach
Figure 6.8 shows the proposed concept transition path to achieve increased capacity in theFinal Approach and Initial Departure operating phases. The chart shows two independentenhancement paths, the one on the right centered on additional runways, the one on theleft centered on increased runway utilization. The improvements are described in detailbelow.
CNS/ATM Transition Logic Diagram NASFinal App/Init Dep (3) Improved Throughput Capacity
Increased Rwy.Utililizationwith currenttechnology
Reduction in lateral separation
to 1000 ft
AdditionalAvailableRunways
TFMAssignm.
Seq.
PRM
CRDA
AIP DGPS
Procedures
ROT
DGPS
Procedures
Rollout /Turnoff
Guidance
WakeVortex
Mitigation
CDTI
Air toGround
ADS
GroundMonitor
Reduction inlateral separation
to 2500 ft
Reduction inlongitudinalseparation to
3/2.5nm
Reduction inlongitudinalseparation to
2nmAir toAir
ADS
Figure 6.8 CNS/ATM Transition for the Final Approach and Initial Departure Phase
Additional Available Runways
This improvement involves a combination of new runways being built, and of existingrunways being made more available through development of instrument approaches.

112
FAA’s Airport Improvement Program is the enabler for new runway construction, whichalso may rely on new approaches to approach and procedure design to address airportnoise concerns. Existing FMS capabilities can be utilized to reduce both the spread andthe severity of noise impact, through tailored approach and departure procedures.Experience at Frankfurt airport (Schadt and Rockel, 1996) has shown that by flying FMSprocedures instead of ATC vectors, neighborhood noise impact can be reducedconsiderably.
Instrument approaches to a larger number of runways in the CONUS will be enabled bydifferential GPS down to CAT III minima, and again the implementation relies onprocedure development for each airport.
Increased Runway Utilization with Current Technology
This improvement step involves the installation of existing technology where needed toincrease throughput of closely spaced parallel and converging runways in IMC. To fullytake advantage of the Precision Runway Monitor and Converging Runway Display Aidtechnologies it may be necessary to include arrival and departure sequencing and spacingautomation.
Reduction in Lateral Separation to 2500 ft
This enhancement reduces further the minimum lateral separation between parallelrunways for independent operations. To assist with aircraft blunder detection, ADSevent-based position reporting and improved monitoring on the ground will be needed.Precision missed approach guidance may also become an issue.
Reduction in Lateral Separation to 1000 ft
The reduction below 2500 ft between independent parallel runways in IMC is currentlybeing discussed in the context of airborne separation assurance through CDTI. Wakevortex is also an issue here. This is an ambitious step, and the exact requirements will haveto be worked out carefully through further research.
Reduction in Longitudinal Separation to 3 or 2.5 nm
In IMC, the longitudinal separation on final approach is currently set by wake vortexconsiderations, and therefore this enhancement step must address wake detection andavoidance. This may be done through a combination of wake prediction/detectiontechnology and new procedures to mitigate risk.
Reduction in Longitudinal Separation to 2 nm
Further reduction in longitudinal spacing on final approach would address runwayoccupancy and the need to ensure rapid braking and turnoff performance of the aircraft.In low visibility this may require improved rollout and turnoff guidance, perhaps based ondifferential GPS. Included here might be the possibility of allowing two aircraft on therunway at the same time, if it can be ensured that the trailing aircraft has the requiredbraking performance to stop short.
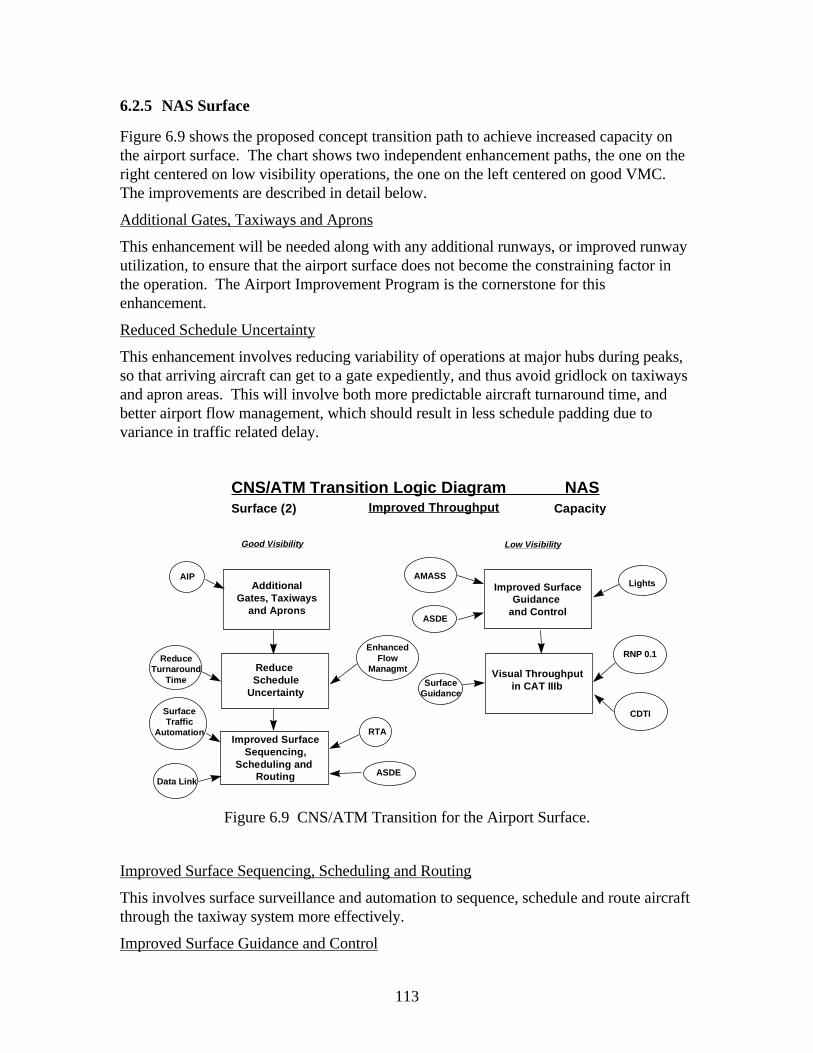
113
6.2.5 NAS Surface
Figure 6.9 shows the proposed concept transition path to achieve increased capacity onthe airport surface. The chart shows two independent enhancement paths, the one on theright centered on low visibility operations, the one on the left centered on good VMC.The improvements are described in detail below.
Additional Gates, Taxiways and Aprons
This enhancement will be needed along with any additional runways, or improved runwayutilization, to ensure that the airport surface does not become the constraining factor inthe operation. The Airport Improvement Program is the cornerstone for thisenhancement.
Reduced Schedule Uncertainty
This enhancement involves reducing variability of operations at major hubs during peaks,so that arriving aircraft can get to a gate expediently, and thus avoid gridlock on taxiwaysand apron areas. This will involve both more predictable aircraft turnaround time, andbetter airport flow management, which should result in less schedule padding due tovariance in traffic related delay.
CNS/ATM Transition Logic Diagram NASSurface (2) Improved Throughput Capacity
ReduceTurnaround
Time
EnhancedFlow
Managmt
AdditionalGates, Taxiways
and Aprons
Reduce Schedule
Uncertainty
Improved SurfaceSequencing,
Scheduling and Routing
SurfaceTraffic
Automation
Data Link
RTA
ASDE
AIP AMASS
ASDE
Lights
RNP 0.1
SurfaceGuidance
Improved SurfaceGuidance
and Control
Visual Throughputin CAT IIIb
Good Visibility Low Visibility
CDTI
Figure 6.9 CNS/ATM Transition for the Airport Surface.
Improved Surface Sequencing, Scheduling and Routing
This involves surface surveillance and automation to sequence, schedule and route aircraftthrough the taxiway system more effectively.
Improved Surface Guidance and Control
114
In extreme low visibility conditions it can be taxiway guidance and surface surveillancethat limit the airport’s throughput. This enhancement step would improve surface lightingto guide the aircraft, and implement surveillance and runway incursion alerting for thetower controller.
Visual Throughput in CAT IIIb
This enhancement would be enabled by all-weather surface operations guidance in theaircraft, along with aircraft position information. Presentation of other aircraft positionmay also be a requirement.
6.3 Concept Validation Needs
The system transitions presented in Section6.2 are constructed to achieve phasedreductions in traffic spacing in high density areas in the NAS. None of the steps presentedhave been fully validated, although the initial improvements are well supported byperformance data, and the steps are subject to more uncertainty as we predict further intothe future.
Regardless of what transition steps the system will eventually go through, it is necessary tofollow a disciplined process of transition plan validation before system procurementdecisions are made. Figures 2.1 and 2.2 are top level illustrations of what this validationprocess entails, in terms of sequence and content of the validation tasks.
The first three steps in Figure 2.1 constitute the system preliminary design phase, whichwhen applied to the air traffic management system development will include the followingtasks:
1. Considering the whole system, which improvement steps should be taken first, basedon considerations of potential benefits vs. estimated cost? This task produces aprioritized list of transition steps, and thus serves to focus further more detailed effortson the most important problems.
2. For each of the operating phases, what are the kinds of improvement steps that areneeded, and in what order should they be taken? This step involves a look at availableand emerging technology, taken together with human factors feasibility issues, butmust remain at a high enough level to retain an overall system view.
3. For a particular improvement step in the plan produced in 1 and 2, derive the requiredsystem performance, and allocate to the associated CNS/ATM elements. Thisallocation, again, must includes human factors feasibility along with technologyperformance.
4. Given the CNS/ATM performance requirements in 3, determine what combinations oftechnology and procedures can be applied to achieve the improvement objectives.This produces a list of alternatives for each transition step under consideration.
5. Determine which of the alternatives in 4 is the best option. This involves technologyand human factors feasibility, investment analysis, and implementation risk, and mustbe considered in the context of the overall system architecture. Thus, the design

115
trades involved in this step will result in functional allocation and system architecturedecisions for the end-to-end system improvements being considered.
Items 1 through 5 above will require appropriate analysis tools to properly resolve thecomplex issues, and it is important for these issues to remain at an overall system level.Thus, the tools employed must include only the necessary level of detail and carefullyconstructed metrics. The team is concerned that this is currently a weakness in the NASmodernization process. Specific research topics aimed at addressing this concern arediscussed in Section 8.3.
The detailed validation of operational concept elements (i.e. the transition steps in themodernization plan) follows the preliminary design trades described above. This is an areawhere much more emphasis has been placed in traditional system development, and thusmany of the required methods and tools are already available. The following items mustbe included in the concept validation process:
• Normal, non-normal, and rare-normal performance of all system components must beincluded throughout the process. This may currently be an area of weakness in ATMsystems development, where too much emphasis is placed on normal performance, anddisturbances and failure modes are considered only late in the development process.
• Technology must be prototyped, including human factors considerations, andsimulation analysis used to produce performance data and refine the system design.
• Concept validation involves demonstrating technical and human performance, and theassociated benefits and costs, against the metrics established in the preliminary designphase.
• The validation process is iterative, may lead to a conclusion that a concept (andassociated technology) is not viable and must be either modified or abandoned.
• When the validation process is completed, and an investment case is made, the conceptmoves into system design, build and install.
Of the three primary system development phases (preliminary design, concept validationand design and implementation), the last is by far the most costly, and the first can beperformed at a relatively low cost by properly focusing the effort. Thus, it is possible toavoid potentially costly procurement that fails to meet requirements with a reasonableinvestment in preliminary system design.
116
7 NAS Concept Evaluation
7.1 Global Scenarios
Scenario writing typically involves the juxtaposition of a number of alternative futures.These constructed images of the future may range from ‘optimistic’ to ‘pessimistic’ asthey attempt to extrapolate current nominal trends with other likely and plausible futures.In this section, only a single NAS scenario was constructed. This single global scenario isbased on a review of some relevant references structured by six major scenario categoriesthat capture the many facets of NAS operations subject to possible limitations, constraints,modifications, and shifts regarding the future ATM system envisioned for 2015. Section2.3.1 outlines the scenario building process, including a brief description of the 13 issuecategories which, along with the six major scenario categories, organize the selected textsdrawn from the several sources listed in the Bibliography. Appendix B contains the collageof texts cited from the Bibliography. The following is a general scenario that provides aspectrum of potential issues which may affect the future patterns of development of theATM infrastructure and operation.
First, according both FAA and Boeing references, the increase of air traffic domesticallyand globally is estimated to grow from 1997 to 2016 by about 5% (Boeing CMO (1997),p. 3). This expected growth will increase domestic aircraft operations in 2008 to 31.5million relative to 1996 (24. 0 million) (U.S. FAA Aviation Forecasts (1997), p. I-14).Coupled to this growing traffic is its effect on the workload levels at ARTCCs. Theforecasts indicate a workload increase at an annual rate of 1.8% from 1996 to 2008. Thisincreased workload means that FAA en route centers are expected to handle 50.2 millionIFR aircraft by 2008 (ibid, p. I-14).
The increased traffic flows require a substantial economic investment for all categories ofinfrastructure including ATC/ATM systems, airports, and feeder roads, all of which willrequire government financial support. These supports may be delayed since governmentsmay be cash-strapped (Booz, Allen & Hamilton (1995), p. 2-29). For example, futurefunding for the FAA will fall far short of what the agency needs to provide even thecurrent level of services, since it is projected that a budget shortfall of $12 billion exists inthe near term or from fiscal year 1997 to 2002. Such deficits promote an unfoldingscenario of increased corporatization and privatization of basic ATM services withuncertain consequences regarding economic, safety and regulatory issues (U.S. Congress(1996), p. 9).
Political and economic related concerns in the international context may also conflict withthe sovereignty of states. Air transport authorities have become increasingly concernedabout the regulation of international air transport. The establishment of unified regionaleconomic markets has invoked concerns about adverse effects on the national airlines ofnon-participating states (Booz, Allen & Hamilton (1995), p. 2-135). A major ICAOmeeting in 1994 concluded that “in view of the disparities in economic and competitivesituations there is no prospect in the near future for a global multilateral agreement in the
117
exchange of traffic rights.” (Donne (1995), pp. 47-49). Related potential disruptive issuesinclude global market access, where an open skies policy for international operations is notyet considered feasible, especially when slot allocations are limited, foreign investment inanother sovereign state’s airlines raises ownership and control concerns, and the over 900different taxes worldwide imposed on the industry creates an added economic burden onairlines (ibid, pp. 50-51).
In the area of environmental considerations, the affect of world air transport has,according to IATA, been less severe than other modes of transportation. However,tougher standards are being proposed which may add to developmental costs incurred bythe airline industry (ibid, pp. 161-162).
The future affects of alternatives to air travel seem to be relatively secure. Various formsof innovative electronic communication have been, and may well be in the future, lesssevere than some reports have suggested. Video-conferencing, for example, seems to havesome impact on reductions in air traffic only during economic recessions whenbusinessmen forego travel expenses during these periods. From an efficiency point ofview, such high-tech communications and information technologies do not directlycompete with air travel (ibid, pp. 85-87).
A number of potential drawbacks exist, however, with the proposed GPS and satellite-based navigation on the use of airspace. First, several ICAO member states have beenvocal in their reluctance to accept a GPS-based satellite navigation system, primarilybecause GPS is U.S.-owned and currently managed by the DOD. They are also concernedthat the U.S. may unilaterally degrade the GPS signal accuracy for precision guidance(Booz, Allen & Hamilton (1995), pp. 3-94, 3-95). Much work has been conducted by theinternational community to develop and implement a GNSS, which may not include GPS(ibid, p. 3-49). Moreover, uncertainties associated with GPS (and other) satellite-basednavigation include system availability and integrity especially crucial during precisionapproaches in poor weather conditions (ibid, pp. 3-53, 3-58).
Not only the space segment poses potential constraints for the future ATC/ATMoperations in NAS or other airspace. The ATC architecture may itself be a source ofpotential problems. If current software practices continue (such as heterogeneouscommunications protocols and data formats, and multiple application languages), costlysoftware maintenance of the many (e.g. 54 operational ATC systems written in 53programming languages) fragmented ATC systems would be the result in the future (U.S.GAO AIMD-97-30 (1997), pp. 40-46). No FAA organization is responsible for theproblem of technical ATC architecture creating the potential proliferation of anuncoordinated ATC software architecture development process affecting the future ATCmodernization effort (ibid, pp. 47-54).
The disruption and delay of traffic flow may also be generated from ground handlingprocesses. For example, due to increased mix of international passengers, delays may becaused by increasing volume of visa processing. This could be especially acute in apossible future of heightened political instabilities which would create stricter measures tocontrol the flow of immigrants and foreign travelers (Booz, Allen & Hamilton (1995), p.148). Another future risk associated with ground handling concern health requirements of
118
travelers. There are signs that debilitating or fatal diseases which have been eradicated inmany countries may be returning and have the potential for spreading throughinternational travel, and thereby causing further processing delays as health-relateddocumentation is reviewed at ports of entry. Also, outmoded and complicated inspectionsnegate the inherent advantage of speed offered by public air transport which may also addto the cost of airline operation in excess of $100,000 per day (Donne (1995), p.149).
In addition to ground handling issues, the efficient operation of airports demands increasedairport capacity that could handle the projected 57% increase in passenger enplanementsbetween 1993 and 2005. Major investments will be needed to accommodate morepassengers and larger aircraft. A substantial increase in aircraft operations at a large hubairport may warrant consideration of additional runways. However, the outlook for newrunways at major origin/destination airports is less promising. New runways are beingconsidered at only 5 of 13 large hub airports where more than two-thirds of traffic islocally generated. The engineering and political obstacles are daunting to new runwayconstruction at these airports. It is projected that airfield congestion at majororigin/destination airports will continue to be one of the most difficult issues facing civilaviation (U.S. FAA NPIAS (1995), pp. 29-30).
Efforts to increase future airspace capacity with Free Flight concepts may be stalled byconflicts of Special Use Airspace issues. Although SUA serves the important safetyfunction of segregating hazardous activity from non-participating aircraft, civil users havevoiced concerns about whether SUA is being efficiently managed. By its location SUA canlimit air traffic to and from a particular location and thus has become a much more urgentissue because of the aviation community’s movement toward Free Flight. Under a FreeFlight operating concept, the users of the system would have more freedom to selectpreferred routes as long as such routes do not interfere with safety, capacity, and SUAairspace. A key recommendation is the establishment of a real time system to notifycommercial users of SUA availability. At least two hours of minimum notice is suggested.Such use of SUA could disrupt the visions of relatively unfettered Free Flight for the NASin 2015 (U.S. GAO RCED-97-106 (1997), p. 25).
Some potential airport safety problems may be anticipated under the emergence of thenew NAS. An example is when the acquisition, development, integration, and assimilationof complex systems and technologies (which rarely are ‘off-the-shelf’) produceunexpected outcomes, costs, and delays, such as was the case for the now defunctAdvanced Automation System (AAS). Currently being replaced by the Standard TerminalReplacement System (STARS) which provides controllers in TRACONs with newworkstations and supporting computer systems, the AAS incurred schedule delays of upto eight years with estimated increase in costs from $2.5 billion to $7.6 billion. FAA’sschedule for STARS can also be jeopardized by scheduling conflicts with othermodernization efforts. For example, in September 1996, a study identified 12 potentialscheduling conflicts at the first 45 STARS sites. Safety issues surrounding airportoperations may also be associated with an unhealthy mix of newer digital and older non-digital systems such as terminal surveillance radars (U.S. GAO RCED-97-51), pp. 3-4).
FAA’s organizational culture and workforce issues also may prove to be problematic inthe future in terms of safety, schedule delays, and project costs. As may be inferred from

119
above, the agency’s organizational culture has been an underlying cause of the persistentcost overruns, schedule delays, and performance shortfalls as exhibited, for example, in itsacquisition of major ATC systems. FAA officials have rushed into production beforecompleting development, testing, or evaluation of programs. Also, poor oversight hascaused acquisition problems in such projects as ODAPS and Mode S where the delivery ofthe latter was delayed for five years (U.S. GAO RCED-96-159 (1996), pp. 22-29).Moreover, an environment of control has been fostered by the agency’s hierarchicalstructure where employees are not empowered to make needed management decisions.Fewer than half reported that they had enough authority to make day-to-day decisionsabout day-to-day problems. Also, poor coordination between FAA’s program offices andfield organizations has caused schedule delays as has been the case with the TerminalDoppler Weather Radar, the Airport Surveillance Radar, and the Airport SurfaceDetection Equipment (ibid, pp. 29-31). Finally, a study in 1994 showed that differences inthe organizational culture among FAA’s air traffic controllers, equipment technicians,engineers, and divisional managers made communication difficult and limited coordinationefforts (ibid, pp. 32-33).
With respect to potential future issues regarding FAA’s workforce, the agency hasidentified that for 1997 and 1998 their staffing needs will be met. However, it is uncertainwhether current sources can provide the controller candidates FAA will need through2002. FAA officials have identified several impediments that hinder their ability to staffATC facilities at specified levels. The first is FAA headquarters’ practice of generally notproviding funds to relocate controllers until the end of the fiscal year, which causesdelayed controller moves and continued staffing imbalances. The second impediment is thelimited ability of regional officials to recruit controller candidates locally to fill vacancies atATC facilities. In addition, FAA regional officials also believe that limited hiring of newcontrollers in recent years has hindered their ability to fill vacancies. Partly due to theseimpediments, as of April 1996 about 53% of ATC facilities were not staffed at levelsspecified by FAA’s staffing standards (U.S. GAO RCED-97-84 (1997), pp. 3-4.
7.2 Implications of Global Scenarios on System Transition Paths
The global scenario outlined in Section 7.1 suggests some of the possible ways that thefuture transitional path of the NAS system in 2015 may be diverted from the generallyexpected trajectory. The particular unfolding nature of these transitions may affect systemcapacity, safety, and efficiency.
NAS system demand is primarily driven by general market and economic conditions. Forexample, about 80% of the Gross Domestic Product (GDP) directly contributes to theRevenue Passenger Miles (RPM). Moreover, political, social, and cultural realities, andconcomitant uncertainties, may also play a significant role in shaping the demand fortravel, in general, and air travel, in particular. To address future traffic demand, a sufficientNAS system capacity must be provided. How the future NAS system capacity is realized,however, is dependent on a number of parameters including airplane size, the mix of anairline’s fleet, the nature and extent of operating in a hub and spoke configuration, andother relevant issues such as airline deregulation and the impact of technologicaldevelopments and applications (e.g. ADS-B, CTAS). In terms of NAS capacity, an

120
estimated 5% constant traffic growth requires that the NAS infrastructure and operationalcapacity in 2015 is prepared to handle 2.4 times the current traffic flow rate. A successfulsystem transition toward this goal may likely be delayed given the range of technical,economic, institutional, and political obstacles. From delays in ground handling due tolikely increases in processing foreign passengers, to delays in integrating the latestsoftware and other technological subsystems, the NAS may have insufficient capacity in2015 to assimilate the projected growth rates in traffic. The estimated RNP levels may notbe viable (especially near terminal areas) for the stated period, as successfully integratingthe CNS/ATM technical operational infrastructure may be affected by potential ATCarchitecture integration issues associated with complexity, functional redundancy, andgeneral compatibility of several software-laden technologies. The number of plannedrunway construction projects at the 13 major hubs promises to constrain the capacityneeds in 2015. Of course, economic shortfalls can undercut needed improvements insystem capacity by underfunding specific technical projects (e.g. ASR-9 surveillance radarinstallations) which directly contribute to enhancements in NAS capacity.
Given recent ATC developmental history, possible impacts on system safety may arisefrom the emerging trend of multiple, uncoordinated, and fragmented technologiesproducing an unsystematic array of incompatible technologies (e.g. several softwareprotocols) which may diminish presumed margins of safety. Also, the expected shortage oftrained air traffic controllers after 2002 may be detrimental to operational safety preciselywhen traffic flow levels are expected to rise dramatically. In addition, possible conflictsstemming from Special Use Airspace between the military and civilian interests mayintroduce added risks in a regime of Free Flight envisioned for en route airspace. If aminimum of two hour notification is needed to communicate the availability status of theSUA, a decrease in operational safety may be expected due to possible communicationerrors in the operational context of relative route flexibilities generated in a Free Flightenvironment, which would require heightened ATC surveillance levels.
Possible setbacks from planned NAS efficiency may come from the inability of operatorsto have unfettered airspace market access, or when limitations in slot allocations at manyairports is reached. This is due, in part, to concerns by sovereign states in protecting theirnational interests. International competitive pressures may further exacerbate the efficienttraffic flows from one global region to another. The uncertainties regarding differentsatellite-based CNS schemes may also cause operational inefficiencies as carriers may berequired to adapt to multiple modes of navigational aids, moving from GPS-based systemsto other non-U.S. developed navigational systems. Finally, potential inefficiencies may beincurred due to possible degradations of satellite-based navigation signal availability orcontinuity of function due to ionospheric scintillations and other potential sources oferrors. These effects would be especially severe during the approach and landing phases.
7.3 Comparison with the FAA and RTCA Operational Concepts
The concept presented in this report is built around the goal of increasing system capacityin clearly defined transition steps. Additional system improvements to support increasedefficiency are also presented. This concept, as well as other long term ATM operational

121
concepts under consideration for the NAS, will need to be validated against the missionobjectives as discussed in Section 6.
Appendix C contains a top level analysis that the team performed on the FAA and RTCAoperational concepts in June of this year. It appears that the FAA and RTCA conceptsassume a very similar technology basis as this report, with an operational emphasis that isperhaps more on user flexibility than on system capacity, although this is not stated ineither document.
Many possible transition paths and a large array of technology can be applied to the NASmodernization. An approach that is largely technology-driven has resulted in an emphasison new technology as the solution, but there is not yet an agreement on what the primaryproblem is. The industry must clearly define what problem should be solved (i.e. state thesystem mission), and use this statement to drive technical requirements with properinclusion of human factors, or run the risk of making a huge investment in a system thatdoes not fulfill the mission.
122
8 Conclusions and Recommendations
8.1 Conclusions
1. The traffic growth predictions presented in Section 2 indicate that as early as 2006the NAS will suffer serious traffic gridlock unless increased capacity is ensured.The terminal area is predicted to be the primary choke point in the system, withincreasing congestion in some en route regions. This situation, if not addressed,will cause airline hubbing operations to become difficult, if not infeasible, withescalating costs which will constrain economic growth.
2. The current approach to NAS modernization will not accommodate the predictedgrowth. This is primarily due to two factors:
• The pace of the modernization is too slow to respond to market needs.
• The system development process is inadequate, as it is largely technology-driven to point solutions, without traceability to clearly defined missiongoals.
8.2 Recommendations
1. NAS capacity must be increased two to three fold through 2015. This is achallenging task, technically and economically, and will involve a combination ofthe following:
1.1. Additional runways will be needed, either at existing hub or relieverairports or at new airports.
1.2. Higher traffic density in terminal areas and the most congested en routeregions will also be needed. The operational concept presented in thisreport proposes to achieve this through a combination of the following:
1.2.1. Improvements in communications, navigation and surveillancetechnology to support reduced separations. This will be aimed atmore accurate trajectory definition and execution, and betterposition and intent information for the separation assurancefunctions. A precision 4-D separation assurance framework,distinct from procedural or radar control, will emerge.
1.2.2. Changes in the separation assurance functions to achieve thecapacity goals. This will involve decision support tools forincreased accuracy and productivity, along with an architecture thatsupports the required criticality of function for separationassurance.
1.2.3. Airspace configuration to support either high or low densityoperations through dynamic partitioning. Access to airspace will bebased on aircraft capability, qualified to a maximum RequiredSystem Performance (RSP) level in which the aircraft can operate.
123
1.2.4. A coordinated traffic flow planning system that supports highercapacity and efficiency. This will involve a careful definition ofroles for each flow planner and the information infrastructureneeded to support each function.
2. A major change is needed in the ATM system development process to ensure thatthe modernization objectives will be achieved. The following issues must becarefully considered:
2.1. All system elements will be affected, and thus a whole-systems approachmust be taken to ensure that benefits will be delivered.
2.2. A collaborative development approach must be adopted throughout themodernization process to ensure inclusion of all system stakeholders.
2.3. The high level preliminary design trade examination must be done beforemajor concept and architecture decisions are made to ensure that thesystem will achieve its mission - which includes total system productivityand affordability.
2.4. Concept development and validation must incorporate human factors andtechnology equally throughout the modernization effort.
2.5. The level of risk and criticality requirements for ground and air elementsmust be understood and incorporated early in the development, to ensurethat the concept and architecture will be certifiable.
2.6. Interdisciplinary research and development teams are essential to ensuringmodernization success, due to the size and complexity of the system.
8.3 Research Needs to Support the 2015 Concept
This report has presented an operational concept baseline for the NAS through 2015, andhas devoted considerable attention to how a large scale system development such as theNAS modernization should be approached. This section presents a list of research areaswhere focused effort will be required to move from a concept into an operational system.The list is not exhaustive and a considerable effort is required to develop a comprehensiveresearch and development plan, but this section attempts to highlight the most criticalresearch needs.
8.3.1 System Development Process
The following are the primary recommendations to address the shortcomings of the ATMsystem development process:
1. System Performance Metrics. An overriding concern for the entire ATM systemdevelopment process is that efforts are not properly focused on clear goals. This ispartly due to a lack of consensus in the industry, but partly due to a lack of meaningfulmetrics against which to measure success. Thus, from the point of view of managingresearch and development, an immediate priority must be placed on the developmentof a set of system performance metrics that directly relate to the system safety,
124
capacity and efficiency goals. Deriving from these top level metrics will be a hierarchyof metrics for measuring performance of system components, all of which need to bedefined to support the top level metrics.
2. Integration of Human Factors. There is a need to determine, in detail, the processof how human factors can be incorporated into ATM system development, design,integration and maintenance. The process should define both the nature and timing ofinputs. The plan for human factors involvement would then be available as guidelineswhich could be used by decision makers in the system development process.
3. Role Definition. Focused and specific guidelines need to be produced on how todetermine and describe the eventual role of the humans in a system where thefunctional allocation is to be human-centered. The kind of automation supporthumans need will be identified by the requirements of the human role within the ATMsystem. This activity must done as part of the operational concept definition phase ofsystem development and would be expected to identify very explicit research questionsthat need to be answered as a part of preliminary design.
8.3.2 Research Tools Development
An integrated set of analysis and simulation tools needs to be developed, aimed at theevaluation of preliminary design concepts for a selected U.S. high density air traffic area.The tools must support the development of a transition plan from the current ATCinfrastructure to the future architecture and operation. This tool set will support theidentification of long range (up to 30 year) system capacity, safety and efficiency needs,evaluation of alternative operational concepts, allocation of requirements to CNS andATM system elements, and evaluation of the safety, human performance suitability andeconomics of alternative transition strategies.
A series of research tasks are needed for developing an operational performance baselineof a high density air traffic services area. These tasks will establish traffic andinfrastructure forecasts, develop an integrated analysis tools set spanning overall systemoperational modeling, technical CNS and ATM performance modeling, and economictransition assessment. Also to be established is a database of technology (current andemerging), as well as human performance tools and assessments. These tools and datawill be applied to the preliminary design and evaluation of the phased introduction of newCNS/ATM technologies for high density traffic areas. A conceptual framework for thisset of preliminary design exploration tools is shown in Figure 8.1.
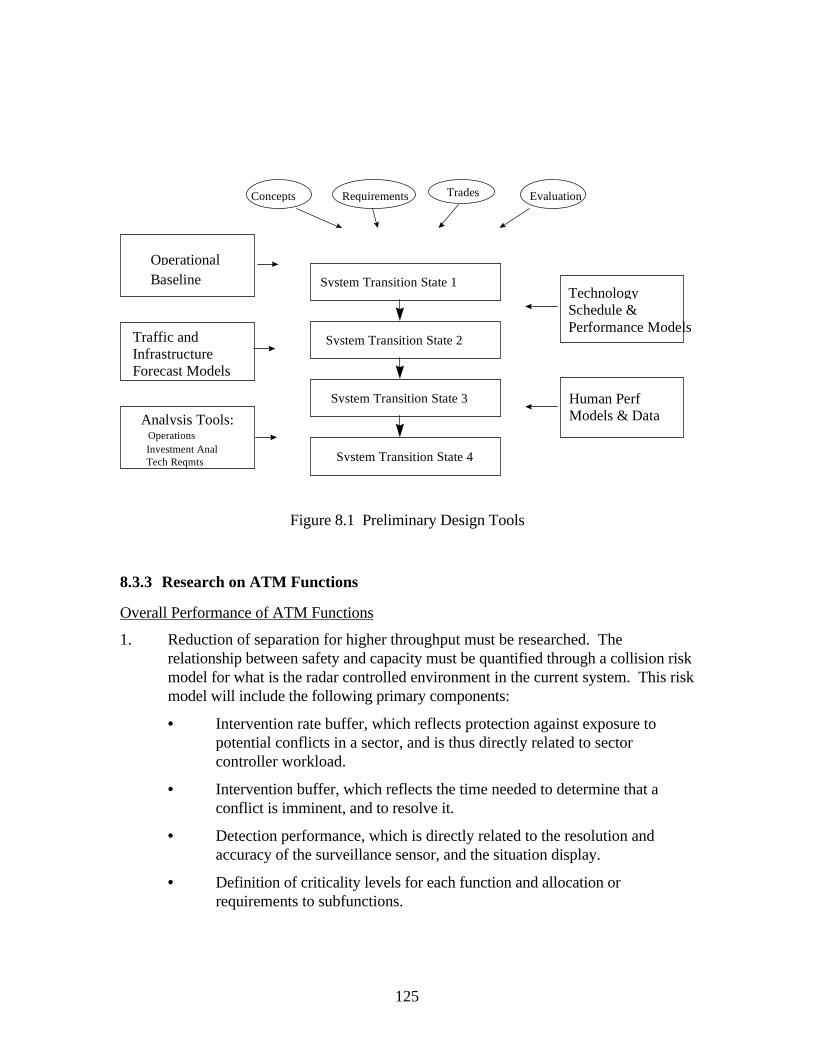
125
OperationalBaseline
TechnologySchedule &Performance Models
Concepts Requirements Trades Evaluation
Traffic andInfrastructureForecast Models
Analysis Tools:Operations
Investment Anal Tech Reqmts
System Transition State 1
System Transition State 2
System Transition State 3
System Transition State 4
Human PerfModels & Data
Figure 8.1 Preliminary Design Tools
8.3.3 Research on ATM Functions
Overall Performance of ATM Functions
1. Reduction of separation for higher throughput must be researched. Therelationship between safety and capacity must be quantified through a collision riskmodel for what is the radar controlled environment in the current system. This riskmodel will include the following primary components:
• Intervention rate buffer, which reflects protection against exposure topotential conflicts in a sector, and is thus directly related to sectorcontroller workload.
• Intervention buffer, which reflects the time needed to determine that aconflict is imminent, and to resolve it.
• Detection performance, which is directly related to the resolution andaccuracy of the surveillance sensor, and the situation display.
• Definition of criticality levels for each function and allocation orrequirements to subfunctions.
126
• Definition of normal, non-normal and rare-normal conditions for eachoperating phase in the ATM system, and accounting for these in the entireprocess to ensure that systems will be certifiable.
2. The relationship between capacity and efficiency must be developed, including thefollowing primary components:
• Degree of structure needed to ensure throughput as contrasted withrouting flexibility to achieve efficient flight.
• Internal schedule flexibility for larger operators, and how collaborativedecision making can be incorporated in flow planning.
• Flow planning and separation assurance for improved routing flexibility.Planning roles in the system must be coordinated and clearly defined.
3. Transitions from en route to high density terminal areas must be addressed. Oneof the possible methods is to base a plan on required time of arrival at particularpoints around the terminal areas. The need to perform conflict prediction andresolution through possibly intermediate sectors is an issue.
4. Trajectory prediction accuracy and use of intent information for traffic planningand separation assurance must be addressed, in the context of the collision riskmodel discussed in item 1.
5. Flow planning in extended terminal areas and high density regions such as thenortheast corridor is a challenging topic and of considerable importance.
6. Surface automation and the overall coordination with terminal area airborneoperations must be examined.
7. The problem of wake vortex in a variety of situations (including approach,departure, parallel approaches and airborne) is one of the largest challenges on theroad to increased capacity.
8.3.4 Human Factors Performance
The output from the following items could be in the form of contributions to both adatabase and knowledge base. It may be possible to formulate either models or analysisand development tools in specific instances.
1. Decision Support Systems:
The main issues identified in Section 4.3.1 were how controllers would becomedependent on decision support systems, how this dependency might affectsituational awareness, and what type of intervention skills may be necessary forany rare-normal or abnormal events. Research should be focused at identifying therelationship between dependency and situational awareness with specific emphasison determining the ability of the controller to:
• Identify when intervention is necessary
• Maintain the necessary skills to intervene.
127
2. Intent:
The research area identified is the understanding of the nature and structure of thecontrollers’ intent. There is a need to understand how their intent is translated intoa 4D action plan, how the plan is shaped by the need to delay execution of specificactions, and how that action plan is modified in real time. This knowledge is basicto determining how intent data could be entered into and used by a decisionsupport tool.
3. Structure to Maximize Throughput:
An understanding needs to be developed about how airspace structure is used toreduce cognitive workload (intervention rate) and thus facilitate increasedcapacity. The cognitive demands on the tactical controller were discussed in termsof being affected by the need to identify potential conflicts. The task ofdetermining the potential for conflicts becomes more difficult in the terminalenvironment due to the uncertainties in the profiles of climbing and descendingaircraft. Topics will include:
• Real time studies on the cognitive workload for distributed flight profilesversus a more structured organization. The scenarios for this test mustinclude both high and low density traffic situations with the presence ofaircraft that do not respect clearance or suffer some failure (i.e., non-normal and rare-normal events).
• Fast time studies on the number of potential conflicts created in high andlow density airspace using a non-airway or free-routing organization.
4. Sharing Separation Assurance Responsibility:
Research associated with the sharing of the separation assurance task should focusprimarily on identifying the feasibility of ground and cockpit recovery proceduresinvolving transfer of control. Factors to address are requirements for independentmonitoring and the technologies needed to support such requirements.
8.3.5 Communication Research
In order to fully exploit the future capability of data link, the following research should beundertaken:
1. Natural Language Information Flow Between the Aircraft and Control - Thecurrent specifications for Controller/Pilot Data Link replicate exactly the standardphrases specified in FAA Order 7110.65 and its ICAO equivalent document.These documents have evolved over many years to ensure complete andunambiguous verbal communication. They do not, however, represent the bestway of communicating when verbal communication is not the means. Research isneeded to define the best way to communication flight clearances and intentindependent of the means of expressing that information. Human factors researchmust accompany this effort to ensure that the resulting natural language of air
128
traffic control can be unambiguously conveyed to and from the humans at each endof the communication process.
2. Natural Language Information Flow for Aircraft Access to Ground DataBases and for Ground Access to Aircraft State and Intent - The currentspecifications for ADS and FIS are derived from their verbal counterparts.Research is required to develop methods for requesting and sending informationthat is independent of the constraints of verbal communication. The bandwidthand latency constraints of air/ground communication media must be recognized inthis development, however.
129
Acknowledgments
The Boeing team worked very closely with NASA personnel during the entire contractperiod, and had numerous opportunities for professional exchange and to gain insight intothe technologies that are being developed within the AATT program.
The team also had an opportunity to work with the FAA Air Traffic Operational ConceptDevelopment Team, which was formed at about the time this contract was beingestablished. The FAA’s first operational concept document draft was available to theBoeing team before this contract was established, and the team received updates as theybecame available. Team members also attended two FAA internal working meetings onfunctional allocation and task analysis for the air traffic concept during the contract period,and gained valuable insight into the details involved in the concept implementation.
The team was supported by NEXTOR faculty members for the duration of the contract,and their expertise was valuable for various aspects of the concept. John R. Hansman,MIT, served as Principal Investigator for NEXTOR. Hansman, along with Amedeo Odoniof MIT, Adib Kanafani and Mark Hansen of UC Berkeley, provided consultation on anumber of technical issues. Their expertise contributed substantially to the conceptdefinition and its presentation.
For the NAS Stakeholder Needs survey, the team relied on the valuable time and ATMsystem knowledge of 11 professional organizations: ACI-NA, ADF, ALPA, AOPA, ATA,DoD, GAMA, HAI, NATCA, NBAA and RAA. The team is grateful for the time takenby the experts in these organizations to provide the information requested in theappropriate format, and for the valuable insight the team gained into the various aspects ofthis large and complex system.
Last, but not least, the team was supported in its work by a number of experts withinBoeing, who contributed to the wide range of topics covered in this report. The primarycontributors, in addition to the authors listed, were Malcolm A. Coote, Nicholas Patrick,George Boucek and Roger Nicholson. Unfailing support from the CNS/ATM Programmanagement team of James E. Templeman, Richard L. Wurdack, and David L. Allen, isalso gratefully appreciated. Information needs, along with persistent and much needededitorial support was provided by Daniel B. Trefethen, and Christa M. Stafford cheerfullyensured that team members always knew exactly where they were going and how to getback again.
130
Bibliography
Air Transport Action Group (1994), Economic Benefits of Air Transport, Geneva,Switzerland. Available on the World Wide Web athttp://www.atag.org/ECO/Index.htm.
Air Transport Action Group (1994?), Air Transport and the Environment, Geneva,Switzerland. Available on the World Wide Web athttp://www.atag.org/ATENV/Index.htm.
Allen, D.L., et al (1997), “The Economic Evaluation of CNS/ATM Transition”, FirstU.S.A./Europe Air Traffic Management Research and Development Seminar,Session 3, ATM Performance Indicators, Paris, June, sponsored by Eurocontrol.
American Institute of Aeronautics and Astronautics (1992), Recommended TechnicalPractice Document (Draft): Operational Concept Document PreparationGuidelines, January 24, Washington DC.
ARINC, Inc.(1993), Automatic Dependent Surveillance, Specification 745, June,Annapolis, Maryland.
ARINC, Inc.(1994), Character-Oriented Air Traffic Service (ATS) Applications,Specification 623, December, Annapolis, Maryland.
Billings, C.E. (1997), Aviation Automation: The Search for a Human Centered Approach,Lawrence Erlbaum Associates.
Boeing Commercial Airplane Group, CNS/ATM Analysis (1997), CNS/ATM FocusedTeam Meeting, presentation binder, March 19-20, Seattle, Washington.
Boeing Commercial Airplane Group (1997), Current Market Outlook, March, Seattle,Washington.
Booz, Allen & Hamilton, Inc. (1995), Air Traffic Control and Air Traffic ManagementSystems: An Analysis of Policies, Technologies and Global Markets, v. 1.,McLean, Virginia.
Campbell, S.D., Mathews, M.P., and Rooney, M.(1995), “The Terrain WeatherInformation for Pilots (TWIP) Program”, paper 4.3 presented at the 6th
Conference on Aviation Weather Systems. Long Beach, CA. Feb 2-71995,American Meteorological. Society, Boston, MA.
Chew, R. (1997), “CNS/ATM: Preserving Airline Opportunity”, presented in CNS/ATMFocused Team Meeting, March 19-20, hosted by Boeing Commercial AirplaneGroup CNS/ATM Analysis, Seattle, Washington.
Coonan, J.R. and Mpontsikaris, P. (1971), A Functional Description of Air TrafficControl, Transportation Systems Center Technical Note DOT-TSC-FAA-71-4,April, Cambridge, Massachusetts.
Cotton, W.B.(1994), “The Need for Teamwork in FANS Air Traffic Management”,Proceedings of the 1994 RTCA Symposium: Implementing Air TrafficManagement Through Government/Industry Partnerships, November 30-December 1, 1994, Reston, Virginia.
Donne, Michael (1995), The Future of International Air Passenger Transport: Into anEra of Dynamic Change, Financial Times Management Report.

131
Eurocontrol (1996), Meeting Europe’s Air Traffic Needs: The Role of EATCHIP andEurocontrol, Brussels, Belgium.
Eurocontrol (1997), EATMS Operational Concept Document (OCD), January, Brussels,Belgium.
Eurocontrol et al (1997), PHARE PD 1 Final Report, document 96-70-24, Brussels,Belgium.
Evans, J. and Ducot E.R.(1997), “Allowing the Major Airports to Operate SmoothlyDespite the Weather with the Integrated Terminal Weather System”, paper P1.8presented at the 7th Conference on Aviation, Range, and Aerospace Meteorology.Long Beach, CA. Feb 2-7 1997, American Meteorological. Society, Boston,MA.
Evans, J.(1995), “Measuring the Economic Value of Aviation Meteorological Products”,paper J5.2 presented at the 14th Conference on Weather Analysis andForecasting, Dallas, TX Jan. 15-20 1995, American Meteorological. Society,Boston, MA.
French Ministry of Transport, Center for the Study of Aerial Navigation (CENA) (1996),Aeronautical Telecommunication Network Panel ATN Validation Archive/Server,version 4.0, October 7, available on the World Wide Web athttp://www.cenatls.cena.dgac.fr/atnp/, directory /srpgm/p1 (user “atnp”,password “upplval”).
Higgins, C.R. (1997), Perspectives on Aviation Safety and Efficiency, presentation to theNational Civil Aviation Review Council, July 1997.
Hinton, D.(1995), Aircraft Vortex Spacing System (AVOSS) Conceptual Design, NASATechnical Memorandum 110184, NASA Langley Research Center, Hampton,VA.
Hunter, C.G. (1996), CTAS Trajectory Sensitivity Analysis and Potential Benefits Study,Seagull Technology Inc. report TM 96150-1, May.
International Civil Aviation Organization (1994), Manual on Required NavigationPerformance (RNP), document 9613, Montreal.
International Civil Aviation Organization (1995), Outlook for Air Transport to the Year2003, circular 252-AT/103, ICAO, Montreal.
International Civil Aviation Organization (1996), Review of the General Concept ofSeparation (RGCS) Panel, ninth meeting, May 6-17, Montreal.
Jane’s Airport Review (anonymous, 1997), “IATA Bemoans High Charges”, Jane’sAirport Review v.9, no. 7, September 1997, p. 11.
Jorna, P. (1997), “Human Machine Interface for ATM Automation: A European StrategyTowards Technology and Human Factors Validation”, Eurocontrol Air TrafficManagement Research and Development Seminar, Paris, June.
Leslie, R.S., Willis, D.L., Shomber, H.R.(1996), U7.4/U8.4 FMCS Navigation Capabilityfor 737-300/400/500, Boeing Commercial Airplane Group, Document D6-38928,Revision A, September 20, Seattle, Washington.
Lindsey, C.G.(1997), Aviation Weather Study Project Plan Document, prepared forBoeing Commercial Airplane Group CNS/ATM Analysis, Everett, Washington.
MITRE Corporation (1996), Report on the Implementation of the Air Traffic ServicePlan report number MP 96W0000184, August, Cambridge, Massachusetts.
132
Nakamura, D.A. and Schwab, R.W. (1996), Development of Minimum Aviation SystemPerformance Standards for RNP for Area Navigation, Boeing CommericalAirplane Group, Working Paper for the International Civil Aviation OrganizationWorking Group A: Review of General Concept of Separation Panel, Montreal.
National Civil Aviation Review Commission (1997), Avoiding Aviation Gridlock: AConsensus for Change, Preliminary Funding Task Force Report, September 10,Washington DC.
National Research Council(1995), Aviation Weather Services, a Call for FederalLeadership and Action, National Aviation Weather Services Committee,Aeronautics and Space Engineering Board, Commission on Engineering andTechnical Systems, National Research Council. National Academy Press,Washington DC.
Nolan, M.S. (1994), Fundamentals of Air Traffic Control, Wadsworth PublishingCompany, Belmont, California.
Parasurman, R.(1997), “Humans & Automation: Use, Misuse, Disuse & Abuse”, HumanFactors and Ergonomics Society Journal, June.
Pavaux, J. (ed.) (1995), Air Transport: Horizon 2020, Key Factors and Future Prospects,Institut du Transport Aerien, Paris.
Perry, T.S. (1997), “In Search of the Future of Air Traffic Control”, IEEE Spectrum, v.34, no. 8, pp.18-35, August.
Qualley, W.L.(1995), “Commercial Airline Operational Control”, paper 5.1 presented atthe 6th Conference on Aviation Weather Systems. Long Beach, CA. Feb 2-71995, American Meteorological. Society, Boston, MA.
Reich, P.G.(1966), “Analysis of Long-Range Air Traffic Systems: Separation Standards -I, II, and III”, Journal of Navigation, v.19, no. 1, pp. 88-96; no.2, pp. 169-176;no. 3, pp. 331-338.
RTCA, Inc. (1997), Minimum Aviation System Performance Standards (MASPS):Required Communication Performance for Safety Services, Special Committee169 draft report version 13, August 13, Washington DC.
RTCA, Inc.(1993), Minimum Operational Performance Standards for ATC Two-WayData Link Communications, Document DO-219, August 27, Washington DC.
RTCA, Inc.(1997), Minimum Aviation System Performance Standards: RequiredNavigation Performance for Area Navigation, Document DO-236, January 27,Washington DC.
RTCA, Inc. (1997), Minimum Aviation System Performance Standards (MASPS) forAutomatic Dependent Surveillance-Broadcast (ADS-B), draft version 6.0, RTCApaper 249-97, August 28, Washington, DC.
RTCA, Inc. (1995), Final Report of RTCA Task Force 3, Free Flight Implementation,October 26, Washington DC.
RTCA, Inc. (1996), RTCA Action Plan: Dynamic Air Traffic Management (Free FlightAction Plan), August 15, Washington DC.
RTCA, Inc. (1997), Operational Concept for Air Traffic Management (ATM) -Aeronautical Operational Control (AOC) Ground-Ground InformationExchange, April 29, Washington DC.
133
Schadt, J and Rockel, B. (1996), “Optimization of Arrival and Departure ProceduresUsing Airborne Flight Management Systems FMS, For Example Frankfurt”,FMS-Users Forum, April 25.
Simpson, R.W. (1995), “Creating New Operational Concepts for Global Automated ATMSystems”, Proceedings of ATM 95, Advanced Workshop on Air TrafficManagement, held October 1995 in Capri, Italy.
Tarlton, T., Allen, D.L., Aimar, J.L.(1995), RNP Capability of FANS-1 FMCS Equipped747-400, Boeing Commercial Airplane Group, Document D240U126, RevisionA, August 10, Seattle, Washington.
Thompson, S.D. (1997), Terminal Area Separation Standards: Historical Development,Current Standards, and Processes for Change, Massachusetts Institute ofTechnology Lincoln Laboratories Project Report ATC-258, January 16,Lexington, Massachusetts.
U.S. Congress, 103rd Session, Senate Committee on Appropriations (1995), Proposal toCorporatize The Nation’s Air Traffic Control System, Senate hearing 103-1016,Government Printing Office, Washington DC.
U.S. Congress, 104th Session, Senate Committee on Commerce, Science andTransportation (1996), Air Traffic Management System PerformanceImprovement Act of 1996, Senate Report 104-251, April 10, GovernmentPrinting Office, Washington DC.
U.S. Department of Transportation and Department of Defense (1997), 1996 FederalRadionavigation Plan, July, Washington DC.
U.S. Federal Aviation Administration, Aeronautical Information Manual, serialpublication, Washington DC.
U.S. Federal Aviation Administration (1981), National Airspace System Plan: Facilities,Equipment and Associated Development, December, Washington DC.
U.S. Federal Aviation Administration (1994), ELVIRA Operational Concept DocumentFinal Report, March, Washington DC.
U.S. Federal Aviation Administration (1995), National Plan of Integrated Airport Systems(NPIAS) 1993-97, April, Department of Transportation, Washington DC.
U.S. Federal Aviation Administration (1996), FAA Strategic Plan, Washington DC.U.S. Federal Aviation Administration (1996), Performance Metrics of the Future
National Airspace System, interim report D60261-01, July 19, Washington DC.U.S. Federal Aviation Administration (1996), National Airspace System Architecture,
Version 2.0, October, Washington DC (version 3.0 is forthcoming).U.S. Federal Aviation Administration (1997), Air Traffic Control, FAA Order 7110.65K,
July 17, Government Printing Office, Washington DC.U.S. Federal Aviation Administration (1997), Air Traffic Service Plan 1996-2001, Draft,
March 10, Washington DC.U.S. Federal Aviation Administration (1997), Air Traffic Services FY-96 Business Plan,
March 24, Washington DC.U.S. Federal Aviation Administration (1997), FAA Aviation Forecasts: Fiscal Years
1997-2008, report number FAA-APO-97-1, March, Government Printing Office,Washington DC.

134
U.S. Federal Aviation Administration (1997), Research, Engineering and DevelopmentAdvisory Committee Report, September, Washington DC.
U.S. Federal Aviation Administration and National Aeronautics and Space Administration(1996), Integrated Plan for Air Traffic Management Research and TechnologyDevelopment, Version 1.0, September 30, Washington DC.
U.S. General Accounting Office (1994), Air Traffic Control: Better Guidance Needed forDeciding Where to Locate Facilities and Equipment, report numberGAO/RCED-95-14, December.
U.S. General Accounting Office (1996), Aviation Acquisition: A Comprehensive Strategyis Needed for Cultural Change at FAA, report number GAO/RCED-96-159,August, Government Printing Office, Washington DC.
U.S. General Accounting Office (1997), Air Traffic Control: Complete and EnforcedArchitecture Needed for FAA Systems Modernization, report numberGAO/AIMD-97-30, February, Government Printing Office, Washington DC.
U.S. General Accounting Office (1997), Air Traffic Control: Improved Cost InformationNeeded to Make Billion Dollar Modernization Investment Decisions, reportnumber GAO/AIMD-97-20, January, Government Printing Office, WashingtonDC.
U.S. General Accounting Office (1997), Airport Development Needs: Estimating FutureCosts, report number GAO/RCED-97-99, April 7, Government Printing Office,Washington DC.
U.S. General Accounting Office (1997), Air Traffic Control: Status of FAA’s StandardTerminal Automation Replacement System Project, report number GAO/RCED-97-51, March.
U.S. General Accounting Office (1997), Aviation Safety and Security: Challenges toImplementing the Recommendations of the White House Commission on AviationSafety and Security, report number GAO/RCED-97-90, March.
U.S. General Accounting Office (1997), Aviation Safety: Opportunities Exist for FAA toRefine the Controller Staffing Process, report number GAO/RCED-97-84, April,Government Printing Office, Washington DC.
U.S. General Accounting Office (1997), National Airspace System: Issues in AllocatingCosts for Air Traffic Services to DoD and Other Users, report numberGAO/RCED-97-106, April, Government Printing Office, Washington DC.
U.S. National Aeronautics and Space Administration (1996), Advanced AirTransportation Technology Program, Non-Advocate Review, November 6-7,Ames Research Center, Moffett Field, California.
U.S. National Aeronautics and Space Administration (1996), Transportation Beyond2000: Technologies Needed for Engineering Design, proceedings of a workshopheld Sept. 26-28, 1995 at Langley Research Center, Hampton, Virginia, publishedFebruary 1996, Conference Publication 10184 pt. 1.
Warren, A.W. and Schwab, R.W. (1997), “A Methodology and Initial Results SpecifyingRequirements for Free Flight Transitions”, Air Traffic Control Quarterly,forthcoming.
Warren, A.W. (1996), Conflict Probe Concepts Analysis in Support of Free Flight,NASA Contractor Report 201623, December.
135
Warren, A.W. (1994), “A New Methodology for Medium Term Conflict Detection andSystem Implications”, Proceedings of the 1994 Air Traffic Control AssociationConference, September, Arlington, Virginia.
Weber, M. et al (1991), “Weather Information Requirements for Terminal Air TrafficControl Automation”, Fourth Int’l Conference on Aviation Weather, AmericanMeteorological Society, Paris, June 24-28.
WEFA Group (1997), World Economic Outlook: 20 Year Extension.White House Commission on Aviation Safety and Security (1997), Final Report, February
17, Washington DC.Wickens, C.D. et al, editors (1997), Flight to the Future: Human Factors in Air Traffic
Control, sponsored by the National Research Council, published by NationalAcademy Press, Washington DC.
Wilczak, J.M., et al(1995), “Contamination of Wind Profiler Data by Migrating Birds:Characteristics of Corrupted Data and Potential Solutions”, J. Atmos. Ocean.Tech. 12:449-467.
136
Appendix A. Technology Inventory
A.1 Communication
The communication technology elements are shown in Tables A-1 through A-3. Asdescribed in the body of this report, communication technology can be described as threelayers. Each lower layer provides certain communication services to the next layer aboveit. The top, application, layer presents communication services to the flight crew or airtraffic controller through a set of control and display interfaces and by accessing andservicing data bases hosted in the aircraft and controller workstation automation.
Table A-1 describes the applications which use communication paths to perform theirfunction. Table A-2 describes the communication protocols which operate over thecommunication media and provide communication transport services to thecommunication applications. Table A-3 describes the communication media whichconnect the aircraft to the ground to support the communication functions.
Table A-1, Communication Applications, presents each application and describes keycharacteristics about that application. The input column identifies the protocol technologywhich is appropriate for that particular application. The output column identifies the userof the communication service. The column marked “performance” describes the userexpectations of performance currently associated with this particular application and itsunderlying protocol and medium. Greater performance may be required in the future tosupport more critical functions (e.g., en route, terminal and ground operations.) Theavailability column describes when the technology and its underlying protocol and mediumsupport is, or will be, available.
Table A-2, Communication Protocols, presents each protocol and describes keycharacteristics about that protocol. The input column identifies the medium or otherprotocol element that supports it. The output column identifies the application or otherprotocol which uses the services provided by the protocol element. Note that ATN andFANS-1 require certain mutually-supporting protocol elements, which are described inSection 5.1 of the body of this document. The performance column identifies theperformance contribution or reduction which the protocol adds to the communicationpath.
Table A-3, Communication Media, presents each radio or other medium which has beenused for aircraft/ground communication. Since the media represent the bottom of thecommunication stack they do not have inputs but the column was retained for consistency.The output column identifies the protocol elements which use the services of the medium.There is a subnetwork protocol associated with all of the data link related media, inaddition to the protocol described in Table A-2. The performance column describes whenthe medium is, or will be, available.
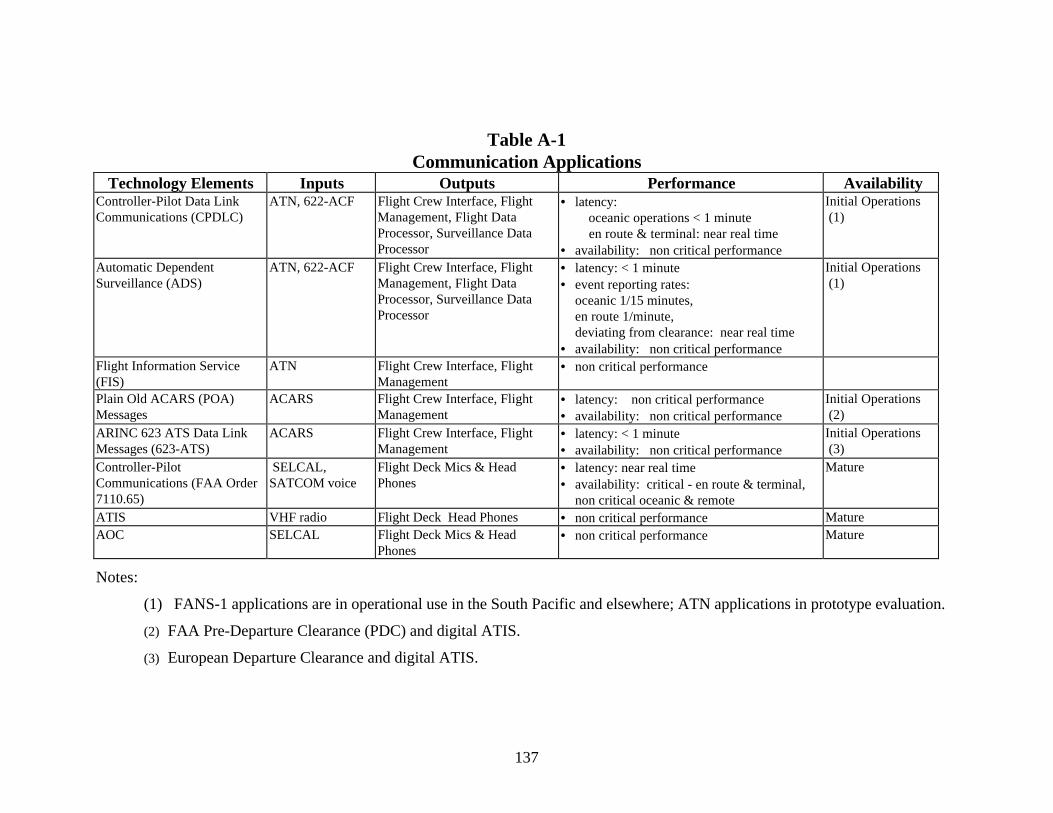
137
Table A-1Communication Applications
Technology Elements Inputs Outputs Performance AvailabilityController-Pilot Data LinkCommunications (CPDLC)
ATN, 622-ACF Flight Crew Interface, FlightManagement, Flight DataProcessor, Surveillance DataProcessor
• latency: oceanic operations < 1 minute en route & terminal: near real time
• availability: non critical performance
Initial Operations (1)
Automatic DependentSurveillance (ADS)
ATN, 622-ACF Flight Crew Interface, FlightManagement, Flight DataProcessor, Surveillance DataProcessor
• latency: < 1 minute• event reporting rates:
oceanic 1/15 minutes,en route 1/minute,deviating from clearance: near real time
• availability: non critical performance
Initial Operations (1)
Flight Information Service(FIS)
ATN Flight Crew Interface, FlightManagement
• non critical performance
Plain Old ACARS (POA)Messages
ACARS Flight Crew Interface, FlightManagement
• latency: non critical performance• availability: non critical performance
Initial Operations (2)
ARINC 623 ATS Data LinkMessages (623-ATS)
ACARS Flight Crew Interface, FlightManagement
• latency: < 1 minute• availability: non critical performance
Initial Operations (3)
Controller-PilotCommunications (FAA Order7110.65)
SELCAL,SATCOM voice
Flight Deck Mics & HeadPhones
• latency: near real time• availability: critical - en route & terminal,
non critical oceanic & remote
Mature
ATIS VHF radio Flight Deck Head Phones • non critical performance MatureAOC SELCAL Flight Deck Mics & Head
Phones• non critical performance Mature
Notes:
(1) FANS-1 applications are in operational use in the South Pacific and elsewhere; ATN applications in prototype evaluation.
(2) FAA Pre-Departure Clearance (PDC) and digital ATIS.
(3) European Departure Clearance and digital ATIS.
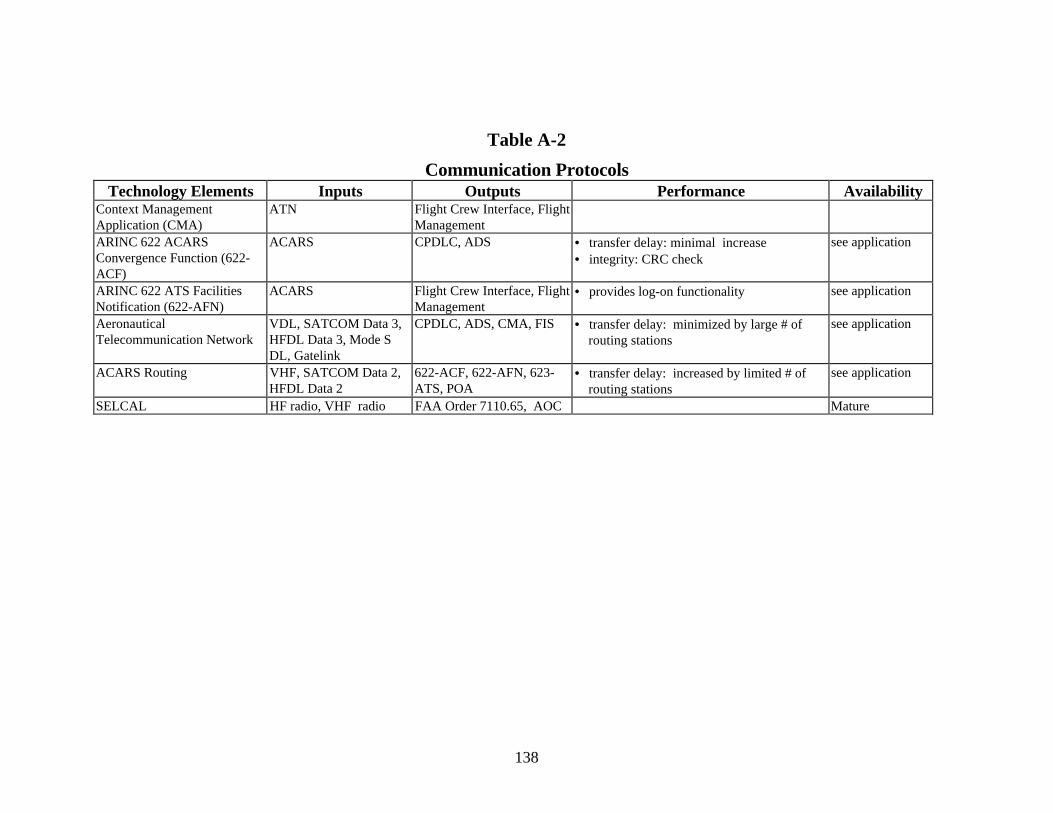
138
Table A-2
Communication ProtocolsTechnology Elements Inputs Outputs Performance Availability
Context ManagementApplication (CMA)
ATN Flight Crew Interface, FlightManagement
ARINC 622 ACARSConvergence Function (622-ACF)
ACARS CPDLC, ADS • transfer delay: minimal increase• integrity: CRC check
see application
ARINC 622 ATS FacilitiesNotification (622-AFN)
ACARS Flight Crew Interface, FlightManagement
• provides log-on functionality see application
AeronauticalTelecommunication Network
VDL, SATCOM Data 3,HFDL Data 3, Mode SDL, Gatelink
CPDLC, ADS, CMA, FIS • transfer delay: minimized by large # ofrouting stations
see application
ACARS Routing VHF, SATCOM Data 2,HFDL Data 2
622-ACF, 622-AFN, 623-ATS, POA
• transfer delay: increased by limited # ofrouting stations
see application
SELCAL HF radio, VHF radio FAA Order 7110.65, AOC Mature
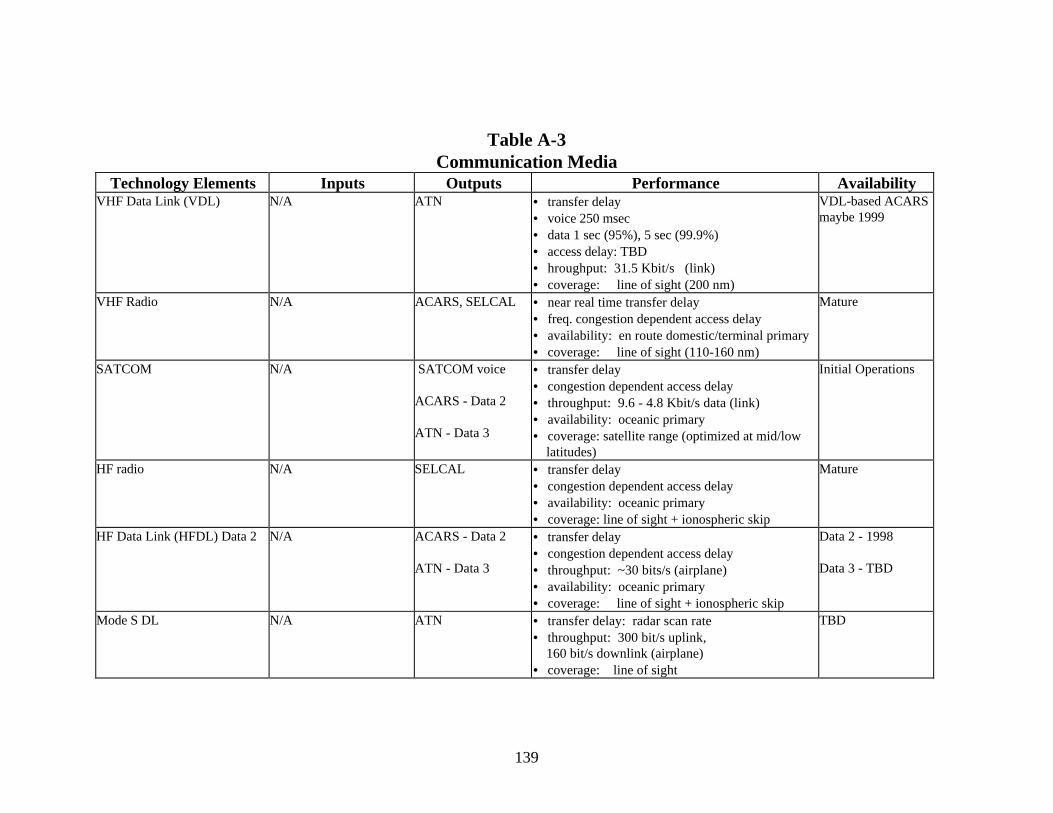
139
Table A-3Communication Media
Technology Elements Inputs Outputs Performance AvailabilityVHF Data Link (VDL) N/A ATN • transfer delay
• voice 250 msec• data 1 sec (95%), 5 sec (99.9%)• access delay: TBD• hroughput: 31.5 Kbit/s (link)• coverage: line of sight (200 nm)
VDL-based ACARSmaybe 1999
VHF Radio N/A ACARS, SELCAL • near real time transfer delay• freq. congestion dependent access delay• availability: en route domestic/terminal primary• coverage: line of sight (110-160 nm)
Mature
SATCOM N/A SATCOM voice
ACARS - Data 2
ATN - Data 3
• transfer delay• congestion dependent access delay• throughput: 9.6 - 4.8 Kbit/s data (link)• availability: oceanic primary• coverage: satellite range (optimized at mid/low
latitudes)
Initial Operations
HF radio N/A SELCAL • transfer delay• congestion dependent access delay• availability: oceanic primary• coverage: line of sight + ionospheric skip
Mature
HF Data Link (HFDL) Data 2 N/A ACARS - Data 2
ATN - Data 3
• transfer delay• congestion dependent access delay• throughput: ~30 bits/s (airplane)• availability: oceanic primary• coverage: line of sight + ionospheric skip
Data 2 - 1998
Data 3 - TBD
Mode S DL N/A ATN • transfer delay: radar scan rate• throughput: 300 bit/s uplink,
160 bit/s downlink (airplane)• coverage: line of sight
TBD

140
Gatelink N/A ATN • coverage: at the gate
141
A.2 Navigation
The navigation technology elements are shown in Tables A-4 and A-5. Like thecommunication elements, navigation can be described in layers. Sensors, described inTable A-4, provide service in the form of raw data to processors or directly to displays.Processors, described in Table A-5, in turn, manipulate the raw data and turn it into usefulinformation for displays and for control of aircraft. The controls and displays are veryaircraft-specific and therefore are not described here.
Table A-4, Navigation Sensors, lists the elements which sense either physical phenomenaabout the aircraft state or radio signals. They can, in, turn be used to determine aircraftstate. The output column describes the user of the raw data and a short list of theparameters which are available from this sensor. The performance column describesaccuracy, availability, area of coverage, and other key characteristics for each sensor. Theavailability column describes the state of development of the sensor technology.
Table A-5, Navigation Processors, describes some of the processors of navigation datatypically found on aircraft. The inputs column describes the data sources which theprocessor requires to performs its function. The outputs column describes the users of theinformation generated by the processor. Performance, as mentioned for all processors, isalmost entirely dependent on the quality of the raw data supplied to the processor. All ofthe processors identified are in current production and in use today. The navigation database, although identified here as a separate processor to better illustrate the functionality,is normally a subfunction of the navigation processor it supports.
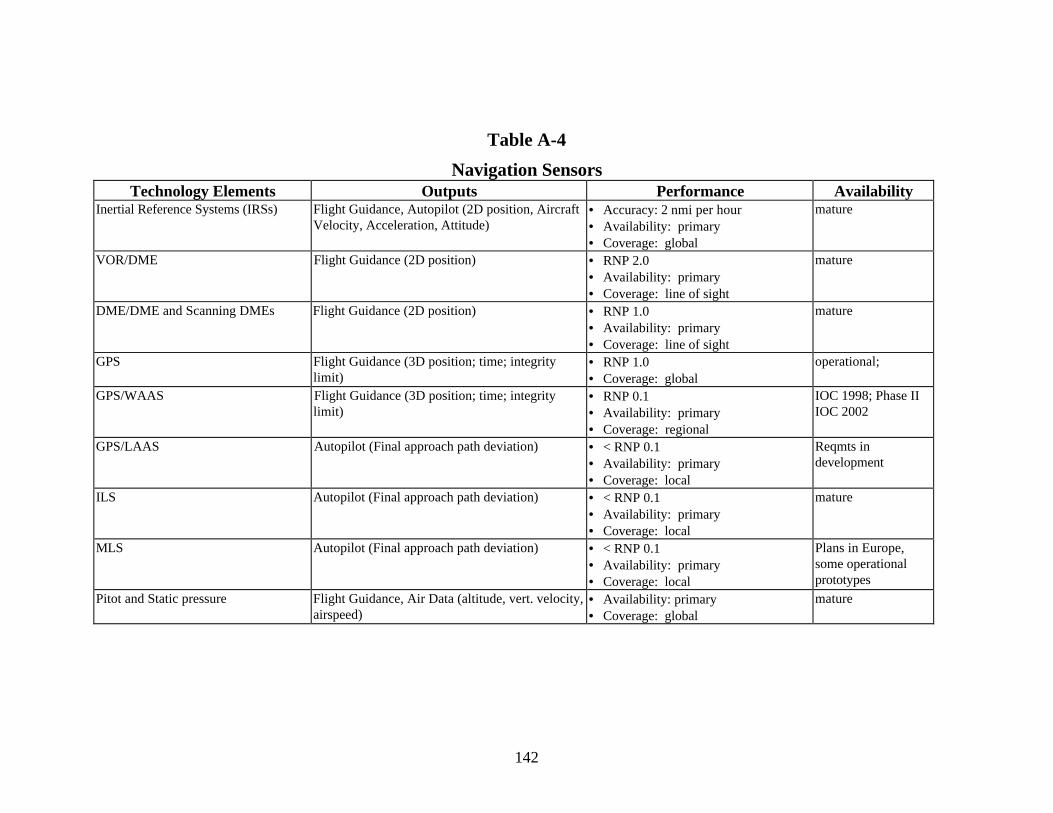
142
Table A-4
Navigation SensorsTechnology Elements Outputs Performance Availability
Inertial Reference Systems (IRSs) Flight Guidance, Autopilot (2D position, AircraftVelocity, Acceleration, Attitude)
• Accuracy: 2 nmi per hour• Availability: primary• Coverage: global
mature
VOR/DME Flight Guidance (2D position) • RNP 2.0• Availability: primary• Coverage: line of sight
mature
DME/DME and Scanning DMEs Flight Guidance (2D position) • RNP 1.0• Availability: primary• Coverage: line of sight
mature
GPS Flight Guidance (3D position; time; integritylimit)
• RNP 1.0• Coverage: global
operational;
GPS/WAAS Flight Guidance (3D position; time; integritylimit)
• RNP 0.1• Availability: primary• Coverage: regional
IOC 1998; Phase IIIOC 2002
GPS/LAAS Autopilot (Final approach path deviation) • < RNP 0.1• Availability: primary• Coverage: local
Reqmts indevelopment
ILS Autopilot (Final approach path deviation) • < RNP 0.1• Availability: primary• Coverage: local
mature
MLS Autopilot (Final approach path deviation) • < RNP 0.1• Availability: primary• Coverage: local
Plans in Europe,some operationalprototypes
Pitot and Static pressure Flight Guidance, Air Data (altitude, vert. velocity,airspeed)
• Availability: primary• Coverage: global
mature
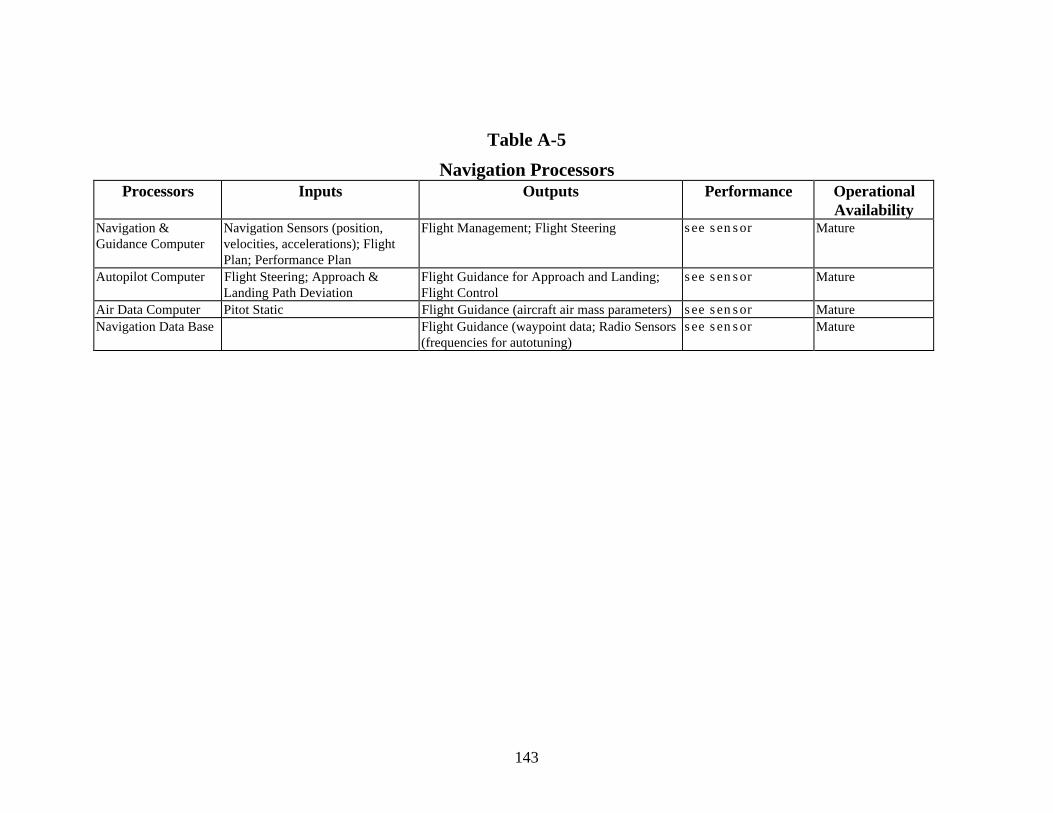
143
Table A-5
Navigation ProcessorsProcessors Inputs Outputs Performance Operational
AvailabilityNavigation &Guidance Computer
Navigation Sensors (position,velocities, accelerations); FlightPlan; Performance Plan
Flight Management; Flight Steering see sensor Mature
Autopilot Computer Flight Steering; Approach &Landing Path Deviation
Flight Guidance for Approach and Landing;Flight Control
see sensor Mature
Air Data Computer Pitot Static Flight Guidance (aircraft air mass parameters)see sensor MatureNavigation Data Base Flight Guidance (waypoint data; Radio Sensors
(frequencies for autotuning)see sensor Mature
144
A.3 Surveillance Inventory
The surveillance system elements which are in place or proposed for the 2000-2015 timeperiod are summarized in Table A-6. There are a total of 12 rows which describe themajor systems comprising air-ground, air-air, and oceanic surveillance. The columns inthe table name the various surveillance elements and give a number of details onperformance characteristics and system availability. The table includes all the systems thatare currently deployed or proposed for regional deployment in future architecture plans,and those which could be available in the time frame of interest to implement futureCNS/ATM systems.
Rows 1 and 2 in Table A-6 summarize the characteristics of current and emerging radartechnologies for air-ground surveillance. The specific systems in these rows, e.g. ASR-9,are NAS deployed radars. The newest proposed radars shown are the ASR-11 primaryradar, the European Mode-S radar (POEMS) which features Downlink of AircraftParameters (DAP) at each scan cycle, and the ATCBI-6 which is a monopulse SSR withselective interrogation capability (Partial Mode-S capability).
Rows 3, 4, 5, and 6 are surveillance elements that describe various concepts forprocessing and distributing surveillance data. The current generation systems embed theRadar Data Processor (RDP) as a major element of current generation ATC automation.The Surveillance Distribution Network (SDN) is a concept for networking terminal and enroute radars to ATC centers and other sensors such as ADS and ADS-B systems. In thecore areas in Europe this concept has been implemented using common surveillancedistribution protocols and appropriate ground based communication networks. The SDNneeds to be paired with appropriate Surveillance Data Processor (SDP) software which isintended to blend multi-sensor inputs into common aircraft track files, i.e. the RDP incurrent systems will probably be replaced in the NAS system with SDN and SDP systems.Finally, the Surveillance Server System (SSS) is an advanced version of SDN and SDPwhich distributes multi-sensor processed track files to any ATC, military, or other users oftrack file data. This system will allow smaller airports and aircraft dispatch operations tohave access to the most current and accurate aircraft state information.
Row 7 describes the current TCAS system for collision avoidance. Although there isresearch and standards development continuing beyond the capabilities shown here, thereare no specific regional plans or commitments to develop TCAS beyond version 7 at thistime, although this is feasible in the time frame of interest. A likely successor to TCAS IIwould be a system using Mode-S extended squitters and Mode-S interrogationcapabilities.
Row 8 in Table A-6 describes Contract ADS. This type of sensor is primarily oriented foroceanic and remote area - non-radar airspace. Many undeveloped areas are consideringthe use of ADS surveillance as a lower cost alternative to traditional radar surveillance.
Rows 9 and 10 in Table A-6 describe ADS-Broadcast sensors for airborne surveillanceand ADS-B listening stations for air-ground reception and distribution of ADS-B data toground facilities. The two primary systems proposed for ADS-B implementation in thistime frame are the Mode-S extended squitter and the STDMA system which is being
145
standardized as VDL Mode-4. Both systems will require ground stations for air-groundsurveillance, and are being considered for reduced cost air-ground surveillance and for air-air applications such as collision avoidance and Cockpit Display of Traffic Information(CDTI).
Row 11 in Table A-6 describes Mode-S Services. This sensor is a potential domestic formof ADS that would use interrogation by the Mode-S radars to downlink surveillance datasuch as aircraft position and velocity states and intent information. Mode-S Services iscomplementary to extended squitter based ADS-B and is considered to be a transitionalsystem between the current radar systems and a fully integrated radar/ADS-B surveillancesystem.
Row 12 in Table A-6 describes Traffic Information Services (TIS) or TIS broadcast. Thisis the concept of transmitting ground based track information to equipped aircraft forproviding air-air surveillance on nearby aircraft. This type of service can be implementedusing the Mode-S interrogation band, or using another communication system such asVDL Mode-4. This service is intended as a lower cost means of surveillance than TCASsystems, and as a transitional or backup service to using ADS-B for air-air surveillance.
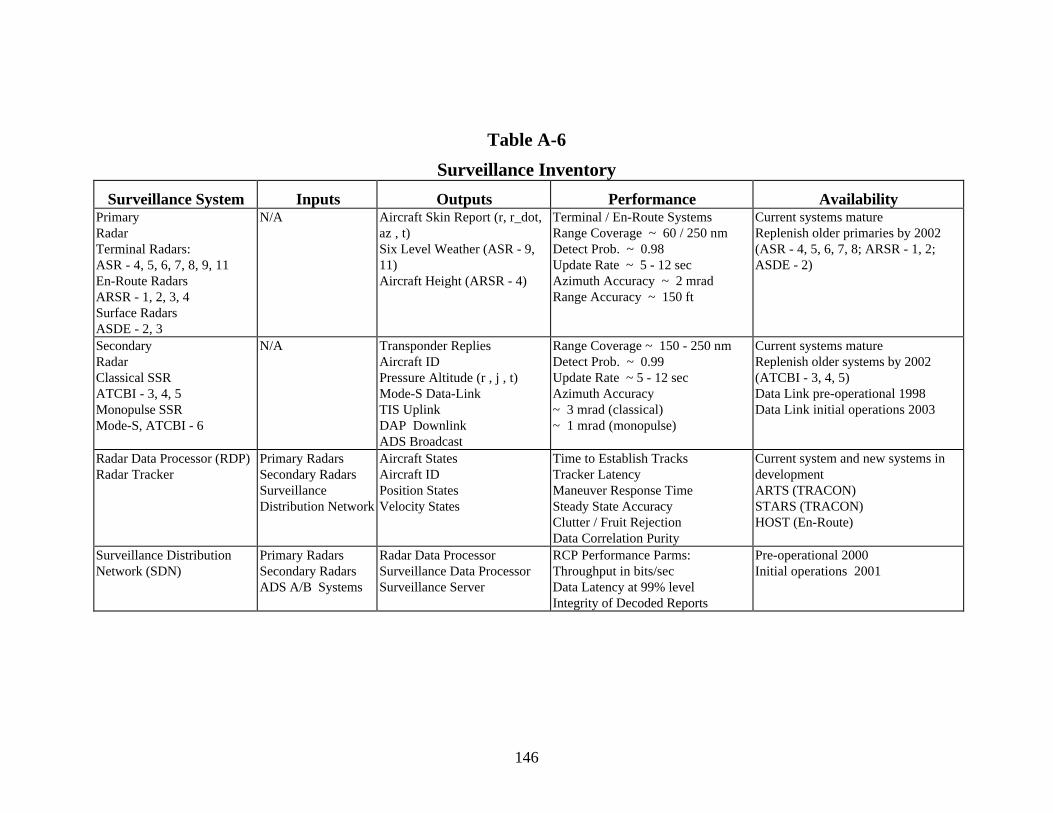
146
Table A-6
Surveillance Inventory
Surveillance System Inputs Outputs Performance AvailabilityPrimaryRadarTerminal Radars:ASR - 4, 5, 6, 7, 8, 9, 11En-Route RadarsARSR - 1, 2, 3, 4Surface RadarsASDE - 2, 3
N/A Aircraft Skin Report (r, r_dot,az , t)Six Level Weather (ASR - 9,11)Aircraft Height (ARSR - 4)
Terminal / En-Route Systems Range Coverage ~ 60 / 250 nmDetect Prob. ~ 0.98Update Rate ~ 5 - 12 secAzimuth Accuracy ~ 2 mradRange Accuracy ~ 150 ft
Current systems matureReplenish older primaries by 2002(ASR - 4, 5, 6, 7, 8; ARSR - 1, 2;ASDE - 2)
SecondaryRadarClassical SSRATCBI - 3, 4, 5Monopulse SSRMode-S, ATCBI - 6
N/A Transponder RepliesAircraft IDPressure Altitude (r , j , t)Mode-S Data-LinkTIS UplinkDAP DownlinkADS Broadcast
Range Coverage ~ 150 - 250 nmDetect Prob. ~ 0.99Update Rate ~ 5 - 12 secAzimuth Accuracy~ 3 mrad (classical)~ 1 mrad (monopulse)
Current systems matureReplenish older systems by 2002(ATCBI - 3, 4, 5)Data Link pre-operational 1998Data Link initial operations 2003
Radar Data Processor (RDP)Radar Tracker
Primary RadarsSecondary RadarsSurveillanceDistribution Network
Aircraft StatesAircraft IDPosition StatesVelocity States
Time to Establish TracksTracker LatencyManeuver Response TimeSteady State AccuracyClutter / Fruit RejectionData Correlation Purity
Current system and new systems indevelopmentARTS (TRACON)STARS (TRACON)HOST (En-Route)
Surveillance DistributionNetwork (SDN)
Primary RadarsSecondary RadarsADS A/B Systems
Radar Data ProcessorSurveillance Data ProcessorSurveillance Server
RCP Performance Parms:Throughput in bits/secData Latency at 99% levelIntegrity of Decoded Reports
Pre-operational 2000Initial operations 2001
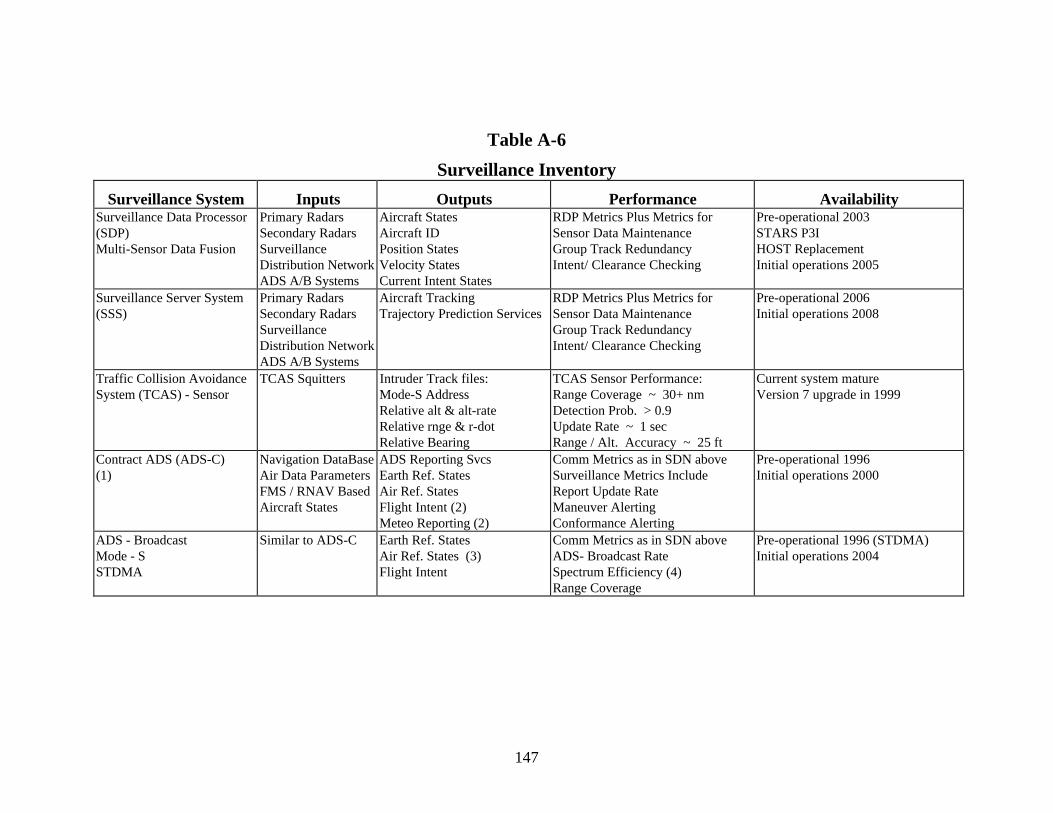
147
Table A-6
Surveillance Inventory
Surveillance System Inputs Outputs Performance AvailabilitySurveillance Data Processor(SDP)Multi-Sensor Data Fusion
Primary RadarsSecondary RadarsSurveillanceDistribution NetworkADS A/B Systems
Aircraft StatesAircraft IDPosition StatesVelocity StatesCurrent Intent States
RDP Metrics Plus Metrics forSensor Data MaintenanceGroup Track RedundancyIntent/ Clearance Checking
Pre-operational 2003STARS P3IHOST ReplacementInitial operations 2005
Surveillance Server System(SSS)
Primary RadarsSecondary RadarsSurveillanceDistribution NetworkADS A/B Systems
Aircraft TrackingTrajectory Prediction Services
RDP Metrics Plus Metrics forSensor Data MaintenanceGroup Track RedundancyIntent/ Clearance Checking
Pre-operational 2006Initial operations 2008
Traffic Collision AvoidanceSystem (TCAS) - Sensor
TCAS Squitters Intruder Track files:Mode-S AddressRelative alt & alt-rateRelative rnge & r-dotRelative Bearing
TCAS Sensor Performance:Range Coverage ~ 30+ nmDetection Prob. > 0.9Update Rate ~ 1 secRange / Alt. Accuracy ~ 25 ft
Current system matureVersion 7 upgrade in 1999
Contract ADS (ADS-C)(1)
Navigation DataBaseAir Data ParametersFMS / RNAV BasedAircraft States
ADS Reporting SvcsEarth Ref. StatesAir Ref. StatesFlight Intent (2)Meteo Reporting (2)
Comm Metrics as in SDN aboveSurveillance Metrics IncludeReport Update RateManeuver AlertingConformance Alerting
Pre-operational 1996Initial operations 2000
ADS - BroadcastMode - SSTDMA
Similar to ADS-C Earth Ref. StatesAir Ref. States (3)Flight Intent
Comm Metrics as in SDN aboveADS- Broadcast RateSpectrum Efficiency (4)Range Coverage
Pre-operational 1996 (STDMA)Initial operations 2004
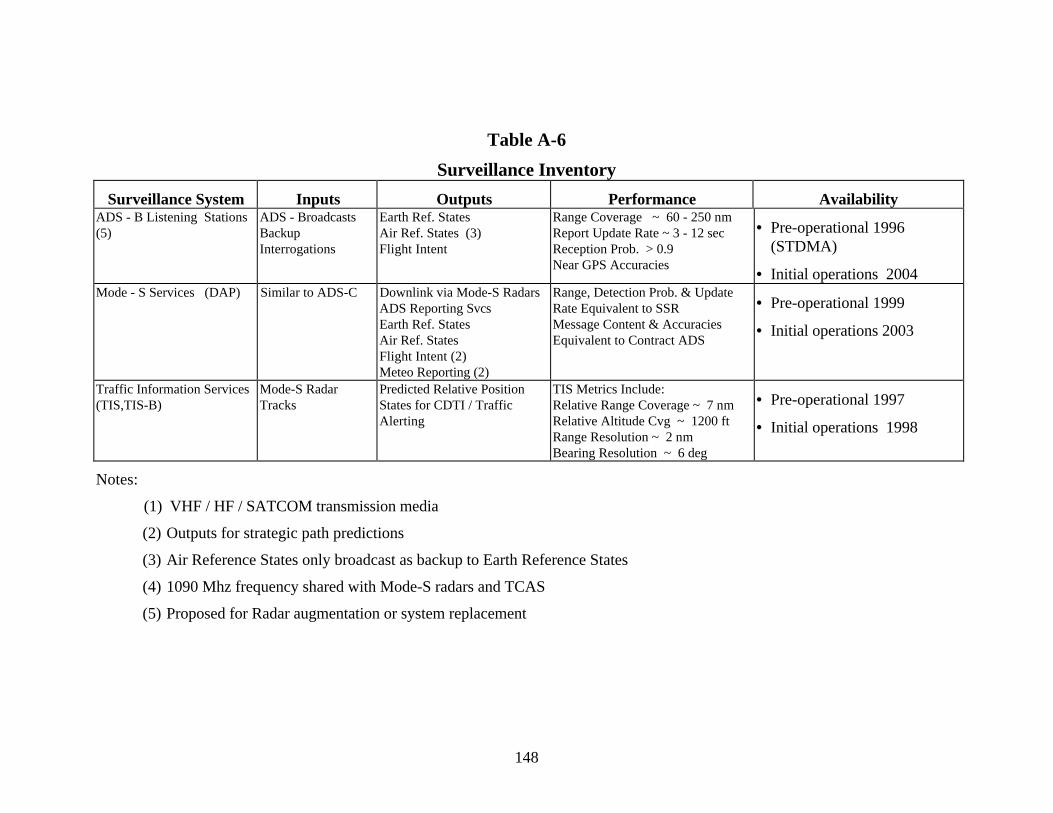
148
Table A-6
Surveillance Inventory
Surveillance System Inputs Outputs Performance AvailabilityADS - B Listening Stations(5)
ADS - BroadcastsBackupInterrogations
Earth Ref. StatesAir Ref. States (3)Flight Intent
Range Coverage ~ 60 - 250 nmReport Update Rate ~ 3 - 12 secReception Prob. > 0.9Near GPS Accuracies
• Pre-operational 1996(STDMA)
• Initial operations 2004Mode - S Services (DAP) Similar to ADS-C Downlink via Mode-S Radars
ADS Reporting SvcsEarth Ref. StatesAir Ref. StatesFlight Intent (2)Meteo Reporting (2)
Range, Detection Prob. & UpdateRate Equivalent to SSRMessage Content & AccuraciesEquivalent to Contract ADS
• Pre-operational 1999
• Initial operations 2003
Traffic Information Services(TIS,TIS-B)
Mode-S RadarTracks
Predicted Relative PositionStates for CDTI / TrafficAlerting
TIS Metrics Include:Relative Range Coverage ~ 7 nmRelative Altitude Cvg ~ 1200 ftRange Resolution ~ 2 nmBearing Resolution ~ 6 deg
• Pre-operational 1997
• Initial operations 1998
Notes:
(1) VHF / HF / SATCOM transmission media
(2) Outputs for strategic path predictions
(3) Air Reference States only broadcast as backup to Earth Reference States
(4) 1090 Mhz frequency shared with Mode-S radars and TCAS
(5) Proposed for Radar augmentation or system replacement
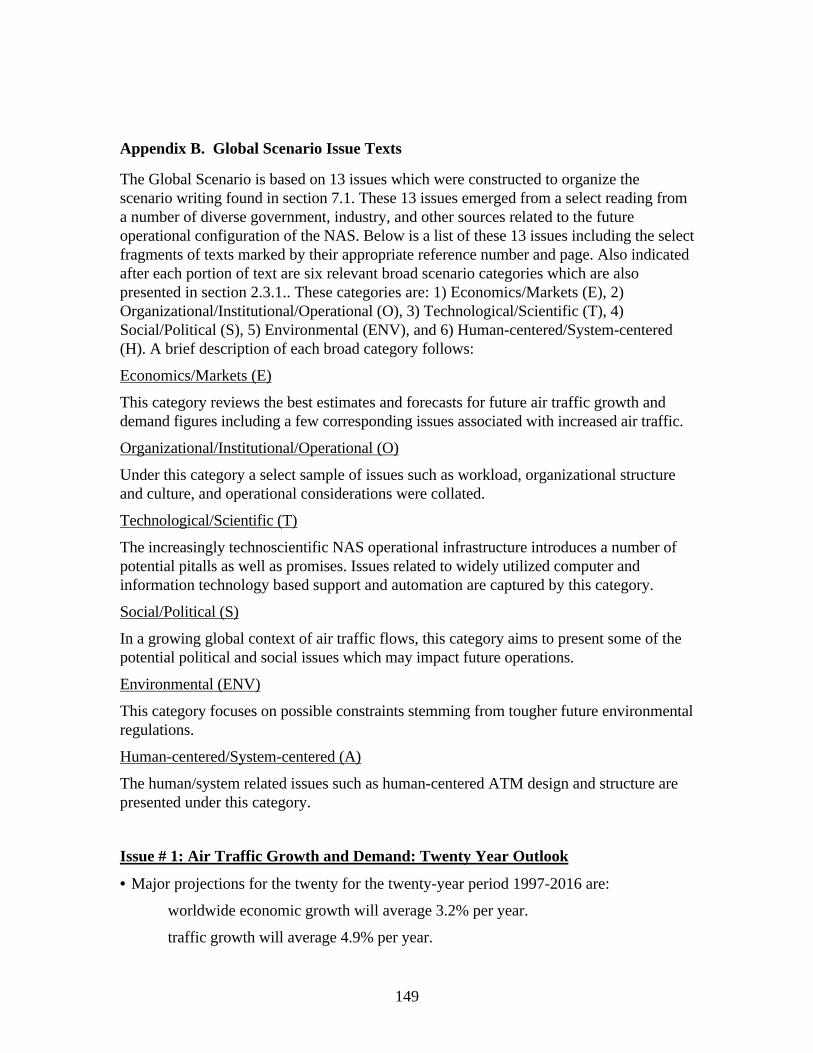
149
Appendix B. Global Scenario Issue Texts
The Global Scenario is based on 13 issues which were constructed to organize thescenario writing found in section 7.1. These 13 issues emerged from a select reading froma number of diverse government, industry, and other sources related to the futureoperational configuration of the NAS. Below is a list of these 13 issues including the selectfragments of texts marked by their appropriate reference number and page. Also indicatedafter each portion of text are six relevant broad scenario categories which are alsopresented in section 2.3.1.. These categories are: 1) Economics/Markets (E), 2)Organizational/Institutional/Operational (O), 3) Technological/Scientific (T), 4)Social/Political (S), 5) Environmental (ENV), and 6) Human-centered/System-centered(H). A brief description of each broad category follows:
Economics/Markets (E)
This category reviews the best estimates and forecasts for future air traffic growth anddemand figures including a few corresponding issues associated with increased air traffic.
Organizational/Institutional/Operational (O)
Under this category a select sample of issues such as workload, organizational structureand culture, and operational considerations were collated.
Technological/Scientific (T)
The increasingly technoscientific NAS operational infrastructure introduces a number ofpotential pitalls as well as promises. Issues related to widely utilized computer andinformation technology based support and automation are captured by this category.
Social/Political (S)
In a growing global context of air traffic flows, this category aims to present some of thepotential political and social issues which may impact future operations.
Environmental (ENV)
This category focuses on possible constraints stemming from tougher future environmentalregulations.
Human-centered/System-centered (A)
The human/system related issues such as human-centered ATM design and structure arepresented under this category.
Issue # 1: Air Traffic Growth and Demand: Twenty Year Outlook
• Major projections for the twenty for the twenty-year period 1997-2016 are:
worldwide economic growth will average 3.2% per year.
traffic growth will average 4.9% per year.
150
cargo traffic will average 6.6% per year.
The world fleet will be 23,600 passenger and cargo jets in 2016.
The composition of the world fleet in 2016 will be:
69.1% single-aisle airplane.
23.5% intermediate-size airplanes.
7.4% 747-size or larger airplanes.
The total market potential for new commercial airplanes over the next twenty years is16,160 airplanes, or an equivalent $1.1 trillion in 1996 us dollrs.
Airlines will take delivery of:
11,260 single-aisle airplanes.
3720 intermediate-size airplanes.
1180 747-size or larger airplanes. [Ref. 15, page 3] (E)
• Cooperative strategies, such as code sharing, concentrate traffic by serving thecustomers of two airlines on a single airplane departure. Partners in the alliance can benefitby accommodating the demand for frequency while enjoying the cost advantage of fewerflights. However, cooperative strategies can also let airlines concentrate their traffic atboth ends of a city pair that would not warrant nonstop service by either airline alone. Thisdiverts traffic from existing pairs, increasing regional frequencies overall. Even in the samecity pair, alliances can increase competition. Large international markets where airlinescombine services are usually opened to additional competition as a prerequisite to thealliance being permitted. Thus, traffic may actually end up divided among morecompetitors or even competing alliances. [Ref. 15, page 25] (S), (E)
• Activity in the combined FAA and contract towered airports is projected to grow from61.8 million operations in 1996 to 72.3 million in 2008, and increase of 1.3% annually.The majority of this growth is expected to be the result of increased commercial aircraftactivity, which is forecast to increase from 24.0 million operations in 1996 to 31.5 millionin 2008, and increase of 2.3% annually. [Ref. 14, page I-14] (E)
• The workload of the air route traffic control centers is forecast to increase at an averageannual rate of 1.8% during the 12-year forecast period. in 2008, FAA en-route centers areexpected to handle 50.2 million IFR aircraft, up from 40.3 million in 1996. [Ref. 14, pageI-14] (O)
• U.S. commercial air carriers flew an estimated total of 12.3 million hours in 1996, upfrom 12.0 million hours in 1995. Two aircraft categories for over three-fourths of totalairborne hours: two-engine narrowbody aircraft (65.2%) and three-engine narrowbody(12.0%). In 2008, the number of hours is forecast to increase to 19.3 million, an averageannual increase of 3.8%. airborne hours are forecast to increase 2.8% in 1997 to 12.7million, and 2.7% in 1998, to 13.0 million. [Ref. 14, page III-43] (E), (O)
151
Issue # 2: Some Limitations of Future Air Traffic Management and Concepts
• Capacity constraints in free flight systems will be restricted by runway operating time.with the aircraft and runways in place today, it is conceivably possible to land or takeoff at55 second intervals from a single runway. However, this is constrained by procedures thatat most airports, limit an arrival or departure to an interval of 90 to 120 seconds causing asignificant portion of the runway resource to be wasted. [Ref. 9, page 2-117] (O)
• For automation to be effective and satisfy minimum safety standards, it must meet theneeds of all system users. Flight crews have always benefited from HF attention, whilemuch less consideration has been given to HF aspects of ATC. With increased automation,routine functions change from controlling to monitoring the systems. This alters thedemands placed on the controller. Monitoring is not the best function for most humansbecause it tends to become monotonous and boring which leads to difficulties maintainingan adequate state of alertness and awareness. [Ref. 9, page 3-18] (T), (O), (H)
• The issue of national and regional security is of fundamental concern to the design ofeffective dual-use airspace and to policies and procedures that will permit the smooth andinstantaneous subjugation of airspace to the military in case of a national security threat.satellite CNS poses some unique and challenging issues to ATC/ATM planners in thisregard. While it has been determined that surveillance is accurately performed by satellitenavigation augmented by ADS, it is not reasonable to assume that hostile aircraft willcooperate. Some form of radar surveillance will be required and will be present in themodernized ATC/ATM environment of the developed or developing country. Duringpeace time, the issue of special use airspace for training or exclusion zone purposes willalso complicate matters. [Ref. 9, page 2-134] (S), (T)
• The hundreds of billions of dollars needed for all categories of infrastructure includingATC/ATM systems, airports, and feeder roads will compete largely in capital markets withfunds required for new aircraft. If government is a financial contributor to thesemodernizations, lengthy delays can be expected, as most governments, LDCs or DCs, arecash strapped...the most likely scenario unfolding will be the corporatization orprivatization of much of the ATC/ATM infrastructure. Government backed bond fundingcan occur in a cycle tied to needs, as opposed to political agendas. [Ref. 9, page 2-29] (E)
• Internationally, several ICAO member states have been vocal in their reluctance toaccept a GPS-based satellite navigation system, primarily because GPS is U.S.-ownedsystem currently managed by the DOD. The international community has repeatedlyexpressed concern that the United States may unilaterally decode to intentionally degradethe current GPS-SPS accuracy or “dither” the SA signal at such a high rate so as topreclude adequate precision guidance. This issue takes on additional significance whenmember states begin to maintain transportation infrastructures that rely completely onsatellite-based navigation. From a European perspective, this apprehension hasunderstandably diminished a willingness to implement a GPS-based satellite navigationsystem for critical safety and life operations. [Ref. 9, page 3-94-95] (S), (T)
• Although ATC is in principal an exercise in safety, it is also a means by which states cancontrol the sovereignty of their airspace as well as access to their economies. In recent

152
years, air transport authorities have become increasingly concerned about the interestshown by anti-trust and competition law authorities in the regulation of international airtransport. The establishment of unified regional economic markets has also invokedconcerns about possible adverse effects on the national airlines of non-participating states.[Ref., page 2-135] (S), (E)
Issue # 3: Changing International Relationships
• Conscious of the pressures for change, ICAO held a major worldwide air transportconference in Montreal from November 23 to 6 December 1994...attended by more than800 delegates from 137 ICAO contracting states and from close to 50 interestedinternational and national aviation organizations, the conference was the biggest and mostimportant international aviation meeting for 50 years...the most significant decisionemerging was on the controversial issue of multilateralism versus bilateralism. Themeeting accepted that those two concepts ‘can and do co-exist, and can eachaccommodate different approaches to international air transport regulation’. But it alsoaffirmed that ‘in view of the disparities in economic and competitive situations there is noprospect in the near future for a global multilateral agreement in the exchange of trafficrights’. [Ref. 4, page 47-49] (S), (E)
• Sub-issues include:
Market Access: It was agreed that full global market access (‘open skies’) is notfeasible at this time, but the meeting supported the principle of ‘gradual,progressive, orderly and safeguarded change’, with preferential treatment fordeveloping nations [Ref. 4, page 50]. (E)
Slot Allocations: Despite many criticisms, the existing voluntary airline system ofslot allocations was recognised as the only tried and tested system offering theassurance of efficient utilisation of the limited resources available: until a bettersystem can be devised internationally, it seems likely to remain in operation, butICAO will continue to study the situation closely [Ref. 4, page 50]. (O), (E)
Airline Ownership and Control: For 50 years the industry has lived with the rulethat a country’s airlines must be owned or effectively controlled by interests basedin that country: there are pressures for this to be changed, so as to allow increasedforeign investment, but this will in turn raise questions concerning sovereignty andinternational traffic rights. there was no consensus on this topic at the meeting, butit was agreed that ICAO should study the situation, with a view of finding ways ofbroadening the present criteria [Ref. 4, page 50]. (E), (S)
Taxation: With over 900 different taxes worldwide imposed on the industry, theburden runs into many millions of dollars annually and is increasing, with theindustry now regarded by governments as a ‘cash cow’ for revenues unrelated to

153
aviation. it was agreed that ICAO’s existing policies on seeking exemption,reduction and elimination of taxes on international air transport be continued. [Ref.4, page 51] (S), (E)
Aero-Political Pressures: ...the multilateral/bilateral traffic rights debate,especially where ‘fifth freedom’ is concerned...seems most likely to dominate aero-political affairs...it is pointed out that where the U.S. is involved, many countries inthe region (Asia-Pacific) feel they have had an unfair deal ...described as‘inequitable and antiquated bilaterals’, which has led to ‘damaging disputes’ withsuch countries as Australia, Japan and Thailand, disrupting trade and travel.Singapore feels that its own liberal attitude-‘Singapore’s skies are open to all U.S.carriers’-is not fully reciprocated by the Americans....it is felt that the U.S. nowenjoys an unacceptable level of ‘fifth-freedom traffic’ which accounts for some40% of the total air traffic in the Asia-Pacific region. [Ref. 4, page 79-80] (S),(E)
Issue # 4: FAA Funding Reform
• Although the FAA’s budget grew significantly in the 1980’s, the years of growth in FAAfunding appear unlikely to continue...the FAA’s budget has been cut by $600 million overthe last few years. The FAA also has substantially reduced the number of employees andeliminated many technology programs...funding for FAA is expected to continue todecline in the foreseeable future because of spending reductions in transportationprograms proposed in the recent balanced budget resolution...because of efforts to balancethe federal budget, future funding will fall far short of what the FAA will need to provideeven the current level of services, and drastic cuts in services will need to be made if newrevenue is not found. The administration...projects an aggregate $12 billion shortfall inFAA funding over the time period from fiscal year 1997 to fiscal year 2002. This projectedshortfall represents the difference between FAA’s stated need of $59 billion during thatperiod and an estimated budget cap of $47 billion...the year-to-year appropriations processmakes it difficult for the FAA to operate under a long-term capital investment plan. Thisleads to reactive, near-term investment decisions by the FAA based on an artificiallyimposed federal budget process, rather than on the basis of need or sound businessdecisions. [Ref. 7, page 9] (O), (E)
Issue # 5: Environmental Considerations
• ...the impact of world air transport on the environment has been far less severe thanother modes of transportation in energy consumption, emissions, global warming, landuse, and noise. However, tougher standards are being proposed. IATA has argued...thatsuch new requirements would affect the development of new aircraft, which are currentlyin their earliest conceptual stages, already appear to offer the prospect of substantialenvironmental benefits in terms of fuel and emissions efficiency, but if tougher new
154
standards are introduced the expense involved could well make the development of suchaircraft impossible...IATA assessed the loss in fleet resale value as a result of introducingany such new constraints at as much as $5bn to $10bn. [Ref. 4, page 161-162] (ENV),(S)
• A European-sponsored committee declared that ‘eliminating aircraft congestion in theair and on the ground is by far the most efficient way to reduce the impact of air transporton the environment. It can and must be achieved as a matter of absolute priority.’Moreover...the aerospace industry lobby is particularly concerned to insure that ICAO ismade well aware of the technical problems for the aerospace manufacturers which wouldresult from the recommendation of new (and more stringent) environmental regulationsfor the aviation community. [Ref. 4, page 162] (ENV), (S), (T)
Issue # 6: Air Travel and Alternatives
• ...a corporate air travel survey by IATA’s market and economic analysis division appearsto indicate that the impact...of various forms of innovative electronic communications hasbeen, and may well be in the future, less severe that some reports have suggested...muchof the growth of video-conferencing over the past few years seems to have been due moreto the effects of recession, with businessmen cutting travel costs, than to any improvementin business efficiency stemming from advanced electronic communications systems. [Ref.4, page 85-87] (T)
Issue # 7: GPS and Satellite-based Navigation Issues
• ...while optimistic, the international aviation community continues to express trepidationabout investing preferentially in a satellite-based system that is currently controlled andoperated by U.S. DOD. Consequently, much work has been conducted by theinternational community to develop and implement a GNSS, which may not include GPS.Potential GNSS architectures may include the Russian Glonass, yet-to-be developedprivate systems, or other satellite systems which may carry GNSS signals, such as thoseproposed by the IRIDIUM consortium and Inmarsat. [Ref. 9, page 3-49] (S), (T)
• There are a number of GPS (and other satellite systems) navigational error sourceswhich are being addressed by various government, industry, and academic institutions.These include: 1) Satellite Clock and Ephemeris errors, 2) Atmosperic related Ionosphereand Troposphere errors, 3) Receiver Errors such as Multipath, Oscillator, Tracking Delay,Noise, Filter Bias, 4) System Errors including Selective Availability and Geometry, andother sources. Although alternate mitigation schemes are being proposed that minimize theeffects of these potential GPS-based navigation errors, the uncertainties associated withsystem integrity and availability of satellite-based operations persist, in particular duringprecision approach and landing (> Cat II, III) phases of flight. [Ref. 9, page 3-53-58] (T),(O)
Issue # 8: ATC Systems Architecture
155
• IPT architecture efforts are limited and do not constitute an ATC-wide technicalarchitecture. [Ref. 5, page 40] (T)
• Heterogeneous communications protocol and data formats require expensive systeminterfaces. [Ref. 5, page 45] (T)
• Myriad of application languages makes maintenance more costly and difficult (softwareapplications associated with 54 operational ATC systems have been written in 53programming languages including 19 assembly languages). [Ref. 5, page 46] (T)
• Software maintenance is a significant FAA expense...the Host Computer System (HCS),its backup - the Enhanced Direct Access Radar Channel (EDARC) and PAMRI(Peripheral Adapter Module Replacement Item cost $63.6 million annually to maintain.[Ref. 5, page 47] (T)
• Until a software sub-architecture is developed that is based on systematic analysis of theneeds of current and planned operating environments and defines the languages to be usedin developing ATC systems, FAA will continue to experience language proliferation...[Ref. 5, page 47] (T)
• FAA...lacks an effective management structure for developing, maintenance, andenforcing a technical ATC systems architecture. no organization in FAA is responsible fortechnical ATC architecture...FAA has permitted a “hodge podge” of independent effortsscattered across its ATC modernization organization to emerge with no central guidanceand coordination. [Ref. 5, page 54] (T), (O)
Issue # 9: Ground Handling
The Visa Problem: although several countries outside the EU have reached bilateralagreements to dispense with visas, in many parts of the world they remain a vital elementof entry facilitation. there are no signs of any significant reduction in requirements in theyears ahead-if anything, in an unstable political world visa requirements will becomestricter, especially as measures to control illegal immigrants become tougher. [Ref. 4, page148] (O), (S)
Health Requirements: ...in some parts of the world, debilitating or even potentially fataldiseases are rife, and some which it had been thought had been eradicated, such assmallpox, are returning. as a result, some countries are toughening their healthrequirements-demanding, for example, to see certificates of vaccinations which in manyplaces have been ignored for years. It is thus incumbent upon every traveler to ensure thathis or her vaccinations and health documentation are in order. [Ref. 4, page 149] (S)
Inspections: ...IATA makes the point that complicated and outmoded inspections...negatethe inherent advantage of speed offered to the public by air transport...it cites oneexample...where ‘ departure delays during peak hours at a major airport by excessiveinspection controls cost the airlines in excess of $100,000 per day’. [Ref. 4, page 149](O), (E)
156
Other ground handling problems include: ‘off-airport’ check-in, baggage handling et al. allof these may produce delays and bottlenecks in the flow of air traffic. [Ref. 4, page 151-155] (E), (O)
Issue # 10: Airport Capacity
• The forecast for a 57 % increase in passenger enplanements between 1993 and 2005suggests that a major investment will be needed to expand terminals to accommodatemore passengers and larger aircraft...the increase in air carrier operations at medium hubswill be accommodated by scheduling more flights for off-peak periods, attracting a portionof general aviation activity to reliever airports, and developing new runways to increaseairfield capacity...a substantial increase in aircraft operations at a large hub airport maywarrant consideration of additional runways...the outlook for new runways at majororigin/destination airports is less promising...only 5 of 13 large hubs airports where morethan two-thirds of traffic is locally generated are actively considering new runways...theengineering and political obstacles to new runway construction at these airports isdaunting...airfield congestion at major origin/destination airports ...will continue to be oneof the most difficult issues facing civil aviation [Ref. 13, page 29-30] (O), (E)
Issue # 11: Management of Special-Use Airspace
• Within the NAS, some airspace is designed for use by the DOD and other federalagencies to carry out special research, testing, training...etc...non-participating aircraft-both civil and military-may be restricted from flying into such areas. Although Special-UseAirspace (SUA) serves the important safety function of segregating hazardous activityfrom non-participating aircraft, civil users have voiced concerns about whether SUA isbeing efficiently managed...by its location SUA can limit air traffic to and from a particularlocation...SUA has become a much more urgent issue because of the aviation community’smovement toward “free flight.” Under a “free flight” operating concept, the users of thesystem would have more freedom to select preferred routes free of many of the currentrestrictions as long as such routes do not interfere with safety, capacity, and SUAairspace...a key recommendation from the task force (RTCA free flight) is theestablishment of a “real-time” system to notify commercial users of the availability ofSUA. FAA and airline officials...suggest... that at a minimum, airlines need 2 hours’ noticeto take advantage of SUA. [Ref. 10, page 25] (O)
Issue # 12: Airport Safety
• ...concerns about accelerating the entire modernization effort that focus on thecomplexities of the technology and the integrity of FAA’s acquisition process....thecomplexity of developing and acquiring new ATC technology-both hardware andsoftware-must be recognized...new ATC technology...is available “off-the-shelf”...however, FAA has found significant additional development efforts have beenneeded to meet the agency’s requirements...two major contracts for systems-the Standard
157
Terminal Replacement System (STARS) and the Wide Area Augmentation System(WAAS)-called for considerable development efforts. [Ref. 21, page 6-7] (T)
• STARS is an outgrowth of the troubled Advanced Automation System (AAS)acquisition...the terminal segment of this system, known as Terminal AdvancedAutomation System, would provide controllers in TRACONS with new workstations andsupporting computer systems. However, in June 1994, the FAA Administrator ordered amajor restructuring of the acquisition to solve long-standing schedule and cost problems.These schedule delays were up to 8 years behind the original schedule, and estimated costshad increased to $7.6 billion from the original $2.5 billion...FAA’s schedule for STARScan be jeopardized by scheduling conflicts with other modernization efforts...in September1996, the IPT identified 12 potential scheduling conflicts at the first 45 STARSsites...another scheduling conflict involves terminal surveillance radars...many existingsurveillance radars are not digital, but STARS requires digital processing andcommunications....there are also potential difficulties in developing STARSsoftware...[Ref. 20, page 3-4] (E), (O)
Issue # 13: FAA Organizational Culture and Workforce
FAA’s Organizational Culture
• FAA’s organizational culture has been an underlying cause of the persistent costoverruns, schedule delays, and performance shortfalls in the agency’s acquisition of majorATC systems. Weaknesses in ATC acquisitions stem from recurring shortcomings in theagency’s mission focus, accountability, internal coordination, and adaptability. [Ref. 12,page 22] (O)
• FAA officials rushed into production of ATC systems....cost, schedule, and performanceproblems have resulted from excessive concurrency-beginning system production beforecompleting development, testing, or evaluation of programs. FAA has proceeded withproducing numerous systems, including Microwave Landing System (MLS), Mode Sradar, and Oceanic Display and Planning System (ODAPS), before critical performancerequirements had been met...[Ref. 12, page 24] (O)
• ...FAA concluded that because accountability for contract administration was not well-defined or enforced, program officials were not encouraged to exercise strong oversight ofcontractors...poor oversight...has caused acquisition problems in such projects as ODAPS,Mode S, and AAS...the delivery of the first system (MODE S)...had been delayed by 5years. [Ref. 12, page 28-29] (O)
• ...an environment of control...has been... fostered by the agency’s hierarchicalstructure...employees are not empowered to make needed management decisions. Thislack of empowerment decreases their sense of ownership and responsibility, which...makesthem more reluctant to be held accountable for their decisions and actions....fewer thanhalf reported that they had enough authority to make day-to-day decisions about day-to-day problems. [Ref. 12, page 29-30] (O), (H)
158
• Poor coordination between FAA’s program offices and filed organizations has causedschedule delays. Although coordination between program offices and filed organizations isnecessary to ensure that sites suitable for installing ATC systems are acquired andprepared, installations of the Terminal Doppler Weather Radar (TDWR), the AirportSurveillance Radar (ASR-9), and the Airport Surface Detection Equipment (ASDE-3)have all been delayed because of problems with putting these systems in the field....theimplementation of the final 10 ASR-9 radars was being delayed because planned sites werenot ready...similarly...FAA had to postpone TDWR’s implementation at 11 locationsbecause of the unavailability of sites and land acquisition problems. [Ref. 12, page 31](O), (T)
• A major limiting coordination among stakeholders in FAA’s acquisition of majorsystems has been its organizational structure...OTA (Office of Technology Assessment)noted (1994) that differences in the organizational culture among FAA’s air trafficcontrollers, equipment technicians, engineers, and divisional managers madecommunication difficult and limited coordination...[Ref. 12, page 32-33] (O)
FAA Workforce
• FAA has identified a sufficient number of controller candidates to meet its short-termstaffing needs in fiscal years 1997 and 1998. However, beyond fiscal year 1998, it isuncertain whether current sources can provide the controller candidates FAA will need tomeet its hiring goals for fiscal years 1999 through 2002. The majority of availablecandidates are controllers who were fired in 1981 and who FAA officials believe could beeligible to retire within a few years of reemployment...[Ref. 11, page 3] (O), (S), (H)
• FAA officials identified several principal impediments that hinder their ability to staffATC facilities at specified levels. The first is FAA headquarters’ practice of generally notproviding funds to relocate controllers until the end of the fiscal year, which causesdelayed controller moves and continued staffing imbalances. The second impediment is thelimited ability of regional officials to recruit controller candidates locally to fill vacancies atATC facilities. In addition, FAA regional officials also believe that limited hiring of newcontrollers in recent years has hindered their ability to fill vacancies. Partly due to theseimpediments, as of April 1996 about 53% of ATC facilities were not staffed at levelsspecified by FAA’s staffing standards...[Ref. 11, pages 3-4] (O), (S)
Selected References
1) Air Transport and The Environment, IATA, http://www.atag.org/atenvv/atenv.htm
2) The Economic Benefits of Air Transport, IATA,http://www.atag.org/ecobat/ecobat.htm
3) Outlook for Air Transport to the Year 2003, ICAO Circular 252-AT/103, 1995
4) The Future of International Air Passenger Transport: Ito an Era of Dynamic Change,Financial Times Management Report, Michael Donnel, 1995
159
5) Air Traffic Control: Complete and Enforced Architecture Needed for FAA SystemsModernization, GAO/AIMD-97-30, February 1997
6) Proposal to Corporatize The Nation’s Air Traffic Control System, S. Hrg. 103-1016,1995
7) Air Traffic Management System Performance Improvement Act of 1996, Report 104-251, April 10, 1996
8) Air Traffic Control: Improved Cost Information Needed to Make Billion DollarModernization Investment Decisions, GAO/AIMD-97-20, January 1997
9) Air Traffic Control and Air Traffic Management Systems: An Analysis of Policies,Technologies, and Global Markets, Volume I, Booz . Allen & Hamilton, 1995
10) National Airspace System: Issues in Allocating Costs for Air Traffic Services to DODand Other Users, GAO/RCED-97-106, April 1997
11) Aviation Safety: Opportunities Exist for FAA to Refine the Controller StaffingProcess, GAO/RCED-97-84, April 1997
12) Aviation Acquisition: A Comprehensive Strategy Is Needed for Cultural Change atFAA, GAO/RCED-96-159, August 1996
13) National Plan of Integrated Airport Systems (NPIAS) 1993-1997, FAA, April 1995
14) FAA Aviation Forecasts: Fiscal Years 1997-2008, FAA-APO-97-1, March 1997
15) 1997 Current Market Outlook, Boeing Airplane Marketing Group, March 1997
16) World Economic Outlook: 20 Year Extension, WEFA Group, 1997
17) EATMS Operational Concept Document (OCD), FCO.ET1.ST07.DEL01, January1997
18) Meeting Europe’s Air Traffic Needs: The Role of Eatchip and Eurocontrol,Eurocontrol 1996
19) In Search of the Future of Air traffic Control, IEEE Spectrum, August 1997
20) Air Traffic Control: Status of FAA’s Standard Terminal Automation ReplacementSystem Project, GAO/RCED-97-51, March 1997
21) Aviation Safety and Security: Challenges to Implementing the Recommendations ofthe White House Commission on Aviation Safety and Security, GAO/T-RCED-97-90,March 1997
22) Air Traffic Control: Better Guidance Needed for Deciding Where to Locate Facilitiesand Equipment GAO/RCED-95-14, December 1994
23) Report on the Implementation of the Air Traffic Service Plan, MP 96W0000184, TheMITRE Corporation, August 1996
24) Status Report: Global Navigation Satellite System (GNSS) Augmentation Audit andCost Benefit Analysis, April 1997

160
25) Aviation Automation: The Search for a Human Centered Approach, Charles E.Billings, LEA, 1997
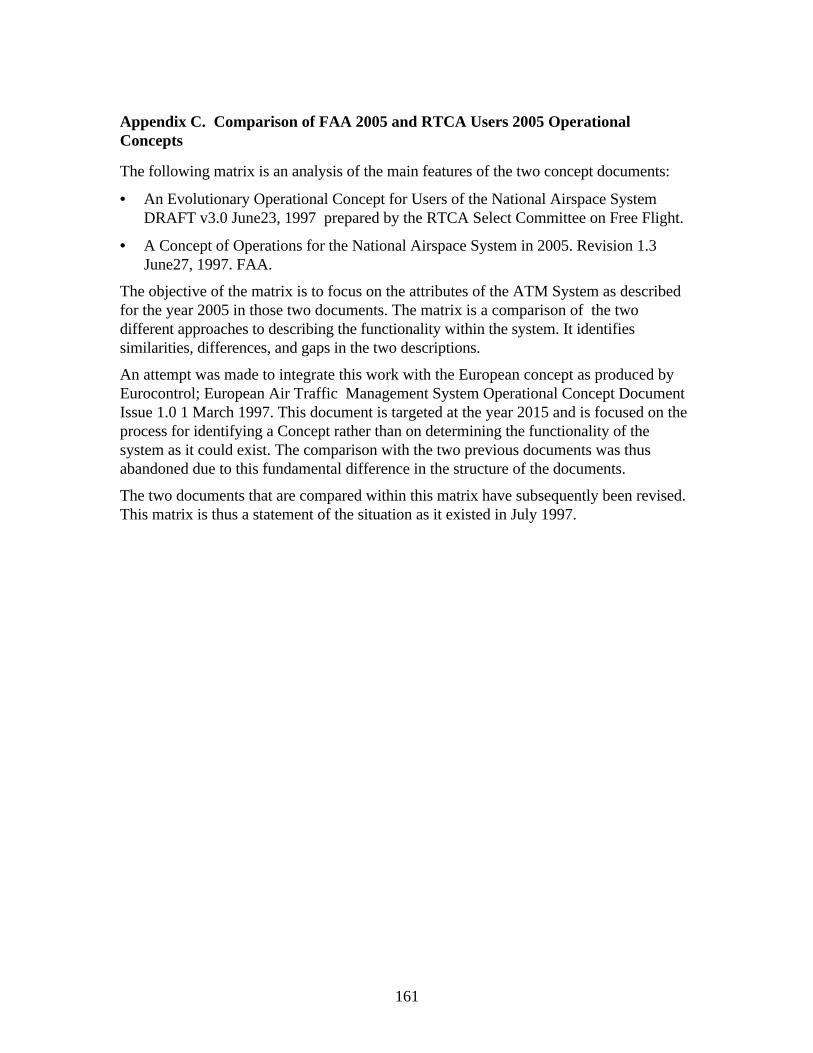
161
Appendix C. Comparison of FAA 2005 and RTCA Users 2005 OperationalConcepts
The following matrix is an analysis of the main features of the two concept documents:
• An Evolutionary Operational Concept for Users of the National Airspace SystemDRAFT v3.0 June23, 1997 prepared by the RTCA Select Committee on Free Flight.
• A Concept of Operations for the National Airspace System in 2005. Revision 1.3June27, 1997. FAA.
The objective of the matrix is to focus on the attributes of the ATM System as describedfor the year 2005 in those two documents. The matrix is a comparison of the twodifferent approaches to describing the functionality within the system. It identifiessimilarities, differences, and gaps in the two descriptions.
An attempt was made to integrate this work with the European concept as produced byEurocontrol; European Air Traffic Management System Operational Concept DocumentIssue 1.0 1 March 1997. This document is targeted at the year 2015 and is focused on theprocess for identifying a Concept rather than on determining the functionality of thesystem as it could exist. The comparison with the two previous documents was thusabandoned due to this fundamental difference in the structure of the documents.
The two documents that are compared within this matrix have subsequently been revised.This matrix is thus a statement of the situation as it existed in July 1997.
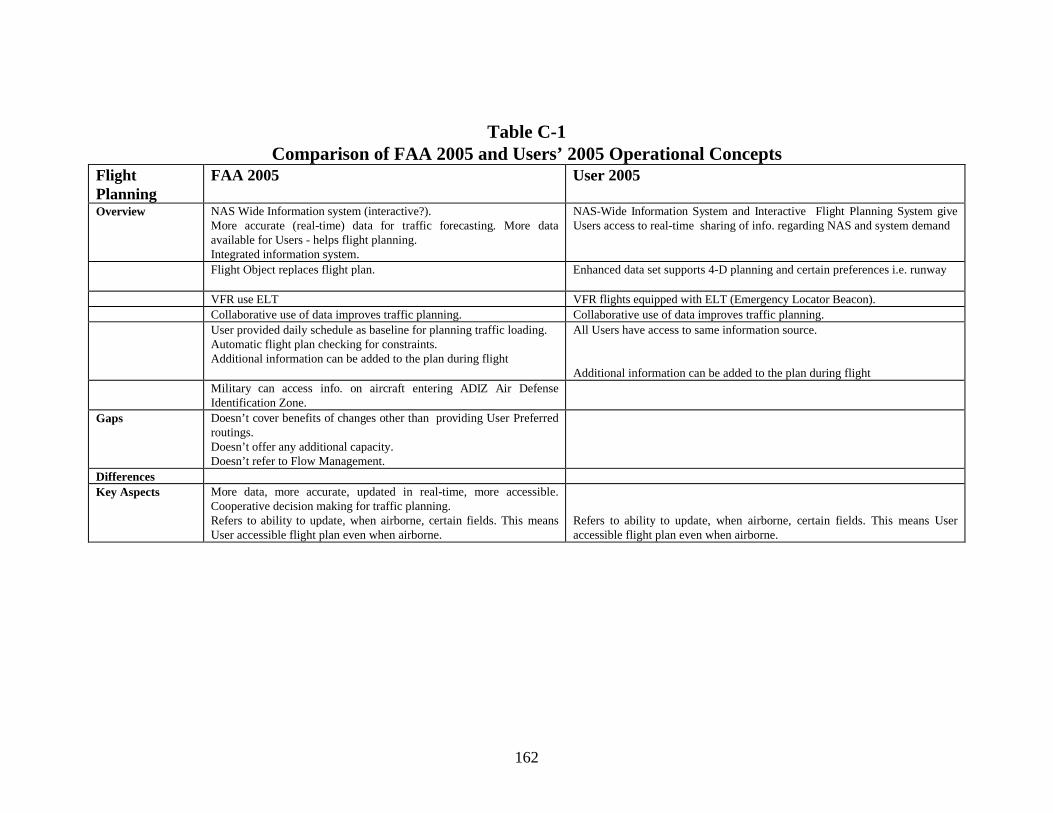
162
Table C-1Comparison of FAA 2005 and Users’ 2005 Operational Concepts
FlightPlanning
FAA 2005 User 2005
Overview NAS Wide Information system (interactive?).More accurate (real-time) data for traffic forecasting. More dataavailable for Users - helps flight planning.Integrated information system.
NAS-Wide Information System and Interactive Flight Planning System giveUsers access to real-time sharing of info. regarding NAS and system demand
Flight Object replaces flight plan. Enhanced data set supports 4-D planning and certain preferences i.e. runway
VFR use ELT VFR flights equipped with ELT (Emergency Locator Beacon).Collaborative use of data improves traffic planning. Collaborative use of data improves traffic planning.User provided daily schedule as baseline for planning traffic loading.Automatic flight plan checking for constraints.Additional information can be added to the plan during flight
All Users have access to same information source.
Additional information can be added to the plan during flightMilitary can access info. on aircraft entering ADIZ Air DefenseIdentification Zone.
Gaps Doesn’t cover benefits of changes other than providing User Preferredroutings.Doesn’t offer any additional capacity.Doesn’t refer to Flow Management.
DifferencesKey Aspects More data, more accurate, updated in real-time, more accessible.
Cooperative decision making for traffic planning.Refers to ability to update, when airborne, certain fields. This meansUser accessible flight plan even when airborne.
Refers to ability to update, when airborne, certain fields. This means Useraccessible flight plan even when airborne.
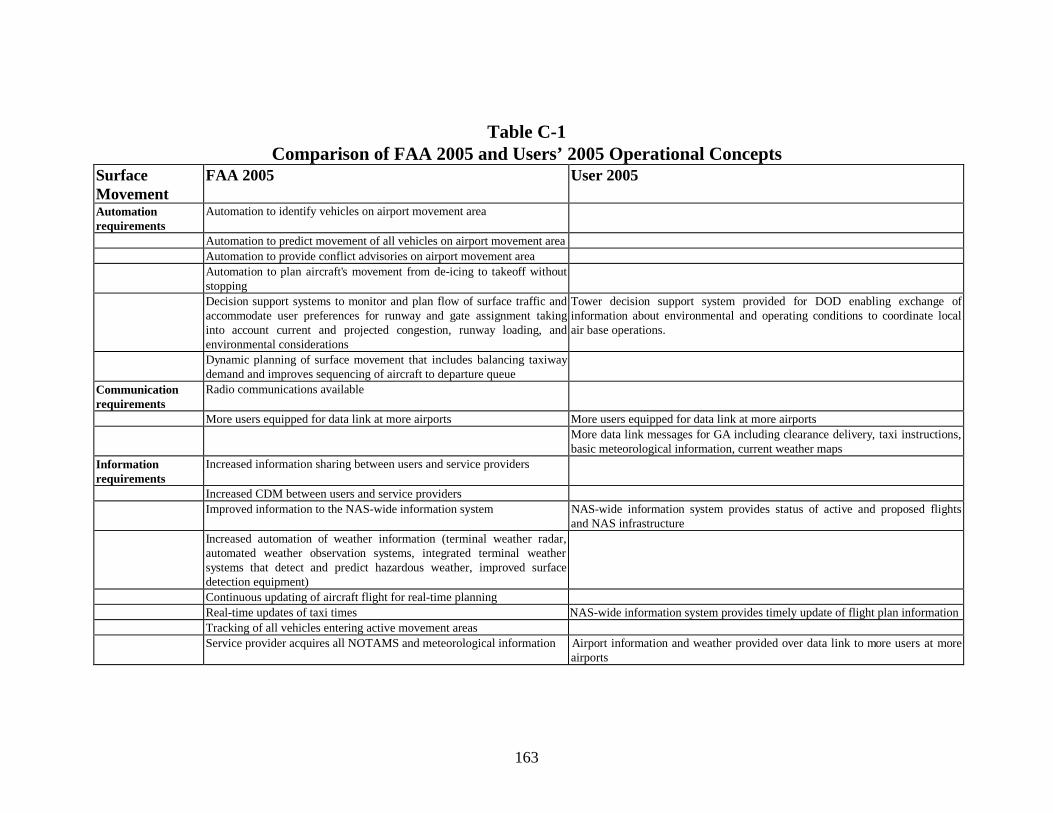
163
Table C-1Comparison of FAA 2005 and Users’ 2005 Operational Concepts
SurfaceMovement
FAA 2005 User 2005
Automationrequirements
Automation to identify vehicles on airport movement area
Automation to predict movement of all vehicles on airport movement areaAutomation to provide conflict advisories on airport movement areaAutomation to plan aircraft's movement from de-icing to takeoff withoutstoppingDecision support systems to monitor and plan flow of surface traffic andaccommodate user preferences for runway and gate assignment takinginto account current and projected congestion, runway loading, andenvironmental considerations
Tower decision support system provided for DOD enabling exchange ofinformation about environmental and operating conditions to coordinate localair base operations.
Dynamic planning of surface movement that includes balancing taxiwaydemand and improves sequencing of aircraft to departure queue
Communicationrequirements
Radio communications available
More users equipped for data link at more airports More users equipped for data link at more airportsMore data link messages for GA including clearance delivery, taxi instructions,basic meteorological information, current weather maps
Informationrequirements
Increased information sharing between users and service providers
Increased CDM between users and service providersImproved information to the NAS-wide information system NAS-wide information system provides status of active and proposed flights
and NAS infrastructureIncreased automation of weather information (terminal weather radar,automated weather observation systems, integrated terminal weathersystems that detect and predict hazardous weather, improved surfacedetection equipment)Continuous updating of aircraft flight for real-time planningReal-time updates of taxi times NAS-wide information system provides timely update of flight plan informationTracking of all vehicles entering active movement areasService provider acquires all NOTAMS and meteorological information Airport information and weather provided over data link to more users at more
airports
164
Table C-1Comparison of FAA 2005 and Users’ 2005 Operational Concepts
SurfaceMovement
FAA 2005 User 2005
Informationrequirements
More data link messages for GA including clearance delivery, taxi instructions,basic meteorological information, current weather maps
Automated ATIS message recorded for transmission over synthetic voiceor digital data link
Automated ATIS message recorded for transmission over synthetic voice ordigital data link for DOD
Weather advisories automatically transmitted over synthetic voice ordigital data link
Weather conditions provided over data link to more users at more airports
Taxi schedules automatically incorporate departure clearances, aircraftlocation, and aircraft type
Taxi routes data linked to the cockpit. Aircraft receive positions of other aircrafton the airport surface.Taxi clearances and instructions data linked to cockpit for DODDeparture clearances that incorporate enhanced flight plan informationincluding pilot requested ascent and descent profiles and cruise speed andaltitude provided over data linkMore data link messages for GA including clearance delivery, taxi instructions,basic meteorological information, current weather maps
Surface movement information system provides environmental andoperational conditions and sends updates to NAS wide informationsystem; this information used for ATIS messageSurface movement information system and NAS-wide information systeminterface with surface and airborne surveillance information, flightinformation, weather, and traffic management system
Aircraft coordinate with ATC regarding pushback and departure times.Pushback clearances include specific aircraft location, aircraft type, andsequencing number.
SeparationAssurance
Separation assurance by service provider through visual cues includingenhanced situation displays and surface detection equipment that receiveand display the aircraft's broadcast of satellite navigation derived positiondata
Satellite-based surveillance broadcasts provide enhanced situation display ofsurrounding surface traffic to the pilot
Pilots continue to rely on visual cues for separation assurance; some aircraftequipped with moving map display in cockpit; some aircraft equipped withconflict detection logic with moving map displayCockpit display of position information from other aircraft.ATC monitors aircraft movement and possible conflicts

165
Table C-1Comparison of FAA 2005 and Users’ 2005 Operational Concepts
SurfaceMovement
FAA 2005 User 2005
Efficiency Ramp service providers sequence and meter aircraft movement at gatesand ramp areas using situation displays that interface with decisionsupport systems and control tower personnel
Ramp service providers sequence and meter aircraft movement at gates andramp areas using situation displays that interface with decision support systemsand control tower personnelService provider coordinates with airline ramp and airport operators toefficiently sequence aircraft on the airport surface
Traffic flow service provider establishes initial taxi times based onweather and airport configuration and adjust parameters as needed
Tower automation uses timely aircraft information from NAS-wide informationsystem to establish a realistic set of schedules for departures, arrivals, andsurface traffic
Traffic flow service provider coordinates with arrival/departure trafficflow service providerReduced taxi occupancy times achieved through decision support systems Reduced taxi occupancy times achieved through decision support systems
Surveillance Satellite-based surveillance broadcastsGaps Doesn’t detail how runway occupancy could be increased.
Doesn’t detail how airfield capacity might be increased.Doesn’t detail how runway occupancy could be increased.Doesn’t detail how airfield capacity might be increased.
Differences Concentrates on ground systems Concentrates on air sideKey Aspects A lot of references to automation.
Concentrates on efficiency.
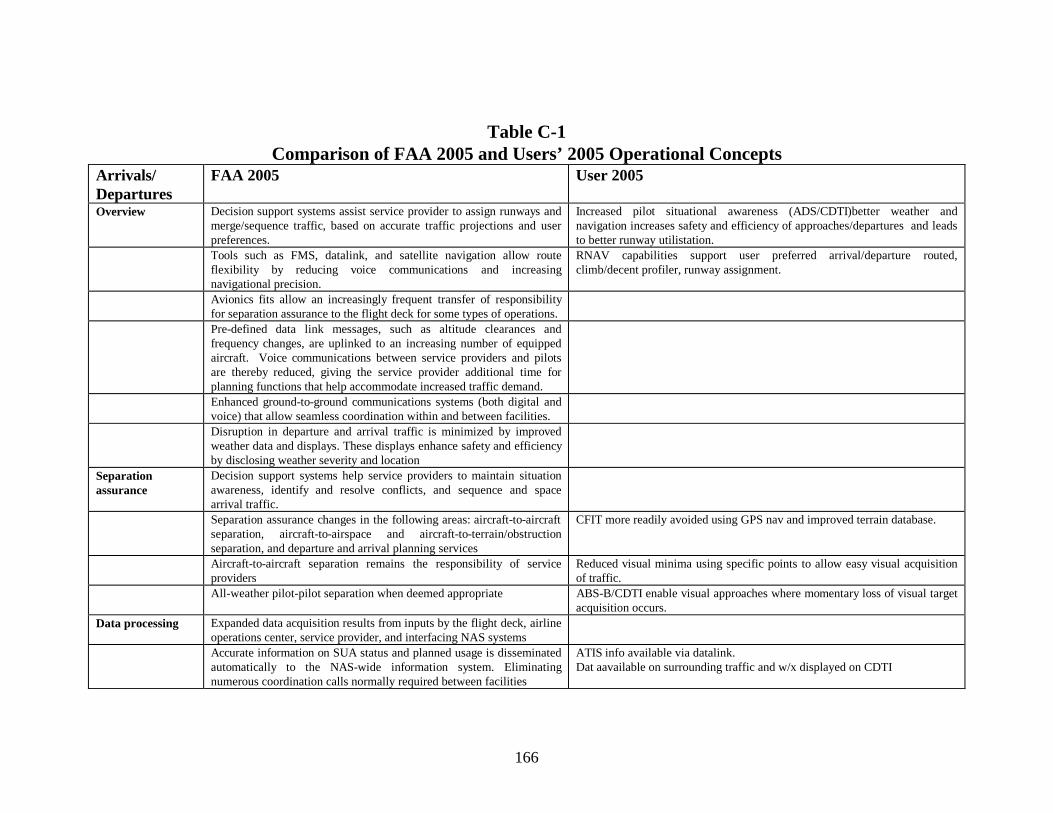
166
Table C-1Comparison of FAA 2005 and Users’ 2005 Operational Concepts
Arrivals/Departures
FAA 2005 User 2005
Overview Decision support systems assist service provider to assign runways andmerge/sequence traffic, based on accurate traffic projections and userpreferences.
Increased pilot situational awareness (ADS/CDTI)better weather andnavigation increases safety and efficiency of approaches/departures and leadsto better runway utilistation.
Tools such as FMS, datalink, and satellite navigation allow routeflexibility by reducing voice communications and increasingnavigational precision.
RNAV capabilities support user preferred arrival/departure routed,climb/decent profiler, runway assignment.
Avionics fits allow an increasingly frequent transfer of responsibilityfor separation assurance to the flight deck for some types of operations.Pre-defined data link messages, such as altitude clearances andfrequency changes, are uplinked to an increasing number of equippedaircraft. Voice communications between service providers and pilotsare thereby reduced, giving the service provider additional time forplanning functions that help accommodate increased traffic demand.Enhanced ground-to-ground communications systems (both digital andvoice) that allow seamless coordination within and between facilities.Disruption in departure and arrival traffic is minimized by improvedweather data and displays. These displays enhance safety and efficiencyby disclosing weather severity and location
Separationassurance
Decision support systems help service providers to maintain situationawareness, identify and resolve conflicts, and sequence and spacearrival traffic.Separation assurance changes in the following areas: aircraft-to-aircraftseparation, aircraft-to-airspace and aircraft-to-terrain/obstructionseparation, and departure and arrival planning services
CFIT more readily avoided using GPS nav and improved terrain database.
Aircraft-to-aircraft separation remains the responsibility of serviceproviders
Reduced visual minima using specific points to allow easy visual acquisitionof traffic.
All-weather pilot-pilot separation when deemed appropriate ABS-B/CDTI enable visual approaches where momentary loss of visual targetacquisition occurs.
Data processing Expanded data acquisition results from inputs by the flight deck, airlineoperations center, service provider, and interfacing NAS systemsAccurate information on SUA status and planned usage is disseminatedautomatically to the NAS-wide information system. Eliminatingnumerous coordination calls normally required between facilities
ATIS info available via datalink.Dat aavailable on surrounding traffic and w/x displayed on CDTI
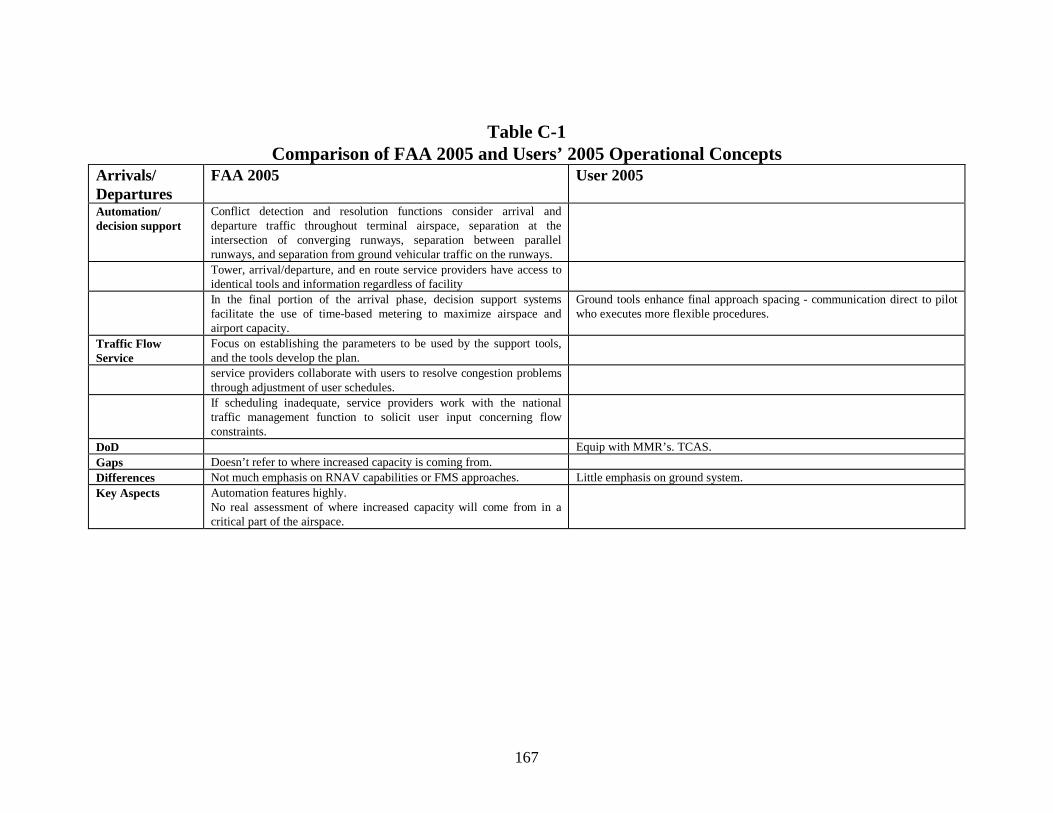
167
Table C-1Comparison of FAA 2005 and Users’ 2005 Operational Concepts
Arrivals/Departures
FAA 2005 User 2005
Automation/decision support
Conflict detection and resolution functions consider arrival anddeparture traffic throughout terminal airspace, separation at theintersection of converging runways, separation between parallelrunways, and separation from ground vehicular traffic on the runways.Tower, arrival/departure, and en route service providers have access toidentical tools and information regardless of facilityIn the final portion of the arrival phase, decision support systemsfacilitate the use of time-based metering to maximize airspace andairport capacity.
Ground tools enhance final approach spacing - communication direct to pilotwho executes more flexible procedures.
Traffic FlowService
Focus on establishing the parameters to be used by the support tools,and the tools develop the plan.service providers collaborate with users to resolve congestion problemsthrough adjustment of user schedules.If scheduling inadequate, service providers work with the nationaltraffic management function to solicit user input concerning flowconstraints.
DoD Equip with MMR’s. TCAS.Gaps Doesn’t refer to where increased capacity is coming from.Differences Not much emphasis on RNAV capabilities or FMS approaches. Little emphasis on ground system.Key Aspects Automation features highly.
No real assessment of where increased capacity will come from in acritical part of the airspace.
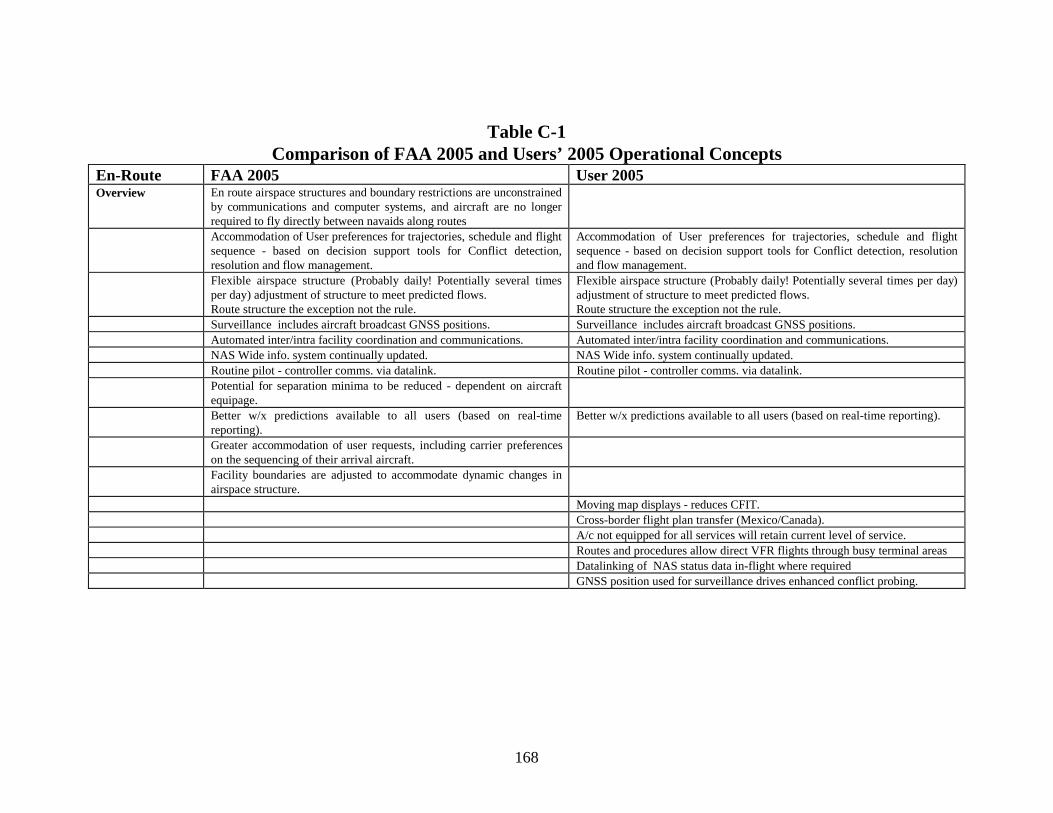
168
Table C-1Comparison of FAA 2005 and Users’ 2005 Operational Concepts
En-Route FAA 2005 User 2005Overview En route airspace structures and boundary restrictions are unconstrained
by communications and computer systems, and aircraft are no longerrequired to fly directly between navaids along routesAccommodation of User preferences for trajectories, schedule and flightsequence - based on decision support tools for Conflict detection,resolution and flow management.
Accommodation of User preferences for trajectories, schedule and flightsequence - based on decision support tools for Conflict detection, resolutionand flow management.
Flexible airspace structure (Probably daily! Potentially several timesper day) adjustment of structure to meet predicted flows.Route structure the exception not the rule.
Flexible airspace structure (Probably daily! Potentially several times per day)adjustment of structure to meet predicted flows.Route structure the exception not the rule.
Surveillance includes aircraft broadcast GNSS positions. Surveillance includes aircraft broadcast GNSS positions.Automated inter/intra facility coordination and communications. Automated inter/intra facility coordination and communications.NAS Wide info. system continually updated. NAS Wide info. system continually updated.Routine pilot - controller comms. via datalink. Routine pilot - controller comms. via datalink.Potential for separation minima to be reduced - dependent on aircraftequipage.Better w/x predictions available to all users (based on real-timereporting).
Better w/x predictions available to all users (based on real-time reporting).
Greater accommodation of user requests, including carrier preferenceson the sequencing of their arrival aircraft.Facility boundaries are adjusted to accommodate dynamic changes inairspace structure.
Moving map displays - reduces CFIT.Cross-border flight plan transfer (Mexico/Canada).A/c not equipped for all services will retain current level of service.Routes and procedures allow direct VFR flights through busy terminal areasDatalinking of NAS status data in-flight where requiredGNSS position used for surveillance drives enhanced conflict probing.
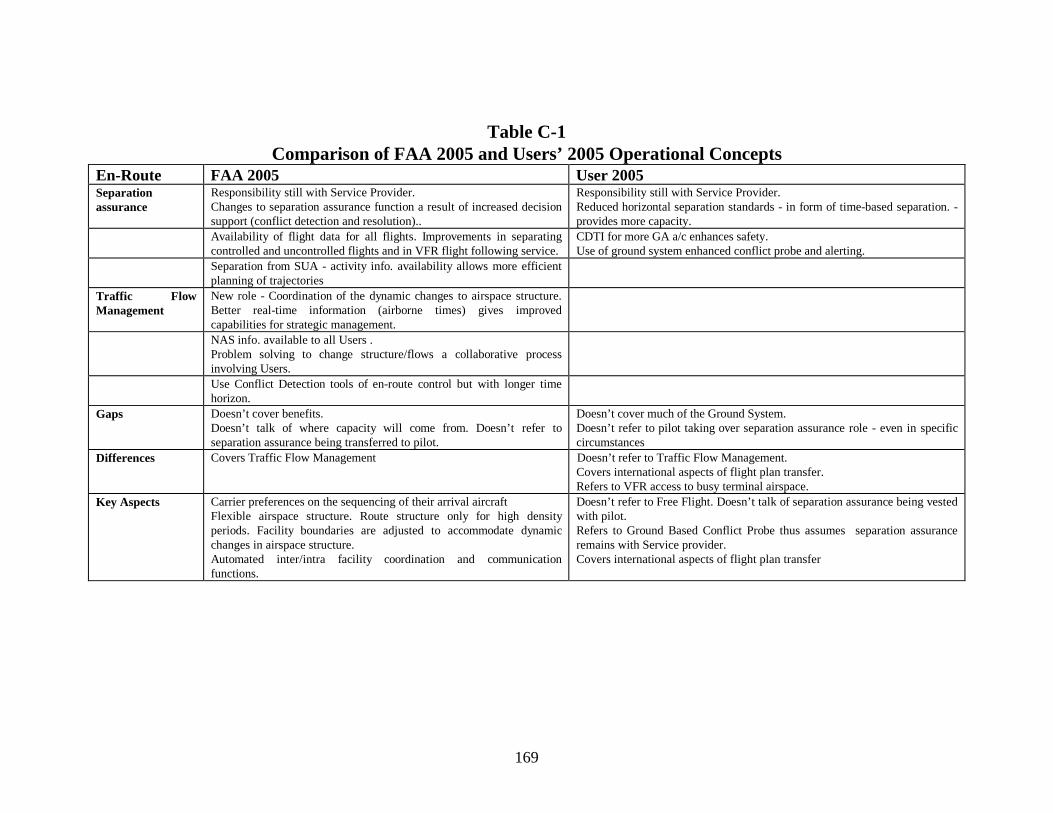
169
Table C-1Comparison of FAA 2005 and Users’ 2005 Operational Concepts
En-Route FAA 2005 User 2005Separationassurance
Responsibility still with Service Provider.Changes to separation assurance function a result of increased decisionsupport (conflict detection and resolution)..
Responsibility still with Service Provider.Reduced horizontal separation standards - in form of time-based separation. -provides more capacity.
Availability of flight data for all flights. Improvements in separatingcontrolled and uncontrolled flights and in VFR flight following service.
CDTI for more GA a/c enhances safety.Use of ground system enhanced conflict probe and alerting.
Separation from SUA - activity info. availability allows more efficientplanning of trajectories
Traffic FlowManagement
New role - Coordination of the dynamic changes to airspace structure.Better real-time information (airborne times) gives improvedcapabilities for strategic management.NAS info. available to all Users .Problem solving to change structure/flows a collaborative processinvolving Users.Use Conflict Detection tools of en-route control but with longer timehorizon.
Gaps Doesn’t cover benefits.Doesn’t talk of where capacity will come from. Doesn’t refer toseparation assurance being transferred to pilot.
Doesn’t cover much of the Ground System.Doesn’t refer to pilot taking over separation assurance role - even in specificcircumstances
Differences Covers Traffic Flow Management Doesn’t refer to Traffic Flow Management.Covers international aspects of flight plan transfer.Refers to VFR access to busy terminal airspace.
Key Aspects Carrier preferences on the sequencing of their arrival aircraftFlexible airspace structure. Route structure only for high densityperiods. Facility boundaries are adjusted to accommodate dynamicchanges in airspace structure.Automated inter/intra facility coordination and communicationfunctions.
Doesn’t refer to Free Flight. Doesn’t talk of separation assurance being vestedwith pilot.Refers to Ground Based Conflict Probe thus assumes separation assuranceremains with Service provider.Covers international aspects of flight plan transfer
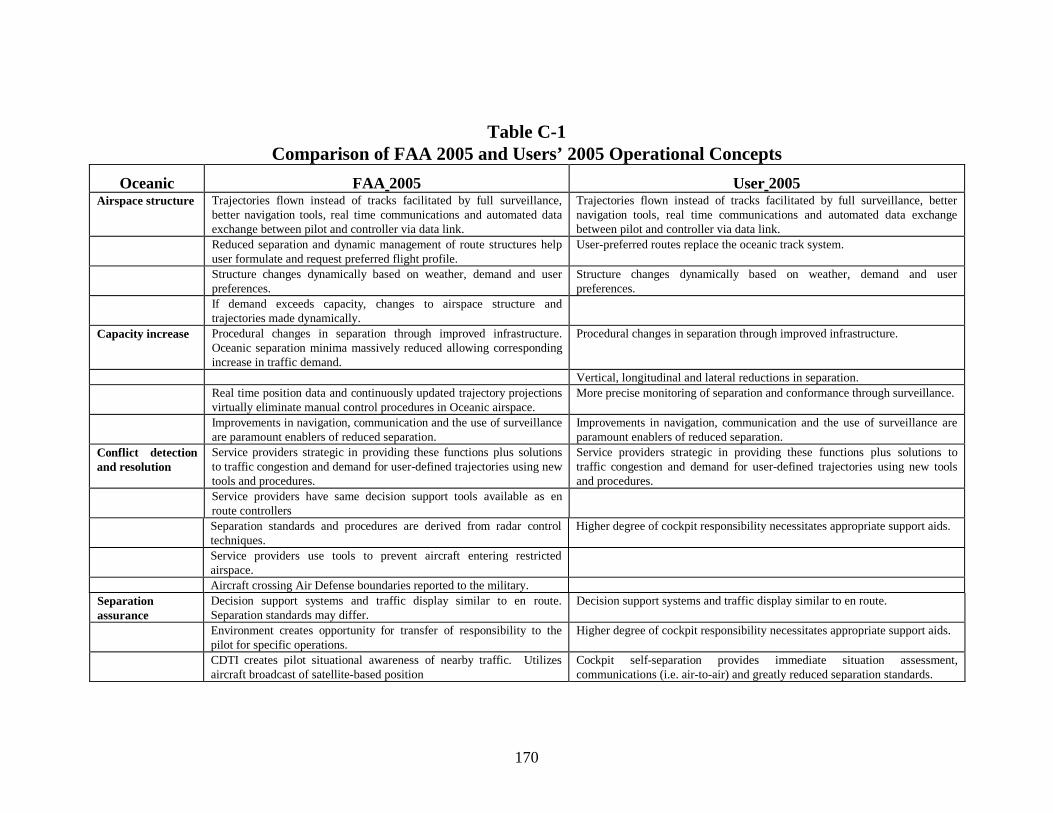
170
Table C-1Comparison of FAA 2005 and Users’ 2005 Operational Concepts
Oceanic FAA 2005 User 2005Airspace structure Trajectories flown instead of tracks facilitated by full surveillance,
better navigation tools, real time communications and automated dataexchange between pilot and controller via data link.
Trajectories flown instead of tracks facilitated by full surveillance, betternavigation tools, real time communications and automated data exchangebetween pilot and controller via data link.
Reduced separation and dynamic management of route structures helpuser formulate and request preferred flight profile.
User-preferred routes replace the oceanic track system.
Structure changes dynamically based on weather, demand and userpreferences.
Structure changes dynamically based on weather, demand and userpreferences.
If demand exceeds capacity, changes to airspace structure andtrajectories made dynamically.
Capacity increase Procedural changes in separation through improved infrastructure.Oceanic separation minima massively reduced allowing correspondingincrease in traffic demand.
Procedural changes in separation through improved infrastructure.
Vertical, longitudinal and lateral reductions in separation.Real time position data and continuously updated trajectory projectionsvirtually eliminate manual control procedures in Oceanic airspace.
More precise monitoring of separation and conformance through surveillance.
Improvements in navigation, communication and the use of surveillanceare paramount enablers of reduced separation.
Improvements in navigation, communication and the use of surveillance areparamount enablers of reduced separation.
Conflict detectionand resolution
Service providers strategic in providing these functions plus solutionsto traffic congestion and demand for user-defined trajectories using newtools and procedures.
Service providers strategic in providing these functions plus solutions totraffic congestion and demand for user-defined trajectories using new toolsand procedures.
Service providers have same decision support tools available as enroute controllersSeparation standards and procedures are derived from radar controltechniques.
Higher degree of cockpit responsibility necessitates appropriate support aids.
Service providers use tools to prevent aircraft entering restrictedairspace.Aircraft crossing Air Defense boundaries reported to the military.
Separationassurance
Decision support systems and traffic display similar to en route.Separation standards may differ.
Decision support systems and traffic display similar to en route.
Environment creates opportunity for transfer of responsibility to thepilot for specific operations.
Higher degree of cockpit responsibility necessitates appropriate support aids.
CDTI creates pilot situational awareness of nearby traffic. Utilizesaircraft broadcast of satellite-based position
Cockpit self-separation provides immediate situation assessment,communications (i.e. air-to-air) and greatly reduced separation standards.
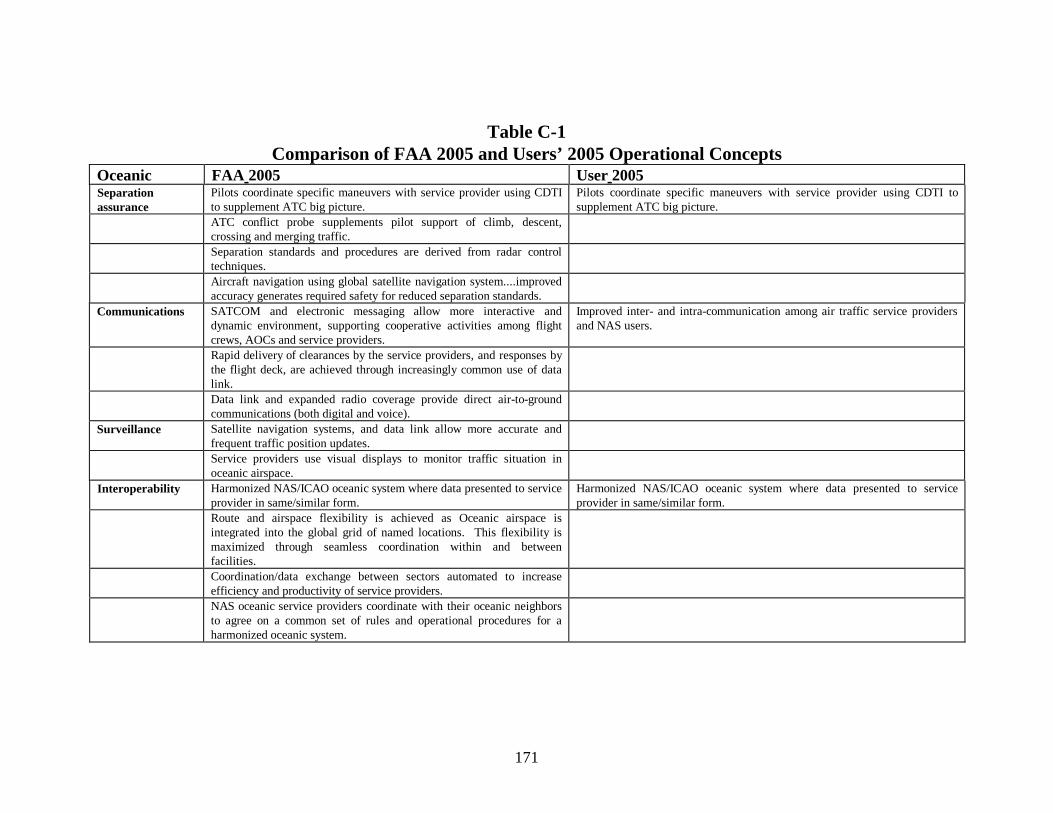
171
Table C-1Comparison of FAA 2005 and Users’ 2005 Operational Concepts
Oceanic FAA 2005 User 2005Separationassurance
Pilots coordinate specific maneuvers with service provider using CDTIto supplement ATC big picture.
Pilots coordinate specific maneuvers with service provider using CDTI tosupplement ATC big picture.
ATC conflict probe supplements pilot support of climb, descent,crossing and merging traffic.Separation standards and procedures are derived from radar controltechniques.Aircraft navigation using global satellite navigation system....improvedaccuracy generates required safety for reduced separation standards.
Communications SATCOM and electronic messaging allow more interactive anddynamic environment, supporting cooperative activities among flightcrews, AOCs and service providers.
Improved inter- and intra-communication among air traffic service providersand NAS users.
Rapid delivery of clearances by the service providers, and responses bythe flight deck, are achieved through increasingly common use of datalink.Data link and expanded radio coverage provide direct air-to-groundcommunications (both digital and voice).
Surveillance Satellite navigation systems, and data link allow more accurate andfrequent traffic position updates.Service providers use visual displays to monitor traffic situation inoceanic airspace.
Interoperability Harmonized NAS/ICAO oceanic system where data presented to serviceprovider in same/similar form.
Harmonized NAS/ICAO oceanic system where data presented to serviceprovider in same/similar form.
Route and airspace flexibility is achieved as Oceanic airspace isintegrated into the global grid of named locations. This flexibility ismaximized through seamless coordination within and betweenfacilities.Coordination/data exchange between sectors automated to increaseefficiency and productivity of service providers.NAS oceanic service providers coordinate with their oceanic neighborsto agree on a common set of rules and operational procedures for aharmonized oceanic system.
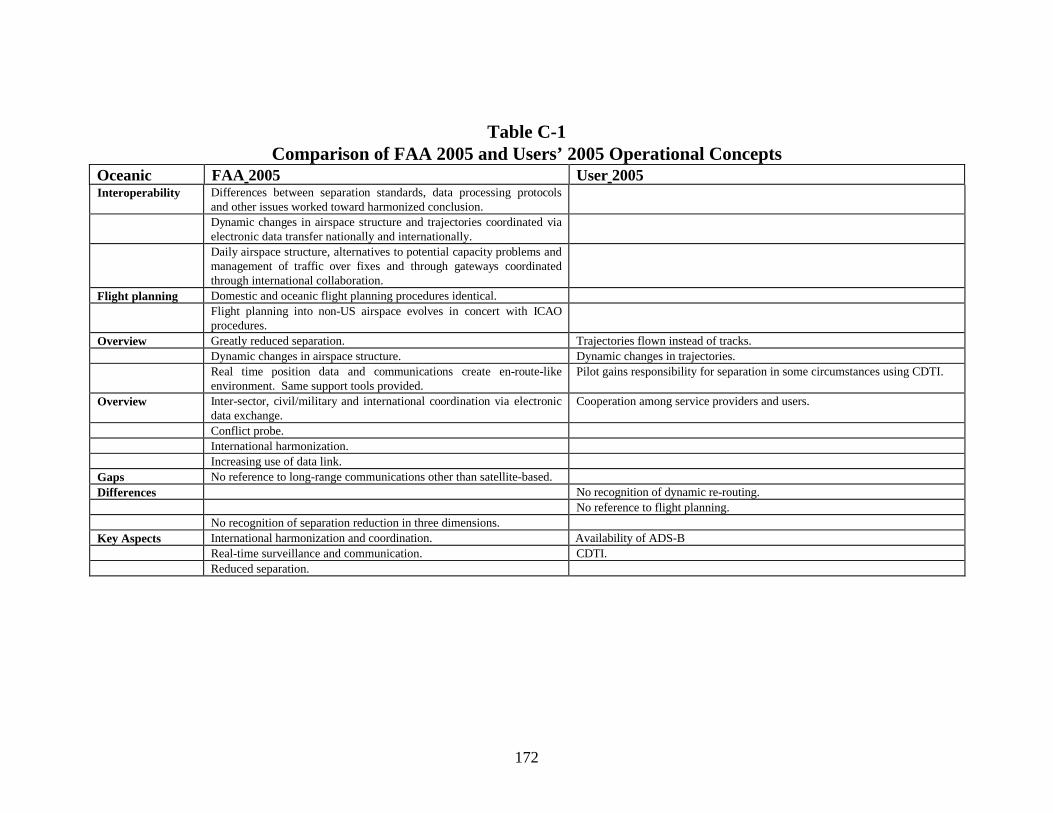
172
Table C-1Comparison of FAA 2005 and Users’ 2005 Operational Concepts
Oceanic FAA 2005 User 2005Interoperability Differences between separation standards, data processing protocols
and other issues worked toward harmonized conclusion.Dynamic changes in airspace structure and trajectories coordinated viaelectronic data transfer nationally and internationally.Daily airspace structure, alternatives to potential capacity problems andmanagement of traffic over fixes and through gateways coordinatedthrough international collaboration.
Flight planning Domestic and oceanic flight planning procedures identical.Flight planning into non-US airspace evolves in concert with ICAOprocedures.
Overview Greatly reduced separation. Trajectories flown instead of tracks.Dynamic changes in airspace structure. Dynamic changes in trajectories.Real time position data and communications create en-route-likeenvironment. Same support tools provided.
Pilot gains responsibility for separation in some circumstances using CDTI.
Overview Inter-sector, civil/military and international coordination via electronicdata exchange.
Cooperation among service providers and users.
Conflict probe.International harmonization.Increasing use of data link.
Gaps No reference to long-range communications other than satellite-based.Differences No recognition of dynamic re-routing.
No reference to flight planning.No recognition of separation reduction in three dimensions.
Key Aspects International harmonization and coordination. Availability of ADS-BReal-time surveillance and communication. CDTI.Reduced separation.
173
Appendix D. Transition Database
This appendix presents a database that captures the relationships between the operationalenhancement steps and the enablers in Figures 6.4-9.
The first column in the tables, Enabler Grouping Number, presents the number assigned tothe enabler grouping. All of the enablers start with a “NAS” for this operatonal conceptand are assigned a number as follows:
1.0 - Navigation
2.0 - Surveillance
3.0 - Airspace
4.0 - Communication
5.0 - ATM tools
6.0 - Weather
7.0 - Airport Enhancements
8.0 - Not modeled
9.0 - Enhanced Flow Management
The second column presents the name of the specific enabler and the third column,presents the name of the enabler grouping. The fourth column, Capacity BenefitMechanism, presents the capacity benefit to be gained from the operational enhancement.The fifth column, Reference Figure Number, provides the figure number in Section 6 inwhich this enhancement appears. The sixth column, Capacity Operational Enhancement,provides the operational enhancement to be gained from that specific enabler.
The ninth column, Source, provides the name of the document from which the enabler ispresented. In this table, the document used is the ATM Concept Baseline Report. Otherdatabases have been developed by the C/AFT for Free Flight, EATCHIP and IATA plans,as discussed in Section 6.
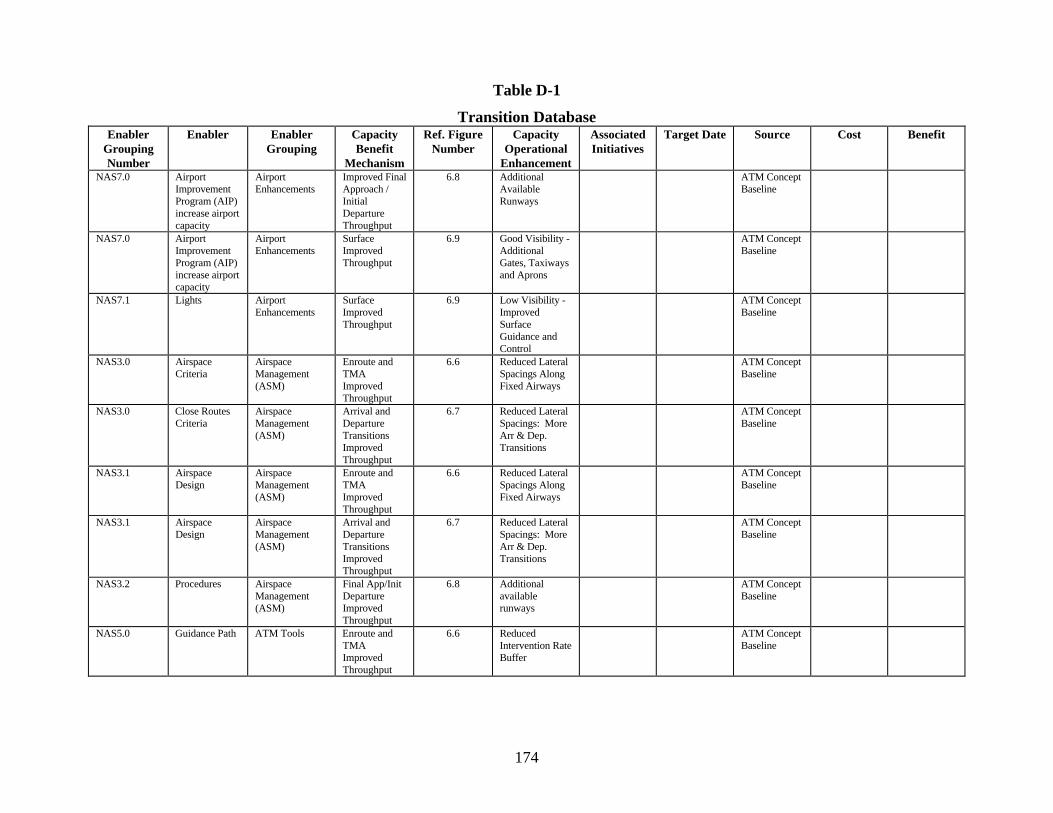
174
Table D-1
Transition DatabaseEnabler
GroupingNumber
Enabler EnablerGrouping
CapacityBenefit
Mechanism
Ref. FigureNumber
CapacityOperational
Enhancement
AssociatedInitiatives
Target Date Source Cost Benefit
NAS7.0 AirportImprovementProgram (AIP)increase airportcapacity
AirportEnhancements
Improved FinalApproach /InitialDepartureThroughput
6.8 AdditionalAvailableRunways
ATM ConceptBaseline
NAS7.0 AirportImprovementProgram (AIP)increase airportcapacity
AirportEnhancements
SurfaceImprovedThroughput
6.9 Good Visibility -AdditionalGates, Taxiwaysand Aprons
ATM ConceptBaseline
NAS7.1 Lights AirportEnhancements
SurfaceImprovedThroughput
6.9 Low Visibility -ImprovedSurfaceGuidance andControl
ATM ConceptBaseline
NAS3.0 AirspaceCriteria
AirspaceManagement(ASM)
Enroute andTMAImprovedThroughput
6.6 Reduced LateralSpacings AlongFixed Airways
ATM ConceptBaseline
NAS3.0 Close RoutesCriteria
AirspaceManagement(ASM)
Arrival andDepartureTransitionsImprovedThroughput
6.7 Reduced LateralSpacings: MoreArr & Dep.Transitions
ATM ConceptBaseline
NAS3.1 AirspaceDesign
AirspaceManagement(ASM)
Enroute andTMAImprovedThroughput
6.6 Reduced LateralSpacings AlongFixed Airways
ATM ConceptBaseline
NAS3.1 AirspaceDesign
AirspaceManagement(ASM)
Arrival andDepartureTransitionsImprovedThroughput
6.7 Reduced LateralSpacings: MoreArr & Dep.Transitions
ATM ConceptBaseline
NAS3.2 Procedures AirspaceManagement(ASM)
Final App/InitDepartureImprovedThroughput
6.8 Additionalavailablerunways
ATM ConceptBaseline
NAS5.0 Guidance Path ATM Tools Enroute andTMAImprovedThroughput
6.6 ReducedIntervention RateBuffer
ATM ConceptBaseline
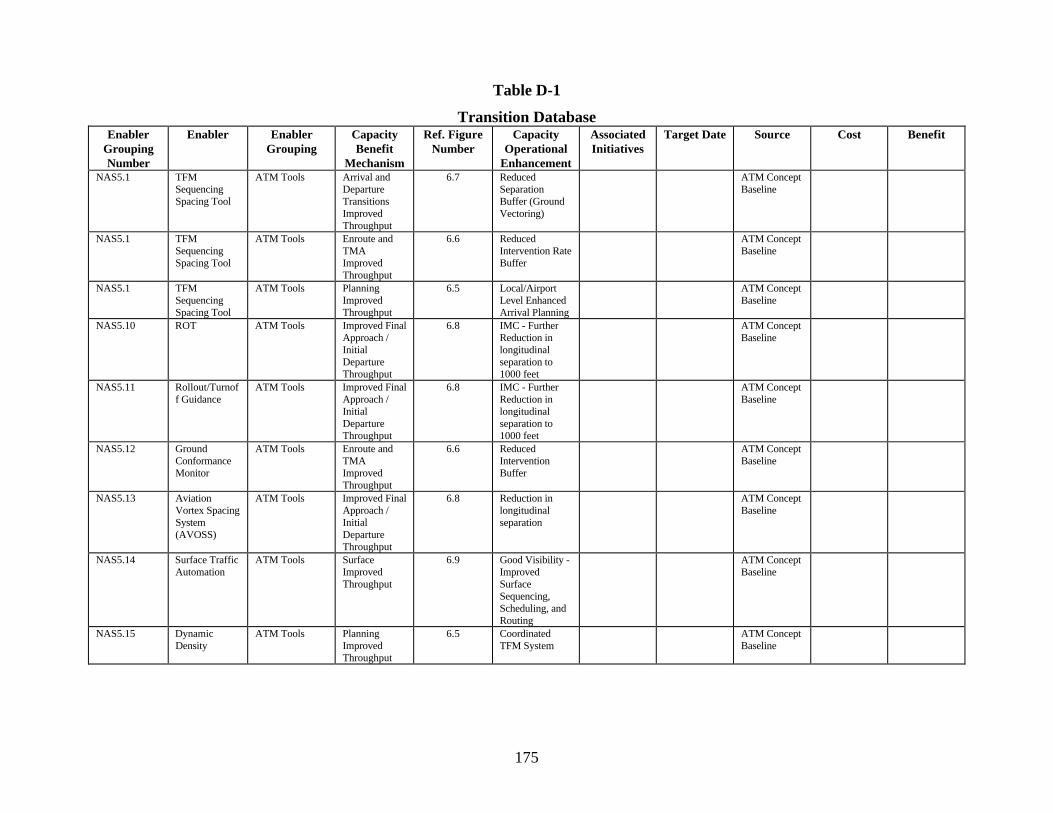
175
Table D-1
Transition DatabaseEnabler
GroupingNumber
Enabler EnablerGrouping
CapacityBenefit
Mechanism
Ref. FigureNumber
CapacityOperational
Enhancement
AssociatedInitiatives
Target Date Source Cost Benefit
NAS5.1 TFMSequencingSpacing Tool
ATM Tools Arrival andDepartureTransitionsImprovedThroughput
6.7 ReducedSeparationBuffer (GroundVectoring)
ATM ConceptBaseline
NAS5.1 TFMSequencingSpacing Tool
ATM Tools Enroute andTMAImprovedThroughput
6.6 ReducedIntervention RateBuffer
ATM ConceptBaseline
NAS5.1 TFMSequencingSpacing Tool
ATM Tools PlanningImprovedThroughput
6.5 Local/AirportLevel EnhancedArrival Planning
ATM ConceptBaseline
NAS5.10 ROT ATM Tools Improved FinalApproach /InitialDepartureThroughput
6.8 IMC - FurtherReduction inlongitudinalseparation to1000 feet
ATM ConceptBaseline
NAS5.11 Rollout/Turnoff Guidance
ATM Tools Improved FinalApproach /InitialDepartureThroughput
6.8 IMC - FurtherReduction inlongitudinalseparation to1000 feet
ATM ConceptBaseline
NAS5.12 GroundConformanceMonitor
ATM Tools Enroute andTMAImprovedThroughput
6.6 ReducedInterventionBuffer
ATM ConceptBaseline
NAS5.13 AviationVortex SpacingSystem(AVOSS)
ATM Tools Improved FinalApproach /InitialDepartureThroughput
6.8 Reduction inlongitudinalseparation
ATM ConceptBaseline
NAS5.14 Surface TrafficAutomation
ATM Tools SurfaceImprovedThroughput
6.9 Good Visibility -ImprovedSurfaceSequencing,Scheduling, andRouting
ATM ConceptBaseline
NAS5.15 DynamicDensity
ATM Tools PlanningImprovedThroughput
6.5 CoordinatedTFM System
ATM ConceptBaseline
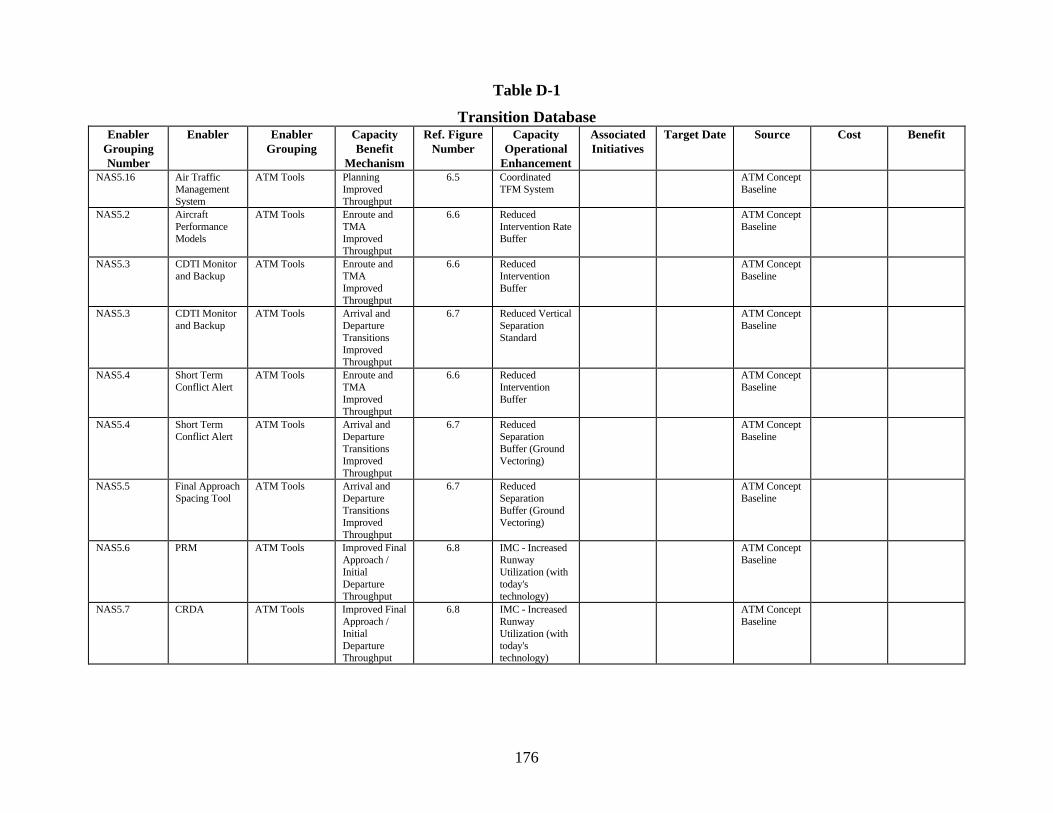
176
Table D-1
Transition DatabaseEnabler
GroupingNumber
Enabler EnablerGrouping
CapacityBenefit
Mechanism
Ref. FigureNumber
CapacityOperational
Enhancement
AssociatedInitiatives
Target Date Source Cost Benefit
NAS5.16 Air TrafficManagementSystem
ATM Tools PlanningImprovedThroughput
6.5 CoordinatedTFM System
ATM ConceptBaseline
NAS5.2 AircraftPerformanceModels
ATM Tools Enroute andTMAImprovedThroughput
6.6 ReducedIntervention RateBuffer
ATM ConceptBaseline
NAS5.3 CDTI Monitorand Backup
ATM Tools Enroute andTMAImprovedThroughput
6.6 ReducedInterventionBuffer
ATM ConceptBaseline
NAS5.3 CDTI Monitorand Backup
ATM Tools Arrival andDepartureTransitionsImprovedThroughput
6.7 Reduced VerticalSeparationStandard
ATM ConceptBaseline
NAS5.4 Short TermConflict Alert
ATM Tools Enroute andTMAImprovedThroughput
6.6 ReducedInterventionBuffer
ATM ConceptBaseline
NAS5.4 Short TermConflict Alert
ATM Tools Arrival andDepartureTransitionsImprovedThroughput
6.7 ReducedSeparationBuffer (GroundVectoring)
ATM ConceptBaseline
NAS5.5 Final ApproachSpacing Tool
ATM Tools Arrival andDepartureTransitionsImprovedThroughput
6.7 ReducedSeparationBuffer (GroundVectoring)
ATM ConceptBaseline
NAS5.6 PRM ATM Tools Improved FinalApproach /InitialDepartureThroughput
6.8 IMC - IncreasedRunwayUtilization (withtoday'stechnology)
ATM ConceptBaseline
NAS5.7 CRDA ATM Tools Improved FinalApproach /InitialDepartureThroughput
6.8 IMC - IncreasedRunwayUtilization (withtoday'stechnology)
ATM ConceptBaseline
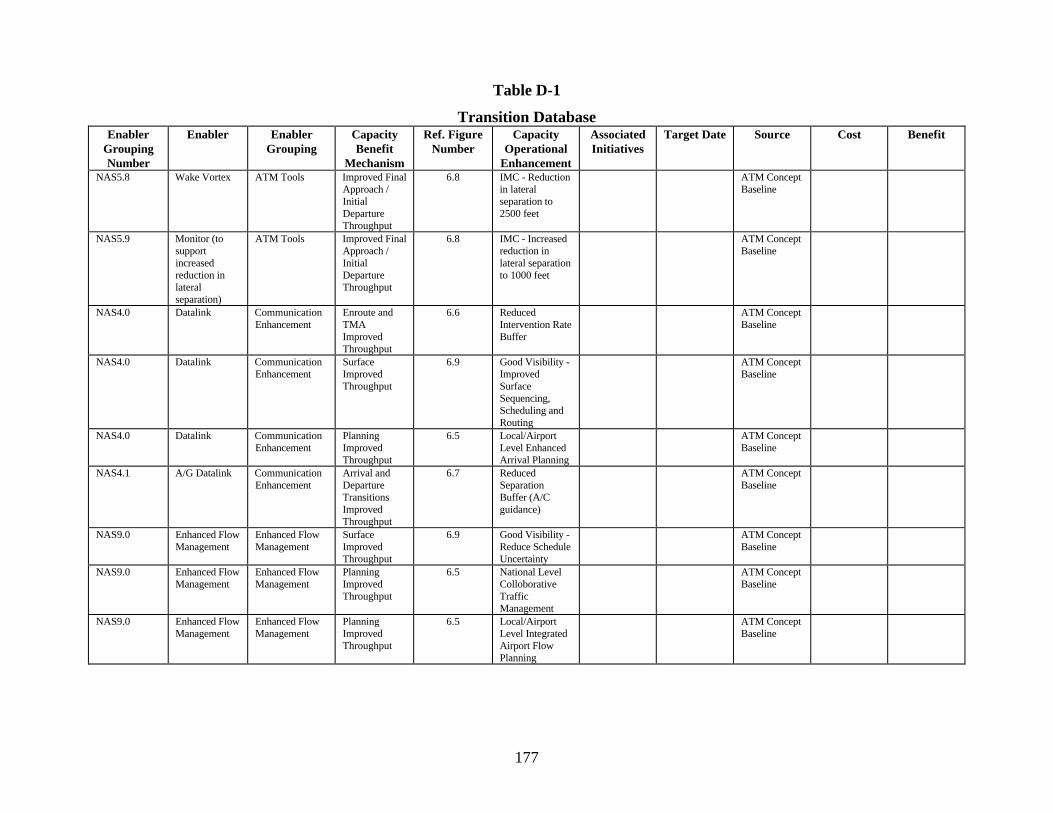
177
Table D-1
Transition DatabaseEnabler
GroupingNumber
Enabler EnablerGrouping
CapacityBenefit
Mechanism
Ref. FigureNumber
CapacityOperational
Enhancement
AssociatedInitiatives
Target Date Source Cost Benefit
NAS5.8 Wake Vortex ATM Tools Improved FinalApproach /InitialDepartureThroughput
6.8 IMC - Reductionin lateralseparation to2500 feet
ATM ConceptBaseline
NAS5.9 Monitor (tosupportincreasedreduction inlateralseparation)
ATM Tools Improved FinalApproach /InitialDepartureThroughput
6.8 IMC - Increasedreduction inlateral separationto 1000 feet
ATM ConceptBaseline
NAS4.0 Datalink CommunicationEnhancement
Enroute andTMAImprovedThroughput
6.6 ReducedIntervention RateBuffer
ATM ConceptBaseline
NAS4.0 Datalink CommunicationEnhancement
SurfaceImprovedThroughput
6.9 Good Visibility -ImprovedSurfaceSequencing,Scheduling andRouting
ATM ConceptBaseline
NAS4.0 Datalink CommunicationEnhancement
PlanningImprovedThroughput
6.5 Local/AirportLevel EnhancedArrival Planning
ATM ConceptBaseline
NAS4.1 A/G Datalink CommunicationEnhancement
Arrival andDepartureTransitionsImprovedThroughput
6.7 ReducedSeparationBuffer (A/Cguidance)
ATM ConceptBaseline
NAS9.0 Enhanced FlowManagement
Enhanced FlowManagement
SurfaceImprovedThroughput
6.9 Good Visibility -Reduce ScheduleUncertainty
ATM ConceptBaseline
NAS9.0 Enhanced FlowManagement
Enhanced FlowManagement
PlanningImprovedThroughput
6.5 National LevelColloborativeTrafficManagement
ATM ConceptBaseline
NAS9.0 Enhanced FlowManagement
Enhanced FlowManagement
PlanningImprovedThroughput
6.5 Local/AirportLevel IntegratedAirport FlowPlanning
ATM ConceptBaseline
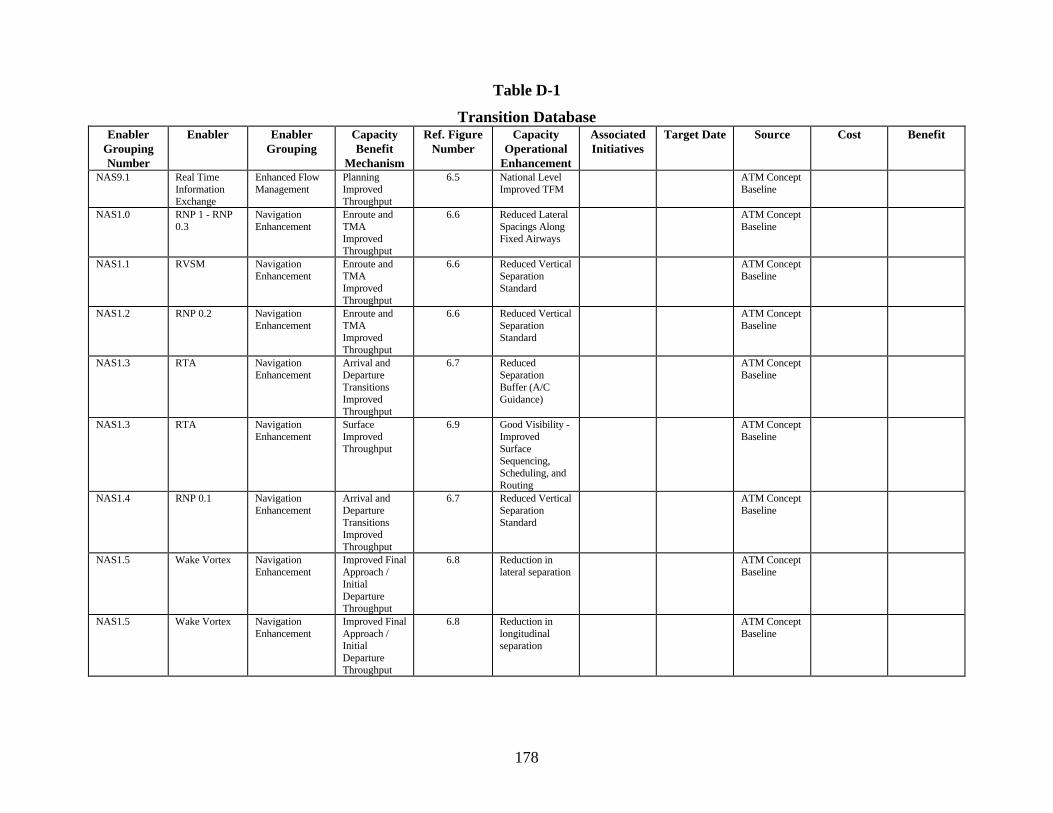
178
Table D-1
Transition DatabaseEnabler
GroupingNumber
Enabler EnablerGrouping
CapacityBenefit
Mechanism
Ref. FigureNumber
CapacityOperational
Enhancement
AssociatedInitiatives
Target Date Source Cost Benefit
NAS9.1 Real TimeInformationExchange
Enhanced FlowManagement
PlanningImprovedThroughput
6.5 National LevelImproved TFM
ATM ConceptBaseline
NAS1.0 RNP 1 - RNP0.3
NavigationEnhancement
Enroute andTMAImprovedThroughput
6.6 Reduced LateralSpacings AlongFixed Airways
ATM ConceptBaseline
NAS1.1 RVSM NavigationEnhancement
Enroute andTMAImprovedThroughput
6.6 Reduced VerticalSeparationStandard
ATM ConceptBaseline
NAS1.2 RNP 0.2 NavigationEnhancement
Enroute andTMAImprovedThroughput
6.6 Reduced VerticalSeparationStandard
ATM ConceptBaseline
NAS1.3 RTA NavigationEnhancement
Arrival andDepartureTransitionsImprovedThroughput
6.7 ReducedSeparationBuffer (A/CGuidance)
ATM ConceptBaseline
NAS1.3 RTA NavigationEnhancement
SurfaceImprovedThroughput
6.9 Good Visibility -ImprovedSurfaceSequencing,Scheduling, andRouting
ATM ConceptBaseline
NAS1.4 RNP 0.1 NavigationEnhancement
Arrival andDepartureTransitionsImprovedThroughput
6.7 Reduced VerticalSeparationStandard
ATM ConceptBaseline
NAS1.5 Wake Vortex NavigationEnhancement
Improved FinalApproach /InitialDepartureThroughput
6.8 Reduction inlateral separation
ATM ConceptBaseline
NAS1.5 Wake Vortex NavigationEnhancement
Improved FinalApproach /InitialDepartureThroughput
6.8 Reduction inlongitudinalseparation
ATM ConceptBaseline
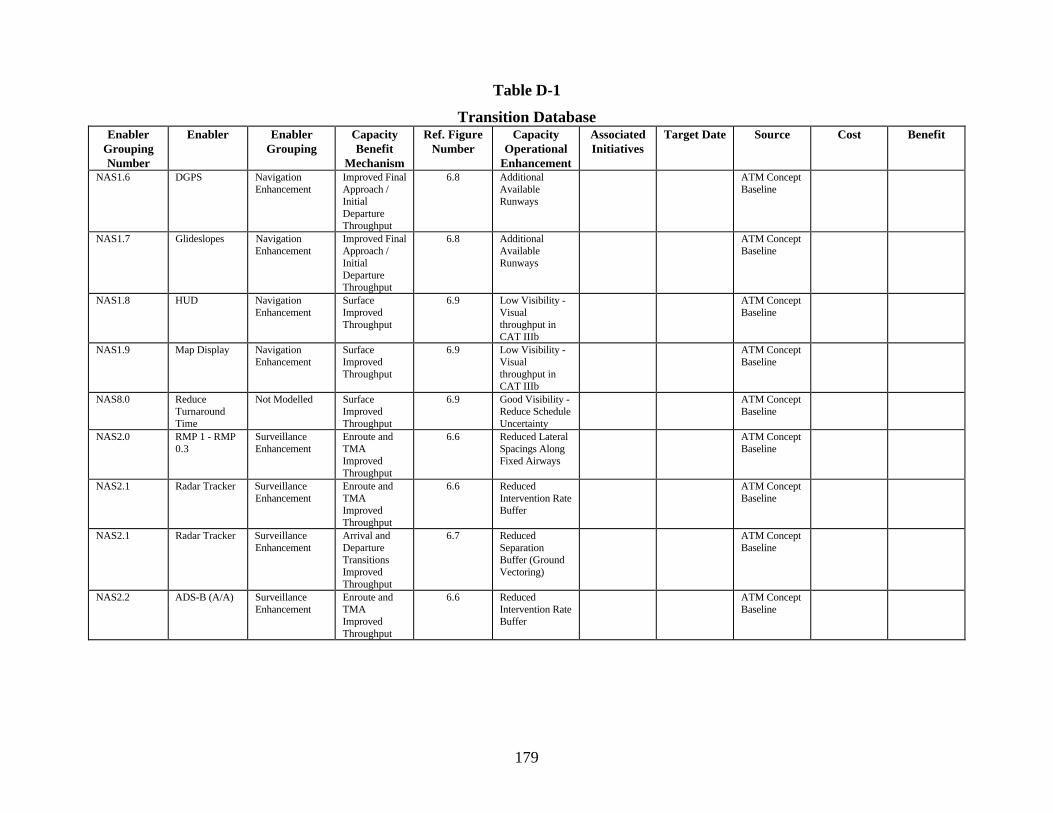
179
Table D-1
Transition DatabaseEnabler
GroupingNumber
Enabler EnablerGrouping
CapacityBenefit
Mechanism
Ref. FigureNumber
CapacityOperational
Enhancement
AssociatedInitiatives
Target Date Source Cost Benefit
NAS1.6 DGPS NavigationEnhancement
Improved FinalApproach /InitialDepartureThroughput
6.8 AdditionalAvailableRunways
ATM ConceptBaseline
NAS1.7 Glideslopes NavigationEnhancement
Improved FinalApproach /InitialDepartureThroughput
6.8 AdditionalAvailableRunways
ATM ConceptBaseline
NAS1.8 HUD NavigationEnhancement
SurfaceImprovedThroughput
6.9 Low Visibility -Visualthroughput inCAT IIIb
ATM ConceptBaseline
NAS1.9 Map Display NavigationEnhancement
SurfaceImprovedThroughput
6.9 Low Visibility -Visualthroughput inCAT IIIb
ATM ConceptBaseline
NAS8.0 ReduceTurnaroundTime
Not Modelled SurfaceImprovedThroughput
6.9 Good Visibility -Reduce ScheduleUncertainty
ATM ConceptBaseline
NAS2.0 RMP 1 - RMP0.3
SurveillanceEnhancement
Enroute andTMAImprovedThroughput
6.6 Reduced LateralSpacings AlongFixed Airways
ATM ConceptBaseline
NAS2.1 Radar Tracker SurveillanceEnhancement
Enroute andTMAImprovedThroughput
6.6 ReducedIntervention RateBuffer
ATM ConceptBaseline
NAS2.1 Radar Tracker SurveillanceEnhancement
Arrival andDepartureTransitionsImprovedThroughput
6.7 ReducedSeparationBuffer (GroundVectoring)
ATM ConceptBaseline
NAS2.2 ADS-B (A/A) SurveillanceEnhancement
Enroute andTMAImprovedThroughput
6.6 ReducedIntervention RateBuffer
ATM ConceptBaseline
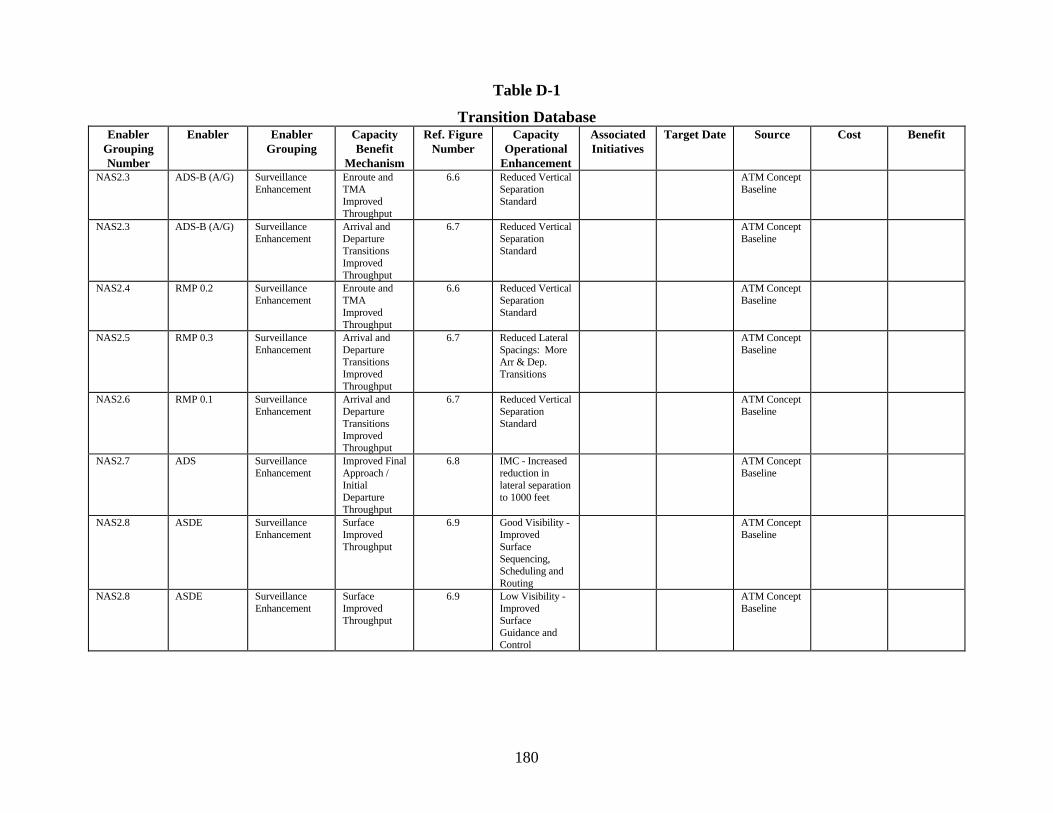
180
Table D-1
Transition DatabaseEnabler
GroupingNumber
Enabler EnablerGrouping
CapacityBenefit
Mechanism
Ref. FigureNumber
CapacityOperational
Enhancement
AssociatedInitiatives
Target Date Source Cost Benefit
NAS2.3 ADS-B (A/G) SurveillanceEnhancement
Enroute andTMAImprovedThroughput
6.6 Reduced VerticalSeparationStandard
ATM ConceptBaseline
NAS2.3 ADS-B (A/G) SurveillanceEnhancement
Arrival andDepartureTransitionsImprovedThroughput
6.7 Reduced VerticalSeparationStandard
ATM ConceptBaseline
NAS2.4 RMP 0.2 SurveillanceEnhancement
Enroute andTMAImprovedThroughput
6.6 Reduced VerticalSeparationStandard
ATM ConceptBaseline
NAS2.5 RMP 0.3 SurveillanceEnhancement
Arrival andDepartureTransitionsImprovedThroughput
6.7 Reduced LateralSpacings: MoreArr & Dep.Transitions
ATM ConceptBaseline
NAS2.6 RMP 0.1 SurveillanceEnhancement
Arrival andDepartureTransitionsImprovedThroughput
6.7 Reduced VerticalSeparationStandard
ATM ConceptBaseline
NAS2.7 ADS SurveillanceEnhancement
Improved FinalApproach /InitialDepartureThroughput
6.8 IMC - Increasedreduction inlateral separationto 1000 feet
ATM ConceptBaseline
NAS2.8 ASDE SurveillanceEnhancement
SurfaceImprovedThroughput
6.9 Good Visibility -ImprovedSurfaceSequencing,Scheduling andRouting
ATM ConceptBaseline
NAS2.8 ASDE SurveillanceEnhancement
SurfaceImprovedThroughput
6.9 Low Visibility -ImprovedSurfaceGuidance andControl
ATM ConceptBaseline
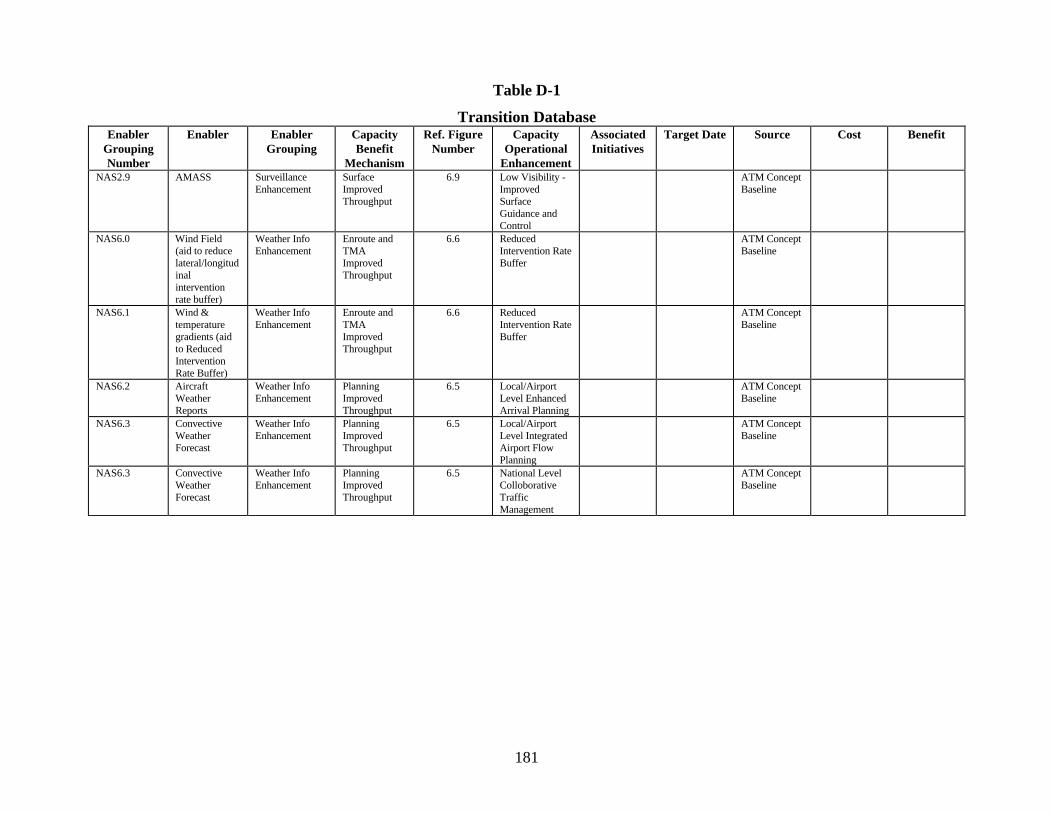
181
Table D-1
Transition DatabaseEnabler
GroupingNumber
Enabler EnablerGrouping
CapacityBenefit
Mechanism
Ref. FigureNumber
CapacityOperational
Enhancement
AssociatedInitiatives
Target Date Source Cost Benefit
NAS2.9 AMASS SurveillanceEnhancement
SurfaceImprovedThroughput
6.9 Low Visibility -ImprovedSurfaceGuidance andControl
ATM ConceptBaseline
NAS6.0 Wind Field(aid to reducelateral/longitudinalinterventionrate buffer)
Weather InfoEnhancement
Enroute andTMAImprovedThroughput
6.6 ReducedIntervention RateBuffer
ATM ConceptBaseline
NAS6.1 Wind &temperaturegradients (aidto ReducedInterventionRate Buffer)
Weather InfoEnhancement
Enroute andTMAImprovedThroughput
6.6 ReducedIntervention RateBuffer
ATM ConceptBaseline
NAS6.2 AircraftWeatherReports
Weather InfoEnhancement
PlanningImprovedThroughput
6.5 Local/AirportLevel EnhancedArrival Planning
ATM ConceptBaseline
NAS6.3 ConvectiveWeatherForecast
Weather InfoEnhancement
PlanningImprovedThroughput
6.5 Local/AirportLevel IntegratedAirport FlowPlanning
ATM ConceptBaseline
NAS6.3 ConvectiveWeatherForecast
Weather InfoEnhancement
PlanningImprovedThroughput
6.5 National LevelColloborativeTrafficManagement
ATM ConceptBaseline

182
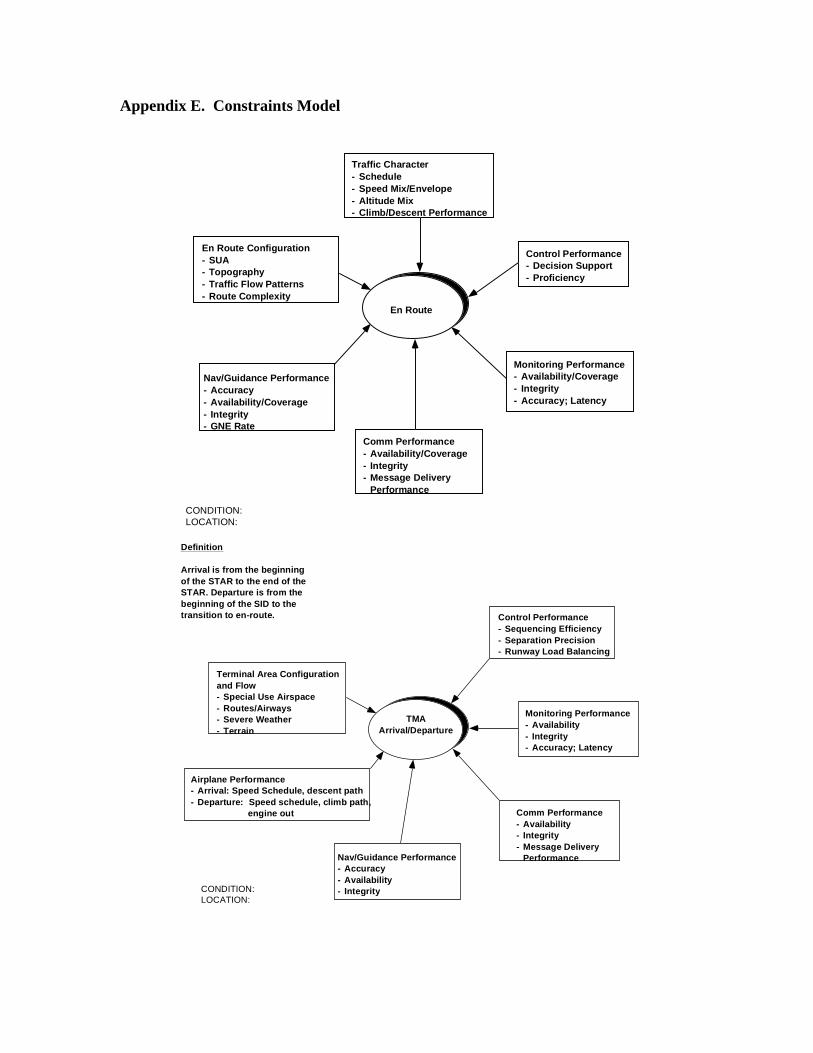
Appendix E. Constraints Model
Monitoring Performance- Availability/Coverage- Integrity- Accuracy; Latency
Traffic Character- Schedule- Speed Mix/Envelope- Altitude Mix- Climb/Descent Performance
Nav/Guidance Performance- Accuracy- Availability/Coverage- Integrity- GNE Rate
Comm Performance- Availability/Coverage- Integrity- Message Delivery
Performance
Control Performance- Decision Support- Proficiency
En Route Configuration- SUA- Topography- Traffic Flow Patterns- Route Complexity
En Route
CONDITION:LOCATION:
Airplane Performance- Arrival: Speed Schedule, descent path- Departure: Speed schedule, climb path,
engine out
Nav/Guidance Performance- Accuracy- Availability- Integrity
Comm Performance- Availability- Integrity- Message Delivery
Performance
Monitoring Performance- Availability- Integrity- Accuracy; Latency
Control Performance- Sequencing Efficiency- Separation Precision- Runway Load Balancing
Terminal Area Configurationand Flow- Special Use Airspace- Routes/Airways- Severe Weather- Terrain
TMAArrival/Departure
Definition
Arrival is from the beginningof the STAR to the end of theSTAR. Departure is from thebeginning of the SID to thetransition to en-route.
CONDITION:LOCATION:
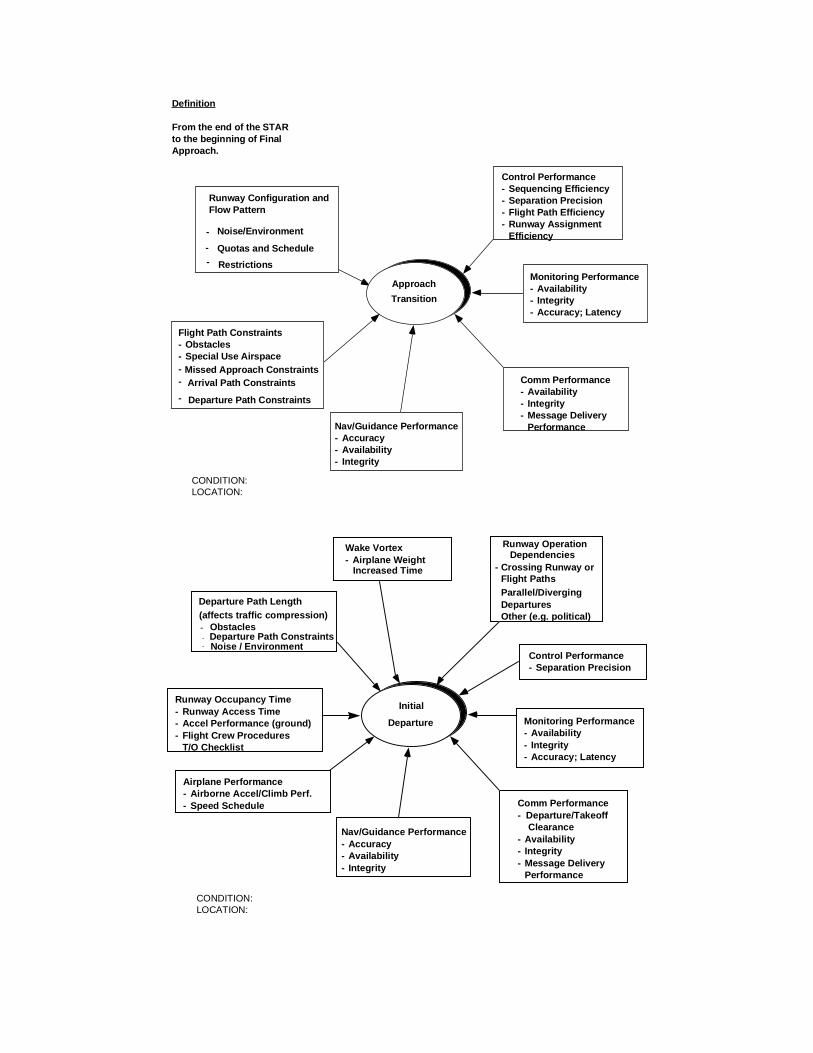
Flight Path Constraints- Obstacles- Special Use Airspace- Missed Approach Constraints- Arrival Path Constraints
- Departure Path Constraints
Nav/Guidance Performance- Accuracy- Availability- Integrity
Comm Performance- Availability- Integrity- Message Delivery
Performance
Monitoring Performance- Availability- Integrity- Accuracy; Latency
Control Performance- Sequencing Efficiency- Separation Precision- Flight Path Efficiency- Runway Assignment
Efficiency
Runway Configuration andFlow Pattern
Noise/Environment
-Quotas and Schedule
Restrictions
Approach
Transition
CONDITION:LOCATION:
Definition
From the end of the STARto the beginning of FinalApproach.
-
-
Wake Vortex- Airplane Weight
Increased Time
Runway Occupancy Time- Runway Access Time- Accel Performance (ground)- Flight Crew Procedures
T/O Checklist
Nav/Guidance Performance- Accuracy- Availability- Integrity
Comm Performance- Departure/Takeoff Clearance- Availability- Integrity- Message Delivery
Performance
Monitoring Performance- Availability- Integrity- Accuracy; Latency
Control Performance- Separation Precision
Initial
Departure
Airplane Performance- Airborne Accel/Climb Perf.- Speed Schedule
Runway OperationDependencies
- Crossing Runway or Flight PathsParallel/DivergingDeparturesOther (e.g. political)
CONDITION:LOCATION:
Departure Path Length(affects traffic compression)- Obstacles- Departure Path Constraints- Noise / Environment
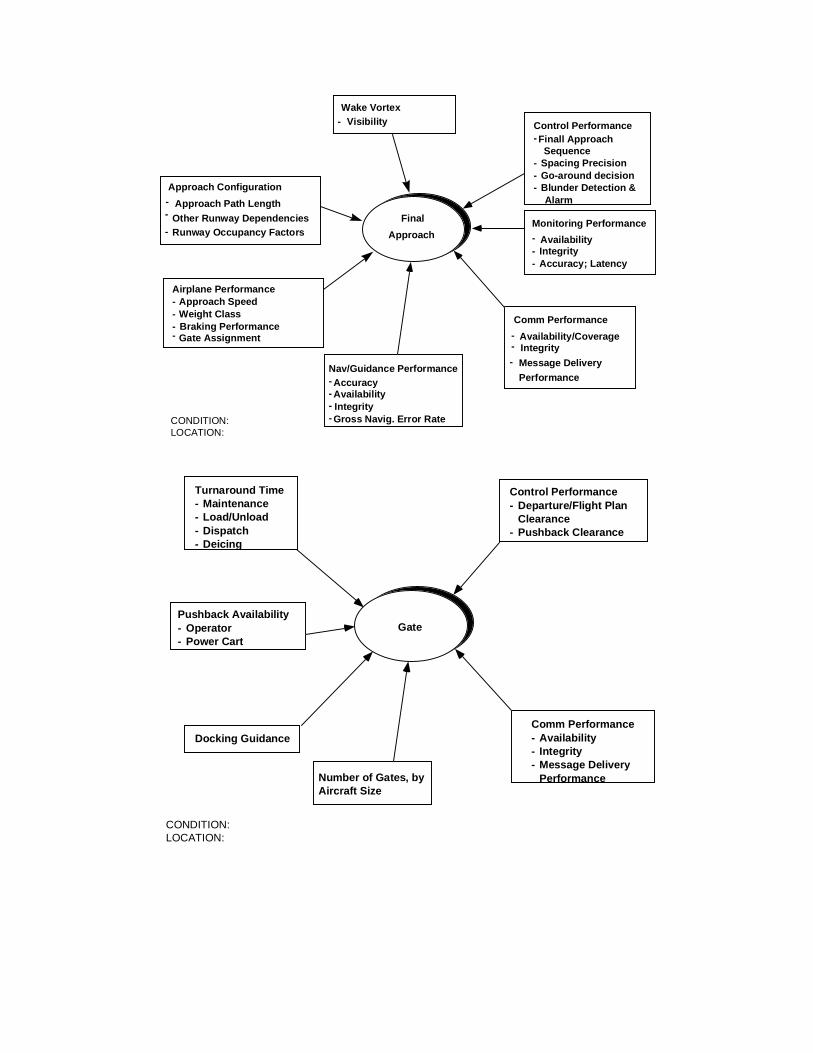
Wake Vortex- Visibility
Approach Configuration--
-Other Runway DependenciesRunway Occupancy Factors
Nav/Guidance Performance-
Gross Navig. Error Rate
-Accuracy
-Availability
-Integrity
Comm Performance
- Availability/Coverage- Integrity- Message Delivery
Performance
Monitoring Performance- Availability- Integrity- Accuracy; Latency
Control Performance-
Spacing Precision
Finall Approach Sequence
- Go-around decision- Blunder Detection & AlarmApproach Path Length
Final
Approach
CONDITION: LOCATION:
Airplane Performance-
Weight Class-Approach Speed
- Braking Performance
-
Gate Assignment-
Docking Guidance
Number of Gates, byAircraft Size
Comm Performance- Availability- Integrity- Message Delivery
Performance
Control Performance- Departure/Flight Plan
Clearance- Pushback Clearance
Turnaround Time- Maintenance- Load/Unload- Dispatch- Deicing
Gate
CONDITION:LOCATION:
Pushback Availability- Operator- Power Cart
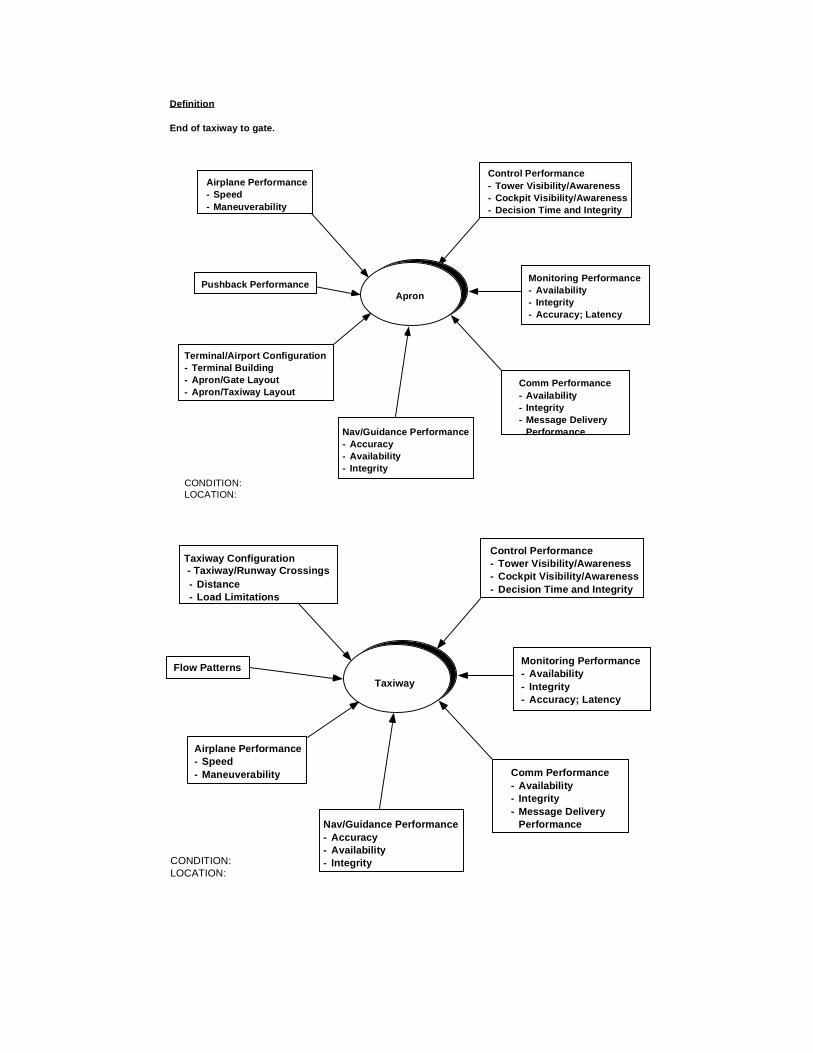
Control Performance- Tower Visibility/Awareness- Cockpit Visibility/Awareness- Decision Time and Integrity
Pushback Performance
Comm Performance- Availability- Integrity- Message Delivery
Performance
Airplane Performance- Speed- Maneuverability
Apron
CONDITION:LOCATION:
Nav/Guidance Performance- Accuracy- Availability- Integrity
Monitoring Performance- Availability- Integrity- Accuracy; Latency
Definition
End of taxiway to gate.
Terminal/Airport Configuration- Terminal Building- Apron/Gate Layout- Apron/Taxiway Layout
Comm Performance- Availability- Integrity- Message Delivery
Performance
Control Performance- Tower Visibility/Awareness- Cockpit Visibility/Awareness- Decision Time and Integrity
Taxiway Configuration - Taxiway/Runway Crossings- Distance- Load Limitations
Taxiway
CONDITION:LOCATION:
Flow Patterns
Nav/Guidance Performance- Accuracy- Availability- Integrity
Monitoring Performance- Availability- Integrity- Accuracy; Latency
Airplane Performance- Speed- Maneuverability