Embed Size (px)
Citation preview
190442.02FA - 5th December 2019
TRAFFIC AND PARKING IMPACT ASSESSMENT OF
THE RESIDENTIAL DEVELOPMENT
AT 1-7 ANDERSON AVENUE & 12 EL ALAMEIN AVENUE, LIVERPOOL
Address: Shop 7, 720 Old Princes Highway Sutherland NSW 2232
Postal: P.O Box 66 Sutherland NSW 1499
Telephone: +61 2 8355 2440
Fax: +61 2 9521 7199
Web: www.mclarentraffic.com.au
Email: [email protected]
Division of RAMTRANS Australia ABN: 45067491678 RPEQ: 19457
Transport Planning, Traffic Impact Assessments, Road Safety Audits, Expert Witness
190442.02FA - 5th December 2019
Development Type: Residential Development
Site Address: 1-7 Anderson Avenue & 12 El Alamein Avenue, Liverpool
Prepared for: Kennedy Associates Architects
Document reference: 190442.02FA
Please be aware that all information and material contained in this report is the property of McLaren Traffic
Engineering. The information contained in this document is confidential and intended solely for the use of the
client for the purpose for which it has been prepared and no representation is made or if to be implied as being
made to any third party. Any third party wishing to distribute this document in whole or in part for personal or
commercial use must obtain written confirmation from McLaren Traffic Engineering prior to doing so. Failure
to obtain written permission may constitute an infringement of copyright and may be liable for legal action.
Status Issue Prepared By Checked By Date
Draft A DF DF 5th December 2019
Final A DF DF 5th December 2019
190442.02FA - 5th December 2019
TABLE OF CONTENTS
INTRODUCTION ................................................................................................................. 1
1.1 Description and Scale of Development ............................................................................................. 1 1.2 State Environmental Planning Policy (Infrastructure) 2007 ............................................................... 1 1.3 Site Description .................................................................................................................................. 1 1.4 Site Context ....................................................................................................................................... 2
EXISTING TRAFFIC AND PARKING CONDITIONS .......................................................... 3
2.1 Road Hierarchy .................................................................................................................................. 3 Anderson Avenue ................................................................................................................................. 3 Hillier Road ........................................................................................................................................... 3 Moore Street ......................................................................................................................................... 3 Alamein Avenue ................................................................................................................................... 3
2.2 Existing Traffic Management ............................................................................................................. 4 2.3 Existing Traffic Volumes .................................................................................................................... 4
Existing Road Performance .................................................................................................................. 4
2.4 Public Transport ................................................................................................................................. 5 2.5 Future Road and Infrastructure Upgrades ......................................................................................... 6
PARKING ASSESSMENT .................................................................................................. 7
3.1 Disabled Parking ................................................................................................................................ 8 3.2 Bicycle & Motorcycle Parking Requirements ..................................................................................... 9 3.3 Servicing & Loading ......................................................................................................................... 10 3.4 Car Park Design & Compliance ....................................................................................................... 10
Required Changes .............................................................................................................................. 10
TRAFFIC ASSESSMENT ................................................................................................. 12
4.1 Traffic Generation ............................................................................................................................ 12 4.2 Trip Assignment ............................................................................................................................... 12 4.3 Traffic Impact ................................................................................................................................... 13
CONCLUSION .................................................................................................................. 15
Residential Development Page 1 of 15 1-7 Anderson Avenue & 12 El Alamein Avenue, Liverpool 190442.02FA - 5th December 2019
INTRODUCTION
MCLaren Traffic Engineering was commissioned by Kennedy Associates Architects to
provide a Traffic and Parking Impact Assessment of the Residential Development at 1-7
Anderson Avenue & 12 El Alamein Avenue, Liverpool as depicted in Annexure A.
1.1 Description and Scale of Development
The proposed development has the following characteristics relevant to traffic and parking:
• A total of 63 units across three (3) buildings consisting of:
o 15 x one-bedroom apartments;
o 43 x two-bedroom apartments;
o 5 x three-bedroom apartments;
• 34 of the proposed units are Affordable Renting Houses (ARH);
• Two (2) basement parking levels with vehicular access via a proposed two-way
driveway from Anderson Avenue, accommodating a total of 78 car spaces including:
o 70 residential car spaces including five (5) disabled spaces;
o 8 visitor car spaces including two (1) spaces capable for use by disabled
persons.
1.2 State Environmental Planning Policy (Infrastructure) 2007
The proposed development does not qualify as a traffic generating development with
relevant size and/or capacity under Clause 104 of the SEPP (Infrastructure) 2007.
Accordingly, formal referral to the Roads and Maritime Services (RMS) is unnecessary and
the application can be assessed by Liverpool City Council officers accordingly.
1.3 Site Description
The subject is currently zoned R4 – High Density Residential under the Liverpool City
Council LEP 2008 and is currently occupied by a single residential dwelling. The site has
frontages to Anderson Avenue to the south and Hillier Road to the east.
The site is generally surrounded by low to medium density residential developments with
Whitlam Leisure Centre to the south and the Liverpool City Centre to the east of the subject
site. The site is within close proximity to bus stops located north and south of the site.
Residential Development Page 2 of 15 1-7 Anderson Avenue & 12 El Alamein Avenue, Liverpool 190442.02FA - 5th December 2019
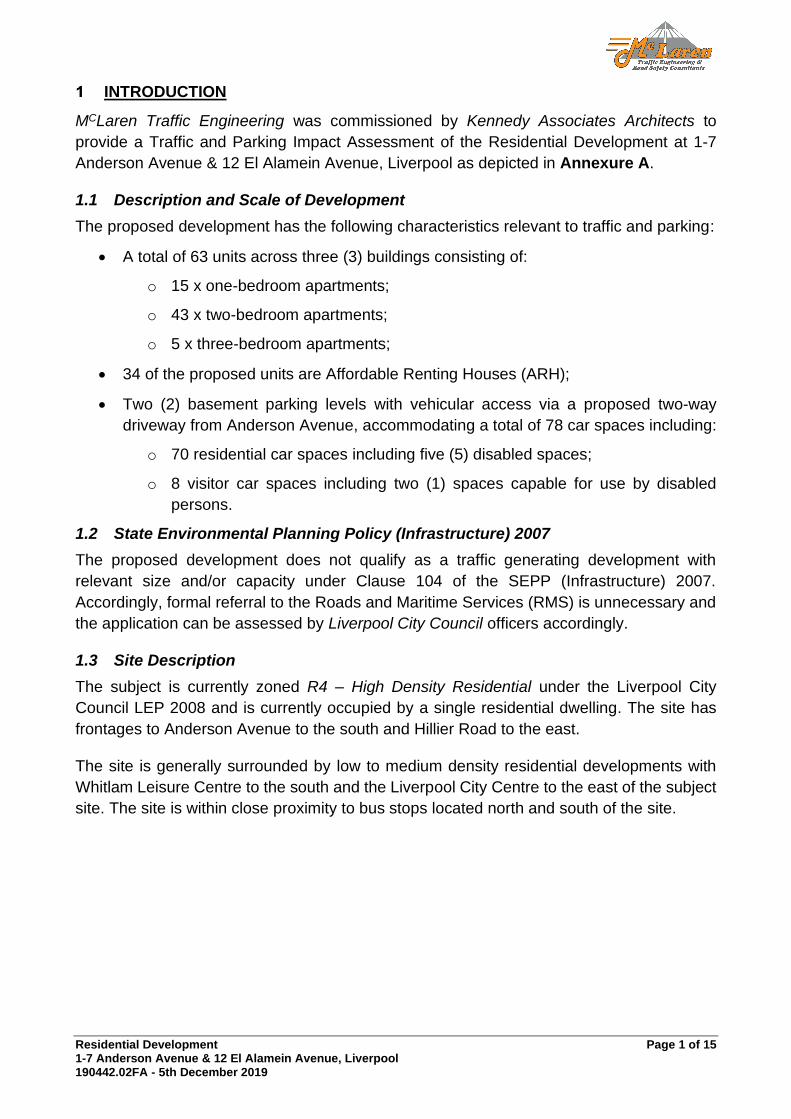
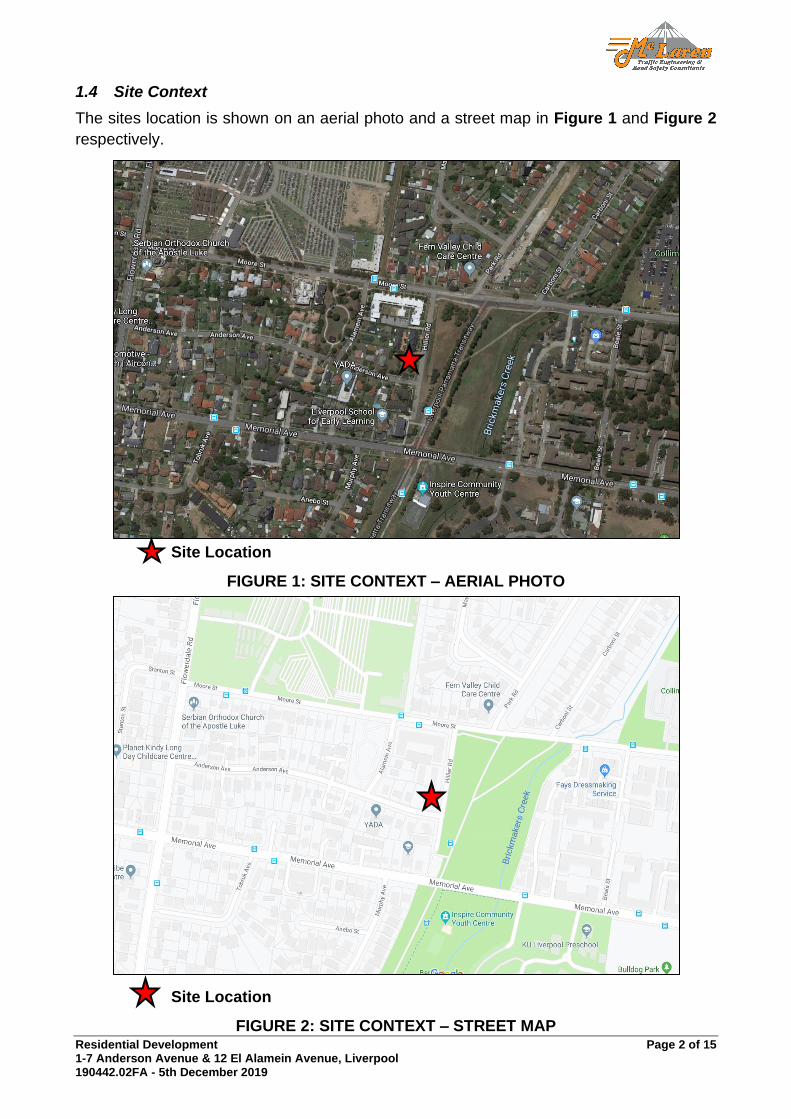
1.4 Site Context
The sites location is shown on an aerial photo and a street map in Figure 1 and Figure 2
respectively.
Site Location
FIGURE 1: SITE CONTEXT – AERIAL PHOTO
Site Location
FIGURE 2: SITE CONTEXT – STREET MAP
Residential Development Page 3 of 15 1-7 Anderson Avenue & 12 El Alamein Avenue, Liverpool 190442.02FA - 5th December 2019
EXISTING TRAFFIC AND PARKING CONDITIONS
2.1 Road Hierarchy
The road network servicing the site has characteristics as described in the following sub-
sections.
Anderson Avenue
• Unclassified LOCAL Road;
• Approximately 7.5m wide carriageway facilitating one traffic-flow lane with
opportunities for two way passing at driveways and kerbside parking.
• Signposted 50km/h speed limit;
• Unrestricted kerbside parking permitted along both sides of the road.
Hillier Road
• Unclassified LOCAL Road;
• Approximately 7m wide carriageway facilitating one-traffic lane in each direction and
kerbside parking.;
• Informal kerbside parking available on the western side of the street;
• No speed limit signposted, 50km/h speed limit applies;
• Unrestricted kerbside parking permitted along both sides of the road.
Moore Street
• Unclassified COLLECTOR Road;
• Approximately 11m wide carriageway facilitating two traffic-flow lanes (one in each
direction) and kerbside parking;
• Signposted 50km/h speed limit;
• Unrestricted kerbside parking permitted along both sides of the road.
Alamein Avenue
• Unclassified LOCAL Road;
• Approximately 7m wide carriageway facilitating one traffic-flow lane with opportunities
for two-way passing at driveway and kerbside parking
• No speed limit signposted, 50km/h speed limit applies;
• Unrestricted kerbside parking permitted along both sides of the road.
Residential Development Page 4 of 15 1-7 Anderson Avenue & 12 El Alamein Avenue, Liverpool 190442.02FA - 5th December 2019
2.2 Existing Traffic Management
• Priority controlled intersection of Anderson Avenue / Alamein Avenue;
• Priority controlled intersection of Anderson Avenue / Hillier Road;
• Priority controlled intersection of Hillier Road / Moore Street;
• Priority controlled intersection of Moore Street / Alamein Avenue.
2.3 Existing Traffic Volumes
Intersection traffic surveys were conducted at the intersections of Flowerdale Road /
Anderson Avenue and Moore Street / Hiller Road from 7:00 AM to 9:00 AM and 4:00 PM to
7:00 PM on Monday the 5th of August 2019 representing a typical operating weekday. The
full survey results are shown in Annexure B for reference.
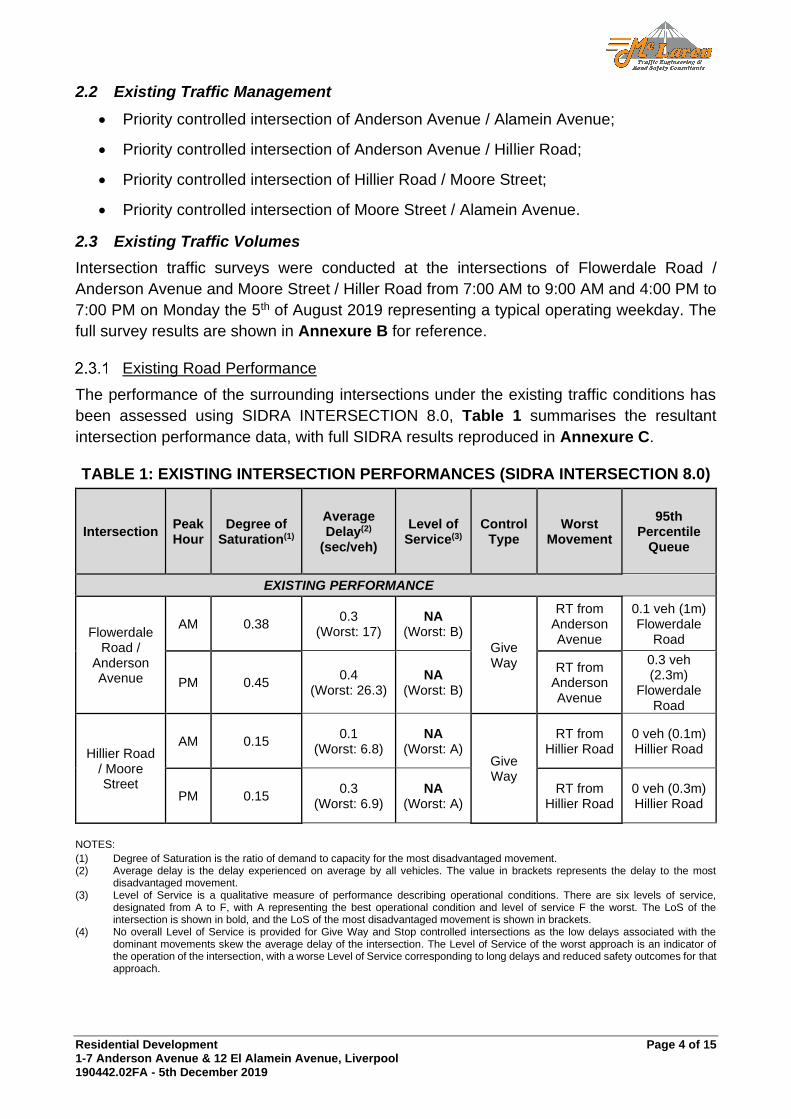
Existing Road Performance
The performance of the surrounding intersections under the existing traffic conditions has
been assessed using SIDRA INTERSECTION 8.0, Table 1 summarises the resultant
intersection performance data, with full SIDRA results reproduced in Annexure C.
TABLE 1: EXISTING INTERSECTION PERFORMANCES (SIDRA INTERSECTION 8.0)
Intersection Peak Hour
Degree of Saturation(1)
Average Delay(2)
(sec/veh)
Level of Service(3)
Control Type
Worst Movement
95th Percentile
Queue
EXISTING PERFORMANCE
Flowerdale Road /
Anderson Avenue
AM 0.38 0.3
(Worst: 17) NA
(Worst: B)
Give Way
RT from Anderson Avenue
0.1 veh (1m) Flowerdale
Road
PM 0.45 0.4
(Worst: 26.3) NA
(Worst: B)
RT from Anderson Avenue
0.3 veh (2.3m)
Flowerdale Road
Hillier Road / Moore Street
AM 0.15 0.1
(Worst: 6.8) NA
(Worst: A) Give Way
RT from Hillier Road
0 veh (0.1m) Hillier Road
PM 0.15 0.3
(Worst: 6.9) NA
(Worst: A) RT from
Hillier Road 0 veh (0.3m) Hillier Road
NOTES:
(1) Degree of Saturation is the ratio of demand to capacity for the most disadvantaged movement. (2) Average delay is the delay experienced on average by all vehicles. The value in brackets represents the delay to the most
disadvantaged movement. (3) Level of Service is a qualitative measure of performance describing operational conditions. There are six levels of service,
designated from A to F, with A representing the best operational condition and level of service F the worst. The LoS of the intersection is shown in bold, and the LoS of the most disadvantaged movement is shown in brackets.
(4) No overall Level of Service is provided for Give Way and Stop controlled intersections as the low delays associated with the dominant movements skew the average delay of the intersection. The Level of Service of the worst approach is an indicator of the operation of the intersection, with a worse Level of Service corresponding to long delays and reduced safety outcomes for that approach.
Residential Development Page 5 of 15 1-7 Anderson Avenue & 12 El Alamein Avenue, Liverpool 190442.02FA - 5th December 2019
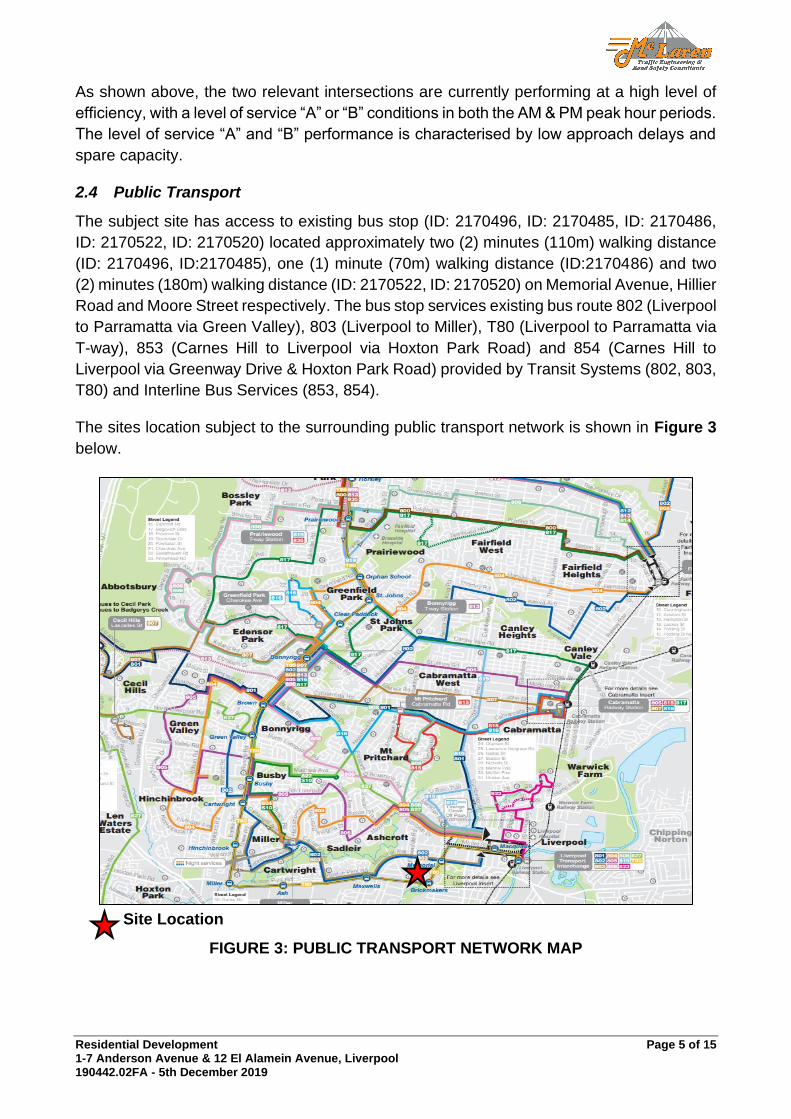
As shown above, the two relevant intersections are currently performing at a high level of
efficiency, with a level of service “A” or “B” conditions in both the AM & PM peak hour periods.
The level of service “A” and “B” performance is characterised by low approach delays and
spare capacity.
2.4 Public Transport
The subject site has access to existing bus stop (ID: 2170496, ID: 2170485, ID: 2170486,
ID: 2170522, ID: 2170520) located approximately two (2) minutes (110m) walking distance
(ID: 2170496, ID:2170485), one (1) minute (70m) walking distance (ID:2170486) and two
(2) minutes (180m) walking distance (ID: 2170522, ID: 2170520) on Memorial Avenue, Hillier
Road and Moore Street respectively. The bus stop services existing bus route 802 (Liverpool
to Parramatta via Green Valley), 803 (Liverpool to Miller), T80 (Liverpool to Parramatta via
T-way), 853 (Carnes Hill to Liverpool via Hoxton Park Road) and 854 (Carnes Hill to
Liverpool via Greenway Drive & Hoxton Park Road) provided by Transit Systems (802, 803,
T80) and Interline Bus Services (853, 854).
The sites location subject to the surrounding public transport network is shown in Figure 3
below.
Site Location
FIGURE 3: PUBLIC TRANSPORT NETWORK MAP
Residential Development Page 6 of 15 1-7 Anderson Avenue & 12 El Alamein Avenue, Liverpool 190442.02FA - 5th December 2019
2.5 Future Road and Infrastructure Upgrades
From Liverpool Council’s Development Application tracker and RMS Projects website, it
appears that there are no future planned road or public transport changes that will affect
traffic conditions within the immediate vicinity of the subject site.
Residential Development Page 7 of 15 1-7 Anderson Avenue & 12 El Alamein Avenue, Liverpool 190442.02FA - 5th December 2019
PARKING ASSESSMENT
Reference is made to the State Environmental Planning Policy (Affordable Rental Housing)
2009 referred to as SEPP (ARH) hereafter, which designates the following car, bicycle and
motorcycle parking rates applicable to the affordable renting housing portion of the proposed
development:
(14) Standards that cannot be used to refuse consent
(2) General
(a) parking
(i) in the case of a development application made by a social
housing provider for development on land in an accessible area
– at least 0.4 parking spaces are provided for each dwelling
containing 1 bedroom, at least 0.5 parking spaces are provided
for each dwelling containing 2 bedrooms and at least 1 parking
space is provided for each dwelling containing 3 or more
bedrooms, or…
It must be noted that the development application is made on behalf of a social housing
provider.
The proposed development provides a combination of both Affordable Renting Housing and
traditional units. Reference is made to Liverpool Development Control Plan 2008 Part 1 –
General Controls for all development – Section 20: Car Parking and Access – Table 13 Car
Parking, Servicing and Loading Provision which designates the following car parking rates
applicable to the proposed development:
20.2 Car Parking Provision and Service Facilities by Land Use
1. Tables 11, 12 and 13 outline the number of car parking spaces… in
proposals where calculations of the car parking requirements result in
fractions of spaces being required, the fraction will be rounded up to
the nearest whole space…
Multi dwelling housing and residential flat buildings
Residential & Business zones:
1 space per small dwelling (<65sqm) or 1 bedroom
1.5 spaces per medium dwelling (65-110sqm) or 2 bedrooms
2 spaces per large dwelling (>110sqm) or 3 or more bedroom
1 visitor car space for every 4 dwellings or part thereof
The car parking requirements of the proposal with application of both SEPP (ARH) 2009
rates and Council’s DCP rates are outline in Table 2.
Residential Development Page 8 of 15 1-7 Anderson Avenue & 12 El Alamein Avenue, Liverpool 190442.02FA - 5th December 2019
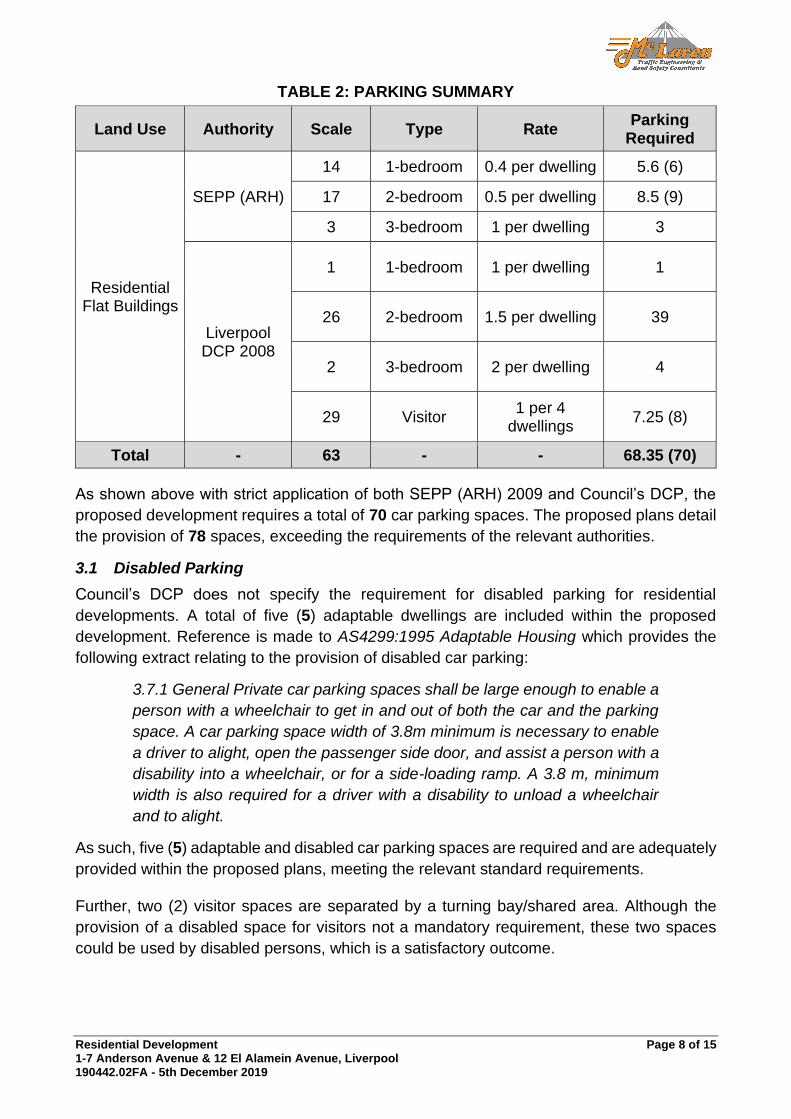
TABLE 2: PARKING SUMMARY
Land Use Authority Scale Type Rate Parking
Required
Residential Flat Buildings
SEPP (ARH)
14 1-bedroom 0.4 per dwelling 5.6 (6)
17 2-bedroom 0.5 per dwelling 8.5 (9)
3 3-bedroom 1 per dwelling 3
Liverpool DCP 2008
1 1-bedroom 1 per dwelling 1
26 2-bedroom 1.5 per dwelling 39
2 3-bedroom 2 per dwelling 4
29 Visitor 1 per 4
dwellings 7.25 (8)
Total - 63 - - 68.35 (70)
As shown above with strict application of both SEPP (ARH) 2009 and Council’s DCP, the
proposed development requires a total of 70 car parking spaces. The proposed plans detail
the provision of 78 spaces, exceeding the requirements of the relevant authorities.
3.1 Disabled Parking
Council’s DCP does not specify the requirement for disabled parking for residential
developments. A total of five (5) adaptable dwellings are included within the proposed
development. Reference is made to AS4299:1995 Adaptable Housing which provides the
following extract relating to the provision of disabled car parking:
3.7.1 General Private car parking spaces shall be large enough to enable a
person with a wheelchair to get in and out of both the car and the parking
space. A car parking space width of 3.8m minimum is necessary to enable
a driver to alight, open the passenger side door, and assist a person with a
disability into a wheelchair, or for a side-loading ramp. A 3.8 m, minimum
width is also required for a driver with a disability to unload a wheelchair
and to alight.
As such, five (5) adaptable and disabled car parking spaces are required and are adequately
provided within the proposed plans, meeting the relevant standard requirements.
Further, two (2) visitor spaces are separated by a turning bay/shared area. Although the
provision of a disabled space for visitors not a mandatory requirement, these two spaces
could be used by disabled persons, which is a satisfactory outcome.
Residential Development Page 9 of 15 1-7 Anderson Avenue & 12 El Alamein Avenue, Liverpool 190442.02FA - 5th December 2019
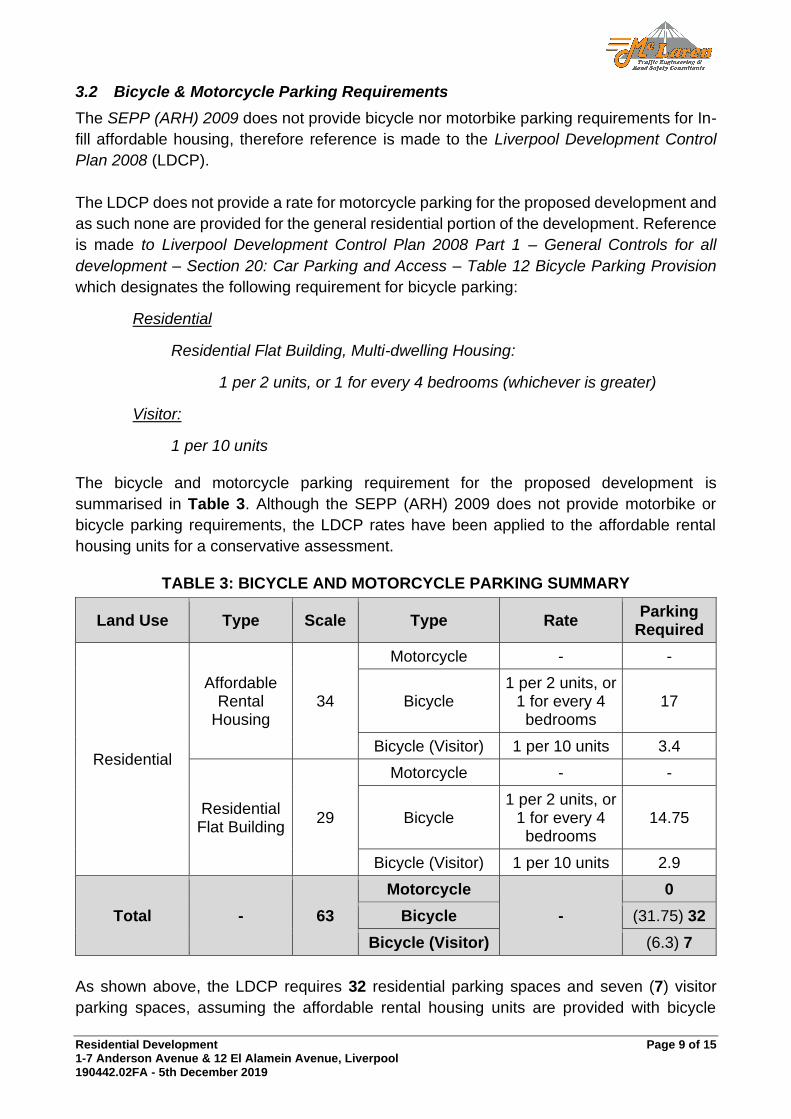
3.2 Bicycle & Motorcycle Parking Requirements
The SEPP (ARH) 2009 does not provide bicycle nor motorbike parking requirements for In-
fill affordable housing, therefore reference is made to the Liverpool Development Control
Plan 2008 (LDCP).
The LDCP does not provide a rate for motorcycle parking for the proposed development and
as such none are provided for the general residential portion of the development. Reference
is made to Liverpool Development Control Plan 2008 Part 1 – General Controls for all
development – Section 20: Car Parking and Access – Table 12 Bicycle Parking Provision
which designates the following requirement for bicycle parking:
Residential
Residential Flat Building, Multi-dwelling Housing:
1 per 2 units, or 1 for every 4 bedrooms (whichever is greater)
Visitor:
1 per 10 units
The bicycle and motorcycle parking requirement for the proposed development is
summarised in Table 3. Although the SEPP (ARH) 2009 does not provide motorbike or
bicycle parking requirements, the LDCP rates have been applied to the affordable rental
housing units for a conservative assessment.
TABLE 3: BICYCLE AND MOTORCYCLE PARKING SUMMARY
Land Use Type Scale Type Rate Parking
Required
Residential
Affordable Rental
Housing 34
Motorcycle - -
Bicycle 1 per 2 units, or
1 for every 4 bedrooms
17
Bicycle (Visitor) 1 per 10 units 3.4
Residential Flat Building
29
Motorcycle - -
Bicycle 1 per 2 units, or
1 for every 4 bedrooms
14.75
Bicycle (Visitor) 1 per 10 units 2.9
Total - 63
Motorcycle
-
0
Bicycle (31.75) 32
Bicycle (Visitor) (6.3) 7
As shown above, the LDCP requires 32 residential parking spaces and seven (7) visitor
parking spaces, assuming the affordable rental housing units are provided with bicycle
Residential Development Page 10 of 15 1-7 Anderson Avenue & 12 El Alamein Avenue, Liverpool 190442.02FA - 5th December 2019
parking at the same rate as the LDCP. The proposed plans detail 42 bicycle parking spaces,
satisfying the requirements of the relevant authorities.
3.3 Servicing & Loading
Reference is made to Liverpool Development Control Plan 2008 Part 1 – General Controls
for all development which designates the following requirement for servicing and loading
applicable to the proposed site:
Residential Flat Building, Multi-dwelling housing:
Service access for removalists and garbage servicing.
Access to waste and recycling storage:
5. Waste and recycling collection vehicles should be able to service
the development efficiently and effectively with no need to reverse…
6. Council and waste collection contractor vehicles will not enter
private property including driveways to collect waste or recycling.
Waste collection will take place off-street as per the existing operations of the sites. The
building manager will utilise the motorised bin tug to move bins from the basement to the
street for collection.
3.4 Car Park Design & Compliance
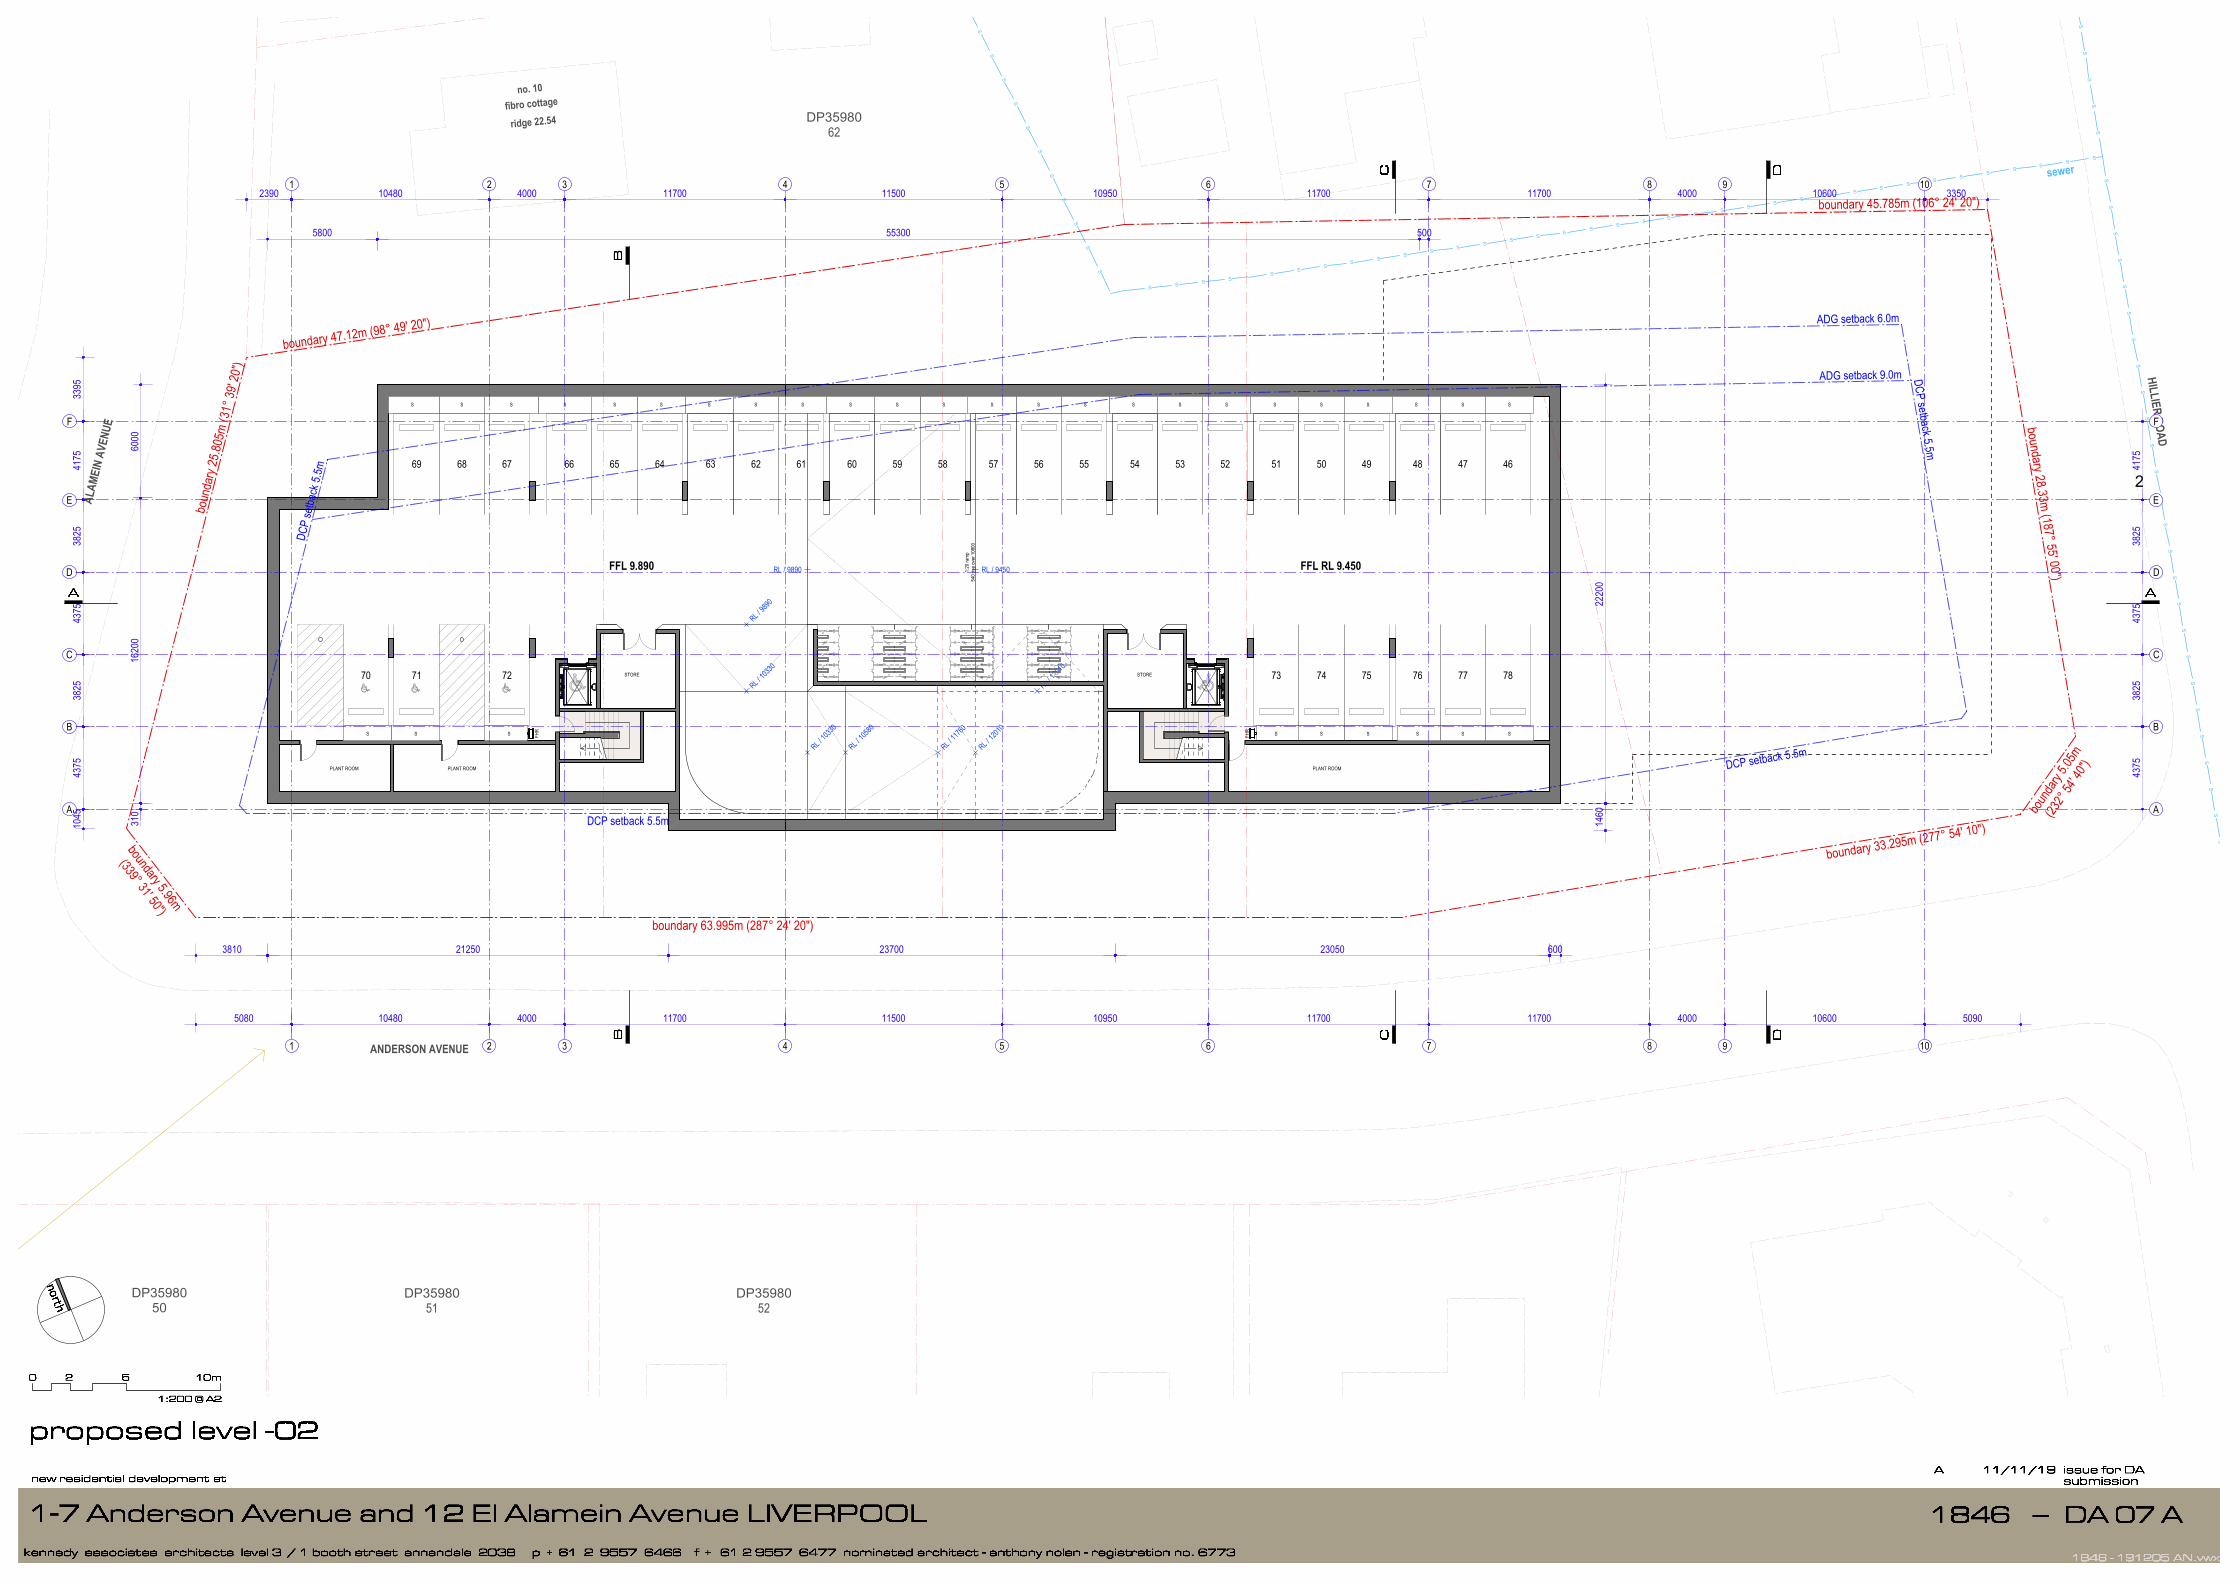
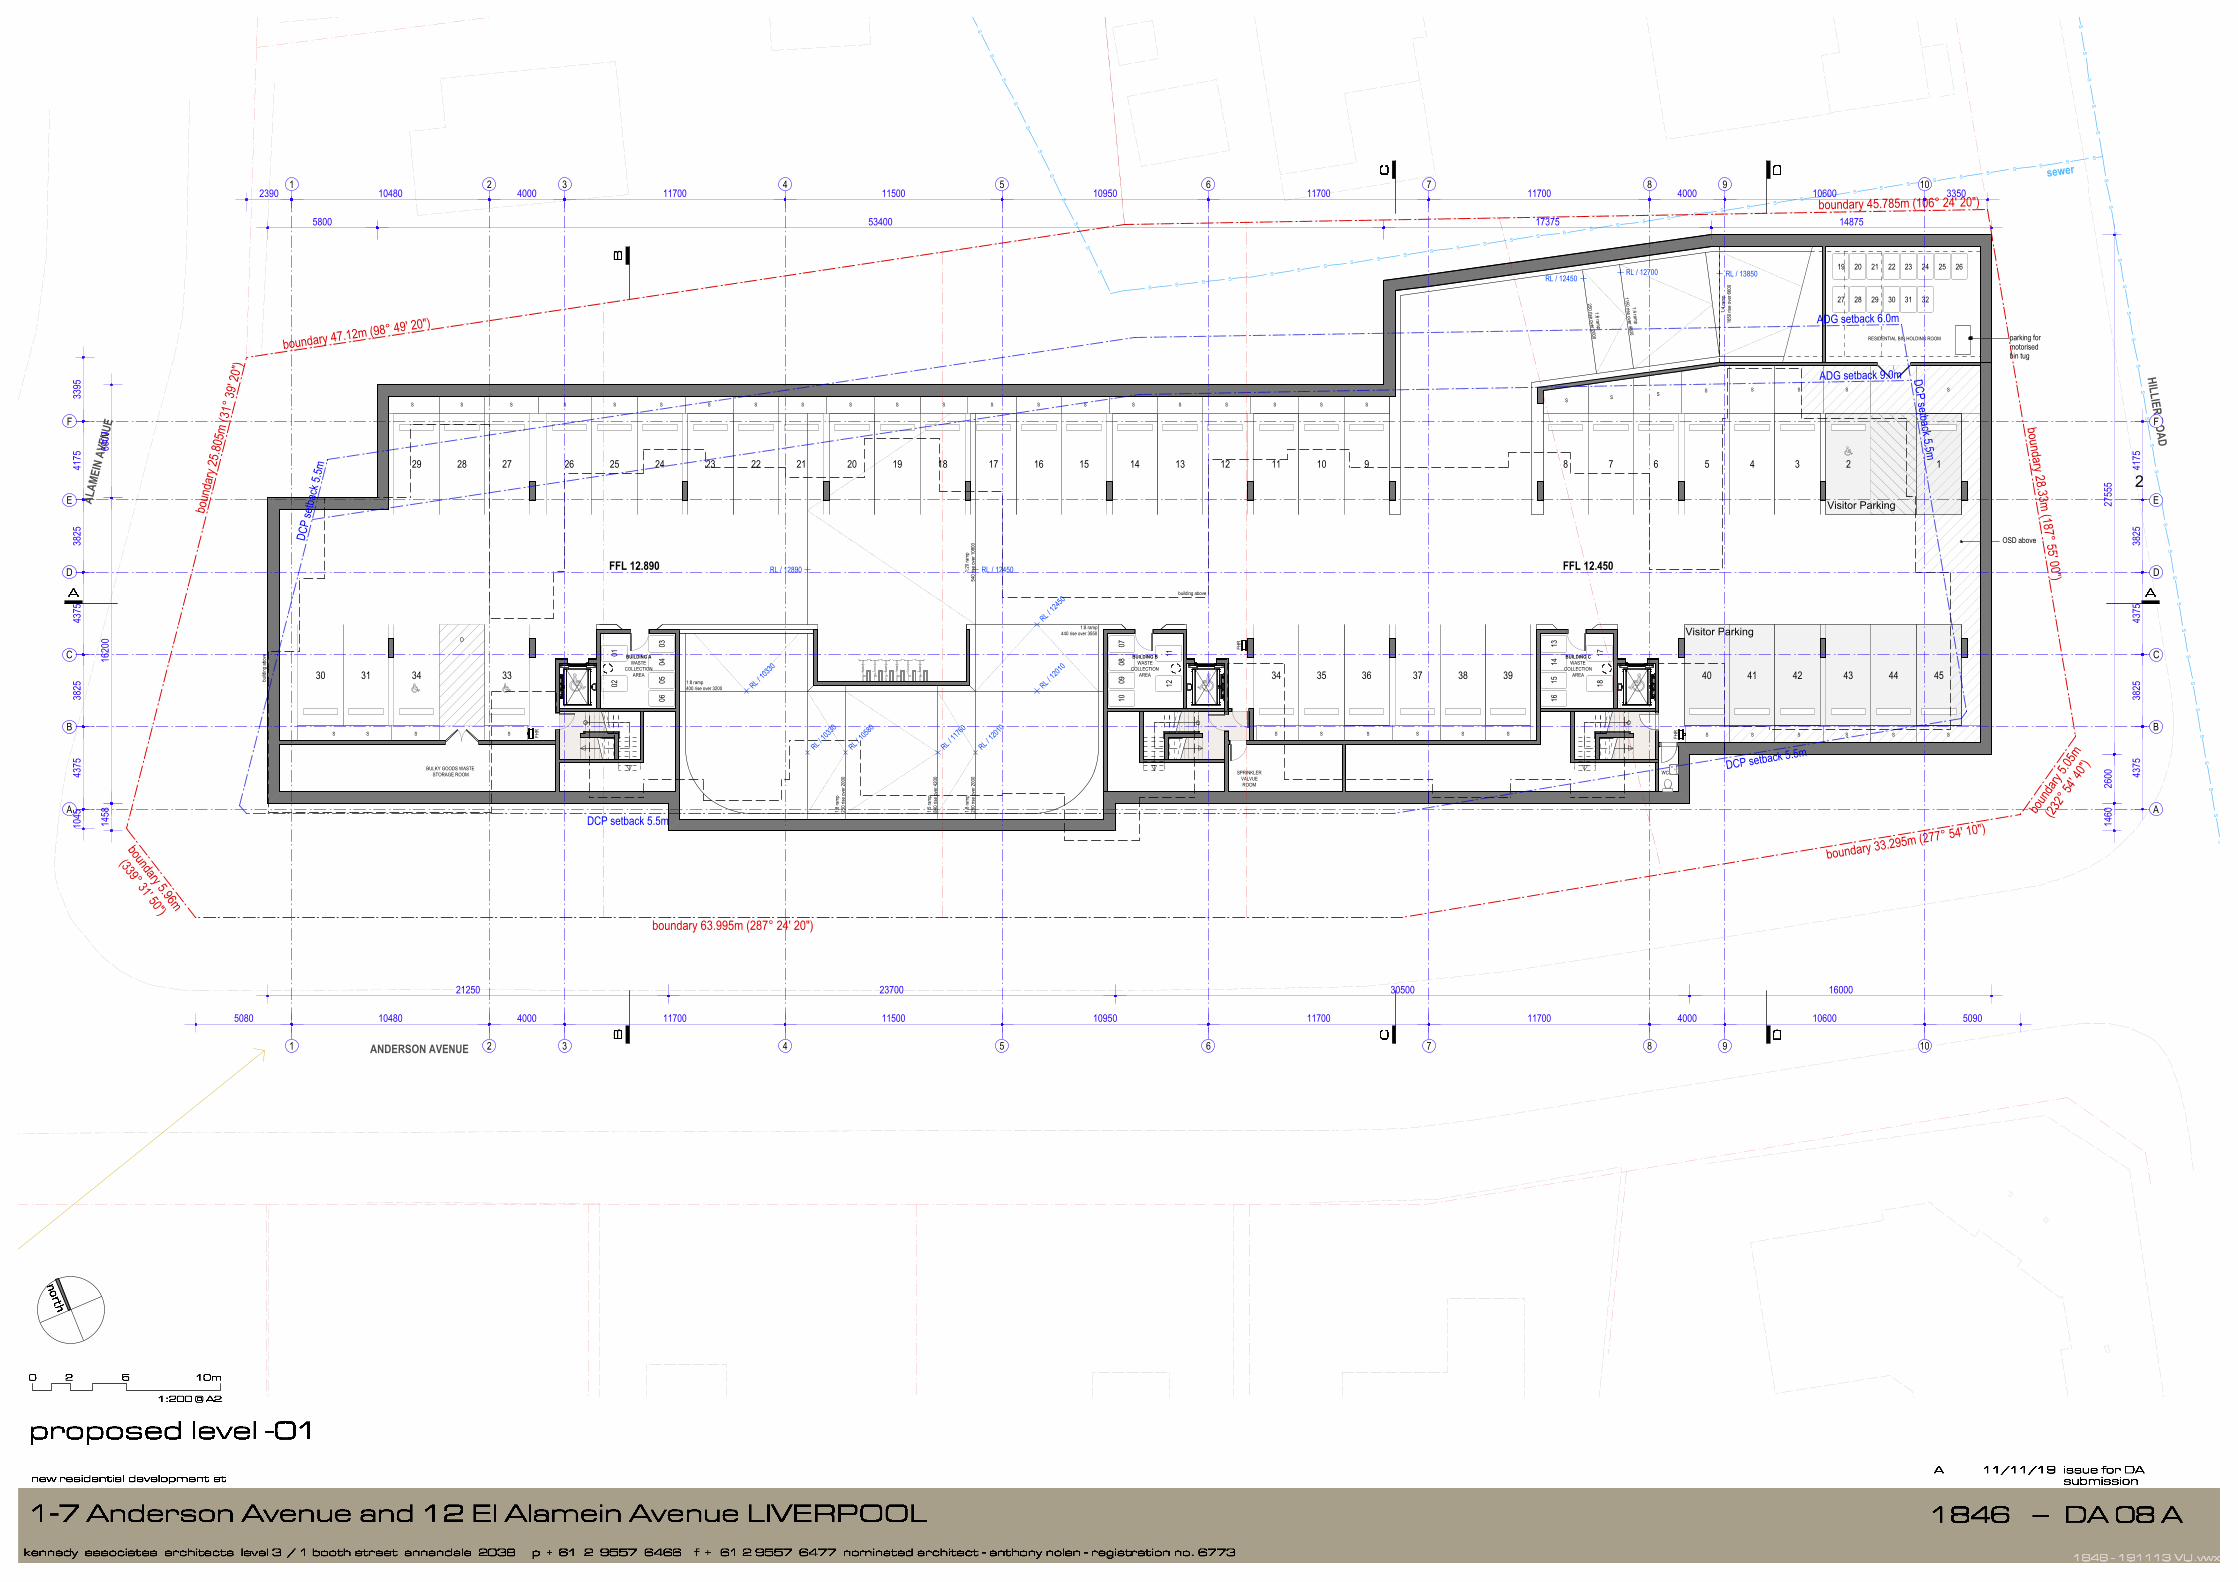
The car parking layout as depicted in Annexure A, have been assessed to achieve the
relevant clauses and objectives of AS2890.1:2004 and AS2890.6:2009. Any variances from
standards are addressed in the following subsections including required changes, if any.
The proposed car park design achieves:
• 5.5m width two-way driveway (kerb to kerb) facilitating access to Hillier Road;
• Minimum 5.8m width parking aisles;
• Compliant ramp grades not exceeding 25% for private developments and no grade
change greater than 12.5%;
• Minimum 5.4m length, 2.4m width spaces;
• Minimum headroom of 2.2m for general circulation and 2.5m headroom clearance
provided over disabled and adaptable parking areas;
Required Changes
• Convex Mirrors
It is recommended that convex mirrors be placed at the base of the driveway ramp and at
the corners of the ramp between basements 1 and 2. The locations are provided in
Annexure D.
Residential Development Page 11 of 15 1-7 Anderson Avenue & 12 El Alamein Avenue, Liverpool 190442.02FA - 5th December 2019
• Visitor Parking Signage
Visitor parking signage should be included at the bottom of the basement ramp to direct
visitor vehicles to these spaces.
Whilst the plans have been assessed to comply with the relevant standards, it is usual and
expected that a design certificate be required at the Construction Certificate stage to account
for any changes following the development application.
Residential Development Page 12 of 15 1-7 Anderson Avenue & 12 El Alamein Avenue, Liverpool 190442.02FA - 5th December 2019
TRAFFIC ASSESSMENT
The impact of the expected traffic generation levels associated with the subject proposal is
discussed in the following sub-sections.
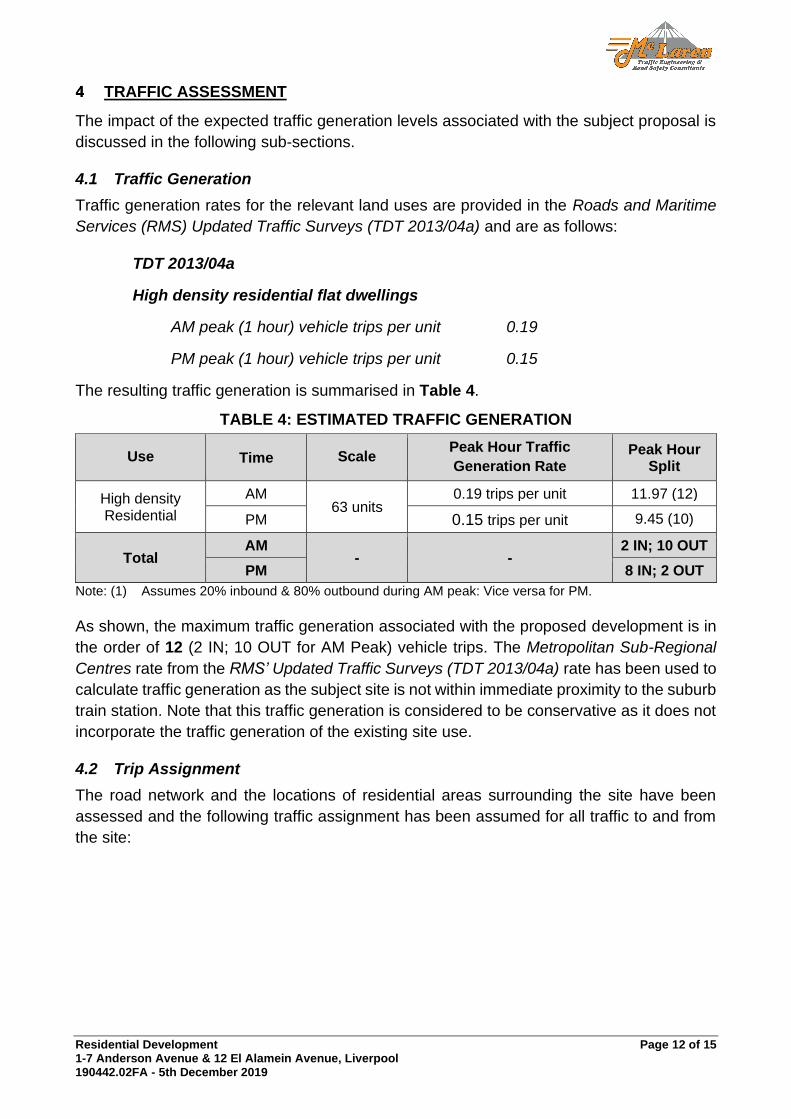
4.1 Traffic Generation
Traffic generation rates for the relevant land uses are provided in the Roads and Maritime
Services (RMS) Updated Traffic Surveys (TDT 2013/04a) and are as follows:
TDT 2013/04a
High density residential flat dwellings
AM peak (1 hour) vehicle trips per unit 0.19
PM peak (1 hour) vehicle trips per unit 0.15
The resulting traffic generation is summarised in Table 4.
TABLE 4: ESTIMATED TRAFFIC GENERATION
Use Time Scale Peak Hour Traffic
Generation Rate Peak Hour
Split
High density Residential
AM 63 units
0.19 trips per unit 11.97 (12)
PM 0.15 trips per unit 9.45 (10)
Total AM
- - 2 IN; 10 OUT
PM 8 IN; 2 OUT
Note: (1) Assumes 20% inbound & 80% outbound during AM peak: Vice versa for PM.
As shown, the maximum traffic generation associated with the proposed development is in
the order of 12 (2 IN; 10 OUT for AM Peak) vehicle trips. The Metropolitan Sub-Regional
Centres rate from the RMS’ Updated Traffic Surveys (TDT 2013/04a) rate has been used to
calculate traffic generation as the subject site is not within immediate proximity to the suburb
train station. Note that this traffic generation is considered to be conservative as it does not
incorporate the traffic generation of the existing site use.
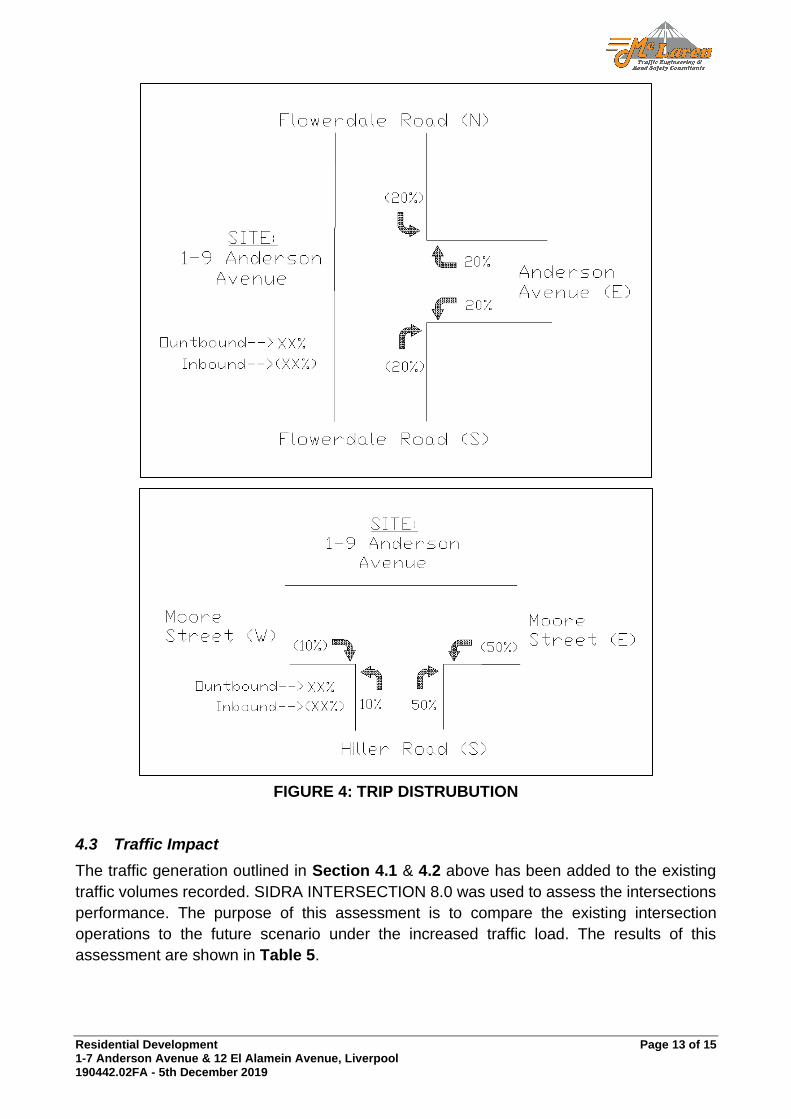
4.2 Trip Assignment
The road network and the locations of residential areas surrounding the site have been
assessed and the following traffic assignment has been assumed for all traffic to and from
the site:
Residential Development Page 13 of 15 1-7 Anderson Avenue & 12 El Alamein Avenue, Liverpool 190442.02FA - 5th December 2019
FIGURE 4: TRIP DISTRUBUTION
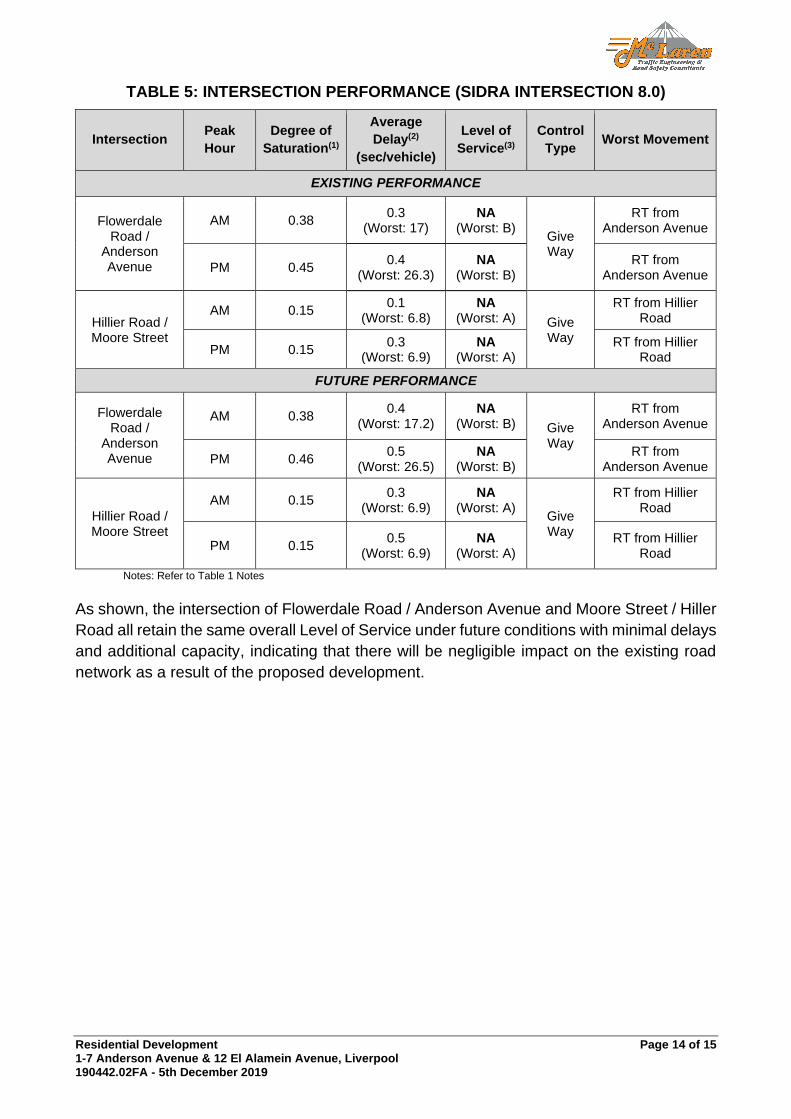
4.3 Traffic Impact
The traffic generation outlined in Section 4.1 & 4.2 above has been added to the existing
traffic volumes recorded. SIDRA INTERSECTION 8.0 was used to assess the intersections
performance. The purpose of this assessment is to compare the existing intersection
operations to the future scenario under the increased traffic load. The results of this
assessment are shown in Table 5.
Residential Development Page 14 of 15 1-7 Anderson Avenue & 12 El Alamein Avenue, Liverpool 190442.02FA - 5th December 2019
TABLE 5: INTERSECTION PERFORMANCE (SIDRA INTERSECTION 8.0)
Intersection Peak
Hour
Degree of
Saturation(1)
Average
Delay(2)
(sec/vehicle)
Level of
Service(3)
Control
Type Worst Movement
EXISTING PERFORMANCE
Flowerdale Road /
Anderson Avenue
AM 0.38 0.3
(Worst: 17) NA
(Worst: B) Give Way
RT from Anderson Avenue
PM 0.45 0.4
(Worst: 26.3) NA
(Worst: B) RT from
Anderson Avenue
Hillier Road / Moore Street
AM 0.15 0.1
(Worst: 6.8) NA
(Worst: A) Give Way
RT from Hillier Road
PM 0.15 0.3
(Worst: 6.9) NA
(Worst: A) RT from Hillier
Road
FUTURE PERFORMANCE
Flowerdale Road /
Anderson Avenue
AM 0.38 0.4
(Worst: 17.2) NA
(Worst: B) Give Way
RT from Anderson Avenue
PM 0.46 0.5
(Worst: 26.5) NA
(Worst: B) RT from
Anderson Avenue
Hillier Road / Moore Street
AM 0.15 0.3
(Worst: 6.9) NA
(Worst: A) Give Way
RT from Hillier Road
PM 0.15 0.5
(Worst: 6.9) NA
(Worst: A) RT from Hillier
Road
Notes: Refer to Table 1 Notes
As shown, the intersection of Flowerdale Road / Anderson Avenue and Moore Street / Hiller
Road all retain the same overall Level of Service under future conditions with minimal delays
and additional capacity, indicating that there will be negligible impact on the existing road
network as a result of the proposed development.
Residential Development Page 15 of 15 1-7 Anderson Avenue & 12 El Alamein Avenue, Liverpool 190442.02FA - 5th December 2019
CONCLUSION
In view of the foregoing, the subject Residential Development proposal at 1-7 Anderson
Avenue & 12 El Alamein Avenue, Liverpool (as depicted in Annexure A) is fully supportable
in terms of its traffic and parking impacts. The following outcomes of this traffic impact
assessment are relevant to note:
• The proposal includes a total of 78 car parking spaces, comprised of 70 for residential
use and 8 for visitor satisfying the relevant controls applicable to the development,
including SEPP(ARH) 2009 and Liverpool Council’s DCP requirements.
• Council’s DCP requires the provision of 39 bicycle parking spaces. 42 bicycle parking
spaces have been provided onsite resulting in compliance with Council’s
requirements.
• The parking areas of the site have been assessed against the relevant sections of
AS2890.1, AS2890.6 and AS4299 and have been found to satisfy the objectives of
each standard.
• Convex mirrors should be provided at the base of the driveway ramp and at the
corners of the ramp between basements 1 and 2. The locations are provided in
Annexure D.
• The traffic generation of the proposed development has been estimated to be some
12 trips in the AM peak hour. The impacts of the traffic generation have been
modelled using SIDRA INTERSECTION 8.0, indicating that there will be no
detrimental impact to the performance of the intersections or on residential amenity
surrounding the site as a result of the generated traffic.
ANNEXURE A: PROPOSED PLANS
(2 SHEETS)
495051525354555657585960616263646566
70
676869
71 72
FFL RL 9.450
RL / 120
10
RL / 120
10
RL / 117
60
RL / 105
80
RL / 103
30
RL / 103
30
RL / 989
0
RL / 9450RL / 9890FFL 9.890 1:20
ram
p54
0 ris
e ov
er 1
0800
S S S
PLANT ROOMPLANT ROOM
SSSSSSSS SSS SSS SSS SSS
SS S
PLANT ROOM
S
73 74 75
FHR
FHR
STORESTORE
464748
SS
SS S
S
76 77 78
ANDERSON AVENUE
ALAM
EIN
AVEN
UEHILLIER ROAD
ridge 22.54
no. 6-8two storey
brick townhouses
no. 10fibro cottage
DP3598051
DP3598050
DP3598052
DP3598062 S
SS
SS
SS
SS
SS
SS
SS
SS
SS
SS
SS
SS
SS
SS
SS
SS
SS
SS
SS
SS
SS
SS
S
S S S S S
S
SS
SS
SS
SS
SS
SS
SS
SS
SS
SS
SS
SS
SS
SS
SS
SS
SS
SS
S
S
S
S
S
S
S
S
S
S
S
S
S
S
S
S
S
S
S
S
S
S
S
S
S
S
sewer
1 2 3 4 5 6 7 8 9 10
1 2 3 4 5 6 7 8 9 10
F
E
D
C
B
A
F
E
D
C
B
A
10480 4000 11700 11500 10950 11700 11700 4000 10600
4175
3825
4375
3825
4375
10480 4000 11700 11500 10950 11700 11700 4000 10600
4175
3825
4375
3825
4375
DCP
setba
ck 5.
5m
DCP setback 5.5m
DCP setback 5.5m
DCP setback 5.5mADG setback 6.0m
ADG setback 9.0m
boundary 47.12m (98° 49' 20")
boundary 45.785m (106° 24' 20")boundary 28.33m (187° 55' 00")
2
boun
dary
5.05m
(232°
54' 4
0")
boundary 33.295m (277° 54' 10")
boundary 5.96m
(339° 31' 50")
boundary 63.995m (287° 24' 20")
boun
dary
25.80
5m (3
1° 39
' 20"
)
3810 21250 23700 23050 600
6000
1620
0
5800 55300 500
2220
014
60
310
5080 5090
1045
3395
2390 3350
37 38 3934 35 36 43 44 4540 41 42
345678121314151617181920212223242526
1:20
ram
p54
0 ris
e ov
er 1
0800
1:8 ramp440 rise over 3550
1:5
ram
p84
0 ris
e ov
er 4
200
1:8
ram
p25
0 ris
e ov
er 2
000
1:8 ramp400 rise over 3200
272829
34 33
FFL 12.450
RL / 13850RL / 12700RL / 12450
FFL 12.890
RL / 124
50
RL / 120
10
RL / 120
10
RL / 117
60
RL / 105
80
RL / 103
30
RL / 103
30
1:8
ram
p25
0 ris
e ov
er 2
000
RL / 12450RL / 12890
OSD above
SSSSSSSSS
building above
build
ing a
bove
SSSSSSSS SSS SSS SSS S
1:4
ram
p16
50 ri
se o
ver 6
600
1:4 ramp
1150 rise over 4600
1:8 ramp
250 rise over 2000
SS
S S S
BULKY GOODS WASTESTORAGE ROOM
BUILDING AWASTE
COLLECTIONAREA
SSSSS S
SPRINKLERVALVUEROOM
RESIDENTIAL BIN HOLDING ROOM
S S S S S S
03
0102
0405
BUILDING BWASTE
COLLECTIONAREA
BUILDING CWASTE
COLLECTIONAREA
19
FHR
FHR
FHR
06
07
1112
0809
10
13
1718
1415
16
20 21 22 23 24 25 26
12
27 28 29 30 31 32
30 31
S
parking for motorised bin tug
WC
Visitor Parking
Visitor Parking
91011
ANDERSON AVENUE
ALAM
EIN
AVEN
UEHILLIER ROAD
SS
SS
SS
SS
SS
SS
S
SS
SS
SS
SS
SS
SS
SS
SS
SS
SS
SS
SS
SS
SS
SS
SS
S
S S S S S
S
SS
SS
SS
SS
SS
SS
SS
SS
SS
SS
SS
SS
SS
SS
SS
SS
SS
SS
S
S
S
S
S
S
S
S
S
S
S
S
S
S
S
S
S
S
S
S
S
S
S
S
S
S
sewer
1 2 3 4 5 6 7 8 9 10
1 2 3 4 5 6 7 8 9 10
F
E
D
C
B
A
F
E
D
C
B
A
10480 4000 11700 11500 10950 11700 11700 4000 10600
4175
3825
4375
3825
4375
10480 4000 11700 11500 10950 11700 11700 4000 10600
4175
3825
4375
3825
4375
DCP
setba
ck 5.
5m
DCP setback 5.5m
DCP setback 5.5m
DCP setback 5.5mADG setback 6.0m
ADG setback 9.0m
boundary 47.12m (98° 49' 20")
boundary 45.785m (106° 24' 20")boundary 28.33m (187° 55' 00")
2
boun
dary
5.05m
(232°
54' 4
0")
boundary 33.295m (277° 54' 10")
boundary 5.96m
(339° 31' 50")
boundary 63.995m (287° 24' 20")
boun
dary
25.80
5m (3
1° 39
' 20"
)
21250 23700 30500 16000
6000
1620
014
58
5800 53400 17375 14875
2755
526
0014
60
5080 5090
1045
3395
2390 3350

ANNEXURE B: TRAFFIC SURVEY DATA
(6 SHEETS)
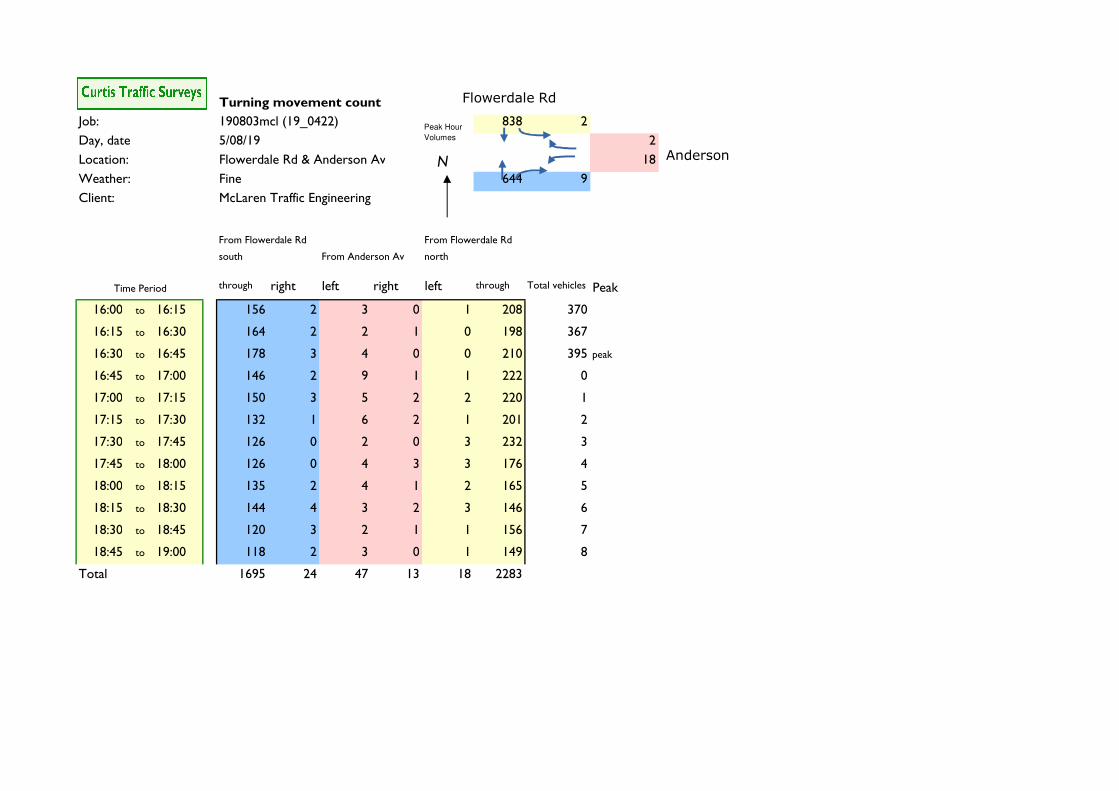
Turning movement count
Job: 190803mcl (19_0422) 838 2
Day, date 2
Location: Flowerdale Rd & Anderson Av 18
Weather: Fine 644 9
Client: McLaren Traffic Engineering
through right left right left through Total vehicles Peak
16:00 to 16:15 156 2 3 0 1 208 370
16:15 to 16:30 164 2 2 1 0 198 367
16:30 to 16:45 178 3 4 0 0 210 395 peak
16:45 to 17:00 146 2 9 1 1 222 0
17:00 to 17:15 150 3 5 2 2 220 1
17:15 to 17:30 132 1 6 2 1 201 2
17:30 to 17:45 126 0 2 0 3 232 3
17:45 to 18:00 126 0 4 3 3 176 4
18:00 to 18:15 135 2 4 1 2 165 5
18:15 to 18:30 144 4 3 2 3 146 6
18:30 to 18:45 120 3 2 1 1 156 7
18:45 to 19:00 118 2 3 0 1 149 8
Total 1695 24 47 13 18 2283 395
Peak Hour
Volumes5/08/19
From Flowerdale Rd
south From Anderson Av
From Flowerdale Rd
north
Time Period
N
Flowerdale Rd
Anderson
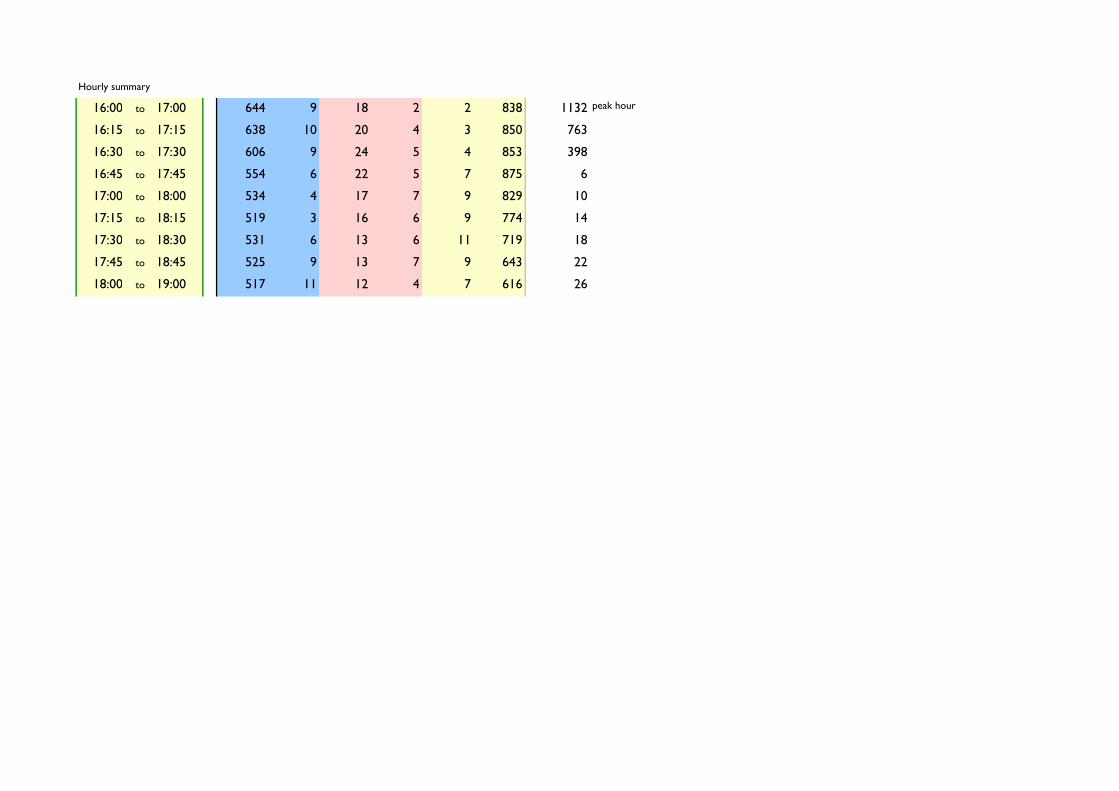
Hourly summary
16:00 to 17:00 644 9 18 2 2 838 1132 peak hour
16:15 to 17:15 638 10 20 4 3 850 763
16:30 to 17:30 606 9 24 5 4 853 398
16:45 to 17:45 554 6 22 5 7 875 6
17:00 to 18:00 534 4 17 7 9 829 10
17:15 to 18:15 519 3 16 6 9 774 14
17:30 to 18:30 531 6 13 6 11 719 18
17:45 to 18:45 525 9 13 7 9 643 22
18:00 to 19:00 517 11 12 4 7 616 261132
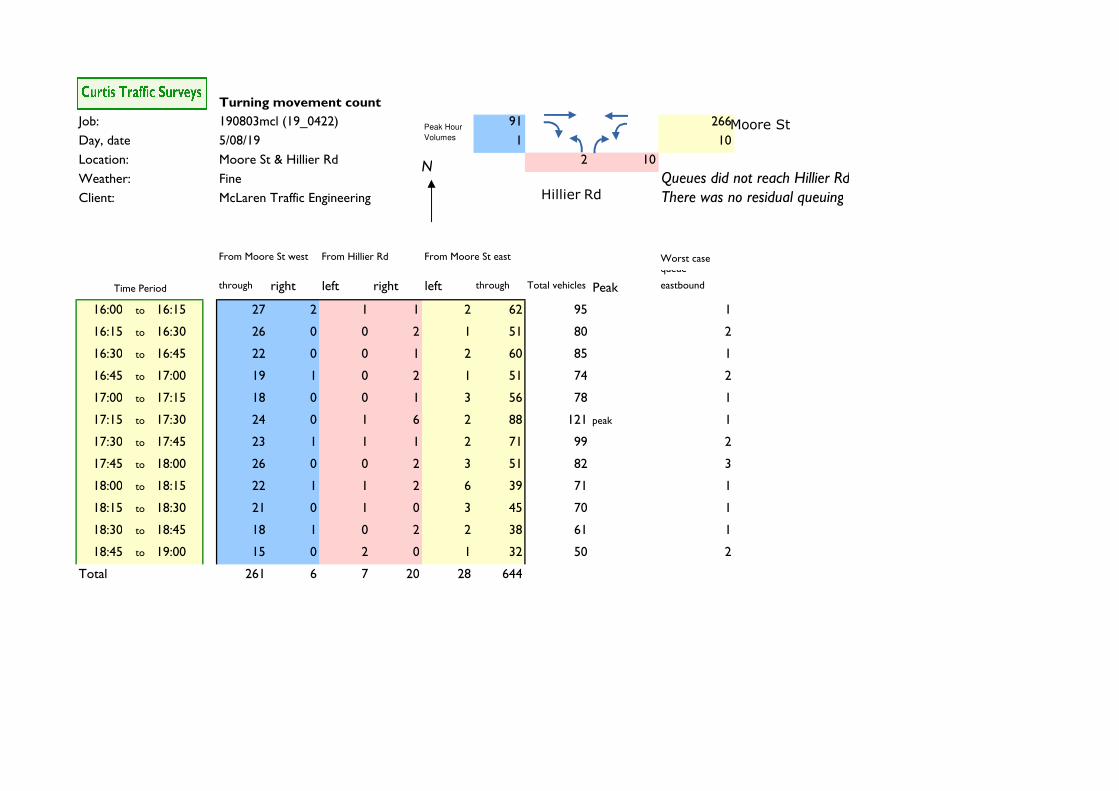
Turning movement count
Job: 190803mcl (19_0422) 91 266
Day, date 1 10
Location: Moore St & Hillier Rd 2 10
Weather: Fine Queues did not reach Hillier RdClient: McLaren Traffic Engineering There was no residual queuing
Worst case
through right left right left through Total vehicles Peak
queue
eastbound
16:00 to 16:15 27 2 1 1 2 62 95 1
16:15 to 16:30 26 0 0 2 1 51 80 2
16:30 to 16:45 22 0 0 1 2 60 85 1
16:45 to 17:00 19 1 0 2 1 51 74 2
17:00 to 17:15 18 0 0 1 3 56 78 1
17:15 to 17:30 24 0 1 6 2 88 121 peak 1
17:30 to 17:45 23 1 1 1 2 71 99 2
17:45 to 18:00 26 0 0 2 3 51 82 3
18:00 to 18:15 22 1 1 2 6 39 71 1
18:15 to 18:30 21 0 1 0 3 45 70 1
18:30 to 18:45 18 1 0 2 2 38 61 1
18:45 to 19:00 15 0 2 0 1 32 50 2
Total 261 6 7 20 28 644 121
Peak Hour
Volumes5/08/19
From Moore St west From Hillier Rd From Moore St east
Time Period
N
Moore St
Hillier Rd
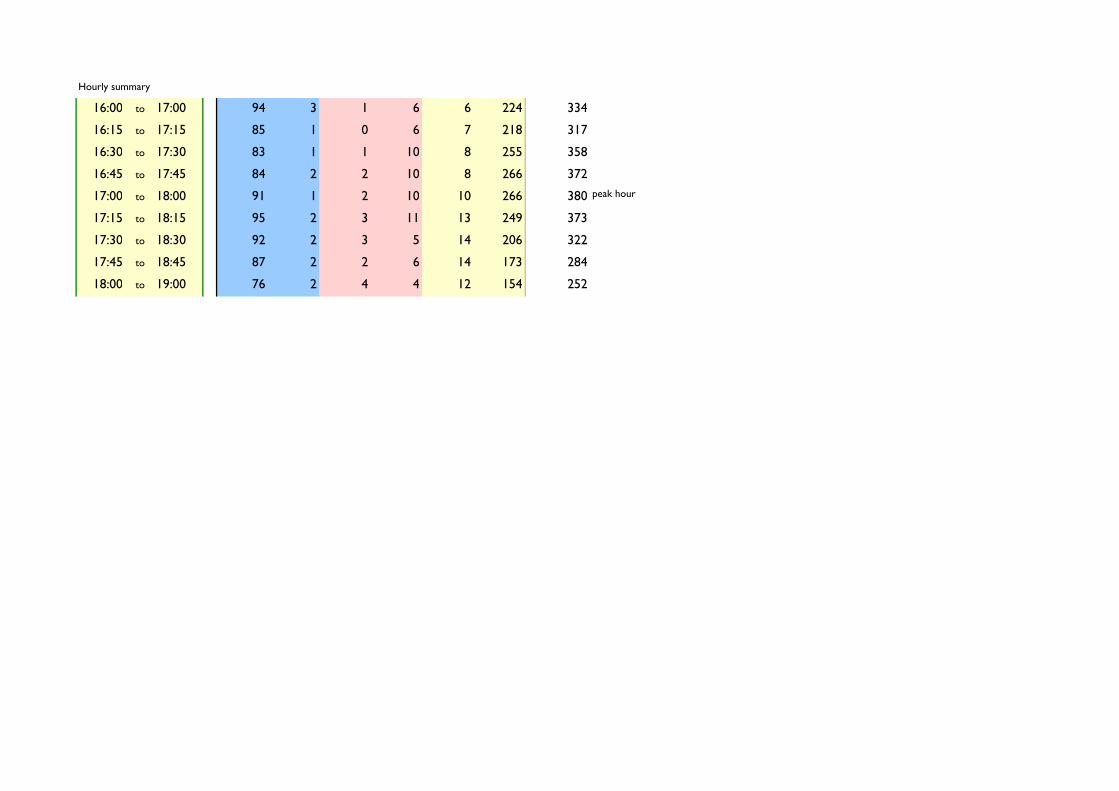
Hourly summary
16:00 to 17:00 94 3 1 6 6 224 334
16:15 to 17:15 85 1 0 6 7 218 317
16:30 to 17:30 83 1 1 10 8 255 358
16:45 to 17:45 84 2 2 10 8 266 372
17:00 to 18:00 91 1 2 10 10 266 380 peak hour
17:15 to 18:15 95 2 3 11 13 249 373
17:30 to 18:30 92 2 3 5 14 206 322
17:45 to 18:45 87 2 2 6 14 173 284
18:00 to 19:00 76 2 4 4 12 154 252380
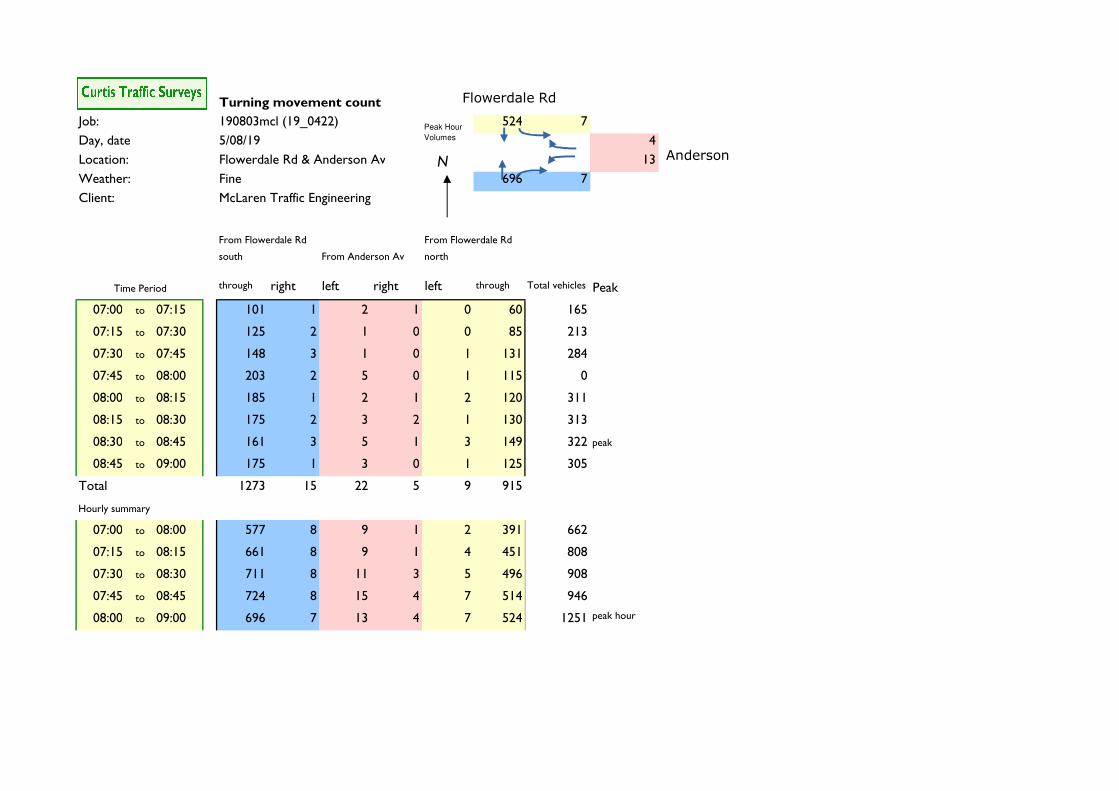
Turning movement count
Job: 190803mcl (19_0422) 524 7
Day, date 4
Location: Flowerdale Rd & Anderson Av 13
Weather: Fine 696 7
Client: McLaren Traffic Engineering
through right left right left through Total vehicles Peak
07:00 to 07:15 101 1 2 1 0 60 165
07:15 to 07:30 125 2 1 0 0 85 213
07:30 to 07:45 148 3 1 0 1 131 284
07:45 to 08:00 203 2 5 0 1 115 0
08:00 to 08:15 185 1 2 1 2 120 311
08:15 to 08:30 175 2 3 2 1 130 313
08:30 to 08:45 161 3 5 1 3 149 322 peak
08:45 to 09:00 175 1 3 0 1 125 305
Total 1273 15 22 5 9 915 322
Hourly summary
07:00 to 08:00 577 8 9 1 2 391 662
07:15 to 08:15 661 8 9 1 4 451 808
07:30 to 08:30 711 8 11 3 5 496 908
07:45 to 08:45 724 8 15 4 7 514 946
08:00 to 09:00 696 7 13 4 7 524 1251 peak hour1251
Peak Hour
Volumes5/08/19
From Flowerdale Rd
south From Anderson Av
From Flowerdale Rd
north
Time Period
N
Flowerdale Rd
Anderson
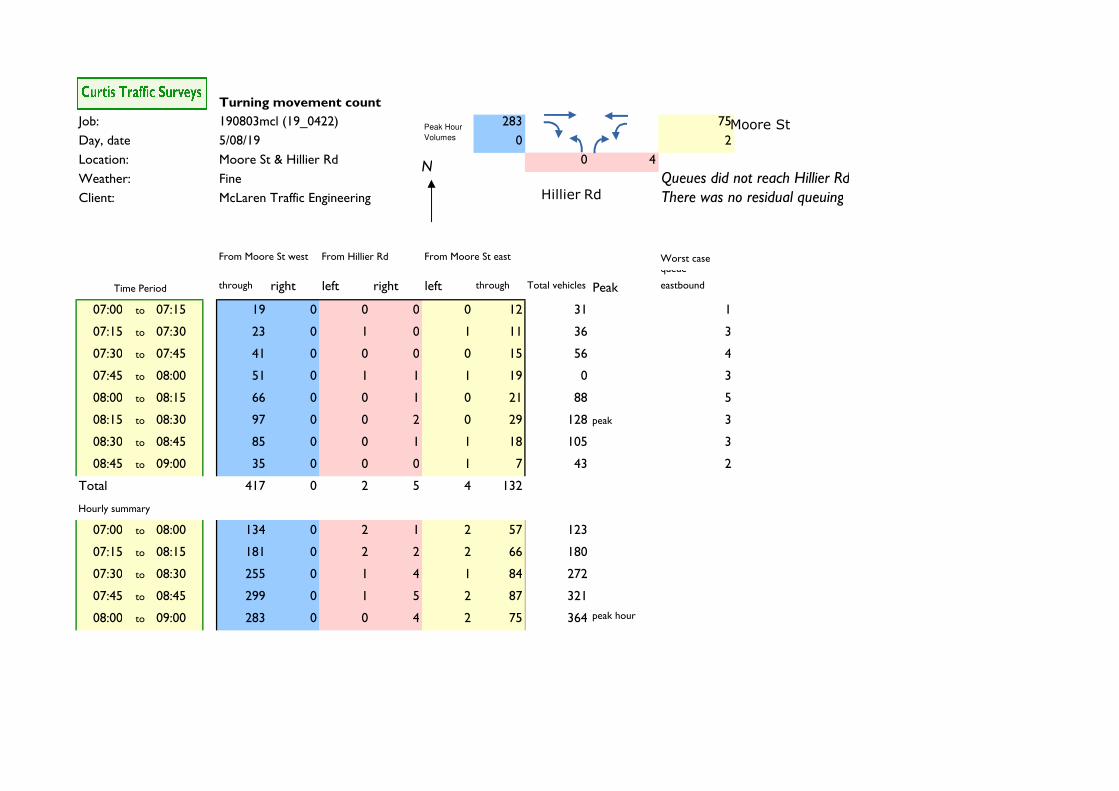
Turning movement count
Job: 190803mcl (19_0422) 283 75
Day, date 0 2
Location: Moore St & Hillier Rd 0 4
Weather: Fine Queues did not reach Hillier RdClient: McLaren Traffic Engineering There was no residual queuing
Worst case
through right left right left through Total vehicles Peak
queue
eastbound
07:00 to 07:15 19 0 0 0 0 12 31 1
07:15 to 07:30 23 0 1 0 1 11 36 3
07:30 to 07:45 41 0 0 0 0 15 56 4
07:45 to 08:00 51 0 1 1 1 19 0 3
08:00 to 08:15 66 0 0 1 0 21 88 5
08:15 to 08:30 97 0 0 2 0 29 128 peak 3
08:30 to 08:45 85 0 0 1 1 18 105 3
08:45 to 09:00 35 0 0 0 1 7 43 2
Total 417 0 2 5 4 132 128
Hourly summary
07:00 to 08:00 134 0 2 1 2 57 123
07:15 to 08:15 181 0 2 2 2 66 180
07:30 to 08:30 255 0 1 4 1 84 272
07:45 to 08:45 299 0 1 5 2 87 321
08:00 to 09:00 283 0 0 4 2 75 364 peak hour364
Peak Hour
Volumes5/08/19
From Moore St west From Hillier Rd From Moore St east
Time Period
N
Moore St
Hillier Rd
ANNEXURE C: SIDRA RESULTS
(8 SHEETS)

MOVEMENT SUMMARY
Site: 101 [(Existing AM) Anderson Avenue / Flowerdale Road]
New SiteSite Category: (None)Giveway / Yield (Two-Way)
Movement Performance - Vehicles
Demand Flows 95% Back of QueueMovID
Turn Deg.Satn
AverageDelay
Level ofService
Prop. Queued
Effective Stop Rate
Aver. No.Cycles
AverageSpeed Total HV Vehicles Distance
veh/h % v/c sec veh m km/hSouth: Flowerdale Road
2 T1 733 0.0 0.383 0.1 LOS A 0.1 1.0 0.02 0.01 0.03 59.8
3 R2 7 0.0 0.383 9.3 LOS A 0.1 1.0 0.02 0.01 0.03 57.6
Approach 740 0.0 0.383 0.2 NA 0.1 1.0 0.02 0.01 0.03 59.8
East: Anderson Avenue
4 L2 14 0.0 0.030 7.7 LOS A 0.1 0.7 0.56 0.72 0.56 50.4
6 R2 4 0.0 0.030 17.0 LOS B 0.1 0.7 0.56 0.72 0.56 49.9
Approach 18 0.0 0.030 9.9 LOS A 0.1 0.7 0.56 0.72 0.56 50.3
North: Flowerdale Road
7 L2 7 0.0 0.287 5.6 LOS A 0.0 0.0 0.00 0.01 0.00 58.2
8 T1 552 0.0 0.287 0.0 LOS A 0.0 0.0 0.00 0.01 0.00 59.9
Approach 559 0.0 0.287 0.1 NA 0.0 0.0 0.00 0.01 0.00 59.8
All Vehicles 1317 0.0 0.383 0.3 NA 0.1 1.0 0.02 0.02 0.02 59.7
Site Level of Service (LOS) Method: Delay (RTA NSW). Site LOS Method is specified in the Parameter Settings dialog (Site tab).
Vehicle movement LOS values are based on average delay per movement.
Minor Road Approach LOS values are based on average delay for all vehicle movements.
NA: Intersection LOS and Major Road Approach LOS values are Not Applicable for two-way sign control since the average delay is not a good LOS measure due to zero delays associated with major road movements.
SIDRA Standard Delay Model is used. Control Delay includes Geometric Delay.
Gap-Acceptance Capacity: SIDRA Standard (Akçelik M3D).
HV (%) values are calculated for All Movement Classes of All Heavy Vehicle Model Designation.
SIDRA INTERSECTION 8.0 | Copyright © 2000-2018 Akcelik and Associates Pty Ltd | sidrasolutions.comOrganisation: MCLAREN TRAFFIC ENGINEERING | Processed: 08 August 2019 14:04:20Project: \\mteserver\mte storage\Jobs\2019\190442\MTE SIDRA\19 07 29.sip8
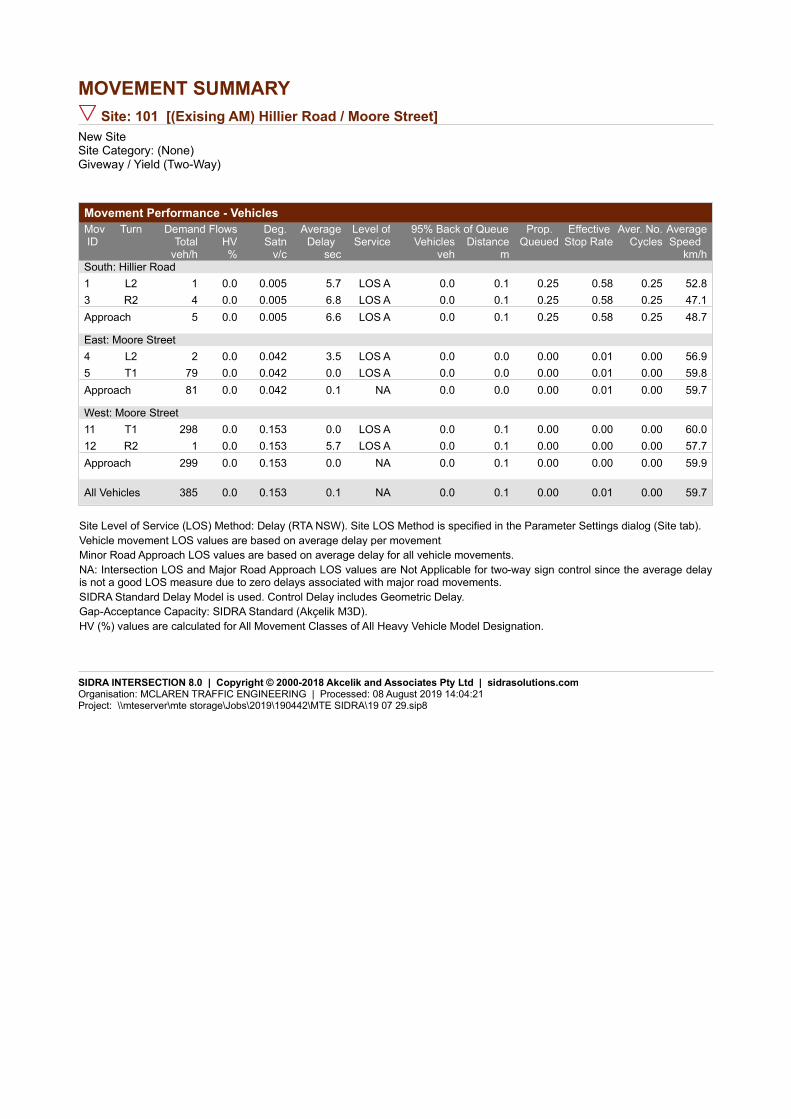
MOVEMENT SUMMARY
Site: 101 [(Exising AM) Hillier Road / Moore Street]
New SiteSite Category: (None)Giveway / Yield (Two-Way)
Movement Performance - Vehicles
Demand Flows 95% Back of QueueMovID
Turn Deg.Satn
AverageDelay
Level ofService
Prop. Queued
Effective Stop Rate
Aver. No.Cycles
AverageSpeed Total HV Vehicles Distance
veh/h % v/c sec veh m km/hSouth: Hillier Road
1 L2 1 0.0 0.005 5.7 LOS A 0.0 0.1 0.25 0.58 0.25 52.8
3 R2 4 0.0 0.005 6.8 LOS A 0.0 0.1 0.25 0.58 0.25 47.1
Approach 5 0.0 0.005 6.6 LOS A 0.0 0.1 0.25 0.58 0.25 48.7
East: Moore Street
4 L2 2 0.0 0.042 3.5 LOS A 0.0 0.0 0.00 0.01 0.00 56.9
5 T1 79 0.0 0.042 0.0 LOS A 0.0 0.0 0.00 0.01 0.00 59.8
Approach 81 0.0 0.042 0.1 NA 0.0 0.0 0.00 0.01 0.00 59.7
West: Moore Street
11 T1 298 0.0 0.153 0.0 LOS A 0.0 0.1 0.00 0.00 0.00 60.0
12 R2 1 0.0 0.153 5.7 LOS A 0.0 0.1 0.00 0.00 0.00 57.7
Approach 299 0.0 0.153 0.0 NA 0.0 0.1 0.00 0.00 0.00 59.9
All Vehicles 385 0.0 0.153 0.1 NA 0.0 0.1 0.00 0.01 0.00 59.7
Site Level of Service (LOS) Method: Delay (RTA NSW). Site LOS Method is specified in the Parameter Settings dialog (Site tab).
Vehicle movement LOS values are based on average delay per movement.
Minor Road Approach LOS values are based on average delay for all vehicle movements.
NA: Intersection LOS and Major Road Approach LOS values are Not Applicable for two-way sign control since the average delay is not a good LOS measure due to zero delays associated with major road movements.
SIDRA Standard Delay Model is used. Control Delay includes Geometric Delay.
Gap-Acceptance Capacity: SIDRA Standard (Akçelik M3D).
HV (%) values are calculated for All Movement Classes of All Heavy Vehicle Model Designation.
SIDRA INTERSECTION 8.0 | Copyright © 2000-2018 Akcelik and Associates Pty Ltd | sidrasolutions.comOrganisation: MCLAREN TRAFFIC ENGINEERING | Processed: 08 August 2019 14:04:21Project: \\mteserver\mte storage\Jobs\2019\190442\MTE SIDRA\19 07 29.sip8
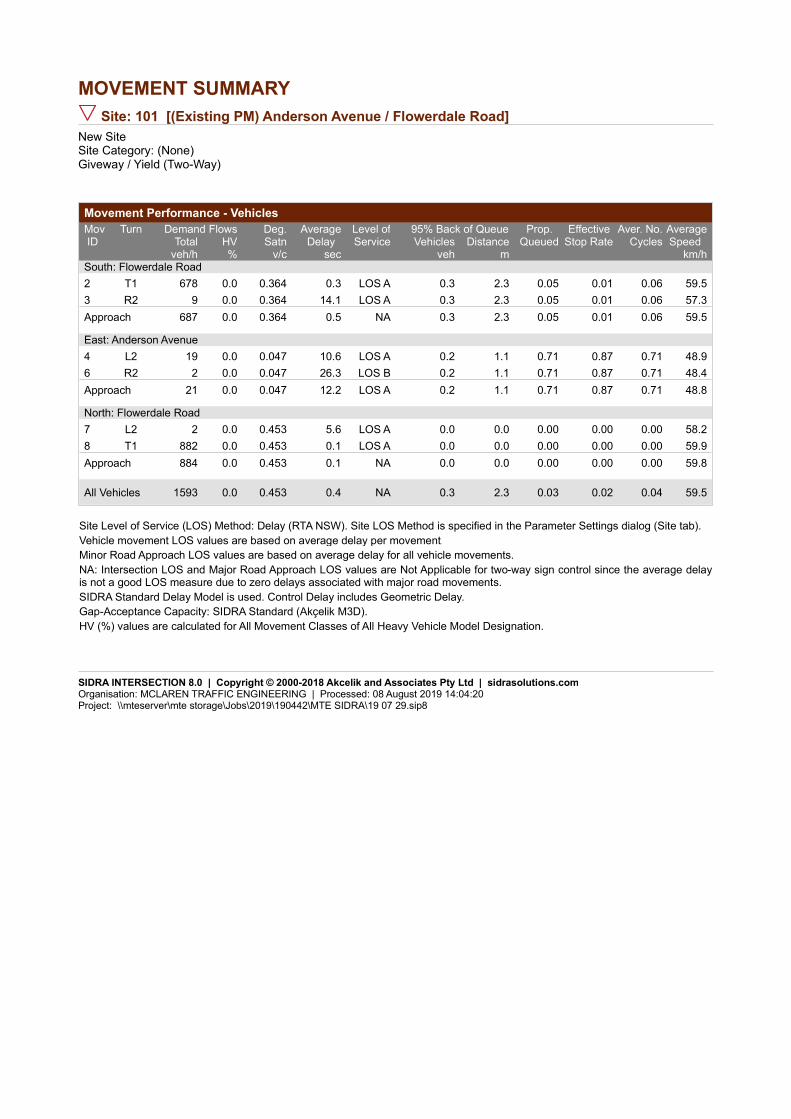
MOVEMENT SUMMARY
Site: 101 [(Existing PM) Anderson Avenue / Flowerdale Road]
New SiteSite Category: (None)Giveway / Yield (Two-Way)
Movement Performance - Vehicles
Demand Flows 95% Back of QueueMovID
Turn Deg.Satn
AverageDelay
Level ofService
Prop. Queued
Effective Stop Rate
Aver. No.Cycles
AverageSpeed Total HV Vehicles Distance
veh/h % v/c sec veh m km/hSouth: Flowerdale Road
2 T1 678 0.0 0.364 0.3 LOS A 0.3 2.3 0.05 0.01 0.06 59.5
3 R2 9 0.0 0.364 14.1 LOS A 0.3 2.3 0.05 0.01 0.06 57.3
Approach 687 0.0 0.364 0.5 NA 0.3 2.3 0.05 0.01 0.06 59.5
East: Anderson Avenue
4 L2 19 0.0 0.047 10.6 LOS A 0.2 1.1 0.71 0.87 0.71 48.9
6 R2 2 0.0 0.047 26.3 LOS B 0.2 1.1 0.71 0.87 0.71 48.4
Approach 21 0.0 0.047 12.2 LOS A 0.2 1.1 0.71 0.87 0.71 48.8
North: Flowerdale Road
7 L2 2 0.0 0.453 5.6 LOS A 0.0 0.0 0.00 0.00 0.00 58.2
8 T1 882 0.0 0.453 0.1 LOS A 0.0 0.0 0.00 0.00 0.00 59.9
Approach 884 0.0 0.453 0.1 NA 0.0 0.0 0.00 0.00 0.00 59.8
All Vehicles 1593 0.0 0.453 0.4 NA 0.3 2.3 0.03 0.02 0.04 59.5
Site Level of Service (LOS) Method: Delay (RTA NSW). Site LOS Method is specified in the Parameter Settings dialog (Site tab).
Vehicle movement LOS values are based on average delay per movement.
Minor Road Approach LOS values are based on average delay for all vehicle movements.
NA: Intersection LOS and Major Road Approach LOS values are Not Applicable for two-way sign control since the average delay is not a good LOS measure due to zero delays associated with major road movements.
SIDRA Standard Delay Model is used. Control Delay includes Geometric Delay.
Gap-Acceptance Capacity: SIDRA Standard (Akçelik M3D).
HV (%) values are calculated for All Movement Classes of All Heavy Vehicle Model Designation.
SIDRA INTERSECTION 8.0 | Copyright © 2000-2018 Akcelik and Associates Pty Ltd | sidrasolutions.comOrganisation: MCLAREN TRAFFIC ENGINEERING | Processed: 08 August 2019 14:04:20Project: \\mteserver\mte storage\Jobs\2019\190442\MTE SIDRA\19 07 29.sip8

MOVEMENT SUMMARY
Site: 101 [(Future AM) Anderson Avenue / Flowerdale Road]
New SiteSite Category: (None)Giveway / Yield (Two-Way)
Movement Performance - Vehicles
Demand Flows 95% Back of QueueMovID
Turn Deg.Satn
AverageDelay
Level ofService
Prop. Queued
Effective Stop Rate
Aver. No.Cycles
AverageSpeed Total HV Vehicles Distance
veh/h % v/c sec veh m km/hSouth: Flowerdale Road
2 T1 733 0.0 0.384 0.1 LOS A 0.2 1.2 0.02 0.01 0.03 59.8
3 R2 8 0.0 0.384 9.3 LOS A 0.2 1.2 0.02 0.01 0.03 57.6
Approach 741 0.0 0.384 0.2 NA 0.2 1.2 0.02 0.01 0.03 59.8
East: Anderson Avenue
4 L2 17 0.0 0.054 7.7 LOS A 0.2 1.2 0.61 0.76 0.61 49.5
6 R2 9 0.0 0.054 17.2 LOS B 0.2 1.2 0.61 0.76 0.61 49.1
Approach 26 0.0 0.054 11.2 LOS A 0.2 1.2 0.61 0.76 0.61 49.4
North: Flowerdale Road
7 L2 8 0.0 0.287 5.6 LOS A 0.0 0.0 0.00 0.01 0.00 58.2
8 T1 552 0.0 0.287 0.0 LOS A 0.0 0.0 0.00 0.01 0.00 59.9
Approach 560 0.0 0.287 0.1 NA 0.0 0.0 0.00 0.01 0.00 59.8
All Vehicles 1327 0.0 0.384 0.4 NA 0.2 1.2 0.03 0.02 0.03 59.5
Site Level of Service (LOS) Method: Delay (RTA NSW). Site LOS Method is specified in the Parameter Settings dialog (Site tab).
Vehicle movement LOS values are based on average delay per movement.
Minor Road Approach LOS values are based on average delay for all vehicle movements.
NA: Intersection LOS and Major Road Approach LOS values are Not Applicable for two-way sign control since the average delay is not a good LOS measure due to zero delays associated with major road movements.
SIDRA Standard Delay Model is used. Control Delay includes Geometric Delay.
Gap-Acceptance Capacity: SIDRA Standard (Akçelik M3D).
HV (%) values are calculated for All Movement Classes of All Heavy Vehicle Model Designation.
SIDRA INTERSECTION 8.0 | Copyright © 2000-2018 Akcelik and Associates Pty Ltd | sidrasolutions.comOrganisation: MCLAREN TRAFFIC ENGINEERING | Processed: 08 August 2019 14:04:21Project: \\mteserver\mte storage\Jobs\2019\190442\MTE SIDRA\19 07 29.sip8

MOVEMENT SUMMARY
Site: 101 [(Future PM) Anderson Avenue / Flowerdale Road]
New SiteSite Category: (None)Giveway / Yield (Two-Way)
Movement Performance - Vehicles
Demand Flows 95% Back of QueueMovID
Turn Deg.Satn
AverageDelay
Level ofService
Prop. Queued
Effective Stop Rate
Aver. No.Cycles
AverageSpeed Total HV Vehicles Distance
veh/h % v/c sec veh m km/hSouth: Flowerdale Road
2 T1 678 0.0 0.369 0.4 LOS A 0.4 3.1 0.06 0.01 0.09 59.3
3 R2 13 0.0 0.369 14.2 LOS A 0.4 3.1 0.06 0.01 0.09 57.1
Approach 691 0.0 0.369 0.7 NA 0.4 3.1 0.06 0.01 0.09 59.3
East: Anderson Avenue
4 L2 20 0.0 0.056 10.7 LOS A 0.2 1.2 0.72 0.88 0.72 48.4
6 R2 3 0.0 0.056 26.5 LOS B 0.2 1.2 0.72 0.88 0.72 48.0
Approach 23 0.0 0.056 12.8 LOS A 0.2 1.2 0.72 0.88 0.72 48.4
North: Flowerdale Road
7 L2 5 0.0 0.455 5.6 LOS A 0.0 0.0 0.00 0.00 0.00 58.2
8 T1 882 0.0 0.455 0.1 LOS A 0.0 0.0 0.00 0.00 0.00 59.8
Approach 887 0.0 0.455 0.1 NA 0.0 0.0 0.00 0.00 0.00 59.8
All Vehicles 1601 0.0 0.455 0.5 NA 0.4 3.1 0.04 0.02 0.05 59.4
Site Level of Service (LOS) Method: Delay (RTA NSW). Site LOS Method is specified in the Parameter Settings dialog (Site tab).
Vehicle movement LOS values are based on average delay per movement.
Minor Road Approach LOS values are based on average delay for all vehicle movements.
NA: Intersection LOS and Major Road Approach LOS values are Not Applicable for two-way sign control since the average delay is not a good LOS measure due to zero delays associated with major road movements.
SIDRA Standard Delay Model is used. Control Delay includes Geometric Delay.
Gap-Acceptance Capacity: SIDRA Standard (Akçelik M3D).
HV (%) values are calculated for All Movement Classes of All Heavy Vehicle Model Designation.
SIDRA INTERSECTION 8.0 | Copyright © 2000-2018 Akcelik and Associates Pty Ltd | sidrasolutions.comOrganisation: MCLAREN TRAFFIC ENGINEERING | Processed: 08 August 2019 14:04:21Project: \\mteserver\mte storage\Jobs\2019\190442\MTE SIDRA\19 07 29.sip8

MOVEMENT SUMMARY
Site: 101 [(Exising PM) Hillier Road / Moore Street]
New SiteSite Category: (None)Giveway / Yield (Two-Way)
Movement Performance - Vehicles
Demand Flows 95% Back of QueueMovID
Turn Deg.Satn
AverageDelay
Level ofService
Prop. Queued
Effective Stop Rate
Aver. No.Cycles
AverageSpeed Total HV Vehicles Distance
veh/h % v/c sec veh m km/hSouth: Hillier Road
1 L2 2 0.0 0.013 6.4 LOS A 0.0 0.3 0.36 0.61 0.36 52.6
3 R2 11 0.0 0.013 6.9 LOS A 0.0 0.3 0.36 0.61 0.36 46.8
Approach 13 0.0 0.013 6.8 LOS A 0.0 0.3 0.36 0.61 0.36 48.3
East: Moore Street
4 L2 11 0.0 0.149 3.5 LOS A 0.0 0.0 0.00 0.02 0.00 56.8
5 T1 280 0.0 0.149 0.0 LOS A 0.0 0.0 0.00 0.02 0.00 59.7
Approach 291 0.0 0.149 0.1 NA 0.0 0.0 0.00 0.02 0.00 59.6
West: Moore Street
11 T1 96 0.0 0.050 0.0 LOS A 0.0 0.1 0.01 0.01 0.01 59.8
12 R2 1 0.0 0.050 6.4 LOS A 0.0 0.1 0.01 0.01 0.01 57.6
Approach 97 0.0 0.050 0.1 NA 0.0 0.1 0.01 0.01 0.01 59.8
All Vehicles 400 0.0 0.149 0.3 NA 0.0 0.3 0.01 0.04 0.01 59.2
Site Level of Service (LOS) Method: Delay (RTA NSW). Site LOS Method is specified in the Parameter Settings dialog (Site tab).
Vehicle movement LOS values are based on average delay per movement.
Minor Road Approach LOS values are based on average delay for all vehicle movements.
NA: Intersection LOS and Major Road Approach LOS values are Not Applicable for two-way sign control since the average delay is not a good LOS measure due to zero delays associated with major road movements.
SIDRA Standard Delay Model is used. Control Delay includes Geometric Delay.
Gap-Acceptance Capacity: SIDRA Standard (Akçelik M3D).
HV (%) values are calculated for All Movement Classes of All Heavy Vehicle Model Designation.
SIDRA INTERSECTION 8.0 | Copyright © 2000-2018 Akcelik and Associates Pty Ltd | sidrasolutions.comOrganisation: MCLAREN TRAFFIC ENGINEERING | Processed: 08 August 2019 14:04:22Project: \\mteserver\mte storage\Jobs\2019\190442\MTE SIDRA\19 07 29.sip8
MOVEMENT SUMMARY
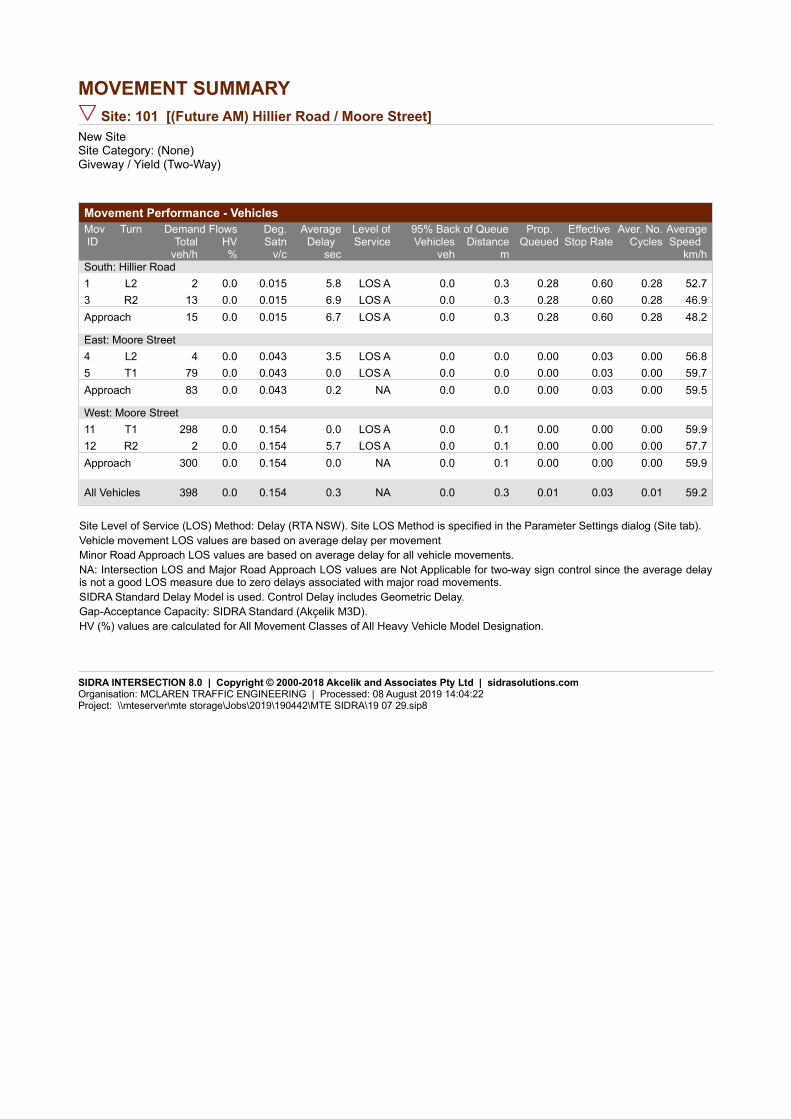
Site: 101 [(Future AM) Hillier Road / Moore Street]
New SiteSite Category: (None)Giveway / Yield (Two-Way)
Movement Performance - Vehicles
Demand Flows 95% Back of QueueMovID
Turn Deg.Satn
AverageDelay
Level ofService
Prop. Queued
Effective Stop Rate
Aver. No.Cycles
AverageSpeed Total HV Vehicles Distance
veh/h % v/c sec veh m km/hSouth: Hillier Road
1 L2 2 0.0 0.015 5.8 LOS A 0.0 0.3 0.28 0.60 0.28 52.7
3 R2 13 0.0 0.015 6.9 LOS A 0.0 0.3 0.28 0.60 0.28 46.9
Approach 15 0.0 0.015 6.7 LOS A 0.0 0.3 0.28 0.60 0.28 48.2
East: Moore Street
4 L2 4 0.0 0.043 3.5 LOS A 0.0 0.0 0.00 0.03 0.00 56.8
5 T1 79 0.0 0.043 0.0 LOS A 0.0 0.0 0.00 0.03 0.00 59.7
Approach 83 0.0 0.043 0.2 NA 0.0 0.0 0.00 0.03 0.00 59.5
West: Moore Street
11 T1 298 0.0 0.154 0.0 LOS A 0.0 0.1 0.00 0.00 0.00 59.9
12 R2 2 0.0 0.154 5.7 LOS A 0.0 0.1 0.00 0.00 0.00 57.7
Approach 300 0.0 0.154 0.0 NA 0.0 0.1 0.00 0.00 0.00 59.9
All Vehicles 398 0.0 0.154 0.3 NA 0.0 0.3 0.01 0.03 0.01 59.2
Site Level of Service (LOS) Method: Delay (RTA NSW). Site LOS Method is specified in the Parameter Settings dialog (Site tab).
Vehicle movement LOS values are based on average delay per movement.
Minor Road Approach LOS values are based on average delay for all vehicle movements.
NA: Intersection LOS and Major Road Approach LOS values are Not Applicable for two-way sign control since the average delay is not a good LOS measure due to zero delays associated with major road movements.
SIDRA Standard Delay Model is used. Control Delay includes Geometric Delay.
Gap-Acceptance Capacity: SIDRA Standard (Akçelik M3D).
HV (%) values are calculated for All Movement Classes of All Heavy Vehicle Model Designation.
SIDRA INTERSECTION 8.0 | Copyright © 2000-2018 Akcelik and Associates Pty Ltd | sidrasolutions.comOrganisation: MCLAREN TRAFFIC ENGINEERING | Processed: 08 August 2019 14:04:22Project: \\mteserver\mte storage\Jobs\2019\190442\MTE SIDRA\19 07 29.sip8

MOVEMENT SUMMARY
Site: 101 [(Future PM) Hillier Road / Moore Street]
New SiteSite Category: (None)Giveway / Yield (Two-Way)
Movement Performance - Vehicles
Demand Flows 95% Back of QueueMovID
Turn Deg.Satn
AverageDelay
Level ofService
Prop. Queued
Effective Stop Rate
Aver. No.Cycles
AverageSpeed Total HV Vehicles Distance
veh/h % v/c sec veh m km/hSouth: Hillier Road
1 L2 3 0.0 0.016 6.4 LOS A 0.1 0.4 0.36 0.61 0.36 52.6
3 R2 13 0.0 0.016 6.9 LOS A 0.1 0.4 0.36 0.61 0.36 46.8
Approach 16 0.0 0.016 6.8 LOS A 0.1 0.4 0.36 0.61 0.36 48.5
East: Moore Street
4 L2 19 0.0 0.154 3.5 LOS A 0.0 0.0 0.00 0.04 0.00 56.7
5 T1 280 0.0 0.154 0.0 LOS A 0.0 0.0 0.00 0.04 0.00 59.6
Approach 299 0.0 0.154 0.2 NA 0.0 0.0 0.00 0.04 0.00 59.4
West: Moore Street
11 T1 96 0.0 0.051 0.0 LOS A 0.0 0.1 0.02 0.01 0.02 59.6
12 R2 2 0.0 0.051 6.5 LOS A 0.0 0.1 0.02 0.01 0.02 57.5
Approach 98 0.0 0.051 0.2 NA 0.0 0.1 0.02 0.01 0.02 59.5
All Vehicles 413 0.0 0.154 0.5 NA 0.1 0.4 0.02 0.05 0.02 58.8
Site Level of Service (LOS) Method: Delay (RTA NSW). Site LOS Method is specified in the Parameter Settings dialog (Site tab).
Vehicle movement LOS values are based on average delay per movement.
Minor Road Approach LOS values are based on average delay for all vehicle movements.
NA: Intersection LOS and Major Road Approach LOS values are Not Applicable for two-way sign control since the average delay is not a good LOS measure due to zero delays associated with major road movements.
SIDRA Standard Delay Model is used. Control Delay includes Geometric Delay.
Gap-Acceptance Capacity: SIDRA Standard (Akçelik M3D).
HV (%) values are calculated for All Movement Classes of All Heavy Vehicle Model Designation.
SIDRA INTERSECTION 8.0 | Copyright © 2000-2018 Akcelik and Associates Pty Ltd | sidrasolutions.comOrganisation: MCLAREN TRAFFIC ENGINEERING | Processed: 08 August 2019 14:04:23Project: \\mteserver\mte storage\Jobs\2019\190442\MTE SIDRA\19 07 29.sip8
ANNEXURE D: CONVEX MIRROR RECOMMENDATION
(1 SHEET)
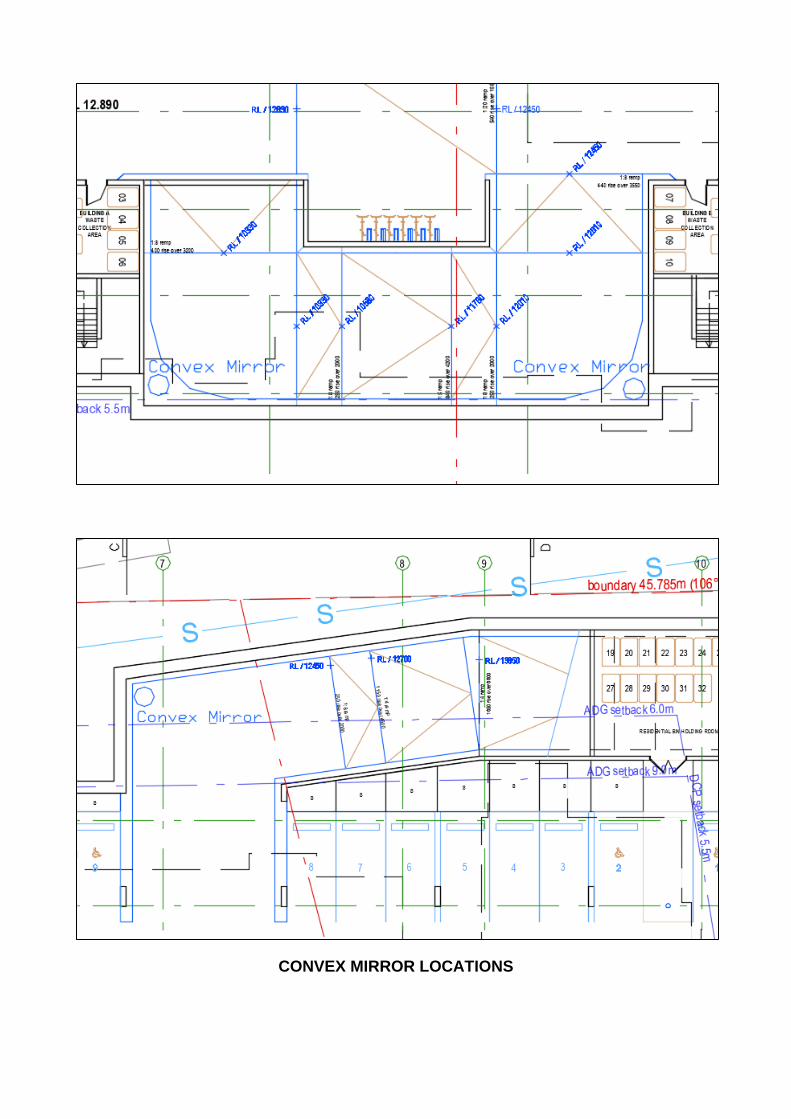
CONVEX MIRROR LOCATIONS