Embed Size (px)
Citation preview
18532.01FC - 16th April 2019
TRAFFIC AND PARKING IMPACT ASSESSMENT OF
CHILD CARE CENTRE
AT 36-40 TURNER CRESCENT, ORANGE
Address: Shop 7, 720 Old Princes Highway Sutherland NSW 2232
Postal: P.O Box 66 Sutherland NSW 1499
Telephone: +61 2 8355 2440
Fax: +61 2 9521 7199
Web: www.mclarentraffic.com.au
Email: [email protected]
Division of RAMTRANS Australia ABN: 45067491678 RPEQ: 19457
Transport Planning, Traffic Impact Assessments, Road Safety Audits, Expert Witness
18532.01FC - 16th April 2019
Development Type: Child Care Centre
Site Address: 36-40 Turner Crescent, Orange
Prepared for: Australian Childcare Solutions
Document reference: 18532.01FC
Please be aware that all information and material contained in this report is the property of McLaren Traffic
Engineering. The information contained in this document is confidential and intended solely for the use of the
client for the purpose for which it has been prepared and no representation is made or if to be implied as being
made to any third party. Any third party wishing to distribute this document in whole or in part for personal or
commercial use must obtain written confirmation from McLaren Traffic Engineering prior to doing so. Failure
to obtain written permission may constitute an infringement of copyright and may be liable for legal action.
Status Issue Prepared By Checked By Date
Draft A LS CM 22nd January 2019
Draft B LS 30th January 2019
Final A LS CM 15th March 2019
Final B LS 18th March 2019
Final C LS 16th April 2019
18532.01FC - 16th April 2019
TABLE OF CONTENTS
INTRODUCTION ....................................................................................................... 1
1.1 Description and Scale of Development ................................................................... 1
1.2 State Environmental Planning Policy (Infrastructure) 2007 ..................................... 1
1.3 Site Description ....................................................................................................... 1
1.4 Site Context ............................................................................................................ 1
EXISTING TRAFFIC AND PARKING CONDITIONS ............................................... 3
2.1 Road Hierarchy ....................................................................................................... 3
2.2 Existing Traffic Management .................................................................................. 4
2.3 Existing Traffic and Parking Environment ............................................................... 4
Intersection Performances...................................................................................... 4 Mitchell Highway Operation .................................................................................... 6
2.4 Public Transport ...................................................................................................... 6
2.5 Future Road and Infrastructure Upgrades .............................................................. 7
PARKING ASSESSMENT ........................................................................................ 8
3.1 Council Parking Requirement ................................................................................. 8
Council DCP Parking Variation ............................................................................... 8 Queuing Analysis ................................................................................................... 9
3.2 Parent Parking ........................................................................................................ 9
3.3 Bicycle & Motorcycle parking Requirements ........................................................... 9
3.4 Servicing & Loading ................................................................................................ 9
3.5 Disabled Parking ..................................................................................................... 9
3.6 Car Park Design & Compliance ............................................................................ 10
Parking Allocation to be shown ............................................................................ 10
TRAFFIC ASSESSMENT ....................................................................................... 11
4.1 Traffic Generation ................................................................................................. 11
4.2 Traffic Assignment ................................................................................................ 11
4.3 Traffic Impact ........................................................................................................ 12
Intersection Performance Assessment ................................................................. 12
4.4 Residential Amenity .............................................................................................. 14
Turner Crescent ................................................................................................... 14 Sieben Drive ........................................................................................................ 14
COUNCIL QUERIES ............................................................................................... 15
5.1 Sight Distance of Entry from Turner Crescent ...................................................... 15
5.2 Circulation Design ................................................................................................. 16
CONCLUSION ........................................................................................................ 17

Child Care Centre Page 1 of 48 36-40 Turner Crescent, Orange 18532.01FC - 16th April 2019
INTRODUCTION
MCLaren Traffic Engineering (MTE) was commissioned by Australian Childcare Solutions to
provide a Traffic and Parking Impact Assessment of the Child Care Centre, as depicted in
Annexure A, at 36-40 Turner Crescent, Orange.
1.1 Description and Scale of Development
The proposed child care centre is to accommodate 94 children as per the following:
24 children between 0-2 years old;
30 children between 2-3 years old;
40 children between 3-6 years old;
Hours of operation are 6:30am to 6:30pm, Monday to Friday.
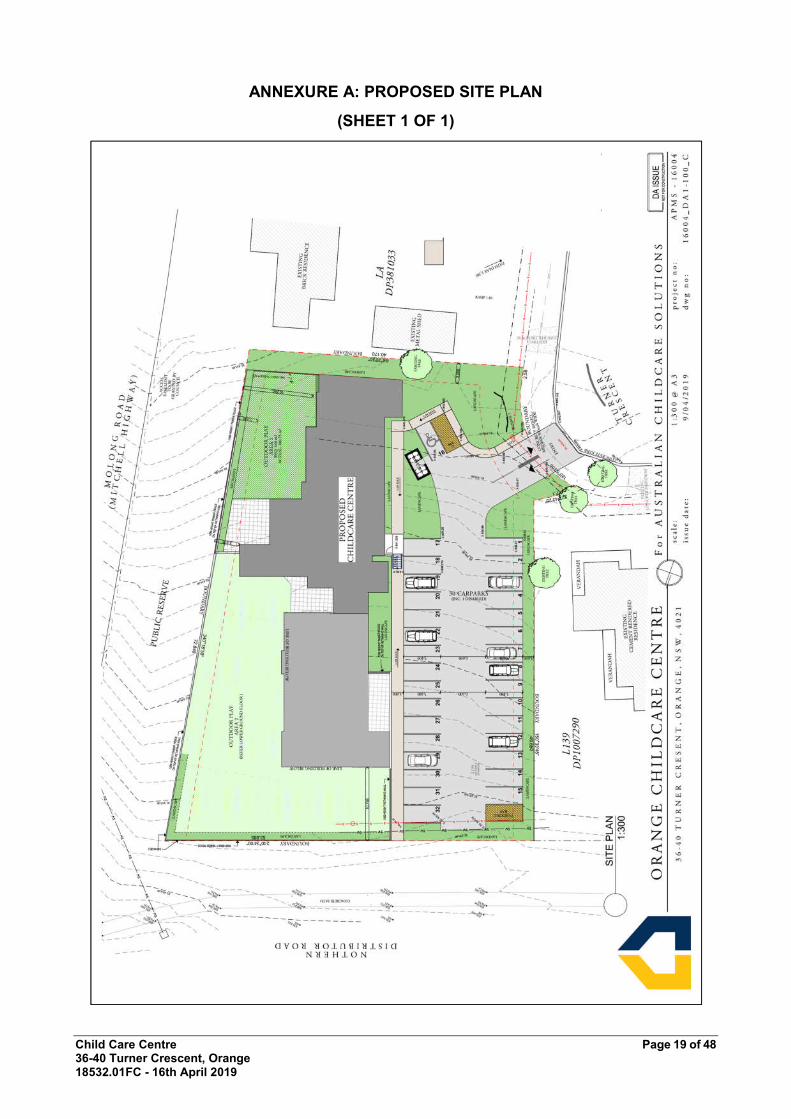
The site layout includes an outdoor car park with a total of 32 car parking spaces including
one (1) disabled space. Vehicular access to the car park is provided via the proposed two-
way driveway from Turner Crescent.
1.2 State Environmental Planning Policy (Infrastructure) 2007
The proposed development does not qualify as a development with relevant size and/or
capacity under Clause 104 of the SEPP (Infrastructure) 2007. Accordingly, formal referral to
the Roads and Maritime Services (RMS) is not necessary and Orange City Council officers
can determine this proposal accordingly.
1.3 Site Description
The subject site is currently unoccupied with frontages to Northern Distributor Road to the
north; Mitchell Highway to the east and Turner Crescent to the south. All vehicular access
to and from the site is currently undertaken via Turner Crescent. It should be noted that
access from Mitchell Highway is not possible as the client does not own the land between
Mitchell Highway and the site boundary.
The site is generally surrounded by low density residential dwellings, with Orange Anglican
Grammar School located to the north of the site.
1.4 Site Context
The site location is shown on aerial imagery and a map in Figure 1 & Figure 2 respectively.

Child Care Centre Page 2 of 48 36-40 Turner Crescent, Orange 18532.01FC - 16th April 2019
Site Location
FIGURE 1: SITE CONTEXT – AERIAL PHOTO
Site Location
FIGURE 2: SITE CONTEXT – STREET MAP
Child Care Centre Page 3 of 48 36-40 Turner Crescent, Orange 18532.01FC - 16th April 2019
EXISTING TRAFFIC AND PARKING CONDITIONS
2.1 Road Hierarchy
Mitchell Highway (Molong Road) has the following characteristics within close proximity to
the site:
RMS Classified STATE Road (No. 7);
Approximately 15m in width facilitating one traffic lane in both directions and one
parking lane on both sides of the road;
Signposted 50km/h carriageway;
Unrestricted kerbside parking along both sides of the road;
Northern Distributor Road has the following characteristics within close proximity to the site:
Unclassified SUB-ARTERIAL road;
Approximately 13 in width facilitating one traffic lane in both directions and shoulders
on both sides of the road;
Signposted 50km/h carriageway;
No kerbside parking permitted on both sides of the road.
Mastronardi Way has the following characteristics within close proximity to the site:
Unclassified LOCAL road;
Approximately 10m in width facilitating two-way passing and kerbside parking along
both sides of the road;
No speed limit signposted - 50km/h applies;
Unrestricted kerbside parking permitted along both sides of the road.
Turner Crescent has the following characteristics within close proximity to the site:
Unclassified LOCAL road;
Approximately 10m in width facilitating two-way passing and kerbside parking along
both sides of the road;
No speed limit signposted - 50km/h applies;
Unrestricted kerbside parking permitted along both sides of the road.

Child Care Centre Page 4 of 48 36-40 Turner Crescent, Orange 18532.01FC - 16th April 2019
2.2 Existing Traffic Management
Giveway controlled intersection of Mitchell Highway / Mastronardi Way;
Priority controlled intersection of Turner Crescent / Mastronardi Way;
Roundabout controlled intersection of Mitchell Highway / Northern Distributor Road;
Priority controlled intersection of Turner Crescent / Sieben Drive.
2.3 Existing Traffic and Parking Environment
Following agreement with RMS and Orange Council representatives, intersection traffic
surveys were undertaken over five (5) consecutive weekdays at the intersections of Mitchell
Highway / Northern Distributor Road, Mitchell Highway / Mastronardi Way, Turner Crescent
/ Sieben Drive between the hours of 7am – 9am and 3:30pm-6pm on Friday 7th December
2018 and Monday 10th – Thursday 13th December 2018. These surveyed dates represent
typical weekdays and will be used to assess the existing impact to the nearby intersection.
Intersection Performances
The existing intersection performances have been assessed using SIDRA INTERSECTION
8 with the existing AM and PM peak periods for each intersection taken as the maximum
weekday peak surveyed across the five weekdays. The analysis is summarised in Table 1
below, with detailed SIDRA results provided in Annexure B for reference.

Child Care Centre Page 5 of 48 36-40 Turner Crescent, Orange 18532.01FC - 16th April 2019
TABLE 1: INTERSECTION PERFORMANCES (SIDRA INTERSECTION 8)
Intersection Peak Hour
Degree of Saturation(1)
Average Delay(2)
Level of Service(3)
Control Type Worst Movement
(sec/veh)
EXISTING PERFORMANCE
Mitchell Hwy / Northern
Distributor Rd
AM 0.25 6.2 A
Roundabout
RT from Mitchell Hwy (N)
(Worst: 11.2) (Worst: A)
PM 0.27 6.2 A
RT from Northern Distributor Rd (W)
(Worst: 10.7) (Worst: A)
Mitchell Hwy / Mastronardi
Way
AM 0.20 1.6 NA
Give Way
RT from Mastronardi Way
(W) (Worst: 7.9) (Worst: A)
PM 0.16 2.2 NA RT from
Mastronardi Way (W) (Worst: 8.0) (Worst: A)
Sieben Dr / Turner Cres
AM 0.03 3.7 NA
Give Way
RT from Turner Cres (N)
(Worst: 5.7) (Worst: A)
PM 0.06 4.5 NA
RT from Turner Cres (N)
(Worst: 5.7) (Worst: A)
NOTES: (1) The Degree of Saturation is the ratio of demand to capacity for the most disadvantaged movement. (2) The average delay is the delay experienced on average by all vehicles. The value in brackets represents the delay to the most disadvantaged movement. (3) The Level of Service is a qualitative measure of performance describing operational conditions. There are six levels of service, designated from A to F, with A representing the best operational condition and level of service F the worst. The LoS of the intersection is shown in bold, and the LoS of the most disadvantaged movement is shown in brackets. (4) No overall Level of Service is provided for Give Way and Stop controlled intersections as the low delays associated with the dominant movements skew the average delay of the intersection. The Level of Service of the worst approach is an indicator of the operation of the intersection, with a worse Level of Service corresponding to long delays and reduced safety outcomes for that approach.
As shown in Table 1 above the intersection of Mitchell Highway / Northern Distributor Road
is operating at Level of Service “A” during the peak AM and PM periods. This represents
minimal delays and additional spare capacity.
It should be noted that SIDRA provides a N/A overall LoS for assessed “Give-Way”
intersections due to the zero delays associated with major through movements, with the LoS
of the worst approach movement considered as an indicator of the operation of the
intersection. The “Give-Way” intersections of Mitchell Highway / Mastronardi Way and
Sieben Drive / Turner Crescent are currently performing at a high level of efficiency, with a
Level of Service “A” reported in both the AM & PM peak hours for both intersections for the
worst movement. The level of service “A” performance is characterised by low approach
delays and spare capacity.
It should also be noted that all intersections provide compliant Safe Intersection Sight
Distance (SISD) in accordance with AUSTROADS requirements.
Child Care Centre Page 6 of 48 36-40 Turner Crescent, Orange 18532.01FC - 16th April 2019
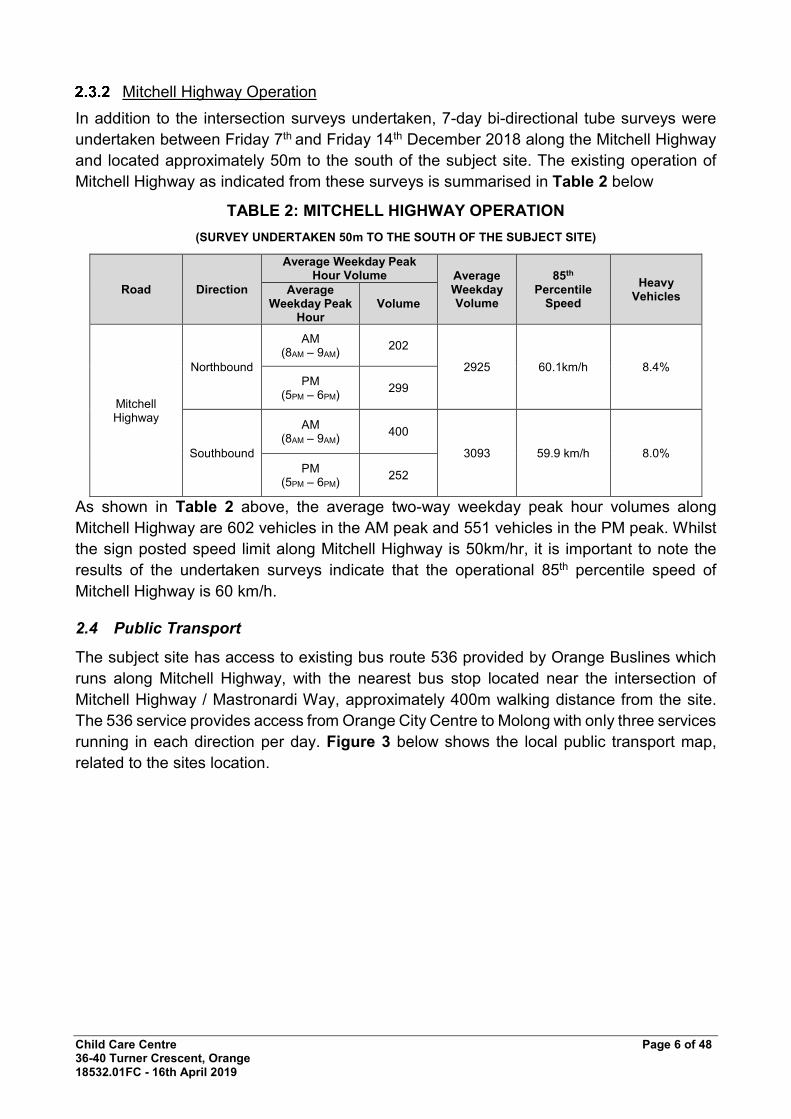
Mitchell Highway Operation
In addition to the intersection surveys undertaken, 7-day bi-directional tube surveys were
undertaken between Friday 7th and Friday 14th December 2018 along the Mitchell Highway
and located approximately 50m to the south of the subject site. The existing operation of
Mitchell Highway as indicated from these surveys is summarised in Table 2 below
TABLE 2: MITCHELL HIGHWAY OPERATION
(SURVEY UNDERTAKEN 50m TO THE SOUTH OF THE SUBJECT SITE)
Road Direction
Average Weekday Peak Hour Volume Average
Weekday Volume
85th Percentile
Speed
Heavy Vehicles
Average Weekday Peak
Hour Volume
Mitchell Highway
Northbound
AM (8AM – 9AM)
202
2925 60.1km/h 8.4% PM
(5PM – 6PM) 299
Southbound
AM (8AM – 9AM)
400
3093 59.9 km/h 8.0%
PM (5PM – 6PM)
252
As shown in Table 2 above, the average two-way weekday peak hour volumes along
Mitchell Highway are 602 vehicles in the AM peak and 551 vehicles in the PM peak. Whilst
the sign posted speed limit along Mitchell Highway is 50km/hr, it is important to note the
results of the undertaken surveys indicate that the operational 85th percentile speed of
Mitchell Highway is 60 km/h.
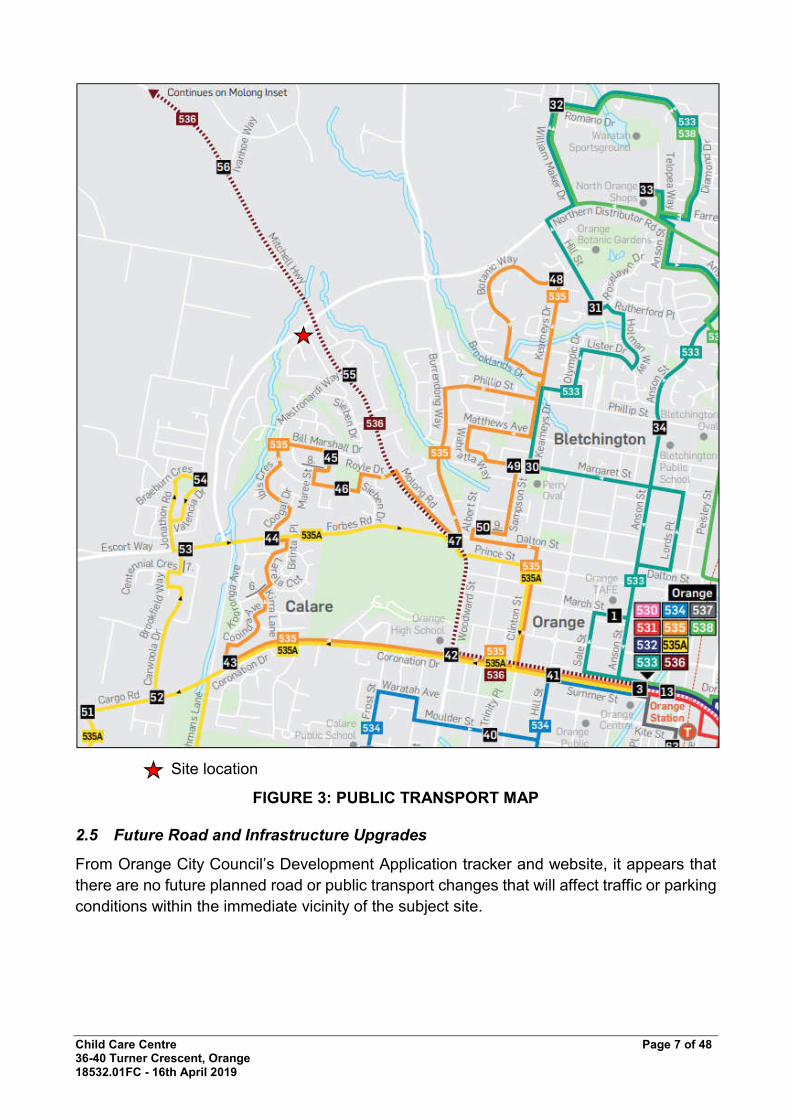
2.4 Public Transport
The subject site has access to existing bus route 536 provided by Orange Buslines which
runs along Mitchell Highway, with the nearest bus stop located near the intersection of
Mitchell Highway / Mastronardi Way, approximately 400m walking distance from the site.
The 536 service provides access from Orange City Centre to Molong with only three services
running in each direction per day. Figure 3 below shows the local public transport map,
related to the sites location.
Child Care Centre Page 7 of 48 36-40 Turner Crescent, Orange 18532.01FC - 16th April 2019
Site location
FIGURE 3: PUBLIC TRANSPORT MAP
2.5 Future Road and Infrastructure Upgrades
From Orange City Council’s Development Application tracker and website, it appears that
there are no future planned road or public transport changes that will affect traffic or parking
conditions within the immediate vicinity of the subject site.
Child Care Centre Page 8 of 48 36-40 Turner Crescent, Orange 18532.01FC - 16th April 2019
PARKING ASSESSMENT
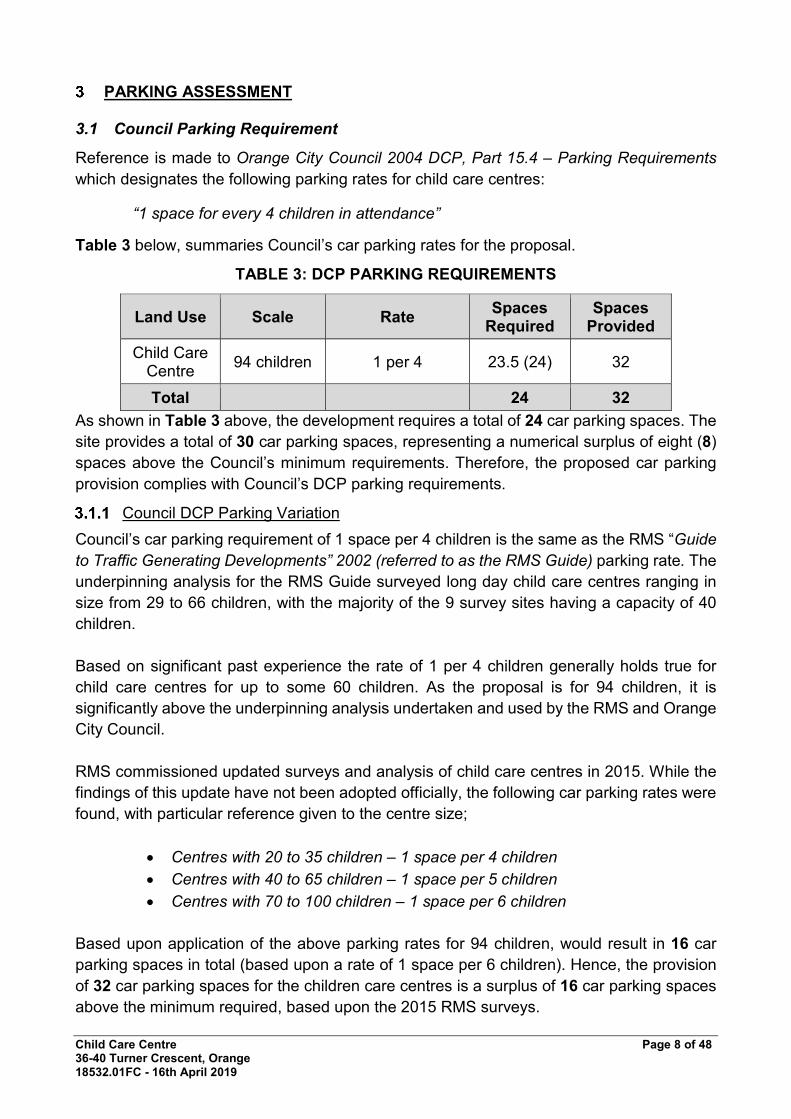
3.1 Council Parking Requirement
Reference is made to Orange City Council 2004 DCP, Part 15.4 – Parking Requirements
which designates the following parking rates for child care centres:
“1 space for every 4 children in attendance”
Table 3 below, summaries Council’s car parking rates for the proposal.
TABLE 3: DCP PARKING REQUIREMENTS
Land Use Scale Rate Spaces
Required Spaces
Provided
Child Care Centre
94 children 1 per 4 23.5 (24) 32
Total 24 32
As shown in Table 3 above, the development requires a total of 24 car parking spaces. The
site provides a total of 30 car parking spaces, representing a numerical surplus of eight (8)
spaces above the Council’s minimum requirements. Therefore, the proposed car parking
provision complies with Council’s DCP parking requirements.
Council DCP Parking Variation
Council’s car parking requirement of 1 space per 4 children is the same as the RMS “Guide
to Traffic Generating Developments” 2002 (referred to as the RMS Guide) parking rate. The
underpinning analysis for the RMS Guide surveyed long day child care centres ranging in
size from 29 to 66 children, with the majority of the 9 survey sites having a capacity of 40
children.
Based on significant past experience the rate of 1 per 4 children generally holds true for
child care centres for up to some 60 children. As the proposal is for 94 children, it is
significantly above the underpinning analysis undertaken and used by the RMS and Orange
City Council.
RMS commissioned updated surveys and analysis of child care centres in 2015. While the
findings of this update have not been adopted officially, the following car parking rates were
found, with particular reference given to the centre size;
Centres with 20 to 35 children – 1 space per 4 children
Centres with 40 to 65 children – 1 space per 5 children
Centres with 70 to 100 children – 1 space per 6 children
Based upon application of the above parking rates for 94 children, would result in 16 car
parking spaces in total (based upon a rate of 1 space per 6 children). Hence, the provision
of 32 car parking spaces for the children care centres is a surplus of 16 car parking spaces
above the minimum required, based upon the 2015 RMS surveys.
Child Care Centre Page 9 of 48 36-40 Turner Crescent, Orange 18532.01FC - 16th April 2019
Queuing Analysis
To further support the development, queuing analysis has been undertaken and is
reproduced in Annexure C for reference. The RMS Guide states that the average duration
of stay for a parent at a child care centre is 6.8 minutes. Applying the duration of stay to the
queuing analysis results in a parking demand of 7 parent car parking spaces based upon a
98th percentile parking demand outcome.
As a worst-case scenario an average stay length of 10 minutes has also been applied, with
the results showing, a parent parking demand of 10 car spaces based upon a 98th percentile
parking demand outcome. Based on the above queuing analysis, the provision of 10 parent
drop-off / pick-up satisfies the 98th percentile queue for the parking demand of the 94-place
child care centre.
3.2 Parent Parking
Visitor parking involves parents and carers exiting or entering the site by vehicle and a
pedestrian movement to / from the centre’s entrance. The RMS promotes Child Care
Centres to provide this parking in a SAFE and CONVENIENT way. The most SAFE and
CONVENIENT way is with a dedicated footpath from each parent space to the entry, in a
low traffic volume area and with minimal crossings of driveways and roads. The proposed
plans provide visitor spaces on-site with a dedicated pedestrian path to the entry separate
to the parking aisle. This is determined to be safe and convenient as per the RMS Guide.
3.3 Bicycle & Motorcycle parking Requirements
Council’s DCP does not provide bicycle or motorcycle parking rates for child care centres,
and as such, the DCP does not require the provision of this facility. No on-site bicycle or
motorcycle parking has been provided.
3.4 Servicing & Loading
Council’s DCP does not specifically outline a rate for the provision of loading facilities at
child care centres. The typical size of vehicles used for small and infrequent deliveries to
child care centres is a B99 utility / courier van (i.e. Toyota Hiace) which can access a normal
sized car space. The site can accommodate a delivery vehicle on-site between 9am and
4pm, hence outside peak visitor times such that a portion of visitor spaces are very likely to
be vacant. This can be under a management plan if required, however it is common practice
and will not be seen to noticeably affect operation of the site. It is reiterated that deliveries
and other arrivals of similar nature are low in frequency and can be easily managed.
It is proposed by the client for waste to be collected via kerbside collection by Council. Waste
bins will be wheeled to the kerbside and collected by Council vehicles along the site’s
frontage within Turner Crescent.
3.5 Disabled Parking
Council’s DCP does not outline any requirements for accessible parking for child care
centres. As such, reference is made to the BCA. A child care centre is a Class 9b building,

Child Care Centre Page 10 of 48 36-40 Turner Crescent, Orange 18532.01FC - 16th April 2019
as such requires the provision of one (1) disabled space per 100 spaces provided, or part
thereof. Therefore, the site requires one (1) disabled space, which has been provided as per
AS2890.6:2009 design requirements.
3.6 Car Park Design & Compliance
The proposed parking layout, as depicted Annexure A, has been assessed against the
relevant Australian standards, namely AS2890.1:2004 and AS2890.6:2009. The car parking
layout has been assessed to generally achieve the relevant objectives and requirements of
these standards subject to any non-compliances / recommended changes detailed in the
sub-sections below. The following are relevant to note:
Staff spaces within minimum dimensions of 2.4m width by 5.4m length (note design
width is greater than the minimum required)
Visitor parking spaces with minimum dimension of 2.6m width by 5.4m length;
Disabled car parking space with minimum dimensions of 2.4m width by 5.4 length,
with adjacent shared space with dimensions of 2.4m width by 5.4m length;
6.3m wide driveway providing a separate entry and egress driveway path via a raised
median;
Parking aisle with a minimum width of 5.8m, design width exceeds this minimum and
provides a 6.6m width for greater parking ease.
Parking Allocation to be shown
It is recommended to designate 10 parking spaces on the side of the parking aisle closest
to the child care centre as parent parking spaces, as per the allocation plan in Annexure D,
with the remaining spaces to be unmarked to be used by both parents and staff.
While the design has been assessed as generally compliant with the relevant standards,
subject to any non-compliances in the subsections above, it is usual and expected that a
compliance certificate is required at the construction certificate stage to account for any
design changes during or after the DA process.
Child Care Centre Page 11 of 48 36-40 Turner Crescent, Orange 18532.01FC - 16th April 2019
TRAFFIC ASSESSMENT
The impact of the expected traffic generation levels associated with the subject proposal is
discussed in the following sub-sections.
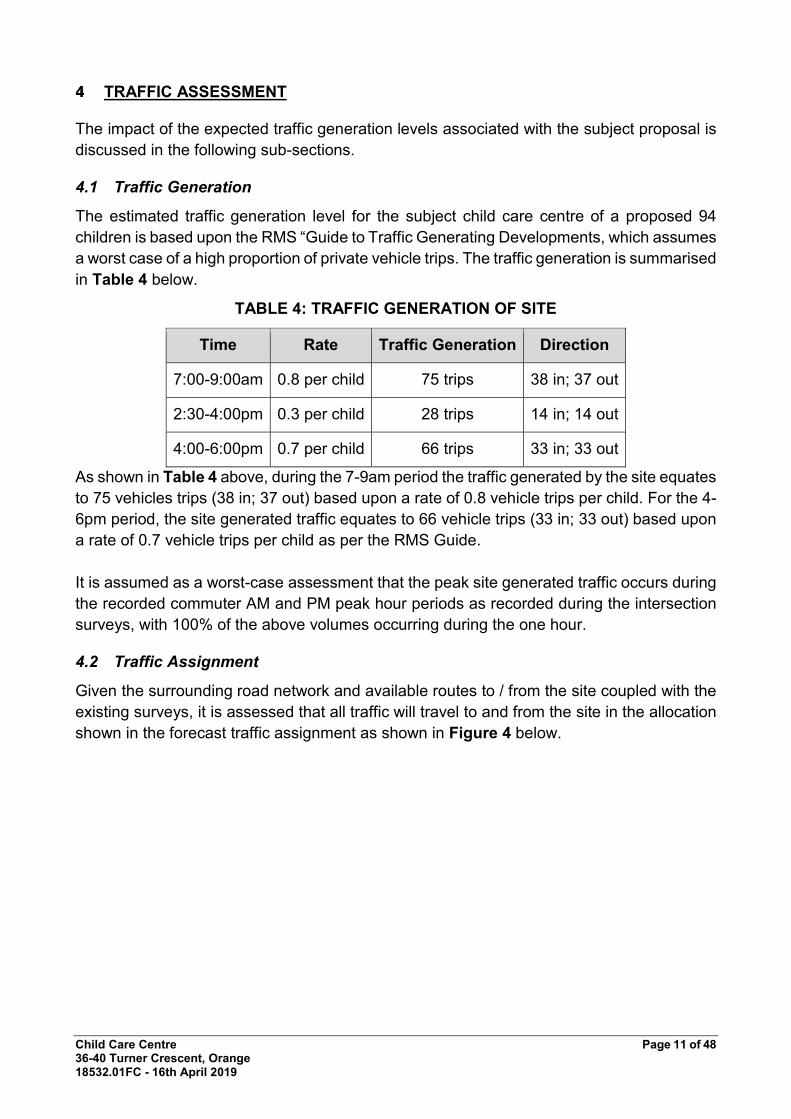
4.1 Traffic Generation
The estimated traffic generation level for the subject child care centre of a proposed 94
children is based upon the RMS “Guide to Traffic Generating Developments, which assumes
a worst case of a high proportion of private vehicle trips. The traffic generation is summarised
in Table 4 below.
TABLE 4: TRAFFIC GENERATION OF SITE
Time Rate Traffic Generation Direction
7:00-9:00am 0.8 per child 75 trips 38 in; 37 out
2:30-4:00pm 0.3 per child 28 trips 14 in; 14 out
4:00-6:00pm 0.7 per child 66 trips 33 in; 33 out
As shown in Table 4 above, during the 7-9am period the traffic generated by the site equates
to 75 vehicles trips (38 in; 37 out) based upon a rate of 0.8 vehicle trips per child. For the 4-
6pm period, the site generated traffic equates to 66 vehicle trips (33 in; 33 out) based upon
a rate of 0.7 vehicle trips per child as per the RMS Guide.
It is assumed as a worst-case assessment that the peak site generated traffic occurs during
the recorded commuter AM and PM peak hour periods as recorded during the intersection
surveys, with 100% of the above volumes occurring during the one hour.
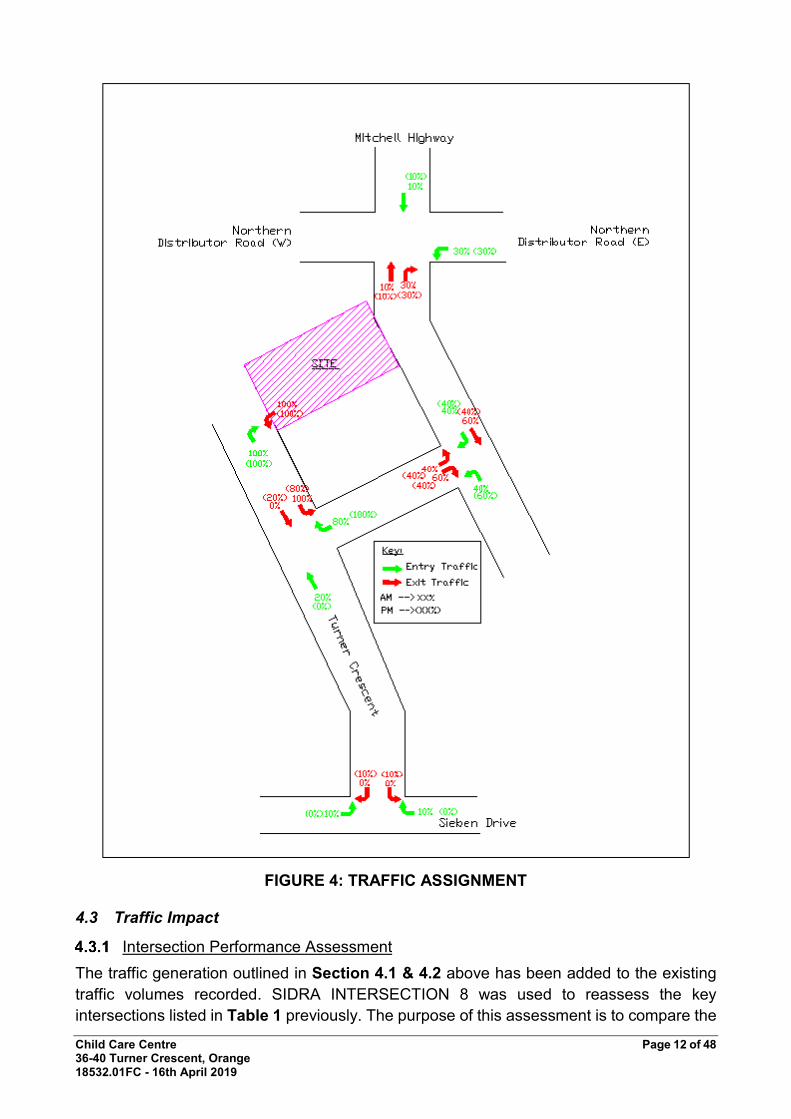
4.2 Traffic Assignment
Given the surrounding road network and available routes to / from the site coupled with the
existing surveys, it is assessed that all traffic will travel to and from the site in the allocation
shown in the forecast traffic assignment as shown in Figure 4 below.
Child Care Centre Page 12 of 48 36-40 Turner Crescent, Orange 18532.01FC - 16th April 2019
FIGURE 4: TRAFFIC ASSIGNMENT
4.3 Traffic Impact
Intersection Performance Assessment
The traffic generation outlined in Section 4.1 & 4.2 above has been added to the existing
traffic volumes recorded. SIDRA INTERSECTION 8 was used to reassess the key
intersections listed in Table 1 previously. The purpose of this assessment is to compare the

Child Care Centre Page 13 of 48 36-40 Turner Crescent, Orange 18532.01FC - 16th April 2019
existing intersection operations to the future scenario under the forecast increased traffic
load associated with the proposed child care centre. The results of this assessment are
shown in Table 5 below, with detailed SIDRA outputs provided in Annexure B for reference.
TABLE 5: INTERSECTION PERFORMANCES (SIDRA INTERSECTION 8)
Intersection Peak Hour
Degree of Saturation(1)
Average Delay(2)
Level of Service(3)
Control Type Worst Movement
(sec/veh)
EXISTING PERFORMANCE
Mitchell Hwy / Northern
Distributor Rd
AM 0.25 6.2 A
Roundabout
RT from Mitchell Hwy (N)
(Worst: 11.2) (Worst: A)
PM 0.27 6.2 A
RT from Northern Distributor Rd (W)
(Worst: 10.7) (Worst: A)
Mitchell Hwy / Mastronardi
Way
AM 0.20 1.6 NA
Give Way
RT from Mastronardi Way
(W) (Worst: 7.9) (Worst: A)
PM 0.16 2.2 NA RT from
Mastronardi Way (W) (Worst: 8.0) (Worst: A)
Sieben Dr / Turner Cres
AM 0.03 3.7 NA
Give Way
RT from Turner Cres (N)
(Worst: 5.7) (Worst: A)
PM 0.06 4.5 NA
RT from Turner Cres (N)
(Worst: 5.7) (Worst: A)
FUTURE PERFORMANCE
Mitchell Hwy /
Northern
Distributor Rd
AM 0.25 6.3 A
Roundabout
RT from Mitchell
Hwy (Worst: 11.3) (Worst: A)
PM 0.28 6.2 A
RT from Northern
Distributor Rd (Worst: 10.8) (Worst: A)
Mitchell Hwy /
Mastronardi
Way
AM 0.21 2.1 NA
Give Way
RT from
Mastronardi Way
(W) (Worst: 8.2) (Worst: A)
PM 0.18 2.6 NA RT from
Mastronardi Way
(W) (Worst: 8.3) (Worst: A)
Sieben Dr /
Turner Cres
AM 0.03 3.8 NA
Give Way
RT from Turner
Cres (N) (Worst: 5.7) (Worst: A)
PM 0.06 4.5 NA
RT from Turner
Cres (N) (Worst: 5.7) (Worst: A)
Notes: Refer to Table 1

Child Care Centre Page 14 of 48 36-40 Turner Crescent, Orange 18532.01FC - 16th April 2019
As shown in Table 5 above, the existing intersection performances remain unaltered under
the future scenario in terms of Level of Service. The existing Level of Service “A” for the
intersection of Mitchell Highway / Northern Distributor Road, and the worst turning
movements of the intersections of Mitchell Highway / Mastronardi Way and Turner Crescent
/ Sieben Drive remains unaltered under the future scenario, with minimal additional delays
and capacity maintained.
4.4 Residential Amenity
Turner Crescent
The existing peak two-way traffic volumes surveyed along Turner Crescent were 90 two way
vehicles during the morning and 129 two way vehicles during the evening peak hour. These
existing two-way flows are well below the environmental goal of 200 vehicles per hour or the
maximum threshold of 300 vehicles per hour for a local street as specified in the RMS Guide
to Traffic Generating Developments 2002.
The additional traffic generation of 75 AM peak (38 in; 37 out) and 66 PM peak (33 in; 33
out) vehicular trips along Turner Crescent will result in a two-way peak traffic flow of 165
and 195 vehicles during the AM and PM peak periods respectively. These two-way traffic
flows are below the environmental goal of 200 vehicles per hour and well below the
maximum threshold of 300 vehicles per hour for local streets as specified in the RMS Guide
and is supported.
Sieben Drive
The existing two-way traffic volumes surveyed along Sieben Drive were 107 two-way
vehicles during the morning and 114 two-way vehicles during the evening peak hour. These
existing two-way flows are well below the environmental goal of 300 vehicles per hour or the
maximum threshold of 500 vehicles per hour for a Collector Road as specified in the RMS
Guide to Traffic Generating Developments 2002.
The additional traffic of 4 AM peak and 4 PM peak vehicular trips along Sieben Drive will
result in a two-way traffic flow of 111 and 118 vehicles during the AM and PM peak periods
respectively. These two-way traffic flows are well below the environmental goal of 300
vehicles per hour and the maximum threshold of 500 vehicles per hour for collector streets
as specified in the RMS Guide and is supported.
Child Care Centre Page 15 of 48 36-40 Turner Crescent, Orange 18532.01FC - 16th April 2019
Council Queries
Reference is made to Council’s queries raised within an email dated 30th March 2017 for a
previously proposed Child Care Centre of larger scale for the subject site of 36 – 40 Turner
Crescent, Orange. The Council concerns are considered to remain relevant for the currently
proposed Child Care Centre and have been addressed within the following subsections.
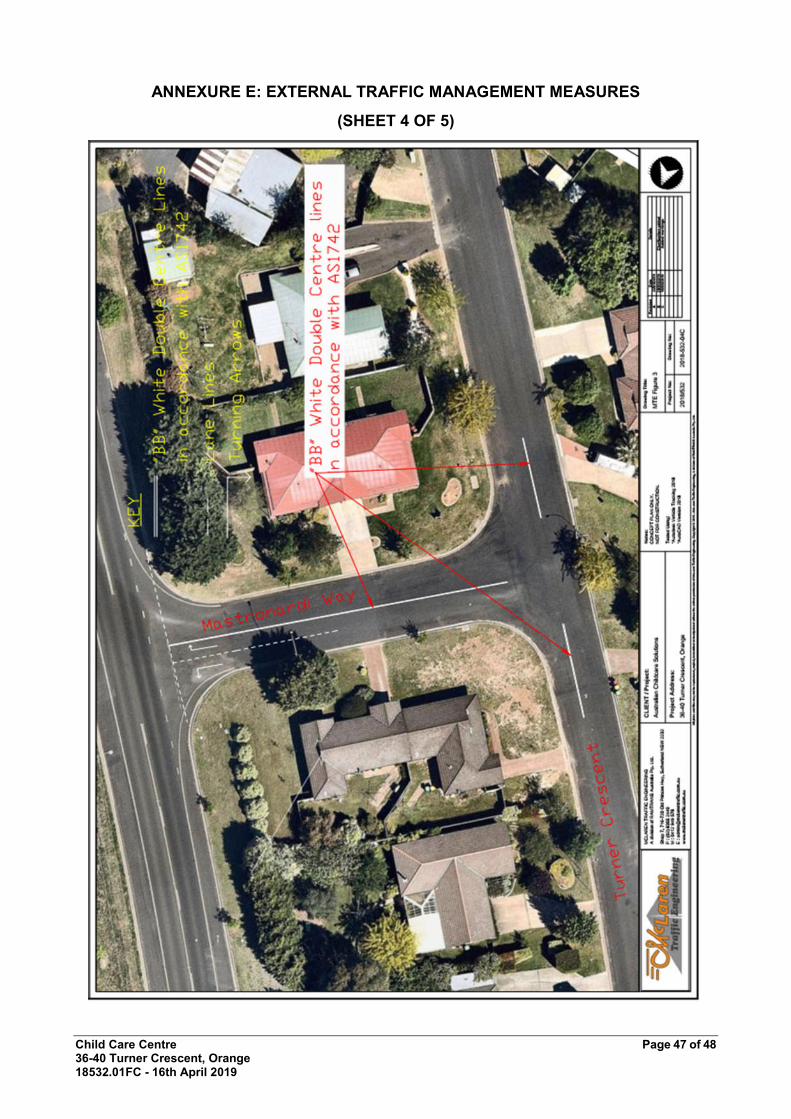
5.1 Sight Distance of Entry from Turner Crescent
Council has requested additional information in relation to “sight distance for vehicles
entering the site”. The proposed entry driveway has been provided along a bend on Turner
Crescent and as a result, vehicles turning right into the development may cut the corner,
before adequate sight line has been achieved to vehicles along Turner Crescent. To restrict
this illegal manoeuvre, a concept has been provided in Annexure E for reference. The
concept provides a raised median and BB lines along Turner Crescent with a break in the
median when adequate sight lines have been achieved for vehicles turning right into the site
to opposing vehicles. The concept provided in Annexure E also provides a linemarking plan
for Mastronardi Way. During a site inspection this arrangement was recommended and the
suggested formal arrangement shown in Annexure E provides a safer outcome for all
vehicles.
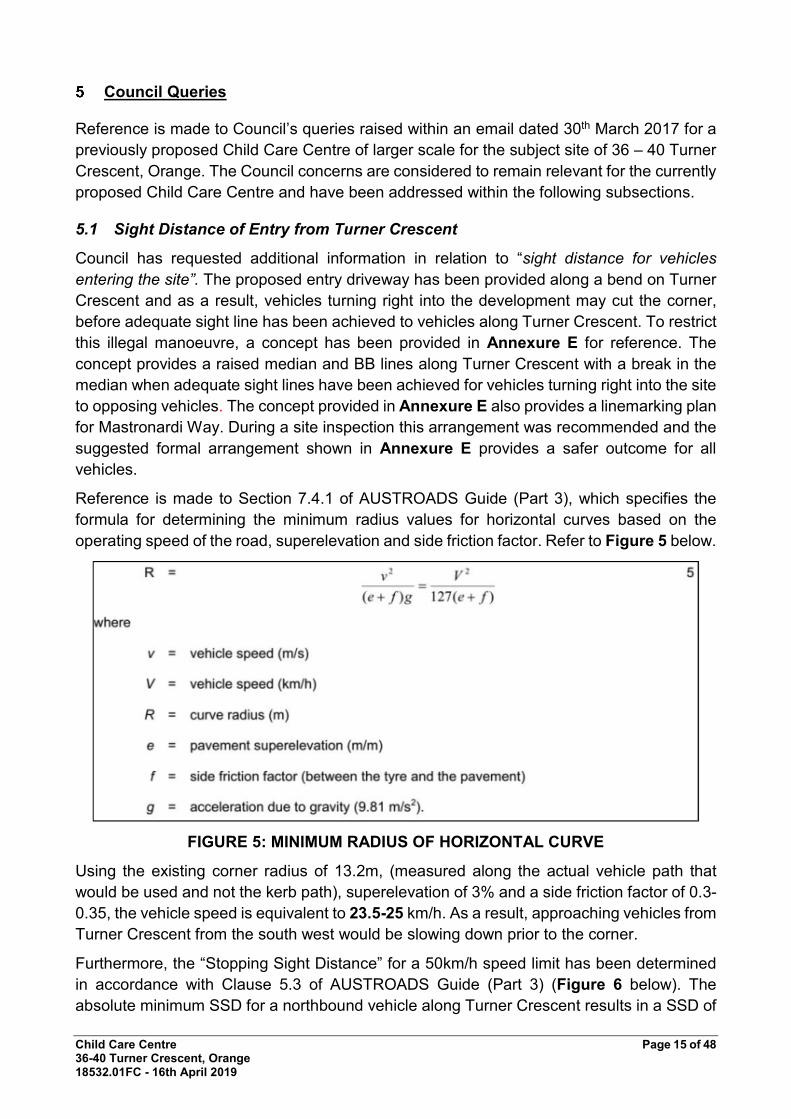
Reference is made to Section 7.4.1 of AUSTROADS Guide (Part 3), which specifies the
formula for determining the minimum radius values for horizontal curves based on the
operating speed of the road, superelevation and side friction factor. Refer to Figure 5 below.
FIGURE 5: MINIMUM RADIUS OF HORIZONTAL CURVE
Using the existing corner radius of 13.2m, (measured along the actual vehicle path that
would be used and not the kerb path), superelevation of 3% and a side friction factor of 0.3-
0.35, the vehicle speed is equivalent to 23.5-25 km/h. As a result, approaching vehicles from
Turner Crescent from the south west would be slowing down prior to the corner.
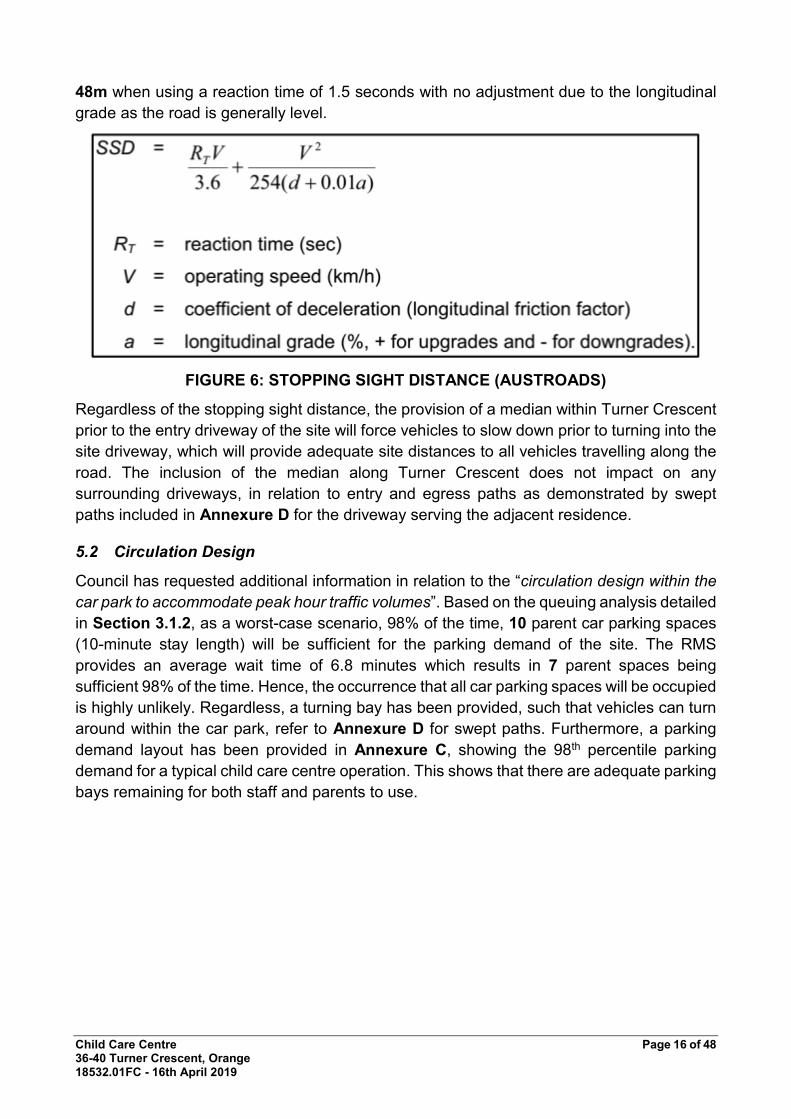
Furthermore, the “Stopping Sight Distance” for a 50km/h speed limit has been determined
in accordance with Clause 5.3 of AUSTROADS Guide (Part 3) (Figure 6 below). The
absolute minimum SSD for a northbound vehicle along Turner Crescent results in a SSD of
Child Care Centre Page 16 of 48 36-40 Turner Crescent, Orange 18532.01FC - 16th April 2019
48m when using a reaction time of 1.5 seconds with no adjustment due to the longitudinal
grade as the road is generally level.
FIGURE 6: STOPPING SIGHT DISTANCE (AUSTROADS)
Regardless of the stopping sight distance, the provision of a median within Turner Crescent
prior to the entry driveway of the site will force vehicles to slow down prior to turning into the
site driveway, which will provide adequate site distances to all vehicles travelling along the
road. The inclusion of the median along Turner Crescent does not impact on any
surrounding driveways, in relation to entry and egress paths as demonstrated by swept
paths included in Annexure D for the driveway serving the adjacent residence.
5.2 Circulation Design
Council has requested additional information in relation to the “circulation design within the
car park to accommodate peak hour traffic volumes”. Based on the queuing analysis detailed
in Section 3.1.2, as a worst-case scenario, 98% of the time, 10 parent car parking spaces
(10-minute stay length) will be sufficient for the parking demand of the site. The RMS
provides an average wait time of 6.8 minutes which results in 7 parent spaces being
sufficient 98% of the time. Hence, the occurrence that all car parking spaces will be occupied
is highly unlikely. Regardless, a turning bay has been provided, such that vehicles can turn
around within the car park, refer to Annexure D for swept paths. Furthermore, a parking
demand layout has been provided in Annexure C, showing the 98th percentile parking
demand for a typical child care centre operation. This shows that there are adequate parking
bays remaining for both staff and parents to use.

Child Care Centre Page 17 of 48 36-40 Turner Crescent, Orange 18532.01FC - 16th April 2019
CONCLUSION
In view of the foregoing, the subject proposal (as depicted in Annexure A) is fully
supportable in terms of its traffic and parking impacts. The following outcomes of this traffic
and parking impact assessment are relevant to note:
Orange City Council requires 24 car parking spaces, the ground level at-grade car
park provides 32 car parking spaces, resulting in compliance with Council’s DCP
requirements, with an actual surplus of eight (8) spaces.
The proposed parking layout, as depicted Annexure A, has been assessed against
the relevant Australian standards, namely AS2890.1:2004 and AS2890.6:2009 and
found to be compliant, subject to any non-compliances or recommended changes
mentioned in Section 3.6.
The child care centre is expected to generate 75 and 66 vehicle trips in the AM (38
in, 37 out) and PM (33 in, 33 out) peak periods. This additional level of traffic has
been assessed using SIDRA intersection analysis which indicates that the existing
traffic movement and intersection “A” LoS of all assessed key intersections listed in
Tables 1 and 5 has been retained. This unaltered LoS of “A” represents minimal
delays and that additional spare capacity is maintained.
The additional traffic generation of 75 peak AM and 66 peak PM vehicular trips will
result in a two-way traffic flow of 165 and 195 vehicles during the AM and PM peak
periods respectively within Turner Crescent. These two-way traffic flows are below
the environmental goal of 200 vehicles per hour and well below the maximum
threshold of 300 vehicles per hour for local streets as specified in the RMS Guide.
The impact upon the COLLECTOR road of Sieben Drive is also acceptable as
outlined in Section 4.4 of this report.
Council’s DCP does not provide bicycle or motorcycle parking rates for child care
centres, and as such, the DCP does not require the provision of this facility. No on-
site bicycle or motorcycle parking has been provided.
The typical size of vehicles used for small and infrequent deliveries to child care
centres is a B99 utility / courier van (i.e. Toyota Hiace) which can access a normal
sized car space. The site can accommodate a delivery vehicle on-site between 9am
and 4pm, hence outside peak visitor times such that a portion of visitor spaces are
very likely to be vacant.

Child Care Centre Page 18 of 48 36-40 Turner Crescent, Orange 18532.01FC - 16th April 2019
A queuing analysis has been undertaken for the proposed development. The results
of the queuing analysis results in a parking demand of 7 parent car parking spaces
(average length of stay 6.8 minutes) based upon a 98th percentile parking demand
outcome. As a worst-case scenario an average stay length of 10 minutes has also
been applied, with the results showing, a parent parking demand of 10 car spaces
based upon a 98th percentile parking demand outcome. Based on the above queuing
analysis, the provision of 10 parent drop-off / pick-up spaces satisfies the 98th
percentile queue for the parking demand of the proposed 94 place child care centre.
Child Care Centre Page 19 of 48 36-40 Turner Crescent, Orange 18532.01FC - 16th April 2019
ANNEXURE A: PROPOSED SITE PLAN
(SHEET 1 OF 1)

Child Care Centre Page 20 of 48 36-40 Turner Crescent, Orange 18532.01FC - 16th April 2019
ANNEXURE B: SIDRA ANALYSIS
(SHEET 1 OF 12)
MOVEMENT SUMMARY
Site: 101 [Northern Distributor Rd / Mitchell Hwy EX AM]
Northern Distributor Road / Mitchell Highway Existing conditions AM peak period Site Category: (None) Roundabout
Movement Performance - Vehicles
Mov ID
Turn Demand Flows Deg.
Satn Average
Delay Level of Service
95% Back of Queue Prop. Queued
Effective Stop Rate
Aver. No. Cycles
Average Speed Total HV Vehicles Distance
veh/h % v/c sec veh m km/h
South: Mitchell Hwy (S)
1 L2 8 0.0 0.066 5.3 LOS A 0.3 2.1 0.43 0.52 0.43 54.0
2 T1 106 4.7 0.115 5.3 LOS A 0.6 4.0 0.43 0.56 0.43 54.6
3 R2 86 1.2 0.115 10.2 LOS A 0.6 4.0 0.42 0.61 0.42 53.9
Approach 200 3.0 0.115 7.4 LOS A 0.6 4.0 0.43 0.58 0.43 54.3
East: Northern Distributor Rd (E)
4 L2 103 1.9 0.114 5.5 LOS A 0.5 3.7 0.44 0.57 0.44 54.3
5 T1 149 14.1 0.236 5.3 LOS A 1.2 9.5 0.45 0.60 0.45 53.9
6 R2 123 8.9 0.236 10.4 LOS A 1.2 9.5 0.45 0.60 0.45 54.0
Approach 375 9.1 0.236 7.0 LOS A 1.2 9.5 0.45 0.59 0.45 54.1
North: Mitchell Hwy (N)
7 L2 120 1.7 0.122 5.0 LOS A 0.5 3.6 0.36 0.53 0.36 54.6
8 T1 265 3.0 0.245 4.8 LOS A 1.2 9.0 0.37 0.49 0.37 55.8
9 R2 36 69.4 0.245 11.2 LOS A 1.2 9.0 0.37 0.49 0.37 53.4
Approach 421 8.3 0.245 5.4 LOS A 1.2 9.0 0.37 0.50 0.37 55.2
West: Northern Distributor Rd (W)
10 L2 31 0.0 0.052 5.3 LOS A 0.2 1.5 0.40 0.53 0.40 54.4
11 T1 150 9.3 0.114 5.0 LOS A 0.5 3.6 0.38 0.48 0.38 55.8
12 R2 1 0.0 0.114 10.0 LOS A 0.5 3.6 0.38 0.47 0.38 56.1
Approach 182 7.7 0.114 5.1 LOS A 0.5 3.6 0.38 0.49 0.38 55.5
All Vehicles 1178 7.6 0.245 6.2 LOS A 1.2 9.5 0.41 0.54 0.41 54.7
Site Level of Service (LOS) Method: Delay (RTA NSW). Site LOS Method is specified in the Parameter Settings dialog (Site tab).
Vehicle movement LOS values are based on average delay per movement.
Intersection and Approach LOS values are based on average delay for all vehicle movements.
Roundabout Capacity Model: SIDRA Standard.
SIDRA Standard Delay Model is used. Control Delay includes Geometric Delay.
Gap-Acceptance Capacity: SIDRA Standard (Akçelik M3D).
HV (%) values are calculated for All Movement Classes of All Heavy Vehicle Model Designation.
Child Care Centre Page 21 of 48 36-40 Turner Crescent, Orange 18532.01FC - 16th April 2019
ANNEXURE B: SIDRA ANALYSIS
(SHEET 2 OF 12)
MOVEMENT SUMMARY
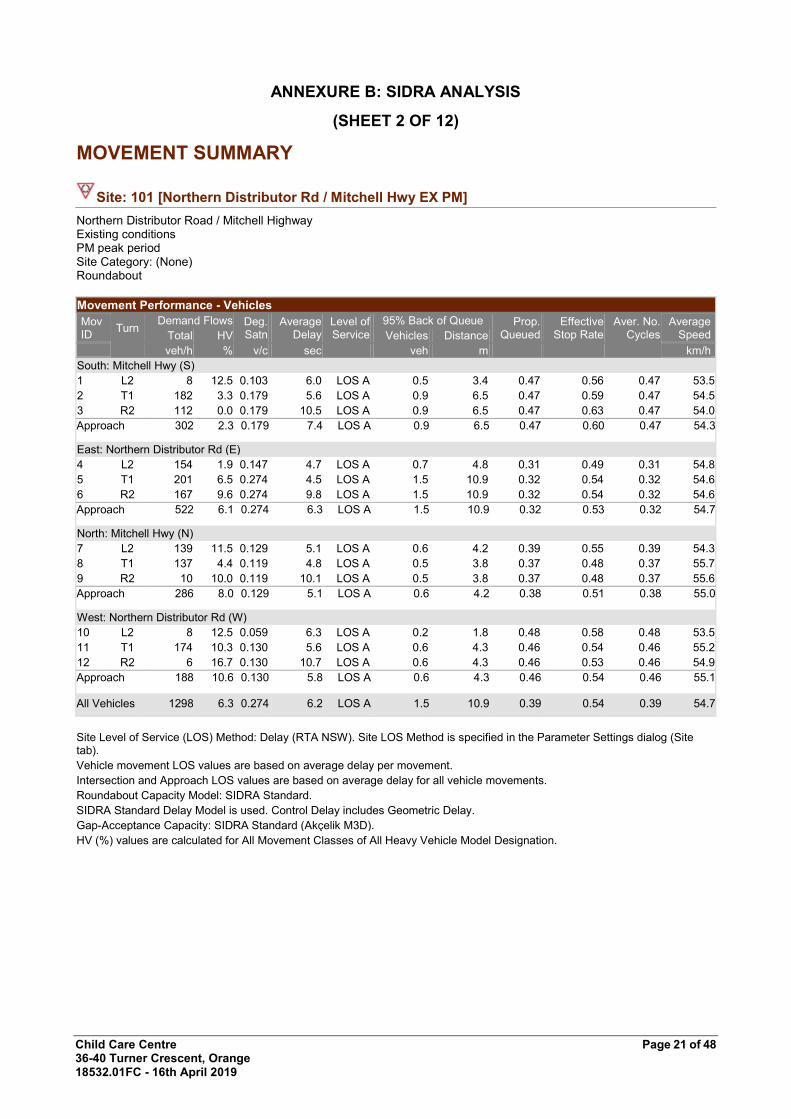
Site: 101 [Northern Distributor Rd / Mitchell Hwy EX PM]
Northern Distributor Road / Mitchell Highway Existing conditions PM peak period Site Category: (None) Roundabout
Movement Performance - Vehicles
Mov ID
Turn Demand Flows Deg.
Satn Average
Delay Level of Service
95% Back of Queue Prop. Queued
Effective Stop Rate
Aver. No. Cycles
Average Speed Total HV Vehicles Distance
veh/h % v/c sec veh m km/h
South: Mitchell Hwy (S)
1 L2 8 12.5 0.103 6.0 LOS A 0.5 3.4 0.47 0.56 0.47 53.5
2 T1 182 3.3 0.179 5.6 LOS A 0.9 6.5 0.47 0.59 0.47 54.5
3 R2 112 0.0 0.179 10.5 LOS A 0.9 6.5 0.47 0.63 0.47 54.0
Approach 302 2.3 0.179 7.4 LOS A 0.9 6.5 0.47 0.60 0.47 54.3
East: Northern Distributor Rd (E)
4 L2 154 1.9 0.147 4.7 LOS A 0.7 4.8 0.31 0.49 0.31 54.8
5 T1 201 6.5 0.274 4.5 LOS A 1.5 10.9 0.32 0.54 0.32 54.6
6 R2 167 9.6 0.274 9.8 LOS A 1.5 10.9 0.32 0.54 0.32 54.6
Approach 522 6.1 0.274 6.3 LOS A 1.5 10.9 0.32 0.53 0.32 54.7
North: Mitchell Hwy (N)
7 L2 139 11.5 0.129 5.1 LOS A 0.6 4.2 0.39 0.55 0.39 54.3
8 T1 137 4.4 0.119 4.8 LOS A 0.5 3.8 0.37 0.48 0.37 55.7
9 R2 10 10.0 0.119 10.1 LOS A 0.5 3.8 0.37 0.48 0.37 55.6
Approach 286 8.0 0.129 5.1 LOS A 0.6 4.2 0.38 0.51 0.38 55.0
West: Northern Distributor Rd (W)
10 L2 8 12.5 0.059 6.3 LOS A 0.2 1.8 0.48 0.58 0.48 53.5
11 T1 174 10.3 0.130 5.6 LOS A 0.6 4.3 0.46 0.54 0.46 55.2
12 R2 6 16.7 0.130 10.7 LOS A 0.6 4.3 0.46 0.53 0.46 54.9
Approach 188 10.6 0.130 5.8 LOS A 0.6 4.3 0.46 0.54 0.46 55.1
All Vehicles 1298 6.3 0.274 6.2 LOS A 1.5 10.9 0.39 0.54 0.39 54.7
Site Level of Service (LOS) Method: Delay (RTA NSW). Site LOS Method is specified in the Parameter Settings dialog (Site tab).
Vehicle movement LOS values are based on average delay per movement.
Intersection and Approach LOS values are based on average delay for all vehicle movements.
Roundabout Capacity Model: SIDRA Standard.
SIDRA Standard Delay Model is used. Control Delay includes Geometric Delay.
Gap-Acceptance Capacity: SIDRA Standard (Akçelik M3D).
HV (%) values are calculated for All Movement Classes of All Heavy Vehicle Model Designation.

Child Care Centre Page 22 of 48 36-40 Turner Crescent, Orange 18532.01FC - 16th April 2019
ANNEXURE B: SIDRA ANALYSIS
(SHEET 3 OF 12)
MOVEMENT SUMMARY
Site: 101 [Mitchell Hwy / Mastronardi Way EX AM]
Mitchell Highway / Mastronardi Way Existing Conditions AM peak period Site Category: (None) Giveway / Yield (Two-Way)
Movement Performance - Vehicles
Mov ID
Turn Demand Flows Deg.
Satn Average
Delay Level of Service
95% Back of Queue Prop. Queued
Effective Stop Rate
Aver. No. Cycles
Average Speed Total HV Vehicles Distance
veh/h % v/c sec veh m km/h
South: Mitchell Hwy (S)
1 L2 10 0.0 0.081 5.5 LOS A 0.0 0.0 0.00 0.04 0.00 58.0
2 T1 144 4.2 0.081 0.0 LOS A 0.0 0.0 0.00 0.04 0.00 59.6
Approach 154 3.9 0.081 0.4 NA 0.0 0.0 0.00 0.04 0.00 59.5
North: Mitchell Hwy (N)
8 T1 339 2.7 0.198 0.1 LOS A 0.2 1.8 0.06 0.05 0.06 59.3
9 R2 32 0.0 0.198 6.0 LOS A 0.2 1.8 0.06 0.05 0.06 57.1
Approach 371 2.4 0.198 0.6 NA 0.2 1.8 0.06 0.05 0.06 59.1
West: Mastronardi Way (W)
10 L2 57 1.8 0.102 6.0 LOS A 0.4 2.6 0.28 0.61 0.28 52.5
12 R2 48 0.0 0.102 7.9 LOS A 0.4 2.6 0.28 0.61 0.28 52.1
Approach 105 1.0 0.102 6.9 LOS A 0.4 2.6 0.28 0.61 0.28 52.3
All Vehicles 630 2.5 0.198 1.6 NA 0.4 2.6 0.08 0.14 0.08 57.9
Site Level of Service (LOS) Method: Delay (RTA NSW). Site LOS Method is specified in the Parameter Settings dialog (Site tab).
Vehicle movement LOS values are based on average delay per movement.
Minor Road Approach LOS values are based on average delay for all vehicle movements.
NA: Intersection LOS and Major Road Approach LOS values are Not Applicable for two-way sign control since the average delay is not a good LOS measure due to zero delays associated with major road movements.
SIDRA Standard Delay Model is used. Control Delay includes Geometric Delay.
Gap-Acceptance Capacity: SIDRA Standard (Akçelik M3D).
HV (%) values are calculated for All Movement Classes of All Heavy Vehicle Model Designation.

Child Care Centre Page 23 of 48 36-40 Turner Crescent, Orange 18532.01FC - 16th April 2019
ANNEXURE B: SIDRA ANALYSIS
(SHEET 4 OF 12)
MOVEMENT SUMMARY
Site: 101 [Mitchell Hwy / Mastronardi Way EX PM]
Mitchell Highway / Mastronardi Way Existing Conditions PM peak period Site Category: (None) Giveway / Yield (Two-Way)
Movement Performance - Vehicles
Mov ID
Turn Demand Flows Deg.
Satn Average
Delay Level of Service
95% Back of Queue Prop. Queued
Effective Stop Rate
Aver. No. Cycles
Average Speed Total HV Vehicles Distance
veh/h % v/c sec veh m km/h
South: Mitchell Hwy (S)
1 L2 41 0.0 0.160 5.6 LOS A 0.0 0.0 0.00 0.08 0.00 57.6
2 T1 263 3.4 0.160 0.0 LOS A 0.0 0.0 0.00 0.08 0.00 59.2
Approach 304 3.0 0.160 0.8 NA 0.0 0.0 0.00 0.08 0.00 59.0
North: Mitchell Hwy (N)
8 T1 194 3.1 0.164 0.6 LOS A 0.6 4.5 0.27 0.19 0.27 57.4
9 R2 81 2.5 0.164 6.7 LOS A 0.6 4.5 0.27 0.19 0.27 55.2
Approach 275 2.9 0.164 2.4 NA 0.6 4.5 0.27 0.19 0.27 56.7
West: Mastronardi Way (W)
10 L2 56 0.0 0.073 6.4 LOS A 0.3 1.9 0.36 0.62 0.36 52.5
12 R2 22 0.0 0.073 8.0 LOS A 0.3 1.9 0.36 0.62 0.36 52.0
Approach 78 0.0 0.073 6.9 LOS A 0.3 1.9 0.36 0.62 0.36 52.4
All Vehicles 657 2.6 0.164 2.2 NA 0.6 4.5 0.16 0.19 0.16 57.2
Site Level of Service (LOS) Method: Delay (RTA NSW). Site LOS Method is specified in the Parameter Settings dialog (Site tab).
Vehicle movement LOS values are based on average delay per movement.
Minor Road Approach LOS values are based on average delay for all vehicle movements.
NA: Intersection LOS and Major Road Approach LOS values are Not Applicable for two-way sign control since the average delay is not a good LOS measure due to zero delays associated with major road movements.
SIDRA Standard Delay Model is used. Control Delay includes Geometric Delay.
Gap-Acceptance Capacity: SIDRA Standard (Akçelik M3D).
HV (%) values are calculated for All Movement Classes of All Heavy Vehicle Model Designation.
Child Care Centre Page 24 of 48 36-40 Turner Crescent, Orange 18532.01FC - 16th April 2019
ANNEXURE B: SIDRA ANALYSIS
(SHEET 5 OF 12)
MOVEMENT SUMMARY
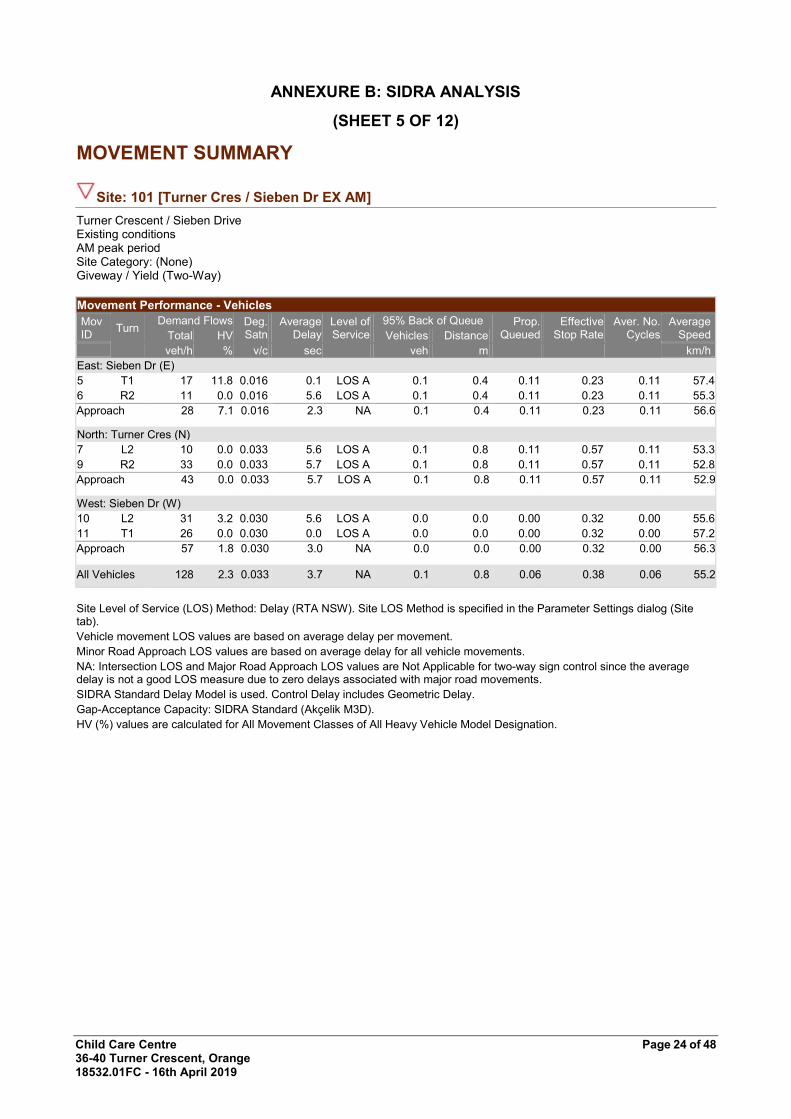
Site: 101 [Turner Cres / Sieben Dr EX AM]
Turner Crescent / Sieben Drive Existing conditions AM peak period Site Category: (None) Giveway / Yield (Two-Way)
Movement Performance - Vehicles
Mov ID
Turn Demand Flows Deg.
Satn Average
Delay Level of Service
95% Back of Queue Prop. Queued
Effective Stop Rate
Aver. No. Cycles
Average Speed Total HV Vehicles Distance
veh/h % v/c sec veh m km/h
East: Sieben Dr (E)
5 T1 17 11.8 0.016 0.1 LOS A 0.1 0.4 0.11 0.23 0.11 57.4
6 R2 11 0.0 0.016 5.6 LOS A 0.1 0.4 0.11 0.23 0.11 55.3
Approach 28 7.1 0.016 2.3 NA 0.1 0.4 0.11 0.23 0.11 56.6
North: Turner Cres (N)
7 L2 10 0.0 0.033 5.6 LOS A 0.1 0.8 0.11 0.57 0.11 53.3
9 R2 33 0.0 0.033 5.7 LOS A 0.1 0.8 0.11 0.57 0.11 52.8
Approach 43 0.0 0.033 5.7 LOS A 0.1 0.8 0.11 0.57 0.11 52.9
West: Sieben Dr (W)
10 L2 31 3.2 0.030 5.6 LOS A 0.0 0.0 0.00 0.32 0.00 55.6
11 T1 26 0.0 0.030 0.0 LOS A 0.0 0.0 0.00 0.32 0.00 57.2
Approach 57 1.8 0.030 3.0 NA 0.0 0.0 0.00 0.32 0.00 56.3
All Vehicles 128 2.3 0.033 3.7 NA 0.1 0.8 0.06 0.38 0.06 55.2
Site Level of Service (LOS) Method: Delay (RTA NSW). Site LOS Method is specified in the Parameter Settings dialog (Site tab).
Vehicle movement LOS values are based on average delay per movement.
Minor Road Approach LOS values are based on average delay for all vehicle movements.
NA: Intersection LOS and Major Road Approach LOS values are Not Applicable for two-way sign control since the average delay is not a good LOS measure due to zero delays associated with major road movements.
SIDRA Standard Delay Model is used. Control Delay includes Geometric Delay.
Gap-Acceptance Capacity: SIDRA Standard (Akçelik M3D).
HV (%) values are calculated for All Movement Classes of All Heavy Vehicle Model Designation.
Child Care Centre Page 25 of 48 36-40 Turner Crescent, Orange 18532.01FC - 16th April 2019
ANNEXURE B: SIDRA ANALYSIS
(SHEET 6 OF 12)
MOVEMENT SUMMARY
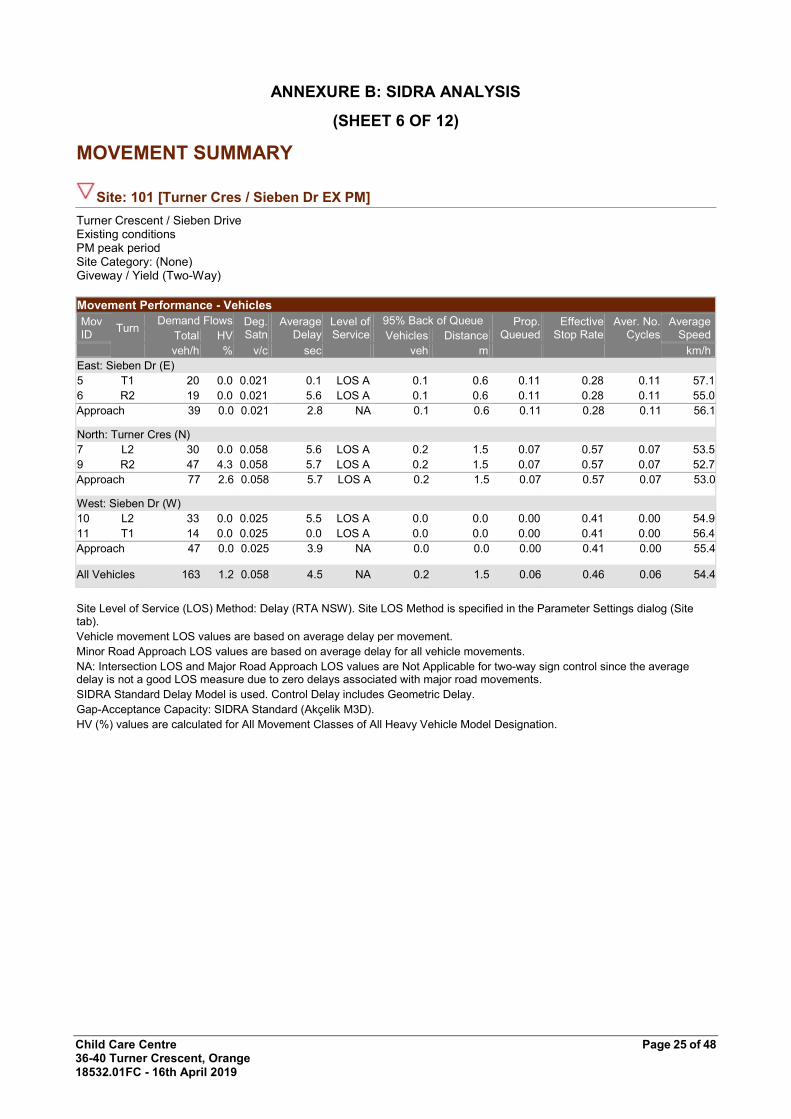
Site: 101 [Turner Cres / Sieben Dr EX PM]
Turner Crescent / Sieben Drive Existing conditions PM peak period Site Category: (None) Giveway / Yield (Two-Way)
Movement Performance - Vehicles
Mov ID
Turn Demand Flows Deg.
Satn Average
Delay Level of Service
95% Back of Queue Prop. Queued
Effective Stop Rate
Aver. No. Cycles
Average Speed Total HV Vehicles Distance
veh/h % v/c sec veh m km/h
East: Sieben Dr (E)
5 T1 20 0.0 0.021 0.1 LOS A 0.1 0.6 0.11 0.28 0.11 57.1
6 R2 19 0.0 0.021 5.6 LOS A 0.1 0.6 0.11 0.28 0.11 55.0
Approach 39 0.0 0.021 2.8 NA 0.1 0.6 0.11 0.28 0.11 56.1
North: Turner Cres (N)
7 L2 30 0.0 0.058 5.6 LOS A 0.2 1.5 0.07 0.57 0.07 53.5
9 R2 47 4.3 0.058 5.7 LOS A 0.2 1.5 0.07 0.57 0.07 52.7
Approach 77 2.6 0.058 5.7 LOS A 0.2 1.5 0.07 0.57 0.07 53.0
West: Sieben Dr (W)
10 L2 33 0.0 0.025 5.5 LOS A 0.0 0.0 0.00 0.41 0.00 54.9
11 T1 14 0.0 0.025 0.0 LOS A 0.0 0.0 0.00 0.41 0.00 56.4
Approach 47 0.0 0.025 3.9 NA 0.0 0.0 0.00 0.41 0.00 55.4
All Vehicles 163 1.2 0.058 4.5 NA 0.2 1.5 0.06 0.46 0.06 54.4
Site Level of Service (LOS) Method: Delay (RTA NSW). Site LOS Method is specified in the Parameter Settings dialog (Site tab).
Vehicle movement LOS values are based on average delay per movement.
Minor Road Approach LOS values are based on average delay for all vehicle movements.
NA: Intersection LOS and Major Road Approach LOS values are Not Applicable for two-way sign control since the average delay is not a good LOS measure due to zero delays associated with major road movements.
SIDRA Standard Delay Model is used. Control Delay includes Geometric Delay.
Gap-Acceptance Capacity: SIDRA Standard (Akçelik M3D).
HV (%) values are calculated for All Movement Classes of All Heavy Vehicle Model Designation.

Child Care Centre Page 26 of 48 36-40 Turner Crescent, Orange 18532.01FC - 16th April 2019
ANNEXURE B: SIDRA ANALYSIS
(SHEET 7 OF 12)
MOVEMENT SUMMARY
Site: 101 [Northern Distributor Rd / Mitchell Hwy FU AM Two Way driveway]
Northern Distributor Road / Mitchell Highway Future conditions with Two Way driveway AM peak period Site Category: (None) Roundabout
Movement Performance - Vehicles
Mov ID
Turn Demand Flows Deg.
Satn Average
Delay Level of Service
95% Back of Queue Prop. Queued
Effective Stop Rate
Aver. No. Cycles
Average Speed Total HV Vehicles Distance
veh/h % v/c sec veh m km/h
South: Mitchell Hwy (S)
1 L2 8 0.0 0.071 5.4 LOS A 0.3 2.3 0.43 0.52 0.43 54.0
2 T1 110 4.5 0.124 5.3 LOS A 0.6 4.4 0.43 0.57 0.43 54.6
3 R2 97 1.0 0.124 10.2 LOS A 0.6 4.4 0.43 0.62 0.43 53.8
Approach 215 2.8 0.124 7.5 LOS A 0.6 4.4 0.43 0.59 0.43 54.2
East: Northern Distributor Rd (E)
4 L2 115 1.7 0.124 5.4 LOS A 0.6 4.0 0.44 0.57 0.44 54.3
5 T1 149 14.1 0.237 5.3 LOS A 1.2 9.6 0.46 0.60 0.46 53.9
6 R2 123 8.9 0.237 10.4 LOS A 1.2 9.6 0.46 0.60 0.46 54.0
Approach 387 8.8 0.237 7.0 LOS A 1.2 9.6 0.45 0.59 0.45 54.1
North: Mitchell Hwy (N)
7 L2 120 1.7 0.124 5.1 LOS A 0.5 3.7 0.37 0.54 0.37 54.6
8 T1 269 3.0 0.250 4.8 LOS A 1.2 9.2 0.38 0.50 0.38 55.7
9 R2 36 69.4 0.250 11.3 LOS A 1.2 9.2 0.38 0.50 0.38 53.4
Approach 425 8.2 0.250 5.4 LOS A 1.2 9.2 0.38 0.51 0.38 55.2
West: Northern Distributor Rd (W)
10 L2 31 0.0 0.052 5.3 LOS A 0.2 1.5 0.41 0.54 0.41 54.4
11 T1 150 9.3 0.115 5.0 LOS A 0.5 3.7 0.39 0.48 0.39 55.7
12 R2 1 0.0 0.115 10.0 LOS A 0.5 3.7 0.39 0.48 0.39 56.0
Approach 182 7.7 0.115 5.1 LOS A 0.5 3.7 0.39 0.49 0.39 55.5
All Vehicles 1209 7.4 0.250 6.3 LOS A 1.2 9.6 0.41 0.55 0.41 54.7
Site Level of Service (LOS) Method: Delay (RTA NSW). Site LOS Method is specified in the Parameter Settings dialog (Site tab).
Vehicle movement LOS values are based on average delay per movement.
Intersection and Approach LOS values are based on average delay for all vehicle movements.
Roundabout Capacity Model: SIDRA Standard.
SIDRA Standard Delay Model is used. Control Delay includes Geometric Delay.
Gap-Acceptance Capacity: SIDRA Standard (Akçelik M3D).
HV (%) values are calculated for All Movement Classes of All Heavy Vehicle Model Designation.

Child Care Centre Page 27 of 48 36-40 Turner Crescent, Orange 18532.01FC - 16th April 2019
ANNEXURE B: SIDRA ANALYSIS
(SHEET 8 OF 12)
MOVEMENT SUMMARY
Site: 101 [Northern Distributor Rd / Mitchell Hwy FU PM Two Way driveway]
Northern Distributor Road / Mitchell Highway Future conditions with Two Way driveway PM peak period Site Category: (None) Roundabout
Movement Performance - Vehicles
Mov ID
Turn Demand Flows Deg.
Satn Average
Delay Level of Service
95% Back of Queue Prop. Queued
Effective Stop Rate
Aver. No. Cycles
Average Speed Total HV Vehicles Distance
veh/h % v/c sec veh m km/h
South: Mitchell Hwy (S)
1 L2 8 12.5 0.108 6.0 LOS A 0.5 3.6 0.47 0.56 0.47 53.4
2 T1 185 3.2 0.187 5.6 LOS A 1.0 6.8 0.47 0.60 0.47 54.5
3 R2 122 0.0 0.187 10.5 LOS A 1.0 6.8 0.47 0.63 0.47 53.9
Approach 315 2.2 0.187 7.5 LOS A 1.0 6.8 0.47 0.61 0.47 54.3
East: Northern Distributor Rd (E)
4 L2 164 1.8 0.155 4.7 LOS A 0.7 5.0 0.32 0.50 0.32 54.8
5 T1 201 6.5 0.275 4.6 LOS A 1.5 11.0 0.33 0.54 0.33 54.6
6 R2 167 9.6 0.275 9.8 LOS A 1.5 11.0 0.33 0.54 0.33 54.5
Approach 532 6.0 0.275 6.2 LOS A 1.5 11.0 0.32 0.53 0.32 54.6
North: Mitchell Hwy (N)
7 L2 139 11.5 0.131 5.1 LOS A 0.6 4.3 0.39 0.55 0.39 54.2
8 T1 141 4.3 0.123 4.8 LOS A 0.5 3.9 0.38 0.49 0.38 55.7
9 R2 10 10.0 0.123 10.1 LOS A 0.5 3.9 0.38 0.49 0.38 55.5
Approach 290 7.9 0.131 5.2 LOS A 0.6 4.3 0.38 0.52 0.38 55.0
West: Northern Distributor Rd (W)
10 L2 8 12.5 0.060 6.3 LOS A 0.2 1.8 0.48 0.59 0.48 53.4
11 T1 174 10.3 0.132 5.6 LOS A 0.6 4.4 0.47 0.54 0.47 55.2
12 R2 6 16.7 0.132 10.8 LOS A 0.6 4.4 0.46 0.53 0.46 54.9
Approach 188 10.6 0.132 5.8 LOS A 0.6 4.4 0.47 0.54 0.47 55.1
All Vehicles 1325 6.2 0.275 6.2 LOS A 1.5 11.0 0.39 0.55 0.39 54.7
Site Level of Service (LOS) Method: Delay (RTA NSW). Site LOS Method is specified in the Parameter Settings dialog (Site tab).
Vehicle movement LOS values are based on average delay per movement.
Intersection and Approach LOS values are based on average delay for all vehicle movements.
Roundabout Capacity Model: SIDRA Standard.
SIDRA Standard Delay Model is used. Control Delay includes Geometric Delay.
Gap-Acceptance Capacity: SIDRA Standard (Akçelik M3D).
HV (%) values are calculated for All Movement Classes of All Heavy Vehicle Model Designation.

Child Care Centre Page 28 of 48 36-40 Turner Crescent, Orange 18532.01FC - 16th April 2019
ANNEXURE B: SIDRA ANALYSIS
(SHEET 9 OF 12)
MOVEMENT SUMMARY
Site: 101 [Mitchell Hwy / Mastronardi Way FU AM Two Way driveway]
Mitchell Highway / Mastronardi Way Future Conditions with Two Way driveway AM peak period Site Category: (None) Giveway / Yield (Two-Way)
Movement Performance - Vehicles
Mov ID
Turn Demand Flows Deg.
Satn Average
Delay Level of Service
95% Back of Queue Prop. Queued
Effective Stop Rate
Aver. No. Cycles
Average Speed Total HV Vehicles Distance
veh/h % v/c sec veh m km/h
South: Mitchell Hwy (S)
1 L2 25 0.0 0.089 5.5 LOS A 0.0 0.0 0.00 0.09 0.00 57.6
2 T1 144 4.2 0.089 0.0 LOS A 0.0 0.0 0.00 0.09 0.00 59.2
Approach 169 3.6 0.089 0.8 NA 0.0 0.0 0.00 0.09 0.00 58.9
North: Mitchell Hwy (N)
8 T1 339 2.7 0.209 0.1 LOS A 0.4 2.6 0.09 0.08 0.09 58.9
9 R2 48 0.0 0.209 6.1 LOS A 0.4 2.6 0.09 0.08 0.09 56.8
Approach 387 2.3 0.209 0.9 NA 0.4 2.6 0.09 0.08 0.09 58.7
West: Mastronardi Way (W)
10 L2 72 1.4 0.143 6.0 LOS A 0.5 3.7 0.30 0.63 0.30 52.4
12 R2 70 0.0 0.143 8.2 LOS A 0.5 3.7 0.30 0.63 0.30 51.9
Approach 142 0.7 0.143 7.1 LOS A 0.5 3.7 0.30 0.63 0.30 52.1
All Vehicles 698 2.3 0.209 2.1 NA 0.5 3.7 0.11 0.19 0.11 57.3
Site Level of Service (LOS) Method: Delay (RTA NSW). Site LOS Method is specified in the Parameter Settings dialog (Site tab).
Vehicle movement LOS values are based on average delay per movement.
Minor Road Approach LOS values are based on average delay for all vehicle movements.
NA: Intersection LOS and Major Road Approach LOS values are Not Applicable for two-way sign control since the average delay is not a good LOS measure due to zero delays associated with major road movements.
SIDRA Standard Delay Model is used. Control Delay includes Geometric Delay.
Gap-Acceptance Capacity: SIDRA Standard (Akçelik M3D).
HV (%) values are calculated for All Movement Classes of All Heavy Vehicle Model Designation.

Child Care Centre Page 29 of 48 36-40 Turner Crescent, Orange 18532.01FC - 16th April 2019
ANNEXURE B: SIDRA ANALYSIS
(SHEET 10 OF 12)
MOVEMENT SUMMARY
Site: 101 [Mitchell Hwy / Mastronardi Way FU PM Two Way driveway]
Mitchell Highway / Mastronardi Way Future Conditions with Two Way driveway PM peak period Site Category: (None) Giveway / Yield (Two-Way)
Movement Performance - Vehicles
Mov ID
Turn Demand Flows Deg.
Satn Average
Delay Level of Service
95% Back of Queue Prop. Queued
Effective Stop Rate
Aver. No. Cycles
Average Speed Total HV Vehicles Distance
veh/h % v/c sec veh m km/h
South: Mitchell Hwy (S)
1 L2 61 0.0 0.171 5.6 LOS A 0.0 0.0 0.00 0.11 0.00 57.3
2 T1 263 3.4 0.171 0.0 LOS A 0.0 0.0 0.00 0.11 0.00 58.9
Approach 324 2.8 0.171 1.1 NA 0.0 0.0 0.00 0.11 0.00 58.6
North: Mitchell Hwy (N)
8 T1 194 3.1 0.175 0.7 LOS A 0.7 5.2 0.31 0.21 0.31 57.1
9 R2 94 2.1 0.175 6.8 LOS A 0.7 5.2 0.31 0.21 0.31 55.0
Approach 288 2.8 0.175 2.7 NA 0.7 5.2 0.31 0.21 0.31 56.4
West: Mastronardi Way (W)
10 L2 69 0.0 0.101 6.4 LOS A 0.4 2.6 0.37 0.64 0.37 52.4
12 R2 35 0.0 0.101 8.3 LOS A 0.4 2.6 0.37 0.64 0.37 51.9
Approach 104 0.0 0.101 7.1 LOS A 0.4 2.6 0.37 0.64 0.37 52.3
All Vehicles 716 2.4 0.175 2.6 NA 0.7 5.2 0.18 0.23 0.18 56.7
Site Level of Service (LOS) Method: Delay (RTA NSW). Site LOS Method is specified in the Parameter Settings dialog (Site tab).
Vehicle movement LOS values are based on average delay per movement.
Minor Road Approach LOS values are based on average delay for all vehicle movements.
NA: Intersection LOS and Major Road Approach LOS values are Not Applicable for two-way sign control since the average delay is not a good LOS measure due to zero delays associated with major road movements.
SIDRA Standard Delay Model is used. Control Delay includes Geometric Delay.
Gap-Acceptance Capacity: SIDRA Standard (Akçelik M3D).
HV (%) values are calculated for All Movement Classes of All Heavy Vehicle Model Designation.

Child Care Centre Page 30 of 48 36-40 Turner Crescent, Orange 18532.01FC - 16th April 2019
ANNEXURE B: SIDRA ANALYSIS
(SHEET 11 OF 12)
MOVEMENT SUMMARY
Site: 101 [Turner Cres / Sieben Dr FU AM]
Turner Crescent / Sieben Drive Future conditions AM peak period Site Category: (None) Giveway / Yield (Two-Way)
Movement Performance - Vehicles
Mov ID
Turn Demand Flows Deg.
Satn Average
Delay Level of Service
95% Back of Queue Prop. Queued
Effective Stop Rate
Aver. No. Cycles
Average Speed Total HV Vehicles Distance
veh/h % v/c sec veh m km/h
East: Sieben Dr (E)
5 T1 17 11.8 0.018 0.1 LOS A 0.1 0.5 0.12 0.27 0.12 57.0
6 R2 15 0.0 0.018 5.6 LOS A 0.1 0.5 0.12 0.27 0.12 54.9
Approach 32 6.3 0.018 2.7 NA 0.1 0.5 0.12 0.27 0.12 56.0
North: Turner Cres (N)
7 L2 10 0.0 0.034 5.6 LOS A 0.1 0.8 0.11 0.57 0.11 53.3
9 R2 33 0.0 0.034 5.7 LOS A 0.1 0.8 0.11 0.57 0.11 52.8
Approach 43 0.0 0.034 5.7 LOS A 0.1 0.8 0.11 0.57 0.11 52.9
West: Sieben Dr (W)
10 L2 34 2.9 0.032 5.6 LOS A 0.0 0.0 0.00 0.33 0.00 55.5
11 T1 26 0.0 0.032 0.0 LOS A 0.0 0.0 0.00 0.33 0.00 57.1
Approach 60 1.7 0.032 3.2 NA 0.0 0.0 0.00 0.33 0.00 56.2
All Vehicles 135 2.2 0.034 3.8 NA 0.1 0.8 0.06 0.39 0.06 55.1
Site Level of Service (LOS) Method: Delay (RTA NSW). Site LOS Method is specified in the Parameter Settings dialog (Site tab).
Vehicle movement LOS values are based on average delay per movement.
Minor Road Approach LOS values are based on average delay for all vehicle movements.
NA: Intersection LOS and Major Road Approach LOS values are Not Applicable for two-way sign control since the average delay is not a good LOS measure due to zero delays associated with major road movements.
SIDRA Standard Delay Model is used. Control Delay includes Geometric Delay.
Gap-Acceptance Capacity: SIDRA Standard (Akçelik M3D).
HV (%) values are calculated for All Movement Classes of All Heavy Vehicle Model Designation.

Child Care Centre Page 31 of 48 36-40 Turner Crescent, Orange 18532.01FC - 16th April 2019
ANNEXURE B: SIDRA ANALYSIS
(SHEET 12 OF 12)
MOVEMENT SUMMARY
Site: 101 [Turner Cres / Sieben Dr FU PM]
Turner Crescent / Sieben Drive Future conditions PM peak period Site Category: (None) Giveway / Yield (Two-Way)
Movement Performance - Vehicles
Mov ID
Turn Demand Flows Deg.
Satn Average
Delay Level of Service
95% Back of Queue Prop. Queued
Effective Stop Rate
Aver. No. Cycles
Average Speed Total HV Vehicles Distance
veh/h % v/c sec veh m km/h
East: Sieben Dr (E)
5 T1 20 0.0 0.021 0.1 LOS A 0.1 0.6 0.11 0.28 0.11 57.1
6 R2 19 0.0 0.021 5.6 LOS A 0.1 0.6 0.11 0.28 0.11 55.0
Approach 39 0.0 0.021 2.8 NA 0.1 0.6 0.11 0.28 0.11 56.1
North: Turner Cres (N)
7 L2 33 0.0 0.063 5.6 LOS A 0.2 1.6 0.07 0.57 0.07 53.5
9 R2 51 3.9 0.063 5.7 LOS A 0.2 1.6 0.07 0.57 0.07 52.7
Approach 84 2.4 0.063 5.7 LOS A 0.2 1.6 0.07 0.57 0.07 53.0
West: Sieben Dr (W)
10 L2 33 0.0 0.025 5.5 LOS A 0.0 0.0 0.00 0.41 0.00 54.9
11 T1 14 0.0 0.025 0.0 LOS A 0.0 0.0 0.00 0.41 0.00 56.4
Approach 47 0.0 0.025 3.9 NA 0.0 0.0 0.00 0.41 0.00 55.4
All Vehicles 170 1.2 0.063 4.5 NA 0.2 1.6 0.06 0.46 0.06 54.3
Site Level of Service (LOS) Method: Delay (RTA NSW). Site LOS Method is specified in the Parameter Settings dialog (Site tab).
Vehicle movement LOS values are based on average delay per movement.
Minor Road Approach LOS values are based on average delay for all vehicle movements.
NA: Intersection LOS and Major Road Approach LOS values are Not Applicable for two-way sign control since the average delay is not a good LOS measure due to zero delays associated with major road movements.
SIDRA Standard Delay Model is used. Control Delay includes Geometric Delay.
Gap-Acceptance Capacity: SIDRA Standard (Akçelik M3D).
HV (%) values are calculated for All Movement Classes of All Heavy Vehicle Model Designation.
Child Care Centre Page 32 of 48 36-40 Turner Crescent, Orange 18532.01FC - 16th April 2019
ANNEXURE C: QUEUING ANALYSIS
(SHEET 1 OF 4)

Child Care Centre Page 33 of 48 36-40 Turner Crescent, Orange 18532.01FC - 16th April 2019
ANNEXURE C: QUEUING ANALYSIS
(SHEET 2 OF 4)
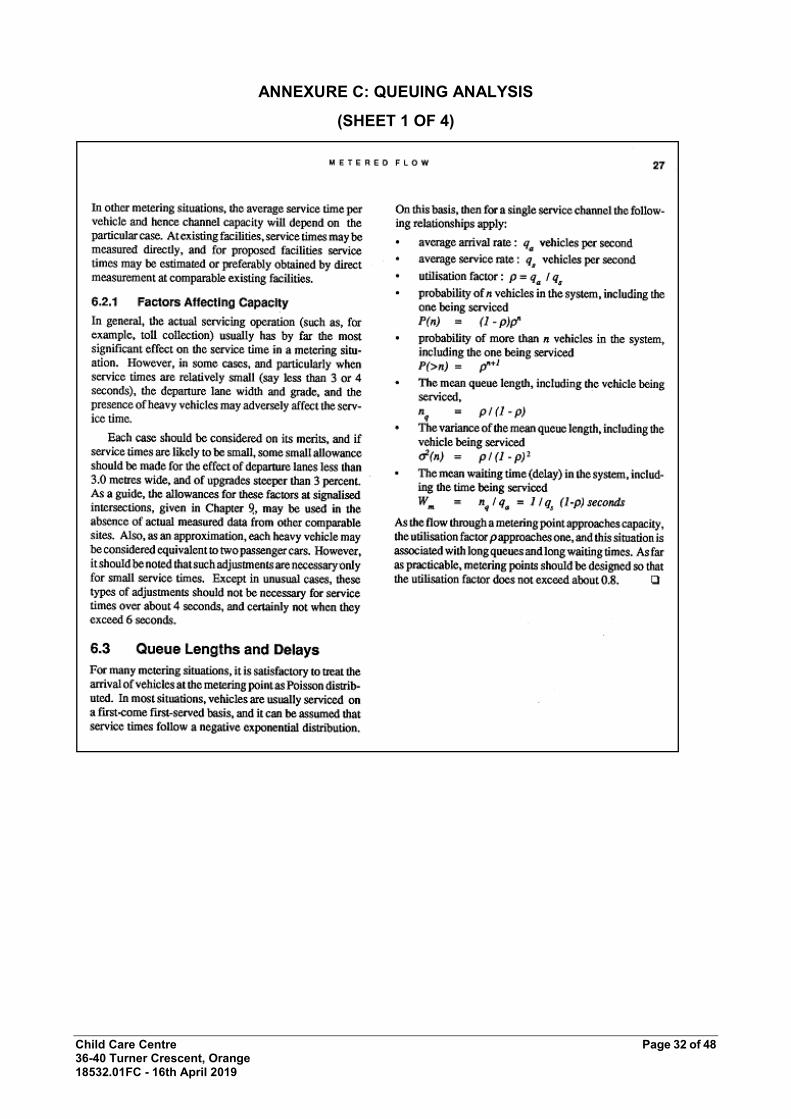
Based on AUSTROADS the detailed queueing analysis for the proposed short term parking
spaces for parent use associated with the proposed child care centre is outlined below:
- Adopted duration of stay of 6.8 minutes. (as all parking provided fully on-site
compared to the average of 7.8 minutes for long day care centres that reply (in part)
on available on-street parking near the centre)
- Number of service bays = 10 (7 only required for a 98th percentile queue)
- Inbound traffic flow is worst case 94 * 0.8 trips per child / 2 = 37.6 inbound vehicles
Based on Austroads Guide to Traffic Management: Part 3: Traffic Studies and Analysis,
Section 5.1.2, the resulting queueing results are shown below.
TABLE 6: QUEUING RESULTS
Number of units in system
Number of vehicles in
queue
Probability of this many
units in system (%)
Probability of this many units in
system or less (%)
Probability of this many units in
system or more (%)
0 0 39.12 39.12 100.00
1 0 23.82 62.94 60.88
2 0 14.50 77.44 37.06
3 0 8.83 86.27 22.56
4 0 5.37 91.64 13.73
5 0 3.27 94.91 8.36
6 0 1.99 96.90 5.09
7 0 1.21 98.11 3.10
Based upon the queue theory, the provision of 10 parent parking spaces exceeds the 98th
percentile queue demand. The satisfaction of the 98th percentile is in accordance with
AS2890.1:2004 requirements.

Child Care Centre Page 34 of 48 36-40 Turner Crescent, Orange 18532.01FC - 16th April 2019
ANNEXURE C: QUEUING ANALYSIS
(SHEET 3 OF 4)
Based on AUSTROADS the detailed queueing analysis for the proposed short term parking
spaces for parent use associated with the proposed child care centre is outlined below:
- Adopted duration of stay of 10 minutes.
- Number of service bays = 10 (10 required under a 98th percentile queue)
- Inbound traffic flow is worst case 94 * 0.8 trips per child / 2 = 37.6 inbound vehicles
Based on Austroads Guide to Traffic Management: Part 3: Traffic Studies and Analysis,
Section 5.1.2, the resulting queueing results are shown below.
TABLE 7: QUEUING RESULTS
Number of units in system
Number of vehicles in
queue
Probability of this many
units in system (%)
Probability of this many units in
system or less (%)
Probability of this many units in
system or more (%)
0 0 37.33 37.33 100.00
1 0 23.40 60.73 62.67
2 0 14.66 75.39 39.27
3 0 9.19 84.58 24.61
4 0 5.76 90.34 15.42
5 0 3.61 93.94 9.66
6 0 2.26 96.20 6.06
7 0 1.42 97.62 3.80
8 0 0.89 98.51 2.38
Based upon the queue theory, the provision of 10 parent parking spaces satisfies the 98th
percentile queue demand, for a worst-case scenario of an average 10-minute duration of
stay. The satisfaction of the 98th percentile is in accordance with AS2890.1:2004
requirements.

Child Care Centre Page 35 of 48 36-40 Turner Crescent, Orange 18532.01FC - 16th April 2019
ANNEXURE C: QUEUING ANALYSIS
(SHEET 4 OF 4)
98th percentile parking demand during peak periods
The parking demand for 10 parent parking spaces is based on an average 10-minute stay
length (queuing analysis) and the staff parking demand is based on a rate of 1 space per 2
staff.
It should be noted that staff typically arrive and depart progressively between 9:00am and
4:00pm resulting in an offset staff peak parking period.
Child Care Centre Page 36 of 48 36-40 Turner Crescent, Orange 18532.01FC - 16th April 2019
ANNEXURE D: SWEPT PATHS AND COMPLIANCE
(SHEET 1 OF 7)
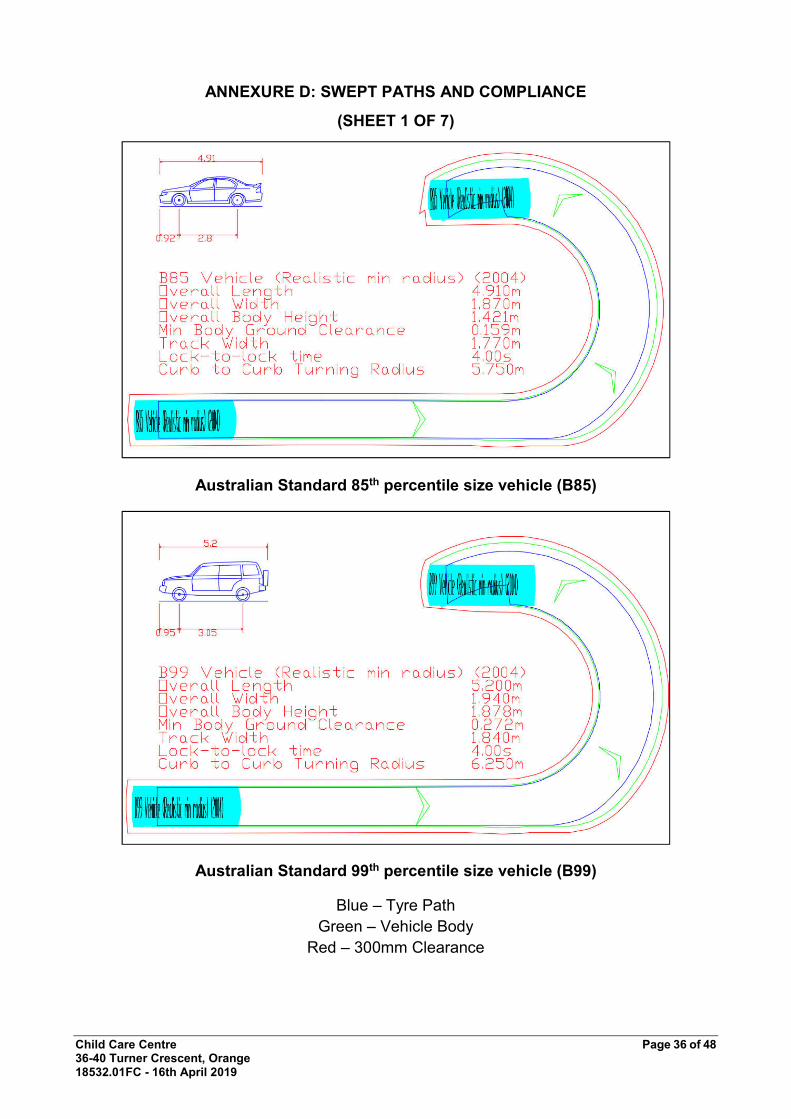
Australian Standard 85th percentile size vehicle (B85)
Australian Standard 99th percentile size vehicle (B99)
Blue – Tyre Path
Green – Vehicle Body
Red – 300mm Clearance

Child Care Centre Page 37 of 48 36-40 Turner Crescent, Orange 18532.01FC - 16th April 2019
ANNEXURE D: SWEPT PATHS AND COMPLIANCE
(SHEET 2 OF 7)
AUSTRALIAN STANDARD SMALL RIGID VEHICLE (SRV)
Blue – Tyre Path
Green – Vehicle Body
Red – 500mm Clearance

Child Care Centre Page 38 of 48 36-40 Turner Crescent, Orange 18532.01FC - 16th April 2019
ANNEXURE D: SWEPT PATHS AND COMPLIANCE
(SHEET 3 OF 7)
B99 two-way passing and driveway entry and exit
Tested at 5km/h
Successful
Blue = Tyre Paths
Green = Vehicle body
Red = 300mm clearance

Child Care Centre Page 39 of 48 36-40 Turner Crescent, Orange 18532.01FC - 16th April 2019
ANNEXURE D: SWEPT PATHS AND COMPLIANCE
(SHEET 4 OF 7)
B85 aisle end space-entry/exit
1 manoeuvre in, 2 out - Successful – subject to confirmation of no obstruction greater than
150mm in height within landscaped area, otherwise an additional 300mm is required
Child Care Centre Page 40 of 48 36-40 Turner Crescent, Orange 18532.01FC - 16th April 2019
ANNEXURE D: SWEPT PATHS AND COMPLIANCE
(SHEET 5 OF 7)
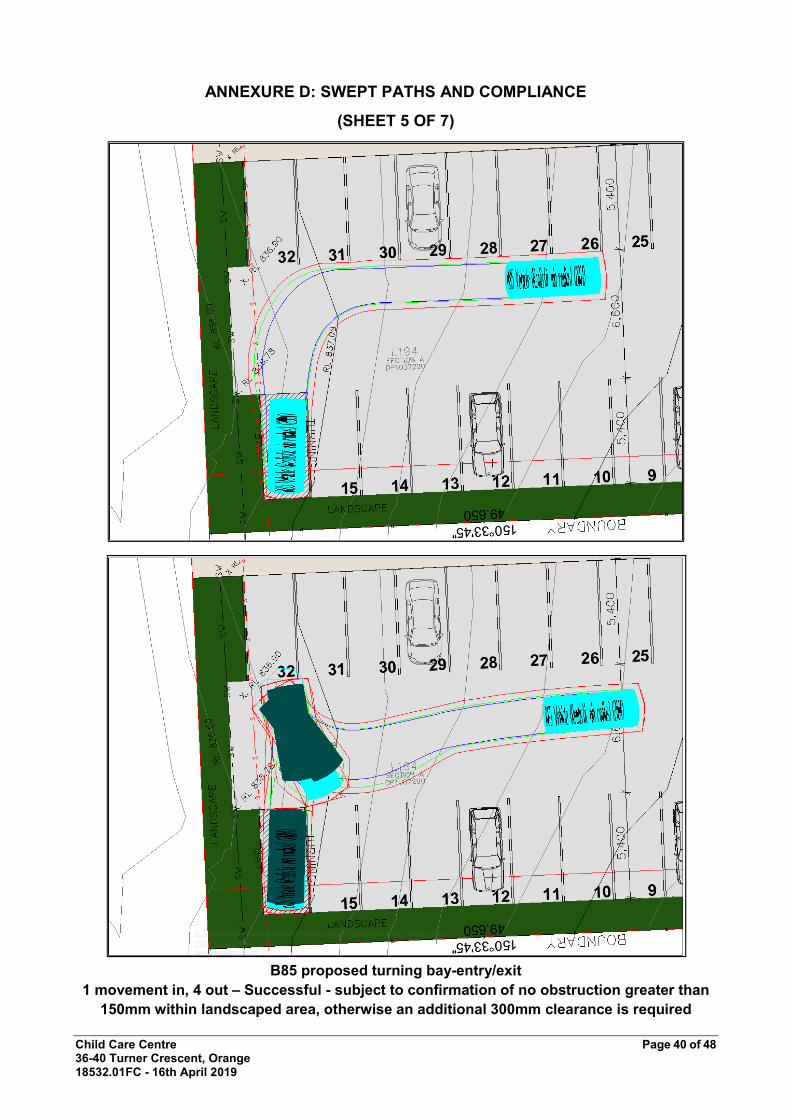
B85 proposed turning bay-entry/exit
1 movement in, 4 out – Successful - subject to confirmation of no obstruction greater than
150mm within landscaped area, otherwise an additional 300mm clearance is required

Child Care Centre Page 41 of 48 36-40 Turner Crescent, Orange 18532.01FC - 16th April 2019
ANNEXURE D: SWEPT PATHS AND COMPLIANCE
(SHEET 6 OF 7)
B85 entry/exit of driveway - 159 Mitchell Highway
Tested @ 5km/h
Successful

Child Care Centre Page 42 of 48 36-40 Turner Crescent, Orange 18532.01FC - 16th April 2019
ANNEXURE D: SWEPT PATHS AND COMPLIANCE
(SHEET 7 OF 8)
SRV Entry and Exit of Driveway
Tested at 5km/h
Successful – subject to access occurring outside of visitor peak periods where
visitor parking spaces are clear

Child Care Centre Page 43 of 48 36-40 Turner Crescent, Orange 18532.01FC - 16th April 2019
ANNEXURE D: SWEPT PATHS AND COMPLIANCE
(SHEET 8 OF 8)
Proposed Parking Allocation - 10 parent spaces allocated, with the remaining
spaces to be shared spaces

Child Care Centre Page 44 of 48 36-40 Turner Crescent, Orange 18532.01FC - 16th April 2019
ANNEXURE E: EXTERNAL TRAFFIC MANAGEMENT MEASURES
(SHEET 1 OF 5)

Child Care Centre Page 45 of 48 36-40 Turner Crescent, Orange 18532.01FC - 16th April 2019
ANNEXURE E: EXTERNAL TRAFFIC MANAGEMENT MEASURES
(SHEET 2 OF 5)

Child Care Centre Page 46 of 48 36-40 Turner Crescent, Orange 18532.01FC - 16th April 2019
ANNEXURE E: EXTERNAL TRAFFIC MANAGEMENT MEASURES
(SHEET 3 OF 5)
Child Care Centre Page 47 of 48 36-40 Turner Crescent, Orange 18532.01FC - 16th April 2019
ANNEXURE E: EXTERNAL TRAFFIC MANAGEMENT MEASURES
(SHEET 4 OF 5)

Child Care Centre Page 48 of 48 36-40 Turner Crescent, Orange 18532.01FC - 16th April 2019
ANNEXURE E: EXTERNAL TRAFFIC MANAGEMENT MEASURES
(SHEET 5 OF 5)