Embed Size (px)
Citation preview
Preliminary: Do not cite, do not distribute.
Trading Places: Impact of Foreign Ownership Changes on Canadian Firms1
Michael R. King a, Eric Santor b* a Economist, Bank for International Settlements, Basel, Switzerland
b Research Adviser, International Department, Bank of Canada, Ottawa, Canada This version: October 15, 2008
This paper examines changes in ownership from widely-held to a controlling shareholder or visa versa to measure the impact on performance and capital structure. We also consider whether the purchase of a control stake by a foreign owner has a different impact from a domestic owner. We estimate the impact of ownership changes using a panel of Canadian firms from 1998 to 2005, using propensity score matching to construct an appropriate counter-factual control group. In the short run, the acquisition of a control stake in a widely-held firm, whether by a Canadian or foreign owner, generates a positive abnormal return around the event while the divestiture of a control stake generates minimal stock market reaction. In the longer term, the acquisition of a control stake by a foreigner no impact on performance or leverage. The purchase of a control stake by a Canadian owner is associated with lower ROA and higher leverage. Finally, the divestiture of a control stake is associated with an a decrease in leverage, and higher ROA.
JEL classification: G12; G15 Keywords: ownership structure; foreign takeovers; firm performance; capital structure; Canada * Corresponding author. Tel.: +1 613 782 7017; fax: +1 613 782 7658. E-mail addresses: [email protected].
1 We would also like to thank seminar participants at the Northern Finance Association, Canadian Economics Association and Queen’s Business School for helpful comments. Any errors and omissions are our own.
2
1. Introduction
The integration of global capital markets, combined with a reduction in regulatory barriers to
foreign investment, has led to a global boom in international mergers and acquisitions (M&A).
Despite the long-run benefits of capital market integration and financial liberalization, some
policymakers remain concerned when foreign investors acquire domestic firms. Inside Canada,
foreign takeovers of Canadian companies such as Hudson’s Bay or Inco have raised concerns
about hollowing out, with critics suggesting that these acquisitions will have negative
implications for the Canadian economy. Outside Canada, similar concerns have been raised in
light of the global investments of sovereign wealth funds and state owned enterprises in strategic
industries such as natural resources or infrastructure. In contrast to the public debate, the
academic literature generally finds that foreign-owned firms have better performance than
domestic-owned firms (Petkova 2007). Critics argue that this finding may be spurious as foreign
firms “cherry pick” the best-performing domestic firms or acquire firms in high-productivity
areas, rather than improving the domestic firm’s performance through the transfer of technology,
management techniques, or better corporate governance. Since the decision to acquire a domestic
firm may be endogenous, any study of the impact of foreign ownership on the performance of
domestic firms must account for this problem of selection bias.2
In this paper, we analyse ownership changes in Canadian firms over 1998 to 2005, where a
controlling shareholder either acquires 20% or more of the votes in a widely-held Canadian firm,
or where the controlling shareholder divests their block holding. We also differentiate between
Canadian and foreign blockholders. We first examine the short-run market reaction to the
announcement of the change in ownership using an event study of abnormal returns. To capture
the longer-term effects, we examine the impact of ownership changes using three measures of a
firm’s performance: its market performance, proxied by Tobin’s q ratio, its accounting
performance, proxied by ROA, and firm leverage, as measured by debt-to-total assets. We
collect annual data for 613 Canadian firms covering 1998 to 2005 and identify the owner’s
nationality, and the percentage control of votes held by the largest shareholder. To our
2 Demsetz and Lehn (1985), Himmelberg, Hubbard and Palia (1999), and Coles, Lemmon and Meschke (2007) argue that ownership and performance are often determined by common characteristics, some of which are unobservable to the econometrician.
3
knowledge, this is the largest and most comprehensive database of Canadian ownership. We then
estimate the impact of changes in ownership using panel data techniques to control for the
problem of unobserved firm-level heterogeneity. Given that there may be systematic differences
between the control group (domestic controlled firms) and the treatment group (foreign
controlled firms), we use propensity score matching techniques to construct an appropriate
counter-factual control group. We then implement a difference-in-differences matching estimator
to identify changes associated with the change in control. We check to see if the results vary
based on the nationality of the blockholder.
One limitation of existing international studies of foreign takeovers is that most studies feature
countries or regions with very different legal, regulatory, and market institutions than the United
States, making it difficult to disentangle firm-level effects (such as the choice of capital structure,
corporate governance, or management quality) from country-level effects. Canada provides an
ideal setting for studying this question. Canada and the U.S. share a common legal ancestry, with
Canadian corporate and securities laws adopted from American precedents (Buckley 1997). Both
countries have the same English common-law legal system, require similar disclosure levels, and
exhibit similar levels of shareholder protection (La Porta et al. 1998, 2000). At the same time,
Canada features more concentrated corporate ownership than the United States (Attig 2005; King
and Santor 2008).3 A study of Canada therefore provides a useful counterfactual assessment as it
features the ownership structures of European or Asian firms in a similar institutional setting to
the United States.
Our main findings highlight differences in the short-run and the long-term effects. In the short
run, we find that the acquisition of a control stake in a widely-held firm, whether by a Canadian
or foreign owner, generates a positive abnormal return around the event with CAARs three times
larger than the reaction for the average takeover of a Canadian firm. By contrast, the divestiture
of a control stake generates no stock market reaction. Turning to the longer term effect on
performance and capital structure, we find that the acquisition of a control stake by a foreigner is
associated with higher ROA. The purchase of a control stake by a Canadian owner is associated
3 For example, 45% of the Canadian firms in our sample have a controlling shareholder at the 20% threshold vs.
28% for the U.S. sample studied by Gadhoum, Lang, and Leslie (2005).
4
with a decrease in ROA and an increase in leverage. Finally, the divestiture of a control stake is
associated with an increase in ROA.
The remainder of this paper is organized as follows. Section 2 reviews the related literature and
highlights the methodological problems that researchers need to address. Section 3 describes the
sample and provides summary statistics. Section 4 conducts an event study on the abnormal
returns around changes in ownership, and distinguishes between changes from widely-held to
controlled, and visa versa. Section 5 discusses our methodology and estimates the relationship
between foreign versus domestic ownership, firm performance, and capital structure. Section 6
concludes.
2. Related Literature
This paper is related to several strands of research. The first strand of literature examines the
impact of foreign takeovers or foreign investments on domestic firm performance. The foreign
acquirer may be a widely-held firm, with no shareholder controlling more than 20% of the voting
shares, or a firm controlled by a family, a widely-held corporation, or a financial investor such as
a pension or mutual fund. Studies of foreign acquisitions typically measure the impact by
looking for changes in total factor productivity (TFP), return on assets (ROA), or labour income
around the event with results reported for the United States (Girma et al. 2006), Japan (Fukao et
al. 2006), U.K. (Haskel, Pereira, and Slaughter 2007), Italy, France, Mexico, Indonesia, and
India (Petkova 2007). Our contribution is to examine Canadian data, and to consider the impact
on valuations, ROA, and financial leverage. We focus on changes in ownership, where a foreign
or Canadian blockholder acquires a control stake in a widely-held Canadian firm, or a closely-
held Canadian firm becomes widely-held. This type of event is less common, but should be
expected to have a greater impact on firm characteristics and performance. We are not aware of
any other Canadian study that looks at this question.
The results of two U.K. studies highlight the methodological difficulties that plague this area of
research. Conyon et al (2002), for example, study the productivity and wage effects of foreign
acquisition in the United Kingdom. Using a specially constructed database for the period 1989-
1994, the authors use ownership change to control for unobserved differences between plants.
They find that U.K. firms that are acquired by foreign firms exhibit an increase in labour
5
productivity of 13%. In a related study, Harris and Robinson (2003) find that foreign investors
cherry-pick the best performing U.K. firms, but subsequently the acquired firms do not
demonstrate any benefits from foreign ownership. This finding raises the problem of selection
bias, as it suggests the results may be sensitive to the control sample used to evaluate the change
in performance. Recent papers by Arnold and Javorcik (2005), Fukao et al (2006), and Petkova
(2007), among others, address this issue using the propensity score matching technique to
establish the control sample, combined with difference-in-differences estimation approach to
isolate the impact of the change in ownership. We employ this methodology in this paper.
Given their focus on productivity or wages, it is not surprising that few if any studies in this
literature examine either the impact of ownership change on a domestic firm’s valuation, or the
impact on the use of financial leverage. Studies of U.S. firms that consider these issues are
studies of leveraged buy-outs by Lichtenberg and Siegel (1987, 1990) and of management buy-
outs by Harris, Siegel, and Wright (2005).
A second strand of literature considers the impact of concentrated ownership on performance.
There are over 100 studies of the impact of concentrated ownership – whether by insiders or
outside investors – on firm performance. These studies report mixed results, with ownership
structure leading to better performance, worse performance, or no observable effect on
performance (King and Santor 2008). Increased ownership by insiders or the presence of a large
blockholder can lead to better performance due to the greater alignment of interests between
manager and minority shareholders, better monitoring of managers, and less myopic behaviour.
Concentrated ownership can have a negative effect on firm performance by entrenching poor
managers, facilitating the expropriation of minority shareholders by insiders or controlling
shareholders, and concentrating manager wealth leading to excessive risk-aversion. A final set of
studies suggests that concentrated ownership may have no observable effect on firm performance
due to endogeneity between ownership structure and firm performance.
One approach to disentangle the impact of ownership on performance is to conduct an event
study of changes in control, then to compare the performance before and after the event. Smith
and Amoako-Adu (1999), for example, look at 124 management successions within Canadian
family-controlled firms. They document negative abnormal returns around the appointment of
6
family successors, whereas there is no significant decrease when either non-family insiders or
outsiders are appointed. Bennedsen, Nielsen, and Pérez-González (forthcoming) use a unique
dataset from Denmark to investigate the impact of family succession on firm performance. The
authors find that family successions have a large negative causal impact on firm performance:
operating profitability on assets falls by at least four percentage points around CEO transitions,
with greater underperformance in fast-growing industries, industries with highly skilled labour
force and relatively large firms. We adopt an event study of abnormal returns to identify the
short-run market reaction, although we believe the impact of the ownership change may take
longer to manifest itself.
A second approach advocated by Himmelberg, Hubbard and Palia (1999) is to use panel
regressions techniques to address unobserved firm heterogeneity. This approach is employed by
Villalonga and Amit (2007) in a study of U.S. firms, Claessens et al. (2002) for European firms,
and Lins (2003) for Asian and emerging market firms. King and Santor (2008) study a panel
dataset of Canadian firms to distinguish the effect of family ownership on firm performance and
capital structure choices. The authors find that freestanding family-owned firms with a single
share class have similar valuations, higher ROA, and higher financial leverage than widely-held
firms. We use panel regressions in this study to control for unobserved firm heterogeneity.
This review of this literature suggests two methodological problems that researchers must
address in their empirical design, namely: the issue of selection bias, and the potential
endogeneity between ownership and performance. We discuss these issues in section 4.
3. Data description and summary statistics
We collect annual data on ownership and control from management proxy circulars (SEDAR),
the Statistics Canada InterCorporate Ownership database, and the Financial Post Top 500. We
follow Claessens et al. (2002) and divide firms into five categories based on a 20% control
threshold: firms are classified by whether they are controlled by a family, government entity,
non-financial corporation (including publicly-traded subsidiaries), or financial institution. Firms
are classified as widely-held where no shareholder controls more than 20% of the voting rights,
either directly or indirectly using dual-class shares or pyramidal structures. We also identify the
7
nationality of the ultimate owner. We collect annual financial statement data from Standard &
Poor’s Compustat, and stock prices from the CRSP and the TSX-CFMRC databases.
The full sample consists of all Canadian firms that meet the following criteria: positive assets
(DATA6 on Compustat), positive sales (DATA12), non-missing book value of equity
(DATA60), and non-missing income before extraordinary items (DATA18). We exclude
financial firms to make our sample comparable with other studies, and drop firms with a market
capitalization below $10 million Canadian dollars. Following Villalonga and Amit (2006) we
exclude 43 observations of firms with Tobin’s q ratios above 10. These restrictions result in a
final sample size of 2,758 firm-year observations from 613 firms, of which the median firm is in
our sample for four years. The distribution of owner type for the entire sample is 56% widely-
held, 32% family-owned, 8% controlled by a corporate entity and 4% controlled by a financial
institution. Of the firms that have a controlling shareholder, 18.7% have a foreign owner, and
82.3% have a Canadian owner.
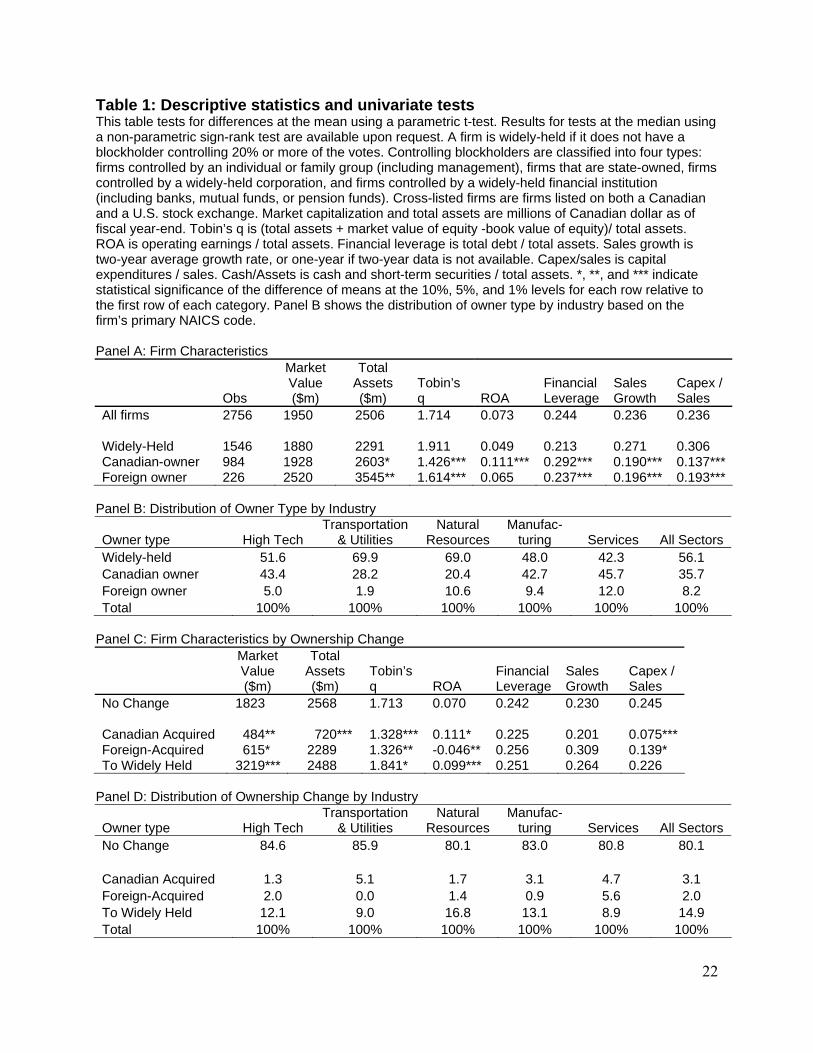
Panel A of Table 1 presents summary statistics and univariate tests of the key variables used in
our analysis for the 613 Canadian firms over the period 1998 to 2005. We use a parametric t-test
to examine whether the differences in means of firm characteristics by owner type are
statistically significant, where the comparison is always relative to widely-held firms. We
highlight three key differences between Canadian-owned and foreign-owned firms, and widely-
held firms. First, Canadian and foreign firms have similar market capitalization to widely-held
firms but greater total assets, implying that financial leverage at closely-held firms must be
higher. In fact, their total debt-to-total assets ratio is 29.2% and 23.7% for Canadian and foreign
firms, significantly higher than the 21.3% for widely-held firms. Second, Canadian closely-held
firms have statistically lower sales growth (19.0%) but higher ROA (11.1%). The mean Tobin’s
q ratio is lower for both foreign and Canadian firms at 1.614 and 1.426, respectively,
representing an discount of more than 25% relative to the average widely-held firm. Given
higher profitability, this discount may be explained by a higher cost of capital, while lower sales
growth may point to fewer growth opportunities. Third, closely-held firms have half the capital
expenditure (capex)-to-sales (14.0%) of widely-held firms (30.6%), consistent with lower sales
growth. We check how these characteristics vary based on firm size. Larger firms exhibit higher
8
Tobin’s q ratios compared to smaller firms (1.906 vs. 1.428), higher financial leverage (27.8%
vs. 24.1%), but lower capex-to-sales and cash-to-assets (results not shown).4
Panel B of Table 2 shows the distribution of owner type by industry. We classify firms into five
broad industries: high technology, transportation and utilities, natural resources, manufacturing
and construction, and wholesale and retail trade and services. Close to 70% of firms in
transportation and utilities sector are widely-held at the 20% threshold, while Canadian firms are
over-represented and foreign firms under-represented. Canadian ownership is higher in the high
tech (43.4%), manufacturing (42.7%), and service sectors (45.7%) but lower in the natural
resources sector. Foreign ownership is comparatively higher in the manufacturing, natural
resource and service sectors. Given the variation in owner type by industry, we control for
industry in our regressions below.
Panel C shows firm characteristics for firms that changed (or did not change) ownership. Firms
that were acquired by a Canadian or Foreign closely held firm were smaller by market cap, and
had lower Tobin’s q than firms that did not change ownership. However, foreign acquired firms
had dramatically lower ROA, suggesting that poor performing firms were targeted. On the other
hand, firms that become widely-held were typically larger with higher Tobin’s q and ROA. With
respect to industry type, foreign acquired firms were more likely to be in services, while firms
that became widely held less likely to be in the transportation and utilities, and services
industries (Panel D).
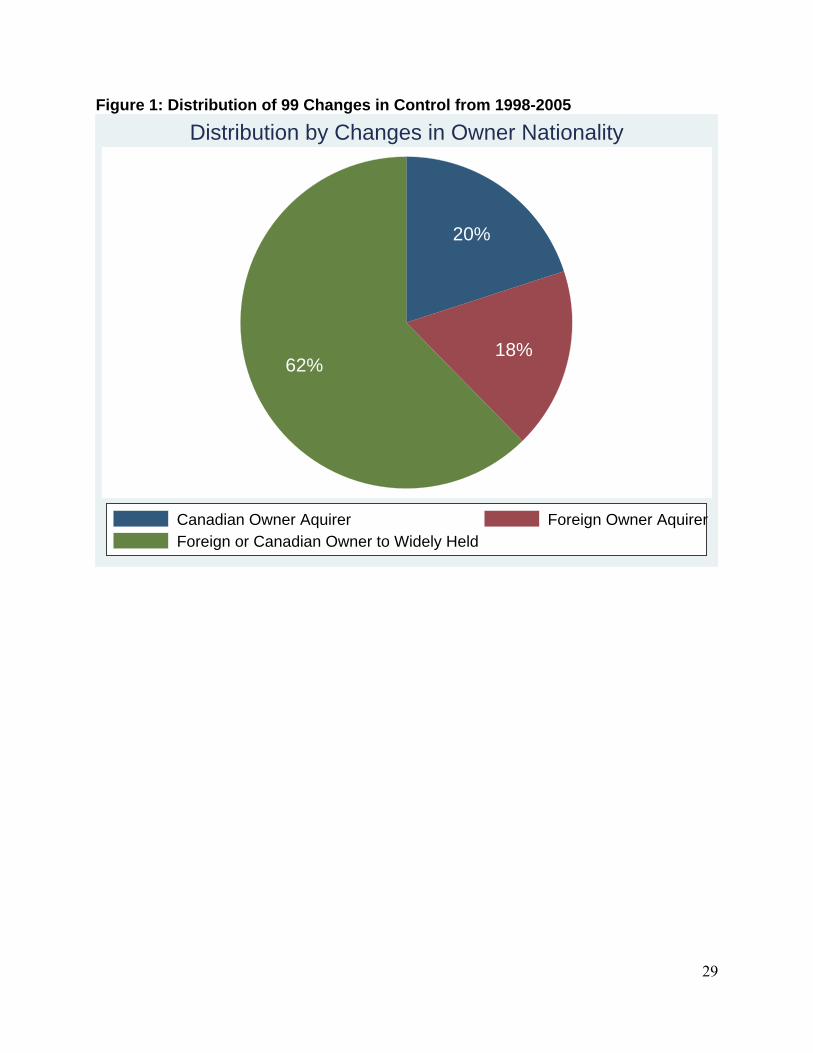
Figure 1 highlights the changes in ownership that are the focus of our analysis. We identify 99
changes in ownership. These events represent either the acquisition of a control stake of 20% or
greater in a widely held firm, or the divestiture of a control stake leading a closely-held Canadian
firm to become widely-held. Given that the entire sample represents 613 firms, this implies that
16.2% of the firms experience a control change of this type over the period covered by this
study. The most common change is for a firm controlled at the 20% threshold to become widely-
held, whether due to the divestiture or dilution of the control stake by a Canadian or a foreign
owner. We observe 61 such ownership changes from 1988 to 2005. In 20 cases, a foreign owner
4 We observe considerable cross sectional variation based on firm size, but the relative distribution of owner type is comparable across size
quartiles.
9
acquires a control stake in a widely-held Canadian firm. Finally, 18 cases represent a Canadian
owner acquiring a block holding of 20% of more in a widely-held Canadian firm.
4. Event study of change in control
As discussed above, a standard approach to measure the impact of a corporate event is to study
the abnormal returns before and after the event. While our sample contains 99 such events, we
can identify the date when a material change in ownership occurs in 62 cases, typically when a
takeover bid is announced.5 For the remaining cases, the control stake is acquired over time with
the change identified by comparing annual management proxy circulars. We identify 21 firms
that change from widely-held to controlled, and 41 firms where the controlling shareholders sell
their block holding and the firm becomes widely-held. We collect market data on total returns
and shares outstanding from the TSX-CFMRC database. The absence of sufficient trading data
required to estimate abnormal returns reduces the sample to 49 cases. For these transactions, we
identified the correct “news-adjusted” announcement date using electronic news searches on
Factiva.
We conduct a standard event study of abnormal returns and trading volume following the
methodology in MacKinlay (1997). The ‘zero date’ in our study, t=0, is the date of the first
public announcement of the takeover. Given that takeover announcements may be announced
when the market is closed or may be reported in the financial media the day following the
announcement, we include the trading day after the announcement in our zero date so our event
date is [0,1]. Our event window begins 50 trading days prior to the first public announcement
and ends 20 trading days after this date, [-50, 20]. Our estimation window lasts from 250 to 101
trading days before the first public announcement, [-250,-101]. We calculate daily abnormal
returns (ARs) for target firm i and event date t in our sample according to the equation:
)|( tititit XRERAR −= (1)
5 We only consider control changes that are material, namely where the control stake increases or decreases by at least 5%. This restriction eliminates changes in control due to marginal changes in controls stakes around the 20% threshold.
10
where ARit, Rit, and E(Rit | Xt) are the abnormal, actual, and normal returns, respectively, for the
time period t. Xt is the conditioning information for the normal return model. We estimate
normal returns over the estimation window [-250,-101] using a standard market model. We use
the TSX-CFMRC equal-weighted index as the proxy for the market.6 We aggregate individual
abnormal returns across securities to generate average abnormal returns (AAR). The average
abnormal returns are then aggregated over the event window to calculate cumulative average
abnormal returns (CAAR) over different windows from t to T, [t,T]. We conduct two tests of the
null hypothesis that the AARs or CAARs are zero, using a parametric z-test.
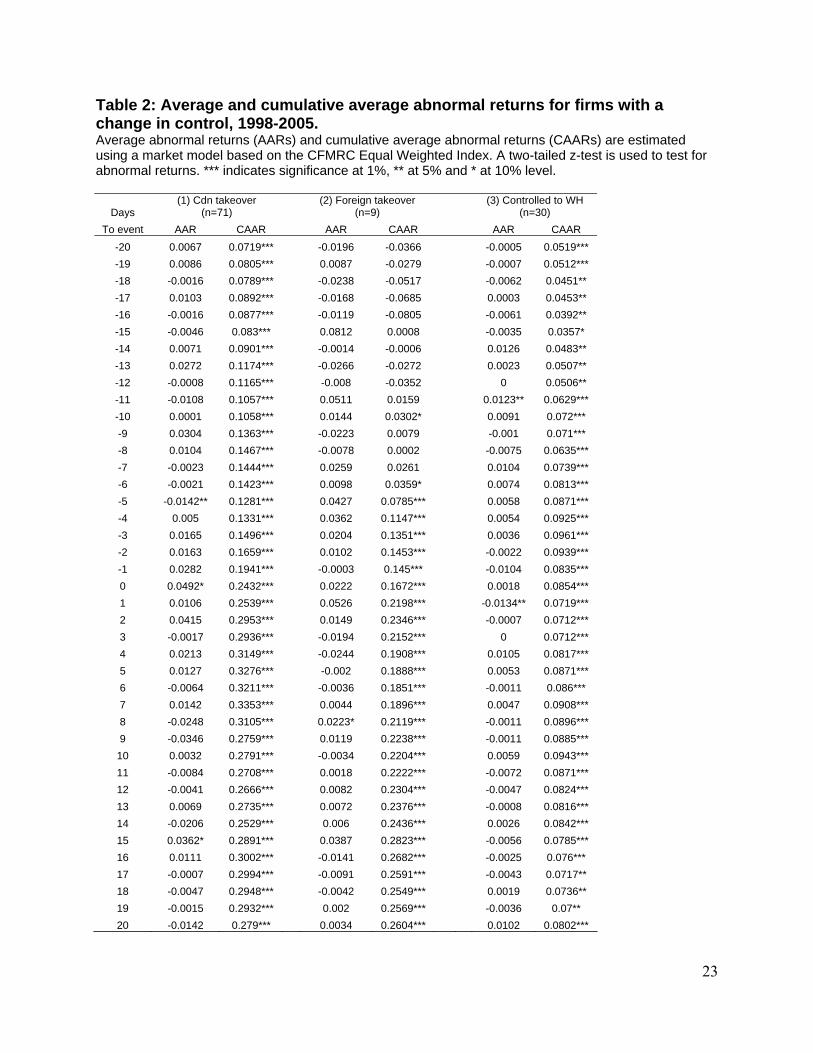
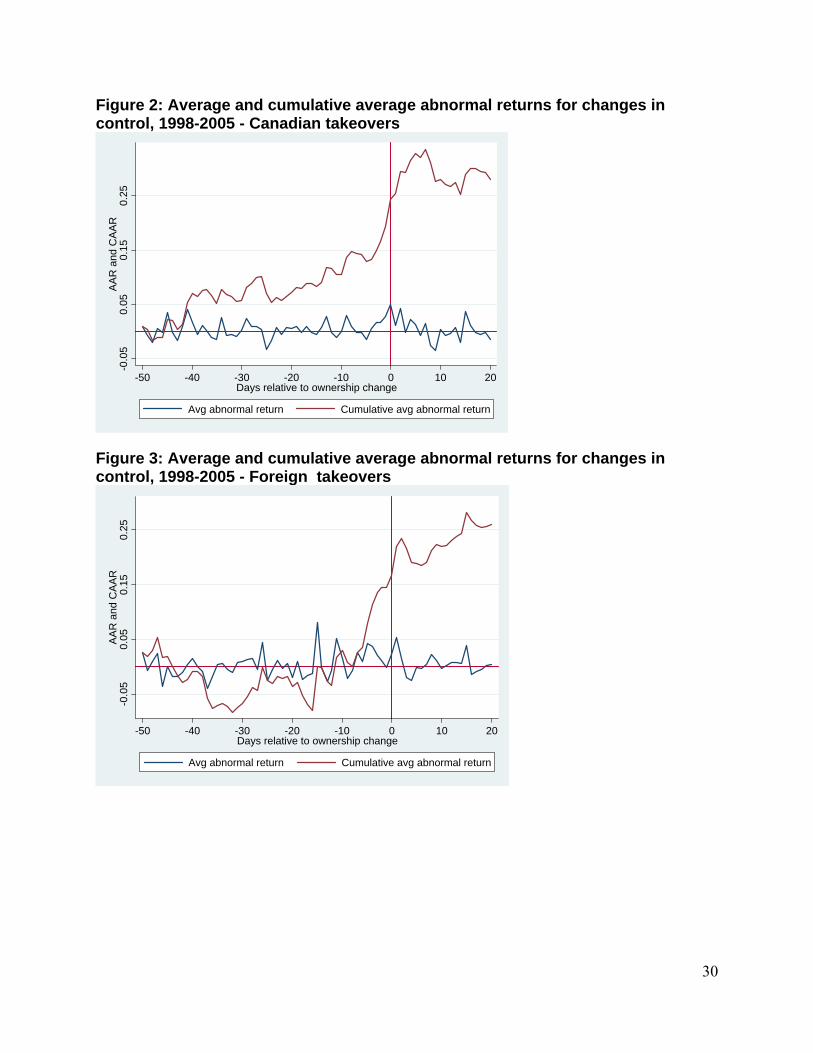
Table 2 presents the results of this event study. Column 1 reports the AARs and CAARs for the
sample of firms that became “Canadian”, over the window [-50,20], estimated using the market
model. The AARs fluctuate around zero with few days where the values are statistically different
from zero. The percentage of AARs that are positive on any given day fluctuates around 50 per
cent (result not shown). By contrast, the CAARs become positive and significant from 20 trading
days prior to the announcement of the control change. This pattern of pre-bid run-ups has been
documented in other studies of Canadian takeovers (Jabbour, Jalilvand and Switzer 2000; King
and Padalko 2005). We note the positive CAARs beginning far ahead of the announcement,
consistent with (i) market anticipation of the control change or (ii) the acquisition of the control
stake over time. By the day of the announcement, the CAAR is 24.32%, and it rises to close to
45% within a week of the announcement. Figure 2 graphs these results.
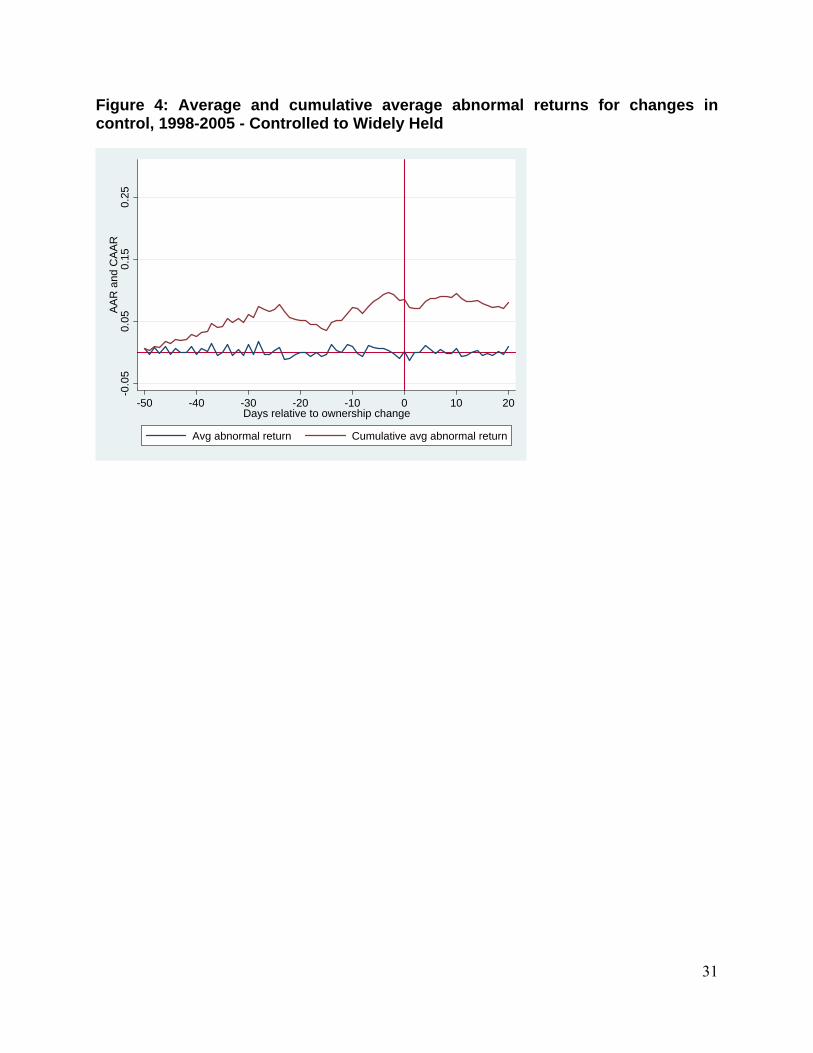
Column 2 of Table 2 reports the results for 9 cases where a widely-held Canadian firm becomes
closely held, following the acquisition of a control stake by a foreign owner. The CAAR only
becomes significant 5 days before the announcement date. The large and economically important
market reaction is consistent with a control premium being reflected in the target’s share price,
and is typical of a takeover setting. Figure 3 graphs these results. Column 3 of Table 2 reports
the results for 30 cases where either a Canadian or a foreign owner divests or dilutes their control
stake below 20% of the voting shares, and the firm becomes widely-held. The CAAR is positive
and significant from 20 days prior to the announcement, but the magnitude is much smaller at
over the window [-50,20]. The CAAR peaks at 9.43% on the tenth trading day following the
announcement. Figure 4 shows the AARs and CAARs for these 30 cases. The smaller reaction to 6 Our results are robust when using the TSX-CFMRC market-weighted index.
11
the change in control suggests that the divestiture is important but not nearly as important as the
acquisition of a control stake by either a Canadian or a foreign owner.
5. Regressions on firm performance and leverage
5.1 Methodology
Next we examine the longer-term reaction to the change in control using multivariate
regressions. We examine the impact of foreign ownership on two measures of a firm’s
performance: its market performance, proxied by Tobin’s q ratio, and its accounting
performance, proxied by ROA. Thus, one can estimate the following equation:
itititit OWNxy εδβα ++′+= (2)
where yit is either Tobin’s q or ROA. The x’s are firm characteristics, namely firm size, sales
growth, industry Tobin’s q, ROA, financial leverage, firm age, membership in the TSE300
index, and capex-to-sales. ROA is a control in the regressions on Tobin’s q only. OWNit is a
measure of ownership, i.e. whether the firm has a Canadian owner, a foreign owner, or is widely
held. εit is the mean-zero residual adjusted for firm-specific heterogeneity. While equation (2)
estimates the impact of foreign ownership on the level of firm performance, we aim to evaluate
the impact of a change in ownership, and in particular, acquisition by a foreign firm. For this, (2)
can be augmented as follows:
itititit OWNCHxy εδβα +′+′+= _ (3)
where CH_OWN is a vector of three dummy variables that indicate whether the firm was
acquired by a Canadian owned firm, a foreign owned firm, or was a firm with a controlling
shareholder that became widely-held. We repeat the same exercise to examine the effect of a
change in ownership on capital structure using the following model:
itititit OWNxlev εδβα ++′+= (4)
12
where levit is financial leverage, measured as total debt-to-total assets, and the control variables
on the right-hand side are the same as in (1), except that financial leverage is excluded and cash-
to-assets is included. CH_OWN is the change in ownership, as described before.
5.2 Econometric Issues
There is a widespread consensus that foreign-owned firms have better performance than
domestic-owned firms (Petkova 2007). But it may be the case that foreign firms simply “cherry
pick” the best-performing domestic firms, or choose only to acquire firms in high-productivity
areas, rather than improve the domestic firm’s performance through the transfer of technology,
management techniques, or better corporate governance.7 The decision to acquire a domestic
firm may be endogenous, and thus any study of the impact of foreign ownership on the
performance of domestic firms must account for the problem of selection bias.
The problem of endogeneity described above complicates the evaluation, for example, of the
impact of a change in ownership. Estimation by OLS will only produce unbiased estimates of
ownership change if the change is exogenous. That is, firms that change ownership have to be
identical to those that do not, except that the change in ownership was exogenously determined.
It is clear that the outcome of acquisition is not exogenous for the firm, as it is often the firms
with best growth potential that are acquired. Nevertheless, OLS estimation can still produce
unbiased estimates of the change in ownership if the characteristics that determine acquisition
are observable.8 It is most likely, however that ownership change is a function of firm
characteristics that are often unobservable: i.e. firm characteristics such as managerial
competence, and/or the availability of good projects may determine which firms are acquired.
Most studies utilize simple Heckman correction models to address these issues.9 However, these
standard approaches, even when they identify acquisition successfully, may still be inadequate
for evaluating the impact of acquisition.
7 Moreover, Demsetz and Lehn (1985), Himmelberg, Hubbard and Palia (1999), and Coles, Lemmon and Meschke (2007) argue that ownership and performance are often determined by common characteristics, some of which are unobservable to the econometrician. 8 This depends on whether one has enough “controls” to account for the determinants of a change in ownership. 9 One notable exception is Petkova (2007)
13
5.3 Matching Methods
Standard non-experimental evaluation techniques rely on the fact that the treatment (acquired
firms) and control groups (non-acquired firms) share common supports for the distribution of
firm characteristics. That is, firms in the treatment and control groups are comparable across a
range of characteristics, such as firm size, age and profitability. However, if the supports of the
distribution are not similar, Heckman et al. (1996) show that the implementation of standard non-
experimental techniques may produce biased estimates of acquisition impacts. This is because
OLS estimates assume that the impact of ownership change can be captured entirely by the
single index X′β, which may not be related to the firm’s propensity to be acquired. Furthermore
OLS, and other standard non-experimental techniques imply a common acquisition effect across
all firms. If there were substantial differences between the control and treatment groups, then
estimates of the impact of acquisition would be biased since the treatment group may respond
differently to the treatment. For example, the treatment group may consist of young, growth-
oriented firms in the natural resources industry, while the control group may be older, established
firms operating in the service industry. Consequently, the impact of acquisition may differ
substantially between firms, and these differences are not resolved by standard selection models.
For example, a treatment effects model estimates the difference, δ, between acquired and non-
acquired as:
)0_|()1_|( 01 =Π−=Π= OWNCHEOWNCHEδ (5)
where Π is the outcome of interest. But to accurately assess the impact of acquisition, one needs
to calculate the effect of the treatment (acquisition) on the treated (those who were acquired):
)1_|()1_|( 01 =Π−=Π= OWNCHEOWNCHETδ (6)
That is, one needs to observe the outcomes for firms that received the treatment and compare
them to outcomes for firms that are otherwise identical, except for the fact that the control group
did not experience a change in ownership (but were eligible to be acquired and would do so).
14
Unfortunately, the second term of the right hand side of (6) does not exist in the data since it is
not observed.10
A solution to this evaluation problem is to create the counterfactual ( )1_|0 =Π OWNCHE by
matching treatment and control firms along observable characteristics. For every firm in the
treatment, one needs to find a firm that is identical in every respect except for the fact that the
firm experienced a change in ownership. For instance, if the treatment group consisted of young,
growth-oriented firms in the natural resources industry, one would like to find similarly
profitable firms, from the same the same industry. Fortunately, there is a solution to this
problem, known as “matching methods.” Rosenbaum and Rubin (1984) show that instead of
matching along X, one can match along P(X), the probability that the firm participated in the
treatment group, and still develop consistent and unbiased estimates of the effect of acquisition
on the treated.11
There are several methods of matching that one can consider: “without replacement”, “with
replacement” and “nearest neighbour” techniques (Dehajia and Wahba, 1998). The standard
technique, matching without replacement, is conducted as follows. First run a logit and/or probit
regression to generate a scalar measure of the probability of acquisition P(X). Then, sort the data
according to the estimate of P(X) from highest to lowest. For each firm in the treatment group
match it to a control firm, in descending order and repeat until each treatment firm is matched
with a firm from the control group. This technique can also be done “with replacement”. In this
case, P(X) is estimated and then the data randomly ordered. Then each firm in the treatment
group is matched with the firm from the control group that is its nearest neighbour. In this way,
different treatment firms may have the same control group analogue. Lastly, one can match each
10 A solution is for the researcher to create the right hand side of (5) through the implementation of a randomized experiment: firms would be randomly acquired by a foreign or Canadian firm. This would create a true control group sample analogue that could be used to determine the difference between the outcomes of those firms that were acquired and those that were not. While the implementation of randomized experiments has been successfully executed in certain settings, thus evaluation techniques is clearly not available. 11 Note that it is quite hard to match on multiple dimensions especially when X consists of continuous variables: this is the so-called curse of dimensionality. Rosenbaum and Rubin (1984) have proposed the propensity score matching approach employed in this paper to this dimensionality problem. See Smith and Todd (2001) and Ham, Li and Reagan (2003) for a thorough discussion of matching method techniques.
15
treatment firm to those control firms within some radius δ of P(X) and take the weighted average
of the characteristics of those firms in the radius.12
The viability of propensity score matching techniques to construct a suitable control group
sample analogue depends on the following crucial assumption:
( )( ) ( )( )0_,|1_,| 00 =Π==Π OWNCHXPEOWNCHXPE , (7)
that is, conditional on the propensity score, the outcome in the non-participation state is
independent of participation. To be able to create suitable counterfactuals to the treatment group
one needs to be able to match along observable characteristics. The limitation of the propensity
score as a measure of “comparability” is determined by the availability of sufficient conditioning
variables. If the outcome to be acquire is poorly measured, the treatment and control groups will
be poorly matched, and any inferences on the effect of the “treatment on the treated” will be
biased in an undetermined manner. In this way, matching may actually accentuate the bias
caused by selection on unobservable firm characteristics (Smith and Todd, 2001). The results
from the application of matching methods to the sample of treatment and control groups are
presented below in addition to the standard descriptive statistics and regression results.
5.4 The impact of ownership changes on performance
We estimate (3) using a random effects regression, and include dummy variables to capture the
effect of a change in ownership. Three types of ownership changes are considered: (1) the
acquisition of a widely-held firm by a Canadian owner; (2) the acquisition of a widely-held firm
by a foreign owner; and (3) a Canadian or foreign owned firm that divests and becomes widely
held.
5.4.1 Benchmark regressions to explain firm performance
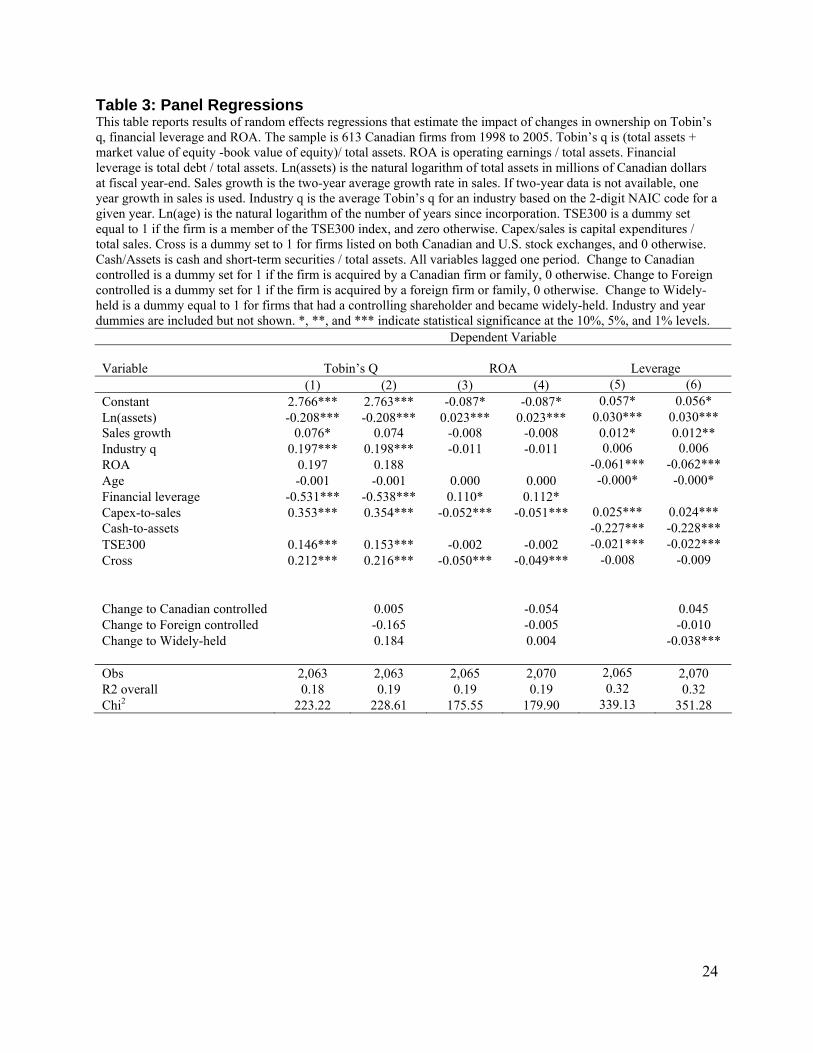
Table 3 presents the results of estimating equation (3), where the dependent variables are firm
performance, as proxied by Tobin’s q, ROA and financial leverage. The benchmark model for
Tobin’s q in column 1 shows that size and financial leverage are negatively correlated to Tobin’s
12 The size of δ is determined by the researcher. Likewise, one can use local linear regression or kernel estimator methods to generate the control group analogue within the range of δ.
16
q. Industry q, membership in the TSE 300, capex-to-sales and cross-listing on a U.S. exchange
are positively correlated to Tobin’s q. Firm age and sales growth are not significant. When
controlling for firm characteristics, Tobin’s’ q does not change when the firm acquired by a
Canadian owner, a foreign firm, or when a closely-held firm becomes widely held.
Columns (3) and (4) in Table 3 examine the relationship between ROA and ownership changes.
For the benchmark model in column 3, we find that larger firms with higher growth opportunities
have higher ROA. Higher financial leverage, TSE 300 membership and capex-to-sales are
associated with lower ROA, with firm age not significant. The impact on ROA (column 4) is
negative for Canadian acquisitions, but like the other ownership changes, is not statistically
different from zero. Lastly, Table 3 presents the results when the dependent variable is a firm’s
total debt-to-total assets. For the benchmark model in column (5), we find that larger firms with
high capex-to-sales have higher ratios of financial leverage. Higher ROA, membership in the
TSE 300, and higher cash-to-assets are associated with lower financial leverage. Acquisition
does not lead to lower financial leverage; on the other hand, becoming widely-held leads to
lower leverage.
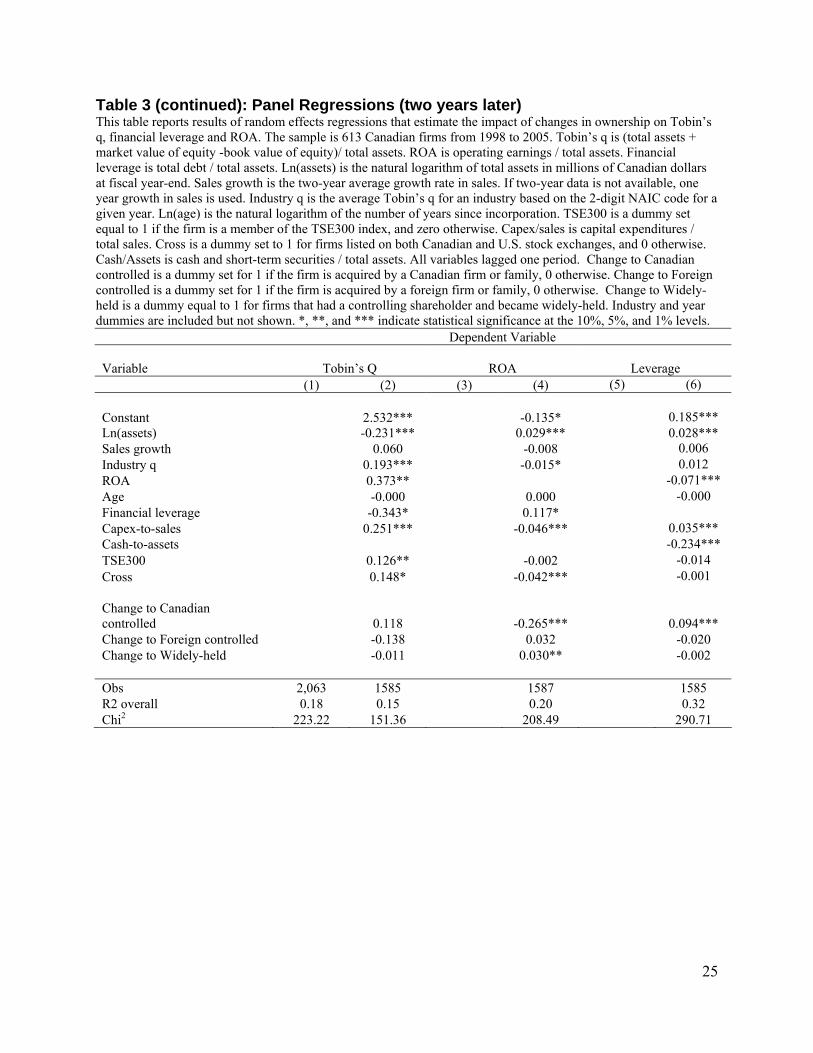
The seeming lack of impact of ownership change on performance may be driven by the fact that
it takes longer than one year for the effects to be realized. The random-effects regression are re-
run but the dependent variable is now measured at a two-year horizon, and the results are
presented in Table 4. Again, there is no impact on Tobin’s q. However, when a firm is acquired
by a Canadian firm, ROA is negatively impacted, and leverage is now higher. This is in contrast
to the positive effect on ROA when a firm becomes widely-held.
5.4.2 Matching Methods
As discussed above, an evaluation of the impact of ownership changes on firm performance
using standard econometric techniques may lead to biased results. To check the robustness of
our results, we estimate a difference-in-differences matching method model. First, we utilize a
probit model using all available control variables to estimate the propensity of a change in
ownership (results not shown). We consider three separate probit regressions with respect to
ownership changes: widely-held to Canadian owner, widely-held to foreign owner, and
controlled to widely-held. Given the values of the propensity score, for each firm in the
17
treatment group, we find its nearest neighbour in the control group. Having constructed a
suitable control group, we compare the change in the three measures of firm performance.13 For
each measure, in addition to the simple matching estimator, we also trim the sample at the 2%
(5%) level and consider “nearest neighbours” for the control group within a 0.02 (0.05) band of
the propensity score.
Table 4 presents the results from the matching methods difference-in-difference estimator for the
three measures of performance, when the treatment group consists of firms acquired by a
Canadian owner. The treatment group saw a decrease in Tobin’s q of 0.113, compared to -0.014
for the control group (all other firms that did not experience a change in ownership). However,
the difference of -0.099 in the change in Tobin’s q between the two groups is not statistically
different than zero (column 3). When matching methods are used and the correct control group
is identified, the control group firms experience an increase in their Tobin’s q (column 4).
Consequently, we find that the impact of the treatment on Tobin’s q is -0.551 (column 5).
However, when the sample is trimmed on either tail of the distribution by 2% and 5%,
respectively, and the control group augmented to include all firms within 0.02 and 0.05 of the
propensity score of the treatment group, the results, are weaker than before. With respect to
ROA, the matching results broadly reflect the previous regression results, with no impact on
ROA from being acquired by a Canadian owner. In the case of leverage, matching reveals that
Canadian acquisition leads to higher leverage, although the effect weakens with trimming.
When the time horizon is expanded to two years, the results change for ROA – in this case,
Canadian acquisition leads to lower ROA.
Table 5 presents the results from the matching methods difference-in-difference estimator for
when the treatment group consists of firms acquired by a foreign owner. The treatment group
saw a decrease in Tobin’s q of -0.052 compared to -0.014 for the control group, and the
difference between the two groups is statistically different than zero (column 3) at -0.038. When
matching methods are used, the control group firms experience a modest increase in their
Tobin’s q when compared to the unmatched sample (column 4), but this effect fades with
13 In each case, matching methods reduces the differences between the treatment group and the control group across most of the variables considered. as measured by t-tests of the differences in means, and by a reduction in the “bias”. See the authors for more details.
18
matching. In all cases, the impact is insignificant. With respect to ROA and leverage, there
appears to be no impact, the matching results again broadly reflect the standard regression
results, with no impact on ROA from being acquired by a foreign owner. In the case of leverage,
however, matching reveals that there is an impact from foreign acquisition, a result that is
confirmed by the regression results. Extending the horizon to two years does not change the
result.
Table 6 presents the results from the matching methods difference-in-difference estimator for
when the treatment group consists of firms that became widely held. The treatment group saw
an increase in Tobin’s q of 0.042, compared to -0.014 for the control group (all other firms that
did not experience a change in ownership), and the difference of 0.057 in the change in Tobin’s q
between the two groups is not statistically different than zero (column 3). When matching
methods are used, the control group firms experience an increase in their Tobin’s q (column 4),
but the resulting difference is not significantly different than zero. Trimming does not change
the result. With respect to ROA, the matching results show that becoming widely-held increases
ROA, an effect that is also true at the longer horizon.. In the case of leverage, matching reveals
that there is an impact from becoming widely held – leverage falls, a result that is consistent with
the regression results.
6. Conclusion
This study examines the link between family ownership, firm performance, and capital structure
using a panel data set of 613 Canadian firms from 1998 to 2005. A Canadian sample provides an
ideal counterfactual to studies of U.S. firms, as Canada features the same legal, regulatory and
market institutions as the U.S. but exhibits higher ownership concentration and greater use of
control-enhancing mechanisms. Previous U.S. studies of the impact of ownership on these
relationships have produced mixed or inconclusive results, likely due to the endogeneity between
these variables as well as the failure to distinguish between ownership and mechanisms that
enhance control. Following Himmelberg, Hubbard and Palia (1999) and Claessens et al. (2002),
we use panel data techniques to control for unobserved firm heterogeneity in order to better
identify these relationships.
19
Our sample of 613 firms from 1998 to 2005 includes 99 events where a controlling shareholder
either acquires 20% or more of the votes in a widely-held Canadian firm, or where the
controlling shareholder divests their block holding. We differentiate between Canadian and
foreign blockholders. Our results show different reactions in the short-run and the long-run. In
the short run, we find that the acquisition of a control stake in a widely-held firm, whether by a
Canadian or foreign owner, generates a positive abnormal return around the event. This reaction
is consistent with premium on control stakes, although the magnitude of the CAAR over the
window [-50,20] is three times larger than for the average takeover of a Canadian firm in this
period. By contrast, the change in control from closely-held to widely held generates a minimal
stock market reaction. In the long term, we use propensity score matching to generate a control
sample of firms with the same characteristics that did not experience a change in control. We use
a difference-in-differences method to address unobserved firm heterogeneity and isolate the
impact of the 99 ownership changes on firm performance and capital structure. We find that
foreign acquisition is associated with no change in performance, while Canadian acquisition is
correlated with lower performance and higher leverage. Becoming widely-held leads to higher
performance. Future research will consider the impact of these changes of control on the total
factor productivity and labour income of Canadian firms.
20
7. Bibliography
Amoako-Adu, Ben, Brian F. Smith, and Madhu Kalimipalli (2007) “Concentrated Control: A Comparative Analysis of Single and Dual Class Structures on Corporate Value.” Mimeo, Wilfrid Laurier University.
Arnold, J., S., Javorcik, B. (2005) "Gifted Kids or Pushy Parents? Foreign Acquisitions and Plant Performance in Indonesia," CEPR Discussion Papers 5065.
Attig, Najah (2005) “Balance of Power.” Canadian Investment Review (Fall): 6-13.
Barbosa, N., Louri, H., 2005. Corporate performance: Does ownership matter? A comparison of foreign- and domestic-owned firms in Greece and Portugal. Review of Industrial Organization 27(1), 73-102.
Bennedsen, M, Nielsen, K. M., Perez-Gonzalez, F. and D. Wolfenzon (2008) “Inside the Family Firm: The Role of Families in Succession Decisions and Performance.” Forthcoming.
Buckley, F.H. “The Canadian Keiretsu.” Journal of Applied Corporate Finance, 9 (1997): 46-56.
Claessens, Stijn, Simeon Djankov, J.P.H. Fan and Larry H.P. Lang (2002) “Disentangling the Incentive and Entrenchment Effects of Large Shareholdings.” Journal of Finance 57(6): 2741-2771.
Coles, Jeffrey L., Michael L. Lemmon, and Felix Meschke (2007) "Structural Models and Endogeneity in Corporate Finance: the Link Between Managerial Ownership and Corporate Performance." Mimeo, Arizona State University. Available at SSRN: http://ssrn.com/abstract=423510.
Conyon, M., Girma, S., Thompson, S., and P.W. Wright (2002) “The productivity and wage effects of foreign acquisitions in the United Kingdom, “ Journal of Industrial Economics (50): 85-102.
Demsetz, Harold, and Kenneth Lehn (1985) “The Structure of Corporate Ownership: Causes and Consequences.” Journal of Political Economy 93(6): 1155 – 77.
Gadhoum, Yoser, Larry H. P. Lang and Leslie Young (2005) “Who Controls US?” European Financial Management 11(3): 339-63.
Fukao, K., Ito, K., Kwon, H. U., and M. Takizawa (2006) “Cross-border acquisitions and target firms’ performance: Evidence from Japanese Firm-Level Data,” NBER Working Paper 12422.
Girma, S., Gorg, H., 2007. Evaluating the foreign ownership wage premium using a difference-in-differences matching approach. Journal of International Economics 73, 97-112.
Girma, S., Kneller, R., Pisu, M., 2007. Do exporters have anything to learn from foreign multinationals. European Economies Review 51, 981-998.
Girma, S., Thompson, S., Wright, P.W., 2006. International acquisitions, domestic competition and firm performance. International Journal of the Economics of Business 13 (3), 335-349.
21
Harris, R.; Siegel, D.; Wright, M.(2005)., "Assessing the Impact of Management Buyouts on Economic Efficiency: Plant-Level Evidence from the United Kingdom", Review of Economic and Statistics, Vol.87, pp.148-153.
Haskel, J., Pereira, S. C., and M. J. Slaughter (2007) “Does inward foreign direct investment boost the productivity of domestic firms?” Review of Economics and Statistics 89(3), 482-496.
Himmelberg, Charles P., R. Glenn Hubbard, and Darius Palia (1999) “Understanding the Determinants of Managerial Ownership and the Link between Ownership and Performance.” Journal of Financial Economics 53(3): 353-84.
King, Michael R. and Eric Santor (2008) “Family Values: Ownership Structure, Performance and Capital Structure of Canadian Firms.” Journal of Banking and Finance forthcoming.
La Porta, Rafael, Florencio Lopez-de-Silanes, Andrei Shleifer and Robert Vishny (1998) “Law and Finance.” Journal of Political Economy 106(6): 1113-55.
La Porta, Rafael, Florencio Lopez-de-Silanes, Andrei Shleifer and Robert Vishny (2000) “Investor Protection and Corporate Governance.” Journal of Financial Economics 58(1-2): 3-27.
Lichtenberg, F.R., Siegel, D., 1987. Productivity and changes in ownership of manufacturing plants. Brookings Papers on Economic Activity 3, 643-683.
Lichtenberg, F.R., Siegel, D., 1990. The effects of leveraged buyouts on productivity and related aspects of firm behaviour. Journal of Financial Economics 27, 165-194.
Lins, Karl V. (2003) “Equity Ownership and Firm Value in Emerging Markets.” Journal of Financial and Quantitative Analysis 38: 159-184.
Petkova, N. (2007) “Does Foreign Ownership Lead to Higher Firm Productivity?” Draft.
Rosenbaum, P., Rubin, D., 1983. The central role of the propensity score in observational studies for causal effects. Biometrika 70, 41-55.
Smith, J., Todd, P.E., 2005. Does matching overcome LaLonde’s critique of nonexperimental estimators? Journal of Econometrics 125, 305-353.
Villalonga, Belen and Raphael Amit (2006) “How Do Family Ownership, Control and Management Affect Firm Value?” Journal of Financial Economics 80(2): 385-417.
22
Table 1: Descriptive statistics and univariate tests This table tests for differences at the mean using a parametric t-test. Results for tests at the median using a non-parametric sign-rank test are available upon request. A firm is widely-held if it does not have a blockholder controlling 20% or more of the votes. Controlling blockholders are classified into four types: firms controlled by an individual or family group (including management), firms that are state-owned, firms controlled by a widely-held corporation, and firms controlled by a widely-held financial institution (including banks, mutual funds, or pension funds). Cross-listed firms are firms listed on both a Canadian and a U.S. stock exchange. Market capitalization and total assets are millions of Canadian dollar as of fiscal year-end. Tobin’s q is (total assets + market value of equity -book value of equity)/ total assets. ROA is operating earnings / total assets. Financial leverage is total debt / total assets. Sales growth is two-year average growth rate, or one-year if two-year data is not available. Capex/sales is capital expenditures / sales. Cash/Assets is cash and short-term securities / total assets. *, **, and *** indicate statistical significance of the difference of means at the 10%, 5%, and 1% levels for each row relative to the first row of each category. Panel B shows the distribution of owner type by industry based on the firm’s primary NAICS code. Panel A: Firm Characteristics
Obs
Market Value ($m)
Total Assets ($m)
Tobin’s q ROA
Financial Leverage
Sales Growth
Capex / Sales
All firms 2756 1950 2506 1.714 0.073 0.244 0.236 0.236 Widely-Held 1546 1880 2291 1.911 0.049 0.213 0.271 0.306 Canadian-owner 984 1928 2603* 1.426*** 0.111*** 0.292*** 0.190*** 0.137***Foreign owner 226 2520 3545** 1.614*** 0.065 0.237*** 0.196*** 0.193***
Panel B: Distribution of Owner Type by Industry
Owner type High Tech Transportation
& Utilities Natural
Resources Manufac-
turing Services All Sectors Widely-held 51.6 69.9 69.0 48.0 42.3 56.1 Canadian owner 43.4 28.2 20.4 42.7 45.7 35.7 Foreign owner 5.0 1.9 10.6 9.4 12.0 8.2 Total 100% 100% 100% 100% 100% 100%
Panel C: Firm Characteristics by Ownership Change
Market Value ($m)
Total Assets ($m)
Tobin’s q ROA
Financial Leverage
Sales Growth
Capex / Sales
No Change 1823 2568 1.713 0.070 0.242 0.230 0.245 Canadian Acquired 484** 720*** 1.328*** 0.111* 0.225 0.201 0.075***Foreign-Acquired 615* 2289 1.326** -0.046** 0.256 0.309 0.139* To Widely Held 3219*** 2488 1.841* 0.099*** 0.251 0.264 0.226
Panel D: Distribution of Ownership Change by Industry
Owner type High Tech Transportation
& Utilities Natural
Resources Manufac-
turing Services All Sectors No Change 84.6 85.9 80.1 83.0 80.8 80.1 Canadian Acquired 1.3 5.1 1.7 3.1 4.7 3.1 Foreign-Acquired 2.0 0.0 1.4 0.9 5.6 2.0 To Widely Held 12.1 9.0 16.8 13.1 8.9 14.9 Total 100% 100% 100% 100% 100% 100%
23
Table 2: Average and cumulative average abnormal returns for firms with a change in control, 1998-2005. Average abnormal returns (AARs) and cumulative average abnormal returns (CAARs) are estimated using a market model based on the CFMRC Equal Weighted Index. A two-tailed z-test is used to test for abnormal returns. *** indicates significance at 1%, ** at 5% and * at 10% level.
Days (1) Cdn takeover
(n=71) (2) Foreign takeover
(n=9) (3) Controlled to WH
(n=30) To event AAR CAAR AAR CAAR AAR CAAR
-20 0.0067 0.0719*** -0.0196 -0.0366 -0.0005 0.0519*** -19 0.0086 0.0805*** 0.0087 -0.0279 -0.0007 0.0512*** -18 -0.0016 0.0789*** -0.0238 -0.0517 -0.0062 0.0451** -17 0.0103 0.0892*** -0.0168 -0.0685 0.0003 0.0453** -16 -0.0016 0.0877*** -0.0119 -0.0805 -0.0061 0.0392** -15 -0.0046 0.083*** 0.0812 0.0008 -0.0035 0.0357* -14 0.0071 0.0901*** -0.0014 -0.0006 0.0126 0.0483** -13 0.0272 0.1174*** -0.0266 -0.0272 0.0023 0.0507** -12 -0.0008 0.1165*** -0.008 -0.0352 0 0.0506** -11 -0.0108 0.1057*** 0.0511 0.0159 0.0123** 0.0629*** -10 0.0001 0.1058*** 0.0144 0.0302* 0.0091 0.072*** -9 0.0304 0.1363*** -0.0223 0.0079 -0.001 0.071*** -8 0.0104 0.1467*** -0.0078 0.0002 -0.0075 0.0635*** -7 -0.0023 0.1444*** 0.0259 0.0261 0.0104 0.0739*** -6 -0.0021 0.1423*** 0.0098 0.0359* 0.0074 0.0813*** -5 -0.0142** 0.1281*** 0.0427 0.0785*** 0.0058 0.0871*** -4 0.005 0.1331*** 0.0362 0.1147*** 0.0054 0.0925*** -3 0.0165 0.1496*** 0.0204 0.1351*** 0.0036 0.0961*** -2 0.0163 0.1659*** 0.0102 0.1453*** -0.0022 0.0939*** -1 0.0282 0.1941*** -0.0003 0.145*** -0.0104 0.0835*** 0 0.0492* 0.2432*** 0.0222 0.1672*** 0.0018 0.0854*** 1 0.0106 0.2539*** 0.0526 0.2198*** -0.0134** 0.0719*** 2 0.0415 0.2953*** 0.0149 0.2346*** -0.0007 0.0712*** 3 -0.0017 0.2936*** -0.0194 0.2152*** 0 0.0712*** 4 0.0213 0.3149*** -0.0244 0.1908*** 0.0105 0.0817*** 5 0.0127 0.3276*** -0.002 0.1888*** 0.0053 0.0871*** 6 -0.0064 0.3211*** -0.0036 0.1851*** -0.0011 0.086*** 7 0.0142 0.3353*** 0.0044 0.1896*** 0.0047 0.0908*** 8 -0.0248 0.3105*** 0.0223* 0.2119*** -0.0011 0.0896*** 9 -0.0346 0.2759*** 0.0119 0.2238*** -0.0011 0.0885***
10 0.0032 0.2791*** -0.0034 0.2204*** 0.0059 0.0943*** 11 -0.0084 0.2708*** 0.0018 0.2222*** -0.0072 0.0871*** 12 -0.0041 0.2666*** 0.0082 0.2304*** -0.0047 0.0824*** 13 0.0069 0.2735*** 0.0072 0.2376*** -0.0008 0.0816*** 14 -0.0206 0.2529*** 0.006 0.2436*** 0.0026 0.0842*** 15 0.0362* 0.2891*** 0.0387 0.2823*** -0.0056 0.0785*** 16 0.0111 0.3002*** -0.0141 0.2682*** -0.0025 0.076*** 17 -0.0007 0.2994*** -0.0091 0.2591*** -0.0043 0.0717** 18 -0.0047 0.2948*** -0.0042 0.2549*** 0.0019 0.0736** 19 -0.0015 0.2932*** 0.002 0.2569*** -0.0036 0.07** 20 -0.0142 0.279*** 0.0034 0.2604*** 0.0102 0.0802***
24
Table 3: Panel Regressions This table reports results of random effects regressions that estimate the impact of changes in ownership on Tobin’s q, financial leverage and ROA. The sample is 613 Canadian firms from 1998 to 2005. Tobin’s q is (total assets + market value of equity -book value of equity)/ total assets. ROA is operating earnings / total assets. Financial leverage is total debt / total assets. Ln(assets) is the natural logarithm of total assets in millions of Canadian dollars at fiscal year-end. Sales growth is the two-year average growth rate in sales. If two-year data is not available, one year growth in sales is used. Industry q is the average Tobin’s q for an industry based on the 2-digit NAIC code for a given year. Ln(age) is the natural logarithm of the number of years since incorporation. TSE300 is a dummy set equal to 1 if the firm is a member of the TSE300 index, and zero otherwise. Capex/sales is capital expenditures / total sales. Cross is a dummy set to 1 for firms listed on both Canadian and U.S. stock exchanges, and 0 otherwise. Cash/Assets is cash and short-term securities / total assets. All variables lagged one period. Change to Canadian controlled is a dummy set for 1 if the firm is acquired by a Canadian firm or family, 0 otherwise. Change to Foreign controlled is a dummy set for 1 if the firm is acquired by a foreign firm or family, 0 otherwise. Change to Widely-held is a dummy equal to 1 for firms that had a controlling shareholder and became widely-held. Industry and year dummies are included but not shown. *, **, and *** indicate statistical significance at the 10%, 5%, and 1% levels. Dependent Variable
Variable
Tobin’s Q ROA
Leverage (1) (2) (3) (4) (5) (6) Constant 2.766*** 2.763*** -0.087* -0.087* 0.057* 0.056* Ln(assets) -0.208*** -0.208*** 0.023*** 0.023*** 0.030*** 0.030*** Sales growth 0.076* 0.074 -0.008 -0.008 0.012* 0.012** Industry q 0.197*** 0.198*** -0.011 -0.011 0.006 0.006 ROA 0.197 0.188 -0.061*** -0.062*** Age -0.001 -0.001 0.000 0.000 -0.000* -0.000* Financial leverage -0.531*** -0.538*** 0.110* 0.112* Capex-to-sales 0.353*** 0.354*** -0.052*** -0.051*** 0.025*** 0.024*** Cash-to-assets -0.227*** -0.228*** TSE300 0.146*** 0.153*** -0.002 -0.002 -0.021*** -0.022*** Cross 0.212*** 0.216*** -0.050*** -0.049*** -0.008 -0.009 Change to Canadian controlled 0.005 -0.054 0.045 Change to Foreign controlled -0.165 -0.005 -0.010 Change to Widely-held 0.184 0.004 -0.038*** Obs 2,063 2,063 2,065 2,070 2,065 2,070 R2 overall 0.18 0.19 0.19 0.19 0.32 0.32 Chi2 223.22 228.61 175.55 179.90 339.13 351.28
25
Table 3 (continued): Panel Regressions (two years later) This table reports results of random effects regressions that estimate the impact of changes in ownership on Tobin’s q, financial leverage and ROA. The sample is 613 Canadian firms from 1998 to 2005. Tobin’s q is (total assets + market value of equity -book value of equity)/ total assets. ROA is operating earnings / total assets. Financial leverage is total debt / total assets. Ln(assets) is the natural logarithm of total assets in millions of Canadian dollars at fiscal year-end. Sales growth is the two-year average growth rate in sales. If two-year data is not available, one year growth in sales is used. Industry q is the average Tobin’s q for an industry based on the 2-digit NAIC code for a given year. Ln(age) is the natural logarithm of the number of years since incorporation. TSE300 is a dummy set equal to 1 if the firm is a member of the TSE300 index, and zero otherwise. Capex/sales is capital expenditures / total sales. Cross is a dummy set to 1 for firms listed on both Canadian and U.S. stock exchanges, and 0 otherwise. Cash/Assets is cash and short-term securities / total assets. All variables lagged one period. Change to Canadian controlled is a dummy set for 1 if the firm is acquired by a Canadian firm or family, 0 otherwise. Change to Foreign controlled is a dummy set for 1 if the firm is acquired by a foreign firm or family, 0 otherwise. Change to Widely-held is a dummy equal to 1 for firms that had a controlling shareholder and became widely-held. Industry and year dummies are included but not shown. *, **, and *** indicate statistical significance at the 10%, 5%, and 1% levels. Dependent Variable
Variable
Tobin’s Q ROA
Leverage (1) (2) (3) (4) (5) (6) Constant 2.532*** -0.135* 0.185*** Ln(assets) -0.231*** 0.029*** 0.028*** Sales growth 0.060 -0.008 0.006 Industry q 0.193*** -0.015* 0.012 ROA 0.373** -0.071*** Age -0.000 0.000 -0.000 Financial leverage -0.343* 0.117* Capex-to-sales 0.251*** -0.046*** 0.035*** Cash-to-assets -0.234*** TSE300 0.126** -0.002 -0.014 Cross 0.148* -0.042*** -0.001 Change to Canadian controlled 0.118 -0.265***
0.094***
Change to Foreign controlled -0.138 0.032 -0.020 Change to Widely-held -0.011 0.030** -0.002 Obs 2,063 1585 1587 1585 R2 overall 0.18 0.15 0.20 0.32 Chi2 223.22 151.36 208.49 290.71
26
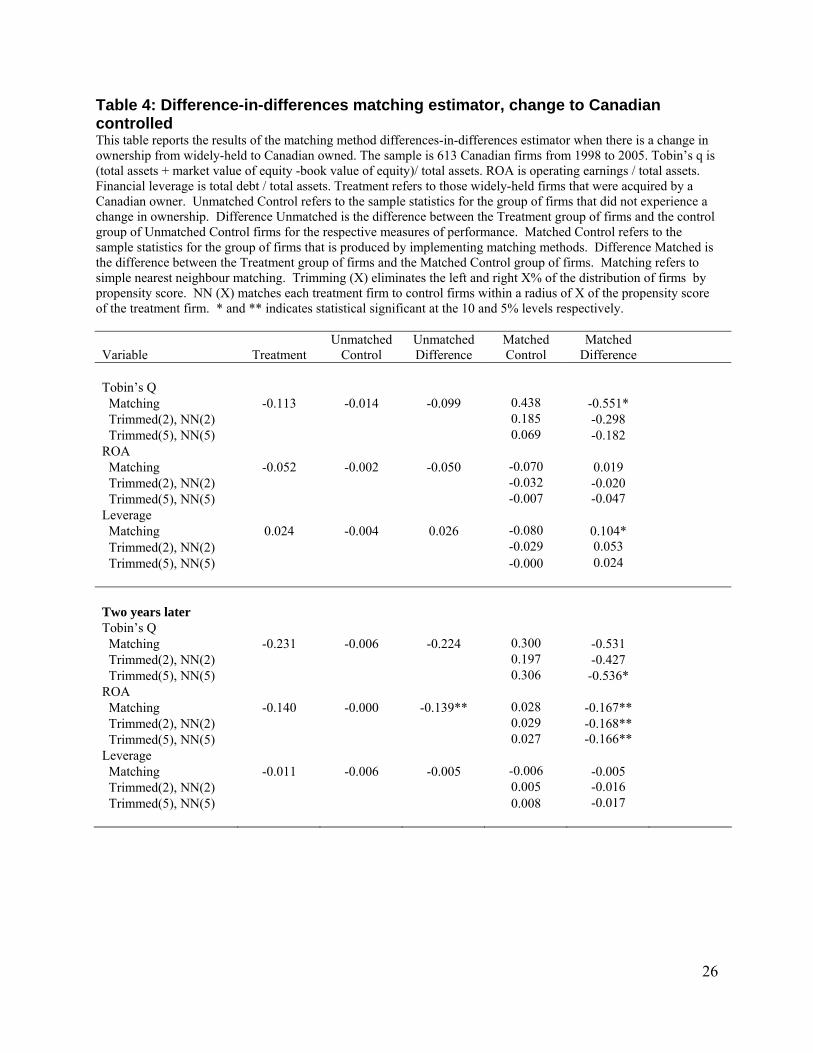
Table 4: Difference-in-differences matching estimator, change to Canadian controlled This table reports the results of the matching method differences-in-differences estimator when there is a change in ownership from widely-held to Canadian owned. The sample is 613 Canadian firms from 1998 to 2005. Tobin’s q is (total assets + market value of equity -book value of equity)/ total assets. ROA is operating earnings / total assets. Financial leverage is total debt / total assets. Treatment refers to those widely-held firms that were acquired by a Canadian owner. Unmatched Control refers to the sample statistics for the group of firms that did not experience a change in ownership. Difference Unmatched is the difference between the Treatment group of firms and the control group of Unmatched Control firms for the respective measures of performance. Matched Control refers to the sample statistics for the group of firms that is produced by implementing matching methods. Difference Matched is the difference between the Treatment group of firms and the Matched Control group of firms. Matching refers to simple nearest neighbour matching. Trimming (X) eliminates the left and right X% of the distribution of firms by propensity score. NN (X) matches each treatment firm to control firms within a radius of X of the propensity score of the treatment firm. * and ** indicates statistical significant at the 10 and 5% levels respectively.
Variable Treatment Unmatched
Control Unmatched Difference
Matched Control
Matched Difference
Tobin’s Q Matching -0.113 -0.014 -0.099 0.438 -0.551* Trimmed(2), NN(2) 0.185 -0.298 Trimmed(5), NN(5) 0.069 -0.182 ROA Matching -0.052 -0.002 -0.050 -0.070 0.019 Trimmed(2), NN(2) -0.032 -0.020 Trimmed(5), NN(5) -0.007 -0.047 Leverage Matching 0.024 -0.004 0.026 -0.080 0.104* Trimmed(2), NN(2) -0.029 0.053 Trimmed(5), NN(5) -0.000 0.024 Two years later Tobin’s Q Matching -0.231 -0.006 -0.224 0.300 -0.531 Trimmed(2), NN(2) 0.197 -0.427 Trimmed(5), NN(5) 0.306 -0.536* ROA Matching -0.140 -0.000 -0.139** 0.028 -0.167** Trimmed(2), NN(2) 0.029 -0.168** Trimmed(5), NN(5) 0.027 -0.166** Leverage Matching -0.011 -0.006 -0.005 -0.006 -0.005 Trimmed(2), NN(2) 0.005 -0.016 Trimmed(5), NN(5) 0.008 -0.017
27
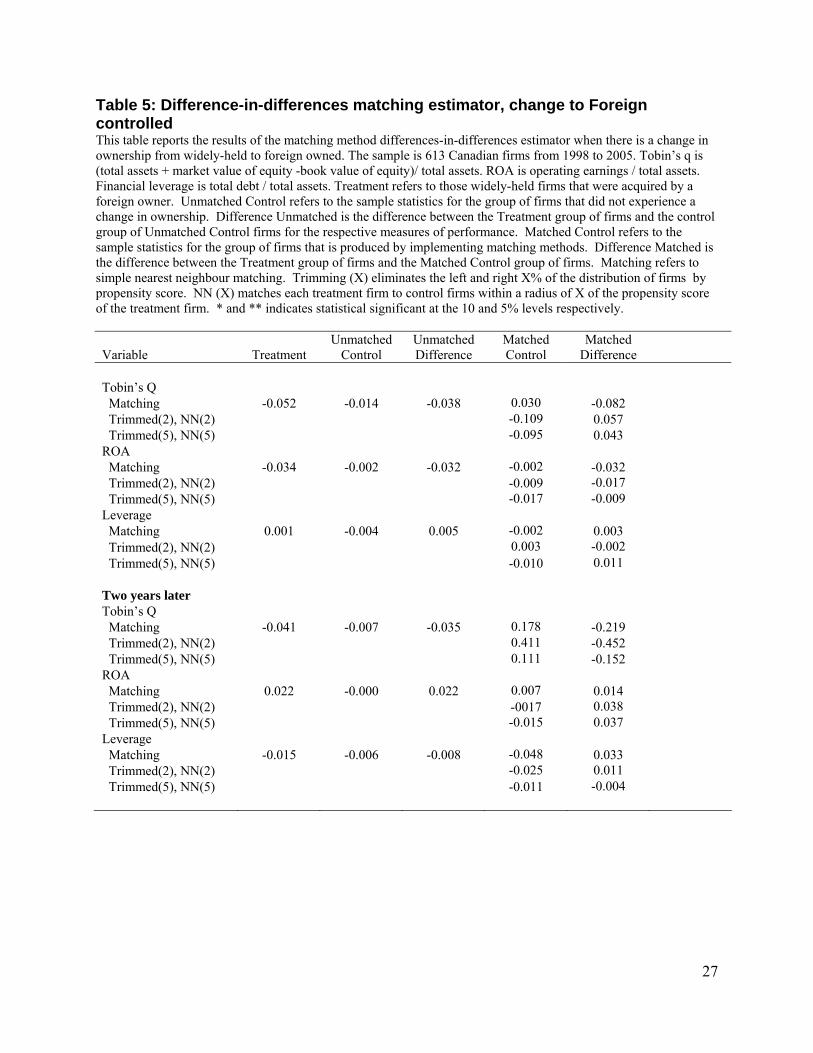
Table 5: Difference-in-differences matching estimator, change to Foreign controlled This table reports the results of the matching method differences-in-differences estimator when there is a change in ownership from widely-held to foreign owned. The sample is 613 Canadian firms from 1998 to 2005. Tobin’s q is (total assets + market value of equity -book value of equity)/ total assets. ROA is operating earnings / total assets. Financial leverage is total debt / total assets. Treatment refers to those widely-held firms that were acquired by a foreign owner. Unmatched Control refers to the sample statistics for the group of firms that did not experience a change in ownership. Difference Unmatched is the difference between the Treatment group of firms and the control group of Unmatched Control firms for the respective measures of performance. Matched Control refers to the sample statistics for the group of firms that is produced by implementing matching methods. Difference Matched is the difference between the Treatment group of firms and the Matched Control group of firms. Matching refers to simple nearest neighbour matching. Trimming (X) eliminates the left and right X% of the distribution of firms by propensity score. NN (X) matches each treatment firm to control firms within a radius of X of the propensity score of the treatment firm. * and ** indicates statistical significant at the 10 and 5% levels respectively.
Variable Treatment Unmatched
Control Unmatched Difference
Matched Control
Matched Difference
Tobin’s Q Matching -0.052 -0.014 -0.038 0.030 -0.082 Trimmed(2), NN(2) -0.109 0.057 Trimmed(5), NN(5) -0.095 0.043 ROA Matching -0.034 -0.002 -0.032 -0.002 -0.032 Trimmed(2), NN(2) -0.009 -0.017 Trimmed(5), NN(5) -0.017 -0.009 Leverage Matching 0.001 -0.004 0.005 -0.002 0.003 Trimmed(2), NN(2) 0.003 -0.002 Trimmed(5), NN(5) -0.010 0.011 Two years later Tobin’s Q Matching -0.041 -0.007 -0.035 0.178 -0.219 Trimmed(2), NN(2) 0.411 -0.452 Trimmed(5), NN(5) 0.111 -0.152 ROA Matching 0.022 -0.000 0.022 0.007 0.014 Trimmed(2), NN(2) -0017 0.038 Trimmed(5), NN(5) -0.015 0.037 Leverage Matching -0.015 -0.006 -0.008 -0.048 0.033 Trimmed(2), NN(2) -0.025 0.011 Trimmed(5), NN(5) -0.011 -0.004
28
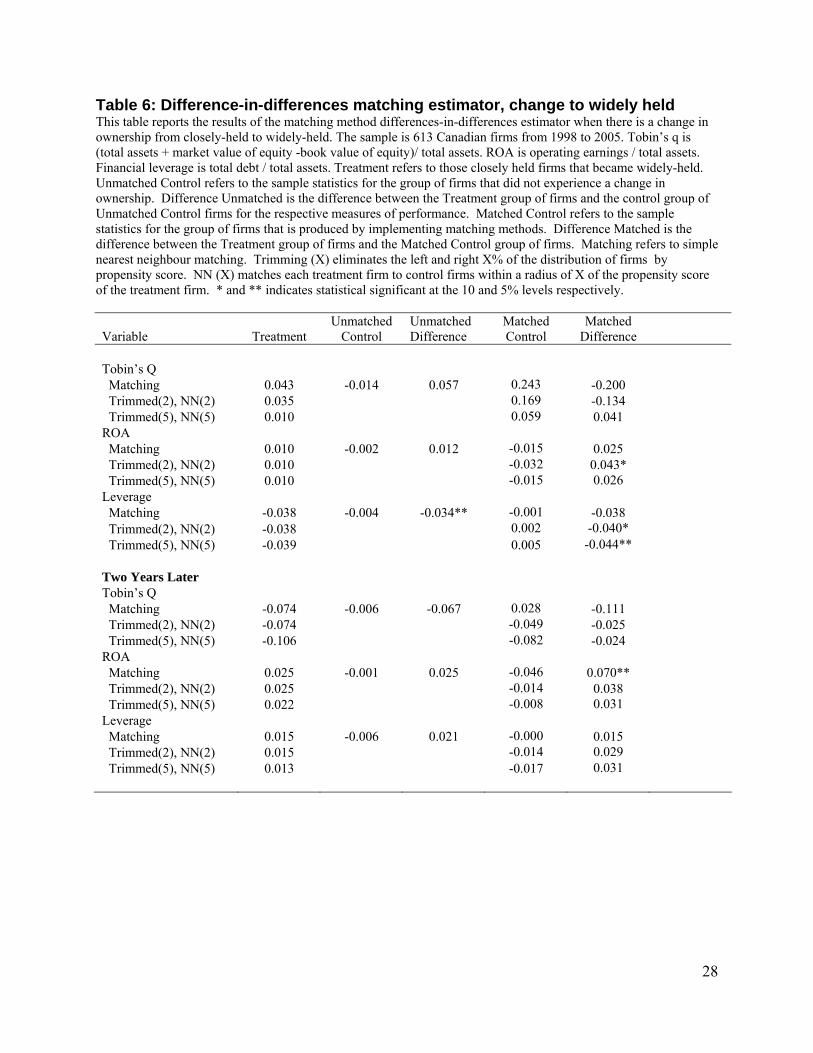
Table 6: Difference-in-differences matching estimator, change to widely held This table reports the results of the matching method differences-in-differences estimator when there is a change in ownership from closely-held to widely-held. The sample is 613 Canadian firms from 1998 to 2005. Tobin’s q is (total assets + market value of equity -book value of equity)/ total assets. ROA is operating earnings / total assets. Financial leverage is total debt / total assets. Treatment refers to those closely held firms that became widely-held. Unmatched Control refers to the sample statistics for the group of firms that did not experience a change in ownership. Difference Unmatched is the difference between the Treatment group of firms and the control group of Unmatched Control firms for the respective measures of performance. Matched Control refers to the sample statistics for the group of firms that is produced by implementing matching methods. Difference Matched is the difference between the Treatment group of firms and the Matched Control group of firms. Matching refers to simple nearest neighbour matching. Trimming (X) eliminates the left and right X% of the distribution of firms by propensity score. NN (X) matches each treatment firm to control firms within a radius of X of the propensity score of the treatment firm. * and ** indicates statistical significant at the 10 and 5% levels respectively.
Variable Treatment Unmatched
Control Unmatched Difference
Matched Control
Matched Difference
Tobin’s Q Matching 0.043 -0.014 0.057 0.243 -0.200 Trimmed(2), NN(2) 0.035 0.169 -0.134 Trimmed(5), NN(5) 0.010 0.059 0.041 ROA Matching 0.010 -0.002 0.012 -0.015 0.025 Trimmed(2), NN(2) 0.010 -0.032 0.043* Trimmed(5), NN(5) 0.010 -0.015 0.026 Leverage Matching -0.038 -0.004 -0.034** -0.001 -0.038 Trimmed(2), NN(2) -0.038 0.002 -0.040* Trimmed(5), NN(5) -0.039 0.005 -0.044** Two Years Later Tobin’s Q Matching -0.074 -0.006 -0.067 0.028 -0.111 Trimmed(2), NN(2) -0.074 -0.049 -0.025 Trimmed(5), NN(5) -0.106 -0.082 -0.024 ROA Matching 0.025 -0.001 0.025 -0.046 0.070** Trimmed(2), NN(2) 0.025 -0.014 0.038 Trimmed(5), NN(5) 0.022 -0.008 0.031 Leverage Matching 0.015 -0.006 0.021 -0.000 0.015 Trimmed(2), NN(2) 0.015 -0.014 0.029 Trimmed(5), NN(5) 0.013 -0.017 0.031
29
Figure 1: Distribution of 99 Changes in Control from 1998-2005
20%
18%62%
Canadian Owner Aquirer Foreign Owner AquirerForeign or Canadian Owner to Widely Held
Distribution by Changes in Owner Nationality
30
Figure 2: Average and cumulative average abnormal returns for changes in control, 1998-2005 - Canadian takeovers
-0.0
50.
050.
150.
25A
AR
and
CA
AR
-50 -40 -30 -20 -10 0 10 20Days relative to ownership change
Avg abnormal return Cumulative avg abnormal return
Figure 3: Average and cumulative average abnormal returns for changes in control, 1998-2005 - Foreign takeovers
-0.0
50.
050.
150.
25A
AR
and
CA
AR
-50 -40 -30 -20 -10 0 10 20Days relative to ownership change
Avg abnormal return Cumulative avg abnormal return
31
Figure 4: Average and cumulative average abnormal returns for changes in control, 1998-2005 - Controlled to Widely Held
-0.0
50.
050.
150.
25A
AR
and
CA
AR
-50 -40 -30 -20 -10 0 10 20Days relative to ownership change
Avg abnormal return Cumulative avg abnormal return