Embed Size (px)
Citation preview
Trading in India
The Status Quo
Anshuman JaswalSenior Analyst, Celent
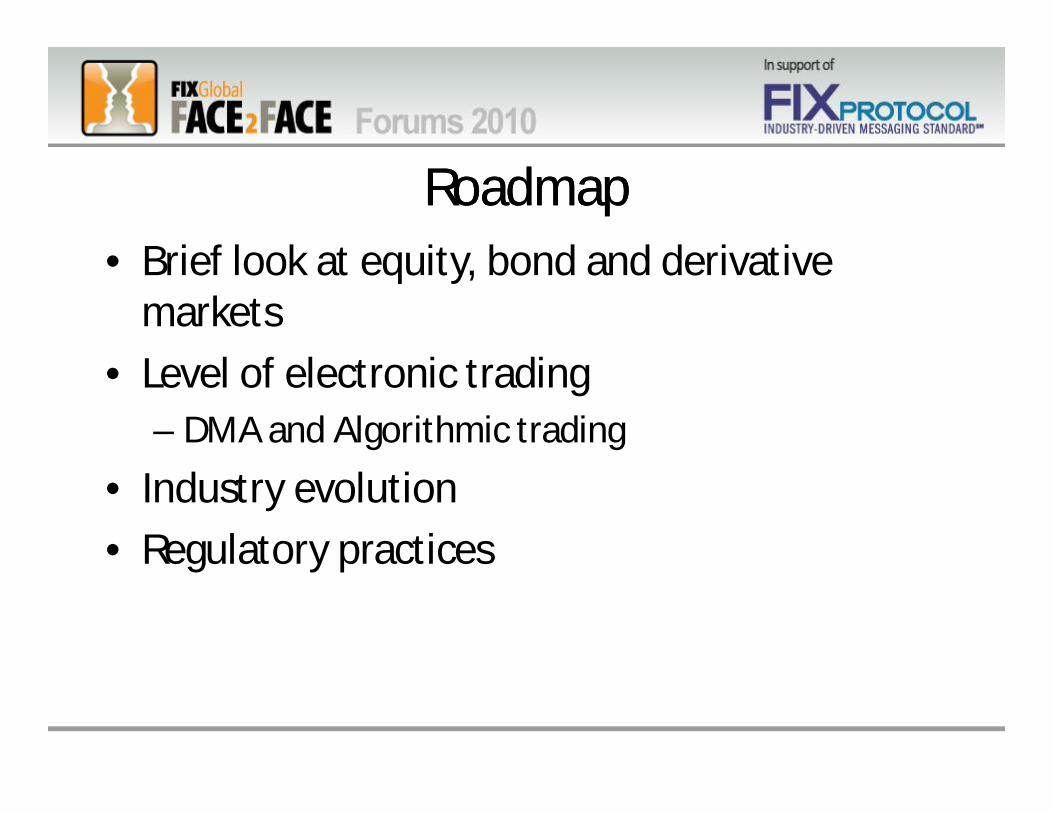
RoadmapRoadmap• Brief look at equity, bond and derivative
markets
• Level of electronic trading– DMA and Algorithmic trading
• Industry evolution
• Regulatory practices
Market OverviewMarket Overview
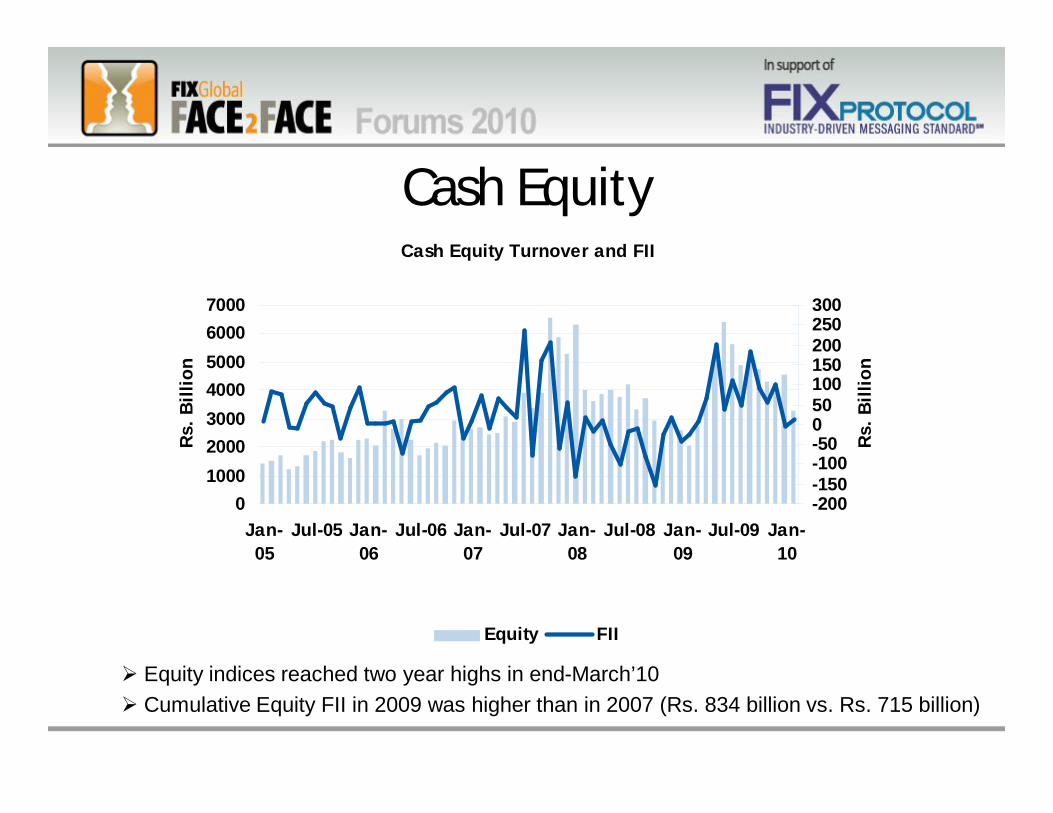
Cash Equity Turnover and FII
01000200030004000500060007000
Jan-05
Jul-05 Jan-06
Jul-06 Jan-07
Jul-07 Jan-08
Jul-08 Jan-09
Jul-09 Jan-10
Rs. B
illio
n
-200-150-100-50050100150200250300
Rs. B
illio
n
Equity FII
Equity indices reached two year highs in end-March’10 Cumulative Equity FII in 2009 was higher than in 2007 (Rs. 834 billion vs. Rs. 715 billion)
Cash Equity
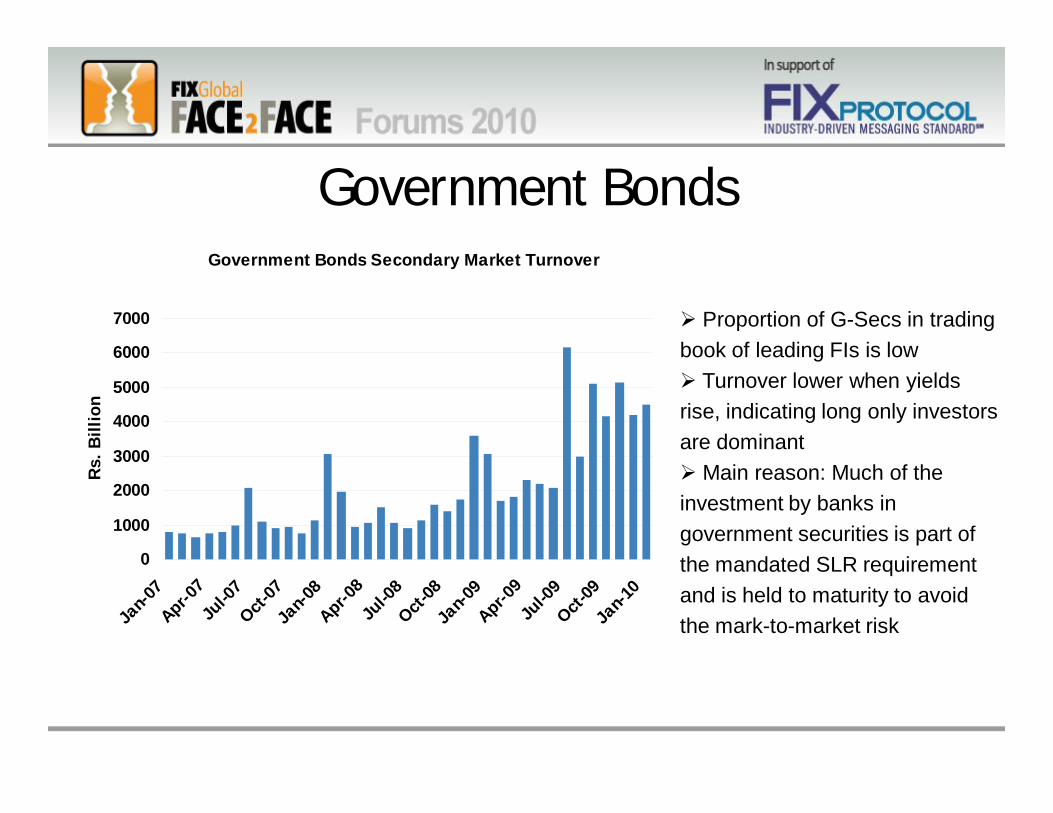
Government BondsGovernment Bonds Secondary Market Turnover
0
1000
2000
3000
4000
5000
6000
7000
Jan-0
7Apr-0
7Ju
l-07
Oct-07
Jan-0
8Apr-0
8Ju
l-08
Oct-08
Jan-0
9Apr-0
9Ju
l-09
Oct-09
Jan-1
0
Rs.
Bill
ion
Proportion of G-Secs in trading book of leading FIs is low Turnover lower when yields rise, indicating long only investors are dominant Main reason: Much of the investment by banks in government securities is part of the mandated SLR requirement and is held to maturity to avoid the mark-to-market risk
Corporate Bonds
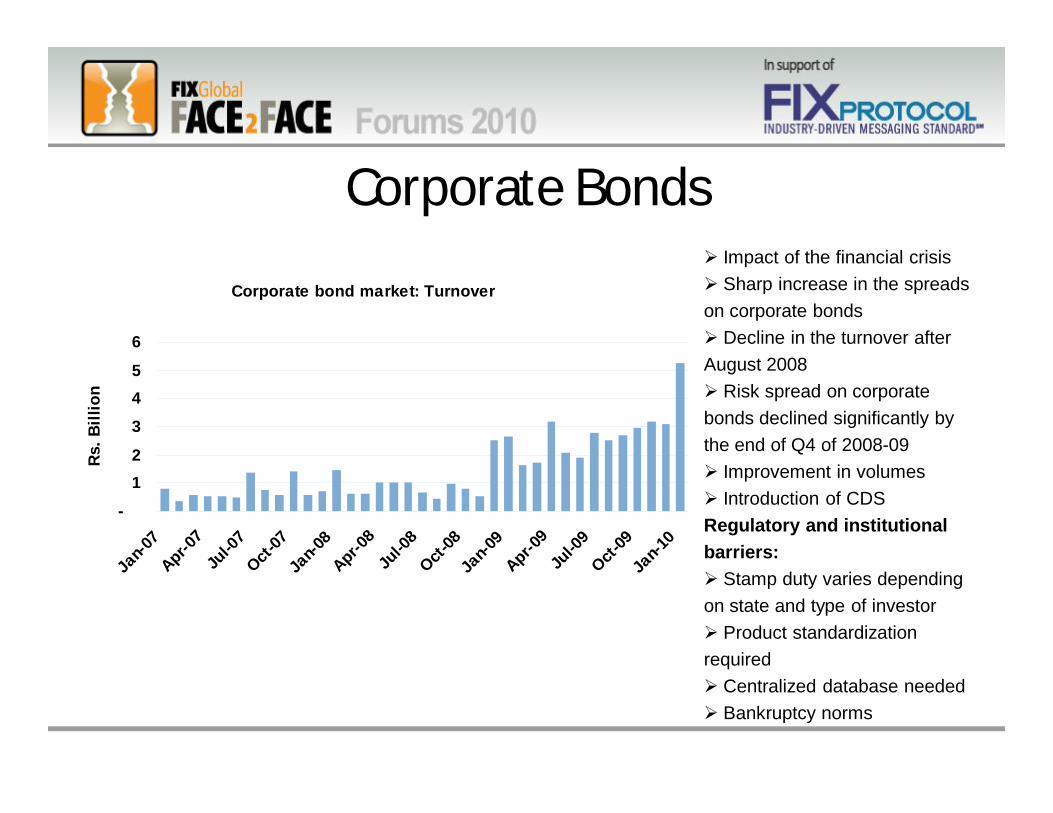
Corporate bond market: Turnover
-
12
3
45
6
Jan-0
7
Apr-07
Jul-0
7
Oct-07
Jan-0
8
Apr-08
Jul-0
8
Oct-08
Jan-0
9
Apr-09
Jul-0
9
Oct-09
Jan-1
0
Rs. B
illio
n
Impact of the financial crisis Sharp increase in the spreads on corporate bonds Decline in the turnover after August 2008 Risk spread on corporate bonds declined significantly by the end of Q4 of 2008-09 Improvement in volumes Introduction of CDSRegulatory and institutional barriers: Stamp duty varies depending on state and type of investor Product standardization required Centralized database needed Bankruptcy norms
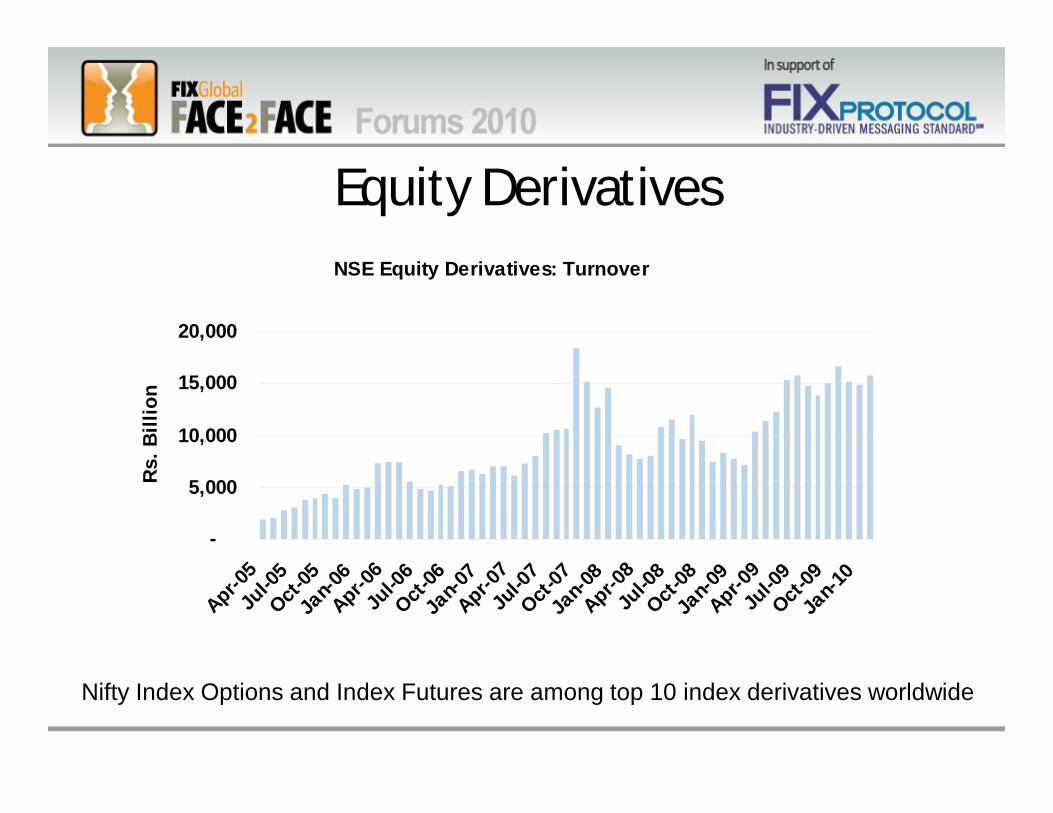
Equity DerivativesNSE Equity Derivatives: Turnover
-
5,000
10,000
15,000
20,000
Apr-05
Jul-0
5Oct-
05Ja
n-06
Apr-06
Jul-0
6Oct-
06Ja
n-07
Apr-07
Jul-0
7Oct-
07Ja
n-08
Apr-08
Jul-0
8Oct-
08Ja
n-09
Apr-09
Jul-0
9Oct-
09Ja
n-10
Rs.
Bill
ion
Nifty Index Options and Index Futures are among top 10 index derivatives worldwide
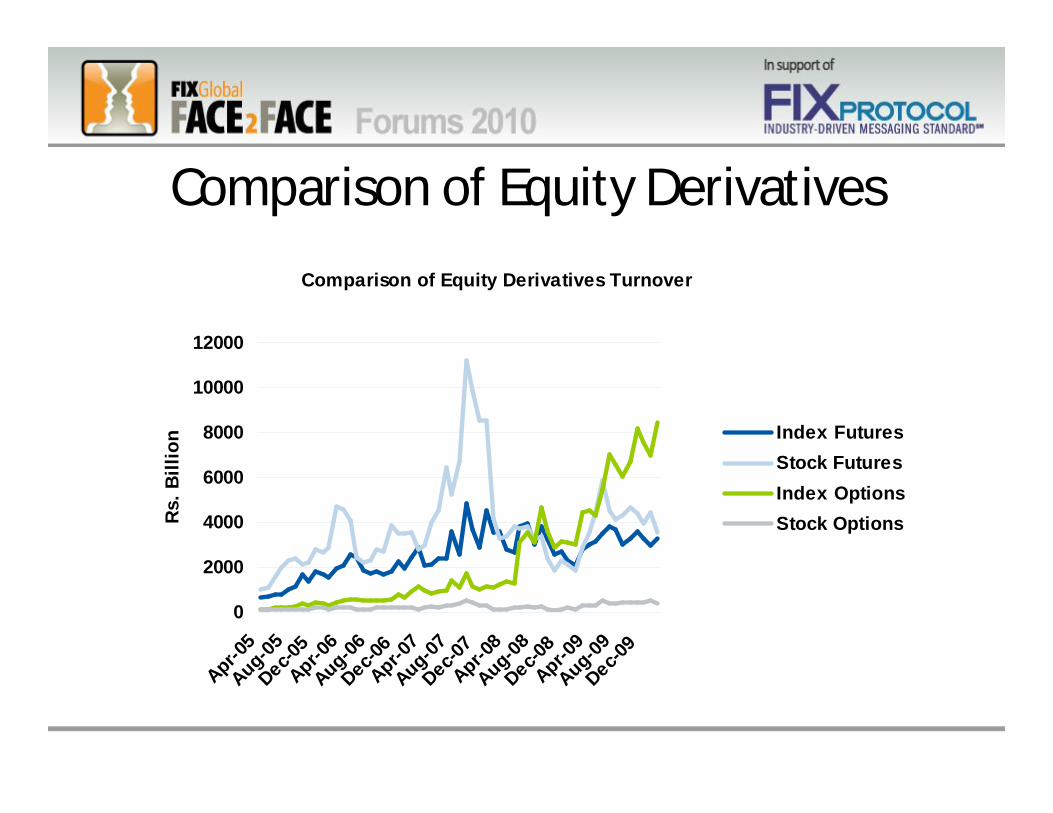
Comparison of Equity Derivatives
Comparison of Equity Derivatives Turnover
0
2000
4000
6000
8000
10000
12000
Apr-05
Aug-05Dec-0
5Apr-0
6Aug-06Dec-0
6Apr-0
7Aug-07Dec-0
7Apr-0
8Aug-08Dec-0
8Apr-0
9Aug-09Dec-0
9
Rs.
Bill
ion Index Futures
Stock FuturesIndex OptionsStock Options
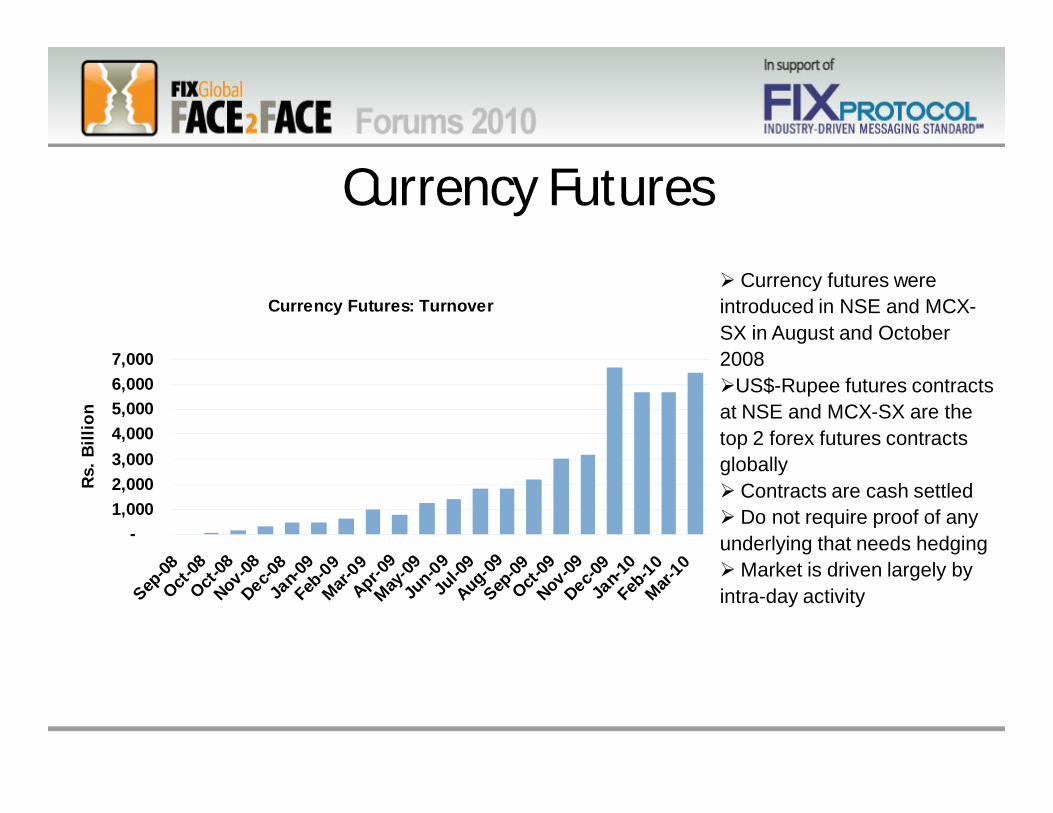
Currency Futures
Currency Futures: Turnover
-1,0002,0003,0004,0005,0006,0007,000
Sep-08
Oct-08
Oct-08
Nov-08
Dec-08
Jan-0
9
Feb-09
Mar-09
Apr-09
May-09
Jun-09
Jul-0
9
Aug-09
Sep-09
Oct-09
Nov-09
Dec-09
Jan-1
0
Feb-10
Mar-10
Rs.
Bill
ion
Currency futures were introduced in NSE and MCX-SX in August and October 2008 US$-Rupee futures contracts at NSE and MCX-SX are the top 2 forex futures contracts globally Contracts are cash settled Do not require proof of any underlying that needs hedgingMarket is driven largely by intra-day activity
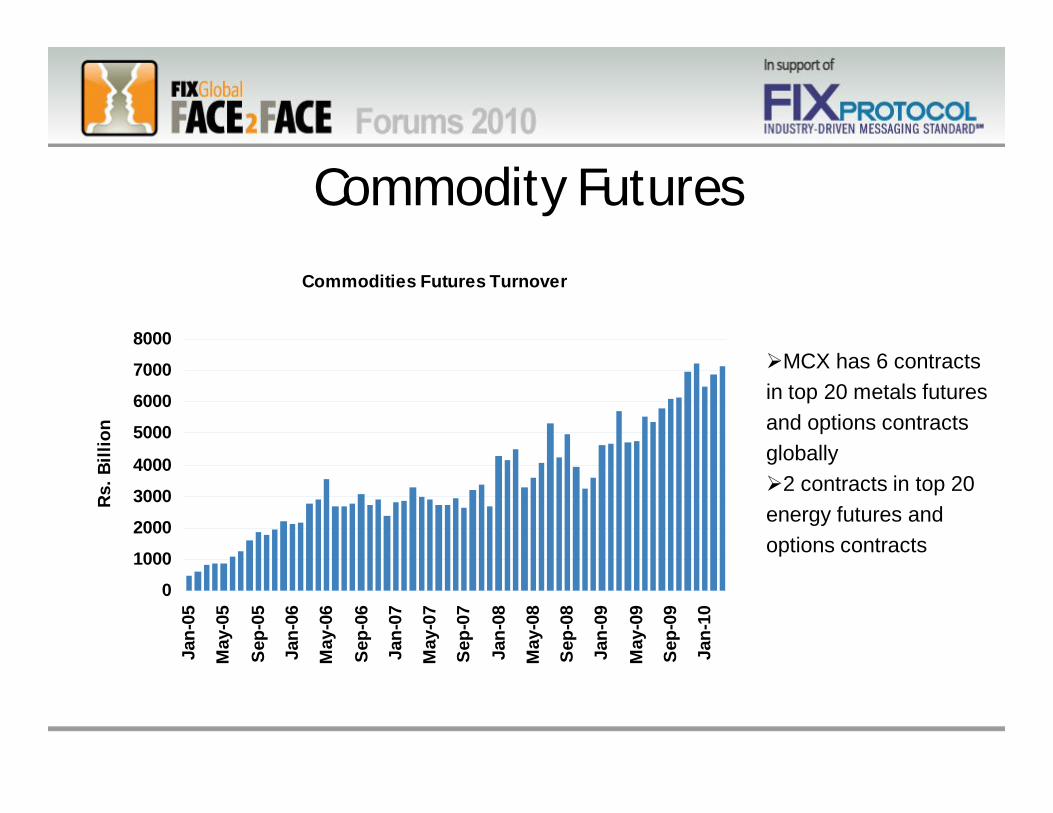
Commodity Futures
Commodities Futures Turnover
0
1000
2000
3000
4000
5000
6000
7000
8000
Jan-
05
May
-05
Sep-
05
Jan-
06
May
-06
Sep-
06
Jan-
07
May
-07
Sep-
07
Jan-
08
May
-08
Sep-
08
Jan-
09
May
-09
Sep-
09
Jan-
10
Rs.
Bill
ion
MCX has 6 contracts in top 20 metals futures and options contracts globally2 contracts in top 20 energy futures and options contracts
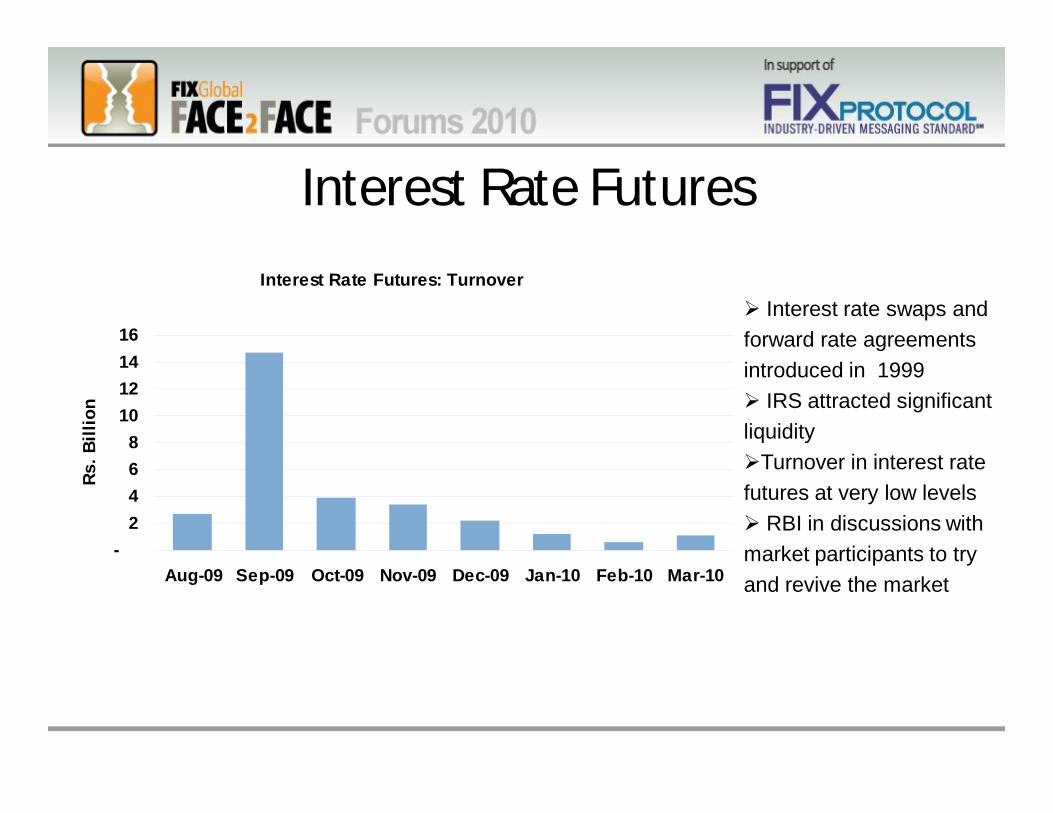
Interest Rate Futures
Interest Rate Futures: Turnover
-2468
10121416
Aug-09 Sep-09 Oct-09 Nov-09 Dec-09 Jan-10 Feb-10 Mar-10
Rs. B
illio
n
Interest rate swaps and forward rate agreements introduced in 1999 IRS attracted significant liquidityTurnover in interest rate futures at very low levels RBI in discussions with market participants to try and revive the market
Electronic TradingElectronic Trading
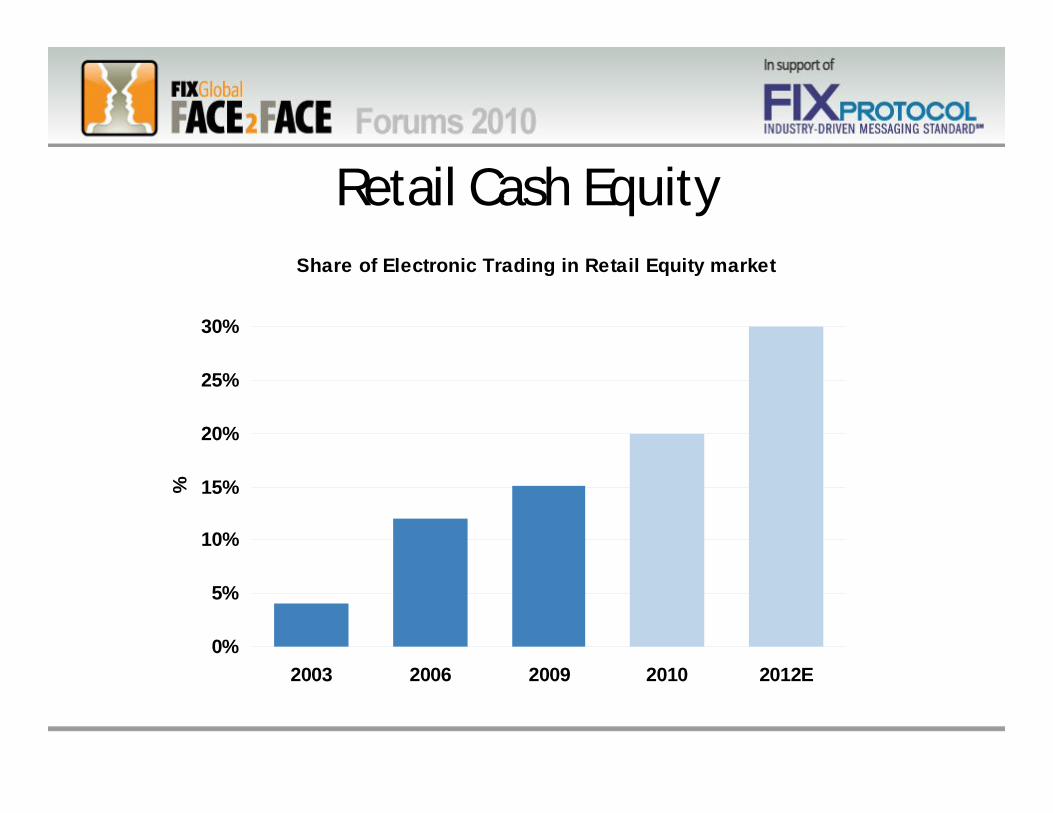
Retail Cash EquityShare of Electronic Trading in Retail Equity market
0%
5%
10%
15%
20%
25%
30%
2003 2006 2009 2010 2012E
%
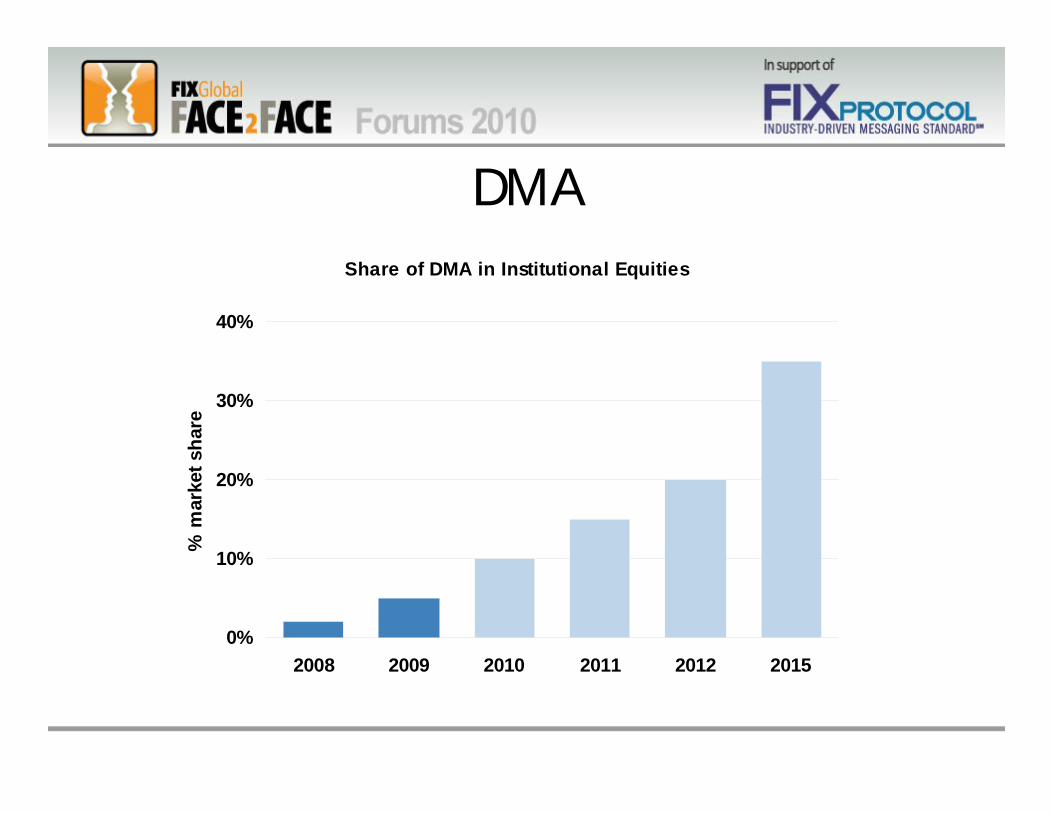
DMAShare of DMA in Institutional Equities
0%
10%
20%
30%
40%
2008 2009 2010 2011 2012 2015
% m
arke
t sha
re
Main IssuesMain Issues
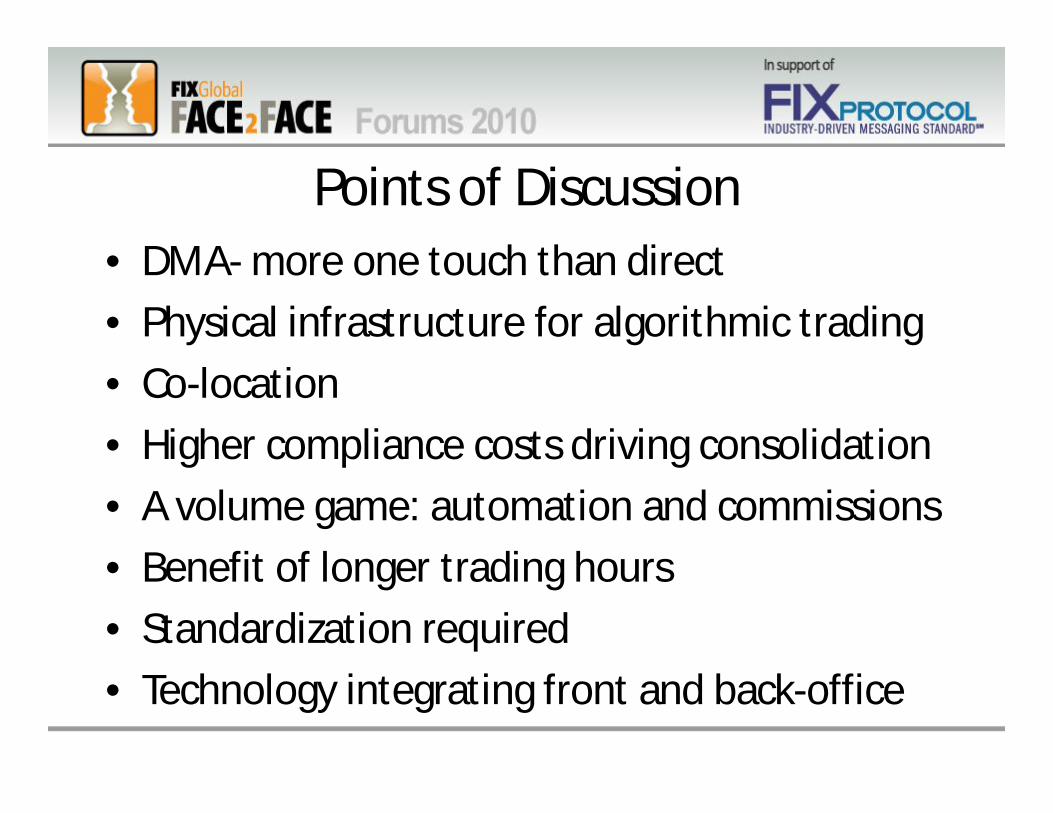
Points of Discussion• DMA- more one touch than direct
• Physical infrastructure for algorithmic trading
• Co-location
• Higher compliance costs driving consolidation
• A volume game: automation and commissions
• Benefit of longer trading hours
• Standardization required
• Technology integrating front and back-office
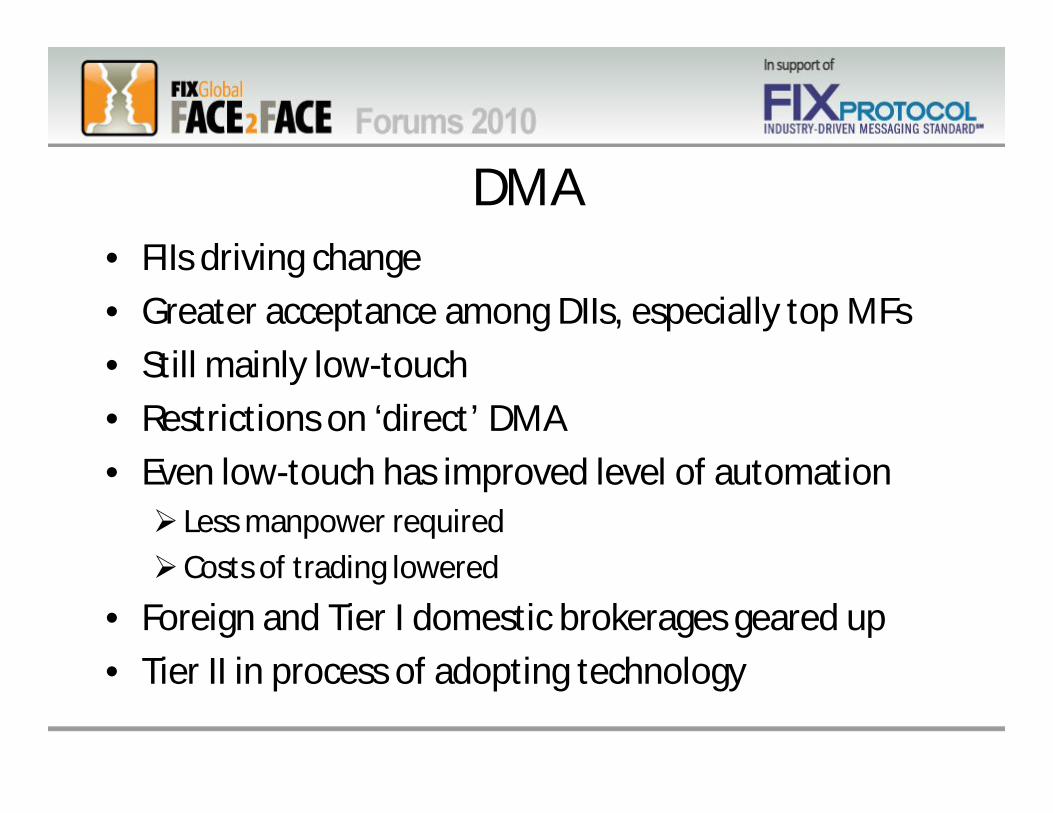
DMA• FIIs driving change
• Greater acceptance among DIIs, especially top MFs
• Still mainly low-touch
• Restrictions on ‘direct’ DMA
• Even low-touch has improved level of automation Less manpower required
Costs of trading lowered
• Foreign and Tier I domestic brokerages geared up
• Tier II in process of adopting technology
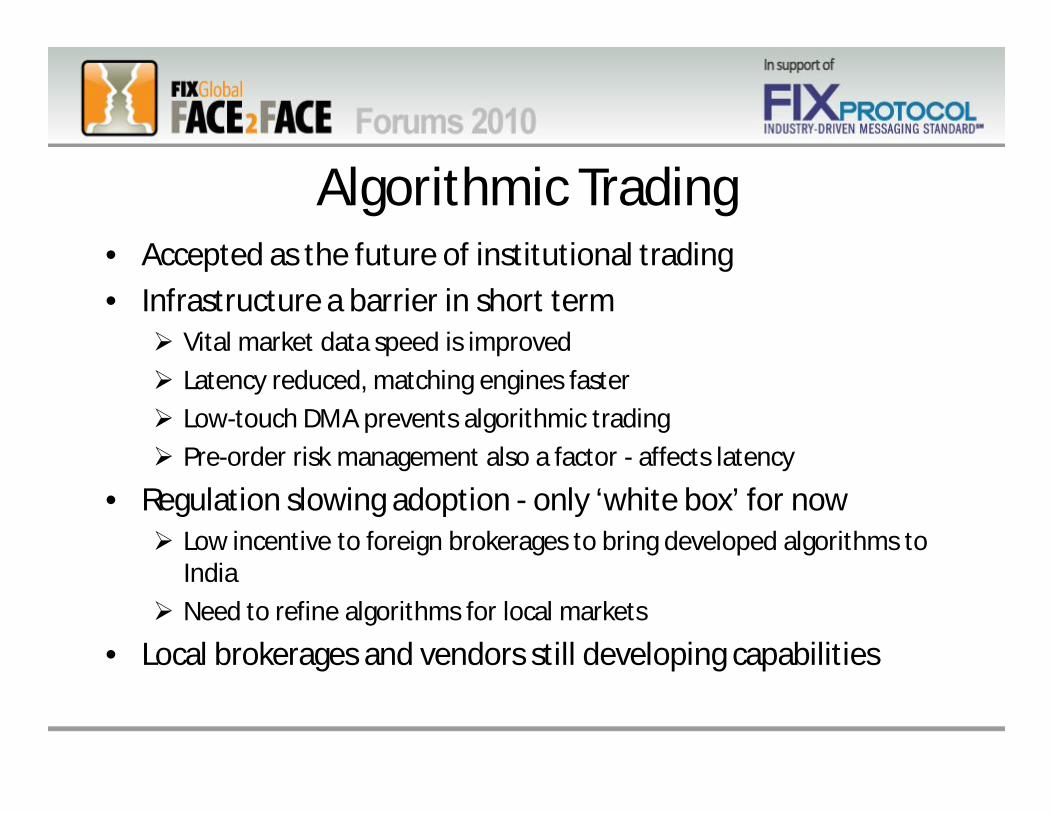
Algorithmic Trading• Accepted as the future of institutional trading
• Infrastructure a barrier in short term Vital market data speed is improved
Latency reduced, matching engines faster
Low-touch DMA prevents algorithmic trading
Pre-order risk management also a factor - affects latency
• Regulation slowing adoption - only ‘white box’ for now Low incentive to foreign brokerages to bring developed algorithms to
India
Need to refine algorithms for local markets
• Local brokerages and vendors still developing capabilities
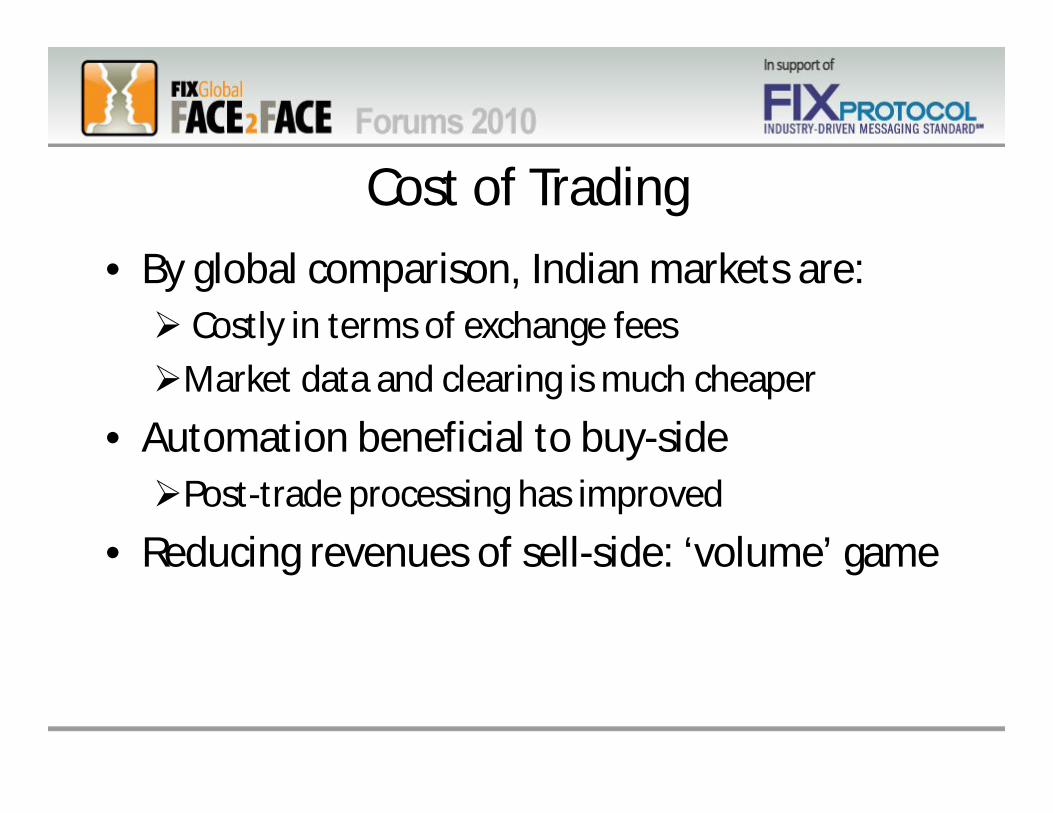
Cost of Trading
• By global comparison, Indian markets are: Costly in terms of exchange fees
Market data and clearing is much cheaper
• Automation beneficial to buy-sidePost-trade processing has improved
• Reducing revenues of sell-side: ‘volume’ game
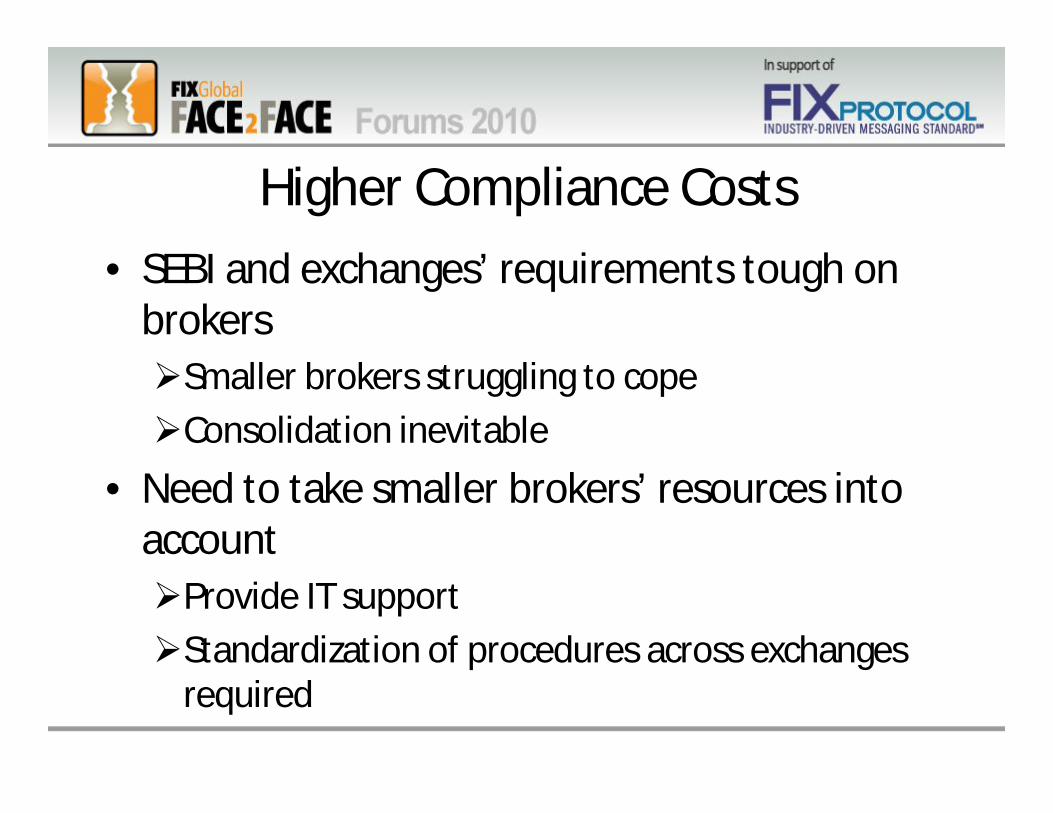
Higher Compliance Costs
• SEBI and exchanges’ requirements tough on brokersSmaller brokers struggling to cope
Consolidation inevitable
• Need to take smaller brokers’ resources into accountProvide IT support
Standardization of procedures across exchanges required
Co-location
• International standard
• India late adopter
• Overall latency needs to be reduced for co-location to be meaningful
Longer Trading Hours
• Benefits still not conclusiveFurther extension expected
Greater pressure on post-trade processing
Smaller players will find it difficult to bear costs
Where does it end? Need for debate
Importance of Standardization
• Number of exchanges risingEach with own certification impacting costsStandardization required going forward
More cooperation between exchanges - finding common ground
Technology
• Front and back-office working together in real-timeAdvantageous for IT vendors which cater to both
front and back-office
• Global and local systems also closer
Clearing Houses• Clearing houses like ‘silos’Need to cover multiple assets across exchanges
Wider coverage will drive innovation and reduce costs
Block Deals• High market impact Operationally difficult to execute for institutional
investors
Dark pools beneficial but not probable
Regulator needs to address issue
Relationships Still Matter
• Domestic institutional brokerages recruited from foreign counterparts to increase market-share
• Reverse flow also seen
• Expected to continue as a factor despite automation
Regulatory Overlaps• Securities and Exchange Board of India is the main
capital market regulator• Overlap of its domain with:
– Insurance regulator, IRDA (e.g., unit linked insurance plans)– Central bank, RBI (e.g., FII limits, currency and interest rate futures,
investment banks)– Provident fund regulator, PFRDA (e.g., NSDL)– FMC (commodity markets)
• High Level Coordination Committee (HLCC) on capital markets not deemed successful
• Financial Stability and Development Council (FSDC)