Embed Size (px)
Citation preview
1 Structural Issues Concerning Algorithm Trading in India
IndexSr No
Topic Page Number
1 Introduction to Algorithm Trading 2 2 High Frequency Trading 9 3 Algorithm Trading Vs High Frequency Trading 11 4 Algorithm Trading in Asia‐Pacific 12 5 Evolution of Electronic Trading in India 14 6 Smart Order Routing, DMA and Colocation 15 7 Current infrastructure in India 18 8 Current Trade Structure in US & India 20 9 HFT and its impact on Market Quality 23 9.1 Data Sample 23 9.2 HFT activity in US 24 9.3 Do HFTs flee in volatile markets? 25 9.4 Do HFTs contribute to Price Discovery Process? 27 9.5 What role HFT plays in providing market liquidity? 28
9.6 Do HFT generate or dampen volatility? 31 10 Possible Manipulations Using HFT/Algorithmic Trading 33
11 Current Risk Management framework in India 39 12 Algo approval, registration and risk management framework 43
13 Concerns 45 14 Recommendations 49 15 Conclusion 54
AnnexureSr No
Topic Page Number
1 Risk management criteria’s for approval of DMA facility at NSE 55 2 Procedure for granting permission to Trading Member for Algorithm
Trading 57
3 Current Risk Management framework in India 58
4 Algorithmic and High Frequency Strategies 66
5 Execution strategies 70

2 Structural Issues Concerning Algorithm Trading in India
Chapter 1
Introduction to Algorithm Trading
Definition of algorithm trading Algorithm trading refers to automated trading based on algorithm. The purpose of using automatic trading is to analyze price and market conditions in order to trade at the minimum cost based on the relevant algorithm method.
Algorithmic Trading can be defined as the use of computer programs for entering trading orders where the computer algorithm decides on aspects of the trade execution such as the timing, price, or quantity of the order. Algorithm Trading is also known as automated trading, algo trading, black‐box trading or robo trading. Algorithms dynamically monitor market conditions across different securities and trading venues to make the trade execution decision. Algorithmic trading (AT) is more complex than electronic trading and it encompasses many form of computer‐aided trading including High Frequency Trading.
Algorithmic Trading is widely used by pension funds, mutual funds, and other buy side (investor driven) institutional traders, to divide large trades into several smaller trades in order to manage market impact, and risk. In fact, algorithms were originally developed for use by the buy‐side to manage orders and to reduce market impact by optimising trade execution once the buy‐and sell decisions had been made elsewhere. Sell side traders, such as market makers and some hedge funds, provide liquidity to the market by generating and executing orders automatically with the help of algorithms.
Algorithm trading focuses on minimizing the market impact by splitting trades. Algorithm trading was originally developed as an order placement system for the purpose of minimizing trading cost, but it is now being used as an overall term to describe its strategy and process.

3 Structural Issues Concerning Algorithm Trading in India
Types of Algorithm Trading
Algorithm Trading is broadly categorised into High frequency trading, Basket Trading, Multi Exchange trading and Situational Algorithm Trading category. Basket Trading (Program trading) is generally used for stock basket trading. Multi‐exchange trading is trading a product across different exchanges using computer algorithm. Multi exchange trading is facilitated by Smart Order Routing algorithms.
Smart order routing is a technique of using the close correlation of major exchanges and cross‐listing of a company—i.e., placing orders on an exchange where the most favourable conditions are seen. In India, SEBI allowed use of Smart Order routing in August 2010 and currently it is operational in both Capital Market as well as Currency Derivative Segment.
Flash Trading refers to practice in US to flash orders for few seconds to select members before submitting it to order matching platform. Situational algorithm trading category hereafter referred as Algorithm Trading / Algorithmic Trading/AT interchangeably, refers to any and all kind of computer aided trading which does not fall under first three categories. Situational algorithm determines what to trade, when to trade and how to trade
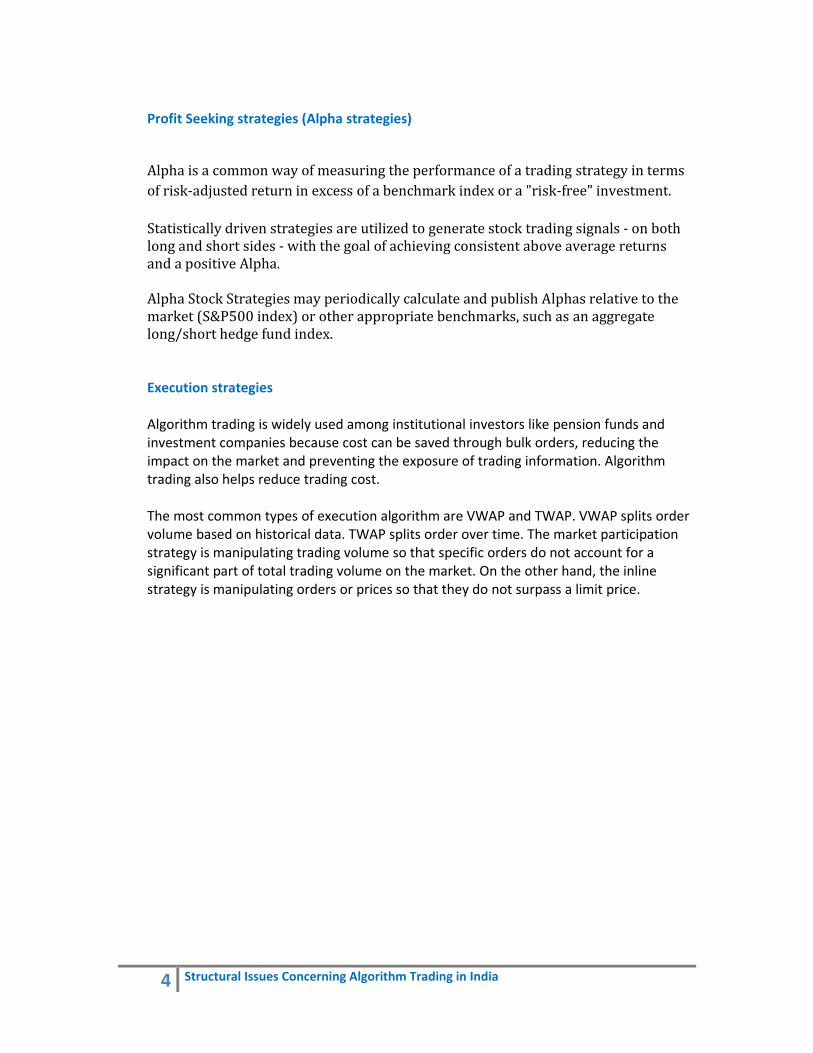
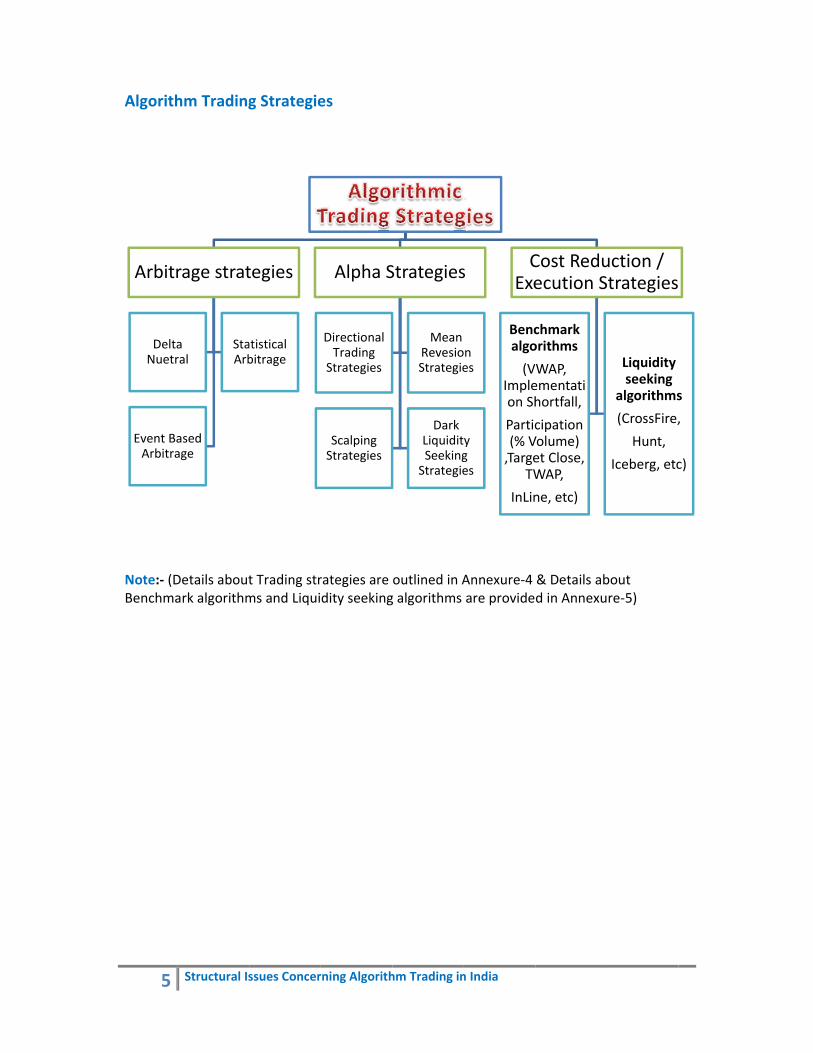
Strategies or algorithms used by the computer to automate (enter, modify or cancel) trade orders are called algorithmic trading strategies and they are broadly classified as execution strategies, profit seeking strategies (Alpha strategies) and arbitrage strategies.
Arbitrage strategies
The simultaneous purchase and sale of an asset in order to profit from a difference in the price. It is a trade that profits by exploiting price differences of identical or similar financial instruments, on different markets or in different forms. Arbitrage exists as a result of market inefficiencies; it provides a mechanism to ensure prices do not deviate substantially from fair value for long periods of time.
Algorithm Trading
High Frequency Trading
Basket Trading (Programm Trading)
MultiExchange Trading
(Trading using SOR)
Flash TradingSituational Algorithmic Trading
4 Structural Issues Concerning Algorithm Trading in India
Profit Seeking strategies (Alpha strategies)
Alpha is a common way of measuring the performance of a trading strategy in terms of risk‐adjusted return in excess of a benchmark index or a "risk‐free" investment.
Statistically driven strategies are utilized to generate stock trading signals ‐ on both long and short sides ‐ with the goal of achieving consistent above average returns and a positive Alpha.
Alpha Stock Strategies may periodically calculate and publish Alphas relative to the market (S&P500 index) or other appropriate benchmarks, such as an aggregate long/short hedge fund index.
Execution strategies
Algorithm trading is widely used among institutional investors like pension funds and investment companies because cost can be saved through bulk orders, reducing the impact on the market and preventing the exposure of trading information. Algorithm trading also helps reduce trading cost. The most common types of execution algorithm are VWAP and TWAP. VWAP splits order volume based on historical data. TWAP splits order over time. The market participation strategy is manipulating trading volume so that specific orders do not account for a significant part of total trading volume on the market. On the other hand, the inline strategy is manipulating orders or prices so that they do not surpass a limit price.
5
Algorith
Note:‐ (DBenchma
Arbitr
DeltaNuetr
Event BaArbitra
Structural Is
hm Trading
Details aboutark algorithm
rage strat
a ral
StaArb
ased age
ssues Concer
g Strategie
t Trading strms and Liqui
tegies
atistical bitrage
rning Algorith
es
rategies are dity seeking
Alpha S
Directional Trading Strategies
Scalping Strategies
hm Trading in
outlined in Ag algorithms
Strategies
Mean RevesioStrategie
Dark LiquiditSeekingStrategie
n India
Annexure‐4are provide
s
n es
y g es
CExe
Bencalgo
(VImpleon Sh
Partic(% V,Targe
TW
InLin
& Details abd in Annexu
Cost Reduecution S
chmark orithms
WAP, ementatihortfall,
cipation Volume) et Close, WAP,
ne, etc)
bout re‐5)
uction / Strategies
Liquidity seeking
algorithms
(CrossFire,
Hunt,
Iceberg, etc
s
,
c)

6 Structural Issues Concerning Algorithm Trading in India
Reasons for using algorithms in trading
In a survey conducted by TRADE group, 22% participants said they prefer algo trading because it provides them anonymity of trade avoiding leakage of information which possibly may lead to front running. 20% said cost reduction in trade execution is the main purpose why they use algo trading. 14% participants said, algo trading allows their trader to focus on trading strategy than trading execution, so that trades productivity could be increased. 13% prefer algo as it reduces market impact. 11% people like algo because of its speed of computation and execution. 7% prefer algos because it is easy to use and 4% prefer it due to customisation features offered by algos.
7 Structural Issues Concerning Algorithm Trading in India
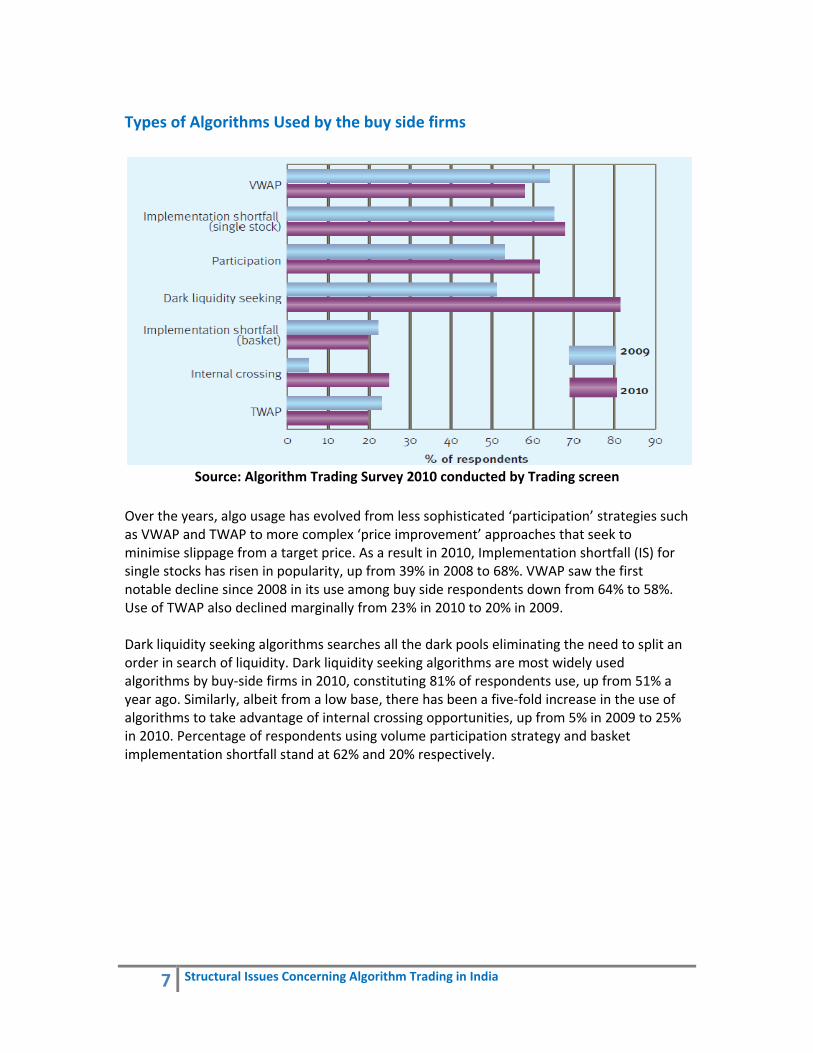
Types of Algorithms Used by the buy side firms
Source: Algorithm Trading Survey 2010 conducted by Trading screen
Over the years, algo usage has evolved from less sophisticated ‘participation’ strategies such as VWAP and TWAP to more complex ‘price improvement’ approaches that seek to minimise slippage from a target price. As a result in 2010, Implementation shortfall (IS) for single stocks has risen in popularity, up from 39% in 2008 to 68%. VWAP saw the first notable decline since 2008 in its use among buy side respondents down from 64% to 58%. Use of TWAP also declined marginally from 23% in 2010 to 20% in 2009. Dark liquidity seeking algorithms searches all the dark pools eliminating the need to split an order in search of liquidity. Dark liquidity seeking algorithms are most widely used algorithms by buy‐side firms in 2010, constituting 81% of respondents use, up from 51% a year ago. Similarly, albeit from a low base, there has been a five‐fold increase in the use of algorithms to take advantage of internal crossing opportunities, up from 5% in 2009 to 25% in 2010. Percentage of respondents using volume participation strategy and basket implementation shortfall stand at 62% and 20% respectively.
8 Structural Issues Concerning Algorithm Trading in India
HFTs (Market Makers/ Liquidity Providers/Sell Side firms)
Non HFTs (Investors/Buy Side firms)
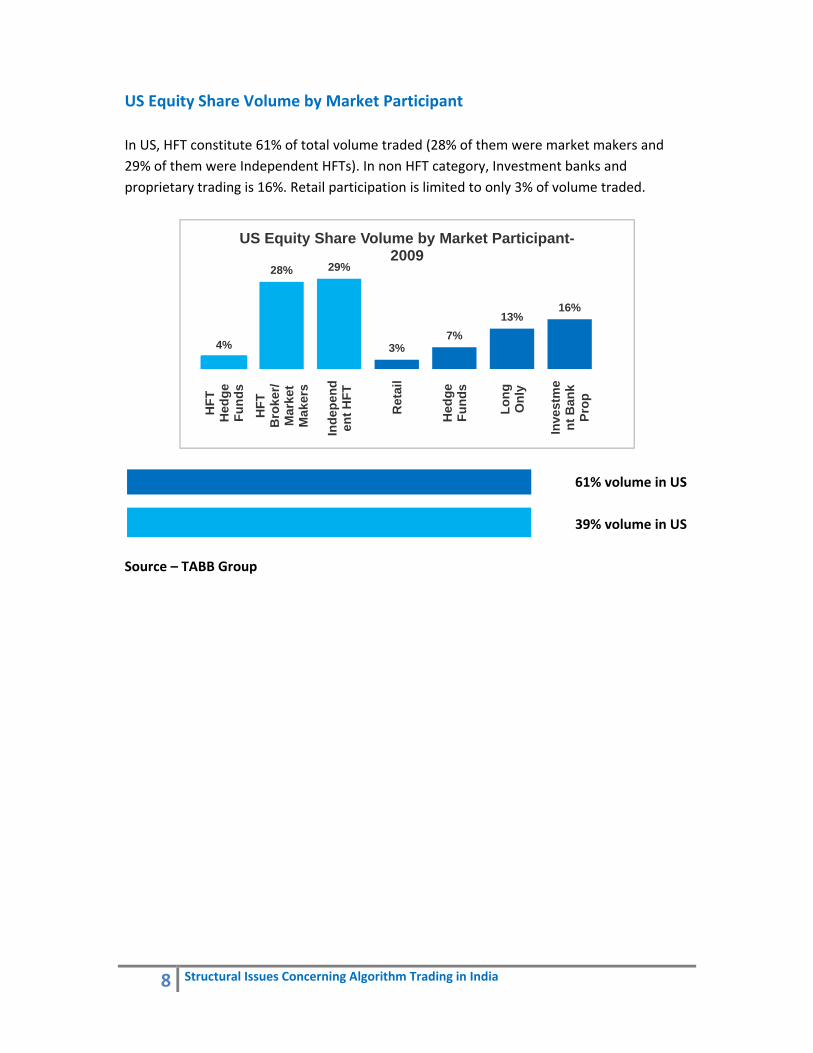
US Equity Share Volume by Market Participant In US, HFT constitute 61% of total volume traded (28% of them were market makers and 29% of them were Independent HFTs). In non HFT category, Investment banks and proprietary trading is 16%. Retail participation is limited to only 3% of volume traded.
61% volume in US
39% volume in US
Source – TABB Group
4%
28% 29%
3%7%
13%16%
HFT
H
edge
Fu
nds
HFT
B
roke
r/ M
arke
t M
aker
s
Inde
pend
ent H
FT
Ret
ail
Hed
ge
Fund
s
Long
O
nly
Inve
stm
ent
Ban
k Pr
op
US Equity Share Volume by Market Participant-2009

9 Structural Issues Concerning Algorithm Trading in India
Chapter 2
High Frequency Trading
High‐frequency trading (HFT) is a subset of algorithmic trading where a large number of orders (which are usually fairly small in size) are sent into the market at high speed, with round‐trip execution times measured in microseconds. Programs running on high‐speed computers analyse massive amounts of market data, using sophisticated algorithms to exploit trading opportunities that may open up for milliseconds or seconds. Participants are constantly taking advantage of very small price imbalances; by doing that at a high rate of recurrence, they are able to generate sizeable profits. Typically, a high frequency trader would not hold a position open for more than a few seconds. Empirical evidence reveals that the average U.S. stock is held for 22 seconds.
TABB group, a financial services industry research firm, estimates that HFT now accounts for 56% of turnover in USA and 38 % turnover in Europe in the equity segment.
What are Buy‐side firms and Sell‐side firms?
Buy‐side firms refer to institutions concerned with buying, rather than selling, assets or securities. Private equity funds, mutual funds, unit trusts, hedge funds, pension funds, and proprietary trading desks are the most common types of buy side entities.
Buy side firms usually take speculative positions or make relative value trades. Buy side firms participate in a smaller number of overall transactions, and aim to profit from market movements.

10 Structural Issues Concerning Algorithm Trading in India
Sell‐side firms refers to institutions that take orders from buy side firms and then "work" the orders by slicing then into small orders. Brokerage firms and Market making firms are most common examples of sell‐side firms.
Sell side brokerages are registered members of a stock exchange, and sometimes they are required to be market makers in a given security.
Sell side firms profit from Commission (brokerage), advisory fee charged to buy side firm and the bid‐offer spread.
Widely used high frequency trading strategies

11 Structural Issues Concerning Algorithm Trading in India
Chapter 3
Algorithm Trading Vs High Frequency Trading
Algorithmic Trading High Frequency Trading
AT is the use of computer programs for entering trading orders with the computer algorithm deciding on aspects of the order such as the timing, price, or quantity of the order
HFT is highly quantitative, employing computerized algorithms to analyze incoming market data and implement proprietary trading strategies
Algorithmic Trading is computer aided but not necessarily High frequency or low latency trading
HFT is part of Algorithmic Trading
Accounts for 70% volume traded in US equity in 2010. Non‐High frequency Algorithmic Trading is only 14% in US.
Accounts for 56% volume traded in US Equity in 2010.
AT firms holding period depends on strategy they employ. They may hold positions for few minutes or for few years or they might never sell it. Typically average holding period is long.
HFT usually implies a firm holds an investment position only for very brief periods of time ‐ even just seconds ‐ and rapidly trades into and out of those positions
AT firms include both Day‐Traders and Position Traders and may carry overnight position depending on strategy they use
HFT firms are typically Day‐Traders and end a trading day with no net investment position in the securities they trade.
AT operations are usually found in Buy‐Side firms(such as Mutual funds, Insurance companies, Pension funds, FII, Investment Banks, some Hedge funds and some Proprietary trading firms )
HFT operations are usually found in proprietary firms or on proprietary trading desks in larger, diversified firms
Selecting High Profit Making and properly backtested algorithms is more important than speed. Speed does matter in AT too, but need for speed is not an utmost priority.
HFT strategies are usually very sensitive to the processing speed of markets (also called Latency) and of their own access to the market.
Application of Algo Trading Directional Trading :‐ Trend Following, Pair Trading, Mean Reversion, Scalping Arbitrage :‐ Delta Neutral Strategies, Statistical Arbitrage Transaction cost reduction(Trade Execution) : VWAP, TWAP, Liquidity seeking, Implementation shortfall
Application of HFT Rebate Trading, Market Making, Filter Trading, Momentum Trading, Statistical Arbitrage and Technical Trading
12 Structural Issues Concerning Algorithm Trading in India
Chapter 4
Algorithm Trading in Asia‐Pacific
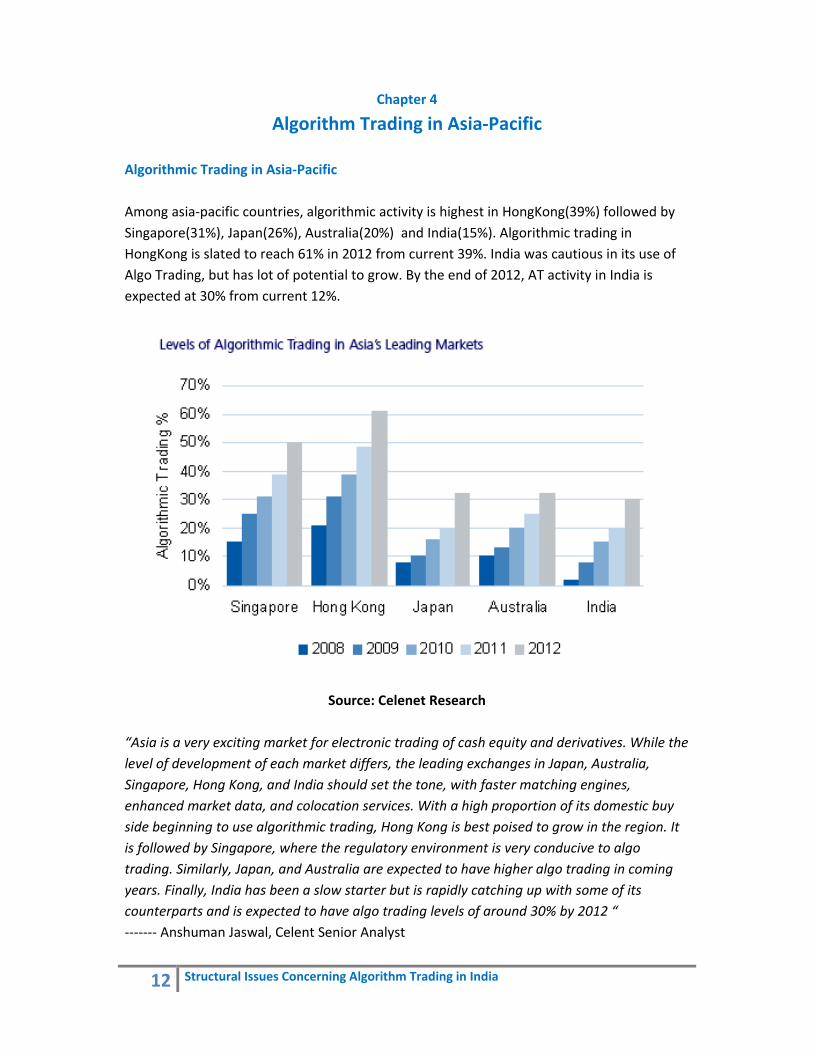
Algorithmic Trading in Asia‐Pacific Among asia‐pacific countries, algorithmic activity is highest in HongKong(39%) followed by Singapore(31%), Japan(26%), Australia(20%) and India(15%). Algorithmic trading in HongKong is slated to reach 61% in 2012 from current 39%. India was cautious in its use of Algo Trading, but has lot of potential to grow. By the end of 2012, AT activity in India is expected at 30% from current 12%.
Source: Celenet Research
“Asia is a very exciting market for electronic trading of cash equity and derivatives. While the level of development of each market differs, the leading exchanges in Japan, Australia, Singapore, Hong Kong, and India should set the tone, with faster matching engines, enhanced market data, and colocation services. With a high proportion of its domestic buy side beginning to use algorithmic trading, Hong Kong is best poised to grow in the region. It is followed by Singapore, where the regulatory environment is very conducive to algo trading. Similarly, Japan, and Australia are expected to have higher algo trading in coming years. Finally, India has been a slow starter but is rapidly catching up with some of its counterparts and is expected to have algo trading levels of around 30% by 2012 “ ‐‐‐‐‐‐‐ Anshuman Jaswal, Celent Senior Analyst
13 Structural Issues Concerning Algorithm Trading in India
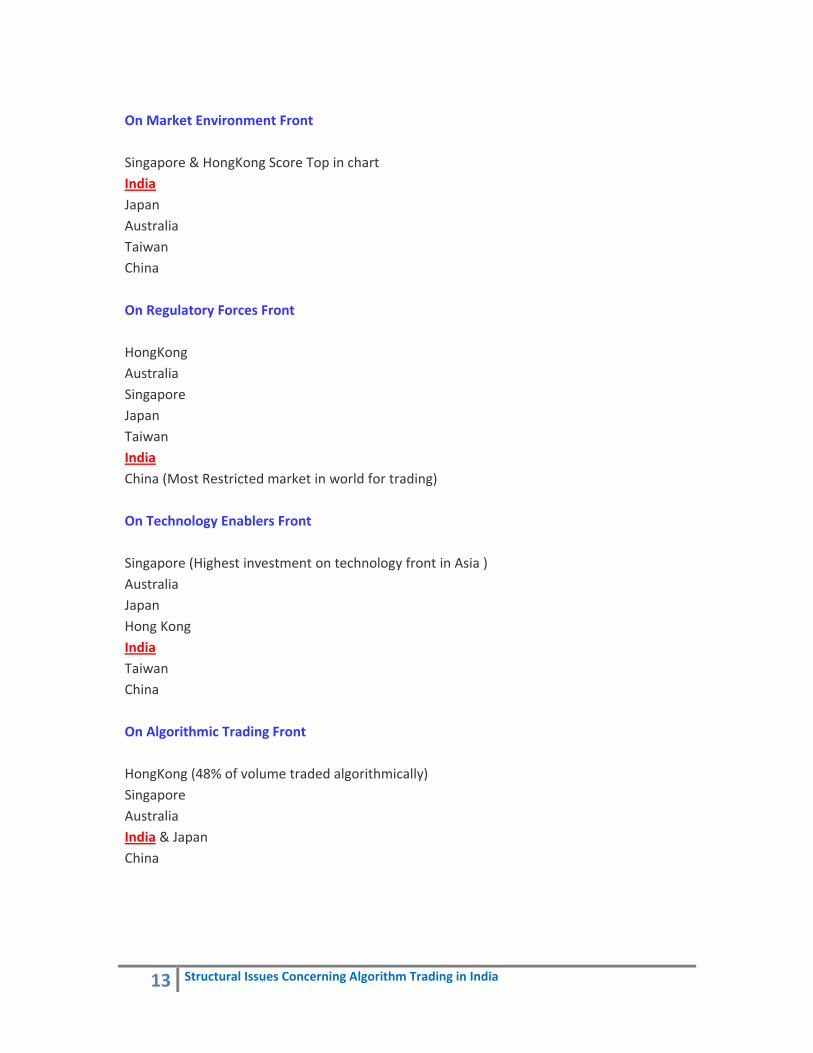
On Market Environment Front Singapore & HongKong Score Top in chart India Japan Australia Taiwan China On Regulatory Forces Front HongKong Australia Singapore Japan Taiwan India China (Most Restricted market in world for trading) On Technology Enablers Front Singapore (Highest investment on technology front in Asia ) Australia Japan Hong Kong India Taiwan China On Algorithmic Trading Front HongKong (48% of volume traded algorithmically) Singapore Australia India & Japan China
14 Structural Issues Concerning Algorithm Trading in India
Chapter 5
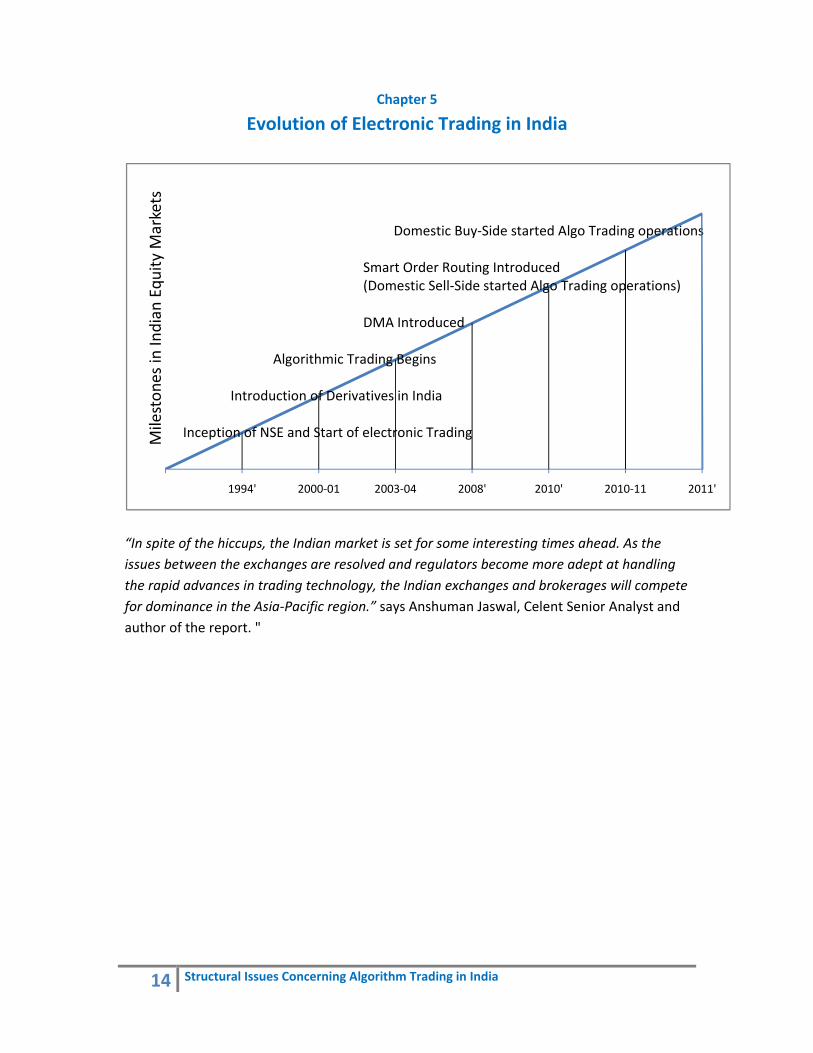
Evolution of Electronic Trading in India
“In spite of the hiccups, the Indian market is set for some interesting times ahead. As the issues between the exchanges are resolved and regulators become more adept at handling the rapid advances in trading technology, the Indian exchanges and brokerages will compete for dominance in the Asia‐Pacific region.” says Anshuman Jaswal, Celent Senior Analyst and author of the report. "
1994' 2000‐01 2003‐04 2008' 2010' 2010‐11 2011'
Mileston
es in
Indian
Equ
ity M
arkets
Domestic Buy‐Side started Algo Trading operations
Smart Order Routing Introduced(Domestic Sell‐Side started Algo Trading operations)
DMA Introduced
Algorithmic Trading Begins
Introduction of Derivatives in India
Inception of NSE and Start of electronic Trading
15 Structural Issues Concerning Algorithm Trading in India
Chapter 6
Smart Order Routing, DMA and Colocation
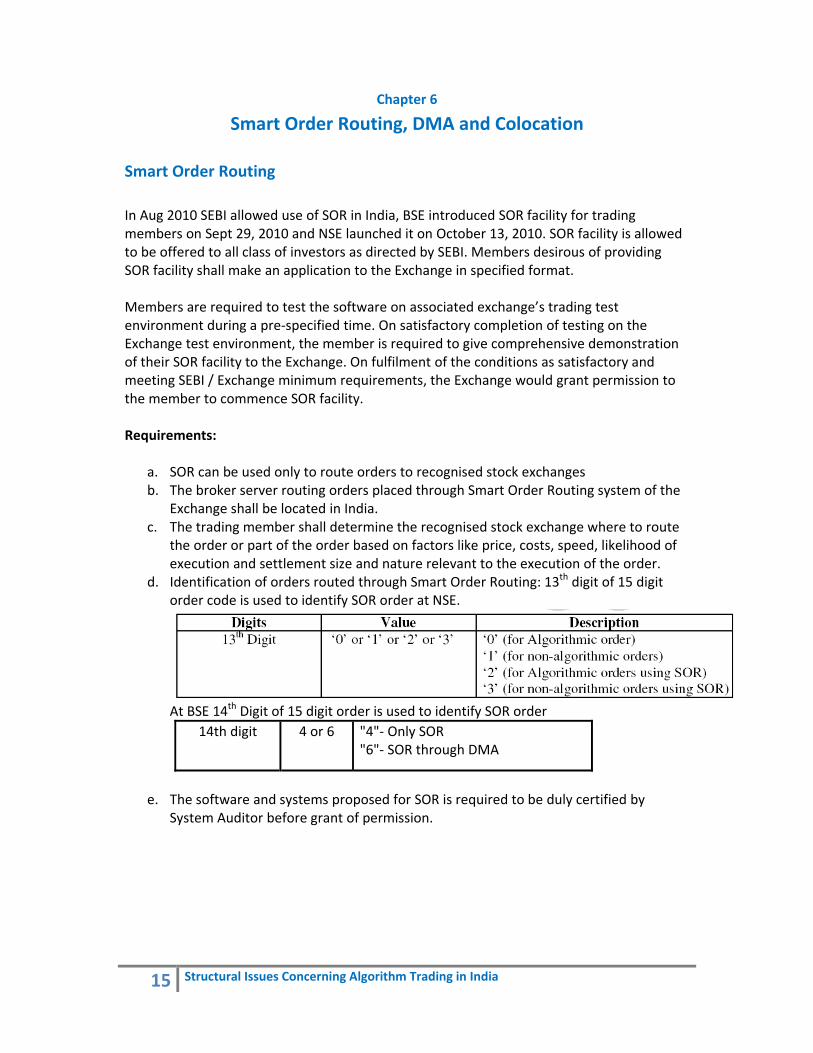
Smart Order Routing In Aug 2010 SEBI allowed use of SOR in India, BSE introduced SOR facility for trading members on Sept 29, 2010 and NSE launched it on October 13, 2010. SOR facility is allowed to be offered to all class of investors as directed by SEBI. Members desirous of providing SOR facility shall make an application to the Exchange in specified format. Members are required to test the software on associated exchange’s trading test environment during a pre‐specified time. On satisfactory completion of testing on the Exchange test environment, the member is required to give comprehensive demonstration of their SOR facility to the Exchange. On fulfilment of the conditions as satisfactory and meeting SEBI / Exchange minimum requirements, the Exchange would grant permission to the member to commence SOR facility. Requirements:
a. SOR can be used only to route orders to recognised stock exchanges b. The broker server routing orders placed through Smart Order Routing system of the
Exchange shall be located in India. c. The trading member shall determine the recognised stock exchange where to route
the order or part of the order based on factors like price, costs, speed, likelihood of execution and settlement size and nature relevant to the execution of the order.
d. Identification of orders routed through Smart Order Routing: 13th digit of 15 digit order code is used to identify SOR order at NSE.
At BSE 14th Digit of 15 digit order is used to identify SOR order
14th digit 4 or 6 "4"‐ Only SOR "6"‐ SOR through DMA
e. The software and systems proposed for SOR is required to be duly certified by
System Auditor before grant of permission.

16 Structural Issues Concerning Algorithm Trading in India
Direct Market Access Facility Direct Market Access (DMA) is a facility which allows brokers to offer clients direct access to the exchange trading system through the broker’s infrastructure without manual intervention by the broker. Some of the advantages offered by DMA are direct control of clients over orders, faster execution of client orders, reduced risk of errors associated with manual order entry, greater transparency, increased liquidity, lower impact costs for large orders, better audit trails and better use of hedging and arbitrage opportunities through the use of decision support tools / algorithms for trading.
• SEBI allowed Trading Members to provide DMA facility in April 2008 for trading in capital market segment. In June 2008, NSE launched its DMA facility for its members.
• Members can use their own software running on any suitable hardware/software platform of their choice and hence customize the software to meet their specialised needs such as provision of on‐line trade analysis, risk management tools, integration of back‐office operations etc
• Boston‐based research and analysis firm Celent estimates that the DMA in the US accounts for about 20% of equities share volume in 2010. In Europe, DMA flow for equities is expected to grow from 8% of traded value to 15% in 2011, according to the firm.
• Celnet estimates, in 2010 11% of traded volume in India was through DMA facility. • The institutional investors, which currently account for 22‐25 % of the total turnover
in the Indian stock markets, are expected to increase their market share of the turnover with the advent of DMA.
• The basic brokerage fees for institutional trades in India range from 10 to 40 basis points, Market analysts expect this fee to drop to 10 to 20 basis points following the adoption of DMA facility.
• Major players: MF Global, BNP Paribas, Morgan Stanley, UBS and Credit Suisse • Broker providing AT as well as DMA services : Merrill Lynch, Goldman Sachs,
JPMorgan, Citigroup and Credit Suisse Requirements
• The software and systems proposed for DMA shall be duly certified by the Exchange empanelled System Auditor before grant of permission.
• Trading members providing ‘Direct Market Access’ facility are required to populate the following values in the field provided (15–digits) in the order structure for every order emanating from DMA terminals.
17 Structural Issues Concerning Algorithm Trading in India
• Member seeking an permission should comply with risk controls checks as
specified in annexure I
Co‐location Co‐location is the practice of locating broker or client trading software and hardware in close proximity to the trading platform’s trading engine. The aim is to minimise propagation and transmission latency. Exchanges and third party providers charge a fee for offering co‐location. Indian Exchanges have started providing co‐location facility to their member brokers, whereby they can place their trading servers close to the exchange’s engine on a first‐come‐first‐served basis. Co‐location saves crucial milliseconds from the time it takes to place an order and its receipt at the other end. The broker with his server next to the exchange engine gets a price feed that is updated every three‐four milliseconds, while a broker at a remote place will get this feed updated every 30‐40 milliseconds. In Futures Industry Association (FIA) conference in Mumbai, an official from the National Stock Exchange (NSE) said 60% of the orders coming into the exchange were from co‐located servers.

K
80,
µ
18
Connecti Indian brmade sigwidespreallow DM In India b
Latency Latency rrely on vexchange NYSE Tec
Time Lag
Time LagAcknowleTime Lagat ( time executio
Recently,microsec Order sp
KRX
,000
µS
HK
10,0
µ
Structural Is
ivity
rokers need gnificant inveead adoptionMA facility.
both NSE and
refers to amery low latees are invest
chnologies U
g for data fee
g for order &edgment g for Round Tfrom order n to trade co
, NYSE launcconds latenc
peed (Round
KE
000
S
SG
10,0
µS
ssues Concer
Curre
FIX connectestments in n of the FIX p
d BSE have F
ount of timency (i.e veryting in new t
Universal Tra
ed
& cancel
Trip Executioconfirmatioonfirmation)
ched Etherney at rates of
d Trip Execut
X
000
S
BSE
10,00
µS
rning Algorith
Ch
ent infras
ivity to attraFIX networkprotocol ove
FIX connectiv
e taken to ely quick data ttechnology t
ading Platfo
on n to trade )
et‐based maf 1 million 20
tion Time) a
E
00
LSE
6,000
µS
hm Trading in
apter 7
structure
act internatiks and order er the last tw
vity.
lectronicallytransmissionto reduce lat
orm
Nasdaq NYSE listBATS: 40DirectEd
arket data d00 byte mes
t major exch
0
TSE
5,000
µS
n India
e in India
onal order fmanageme
wo years, all
y send or recn) for tradintency.
3 mi
2 mi
listed issue –ted issue – 900 microsecodge: 300‐500
delivery solusages per se
hanges
NSE
5,000
µS
low and mant systems (owed many
ceive informag strategies.
lliseconds
lliseconds
– 650 micros950 microseconds 0 microsecon
ution that haecond per co
ASX
250
µS
ny have (OMSes). Thcountries to
ation. HFTs . Worldwide
secondsconds
nds
as 25 ore.
NDAQ
143
µS
e o
e
NYSE
25
µS
19 Structural Issues Concerning Algorithm Trading in India
Capacity
Capacity refers to the amount of data that can be simultaneously electronically sent or received. It is a necessary prerequisite for many algorithmic traders that a trading system can reliably sustain large volumes of data. For example, electronic market makers constantly check market prices and adjust their quotes accordingly. Statistical arbitrageurs are constantly looking for mis‐pricing opportunities. Both strategies require the ability to send and receive large amounts of data simultaneously, like requesting current bids/offers, sending their own bid/offer and then receiving confirmation that the trading engine has received their order and any subsequent amendment or cancellation of that order. With introduction of Algorithm Trading now many stock exchanges are struggling to keep pace with ever increasing capacity demands. They are investing in new technologies to increase capacity in order to facilitate Multilateral Trading Facility. In response to changing environment, BSE increased capacity from 1000 orders per second to 20,000 orders per second. NSE also is working towards increasing capacity.

20 Structural Issues Concerning Algorithm Trading in India
Chapter 8
Current Trade Structure in US & India
Average Trade size and Number of trades in US
Average shares per trade (Average Trade size) decreased by 83% from 1,477 shares in 1997 to 244 shares in 2009, while Average trades per Day (Number of Trades) increased by 26 times from 743 trades in 1997 to 19,943 trades in 2009. Average shares Per Day increased from 1.09 mn (1477*743) in 1997 to 4.86 mn(19943*244) in 2009. The figures show that there is been increase in number of trades executed and decrease in order size. This can be attributed to introduction of algo trading which slice large order into many small orders. The negative impact of this is that it may flood the system with large number of orders increasing the load on exchanges trading system. Also it increases clearing and settlement costs for traders.
Source: ‐ TABB Group
0
200
400
600
800
1,000
1,200
1,400
1,600
0
5,000
10,000
15,000
20,000
25,000
30,000
35,000
40,000
Avg.
Sha
res
/ Tra
de
US Equity Share volume and trades
Avg Shares Per Day (mm) Avg Trades Per Day Shares / Trade

21 Structural Issues Concerning Algorithm Trading in India
Average Trade size and Number of trades in India
In 2010, NSE was the 4th largest exchange in the world in terms of number of trades executed in equity segment followed by NYSE, NASDAQ and SSE. BSE was 7th largest exchange overtaking many European and Asian exchanges.
Source: ‐ wfe But the interesting point here is that in terms of least number of shares per trade, India is also the first country in the world with just 120 shares traded per trade followed by followed by NASDAQ (230), Korea Exchange (278) and NYSE (293).
Source: ‐ wfe
205174 166 156
133
92
56
NYSE Euronext (US)
NASDAQ OMX
Shanghai SE
National Stock
Exchange India
Shenzhen SE
Korea Exchange
Bombay SE
Number of Trades in Equity Segment (in Crore)
293 230
1,559
120
1,218
278
NYSE Euronext (US)
NASDAQ OMX
Shanghai SE National Stock
Exchange India
Shenzhen SE Korea Exchange
Shares Per Trade in Equity Segment

22 Structural Issues Concerning Algorithm Trading in India
Average Order Cancellation Rate Since introduction of AT, Order to Trade ratio has significantly gone up in many countries including India. At NYSE order to trade ratio is 30:1, which means only one order, out of 30 orders entered, gets executed and 29 others are either modified or cancelled. AT BSE order to trade ratio is 19:1.
The increase in the average order to trade ratio and average order cancellation rate may no be the concern as long as exchanges have built sufficiently large capacity and have limited order entry rate through algorithms.
Commission, Clearing and Settlement charges and Transaction cost It is been observed worldwide with introduction of AT and DMA facility there has been considerable decrease in the commission charged as many institutions prefer to execute trades directly using DMA facility. Also with advent of AT and HFT, there has been an increase in the number of orders executed, which causes clients to negotiate commission in percentage term with their brokers. For institution brokerage is 10‐40 bps, whereas for retail investors it is in the range of 20‐50 bps. Clearing and settlement charges are sky high in India especially for retail investors. These charges are applicable only on sell transactions and varies from 10‐30 Rs for every transaction from broker to broker. Irrespective of number of shares sold, you have to pay clearing and settlement charges, which I believe are quit high for retail investors selling 10‐100 shares.
Transaction cost for intraday transaction is reasonable but for Delivery transaction it is quite high at around 0.14% of turnover for proprietary traders, and 0.5% for retail investors.
23 Structural Issues Concerning Algorithm Trading in India
Chapter 9
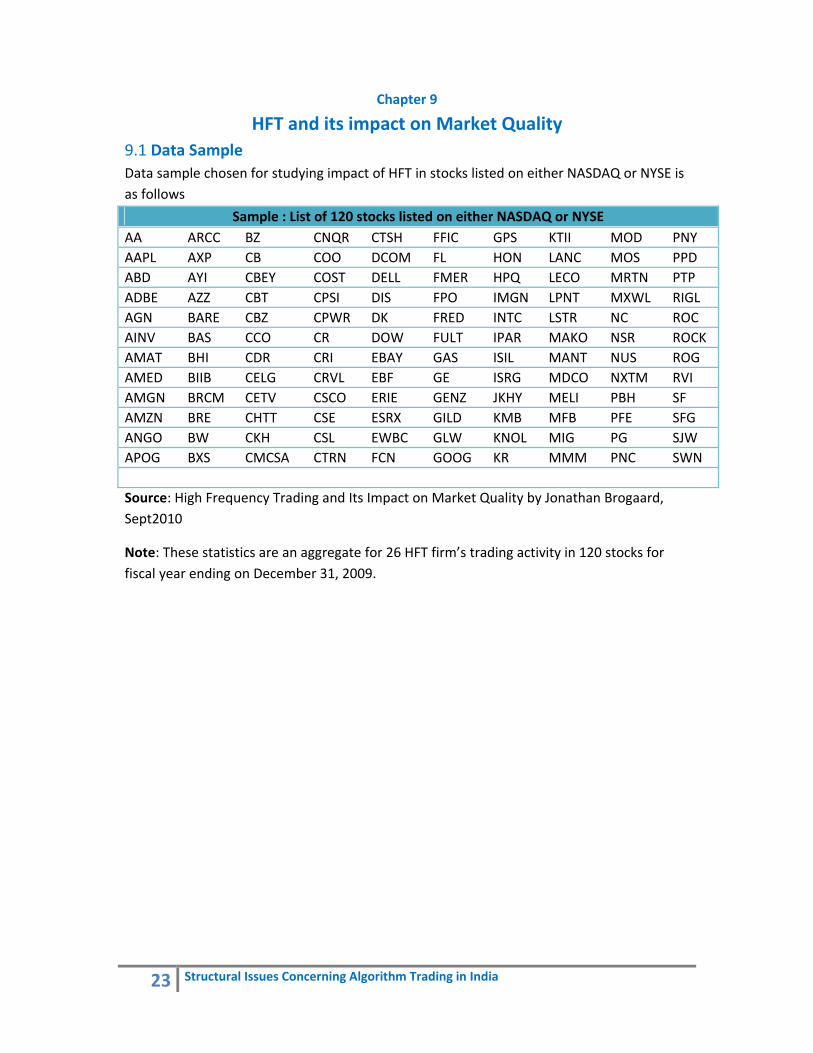
HFT and its impact on Market Quality 9.1 Data Sample Data sample chosen for studying impact of HFT in stocks listed on either NASDAQ or NYSE is as follows
Sample : List of 120 stocks listed on either NASDAQ or NYSE AA ARCC BZ CNQR CTSH FFIC GPS KTII MOD PNY AAPL AXP CB COO DCOM FL HON LANC MOS PPD ABD AYI CBEY COST DELL FMER HPQ LECO MRTN PTPADBE AZZ CBT CPSI DIS FPO IMGN LPNT MXWL RIGL AGN BARE CBZ CPWR DK FRED INTC LSTR NC ROC AINV BAS CCO CR DOW FULT IPAR MAKO NSR ROCK AMAT BHI CDR CRI EBAY GAS ISIL MANT NUS ROG AMED BIIB CELG CRVL EBF GE ISRG MDCO NXTM RVIAMGN BRCM CETV CSCO ERIE GENZ JKHY MELI PBH SF AMZN BRE CHTT CSE ESRX GILD KMB MFB PFE SFG ANGO BW CKH CSL EWBC GLW KNOL MIG PG SJW APOG BXS CMCSA CTRN FCN GOOG KR MMM PNC SWN Source: High Frequency Trading and Its Impact on Market Quality by Jonathan Brogaard, Sept2010
Note: These statistics are an aggregate for 26 HFT firm’s trading activity in 120 stocks for fiscal year ending on December 31, 2009.

24 Structural Issues Concerning Algorithm Trading in India
9.2 HFT activity in US
HFTs are involved in 68.5% of all dollar‐volume traded in the sample. Their level of daily involvement varies from 60.4% to 75.9%. They demand liquidity in 42.7% of all dollar volume traded and supply it in 41.1%.
HFTs participate in 73.8% of all trades and participation varies at the day level from 65.1% to 81.9%. They demand liquidity in 43.6% of all trades and supply it in 48.7%.
Panel A ‐> Dollar‐Volume traded by HFTs as percentage of Total Dollar‐Volume traded in the sample of 120 stocks
Panel B ‐> Quantity traded by HFTs as percentage of Total Quantity traded in the sample of 120 stocks
Table 1
Source: High Frequency Trading and Its Impact on Market Quality by Jonathan Brogaard, Sept2010 Note: These statistics are an aggregate for 26 HFT firms trading activity in 120 stocks for fiscal year ending on December 31, 2009.

25 Structural Issues Concerning Algorithm Trading in India
9.3 Do HFTs flee in volatile markets?
While HFT may be increasingly providing liquidity to the market in the place of more traditional market making activities, some investors suggested that unlike registered market makers on trading venues there is no obligation or incentive for high frequency traders to continue to provide liquidity to the market in the event of adverse market conditions (high volatility). Research shows as indicated in Graph 1, HFTs activity appears to be almost flat across volatility levels. Even on the most volatile days HFT overall activity does not seem to increase or decrease substantially. However, when volatility is low HFTs activity is less than average.
Graph 1
Source: High Frequency Trading and Its Impact on Market Quality by Jonathan Brogaard, Sept2010 Where, HFT % Change – Percent change in HFT activity HFT% MA (9) ‐ 9 Day moving average of percent change in HFT activity 95% conf MA (9) – Upper and Lower price band of HFT% MA (9) HFT provide about 10% more liquidity than usual on very low volatility days. The level of HFT liquidity slowly declines as volatility picks up, at the highest volatility the HFT liquidity is about 10% less than on an average day.
HFT activity more than average
HFT activity Less than average
26 Structural Issues Concerning Algorithm Trading in India
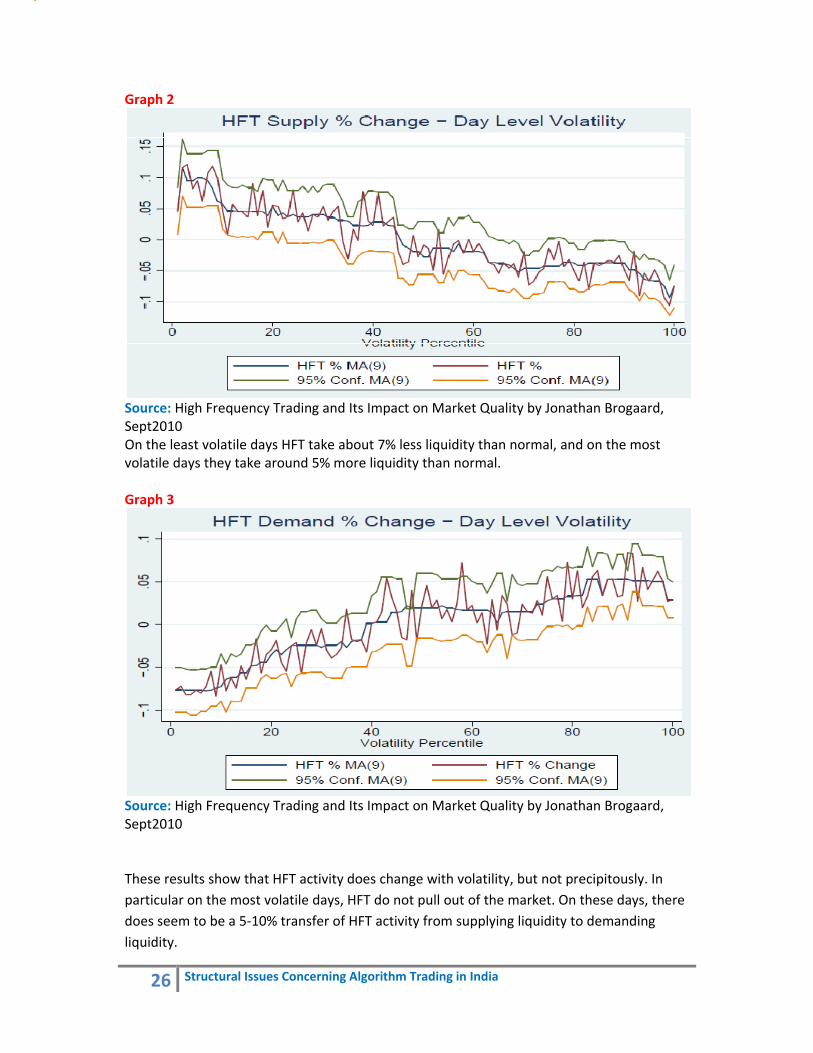
Graph 2
Source: High Frequency Trading and Its Impact on Market Quality by Jonathan Brogaard, Sept2010 On the least volatile days HFT take about 7% less liquidity than normal, and on the most volatile days they take around 5% more liquidity than normal. Graph 3
Source: High Frequency Trading and Its Impact on Market Quality by Jonathan Brogaard, Sept2010 These results show that HFT activity does change with volatility, but not precipitously. In particular on the most volatile days, HFT do not pull out of the market. On these days, there does seem to be a 5‐10% transfer of HFT activity from supplying liquidity to demanding liquidity.
HFT activity Less than average
HFT activity more than average
HFT activity more than average
HFT activity Less than average

27 Structural Issues Concerning Algorithm Trading in India
9.4 Does HFT contribute to Price Discovery Process?
Of the 118 stocks, 68 stocks show as having greater contribution to price discovery process and 28 of those stocks HFT‐Non HFT contribution is statistically significant. In the 50 stocks, where non HFT contribution is greater than that of HFT, the difference is statistically significant for 7 firms.
On average HFT contribute 86%, [(0.195‐0.105)/0.105*100], more to price discovery than do non‐HFT. Based on these results we can safely say that HFT contribute to price discovery process.
Table 2: HFT ‐ non‐HFT Variance Decomposition
Source: High Frequency Trading and Its Impact on Market Quality by Jonathan Brogaard, Sept2010 Where HFT % shows Variance (Efficient Price, HFT trade price)
28 Structural Issues Concerning Algorithm Trading in India
Non HFT% shows Variance (Efficient Price, Non HFT trade price)
T Stat t statistics for difference between HFT and Non HFT contribution to price discovery
Conclusion: ‐ HFT contribute more to price discovery than non HFT.
9.5 What role HFT plays in providing market liquidity?
This section analyzes HFT and the supply of liquidity.
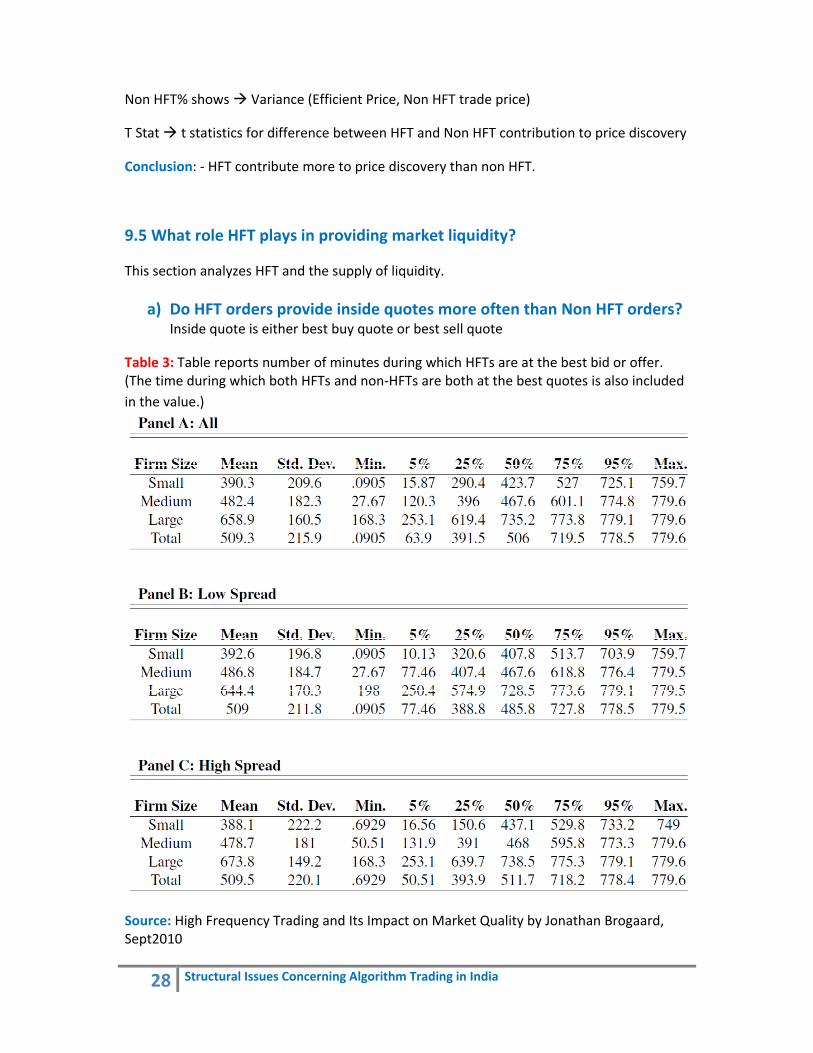
a) Do HFT orders provide inside quotes more often than Non HFT orders? Inside quote is either best buy quote or best sell quote
Table 3: Table reports number of minutes during which HFTs are at the best bid or offer. (The time during which both HFTs and non‐HFTs are both at the best quotes is also included in the value.)
Source: High Frequency Trading and Its Impact on Market Quality by Jonathan Brogaard, Sept2010

29 Structural Issues Concerning Algorithm Trading in India
Panel A all stocks at all times, Panel B the stocks that are offering lower spreads than average all time Panel C the stocks that are offering lower spreads than average all time In each Panel the data are divided into three groups, with 40 firms each, based on firm size Viz. Small, Medium and Large Sample = 780 = 2(Providing either inside bid/offer every minute)*60(minutes/hour)*6.5(trading hours) =Number of minutes that a HFT could potentially be providing at least one inside quote Panel A shows that HFT firms frequently (at around 65.3% (=509.3/780*100) of the time of the day) provide the best bid or offer quotes. As the firm size increases HFTs are more competitive in their quotes, matching or beating non‐HFTs quotes for a significant portion of the day. Also there is no significant difference between liquidity provided by HFT firms in High spread & Low spread stocks
Conclusion:‐ HFT firms provide best bid/ best offer more frequently than non‐HFT firms.
b) Does HFT provide depth to the order book?
In previous section, the analysis on liquidity has been by looking at the best inside bid and asks. Another way of looking at HFT impact on liquidity is by looking at the depth of the book supplied by HFT. Panel A and B shows increase in impact cost due to withdrawal of either HFT orders or Non HFT orders. Firms are divided based on their market capitalizations. Very Small includes firms under $ 400 million, Small are those between $400 million and $1.5 billion, Medium are those between $1.5 billion and $3 billion, and large are for firms valued at more than $3 billion. Dollar Dollar increase in impact cost Basis Percent increase in impact cost Panel A shows the results of removing HFT from the book. As the trade size increases, the price impact increases across firms of all sizes and for all ten trade size increases. The Small category tends to be more impacted by the withdrawal of HFT liquidity than is the Very Small category. Table 4:

30 Structural Issues Concerning Algorithm Trading in India
Source: High Frequency Trading and Its Impact on Market Quality by Jonathan Brogaard, Sept2010
Panel B shows the results of removing non‐HFTs from the book. Across all categories the removing of non‐HFTs has a much larger impact than does the removal of HFTs. This means that although HFTs supply liquidity in 41% of all dollars traded, they provide only a fraction of the depth compared to non‐HFTs. Table 5:
Source: High Frequency Trading and Its Impact on Market Quality by Jonathan Brogaard, Sept2010
Conclusion: Beyond supplying liquidity in 51.4% of all trades, HFTs frequently supply the inside quotes throughout the day. While removing either type of trader would result in price impact, but removing non‐HFTs has a larger impact

31 Structural Issues Concerning Algorithm Trading in India
9.6 Does HFT generate or dampen volatility?
Assumption: Prices would have achieved their actual levels even in the absence of high frequency trades but would jump around more.
Of the 120 firms, 72 of them have a higher volatility when HFTr initiated trades are removed. Further, A small majority of firms experience slightly higher volatility without HFTr initiated trades. However of these 72 stocks, only one is statistically significant. This indicates volatility would have increased in the absence of HFT. Of the 48 stocks where the removal of HFTr initiated trades reduces volatility, suggestive of HFTs causing volatility, none show a statistically significant difference in volatility. Table 6:
32 Structural Issues Concerning Algorithm Trading in India
Source: High Frequency Trading and Its Impact on Market Quality by Jonathan Brogaard, Sept2010 Conclusion: The overall results show that when HFTr initiated trades are removed, volatility increases and this difference is statistically significant. Admittedly the results are not strong in one direction or another; they lean in favour of HFT reducing volatility.

33 Structural Issues Concerning Algorithm Trading in India
Chapter 10
Possible Manipulations Using HFT/Algorithmic Trading
1) Front Running Front running is an illegal activity in which a trader takes a position in an equity in advance of an action which he/she knows his/her brokerage will take that will move the equity's price in a predictable fashion. Apart from Flash Trades (discussed below), which some believe is part of Front Running, there is no occurrence of front running using Algorithmic Trading. Flash Trading Services show stock pricing information to some select member around 500 milliseconds before routing it to public market. If such orders are of large quantity, few members can take advantage of it by front running.
In 2008, SEBI allowed stock exchanges to offer DMA facility, which many believe would help reduce instances of front running. DMA facility allows Institutions with large orders to execute the trades directly on stock exchange without manual intervention of Trading Member. This prevents leakage of information and curbs the practise of front running.
There is no conclusive evidence that would define relationship between Front running and use of Algo trading. And hence, use of Algorithmic Trading (without using DMA) will not have any significant impact on Increase or decrease of number of instances of front running. But the use of DMA will most certainly reduce number of instances of front running.
2) Unintended and Uncontrolled operations of algorithms
Sometime algorithms operate in aberrant manner, due to several factors like programming deficiencies, network problems, unexpected market scenarios and all hosts of endogenous and exogenous factors. Such aberrant operation sometimes may create issues such as “Network Jam”, “Server Jam”, “Queing of orders”, “server/network breakdown”, “submission and cancellation of orders which traders have no intention to trade”, “Cancelation requests for orders that were never entered” etc.
Though there are several system checks by exchanges in place, there is a possibility of algo acting in aberrant manner.

34 Structural Issues Concerning Algorithm Trading in India
Case 1: NYSE imposed penalty of $150,000 on Credit Suisse Securities (USA) LLC for failing to adequately supervise development, deployment and operation of proprietary algorithm. Beginning at approximately 3:40 p.m., a Credit Suisse proprietary algorithm routed hundreds of thousands of cancel/replace requests to the New York Stock Exchange for orders that had been previously generated by the algorithm, but, due to an unforeseen programming issue, were never sent by the algorithm. The unusually large amount of cancel/replace messages contributed to the over‐queuing of message traffic in all of the securities, approximately 975 in total, traded at five posts on the NYSE Trading Floor. Messages, including new orders, modifications of orders, and cancellation requests were frozen in queue and could not be immediately processed. These five posts could not be closed on time, ultimately closing between 4:10 p.m. and 4:27 p.m.
3) Order stuffing /Quote stuffing
Quote‐stuffing is essentially a denial‐of‐service attack, aimed at trying to slow down a market in an environment where milliseconds matter.
With quote‐stuffing, high‐frequency traders enter an enormous number of bids and offers, significantly outside the current bid‐offer spread, just to introduce a vast amount of noise into the quote feed. All that noise takes time (maybe just a few extra nanoseconds) for rival HFT shops and Exchange’s‐Trading‐Systems to process, giving the quote stuffer a crucial time advantage.
The SEC is looking into whether quote‐stuffing exists, and whether it’s a strategy that anybody has actually used to make money. They are also investigating whether Quote stuffing has any involvement in Flash Crash that happened on May 6, 2010.
In India, my guess is quote stuffing may not exists at this point in time, given very low participation by HFTs but again we can not rule out chance of happening in the future with more and more penetration by HFTs. Quote stuffing is worldwide regarded as very serious act and should be punished seriously if attempted by any market participants.
4) Flash Trades Flash orders shows stock pricing information for a brief period to a limited group of member traders who can then decide whether to fill an order before it is routed out to the public market. Direct Edge, an electronic communications network backed by Goldman Sachs, Citadel and Knight Trading, was the first to offer such an order type to its members in 2006. NASDAQ and Bats (U.S. exchanges) created their own flash market in early
35 Structural Issues Concerning Algorithm Trading in India
2009 in response to the Direct Edge market. Both voluntarily discontinued the practice in August 2009. Direct Edge became a U.S. exchange in July 2010 and used flash trading to great success in siphoning market volume away from NYSE, Bats and Nasdaq and now it claims third largest exchange in US. Currently SEC is considering banning Flash Trading in US following complaint by Euronext operator of NYSE and Gletco One of the top market makers in US.
Officially, so far, no stock exchange in India is offering this service but introduction of Smart Order Routing may open the gates of opportunities for stock exchanges to attract institutional traders by providing flash trading facility. Flash trading service gives unfair advantage to select group of people / institutions at the expense retail investors. This service is detrimental to the development of securities market and SEBI should enact regulations to ban its operation in India.
5) Internalisation / Cross‐Trades Internalisation refers to ability of brokers to match customers away from public markets. In India, SEBI has banned internal crossing of orders and mandated that all orders entered by clients must be submitted to central order matching system of the exchanges. This prevents setting up of stealth stock exchanges, dark pools or private trading venues, stealing liquidity away from the market. In spite of having such strong regulations, I can not rule out the possibility of use of algorithms to develop Internal Crossing systems, which I am sure many brokerage firms would be etching to start in order to reduce transaction cost for their proprietary trades. High cost of transaction in India could actually work as an impetus for use of such systems. I see no real danger in allowing internalisation of proprietary trading as it avoids extra costs such as STT on intraday transactions for TM. However, internal matching of client’s orders or matching orders across different Trading Member should never be allowed as it raises several Clearing and Settlement issues and also there is real risk of new unregulated trading venues such as dark pool being set up.
36 Structural Issues Concerning Algorithm Trading in India
6) Layering Layering is a technique of entering Limit Orders with large quantity at different price level on any side of order book in order to create a false appearance of buy‐ or sell‐side pressure. Person, who wants to buy a stock, enters hidden buy order at best bid and enters numerous sell limit order with large quantity at such a price levels that have low probability of getting executed. This creates an impression that there are many sellers in the script and hence it may go down inducing other people to sell their stocks to buyer (manipulator) In India, Layering may not be used that extensively mainly because absence of “Deep‐Order‐Book”. Only 5 best bids and 5 best offers are provided in India for a particular script as against all possible orders provided in US. This limits the ability of Day‐Traders to take a call based on demand and supply of the stock. Layering requires as many limit orders to be visible to effectively implement it. Having said this, I still suspect many cases of manipulation using layering in India in Low Volume or illiquid scripts without the help of HFT. Permitting use of algorithmic trading in Low Volume stocks may aggravate this problem. So if permitted, it should be verified that Layering algos are not permitted to use.
Case 2: FINRA imposed $1 million penalty on Trillium Brokerage Services, LLC for using an illicit high frequency trading strategy
Trillium, through nine proprietary traders, entered numerous layered, non‐bona fide market moving orders to generate selling or buying interest in specific stocks. By entering the non‐bona fide orders, often in substantial size relative to a stock's overall legitimate pending order volume, Trillium traders created a false appearance of buy‐ or sell‐side pressure. This trading strategy induced other market participants to enter orders to execute against limit orders previously entered by the Trillium traders. Once their orders were filled, the Trillium traders would then immediately cancel orders that had only been designed to create the false appearance of market activity. As a result of this improper high frequency trading strategy, Trillium's traders obtained advantageous prices that otherwise would not have been available to them on 46,000 occasions. Other market participants were unaware that they were acting on the layered, illegitimate orders entered by Trillium traders.
37 Structural Issues Concerning Algorithm Trading in India
7) Dark pools
Dark pools are venues where trading is done off of an exchange to obtain price improvement and not move the price if a large block of stocks is being traded. The executions done in dark pools are only hidden from the public and other brokers before and during trading. Dark pools have been traditionally been used by institutional traders, who use them to execute large stock transactions without moving the market against themselves. But dark pools have evolved to give retail investors and smaller orders a crack at price improvement and better liquidity.
Advantages of dark pools are lower trading cost, better trade price and more liquidity as broker has multiple venues to operate in. The risk of Dark pools is that when information is leaked out of a dark pool it can lead to front running by broker and executing trade ahead of other Dark pool participants. Also few investors may not be aware of price available for same stock elsewhere.
Currently, Dark Pools are not operating in India. But Block Deal platform which is almost similar to Dark pool platform is operational in India and In fact authorised by SEBI. Large Investors who want to buy/sell more than 5 lakh shares or more than 5 crore worth of shares can enter order in Block Deal platform. If those orders are allowed to be entered as hidden and algo traders are also allowed to operate in that space, then we can have virtual Dark Pool running on the same exchange. To prevent this either orders should not be allowed to be entered as hidden in Block Deal Segment or algo traders should not be permitted to operate in that space.
8) Wash Trades An illegal stock trading practice where an investor simultaneously buys and sells shares in a company through two different brokers in order to increase turnover and in turn capture the attention of general public enticing them to trade the stock. The research conducted by ASX suggests that there is been an increase in the number of trades being cancelled, majority of which were Wash Trades, from 0.16% in Jan 2009 to 0.39% in Aug 2009. The reason behind this is many Algo Trading firms employ different trading Strategies viz arbitrage strategies, market making strategies, directional strategies simultaneously. This increase likelihood that bids and offers entered from those algos will inadvertently execute against each other.
9) Liquidity Detection Liquidity detection is an umbrella term for trading strategies that involve sending small orders to look for where large undisclosed orders might be resting, on the assumption that

38 Structural Issues Concerning Algorithm Trading in India
When a small order is filled quickly there is likely to be a large order behind it. Some of the common liquidity detection strategies are: • Pinging: sending out large numbers of small orders with the intention of getting a fill or to gain information about electronic limit order books; • Sniper: an Algorithm that tries to detect ‘hidden’ liquidity by trading in round or odd lots until it completes or reaches an investor’s limit price; • Sniffing: Used to ‘sniff’ out algorithmic trading and the algorithms being used by sending a small portion of an order waiting to see if someone comes and gets it. Sniffers attempt to outsmart many buy‐side algorithmic techniques like iceberging. A survey was conducted by TABB group to find whether liquidity detection is a form of manipulation. 74% of market participants said that they did not regard liquidity detection as a form of manipulation, because the trader does not have direct knowledge of an order.
10) Exchanges helping their brokers by providing Special Data Feeds
Special data feeds are type of data feeds which are either provided early to some market participants compared to others or which contains special information which is not available to other public. There is possibility of this malpractice and SEBI would never know about this since data feeds provided by exchange are only for colocated servers and not for public or even SEBI. Such kind of practices may cause systemic breakdown of the financial system. Example: ‐ If I know some institution is moving large block of XYZ share, and it is selling till lowest price of 800 Rs. I can find this opportunity to short stock/ future in order to cover later.

39 Structural Issues Concerning Algorithm Trading in India
Chapter 11 Current Risk Management framework in India
Price Bands in Equity and F&O Segment
In India, there are price bands of 2%, 5%, 10% and 20% on individual security.
No price band is applicable on scrips on which derivative products are available. Rest all securities are categorised in different categories based on their daily volume and impact cost. 2%, 5%, 10% and 20% bands are applicable on those categories.
Once scrip hit a price band on either side, trading is halted for remaining day.
In F&O, there are no price bands but to prevent erroneous trade entry. Operational price bands are defined as 10% for Index futures, 20% for stock futures and Delta based value for Stock & index options.
Index wise Circuit Filter/ Circuit Breakers
Indexwise Circuit Filter is an automated trading halt mechanism, which stops trading on the exchange for specified period of time.
There are 10%, 15% and 20% circuit breakers on two main indices Nifty & Sensex.
9:15 am – 1.00 pm 1.00 pm – 2.30 pm 2.30 pm – 3.30 pm 10% movement 1 Hr market Halt 1/2 Hr market Halt No Trading Halt 9:15 am – 1.00 pm 1.00 pm – 2.00 pm 2.00 pm – 3.30 pm15% movement 2 Hr market Halt 1 Hr market Halt Trading Halted 20% movement Trading Halted for rest of the day
Margining System in Equity and F&O
Indian markets are much better placed vis‐à‐vis the US markets, thanks to the practice of collecting margins on a real‐time basis. If a member firm exhausts its margin with an exchange, it is barred from taking fresh positions. If client or trading member or Clearing member crosses specified limits, trading facility is suspended for all clients trading through TM (in case TM violates limit)and all trading member clearing through CM (in case CM violates limit).
Stocks are categorized in Group I, II & III on the basis of impact cost and stocks traded in last 6 months for the purpose of assigning different margins on different categories having different risk.
In Equity, Initial Margin = VaR margin + Exposure margin is collected on upfront basis, Typically VaR Margin is in the range of 7.5 ‐15% and Exposure margin ranges between 5‐

40 Structural Issues Concerning Algorithm Trading in India
10%. So typically, total initial Margin Varies from 12.5 – 25%. MTM margin is calculated by marking each transaction in security to the closing price of the security at the end of trading. And collected before start of next trading day
In F&O, Initial Margin and Exposure margin are collected upfront. Initial Margin = Total SPAN Margin (VaR margin)+ Buy Premium + Assignment Margin. And Exposure Margin 3% of the notional value of a futures contract (for futures) & The higher of 5% or 1.5 standard deviation of the notional value of gross open position (for options). Total Initial Margin is typically 15‐20% of Transaction Value. MTM margins are collected before start of next trading day.
Position Limits
At the end of each day the Exchange disseminates the aggregate open interest across all Exchanges in the futures and options on individual scrips along with the market wide position limit for that scrip and tests whether the aggregate open interest for any scrip exceeds 95% of the market wide position limit for that scrip. If yes, the Exchange takes note of open positions of all client/ TMs as at the end of that day in that scrip, and from next day onwards the client/ TMs should trade only to decrease their positions through offsetting positions till the normal trading in the scrip is resumed.
In India, we have TM wise & client wise position limits, which prevent a single TM or a single Investor from taking huge position in a single stock. For clients it is 1% of Total Free float capitalisation (for cash) and 5% of MWPL (for F&O)
NSE Also monitor FII and MF positions for sectoral and company specific limits set by RBI & SEBI.
There are stiff penalties for violation of any of the above mentioned limits and margining requirements.
Pre‐trade Control in F&O segment
Quantity Freeze: ‐ Any order coming to the exchange for trade in NIFTY, S&P500, BANKNIFTY, CNXIT or MINIFTY future/option with quantity more than 15,000 will be Freezed until broker confirm it as a genuine order. For trade in future/option on individual stocks, freeze quantity is as decided by exchange from time to time. Price Freeze: ‐ Price freeze is operational only in the F&O segment. Operational price bands are defined as 10% for Index futures, 20% for stock futures and Delta based value for Stock & index options.

41 Structural Issues Concerning Algorithm Trading in India
Pre‐trade Control in Equity segment
Apart from price bands there are no pre‐trade controls in equity segment to check erroneous trades. In US erroneous trades that are executed way outside last traded price may be contested and cancelled after complaining to the respective stock exchange. I have given two cases where trades were cancelled. Personally I don’t think any trade should be cancelled even if it is the punching error. However it is also true that, unintended erroneous trades should not be punished so heavily that operators are afraid to enter orders. One way to counter this would be introducing tighter pre‐trade control. I have explained introduction of 5% dynamic price bands as pre trade control in recommendation section of this report.
Case 3 : NYSE Euronext cancelled all trades in the $74.8 billion SPDR S&P 500 ETF Trust that occurred at almost 10 percent below the security’s opening price, according to an email sent by the exchange. The trades occurred on the NYSE’s Arca platform at 4:15 p.m. New York time on 18/10/2010 and priced the exchange‐traded fund that tracks the Standard & Poor’s 500 Index at $106.46 compared with its opening price of $117.74. The ETF plunged 9.6 percent over eight seconds as 7.2 million shares traded on NYSE Arca, according to data compiled by Bloomberg. The S&P 500 rose 0.7 percent to close at 1,184.71 today. The glitch occurred after the closing auction was delayed due to a software upgrade at the exchange. Official closing price in each security is decided in an auction process conducted after close of the market.
Case 4 : Nasdaq & NYSE cancelled all trades in 296 securities that were executed at greater or less than 60% of their prices at 2:40 p.m. ET on May 6,2010
42 Structural Issues Concerning Algorithm Trading in India
Case 5: First case was of punching error in Tulip IT services on Jan 5, 2006. Tulip IT Services saw two unusual trades happening on its listing day. One deal saw 4,04,800 shares sold at 25 paise against the average price of Rs 185 at the Bombay Stock Exchange, while the other saw 5,95,575 shares sold at Rs 100 each. Those deals caused the seller a loss of Rs 12.69 crore in just 38 seconds. The first transaction led to a net loss of Rs 7.40 crore while the second transaction cost Rs 5.06 crore.
Case 6: The second case is freak trade in Reliance on June 1, 2010. A ‘market’ order to sell 1.6 lakh shares was entered in Reliance by a dealer at a broker‐member firm which got matched with ‘limit’ purchase orders in the trading system. Within few seconds of entering order, Reliance stock plunged to Rs 840.55 from pre‐trade price of Rs 1,010 causing script to fall by 19.56 %. Many analysts believe this trade might have cost broking firm a more than Rs 1 crore. Apart from loss to the broker, such trades hurt investor’s confidence which takes time to recoup.
Why is it important to implement such stringent operational dynamic price bands?
There were two cases in the history of Indian Securities Market that caused huge loss to the broking firms and their clients due to punching errors by operators.
Both of these cases could have been avoided, had there been 5% dynamic price band operational. Having narrow dynamic price band of 5% ensures that a single trade cant make any stock fall by more than 5%.

43 Structural Issues Concerning Algorithm Trading in India
Chapter 12
Algo approval, registration and risk management framework
Algorithm approval and registration
Because SEBI has not issued a specific guidelines regarding algorithm trading, there is divergence in operation of two major Indian exchanges. NSE requires all algorithms to be approved and all entities using algorithms to be registered. Whereas BSE requires mere registration to start Algo Trading. BSE does not require its member to disclose their proprietary trading algorithms to it.
Though BSE is following an international practice of non‐intervention by the exchanges in use of algorithms, it is quite a dangerous practice to start with in an market which is not yet fully developed and any event similar to Flash Crash in US may whisk away retail investors from securities market permanently. American and European exchanges have developed state of art technology to prevent any major breakdown of the system and in spite of these measures breakdown happens. And AT is a tool if not properly implemented and monitored can cause havoc. So it is better to be on cautious side than to repent later.
So I suggest that SEBI should issue guidelines to exchanges requiring them to approve algorithms prior to giving them permission to operate. Approval will be on the basis of implementation of risk control measures.
Procedure for granting permission to Trading Member for Algorithm Trading at NSE
a) NSE, on May 17, 2011, issued a circular to smoothen the process and facilitate early approval of decision support tools/ algorithms for trading through non‐neat front end. It categorised application for seeking approval in algo trading in three main categories viz. Approved Algorithms through CTCL, Non‐Approved Algorithms through CTCL and DMA Algorithms. This categorisation helps NSE to scrutinize new algos more for their pre‐trade and post‐trade risk controls than already approved algos.
b) On fulfilment of conditions as satisfactory and meeting SEBI and Exchanges minimum requirements, the exchange will identify the vendor’s/member’s algorithm as “Approved algorithm”.
c) Total procedure takes around 30 days to get algo approved from day of application. (For details refer to annexure II)
BSE does not require Algorithm approval to start algorithmic trading
44 Structural Issues Concerning Algorithm Trading in India
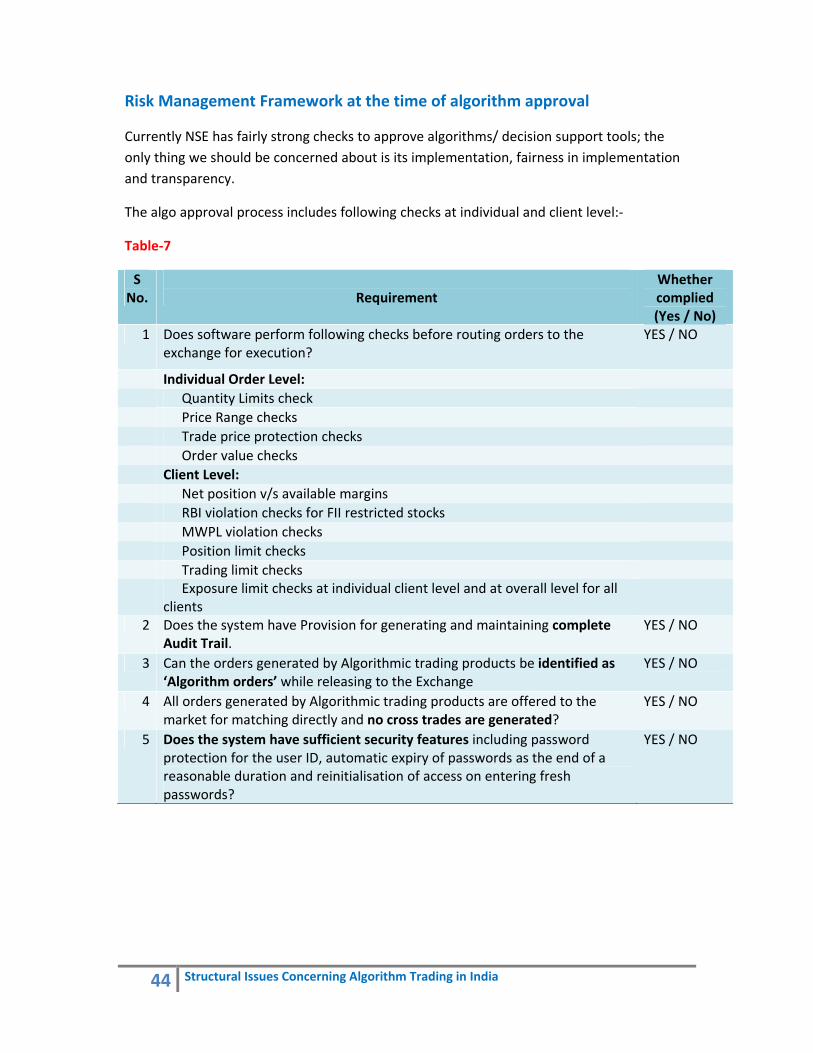
Risk Management Framework at the time of algorithm approval
Currently NSE has fairly strong checks to approve algorithms/ decision support tools; the only thing we should be concerned about is its implementation, fairness in implementation and transparency.
The algo approval process includes following checks at individual and client level:‐
Table‐7
S No.
Requirement
Whether complied (Yes / No)
1 Does software perform following checks before routing orders to the exchange for execution?
YES / NO
Individual Order Level: Quantity Limits check Price Range checks Trade price protection checks Order value checks Client Level: Net position v/s available margins RBI violation checks for FII restricted stocks MWPL violation checks Position limit checks Trading limit checks Exposure limit checks at individual client level and at overall level for all
clients
2 Does the system have Provision for generating and maintaining complete Audit Trail.
YES / NO
3 Can the orders generated by Algorithmic trading products be identified as ‘Algorithm orders’ while releasing to the Exchange
YES / NO
4 All orders generated by Algorithmic trading products are offered to the market for matching directly and no cross trades are generated?
YES / NO
5 Does the system have sufficient security features including password protection for the user ID, automatic expiry of passwords as the end of a reasonable duration and reinitialisation of access on entering fresh passwords?
YES / NO

45 Structural Issues Concerning Algorithm Trading in India
Chapter 13
Concerns 1. Are retail investors are at disadvantage due to use of AT and HFT
mostly by institutional investors?
Certainly not. First reason is typically investor’s investment horizon is long term, so milliseconds advantage, which comes at exorbitant cost, may hardly matter to them. Second even if they have millisecond of time advantage, they are not 100% sure about future price movement. What they know is probability of future price movement which any retail investor has an option to calculate on his own by using freely available data services. Third HFT does not compete with long term investors, they compete with other HFTS. As more and more HFT come in the market, they have less spreads to enjoy; they will have very short lived arbitrage opportunities. So they will compete more on speed. If now they execute orders in milliseconds, in future they will develop technology that will execute trades in microseconds. Apart from this HFTs reduces spread and improves liquidity bring prices in all market on par and contribute to price discovery process. In absence of manipulative/ predatory strategies by HFT, retail investor will not be at disadvantage.
2. Is allowing use of DMA facility, COLO facility and SOR facility give an unfair advantage to some of the market participants?
In India, non intermediary DMA facility is not allowed, which means all the orders of clients have to go through broker and will be tagged as that broker’s order. So there is less scope of manipulation as order generally goes through broker’s risk management system. Broker is not able to stop or modify the order manually but its system can reject the bad orders upfront. This leaves only one way to misuse DMA, i.e when broker itself relaxes his automated risk controls for his client.
Colocation is service offered by exchanges to their trading members to setup their servers close in proximity of exchanges order matching system in order to reduce network latency and access latency. The service offers varied advantage including low turnaround time, which is very crucial for HFT, alternate setup in case of network or system breakdown. Colocation facility offers usually 1‐2 milliseconds advantage to their TMs, which reduces trading latency. So as stated in 1st concern, 1‐2 millisecond advantage may not matter to long term investors and that too at exorbitant cost. The problem with this service starts when exchanges collude with brokers to increase their business by adopting unethical and unfair practices such as providing special data feeds, giving priority in order submission to collocated users, etc.
46 Structural Issues Concerning Algorithm Trading in India
SOR facility is algorithm that automatically routs the order to the exchange which offers best bid / best offer for investor. This service has been around for quite some time now in US & Europe and it contributes significantly to price discovery process. SOR is concern when it is used for Pinging / Sniffing out large order at some other exchange or at some other segment (block deal segment) and then trade ahead of institutional order. The other concern of SOR would be when exchanges put some restriction on its use to prevent flow of its business to some other exchange. Overall advantages overweigh disadvantages.
3. Does Algorithm Trading improve Market Quality?
As discussed in the topic “Impact of HFT on market quality”, HFT in Us has helped reduce spreads and improve liquidity. Also HFT has increased depth of the order books. However they might not have considerable impact on change in the volatility. The effect of HFT on volatility was inconclusive but still was leaning in the favour of HFT. Many researchers and exchanges have corroborated the point that there is no significant correlation between participation of HFTs and volatility. And event such as Flash crash could have occurred even in the absence of HFTs. Since HFT is part of Algo Trading and presents more severe risk than non High Frequency algo trading, we can safely extent conclusions of above study to AT as well. Here we should make a note of one point that significant number of HFTs in US are market makers have employed rebate trading strategies due to favourable maker‐taker structure. So assuming that liquidity will improve also in India because of introduction of AT would be incorrect.
4. Is HFT and AT in the long term interest of the market development?
The answer depends upon fairness and ethics of the market participants including exchanges. Few may twist and bend the rules to suit them. But this should not stop us from moving ahead with time. Market developments should not be stopped just because we fear some may misuse the system. So it is always advisable to start with cautious approach by slightly regulating market with a long term view of relaxing the
regulations. SEBI can not and should not regulate each and everything. It is beyond its scope. But at any point in time message should be loud and clear “Whatever you do, We are watching you.” There are quite a few advantages of AT, which includes increase in liquidity, decrease in the spreads, better price discovery, more participation by Oversees

47 Structural Issues Concerning Algorithm Trading in India
Institutions and it can be used as risk management tool. To sum it up, I can say “AT and HFT are in the long term interest of the market. Its advantages outweigh disadvantages and I believe it is the need of the time and if we don’t change now time will change us.”
5. Is infrastructure in India adequate enough to handle AT and HFT?
If publically available information is to be believed, we have adequate technological infrastructure to allow AT operations but certainly it’s not one of the best. We fall short on standards set by NYSE, NASDAQ and few other European exchanges. For example, Latency (response time) at NYSE and NASDAQ are 25 microseconds and 143 microseconds respectively compared to 5,000 microseconds and 10,000 microseconds at BSE and NSE respectively. Since India is the 4th largest country in the world in terms of number of trades, Indian servers have been always overburdened and introduction of AT and HFT will make thing worse as it will put an additional load on existing overburdened system.
6. Do we have sufficiently robust real‐time risk management system? For non‐algorithmic trading and non‐HFT, we have sufficient strong risk management system which includes pre‐trade order controls, price and quantity freeze, security wise and marketwise circuit breakers, real time margin collection system, and barring client/TM/CM from taking any position if their limits are exhausted. In algorithmic trading this task may get little complicated owing to tremendous speed of executions and DMA facility which may bypass TM’s risk management framework. To be doubly sure, it is worthwhile to survey and audit exchanges Risk Management systems from algo trading perspective. It is also required that exchanges should provide their “Risk control checklist” to SEBI so that SEBI could decide minimum “risk control checks” for all the exchanges before giving approval to algorithms.
7. Are there any systemic risk arising from Algo Trading?
There is possibility of systemic risks, if exchanges are hand in glove with their Trading members. If exchanges provide special feeds to brokers who have colocated their servers at exchanges, then it gives unfair advantage to some market participants.

48 Structural Issues Concerning Algorithm Trading in India
Apart from this widespread use of any of the fraudulent practices such as Front Running, Order stuffing /Quote stuffing, Flash Trades, Internalisation/ Cross Trades, Layering, Dark pools and Wash Trades may cause systemic failure of financial system in India.
49 Structural Issues Concerning Algorithm Trading in India
Chapter 14
Recommendations
1. SEBI should develop order segregation platform / or upgrade an “Integrated Market Surveillance System"(IMSS) to segregate AT order, HFT order, COLO order, DMA order and SOR order individually or in combination. Exchanges are saying that they have assigned unique digit code for each 15 digit order and hence orders can easily be segregated. If so, SEBI should be in the position to segregate orders with any combination of orders and entities/persons. For example‐ On a particular day, SEBI should be in the position to identify “Number of orders cancelled by a XYZ HFT firm, which were entered through DMA facility”
If Flash Crash like event happens in India, How will we investigate the matter if we don’t have data? How will we know which algo traders sold X number of shares and at what time? How will possibly we know about ongoing manipulations or malpractices if we can’t segregate trades based on their type of origin? How will we be able to pinpoint a specific type of trading that caused havoc? And how will we be able to develop guidelines if regulator itself is clueless about market conditions?
2. Introduction and strengthening of three tier pre‐trade controls Pre‐trade controls are proactive in nature rather than reactive. Pre trade controls help avoid entry of erroneous trade and violation of limits by different participants. Pre submission order level filters and Pre submission account level filters are employed at broker’s end. These measures help exchanges to reduce latency or roundtrip execution time as more and more orders will be rejected at broker’s end only.
• Pre‐submission order level filters: Filters that assess an order as a discrete unit rather than as part of an account. Filters are designed to prevent errors in price, value and direct compliance such as short selling.
• Pre‐submission account level filters: Filters that assess an order in the context of account level exposure. Such filters depend on a consolidate account position irrespective or execution venue.
• Pre-execution Exchange level filters: Any order submitted to exchange should be authenticated for quantity, price, clientwise and TMwise limits and any other relevant criteria. It also checks for price bands and marketwide circuit filters.
50 Structural Issues Concerning Algorithm Trading in India
3. Introduction of 5% dynamic price bands on all securities (One of the Pre‐submission order level filter)
• Introducing price filters to prevent systems from entering erroneous trades.
• Dynamic price band should be defined as 5% of the last traded price in all scripts listed at NSE & BSE.
• This price band will change with every new trade happening. If changing price bands with every new trade is not feasible, we can implement it on 5 seconds delayed basis. So price band will change every 5 seconds.
• Just for example :‐ If a XYZ stock is currently trading at Rs 100, Any algo trading system will not be able to enter buy order at more than Rs 105 and sell order at less than 95. However buy order shall be allowed to enter below 95 and sell order shall be allowed to enter above 105. Placing a buy order below current market price & placing a sell order above CMP will improve liquidity as this would increase number of passive orders sitting in the order book.
• This rule should only be made applicable for “Limit Orders” and “Market Orders” and should not be made applicable to “stop‐loss orders”. In stop Loss order trader can place trigger price and limit price at any price he desires.
• This pre submission order level check will be validated at broker’s (Trading Member’s) end and the order will be rejected outright and will not be submitted to exchange.
• This rule should also be extended to all manually entered as well as non‐algorithmic order.
• This rule should also be made applicable on the first trading day of the IPO listing.
• This rule ensures that any single trade cant make any stock fall by more than 5% irrespective of quantity and price entered.
4. Mechanism to flush out all the pending orders
On May 6, 2010, Dow Jones Index tumbled more than 6% in just 4 minutes due to relentless selling by HFTs in E‐Mini 500 contracts. In order to prevent a cascade of further price declines, CME triggered “STOP LOGIC FUNCTINALITY” which halted trading in E‐mini future contracts for 5 seconds.
“In that short period of time, sell‐side pressure in the E‐Mini was partly alleviated and buy‐side interest increased. When trading resumed at 2:45:33 p.m., prices stabilized and shortly thereafter, the E‐Mini began to recover.” Said SEC‐CFTC joint report.

51 Structural Issues Concerning Algorithm Trading in India
STOP LOGIC FUNCTINALITY is basically disaster management tool and every exchange should have it in it arsenal. I expect NSE/BSE already have it and if not it is the time to develop one.
5. Introduction of Maker‐Taker Structure fee to improve liquidity Maker‐Taker structure involves giving credit to buyer or seller for providing liquidity to other market participants and charging fee for taking liquidity. Liquidity is provided by entering passive limit order and liquidity is taken when you hit the bid or take the offer by entering market order. An example of a new trading strategy that has emerged overseas and attracted the label ‘predatory’ is a Form of arbitrage designed to ensure that the HFT receives a rebate for providing liquidity to a retail or institutional investor. This is also called “Rebate Trading”. In India, BSE has introduced Maker‐Taker structure in its F&O segment but did not have any significant impact in its market share as it already had very little market share. Transaction charges/rebate for every 1 Lakh shares entered as Passive/Active orders are as follows Passive
OrdersActive Orders
Futures ( Stock & Index) Credit 1 Rs Charge 1.5 Rs Options (Stock & Index) Credit 15 Rs Charge 20 Rs
Passive Orders: Passive orders are defined as the orders that already exist in the order book at the time of matching (order taking place).
Active Orders: Active orders are defined as the orders that are matched against the orders already existing in the order book at the time of matching (trade taking place).
6. Asking exchanges to prepare a report on “Structural issues and systemic risks arising due to Algorithm Trading” It is a worldwide practice to update the regulator about operational problems, potential threats and latest happening on technology and development front. As exchanges are in direct contact with market participants and also know minuscule details about their order matching platform, they would be more equipped and in better position to help SEBI achieve its goals of market development and investor protection.
52 Structural Issues Concerning Algorithm Trading in India
London stock Exchange, Australian Securities Exchange and many other stock exchanges have prepared the report on above mentioned topic and are available to the public.
7. Audit and Survey of Exchanges risk management systems for
algorithmic trading by a special team and submit the report to the higher management on the same
On paper, NSE and BSE have sound Risk management System(RMS) but we need to ensure that a) system is faultless, b) Capable to monitor and control all trades c) is not or least susceptible to attacks on their servers/ order matching platforms d) is not prone to frequent breakdown and e) They have alternate RMS in case of breakdown. It is essential to assess all the risk control parameters and present risk management system before proposing any policy changes. Indian stock exchanges are not that keen on providing extra information. If SEBI, being a regulator, doesn’t know about their current RMS then possibly nobody would know about it until catastrophe occurs. So I hope, SEBI would send a special team to investigate all issues from AT perspective and given a chance, I would like to be a part of that team.
8. Defining some of the practices such as Front Running, Order stuffing /Quote stuffing, Flash Trades, Internalisation/ Cross Trades, Layering, Dark pools, Wash Trades and special data feeds as fraudulent and unfair trading practices, banning its use and defining punitive action if violated.
9. Data Reporting requirement NSE and BSE to prepare Monthly Report on Algo Trading in formats specified in Table 8 and should provide it to SEBI as and when asked. They should prepare and analyse AT firm wise report regularly, evaluate risks involved and brief SEBI in case there is any concern. Since information in table 8 is company specific, we can not publish it in our Monthly Bulletin and annual Reports. But this data is still needed to assess company specific risks, to investigate scams and to develop policies. For the information of Investors, exchanges need to provide data to SEBI in format specified in Table 9 on monthly basis. This data will help SEBI ensure that the required infrastructure for Algo Trading is in place and also it will provide Investors an option to exit the market, if they feel there is heightened risk due to high amount of Algo Trading Activity.
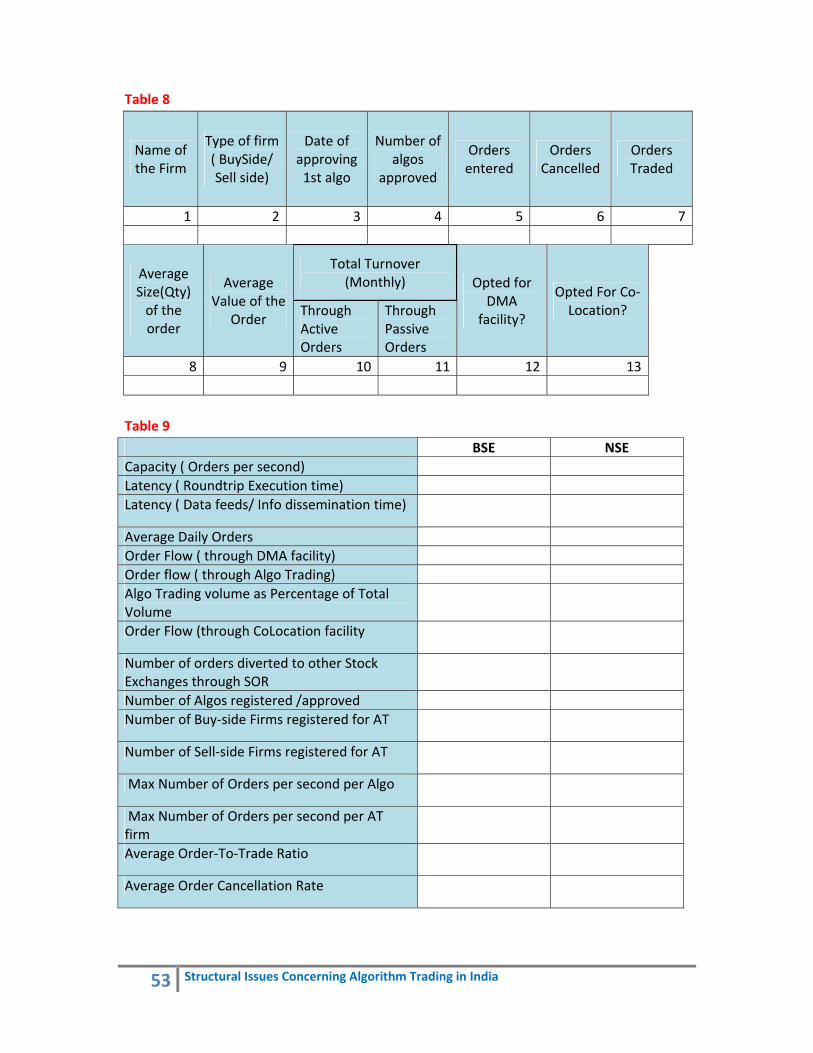
53 Structural Issues Concerning Algorithm Trading in India
Table 8
Name of the Firm
Type of firm ( BuySide/ Sell side)
Date of approving 1st algo
Number of algos
approved
Orders entered
Orders Cancelled
Orders Traded
1 2 3 4 5 6 7
Average Size(Qty) of the order
Average Value of the
Order
Total Turnover (Monthly) Opted for
DMA facility?
Opted For Co‐Location? Through
Active Orders
Through Passive Orders
8 9 10 11 12 13 Table 9
BSE NSE Capacity ( Orders per second) Latency ( Roundtrip Execution time)Latency ( Data feeds/ Info dissemination time)
Average Daily Orders Order Flow ( through DMA facility) Order flow ( through Algo Trading) Algo Trading volume as Percentage of Total Volume
Order Flow (through CoLocation facility
Number of orders diverted to other Stock Exchanges through SOR Number of Algos registered /approved Number of Buy‐side Firms registered for AT
Number of Sell‐side Firms registered for AT
Max Number of Orders per second per Algo
Max Number of Orders per second per AT firm
Average Order‐To‐Trade Ratio
Average Order Cancellation Rate

54 Structural Issues Concerning Algorithm Trading in India
Chapter 15
Conclusion Algorithm Trading has been accepted internationally due to: reduced market impact; increased trading efficiency; better alignment between strategy and execution and lower cost. AT is also seen to drive down trading costs. It is estimated that the use of AT reduces transaction costs by almost 75%. Another significant advantage is the anonymity of algorithms which helps prevent information leakage. Further, algorithmic strategies satisfy regulatory compliance. It also enhances the efficiency of the financial market for arbitrageurs and eliminates front running. While negatives of AT May Include undermined market stability due to frequent trading and system overload issues, which need to be resolved on urgent basis. HFT which is part of Algorithm Trading, as observed in the international markets, tends to a) Increase Liquidity b) Reduce spreads c) Contribute to price discovery process and d) have no impact on volatility. The larger concern about high‐frequency trading (HFT) is that it could destabilize markets, especially after the flash crash in the US on 6 May 2010. Many analysts believe that such a situation can arise even in a world without HFT and we should not punish HFT for such one‐off instance of heightened uncertainty. A flash crash situation arises when a large order is placed into a thin order book inadvertently. Few may twist and bend the rules to suit them. But this should not stop us from moving ahead with time. Market developments should not be stopped just because we fear some may misuse the system. So it is always advisable to start with cautious approach by slightly regulating market with a long term view of relaxing the regulations. SEBI can not and should not regulate each and everything. It is beyond its scope. But at any point in time message should be loud and clear “Whatever you do, We are watching you.”
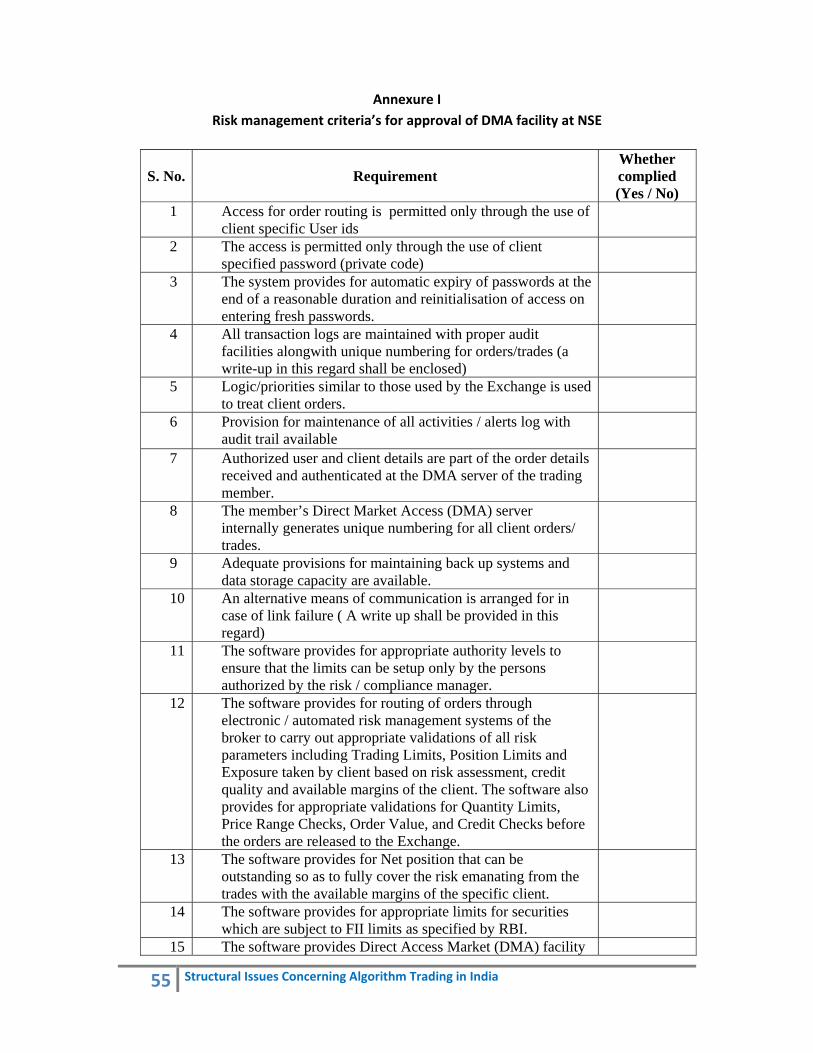
55 Structural Issues Concerning Algorithm Trading in India
Annexure I Risk management criteria’s for approval of DMA facility at NSE
S. No.
Requirement Whether complied (Yes / No)
1 Access for order routing is permitted only through the use of client specific User ids
2 The access is permitted only through the use of client specified password (private code)
3 The system provides for automatic expiry of passwords at the end of a reasonable duration and reinitialisation of access on entering fresh passwords.
4 All transaction logs are maintained with proper audit facilities alongwith unique numbering for orders/trades (a write-up in this regard shall be enclosed)
5 Logic/priorities similar to those used by the Exchange is used to treat client orders.
6 Provision for maintenance of all activities / alerts log with audit trail available
7 Authorized user and client details are part of the order details received and authenticated at the DMA server of the trading member.
8 The member’s Direct Market Access (DMA) server internally generates unique numbering for all client orders/ trades.
9 Adequate provisions for maintaining back up systems and data storage capacity are available.
10 An alternative means of communication is arranged for in case of link failure ( A write up shall be provided in this regard)
11 The software provides for appropriate authority levels to ensure that the limits can be setup only by the persons authorized by the risk / compliance manager.
12 The software provides for routing of orders through electronic / automated risk management systems of the broker to carry out appropriate validations of all risk parameters including Trading Limits, Position Limits and Exposure taken by client based on risk assessment, credit quality and available margins of the client. The software also provides for appropriate validations for Quantity Limits, Price Range Checks, Order Value, and Credit Checks before the orders are released to the Exchange.
13 The software provides for Net position that can be outstanding so as to fully cover the risk emanating from the trades with the available margins of the specific client.
14 The software provides for appropriate limits for securities which are subject to FII limits as specified by RBI.
15 The software provides Direct Access Market (DMA) facility
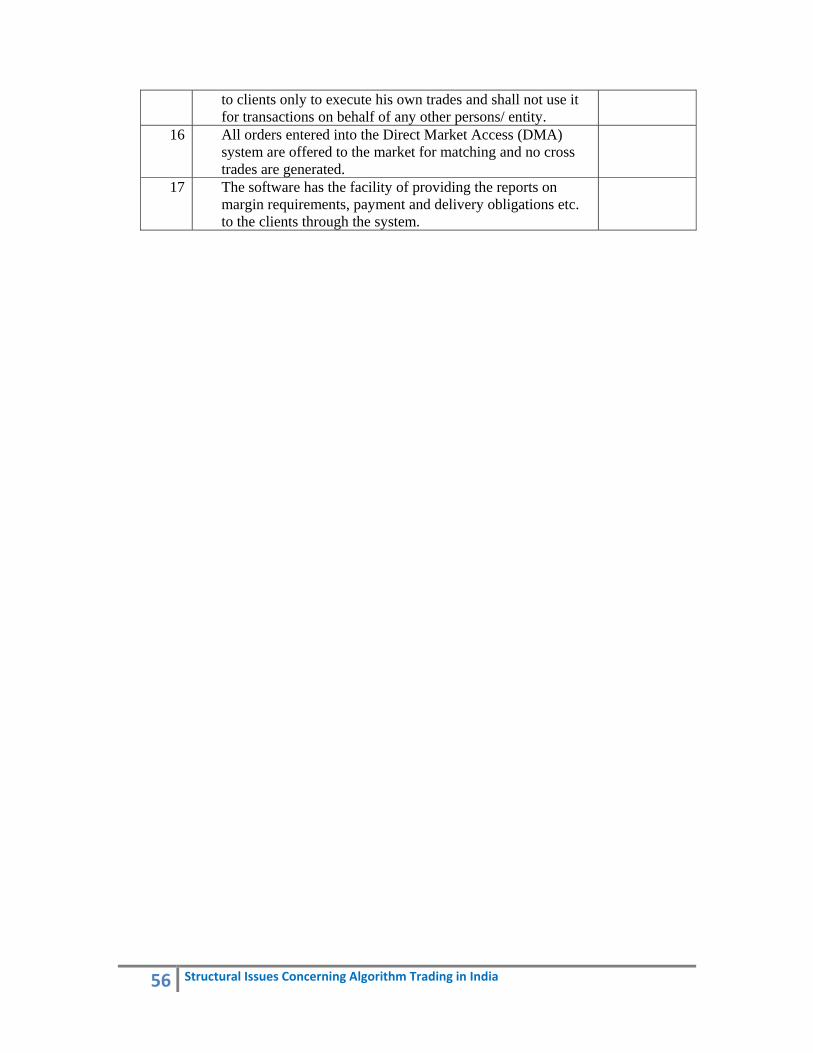
56 Structural Issues Concerning Algorithm Trading in India
to clients only to execute his own trades and shall not use it for transactions on behalf of any other persons/ entity.
16 All orders entered into the Direct Market Access (DMA) system are offered to the market for matching and no cross trades are generated.
17 The software has the facility of providing the reports on margin requirements, payment and delivery obligations etc. to the clients through the system.
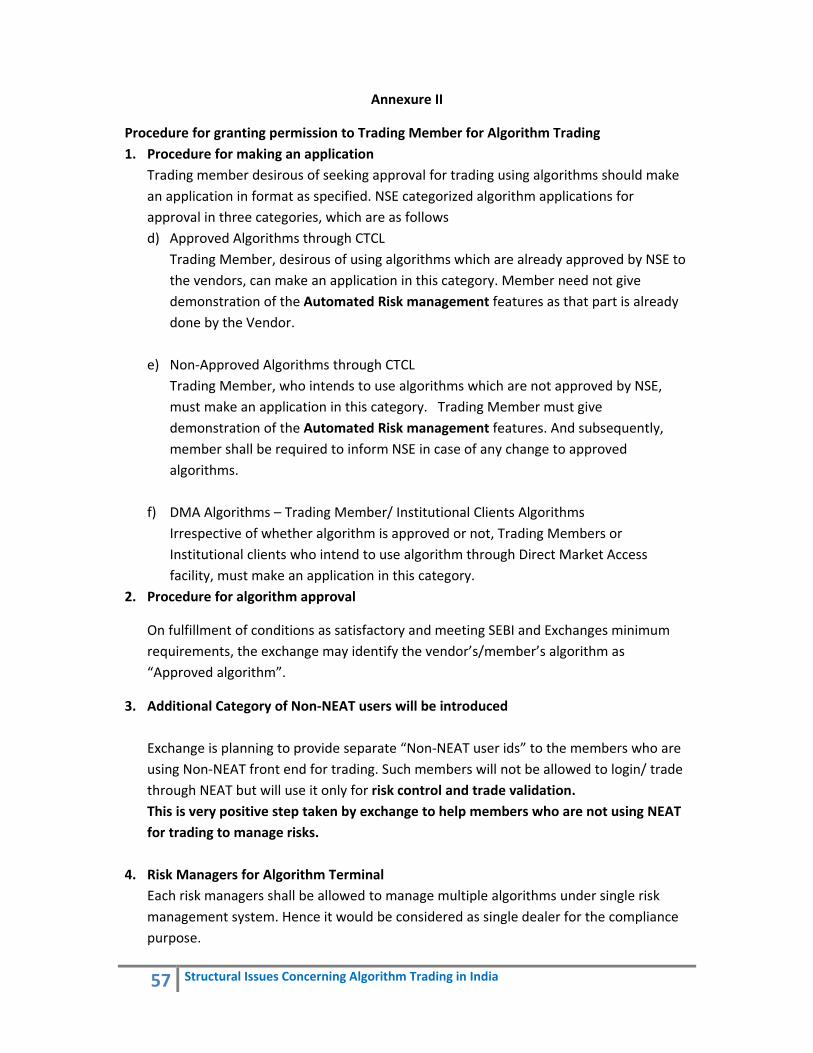
57 Structural Issues Concerning Algorithm Trading in India
Annexure II
Procedure for granting permission to Trading Member for Algorithm Trading 1. Procedure for making an application
Trading member desirous of seeking approval for trading using algorithms should make an application in format as specified. NSE categorized algorithm applications for approval in three categories, which are as follows d) Approved Algorithms through CTCL
Trading Member, desirous of using algorithms which are already approved by NSE to the vendors, can make an application in this category. Member need not give demonstration of the Automated Risk management features as that part is already done by the Vendor.
e) Non‐Approved Algorithms through CTCL Trading Member, who intends to use algorithms which are not approved by NSE, must make an application in this category. Trading Member must give demonstration of the Automated Risk management features. And subsequently, member shall be required to inform NSE in case of any change to approved algorithms.
f) DMA Algorithms – Trading Member/ Institutional Clients Algorithms Irrespective of whether algorithm is approved or not, Trading Members or Institutional clients who intend to use algorithm through Direct Market Access facility, must make an application in this category.
2. Procedure for algorithm approval
On fulfillment of conditions as satisfactory and meeting SEBI and Exchanges minimum requirements, the exchange may identify the vendor’s/member’s algorithm as “Approved algorithm”.
3. Additional Category of Non‐NEAT users will be introduced Exchange is planning to provide separate “Non‐NEAT user ids” to the members who are using Non‐NEAT front end for trading. Such members will not be allowed to login/ trade through NEAT but will use it only for risk control and trade validation. This is very positive step taken by exchange to help members who are not using NEAT for trading to manage risks.
4. Risk Managers for Algorithm Terminal Each risk managers shall be allowed to manage multiple algorithms under single risk management system. Hence it would be considered as single dealer for the compliance purpose.