Embed Size (px)
Citation preview
1
Trade Policy and WTO Accession for Economic Development: Application to Russia and the CIS
Module 2
Openness, Growth and Poverty
by
Giorgio Barba Navaretti and Marcello Spanò
Revised, April 16, 2005
2
This chapter examines the effects of trade on growth and poverty. It addresses the following
questions:
• Which are the channels through which trade openness may affect the economic activities of
a given country?
• What are the effects of trade openness on growth?
• What are the effects of trade openness on poverty and income distribution?
By addressing these questions we derive the following main lessons.
Lesson 1. The first channel by which trade openness affects the economic activities of a given
economy is through a reallocation of resources. By pushing domestic product prices close to world
prices trade forces economies to produce only goods they can produce relatively cheaply and
efficiently and to buy the rest in the world market.
TABLE OF CONTENTS
1. Trade openness growth and poverty: analytical framework ....................................................................................... 5 1.1 Economic growth................................................................................................................................................. 6 1.2 Poverty and income distribution........................................................................................................................... 8
2. Cross-country evidence. ............................................................................................................................................... 11 2.1. Does openness affect growth? ........................................................................................................................... 11 2.2. Does openness affect convergence of income? ................................................................................................. 14 Box 1. Government Policies for Competitiveness in a Global Economy by David G. Tarr................................. 17 2. 3. Does openness affect absolute poverty? .......................................................................................................... 18 2. 4. Does openness affect income inequality? ........................................................................................................ 22
3. Country studies............................................................................................................................................................. 23 3.1. Policy strategies................................................................................................................................................. 24 3.2 Microeconomic effects of trade liberalisation .................................................................................................... 27
Appendix 1. Reallocation of resources in the Hecksher Olin model ............................................................................... 31 Appendix 2: How to measure openness and poverty....................................................................................................... 32 References ........................................................................................................................................................................ 34
3
Lesson 2. The second channel by which trade openness affects the economic activities of a given
economy is through the improved access to foreign technologies and resources. Through trade
economies have access to a much wider variety of goods and factors of production, including
technologies, than those available in the domestic market.
Lesson 3. Trade openness is a necessary condition for faster long term growth. There are no
sustainable development miracles without a substantial expansion of exports and integration into
the world economy. There is no evidence that protection and trade barriers favour long term
sustainable growth. Trade is expected to foster growth as far as it leads to an efficient use of
resources. Trade barriers typically shelter domestic producers from the international market.
Although this may be advantageous for protected sectors, it is unlikely to induce an efficient
allocation of resources in the whole economy. Trade liberalisation, in contrast, encourages an
efficient exploitation of resources which in turns may trigger economic growth. Equally, access to
foreign technologies and inputs provides developing countries with the opportunity of using and
applying the results of R&D in foreign countries. The empirical evidence supports this prediction
that trade leads to faster growth. In contrast, several studies, particularly conducted during the
Eighties and the Nineties, provide robust evidence of how protectionist strategies, like import
substituting industrialisation, have proven to be unsustainable in the longer term and not a viable
shortcut to prosperity.
Lesson 4. However, trade openness in itself is not always a sufficient condition to achieve
faster growth. It needs to be coupled with other policies, like macroeconomic stability and
institutional reforms. There is consensus that openness provides a necessary environment for
economic growth, but the experience of many countries which reduced their barriers to trade in the
last two decades, is controversial. For most this has resulted in higher growth and improved
economic performance, while for others there has been only a limited supply response and
disappointing results. Whereas the trade and development literature of the 1960s and 1970s
contended that “getting prices right” would result in improved economic performance, it is now
recognized that these reforms are necessary but not sufficient to generate growth. Other conditions,
like macro-economic stability, policy credibility, enforcement of contracts and (under very specific
conditions) some targeted interventions are also fundamental (Panagariya, 2004). It is therefore very
important to understand under which conditions a country can reap the benefits of trade and what
measures are needed to make sure that these conditions are actually in place.
Lesson 5. Trade openness, particularly through its effects on growth, has been effective in
reducing absolute poverty. Trade has also effects on poverty. Part of the story is related to growth
and how far it trickles down to the poor. That growth alleviates poverty is a robust empirical
4
regularity, little disputed in the literature (World Bank, 2002). In fact, it is rare that growth is so
biased against the poor to increase absolute poverty. The poor can also benefit from a favourable
reallocation of resources induced by trade liberalisation. Many poor rural households in developing
countries would likely benefit from a reduction of trade barriers in agriculture. Or, poor urban
household would gain from increased access to cheaper imported consumer goods.
Lesson 6. Trade openness may instead have ambiguous effects on income distribution. Trade
liberalisation engenders important redistributive effects, leaving behind winners and losers. For
example, if trade is liberalised in import competing sectors and consequently prices decline,
producers will be worse off and consumers better off. Therefore, even when the net effect is
positive, some people may take losses, and these could possibly be concentrated among the poor.
For this reason, trade liberalisation should be coupled with safety nets protecting the more exposed
and weaker components of society.
Lesson 7. Country studies show that there are different models of successful trade liberalisation
Countries which have successfully liberalised trade and achieved rewarding growth rates have
followed different strategies based on different mix of ingredients: exchange rate management (e.g
Chile); reduction of trade barriers like tariffs and non tariff barriers (Chile, Singapore, Hong
Kong); introduction of export processing zones (e.g. Mauritius); targeted interventions to support
the export industry (e.g. Korea)
In the first part of this chapter we develop an analytical framework to discuss the channels
linking trade openness to growth and poverty. We then look at the empirical evidence. The evidence
can be organised under two broad headings: cross country studies and country specific studies. The
former examines if countries that have liberalised trade have performed better than those which
have not. Cross country evidence provides a useful broad picture, but no insights on specific policy
measures or on the microeconomic effects of liberalisation. These will then be discussed by
reviewing a few country studies.
The theoretical and empirical arguments are organised so as to support the lessons spelt out
above. The lessons are restated, whenever appropriate in the theoretical and empirical sections, and
indexed progressively with capital letters (e.g. lesson 1A, lesson 1B) when there is more than one
argument supporting them and these are spread in different part of the text (e.g. theoretical and
empirical arguments).
1. Trade openness growth and poverty: analytical framework
Key question: which are the channels through which trade affects growth and poverty?
5
Lesson 1. The first channel through which trade affects growth and poverty is a reallocation of resources
Lesson 2. The second channel through which trade affects the economic activities of a given
economy is towards improved access to foreign technologies and resources.
We can identify two channels through which trade affects growth and poverty. The first one
is that relative product and factor prices are different under free trade than under autarky. Start with
a country very protected from international trade. The government decides to liberalise trade. How
can it do it? Essentially, by lifting those earlier measures which were keeping the economy isolated
from international trade. As argued in module 1 all these measures have directly or indirectly to do
with prices: high tariffs, a misaligned exchange rate, quantitative restrictions (which under given
circumstances are equivalent to tariffs). In turn, these changes in relative prices affect the supply
and demand of goods and factors of production, which produce further changes in relative prices.
Consequently, under the two regimes the allocation of resources is different, factors are used
in different combinations and products are different. The most widely known analytical framework
to study the effect of trade on the allocation of resources according to comparative advantage (to
what countries can do relatively more cheaply then other countries) is the Hecksher-Olin model,
which is described in Appendix 1. We will see how this reallocation of resources can have effects
on the efficiency of the economy and thus on its long term growth prospects.
The second channel of transmission is that with trade an economy has access to bigger
markets and new inputs, like capital and technologies. With bigger markets, if there are increasing
economies of scale, it can produce at lower costs, use fewer resources for unit of output and grow
faster. With additional factors of production than those available at home, with new and more
productive technologies it can also raise efficiency and grow faster.
In what follows we examine how reallocation of resources and access to new product and
factor markets affects growth, poverty and income distribution.
1.1 Economic growth
Key question: what does theory predict on the effects of trade openness on growth? Lesson 3A. Theory predicts that trade openness provides a conducive environment and a
necessary condition for faster long term growth.
The reallocation of resources induced by trade may have effects on economic growth. Trade
barriers typically shelter domestic producers from the international market. Although this may be
6
advantageous for protected sectors, it is unlikely to induce an efficient allocation of resources in the
whole economy. Trade liberalisation, in contrast, encourages an efficient exploitation of resources
which in turns may trigger economic growth.
However, to understand the full effect of trade on economic growth we should not just
consider the first reaction of the economy to a shock in relative prices following trade reforms. We
should examine also whether growth can be sustained in the long term. Several studies explain the
long run mechanisms relating openness to growth and analyse growth as a self-enhancing process
(endogenous growth models). Trade integration may favour economic growth by changing the
incentives and the opportunities to invest, to produce a larger number of varieties, to specialise in
goods with a high potential for technological learning and innovation. (Romer, 1989, Young, 1991,
Grossman and Helpman,1991).
One important process is the transfer of technologies or other types of innovative knowledge
(managerial practices) which have been developed in a given country. These can be exported to and
used in other countries if there is free trade. Transfer of technology can take place in several ways:
spillovers or externalities (reverse engineering on imported components, product characteristics or
designs observed in export markets etc.); transfer of technologies embodied in machines or
components; training between suppliers and customers. Under free trade and if there were no
protection of property rights, knowledge can be seen as an international “public good”, available at
no cost to multiple users. A new discovery carried out in a particular country adds to the public
stock of knowledge, and all other countries can take advantage of it, therefore enhancing collective
growth opportunities.
Technologies can spread internationally also through Foreign Direct Investment (FDI). More
generally, a flow of foreign direct investment into a country brings new business practices and other
effects in domestic companies, which may affect their productivity and growth (Hejazi and
Safarian, 1999). There is widespread evidence that trade liberalisation favours the diffusion of FDI,
thereby enhancing their role as conveyors of foreign technologies and business practices (see
Module 15 on this).
Lesson 4A. However, theory, also predicts that trade openness in itself may not always be a sufficient condition to achieve faster growth.
Although trade openness is a necessary condition for faster growth, several contributions in
the literature help explaining why the relationship between trade and growth can be controversial
and why some countries fail to exploit trade to converge towards higher levels of income per capita.
The development process in some countries may fail due to ‘poverty traps’, in which slow growth
7
and poor initial conditions sustain each other. For example, trade could induce countries to
specialise in products like primary commodities with little potential for enhancing productivity and
growth (Young, 1991, Grossman and Helpman, 1991).
Also, new developments in the theory of international trade show that in addition to
comparative advantage ( according to which each country specialises in what it can do better than
others - see appendix 1 below), the roles of geography and investment flows are extremely
important. According to these theories, different forces interact in a complex way to determine
patterns of agglomeration or dispersion of economic activities, leading to spatial inequalities. In this
framework some activities will cluster in few locations, where there is a sufficient ‘critical mass’ of
infrastructure, human capital , technological knowledge etc. When a country opens up to world
trade it is initially hard to attract these activities.
Finally, an economy could be affected by distortions or intrusive factors that could make
trade policy totally irrelevant. For example, labour market rigidities or an inefficient financial
sector may hinder the process of adjustment and reallocation of resources which is necessary for
trade liberalisation to speed up the rate of growth. A non conducive investment climate or a
distorted macroeconomic framework leading to financial instability and, even more, corruption,
wars and political unrest discourage new investments in tradable activities. Under these
circumstances trade policy is little effective in changing the incentive framework.
The bottom line is that countries are expected to grow faster with trade, but in many
circumstances other measures are necessary to make sure that they are able to exploit all the
advantages and the opportunities offered by open economies. For example it is extremely important
that countries have stable macroeconomic policies and a clear legislative framework to attract much
needed foreign investments. Or the experience of many successful liberalisers shows that a
coordinated policy package is often necessary to create sufficient momentum for a ‘big push’, in
which industrialization and technological upgrading become self-sustaining
1.2 Poverty and income distribution
Key question: what does theory predict on the effects of trade openness on poverty and income distribution?
Lesson 5A. Theory predicts that trade openness can reduce average absolute poverty.
The first link between trade and poverty is an indirect one, through growth of income per
capita. If trade enhances growth, does it also implicitly reduce poverty? This partly depends on the
relationship between growth and poverty. It is indeed likely that all households living in a country,
8
richer and poorer, get better off if the country exhibits a sustained growth rate., although the speed
of poverty reduction depends on how increasing wealth is distributed among individuals (or
households).
Not all the opportunities of poverty alleviation arising from trade openness are linked to
economic growth. There are other possible channels through which openness may improve the
welfare conditions of the poor. The Hecksher-Olin model and the Stolper Samuelson theorem
described in Appendix 1 show that trade reforms induce changes in the relative demands and prices
of goods and factors and these changes are not equally distributed across people in a given country.
What can we say, more specifically, about the poor? Do they take advantage from this process of
reallocation of resources? Yes, under many circumstances. If exported products are produced by
poor urban workers, or poor rural workers, then liberalisation helps reducing poverty, as the wages
of the poor will rise. Similarly, if the poor are also intensive consumers of imported products, say
clothes, they gain from liberalisation as the consumer prices they face decline. Thus, as far as a
sufficiently large share of the poor benefit from the reallocation process, then average absolute
poverty will decline. However, the poor can find themselves on the wrong side of the reallocation
process, for example as workers in import competing industries and loose out from liberalisation.
Therefore, although the net effect on absolute poverty is positive, some people may take losses and,
if these are concentrated among the poor, income distribution worsens.
Lesson 6A. However, theory also predicts that the reallocation of resources induced by trade openness may instead have controversial effects on income distribution, especially in the short term.
The problem can be especially harsh if the adjustment process is slow. Consumers may be
unable to find cheaper substitutes to products the price of which rises because of export demand.
Equally, producers may not be able to move towards the production of more profitable goods,
because they are unable to use the required technology; workers laid off from import competing
firms might not find alternative jobs in the export sector, because they are not qualified or because
they are unable to move where the export sector is located. Thus, the effect of liberalisation
crucially rests on how low income households are able to adjust to the new set of prices and
incentives generated by trade reforms. For these reasons it is essential that growth rapidly bites in to
offset these likely adjustment costs.
9
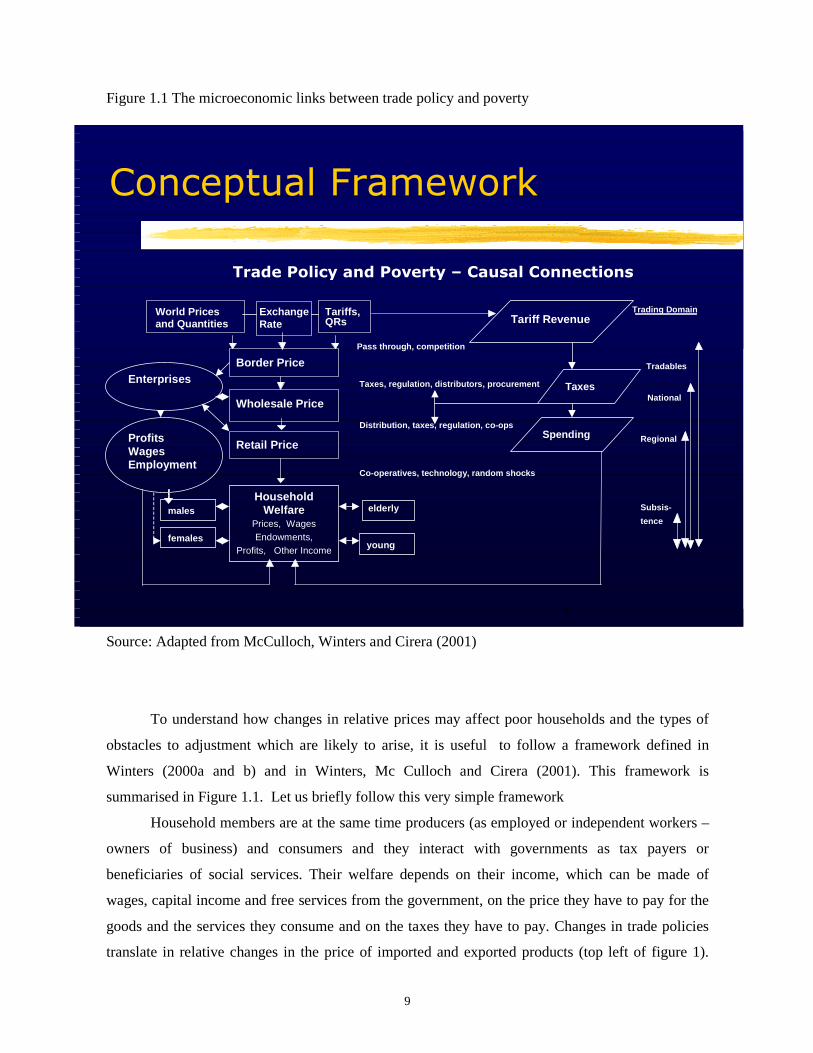
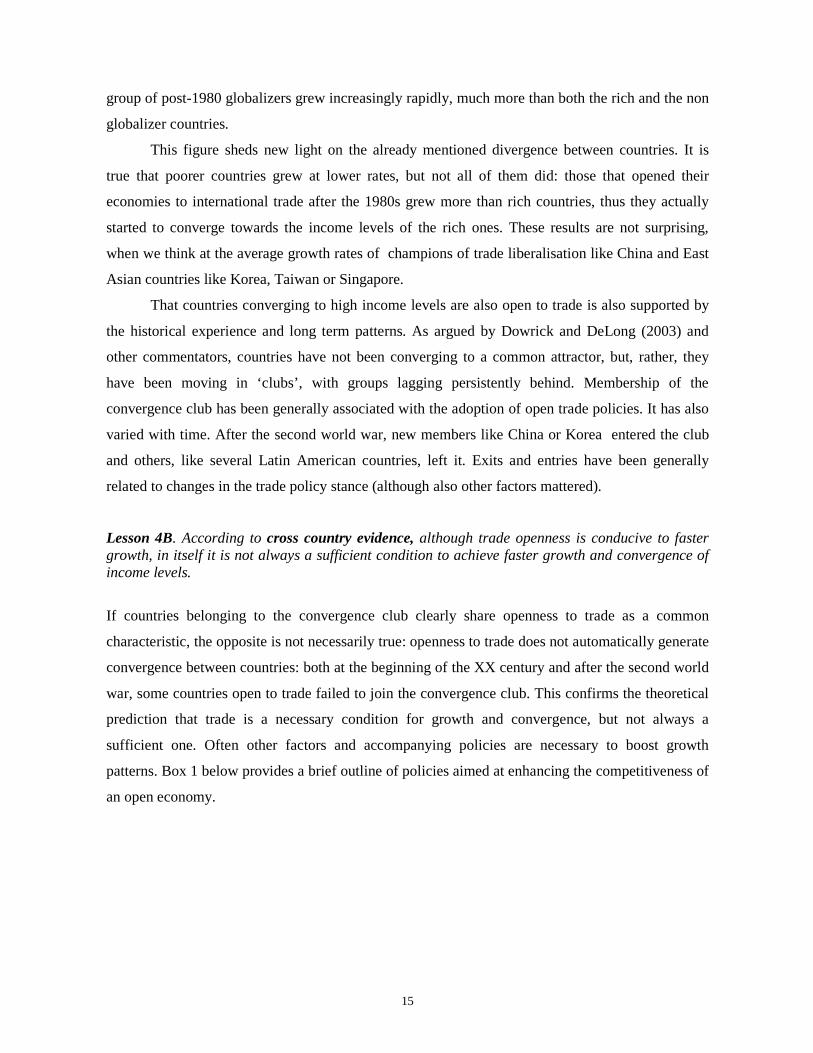
Figure 1.1 The microeconomic links between trade policy and poverty
Source: Adapted from McCulloch, Winters and Cirera (2001)
To understand how changes in relative prices may affect poor households and the types of
obstacles to adjustment which are likely to arise, it is useful to follow a framework defined in
Winters (2000a and b) and in Winters, Mc Culloch and Cirera (2001). This framework is
summarised in Figure 1.1. Let us briefly follow this very simple framework
Household members are at the same time producers (as employed or independent workers –
owners of business) and consumers and they interact with governments as tax payers or
beneficiaries of social services. Their welfare depends on their income, which can be made of
wages, capital income and free services from the government, on the price they have to pay for the
goods and the services they consume and on the taxes they have to pay. Changes in trade policies
translate in relative changes in the price of imported and exported products (top left of figure 1).
Conceptual Framework
Trade Policy and Poverty – Causal Connections
Trading Domain
Tradables
Pass through, competition
National
Taxes, regulation, distributors, procurement
Regional
Distribution, taxes, regulation, co-ops
Co-operatives, technology, random shocks
Subsis-
tence
World Pricesand Quantities
Border Price
Wholesale Price
Tariffs,QRs
Retail Price
)
ExchangeRate
elderlyHousehold
WelfarePrices, WagesEndowments,
Profits, Other Income young
males
females
Enterprises
ProfitsWagesEmployment
Tariff Revenue
Taxes
Spending
10
These changes in prices are transmitted to enterprises, to consumers (downward in figure 1) and to
the activities of the government (rightward in figure 1) and therefore affect all components of
households’ welfare. Members of poor households could be either employees or owners of the
enterprise. If firms suffers from foreign competition, profits and wages decline, workers can be laid
off and the firm even close down. If the firm is in the export sector it could then thrive and the
opposite happens. Of course, poor household badly hit by the liberalisation will suffer less if they
can easily adjust by finding a new job or opening a new activity in the export sector. For this reason
adjustment is a fundamental component linking trade to poverty. Also, safety nets compensating the
costs of adjustment are essential in preserving the income of the poor.
As for consumption, poor households will be better off if the prices of the goods and
services they use decline because import tariffs are reduced and quantitative restrictions lifted. But
these reductions in border prices will never reach poor consumers if the wholesale distribution of
these products is not competitive or regulated. Lower border prices will translate in higher profits
for wholesalers and consumer prices faced by the poor will remain unchanged.
Finally, a reduction in tariffs also reduces governments’ revenues. This is an important
source of revenue in developing countries, where the tax base for income taxes is very narrow.
Governments will then face the option of raising taxes and/or reducing public expenditure (even if
they can increase their deficit in the short term). The way in which these measures will impact on
the poor, depends on how tax increases are distributed among income brackets and on whether
expenditure is reduced for services that especially cater to the needs of poor households.
It is easy to understand how all these effects are very country specific and why trade policies
need to be supplemented by a range of other policies if the benefits of liberalisation are to trickle
down to the poor(see Winters 2002 for a detailed analysis of these policies). However, it should also
be clear that these adjustment costs are normally short term and likely to be offset in the longer term
by faster growth.
We now move to the empirical evidence.
2. Cross-country evidence.
This section focuses on cross country evidence. This includes empirical works which
compare, within a unified framework, several countries according to their degree of openness to
trade. These works study if openness affects some measure of performance (growth, absolute
poverty, income distribution) (Dollar, 1992, Levine and Renelt 1992, Edwards 1993, Sachs and
Warner 1995, Frankel and Romer, 1999, Baldwin and Spergami, 2000, World Bank, 2001 and Irwin
11
and Tervio 2002, Wacziarg and Welch, 2003). Although cross-country comparisons are fraught
with technical problems and it is not always easy to reach firm conclusions on the causal
relationship between openness and performance, they allow for a first hand comprehensive way of
comparing the different experiences of several countries (Rodriguez and Rodrik, 2000).
In what follows we review the main results of this literature. We first discuss the
relationship between trade and growth and then between trade and poverty.
2.1. Does openness affect growth?
Key question: what are the effects of trade openness on growth according to cross-country evidence?
Lesson 3B. According to cross country evidence, trade openness is associated to faster
growth. There is no evidence of sustainable development miracles without export expansion and integration into world markets. Several contributions also find evidence that trade openness has a positive causal effect on growth. There is no evidence of the contrary, that protection and trade barriers favour long term sustainable growth.
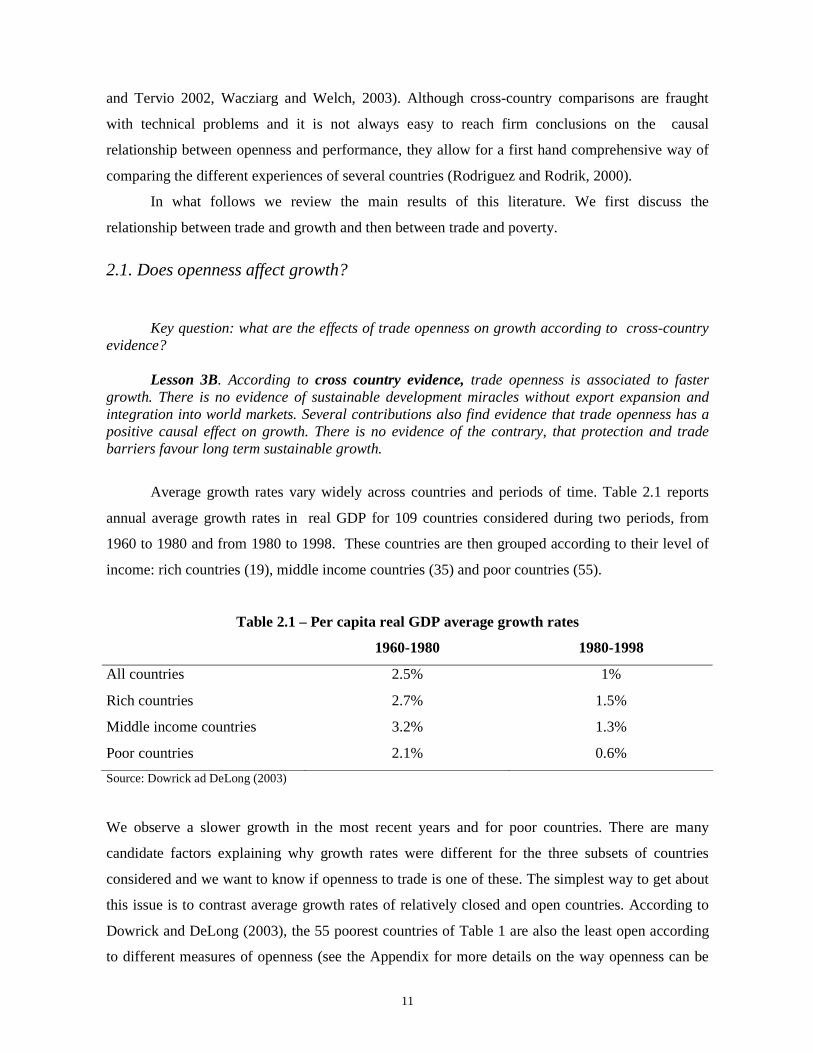
Average growth rates vary widely across countries and periods of time. Table 2.1 reports
annual average growth rates in real GDP for 109 countries considered during two periods, from
1960 to 1980 and from 1980 to 1998. These countries are then grouped according to their level of
income: rich countries (19), middle income countries (35) and poor countries (55).
Table 2.1 – Per capita real GDP average growth rates
1960-1980 1980-1998
All countries 2.5% 1%
Rich countries 2.7% 1.5%
Middle income countries 3.2% 1.3%
Poor countries 2.1% 0.6%
Source: Dowrick ad DeLong (2003)
We observe a slower growth in the most recent years and for poor countries. There are many
candidate factors explaining why growth rates were different for the three subsets of countries
considered and we want to know if openness to trade is one of these. The simplest way to get about
this issue is to contrast average growth rates of relatively closed and open countries. According to
Dowrick and DeLong (2003), the 55 poorest countries of Table 1 are also the least open according
to different measures of openness (see the Appendix for more details on the way openness can be
12
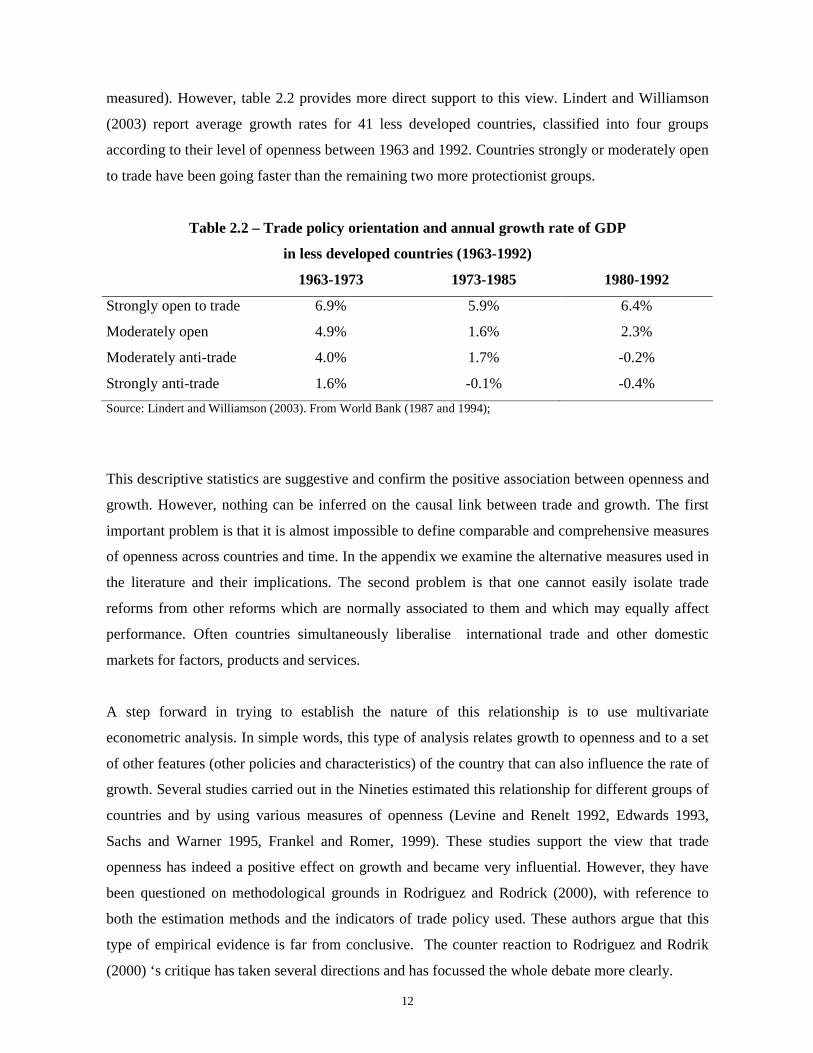
measured). However, table 2.2 provides more direct support to this view. Lindert and Williamson
(2003) report average growth rates for 41 less developed countries, classified into four groups
according to their level of openness between 1963 and 1992. Countries strongly or moderately open
to trade have been going faster than the remaining two more protectionist groups.
Table 2.2 – Trade policy orientation and annual growth rate of GDP
in less developed countries (1963-1992)
1963-1973 1973-1985 1980-1992
Strongly open to trade 6.9% 5.9% 6.4%
Moderately open 4.9% 1.6% 2.3%
Moderately anti-trade 4.0% 1.7% -0.2%
Strongly anti-trade 1.6% -0.1% -0.4%
Source: Lindert and Williamson (2003). From World Bank (1987 and 1994);
This descriptive statistics are suggestive and confirm the positive association between openness and
growth. However, nothing can be inferred on the causal link between trade and growth. The first
important problem is that it is almost impossible to define comparable and comprehensive measures
of openness across countries and time. In the appendix we examine the alternative measures used in
the literature and their implications. The second problem is that one cannot easily isolate trade
reforms from other reforms which are normally associated to them and which may equally affect
performance. Often countries simultaneously liberalise international trade and other domestic
markets for factors, products and services.
A step forward in trying to establish the nature of this relationship is to use multivariate
econometric analysis. In simple words, this type of analysis relates growth to openness and to a set
of other features (other policies and characteristics) of the country that can also influence the rate of
growth. Several studies carried out in the Nineties estimated this relationship for different groups of
countries and by using various measures of openness (Levine and Renelt 1992, Edwards 1993,
Sachs and Warner 1995, Frankel and Romer, 1999). These studies support the view that trade
openness has indeed a positive effect on growth and became very influential. However, they have
been questioned on methodological grounds in Rodriguez and Rodrick (2000), with reference to
both the estimation methods and the indicators of trade policy used. These authors argue that this
type of empirical evidence is far from conclusive. The counter reaction to Rodriguez and Rodrik
(2000) ‘s critique has taken several directions and has focussed the whole debate more clearly.
13
The first reaction has been to improve cross country analysis by taking into account the
methodological issues raised by Rodriguez and Rodrik. For example, Wacziarg and Welch (2002)
work on a panel data set (combining observation across time and across country). This type of data
allow them to observe also the within country effects of changes in trade policy, in other words,
whether countries grow faster after they liberalise trade. They find compelling evidence that this is
the case.
The second reaction is to note that if cross country evidence is to be rejected, we cannot prove the
opposite effect either, i.e. that trade liberalization harms growth. Rather there is not even descriptive
evidence of this link. Lindert and Williamson, 2003, note that the methodological ‘doubts that each
individual study might raise threaten to block our view of the overall forest of evidence’ p. 252.
They argue that one way of looking at the problem is to consider two sets of studies: one including
studies showing that protection helps and trade liberalisation harms third world economic growth;
another one including countries which were more closed to trade and factor flows in the Nineties
than in the Sixties and rose in the global living standard ranks. Now, the first set is almost empty
and the second one completely empty.
In other words, even if the evidence that trade has positive effects on growth can be questioned on
methodological and other grounds, there is no competing evidence supporting the alternative
scenario, i.e. that protection favours economic growth in the longer term. In contrast, several
studies, particularly conducted during the Eighties and the Nineties, provide robust evidence of how
protectionist strategies, like import substituting industrialisation, have proven to be unsustainable in
the longer term and not a viable shortcut to prosperity (see de Melo and Grether, 2001 for a survey
of this evidence).
2.2. Does openness affect convergence of income?
Key question: does trade affect growth more in poor than in rich countries and therefore
favours the convergence of the poor to high levels of income?
Lesson 3 C: According to cross country analysis, those developing countries that managed to grow faster than rich countries and to converge to their income level are open to trade
Up to now we have questioned whether trade policy affects growth. Yet another question is
whether it affects growth more in poor than in rich countries. This is of course essential for low
14
income countries to acquire income levels close to those of the advanced economies. This catching
up process is normally defined as convergence, which implies that poor countries grow much faster
than rich ones. If we look at convergence per se, poor countries have lagged behind compared with
both middle income and rich countries, even if they had positive rates of growth. In other words,
even if poor countries have turned richer on average, in relative terms they became poorer than
nearly forty years ago, as their distance from rich countries widened instead of narrowing down.
What is the role of trade in this process. If, as we have seen above, openness affects growth,
what is its impact on convergence? Does it help poor countries to grow faster than rich ones? Again,
as an initial step it is useful to consider average trends by comparing groups of countries classified
according to their level of openness. Here, though, the picture is slightly more complex than in the
previous section as we need to take into account three dimension, not two as before: growth of
income, openness and the initial level of income. To this purpose, Dollar and Kraay (2000) divide
countries into three groups: the rich countries that since the second world war can all be assumed to
be open to trade; developing countries which have adopted open trade policies after 1980
(globalizers); developing countries which have not adopted open trade policies after 1980 (non-
globalizers). Around 1980 many previously protected developing countries liberalised trade. The
threshold between globalizers and non globalizers is based on the ratio of the sum of exports and
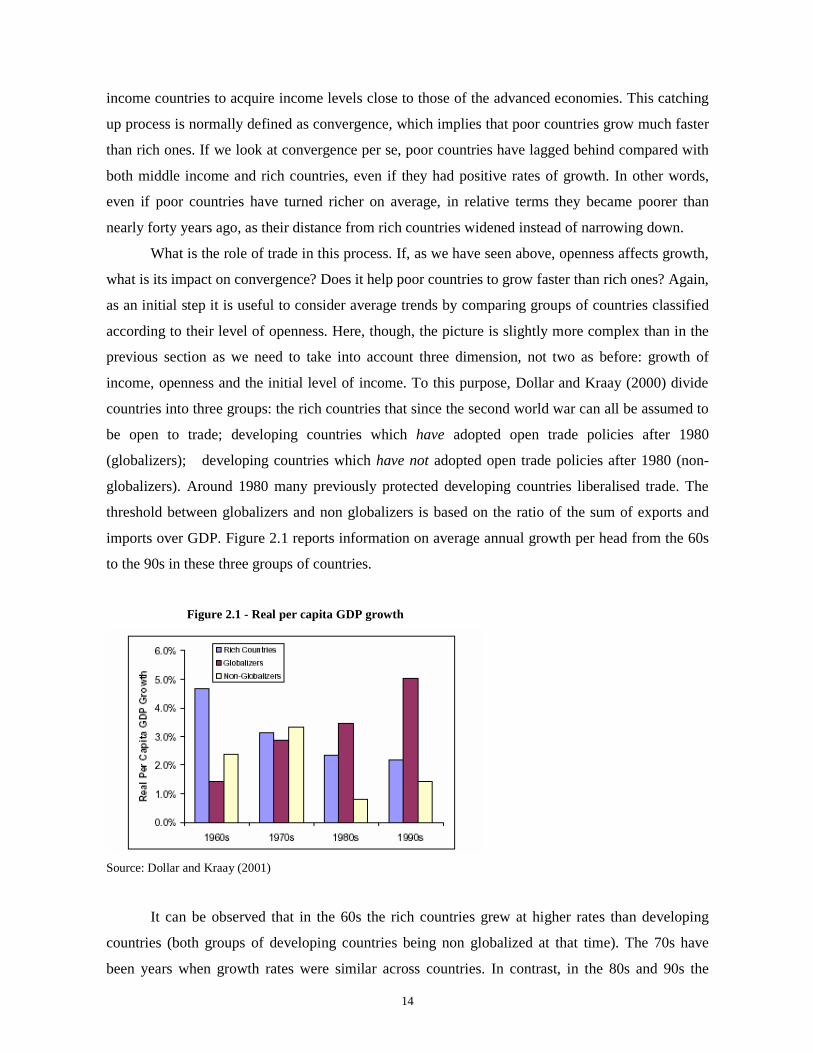
imports over GDP. Figure 2.1 reports information on average annual growth per head from the 60s
to the 90s in these three groups of countries.
Figure 2.1 - Real per capita GDP growth
Source: Dollar and Kraay (2001)
It can be observed that in the 60s the rich countries grew at higher rates than developing
countries (both groups of developing countries being non globalized at that time). The 70s have
been years when growth rates were similar across countries. In contrast, in the 80s and 90s the
15
group of post-1980 globalizers grew increasingly rapidly, much more than both the rich and the non
globalizer countries.
This figure sheds new light on the already mentioned divergence between countries. It is
true that poorer countries grew at lower rates, but not all of them did: those that opened their
economies to international trade after the 1980s grew more than rich countries, thus they actually
started to converge towards the income levels of the rich ones. These results are not surprising,
when we think at the average growth rates of champions of trade liberalisation like China and East
Asian countries like Korea, Taiwan or Singapore.
That countries converging to high income levels are also open to trade is also supported by
the historical experience and long term patterns. As argued by Dowrick and DeLong (2003) and
other commentators, countries have not been converging to a common attractor, but, rather, they
have been moving in ‘clubs’, with groups lagging persistently behind. Membership of the
convergence club has been generally associated with the adoption of open trade policies. It has also
varied with time. After the second world war, new members like China or Korea entered the club
and others, like several Latin American countries, left it. Exits and entries have been generally
related to changes in the trade policy stance (although also other factors mattered).
Lesson 4B. According to cross country evidence, although trade openness is conducive to faster growth, in itself it is not always a sufficient condition to achieve faster growth and convergence of income levels.
If countries belonging to the convergence club clearly share openness to trade as a common
characteristic, the opposite is not necessarily true: openness to trade does not automatically generate
convergence between countries: both at the beginning of the XX century and after the second world
war, some countries open to trade failed to join the convergence club. This confirms the theoretical
prediction that trade is a necessary condition for growth and convergence, but not always a
sufficient one. Often other factors and accompanying policies are necessary to boost growth
patterns. Box 1 below provides a brief outline of policies aimed at enhancing the competitiveness of
an open economy.
16
Box 1. Government Policies for Competitiveness in a Global Economy by David G. Tarr
What reforms, policies or instruments should be employed to best achieve a reoriented restructured globally
competitive industrial structure? We provide guidance on these questions based on general surveys of the experience of developing countries with industrial restructuring (see Leiberman, 1990; Atiyas, Dutz, Frischtak and Hadjimichael, 1992; Westphal, 1990; Krugman, 1989 and 1992).
The general principle is that it is crucial for the government to provide a stable macroeconomic environment conducive to business development with a clear, transparent and neutral regulatory environment and neutral incentives to all firms and industries. Clear, transparent and neutral incentives (those which do not distinguish by sector or firm) are crucial so that entrepreneurial innovation is rewarded more highly than rent-seeking activities. The economy must provide its most talented members with the incentive to engage in entrepreneurial activities such as starting or expanding firms, developing new products and lowering costs. If the economy provides extensive subsidies or tax exemptions to industries or firms, or presents a difficult regulatory framework within which to do business, corruption will be encouraged and, crucially, talented people will find it more profitable to engage in the socially wasteful activity of lobbying the government for subsidies, protection, tax or regulatory relief (see Murphy, Shleifer and Vishny,1991). This socially wasteful lobbying is especially harmful because it attracts scarce entrepreneurial talent that would otherwise be devoted to helping the economy grow.
Targeting particular industries for special assistance involves a number of risks that are potentially very costly. First, there is the risk that the wrong industries will be identified. The market is a more reliable indicator of the industries that have comparative advantage than any economic model or theory. Over time this is particularly true, as comparative advantage changes with technological development. Moreover, targeting industries as "winners" will generate rent-seeking where industries will spend resources to obtain government subsidies rather than attempting to compete more effectively on the market. Governments often find it difficult to resist these pressures. And assistance that is designed to be temporary may become permanent. Thus, experience in most countries has shown that a government policy of attempting to "pick winners" is highly counterproductive. Endorsement of a more general approach to industry development--with little differentiation in the level of assistance among industries-- thus emanates from a wider skepticism about the practical merits of targeting of any kind, see Westphal (1990) and Krugman (1989, 1992).
As a positive policy agenda for establishing industry competitiveness, there is much for the government to do:
1 Sound Macroeconomic Policies This includes avoiding overvalued exchange rates, which discourage exports and make
import competing sectors vulnerable. Fiscal deficits should be avoided in part because they crowd
out private investment, and because they lead to inflation that makes price signals less transparent.
2. Provide a neutral, transparent regulatory regime that is neither pervasive nor costly
Regulatory, tax and licensing regimes that are pervasive, frequently changed and not
transparent should be avoided since they encourage rent-seeking for regulatory relief.
3. Provide Sound Competition Policies This includes first and foremost an open trade regime such that firms produce according to comparative advantage and are forced to compete. Moreover, export growth has been crucial to all recent development miracles, and import protection imposes an implicit tax on exporters. Constraints on foreign investment, including restraints on repatriation of profits and royalties, as well as inadequate protection of intellectual property, limit access to state of the art production technology and to marketing networks. Barriers to entry and exit (including licensing of capacity expansion and limits on firm size), as well as discretionary subsidies, prevent industrial development and constrain the ability to respond to new competition. Complex licensing requirements often exclude small firms for whom the costs of dealing with the bureaucracy are excessive. Protection of state-owned monopolies, including special pricing arrangements, subsidies and credits, reduces the incentive to the state-owned enterprise to restructure and inhibits competition from new more efficient competitors (who are often private and often an effective means of privatizing the industry). Price controls prevent the transmission of market signals to firms, and should be avoided. 4. Develop Sound Labor Market Policies
17
Policies which facilitate labor mobility are crucial in effective restructuring. Estimates have shown that labor adjustment costs are often larger where labor adjustment is restricted (Leiberman, p. 7). Therefore layoffs should not be restricted or penalized by law. Strong unions sometimes act as an important barrier to effective labor mobility. Retraining programs may play a useful role in facilitating labor mobility, but need to be demand driven. 5. Adequate Infrastructure Inadequate or inefficient infrastructure in ports, roads, telecommunications, water and electricity can hinder industrial competitiveness. At the same time, costly public projects in these areas will increase the fiscal burden, crowd out private investment and similarly hinder industrial competitiveness. Infrastructure projects should therefore target bottleneck areas for efficiency and attempt innovative financing and participation solutions that involve the private sector.
Technical assistance in the form of information and marketing, technology transfer and training programs may also be useful. These programs would include those that help firms develop an effective export marketing strategy, that focus on adopting foreign technology to local conditions and that are designed to develop a flexible labor force. Industry associations and efficient banks are likely to be the best agents for identifying and arranging appropriate technical assistance.
2. 3. Does openness affect absolute poverty?
Key question: what is the effect of trade openness on absolute poverty? Lesson 5B. In countries open to trade, growth has a positive effect on absolute poverty.
Up to now we have discussed the link between openness and growth (in absolute and relative
terms), but not yet the one between openness and poverty. This effect is partly mediated by growth,
so we should initially consider the relationship between growth and poverty in open economies. If a
country grows as a consequence of its increasing international trade, this effect may be beneficial
for all its inhabitants, richer and poorer. However, some inhabitants may benefit more than others.
Therefore, the question of whether growth in open economies is beneficial to the poor – can be
divided into two more questions, one pertaining to the relationship between growth and absolute
poverty, and the other one to the relationship between growth and relative poverty, income
distribution.
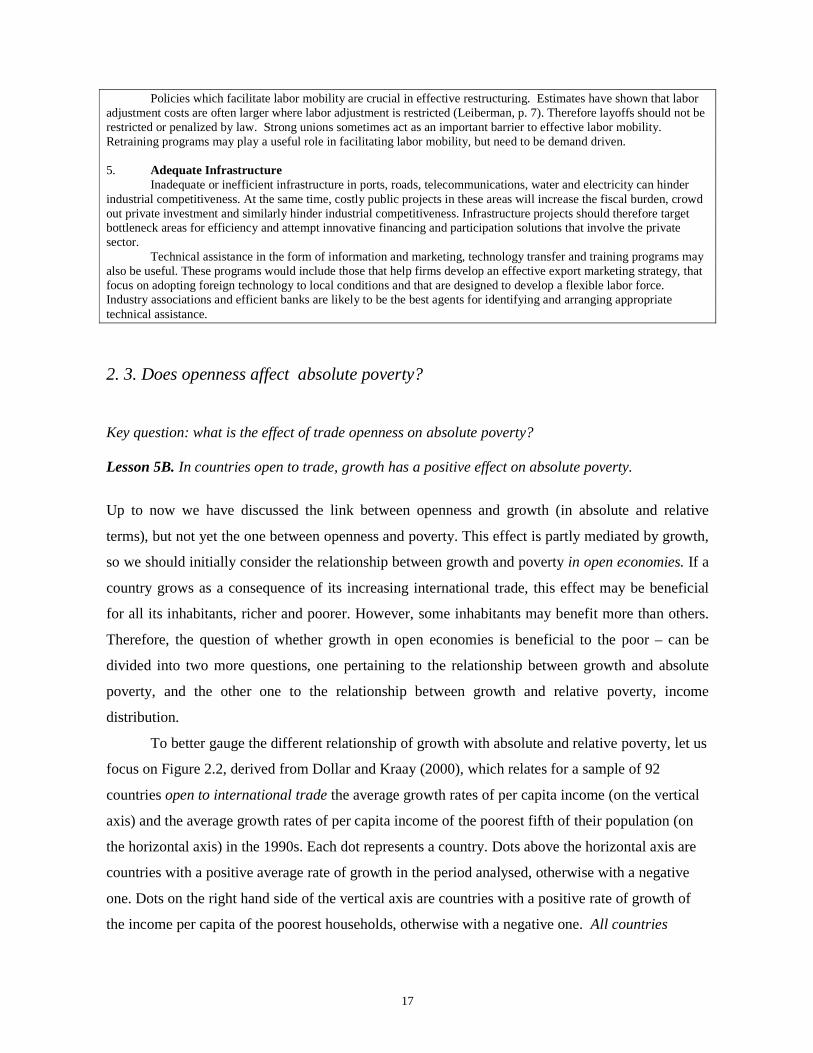
To better gauge the different relationship of growth with absolute and relative poverty, let us
focus on Figure 2.2, derived from Dollar and Kraay (2000), which relates for a sample of 92
countries open to international trade the average growth rates of per capita income (on the vertical
axis) and the average growth rates of per capita income of the poorest fifth of their population (on
the horizontal axis) in the 1990s. Each dot represents a country. Dots above the horizontal axis are
countries with a positive average rate of growth in the period analysed, otherwise with a negative
one. Dots on the right hand side of the vertical axis are countries with a positive rate of growth of
the income per capita of the poorest households, otherwise with a negative one. All countries
18
included in this sample are open economies. With reference to figure 2.1, the sample includes rich
countries and developing countries classified as globalisers.
Figure 2.2 – Open Economies:
Average Per Capita Income Growth of Total Population and of the Poorest Quintile
Source: Dollar and Kraay (2000)
Let us focus on absolute poverty first. Take dots on the left hand side, those countries for
which absolute poverty worsened. Notice that most of these dots are in the bottom left quadrant of
the diagram, i.e. below the horizontal line. Therefore, absolute poverty worsened mostly in
countries with a negative average rate of growth. In the top left quadrant there are only two or three
dots: in almost no country with a positive average rate of growth absolute poverty worsened. In
contrast virtually all countries with a positive rate of growth (dots above the horizontal line) are in
the top right quadrant, thus income per capita of the poor also grew. This confirms what argued
earlier, that rarely growth in open economies is so biased against the poor that absolute poverty
increases. We will complete the discussion of figure 2.2 below when taking up the issue of income
distribution.
• Positive growth of average income
• Positive growth of income of the poor
• Positive growth of average income
• Negative growth of income of the poor
• Negative growth of average income
• Positive growth of income of the poor
• Negative growth of average income
• Negative growth of income of the poor
19
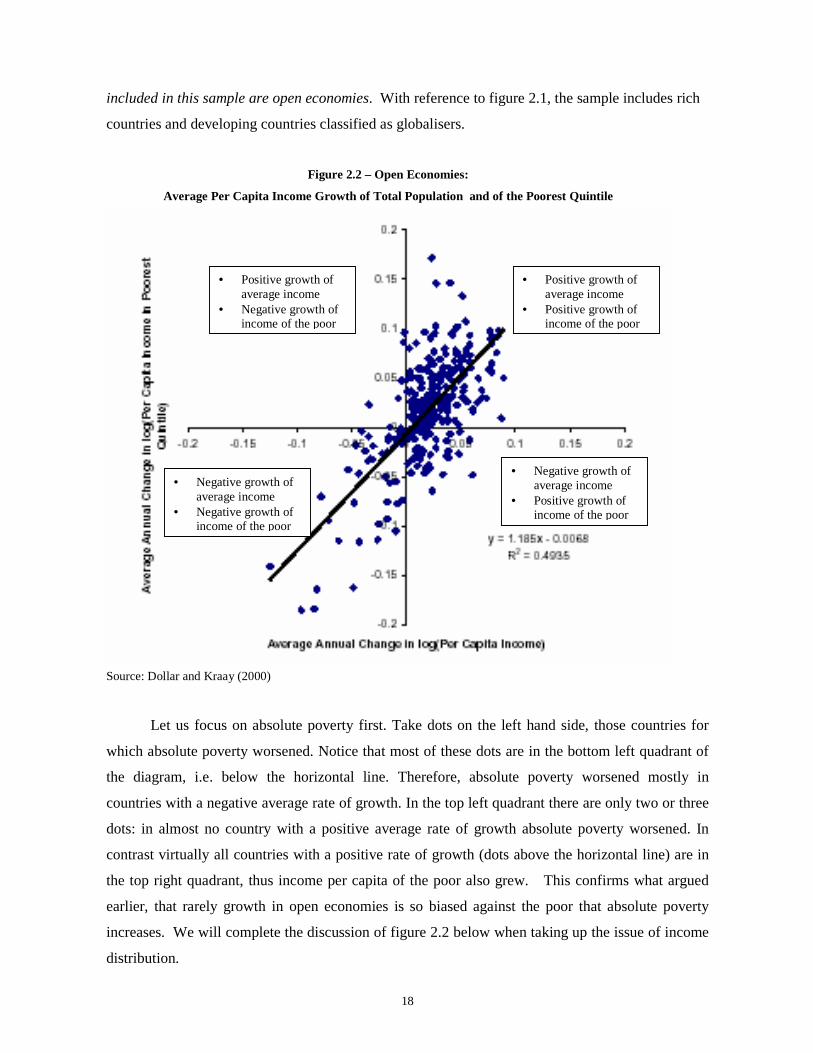
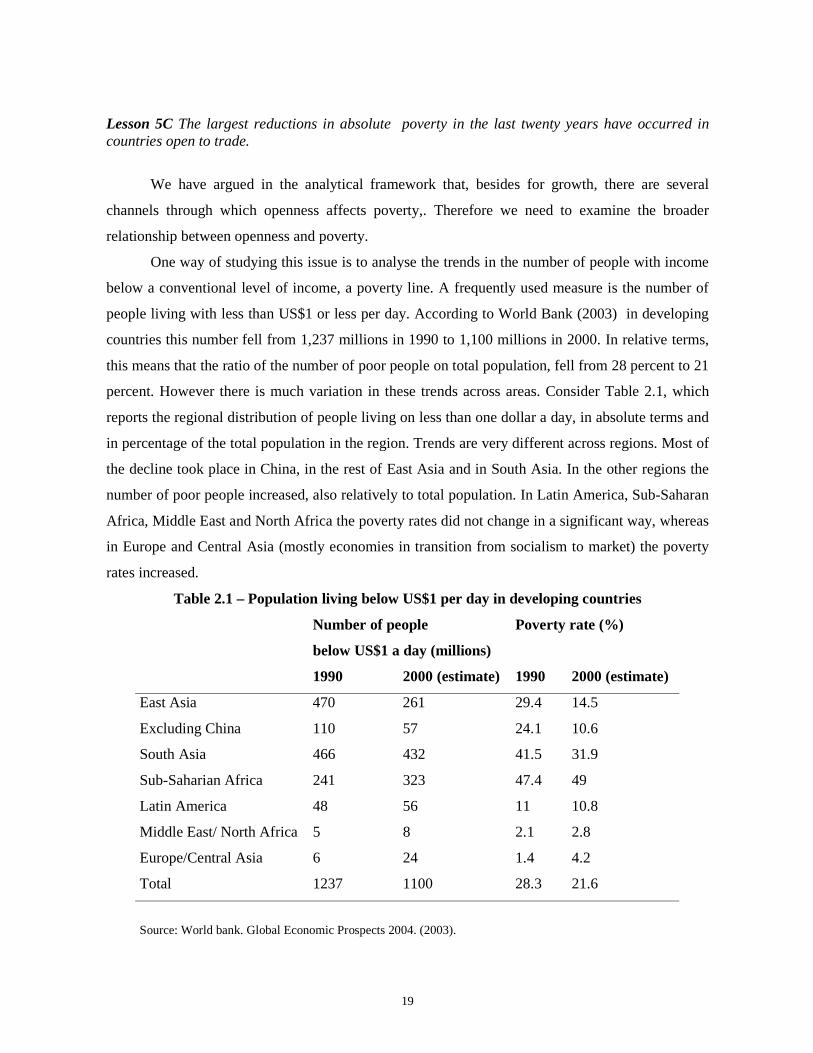
Lesson 5C The largest reductions in absolute poverty in the last twenty years have occurred in countries open to trade.
We have argued in the analytical framework that, besides for growth, there are several
channels through which openness affects poverty,. Therefore we need to examine the broader
relationship between openness and poverty.
One way of studying this issue is to analyse the trends in the number of people with income
below a conventional level of income, a poverty line. A frequently used measure is the number of
people living with less than US$1 or less per day. According to World Bank (2003) in developing
countries this number fell from 1,237 millions in 1990 to 1,100 millions in 2000. In relative terms,
this means that the ratio of the number of poor people on total population, fell from 28 percent to 21
percent. However there is much variation in these trends across areas. Consider Table 2.1, which
reports the regional distribution of people living on less than one dollar a day, in absolute terms and
in percentage of the total population in the region. Trends are very different across regions. Most of
the decline took place in China, in the rest of East Asia and in South Asia. In the other regions the
number of poor people increased, also relatively to total population. In Latin America, Sub-Saharan
Africa, Middle East and North Africa the poverty rates did not change in a significant way, whereas
in Europe and Central Asia (mostly economies in transition from socialism to market) the poverty
rates increased.
Table 2.1 – Population living below US$1 per day in developing countries
Number of people
below US$1 a day (millions)
Poverty rate (%)
1990 2000 (estimate) 1990 2000 (estimate)
East Asia 470 261 29.4 14.5
Excluding China 110 57 24.1 10.6
South Asia 466 432 41.5 31.9
Sub-Saharian Africa 241 323 47.4 49
Latin America 48 56 11 10.8
Middle East/ North Africa 5 8 2.1 2.8
Europe/Central Asia 6 24 1.4 4.2
Total 1237 1100 28.3 21.6
Source: World bank. Global Economic Prospects 2004. (2003).
20
It is quite undisputable that the poverty decline in China and in East Asia has to large extent
been driven by their successful export strategies and by their remarkable growth rates. The World
Bank in its Global Economic Prospects 2004 carries out simulations and estimates that a further
liberalisation of trade both in developing and in advance countries can potentially entice a radical
reduction in the number of poor people. We should however also notice that other countries that
have liberalised trade in the Nineties, like the transition economies in Eastern and Central Europe
have witnessed an increase in the poverty rate.. This increase in poverty, however, cannot be
attributed to trade itself but rather to the difficult transition process from a command to a market
economy.
There are little econometric studies relating trade policy and poverty in a multivariate
framework. A recent attempt is a study by Agénor (2002), which tests whether globalisation,
captured by an index encompassing measures of financial and trade openness, had any effect on the
poverty rate in 57 developing countries from the early 80s to the late 90s. The main result of this
study is that the relation between globalisation and the poverty rate has a U-shaped form. When
countries are only slightly open to international trade and financial flows, then increasing
globalisation is found to hurt the poor; when countries are strong globalisers, then the number of
poor people decreases as the globalisation index increases.
One possible explanation of this ‘non-linear’ relationship between globalisation and poverty,
is that a full integration in international markets requires further reforms concerning other aspects of
national and international economic activities, like regulatory reforms, the liberalisation of labour
and financial markets and so on. Many of these policies often come along with the liberalisation of
trade and they may not be implemented if the opening up to world market is limited.
2. 4. Does openness affect income inequality?
Key question: what is the effect of trade openness on income distribution?
Lesson 6B. In countries open to trade, growth does not worsen average income distribution.
Let us now focus on relative poverty, income distribution. Consider again Figure 2.2. The
upward sloping straight line reports the average association between the two growth rates found for
all the sample countries. The slope of the straight line is close to the 45 degree line, meaning that,
on average, income of the poorest households grew at the same pace than average income of the
country. In other words, if in a particular country the poorest households grew as much as the rest of
the economy (i.e. growth is equally distributed), then such country should lie somewhere on the 45
21
degree line (which joins all points with equal values on the horizontal and vertical axis). The fact
that the fitted line (which represents the average relationship for the sample) is namely a 45 degrees
line, means that on average growth is evenly distributed across the population and does not worsen
income inequality. Now, this is the average relationship, but individual countries can deviate from
the average. Dots below the 45 degree line represent those countries whose poorest households
grew less than proportionally than the rest of the households, meaning that growth was biased
against the poor and income inequality rose with it. In contrast, dots above the 45 degree line
represent those countries whose poorest households grew more than proportionally than the rest of
the households, meaning that growth was biased in favour of the poor and income inequality
declined with it.
Summing up figure 2.2 tells us that there is a positive average relationship between the
growth rate of per capita income of the poor and the growth rate of per capita income of the whole
population; however, there is much variation around this average relationship. The first result
allows us to reject the statement that on average trade integration leads to growing household
inequality – remember all countries in the sample are open to trade. However, the second result may
suggest that this could happen in some cases (all cases below the 45 degree line). Consider three
examples of developing countries that globalised their economies in the last two decades and find
three opposite stories of what happened to inequality. In China income inequality increased, despite
the dramatic decline of absolute poverty. In the Philippines income distribution has been stable (it
lies on the 45 degree line). In Mexico, inequality increased in the 80s and fell in the 90s.
Lesson 6 C However, cross country evidence is not conclusive on the broad effects of trade on inequality
Dollar and Kraay (2001) attempt to isolate the relationship between openness and inequality
from other factors – like growth- affecting income distribution. They find that, besides for its
indirect effect through growth, in broad terms openness is not associated to inequality. Also careful
econometric studies assessing this link do not find that trade openness affect significantly inequality
(Bourguignon and Morrison, 1990, Edwards, 1997, Dollar and Kraay, 2002)
According to Ravallion (2003) it is quite understandable that cross- country studies
fail to find any effect of openness on inequality. This, in fact, is heavily dependent on
different country specific factors that cannot be controlled for in cross country
regressions: the initial income level, the initial inequalities in incomes, educational
attainments, geographic and other non-income characteristics. Also, results change a
22
lot depending on the alternative measures of openness (such as average tariff rates or
capital controls) and inequality (such as the Gini coefficient of income distribution)
used. Therefore, once more, country studies are important to understand how trade
interacts with other factors in determining inequality outcomes.
3. Country studies
We have argued in the previous section that trade liberalisation often requires a
comprehensive and broad mix of policies to induce fast growth rates. Indeed the experience of
successful liberalisation, in terms of the policy mix adopted and the strategy followed, has been
different in each country. Also, we have seen in the previous sections that the effects of openness on
growth and poverty can be very different from country to country. Cross country analyses are
helpful to provide a synthetic picture and to compare countries within a coherent framework. But
their aggregate outcome is unable to capture specific links and effects taking place at the
microeconomic level. In this section we therefore revert to country specific studies.
We first deal with policy strategies and discuss the case of: Mauritius, Chile and Korea. We
then move to the analysis of the micro effects of trade openness. Specifically, we look at the pro-
competitive effects of liberalisation in Chile and Columbia at the effect on labour market
fluctuations and job insecurity in Chile Colombia and Mexico.
3.1. Policy strategies
Key question: Have countries followed different successful trade liberalisation strategies?
Lesson 7. Country studies show that there are different models of successful trade liberalisation
Each country’ strategy is unique in the blend of the different policy measures and
institutional settings. It is therefore not possible to generalise and define an optimal strategy. There
are however several patterns emerging that provide broad guidelines to group individual
experiences. Here, we consider three patterns. The first one, is the experience of Mauritius, largely
based on Export processing Zones (EPZ). The second one is the experience of Chile, which
implemented fairly straight forward policies and where the exchange rate management played a
very important role. The final one, is the well known tale of Korea, where the government
liberalised trade and actively promoted exports at the same time.
23
3.1.1 Trade liberalization and the role of export processing zones (EPZ) (Mauritius)
We have seen in the analytical framework that trade liberalization should determine a
reallocation of a country’s resources towards more efficient uses. Mauritius provides a good
example of how this process of reallocation of resources can be successfully accomplished.
Mauritius’s strategy has been heavily reliant on Export Processing Zones (EPZ).
Trade liberalisation was implemented gradually: it started in 1979 with a policy of exchange
rate stabilisation (1979-83), followed by a gradual removal of non tariff barriers (1983-94) and
tariff reductions and reforms (since 1994). These reforms changed drastically the degree of
openness to trade of the economy. Since the mid Eighties, the volume of imports and exports grew
at an average yearly rate of 8.7 percent and 5.4 percent respectively. The ratio of trade in goods to
GDP rose from 70 to 100 per cent, compared to an average of 45 percent in the rest of Sub-
Saharan Africa (Subramanian and Roy, 2001). During this period, GDP has been growing at an
average yearly rate of 6 percent.
Economic growth has been essentially export led. Initially, the main export crop was sugar.
Since trade reforms, exports have been progressively diversified: in addition to sugar, textiles and
clothing, tourism and financial services. As a result, in 2001 manufacturing accounted for 75% of
merchandise exports; the services sector (tourism and financial services) accounted for 74% of real
GDP, while agriculture accounted for 6% only.
EPZs played an important role in fostering Mauritian exports of manufacturing products.
They were created in the 70s with the aim of establishing companies able to compete in the export
market. They provided hefty financial and fiscal incentives to exporters and also less stringent
labour regulations (no severance allowances, flexible conditions of overtime, lower minimum
wages for women etc.). Therefore exports from these areas were implicitly and explicitly
subsidised. EPZs were initially a small enclave of efficient firms open to the international market
which coexisted with a traditionally protected import-competing sector. They expanded with time,
absorbing a large share of economic activities. Now EPZs account for 36 percent of total
employment, 66 percent of total exports and 26 percent of GDP.
In 1994 a Technology Diffusion Scheme was introduced to finance the introduction of new
technologies to improve design, quality and productivity of domestic manufacturing. Export led
industrialisation and technological upgrading ultimately affected the remuneration of factors of
production. Real wages have been growing in Mauritius faster than productivity. Domestic
production has progressively become more capital-intensive, and has shifted to producing goods
24
with higher value-added, whereas the most labour intensive activities have been transferred to
neighbouring countries.
The EPZ Act was followed by the Export Service Zone Act, in the 80s, which played an
important role in the development of the service sector, particularly financial services. Financial
services are now diversified into non banking offshore business activities, aircraft financing and
leasing, international consultancy services, fund management and so on. The growth rate of the
financial sector is currently around 9% per year.
Although the performance of Mauritius has been undoubtedly driven by trade, on the basis
of several standard indicators, Mauritius kept protecting its import substitution industries and its
agriculture up to the mid Nineties (Subramanian and Roy, 2001 and Rodrik, 1999). The export
sector was indeed insulated from the rest of the economy. This prevented protectionist interests
from gaining stance in the policy arena and exports from being hindered by the anti export bias of
the import substitution policy. Also, returns in the export sector were sufficiently high anyway, to
avoid resources from being diverted towards protected activities.
3.1.2. A successful strategy of export diversification and poverty reduction, or when pegging the exchange rate gets suicidal (Chile )
Chile started to liberalise trade in 1979 with a tariff reduction of 10% across industries. It
had a first period of trade liberalisation (until 1982), when the Chilean industry was restructured by
changing the product mix and rationalising the use of labour in production. However, to fight
against the inflation which persisted from the 70s, Chile also pegged the nominal value of its
currency (the peso) against the value of the dollar. The appreciating value of the peso generated an
initial flow of external borrowing, followed by a sharp capital flight when confidence on the
sustainability of the exchange rate fell. As there were capital controls, capital flight was mainly
carried out by buying imported consumer durables. The deterioration in the terms of trade, coupled
with an increasing foreign interest rate, ended up, in 1982-83, in the worst depression experience in
Chile since the 30s.
The recession forced the country to rethink about its trade policy, as it was clear that
currency pegging was a very painful way to fight against unbalances. Between 1982 and 1985 the
protectionist stance gained momentum again: tariffs were raised up to 35 percent, allowing the
currency to abandon the peg with the dollar and to depreciate by almost 60%.
However, this change in policy (tariffs instead of currency overvaluation) set a more reliable
ground for future trade liberalisation. Since March 1985 tariffs started decreasing progressively. In
1991 they were reduced to 11%, and between 1989 to 1995 the exchange rate had appreciated again
25
by 22%. As a result of trade liberalisation, Chile diversified its exports into forestry, fishing, wines,
fruits, and other agro-based products, thereby reducing its dependence from copper, its major export
product. Even when the revaluation of the peso reduced the competitiveness of exports, these
effects were offset by gains in productivity and changes in the product mix. Consequently Chile’s
average growth rate was a surprising 6.8% per year until 1999, when it was affected by the East
Asian crisis. Anyway, since 1999, the country has avoided recession and has grown at a rate of
5.4% in 2000 and 3.1% in 2001.
During the 1990s Chile was also very successful in alleviating poverty. A key factor of
success was a combination of increasing public spending in human capital and social protection,
which increased equality in income distribution, and rigorous fiscal management, which led to
macroeconomic stability and a favourable investment climate. Poverty rates decreased from 40
percent in 1987 to 17 percent in 1998 and extreme poverty rates from 13 percent in 1987 to 4
percent in 1998. Social indicators (primary education, youth literacy, infant mortality and life
expectancy) also improved, reaching levels similar to those of the industrialized countries.
3.1.3. Trade liberalization and active export promotion (Korea )
Korea is probably the most studied experience of export led development miracle (for
thorough accounts of this experience see Westphal and Kim, 1982, Westphal, 1990, Rodrik, 1995,
Amsden, Wade). It is also quite unique: the gradual process of trade liberalisation was coupled with
interventionist measures, as Korea’s government mastered a successful strategy of investment
coordination favouring export growth.
Initially, Korea adopted a mixed trade regime characterised by import substitution and an
activist export policy. Exports in the textile, electrical machine, and small appliance industries, were
triggered by financial incentives such as tax-free imports of raw materials. During the 70s this
export strategy was extended to chemicals and heavy industries like transport equipment. As a
result, exports increased by 45 percent a year, topping US$17.5 billion in 1980. Particularly, auto
exports took off, and imported cars virtually disappeared. Price controls also eased the shift of
resources from the production of domestic consumer goods to export goods.
During the second half of the 80s the government moved away from stimulating heavy
industry, towards export-oriented consumer products, including electronics and high tech goods. It
also carried out a further removal of trade restrictions to create a friendlier import environment,
although many non-tariff barriers continued to be applied.
Explaining Korea’s miracle is a controversial issue. Some authors argue that the high
performance of Korea has to be ascribed strictly to its outward and market oriented policies
26
(Bhagwati, Krueger, Little). Others that trade liberalisation played a crucial role, but the observed
high growth rate would not have been achieved if it had not been coupled with an industrial policy
oriented to introduce technological change in selected industries (Westphal, Pack). A third view is
ascribes Korea’s success mostly to industrial policy and argues that trade openness played a more
limited role than normally assumed (Amsden, Rodrik, Wade).
However, as argued by Panagaryia (2004), it is quite difficult to believe that Korea would
have achieved similar growth rates if it had kept protecting its domestic market and if it had not
pursued an export oriented strategy. The problem with Korea’s strategy is that it is very difficult to
implement. It is demanding on the government’s apparatus and it requires the government to have a
sufficiently clear strategy and sufficient bargaining power to force this strategy through, against all
odds and conflicting interests. These conditions are rarely available in developing countries.
3.2 Microeconomic effects of trade liberalisation
Key question: what is the evidence on the microeconomic effects of trade liberalisation?
As argued, the effects of trade on firms or households, often depend on specific country
conditions. It is therefore useful to report evidence on some specific micro issues. We first discuss
the effect on competitiveness and market structure in the domestic market (Chile and Columbia).
We then move to analyse labour market effects and employment security (Chile and Mexico)
3.2.1. Pro competitive effects at the firm level (Chile)
Lesson 3D Evidence on Chile shows that trade liberalisation has pro-competitive effects and
improves firms’ efficiency
Tybout (1996) examined the case of Chile in the first half of the 80s, when the first wave of
trade reforms were carried out. He found that liberalisation had pro-competitive effects and that it
enhanced the efficiency of domestic firms. He first looked at price-cost margins. He found that the
lowest price-cost margins were in industries with the highest import penetration rates, thus imports
had clearly a pro-competitive effect.
Tybout then analysed the patterns of entry and exit of firms in the industrial sector. Clearly,
after trade reforms, the industrial sector was exposed to more import competition, thus a pressure to
lower the output prices. There was initially a large number of exits and limited new entries, as the
least efficient firms were expelled from the market. In the longer term, however, there was an
27
overall reorganisation of the industrial sector. This process had two main features. First, a large
number of firms which survived from initial selection switched product lines and changed mix of
products. Second, entering companies were larger than exiting companies, thus the average size of
industrial firms increased. At the end of this process industry was characterised by lesser and bigger
firms producing different products compared to the pre-trade reform period. The government played
a role in this process, as several policies were introduced, including a debt relief scheme and a
reduction in business taxes, to ease the cost of adjustment.
3.2.2.Effects on the volatility of employment (Chile and Columbia)
Lesson 5D Evidence on Chile and Colombia shows that trade liberalisation does not necessarily increase job volatility and insecurity. The effects vary depending on the country and the type of firm
Trade liberalization may affect the volatility of employment and job insecurity. On the
negative side, domestic activities are more exposed to international shocks and because in more
competitive markets firms are forced to adjust their labour demand fast in response to shocks in
output, prices or factor costs. On the other and more positive hand, firms competing in international
markets can grow faster and have more opportunities to diversify their risks and thus smoothen
exogenous shocks. Therefore, the question of job insecurity is really an empirical one. There are
two ways of analysing this problem empirically. The first one is to look at the effect of openness on
entry and exits of firms; the second one is to analyse the job creation and destruction in firms that
are present in the domestic economy before and after trade reforms. This latter question can be
addressed by checking whether the ‘elasticity’ of labour demand changed. The elasticity measures
the extent of the response of firms’labour demand to changes in wages.
One study dealing with this issue is Fajnzylber, Maloney and Ribeiro (2001), based on the
experiences of Chile and Colombia. Survey data from Chile (1979-95) and Colombia (1977-90).
They analyse both changes in employment due to entry-exit of firms and changes in the labour
demand elasticity of existing firms. They find that liberalisation affects both the pattern of job
creation and destruction through entry end exit and the demand elasticity of existing firms.
However, the evidence is often contradictory with opposite results for the two countries. The
bottom line is that both increased and decreased volatility are plausible outcomes and liberalisation
can deliver both. It is important to understand which factors might actually change the direction of
the effect. Findings are mixed: when Chile opened the economy to international trade, the wage-
employment sensitivity increased for the entering and exiting companies, whereas it decreased for
the continuing companies; an opposite effects was observed in Colombia, where the same
28
relationship decreased for the entering and exiting companies and increased for the continuing
companies. These findings suggest that the theoretical prediction that more openness leads to higher
sensitivity of employment level to wages is not consistent with the empirical evidence.
3.2.3. Food insecurity and price variability in rural households (Mexico)
Lesson 6D Evidence on households in Mexico shows that different groups can be hit differently by changes in relative prices and by price volatility following trade liberalisation
Of particular concern is the effect of liberalisation on rural households. These are normally
exposed to shocks, as liberalisation in the agricultural sector implies a change in the price and in the
characteristics of the crops produced.
A good example of this issue, that we draw from Mc Culloch, Winters and Cirera (2002)
Box 9.4, and which is based on Barret (1998), is the one of rice reforms in Madagascar in the 80s.
Following reforms, the men price of rice rose by 42 percent and price variance by 53 percent and
output growth accelerated. The effects of this pattern was different for small and large farmers. As
for small farmers, these were net purchasers of rice, thus their welfare declined, as shown by
nutritional, educational and overall expenditure data. The way in which small farmers reacted was
to increase output, and try to offset the higher variability of income with a higher mean level of
income. Note that this move exposed farmers to higher risk, as it increased the variability of their
overall income. Indeed their losses from increased price and volatility outweighted the benefits
from increased sales. Things went better for large farmers, who were net producers of rice.
However their reaction to increased volatility in prices was to limit their exposure, by reducing their
output of rice. Summing up, we should not just consider the effects of a one off change in prices,
but changes in volatility and insecurity are also important. Equally, different groups (small and
large producers) could have a different exposure to risk and input opportunities and respond
differently to changes in incentives.
29
Appendix 1. Reallocation of resources in the Hecksher Olin model Trading with foreigners generates a reallocation of resources towards the production of tradable goods. The most well known model to examine how this process takes place is the Hecksher - Ohlin model. In its simplest format it is based on a two-countries, two-goods and two-factors competitive market economy (See Krugman and Obsfeld (2003) for a more detailed exposition). Let the countries be the Russia and the US, the goods be food and clothes, the factors be labour and capital. We also assume that the factors are perfectly mobile, thus can easily shift from the sector producing food and the sector producing clothes and viceversa. Firms can rent labour and capital at given prices (the wage rate and the interest rate being the prices of one unit of labour and one unit of capital, respectively). By employing these factors, each firm can produce either food or clothes. Suppose also that the technology available requires more capital and less labour to produce one unit of food than to produce one unit of clothes (the production technology of food is more capital intensive, whereas the production technology of clothes is more labour intensive). Suppose that the key difference between the Russia and the US is that Russia has a limited stock of capital per head (50 computers per thousand people in Russia and 625 in the US in 2001). What happens if Russia is a closed economy and thus does not trade with US (it is still a market economy , even if closed to external trade)? Obviously, it has to produce internally all the food and the clothes that Russians are willing and able to buy. If there are many workers supplying labour, the competition in the labour market will determine low wages, therefore clothes, produced prevalently with labour, will be cheap. By contrast, as there is little supply of capital, market forces will determine a high interest rate, therefore food, produced prevalently with capital, will be expensive. What happens then if Russia decides to trade with the US (i.e. to open its economy)? If the clothes produced in Russia are cheaper than those produced in the US and food produced in Russia is more expensive than clothes produced in the US, then Russia has the opportunity to export clothes in exchange for food produced abroad. A general effect of openness, therefore, is that a country will export the good that make intensive use of its relatively most abundant factor (labour in our example). The long term effect of the increasing demand of Russian clothes is that their price will gradually rise. For the same reason, the demand and the price of Russian food will fall. The change in relative product demands brings along an equivalent change in relative factor demands and prices. Thus wages rise and interest rates fall. More precisely, the Stolper-Samuelson theorem states that, in this two-countries two-goods model, if the relative price of a commodity rises, the return on the factor of production used more intensively in producing that commodity rises as well. The rising price of food and falling price of clothes imply that in Russia there is an incentive to produce more food and less clothes. Labour initially employed in firms producing food will move to the clothing sector, whereas capital will be less in demand.. Consequently, more labour and less capital is needed after the economy opens to international trade. In synthesis, according to the Hecksher-Ohlin model, the immediate consequences of opening the economy to international trade on the reallocation of the resources are that: (i) production shifts from the commodity produced prevalently with the less abundant factor
(food) to the commodity produced prevalently with the most abundant factor (clothes), (ii) the former becomes cheaper whereas the latter becomes more expensive. (iii) the remuneration rate of one unit of the most abundant factor (wage rate) rises relative to the
remuneration rate of one unit of the less abundant factor (interest rate).
30
Appendix 2: How to measure openness and poverty
Openness
Can we unequivocally define if an economy is open or closed? How can we measure the “degree of openness”? How can we affirm whether the openness is related to trade policy decisions or simply to other factors such as a country’s geographical position? There is not a unique satisfactory method to measure openness: each measure has its own limitations and may neglect some aspects of trade reforms which should not be ignored. If we simply look at the tariffs imposed on a commodity’s import or export, we may neglect the so-called non-tariff barriers, such as the legal requirements (quality, health characteristics, respect of the environment, etc.) that some countries impose on commodities crossing their borders. Moreover, data on tariffs are often messy, as a country normally imposes many kinds of tariff on many kinds of commodities. Tariffs, finally, may not account for the overall outward orientation of a country, which is often a combination of several elements (from simple administrative and institutional factors to the characteristics of the whole political system). The empirical literature has proposed several alternative proxies to capture trade restrictions. The following proxies are some examples taken from recent studies. Dollar (1992) adopts two indices of openness based on the real exchange rate: an “index of real exchange rate distortion” and an “index of real exchange rate variability”. The author claims that an outward oriented trade policy implies that the real exchange rate is sustainable (i.e. low distortions) and stable (i.e. low variability). Both these proxies, however, may not strictly mirror trade restrictions: distortions are sensitive to the different types of trade restrictions applied and variability is a proxy for instability rather than for trade restriction. Sachs and Warner (1995) construct an index of openness which has been widely used in several empirical studies. This index divides countries into two sets, open economies and closed economies. An economy is “closed” if any of the following criteria holds:
• its average tariff rates is higher than 40%; • its nontariff barriers cover on average more than 40% of imports; • it is a socialist economy; • most of its exports are carried out by state monopoly • its black market premium exceeds 20%.
Rodriguez and Rodrik (2000) argue that the Sachs-Warner index overestimates the effects of trade restrictions, as it actually captures a number of institutional differences between countries which are not necessarily related to trade policy. Frankel and Romer (1999) consider changes in trade volumes (i.e. the value of commodities traded with foreign countries as a percentage of GDP) as proxies for changes in trade policy. This proxy has also been used in subsequent studies (see Dollar and Kraay, 2000a and 2000b). It has been pointed out that changes in trade volumes may measure an effect of openness and not openness per se (see Rodrik, 2000)..
31
Poverty
The measurement of poverty is equally complex. We have already seen the distinction between relative and absolute poverty measures. Since 1990 the World Bank adopts a measure of absolute poverty by considering what poverty means in poor countries (i.e. living with the equivalent in local currency of $1 a day). This criteria has the advantage of comparing people from different countries by setting a unique standard based on consumption levels. This measure, however, can be criticised when applied to middle-income countries, where the poverty line is higher than in poor countries. This criticism implies that many more poor people in the world are not classified as poor by the World Bank poverty index1. This implies that the “poverty line” could be treated as a relative concept, in that it changes with the perception of the minimum welfare below which a person is considered a poor. Chen and Ravallion (2001) adopt a relative concept of poverty line, which rises with mean income. Another way to deal with poverty measurement is by accounting for non-income factors, which affect the welfare of poor people without directly affecting their income2. According to Amartya Sen, being poor does not mean living below an imaginary poverty line, such as an income of one dollar a day or less. It means, more generally, not being able to cover certain basic necessities, taking into account the circumstances and social requirements of the environment. For example, consider two households living in two different countries. They are both classed as low income household (below the 20% of the population); however, one of these household has more access to school and to information, enjoys a better standard level of health care system and it is reasonably integrated in the society, whereas the other one is socially excluded, lives in an uncomfortable or dangerous geographic area, hardly has the access to school and to public health system. These two households, which have different levels of welfare, would be classified as equally poor if poverty is measured in monetary income terms only. The income measures of poverty also ignore inequality within households, which are difficult to observe empirically. Moreover, they do not consider individual concerns about uninsurable fluctuations in income and health over lifetime: the individuals might prefer to earn less money but on a constant basis or they could prefer to sacrifice part of their earning to cover their expenditure on health care in case of negative events; if this sort of risks are not insurable, the individuals get worse off and this is not accounted by income measures of poverty.
1 See Wade (2002) and Reddy and Pogge (2002). 2 See Citro and Michael (1995).
32
References Adams, R.H., jr., (2002), Economic growth, Inequality and Poverty: Findings from a New Dataset, World Bank Policy Research Working Paper 2972. Agénor, P.R. (2002a), Macroeconomic Adjustment and the Poor: Analytical Issue and Cross-Country Evidence, World Bank Policy Research Working Paper 2788. Agénor, P.R. (2002b), Does Globalization Hurt the Poor?, World Bank Policy Research Working Paper 2922 Ancharaz, V. D. (2003), ‘ Trade Policy, Trade Liberalisation in Mauritius: Lesssons for Sub-Saharan Africa’. Department of Economics, University of Mauritius, mimeo Atiyas, Izak; Dutz, Mark; and Frischtak, Claudio; with Bita Hadjimichael, Fundamental Issues and Policy Approaches in Industrial Restructuring, Industry Series Paper No. 56, The World Bank, April 1992. Auffret P. (2003), Trade reform in Vietnam: Opportunities with Emerging Challenges, World Bank Policy Research Working Paper 3076. Barret, C.B. (1998), ‘Immiserized Growth in Liberalized Agriculture’, World development, 26, pp. 743-53 Bordo, D., A.M. Taylor and J.G. Williamson (2003), Globalization in Historical Perspective, NBER. Bannister G.J. and K. Tugge (2001), International Trade and Poverty Alleviation, IMF working paper 01/54 Bourguignon, F. and C. Morisson, 1990, ‘Income Distribution, Development and Foreign Trade’, European Economic Review, 34; 113-1132 Chen S. and M. Ravallion (2000), How did the world’s poorest fare in 1990s?, World Bank Policy Research Working Paper 2409. Christiaensen, L., L. Demery, and S. Paternostro (2002), Growth Distribution and Poverty in Africa. Messages from the 90s, World Bank Policy Research Working Paper 2810. G. Datt and M. Ravallion (2002), Is India’s Economic Growth Leaving the Poor Behind?, World Bank Policy Research Working Paper 2845. Deininger, K., (2003) Land Policies for Growth and Poverty Reduction, World Bank Policy Research Report
33
Dollar D., A.Kraay (2001), Trade, growth, and Poverty, World Bank Policy Research Working Paper 2615 Dollar D., A.Kraay (2002), Growth is Good for the Poor, Journal of Economci Growth, 7(3), pp. 195-225 Dollar D. (2002), Reform, Growth, and Poverty in Vietnam World Bank Policy Research Working Paper 2837. Dowrick S. and J.B. DeLong (2003), Globalization and Convergence, in Bordo et al. (Eds.), pp.191-226. Edwards, S. (1997), ‘Trade Policy, Growth and Income Distribution’, American Economic Review, Papers and Proceedings, 87 (2) Fajnzylber, P., W. F. Maloney and E. Ribeiro (2001), Firm Entry and Exit, Labor Demand, and Trade Reform. Evidence from Chile and Colombia, World Bank Policy Research Working Paper 2659 Feenstra (2004), Advanced international trade: Theory and Evidence, http://www.econ.ucdavis.edu/faculty/fzfeens/textbook.html Ferreira F.H.G. (1999), Inequality and Economic Performance. A Brief Overview to Theories of Growth and Distribution, http://www.worldbank.org/poverty/inequal/index.htm Fofack H., C. Monga and H. Tuluy (2001), Household Welfare and Poverty Dynamics in Burkina Faso: Empirical Evidence from Household Surveys, World Bank Policy Research Working Paper 2590. Frankel, J. and D. Romer (1998) “Does Trade Cause Growth?” American Economic Review; Graham, E. (2000) "Fighting the Wrong Enemy: Anti-Global Activists and Multinational Enterprises" Institute for International Economics GLOBAL POVERTY REPORT (2001), A Globalized Market: Opportunities and Risks for the Poor, G8 Genoa Summit, July. Grossman, G., and E., Helpman, 1991 Innovation and Growth in the Global Economy, Cambridge Mass., MIT Press Harrison, G.W., T.F. Rutherford, D.G. Tarr and A. Gurgel (2003), Regional, Multilateral and Unilateral Trade Policies of MERCOSUR for Growth and Poverty Reduction in Brazil, World Bank Policy Research Working Paper 3051. Henderson, D. (1999) The MAI Affair: A Story and Its Lessons, Royal Institute of International Affairs. Henderson D. (2000) Anti-Liberalism 2000”, Institute of Economic Affairs, 2000. Cline, W. (1997) “Trade and Income Distribution” Institute for International Economics Hoekman B., A. Mattoo and P. English (Eds.) (2002), Development, Trade and the WTO. A Handbook, World Bank
34
Jalan J. and M. Ravallion (2002), Household Income Dynamics in Rural China, World Bank Policy Research Working Paper 2706. Karakaya E. and A. Cooke (2002), Economic Integration: An Overview of the Theoretical and Empirical Literature, Nottingam Trent University, Discussion Papers in Applied Economics and Policy, 2002/2. Krugman, P. A. (1992), “Does the New Trade Theory Require a New Trade Policy,” World Economy, Vol. 15, pp. 423-442. ———— (1989), “Is Free Trade Passe,” Journal of Economic Perspetives, Vol. 1, pp. 131-144. Krugman, P. and Obstfeld, M. (2003), ‘International Economics: Theory and Policy’, Addison Wsley, 6th edition Leiberman, Ira, Industrial Restructuring: Policy and Practice, Policy and Research Series No. 9, Washington D.C.: The World Bank, 1990. Lindert P.H. and J.G. Williamson (2003), Does Globalization Make the World More Unequal?, in Bordo et al. (Eds.), pp.227-276. McCulloch N., L.A. Winters, X. Cirera (2001), Trade Liberalisation and Poverty: A Handbook, CEPR McKay A., L.A. Winters, A.M. Kedir (2000), A review of the Empirical Evidence on Trade, Trade Policy and Poverty, Report to the DFID. de Melo, J. and J.-M. Grether, (2002), ‘Openness, Economic Growth and Poverty’ in J. de Melo and M. Bacchetta, ‘Applied Trade Policy for Developing Countries; Outline, Readings and Content for a Short Course’ CD Rom in Hoekman B., A. Mattoo and P. English (Eds.), Development, Trade and the WTO. A Handbook, World Bank. Murphy, Kevin; Shleifer, Andrei; and Vishny, Robert, "The Allocation of Talent: Implications for Growth", Quarterly Journal of Economics, May 1991. Panagariya, A., (2004), ‘Miracles and Debacles: in Defense of Trade Openness’, Columbia University, mimeo Ravallion M. (2001), Growth, Inequality and Poverty: Looking Beyond Averages, World Bank Policy Research Working Paper 2558. Ravallion M. (2002), Externalities in Rural Development: Evidence for China, World Bank Policy Research Working Paper 2879. Ravallion M. (2003), The Debate on Globalization, Poverty and Inequality: Why Measurement Matters, World Bank Policy Research Working Paper 3038. Reimer J.J. (2002), Estimating the Poverty Impact of Trade Liberalization, World Bank working paper 2790.
35
Rodriguez, F., and D. Rodrik (2000), Trade policy and Economic Growth: A Skeptic’s Guide to Cross-National Evidence, Macroeconomics Annuals 2000, B. Bernanke and H. Rogoff (Eds.), MIT Press for NBER Rodrik, D, (1999) ‘The New Global Economy and Developing Countries: Making Openness Work’, Overseas Developing Council, London Rodrik D. (2000), Can Integration into the World Economy Substitute for a Development Strategy?, World Bank’s ABCDE – Europe Conference in Paris, France, June 26-28 Rodrik D. (2000) Development Strategies for the Next Century, Institute for Developing Economies, Japan External Trade Organization, Conference on “Developing Economies in the 21th Century”, Chiba, Japan, January 26-27. Rodrik D. (2002), Trade Policy Reform as Institutional Reform, in Hoekman et al., p 3-10. Sachs, J., and A. Warner (1995) Economic Reform and the Process of Global Integration, Brookings Papers on Economic Activity, vol 1. Slaughter M.J. (1997), Per Capita Income Convergence and the Role of International Trade, American Economic Review, 87,2, pp.194-99. Srinivasan T.N. and J. Bhagwati, “Outward Orientation and Development: Are Revisionsits Right?” available at www.columbia.edu/~jb38/papers.htm . Subramanian, A. and D.Roy, (2001), ‘Who can Explain the Mauritian Miracle?’, Meade, Romer, Sachs or Rodrik?’, IMF Working Paper 01/116 The Economist (2003), Libert’s great advance, Survey, June 26. Vijverberg W.P.M. and J. Haughton (2002), Household Enterprises in Vietnam: Survival, Growth, and Living Standards, World Bank Policy Research Working Paper 2773. Wacziarg R, and K. Welch, 2003, ‘Trade Liberalization and Growth: New Evidence’, NBER Working Paper 10152 Wade R. (2001), Winners and Losers, The Economist, April 26. Westphal, L.E. (1990), “Industrial Policy in an Export-propelled Economy: Lessons from South Korea’s Experience,” Journal of Economic Perspectives, Vol. 4, pp. 41-60. Winters A. (2000a), Trade Liberalisation and Poverty, mimeo Winters A. (2000b), Trade, Trade Policy and Poverty: What are the Links?, CEPR Discussion Paper 2382 Winters A. (2002), ‘Trade Policies for Poverty Alleviation’ in Hoekman B., A. Mattoo and P. English (Eds.) (2002) World Bank Policy Research Report (2002), Globalization, Growth, and Poverty, World Bank and Oxford University Press.
36
World Bank (Ed.) (2000), Poverty and the International Economy, Conference in Stockholm, Sweden, October 20-21. World Bank (2003), Global Economic Prospects 2004. Realizing the Development Promise of the Doha Agenda, IBRD/World Bank. Young, Alwyn. 1991. “Learning by Doing and the Dynamic Effects of International Trade,” Quarterly Journal of Economics: 369-405.


![Accession to the WTO - WHO · © WTO - OMC 2004 Accession to the WTO ... WORLD TRADE ORGANIZATION ... Microsoft PowerPoint - WHOpres.ppt [Read-Only] Author:](https://img.pdfslide.us/doc/110x75/5aea95b97f8b9a90318bd175/accession-to-the-wto-wto-omc-2004-accession-to-the-wto-world-trade-organization.jpg)


![U.S. - RUSSIAN TRADE RELATIONS & WTO ACCESSION. Sara Scarbro George Mason University. [Independent Study, Dr. Malawer -- Fall 2006.]](https://img.pdfslide.us/doc/110x75/5514168d550346e2488b532a/us-russian-trade-relations-wto-accession-sara-scarbro-george-mason-university-independent-study-dr-malawer-fall-2006.jpg)