Embed Size (px)
Citation preview

TRADE POLICY AND MARKET ACCESS ISSUES FOR DEVELOPING COUNTRIES:
Implications for the Millenium Round
Constantine Michalopoulos*
*The author is Senior Economic Advisor in the World Bank. The views expressed in this paper are solelythose of the author and should not attributed in any way to the World Bank.
ii
PREFACE
The research and writing of this paper was undertaken over the period November 1997 - June 1999, while Iwas serving as Special Economic Advisor to the WTO on secondment from the World Bank. Completion ofthe project was only possible because of the assistance and contributions of many current and former WTOstaff, all of whom I wish to thank, but who are in no way responsible for remaining errors and inaccuraciesin the paper. In particular, Marcelo Olarreaga helped with directing the original data collection andcompilation effort. Later on this role was played by Mukela Luanga, who also helped organize thedeveloping country tariff information. The data intensive nature of the project required contributions fromseveral research assistants. I am especially grateful to Gilles Moser, without whom this work could not havebeen completed and Philip Rauh and Stephanie Guinaut-Straus for their help at earlier stages of the project.Several WTO staff, Willy Alfaro, Zdenek Drabek, Michael Finger, Mukela Luanga and LudgerSchuknecht and J. Michael Finger of the World Bank made useful comments on a previous draft of thepaper. Finally, I wish to thank Patrick Low and Peter Tulloch for the overall support and encouragementthey gave me at all stages of initiating and completing this work.. Views expressed in this paper are solelymy own and should not be attributed to either the WTO or the World Bank.
Constantine Michalopoulos

iii
TABLE OF CONTENTS
PAGE
SUMMARY.................................................................................................................................... iv
INTRODUCTION ........................................................................................................................... 1
TRENDS IN DEVELOPING COUNTRIES’ TRADE, 1989-1997................................................ 4
DEVELOPING COUNTRIES’ TRADE POLICIES AND INSTITUTIONS................................. 8
Trade Policies that Affect Imports .................................................................................. 10Trade Policies that Affect Exports .................................................................................. 30Other Institutions and Measures that Affect Trade......................................................... 39
THE EXTERNAL ENVIRONMENT ........................................................................................... 44
Tariffs ............................................................................................................................ 45Non-Tariff Measures ..................................................................................................... 50Trade Remedies............................................................................................................. 55
CONCLUSIONS AND POLICY IMPLICATIONS ..................................................................... 61
REFERENCES .............................................................................................................................. 68
APPENDIX ................................................................................................................................... 71

iv
TRADE POLICY AND MARKET ACCESS ISSUES FOR DEVELOPING COUNTRIES:Implications for the Millenium Round
SUMMARY
Following the Uruguay Round Agreements (URA) developing countries increased their integrationinto the world economy. As the World Trade Organization (WTO) is about to embark on a new Round ofmultilateral trade negotiations, this study analyses two important dimensions of developing countries’integration in the international trading system: their own trade policies and problems of market access fortheir merchandise exports. The results of the analysis are then used to recommend an agenda of topics anddeveloping country positions for the upcoming WTO negotiations.
The major innovation of this study is that it is based on a systematic review of the detailedinformation contained in 61 Trade Policy Reviews (TPRs) of 42 developing countries prepared forGATT/WTO over the period 1989-1998. The TPRs contain a great deal of detailed and authoritativeinformation on countries’ trade policies and institutions on a consistent basis and over time which has notbeen hitherto systematically analysed. The group of developing countries on which the study is basedincludes thirteen developing economies from Latin America and the Caribbean, thirteen from Asia and thePacific, eleven from Sub-Sahara Africa and five from Europe, Middle-East and North Africa which togetheraccount for the bulk of the trade of developing members of the WTO
The main findings and recommendations are as follows:
1. The integration of the developing countries into the multilateral trading system has beenespecially impressive for a group of perhaps 15-20 middle and higher income developing countries inLatin America and Asia. For many others, progress has been much slower. Following the URA,protection both through tariff and non-tariff measures appears to be greater in low- income than inmiddle- and higher- income developing countries. While this conclusion is subject to a number ofmethodological caveats, it suggests the variety of challenges and opportunities different developingcountries will face in the context of future WTO negotiations.
2. The URA resulted in a major step forward by bringing the agriculture sector under thedisciplines of the GATT. Nonetheless, very substantial protection continues to be present through avariety of controls and interventions that encumber international trade in agriculture. Various developingcountries face different situations and challenges in their agricultural sector, which are likely to result indifferent groups of developing countries emphasizing different issues in the up-coming negotiations.There are two main groups: (a) major exporters of agricultural commodities, members of the Cairns groupwho would be seeking to reduce the Aggregate Measures of Support (AMS) and export subsidiesprovided to agriculture by developed countries; (b) traditional net food importing developing countriesand others with substantial protection of agriculture which are concerned that export subsidy reduction bythe developed countries will increase their import bills. These countries have been seeking to obtain anincreased amount of food aid through the recently renegotiated Food Aid Convention to compensate forwhatever increased costs export subsidy reduction may entail. While the revised Convention should proveof greater assistance to developing countries as a whole, and could help in a small way in dealing withsome of the food security problems many face, it is not a substitute for further liberalization ofagricultural trade - indeed it should be viewed as a supporting element for such liberalization. Reducedprotection in developed country markets will improve market access prospects both for existing andpotential exporters; while reduced export subsidies by developed countries will reduce internationalmarket distortions that impede the expansion of developing country agricultural production.

v
3. There is mounting support by both developed and developing countries that negotiations forthe mutual reduction of tariffs on manufactures be included in the future Round. The analysis shows thatdeveloping countries continue to face tariff peaks and escalation in developed country markets for somecategories of manufacturing products—albeit to a smaller degree than before the URA. But the analysisalso shows that applied tariffs for manufactures are on average higher in developing countries than indeveloped countries; that this even more the case, when bound rates are compared; and that manydeveloping countries have not bound a significant proportion of their tariffs on manufactures. Theconclusion is that there is a good opportunity for a negotiation with prospects for shared and balancedbenefits, for developed and developing countries alike, emanating both from the liberalization undertakenby countries themselves and improvements in foreign market access; and that a formula approach is likelyto be helpful in securing reductions in developed country tariff peaks.
4. As there are few non-tariff barriers (NTBs) still in place in the developed countries outside thetextile and clothing sector, the key issues developing countries face are how to ensure that: (a)commitments under the Agreement on Textiles and Clothing (ATC) are implemented; and (b) NTBs arenot imposed under the guise of other rules or arrangements. Also, some developing countries continue toimpose NTBs on manufacturing imports. These have been shown to be very damaging to their economiesfor a variety of reasons including through the lack of transparency and the stimulation of wasteful rentseeking. These measures should be eliminated at the earliest possible opportunity, or, where appropriate,converted into tariffs that will be subject to reductions over time, possibly as part of the WTOnegotiations.
5. In the last few years anti-dumping action has become the instrument of choice for providingtrade remedies by both developed and higher and middle income developing countries. Their example islikely to be followed by other developing countries in the future. Anti-dumping actions have beenespecially frequent against imports from non-WTO members and, in particular, so called “non-market”economies in the former Soviet Union and China. Although anti-dumping actions carry the potential ofshielding inefficient domestic producers, their proliferation in developing countries and especiallyagainst developed country exporters, could well provide the balance needed for a longer termreconsideration and tightening of the WTO anti-dumping agreement provisions. Such a reconsiderationshould aim at reducing the flexibility all countries have in granting relief through this instrument andinduce governments to rely more on safeguard actions, which tend to be more transparent and time-limited.
6. Developing countries have reduced interventions aimed at controlling or taxing primaryexports, while bringing their practices in promoting manufacturing exports more in line with the overalldisciplines of the WTO, e.g. with regard to the use of export subsidies. Nonetheless, export controls onprimary products continue to be present and pose dangers in a number of countries: they createdisincentives to production for export which may reduce export earnings; and could lead to theestablishment of inefficient domestic processing industries, which can only survive through the implicitprotection afforded by the artificially lower domestic input prices. Alternative instruments for support ofdomestic processing activities are available and should be used instead.
7. Many developing countries, especially lower income and Least Developed Countries facesignificant constraints in their capacity to implement effectively their WTO obligations in a number ofareas, including customs administration, Sanitary and Phyto-sanitary measures, and technical barriers totrade. These constraints have been recognized in the WTO agreements, which permit developingcountries longer time frames to bring their policies and institutions into line with their WTO obligationsin some of these areas, as well as encourage developed country members to provide technical assistancein support of developing country efforts to strengthen their institutions. Considerable amounts of

vi
technical assistance are available from a variety of bilateral donors and international organizations. Thereare problems, however, regarding the effective co-ordination of such assistance, ensuring that it is notsupply- driven and reflects accurately the priorities and needs of the developing countries concerned.While the WTO has increased its technical co-operation efforts in recent years, more resources from itsown budget may usefully be employed to assist developing country members. This is needed both inorder to permit the WTO to provide leadership in international co-ordination of technical assistanceefforts, and in order to provide support in areas in which the WTO has particular expertise andresponsibilities.

TRADE POLICY AND MARKET ACCESS ISSUES FOR DEVELOPING COUNTRIES
I. Introduction
As developing countries approach the new millennium, policies and attitudes about integration into
the multilateral trading system differ. In many countries, the rapid expansion of international trade over the
1990’s has created a solid domestic base in support of liberal trade regimes. In others, especially the Least
Developed Countries (LDC) and many in Africa, which are still only marginally integrated into the
multilateral trading system, policies and attitudes are clouded with uncertainty. The Asian crisis has
heightened government concerns about the impact of globalization on fragile economies with pervasive
poverty. Many developing countries have also questioned whether aspects of the Uruguay Round
Agreements (URA) of interest to them have been implemented consistently with the intent and expectations
they had at the time of the agreements; and whether further commitments to liberalize trade can be
supported by their weak domestic institutions. Finally, there are different emphases in the thrust of future
integration efforts, as between regional and multilateral approaches.
In this global environment, developing countries are participating in a series of important trade
negotiations, some of which are already under way and some of which will start by the year 2000. First,
there are the WTO negotiations on agriculture and services already scheduled to start in 1999 - 2000 which
will involve all developing countries members of the WTO; and there is still the open question as to whether
a wider set of trade negotiations will be launched by the WTO starting in 2000 and beyond and what will be
its focus. At the same time, there are several negotiations involving groups of developing countries, such as
those between the ACP countries and their EU partners, and regional arrangements among developing
countries, such as MERCOSUR and SADEC.
As developing countries are approaching these negotiations in the currently unsettled international
environment, it would seem useful to take stock of where they stand in terms of their integration into the
multilateral trading system. This study attempts such a stock taking after several years of implementation

2
of the URA. It focuses on two important dimensions of integration in the international trading system:
developing countries’ own trade policies and issues of market access for trade in goods.
The study has two main objectives: (a) to review and analyse trade policies and institutions of
developing countries and conditions of market access in their main trading partners; (b) to use the results of
the analysis in the development of a future agenda of topics for negotiation in the WTO as well as initiatives
by the international community and the developing countries aimed at their more effective integration in the
international economy.
Trade policies and market access issues for developing countries have been extensively analysed in
the aftermath of the URA (Martin and Winters, 1996; Finger et.al., 1996; UNCTAD/WTO, 1997; Drabek
and Laird 1998; Finger and Schuknecht, 1999). The major innovation of this study is that it is based on a
systematic review of the detailed information contained in Trade Policy Reviews (TPRs) of developing
countries prepared for GATT/WTO. The analysis utilises information from 61 TPRs prepared for 42
developing economies over the period 1989-19981 In addition, the study updates trade policy information,
e.g. regarding applied tariffs, and market access issues, such as anti-dumping, based on more recent WTO
notifications.
The main objective of the TPR mechanism is to " contribute to improved adherence by all WTO
Members to rules, disciplines and commitments under the Multilateral Trade Agreements by achieving
greater transparency and understanding of the trade policies and practices of members" (WTO, 1995, p.434).
The reviews contain a significant body of detailed information on policies and institutions affecting both
imports and exports on a consistent basis and over time which has been reviewed and discussed by the
country and the WTO Members (and previously, the GATT Contracting Parties) and can therefore be

3
considered accurate and authoritative, but which has not been hitherto systematically analysed. 2 While
various aspects of the TPR could be strengthened, (Keesing, 1998), There is little dispute over the accuracy
of the information they contain. For the countries for which only a GATT period TPR was available (i.e.
before 1995) however, it has been necessary to update the TPR information based on recent country
notifications, e.g. regarding tariffs, which contain URA commitments. In others, such as antidumping
measures or LDC problems, different and more complete data exist in the WTO and have been used to
supplement TPR based information. In still others, for example market access issues, additional outside
sources have been used, mainly from the OECD.
The group of developing countries on which the study is based includes thirteen developing
economies from Latin America and the Caribbean, thirteen from Asia and the Pacific, eleven from
Sub-Sahara Africa and five from Europe, Middle-East and North Africa. A detailed list of the countries can
be found in the Appendix Table A-1. They account for the bulk of the trade of developing members of the
WTO (see below). The main limitation of the group of developing countries on which the study is primarily
based is that it contains only four least developed countries (Bangladesh, Benin, Uganda and Zambia) out of
a total of 29 which are members of the WTO. On the other hand, the study has used information regarding
the challenges least developed countries face in integrating into the multilateral system developed in the
context of the assessments of trade-related technical assistance needs prepared for 38 LDCs in 1997-1998
(WT/COMTD/IF1-38, 1997-1998). Also, the analysis is limited to merchandise trade only, excluding
services, partly in order to make the scope of the project more manageable and partly because the TPRs did
not cover services before the establishment of the WTO.
1By the end of 1998, TPRs had been prepared for 47 developing economies, members of the WTO. Five of these (Burkina Faso,
Jamaica, Mali, Trinidad and Tobago and Solomons Islands) are not included in the study, as the TPR was prepared after thedata base for the study was completed.
2 While several aspects of the TPRs in principle could be strengthened, (see Keesing ,1998), it is important to recallthat there are serious limits to what can be done in that respect: There are inherent limitations spelled out in theterms of reference for the TPRs, e.g. regarding their use in developing information on the consistency of
4
The study starts with a brief review of developing country trade performance in the 1990’s. This
uses WTO and World Bank data and covers major developments in developing countries’ exports and
imports utilising growth rates, shares of trade related to output and similar aggregate indicators. The main
purpose of this section is to compare, in general terms, the performance of the 42 developing countries, on
which the study is based, to that of developing countries as a whole; not to undertake a systematic analysis
of trends in developing countries trade performance or the factors that affected it during this period.
The next section presents a comprehensive and detailed review of the state of developing country
trade policies and institutions based on the latest available Trade Policy Review. For the 17 economies, for
which more than one TPR has been prepared, an effort is made to trace the evolution of various policies and
institutions over the whole period 1989-1997.
The third section is devoted to a discussion of the international environment facing developing
countries. This is based on information developed from three main sources: (a) the TPRs of the developed
countries, their main trading partners; (b) information generated outside this project - e.g. in the
OECD/UNCTAD, regarding key indicators of access in developed country markets; and (c) special WTO
analyses of market access issues for LDCs ( WT/COM/TD/HL/14).
The final section summarizes the main conclusions of the study and their implications for action by
the developing countries and the international community on steps that would enhance the integration of the
developing countries into the multilateral trading system.
II. Trends in Developing Countries’ Trade, 1989-1997
The period covered by this study, 1989-1997, witnessed a very rapid expansion of world trade,
and an even more rapid expansion of developing countries’ trade. Between 1989 and 1997, the value of
country measures with WTO obligations; as well as constraints on what the WTO Secretariat can accomplishwith the limited resources devoted to TPR preparation.

5
world merchandise exports increased at a compound annual rate of 7.6 per cent while exports of
developing countries increased at an annual rate of 9.5 per cent. Developing countries’ merchandise
imports increased even faster, at an annual rate of 10.4 per cent (see Table 1). The 42 countries in the
study experienced a slightly greater growth in trade than developing countries as a whole: their
merchandise exports grew in value at an average annual rate of 10.2 per cent and their imports at 12.2 per
cent. This performance contrasts starkly with the perfomance of the 48 least-developed countries, many of
which are not WTO members: In the 1990’s exports of the least-developed countries as a group grew at
5.5 per cent per annum in value, resulting in a further marginalization of these small economies, whose
exports at present account for no more than 0.6 per cent of world exports (WTO, 1998).
Table 1
Trends in World Merchandise Trade
(in US$ million and %)
Exports ImportsExports
Growth RateImports
Growth Rate
1989 1997 1989 1997 1989-1997 1989-1997
42 Developing Countries 399368 865921 396712 994633 10.2% 12.2%
Developing countries Members of WTO 466320 962419 456939 1091432 9.5% 11.5%
Least developed Countries 14044 21507* 21698 32751* 5.5%* 5.3%*
All Developing Countries 674924 1395585 658899 1451235 9.5% 10.4%
World Trade** 2237081 4023348 2341482 4185652 7.6% 7.5%
Explanation :* 1996** excluding significant double counting and EU intra-imports.
All developing countries-- based on the WTO statistical “definition” with the following changes : South Africa is included indeveloping countries and Israel is excluded.
Source: WTO, 1998.
At the beginning of the period, the 42 developing countries had economies which were slightly
less dependent on international trade than developing countries as a whole: The ratio of their total trade
(merchandise exports plus imports) to GDP in 1989 was 36.2 per cent compared to 38.3 per cent for all

6
developing countries. By the end of the period, their trade/GDP ratio was almost identical to that of
developing countries as a whole (Table 2), as both had grown to about 44 per cent, reflecting the greater
integration of developing countries in the world economy, as measured by this indicator.
Total trade of the 42 countries at the end of the period (1997) accounted for 91 per cent of the
trade of developing countries members of the WTO. The remaining, over 50 developing countries –
mostly LDCs and other small economies, accounted only 9 per cent. Thus, with the exception of the
LDCs the performance of the group of countries in the study can be taken to reflect the performance of
developing countries as a whole, especially developing countries members of the WTO.3
Tables 2 and 3 provide more detailed information on the trade performance of the 42 countries by
per capita income level and region as well as by broad commodity categories of exports and imports.
Table 2 shows little variation in the export growth over the period when countries are grouped by per
capita income level; though, the growth rate of exports was lowest among the highest per capita income
group. Imports grew the fastest in the countries in the middle income group and in the Latin America
region.
The trade/GDP ratio in both periods was highest for the high income countries and lowest for
those in the low income group, suggesting that the degree of a country's integration in the world economy
is positively related to per capita income. This is not necessarily the case, however, as the trade/GDP
ratio is also affected by aggregate economic size, and many small, low income, raw material exporters in
Sub-Sahara Africa have high trade/GDP ratios. On the other hand, one of the interesting facts brought out
in this table is that, over the period 1989-1997, the ratio of trade/GDP rose the most for the low income
group, suggesting their increasing integration in the world economy over time.

7
Table 2
Trends in Developing Countries’ Merchandise Trade
Annual Rates of Growth and Trade / GDP(in %)
Exports
(1989-1997)
Imports
(1989-1997)
Total Trade* /GDP
(1989)
Total Trade* /GDP
(1996)
42 Developing countries 10.2% 12.2% 36.2% 43.4%
High Income (4) 8.9% 10.1% 87.3% 83.9% Middle Income (23) 11.0% 13.9% 30.8% 41.3% Low Income (15) 9.4% 9.9% 24.0% 36.1%
Latin America and the Caribbean (13) 10.5% 15.8% 22.2% 27.3% Asia and Pacific (12) 11.0% 11.4% 53.3% 64.4% Sub-Sahara Africa (12) 4.5% 7.1% 45.3% 52.7% Europe, Middle-East and North Africa (5) 9.5% 11.2% 30.7% 37.4%
All Developing countries 9.5% 10.4% 38.3% 44.0%
Explanation :* Exports plus Imports relative to GDP.High Income (H), Middle Income (M) and Low Income (L) : see World Bank Classification of Economies (1996)Latin America and the Caribbean : Argentina (M), Bolivia (M), Brazil (M), Chile (M), Colombia (M), Costa Rica (M),Dominican Republic (M), El Salvador (M), Mexico (M), Paraguay (M), Peru (M), Uruguay (M), Venezuela (M).Asia and Pacific : Bangladesh (L), Fiji (M), Hong Kong China (H) , India (L), Indonesia (M), Korea (H), Malaysia (M),Pakistan (L), Philippines (M), Singapore (H), Sri Lanka (L), Thailand (M).Sub-Sahara Africa : Benin (L), Cameroon (L), Côte d'Ivoire (L), Ghana (L), Kenya (L), Mauritius (M), Nigeria (L), Senegal(L), South Africa (M), Uganda (L), Zambia (L), Zimbabwe (L).Europe, Middle- East and North Africa : Cyprus (H), Egypt (M), Morocco (M), Tunisia (M), Turkey (M).
Source: WTO, 1998 ; World Bank, 1998 ; IMF, 1998.The table also shows that both exports and imports grew the slowest in the group of countries in Sub
Sahara Africa, whose performance during this period was actually even worse than that of the LDCs.
Finally, Table 3 looks at the trade performance of the 42 countries by regional group in terms of
their composition of trade as between manufactures and non-manufactures. The table highlights the
strong expansion of manufactures exports in Latin America over the period; but also, somewhat
surprisingly, among the Sub-Saharan countries, although the latter group was starting from a low base.
3The words "countries" and "economies" are used interchangeably in this study—although certain WTO members, for example,
Hong Kong (China) are not sovereign states. The largest developing economies by trade value excluded from this analysisare China, Chinese Taipei and Saudi Arabia which are not members of the WTO.

8
The Table also shows the very slow growth in exports of non-manufactures by Sub-Saharan African
countries, explained in good part by weak prices for their main raw material exports. Other studies
(Martin, 1999) have shown that a significant portion of the growth in developing countries exports of
manufactures in Latin America and Asia is the result of expanding trade among the developing countries
themselves.
III. Developing Countries’ Trade Policies and Institutions
The Trade Policy Reviews document in detail the great progress most developing countries
members of the WTO have made in liberalizing their trade regimes during the last decade. The
liberalization has had several dimensions: (a) applied tariffs have been lowered; (b) many countries have
bound a significant number of tariff lines in the context of the URA; (c) the overall use of non-tariff
barriers to trade has decreased in practically all countries; and (d) in general, the incidence
Table 3
Developing Countries Trade (1989-1997): Manufactures and Non Manufactures
Annual growth rates(in %)
Manufactures exports
Non manufactures exports
Manufacturesimports
Non manufactures imports
42 Developing countries 14.2% 5.5% 14.6% 9.8%
Latin America and the Caribbean 15.3% 6.7% 17.7% 10.4% Asia and Pacific 12.6% 6.0% 12.4% 8.8%
Sub-Sahara Africa 15.2% 1.7% 7.0% 7.3% Europe, Middle-East and North Africa 11.1% 6.9% 12.5% 9.1%
All Developing countries 14.2% 8.5% 14.0% 9.7%
Explanations :For definitions see Tables 1 and 2.
Source : WTO, 1998 ; World Bank, 1998.
9
of government intervention in trade has declined. Similar conclusions have been reached by many recent
studies (Drabek and Laird, 1998; Finger and Schuknecht, 1999). This analysis permits us to document
them with individual country details collected on a systematic basis.
The timing of liberalization varied: In some countries, for example, Bolivia, Chile and Morocco
the bulk of the reforms occurred in the 1980’s; in others, such as Brazil, Dominican Republic and Zambia
they occurred in the early 1990’s and were then consolidated in the context of the URA. In still others
limited progress has been made in recent periods.
At the same time the TPRs help identify the remaining issues in the reform agenda and some of
the new challenges faced by developing countries. For example, a lot of the tariff bindings are at levels
much higher than applied tariffs, creating a degree of uncertainty to exporters wishing to access these
countries’ markets as well as an opportunity for resurgent protectionism; while the overall use of non-
tariff measures has declined, the use of certain trade remedy measures such as anti-dumping is on the
increase; Moreover, there is rising evidence of the difficulties institutions of developing countries,
especially LDCs, are encountering in implementing WTO commitments in new areas such as Trade-
related Intellectual Property Rights (TRIPS), Sanitary and Phytosanitary Measures, (SPS) and Technical
Barriers to Trade (TBT).
The next two parts of this section are devoted to a review of developing countries’ trade policies
that directly affect imports and exports. In each case, there is a discussion of institutional issues. But no
effort has been made to discuss other policies that affect trade, especially exchange rate or macro-
economic policies or domestic subsidies or taxes. In cases where more than one TPR has been prepared
it is possible to document the changes relatively precisely and show some of them in quantitative terms.
In others, the TPRs provide us with snapshots of the situation at the time the most recent TPR was
prepared.
10
A. Trade Policies that Affect Imports
1. Tariffs
The simple average applied MFN tariff level and the standard deviation in the applied tariff level
for the latest year available, as well as the average level of binding, the average difference between
applied and end of UR bound rates and the proportion of tariff lines unbound for the 42 developing
countries in the sample are presented in Table 4. The table shows the great variability in developing
country trade regimes. Average applied rates range from zero in Hong Kong and Singapore, to a range of
10-20 per cent in many countries in Latin America, to over 30 per cent in Egypt, India, Kenya, Pakistan,
Tunisia and Thailand and several African countries.4 The simple average applied tariff rate for the
countries in the sample was 19 per cent.5
Tariff rates also vary substantially within each country with overall standard deviations in excess
of 10 for several countries; and similarly high coefficients of variation. Interestingly enough however, the
variability in the applied tariff rate structure of the developing countries in the sample is not substantially
different from that of many developed countries (See OECD, 1997, Tables 1.1-1.4). The main reason for
this increasing similarity is the increased variability of the agricultural tariffs in developed countries as a
consequence of tariffication in agriculture.
The Table also shows the significant variability in the proportion of total tariff lines developing
countries have bound in the UR. On the whole , of course, the proportion of tariff lines bound by
developing countries increased during the UR. But, while WTO Members have bound all their
agricultural tariff lines, many developing country members have bound only a small proportion of the
4The main source of the data is the WTO Integrated Data Base (IDB) which is based on country notifications. In a few cases
where the TPRs contain more up to date information on country applied rates than those notified, these later estimates havebeen used and are noted with an asterisk in Tables 4 and 5. TPR applied tariff information is sometimes available at the 2-digit HS classification.
5 This average needs to be used with caution as it refers to applied rates in different countries in different years, andsome countries have subsequently reduced their tariff schedules. Unfortunately the data do not permit acalculation of an applied tariff average for the group of countries as of a given recent year post URA.

11
lines in the rest of their tariff schedules. There is an apparent regional pattern: In Latin America all the
countries analysed have bound virtually all their tariff lines. But in Africa and Asia many countries have
bound only a small proportion of tariffs outside agriculture. In some cases, e.g. Hong Kong, Singapore,
countries committed to low applied tariff rates, 62 per cent and 34 per cent of the tariff schedule is
unbound. Their practice, according to the TPR, appears to be motivated primarily by a desire to use the
portion of the unbound tariff as a bargaining chip in future negotiations. In other countries, e.g. India,
Nigeria, Pakistan, with equally or even higher proportion of their tariff schedules unbound, there may be a
mixture of motivations which includes the desire to maintain the freedom to increase protection as
needed, for development or other objectives.
Table 4 also illustrates the large differences, on average, between bound and applied rates in most
developing countries. The bound rates reflect end period UR bindings. In a few cases, e.g. Pakistan,
Philippines, the average applied rates exceed the UR bound rates as these countries have committed in the
UR to reduce tariff rates (usually, in agriculture) over time. With these exceptions, most developing
countries have bound their tariffs at substantially higher rates than those they apply, if they have bound
them at all. Sometimes (e.g. Zimbabwe) the differences are in excess of 100 percent. For example,
Brazil has bound all its tariff schedule but at ceiling rates of 32 per cent. For countries which have bound
all their tariff schedule (Latin America, and a few others, e.g. Morocco) the average difference between
applied and bound rates is 30 per cent. In some cases, e.g. India, Nigeria, Pakistan, countries have bound
a small portion of their tariff schedule and have used ceiling bindings with high average rates for that
part which has been bound.
Ceiling bindings, just like unbound rates, introduce flexibility in developing country policy,
should governments feel the need to increase protection. However, they also carry significant risks. They
leave governments open to protectionist pressures from domestic producers who would wish to raise the

12
Table 4Developing Countries’ Tariffs
(in %)
COUNTRY YEAR BOUND APPLIED SD CV MARGIN % UNBOUND
Argentina 1997 35 14 2.1 0.2 22 0Bangladesh 1996 84 29 15.0 0.5 54 …Benin* 1998 114 13 6.4 0.49 101 …Bolivia 1995 40 10 0.1 0.0 30 0Brazil 1996 32 12 2.9 0.2 20 0Cameroon 1994 80 21 4.7 0.2 59 …Chile 1996 25 11 0.2 0.0 14 0Colombia 1996 52 13 3.4 0.3 39 0Costa Rica 1995 44 12 5.5 0.4 32 0Côte d'Ivoire 1994 13 21 0.3 0.0 -7 …Cyprus 1996 43 15 10.4 0.7 28 16Dominican Rep. 1994 40 20 5.0 0.2 20 0Egypt 1993 48 32 16.2 0.5 15 …El Salvador 1994 38 10 7.6 0.8 28 0Fiji* 1997 40 12 … ... 28 48Ghana 1993 78 17 4.0 0.2 61 …Hong Kong, China 1999 0 0 0.0 0.0 0 62India* 1997 54 35 … ... 19 67Indonesia* 1999 38 10 … ... 29 6Kenya 1994 93 36 7.6 0.2 57 …Korea 1996 26 15 57.1 3.9 11 17Malaysia 1996 19 9 14.4 1.7 10 21Mauritius* 1996 70 29 … ... 41 2Mexico 1996 49 14 … ... 35 0Morocco 1995 42 25 13.1 0.5 17 0Nigeria* 1999 117 24 … ... 94 80Pakistan 1996 68 68 16.3 0.2 0 70Paraguay 1996 35 11 3.4 0.3 24 0Peru 1993 32 19 2.3 0.1 13 0Philippines 1996 28 30 10.1 0.3 -2 40Senegal** 1989 17 12 … … 5 42Singapore 1995 9 0 … ... 8 34South Africa 1993 22 16 9.7 0.6 6 2Sri Lanka 1995 50 24 8.0 0.3 26 73Thailand 1995 29 25 8.9 0.3 4 36Tunisia 1995 69 31 7.5 0.2 38 47Turkey 1995 30 11 4.8 0.4 19 55Uganda 1996 62 17 4.7 0.3 45 75Uruguay* 1999 31 12 7.3 0.6 19 0Venezuela 1995 39 14 2.7 0.2 25 0Zambia 1996 101 16 4.0 0.3 85 85Zimbabwe 1994 123 17 6.4 0.4 106 9Average 49 19 8.0 0.5 30Average*** 38 14 4.3 0.3 24
Explanation:*** Average for 100% bound onlyBOUND simple average bound rate at the end of implementation of URAAPPLIED simple average applied rate (latest year available)SD standard deviation for applied tariff linesCV coefficient of variation : SD divided by the APPLIED tariff% UNBOUND proportion of total tariff lines unboundMARGIN difference between the average bound and applied rates
Source: WTO, IDB ; *WTO, TPR ; **Finger et. al., 1996, import weighted.

13
applied tariff to the ceiling binding; and they introduce uncertainty to foreign suppliers regarding market
access conditions which may also inhibit foreign direct investment.
Table 5 provides the same information as Table 4, but distinguishes between "Agriculture" (HS1-
24) and "Manufactures" (HS25-97). The Table shows that with the exception of six countries, average
applied tariffs on agricultural products are higher than tariffs for the rest of the product groups - which
include raw materials, fuels as well as manufactures. The same is true for bound tariffs with the exception
of 12 countries which have chosen ceiling bindings at the same rates for both agricultural and other
products.
A comparison of tariff rates for developing countries with those for industrial countries
(see below section IV), shows that average applied tariff rates for agriculture are broadly similar for the
two groups of countries. However, tariffs for manufactures are on average substantially higher for
developing countries.
Finally, Table 6 shows simple averages for applied and bound tariffs as well as for differences
between the two for different developing country income groups and regions. The averages contained in
this Table should be used with caution for reasons discussed earlier ( see footnote 6) and the small size of
some groupings (for example high income developing countries) necessitate even greater caution. It is
interesting, nonetheless, to note the pattern that both average bound and applied tariffs in manufactures
and for all the products together tend to vary inversely with per capita income—i.e. the poorer the
country, the higher the tariffs. This holds for all sectors and groups with the exception of applied tariffs in
agriculture, where there is little difference between the average for the high income and middle income
countries. Similarly, the average differences in the margins between applied and bound tariffs tend to be
highest in the low income countries and lowest in the highest income ones.

14
Table 5Developing Countries’ Tariff Rates by Sector
(in %)
COUNTRY HS2 BOUND APPLIED SD CV MARGIN
Argentina Agriculture 23 9 1.4 0.2 14
Manufactures 31 14 2.4 0.2 18
Bangladesh Agriculture 84 30 14.5 0.5 54
Manufactures 84 27 14.9 0.6 56
Benin* Agriculture 79 … … ... ...
Manufactures 119 … … ... ...
Bolivia Agriculture 40 10 0.0 0.0 30
Manufactures 40 10 0.1 0.0 30
Brazil Agriculture 36 11 2.4 0.2 30
Manufactures 32 13 3.0 0.2 26
Cameroon Agriculture 80 23 4.9 0.2 57
Manufactures 79 20 4.6 0.2 59
Chile Agriculture 32 11 0.0 0.0 21
Manufactures 25 11 0.2 0.0 14
Colombia Agriculture 85 14 3.0 0.2 71
Manufactures 40 12 3.5 0.3 28
Costa Rica Agriculture 44 17 9.9 0.6 27
Manufactures 45 11 4.1 0.4 34
Côte d'Ivoire Agriculture 15 17 0.2 0.0 -2
Manufactures 13 22 0.3 0.0 -9
Cyprus Agriculture 47 29 24.9 0.9 18
Manufactures 40 10 5.6 0.5 29
Dominican Republic Agriculture 40 21 4.8 0.2 19
Manufactures 40 20 5.1 0.3 20
Egypt Agriculture 92 34 24.6 0.7 58
Manufactures 33 31 13.5 0.4 1
El Salvador Agriculture 47 14 6.0 0.4 33
Manufactures 37 9 4.9 0.5 27
Fiji* Agriculture 41 12 0.0 29
Manufactures 40 13 0.0 27
Ghana Agriculture 87 20 3.9 0.2 67
Manufactures 67 16 4.0 0.3 52
Hong Kong, China Agriculture 0 0 0.0 n.a. 0
Manufactures 0 0 0.0 n.a. 0
India* Agriculture 112 … … ... ...
Manufactures 44 … … ... ...
Indonesia* Agriculture 47 9 24.3 2.8 39
Manufactures 37 10 15.7 1.6 27
Kenya Agriculture 98 40 7.1 0.2 59
Manufactures 84 35 7.7 0.2 49
Korea Agriculture 60 49 131.7 2.7 11
Manufactures 19 8 12.9 1.7 11
Malaysia Agriculture 17 5 8.3 1.7 12
Manufactures 20 9 14.9 1.6 10
Mauritius* Agriculture 119 18 … … 101

15
COUNTRY HS2 BOUND APPLIED SD CV MARGIN
Manufactures 65 30 … … 35
Mexico Agriculture 47 22 36.9 1.7 25
Manufactures 49 13 7.2 0.6 36
Morocco Agriculture 44 29 13.8 0.5 16
Manufactures 42 24 12.9 0.5 18
Nigeria* Agriculture 150 … … ... ...
Manufactures 46 … … ... ...
Pakistan Agriculture 101 71 16.6 0.2 30
Manufactures 51 67 16.2 0.2 -16
Paraguay Agriculture 0 10 2.6 0.3 -10
Manufactures 0 11 3.7 0.3 -11
Peru Agriculture 38 18 2.5 0.1 20
Manufactures 30 19 2.2 0.1 11
Philippines Agriculture 35 35 12.6 0.4 0
Manufactures 26 29 9.2 0.3 -3
Senegal** Agriculture 30 0 0 ## 30
Manufactures 12 13 … … 0
Singapore Agriculture 10 0 0.0 ## 10
Manufactures 8 0 0.0 ## 8
South Africa Agriculture 38 14 9.1 0.7 24
Manufactures 16 16 9.9 0.6 0
Sri Lanka Agriculture 50 35 10.6 0.3 15
Manufactures 50 20 7.2 0.4 30
Thailand Agriculture 34 38 8.0 0.2 -4
Manufactures 27 21 9.1 0.4 6
Tunisia Agriculture 115 35 7.4 0.2 80
Manufactures 49 30 7.5 0.3 19
Turkey Agriculture 53 18 10.1 0.6 35
Manufactures 21 8 3.1 0.4 12
Uganda Agriculture 61 23 5.6 0.2 38
Manufactures 63 15 4.4 0.3 48
Uruguay* Agriculture 35 13 7.3 0.6 22
Manufactures 30 12 5.4 0.4 18
Venezuela Agriculture 50 15 2.7 0.2 35
Manufactures 35 14 2.7 0.2 22
Zambia Agriculture 118 18 4.0 0.2 100
Manufactures 80 15 4.0 0.3 64
Zimbabwe Agriculture 134 15 6.4 0.4 119
Manufactures 106 18 6.4 0.4 88
Average Agriculture 59 21 12.2 0.6 34
Manufactures 42 17 6.3 0.4 23
Explanation:## not applicableSee also Table 2Agriculture products: HS1-24.Manufactured products: HS25-97
Source: WTO, IDB ; *WTO, TPR ; **Finger et. al. 1996, import weighted.

16
There are a few points to note in the regional breakdown as well. First, the few Sub Saharan
African countries that have bound tariffs, have done so at levels on average much higher than in the other
regions. Also, the simple average bound tariffs on agricultural products (where all countries have bound
100% of tariff lines) in Africa and the Europe and Middle East region, tend to be much higher than in
Asia and Latin America. In terms of applied tariffs, Latin America and the Caribbean countries have the
lowest average tariffs both in manufactures and agriculture, but the differences among the other three
regions are not large.
Table 6
Tariff Averages
(in %)
BOUND APPLIED MARGIN
M A T M A T M A T
42 developing countries 42 59 49 17 21 19 23 34 30
High Income (4) 17 29 20 5 20 8 12 10 12 Middle Income (23) 34 48 39 16 18 17 18 30 22 Low Income (15) 64 86 75 24 27 25 38 52 50
Latin America and the Caribbean (13) 33 40 38 13 14 13 21 26 25 Asia and Pacific (12) 34 49 37 19 26 21 14 18 16 Sub-Sahara Africa (12) 63 84 74 20 19 20 39 59 54 Europe, Middle-East and North Africa (5) 37 70 46 21 29 23 16 41 23
Explanations :M : ManufacturesA : AgricultureT : Total
Source : WTO, IDB ; WTO, TPR, Finger et. al. 1996, import weighted.
For most countries, the TPRs also contain a systematic estimation of escalation in the tariff
schedule. Escalation is measured by calculating the average tariff rates applied to three groups of
products, raw materials, intermediate products and final goods, which are consistently defined at the HS 6
digit level. Table 7 summarizes the information and reflects the judgements contained in the TPRs: thus a
rating of "1" in the table is given to countries where "substantial" escalation has been found, involving
rising average applied tariffs for all three product groups in ascending order. Negative escalation "2" is

17
defined as declining average rates as the stage of processing increases. A "mixed" rating, "3" is given to
countries where average tariffs are higher for final goods - but there is no significant difference between
raw materials and intermediates, or, as is sometimes the case, the average for intermediates is higher than
for raw materials. A rating of zero is given when escalation is low or not significant.
The Table shows that while progress has been made in reducing tariff escalation in some country
schedules in the post UR period (e.g. Korea, Mexico, South Africa, Thailand), the tariff schedules of 38
per cent of the countries on which information is available showed substantial escalation. In some cases,
(e.g. Pakistan), countries have noted that the escalation in the tariff schedules has been designed explicitly
to promote industrialization. Whatever the justification and merits of the policy, the facts are that tariff
escalation in a large number of developing countries is quite extensive and involves higher degree of
effective protection than escalation in developed countries (see below).
Unfortunately, while effective rates of protection were calculated in some TPRs , not enough
information was available on a systematic basis to present in a tabular form. But it is clear that countries
whose tariff schedules contain substantial escalation as shown in Table 7 as well as high average applied
rates, i.e 30 per cent or more as shown in Tables 4 and 5, and high dispersion (e.g. Egypt, Kenya,
Pakistan, Philippines, Tunisia), are likely to have effective rates of tariff protection of several hundred per
cent in a number of products/sectors.
The other issue that the TPR bring out quite clearly, is the large differences between the applied
MFN rates and the rates actually paid by importers. The differences are due to two factors: first, there is a
growing number of preferential trade arrangements (PTA), usually of a regional nature, resulting in an
increasing proportion of imports coming in at lower preferential rates; second, most developing countries
provide tariff exemptions on a large number of products for a variety of purposes. Practically all countries
exempt from duties and other taxes goods imported by international and charitable organizations,

18
Table 7
Developing Countries Tariffs: Escalation and Exemptions
COUNTRY ESCALATION EXEMPTIONS COUNTRY ESCALATION EXEMPTIONS
Argentina(90) 1 0 Malaysia (97) 1 i
Argentina (98) 1 I Mauritius … i,x,r
Bangladesh 3 i,r Mexico (93) 1 i,x
Benin 2 x Mexico (97) 3 i,x
Brazil (92) 1 i,x Morocco (89) … i,x
Brazil (96) 1 0 Morocco (96) 1 i,x
Bolivia 0 i,x Nigeria (91) 0 i,x
Cameroon 3 0 Nigeria(98) 0 i
Chile (91) 0 x Pakistan 1 x
Chile (97) 0 x Paraguay 3 i,x
Colombia (90) 1 x Peru … x
Colombia (96) … x Philippines 1 x
Costa Rica 0 x Senegal 3 i
Côte d'Ivoire 1 i Singapore (92) 0 x
Cyprus 3 0 Singapore (96) 0 x
D. Republic 3 0 S Africa/SACU (93) 1 i,x,r
Egypt 1 i,r S Africa/SAC7 (97) 3 i,x,r
El Salvador 1 0 Sri Lanka 1 i,x
Fiji 1 x Thailand (91) 1 i,x,r
Ghana 1 i.x,r Thailand (95) 3 i,x,r
Hong Kong, China (90) 0 0 Tunisia 1 ...
Hong Kong, China(98) 0 0 Turkey (94) 3 i,x,r
India (93) 1 i,r Turkey(98) 3 I,x
India (97) 1 x Uganda 0 i,x
Indonesia (91) 1 i,x,r Uruguay (92) 1 i,x
Indonesia (98) 1 x Uruguay(98) 1 i,x
Kenya 1 0 Venezuela … x
Korea (92) 1 i,x Zambia 3 x
Korea (96) 0 i,x Zimbabwe … i,x,r
Explanation:Tariff Escalation: 0 = low or not significant Tariff Exemption: 0 = de minimis
1 = significant 1 = investment2 = negative r = regional development3 = mixed x = exports... = no information ... = no information
Source: GATT, TPR ; WTO, TPR..

19
diplomats, etc., which do not involve large amounts. Most also exempt products used in exports directly
or indirectly (see below section B). This is essential in order to eliminate the disadvantages export
industries would face if they had to pay higher than world prices for inputs they use. But many also
provide duty exemptions for the pursuit of a variety of objectives ranging from regional development,
investment in general - resulting in duty free importation of capital goods and raw materials - or
investment in particular sectors or industries (see Table 7). In 1991, Mauritius, for example, collected
US$26 million in duties on imports (includes sales and excise taxes) but exempted US$150 million, less
than half of which was related to exports. In the same year Benin, collected less than 10 per cent of duties
due, if the MFN rates were applied.
2. Non- Tariff Measures
The analysis of non-tariff measures (NTM) has three main dimensions: (a) the relative
importance of the different policy measures employed by all developing countries in the sample, as
measured by the frequency of their use; (b) the main product categories whose importation is affected by
non-tariff measures across the countries in the sample; (c) the overall use of non-tariff measures by
developing countries to control imports over the period 1989-1998 as measured by the overall frequency
of application of such measures.
The analysis relies on frequency ratios as indicators of the existence and scope of application of
various protective measures on different products by various countries. The advantages and limitations of
frequency ratios as indicators of protection are well understood (See Deardorf and Stern, 1998; Nogues
et.al. 1986; OECD, 1997). These ratios are indicators of the extent to which countries resort to particular
measures and the proportion of total products in terms of tariff lines or product groups which are affected
by such measures, irrespective of the value of the products actually imported. They do not necessarily
capture the protective effect of the measures taken. The protective effect of a prohibition of the
importation of a product e.g. in Thailand is going to be completely different from the application of a
20
variable levy in Uruguay or the use of a non-automatic license by India. The frequency ratios are
presented here in order to give overall impressions of the trade regimes in place in individual countries,
and the various measures used by different countries on different products - not to measure the actual
protection provided to each product or product group. A detailed discussion of the estimating procedures
followed and their limitations is presented in the Appendix. It is important to bear in mind these
limitations and use the estimates of the prevalence of non-tariff measures with caution. These indicators
are probably more useful in tracing the evolution of trade regimes within each country over time, than for
making inter-country comparisons, especially when the differences in indicator values are small.
The non-tariff measures include import licencing (and approvals), import prohibitions (partial or
total), quotas, tariff quotas, variable levies and/or minimum pricing, and import monitoring. Frequency
ratios were calculated for each measure as well as a total for each country.
(a) The Relative Importance of Different Kinds of Non-Tariff Measures employed by
developing countries is shown in Table 8. The table shows the product coverage of each non tariff
measure employed by each developing country relative to 97 product categories at the HS-2 level. Thus,
for example, the line for Argentina shows that non-automatic licensing affected products in 3 per cent of
the 97 product categories during 1989-1994. Note that this table (and several others similar to it) presents
a snapshot of a countries’ non-tariff measures as of the time their TPRs were prepared, not a period
average. The averages by measure show the relative frequency for each measure used only in the 17 the
developing countries for which two TPRs had been prepared, one in each period.
The data reveal several policy tendencies for the developing countries analysed: First,
non-automatic import licensing (including various forms of administrative approvals) continues to be the
measure that affects by far the greatest number of products imported into these countries, with
prohibitions of various kinds ranking second. An effort was made to exclude from consideration in these
calculations the large number of products which are subject to licensing to ensure public health, safety,
21
environmental and other standards. These are frequently justified by reference to GATT Article XX in the
TPRs. Even so, during the early period considered (1989-1994) non-automatic licensing affected large
proportions of developing country imports: Non-automatic licensing was present in more than one third
of the product categories. Several countries, such as Bangladesh, India, Nigeria and Pakistan have
indicated that the licensing and prohibition measures which they have used derive from balance-of-
payments difficulties.
No effort was made in this study to determine the consistency of these licensing arrangements or
for that matter, any other member policies with GATT provisions. Only 39 WTO Members have made
notifications on quantitative restrictions of which 22 are included in our study. Of the latter, 16 indicated
the use of quantitative restrictions - mostly justified under GATT Article XX. Three members, India,
Korea and Philippines also justified restrictions under the balance-of-payments provisions of Article
XVIIIb6. A recent report of the WTO Committee on Import licensing (WTO, 1998), showed that 19 of
the 42 developing countries analysed in the study invoked the delayed application provisions of the WTO
agreement regarding licensing procedures and that one quarter of the total (13) had not submitted
notifications regarding publications and/or legislation concerning licensing procedures.
Second, while caution is needed in interpreting the findings regarding the evolution of policy over
time because the sample of countries is partly different in the two sub-periods examined, the data strongly
suggest that the utilisation of all "core" non tariff measures with clearly protective effect, such as
licensing, prohibitions, quotas, and administered pricing has declined over time. This is shown by the
decreasing frequency ratios for the 1995-1998 period for the large majorities of countries for which data
are available for each of the two sub-periods. The only measure clearly showing an increase, is the use of
tariff quotas which is permitted under the URA in agriculture. Furthermore, the Tables do not show
further liberalization of the import regimes that has taken place

22
Table 8
Non-Tariff Measures in Developing Countries
Frequencies in Percent of Total HS 2 Categories, 1989-1998
Country Non-AutomaticLicensing Prohibitions Quotas Tariff Quotas Import
MonitoringVariable leviesMin. Pricing
1989-94 1995-98 1989-94 1995-98 1989-94 1995-98 1989-94 1995-98 1989-94 1995-98 1989-94 1995-98Argentina 3% 1% 2% 1% 1%Bangladesh 34% ... 43% ... ... ... ... ...Benin ... ... 1% ... ... ... ...Bolivia ... ... ... ... ... ...Brazil 10% 11% 7% 11% 1% 100% 1%Cameroon 8% ... ... ... ... ... ...Chile 1% 1% 5% 4%Colombia 55% 6% 7% 1% 3% 6%Costa Rica ... 6% ... ... ... 6% ... ...Côte d'Ivoire ... 31% ... ... 5% ... ... ...Cyprus ... 1% ... ... ... 21% ... ...Dominican Rep. ... 5% ... 1% ... ... ... 1% ...Egypt 14% ... 53% ... ... ... ... ...El Salvador ... 5% ... 1% ... 1% ... ... ...Fiji ... 5% ... ... ... ... ...Ghana ... 3% ... ... ... ... ...Honk Kong,China
2% 2% 16%
India 99% 94% 3% 1%Indonesia 53% 31% 5% 3% 1%Kenya 87% ... ... ... ... ... ...Korea 32% 3% 26% 25%Malaysia 55% 20% 4% 14% 2% 2% 7%Mauritius ... 9% ... 7% ... ... ... ...Mexico 28% 6% 1% 2% 7% 2%Morocco 51% 13% 1% 24%Nigeria 2% 14% 9%Pakistan ... 17% ... 1% ... ... ... ...Paraguay ... ... ... ... ... ...Peru ... ... ... ... ... 6% ...Philippines 7% ... 4% ... 1% ... ... ... ...Senegal 10% ... ... 5% ... ... ... ...Singapore 1% 1% 1%South Africa 36% 5% 3%Sri Lanka ... 23% ... ... ... ... ...Thailand 36% 11% 6% 2% 1% 12% 2% 3%Tunisia 54% ... ... ... ... ... 2% ...Turkey 5% 8% 11%Uganda ... 3% ... ... ... ... ...Uruguay 1% 1% 4% 31%Venezuela ... 2% ... 3% ... ... ... ... 13%Zambia ... ... 1% ... ... ... ...Zimbabwe 23% ... ... ... ... ... ...Average 24% 10% 6% 2% 1% 1% 1% 3% 4% 0% 3% 1%Explanation :… not available.Blank means zero.
Source: GATT, TPR ; WTO, TPR..
6WTO database cited in Finger and Schuknecht,1999.

23
since the TPR had been prepared (e.g. Tunisia) or commitments that countries have made (e.g. India) to
liberalize non-tariff measures in the future.
(b) The Main Products whose importation is controlled by Non Tariff Measures in these
developing countries – which account for the bulk of WTO member developing country trade, are shown
in Tables 9. The table shows the percentage of countries using each measure to affect imports in each
product category during the GATT period, 1989-1994 and during the WTO period, 1995-1998. Thus, for
example, the line on HS product group VII (Plastics), under non-automatic licensing for 1995-1998,
shows that 17 per cent of the 30 countries, for which there are TPRs for that period, used non-automatic
licensing procedures to control some products in this group. Country detail at the HS2 level is provided
in Appendix Table A-3.
The data show that agricultural products (Group I-IV or HS1-HS24) were the most subjected to
overall controls especially in the earlier period. The number of countries imposing these controls has
substantially declined in the period 1995-1998, following the tariffication in agriculture under the URA.
In addition to agriculture, mineral products, in particular fuels (HS27), rubber products (HS40),
machinery, especially Electrical Machinery (HS-85), and precious stones and metals continued to be
subject to controls, especially through licensing in a significant number of countries during this period
(See also Table A-3 ).7
7Table 17 below suggests that the product groups which are the focus of antidumping actions, both in developed and developing
countries tend to be somewhat different and include especially basic metals and chemicals.


24
Table 9
Non-Tariff Measure by Product Group
in % of Countries Using Measure, 1989-1998
NON AUTOMATICLICENSING PROHIBITIONS QUOTAS TARIFF QUOTAS
VARIABLE LEVIES& ADMINISTERED
PRICING
HS PRODUCT GROUP
1989-94 1995-98 1989-94 1995-98 1989-94 1995-98 1989-94 1995-98 1989-94 1995-98
I ANIMAL PRODUCTS 40% 14% 10% 3% 2% 0% 1% 9% 3% 3%
II VEGETABLES 37% 19% 5% 3% 4% 2% 1% 9% 3% 3%
II FATS AND OILS 45% 17% 14% 7% 0% 0% 0% 10% 3% 13%
IV PREPARED FOODSTUFF 32% 11% 7% 2% 1% 1% 1% 4% 3% 3%
V MINERALS 34% 24% 3% 6% 0% 0% 1% 2% 0% 0%
VI CHEMICALS 18% 9% 4% 1% 0% 0% 1% 2% 1% 0%
VII PLASTICS 21% 17% 5% 7% 0% 2% 3% 2% 5% 2%
VIII LEATHER 14% 2% 2% 0% 0% 0% 1% 0% 0% 0%
IX WOOD 14% 6% 2% 2% 0% 0% 2% 2% 1% 0%
X PULP AND PAPER 22% 4% 3% 1% 0% 0% 1% 2% 3% 0%
XI TEXTILES 24% 7% 10% 1% 0% 2% 1% 2% 5% 0%
XII FOOTWEAR 14% 3% 3% 0% 0% 0% 0% 1% 1% 0%
XIII GLASS 16% 6% 9% 1% 0% 0% 1% 1% 2% 0%
XIV PEARLS 34% 17% 3% 0% 0% 0% 0% 0% 0% 0%
XV BASE METALS 17% 7% 2% 2% 0% 0% 1% 2% 2% 0%
XVI MACHINERY AND ELECTRICAL EQUIPMENT 45% 22% 12% 7% 0% 0% 0% 3% 7% 0%
XVII VEHICLES 24% 11% 6% 6% 4% 2% 0% 1% 3% 0%
XVIII INSTRUMENTS 16% 4% 3% 0% 0% 0% 0% 0% 0% 0%
XIX ARMS 21% 3% 3% 0% 3% 0% 0% 3% 0% 0%
XX OTHER MANUFACTURES 13% 7% 8% 1% 0% 0% 0% 0% 1% 0%
XXI WORKS OF ART, ANTIQUES 10% 3% 0% 0% 0% 0% 0% 0% 0% 0%
Source : GATT, TPR ; WTO, TPR.

25
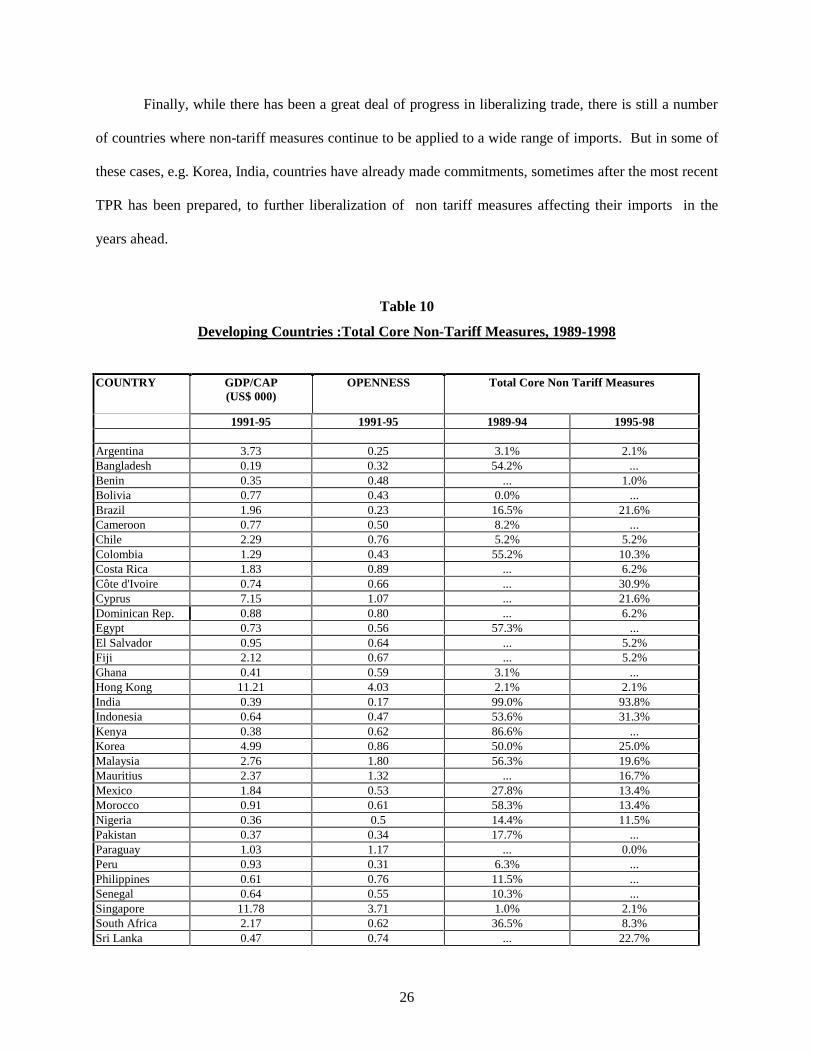
(c) The Overall Use of Non-Tariff Measures by developing countries during the GATT and
WTO sub-periods is presented in Table 10. Column 1 shows country per capita income averaged over the
period 1991-1995. Column 2 shows an openness index for each country calculated as the ratio of exports
plus imports divided by GDP over the period 1991-1995. Column 3 shows the total frequency ratios
(Tfm) for "core " non tariff measures ( see Appendix for a discussion of the meaning of total frequency
ratios). Core measures are defined as those that involve quantitative restrictions or price controls on
imports, i.e. non-automatic licensing of any kind, prohibitions, quotas and tariff quotas as well as variable
import levies and administrative/minimum pricing.8 As a particular product category may be affected by
more than one NTM, duplicative measures have been excluded in this calculation, i.e. if both a tariff-
quota and an import license are imposed on the same products in HS17, it would be only counted once.
The first point to note from the Table is that in the "GATT" part of the period covered 1989-1994,
the values of the total frequency ratios for NTMs using were extremely high for several countries -
covering more than 50 per cent of products in such countries as Bangladesh, Colombia, Egypt, Kenya,
India, Indonesia, Malaysia, Morocco and Tunisia. Without doubt NTMs at that time were an important
feature of many developing countries in all regions. Subsequently, the data strongly suggest that the total
frequency ratios have been substantially reduced, except for three of the countries (Brazil, Singapore,
Turkey) for which data exist for both periods.
Second, there is some tendency for the total frequency ratios of non- tariff measures to be greater
in countries with lower levels of per capita income and lower degrees of openness. The links however,
are weak and the data need to be subjected to more systematic analysis for more definitive conclusions as
to the relationship between these variables.
8See Nogues et. al. 1986 and OECD, 1997 on the definition of "core" non tariff measures. The definition used is similar to the
one used by OECD except that trade remedies are treated separately.
26
Finally, while there has been a great deal of progress in liberalizing trade, there is still a number
of countries where non-tariff measures continue to be applied to a wide range of imports. But in some of
these cases, e.g. Korea, India, countries have already made commitments, sometimes after the most recent
TPR has been prepared, to further liberalization of non tariff measures affecting their imports in the
years ahead.
Table 10
Developing Countries :Total Core Non-Tariff Measures, 1989-1998
COUNTRY GDP/CAP(US$ 000)
OPENNESS Total Core Non Tariff Measures
1991-95 1991-95 1989-94 1995-98
Argentina 3.73 0.25 3.1% 2.1%Bangladesh 0.19 0.32 54.2% ...Benin 0.35 0.48 ... 1.0%Bolivia 0.77 0.43 0.0% ...Brazil 1.96 0.23 16.5% 21.6%Cameroon 0.77 0.50 8.2% ...Chile 2.29 0.76 5.2% 5.2%Colombia 1.29 0.43 55.2% 10.3%Costa Rica 1.83 0.89 ... 6.2%Côte d'Ivoire 0.74 0.66 ... 30.9%Cyprus 7.15 1.07 ... 21.6%Dominican Rep. 0.88 0.80 ... 6.2%Egypt 0.73 0.56 57.3% ...El Salvador 0.95 0.64 ... 5.2%Fiji 2.12 0.67 ... 5.2%Ghana 0.41 0.59 3.1% ...Hong Kong 11.21 4.03 2.1% 2.1%India 0.39 0.17 99.0% 93.8%Indonesia 0.64 0.47 53.6% 31.3%Kenya 0.38 0.62 86.6% ...Korea 4.99 0.86 50.0% 25.0%Malaysia 2.76 1.80 56.3% 19.6%Mauritius 2.37 1.32 ... 16.7%Mexico 1.84 0.53 27.8% 13.4%Morocco 0.91 0.61 58.3% 13.4%Nigeria 0.36 0.5 14.4% 11.5%Pakistan 0.37 0.34 17.7% ...Paraguay 1.03 1.17 ... 0.0%Peru 0.93 0.31 6.3% ...Philippines 0.61 0.76 11.5% ...Senegal 0.64 0.55 10.3% ...Singapore 11.78 3.71 1.0% 2.1%South Africa 2.17 0.62 36.5% 8.3%Sri Lanka 0.47 0.74 ... 22.7%

27
COUNTRY GDP/CAP(US$ 000)
OPENNESS Total Core Non Tariff Measures
1991-95 1991-95 1989-94 1995-98Thailand 1.60 0.89 36.5% 17.5%Tunisia 1.40 0.87 54.2% ...Turkey 1.81 0.43 5.2% 19.8%Uganda 0.51 0.23 ... 3.1%Uruguay 2.70 0.58 32.3% 0.0%Venezuela 2.73 0.49 ... 17.7%Zambia 0.28 0.71 ... 1.0%Zimbabwe 0.62 0.63 22.7% ...
Explanation :GDP/CAP-- Per capita GDP in constant 1987 US$, US$ 000 (average, 1991-1995).Openness-- Merchandise Exports plus Imports divided by GDP (average, 1991-1995).Total Core NTMS-- Frequency ratio in % relative to total 2-digit HS categories.
Source : GATT, TPR ; WTO, TPR ; World Bank, 1998.
3. Trade Remedies
Trade remedies are defined to include anti-dumping, countervailing and safeguard actions. In
principle such actions are consistent with GATT provisions. The legal basis and procedures for the
imposition of trade remedies in each instance are different as are the remedies, which usually do not
involve quantitative restrictions but changes in duties and charges to address the problem as appropriate
in each case. In the case of antidumping and countervailing duties, remedies are intended to correct for
distortions that occur when exporters are obtaining subsidies and engaging in discriminatory pricing
practices which result in injury to domestic producers. In the case of safeguards, the issue is simply
injury to domestic producers - even if no unfair trade practices are involved.9
The evidence regarding the frequency with which developing countries have taken trade remedy
actions is presented in Table 11. For antidumping measures, the WTO data base contains information
from which tariff line frequencies were calculated. As it has been argued that the mere initiation of
investigations regarding antidumping action tends to have a restraining effect on imports - irrespective of
9Also, countervailing and anti-dumping actions are directed against the imports from only one country and not all trade—
although they may thereby create disincentives to exporters of other countries as well. For these reasons, it is consideredappropriate to keep the total frequency ratios for each group of measures separate (unlike the OECD study which adds themup for each country; see OECD, 1997, Table 5.1 ).

28
the final disposition of the case (Finger 1993; OECD, 1997), the main indicator used is the number of
anti-dumping investigations that had been initiated as of the time of the TPR. For safeguards and
countervailing, the actions were so infrequent , that the data shown refer to the number of specific
products, usually narrowly defined, on which there were either affirmative actions in place or on going
investigations as of the time of the most recent TPR, using both TPR data and WTO notifications. Thus,
while the two sets of data in Table 11 are not directly comparable, the frequency of safeguard and
countervailing actions is likely to be much smaller than those for anti-dumping.
The data verify and provide detail on the well known increasing use of antidumping actions,
especially by higher middle income developing countries and the emergence of antidumping as the
Table 11
Trade Remedies by Developing Countries, 1989-1998
(in % and Number of Products)
COUNTRY Antidumping*(1)
Countervailing**(2)
Safeguards**(3)
1989-94 1995-98 1989-94 1995-98 1989-94 1995-98
Argentina 0.70% 1.12% 2 3 2BangladeshBeninBoliviaBrazil 1.28% 0.54% 2 2 1CameroonChile 0.01% 0.74% 2 5Colombia 0.14%Costa Rica 0.23%Côte d'IvoireCyprusDominican Rep.Egypt xEl Salvador 1 1FijiGhanaHong Kong, ChinaIndia 0.07% 0.72%Indonesia 0.16%KenyaKorea 0.27% 0.53% 3Malaysia 0.16%MauritiusMexico 16.31% 28.12% 3Morocco

29
COUNTRY Antidumping*(1)
Countervailing**(2)
Safeguards**(3)
1989-94 1995-98 1989-94 1995-98 1989-94 1995-98
NigeriaPakistanParaguayPeru 0.05% 3.50%Philippines 0.06% 0.51%SenegalSingapore 0.02%South Africa 0.76%Sri LankaThailand 0.05% 0.05%TunisiaTurkey 0.45% 0.22%UgandaUruguayVenezuela 0.03% 0.12% 1ZambiaZimbabwe
Explanation :* Investigations based on WTO database. Frequency ratio relative to total tariff lines** Number of Products, based on TPR’s and WTO notificationsx = 2 tariff linesBlanks means zero
** Source: GATT, TPR ; WTO, TPR ; WTO, Antidumping Measures Database.
most frequent used remedy both by developed and developing countries (Miranda et. al.1998; Finger and
Schuknecht, 1999). The countries in our sample taking such action increased from 11 in the period 1989-
1994 to 18 in 1995-1998. They include most of the developing country members of the WTO which have
taken anti-dumping actions.10 The Table also shows that only four developing countries out of the 42 in
our sample have used safeguard actions and only six countries have taken countervailing actions, mostly
in the period since 1994; and in each instance affecting only a few isolated products.
The average frequency ratio for anti-dumping actions taken by developing countries, which had
taken action in both periods, also increased over the period, from an average of 1.75 per cent of tariff lines
to 3.29 per cent. Despite increases in anti-dumping actions by developing countries, a comparison with
Table 10 and Table A-2 in the Appendix (keeping in mind some of the methodological and data
10Recent notifications for 1998 suggest that the number is increasing. In addition to the countries above, Guatemala, Trinidad and
Tobago, Nicaragua, Equador and Panama have initiated investigations since 1996, the last three for the first time in 1997-1998, (WTO, 1999a).

30
differences) suggests that anti-dumping actions still continue to affect less product categories and tariff
lines than non-tariff measures such as licensing. This conclusion is reinforced if one considers the
number of developing countries and products on which provisional and definite measures are taken –
which is typically significantly smaller than that for investigations.
Among developing countries, anti-dumping is, for the most part, a middle and higher income
developing country practice. With the exception of India, all developing countries taking antidumping
action had per capita income in 1996 of more than US$785. It is interesting to note that these seventeen
countries (with one exception, Pakistan) are the countries which have initiated trade complaints using the
WTO Dispute Settlement Mechanism (DSM) and more broadly can be considered as among the
developing countries most fully integrated in the WTO ( Michalopoulos, 1999).
Mexico is the developing country that has used anti-dumping actions affecting by far the largest
number of product lines (16 per cent of its total tariff lines in the early period and 28 per cent in the later
one). The main reason for this increased frequency was not primarily that Mexico took more AD actions
more frequently in the latter period; but rather that when it did, it applied antidumping measures across
broad categories of products - i.e all the tariff lines in several whole HS2 product groups, such as
textiles.11
B Trade Policies Affecting Exports
There are clear links between country trade policies that affect their exports and those that affect
their imports: For example, measures which control exports of raw materials that are used as inputs into
domestic industries introduce distortions in resource allocation in much the same way as import
protection of that industry. Similarly, the imposition of measures that restrict the quantity and increase

31
the domestic price of imports, may adversely affect the profitability of exports and lead countries to take
offsetting measures in favour of exporters.12 Thus, it is not surprising to find that over the period
reviewed, developing countries liberalized their policies affecting exports in much the same direction as
they liberalized policies affecting imports.
Developing country policies towards their exports are characterised by two broad tendencies:
Countries have tended to impose controls and taxes on their exports of primary products and foodstuffs;
while they have tended to provide incentives and subsidies to their exports of manufactures. The controls
and taxation of exports of primary products has been driven by two sets of considerations: First, to
capture some of the rents from the production and sale of raw materials; second, to provide incentives to
industrialization by taxing the exportation of raw material and other inputs, and thereby make them
available to domestic industries at lower than world prices. For foodstuffs, the main justification is the
promotion of food security. Manufacturing or, more broadly, non-traditional exports (some of which may
involve processed agricultural or related products) are being provided with incentives because they are
believed to contribute to long term growth and development - and because it is felt that, without
government assistance, developing country exporters would face difficulties in breaking into foreign
markets due to externalities of various kinds. Also, some so called "incentives" amount to no more than
government efforts to offset the disincentives to non-traditional exports created by the import regime.
1. Measures Which Tend to Tax or Regulate Exports
Table 12 shows the frequency in developing country use of different kinds of policy measures to
tax or regulate their exports. It is constructed much like the tables on imports and shows the frequency of
use of different measures by various countries in snapshots at two time periods. The frequencies are
11As with all other aspects of this study, no inference should be drawn about the compatibility of the measures taken with GATT
provisions. It should be noted however, that the anti-dumping measures taken by Mexico and several other countries havebeen increasingly directed against imports from non-WTO members.
12The broad theoretical point is covered in the so called Lerner symmetry theorem on the equivalence of import and export taxes(Lerner, 1936).

32
defined in terms of the proportion of total product groups at the HS2 level which may contain products
taxed or regulated by different measures in different countries. The measures include export taxes or
similar levies, minimum export prices, non-automatic export licensing (or approval), export prohibitions
(total or partial) and export quotas.
Just as with respect to imports, non-automatic licensing procedures are the most commonly used
measure, with export levies the next most important. The variation among countries, especially during
the earlier period is rather large, with some countries, such as Brazil, Indonesia, Korea, Mexico and the
Philippines controlling more than 20 per cent of export product groups through licensing or other
approval procedures, while many others limit such licensing only to the implementation of health and
safety standards, environmental obligations etc.13
As with imports though, it appears that the frequency of use of these measures declined over time.
This seems almost certain to be the case with respect to export licensing. On the other hand, it appears
that export taxation increased slightly on average in countries for which information is available in both
periods. With respect to the other measures, the results are ambiguous and are affected by the inclusion
of different countries in the measures during the different periods.
The data also permit a broad analysis of the product groups most likely to be affected by export
regulation or taxation. Table 13 shows the proportion of the total countries in each of the two sub-periods
which applied different types of export measures by product group. The purpose of the table is to show
which are the product groups which developing countries tend to tax or regulate most frequently. Thus,
subjected such products to export licensing in the 1989-1994 sample. Details by the specific number of
13Just like the estimates of non-automatic licensing affecting imports, the analysis has attempted to exclude licensing which the
authorities state they undertake in order to meet health, environmental and safety standards, national security reasons or theimplementation of voluntary export restraints negotiated with developed countries or the implementation of the Agreementon Textiles and Clothing (ATC).

33
Table 12
Developing Countries’ Trade Policies Affecting Exports
Frequencies in % of Total 2-Digit HS Categories Affected by Each Measure
Export Levies Minimum ExportPrices
Export Licensing ExportProhibitions
Export Quotas
Country
1989-94 1995-98 1989-94 1995-98 1989-94 1995-98 1989-94 1995-98 1989-94 1995-98
Argentina 1% 2% 1% 1%
Bangladesh 3% ... 1% ... 20% ... 9% ... 1% ...
Benin ... 3% ... ... 1% ... 2% ...
Bolivia ... ... 1% ... ... ...
Brazil 1% 3% 1% 29% 1% 1% 3% 3%
Cameroon 6% ... ... 3% ... 1% ... 2% ...
Chile
Colombia 1% 3% 2% 3% 2% 1% 1% 1%
Costa Rica ... 4% ... 1% ... ... ... 1%
Côte d'Ivoire ... 5% ... 9% ... 2% ... ... 3%
Cyprus ... ... ... ... ...
Dominican Rep. ... ... ... ... ... 1%
Egypt 1% ... ... 1% ... 4% ... 3% ...
El Salvador ... ... ... ... 1% ... 1%
Fiji ... 2% ... ... 7% ... ...
Ghana 1% ... 24% ... 3% ... 1% ... ...
Honk Kong, China 1%
India 1% 13% 4% 1% 10% 9% 2% 3% 4% 5%
Indonesia 6% 5% 33% 19% 6% 3%
Kenya 10% ... ... 16% ... ... ...
Korea 42% 4%
Malaysia 9% 10% 15% 35%
Mauritius ... 1% ... ... 4% ... 3% ...
Mexico 3% 14% 24% 7% 9%
Morocco 2% 2% 5% 2% 2%
Nigeria 1% 1% 2% 2% 5% 5% 1%
Pakistan 21% ... 3% ... 20% ... 13% ... ...
Paraguay ... ... ... 6% ... 1% ... 1%
Peru ... ... ... 1% ... ...
Philippines ... ... 26% ... ... 15% ...
Senegal 1% ... 3% ... 4% ... ... ...
Singapore 1% 6% 2%
South Africa 1% 1% 9% 8% 2% 1%
Sri Lanka ... 6% ... 1% ... 7% ... 1% ...
Thailand 3% 4% 2% 11% 8% 4% 1%
Tunisia ... 1% ... ... 1% ... 1% ...
Turkey 4% 2% 1% 3% 1% 1%
Uganda ... 1% ... 1% ... 4% ... ...
Uruguay 5% 3%
Venezuela ... 1% ... ... 7% ... ... 1%
Zambia ... ... ... 1% ... ...
Zimbabwe ... ... 9% ... ... ...
Explanation :…: Not availableBlank meansSource: GATT, TPR ; WTO, TPR..
34
countries at the HS-2 level are presented in Appendix Table A-4. The TPRs suggest that usually a
combination of measures - sometimes a quantitative measure, such as a license in combination with a
price linked measure, such as an export levy - would be used. It was not possible, however, to develop
aggregate indicators of export restraint which excluded duplicative measures.
Nevertheless, a rather crude adding up of the number of countries and measures that are imposed
by product group shows that the five most frequently regulated/taxed product groups of exports by
developing countries in 1989 – 1994, at the HS-2 level, were live animals, coffee and tea, fuels, hides and
skins and cotton (See Appendix Table A-4). The list was identical in 1995-1998, except that, at the HS2
level, wood and wood products substituted for cotton. Again, without more detailed analysis, the findings
regarding which exports are being regulated/taxed lends support to the conclusion that there are two main
motivations for export restrictions: (a) to gain revenue from taxation; and (b) to promote the development
of downstream manufacturing activities using domestically produced raw materials as inputs. But these
results should not be used to draw inferences about the restrictiveness of the measures or the impact of the
export regulation or controls on the volume or value of developing country exports.

35
Table 13
Non-Tariff Measure by Product Group
in % of Countries Using Measure, 1989-1998
EXPORT TAXES/LEVIES MINIMUM EXPORTPRICES
EXPORTLICENSING
EXPORT PROHIBITIONS EXPORTQUOTAS
PRODUCT GROUP1989-1994 1995-1998 1989-1994 1995-1998 1989-1994 1995-1998 1989-1994 1995-1998 1989-1994 1995-1998
I ANIMAL PRODUCTS 7% 5% 3% 1% 19% 9% 7% 4% 3% 3%
II VEGETABLES 8% 7% 3% 2% 15% 9% 5% 2% 3% 3%
II FATS AND OILS 0% 10% 3% 3% 10% 10% 3% 7% 7% 0%
IV PREPARED FOODSTUFF 2% 4% 2% 1% 11% 7% 0% 0% 2% 1%
V MINERALS 6% 9% 2% 4% 29% 14% 2% 3% 2% 2%
VI CHEMICALS 1% 1% 0% 0% 4% 3% 0% 1% 1% 0%
VII PLASTICS 3% 2% 2% 0% 7% 2% 2% 0% 0% 0%
VIII LEATHER 8% 10% 2% 1% 10% 7% 6% 3% 2% 0%
IX WOOD 5% 4% 1% 1% 10% 8% 6% 6% 1% 1%
X PULP AND PAPER 1% 0% 0% 0% 9% 1% 5% 0% 0% 0%
XI TEXTILES 2% 3% 4% 0% 14% 3% 0% 0% 4% 0%
XII FOOTWEAR 0% 0% 0% 0% 4% 2% 0% 0% 0% 1%
XIII GLASS 0% 0% 0% 0% 3% 2% 0% 0% 0% 0%
XIX PEARLS 3% 10% 3% 0% 21% 17% 0% 7% 0% 0%
XV BASE METALS 3% 1% 1% 0% 5% 2% 1% 0% 0% 0%
XVI MACHINERY AND ELECTRICAL EQUIPMENT 0% 2% 0% 0% 16% 2% 0% 0% 0% 2%
XVII VEHICLES 0% 0% 0% 0% 10% 3% 0% 0% 0% 0%
XVIII INSTRUMENTS 0% 0% 0% 0% 1% 1% 0% 0% 0% 0%
XIX ARMS 0% 0% 0% 0% 3% 3% 0% 0% 0% 0%
XX OTHER MANUFACTURES 0% 0% 0% 0% 6% 0% 0% 0% 0% 0%
XXI WORKS OF ART, ANTIQUES 0% 3% 0% 0% 7% 0% 7% 3% 0% 0%
Explanation :Total Number of Countries : 1989-1994 = 29 ; 1995-1998 = 30
Source : GATT, TPR ; WTO, TPR.

36
2. Export Incentives and Institutional Support
Practically all developing countries reviewed undertake a variety of policies and institutional
measures of support for non- traditional exports. In some cases explicit export subsidies have been
introduced. But more frequently the measures involve policies aimed at offsetting the impact of import
controls as well as institutional support through the provision of export financing - sometimes on
concessional terms - and insurance, marketing and the establishment of export processing zones (EPZ) or
similar arrangements of temporary admission aimed at export promotion. In most cases the measures are
not product specific. Rather, the incentives are available for broad categories of products - usually
defined as non-traditional or manufacturing exports. Sometimes, the incentives are available only to
certain groups of producing/exporting units, such as small and medium enterprises.
Since the incentives are not product specific, it was not possible to undertake an analysis at the
tariff line or product group level as was undertaken for other policies affecting imports or exports.
Rather, it was only possible to note the presence or absence of a particular kind of program and its main
characteristics. Also, it was not possible to evaluate the effectiveness of any of the programs or
institutions reported. While some TPRs identify problems or constraints affecting the effectiveness of
programs or institutions, this was not the case as a rule.14 Thus, the results reported here should not be
interpreted to imply that the programs mentioned accomplished their intended objectives in support of
exports. Finally, it should be noted that, while in general, the TPRs are a good source of information
about such programs, in some instances their information may not have been complete; and since this
information has not been checked with other sources, the results of the analysis should be considered
indicative only of general tendencies and not of the specifics affecting a particular country or program.
14 It should be noted that assessment of the effectiveness of institutions in support of trade or the needs of
developing countries for technical assistance, goes beyond the current terms for TPRs and in any case could notbe undertaken with the available Secretariat resources.

37
Table 14 shows the main programs and institutional arrangements reported in support of exports.
It shows that 41 per cent of the countries for which TPRs are available in the WTO period reported the
use of export subsidies (Column 3), while several others (India, Korea, Malaysia, Venezuela) are using
more generalized production support which does not differentiate as between support for sales in the
domestic market and exports. In some cases, countries which reported export subsidy programs in place
indicated their intention to terminate them at some specific date in the future (eg. Costa Rica). At the
same time, most of the countries have reported the establishment of incentives regimes aimed to attract
foreign direct investment geared to the production of exportables.
On the other hand practically all countries have introduced some type of duty drawback system
(Column 2).15 In many of the countries the system is intended to cover both duties and other border taxes
as well as domestic taxes such as VAT. In an increasing number of cases it also covers taxes on
domestically produced inputs. Frequently, in order to facilitate administration, the actual tax rebate
mechanism involves the reimbursement or credit for a certain percentage of the firms overall tax liability,
rather than the rebate of specific duties or taxes. As a consequence, some of these programs may contain
an element of implicit export subsidy. On the other hand, this is one area where several TPRs reported
problems and difficulties with delays in payment and rebates which result de facto in penalizing exporters
relative to their overseas competitors. Many countries have also introduced programs or institutions
aimed at ensuring the availability of trade finance (as well as insurance) both for imports and exports.
Roughly half of the countries, on which there are reports of such programs, indicate that they offer
concessional credit terms. In some instances, e.g. Bolivia, concessional terms are reserved for SMEs, in
others, e.g. Fiji, they are not. It is interesting to note that some countries (Bolivia, Fiji) which reported no
explicit export subsidy programs also reported the existence of concessional export finance facilities

38
Table 14
Developing Countries’ Measures to Support or Promote Exports
COUNTRY DutyDrawback
ExportSubsidy
ExportFinance
ExportMarketing
ExportInsurance
ExportProcessing Zones
Argentina (92) 2 1 1 … 1 1Argentina (98) 3 1 1 1 1 1Bangladesh 2 1 2 1 1 2Benin 0 0 0 0 0 0Brazil (92) 3 1 1 1 1 2Brazil (96) 3 1 2 1 0 2Bolivia 2 0 2 1 ... 1Cameroon 0 1 0 0 0 1Chile (91) 3 1 1 1 1 1Chile (97) 3 ... 1 1 1 1Colombia (90) 3 1 1 1 1 2Colombia (96) 2 1 1 1 1 2Costa Rica 3 1 1 1 1 2Côte d'Ivoire 0 0 0 0 0 1Cyprus 1 0 ... 1 1 1Dominican Rep. 0 0 1 1 0 3Egypt 1 1 2 1 0 2El Salvador 1 0 1 1 0 3Fiji 2 0 2 0 0 2Ghana 3 0 1 1 0 0Hong Kong, China (90) 0 0 ... ... 1 0Hong Kong, China (98) 0 0 ... 1 1 0India (93) 2 1 2 ... 1 2India (97) 3 2 2 ... 1 3Indonesia (91) 2 1 2 1 1 1Indonesia (98) 3 1 1 1 1 1Kenya 2 0 1 1 0 1Korea (92) 3 1 2 1 1 2Korea (96) 3 2 1 1 1 0Malaysia (93) 3 2 1 1 1 3Malaysia (97) 3 2 1 1 1 3Mauritius 1 1 1 1 ... 3Mexico (93) 3 1 2 1 1 3Mexico (97) 2 1 ... 1 1 3Morocco (89) 3 1 ... 1 1 ...Morocco (96) 3 1 ... 1 1 ...Nigeria (92) 3 0 1 1 ... 2Nigeria (98) 1 1 1 … 0 1Pakistan 2 1 2 ... 1 0Paraguay 3 0 1 0 ... 0Peru 3 0 1 1 1 2Philippines 2 0 1 ... 1 2Senegal 2 3 2 1 1 2Singapore (92) 3 0 1 1 1 0Singapore (96) 0 0 1 1 1 0S Africa/SACU (93) 3 1 1 1 1 0S Africa/SACU (97) 3 3 2 1 1 0Sri Lanka 2 0 1 1 1 2
15 The only economies in which such a program was not reported to exist were Hong Kong (which has no import duties), three
African countries (Benin, Cameroon, Ivory Coast) and the Dominican Republic, where the export incentives focus on theEPZs .

39
COUNTRY DutyDrawback
ExportSubsidy
ExportFinance
ExportMarketing
ExportInsurance
ExportProcessing Zones
Thailand (91) 3 1 2 1 0 2Thailand (95) 3 0 1 1 0 0Tunisia ... ... ... 1 1 3Turkey (94) 3 1 2 1 1 2Turkey (98) 2 1 1 1 1 2Uganda 2 3 2 1 0 0Uruguay (92) 2 0 1 1 1 2Uruguay (98) 3 0 2 1 1 2Venezuela 3 2 2 1 1 2Zambia 3 3 2 0 ... 2Zimbabwe 2 ... 2 1 1 0
Explanation :For All measures 0 = no program; --- = no information; 1 = program in placeDuty Drawback 1 = duty drawback only; 2 = duties plus domestic taxes; 3 = duties, domestic taxesplus indirectExport Subsidies: 1 = export subsidy 2 = Production subsidies; 3= de minimisExport Finance: 1 = Market terms 2 = Concessionary termsExport Processing Zones: 1 = De minimis 2 = Less than 20% of exports affected 3 = More than 20% of
exports affected
Source: GATT, TPR ; WTO, TPR.
Over three quarters of the countries reported the existence of one or more export processing zones
or temporary admission schemes. While a significant number of countries has reported the establishment
of such schemes, a much smaller number, including Dominican Republic, El Salvador, India, Malaysia,
Mauritius, Mexico and Tunisia derive more than 20 per cent of their exports from such schemes.
Finally, practically all countries have established some kind of an export promotion agency with
responsibilities to help in marketing exports abroad. Unfortunately, there is little information on the
specific aims of these institutions or their effectiveness.
C. Other Institutions and Measures that Affect Trade
Beyond the institutions and policies that directly support exports, there are a number of other,
usually governmental, institutions that affect trade in goods. These include institutions that ensure proper
classification and valuation of products entering trade as well ensuring that such products meet technical
and sanitary and phytosanitary standards. The strength of these institutions in developing countries is

40
important for several reasons: First, proper valuation and classification of products is important in these
countries because they rely to a much greater extent than industrial countries on tariffs as a source of
budgetary revenue16. Second, the existence of regulations that address technical and other standards and
the effectiveness of domestic institutions entrusted with the implementation of these regulations is of
importance not only to the health of the population and the performance of firms but also to their
capacity to export abroad. Weak domestic institutions and non-adherence to international standards can
result in developing country exports being denied access to foreign markets.
The TPRs contain information regarding a number of institutions. But usually the
information is limited to the identification of the existence of a set of rules or regulations and the presence
of an institution. For this reason, TPR discussions of these issues was supplemented with a review of the
needs assessments for trade-related technical assistance prepared for the LDCs following the 1997 HLM.
Even so, the institutional discussion presented below is much less systematic than the policy analyses in
other parts of this study and a great deal more information is needed to make an assessment of the issues
and constraints facing developing countries in this aspect of their integration into the multilateral trading
system.
1. Customs Valuation, Preshipment Inspection
Developing countries are actively engaged in efforts to bring their customs valuation procedures
into conformity with the WTO valuation system by the year 2000, as provided in the WTO Agreement
on Customs Valuation. The TPRs typically reaffirm the commitments of authorities to meet their
obligations under the agreements by the stated timetables. In many countries this would involve
significant changes because valuation of goods for customs purposes is frequently based on the Brussels
definition of value. The issues here involve both the enactment of new legislation, changes in the relevant
16Despite the fact that tariff regimes in developing countries are also more likely to contain exemptions.

41
rules and procedures, the issuance of new documentation, the adoption of new software as well as the
training of officials in the new procedures and documentation requirements. Many least-developed
countries have requested technical assistance for this purpose in the context of the needs assessments they
have prepared. While it is clear that LDCs have significant needs in this area, it is also possible that other
developing countries also have needs which have not been assessed, and would face difficulties in
meeting their commitments without technical assistance.
The TPRs provide substantial information on problems developing countries have faced in
under-valuation of products more broadly which give rise to requirements for preshipment inspection.
According to the most recent information provided by the WTO, sixteen of the countries investigated had
a PSI program (WTO, 1999b; see also Low, 1995). And there were an additional 18, usually small low
income countries or LDCs using such services for which TPRs had not been prepared.
2. Technical Barriers to Trade, Sanitary and Phytosanitary Measures
The reviews show that practically all developing countries had established institutions to maintain
technical standards as well as enforce health, sanitary and phytosanitary regulations. The information
available for most countries however, was not sufficiently detailed to permit judgements about the
capacity of the institutions to implement regulations. In some cases, for example, some of the countries in
Latin America and East Asia, there was little doubt about the adequacy of the institution; In others,
especially in Africa, it was difficult to tell. For example, most developing countries have legislation
defining national standards which are based on those of the International Standards Organization (ISO),
of which many are also members. But in some cases, e.g. Zambia, there appear to be no government
testing facilities. Most countries report that they have concluded many formal bilateral mutual
recognition agreements on technical standards. But it is not clear whether these agreements provide
adequate information to their producers about appropriate standards in countries where they may consider
marketing their products.

42
The situation regarding sanitary and phytosanitary measures appears to be quite similar:
Countries have established regulations requiring sanitary or phytosanitary certificates for imports of food,
drugs and similar agriculture and veterinary products. Again, the standards used are reportedly based on
those of international agreements such as the Codex Alimentarius. But it is difficult to judge the
adequacy of the regulations or the effectiveness of the institutions entrusted with their implementation.
On the other hand the technical assistance needs assessments of the LDCs carried out following
the HLM suggest many weaknesses in these countries’ institutions entrusted with the enforcement of
technical or sanitary and phytosanitary standards. The areas in which assistance was being sought ranged
from the preparation of appropriate TBT and SPS legislation and regulations, to actually setting up of
standards institutions, test laboratories and inspection services, to staff training in all aspects related to
standards monitoring and implementation. Most assessments reported urgent needs in increasing the
general dissemination of information regarding standards which would make them conform to WTO
regulations and the setting up of "enquiry" points regarding standards used by major importers to enhance
access to their markets. There is little in these analyses to suggest that other low income countries may
not suffer from similar institutional weaknesses in these areas, if only to a smaller degree.
In response to these problems, a variety of technical co-operation activities have been established
by the WTO, other international organizations and bilateral donors. Some of these activities focus on the
LDCs and derive from the initiatives undertaken in the aftermath of the HLM in 1997; others are broader
in nature and are designed to address the needs of all developing countries members of the WTO.17
3. Adjustment Assistance
The trade liberalizing policies pursued by developing countries in the last decade undoubtedly
generated significant benefits; but also gave rise to costs to firms and individuals adversely affected by

43
import competition. The private costs of trade liberalization take the form of reduced employment and
incomes in industries affected by increased competition from imports. They are not the same as the social
costs: the latter are likely to be lower than private costs because of the benefits, in the form of
employment and income, that accrue to workers in export industries, whose output is likely to increase
following import liberalization (Matusz and Tarr, 1998). But, whatever their size, private costs are likely
to exist and influence the political economy of trade reform. It could be argued that prospects for further
liberalization could be affected by whether or not developing countries have institutions which can
effectively mitigate the costs to firms or to individuals of increased competition resulting from trade
liberalization.
The TPRs revealed that only seven of the forty two developing countries had trade-related
adjustment assistance programs. In some cases, e.g. Mexico, the programs focused on providing
assistance to firms facing increased competition from imports. In others, e.g. Egypt, the focus was on
providing a safety net for affected workers. In still others, trade-related adjustment assistance was offered
in the context of programs with wider objectives of raising productivity or strengthening the profitability
of SMEs. In none of the cases was it possible to form a judgement as to how significant were the private
costs associated with trade reform or on the role adjustment assistance programs played in addressing
them. In a few cases, e.g. India, it appeared that the program of assistance had little impact on firms
affected by import competition. But there was very little information to suggest that developing countries
more broadly have the institutional capacity to cope with the adjustment costs associated with trade
reform, especially the private costs incurred by displaced workers
It may not be necessary or even optimal to design adjustment assistance programs focusing
narrowly on adjustment linked to increase competition from imports. More broadly based programs
17 For a more detailed discussion of these issues see Michalopoulos, 1999.

44
and/or a broad and effective social safety net may be a better way of dealing with adjustment costs. The
point is that whatever the optimal instrument may be, few countries appear to have the institutional
capacity to deal with the problem of adjustment to increased competition.
IV. The External Environment
The period under review witnessed mixed developments in the external environment affecting
developing countries’ trade. On the one hand, GDP in developed countries, an important determinant of
overall demand for developing country exports, increased at a rate slightly lower than longer term growth
trends in these countries - at about 2.0 per cent for the period 1989-1997 compared to 2.2 per cent in the
1980’s and 3.0 per cent in the 1970’s (OECD, 1998). On the other hand, market access conditions for
developing countries improved, in part as a result of standstills and subsequent liberalization linked to the
URA as well as through subsequent reductions in tariffs following the Information Technology
Agreement. The actual implementation of the URA had not been completed by the end of the period
examined, nor the ITA. But there is evidence that access conditions improved in many respects in the
markets of developed countries through most of the period under review. Nevertheless, access continued
to be impeded by high trade barriers in certain sectors, such as agriculture and textiles; and, while
progress was made on issues such as escalation, the problem persisted in certain sectors, for example
textiles and leather products. Moreover, towards the end of 1998, evidence mounted on the resurgence of
protectionism in certain sectors e.g. steel, in both the US and the EU markets. Finally, as part of the
URA, WTO members committed themselves to take several explicit additional steps in favor of
developing countries in areas such as anti-dumping, whose implementation it would be interesting to
review.18
The market access analysis for this study relied to a large extent on analyses of indicators of
tariff and non-tariff barriers prepared by the OECD. The focus is on market access conditions in the

45
Quad (Canada, EU, Japan and US) countries which account for the bulk of developing country exports to
developed country markets. These analyses were supplemented by information gathered from TPRs of
major developed countries as they relate to market access conditions for developing countries.
A. Tariffs
1. Overall Averages
The results of the URA on the MFN tariffs of the developed countries have been studied
extensively in previous studies whose main findings will be summarized here (Martin &Winters, 1996;
UNCTAD/WTO, 1997;OECD, 1997). Broadly speaking, tariffs on imports of manufactures into the
major industrial countries markets were reduced by an average of 40 per cent from a trade weighed
average of 6.3 per cent to 3.8 per cent with the reductions to be phased in over five years and the first
instalment to be put in place on January 1, 1995.19 Countries have reduced their tariff rates accordingly
since then. Moreover, in 1997, following the Information Technology agreement, duties on a number of
products in this sector were reduced to zero on an MFN basis (See Finger and Schuknecht, 1999) .
The tariffication of various measures of support and protection in the agricultural sector has
resulted in substantial increases in the initial tariff levels applicable to a wide range of agricultural
products in some major markets. Thus, the average applied MFN rate for agricultural commodities
(production weighted) in 1996 ranged from 7.9 per cent in the U.S, and 10.7 per cent in the EU, to 0.5 per
cent in Australia (OECD, 1997, Table 3.1). Subsequently, developed countries are to reduce agricultural
tariffs by 36 per cent across the board, at the same time as access for agricultural products is being
enhanced through reductions in domestic support measures.
18See Article 15 of the UR Agreement on the Procedures for Implementation of GATT Article VI.19The EU advanced from January 1, 1997 to January 1, 1996 its schedule of implementation of the third stage of
tariff reductions for most non-agricultural products as part of its compensation for the EU enlargement throughthe accession of Austria, Finland and Sweden (WTO,TPR, European Union, 1997, p.15).

46
In most developed country markets, applied MFN tariffs for other products, are on average lower
than in agriculture. Upon conclusion of the liberalization committed under the URA, applied MFN tariffs
on products other than agriculture will range, for example, from an average of 0.8 per cent in Japan to 3.7
per cent in the US and 4.0 per cent in the EU (UNCTAD/WTO, 1997, Annex Table 3.1). But the rates on
products of interest to developing countries are higher (Martin,1999). At the same time, for the Quad
countries (Canada, EU, Japan, US), one third of all MFN tariff lines will be duty free, involving a large
range of products of export interest to the developing countries.
2. Preferences
The actual tariff rates applied to imports from individual developing countries tend to be even
lower than the above MFN rates suggest, however. This is for two main reasons: First, the existence of
the Generalized System of Preferences (GSP) which reduce tariffs further for selected commodities and
countries. Second, the existence of preferential arrangements in favor of particular countries in specific
developed country markets, such, as for example, the preferences afforded to the ACP countries in the EU
market, and the ones enjoyed by Mexico as part of NAFTA or the Caribbean and Central American
countries preferences in the US market as a consequence of the Caribbean Basin Initiative. Also,
individual developed countries have introduced even further preferential treatment for imports from the
Least Developed Countries following the High Level Meeting on Trade-related Measures for LDCs in
1997. For example, in this connection, the EU announced that it would extend to the least developed
countries the same duty free treatment it extends to all ACP members - which tends to provide greater
preferences than the GSP.
Given the complexity of the various preferential systems in place, it is very difficult to assess
their overall effect on the average tariff level applied to developing countries that are eligible
beneficiaries. One study suggested that the GSP, "remains a valuable tool for promoting developing
country exports"(UNCTAD/WTO, 1997, p.9) despite the erosion of preferences associated with the MFN

47
reduction of tariffs and the increasing limitations on product and country eligibility imposed by the
"graduation" features of various programs. This is because when GSP is taken into account, average
applied tariff rates would decline further in major markets as the frequency of items on which duties are
set at zero increases substantially - doubling, for example, in the US. Notwithstanding such benefits, the
GSP as well as other unilateral preferential schemes may create the wrong types of "dependency"
incentives in developing countries and retard rather than promote the fuller integration of developing
countries into the international trading system (Finger and Winters, 1998; Srinivasan, 1998).
3. Peaks
Despite the overall declines in the average applied MFN tariff levels following the URA, there is
a number of sectors and product groups in various developed countries where tariffs are at substantially
higher levels which would limit market access. The URA tended to increase the tariff dispersion in some
developed country markets and decrease it in others (OECD p.18, 1997; Daly and Kuwahara p.223,
1998). But in all countries there are many products and product groups in which the average MFN
applied tariff level following the URA agreements exceeds 12 per cent, or roughly three times the overall
average MFN applied tariff level of developed countries. These products and groups can be defined as
having tariff "peaks". They exist in both agriculture and manufactures in different developed country
markets. But the very high rates typically have been the consequence of tariffication in agriculture. The
main products in which such tariff peaks can be observed in various markets are the following:
-- Major agricultural staple food products, such as meat , sugar, milk and dairy products, cereals,
where the tariffication of quantitative restrictions has resulted in tariff rates frequently exceeding 100 per
cent and ranging, for example up to 550 per cent for rice in Japan.20
20These are estimates reported in UNCTAD/WTO, 1997. It is difficult to estimate accurately the ad-valorem tariff equivalents
for many agricultural commodities where tariffication involves the adoption of specific duties often combined with quotas.

48
-- Similarly high rates for similar reasons occur in products such as cotton and tobacco, with rates
on the latter reaching 350 per cent in the US.
-- Fruits and Vegetables - including 180 per cent for above quota bananas in the EU, and 550 per
cent and 132 per cent for shelled groundnuts in Japan and the US respectively.
-- Food industry products, including fruit juices, canned meat, peanut butter, sugar confectionery
with many rates exceeding 30 per cent in several markets and ranging up to 230 per cent for grape juice in
the EU.
-- Textiles and Clothing, where tariff rates are in the 12-30 per cent range for a large number of
products in Canada, the EU and the US - although developing country exports of these products are at
present being simultaneously restrained (but on a declining basis) through the ATC.
-- Footwear and leather products, with tariff peaks in excess of 35 per cent in 10 per cent of the
products in Japan (ranging up to 160 per cent for shoes) and 17 per cent of the products of Australia
(Smeets and Fournier, 1998).
-- Some selected automotive and transport sector products (trucks in the US and the EU, ships
and boats in Canada) with rates exceeding 20 per cent.
The GSP and other preferential schemes operated by the various developed countries would tend
to reduce - in some cases significantly, the tariff rates applicable to imports of these products from
developing countries. However, in almost all cases where tariff peaks are present, the sensitivity of the
domestic industry to imports results in exclusions of various products from the schemes or some type of
limitations either in the amounts that can be imported under the preferential rates or the countries that are
eligible. For example, the US completely excludes most textile products from its GSP scheme, the EU
limits preferential margins and imposes country/sector quotas; quota limitations also exist for non-
traditional suppliers of various fruits and vegetables in the EU market and in Japan’s market for leather
goods and footwear.

49
Given the attention that the international community has been devoting to the issue of the
integration of the LDCs into the international trading system, it is worth noting, that partly as a result of
the composition of their exports and partly as a consequence of the special preferences these countries
typically enjoy in developed countries, that the average tariff rates they face in developed country markets
are generally much lower than those facing other countries. It has been estimated that in 1995 the overall
unweighted average applied tariff facing LDCs main exports to seven main developed country markets
(the Quad plus Australia, Norway and Switzerland), taking account of all the preferences they enjoy, was
1.8 per cent, and was going to decline further as a consequence of the implementation of the URA. But
for a number of products (beef, asparagus, cigarettes, processed wood, clothing and footwear) amounting
to about 10 per cent of their total exports, tariffs in these seven developed country markets ranged
between 5 and 15 per cent (UNCTAD/WTO, 1997).
4. Escalation
Tariff escalation has been a matter of concern for developing countries in the context of market
access because it tends to increase the rate of effective protection at higher stages of processing - thereby
making market access more difficult for finished manufactured products - which in turn could have
adverse consequences on developing countries’ industrialization efforts. There is little disagreement that
as a consequence of the URA, the degree of overall escalation has decreased. But evidence from a
number of sectors suggests that it is still a matter of concern.
The URA has tended to increase the tariffs for agricultural products. As a consequence, if one
combines tariffs for raw materials and unprocessed agriculture products in the calculation of primary
products, they were no longer (in 1996) higher than those for semi-manufactures in a number of
developed country markets (the US, EU, Canada and Norway). But this simply means that the pre-URA
calculations of tariff escalation - which did not include the non-tariff barriers present in agriculture were
biased upwards and the apparent improvement less significant. At the same time, whereas the overall

50
degree of escalation declined in all countries studied, tariffs for finished manufactured products continued
to be higher than those for semi-manufactures in developed countries except for the US, Japan and
Australia (OECD, 1997). Furthermore, various studies of specific product chains in various developed
countries show continued tariff escalation in such products as processed foods (wheat flour, orange juice,
vegetable oils, dairy products), clothing, leather and wood products (Lindbland, 1997; WTO, 1998,
UNCTAD/WTO,1997). These results should be interpreted with caution because of data limitations as
well as the continued existence of non-tariff measures in some of these product chains which make
calculation of the effective rates of protection difficult. But they all point to the conclusion that tariff
escalation - much as tariff peaks - in certain products, though reduced by the URA, continues to be an
area of concern related to market access for developing country exports.
B. Non-Tariff Measures
In the aftermath of the URA, it is probably fair to say that the pervasiveness of core non-tariff
measures in developed country trade regimes is at its lowest point in more than 50 years. By core non-
tariff measures, we mean, as in the case of developing countries, the use of non-automatic licensing,
quotas and tariff quotas and voluntary export restraints as well as price control measures such as variable
charges, minimum prices or voluntary export price restraints.
Following the URA, non-tariff measures have been drastically reduced in agriculture, where only
tariff quotas exist in a number of products in some of the major developed markets. At the same time, as
a result of the URA, non-automatic licensing has been reduced in all major developed country markets,
and is now focusing primarily on restraints linked to the maintenance of sanitary and phytosanitary
standards, technical standards or protection for the environment.21 Finally, as part of the URA, voluntary
21Some concerns however, have been raised as to whether the implementation of WTO agreements in these areas has been
motivated by protection of domestic industries and a number of disputes have arisen regarding the compatibility of certainmeasures implemented by some countries with these agreements.

51
export restraints were supposed to be phased out by the end of 1998; and the remaining restraints in
developed countries appear to be directed in significant measure against non-WTO Members.
The total frequency ratios for core non-tariff measures in developed country markets are
presented in Table 15. This ratio, is the same frequency measure used in the context of developing
countries in the previous section but relates to the ratio of tariff lines affected by a core non-tariff and the
measure relative to the total tariff lines.22 As can be seen from the table there has been a decline in the
frequency of imposition of non-tariffs in all developed countries and for all measures between 1993-1996.
In two countries, Australia and Switzerland, the markets are virtually free of any non-tariff barriers. In
the Quad countries the total frequency ratio of border non-tariff measures ranges from a low of 1.2 per
cent in Canada to a 3.8 per cent in the European Union. Comparison with Table 8 as well as Appendix
Table 2, and keeping in mind the methodological limitations in some of these measures, strongly suggests
that non-tariff measures are much more pervasive in developing than in developed country markets.
The decline in the pervasiveness of NTMs reflects several factors: (a) the tariffication process in
agriculture which reduced quantitative controls as well as price related measures such as variable charges
(though, of course, it also increased tariffs); (b) the termination of VERs - some, e.g. the VER on sardines
by the EU has already been terminated; others were supposed to expire at the end of 1998 - and
presumably will lead to further declines in the frequency ratios reported in Table 14; (c) other ad hoc
reductions of NTMs.
While the vast majority of products enter developed countries free of non-tariff controls, such
controls are pervasive in a few sectors. These sectors include apparel and clothing in the US, EU and
Canada, and silk and man made staple fibers in Japan (OECD, 1997, p.61). This reflects to a large extent
22 As with the developing country data, the information assumes that measures apply across the board to imports from all
countries, and is not based on transaction by transaction information.

52
the continued influence of the ATC, which at present constitutes the main remaining NTM restricting
access to developed country markets
Under the terms of the URA, the integration of the textile and clothing sector into GATT (i.e. the
elimination of quantitative restrictions which would otherwise not be permitted by the GATT) is taking
place in stages: Stage 1, involved the integration into GATT of 16 per cent of the products (in volume of
1990 imports, in four specific categories) on the date of entry of the WTO Agreement. Stage 2, involving
the integration of another 17 per cent by volume occurred on January 1, 1998. Stage three involving 18
per cent will occur on January 1, 2002, and the balance will be integrated on January 1, 2005. In parallel,
specific quotas were to be eliminated as a consequence of the integration process and the remaining ones
enlarged at specified rates.
In 1997, the Textile Monitoring Body (TMB) set up to monitor the implementation of the ATC
conducted a review of: (a) the liberalization steps members had taken during the first stage of the
implementation of the agreement; (b) the plans for further liberalization of textiles and clothing 23during
the second stage of implementation of the ATC; and (c) other aspects of the implementation of the ATC,
including the use of a transitional safeguard mechanism, and special provisions regarding least developed
countries and cotton producing exporters (WTO, 1997b).
The review revealed that the four major developed country members which maintained restraints
(US, EU, Canada and Norway) met their ATC commitments in terms of the liberalization of 16 per cent
of their 1990 imports by volume (of the appropriate textile and clothing categories) during the first stage
and their planned integration of another 17 per cent of 1990 imports by volume during the second stage.
However, they chose to do so - which they had the right to under the ATC - by including low value
23The precise term used is the "integration of a volume of textile and clothing products in GATT1994" which implies the
elimination of quantitative restraints permitted under the ATC.
53
products. As a consequence, the liberalization of textiles through the second stage (i.e. through 2001) will
only amount to between 18 per cent-29 per cent in value terms of 1990
imports - leaving the bulk of the liberalization to take place at the end of the period. In addition, the
review suggested that quotas would be actually eliminated only on a few products in stages 1&2 and the
annual growth rates in remaining quotas would be small.
Thus, while implementation of the ATC can be considered to have been consistent with its legal
provisions, the manner in which it has been implemented has raised concerns about whether developed
countries would find it possible to live up to their commitment to integrate all of the textile and clothing
sector into mainstream GATT rules by 2005.24
As the value of textile and clothing imports liberalized in countries that have quotas under the
ATC has been small, the Review raised concerns about the likelihood of future elimination of trade
barriers in the developed countries, rather than about an increase in trade barriers in the sector up to now.
But as the full implementation of liberalization in the context of ATC was an important aspect of the
overall balance of commitments and concessions made by developing countries in the course of the URA,
doubts as to the capacity of the developed countries to undertake the necessary adjustment steps needed
for further integration of the textile and clothing sector in the GATT, tend to cloud the atmosphere for
negotiations in other areas.
24Some developing countries also feel that neither the commitment regarding the consultations with cotton exporters, nor the
special consideration to the interests of least developed countries in implementing the transitional safeguards were fullyimplemented.


54
Table 15
Non Tariff Mesures and Trade Remedies in Selected Major Developed Country Markets, 1993-1996
(Tariff Line Frequencies in %)
Australia Canada EU Japan Norway Switzerland U.S.
1993 1996 1993 1996 1993 1996 1993 1996 1993 1996 1993 1996 1993 1996NTMS-TOTAL 0.3 0.3 1.4 1.2 9.4 4.2 3.8 2.6 24.0 3.8 3.5 0.2 10.3 2.9 Licencing Non-Automatic
0.0 0.0 0.0 0.0 1.7 0.8 1.3 1.3 3.5 2.6 0.4 0.0 0.0 0.0
Export Restrictions
0.0 0.0 1.4 1.2 5.6 3.0 0.0 0.0 13.8 1.2 0.0 0.0 10.1 2.7
Other QRs 0.0 0.0 0.3 0.0 0.0 0.0 1.7 0.6 0.2 0.0 1.4 0.2 0.2 0.0 Variable Charges
0.0 0.0 0.0 0.0 1.5 0.1 0.8 0.7 5.4 0.0 1.6 0.0 0.0 0.1
Other PCMs 0.3 0.3 0.0 0.0 0.6 0.3 0.0 0.0 1.1 0.0 0.1 0.0 0.0 0.1 TRADEREMEDIES AD/CV and VEPRs
0.4 0.4 0.8 0.7 1.3 0.2 0.0 0.0 1.9 0.0 0.0 0.0 7.3 5.0
Source: OECD, 1997, Table 5.1.

55
C. Trade Remedies
As noted earlier (in Section III), anti-dumping and countervailing actions, in particular
investigations, are being reviewed in this study as potential indicators of market access restrictions,
irrespective of their consistency with WTO provisions. The evidence shows that the frequency of
antidumping and countervailing actions (as well as other price related controls) in developed countries
declined significantly over the period 1994-1997. Several developed countries (Japan , Switzerland,
Norway) did not use such measures at all; while in others (EU, Canada) the frequency of their use fell to
less than 1 per cent of the total tariff lines.
This evidence is corroborated by detailed analysis of antidumping actions initiated by developed
countries based on the WTO antidumping data base. Table 16 shows that the annual average number of
anti-dumping investigations initiated by developed countries fell from 160 cases in the period 1989-1993
to 95 in the period 1994-1997; although they increased in 1997, after declining for four straight years.
Also, in recent months there has been a significant increase of announced anti-dumping actions by the US
involving steel products. And there have been press reports that the EU will take similar actions. It is too
early to say whether this is the beginning of a series of actions
It is worth noting also that the share of developed countries in anti-dumping investigations fell to
less than 50 per cent of the total antidumping investigations in the latter period - i.e. in the latter period,
developing rather than developed countries initiated the majority of anti-dumping investigations. The
use of antidumping as a trade remedy in a number of developing countries has given rise to requests from
many others for technical assistance from international organizations to help establish similar capacity to
bring antidumping actions.
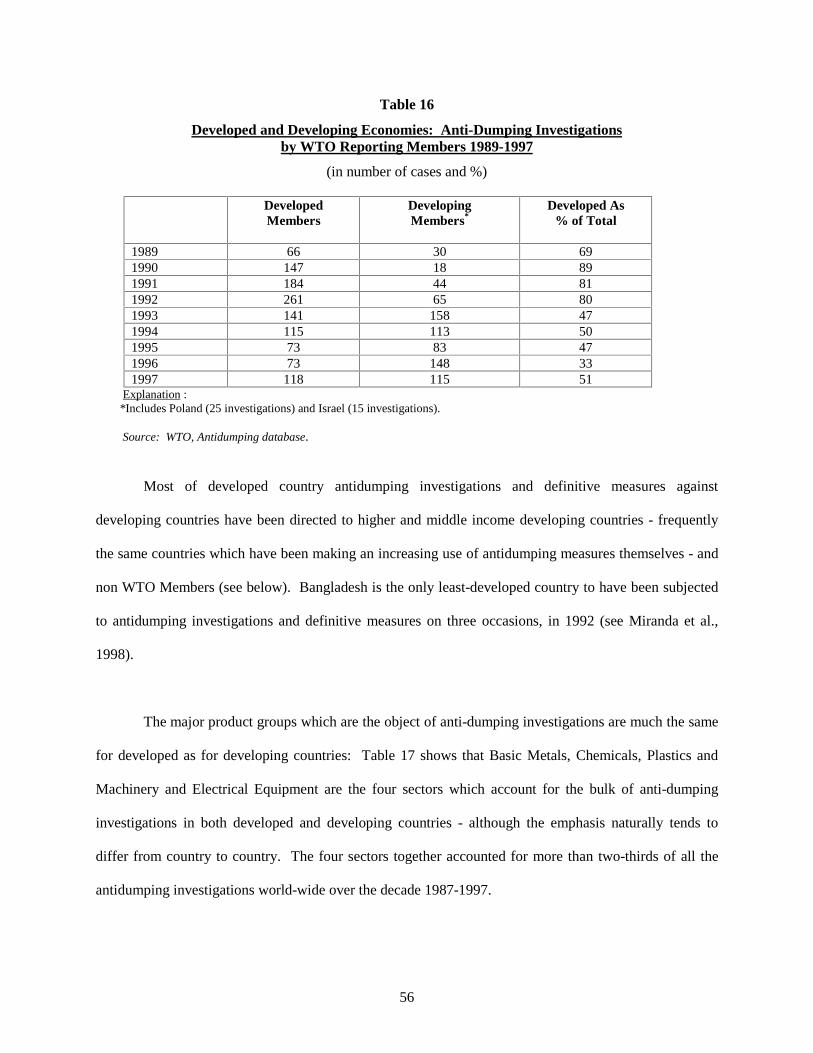
56
Table 16
Developed and Developing Economies: Anti-Dumping Investigationsby WTO Reporting Members 1989-1997
(in number of cases and %)
DevelopedMembers
DevelopingMembers*
Developed As% of Total
1989 66 30 691990 147 18 891991 184 44 811992 261 65 801993 141 158 471994 115 113 501995 73 83 471996 73 148 331997 118 115 51
Explanation : *Includes Poland (25 investigations) and Israel (15 investigations).
Source: WTO, Antidumping database.
Most of developed country antidumping investigations and definitive measures against
developing countries have been directed to higher and middle income developing countries - frequently
the same countries which have been making an increasing use of antidumping measures themselves - and
non WTO Members (see below). Bangladesh is the only least-developed country to have been subjected
to antidumping investigations and definitive measures on three occasions, in 1992 (see Miranda et al.,
1998).
The major product groups which are the object of anti-dumping investigations are much the same
for developed as for developing countries: Table 17 shows that Basic Metals, Chemicals, Plastics and
Machinery and Electrical Equipment are the four sectors which account for the bulk of anti-dumping
investigations in both developed and developing countries - although the emphasis naturally tends to
differ from country to country. The four sectors together accounted for more than two-thirds of all the
antidumping investigations world-wide over the decade 1987-1997.

57
Finally, it is important to recall that during the URA, and in the context of the Agreement on the
Implementation of GATT Article VI on antidumping, the developed countries committed themselves in
Article 15 of the Agreement, to give special regard to the "special situation of developing county
Members when considering anti-dumping measures under the this Agreement. Possibilities of
constructive remedies provided for by this Agreement shall be explored before applying anti-dumping
duties where they would affect the essential interests of developing country Members."
There is little guidance regarding how this article is to be implemented. In particular, it is not
clear how "the special situation of developing country members is to be taken into account."
Table 17
Sectoral Distribution of Anti-Dumping Investigations by Developedand Developing Countries 1987-1997
(in number of cases and in %)
Developed % Developing* %I Animal products 8 0.6 17 2.2II. Vegetables 11 0.8 18 2.3III. Fats and oils 4 0.3 13 1.7IV. Prepared foodstuff 52 3.7 9 1.2V. Minerals 41 2.9 11 1.4VI. Chemicals 210 15.0 157 20.2VII. Plastics 147 10.5 102 13.1VIII. Leather. 8 0.6 1 0.1IX. Wood 16 1.2 8 1.0X. Pulp and paper 65 4.6 47 6.0XI. Textiles 95 6.8 55 7.1XII. Footwear 24 1.7 9 1.2XIII. Glass 59 4.2 15 1.9XV. Base metals 374 26.7 178 22.9XVI. Machinery and electrical equipment 212 15.1 83 10.7XVII. Vehicles 27 1.9 7 0.9XVIII. Instruments 19 1.4 21 2.7XIX. Arms 3 0.2 0 0.0XX. Other Manufactures 27 1.9 27 3.5
1402 100 778 100Explanation :
*Includes Poland (25 investigations) and Israel (15 investigations).
Source: WTO, Antidumping database.

58
The article does not appear to commit developed countries to do anything more than to use the
"constructive remedies" provided by the Agreement before applying anti-dumping duties - but
presumably, they would have to do this in all cases - not only for developing countries.
The actual experience regarding the initiation of anti-dumping investigations and the imposition
of definitive measures against developing countries following the URA is mixed: on the one hand, the
overall use of anti-dumping by developed countries including the total number of cases brought against
developing countries declined following the URA. On the other hand, the proportion of overall
investigations in which a developing country is affected is much higher than the share of developing
countries in world exports (See Table 18). While this ratio of the two shares, Rad, should be interpreted
with care because the proportion of investigations may not accurately reflect the actual amounts of
exports affected, it would be difficult to conclude from the data anything other than that the developing
countries have sustained a disproportionate amount of anti-dumping investigations over the last ten years.
Rad investigations for developing countries had a value of 1.6 compared to an Rad of O.6 for the
developed countries for the period 1987-1997. This means that developing countries, over the last
decade, were more than twice as likely to have their imports affected by an antidumping investigation
(relative to their share in international trade) than developed countries.
The situation has not changed in the last three years, (1995-1997) i.e. after the WTO came into
being. Table 18 shows that the Rad values have basically remained the same, both for developing
countries and developed, but the latter continued to be much lower than the former.
The Table also shows the very large incidence of anti-dumping actions taken against non-WTO
members, especially so called "non-market economies" which have seen their exports being targeted for
anti-dumping investigations at a far greater rate than their share in world trade. Indeed, controlling for the

59
Table 18
Antidumping: Share of Affected Economies in Total CasesRelative to Share in World Exports
(in % and ratios)
Affected EconomiesShare in
World Exports %Share in Total Anti-Dumping
Investigations %Share in
Total Definitive Measures %Rad
InvestigationsRad
Definitive Measures
1989-1997 1995-1997 1987-1997 1995-1997 1987-1997 1995-1997 1987-1997 1995-1997 1987-1997 1995-1997WTO Members 88.2 87.7 77.8 73.4 73.9 63.9 0.9 0.8 0.8 0.7
Developed 63.5 62.5 38.1 34.1 34.9 21.7 0.6 0.5 0.5 0.3
Developing 21.6 22.0 34.5 34.4 32.9 36.1 1.6 1.6 1.5 1.6
Transition and Other 3.0 3.2 5.0 4.8 6.2 6.1 1.7 1.5 2.1 1.9
Non WTO Members 11.8 12.3 22.2 26.6 26.1 36.1 1.9 2.2 2.2 2.9
"Non Market" 6.3 6.9 16.4 20.8 21.4 32.1 2.6 3.0 3.4 4.7
Other 5.5 5.4 5.8 5.8 4.7 4.0 1.0 1.1 0.8 0.7Explanation :Rad : Share in Investigations (Measures)/Share in World Exports
Source: WTO, IDB and Antidumping Data Base , J. Miranda et. al., 1998.
60
value of total exports, an antidumping investigation over the last decade was at least 4 times more likely
to be directed against a product from a non- market economy which is not a WTO Member than a product
from a developed market economy. In this regard, the situation of "non- market" economies which are not
WTO members ( essentially China and the countries of the former Soviet Union) has deteriorated further
since the establishment of the WTO In the period 1995-1997, their exports were being targeted for
antidumping investigations six times more frequently than exports from developed countries.
The differences between country groups become even more pronounced when Rad values are
calculated for antidumping definitive measures (shown in last two columns of Table 18). In the 1995-
1997 period definitive measures were five times more likely to be taken against developing country
compared to developed country exports; and they were even more likely to be taken against WTO non-
members, especially countries classified as non-market economies. These countries, which account for
less than 7% of world exports have been affected by about a third of all the definitive anti-dumping
measures taken during the 1995-1997 period.
In discussing these trends in anti-dumping investigations, a recent paper suggested that the reason
for the disproportionate share of investigations against "transition" economies and developing countries is
that "the latest arrivals in the world markets tend to price their exports competitively,
because otherwise they cannot capture market share from incumbents." (Jorge Miranda et.al. 1998, p.67).
Table 18 suggests that some other factors may also be at play: The very high incidence of antidumping
actions against non- WTO Members, classified as "non-market" transition economies by the EU and the
US, as compared to the incidence of investigations and definitive actions against transition economies
which are already WTO Members, suggests that countries taking anti-dumping action may feel less
constrained when taking action against non-WTO Member countries. And with respect to so called non-
market economies, there is evidence suggesting that the procedures used tend to be more opaque and may

61
well lead to a greater incidence of definitive findings than those against other economies (Michalopoulos
and Winters 1997).
What can be concluded from this analysis of the prevalence of anti-dumping actions against
developing countries as an indicator of market access to developed country markets? There appears to be
an improvement in recent periods, because fewer overall anti-dumping actions have been taken by
developed countries; but the share of antidumping actions against developing countries, taking account of
the value of their exports, has not changed and tends to be disproportionately high for investigations and
even more so for definitive actions. This is a somewhat mixed experience in the implementation by the
developed countries of their commitment "to give special regard to the special situation of developing
countries."
V. Conclusions and Policy Implications
The integration of the developing countries into the multilateral trading system was substantially
advanced by the Uruguay Round , which contributed to the liberalization of developing countries’ own
trade regimes and improvements in the conditions affecting access to the major markets for their export
products. The integration process has been especially impressive for a group of perhaps 15-20 middle
and higher income countries in Latin America and Asia. For many others, progress has been slower.
One of the interesting findings of the study is that following the URA, protection both through
tariff and non-tariff measures appears to be greater in low- income than in middle- and higher- income
developing countries. While this conclusion is subject to a number of methodological caveats discussed in
the paper and needs to be subjected to further testing, it is suggestive of the many challenges and
opportunities low income developing countries face in their efforts to achieve fuller integration into the
multilateral trading system. Some of these could be addressed in the context of future WTO
negotiations. Other issues may require special action by the international community and the developing

62
countries. This section presents a summary of the issues as they arise form the analysis and their
implications for action by different groups of developing countries and the international community.
1. Agriculture
The main finding of the analysis is that while the URA resulted in a major step forward by
bringing the agriculture sector under the disciplines of the GATT, very substantial protection continues to
be present through a variety of controls and interventions that encumber international trade. The analysis
above suggests that various developing countries face different situations and challenges in their
agricultural sector, which may well result in different groups of developing countries emphasizing
different issues in the up-coming WTO negotiations scheduled to begin by the year 2000. First, there is a
number of developing countries, members of the Cairns group, with relatively low protection of
agriculture who are major exporters of agricultural commodities. These countries face two major
challenges in expanding their agricultural exports: (a) the continued presence of high tariffs and
substantial Aggregate Measures of Support (AMS) by developed countries which restricts market access,
(b) developed country export subsidies which make it difficult for them to compete in third country
markets.
Second, there is another group of countries which includes the traditional net food importing
developing countries (NFIDCs) and others with substantial protection of agriculture which, are concerned
that export subsidy reduction by the developed countries will increase their import bills. These countries
have been seeking to obtain an increased amount of food aid through the recently renegotiated Food Aid
Convention (International Grains Council, 1999) to compensate for whatever increased costs export
subsidy reduction may entail. The Convention provides for greater commitments in food aid volumes,
increased flexibility - including the provision of commodities under food aid programs and full coverage
of all NFIDCs identified by the WTO - as well as LDCs and low income countries.

63
While the revised Convention should prove of greater assistance to developing countries as a
whole, and could help in a small way in dealing with some of the food security problems many face, it is
not a substitute for further liberalization of agricultural trade - indeed it should be viewed as a supporting
element for such liberalization. Reduced protection in developed country markets will improve market
access prospects both for existing and potential exporters; while reduced export subsidies by developed
countries will reduce international market distortions that impede the expansion of developing country
agricultural production; and reduction in their own protection of agriculture (as part of a broader
reduction in protection) will stimulate efficiency through improved allocation of their own resources.
2. Manufactures
The policy issues surrounding protection in trade of manufactures can be divided into three
distinct topics: tariffs, non-tariff measures and trade remedies.
(a) Tariffs: There is no agreement yet that tariff reduction (outside agriculture) be part of a
future WTO negotiation. There is however, mounting support by several countries --both developed and
developing--for this topic to be included. In such negotiations,. developing countries have been
concerned about tariff peaks and escalation in developed country markets for some categories of
manufacturing products. The analysis above shows that there are peaks in agricultural commodities and
processed foodstuffs ( which should be the subject of the negotiations in agriculture), textiles and clothing
and a few other sectors including leather products and automobiles. The analysis also shows that applied
tariffs for manufactures are on average higher in developing countries than in developed countries; that
this even more the case, when bound rates are compared; and that many developing countries have not
bound a significant proportion of their tariffs on manufactures.
Clearly, further tariff reduction in manufactures would benefit all countries, because of the
efficiency losses caused by the protection to the country imposing it. If tariffs are included in a future

64
WTO negotiation however, this is likely to involve a negotiation process similar to that in the UR in
which developing countries would be expected to make a contribution - whether fully reciprocal or not
may be depend on the countries involved. In such a scenario, the following considerations drawn from
the analysis above should be taken into account. First, there would be pressure for the developing
countries to take considerable action in this area because their tariff levels are much higher than those in
developed countries. They will also be under pressure to reduce ceiling bindings as well as to bind a
significant portion of the tariffs remaining unbound in many countries. Second, as the developed countries
have already reduced tariffs in most manufactures, the remaining ones are concentrated in a few
"sensitive sectors". There will be opposition from some major developed countries to include reductions
in tariffs in these areas, especially for textiles and clothing, since following the implementation of ATC,
tariffs will be the sole means of protection available to this sector.
The implications of this situation are that first, developing countries should take advantage of any
opportunities offered by the inclusion of tariffs on manufactures in a new WTO negotiation to reduce
their own ceiling bindings and applied rates on manufactures as well as to increase the number of
products in which tariffs are bound. This would be helpful to their economies as well as provide
negotiating leverage which could be used to obtain, through negotiations, developed country
commitments for reductions in tariffs in sectors where there are tariff peaks. Recognizing that there are
few such sectors outside agriculture, developing countries need to seek a formula for reducing tariffs
which would permit them to exchange reductions of tariffs along a broad area of products on their part,
for reductions in the peaks in manufacturing sectors of developed countries. Finally, as trade in
manufactures is rapidly expanding among the developing countries themselves, they would obtain
significant benefits from mutual reductions in tariff barriers that affect their exports in other developing
country markets.
65
(b) Non-Tariff Barriers: As there are few non-tariff barriers (NTBs) still in place in the
developed countries, the key issue for developing countries here has to do with ensuring that first,
commitments under the ATC are implemented and second, that NTBs are not imposed under the guise of
any other rules or arrangements. One way in which this may occur is through the application of
discriminatory rules and practices under the SPS and TBT agreements. The way to guard against such
developments is to be vigilant and scrutinize actions of developed countries to ensure appropriate
implementation of the relevant agreements. But while textiles and clothing actions are being monitored
systematically through the Textile Bureau, no similar arrangement is present with regard to SPS and TBT
- areas in which many developing countries have limited institutional capacities - which may constrain
their ability to scrutinize the consistency of developed country actions.
At the same time it is clear that some developing countries continue to impose non-tariff
measures on manufacturing imports. These have been shown to be very damaging to their economies for
a variety of reasons including through the lack of transparency, the generation of rents and corruption etc.
NTBs are also sub-optimal as a means for addressing of balance-of-payments problems. There is no
difference in this regard between LDCs and other developing countries. These measures should be
eliminated at the earliest possible opportunity, or, where appropriate, converted into tariffs that will be
subject to reductions over time, possibly as part of multilateral WTO negotiations involving tariffs in
agriculture and/or manufactures.
(c) Trade Remedies: The experience of the last few years suggests strongly that
anti-dumping action has become the instrument of choice for providing trade remedies by both developed
and higher and middle income developing countries. Many of these developing countries, consistent with
their WTO obligations, have abandoned the use of non-tariff measures to protect their manufacturing
sector, and are in effect emulating developed country practices regarding trade remedies, which are
consistent with WTO rules and procedures: In this manner they can be considered to have become more

66
effectively integrated into the multilateral trading system. Their example is likely to be followed by other
developing countries in the future. Although anti-dumping actions carry the potential of shielding
inefficient domestic producers, their proliferation in developing countries and especially against
developed country exporters, could well provide the balance needed for a longer term reconsideration and
tightening of the WTO anti-dumping agreement provisions. Such a reconsideration should aim at
reducing the flexibility all countries have in granting relief through this instrument and induce
governments to rely more on safeguard actions, which tend to be more transparent and time- limited.
3 Export Policies
The analysis above shows that developing countries have over time reduced their interventions
aimed at controlling or taxing primary exports, while bringing their practices in promoting manufacturing
exports more in line with the overall disciplines of the WTO, e.g. with regard to the use of export
subsidies. Nonetheless, export controls on primary products continue to be present in a number of
countries. Such controls and taxes pose two dangers: First, they create disincentives to production for
export which may reduce export earnings. Second, export controls, including taxation, result in domestic
prices of exportables which are lower than international prices. This could lead to the establishment of
inefficient domestic processing industries, which can only survive through the implicit protection
afforded by the artificially lower domestic input prices. A better set of policies would include: (a) the
establishment of instruments of taxation that are neutral as between income derived from exports and
income from domestic sales; (b) the provision of support to domestic processing activities which does not
rely on artificially depressing the domestic prices of exportable primary commodities and raw materials.
4 Capacity Building
Many developing countries, especially lower income and LDCs, face significant constraints in
their capacity to implement effectively their WTO obligations in a number of areas, including customs
administration, SPS, and TBT as well as adjustment assistance. These constraints have been recognized

67
in the WTO agreements, which permit developing countries longer time frames to bring their policies and
institutions into line with their WTO obligations in some of these areas, as well as encourage developed
country members to provide technical assistance in support of developing country efforts to strengthen
their institutions.
A detailed analysis of the implementation of these provisions and of other measures to assist
developing countries, and especially LDCs, in capacity building efforts was beyond the scope of this
study. However, some of the conclusions and recommendations of other studies of the issue may be
useful to recall in this context. In particular, regarding technical assistance, it appears that considerable
amounts are available from a variety of bilateral donors and international organizations. There are
problems, however, regarding the effective co-ordination of such assistance and ensuring that it is not
supply- driven and reflects accurately the priorities and needs of the developing countries concerned. An
effort to co-ordinate such assistance to LDCs was launched in 1997, but has produced little tangible
results so far. While the WTO has increased its technical co-operation efforts in recent years, and
together with other international agencies has launched the Integrated Program for Technical Assistance,
more resources from its own budget may usefully be employed in this and other programs to assist
developing country members. This is needed both in order to permit the WTO to provide leadership in
international co-ordination of technical assistance efforts, and in order to provide support in areas in
which the WTO has particular expertise and responsibilities (Michalopoulos, 1999).

68
REFERENCES
Blackhurst, Richard et.al.. 1996. "The Uruguay Round and Market Access: Opportunities andChallenges for Developing Countries" in W. Martin and L. A. Winters Eds. The UruguayRound and the Developing Countries, Cambridge University Press.
Daly, Michael and Hiroaki Kuwahara. 1998. "The Impact of the Uruguay Round on Tariff and Non-Tariff Barriers to Trade in the ’Quad’, The World Economy, Vol.21, No.2, March,pp.207-234.
Deardorf, Alan and Stern, Robert M. 1998. Measurement of Non-tariff Barriers, University ofMichigan Press, Ann Arbor.
Drabek, Zadek and Sam Laird. 1998. "The New Liberalism-Trade Policy Developments in EmergingMarkets", Journal of World Trade, Vol.32, No.5, October.
Finger, Michael J.1993. Anti-dumping: How It Works and Who Gets Hurt, Michigan University Press,1993.
Finger, Michael J. et.al.1996. The Uruguay Round: Statistics on Tariff Concessions Given andReceived, World Bank.
Finger Michael, J. and L Alan Winters.1998. "What Can the WTO Do for Developing Countries",In A.O.Krueger Ed. The WTO as an International Organization, The University of ChicagoPress.
Finger Michael J. and Ludger Schuknecht. 1999. "Market Access Advances and Retreats Since theUruguay Round", Paper presented at the Annual World Bank on Development Economics,Washington, April 29-30.
GATT. 1994. The Results of the Uruguay Round of Multilateral Trade Negotiations, The Legal TextsGATT.
GATT, Trade Policy Reviews For 29 Developing Countries, 1989-1994. (For details, See Appendix).
IMF. 1999.International Financial Statistics.Washington
International Grains Council, Food Aid Committee. 1999. "Food Aid Convention", London, March 24
Keesing, Donald, B.1998. Improving Trade Policy Reviews in the World Trade Organization,Institute for International Economics.
Lerner, Abba. 1936. "The Symmetry between Import and Export Taxes", Economica 3 August,pp.306-13.
Lindbland, Jostein,. 1997. "The Impact of the Uruguay Round on Tariff Escalation in AgriculturalProducts", FAO, ESCP No.3.
Low, Patrick.1995. Preshipment Inspection Services, World Bank Discussion Paper #278, WorldBank..

69
Martin, Will. 1999. "Developing Countries Interests in Liberalizing Manufactures Trade" World Bank(processed).
Martin, Will and L.Alan Winters.1996. "The Uruguay Round: A Milestone for the DevelopingCountries", in W. Martin and L.A. Winters Eds. The Uruguay Round and the DevelopingCountries,Cambridge University Press.
Matusz, Steven J. and David C. Tarr. 1998. "Adjusting to Trade Policy Reform", (processed) August.
Michalopoulos, Constantine and Alan L. Winters. 1997."Policies on Imports from Economies inTransition: Summary and Overview" in Peter D.Ehrenhaft et.al., Policies on Imports fromEconomies in Transition: Two Case Studies, World Bank .
Michalopoulos, Constantine.1999. "Developing Countries in the WTO", World Economy , Vol. 22 #1
Miranda, Jorge et.al.1998. "The International Use of Antidumping:1987-1997", Journal of WorldTrade, 32(5), pp.5-71.
Nogues, Julio et .al.1986. "The Extent of Non-Tariff Barriers to Industrial Countries’ Imports", TheWorld Bank Economic Review, Vol.1, No. 1, pp.181-99.
OECD. 1997.Indicators of Tariff and Non-Tariff Barrier, Paris.
OECD.1998.Outlook.Paris.
Smeets, M. and C. Fournier. 1998. Trade and Tariffs in Leather and Leather Products.WTO, Geneva.
Srinivasan, T.N. 1998. Developing Countries and the Multilateral Trading System, Westview Press.
UNCTAD.1997. "The Post-Uruguay Round Tariff Environment for Developing Country Exports",
UNCTAD/WTO Joint Study, TD/B/COM.1/14, October .
UNCTAD/WTO.1997. "Market Access Developments since the Uruguay Round: Implications,Opportunities and Challenges , in Particular for Developing Countries, and Least DevelopedCountries, in the Context of Globalization and Liberalization", UNCTAD.
World Bank.1998.World Development Indicators.Washington
WTO.1995. The Results of the Uruguay Round of Multilateral Trade Negotiations: The Legal Texts,Geneva.
WTO.1998. "Second Biennial Review of the Implementation and Operation of the Agreement onImport Licensing Procedures", Committee on Import Licensing, G/LIC/6, November.
WTO. 1997-1998. "Trade-Related Technical Assistance Needs-Assessment" Committee on Trade andDevelopment, WT/COMTD/IF/1-38.
WTO. 1997a. "Market Access for Least Developed Countries", High Level Meeting on Integrated

70
Initiatives for Least Developed Countries’ Trade Development, WT/LDC /HL/14, November.
WTO. 1997b. "Report on the Implementation of the Agreement on Textiles and Clothing", TextilesMonitoring Body, G/L/179, July, 1997.
WTO, Integrated Database
WTO, .Rules Division Antidumping Measures Database
WTO, Trade Policy Reviews for 31 developing Countries 1995-1998 (for details see Appendix) ;alsoTrade Policy Reviews for the EU, (1997), Canada, (1998), US (1996), Japan (1998).
WTO. 1999a. "Semi-Annual Reports under Article 16.4 of the Agreement", Committee on Anti-Dumping Practices, G/ADP/N/41 and N/47 Add.1. April.
WTO. 1999b. " Report of the Working Party on Pre-shipment Inspection", G/L/300, March.
WTO, Statistics Division : "International Trade Statistics : Statistics on International Trade inmerchandise and commercial services"
71
APPENDIXMethodology in Estimating Frequency Ratios
The TPR data permitted us to estimate frequencies, in the applications of these non-tariff
measures at the HS2 digit level involving 97 product categories. Thus, the frequency ratios (f) calculated
from the TPR relate to the proportion of HS2 product categories out of the total which is affected by a
particular measure. The weakness of this indicator is that it gives equal weight to the presence of a
measure in a country that could affect only one or a few lines in an HS2 category, for example HS72, Iron
and Steel, with the presence of the same measure in another country which affects a large number of tariff
lines or, for example all steel products.
Formally, let Nqm be a non-tariff measure imposed by country m on a product or group of
products q. Then the frequency ratio for that measure, fnm = Nqm / Qm , where Qm is the total number of
products, measured in total tariff lines or product groups. Thus, for the calculation of (f), using the HS2
product breakdown employed in most of the analysis for the Qm =97. Where tariff line information was
available, as for example in the case of anti-dumping measures for the calculation of (f’), a standard HS 6-
digit tariff line classification of approximately 5200 lines was used. Two other frequency ratio concepts
are used in the paper: The total frequency ratio (Tfm) , which is simply the sum of all frequency ratios of
NTM used by country m; and the average frequency ratio (Af n ) which shows the average use of a
particular non-tariff measure for the countries in the group.
It may appear at first glance, that f would always be larger than f’. This is not the case, however.
The two different frequency ratios show different aspects of a country’s trade regime: If a specific non-
tariff measure involves a large number of tariff lines concentrated in one or two groups of products, f may
be smaller than f’; the converse will be the case if a particular measure applies to a few products in a
large number of groups. A simple example from one of the countries, Thailand, in which tariff line and

72
broader category measures are available for the same year, can be used to illustrate this point: In 1997
Thailand applied non-automatic licensing on a total of 25 product categories, involving 713 tariff lines. In
this case, f= 26% while f1=14%. For the same year, Thailand’s prohibitions were concentrated in 6
product categories involving 613 tariff lines. In this case f= 6% while f1= 12% .
An effort was made to complement the TPR analysis of non tariff measures with data obtained
from the UNCTAD, TRAINS data base, which permit the calculation of frequency ratios (f’) at the tariff
line level. The TRAINS data are available for a fewer number of countries (22), and only in six cases was
information available for the same country over a period of time. The f1 ratios for similar non-tariff
measures as those calculated from the TPRs but based on tariff line data from TRAINS are shown in
Appendix Table A-2. Comparison with Table 8 suggests that there is a pretty good correlation between
the frequency ratios in countries which, either apply non-tariff measures on just a few products or those
that apply them on a very large number of products; but there appears to be little correlation between the
two frequency measures for countries in between.
On the other hand, when looking at the evolution of frequency ratios over time, frequency ratios
for Chile, Colombia and Thailand are shown to increase from the first period to the second, while they are
shown to decline for the same countries using the TPR information. On closer investigation however, it
appears that the reason for the increase, is the introduction in all three countries of licensing and/or
prohibitions for the importation of products which are either hazardous (radioactive materials and the
like) and/or protected under environmental conventions (tropical wood and articles thereof); and there is
no record in the TPR of any changes in the commercial policy of the countries involved affecting these
products. While an effort was made to exclude from consideration in the TPRs of all products in which
licensing and prohibitions imposed for safety and environmental reasons, it was not possible to check all
the TRAINS data in order to determine the extent to which they included restrictions for this purpose. As
a consequence the TRAINS data cannot be readily compared with the data obtained from the TPRs; and

73
were used only for general reference purposes, as well as in the construction of the estimates for NTMs at
the HS-2 level for of India—as the information contained in the TPRs for India was inadequate for that
purpose.
Finally, it should be noted that the frequency ratios employed assume that the measure taken
applies to all transactions involving that tariff line or product group and is not limited to transactions with
one country or group of countries. This is not a major weakness in the set of measures being considered
because, unlike most trade remedies (anti-dumping, countervailing) measures included here are almost
always applied to imports from all sources.25
25There are a few exceptions: For example, Korea applied tariff quotas on certain items only against imports from Japan; and
similarly for Cyprus against the EU. The measures applied by these countries were included in the calculated frequencies, asat the time they affected trade with a major partner. On the other hand, several countries impose total embargoes on importsfrom certain countries for political reasons—for example a number of Arab states against Israel. These embargoes wereignored in the calculations.

74
Table A-1
TPR Country Coverage
Country GATT TPR WTO TPRArgentina 1992 1999*Bangladesh 1992Benin 1998Brazil 1993 1997Bolivia 1993Cameroon 1995Chile 1991 1997Colombia 1990 1997Costa Rica 1995Côte d'Ivoire 1995Cyprus 1997Dominican Republic 1996Egypt 1993El Salvador 1996Fiji 1997Ghana 1992Hong Kong, China 1990 1994,1999*India 1993 1997Indonesia 1991 1994,1999*Kenya 1994Korea 1992 1996Malaysia 1993 1998Mauritius 1996Mexico 1993 1998Morocco 1990 1996Nigeria 1991 1999*Pakistan 1995Paraguay 1997Peru 1994Philippines 1993Senegal 1994Singapore 1992 1996S. Africa/SACU 1993 1998Sri Lanka 1995Thailand 1991 1995Tunisia 1994Turkey 1994 1999*Uganda 1995Uruguay 1992 1999*Venezuela 1996Zambia 1996Zimbabwe 1995
Explanation :*The year refers to the date of TPR publication actual or forthcoming, not the year when the Review wasundertaken. In the cases of Cameroon, Pakistan, Zimbabwe, 1994 GATT reviews were published in 1995.
Source. GATT, TPR ; WTO, TPR.
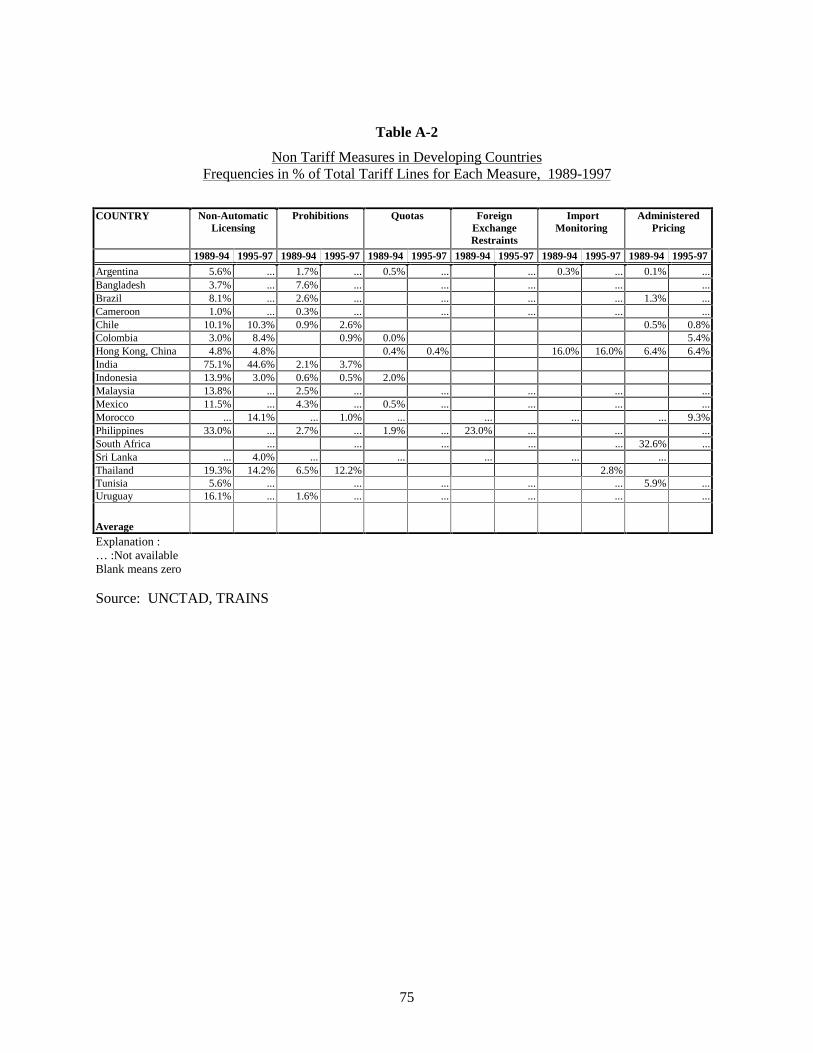
75
Table A-2
Non Tariff Measures in Developing CountriesFrequencies in % of Total Tariff Lines for Each Measure, 1989-1997
COUNTRY Non-AutomaticLicensing
Prohibitions Quotas ForeignExchangeRestraints
ImportMonitoring
AdministeredPricing
1989-94 1995-97 1989-94 1995-97 1989-94 1995-97 1989-94 1995-97 1989-94 1995-97 1989-94 1995-97
Argentina 5.6% ... 1.7% ... 0.5% ... ... 0.3% ... 0.1% ...Bangladesh 3.7% ... 7.6% ... ... ... ... ...Brazil 8.1% ... 2.6% ... ... ... ... 1.3% ...Cameroon 1.0% ... 0.3% ... ... ... ... ...Chile 10.1% 10.3% 0.9% 2.6% 0.5% 0.8%Colombia 3.0% 8.4% 0.9% 0.0% 5.4%Hong Kong, China 4.8% 4.8% 0.4% 0.4% 16.0% 16.0% 6.4% 6.4%India 75.1% 44.6% 2.1% 3.7%Indonesia 13.9% 3.0% 0.6% 0.5% 2.0%Malaysia 13.8% ... 2.5% ... ... ... ... ...Mexico 11.5% ... 4.3% ... 0.5% ... ... ... ...Morocco ... 14.1% ... 1.0% ... ... ... ... 9.3%Philippines 33.0% ... 2.7% ... 1.9% ... 23.0% ... ... ...South Africa ... ... ... ... ... 32.6% ...Sri Lanka ... 4.0% ... ... ... ... ...Thailand 19.3% 14.2% 6.5% 12.2% 2.8%Tunisia 5.6% ... ... ... ... ... 5.9% ...Uruguay 16.1% ... 1.6% ... ... ... ... ...
AverageExplanation :… :Not availableBlank means zero
Source: UNCTAD, TRAINS

76
Table A-3Non-Tariff Measures
(by HS 2 Category in number of Countries Using Measure, 1989-1998)
Non automaticLicensing
Prohibitions Quotas Tariff Quotas Variable Levies /Administered Pricing
HS2
1989-94 1995-98 1989-94 1995-98 1989-94 1995-98 1989-94 1995-98 1989-94 1995-98I LIVE ANIMALS; ANIMAL PRODUCTS
1 11 4 4 1 2 0 1 2 0 02 12 5 5 1 0 0 0 4 1 13 11 4 2 1 0 0 1 0 0 14 14 6 2 1 1 0 0 6 3 25 10 2 1 0 0 0 0 1 1 0
II VEGETABLE PRODUCTS6 8 3 0 0 0 0 0 0 0 07 14 8 3 1 3 1 1 6 0 18 14 3 2 0 1 1 1 3 0 09 12 7 3 1 1 1 0 6 0 0
10 17 13 2 2 4 1 0 4 3 311 10 9 0 2 0 1 0 2 3 212 13 5 2 3 2 0 1 3 1 213 6 1 0 0 0 0 0 0 0 014 3 1 1 0 0 0 0 0 0 0
III ANIMAL OR VEGETABLE FATS AND OILS15 13 5 4 2 0 0 0 3 1 4
IV PREPARED FOODSTUFFS; BEVERAGES; SPIRITS AND VINEGAR; TOBACCO AND MANUFACTURES16 9 1 1 0 0 0 0 0 0 017 15 6 2 3 1 3 1 3 3 318 9 1 1 1 1 0 0 1 0 019 8 3 1 0 0 0 0 1 1 120 7 3 0 0 1 0 0 0 0 121 6 2 1 0 0 0 0 2 0 022 10 7 6 1 0 0 1 2 2 123 9 4 1 0 0 0 0 1 1 124 11 4 4 1 0 1 0 2 1 0
V MINERAL PRODUCTS25 9 6 2 4 0 0 0 1 0 026 7 4 0 0 0 0 0 0 0 027 14 12 1 1 0 0 1 1 0 0
VI PRODUCTS OF THE CHEMICAL OR ALLIED INDUSTRIES28 5 5 1 0 0 0 1 3 2 029 8 5 3 1 0 0 1 1 1 030 6 2 1 1 0 0 0 0 0 031 9 3 0 0 0 0 0 2 0 032 4 1 2 0 0 0 1 1 0 033 3 3 1 0 0 0 0 0 0 034 5 1 2 1 0 0 0 0 0 035 3 1 2 0 0 0 0 0 0 036 4 5 1 0 0 0 0 1 0 037 4 2 0 0 0 0 0 0 1 038 6 2 1 1 0 0 0 0 0 0
VII PLASTICS AND ARTICLES THEREOF; RUBBER AND ARTICLES THEREOF39 7 3 2 1 0 0 1 0 1 040 5 7 1 3 0 1 1 1 2 1
VIII RAW HIDES AND SKINS; LEATHER; FURSKINS AND ARTICLES THEREOF41 4 0 0 0 0 0 1 0 0 042 5 1 1 0 0 0 0 0 0 043 3 1 1 0 0 0 0 0 0 0
IX WOOD AND ARTICLES OF WOOD PLAITING MATERIALS; BASKETWARE AND WICKERWORK44 8 3 2 2 0 0 1 2 1 045 1 1 0 0 0 0 1 0 0 046 3 1 0 0 0 0 0 0 0 0
Total Countries 29 30 29 30 29 30 29 30 29 30
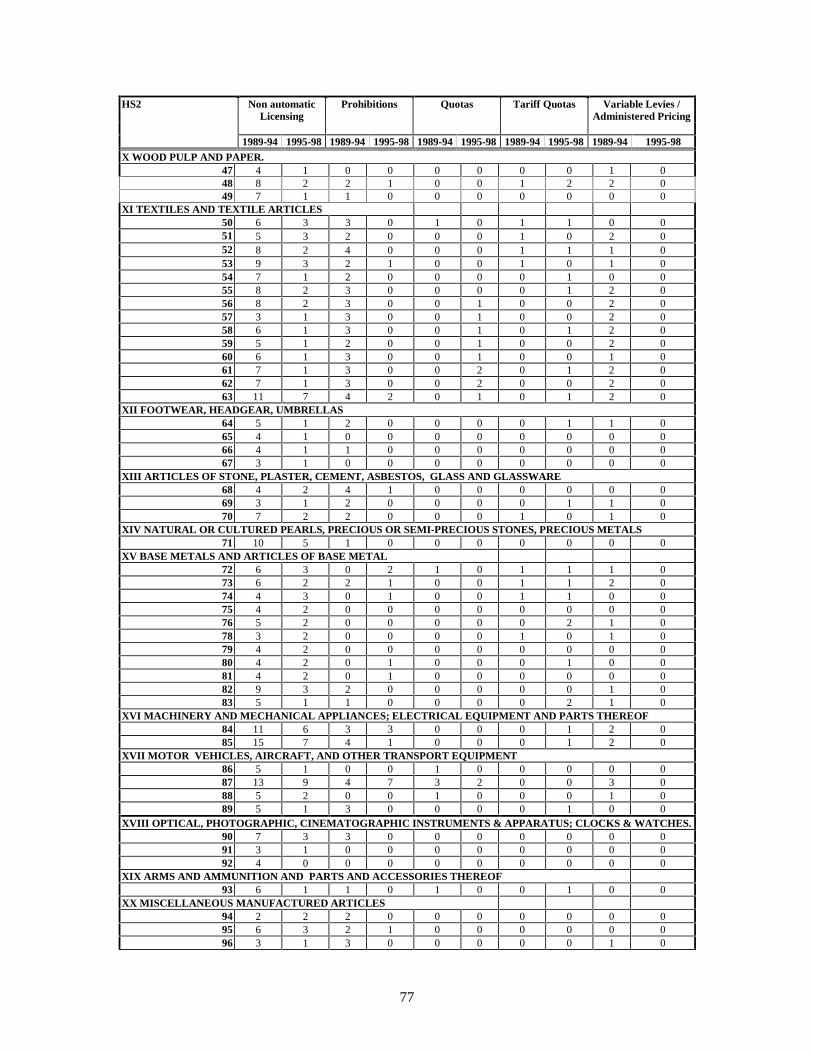
77
Non automaticLicensing
Prohibitions Quotas Tariff Quotas Variable Levies /Administered Pricing
HS2
1989-94 1995-98 1989-94 1995-98 1989-94 1995-98 1989-94 1995-98 1989-94 1995-98X WOOD PULP AND PAPER.
47 4 1 0 0 0 0 0 0 1 048 8 2 2 1 0 0 1 2 2 049 7 1 1 0 0 0 0 0 0 0
XI TEXTILES AND TEXTILE ARTICLES50 6 3 3 0 1 0 1 1 0 051 5 3 2 0 0 0 1 0 2 052 8 2 4 0 0 0 1 1 1 053 9 3 2 1 0 0 1 0 1 054 7 1 2 0 0 0 0 1 0 055 8 2 3 0 0 0 0 1 2 056 8 2 3 0 0 1 0 0 2 057 3 1 3 0 0 1 0 0 2 058 6 1 3 0 0 1 0 1 2 059 5 1 2 0 0 1 0 0 2 060 6 1 3 0 0 1 0 0 1 061 7 1 3 0 0 2 0 1 2 062 7 1 3 0 0 2 0 0 2 063 11 7 4 2 0 1 0 1 2 0
XII FOOTWEAR, HEADGEAR, UMBRELLAS64 5 1 2 0 0 0 0 1 1 065 4 1 0 0 0 0 0 0 0 066 4 1 1 0 0 0 0 0 0 067 3 1 0 0 0 0 0 0 0 0
XIII ARTICLES OF STONE, PLASTER, CEMENT, ASBESTOS, GLASS AND GLASSWARE68 4 2 4 1 0 0 0 0 0 069 3 1 2 0 0 0 0 1 1 070 7 2 2 0 0 0 1 0 1 0
XIV NATURAL OR CULTURED PEARLS, PRECIOUS OR SEMI-PRECIOUS STONES, PRECIOUS METALS71 10 5 1 0 0 0 0 0 0 0
XV BASE METALS AND ARTICLES OF BASE METAL72 6 3 0 2 1 0 1 1 1 073 6 2 2 1 0 0 1 1 2 074 4 3 0 1 0 0 1 1 0 075 4 2 0 0 0 0 0 0 0 076 5 2 0 0 0 0 0 2 1 078 3 2 0 0 0 0 1 0 1 079 4 2 0 0 0 0 0 0 0 080 4 2 0 1 0 0 0 1 0 081 4 2 0 1 0 0 0 0 0 082 9 3 2 0 0 0 0 0 1 083 5 1 1 0 0 0 0 2 1 0
XVI MACHINERY AND MECHANICAL APPLIANCES; ELECTRICAL EQUIPMENT AND PARTS THEREOF84 11 6 3 3 0 0 0 1 2 085 15 7 4 1 0 0 0 1 2 0
XVII MOTOR VEHICLES, AIRCRAFT, AND OTHER TRANSPORT EQUIPMENT86 5 1 0 0 1 0 0 0 0 087 13 9 4 7 3 2 0 0 3 088 5 2 0 0 1 0 0 0 1 089 5 1 3 0 0 0 0 1 0 0
XVIII OPTICAL, PHOTOGRAPHIC, CINEMATOGRAPHIC INSTRUMENTS & APPARATUS; CLOCKS & WATCHES.90 7 3 3 0 0 0 0 0 0 091 3 1 0 0 0 0 0 0 0 092 4 0 0 0 0 0 0 0 0 0
XIX ARMS AND AMMUNITION AND PARTS AND ACCESSORIES THEREOF93 6 1 1 0 1 0 0 1 0 0
XX MISCELLANEOUS MANUFACTURED ARTICLES94 2 2 2 0 0 0 0 0 0 095 6 3 2 1 0 0 0 0 0 096 3 1 3 0 0 0 0 0 1 0

78
Non automaticLicensing
Prohibitions Quotas Tariff Quotas Variable Levies /Administered Pricing
HS2
1989-94 1995-98 1989-94 1995-98 1989-94 1995-98 1989-94 1995-98 1989-94 1995-98XXI WORKS OF ART, COLLECTORS’ PIECES AND ANTIQUES
97 3 1 0 0 0 0 0 0 0 0Total countries 29 30 29 30 29 30 29 30 29 30
Source: GATT, TPR ; WTO, TPR.
Table A-4
Developing Countries Trade Policies Affecting Exports(by HS Categories in number of Countries Measure)
HS2 Export Levies Minimum ExportPrices
Export Licensing Export Prohibitions Export Quotas
1989-94 1995-98 1989-94 1995-98 1989-94 1995-98 1989-94 1995-98 1989-94 1994-98
I LIVE ANIMALS; ANIMAL PRODUCTS1 4 3 2 0 9 6 5 0 1 12 1 1 0 0 4 1 1 1 2 13 1 1 2 0 6 3 0 2 1 14 3 1 0 0 5 3 4 1 0 15 1 2 0 1 4 1 0 2 0 0
II VEGETABLE PRODUCTS6 0 1 0 0 3 0 0 0 0 07 2 0 0 0 6 2 3 0 0 08 4 3 2 2 5 2 2 2 2 19 4 7 2 3 7 4 1 0 1 6
10 2 0 1 0 6 8 3 0 2 111 2 1 1 0 2 2 0 1 0 112 4 2 3 1 5 5 3 1 2 013 1 2 0 0 2 0 0 1 0 014 2 2 0 0 2 1 1 0 1 0
III ANIMAL OR VEGETABLE FATS AND OILS.15 0 3 1 1 3 3 1 2 2 0
IV PREPARED FOODSTUFFS; BEVERAGES; SPIRITS AND VINEGAR; TOBACCO AND MANUFACTURES.16 0 0 1 0 3 1 0 0 0 017 1 4 0 0 7 10 0 0 2 118 1 4 2 1 3 1 0 0 1 219 0 0 0 0 5 1 0 0 1 120 0 1 0 0 3 1 0 0 1 021 0 1 0 0 1 2 0 0 0 022 0 1 0 0 2 3 0 0 0 023 1 0 1 1 3 1 1 1 1 024 1 0 0 0 1 0 0 0 0 0
V MINERAL PRODUCTS25 2 2 1 2 6 2 1 1 0 026 0 1 0 0 6 6 0 0 1 127 3 5 1 2 13 5 1 2 1 1
VI PRODUCTS OF THE CHEMICAL OR ALLIED INDUSTRIES28 1 1 0 0 1 2 0 0 0 029 0 0 0 0 1 0 0 0 0 030 0 1 0 0 1 1 0 1 1 031 1 0 0 0 4 4 0 1 0 032 1 0 0 0 0 0 0 0 0 033 0 1 0 0 0 1 0 1 0 034 0 0 0 0 1 0 0 0 1 035 0 0 0 0 0 0 0 0 0 036 0 0 0 0 0 0 0 0 1 037 0 0 0 0 3 1 1 0 0 038 0 1 0 0 2 1 0 0 0 0

79
HS2 Export Levies Minimum ExportPrices
Export Licensing Export Prohibitions Export Quotas
1989-94 1995-98 1989-94 1995-98 1989-94 1995-98 1989-94 1995-98 1989-94 1994-98
VII PLASTICS AND ARTICLES THEREOF; RUBBER AND ARTICLES THEREOF39 0 0 0 0 1 0 0 0 0 040 2 1 1 0 3 1 1 0 0 0
VIII RAW HIDES AND SKINS; LEATHER; FURSKINS AND ARTICLES THEREOF41 7 5 1 1 5 3 5 2 2 042 0 3 1 0 3 0 0 1 0 043 0 1 0 0 1 3 0 0 0 0
IX WOOD AND ARTICLES OF WOOD ; BASKETWARE AND WICKERWORK44 3 4 1 1 8 7 5 5 1 145 1 0 0 0 1 0 0 0 0 046 0 0 0 0 0 0 0 0 0 0
Total countries 29 30 29 30 29 30 29 30 29 30X WOOD PULP AND PAPER.
47 1 0 0 0 2 0 0 0 0 048 0 0 0 0 5 1 2 0 0 049 0 0 0 0 1 0 2 0 0 0
XI TEXTILES AND TEXTILES ARTICLES50 1 0 1 0 5 1 0 0 0 051 1 2 1 0 4 1 0 0 2 052 2 0 3 0 6 1 0 1 4 053 2 1 3 0 4 1 0 0 2 054 0 0 1 0 3 1 0 0 1 055 0 0 1 0 3 1 0 0 1 056 1 1 1 0 3 1 0 0 1 057 0 1 1 0 3 1 0 0 1 058 0 1 1 0 3 1 0 0 1 059 0 1 1 0 3 1 0 0 1 060 0 1 1 0 3 1 0 0 1 061 0 1 1 0 4 1 0 0 1 162 0 1 1 0 5 1 0 0 1 163 1 1 1 0 6 1 0 0 1 0
XII FOOTWEAR, HEADGEAR, UMBRELLAS64 0 0 0 0 3 1 0 0 0 065 0 0 0 0 1 1 0 0 0 066 0 0 0 0 0 0 0 0 0 067 0 0 0 0 1 0 0 0 0 1
XIII ARTICLES OF STONE, PLASTER, CEMENT, ASBESTOS, GLASS AND GLASSWARE68 0 0 0 0 1 1 0 0 0 069 0 0 0 0 0 1 0 0 0 070 0 0 0 0 2 0 0 0 0 0
XIV NATURAL OR CULTURED PEARLS, PRECIOUS OR SEMI-PRECIOUS STONES, PRECIOUS METALS71 1 3 1 0 6 5 0 2 0 0
XV BASE METALS AND ARTICLES OF BASE METAL72 1 3 1 1 3 4 3 0 1 073 0 0 0 0 2 1 0 0 0 174 1 0 0 0 1 1 0 0 0 075 1 0 0 0 1 0 0 0 0 076 2 0 1 0 0 0 0 0 0 078 1 0 0 0 1 0 0 0 0 079 1 0 0 0 2 0 0 0 0 080 1 0 0 0 2 1 0 0 0 081 1 0 0 0 1 0 0 0 0 082 0 0 0 0 1 0 0 0 0 083 0 0 0 0 1 0 0 0 0 0
XVI MACHINERY AND MECHANICAL APPLIANCES; ELECTRICAL EQUIPMNT AND PARTS THEREOF84 0 1 0 0 3 1 0 0 0 185 0 0 0 0 6 0 0 0 0 0
XVII VEHICLES, AIRCRAFT, VESSELS AND ASSOCIATED TRANSPORT EQUIPMENT86 0 0 0 0 3 1 0 0 0 087 0 0 0 0 4 2 0 0 0 088 0 0 0 0 3 0 0 0 0 0

80
HS2 Export Levies Minimum ExportPrices
Export Licensing Export Prohibitions Export Quotas
1989-94 1995-98 1989-94 1995-98 1989-94 1995-98 1989-94 1995-98 1989-94 1994-98
89 0 0 0 0 2 0 0 0 0 0XVIII OPTICAL, PHOTOGRAPHIC, CINEMATOGRAPHIC INSTRUMENTS AND APPARATUS; CLOCKS AND WATCHES.
90 0 0 0 0 1 0 0 0 0 091 0 0 0 0 0 1 0 0 0 092 0 0 0 0 0 0 0 0 0 0
XIX ARMS AND AMMUNITION; PARTS AND ACCESSORIES THEREOF93 0 0 0 0 1 1 0 0 0 0
XX MISCELLANEOUS MANUFACTURED ARTICLES94 0 0 0 0 1 0 0 0 0 095 0 0 0 0 2 0 0 0 0 096 0 0 0 0 2 0 0 0 0 0
XXI WORKS OF ART, COLLECTORS’ PIECES AND ANTIQUES97 0 1 0 0 2 0 2 1 0 0
total countries 29 30 29 30 29 30 29 30 29 30
Source: GATT, TPR ; WTO, TPR
Sept2/int8