Embed Size (px)
Citation preview
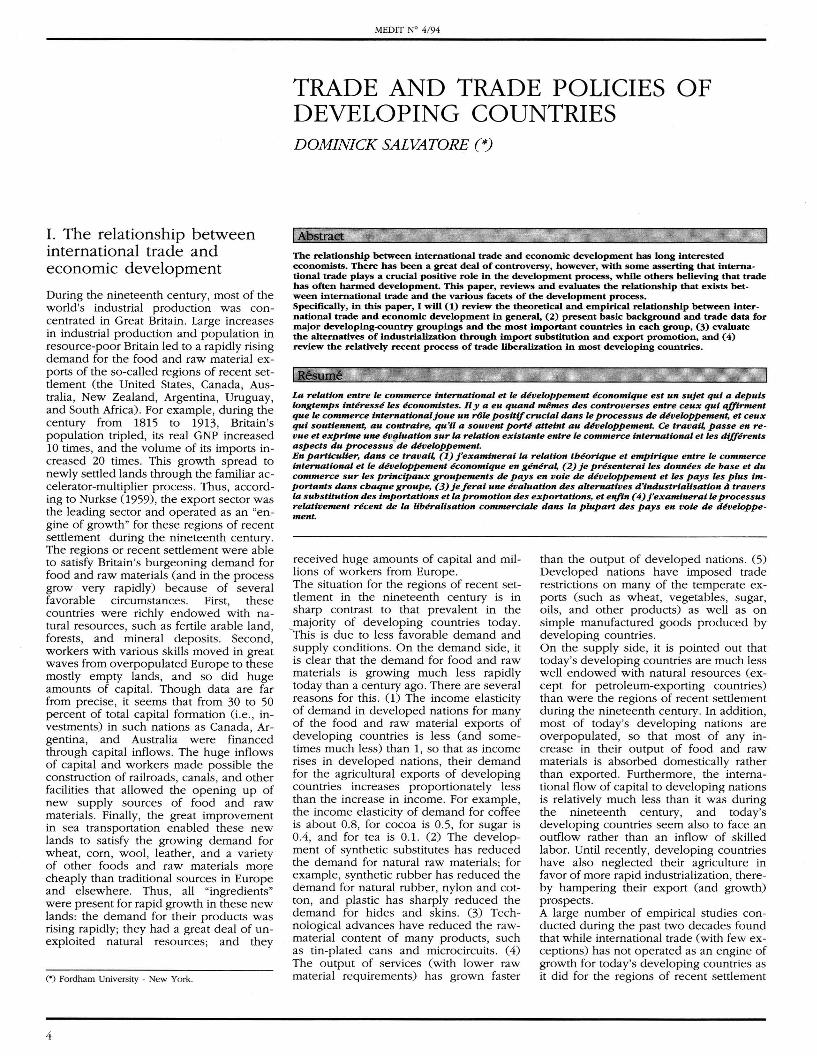
I. The relationship between international trade and economic development
During the nineteenth century, most of the world's industrial production was concentrated in Great Britain. Large increases in industrial production and population in resource-poor Britain led to a rapidly rising demand for the food and raw material exports of the so-called regions of recent settlement (the United States, Canada, Australia, New Zealand, Argentina, Uruguay, and South Africa). For example , during the century from 1815 to 1913, Britain's population' tripled, its real GNP increased 10 times , and the volume of its imports increased 20 times. This growth spread to newly settled lands through the familiar accelerator-multiplier process. Thus, according to Nurkse (959), the export sector was the leading sector and operated as an "engine of growth" for these regions of recent settlement during the nineteenth century. The regions or recent settlement were able to satisfy Britain's burgeoning demand for food and raw materials (and in the process grow very rapidly) because of several favorable circumstances. First, these countries were richly endowed with natural resources, such as fertile arable land, forests , and mineral deposits. Second, workers with various skills moved in great waves from overpopulated Europe to these mostly empty lands, and so did huge amounts of capital. Though data are far from precise, it seems that from 30 to 50 percent of total capital formation (i.e ., investments) in such nations as Canada, Argentina, and Australia were financed through capital inflows. The huge inflows of capital and workers made possible the construction of railroads, canals , and other facilities that allowed the opening up of new supply sources of food and raw materials. Finally, the great improvement in sea transportation enabled these new lands to satisfy the growing demand for wheat, corn, wool, leather, and a variety of other foods and raw materials more cheaply than traditional sources in Europe and elsewhere. Thus , all "ingredients" were present for rapid growth in these new lands: the demand for their products was rising rapidly; they had a great deal of unexploited natural resources ; and they
(0) Fordham University - New York.
4
MEDIT W 4/94
TRADE AND TRADE POLICIES OF DEVELOPING COUNTRIES DOMINICK SALVATORE (*)
The relationship between international trade and economic development has long interested economIsts_ There has been a great deal of controversy, however, with some asserting that international trade plays a Cnlcial positive role in the development process, while others believing that trade has often harmed development. This paper, reviews and evaluates the relationship that exists between international trade and the various facets of the development process. Specifically, in this paper, I will (1) review the theoretical and empirical relationship between international trade and economic development in general, (2) present basic background and trade data for major developing-country groupings and the most important countries in each group, (3) evaluate the alternatives of industrialization through import substitution and export promotion, and (4) review the relatively recent process of trade liberalization in most developing countries.
La relation entre le commerce international et le Mvewppement economique est un sujet qui a depuis wngtemps interesse les economistes. 11 y a eu quand m~mes des controverses entre ceux qui affirment que le commerce international joue un r6le positif crucial dans le processus de devewppement, et ceux qui soutiennent, au contraire, qu'il a souvent porte aneint au Mvewppement. Ce travai~ passe en revue et exprlme une eV!fluation sur la relation existante entre le commerce international et les df£ferents aspects du processus de Mvewppement. En particulier, dans ce travai~ (1) j'examinerai la relation tbeorlque et empirlque entre le commerce international et le devewppement economique en genera~ (2) je presenterai les donnees de base et du commerce sur les prlncipaux groupements de pays en voie de devewppement et les pays les plus importants dans cbaque groupe, (3) je ferai une evaluation des alternatives d'industrlalisation a travers la substitution des importations et la promotion des exportations, et erifin (4) j'examinerai le processus relativement recent de la liberalisation commerciale dans la plupart des pays en voie de developpement.
received huge amounts of capital and millions of workers from Europe. The situation for the regions of recent settlement in the nineteenth century is in sharp contrast to that prevalent in the
_majority of developing countries today. This is due to less favorable demand and supply conditions. On the demand side, it is clear that the demand for food and raw materials is growing much less rapidly today than a century ago. There are several reasons for this. (1) The income elasticity of demand in developed nations for many of the food and raw material exports of developing countries is less (and sometimes much less) than 1, so that as income rises in developed nations, their demand for the agricultural exports of developing countries increases proportionately less than the increase in income. For example , the income elasticity of demand for coffee is about 0.8, for cocoa is 0.5 , for sugar is 0.4, and for tea is 0.1. (2) The development of synthetic substitutes has reduced the demand for natural raw materials; for example, synthetic rubber has reduced the demand for natural rubber, nylon and cotton, and plastic has sharply reduced the demand for hides and skins. (3) Technological advances have reduced the rawmaterial content of many products, such as tin-plated cans and microcircuits . (4) The output of services (with lower raw material requirements) has grown faster
than the output of developed nations. (5) Developed nations have imposed trade restrictions on many of the temperate exports (such as wheat, vegetables , sugar, oils, and other products) as well as on simple manufactured goods produced by developing countries. On the supply side, it is pointed out that today's developing countries are much less well endowed with natural resources (except for petroleum-exporting countries) than were the regions of recent settlement during the nineteenth century. In addition, most of today's developing nations are overpopulated, so that most of any increase in their output of food and raw materials is absorbed domestically rather than exported. Furthermore, the international flow of capital to developing nations is relatively much less than it was during the nineteenth century, and today's developing countries seem also to face an outflow rather than an inflow of skilled labor. Until recently, developing countries have also neglected their agriculture in favor of more rapid industrialization, thereby hampering their export (and growth) prospects. A large number of empirical studies conducted during the past two decades found that while international trade (with few exceptions) has not operated as an engine of growth for today's developing countries as it did for the regions of recent settlement
during the nineteenth century, it has nevertheless contributed positively to the growth of most of today's developing countries [see: Bahami-Oskooee (991), Boggio and Tirelli (989), Cline (984) , Kravis (970), Ram (987), Reidel (988), Salvatore (983), Salvatore and Hatcher (991)]. There are several important ways by which international trade contributes to economic development even under today's changed international conditions. 0) Trade can lead to the full utilization of otherwise underemployed domestic resources. That is, through trade, a developing nation can move from an inefficient production point inside its production frontier, with unutilized resources because of insufficient internal demand, to a point on its production frontier with trade. For such a nation, trade would represent a vent for surplus, or an outlet for its potential surplus of agricultural commodities and raw materials . This has indeed occurred in many developing nations, particularly those in Southeast Asia and West Africa . In addition, (2) by expanding the size of the market, trade makes possible division of labor and economies of scale. This is especially important and it has actually taken place in the production of light manufactures in such economies as those of Taiwan, Hong Kong, Singapore, Korea, and other countries . (3) International trade
MEDIT N" 4/94
is the vehicle for the transmission of new ideas, new technology, and new managerial and other skills. (4) Trade also stimulates and facilitates the international flow of capital from developed to developing countries . For example, in the case of foreign direct investments, where the foreign firm retains control over its investment, the foreign capital is likely to be accompanied by foreign skilled personnel to organize production. (5) In several large developing nations, such as Brazil ad India, the importation of new manufactured products has stimulated domestic demand until efficient domestic production of these goods became feasible . Finally, (6) international trade is an excellent antimonopoly weapon (when allowed to operate) because it stimulates greater efficiency by domestic producers to meet foreign competition. This is particularly important to keep low the cost and price of intermediate or semifinished products used as inputs in the domestic production of other commodities. Critics of international trade can match this impressive list of benefits with an equally impressive list of allegedly harmful effects of trade . However, since a developing nation can always refuse to trade if it gains nothing or loses, the presumption is that it must also gain from trade. It is true that when most of the gains from trade accrue
Table 1 Gross domestic product and economic structure.
GNP per Capita GDP Growth (billions (dollars) (percent) of dollars) Agriculture
1990 1965-1990 1990 1965 1990
Sub-Saharan Africa 340 0.2 163 40 32
East Asia & Pacific 600 5.3 821 37 21 China 370 5.8 365 38 27 Indonesia 570 4.5 107 51 22 Korea, Republic of 5,400 7.1 236 38 9 Thailand 1,420 4.4 80 32 12
South Asia 330 1.9 346 44 33 Bangladesh 210 0.7 23 53 38 India 350 1.9 255 44 31 Pakistan 380 2.5 36 40 26
Low- & Middle-Income Europe 2,400 ... 489 . .. ... Greece 5,990 2.8 58 24 17 Portugal 4,900 3.0 57 ... ... Turkey 1,630 2.6 96 34 18
Middle East & N.Africa 1,790 1.8 ... 20 ... Algeria 2,060 2.1 42 ... 13 Egypt, Arab Rep. 600 4.1 33 29 17
Latin America & Caribbean 2,180 1.8 1,015 16 10 Argentina 2,370 -0.3 93 17 13 Brazil 2,680 3.3 414 19 10 Mexico 2,490 2.8 238 14 9
Low-Income Countries 350 2.9 916 41 31 Middle-Income Countries 2,220 2.2 2,438 19 12 Severely Indebted Countries 2,140 2.1 1,026 16 10 High-Income Economies 19,590 2.4 16,31 6 5 ...
Source: World Bank, Growth Development Report 1992. Washington, D.C.
to developed nations, there is a great deal of dissatisfaction and justification for demands to rectify the situation, but this should not be construed to mean that trade is actually harmful. One, of course, could always find cases where , on balance, international trade has actually hampered economic development. However, in most cases it can be expected (and the empirical evidence to date overwhelmingly seems to show) that international trade can provide invaluable assistance to the development process [see: Bhagwati (978), Bliss (989), Chenery (961), Evans (989), Findlay (984) , Greenaway (1987), Grilli (1990), Grilli and Yang (1988), Helleiner (1989) , IMF (989), Krueger (978), Lal and Sarath (1987), Salvatore 0989, 1992a), Salvatore et al (1992), Spraos (1983), World Bank (1991a)].
n. Background and trade data for developing countries
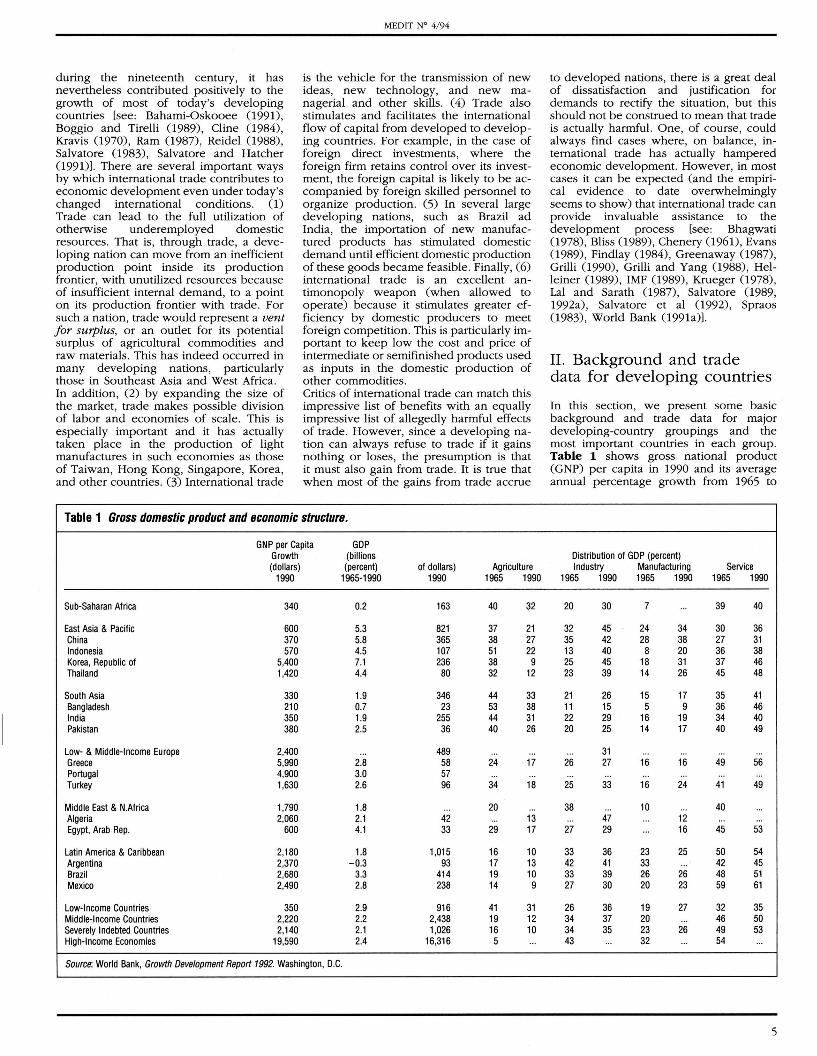
In this section, we present some basic background and trade data for major developing-country groupings and the most important countries in each group. Table 1 shows gross national product (GNP) per capita in 1990 and its average annual percentage growth from 1965 to
Distribution of GDP (percent) Industry Manufacturing Service
1965 1990 1965 1990 1965 1990
20 30 7 ... 39 40
32 45 24 34 30 36 35 42 28 38 27 31 13 40 8 20 36 38 25 45 18 31 37 46 23 39 14 26 45 48
21 26 15 17 35 41 11 15 5 9 36 46 22 29 16 19 34 40 20 25 14 17 40 49
... 31 ... ... . .. . .. 26 27 16 16 49 56 ... . .. ... .. . .. . . ..
25 33 16 24 41 49
38 ... 10 . .. 40 . .. ... 47 ... 12 . .. ...
27 29 ... 16 45 53
33 36 23 25 50 54 42 41 33 ... 42 45 33 39 26 26 48 51 27 30 20 23 59 61
26 36 19 27 32 35 34 37 20 ... 46 50 34 35 23 26 49 53 43 ... 32 ... 54 ...
5
1990, as well as the distribution of gross domestic product (GDP) among agriculture, industry, manufacturing, and services in both 1965 and 1990. From table 1, we see the huge disparities in per capita incomes between the high-income economies and the low-income countries, especially those of the SubSahara. Even correcting for the well-known exaggeration in per capita income inequalities between rich and poor countries when expressed in the same currency would leave huge differences . Furthermore , while the growth of real per capita GNP of low-income countries as a group exceeded the growth of real per capita GNP in high-income economies between 1965 and 1990, this is due primarily to the very high growth experienced by the countries of East Asia and the Pacific. Sub-Saharan countries barely grew and Argentina's real per capita GNP actually declined. Table 1 also shows that the percentage of GDP from agriculture declined from 1965 to 1990 for each group countries and individual country listed (in Korea , it actually declined 38 percent to 9 percent); the percentage of GDP from industry increased for most groups and individual countries (especially for Indonesia, where it was financed from petroleum receipts) ; the same is generally true for manufacturing (a subdivision of industry) and services.
Table 2 Merchandise trade.
MEDIT N" 4/94
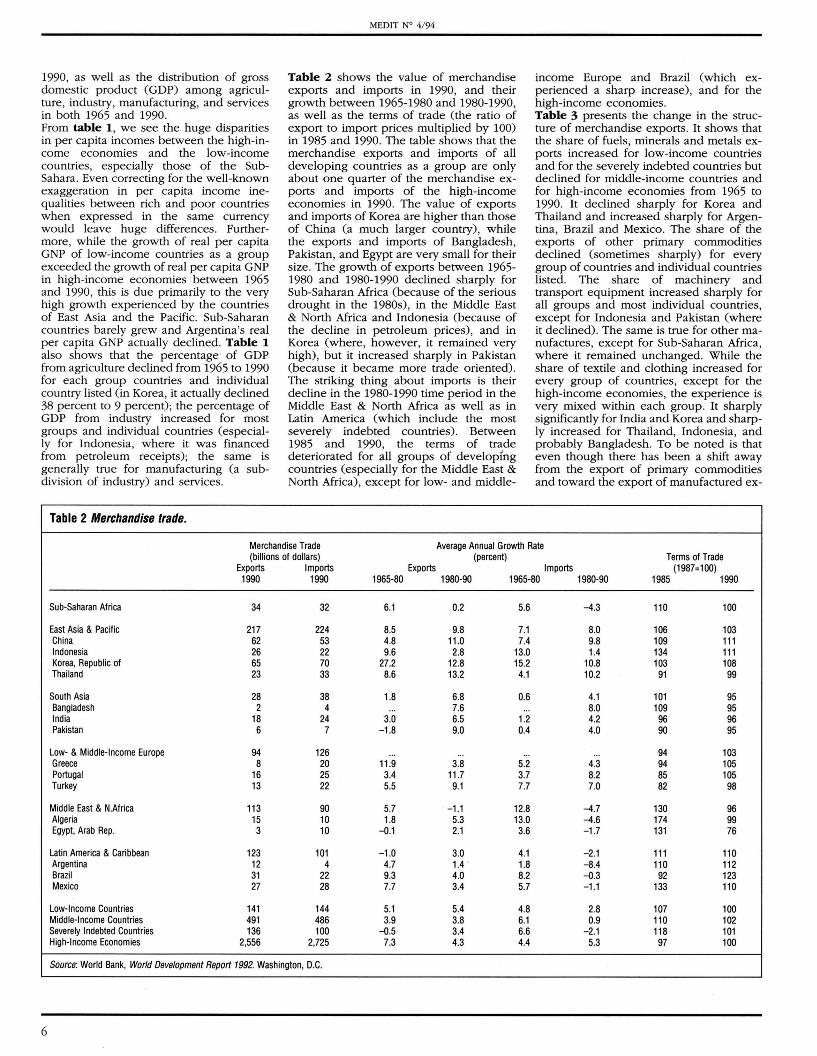
Table 2 shows the value of merchandise exports and imports in 1990, and their growth between 1965-1980 and 1980-1990, as well as the terms of trade (the ratio of export to import prices multiplied by 100) in 1985 and 1990. The table shows that the merchandise exports and imports of all developing countries as a group are only about one quarter of the merchandise exports and imports of the high-income economies in 1990. The value of exports and imports of Korea are higher than those of China (a much larger country) , while the exports and imports of Bangladesh, Pakistan, and Egypt are very small for their size. The growth of exports between 1965-1980 and 1980-1990 declined sharply for Sub-Saharan Africa (because of the serious drought in the 1980s), in the Middle East & North Africa and Indonesia (because of the decline in petroleum prices), and in Korea (where , however, it remained very high), but it increased sharply in Pakistan (because it became more trade oriented) . The striking thing about imports is their decline in the 1980-1990 time period in the Middle East & North Africa as well as in Latin America (which include the most severely indebted countries). Between 1985 and 1990, the terms of trade deteriorated for all groups of developing countries (especially for the Middle East & North Africa), except for low- and middle-
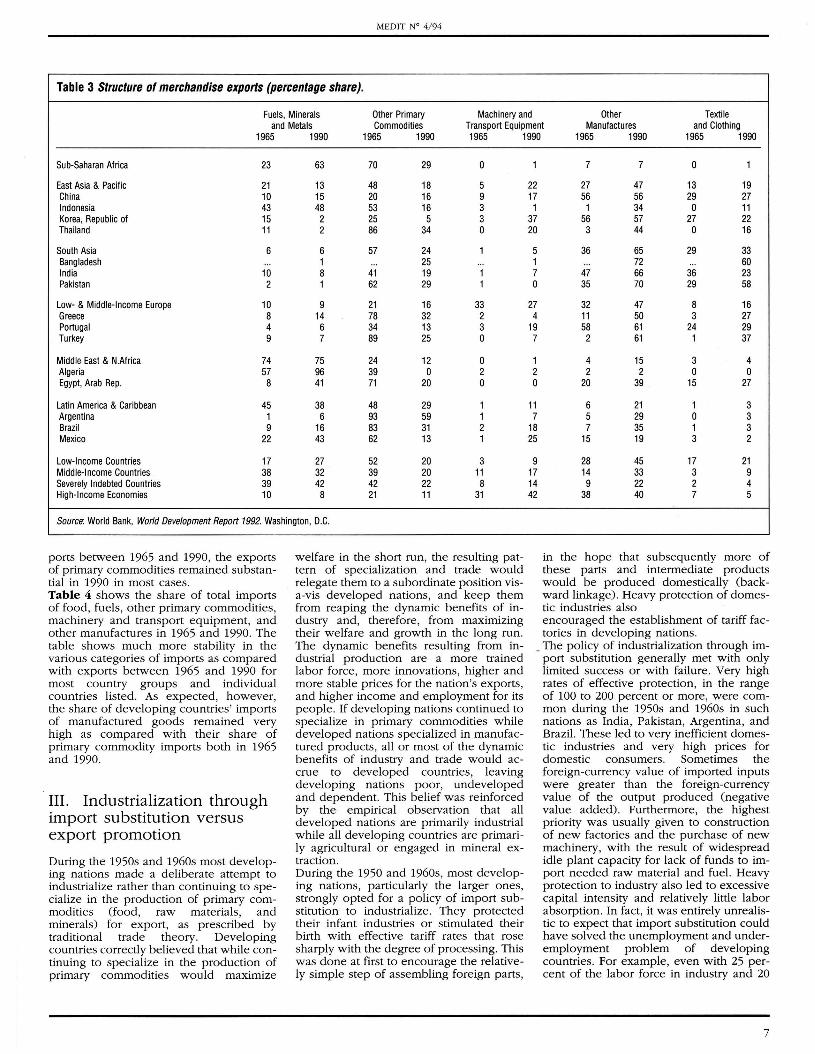
income Europe and Brazil (which experienced a sharp increase), and for the high-income economies. Table 3 presents the change in the structure of merchandise exports. It shows that the share of fuels, minerals and metals exports increased for low-income countries and for the severely indebted countries but declined for middle-income countries and for high-income economies from 1965 to 1990. It declined sharply for Korea and Thailand and increased sharply for Argentina, Brazil and Mexico. The share of the exports of other primary commodities declined (sometimes sharply) for every group of countries and individual countries listed. The share of machinery and transport equipment increased sharply for all groups and most individual countries, except for Indonesia and Pakistan (where it declined). The same is true for other manufactures, except for Sub-Saharan Africa, where it remained unchanged. While the share of textile and clothing increased for every group of countries, except for the high-income economies, the experience is very mixed within each group. It sharply significantly for India and Korea and sharply increased for Thailand, Indonesia, and probably Bangladesh. To be noted is that even though there has been a shift away from the export of primary commodities and toward the export of manufactured ex-
Merchandise Trade Average Annual Growth Rate (billions of dollars) (percent) Terms of Trade
Exports Imports Exports Imports (1987=100) 1990 1990 1965-80 1980-90 1965-80 1980-90 1985 1990
Sub-Saharan Africa 34 32 6.1 0.2 5.6 -4.3 110 100
East Asia & Pacific 217 224 8.5 9.8 7.1 8.0 106 103 China 62 53 4.8 11 .0 7.4 9.8 109 111 Indonesia 26 22 9.6 2.8 13.0 1.4 134 111 Korea, Republic of 65 70 27.2 12.8 15.2 10.8 103 108 Thailand 23 33 8.6 13.2 4.1 10.2 91 99
South ASia 28 38 1.8 6.8 0.6 4.1 101 95 Bangladesh 2 4 ... 7.6 ... 8.0 109 95 India 18 24 3.0 6.5 1.2 4.2 96 96 Pakistan 6 7 -1 .8 9.0 0.4 4.0 90 95
Low- & Middle-Income Europe 94 126 ... ... ... . .. 94 103 Greece 8 20 11.9 3.8 5.2 4.3 94 105 Portugal 16 25 3.4 11.7 3.7 8.2 85 105 Turkey 13 22 5.5 9.1 7.7 7.0 82 98
Middle East & N.Africa 113 90 5.7 -1 .1 12.8 -4.7 130 96 Algeria 15 10 1.8 5.3 13.0 -4.6 174 99 Egypt. Arab Rep. 3 10 -0.1 2.1 3.6 -1 .7 131 76
Latin America & Caribbean 123 101 -1.0 3.0 4.1 -2.1 111 110 Argentina 12 4 4.7 1.4 1.8 -8.4 110 112 Brazil 31 22 9.3 4.0 8.2 -0.3 92 123 Mexico 27 28 7.7 3.4 5.7 -1 .1 133 110
Low-Income Countries 141 144 5.1 5.4 4.8 2.8 107 100 Middle-Income Countries 491 486 3.9 3.8 6.1 0.9 110 102 Severely Indebted Countries 136 100 -0.5 3.4 6.6 -2.1 118 101 High-Income Economies 2,556 2,725 7.3 4.3 4.4 5.3 97 100
Source: World Bank, World Development Report 1992. Washington. D.e.
6
MEOIT W 4/ 94
Table 3 Structure of merchandise exports (percentage share)_
Fuels, Minerals Other Primary Machinery and Other Textile and Metals Commodities Transport Equipment Manufactures and Clothing
1965 1990 1965 1990 1965 1990 1965 1990 1965 1990
Sub-Saharan Africa 23 63 70 29 0
East Asia & Pacific 21 13 48 18 5 China 10 15 20 16 9 Indonesia 43 48 53 16 3 Korea, Republic of 15 2 25 5 3 Thailand 11 2 86 34 0
South Asia 6 6 57 24 1 Bangladesh ... 1 ... 25 ... India 10 8 41 19 1 Pakistan 2 1 62 29 1
Low- & Middle-Income Europe 10 9 21 16 33 Greece 8 14 78 32 2 Portugal 4 6 34 13 3 Turkey 9 7 89 25 0
Middle East & N.Africa 74 75 24 12 0 Algeria 57 96 39 0 2 Egypt, Arab Rep. 8 41 71 20 0
Latin America & Caribbean 45 38 48 29 1 Argentina 1 6 93 59 1 Brazil 9 16 83 31 2 Mexico 22 43 62 13 1
Low-Income Countries 17 27 52 20 3 Middle-Income Countries 38 32 39 20 11 Severely Indebted Countries 39 42 42 22 8 High-Income Economies 10 8 21 11 31
Source: World Bank, World Development Report 1992. Washington, D.C.
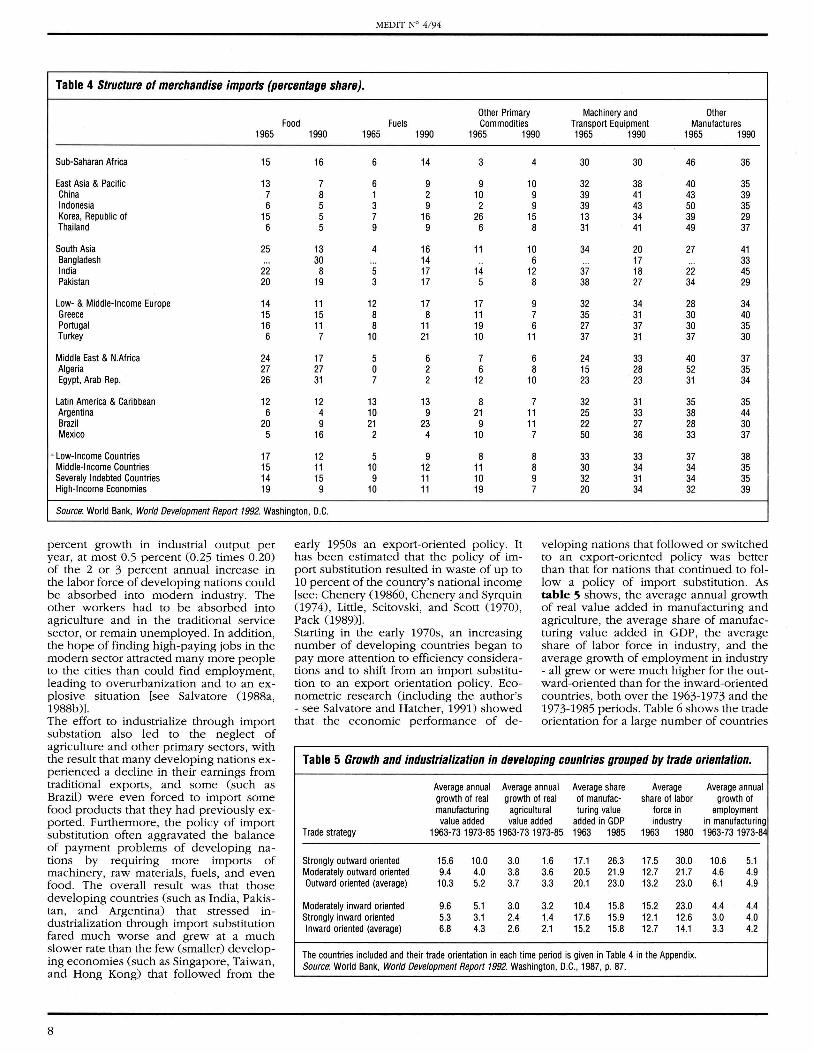
ports between 1965 and 1990, the exports of primary commodities remained substantial in 1990 in most cases. Table 4 shows the share of total imports of food, fuels, other primary commodities, machinery and transport equipment, and other manufactures in 1965 and 1990. The table shows much more stability in the various categories of imports as compared with exports between 1965 and 1990 for most country groups and individual countries listed. As expected, however, the share of developing countries' imports of manufactured goods remained very high as compared with their share of primary commodity imports both in 1965 and 1990.
Ill. Industrialization through import substitution versus export promotion
During the 1950s and 1960s most developing nations made a deliberate attempt to industrialize rather than continuing to specialize in the production of primary commodities (food, raw materials, and minerals) for export, as prescribed by traditional trade theory. Developing countries correctly believed that while continuing to specialize in the production of primary commodities would maximize
welfare in the short run, the resulting pattern of specialization and trade would relegate them to a subordinate position visa-vis developed nations, and keep them from reaping the dynamic benefits of industry and, therefore, from maximizing their welfare and growth in the long run . The dynamic benefits resulting from industrial production are a more trained labor force, more innovations, higher and more stable prices for the nation's exports, and higher income and employment for its people. If developing nations continued to specialize in primary commodities while developed nations specialized in manufactured products , all or most of the dynamic benefits of industry and trade would accrue to developed countries, leaving developing nations poor, undeveloped and dependent. This belief was reinforced by the empirical observation that all developed nations are primarily industrial while all developing countries are primarily agricultural or engaged in mineral extraction. During the 1950 and 1960s, most developing nations, particularly the larger ones, strongly opted for a policy of import substitution to industrialize. They protected their infant industries or stimulated their birth with effective tariff rates that rose sharply with the degree of processing. This was done at first to encourage the relatively simple step of assembling foreign parts,
1 7 7 0 1
22 27 47 13 19 17 56 56 29 27 1 1 34 0 11
37 56 57 27 22 20 3 44 0 16
5 36 65 29 33 1 ... 72 .. . 60 7 47 66 36 23 0 35 70 29 58
27 32 47 8 16 4 11 50 3 27
19 58 61 24 29 7 2 61 1 37
1 4 15 3 4 2 2 2 0 0 0 20 39 15 27
11 6 21 1 3 7 5 29 0 3
18 25
9 17 14 42
7 35 1 3 15 19 3 2
28 45 17 21 14 33 3 9 9 22 2 4
38 40 7 5
in the hope that subsequently more of these parts and intermediate products would be produced domestically (backward linkage) . Heavy protection of domestic industries also encouraged the establishment of tariff factories in developing nations.
_ The policy of industrialization through import substitution generally met with only limited success or with failure . Very high rates of effective protection, in the range of 100 to 200 percent or more, were common during the 1950s and 1960s in such nations as India, Pakistan, Argentina, and Brazil. These led to very inefficient domestic industries and very high prices for domestic consumers. Sometimes the foreign-currency value of imported inputs were greater than the foreign-currency value of the output produced (negative value added). Furthermore, the highest priority was usually given to construction of new factories and the purchase of new machinery, with the result of widespread idle plant capacity for lack of funds to import needed raw material and fuel. Heavy protection to industry also led to excessive capital intensity and relatively little labor absorption. In fact, it was entirely unrealistic to expect that import substitution could have solved the unemployment and underemployment problem of developing countries. For example, even with 25 percent of the labor force in industry and 20
7
MEDIT W 4/ 94
Table 4 Structure of merchandise imports (percentage share).
Other Primary Machinery and Other Food Fuels Commodities Transport Equipment Manufactures
1965 1990 1965 1990 1965 1990 1965 1990 1965 1990
Sub-Saharan Africa 15 16 6 14 3 4 30 30 46 36
East Asia & Pacific 13 7 6 9 9 10 32 38 40 35 China 7 8 1 2 10 9 39 41 43 39 Indonesia 6 5 3 9 2 9 39 43 50 35 Korea, Republic of 15 5 7 16 26 15 13 34 39 29 Thailand 6 5 9 9 6 8 31 41 49 37
South Asia 25 13 4 16 11 10 34 20 27 41 Bangladesh ... 30 ... 14 .. 6 ... 17 . .. 33 India 22 8 5 17 14 12 37 18 22 45 Pakistan 20 19 3 17 5 8 38 27 34 29
Low- & Middle-Income Europe 14 11 12 17 17 9 32 34 28 34 Greece 15 15 8 8 11 7 35 31 30 40 Portugal 16 11 8 11 19 6 27 37 30 35 Turkey 6 7 10 21 10 11 37 31 37 30
Middle East & N.Africa 24 17 5 6 7 6 24 33 40 37 Algeria 27 27 0 2 6 8 15 28 52 35 Egypt, Arab Rep. 26 31 7 2 12 10 23 23 31 34
Latin America & Caribbean 12 12 13 13 8 7 32 31 35 35 Argentina 6 4 10 9 21 11 25 33 38 44 Brazil 20 9 21 23 9 11 22 27 28 30 Mexico 5 16 2 4 10 7 50 36 33 37
• Low-Income Countries 17 12 5 9 8 8 33 33 37 38 Middle-Income Countries 15 11 10 12 11 8 30 34 34 35 Severely Indebted Countries 14 15 9 11 10 9 32 31 34 35 High-Income Economies 19 9 10 11 19 7 20 34 32 39
Source: World Bank, World Development Report 1992. Washington, D.C.
percent growth in industrial output per year, at most 0.5 percent (0.25 times 0.20) of the 2 or 3 percent annual increase in the labor force of developing nations could be absorbed into modern industry. The other workers had to be absorbed into agriculture and in the traditional service sector, or remain unemployed. In addition, the hope of finding high-paying jobs in the modern sector attracted many more people to the cities than could find employment, leading to overurbanization and to an explosive situation [see Salvatore 0988a, 1988b)]. The effort to industrialize through import substation also led to the neglect of agriculture and other primary sectors, with the result that many developing nations experienced a decline in their earnings from traditional exports, and some (such as Brazil) were even forced to import some food products that they had previously exported. Furthermore, the policy of import substitution often aggravated the balance of payment problems of developing nations by requmng more imports of machinery, raw materials, fuels, and even food. The overall result was that those developing countries (such as India, Pakistan, and Argentina) that stressed industrialization through import substitution fared much worse and grew at a much slower rate than the few (smaller) developing economies (such as Singapore, Taiwan, and Hong Kong) that followed from the
8
early 1950s an export-oriented policy. It has been estimated that the policy of import substitution resulted in waste of up to 10 percent of the country's national incom~ [see: Chenery 09860, Chenery and Syrquin (974), Little, Scitovski, and Scott (970), Pack (989)]. Starting in the early 1970s, an increasing number of developing countries began to pay more attention to efficiency considerations and to shift from an import substitution to an export orientation policy. Econometric research (including the author's - see Salvatore and Hatcher, 1991) showed that the economic performance of de-
veloping nations that followed or switched to an export-oriented policy was better than that for nations that continued to follow a policy of import substitution. As table 5 shows, the average annual growth of real value added in manufacturing and agriculture, the average share of manufacturing value added in GDP, the average share of labor force in industry, and the average growth of employment in industry - all grew or were much higher for the outward-oriented than for the inward-oriented countries, both over the 1963-1973 and the 1973-1985 periods . Table 6 shows the trade orientation for a large number of countries
Table 5 Growth and industrialization in developing countries grouped by trade orientation.
Average annual Average annual Average share Average Average annual growth of real growth of real of manufac- share of labor growth of manufacturing agricultural turing value force in employment value added value added added in GDP industry in manufacturing
Trade strategy 1963-731973-851963-731973-85 1963 1985 1963 1980 1963-731973-84
Strongly outward oriented 15.6 10.0 3.0 1.6 17.1 26.3 17.5 30.0 10.6 5.1 Moderately outward oriented 9.4 4.0 3.8 3.6 20.5 21.9 12.7 21.7 4.6 4.9 Outward oriented (average) 10.3 5.2 3.7 3.3 20.1 23.0 13.2 23.0 6.1 4.9
Moderately inward oriented 9.6 5.1 3.0 3.2 10.4 15.8 15.2 23.0 4.4 4.4 Strongly inward oriented 5.3 3.1 2.4 1.4 17.6 15.9 12.1 12.6 3.0 4.0 Inward oriented (average) 6.8 4.3 2.6 2.1 15.2 15.8 12.7 14.1 3.3 4.2
The countries included and their trade orientation in each time period is given in Table 4 in the Appendix. Source: World Bank, World Development Report 1992. Washington, D.C., 1987, p. 87.
for which data existed and its change between 1963-1973 and 1973-1985.
IV. Trade liberalization in developing countries
Starting in the early 1970s, an increasing number of developing countries, especially those that had opted for an inwardoriented strategy for industrialization during the 1950s and 1960s, began to liberalize trade. This involved some mixture of reduction and simplification of import tariffs, import taxation, and quantitative restrictions, as well as attempts to reduce impediments to exports. These trade-liberaliZing measures were intended to promote the more efficient use of resources in the country by (1) eliminating the static costs of protection (such as the higher prices paid by domestic consumers of the product), (2) overcoming xinefficiencies (i.e. , the cost associated with the "quiet life"), (3) taking away the incentive for such unproductive activities as lobbying to retain or impose trade regulations , (4) making economies of scale possible , and (5) stimulating the flow of investments and advanced technology from abroad . Some countries (such as Chile , Greece, Israel , Korea , New Zealand, Singapore, and Spain) conSistently pursued liberalization during the past two decades. Others (such as Argentina, Brazil , Columbia, Mexico , Pakistan, Peru, the Philippines , Sri Lanka, Turkey, and Yugoslavia) were not as consistent and their commitment to trade liberalization during some years wavered. In general, the majority of the more liberaliZing countries were smaller, had a higher per capita income, and were more politically stable than those countries that were less consistent in their liberalizing efforts. In addition, while the shift from an inward-oriented to an outward-oriented strategy can best be accomplished by removing existing trade barriers and devaluing the nation's currency, many countries (mostly in the second group that was less consistent in its liberalization efforts) used export incentives without eliminating or significantly redUCing their import barriers or devaluing their currency. As a result, the growth of their exports was half as large as that for the more liberaliZing countries. Furthermore, while exports grew at about the same rate as GDP in the less liberaliZing countries, exports grew Significantly faster than GDP in the more liberaliZing countries and, therefore , behaved more like the leading sector in the latter than in the former group of countries. Research conducted at the World Bank (1988) also showed that liberalization policies are more likely to be sustained in the long run if they are (1) initiated in the midst of macro-economic difficulties, (2) carried out in a crisis atmosphere and under international pressure , and (3)
MEDIT W 4/94
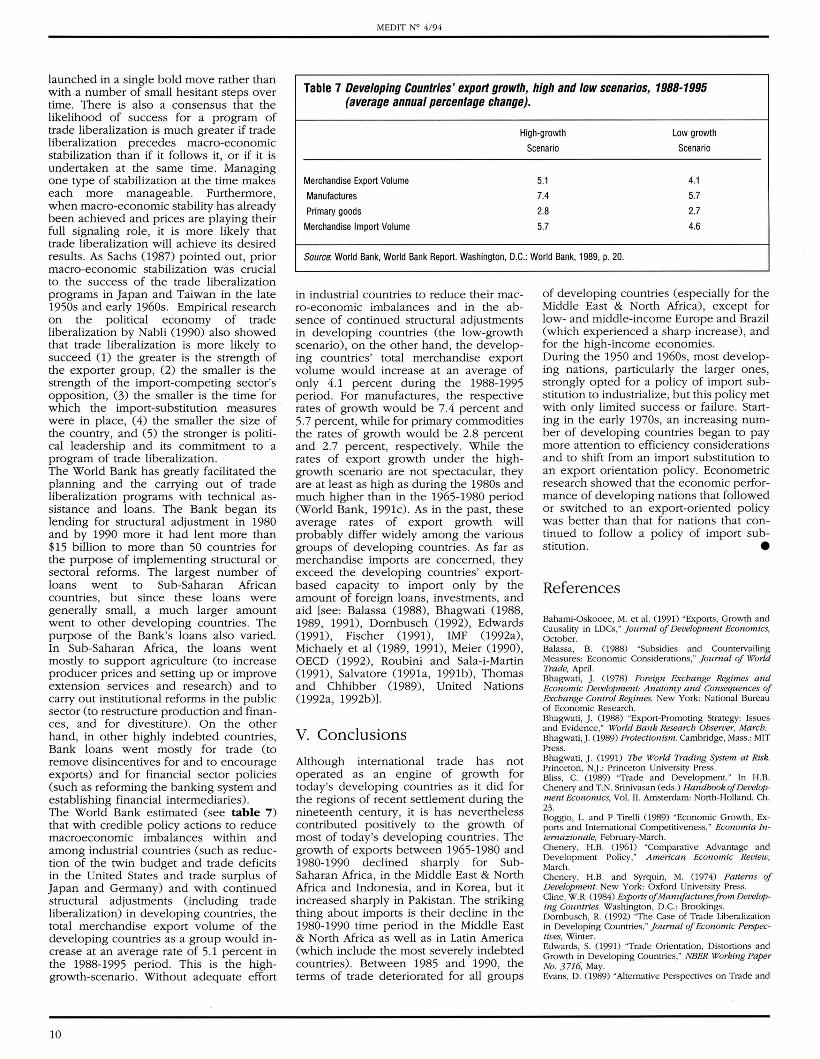
Table 6 Composition of trade-orientation country groups: 1963-1973 and 1973-1985.
Period I: 1963·1973
Strongly Outward Oriented: Korea, Rep. of, Singapore
Moderately Outward Oriented: ·Colombia, Israel, • Ivory Coast, Malaysia
Moderately Inward Oriented: El Salvador, Honduras, Kenya, Mexico, Nicaragua, ·Nigeria, Philippines, Senegal, ·Tunisia, Yugoslavia
Strongly Inward Oriented: Argentina, Bangladesh, ·Chile, Dominican Republic, India, ·Pakistan, Peru, ·Turkey, ·Uruguay, Zambia
Period 11. 1973-1985
Strongly Outward Oriented: Korea, Rep. of, Singapore
Moderately Outward Oriented: ·Chile, Israel, Malaysia, ·Tunisia, ·Turkey, ·Uruguay
Moderately Inward Oriented: ·Colombia, El Salvador, Honduras, · Ivory Coast, Kenya, Mexico, Nicaragua, • Pakistan, Philippines, Senegal, Yugoslavia
Strongly Inward Oriented: Argentina, Bangladesh, Dominican Republic, India, ·Nigeria, Peru , Zambia
·Refers to countries that changed trade orientation between the two time periods. Source: World Bank, World Development Report 1987, Washington, D.C.: World Bank, 1987, p. 83.
9
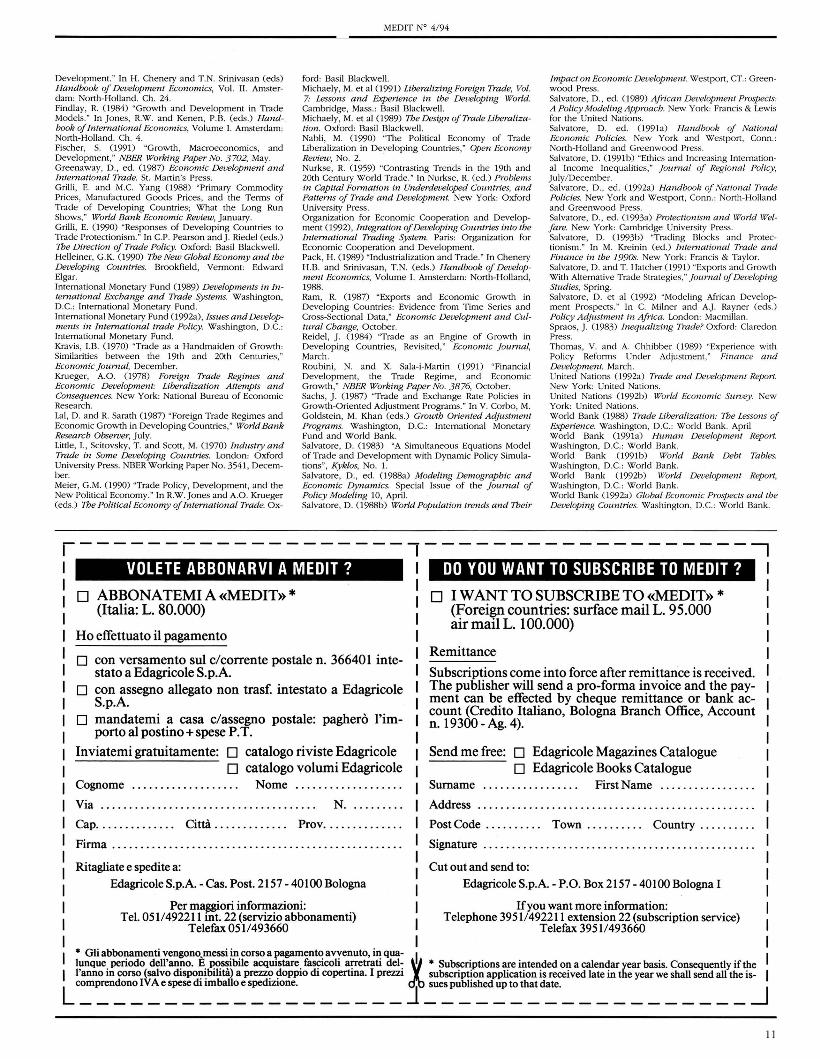
launched in a single bold move rather than with a number of small hesitant steps over time. There is also a consensus that the likelihood of success for a program of trade liberalization is much greater if trade liberalization precedes macro-economic stabilization than if it follows it, or if it is undertaken at the same time. Managing one type of stabilization at the time makes each more manageable . Furthermore, when macro-economic stability has already been achieved and prices are playing their full signa ling role, it is more likely that trade liberalization will achieve its desired results. As Sachs (987) pointed out, prior macro-economic stabilization was crucial to the success of the trade liberalization programs in Japan and Taiwan in the late 1950s and early 1960s. Empirical research on the political economy of trade liberalization by Nabli (990) also showed that trade liberalization is more likely to succeed 0) the greater is the strength of the exporter group, (2) the smaller is the strength of the import-competing sector's opposition, (3) the smaller is the time for which the import-substitution measures were in place , (4) the smaller the size of the country, and (5) the stronger is political leadership and its commitment to a program of trade liberalization. The World Bank has greatly facilitated the planning and the carrying out of trade liberalization programs with technical assistance and loans. The Bank began its lending for structural adjustment in 1980 and by 1990 more it had lent more than $15 billion to more than 50 countries for the purpose of implementing structural or sectoral reforms. The largest number of loans went to Sub-Saharan African countries, but since these loans were generally small, a much larger amount went to other developing countries. The purpose of the Bank's loans also varied. In Sub-Saharan Africa, the loans went mostly to support agriculture (to increase producer prices and setting up or improve extension services and research) and to carry out institutional reforms in the public sector (to restructure production and finances, and for divestiture). On the other hand, in other highly indebted countries, Bank loans went mostly for trade (to remove disincentives for and to encourage exports) and for financial sector poliCies (such as reforming the banking system and establishing financial intermediaries). The World Bank estimated (see table 7) that with credible policy actions to reduce macroeconomic imbalances within and among industrial countries (such as reduction of the twin budget and trade deficits in the United States and trade surplus of Japan and Germany) and with continued structural adjustments (including trade liberalization) in developing countries, the total merchandise export volume of the developing countries as a group would increase at an average rate of 5.1 percent in the 1988-1995 period. This is the highgrowth-scenario. Without adequate effort
10
MEDIT N" 4/ 94
Table 7 Developing Countries' export growth, high and low scenarios, 1988-1995 (average annual percentage change).
High-growth Low growth
Scenario Scenario
Merchandise Export Volume 5.1 4.1
Manufactu res 7.4 5.7
Primary goods 2.8 2.7
Merchandise Import Volume 5.7 4.6
Source: World Bank, World Bank Report. Washington, D.G.: World Bank, 1989, p. 20.
in industrial countries to reduce their macro-economic imbalances and in the absence of continued structural adjustments in developing countries (the low-growth scenario), on the other hand, the developing countries ' total merchandise export volume would increase at an average of only 4.1 percent during the 1988-1995 period. For manufactures, the respective rates of growth would be 7.4 percent and 5.7 percent, while for primary commodities the rates of growth would be 2.8 percent and 2.7 percent, respectively. While the rates of export growth under the highgrowth scenario are not spectacular, they are at least as high as during the 1980s and much higher than in the 1965-1980 period (World Bank, 1991c). As in the past, these average rates of export growth will probably differ Widely among .the various groups of developing countries . As far as merchandise imports are concerned, they exceed the developing countries' exportbased capacity to import only by the amount of foreign loans , investments , and aid [see: Balassa (988), Bhagwati 0988, 1989, 1991), Dornbusch (992) , Edwards (991), Fischer (991) , IMF 0992a), Michaely et al 0989, 1991), Meier (990), OECD (992), Roubini and Sala-i-Martin (991), Salvatore 0991a, 1991b), Thomas and Chhibber (989), United Nations 0992a, 1992b)].
V. Conclusions
Although international trade has not operated as an engine of growth for today's developing countries as it did for the regions of recent settlement during the nineteenth century, it is has nevertheless contributed positively to the growth of most of today's developing countries. The growth of exports between 1965-1980 and 1980-1990 declined sharply for SubSaharan Africa , in the Middle East & North Africa and IndoneSia , and in Korea , but it increased sharply in Pakistan. The striking thing about imports is their decline in the 1980-1990 time period in the Middle East & North Africa as well as in Latin America (which include the most severely indebted countries) . Between 1985 and 1990, the terms of trade deteriorated for all groups
of developing countries (especially for the Middle East & North Africa), except for low- and middle-income Europe and Brazil (which experienced a sharp increase), and for the high-income economies. During the 1950 and 1960s, most developing nations, particularly the larger ones, strongly opted for a policy of import substitution to industrialize , but this policy met with only limited success or failure. Starting in the early 1970s, an increasing number of developing countries began to pay more attention to efficiency considerations and to shift from an import substitution to an export orientation policy. Econometric research showed that the economic performance of developing nations that followed or switched to an export-oriented policy was better than that for nations that continued to follow a policy of import substitution. •
References
Bahami-Oskooee, M. et al. (1990 "Expo rts, Growth and Causality in LDCs," Journal of Development Economics, October. Balassa , B. (1988) "Subsidies and Countervailing Measures: Economic Considerations," Journal of World Trade, April. Bhagwati, J. (1978) Foreign Exchange Regimes and Economic Development: Anatomy and Consequences of .Exchange Control Regimes. New York: National Bureau of Economic Research. Bhagwati, J. (1988) "Export-Promoting Strategy: Issues and Evidence," World Bank Research Observer, March. Bhagwati,J. (1989) Protectionism. Cambridge , Mass. : MIT Press. Bhagwati, J. (1990 The World Trading System at Risk. Princeton, N.J .: Princeton Unive rsity Press. Bliss, C. (1989) "Trade and Deve lopment. " In H.B. Chenery and T. N. Srinivasan (eds.) Handbook of Development EconomiCS, Vo l. II . Amsterdam: North-Holland. Ch. 23. Boggio, L. and P Tirelli (1989) "Economic Growth, Exports and Inte rnational Competitiveness," Economia Internaz ionale, February-March. Chenery, H.B. (1961) "Comparative Advantage and Development Policy," American Economic Review, March. Chenery, H.B. and Syrquin, M. (1974) Patterns of Development. New York: Oxford Unive rsity Press. Cline , W.R. (1984) Exports of Manufactures from Developing Countries. Washington, D.C.: Brookings . Dornbusch , R. (1992) "The Case of Trade Liberalization in Deve loping Countries," Journal of Economic Perspectives, Winter. Edwards, S. (1991) "Trade Orientation, Distortions and Growth in Developing Countries," NBER Working Paper No. 3 716, May. Evans, D. (989) "Alte rnative Pe rspectives on Trade and
Develo pment. " In H. Chenery and T N. Srinivasan (eds) Handbook of Development Economics, Vol. 11. Amsterdam: North-Holland . Ch . 24. Findlay, R (984) "Growth and Developme nt in Trade Models. " In Jones, R.W. and Kenen , P.B. (eds.) Ha ndbook of International Economics, Volume I. Amsterdam: North-Holland. Ch. 4. Fische r, S. ( 991) "Growth, Macroeconomics, and Development," NBhl? Working Paper No. 3 702, May. Greenaway , D., ed. (987) Economic Development and International Trade. St. Martin 's Press. Grilli , E. and M.C. Yang (988) "Primary Commodity Prices, Manufactured Goods Prices, and the Te rms of Trade of Developing Countries; What the Long Run Shows," World Bank Economic Review, January. Grilli , E. (990) "Responses of Develo ping Countries to Trade Protectionism." In e.P. Pearson and ). Riede l (eds.) The Direction of Trade Policy. Oxford: Basil Blackwell . He lle iner, G. K. ( 990) The New Global Economy and the Develop ing Countries. Brookfield, Vermont: Edward Elgar. Internat ional Monetary Fund (989) Developments in International Exchange and Trade Systems. Washington, D.e.: International Monetary Fund. International Monetary Fund 0992a), Issues and Develop ments in International trade Policy. Washington , D.e.: International Monetary Fund. Kravis, I.B. ( 970) "Trade as a Handmaiden of Growth : Similarities between the 19th and 20th Centuries," Economic j ournal, Decembe r. Krueger, A.O. (978) Foreign Trade Regimes and Economic Development: Liberalization Attempts and Consequences. New York: Natio nal Bureau of Econo mic Research. Lal, D. and R Sarath (987) "Fore ign Trade Regimes and Economic Growth in Developing Countries," World Bank Research Observer, July. Little, I. , Scitovsky, T and Scott, M. (970) Industry and Trade in Some Developing Countries. Londo n: Oxford University Press. NBER Working Paper No. 3541, December. Me ier, G.M. ( 990) "Trade Policy, Developme nt, and the New Political Economy. " In RW. Jones and A.O. Krueger (eds.) The Political Economy of International Trade. Ox-
MEDIT N° 4/ 94
fo rd: Basil Blackwell . Michaely, M. et al ( 991) liberaliz ing Foreign Trade, Vo/. 7: Lessons and Experience in the Developing World. Cambridge, Mass.: Basil B1ackwell . Michaely, M. et al (989) The Design of Trade Liberalization.. Oxford : Basil B1ackwell . Nabli, M. ( 990) "The Political Economy of Trade Liberalization in Developing Countries," Open Economy Review, No. 2. Nurkse, R ( 959) "Contrasting Trends in the 19th and 20th Century World Trade." In Nurkse, R (ed .) Problems in Capital Formation in Underdeveloped Countries, and Patterns of Trade and Development. New York: Oxford University Press. O rganization for Economic Cooperation and Developme nt (992) , Integration of Develop ing Countries into the International Trading System. Paris: Organizatio n fo r Econo mic Cooperation and Developme nt. Pack, H. (989) "Industrialization and Trade." In Che nery H.B. and Srinivasan, T N. (eds.) Handbook of Develop ment Economics, Volume I. Amsterdam: North-Holland, 1988. Ram, R (987) "Exports and Economic Growth in Developing Countries: Evidence from Time Series and Cross-Sectio nal Data ," Economic Develop ment and Cultural Change, October. Reide l, ). (984) "Trade as an Engine of Growth in Developing Countries, Revisited ," Economic j ournal, March . Roubini , N. and X. Sala-i-Martin ( 991) "Financial Development, the Trade Regime, and Economic Growth ," NBhl? Working Paper No. 3876, October. Sachs , ). (987) "Trade and Exchange Rate Policies in Growth-Orie nted Adjustme nt Programs." In V. Corbo , M. Goldstein, M. Khan (eds.) Growth Oriented Adjustment Programs. Washington, D.e.: Inte rnatio nal Mone tary Fund and World Bank. Salvato re , D. (983) "A Simultaneous Equations Model of Trade and Development with Dynamic Policy Simulations", Kyklos, No. 1. Salvatore, D., ed . 0988a) Modeling Demograpbic and Economic Dynamics. Special Issue of the Journal of Policy Modeling 10, April. Salvatore , D. 0988b) World Population trends a nd Their
Impact on Economic Development. Westport , CT.: Greenwood Press. Salvatore , D., ed . (989) African Development Prospects: A Policy Modeling Approach. New York : Francis & Lewis for the United Natio ns. Salvatore , D. ed . (1991a) Handbook of National Economic Policies. New York and Westport , Conn.: North-Holland and Greenwood Press. Salvatore , D. (1991b) "Ethics and Increasing Inte rnational Income Inequalities, " journal of Reg ional PoliCY, July/ December. Salvatore, D., ed . (1992a) Handbook of National Trade Policies. New York and Westport , Conn.: Nonh-Holland and Greenwood Press. Salvatore , D., ed . (1993a) Protectionism and Wor/d Welfare. New York: Cambridge University Press. Salvatore , D. (1993b) "Trading Blocks and Protectio nism." In M. Kre inin (ed.) International Trade and Finance in the 1990s. New York: Francis & Taylor. Salvatore , D. and T Hatcher (1991) "Exports and Growth With Alte rnative Trade Strategies," j ou.rnal of Developing Studies, Spring. Salvatore , D. et al (1992) "Modeling African Development Prospects." In e. Milner and A.]. Rayner (eds.) Policy Adjustment in Af rica. Londo n: Macmillan . Spraos, J . (983) Inequ.alizing Trade? Oxfo rd : Claredo n Press. Tho mas, V. and A. Chhibber (989) "Experience with Policy Reforms Under Ad justment," Finance and Development. March. United Nations 0992a) Trade and Development Report. New York: United Nations. United Nations (1992b) World Economic Survey. New York: United Natio ns. World Bank ( 988) Trade Liberalization: The Lessons of Experience. Washingto n, D.e.: World Bank. April World Bank 0991a) Human Development Repo/1. Washington, D.e. : World Bank. World Bank 0 991b) World Bank Debt Tables. Washington, D.e.: World Bank. World Bank 0992b) Wo /id Development Report, Washington, D.e. : World Bank. World Bank (1992a) Global Economic Prospects and the Develop ing Countries. Washington, D.e.: World Bank.
----------------------------------------, VOLETE ABBONARVI A MEOIT ?
D ABBONATEMI A «MEDIT» * (Italia: L. 80.000)
Ho effettuato il pagamento
o con versamento sui c/corrente postale n. 366401 intestato a Edagricole S.p.A.
o con assegno allegato non trasf. intestato a Edagricole S_p_A.
o mandatemi a casa c/assegno postale: paghero l'importo al postino + spese P. T.
Inviatemi gratuitamente: 0 catalogo riviste Edagricole o catalogo volumi Edagricole
Cognome Nome __ . ____ . __ . . _. __ . _.
Via _____ ... ____ __ .. _ ... __ .... _. _ .. _ . . _ ... N. __ _____ _ _
Cap_ . _ . ___ __ . . . . . Citta _ . . _ .. . .. _ . _ _ Prov. _ . _ . . _ .. _ .. _ .
Firma .. _ . ___ ... _ . _____ ______ ____ ______ _____ . __ . __ . _ . . _ . _
Ritagliate e spedite a: Edagricole S.p.A - Cas_ Post 2157 - 40100 Bologna
Per maggiori informazioni: TeL 0511492211 into 22 (servizio abbonamenti)
Telefax 0511493660
* Gli abbol).amenti ,:engono,messi !no corso a pagament~ a~enuto, i~ qua-
DO YOU WANT TO SUBSCRIBE TO MEDlT ?
D I WANT TO SUBSCRIBE TO «MEDIT» * (Foreign countries: surface mail L. 95.000 air mail L. 100.000)
Remittance
Subscriptions come into force after remittance is received. The publisher will send a pro-forma invoice and the payment can be effected by cheque remittance or bank account (Credito Italiano, Bologna Branch Office, Account n. 19300 - Ag. 4)_
Send me free: 0 Edagricole Magazines Catalogue o Edagricole Books Catalogue
Surname FirstName .. ___ . __ ____ .. __ .
Address ___ _ .. _ .. . _ .. . ____ _ ... . . . __ ... ___ ... ..... . . __ ... _
PostCode ____ . _. _. _ Town _ . .. . . _ ... Country. ___ .. . __ .
Signature ....... . _ . .. _ ...... __ . ___ ... _ . _ . . ... _ . _ .. . __ _ . __
Cut out and send to:
Edagricole S.p.A - P_O. Box 2157 - 40100 Bologna I
If you want more information: Telephone 39511492211 extension 22 (subscription service)
Telefax 395 11493660
I anno m corso (salvo dispo~bilita) a prezz~ ~OpplO di copert1Oa_ I preZZl subscription application is received late in the year we shall send all the is-I~nque . penodo dell aJl!l0. E. ~s~lbile acqwstare. fa~lcoh ~etratl del: 1 * Subscriptions are intended on a calendar year basis. Consequently if the
comprendono IV A e spese di 1mballo e spedizlOne. sues published up to that date. L ___________________ ] ___________________ ~
11