Embed Size (px)
Citation preview
No 1997 – 07April
Trade Patterns Inside the Single Market
_____________
Lionel FontagnéMichael Freudenberg
Nicholas Péridy

CEPII, document de travail n° 97-07
3
TABLE OF CONTENTSRESUME 5SUMMARY 9INTRODUCTION 111. WHY AND HOW AN EX POST STUDY ON TRADE PATTERNS WITHIN THEEU? 14
1.1. Why a study on trade effects of the Single European Market? 141.2. How to measure intra-EC trade patterns? 16
1.2.1. Nature of intra-EC trade flows 161.2.2. Specialisation along quality ranges 17
1.3. How to capture the impact of the SEM on intra-EC trade patterns? 171.3.1. Determinants 181.3.2. Anti-monde 181.3.3. Main features of the econometric model 19
2. THE NEW INTERNATIONAL ECONOMICS AND THE GAINS FROMINTERNATIONAL INTEGRATION 19
2.1. A unified definition of what a product is 222.2. The integrated equilibrium 232.3. Externalities 242.4. Internal economies of scale 262.5. Vertical versus horizontal differentiation 272.6. Factor mobility and trade types 282.7. The Internal Market and the gains from integration 29
3. INTRA-EC TRADE PATTERNS: 1980-1994 343.1. Methodology and data 35
3.1.1. Methodology 353.1.2. Harmonisation of trade data 39
3.2. Overall picture of the patterns of trade in all intra-EC trade 403.3. Analysis of industries 41
3.3.1. Share of industries in total intra-EC trade 413.3.2. Evolution of the GL indicator by industry 433.3.3. Evolution of trade types by industry 44
3.4. Analysis of member states 493.4.1. Share of member states in total intra-EC-trade 493.4.2. Evolution of the GL indicator by country 513.4.3. Evolution of trade types by country 533.4.4. Analysis of price/quality ranges by country 63
4. ECONOMETRIC METHODOLOGY 774.1 How to explain intra-EC trade patterns? 77
4.1.1. The determinants of intra-EC trade patterns 784.1.2. The model 79

Trade patterns inside the Single Market
4
4.2. The database of explanatory variables 824.2.1. Country variables 824.2.2. Market structure variables 844.2.3. Variables associated with European integration 88
4.3 The estimates 954.3.1. Feasibility study 954.3.2. The final model 97
5. TRADE PATTERNS AND THE SINGLE MARKET 985.1. The potential effects of the Single Market 995.2. The general determinants of intra-EC trade patterns 102
5.2.1. Overview of the results 1025.2.2. Intra-industry trade in horizontal differentiation 1035.2.3. Intra-industry trade in vertical differentiation 1055.2.4. Inter-industry trade 106
5.3. The impact of the Single Market 1075.3.1. What do we know about the story? 1075.3.2. Synthesis 1095.3.3. Where NTBs boosted IIT 1105.3.4. The impact of reduced transaction costs 1125.3.5. Where size matters 1145.3.6. Where FDI did not displace trade 1185.3.7. Accession or completion? 1185.3.8. Single market without a single currency 123
CONCLUSION 124APPENDIX : NOMENCLATURES 131BIBLIOGRAPHY 136LIST OF WORKING PAPERS RELEASED BY CEPII 143

CEPII, document de travail n° 97-07
5
RESUME
En dépit de la mise en place du Marché commun, l'intégration économiqueeuropéenne était restée inachevée, de sorte que l’on évoquait, au milieu des années quatre-vingt, les “coûts de la non-Europe”. Aussi le Livre Blanc sur le Marché unique de 1985prévoyait-il quelque 300 mesures visant à libéraliser le commerce de biens et services etles mouvements de facteurs : suppression des barrières non tarifaires ayant résisté auMarché commun, suppression des formalités aux frontières, libéralisation des marchéspublics, reconnaissance mutuelle des normes, déréglementation et intégration financières,libre circulation des personnes.
Une batterie d'études ex ante, synthétisées dans le rapport Cecchini, justifiait cetobjectif d'intégration accrue : l'achèvement du marché intérieur, parce qu'il renforçait laconcurrence, devait favoriser la réallocation des ressources vers les emplois efficaces, etpermettre la réalisation d'économies d'échelle. La suppression des dernières entraves aucommerce devait déboucher sur une forte croissance des échanges intra-communautaires,augmenter le bien-être de la Communauté et renforcer sa compétitivité vis-à-vis des paystiers.
Même si le commerce international per se n’était pas au coeur des études ex ante,l’hypothèse implicite était que la libéralisation commerciale devait augmenter les échangesen Europe, et qu’une grande partie de cette progression serait un commerce intra-branche,c’est-à-dire un accroissement simultané des exportations et importations au sein desmêmes branches. Les coûts d’ajustement liés à un tel commerce sont généralementconsidérés comme beaucoup plus faibles que ceux liés à une spécialisation inter-branche,entraînant la concentration des activités économiques sur un nombre limité de secteurs etl’abandon des autres. Ce scénario optimiste était basé sur l'expérience acquise lors de lamise en place du Marché commun: contrairement aux théories traditionnelles quiassociaient intégration et commerce inter-branche, les premières études des annéessoixante ont mis en évidence de forts échanges intra-branche entre pays européens.
Quarante ans après la mise en place du Marché commun, on se propose -à lalumière des développements récents des théories du commerce international- de dresser unbilan du commerce intra-européen et d'évaluer, ex post, l'impact du Marché unique.
L'analyse proposée ici repose sur deux innovations importantes : le niveau de détailauquel les flux de commerce sont examinés et une nouvelle typologie du commerce. Ceréexamen est entrepris sur la base des statistiques de commerce pour 10 000 produits. Lecommerce est décomposé en trois types : commerce inter-branche, commerce intra-branche de produits différenciés horizontalement (produits de même niveau de prix), enfincommerce intra-branche de produits différenciés verticalement (produits de qualité, etdonc de prix différents). Comme attendu, ce sont bien les échanges intra-branche qui ontpris leur essor pendant cette période. Le scénario d'une concentration de certainesbranches dans un petit nombre de pays ne s'est donc pas globalement concrétisé. Mais,contrairement aux conclusions suggérées par les études ex ante, la part du commerceintra-branche de produits différenciés horizontalement est restée relativement stable,tandis que celle du commerce intra-branche de produits différenciés verticalement s'est

Trade patterns inside the Single Market
6
développée rapidement, jusqu'à représenter le principal type de commerce en 1994. De cefait, l'intégration profonde des économies au sein du Marché unique n'a pas, jusqu'ici,induit de fortes spécialisations. Ainsi, l'Espagne et le Portugal ont réussi leur intégrationdans l'échange intra-communautaire en s'éloignant d'un schéma de spécialisationrésiduelle sur les activités (intensives en travail) abandonnées par les pays membres plusavancés.
Toutefois, la prépondérance d'un commerce intra-branche de produits différenciésverticalement, plutôt qu'horizontalement, suggère une division qualitative du travail àl'intérieur de la Communauté. Les ajustements se font au sein des branches sur les gammesde qualité, plutôt qu'entre les branches.
Cette progression du commerce intra-branche tient à de multiples déterminants,repérés ici au moyen d’un modèle économétrique à quatre dimensions (pays, partenaires,branche, temps) combinant des variables explicatives relatives aux pays (avantagecomparatif, taille etc.), aux structures de marché (économies d’échelle, différenciation) età l’intégration européenne (barrières non tarifaires par exemple). On met en particulier enévidence que la part des échanges intra-branche en différenciation verticale est en relationpositive avec la distance économique entre partenaires, un résultat jusqu’ici plutôt associéà l’échange inter-branche. En ce sens les coûts d’ajustement associés à l’intra-branche endifférenciation verticale ne sont certainement pas négligeables.
Les mesures prises en vue de mettre en place le Marché unique n'ont toutefois euqu'une influence limitée dans cette évolution de la nature des échanges intra-communautaires.
Cinq résultats principaux peuvent être tirés de l'analyse. Tout d'abord, les effetsdirects sur le commerce intra-branche des mesures prises lors de la création du Marchéunique sont restés limités. La suppression des formalités aux frontières représente un chocclairement identifiable qui s'est inscrit dans une tendance plus générale de recul des coûtsde transaction favorisant le commerce intra-branche. En revanche, la suppression desbarrières non tarifaires semble avoir favorisé le développement des échanges inter-branche, peut-être parce qu'elle a réactivé le processus de spécialisation des pays membres.Enfin, le phénomène d'agglomération spatiale des industries -source potentielle dedivergence en Europe- n'apparaît pas globalement, mais s'est manifesté dans certainesbranches, comme la chimie ou l'automobile, par ailleurs fortement marquées par lesbarrières non tarifaires.
Ce sont donc des déterminants plus généraux qui ont joué. Ainsi la taille desmarchés autorise-t-elle à la fois une plus grande variété de produits et un spectre de qualitéplus étendu, et ceci d'autant plus qu'il s'agit de pays à niveau de vie élevé. Les économiesd'échelle justifient la spécialisation des unités de production ce qui tend à accroître leséchanges intra-branche ; ce type de spécialisation est favorisé par les fusions-acquisitionsintra-européennes. Tous ces mécanismes, qui peuvent avoir été indirectement facilités par
CEPII, document de travail n° 97-07
7
le Marché unique, se sont donc conjugués pour renforcer le caractère intra-branche ducommerce communautaire.
Au total, les premières années de fonctionnement du Marché Unique n'ont validé niles attentes les plus optimistes des travaux ex ante, où le développement des échanges devariétés permettait d'éviter les coûts d'ajustements, ni le scénario de spécialisationaccroissant les asymétries entre pays européens. C'est bien à l'intérieur des branches queles ajustements se sont faits de façon prioritaire, sur les niveaux de qualité. Ceci suggèrequ’une division qualitative du travail s’est renforcée en Europe, dans laquelle des paysaussi différents que l'Irlande -au bénéfice d'implantations étrangères- ou l'Allemagne sontspécialisées dans le haut de gamme, tandis que les pays du Sud de l'Europe sont spécialisésdans les produits de bas et de moyenne gamme.

Trade patterns inside the Single Market
8

CEPII, document de travail n° 97-07
9
SUMMARY
Despite the implementation of the Common Market, European economic integrationstill remained unachieved in the mid-1980s. The "costs of Non-Europe" were addressed inthe White Paper of 1985, proposing some 300 measures to promote the liberalisation oftrade in goods and services and of factor movements, such as the cancellation of borderformalities and non tariff barriers having survived the Common market, the liberalisationof public procurement practices, the mutual recognition of technical standards, andfinancial integration and deregulation, the free movement of citizens.
Ex ante studies -synthesised in the Cecchini report- suggested that the SingleMarket would tend to lower prices through increased competition, induce market structuretransformations, and foster a concentration of resources in more efficient uses. Theseeffects would translate into sizeable welfare gains, increases in GDP, and increasedcompetitiveness vis-à-vis non-member countries.
Even if trade per se was not the core of ex ante studies, the implicit assumption wasthat trade liberalisation would translate into an increase in trade flows within theCommunity, and that most of this increase would be intra-industry trade (IIT), i.e.simultaneous exports and imports within the same industries. Adjustment costs in thatcase are generaly considered to be much smaller than those associated with an inter-industry specialisation driving towards a concentration of economic activity on a limitednumber of industries and the abandon of others. This optimistic reasoning was built uponthe experience of the implementation of the Common Market: contrasting with theconclusions of a traditional theory of international trade linking integration and inter-industry trade, the European integration was accompanied by a sharp increase in intra-industry trade.
New developments in international trade theory, such as agglomeration economiesor the vertical differentiation of products need to be taken into account when assessing theSingle market and giving an overview of intra-European trade patterns
Bilateral intra-European trade flow statistics for some 10,000 products are used inorder to break down trade into three categories: inter industry trade, intra-industry trade inhorizontally differentiated products and, finally, intra-industry trade in verticallydifferentiated products (products of different quality). As expected, intra-industry trade hasincreased since the mid-1980s: thus, on the whole, this evidence does not support apossible scenario of concentration of industries in a limited number of countries.Contrasting with the conclusions of ex ante studies, the share of intra-industry trade ofvarieties has remained remarkably stable over time, whereas the share of intra-industrytrade of qualities has increased rapidly, and is now the most important trade type in intra-European trade. As a result, the deep integration of European economies has not so farimplied deep specialisation. Spain and Portugal have successfully managed their opennessto European competition withdrawing from a scheme of residual specialisation in those(labour intensive) activities abandoned by the core countries.

Trade patterns inside the Single Market
10
Nevertheless the importance of intra-industry trade in qualities, and not in varieties,suggests a qualitative division of labour within the Community. Adjustments are takingplace within industries along the quality spectrum, rather than between industries.
The increase in intra-industry trade is the result of numerous determinants, hereidentified using an econometric model having four dimensions (country, partner, industry,time) and combining explanatory variables on country characteristics (comparativeadvantage, size etc.), market structure (returns to scale, product differentiation), andEuropean integration (non tariff barriers for example). One of the main conclusion is thatthe share of IIT in vertically differentiated products increases with the economic distancebetween countries, a result so far rather associated to inter-industry trade. This suggeststhat the adjustment costs associated with intra-industry trade in vertically differentiatedproducts are all but negligible.
The Single market in itself has only had a limited direct impact on this evolution ofintra-EC trade patterns.
The cancellation of boarder formalities represents a visible shock, reinforcing themore general trend of decreasing transaction costs pushing towards IIT. In contrast, thecancellation of non tariff barriers seems to favour inter-industry trade, possiblyrevigorating the specialisation process among member countries. Finally -despite evidencefor industries like chemicals and automobiles- there is no evidence of generalisedagglomeration economies potentially fuelling asymmetries among member states.
In total, more general determinants are at work. For example, the market sizefavours more variety as well as a larger quality spectrum, especially for rich countries.Returns to scale also lead to a higher share of IIT, a phenomenon reinforced by the waveof intra-European mergers and acquisitions. These factors, which may be indirectlyassociated to the Single market, have thus contributed to reinforce the intra-industrynature of intra-EC trade.
Thus, so far, the first years of the Single market have neither validated theoptimistic scenario entailed in ex ante studies, nor led to a more pronounced specialisationof European members potentially associated with cohesion costs. Adjustments have takenplace within industries, on the quality spectrum. This suggests that a qualitative divisionof labour has emerged in Europe, in which countries as different as Ireland (due to inwardforeign direct investment) and Germany are specialised on up-market products, whereasSouthern member states are specialised on the low and medium quality segments.

CEPII, document de travail n° 97-07
11
TRADE PATTERNS INSIDE THE SINGLE MARKET1
Lionel Fontagné, Michael Freudenberg, Nicolas Péridy2
INTRODUCTION
The programme to complete the Single European Market (SEM), implemented inthe mid-1980s, has introduced major changes to the European economies.
The measures taken consist mainly of a liberalisation of trade in products andservices, through a cut of Non Tariff Barriers (NTBs), cancellation of border formalities,liberalisation of public procurement practices, and the mutual recognition of technicalstandards. Also included are the liberalisation of factor movements, notably throughfinancial deregulation and integration; as well as deregulation of sectors formerly subjectto tight national regulation.
The reasoning behind these measures was that liberalisation would tend to lowerprices through increased competition, induce market structure transformations, and fostera concentration of resources in more efficient uses. These effects would translate intosizeable welfare gains, increases in GDP, and increased competitiveness vis-à-visnon-member countries.
To overcome the potential problem of cohesion in the Community, Structural Fundswere boosted in order to foster a convergence in real income levels and to facilitateindustrial conversions in sensitive sectors. Lastly, this entire process was implementedwithin the clear perspective of a monetary union.
Most ex ante studies to assess the gains from integration were to a large extentbased on economies of scale.3 Trade was not the focus of these studies and, so far, nofully-fledged quantitative evaluation of the effects of 1992 on both the volume andcomposition of trade has been undertaken. Nevertheless, the implicit assumption of moststudies was that the removal of the remaining barriers to the mobility of goods wouldtranslate into an increase in trade flows within the Community, and that most of thisincrease would be of the intra-industry type, i.e. simultaneous exports and imports withinindustries.4 Intra-industry trade, based upon the similarity of nations, may lead to cost
1 This is a revised and shortened version of a study prepared for the European Commission within the framework ofthe ex post evaluation of the Single European Market. The initial study what is going to be published by the EC underthe same title included a chapter on a case study on Spain, by E. Gordo (Universidad Complutense de Madrid) and C.Martin (Universidad Complutense de Madrid and FIES), which is not reproduced here.The authors are indebted to Pier-Carlo Padoan (University of Rome and CER) and Dieter Schumacher (DIW-Berlin)who accepted to serve as scientific advisers and who made helpful comments and suggestions. They would also like tothank Deniz Ünal-Kesenci who has been involved in the early stages of the project, Michel Fouquin andJean Pisani-Ferry who supported the project and made helpful suggestions, Pascal Bernard who has participated in theeconometric work, Eric Vanhaelewyn who kindly compiled and provided data on M&A in Europe, and Daniel Gros,Peter Holmes and David Neven who have been highly helpful referees.2 Nicolas Péridy est maître de conférence à l'Université de Nantes.3 See the Cecchini report.4 Emerson et al. (1990, Chap. 6).

Trade patterns inside the Single Market
12
free adjustments, increased efficiency and welfare gains associated with variety. Incontrast, inter-industry trade, traditionally associated with comparative advantages ofnations, may lead to more costly adjustments, as trade and specialisation move factorsfrom contested export-oriented industries.
At the same time, ex ante studies expected that not all sectors and member stateswould be affected in the same way.5
(a) For sensitive sectors with important NTBs in the "pre-completion" situation,conversion costs, implying factor mobility, possibly sunk costs, and cohesion costs,were therefore predicted.
(b) The sectoral adjustment occurring in the less developed member states were farfrom clear. One possible adjustment is an increased specialisation alongcomparative advantages giving rise in inter-industry trade, whereas a convergencein production structures should increase intra-industry trade. Trade would therebycontribute to reducing the asymmetries in production and trade structures amongthe member states.
Recent development in international trade theory complicate the traditionalrelationship between trade structure and the correlative adjustments in productionstructures. As a result the debate on trade patterns in Europe might be less clear thansuggested by the traditional association referred to above, of painful adjustments withinter-industry trade, and cost free adjustments with intra-industry trade.
(a) Determinants and consequences of intra-industry trade in horizontallydifferentiated products are different from those in vertical differentiation. In theformer case, products sold at the same price are perfect substitutes, while in thesecond a common ranking of consumer preferences can be associated withdifferences in quality. In the latter case, the adjustment costs associated with anincrease in intra-industry trade might be sizeable, since it might not be equivalentto specialise in high or low quality products in the same industry. This suggeststhat our investigation must not only capture changes in the intra versus inter-industry nature of trade flows, but also distinguish intra-industry trade inhorizontal product differentiation (exchange of varieties) and intra-industrytrade in vertical differentiation (exchange of qualities).
(b) Inter-industry trade is no longer exclusively based upon comparative advantages:economies of mono-location or agglomeration, spillover effects, or more generallythe country size (and differences in size) do matter. Agglomeration economiesmight increase inter-industry trade, in the same manner as in the United States,where states and regions exhibit a high degree of industrial specialisation.6
(c) Concerning factor mobility, the convergence hypothesis7 leads to a complexrelationship between FDI, trade values and trade structure: as countries converge,
5 European Commission (1990b).6 Krugman (1993).7 Markusen and Venables (1995).

CEPII, document de travail n° 97-07
13
multinational firms might displace trade. As pointed out by Markusen (1995), aninternational mobility of capital -associated with multinational companies- mightlead to a trade displacement: in that case decreasing values of inter-industry tradewould translate in an increasing share of IIT, as affiliates increase their sales.Therefore, an important issue is whether factor mobility has been, or not, asubstitute to trade flows (due to increasing affiliates' sales) as a result of the singlemarket completion.
As a result, this study first addresses the following questions:
(a) What evolution of intra-EC trade patterns can be observed over 1980-1994? Has thecompletion of the SEM been associated with increased trade flows among memberstates on an inter-industry or intra-industry basis?
(b) In case of an increase in intra-industry trade, does it concern mostly horizontally orvertically differentiated goods?
(c) On which quality segments are the member states positioned?
In order to isolate the effects of the SEM, we estimate the impact of determinantsassociated or not with the SEM:
(a) What are the "natural" determinants of these intra-EC trade patterns?(b) Controlling for these factors, what have been the effects of (i) the cancellation of
border formalities, (ii) the reduction of transaction costs, (iii) the phasing-out ofNTBs, and (iv) the correlative factor mobility on the nature of intra-EC trade flows?
(c) And, finally, what would be the impact of a real convergence between memberstates?
These questions are important as variations in trade patterns among member statescan be expected to provide important information about the nature and the size of theeffects of the Single Market on production structures, and thereby give indirect indicationsabout the magnitude of efficiency gains achieved so far. Turning to the catching-up issue,observing trade patterns inside the Single Market should help clarify whether the degree ofstructural asymmetry among member states can be expected to increase or to decrease as aconsequence of the SEM. This is an important issue for determining whether there is acomplementarity between the Single Market and monetary union.
The paper is organised as follows. Section 1 presents the motivations for an exante study. Section 2 gives an overview of useful recent theoretical and empiricaldevelopments related to this enquiry. It will introduce a joint representation of intra- andinter-industry trade, taking into consideration returns to scale and the type of productdifferentiation. Particular attention will be paid to factor mobility. Section 3 indicates themain results of the method which disentangles trade, with particular attention paid to thedifferences between horizontal and vertical differentiation (developed in Fontagné andFreudenberg 1997) from 1980 to the end of the period. This Section will provideindicators which will fuel the econometric modelling developed in Section 4, and

Trade patterns inside the Single Market
14
implemented in Section 5 in order to test for the different hypotheses using a country-partner-industry-time model. The latter Section turns to the very question of the impact ofthe single market. It starts by listing the potential effects and the questions addressed tothe data base. A first round of estimates is then given, explaining the trade patternsobserved in Section 3, before capturing the effects of the single market, controlling forother determinants of trade patterns.
1. WHY AND HOW AN EX POST STUDY ON TRADE PATTERNS WITHIN THE EU?
1.1. Why a study on trade effects of the Single European Market?
There are four main reasons why the trade effects of the Single Market deserve astudy of their own. First, trade per se is an important variable, if only in the context of theregionalisation versus globalisation debate.
Second, variations in the intensity and composition of trade among member statescan be expected to provide important information about the nature and the size of theeffects of the Single Market upon production structures, and thereby give indirectindications about the magnitude of efficiency gains achieved so far.
Third, differences in the evolution of trade patterns between developed and lessdeveloped member states should provide indications of the effects of the Single Marketcum Structural Fund programme upon economic and social cohesion. More generally,trade patterns are an indicator of the distribution of efficiency gains among and withinmember states.
Lastly, observing trade developments since the Single Market began to beimplemented should help clarify whether the degree of structural asymmetry amongmember states can be expected to increase or to decrease as a consequence of economicintegration. This is an important issue for determining whether there is acomplementarity between the Single Market and monetary union.
The theoretical considerations examined in Section 3 lead to the hypothesis that theSEM has had a magnification effect, reinforcing the "natural tendencies" towards moreIIT -and primarily on a vertical differentiation basis- among member countries. In order toundertake an ex-post appraisal of the effectiveness of the measures mentioned above, it istherefore necessary to address key questions related to the patterns of trade, especiallybetween member countries.
(a) Has the completion led to a deeper involvement in intra-European trade flows bythe more developed Member Countries or of the less advanced ones, or both?
(b) Are the related trade flows of an inter-industry or intra-industry nature?(c) Are the observed intra-industry flows linked to a horizontal or vertical
differentiation of goods?

CEPII, document de travail n° 97-07
15
(d) Have returns to scale, where they have been achieved, boosted systematically intra-industry trade or, in contrast, have they led to agglomeration economies potentiallydetrimental to the internal cohesion of Europe?
(e) Have microeconomic strategies, coupled with macroeconomic comparativeadvantages led to changes in the location of countries along the vertical range ofdifferentiated products?
(f) Will a division of labour take place, in the sense that more advanced countries arespecialised in up-market goods, and lesser ones in down-market products? Even ifthis were the case, a long run study would reveal any price/quality convergence,e.g. that some lesser developed countries will "upgrade" in their specialisation.
The answers suggest the completion effects on efficiency and welfare, and shed lighton potential distribution conflicts inside member countries8 or between the latter, in thecase of sizeable agglomeration effects which cannot be excluded a priori.
Taking into consideration the current theoretical analysis of the gains frominternational integration, the basic idea is that an appraisal of the impact of the SingleEuropean Market (SEM) on intra-EC trade patterns must:
(a) identify the nature of intra-EC trade flows over a given time period (1980 to 1994);and then
(b) estimate the impact of the SEM on this nature9, using econometric analysis.
Concerning the former objective, it was mentioned above that the horizontal andvertical dimensions of the differentiation have to be distinguished: from this perspective,methodological choices have to be made in order to identify types of trade for eachyear/country/partner/industry, before turning to the measurement of transformations intrade relationships between European partners over a period covering the microeconomicexpectations of the completion of the Internal Market, and the completion itself. Thedifficulty, is to choose between complementary methodologies measuring the respectiveweight of the different trade types. To explain it non-technically, it might be pointed outthat traditional measures of IIT have been renewed following two directions:
(a) traditional indices, based on the trade overlap in the line of the seminal Grubel andLloyd study, can be adjusted to the necessary distinction between types of productdifferentiation: using unit values in order to characterise the (non-) similarity ofproducts, traditional indices can be calculated for the two types of differentiation.This methodology has been adopted by Greenaway, Hine and Milner (1994, 1995);the case study on Spain occasionally used such a measurement, due to technicalreasons of data availability;
8 Under the classical scarce/abundant factor scheme, even if human capital is understood as a factor in a wideracceptation.9 And incidentally on its value.
Trade patterns inside the Single Market
16
(b) a complementary methodology, initially introduced by Abd-El-Rahman, andsuccessively refined by Freudenberg and Müller10 and the CEPII11, will be usedcentrally in this paper, as referred to in the tender.
Having done this, the latter objective will be to address -on an econometric basis-the responsibility of the SEM in the evolution of trade patterns. It might be found that theSEM per se has had no role in the evolution observed, the changes in the nature of tradebeing explained on a time/country/partner/industry basis. In contrast, it might be foundthat the SEM has had a significant impact on trade flows, controlling for all otherdeterminants, over the period considered.
1.2. How to measure intra-EC trade patterns?
It is important to start by underlining that "industries" do not intervene in thecalculations referred to below. However, the main results obtained in this first part of thestudy will be presented as such, as they are of interest in themselves. For this, elementaryobservations will be aggregated to the industry level. In addition, these results at anindustry level will serve as inputs (as dependent variables) for the multi-country,multi-industry, multi-year econometric model of bilateral, intra-EC trade to estimate theimpact of the Single Market.
1.2.1. Nature of intra-EC trade flows
To identify the nature of intra-EC trade flows, the CEPII proposes rejecting thetraditional dividing line between "intra- versus inter-industry trade". This does not meanthat the distinction between these two types of trade should be rejected. In contrast, theCEPII -bearing in mind the theoretical approach of trade types- aims to provide ameasurement directly linked with theoretical explanations, while disentangling horizontaland vertical differentiation.
Indeed contemporary developments in the new international economics suggest thattrade must be quantified with tools implementing a distinction between vertical andhorizontal differentiation. In this perspective, a clear definition of what a product is,based on price considerations, must be borne in mind.
In contrast to most other empirical studies on "intra- versus inter-industry trade",this new methodology not only takes into account unit value differentials (a proxy for pricedifferentials) at the most detailed level of classification (some 10,000 products), but breaksdown trade into different components. At the same time, it distinguishes between bilateraland multilateral relationships, in order to cancel the geographical bias and to introduce thenotion " bilateral, two-way trade in similar products".
10 Abd-El-Rahman (1984, 1986a and 1986b) and Freudenberg and Müller (1992).11 See Freudenberg and Fontagné (1997).

CEPII, document de travail n° 97-07
17
This approach permits the decomposition of total trade into different types, thusproviding additional information, as compared to traditional indicators (Balassa, Grubeland Lloyd).
As the initial intention was to apprehend better the notion of intra-industry trade atproduct level, by breaking with traditional measures , it is necessary to define what a"product" is, what a "similar" product is, and lastly what "two-way trade" is. If trade flowsof a particular product with a partner country fulfil the two criteria of similarity andoverlap, we qualify both exports and imports as "two-way trade in similar products."12
The scope of this methodology, however, is far larger, in the sense that trade flowswhich do not fulfil the two criteria of "similarity" and "trade overlap" can also be defined.Each elementary, bilateral trade flow can finally be classified in one of the following threetrade types:
(a) two-way trade in similar (or horizontally differentiated) products;(b) two-way trade in vertically differentiated products; and(c) one-way trade.
1.2.2. Specialisation along quality ranges
Concerning quality ranges on which member countries specialise, the CEPIIproposes comparing unit values to a European norm for each trade flow. As exports andimports are analysed separately, flows for the same product, with a given trade partner,can exist in different European price/quality ranges:
(a) up-market products (with unit values exceeding the Community average by at least15 %);
(b) down-market products (more than 15 % below the norm); and(c) middle-market products.
Carrying out the analysis at the most detailed level of the classification means thatsectoral and geographical bias has been reduced to a strict minimum. The two dimensionsproposed here (trade types and price/quality ranges) can subsequently be aggregated to anydesired level.
1.3. How to capture the impact of the SEM on intra-EC trade patterns?
Having based intra-industry trade appraisal in a clear theoretical framework, inwhich the definition of the product will be a key point, the original empirical methodologyreferred to above will be used, which attributes a key role to prices, in addition to theconventional nomenclature disaggregation. This first step sheds light on general features(the rise of trade in vertically differentiated products), on country specificity (the
12 As a result, in contrast to the Grubel and Lloyd indicator, a surplus or a deficit can appear for this kind ofintra-industry trade.

Trade patterns inside the Single Market
18
convergence of Southern countries trade types towards Northern ones), and finally ondifferences among industries. In a second step, in order to estimate the impact of theSingle Market programme on trade patterns (both in terms of volume and composition)among member states, the general influences on intra- and inter-industry trade will haveto be separated from those related to the Single Market related ones.
1.3.1. Determinants
Inter-industry trade has a set of traditional determinants (comparative advantagerelated to factor endowments, notably qualifications), but can also be related, as underlinedabove, to new explanations like agglomeration effects.
Turning to intra-industry trade, similarity between countries and per capita GDPhas to be related to the volume in intra-industry flows. At the same time, differentiation ofthe products, economies of scale, and more generally market structure are related tohorizontal differentiation. Lastly, income distribution differences between countries willlead to cross-hauling.
In addition, the Internal Market programme has introduced a major change in theintra-European relations, whether they are of a financial nature or of a real one. As aconsequence there has been a jump in FDI between European countries; market structureshave been reorganised leading to huge Mergers and Acquisitions; price convergence isexpected as a result of reduced opportunities for discrimination in markets; etc..
1.3.2. Anti-monde
How are the effects of the Single Market on trade patterns to be estimated?
During the considered time period (1980 to 1994) which correspond to a pre- and apost announcement (implementation) period, GDPs, differences in GDPs, differences inper capita income, exchange rates etc. have changed. It is therefore necessary to controlfor these effects in order to identify the Single Market effect per se: growth translates"naturally" in IIT, what can not been, for example, interpreted has a direct result of theSingle Market.
The approach used here to build an Anti-Monde is a panel analysis of theregressions for the determinants of intra-industry trade. A dummy for the pre- and post-period could have been used, but is rather an empirical expedient than a satisfactorysolution. The introduction of variables of bilateral FDI or cuts in NTBs associated withthe completion is more accurate. For each year-country-partner-product, the importance(value or share) of intra-industry trade may be taken as the explained variable, in thedistinctive features shown by this phenomenon: horizontal versus vertical differentiation.It will also be necessary to measure the impact of cuts in transaction costs associated withthe cancellation of border formalities.

CEPII, document de travail n° 97-07
19
It is useful to divide the questions addressed by the models in two: (1) to explain thenature of intra-EC trade, and (2) to estimate the impact of the SEM.
1.3.3. Main features of the econometric model
As we propose tackling the impact of the SEM on the nature of intra-EC trade flowsby using econometric analysis, the core model is the following:
(a) the dependent variable is the share of bilateral two-way trade in bilateral trade,both horizontally and vertically differentiated. The latter can be tested separatelyor jointly. As the methodology to identify the nature of intra-EC trade is free of anybias of aggregation, the elementary observations of the first part of the study(country/partner/product/year) can be aggregated to any desired level. As data onexplanatory variables are limited to 14 industries, trade data is aggregated to thecountry/partner/industry/year level.
(b) they are three types of explanatory variables: country variables (in order to controlfor size, differences in sizes, income, transaction costs, etc.), industry variables(controlling for market structures at the industry level), and integration variables,(Non-Tariff Barriers, FDI).
(c) the model controls for bilateral exchange rate movements.
In addition to this core specification of the model, the latter has also been estimatedin value for the global panel, and in value and share for each industry and each countryseparately.
Turning to the impact of the SEM, three types of questions are raised:
(a) has the presence of NTBs changed the nature of intra-EU trade over the periodconsidered: to say it differently, are industries characterised by high pre-completionNTBs subject to less or more specialisation? Has the boost in M&A over thecompletion period led to a change in trade structure; has it been trade displacingalong the Markusen’s convergence hypothesis?
(b) what is the profile of parameter estimates for variables associated with thecompletion: not only tariff barriers but also transaction costs smoothed by theremoval of border formalities?
(c) are these results sensitive to the accession of Portugal and Spain, and did thesecountries follow the general scheme of trade transformations observed for othermember states?
2. THE NEW INTERNATIONAL ECONOMICS AND THE GAINS FROM INTERNATIONALINTEGRATION
Since the 1960s, the theoretical link between international trade and resourcere-allocation has been questioned, opening the way towards a "rethinking of internationaltrade" (Krugman). The conventional view of international trade, based on differences

Trade patterns inside the Single Market
20
between countries, established a positive relationship between these differences and thevolume of trade: such a view misses the bulk of contemporary international trade,especially when one looks at regional integration experiences, like the European one.Imperfect competition, and more generally market structures, consumers' preferences andreturns to scale, were as a result substituted to comparative advantage in the search for anew explanation of trade patterns.
Gains from trade therefore change, efficiency under constant returns to scalebrought on by inter-industry factor mobility being replaced by efficiency under increasingreturns, and by welfare gains associated with consumer preferences. Trade theorists havesubstituted comparative advantages with imperfect competition, leading to a change in thegains from trade: efficiency under constant returns to scale brought on by inter-industryfactor mobility has been replaced by efficiency under increasing returns, and by welfaregains associated with consumer preferences or the possibility for producers to find inputsadapted to their specific needs. As a result, potential gains are enhanced, as a result ofimperfect competition, increasing returns and externalities. But at the same time, thesehave failed to be systematic.
Two main results of the burgeoning literature since the sixties can be pointed out:
(a) first of all, after a period of search for a new theory alternative to the HO-scheme, asynthesis has been reached: intra and inter-industry trade can be understood in asynthetic manner;
(b) potential gains from trade are enhanced, as a result of imperfect competition,increasing returns and externalities; but at the same time, they fail to be systematic,contrary to those related to the classical view of international trade.
In the line of the World Integrated Equilibrium popularised by Helpman andKrugman, two concepts are fruitful when looking at these contemporary developments inthe perspective of an ex-post appraisal of the internal market's completion,: the economicdistance between countries on the one hand, the factor content of net trade flows on theother hand.
Intra-industry trade between differentiated varieties of a same product, implying nospecialisation process, and no displacement of resources from industry to industry, is apriori the only pattern of trade that will be observed between two perfectly identicalcountries: international trade is of an intra-industry nature. As a result, conversion costs,factor mobility, distribution of income are irrelevant topics for trade between countriesseparated by a very small economic distance: in this case the factor content of trade wouldbe nil. In contrast, trade between countries separated by a high economic distance wouldbe of the classical, inter-industry type.
From this perspective, the Internal Market programme should lead to an increase ofintra-industry trade between the more developed member states, and possibly between theless developed ones. Conversely, adjustment processes at a sectoral level are concerned if,and only if, the transformations in the nature of trade associated with the Single Market

CEPII, document de travail n° 97-07
21
lead to a deeper specialisation between the less developed member states and the moreadvanced ones.
Such a presentation is nevertheless strongly associated with the horizontaldifferentiation of products. Turning to the vertical differentiation, a peculiar feature oftrade has to be identified: differentiated products belonging to the same "group" do notshare the same production function. Therefore, whatever the basis for this difference, itwould imply a net factor content of trade not necessarily nil even if trade is balanced andperfectly intra-industry. This means that potential effects associated with IIT in verticallydifferentiated products are not those referred to in the literature on horizontaldifferentiation. Adjustments costs might replicate, inside industries, effects observedbetween industries in the inter-industry/specialisation framework, whereas advantages ordisadvantages for different type of qualities might be cumulative.
In addition, sector specific, country specific and international economies of scalealter the picture: if agglomeration economies exist, leading to a concentration of firms inthe 'country' being initially advantaged, two complementary bases for specialisation areoperating:
(a) the availability of resources largely used in the industry leads to a comparativeadvantage;
(b) the size of the country leads to cuts in average costs associated with externalities:larger industries are more competitive, which may counter-balance comparative(dis)advantages considered at a given level of output.
Finally, it must be kept in mind that regionalisation has a factor mobility dimension.FDI flows, and/or M&A strategies have a double face: efficiency and market power. Butwhat is more striking is the convergence hypothesis established by Markusen andVenables (1995): as countries converge, multinational firms might displace trade: theshare of IIT might increase, whereas the value of inter-industry trade might decrease. As aresult, an important issue is whether factor mobility has been, or not, a substitute to tradeflows as a result of the single market completion.
In this new perspective it is useful to understand how things would have been, if theEuropean economy had been perfectly integrated rather than divided among countries withdifferent factor endowments. A key feature of the world integrated equilibriumpopularised by Helpman and Krugman, is that in a perfectly integrated economy factorprices and product prices would be identical between countries. Such a benchmark isrelevant in the perspective of European integration, as far as the lack of convergence inprices has been understood as an indirect proof of the "non-Europe". In contrast, the SEMwill precisely push in the direction of a perfectly integrated (European) economy. Inimplementing this tool, it is nowadays usual to consider that an appraisal of internationaltrade effects has to be based on factor services embodied in goods, rather than on goods.
A first question to address in order to give an overview of contemporary theoreticalinsights in intra-industry trade is therefore the definition of the product. A second

Trade patterns inside the Single Market
22
question is related to the possibility of externalities, which alter traditional results inunexpected ways. A third question is related to increasing returns, which are a centralfeature of the integration process, especially in the perspective of the Completion of theInternal Market, which is related to the market structure question. Lastly, a distinctionhas to be made between the horizontal and vertical differentiation of products.
2.1. A unified definition of what a product is
It has become usual to assume that the consumer choice can be represented by atwo-stage budgeting. In a first stage, the consumer chooses between different products(note that products are defined by their production functions, not by positions in thecustom's nomenclature), and on a second stage, between differentiated varieties of thesame product.
Following this general principle, intra-industry trade between differentiated varietiesof a same product has the following consequence: as exports and imports concern outputsof the same industry, i.e. products associated with the same production function, the factorcontent of net trade flows is nil if trade is balanced. Each country exports and imports thesame amounts of services of each factor embodied in products. In the same way, efficiencywould be nil under constant returns to scale: there would be no process of specialisation,no displacement of resources from industry to industry, the only gain being a benefit overthe diminishing marginal utility associated with the consumption of a given variety by agiven consumer in increasing quantities. But indeed, efficiency gains are positive, sincevarieties are produced under increasing returns.
This is a priori the only pattern of trade that will be observed between two perfectlyidentical countries: international trade is an intra-industry one. Using the traditionalGrubel and Lloyd index that will be discussed below, an empirical investigation will give 1as a result, 100% of trade being of an intra-industry type. There is therefore nospecialisation at a macroeconomic level, trade having consequences only at themicroeconomic level. As a result, conversion costs, factor mobility, distribution of incomeare irrelevant topics.
While this ideal situation cannot be observed in practice, this definition of a producthas to be borne in mind when one tries to establish empirically results related to intra-industry trade: the bulk of the literature misses this when using custom-items (even at avery disaggregated level) as a basis for empirical investigation. In contrast, themethodology used below, keeps this principle in mind as will be demonstrated. Thismethodological concern is, from our point of view, of major significance if one tries tobase empirical investigation on theoretical foundations rather than on empiricalexpedients.
At this initial level, the relationship associating inter-industry trade to differences infactor endowments and intra-industry trade to product differentiation is perfectlyestablished and the analysis of gains from integration is straightforward:

CEPII, document de travail n° 97-07
23
(a) inter-industry trade between different countries carries efficiency gains (resourcesre-allocation) and a gain for the consumer, as the latter is confronted with a new setof relative prices13;
(b) intra-industry trade between similar countries carries a gain for the consumer, asthe latter values variety per se, or finds a product closer to his/her most preferredone; an efficiency gain is added under increasing returns, as international trade haspro-competitive effects.
From this perspective, the Internal Market programme should lead:
(a) to an increase of intra-industry trade between the more developed member states,and possibly between the less developed ones;
(b) and to an increase of inter-industry trade between the former and the latter.
Following this approach, adjustment processes at a sectoral level are concerned ifthe transformations in the nature of trade associated with to the Single Market lead to adeeper specialisation between the less developed member states and the more advancedones.
In contrast, the development of intra-industry trade between the former and thelatter on the one hand, and between the only latter on the other one, would not entail thesetypes of costs. Adjustments would be of a microeconomic nature, among firms insideindustries, rather than among industries. As will be pointed out below, this presentation isnevertheless heavily associated with the horizontal differentiation of products. A furtherdistinction between similar and vertically differentiated products inside each industry willlead to conclusions which are more complex.
2.2. The integrated equilibrium
The notations are the following in the text: j for the industries, i for thedifferentiated products, k for countries. As a result Qijk will for example represent theoutput of country k for the variety i of product j. We have m products, n varieties of each,and l countries.
Consider an input/output structure involving f primary factors (subscripts f) under a"perfect competition on all markets" assumption: a set V of m input vectors υ j
corresponding to the general producer equilibrium exist for each vector ω of factor prices.Each product being defined by a υ j , if technology is free, for example inside
multinationals, it is not useful to add a subscript k to υ j .
One can establish the conditions under which the international economy replicatesthe result of a theoretical "world integrated equilibrium" (Helpman-Krugman, 1985).
13 If the comparative advantage is of a vertical rather than a horizontal nature, trade in intermediates boosts this gain(Fontagné 1991).

Trade patterns inside the Single Market
24
Consider N countries (subscripts k), with factor endowments represented by a υk vector ofprimary inputs.
The question to address is the following: is V compatible with the set V ofendowments in the perspective of uniqueness of ω? If one can answer 'yes', the integratedequilibrium can be replicated by free trade between countries.
At the elementary level of dimensionality entailed in the traditional textbooks, i.e. j= (1, 2), the two vectors define a diversification cone (McKenzie, 1955, Chipman, 1966) ;if the endowment vector belongs to it for all countries one can find a solution associatingpositive outputs for all goods to a unique ωk. Assuming a higher dimensionality (lcountries, m final goods et 3 primary factors), this result (Simonnard, 1966, Leamer,1987) is robust only in the same triangle of diversification. The "natural friend principle"(Ethier, 1974) does therefore no longer establish a one to one relationship between inputsand outputs. And the same price movements will have different results for differenttriangles of diversification (Rybczynski derivatives...).
With a nil economic distance (Dkk' =0),and at the elementary level ofdimensionality,
GLkk
kk
'
'
=
=
1
0 ∆
2.3. Externalities
Sector specific, country specific and international economies of scale, that aremagnified in the new international economics literature, alter the picture. These effectscan be synthesised in a very simple way. If the development of aeronautics in Europeleads to better European competitiveness for this industry, without altering competitionbetween European firms14, it may be said that this externality is sector and country15
specific. From this perspective, agglomeration16 effects exist, leading to a concentrationof firms in the 'country' being initially advantaged. In contrast, externalities may be of aninternational nature, costs being cut as world output is boosted, as in electronics.
As far as the former case of externalities is taken into account, two complementarybases for specialisation are operating: the availability of resources largely used in theindustry leads to a comparative advantage, ceteris paribus, while the size of the domesticproduction (due either to per capita income, population and/or domestic preferences) leadsto cuts in average costs associated with externalities: the size of countries matters.
14 Each of these facing constant returns to scale.15 Under the assumption that Europe is a single country.16 The monolocation of activities refers to the agglomeration of producers, not a displacement of resources betweencountries, which is not taken into account at this stage of analysis.

CEPII, document de travail n° 97-07
25
Lastly larger industries are more competitive, which may counter-balancecomparative advantages considered at a given level of output. And small countries - ormore generally countries initially characterised by a small domestic market - will bepushed out of such industries, notwithstanding their comparative advantages, whereassimilar countries - as far as factor endowments are concerned - will compete on the basisof industry size.
In order to take into account externalities, one defines a vector γ , representative ofall externalities to production being identified for the sets N and J i.e. for l countries and mindustries
( )γ = Q Q Q Qm l lm11 1 1,..., ,..., ,...,
Therefore, with g referring to production functions of m homogeneous products:
δ∂γ
γ
gkj
t
⟩
=
0
Qt kj
δ∂γ
γ
g kj
t
⟩
=
0
Qt j
An external sector and country specific economy of scale drives to the followingproduction function:
( )g h Qkj kj j kj= ν ,
In contrast, an international economy of scale will lower the costs in the industry jwhen the world output increases, but without any efficiency gain for each firm or eachcountry on his own.
Taking this kind of effect into account in the international equilibriumdetermination, the previous results are modified in the following way:
(a) the mono-location of industries subject to external economies of scale will lead to asectoral specialisation;
(b) inter-industry trade is possible without any comparative advantage;(c) and more generally, comparative advantages no longer determine inter-industry
trade patterns, as economies of scale modify their relation to prices.

Trade patterns inside the Single Market
26
2.4. Internal economies of scale
Internal economies of scale rather than externalities can be introduced in ourtheoretical scheme without modifying fundamentally the principle of factor content of nettrade flows. With homogeneous products in industries without barriers to competition,
average costs of firms (subscripts ζ) belonging to the set Z jk
are determined by ω and
qjζ. Under the contestability assumption, the related industries will be monopolisedwithout altering the average cost pricing principle. If one assumes a positive relationshipbetween the capitalistic nature of industries and the intensity of scale economies, one cantherefore divide the set G of m homogeneous products in two sub-sets entailingrespectively all contestable markets and all perfectly competitive markets:
( )j b b m
KL
KL
j
q q j b
j
j
j
j
kjk
j
∈ +
⟨ ∀
= ∀ ≤
+
+
∑∑
1 1
1
1
..... , ...........
;
;ζζ
ζ
As referred to above, returns to scale are a key point when one tries to appraise thepotential effects of an economic integration. As far as Europe is concerned, is notnecessary to underline the role taken by economies of scale in the ex-ante evaluation of the1992 programme.
In order to give a better understanding of the problem, one has to remember thatnew developments in microeconomics relax the tight link between concentration andanti-competitive practices that is the base for traditional competition policies. As a result,two extreme cases can be presented.
(a) In the first case, returns to scale lead to oligopolistic market structures, butpotential entries guarantee that firms will not adopt strategies boosting marketprices. Mono-location of firms will lead to inter-industry trade and the tight linkbetween comparative advantage and trade patterns will be relaxed once more.
(b) In contrast, in the latter case, firms will adopt pricing strategies based on theimperfect substitutability of varieties of the same product. Economies of scale andmark-up will lead to intra-industry trade of differentiated products. In this case,gains from trade are increased, as microeconomic efficiency gains are broughtabout by more competitive market structures, while completion of markets opensthe way towards more diversity/variety for the representative consumer. At thesame time, the first best pricing associated with perfect competition is no longer arelevant principle: therefore, effects associated with the economic integration are
CEPII, document de travail n° 97-07
27
less systematic, subject to the different sets of assumptions, and possiblycounter-intuitive.
2.5. Vertical versus horizontal differentiation
Turning to a theoretical explanation of the imperfect substitutability betweenvarieties, three key assumptions can be made:
(a) under the "love for variety" approach17, consumers value variety per se, morevariety of the same product leading to a higher utility;
(b) under the "diversity of tastes" approach18, each consumer has a "most preferred"variety in mind, and tries to find a variety closely related to his ideal; as consumersare regularly distributed on the "preference spectrum", each firm will choose alocation on the latter, i.e. will produce a variety combining the characteristics of theproducts in a specific way;
(c) finally, contrary to the two previous assumptions related to a horizontaldifferentiation, one can assume a vertical differentiation: a continuum of qualitiesof the same product, having different prices is proposed to the consumer.
A central feature of the models related to horizontal differentiation is the "lessdifferentiation-more diversity" approach to economic integration. While tightly linked toa hypothesis about demand elasticity under the first assumption, this central result isclearly established under the second one: from an empirical point of view, it will meanthat the integration effects on industry structures have a great significance, which have tobe taken into account.
Turning to vertical differentiation strategies, a peculiar feature of trade has to beidentified: differentiated products belonging to the same "group" do not share the sameproduction function. As far as they are not sold at the same price (otherwise only oneproduct -the highest quality- would be sold), even if produced in the same country, they donot entail the same content of factor services.
The difference might be based on fixed costs of development increasing with thelevel of quality; conversely they might be based on variable costs associated with a contentof capital19 or qualified labour increasing with quality. For example Falvey (1981) uses amodel of IIT with vertically differentiated products, in which the unit cost20 of a givenquality v is simply the price of one unit of labour plus v units of capital. In contrast, theprice to pay for quality can be a fixed cost, associated with R&D expenditures, andincreasing with the quality differential between domestic and export markets, as in Motta,Thisse and Cabrales (1995).
17 Referred to as the Spence-Dixit-Stiglitz-Krugman approach in the literature.18 Referred to as the Helpman-Lancaster approach.19 See Falvey and Kierzkowski20 And therefore the price, under perfect competition.

Trade patterns inside the Single Market
28
Fontagné and Freudenberg (1997) identify a complex relationship between theeconomic distance and the nature of trade, which raises into doubt the traditional negativerelationship between the economic distance and the intensity of IIT. The distinctionbetween the horizontal and vertical differentiation of products, referred to here, modifiesthe theoretical framework: using the "integrated equilibrium" approach: the economicdistance between countries is no longer the basis for specialisation between industriesalong a comparative advantage scheme only, but also the basis for a specialisation alongranges of quality, within industries. Combining these two kinds of product differentiationinto a single model of imperfect competition -in which consumers choose first amongqualities and then among varieties of each quality- yields the following central result:different countries will engage in IIT in vertically differentiated products whereas similarones will engage in IIT of varieties within similar qualities. The economic distance - herethe difference among countries in the allocation of specific resources along the qualityspectrum - leads to IIT in vertically differentiated products. Thus a negative relationshipbetween the difference in GDP per capita and the share of IIT in horizontallydifferentiated products in bilateral trade is expected in the empirical study below, andconversely for the share of IIT in vertically differentiated products.
Whatever this basis would be, it would imply a net factor content of trade which isnot necessary nil even if trade is balanced and perfectly intra-industry. This means thatpotential effects associated with IIT in vertically differentiated products are not thosereferred to in the literature on horizontal differentiation. Adjustments costs mightreplicate, inside industries, effects observed between industries in the inter-industry/specialisation framework, whereas advantages or disadvantages for different typeof qualities might be cumulative.
It should be thus borne in mind that a country involved in IIT based on the verticaldifferentiation of products is specialised, with all potential effects associated with thisevent.
In addition, the IO literature points out the role of advertising expenses as a basis forvertical differentiation, an issue raising the question of increasing barriers to entrypotentially associated with an increase in the share of IIT in vertically differentiatedproducts. If this last interpretation was right, it might mean that newcomers arediscriminated on the related markets, as they face barriers to entry erected by oldercompetitors who have previously invested in goodwill.
In this perspective, it is necessary to adopt an empirical point of view reflecting theexistence of these alternative sets of assumptions by combining the most detailed level oftrade statistics with information available on qualities of products.
2.6. Factor mobility and trade types
The theoretical arguments referred to above highlighted the relationship between(1) the economic distance, returns to scale and the type of product differentiation, and
CEPII, document de travail n° 97-07
29
(2) the types of trade. It must be nevertheless be kept in mind that the globalisation of theworld economy, and in addition the regionalisation, have a factor mobility dimension.
As far as the completion of the single market is concerned, it has been oftenunderlined that firms have taken this opportunity to increase intra-European FDI flows,and/or taken into account this new competitive challenge by developing M&A strategies.In the same way, it could be advocated that the potential reduction in market power hasled firms to impulse M&A potentially increasing barriers to entry against new competitors.As always, industrial restructuring has a double face: efficiency and market power.
What do we know about these questions?
Brainard (1993) and Horstmann and Markusen (1992) have derived an interestingresult of models where multinational firms rise endogeneously as an internationalequilibrium: ceteris paribus for returns to scale and transportation costs21, large countries(defined as the average GDP of declaring country k and partner k’)22 or countries withsimilar factor endowments (the difference in per capita incomes between declaringcountry k and partner k’)23 are the very conditions for such an outcome24.
But what is more striking is the result established by simulations done by Markusenand Venables (1995): as GDPkk’ increases and PCIDkk’ decreases (convergence hypothesis)inter-industry trade decreases whereas IIT increases, resulting in an increase of the shareof IIT in total trade. This result is only partially consistent with the Helpman-Krugmanline of "mono-national" firms, models concluding at a rising IIT in the same context. Heremultinational firms displace trade: the share of IIT increases along the diminishing valueof inter-industry trade. But since it is the result of a trade displacement, the steady state isno trade between similar countries. Markusen (1995) notices that this potential impact ofFDI on the nature of trade as not paid much attention in the empirical literature. Theeconometric developed below will authorise to evaluate this hypothesis for the completionperiod. An important issue is whether factor mobility has been or not a substitute to tradeflows as a result of the completion of the single market.
2.7. The Internal Market and the gains from integration
As a result of deeper economic integration in Europe, efficiency and welfare shouldbe enhanced through the mobility of goods and factors. In this process, three intermediateobjectives should be reached: achievement of returns to scale, competition-reinforcement,re-allocation of resources towards the most efficient uses.
21 Unfortunately, a further qualification of the model is that, given sizes and incomes, multinationals emerge as theresult of high transportation costs or tariff barriers, a scheme which does not fit well with the completion periodcharacterised by decreases in transportation costs (along the cancellation of border formalities and the deregulation ofthe sector) and the phasing out of NTBs.22 See the variable GDPkk’, referred to in the econometric model below23 Resp. PCIDkk’24 See Markusen (1995) for a simplified presentation.

Trade patterns inside the Single Market
30
As a result, inter-industry and inter-firm re-allocation of resources might lead tore-conversion costs, as well as efficiency gains. At the same time, external effects mightinduce agglomeration effects. And finally, from the consumer's point of view, one has toassess if variety has been preserved, on average. Even if there is no theoretical foundationthat could guarantee that welfare has finally increased25, given all these effects, theprobability of a positive answer to this question is fairly high. As a result, each Europeancountry might recover, at least, its pre-Single Market level of consumption , in thepost-completion situation.
Macroeconomic efficiency gains: with pe the free trade price m-vector, C unit costfunctions and Q the world output vector, this condition can be written (subscript A forAutarky):
( )p p C Q Ve A e e jj
m
je
kk
Θ Θ
∆
≤ = =
≠=
∑ ω ω1
0 '
Gain for consumers being confronted to a new set of relative prices (with U≈
, theindirect utility function):
( ) ( )U p r U p r
p D r
e A
jj
j
≈ ≈≤
≤∑
, ,
Specific gain to trade in middle products (vertical comparative advantage). Withthe subscript i for the successive stages of the process, the necessary condition is:
( ) ( ) ( )C Q C Q C Qjj
m
jA jj
m
je ii
n
ieω ω ω= = =
∑ ∑ ∑> >1 1 1
Taking into account external economies of scale or contestable markets, a gain existif:
( ) ( )C q q C q qj
z
j
m
je jA j
z
j
m
jA jAζζ
ζ ζ ζζ
ζ ζω ω== ==
∑∑ ∑∑≤11 11
, ,
25 Helpman-Krugman (1985) have nevertheless established a sufficient condition in order to attain a gain on thewhole: large increases of output in industries with high economies of scale and large increases in a variety forindustries where differentiated products are weak substitutes.

CEPII, document de travail n° 97-07
31
In the case of internal economies of scale: a gain exist if, with D j
≈ the index of
consumption services of the j product and p j
≈
the price to pay for these services:
U p r U p r
p D r
e A
jj
j
≈ ≈ ≈ ≈
≈ ≈
≥
≤∑
, ,
Under the variety assumption, one has to add the following condition for consumers(see Helpman-Krugman, 1985).
U p r U p r
p D r
D D n
p p n
e A
jj
j
j j j
j j j
j
≈ ≈ ≈ ≈
≈ ≈
≈
−
≥
≤
=
=
∑−
−
, ,
α
α
1
11
Thus, mechanisms leading to these gains are tightly connected with the type of tradeadjustment associated with the completion of the internal market. This connection has asectoral and country dimension as far as more and less advanced member countries do notshare the same type of adjustment, whereas different industries are not identicallyconcerned by the internal market.
Concerning the latter point, Buigues, Ilzkowitz and Lebrun (European Commission,1990b) have established a typology of industries subject to high market completion effects:as far as NTBs, share of intra-European imports in internal demand, price dispersion andeconomies of scale are concerned, 40 industries in 4 groups are sensitive26:
(a) high tech industries protected by public procurement practices;(b) regulated or traditional public procurement industries (2 groups);(c) industries with smooth NTBs, of which consumer goods, capital goods and
intermediates.
26 In a second stage, the previous list has been modified to take into account national patterns: for example 13industries have been appended in the Portuguese case.
Trade patterns inside the Single Market
32
From this perspective, the distinction between intra and inter-industry trade is a keyquestion: will the adjustment to the cancellation of non-tariff barriers lead to aspecialisation along comparative advantages of member countries, or will economies ofscale lead to a greater concentration of industries? In contrast, will smoother adjustmentsbe observed, with exits of industries at the microeconomic level, whereas countriesmaintain their industrial structure?
In the former case, an increase in inter-industry trade would be observed, associatedwith a displacement of resources between industries, and with a redistribution of incomeinside countries between production factors. In the latter case, in contrast, consumers andproducers would face a greater variety of products whereas competitive pressures woulddrive prices down, reduce price discrimination, and last but not least, lead to anachievement of scale economies.
Another possible dimension of the trade adjustment must be borne in mind: even ifthe trade adjustment might probably lead to an increase in intra-industry trade, it does notmean that consequences might be those generally referred to in models of intra-industrytrade, based on hypothesis of horizontal differentiation à la Chamberlin. In contrast, thespecialisation might occur at a very fine level, inside industries, on quality ranges.
What would such a vertical differentiation assumption mean from a practical pointof view? Countries would specialise inside industries on products with different levels ofprice ranges; cross hauling would mean importing low qualities and exporting high onesor conversely; and differences in quality would mean differentials in the factor contents oftrade associated with differing inputs in qualified labour, capital or R&D.
As in Krugman (1980), size of countries matters if higher qualities of productsrequire larger fixed costs : will countries with lower GDP, engaged in an economicintegration with richer ones, catch-up or not? They initially bear a disadvantage associatedwith the lower qualities produced for the domestic market, facing an integrated marketthat asks for higher ones. The adjustment cost, a fixed cost in R&D, is increasing with thedifference in sizes. Persistence of leadership is always an equilibrium in such a context, tothe benefit of the richer country, as demonstrated by Motta, Thisse and Cabrales: butanother equilibrium, leapfrogging, is possible in as far as the asymmetry between countriesis not too large.
From a policy oriented point of view, such outcomes address the question ofcatching-up for Southern Member countries of the Community, in a context of increasingIIT in vertically differentiated products. Has the completion of the SEM led to persistenceof leadership, « Southern » member countries being marginalised in bottom qualityproducts, or in contrast have the latter increase the quality of their output? Trade patternswill provide useful information as far as IIT disentangle horizontally and verticallydifferentiation.

CEPII, document de travail n° 97-07
33
Lastly, the simple (traditional) way to manage the trade effects of an economicintegration (i.e. an association of economic distance27 with inter-industry trade andconversely), is dramatically affected by the many qualification of models. As a result, therelevance of a unique theoretical scheme is no longer certain (see Table 1), and an analysisof intra-industry trade at the most disaggregated level has to be implemented in order togive an empirical echo to the horizontal-vertical differentiation scheme.
Table 1. Determinants of trade types and potential effects on integration
Determinants Trade Types Potential Effects of Integration on
Specialisation IncomeDistribution
ComparativeFactor endowments
Along Changes inAdvantage Productivity differential
Inter-industrycomparativeadvantages
factor priceswithin countries
ExternalThrough
agglomerationPotentialincome
NewInternationalEconomics
Economies ofscale Internal
(under monopolisticIntra-industry
Verticaldifferentiation
divergenceamong countries
competition) Horizontal Fewdifferentiation
To give an example, stating that there is a strong link associating Germany toFrance in intra-industry trade relations compared with inter-industry trade relationshipsbetween France and Spain, is clearly an over-simplification. Intra-industry trade betweenFrance and Germany can be based on a quality differential (i.e. price differential) betweenvarieties of products, reflecting a "specialisation". At the same time, the less developedcountries of the Union can benefit from an up-grading of their line of products channelledby FDI: as a result, the share of intra-industry trade in their bilateral commercialrelationships can increase rather than decrease.
To summarise, contemporary developments in the new international economics leadto the following empirical suggestions:
(a) Intra-industry-trade must be quantified with tools implementing a distinctionbetween vertical and horizontal differentiation. From this perspective, a cleardefinition of what a product is, based on price considerations in addition tonomenclatures, must be borne in mind.
(b) Inter-industry trade must be disconnected from its traditional comparativeadvantage basis, in order to integrate new considerations like externalities,agglomeration effects etc.
27 Understood as differences in factor endowments or income per capita.

Trade patterns inside the Single Market
34
(c) A large diversity of trade patterns is expected as determinants, nature, and effects oftrade are highly dependent of market structures. This must discourage theresearcher from seeking a monolithic representation of what the trade effects of theEuropean integration are.
3. INTRA-EC TRADE PATTERNS: 1980-1994
Intra-EC trade has been affected by numerous events over the past fifteen years.The enlargement of the European Community, with the accession of new members(Greece, Portugal and Spain) in the 1980s and the German unification in the beginning ofthe 1990s, had an impact on trade flows and macroeconomic adjustments in Europe. TheSouthern countries were characterised by lower per capita income, with a distinctivespecialisation along industries and high potential of trade-creating and trade-divertingeffects.
The programme to complete the Internal Market, implemented in the mid-1980s,has also introduced major changes for the European economies. The anticipation byeconomic actors of the completion of the Single European market (SEM) drove to strongindustrial restructuring at the microeconomic level, notably through mergers andacquisitions both by European and non-European companies. Last but not least, themacroeconomic context changed and affect adversely the European market during the veryphase of SEM completion. Overall, dramatic changes in intra-EC trade were expected.
The methodology applied here allows to examine the nature of intra-EC trade flows.The definition of trade types is based on the traditional distinction between inter-industrytrade -associated with the specialisation of countries in industries along lines ofcomparative advantages or due to scale economies- and intra-industry trade based onimperfect competition. This traditional distinction is augmented there by another onebetween horizontally and vertically differentiated products. Concerning this distinction,unit values are taken as proxies for prices, prices themselves reflecting differences inquality of products exchanged. Total trade can be decomposed in three trade typesaccording to their similarity in unit values and to overlap in trade: two-way trade insimilar products (significant overlap and low unit value differences); two-way trade invertically differentiated products (significant overlap and high unit value differences); aswell as one-way trade (no or no significant overlap). In addition, three Europeanprice/quality ranges are defined to examine on which market segment products areexchanged: up-market products (with unit values exceeding the EC-average by at least15 %); down-market products (more than 15 % below the norm), as well as middle-marketproducts (between +/- 15% around the average).
All calculations for trade types and price/quality ranges are done at the elementarylevel (11 countries-10 partners-10,000 products-15 years). Only then the figures areaggregated: on the one hand for the presentation of the main results in this Section, and onthe other hand to introduce them as dependent variables in the econometric model inSection 7 (country-partner-industry-year).

CEPII, document de travail n° 97-07
35
3.1. Methodology and data
The methodology -based on Abd-El-Rahman (1986a) and further refined inFontagné and Freudenberg (1997)- is summarised below.
3.1.1. Methodology
The definition of "two-way trade in similar products"...
The basic idea is to give a definition of intra-industry trade which is closer both toreality and economic theory. On a conceptual level, we prefer to apprehend thephenomenon of "intra-industry trade" better at the product level, and at the same time todistinguish between horizontal and vertical product differentiation. To operationalise thenotion of "two-way trade in similar products", it is necessary to define what a "product" isempirically, what a "similar" product is, and lastly what "two-way trade" is. Thefollowing definitions are used here:
(a) a product: the detailed composition of the classification is the best guarantee foravoiding the empirical problems of sectoral aggregation. The data published byEurostat in the classification of the 8-digit "Combined Nomenclature (CN)" (and,until 1987, the 6-digit Nimexe) provide some 10,000 items, which are sufficientlydetailed for products to be distinguished by their principle, technical characteristics.For each elementary flow (exports or imports of the declaring country to/from thepartner country for a given product item) two criteria are applied.
(b) product similarity: even inside an item of the "combined nomenclature", productsmay differ clearly by their quality. Here, it is assumed that differences in prices(unit values) reflect quality differences. Therefore, products whose unit values areclose (in a given year) are considered as similar. Traded products are considered tobe similar (or horizontally differentiated) if the export and import unit values differby less than 15%28, i.e. if they fulfil the following condition:
1115
115.
.'
'
≤ ≤UVUV
kk ptX
kk ptM ,
where UV stands for unit value, superscripts X and M refer to exports and importsand indices k representing the declaring country, k’ the partner country and p theproduct in year t. When this is not the case, products are considered to bevertically differentiated.
(c) trade overlap: trade in an item is considered to be "two-way" when the value of theminority flow (for example imports) represents at least 10% of the majority flow(exports in this case), i.e. if they fulfil the following condition, where X and Mstand for the value of exports and imports:
28 Following Abd-El-Rahman (1991), Greenaway, Hine and Milner (1994) also used a 15% threshold to distinguishbetween similar products and vertically differentiated products, despite a more limited degree of classificationdisaggregation. Nevertheless, their study takes the "traditional" line in the sense that they split up the overall Grubeland Lloyd indicator to apprehend the relative importance of these two categories.

Trade patterns inside the Single Market
36
( )( )
Min X M
Max X Mkk pt kk pt
kk pt kk pt
' '
' '
,
,> 10% ,
Below this level, the minority flow cannot be considered significant as it does notrepresent a structural feature of trade.
If trade flows of a particular product with a partner country fulfil the two criteria ofsimilarity and overlap, we qualify exports as well as imports as "two-way trade in similarproducts"29. For a discussion on the two (arbitrary) thresholds see Fontagné andFreudenberg (1997).
A typology of international trade
But the second novelty of this approach is to identify also trade flows which do notfulfil these two conditions. This method allows for each year total trade to be broken downinto different categories according to the similarity in unit values and to the overlap intrade:
(a) two-way trade in similar products (significant overlap and low unit valuedifferences);
(b) two-way trade in vertically differentiated products (significant overlap and highunit value differences);
(c) one-way trade (no or no significant overlap).
This approach permits the totality of trade to be broken down according to thesecriteria, both imports and exports being part of one and the same of these types. A surplusor a deficit may thus appear for each of the three types. Table 2 syntheses this typology.As the calculations are done for each year, bilateral trade flows for a given product can bedefined as two-way trade in similar products in one year, and part of two-way trade invertically differentiated products in another year.
29 In contrast to the Grubel and Lloyd indicator, a surplus or a deficit can appear for this kind of intra-industry trade.This has important implications both for theoretical and empirical considerations, as we can identify situations where"intra-industry" trade goes along with "revealed" comparative advantages (see below).

CEPII, document de travail n° 97-07
37
Table 2. How to define the three trade types
Degree of Overlap betweenExports and Import Values:
Does the minority flow represent atleast 10% of the majority flow?
Similarity of Export and Import Unit Values:Do export and import unit values differ less than 15%?
Yes(horizontal differentiation)
No(vertical differentiation)
Yes Two-way trade in similarproducts
Two-way trade in verticallydifferentiated products
No One-way trade
How to aggregate the results?
As already mentioned, the elementary trade flows have 4 dimensions: country-partner-product-year. The aggregation procedure is straightforward. For example, theaverage Grubel and Lloyd indicator of intra-EC trade flows for industry j in year t isobtained by summing up over declaring countries k, partner countries k’ and theproducts p being part of industry j :
GLX M
X MEC EC j t
kk pt kk ptp jk ECk EC
kk pt kk ptp jk ECk EC
, , ,
' ''
' ''
( )= −
−
+
∈∈∈
∈∈∈
∑∑∑
∑∑∑1
Likewise, the value of two-way, intra-EC trade in similar products in industry j inyear t is
( )TWHDval X MEC EC j tz TW HD
kk ptz
kk ptz
p jk ECk EC, , , ' '
'
= +∈ −∈∈∈∑∑∑∑
where z is one of three categories depending on the corresponding trade type(TWHD, TWVD, OW).
The share of two-way, intra-EC trade in similar products in industry j in year t is
( )TWHDsh
X M
X MEC EC j t
z TW HDkk ptz
kk ptz
p jk ECk EC
zkk ptz
kk ptz
p jk ECk EC
, , ,
' ''
' ''
( )=
+
+
∈ −∈∈∈
∈∈∈
∑∑∑∑
∑∑∑∑European price ranges: a quantitative measure of quality ranges

Trade patterns inside the Single Market
38
The question on which market segments (in terms of price/quality) different memberstates are positioned in is less developed theoretically, but not less important for politicaleconomy issues, as this might have important consequences in terms of incomedistributions: will we find a (vertically differentiated) division of labour, in the sense thatmore advanced countries are specialised in up-market goods, and lesser ones indown-market products?
As we did for trade types, we assume that differences in prices (unit values) reflectquality differences. As exports and imports are analysed separately, flows for the sameproduct with a given trade partner can exist in different European price/quality ranges(Freudenberg and Müller, 1992):
(a) up-market products (with unit values exceeding the Community average by at least15 %),
(b) down-market products (more than 15 % below the norm), as well as(c) middle-market products (between +/- 15% around the average).
Being carried out at the most detailed level of the classification, this work allowsheadings to be aggregated to any desired level, so that a break down all trade into threetrade types and three price/quality ranges may be obtained.
It is important to mention that trade types and price/quality ranges are two distinctand strictly independent notions. For example, two-way trade in similar products can bedone in different European price segments. Likewise, two-way trade in verticallydifferentiated products can be done in the same market segment.
Let us consider country A's trade relations with partners B to G for a given product(Figure 1). Price/quality ranges are defined using the 15% thresholds around the averageEuropean unit value. In this illustration, A's trade with partners B and C is two way-tradein similar products, and two-way trade in vertical differentiation with D and E (since thetrade flows are outside the brackets). There are one-way exports to F (with only littleimports) and one-way imports from G (with little exports). The two notions are thusstrictly independent. For example, two-way trade in similar products can be done indifferent European price segments (with partner B). Likewise, two-way trade in verticallydifferentiated products can be done in the same market segment (with country D).

CEPII, document de travail n° 97-07
39
Figure 1. Different configurations of trade types and price/quality ranges
0
50
100
150
200
Ave
rage
EC
uni
t val
ue=
100 Up-market
Middle-market
Down-market
85
115MX
X
X
M
M
M
B C D E
X
F
m
X
G
M
x
Two-way trade in similar products
Two-way trade in vertically differentiated
products
One-way trade
Note: Exports and imports indicated in uppercase (XM) means that there is significant overlap, andthus two-way trade. In case of one-way trade, only the majority flow is in uppercase, and thecorresponding minority flow in lowercase (Xm, xM).The brackets indicate the maximum gap between unit values for exports and imports for beconsidered similar. If two flows are within such a bracket, we consider them as horizontallydifferentiated, otherwise as vertically differentiated.
3.1.2. Harmonisation of trade data
The different indicators mentioned above are calculated using Eurostat data. Inorder to minimise the following two problems, we decided to "harmonise" the trade dataused in our study:
(a) double-declaration of the same trade flow in fob-cif;(b) no declarations for Greece, Portugal and Spain before their entry into the EC.
Each individual trade flow within the EC is declared twice, by the exporting country(fob) and by the importing one (cif). This, however, can cause a strong non-symmetry ofthe overall results. Tests have shown that the difference between two declarations cannotbe attributed solely to differences in fob and cif, since the transactions do not only differ interms of value, but also in terms of quantities. In addition to these problems, there are nodeclarations for Greece before 1981 and for Spain and Portugal before 1986.
The solution we adopted is harmonising all bilateral trade flows at the most detailedlevel of the classifications (so that harmonised exports from declaring country k to partner

Trade patterns inside the Single Market
40
k' for the product j will equal the harmonised imports of country k' from country k) byweighting the declarations of the importing country twice as much as those by theexporting country:
X MX M
kk jH
k kjH kk j k kj
' '' '= =
+ 23
Concerning data for Greece, Portugal and Spain before their entry into the EC, wederived them indirectly by using the declarations of the other member states: for example,French exports to Spain for a given product are used as a proxy for Spanish imports fromFrance. In that case, of course, bilateral trade flows between Greece, Portugal and Spaincannot be calculated before their respective entry into the EC.
3.2. Overall picture of the patterns of trade in all intra-EC trade
A well-known phenomenon in the economic literature is the rise of intra-industrytrade within the European Community. Let us examine the patterns of intra-EC trade overthe last 15 years at the most aggregated level, all countries and products taken together.
Figure 2 indicates both the traditional Grubel and Lloyd (GL) indicator as well asthe share of the three trade types in intra-EC trade from 1980 to 1994. The consideredtime period was characterised by an increase in intra-industry trade: the GL was around33% in the beginning of the 1980s, and gained rather regularly about five points until1994. While this observation comes as no surprise, as it is well documented in theliterature, the level of the GL might seem low when compared to other studies, but this is,of course, due to the level of disaggregation (calculated on a bilateral basis for some10,000 products).
The most important trade type in the beginning of the 1980s was one-way trade(with a share of some 45%). However, from the mid-1980s onwards, it started to decline.In that sense, the evolution of one-way trade is symmetric to the GL indicator and showsthat the preparation phase of the SEM was accompanied by a decrease in the share ofinter-industry trade in Europe. This, however, does not mean that SEM per se has causedthis event; it could be associated with other determinants which may have playedsimultaneously.
One of the value added of the method used here is to disentangle the correlativeincrease in intra-industry trade. At this level of presentation, in contrast to what is oftenimplicitly assumed, the rise in intra-industry trade in intra-EC trade does not concernhorizontally differentiated products, but products which are vertically differentiated. Infact, two-way trade in similar products remains rather stable and represents less than 20%of all intra-EC trade, whereas two-way trade in vertically differentiated products-associated with a qualitatively division of labour- increased from less than 35% in 1980 to1985 to more than 42% in 1994.

CEPII, document de travail n° 97-07
41
Figure 2. Evolution of trade types and the GL indicator in intra-EC trade, 1980-1994
80 81 82 83 84 85 86 87 88 89 90 91 92 93 9415
20
25
30
35
40
45
50
Two-way tradein similar products
Two-way tradein vertical differentiation
One-way-trade
Grubel & Lloyd
Source: Eurostat-Comext, calculations by the CEPII.
3.3. Analysis of industries
The 14 industries used in this study were determined in interaction of availablestatistics for the econometric model, thereby operating a trade-off between differentconstraints (see Table A-23 in the appendix).30
3.3.1. Share of industries in total intra-EC trade
Figure 3 shows that chemicals remained -with a share of some 15%- the mostimportant industry in intra-EC trade over the considered time period, followed by
30 Shortly, different sources of data have been used, including trade figures in different nomenclatures, and figures forproduction or industrial structures emanating from Eurostat and OECD.

Trade patterns inside the Single Market
42
non-electrical machinery31 and motor vehicles (some 12% in 1994). However, the relativeimportance of some of the industries changed substantially between 1980 and 1994.Among the industries which increased their share are chemicals, electrical machinery, andthe heterogeneous "other industries." In contrast, mining, quarrying and petroleumexperienced a sharp decline over the same time period (from some 12% to 4%).
Figure 3. Share of industries in intra-EC trade, 1980-1994
80 81 82 83 84 85 86 87 88 89 90 91 92 93 940
2
4
6
8
10
12
14
16
Other transport
Prof. goods
Motor vehicles
Chemicals
Other industries
Basic metals
Mining & quarrying
Food & beverages
Non met. minerals
Agriculture
Textiles
Wood & paper
Non elec. machinery
Elec. machinery
Source: Eurostat-Comext, calculations by the CEPII.
31 Non-electrical machinery, unfortunately, includes some automatic data processing equipment from section HS-84.

CEPII, document de travail n° 97-07
43
3.3.2. Evolution of the GL indicator by industry
Using the traditional Grubel & Lloyd index (Figure 4), and considering totalintra-EC trade, the nature of trade flows for the 14 industries is in general not surprising.Two groups of industries can be distinguished:
(a) industries in the first group are characterised by an important share of intra-industry trade. "Other transport equipment" shows up a large increase of the GL(to about 60% in 1994), and has an unexplainable value for 1982.32 Otherindustries with a higher than average degree of overlap are non electricalmachinery, professional goods and motor vehicles (GL of 45%); chemicals, woodand paper and electrical machinery as well as basic metals;
(b) For food & beverages, mining, quarrying & petroleum, as well as for agriculture,more than three quarter of trade is of an inter-industry nature and more than twothirds for textiles and non metallic minerals.
Figure 4. Evolution of the GL indicator in intra-EC trade by industry, 1980-1994
80 81 82 83 84 85 86 87 88 89 90 91 92 93 940
10
20
30
40
50
60
70
Other transport
Prof. goodsMotor vehicles
ChemicalsElec. machinery
Basic metals
Mining & quarrying
Food & beverages
Non met. minerals
Agriculture
Textiles
Wood & paper
Non elec. machinery
Source: Eurostat-Comext, calculations by the CEPII.
32 Concerning this industry, we cannot exclude a possible overestimation of intra-industry trade due to statisticalregimes.

Trade patterns inside the Single Market
44
3.3.3. Evolution of trade types by industry
Let us now examine the three trade types in order to disentangle the components ofIIT. Three groups of industries can be distinguished on the basis of their intra-Europeantrade types in 1994 (Table 3 and Figure 5):
(a) industries characterised by a high share of one-way trade (50% or more),suggesting a specialisation of member states along lines of comparative advantages:agriculture, mining, food and beverages, textiles as well as non metallic minerals;
(b) industries characterised by a high share of two-way trade in similar products, i.e.the "traditional" intra-industry trade based on varieties and excludingmacroeconomic adjustments are other transport equipment and motor vehicles, and,to a lesser extent, basic metals, chemicals and wood and paper products;
(c) industries characterised by an important share of two-way trade in verticallydifferentiated products, based on a specialisation along ranges of qualities areelectrical as well as non-electrical machinery, professional goods, and theheterogeneous "other industries."
Table 3. Share of trade types in intra-EC trade by industry
Industries Share in 1994(%)
Variation 1985 to 1994(% points)
Two-waytrade insimilar
products
Two-waytrade in
verticallydiff.
products
One-waytrade
Two-waytrade insimilar
products
Two-waytrade in
verticallydiff.
products
One-waytrade
Motor vehicles 40.4 41.8 17.8 19.1 1.9 -21.0Other transport 47.6 33.8 18.5 1.2 6.8 -8.0Non electr. machinery 14.4 58.1 27.5 -3.9 3.4 0.5Prof. goods 13.9 57.9 28.3 -3.9 0.4 3.5Electr. machinery 14.2 53.4 32.4 -0.4 -3.1 3.6Wood & paper 20.2 46.9 32.9 -3.3 10.1 -6.8Chemicals 20.3 45.5 34.3 -2.6 5.8 -3.3Other industries. 5.9 57.0 37.2 -6.0 2.0 3.9Basic metals 25.5 35.2 39.3 -2.0 6.1 -4.2Textiles 10.7 40.4 48.9 -3.2 9.2 -6.0Non met. minerals 11.6 38.7 49.7 1.3 0.0 -1.4Food & beverages 12.5 26.6 60.9 0.8 8.7 -9.5Mining & quarrying 19.6 12.6 67.8 4.4 -1.0 -3.4Agriculture 9.3 16.8 73.9 2.6 5.2 -7.8
All industries 19.2 42.3 38.5 2.0 3.1 -5.1Source: Eurostat-Comext, calculations by the CEPII.The industries are ranked according to the importance of two-way trade in all trade. Figures in boldindicate higher-than-EC-average shares (or variations).

CEPII, document de travail n° 97-07
45
Figure 5. Share of trade types in intra-EC trade by industry, 1994
One-way trade
Two-way tradein similar products
Two-way tradein vertically differentiated products
Agriculture
Min., quarr. & petr.
Food, bev. & tob.
Textiles
Other transportMotor vehicles
Elec. machinery
Chemicals
Non met. minerals
Prof. goodsWood & paper
Non elec. machinery
Basic metals
Other
Source: Eurostat-Comext, calculations by the CEPII.
Let us now examine the evolution over the 1980-94 period (Figure 6):
(a) A relative stability can be found both in industries characterised by a high share ofone-way trade (agriculture, mining, food and beverages, textiles and non metallicmineral products) and in those which already had high levels of two-way trade invertically differentiated products in the early 1980s (electrical and non electricalmachinery, and professional goods). In these industries, the predominant trade typeremains the same over the whole period. Despite the relative stability, IIT invertical differentiation increases slightly in most of these industries, especially intextiles and food and beverages.
(b) The global trend towards more IIT in vertically differentiated products can beobserved especially in chemicals, basic metals and wood and paper.

Trade patterns inside the Single Market
46
(c) Finally -besides other transport material which shows up erratic movements in thebeginning of the 1980s and the highest share of two-way trade in similar productsof all industries in the 1990s- the most impressive change is observed for motorvehicles: after a period of decreasing one-way trade associated with increasing two-way trade in vertically differentiated products over 1985-1992, a huge increase inIIT with horizontal differentiation pushes the latter IIT and inter-industry tradedown in the recent period. This phenomenon is certainly anything else than a flashincrease in the demand for vertical differentiation in Europe: one might interpret itin terms of a sharp cut in price discrimination practices of firms along memberstates' markets often referred to in the pre-completion period. This evolution wasexpected; but the extent of it, and its speed, suggest huge gains for Europeanconsumers of these products. If the SEM has had strong effects somewhere, itmight be in this industry.

CEPII, document de travail n° 97-07
47
Figure 6. Evolution of the GL indicator and the share of trade types in intra-ECtrade, 1980-1994
Agriculture
80 82 84 86 88 90 92 940
10
20
30
40
50
60
70
80
90
Two-way tradein similar products
Two-way tradein vertical
differentiation
One-way-trade
Grubel & Lloyd
Mining
80 82 84 86 88 90 92 940
10
20
30
40
50
60
70
80
90
Two-way tradein similar products
Two-way tradein vertical differentiation
One-way-trade
Grubel & Lloyd
Food & beverages
80 82 84 86 88 90 92 940
10
20
30
40
50
60
70
80
90
Two-way trade in similar products
Two-way tradein vertical differentiation
One-way-trade
Grubel & Lloyd
Textiles
80 82 84 86 88 90 92 940
10
20
30
40
50
60
70
80
90
Two-way trade in similar products
Two-way tradein vertical differentiation
One-way-trade
Grubel & Lloyd
Non metallic minerals
80 82 84 86 88 90 92 940
10
20
30
40
50
60
70
80
90
Two-way trade in similar products
Two-way tradein vertical differentiation
One-way-trade
Grubel & Lloyd

Trade patterns inside the Single Market
48
Figure 6 continued
Electrical machinery
80 82 84 86 88 90 92 940
10
20
30
40
50
60
70
80
90
Two-way trade in similar products
Two-way trade invertical differentiation
One-way-trade
Grubel & Lloyd
Non electrical machinery
80 82 84 86 88 90 92 940
10
20
30
40
50
60
70
80
90
Two-way trade in similar products
Two-way tradein vertical differentiation
One-way-trade
Grubel & Lloyd
Professional goods
80 82 84 86 88 90 92 940
10
20
30
40
50
60
70
80
90
Two-way trade in similar products
Two-way tradein vertical differentiation
One-way-trade
Grubel & Lloyd
Chemicals
80 82 84 86 88 90 92 940
10
20
30
40
50
60
70
80
90
Two-way trade in similar products
Two-way tradein vertical differentiation
One-way-tradeGrubel & Lloyd
Basic metals
80 82 84 86 88 90 92 940
10
20
30
40
50
60
70
80
90
Two-way tradein similar products
Two-way tradein vertical
differentiation
One-way-trade
Grubel & Lloyd
Wood and paper
80 82 84 86 88 90 92 940
10
20
30
40
50
60
70
80
90
Two-way trade in similar products
Two-way tradein vertical differentiation
One-way-trade
Grubel& Lloyd

CEPII, document de travail n° 97-07
49
Figure 6. continued
Motor vehicles
80 82 84 86 88 90 92 940
10
20
30
40
50
60
70
80
90
Two-way tradein similar products
Two-way tradein vertical differentiation
One-way-trade
Grubel& Lloyd
Other transport
80 82 84 86 88 90 92 940
10
20
30
40
50
60
70
80
90
Two-way tradein similarproducts
Two-way tradein vertical
differentiation
One-way-trade
Grubel & Lloyd
Source: Eurostat-Comext, calculations by the CEPII.
3.4. Analysis of member states
This section examines the nature of trade of member states in intra-EC trade. Theenlargement of the European Community, with the accession of new members (Greece,Portugal and Spain) in the 1980s and the German unification in the beginning of the1990s, had an impact on the weight of the member states in total intra-EC-trade.
3.4.1. Share of member states in total intra-EC-trade
Figure 7 indicates the share of member states in total intra-EC-trade. This permitsto identify three groups of countries according to their relative importance:
(a) the two major European economies, Germany and France, account together foraround 40% of all intra-EC trade;
(b) four countries have a similar, relative share in intra-EC trade (between 10% and12%): the United Kingdom and Italy, as well as two smaller, highly open ones,largely turned towards the European market: the Netherlands andBelgium-Luxembourg;
(c) the last group includes smaller countries (Denmark and Ireland) as well asnewcomers (Greece, Portugal and Spain). Except for Spain in the last period, thesecountries have each a weight of between 1% and 2% of total intra-EC-trade.

Trade patterns inside the Single Market
50
The main changes over the considered time period occurred in this latter group ofcountries, which justifies the interest for "Southern" European countries. Note that thereare no declarations for Greece, Portugal and Spain before their entry into the EC. Theirtrade flows are derived indirectly by using the declarations of the other member states. Inthat case, of course, bilateral trade flows between Greece, Portugal and Spain could not becalculated before their entry into the EC. While for Greece, the "statistical" accessioneffect (which should have happened in 1982) is negligible, the inclusion of bilateralSpanish-Portuguese trade data after 1986 explains the sudden rise of the relative tradeshares of these two countries between 1985 and 1986. However, and in contrast to Greece,Spain and Portugal continued to increase their share in overall EC-trade after theiradhesion the European Community. This increase for Spain and Portugal is largelypredictable on the basis of the traditional theoretical arguments as far as these countrieswere fundamentally separated by a high economic distance33 from other member states.In contrast, this argument does not hold for Greece. In addition, it is very difficult todisentangle between the effects due to their accession and those due to the Single market.
Figure 7. Share of member states in intra-EC trade, 1980-1994
80 81 82 83 84 85 86 87 88 89 90 91 92 93 940
2.5
5
7.5
10
12.5
15
17.5
20
22.5
25
27.5
France
Germany
Belgium-Lux.
United Kingdom
Netherlands
Spain
Italy
IrelandDenmark
PortugalGreece
Bilateral trade flows between Greece, Portugal and Spain are not taken into account before theirentry into the EC.Source: Eurostat-Comext, calculations by the CEPII.
33 One refers here to differences in income per capita, factor endowments, technological level, which are thetraditional determinants of inter-industry trade.

CEPII, document de travail n° 97-07
51
3.4.2. Evolution of the GL indicator by country
Figure 8 shows the evolution of intra-industry trade (as measured by the Grubel andLloyd indicator) between 1980 and 1994 for each member country, as well as the ECaverage.
France and Germany show up the highest values of the GL (about 42% in 1994),followed by Belgium-Luxembourg, the United Kingdom and the Netherlands. In contrast,Greece's, and, to a lesser extent, Portugal's trade with other EC-members is largelydominated by inter-industry trade flows.
While intra-industry trade increased for most countries, the rise is most importantfor Portugal and Spain: between 1980 and 1994, the GL almost quadrupled for Portugal(from the very low level of 5% to more than 18%) and doubled for Spain (from 17% to32%, at par with Italy). Note that the rise of intra-industry trade for Spain and Portugalbegan well before their entry into the EC.
As a result of diverging transformations in trade structures, the ranking of Europeancountries in terms of intra-industry trade has been largely modified over the period(Figure 8). Spain is the most outstanding country: at the ninth place in terms of the GL in1980, it overtook Ireland and Denmark, and is at par with Italy in 1994, gaining 3 ranks.
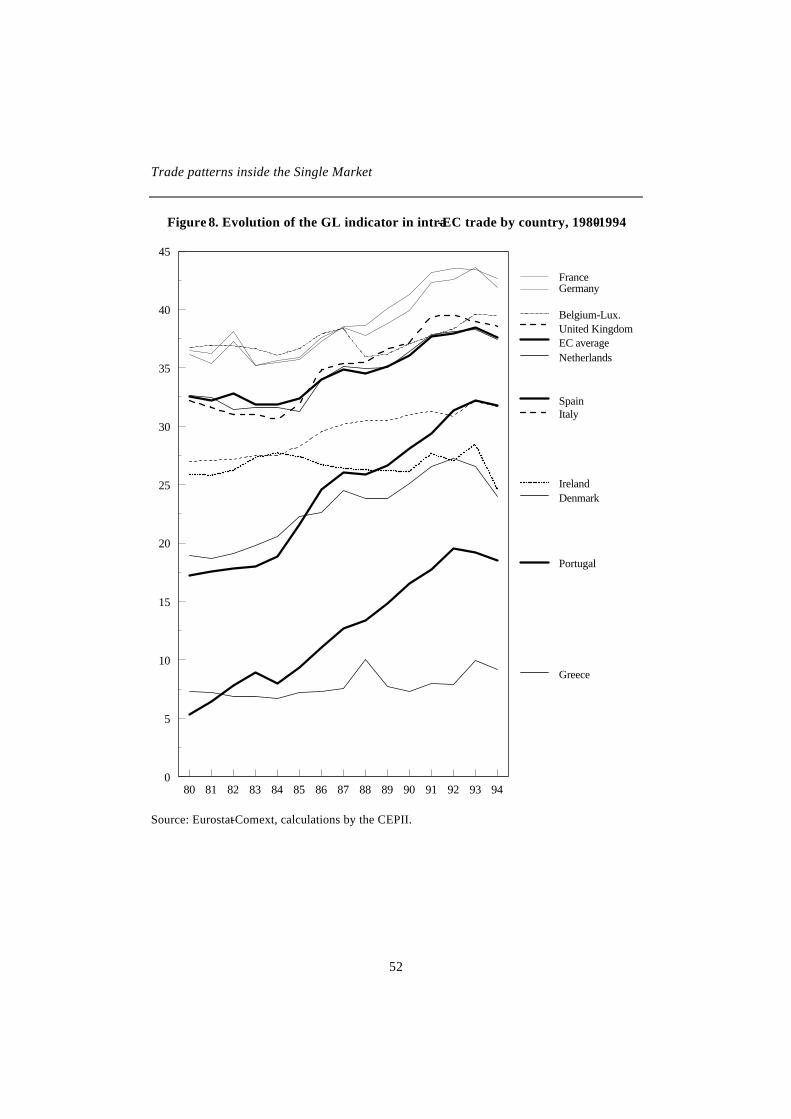
Trade patterns inside the Single Market
52
Figure 8. Evolution of the GL indicator in intra-EC trade by country, 1980-1994
80 81 82 83 84 85 86 87 88 89 90 91 92 93 940
5
10
15
20
25
30
35
40
45
FranceGermany
Belgium-Lux.United KingdomEC averageNetherlands
SpainItaly
IrelandDenmark
Portugal
Greece
Source: Eurostat-Comext, calculations by the CEPII.

CEPII, document de travail n° 97-07
53
Table 4. Ranking of European countries by the importance of intra-industry trade(GL indicator, all industries)
Rank 1980 1987 1994
1 France France, Germany, Belgium-Lux. France2 Belgium-Lux. Germany3 Germany Belgium-Lux.4 Netherlands United-Kingdom United-Kingdom5 United-Kingdom Netherlands Netherlands6 Italy Italy Spain, Italy7 Ireland Ireland8 Denmark Spain Ireland9 Spain Denmark Denmark10 Greece Portugal Portugal11 Portugal Greece Greece
Source: Eurostat-Comext, calculations by the CEPII.
3.4.3. Evolution of trade types by country
After a presentation of the results based on the traditional Grubel and Lloydindicator, we present the relative importance of the three trade types (Table 5). Twogroups of countries can roughly be distinguished,
(a) The first group is composed of countries characterised by a high share of intra-industry trade. Two-way trade in similar products is particularly important forFrance, Belgium-Luxembourg and Germany, and two-way trade in verticallydifferentiated products for the United Kingdom, Germany and France. Due to itsrapid convergence towards the trade structure of the more developed Europeancountries, Spain is now part of this group and shows up a situation close to Italy's.
(b) Countries in the second group are characterised by an inter-industry specialisation.This phenomenon is particularly true for Greece, whose trade is almost completelyof an inter-industry nature; a situation which, in contrast to Portugal, has hardlychanged since 1987. As far as the countries in this group engage in intra-industrytrade, two-way trade is predominantly done in goods differing by quality. At theexception of Denmark, the countries (Greece, Portugal, Ireland) have rather lowlevels of economic development.
Even if the rise in two-way trade (be it in horizontal or vertical productdifferentiation) is most pronounced for Spain (+12 percentage points) and for Portugal(+9), the overall rise in intra-industry trade within the EC (as also seen in Figure 2)cannot be attributed to these two countries, as the EC-average hardly changes once Spainand Portugal are excluded. In fact, two-way trade is increasingly important for most

Trade patterns inside the Single Market
54
countries, the exceptions being Ireland and Denmark who show up a slight decrease overthe 1987-1994 period.
Table 5. Share of trade types in intra-EC trade by country
Country Share in 1994(%)
Variation 1987 to 1994(% points)
Two-waytrade insimilar
products
Two-waytrade in
verticallydiff.
products
One-waytrade
Two-waytrade insimilar
products
Two-waytrade in
verticallydiff.
products
One-waytrade
France 24.1 44.3 31.6 2.8 3.6 -6.4Germany 20.5 46.9 32.6 1.9 3.4 -5.4Belgium-Lux. 23.2 42.0 34.8 1.6 2.2 -3.8United Kingdom 16.5 47.9 35.6 -1.9 8.9 -7.0Netherlands 18.9 41.9 39.3 -0.3 5.1 -4.8Spain 18.9 35.2 45.9 8.7 3.3 -12.0Italy 16.2 36.9 46.9 5.8 -3.1 -2.8Ireland 7.9 34.4 57.7 -0.9 -1.3 2.2Denmark 8.1 31.9 60.0 -1.1 -0.0 1.1Portugal 7.5 23.9 68.6 3.9 4.8 -8.6Greece 3.7 10.3 86.0 0.8 -0.6 -0.2
EC-12 19.2 42.3 38.5 2.0 3.1 -5.1EC without Spainand Portugal
19.5 43.1 37.4 1.7 3.3 -5.0
Source: Eurostat-Comext, calculations by the CEPII.The countries are ranked according to the importance of two-way trade in all trade. Figures in boldindicate higher-than-EC-average shares (or variations).
Figure 9 shows the evolution of the shares of trade types by countries for the years1980, 1987 and 1994 and Figure 10 for 1994 only. As already mentioned, the advantagecompared to traditional presentations showing the GL over time is that an increase of thatlatter indicator (increase in intra-industry trade) translates into a downward movement inthe triangle (away from one-way trade towards two-way trade), but it also indicateswhether the change is towards two-way trade in horizontal differentiation (movement tothe left) or in vertical differentiation (to the right).
Notice that all countries are on the right side in the triangle: independent of theshare of two-way trade in all intra-EC trade, for each country, two-way trade is moreimportant for vertically differentiated products than for similar products. However, thisphenomenon, the pre-eminent feature of intra-European trade, received little attention inthe theoretical literature when compared to intra-industry trade in horizontaldifferentiation. It nevertheless underlines the particular interest of the question on which

CEPII, document de travail n° 97-07
55
market segment different member states are positioned, question which will be addressedin the following section.
Concerning the question addressed in Section 2 on the fears for potential divergenceamong European countries associated with a possible increase of specialisation along linesof comparative advantage through agglomeration effects in Europe. For all countries, tothe exception of Greece and Ireland, two-way trade (be it in horizontal or verticaldifferentiation) became increasingly important, the movement being most pronounced forPortugal and Spain. At least at this level of aggregation, it appears that theoreticallypossible agglomeration effects, detrimental to European cohesion, are not empiricallyobserved.
Two provisional explanations for this overall result might be suggested here:
(a) first of all, factor mobility, which has been favoured by the SEM, implies foreigndirect investment flows towards low per capita income countries. In accordance tothe traditional theory of factor endowments, returns on capital are expected to behigh in countries with lower endowment in capital per unit of labour. Possibly, FDImight have engaged Southern European countries in a rapid convergence of tradestructures to those observed in Northern ones.
(b) on the same time, structural funds engaged by the Community are expected tosmooth the transition period for these countries.
Lastly, it has to be borne in mind that other factors may have played an importantrole: the real convergence between countries pushes towards more intra-industry trade, asthe general increase in income in Europe, and, possibly, the development of industriescharacterised by high level of economies of scale etc. As a result, we do have to wait untilSection 7 before interpreting the present results in terms of effects associated with theSingle Market: the econometric model will shed light on an anti-monde which will give aslightly different interpretation
At this stage, it is difficult to assess the impact of the completion of the SEM onthese events; the econometric modelling developed below will identify the impact of NonTariff Barriers cancellation combined with a surge of intra-European Foreign directInvestment associated with the Single Market. Complex relationships will be identified,which exclude any interpretation of figures at this stage. It will be simply kept in mindthat intra-industry trade on a bilateral basis has grown very fast in the past decade, anevent which appeared simultaneously to the completion of the SEM and to the integrationof new -Southern- partners in the Community.

Trade patterns inside the Single Market
56
Figure 9. Share of trade types in intra-EC trade by country, 1980, 1987 and 1994
One-way trade
Two-way tradein similar products
Two-way tradein vertically differentiated products
GR
P
DKIRL
NL
DF
BL
EI
UK
Source: Eurostat-Comext, calculations by the CEPII.

CEPII, document de travail n° 97-07
57
Figure 10. Share of trade types in intra-EC trade by country, 1994
One-way trade
Two-way tradein similar products
Two-way tradein vertically differentiated products
Greece
Portugal
Denmark
Ireland
ItalySpain
United Kingdom
Netherlands
GermanyFrance
Belg.-Lux.
Source: Eurostat-Comext, calculations by the CEPII.
Let us examine in more detail the trade adjustments which occurred for theEuropean countries. If, in 1980, one-way trade was the predominant trade type for allcountries, Table 5 nevertheless helped distinguishing two groups of countries: countrieswhere two-way trade is now predominant and those for which one-way trade remains themain trade type. Notice the difference of the scale between Figure 11 (55%) and Figure 12(100%).
(a) The countries of the first group (Figure 11) show up a high share of two-way trade.For each of these countries, one-way trade represented the most important tradetype in 1980, but has fallen since the mid-1980s by some 10 to 15 points, the dropbeing most pronounced for the United Kingdom. The correlative increase in two-way trade is mostly due to a rise in two-way trade in vertically differentiatedproducts, representing now the most important trade type for all countries: for

Trade patterns inside the Single Market
58
France and Germany since 1986, for Belgium-Luxembourg and the UnitedKingdom34 since 1989 and Netherlands since 1992.
(b) The six countries in the second group (Figure 12) are still characterised by a highshare of one-way trade. Four of them show up a relative stability: Italy, Ireland,Denmark and especially Greece. In fact, Greece's trade relations with its EC-partners hardly changed during the considered time period. In 1980 as in 1994,some 85% of its intra-EC trade remain of an inter-industry nature, two-way trade insimilar products being negligible. In contrast, Portugal, and even more so Spain,experienced remarkable changes in trade patterns. Trade structures moved towardsthose observed in more developed countries. Unlike countries like Germany orFrance, whose increase in two-way trade is mostly due to trade in verticallydifferentiated products, Spain and Portugal experienced an increase of two-waytrade in horizontally and vertically differentiated products. While one-way tradestill remains at a rather high level for Portugal, the nature of Spanish trade is nowcomparable to the one observed in Italy.
34 While being based on a different methodology, the results for the United-Kingdom are compatible with the ones putforward by Greenaway, Hine and Milner (1994 and 1995).

CEPII, document de travail n° 97-07
59
Figure 11. Evolution of the GL indicator and the share of trade types in intra-ECtrade, 1980-1994
United Kingdom
80 82 84 86 88 90 92 940
5
10
15
20
25
30
35
40
45
50
55
Two-way trade in similar products
Two-way tradein vertical
differentiation
One-way-trade
Grubel & Lloyd
France
80 82 84 86 88 90 92 940
5
10
15
20
25
30
35
40
45
50
55
Two-way trade in similar products
Two-way tradein vertical
differentiationOne-way-trade
Grubel& Lloyd
Germany
80 82 84 86 88 90 92 940
5
10
15
20
25
30
35
40
45
50
55
Two-way trade in similar products
Two-way tradein vertical
differentiation
One-way-trade
Grubel& Lloyd
Netherlands
80 82 84 86 88 90 92 940
5
10
15
20
25
30
35
40
45
50
55
Two-way trade in similar products
Two-way tradein vertical
differentiationOne-way-trade
Grubel& Lloyd
Belgium-Luxembourg
80 82 84 86 88 90 92 940
5
10
15
20
25
30
35
40
45
50
55
Two-way trade in similar products
Two-way tradein vertical
differentiation
One-way-trade
Grubel& Lloyd
Source: Eurostat-Comext, calculations by the CEPII.Notice the difference of the scale between Figure 11 (55%) and Figure 12 (100%).

Trade patterns inside the Single Market
60
Figure 12. Evolution of the GL indicator and the share of trade types in intra-ECtrade, 1980-1994
Italy
80 82 84 86 88 90 92 940
10
20
30
40
50
60
70
80
90
100
Two-way trade in similar products
Two-way trade in vertical diff.
One-way-trade
Grubel & Lloyd
Denmark
80 82 84 86 88 90 92 940
10
20
30
40
50
60
70
80
90
100
Two-way trade in similar products
Two-way tradein vertical differentiation
One-way-trade
Grubel & Lloyd
Ireland
80 82 84 86 88 90 92 940
10
20
30
40
50
60
70
80
90
100
Two-way trade in similar products
Two-way tradein vertical differentiation
One-way-trade
Grubel & Lloyd
Spain
80 82 84 86 88 90 92 940
10
20
30
40
50
60
70
80
90
100
Two-way tradein similar products
Two-way tradein vertical differentiation
One-way-trade
Grubel & Lloyd
Portugal
80 82 84 86 88 90 92 940
10
20
30
40
50
60
70
80
90
100
Two-way tradein similar products
Two-way tradein vertical differentiation
One-way-trade
Grubel& Lloyd
Greece
80 82 84 86 88 90 92 940
10
20
30
40
50
60
70
80
90
100
Two-way tradein similar products
Two-way tradein vertical
differentiation
One-way-trade
Grubel& Lloyd
Source: Eurostat-Comext, calculations by the CEPII.Notice the difference of the scale between Figure 11 (55%) and Figure 12 (100%).
Finally, Table 6 shows the relative importance of the three trade types in bilateraltrade in 1994 (complete figures can be found in Figure A-32).

CEPII, document de travail n° 97-07
61
(a) Bilateral two-way trade in similar products represents almost a third of all bilateraltrade between Belgium-Luxembourg and the Netherlands, and more than a quarterfor the couples France-Belgium-Luxembourg, France-Germany as well as for Italy-Spain. The presence of the latter country may seem somewhat surprising, but asexamined above, due to its rapid convergence towards the trade structure of themore developed European countries, Spain shows up a situation close to... Italy's.By the way, Spain also shows up above-EC-average shares in its trade with Franceand the United Kingdom. In contrast, less than 1 percent of Greece's trade withPortugal, Denmark, the Netherlands and Belgium-Luxembourg concerns two-waytrade in similar products. Bilateral two-way trade in similar products seems mostimportant for countries which are economically and geographically close.
(b) More than half of British trade with Germany, Belgium-Luxembourg and theNetherlands concerns two-way in vertically differentiated products. Note also thepredominance of this trade category for French-German trade. In contrast, thistrade type is again negligible for Portugal-Greece and Portugal-Ireland.
(c) The share of one-way trade -by construction the complement of the two formertrade types to 100% - is particularly high for bilateral trade among Southerncountries or between Southern and Northern countries: bilateral trade betweenGreece and Portugal is almost exclusively one-way trade, whereas this traderepresents only 17% of French-German trade. This suggests that the level ofeconomic development and the market size might also play a major role.
In general, South-South trade is characterised by one-way trade, and North-Northtrade by two-way trade (predominantly in vertical, but also in horizontal differentiation). IfSouthern countries engage in two-way trade, it is predominantly in vertical differentiationwith Northern countries. At this level of analysis -and notwithstanding sectoral effects- itseems that economic and geographic proximity, as well as the level of economicdevelopment and the market size favour two-way trade.

Trade patterns inside the Single Market
62
Table 6. Share of trade types in bilateral trade, 1994
Most important Least important
Two-way trade in similar products31.4 Belgium-Lux. Netherlands 0.2 Greece Portugal29.0 France Belgium-Lux. 0.4 Denmark Greece28.2 France Germany 0.6 Netherlands Greece25.7 Italy Spain 0.6 Belgium-Lux. Greece24.6 Belgium-Lux. Germany 1.2 Italy Ireland24.5 France Spain 1.3 France Greece24.3 France UK 1.4 Denmark Portugal22.9 France Italy 1.5 Ireland Portugal20.7 Netherlands Germany 1.6 Greece Spain19.8 UK Spain 1.6 France Ireland19.2 EC-average 1.9 Germany Ireland
Two-way trade in vertically differentiated products56.8 Germany UK 1.5 Greece Portugal55.4 Belgium-Lux. UK 3.9 Ireland Portugal54.8 France Germany 4.9 Netherlands Greece51.1 Netherlands UK 4.9 Denmark Greece46.4 UK Ireland 5.5 Greece Spain44.4 France UK 7.7 Italy Greece44.3 Netherlands Germany 7.9 Belgium-Lux. Greece43.6 Belgium-Lux. Netherlands 8.6 Ireland Spain43.3 Germany Italy 9.4 Denmark Portugal42.7 Italy UK42.4 France Netherlands42.3 Belgium-Lux. Germany42.3 EC-average
One-way trade98.4 Greece Portugal 17.0 France Germany94.8 Denmark Greece 24.9 Belgium-Lux. Netherlands94.6 Ireland Portugal 25.1 Germany UK94.4 Netherlands Greece 29.7 France Belgium-Lux.92.9 Greece Spain 31.3 France UK91.6 Belgium-Lux. Greece 32.5 Netherlands UK89.2 Denmark Portugal 33.1 Belgium-Lux. Germany87.7 Ireland Spain 35.0 Netherlands Germany87.1 Italy Greece 35.9 Belgium-Lux. UK85.3 UK Greece 36.5 France Spain83.7 Netherlands Portugal 38.5 EC-average83.6 Denmark Spain82.7 Italy Ireland81.7 France Greece81.3 Germany Greece80.9 UK Portugal

CEPII, document de travail n° 97-07
63
3.4.4. Analysis of price/quality ranges by country
The results obtained by disentangling intra-EC by trade types suggest that the1980-1994 period is characterised by an increase in two-way trade in verticallydifferentiated products, i.e. simultaneous exports and imports of products with the same,principle technical characteristics, but under different prices (unit values).
Intra- EC trade as a whole
In order to better understand this "qualitatively division of labour" within Europe,we defined three European price/quality ranges (up-market, middle-market and down-market products). For each of the 10,000 products, the same 15% threshold fordifferences in unit values around the EC-average was applied for every year.
If unit values differences were essentially determined by discrimination in pricesassociated with counter-competitive practices, the share of middle-market products shouldhave increased, since the second half of the considered time period saw the announcementand completion of the SEM, intending to cutting down anti-competitive practices.
However, Figure 13 shows that while remaining the most important marketsegment, middle-market products saw their share actually decline (by some 15 points).This means that the dispersion of unit values has grown throughout the last 15 years: thedecrease in the share of trade in medium range products suggests that differences in unitvalues reflect essentially differences in quality.
From a policy point of view, a theoretical argument referred to above must be bornein mind when interpreting the results below: products sold at significantly different priceson the same market are outputs of distinctive production functions. High quality meansmore R&D, a higher qualification of labour, specific organisation of internal procedures offirms etc. Therefore, the range on which countries specialise is not "neutral" from a policypoint of view.
Keeping this interpretation in mind, the correlative increase of trade in top and lowquality products means a specialisation of countries over the quality spectrum, a samecriteria (the 15% difference in unit values) pushing a growing part of trade outside theboundaries.
The choice of using the same criteria over the whole period was made since thealternative -calibrating the criteria in order to keep the medium range constant- would nothave picked up this phenomenon of specialisation. A consequence of this choice is toimply the introduction of a trend of quality differences by industry in the econometricmodel. As referred to below, an indictor of product differentiation will be used in theeconometric model in order to control this effect.

Trade patterns inside the Single Market
64
Figure 13. Evolution of intra-EC trade by price/quality range, 1980-1994
80 81 82 83 84 85 86 87 88 89 90 91 92 93 945
10
15
20
25
30
35
40
45
50
55
60
65
Down-market
Medium-market
Up-market
Source: Eurostat-Comext, calculations by the CEPII.
Intra-EC trade structure for member countries
In 1994, the structure of imports, according to the price/quality criteria used here, isso close among the EC member states that virtually no "outlier" country can be identified(Table 7): concerning the "demand" side, patterns of consumption at this aggregated levelseem to be very "harmonised".
The situation is rather different when we look at exports, these exports reflecting thespecialisation of countries along the quality spectrum in each industry. Thus, afteraggregation over all industries, some EC countries are specialised on down marketsegments, whereas other countries are specialised on top quality products. Here, we canclearly distinguish the Southern countries which joined the EC in the 1980s (Greece,Portugal and Spain), plus Italy, whose exports are primarily made of down- ormiddle-market products. On the other extreme, more than 50% of Irish exports are in the

CEPII, document de travail n° 97-07
65
up-market segment, followed by Germany, Denmark, the United Kingdom, and, to a lesserextent, by France.
These contrasted results suggest that the dispersion among member states ofconsumption structures along the quality spectrum are smaller than the dispersion ofproduction structures: German and Italian consumers buy different qualities inapproximately the same proportions (due to "identical" preferences as revealed by importsfrom other EC countries), but German producers are on the whole specialised on high unitvalues products, contrary to Italian ones.
If these preliminary results for Germany seem to be compatible with the image ofthe label "made in Germany", expensive but supposedly high-quality products, it is moredifficult to identify the reasons associated with the performance of Ireland. In this lattercase, the role of foreign affiliates using this country as a location of assembly lines devotedto the furniture of the European market is certainly leading. The import content of highquality exports is relatively high is this case35. Of course, these results at amacroeconomic level have to be interpreted with care, but analyses developed below at amore detailed level confirm these first results.
Table 7. The countries' price/quality structure of exports and imports in intra-ECtrade, 1993/94
Country Exports(%)
Imports(%)
Down Medium High Down Medium HighIreland 21.3 24.9 53.8 28.3 30.3 41.4Germany 14.0 38.6 47.4 14.2 46.4 39.4Denmark 19.8 38.4 41.7 20.8 32.9 46.3United Kingdom 20.5 39.1 40.5 21.8 36.7 41.6France 14.9 45.2 39.9 19.2 44.1 36.7Netherlands 15.4 50.9 33.7 19.6 45.2 35.2Italy 28.5 39.4 32.2 15.1 43.7 41.2Belgium-Lux. 18.1 50.0 31.9 19.9 45.2 34.9Greece 31.0 42.3 26.7 21.5 37.0 41.6Portugal 34.1 39.6 26.3 22.8 41.0 36.2Spain 28.9 48.0 23.1 23.8 40.4 35.8
EC-12 18.7 42.9 38.4 18.7 42.9 38.4
Source: Eurostat-Comext, calculations by the CEPII.
Figure 14 shows the evolution of intra-EC exports by price/quality range over 1980to 1994. Concerning Ireland, Germany, Denmark and the United-Kingdom, the mainfeature of export patterns is certainly the fact that up-market products are leading in thefinal period, after having increased their share throughout the period considered here.Up-market products now account for more than 50% for Ireland, nearly half of Germanexports, and 40% of Danish and British exports. But this increase in quality of products
35 See Fontagné, Freudenberg, Ünal-Kesenci (1995).

Trade patterns inside the Single Market
66
over time has been obtained through a sharp decrease of medium market products, notlower ones. In contrast, simultaneously, the share of down-market products has increasedin all these countries’ exports.
Quality ranges are sometimes interpreted in terms of a response to exchange ratespressure on exporters, countries with appreciating currencies being pushed to up-grade intheir specialisation in order to balance declining market shares in volume. In contrast,producers from countries with depreciating currencies may be able to compete on the basisof lower prices, feeling less obliged to up-grade and may therefore persist in producing agiven (lower) quality. The similar evolution for Germany and United-Kingdom, twocountries which recently had opposite strategies concerning their respective exchangerates, raised this interpretation into doubt: British exporters have not been drivendownward the quality spectrum.
Concerning Southern countries, exporters are located mainly on the medium rangeof the price/quality spectrum. But as in most countries, exports in the medium-marketrange are decreasing. Down-market and up-market exports have an increasing share,which highlights the process of an in-depth specialisation of producers which is notoriented a priori against top quality products, contrary to the intuition, even if finallydown-market products account systematically for a larger share of exports than up-marketones.
Figure 15 shows the evolution of the price/quality structure of exports by countrybetween 1980, 1987 and 1994. All countries exported more up-market products in 1994than in 1980. However, the two sub-periods clearly show that for Southern countries, thetrend until 1987 was towards down-market products and towards up-market goodsthereafter. While they have not yet caught-up with the more advanced countries, this ahuge up-grading effect nevertheless suggests a certain convergence since 1987.

CEPII, document de travail n° 97-07
67
Figure 14. The countries' export structure by price/quality range in intra-EC trade
Ireland
80 82 84 86 88 90 92 940
10
20
30
40
50
60
70
80
Down-market
Medium-market
Up-market
Germany
80 82 84 86 88 90 92 940
10
20
30
40
50
60
70
80
Down-market
Medium-market
Up-market
Denmark
80 82 84 86 88 90 92 940
10
20
30
40
50
60
70
80
Down-market
Medium-market
Up-market
United Kingdom
80 82 84 86 88 90 92 940
10
20
30
40
50
60
70
80
Down-market
Medium-market
Up-market
France
80 82 84 86 88 90 92 940
10
20
30
40
50
60
70
80
Down-market
Medium-market
Up-market
Netherlands
80 82 84 86 88 90 92 940
10
20
30
40
50
60
70
80
Down-market
Medium-market
Up-market
Italy
80 82 84 86 88 90 92 940
10
20
30
40
50
60
70
80
Down-market
Medium-market
Up-market
Belgium-Lux.
80 82 84 86 88 90 92 940
10
20
30
40
50
60
70
80
Down-market
Medium-market
Up-market
Greece
80 82 84 86 88 90 92 940
10
20
30
40
50
60
70
80
Down-market
Medium-market
Up-market
Portugal
80 82 84 86 88 90 92 940
10
20
30
40
50
60
70
80
Down-market
Medium-market
Up-market
Spain
80 82 84 86 88 90 92 940
10
20
30
40
50
60
70
80
Down-market
Medium-market
Up-market
Source: Eurostat-Comext, calculations by the CEPII.
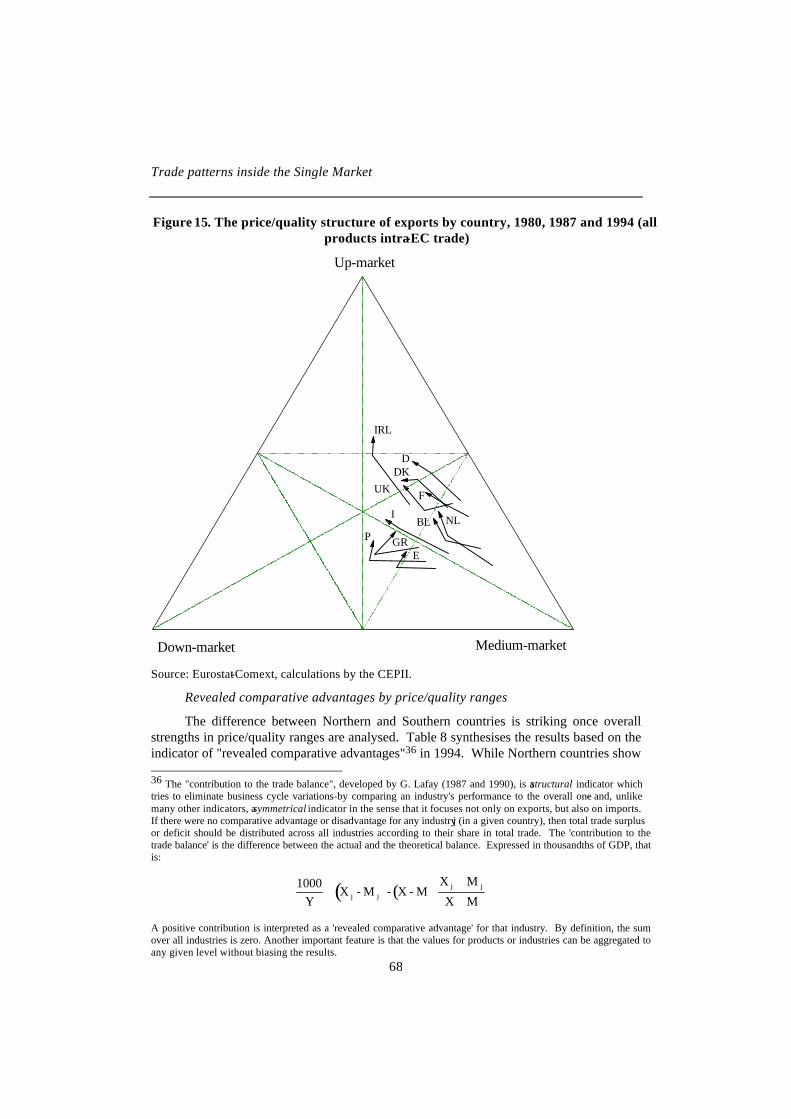
Trade patterns inside the Single Market
68
Figure 15. The price/quality structure of exports by country, 1980, 1987 and 1994 (allproducts intra-EC trade)
Up-market
Down-market Medium-market
F
I
D
BL NL
GRP
IRL
UKDK
E
Source: Eurostat-Comext, calculations by the CEPII.
Revealed comparative advantages by price/quality ranges
The difference between Northern and Southern countries is striking once overallstrengths in price/quality ranges are analysed. Table 8 synthesises the results based on theindicator of "revealed comparative advantages"36 in 1994. While Northern countries show 36 The "contribution to the trade balance", developed by G. Lafay (1987 and 1990), is a structural indicator whichtries to eliminate business cycle variations -by comparing an industry's performance to the overall one- and, unlikemany other indicators, a symmetrical indicator in the sense that it focuses not only on exports, but also on imports.If there were no comparative advantage or disadvantage for any industry j (in a given country), then total trade surplusor deficit should be distributed across all industries according to their share in total trade. The 'contribution to thetrade balance' is the difference between the actual and the theoretical balance. Expressed in thousandths of GDP, thatis:
( ) ( )1000Y
X - M - X - MX M
X M j j
j j
+
+
A positive contribution is interpreted as a 'revealed comparative advantage' for that industry. By definition, the sumover all industries is zero. Another important feature is that the values for products or industries can be aggregated toany given level without biasing the results.

CEPII, document de travail n° 97-07
69
up comparative advantages in up-market products (Ireland and Germany), in the medium-and up-market range (France) or in medium-market goods (United Kingdom, Netherlands,Belgium-Luxembourg and Denmark), Southern countries are specialised in the lowerquality range: down-or medium-market goods for Spain and Greece, and down-marketproducts for Italy and Portugal.
Table 8.The countries' strengths in intra-EC trade by price/quality range, 1994
Country Price/quality range
Down Medium High
Ireland +Germany +France + +United Kingdom +Netherlands +Belgium-Lux. +Denmark +Spain + +Greece + +Italy +Portugal +
Source: Eurostat-Comext and CEPII-CHELEM, calculations by the CEPII.An "+" represents a positive "contribution to the trade balance" of the price/quality ranges.
Figure 16 shows the evolution of the "contribution to the trade balance" byprice/quality range for selected countries. A positive value of that indicator can beinterpreted as a "revealed comparative advantage", a negative one as a comparativedisadvantage. By definition, the sum over the three categories is zero.
Germany's comparative advantages are in up-market products, as is the case forIreland. But for the two former countries, it must be pointed out that this traditionalpattern of specialisation sharply decreases in the early 1990s, a feature of trade patternswhich is difficult to interpret at this stage in the perspective of the completion of theSingle Market.
Italy highlights a symmetric location of comparative advantages along the qualityspectrum: this country has clearly made the choice of a cheaper currency and a lowerquality for products, a choice which is diametrically opposite to the one made by other"core countries" of the EC. It does not mean that this choice is a "bad" specialisation: themarket exhibits a demand for high and low quality products, and being the only largecountry strongly specialised in down-market products sold at a cheaper price might be aninteresting strategy.

Trade patterns inside the Single Market
70
Turning to the three "Southern" countries, patterns of comparative (dis)advantagesare those expected: these countries are disadvantaged for top quality products. But overtime, and this is more interesting, things have changed: in the early 1990s, theircomparative advantage for down-market products falls, whereas specialisation turnedeither towards top or middle quality products. The scenario of an integration to the ECbased on "residual" specialisation on down-market products, with its correlative adverseconsequences for the catching-up, is not borne out by the evidence at this stage.

CEPII, document de travail n° 97-07
71
Figure 16. Evolution of revealed comparative advantages in intra-EC trade byprice/quality ranges for selected countries, 1980-1994
Germany
80 82 84 86 88 90 92 94-20
-15
-10
-5
0
5
10
15
20
Down-market
Medium-market
Up-market
Ireland
80 82 84 86 88 90 92 94
-60
-40
-20
0
20
40
60
80
Down-market
Medium-market
Up-market
Italy
80 82 84 86 88 90 92 94
-15
-10
-5
0
5
10
15
Down-market
Medium-market
Up-market
Portugal
80 82 84 86 88 90 92 94
-40
-30
-20
-10
0
10
20
30
40
Down-market
Medium-market
Up-market
Spain
80 82 84 86 88 90 92 94
-15
-10
-5
0
5
10 Down-market
Medium-market
Up-market
Greece
Down-market
Medium-market
Up-market
80 82 84 86 88 90 92 94
-30
-20
-10
0
10
20
Source: Eurostat-Comext and CEPII-CHELEM, calculations by the CEPII.
Comparative advantages by industry and price/quality ranges
These overall results need nevertheless be examined at an industry level. Figure 17shows revealed comparative advantages by industry and price/quality range for all member

Trade patterns inside the Single Market
72
states in 1994. Table 9 synthesises the results by taking the five most important positive(strengths) and negative (weaknesses) values from Figure 17.
The patterns are quite contrasting across countries.
(a) Some countries are specialised in certain industries over the whole price/qualityspectrum: Denmark (agriculture) and Greece (textiles).
(b) Most countries also show up a rather strong industrial specialisation with two of thefirst five strengths in the same industry. Here we find the Netherlands (medium-followed by up-market agriculture), Italy (up- and medium market textiles anddown- and medium-market non electrical machinery), the United Kingdom (up-andmedium-market electrical machinery), Ireland (up- and medium-market nonelectrical machinery37), Portugal (medium- and down-market textiles and woodand paper products) as well as Spain (medium- and down-market motor vehiclesand agriculture).
(c) In this typology, Germany is a clear outlier. Its specialisation is not orientedtowards specific industries, but clearly towards a price/quality specialisation.Germany's five major strengths are all in up-market goods (motor vehicles, nonelectrical machinery, electrical machinery, chemicals and other transport).
For France and Ireland, the analysis by price/quality ranges yields an interestingfinding, as strengths and weaknesses can be found within the same industry. Ireland'smajor advantage is chemicals in the up-market segment, and its main disadvantageconcerns chemicals in the medium-market range! A symmetric observation can be madefor France for motor vehicles. These results are compatible with the predominance of two-way trade in vertically differentiated products in Europe, indicating a qualitatively divisionof labour. Another example concerns Germany and Italy, Europe's two major producers ofnon-electrical machinery: while Italy is specialised in down- and medium-market goods,Germany is specialised in the up-market segment in that industry. However, between1987 and 1994, Germany lost ground in almost all its high-priced key industries.
As mentioned before, one possible argument against our indicator based on relativeunit values concerns the impact of bilateral exchange rates variations on relative prices.Substantial deprecations can lead domestic producers to a higher competitiveness due tolower export prices, a phenomenon which in our methodology might be falsely interpretedas "lower quality", thus invalidating the (theoretical) link between relative prices andproduct quality. For example the overall specialisation in down-market products which wefound for Italy can be raised into doubt since it may be the result of the exchange ratedepreciation. However, an analysis at the industry level shows that currency depreciationhas not led Italy to down-market specialisation in its key industries: its first comparativeadvantage still concerns up-market textiles. The same remark can be made for the UnitedKingdom, showing up an up-market specialisation for chemicals. The findingsconcerning Italy and the United Kingdom may thus serve as an ex-post justification of our
37 As already mentioned in footnote 31, non-electrical machinery includes some automatic data processing equipment.

CEPII, document de travail n° 97-07
73
indicator of price/quality ranges, since these two countries are still able to sell at highprices in their key industries.
Table 9. The countries' five major strengths and weaknesses in intra-EC trade byprice/quality range, 1994
Country Major strengths Major weaknessesIndustry Price/quality range Industry Price/quality range
Down Medium High Down Medium High
France Motor vehicles M Non elec. machinery MAgriculture M Min.-extraction MOther manufacturing H Other transport HOther transport M Motor vehicles HMin.-extraction H Textiles D
Belgium-Lux. Motor vehicles M Other manufacturing MBasic metals M Other manufacturing DChemicals M Min.-extraction MTextiles M Other manufacturing HMotor vehicles H Non elec. machinery H
Netherlands Min.-extraction M Motor vehicles MAgriculture M Non elec. machinery HAgriculture H Non elec. machinery DOther manufacturing H Chemicals HFood and beverages M Textiles M
Germany Motor vehicles H Other manufacturing HNon elec. machinery H Min.-extraction MElec. machinery H Agriculture MChemicals H Agriculture HOther transport H Other transport M
Italy Textiles H Agriculture MNon elec. machinery D Elec. machinery HTextiles M Chemicals MNon elec. machinery M Chemicals HOther manufacturing H Motor vehicles M
United Kingdom Other manufacturing H Motor vehicles HChemicals H Motor vehicles DElec. machinery H Motor vehicles MElec. machinery M Food and beverages MOther transport M Agriculture M
Ireland Chemicals H Chemicals MAgriculture M Motor vehicles MFood and beverages H Basic metals MNon elec. machinery H Motor vehicles DNon elec. machinery M Textiles H
Denmark Agriculture M Motor vehicles MAgriculture H Chemicals MAgriculture D Motor vehicles DOther manufacturing H Elec. machinery HOther manufacturing D Chemicals H
Greece Food and beverages M Chemicals HTextiles M Motor vehicles MTextiles D Chemicals MTextiles H Non elec. machinery HMin.-extraction D Elec. machinery H
Portugal Textiles M Motor vehicles MTextiles D Agriculture MWood and paper M Chemicals HWood and paper D Motor vehicles HElec. machinery H Basic metals M
Spain Motor vehicles M Chemicals HMotor vehicles D Non elec. machinery HAgriculture M Chemicals MOther manufacturing M Non elec. machinery DAgriculture D Elec. machinery H
Source: Eurostat-Comext and CEPII-CHELEM, calculations by the CEPII.For each country, industries are ranked according to the "contribution to the trade balance" of therespective price/quality ranges.

Trade patterns inside the Single Market
74
Figure 17. Revealed comparative advantages by industry and price/quality range,1994 (intra-EC trade)
Down-market Medium-market Up-market
France
Agriculture
Other manuf.
Food & beverages
Motor vehicles
Chemicals
Other transport
Wood and paper
Non met. minerals
Elec. machinery
Basic metals
Professional goods
Min.-extractionTextiles
Non elec. machinery-3
-2
-1
0
1
2
3
4
Belgium-Lux.
Motor vehicles
Chemicals
Basic metals
AgricultureTextile
s
Non met. minerals
Wood and paper
Food & beverages
Elec. machinery
Other transport
Professional goods
Non elec. machinery
Min.-extraction
Other manuf.-30
-20
-10
0
10
20
30
Netherlands
Min.-extraction
Agriculture
Food & beverages
Other manuf.
Professional goods
Elec. machinery
Non met. minerals
Chemicals
Other transport
Wood and paperTextile
s
Basic metals
Non elec. machinery
Motor vehicles-15
-10
-5
0
5
10
15
20
25

CEPII, document de travail n° 97-07
75
Figure 17 continued
Down-market Medium-market Up-market
Italy
Textiles
Non elec. machinery
Other manuf.
Non met. mineral
s
Other transport
Basic metal
s
Wood and paper
Food & beverages
Professional g
oods
Min.-extrac
tion
Elec. machinery
Motor vehicles
Agriculture
Chemicals-6
-4
-2
0
2
4
6
Germany
Motor vehic.
Non elec. machinery
Chemicals
Elec. machinery
Professional g
oods
Basic metal
s
Wood and paper
Other transport
Non met. mineral
s
Food & beverages
Textiles
Other manuf.
Min.-extrac
tion
Agriculture
-6
-4
-2
0
2
4
6
United Kingdom
Other manuf.
Min.-extrac
tion
Elec. machinery
Chemicals
Professional g
oods
Other transport
Basic metal
s
Non elec. machinery
Non met. mineral
s
Wood and paperTextiles
Agriculture
Food & beverages
Motor vehicles-6
-4
-2
0
2
4
6
8

Trade patterns inside the Single Market
76
Figure 17 continued
Down-market Medium-market Up-market
Ireland
Non elec. mac.h
.
Agriculture
Food & beverages
Chemicals
Elec. machinery
Professional g
oods
Non met. mineral
s
Other transport
Other manuf.
Min.-extrac
tion
Wood and paperTextiles
Basic metal
s
Motor vehicles-20
-10
0
10
20
30
Denmark
Agriculture
Other manuf.
Food & beverages
Min.-extrac
tion
Wood and paper
Non met. mineral
s
Professional g
oods
Other transport
Textiles
Non elec. machinery
Basic metal
s
Elec. machinery
Chemicals
Motor vehicles-10
-5
0
5
10
15
20
Greece
Textiles
Food & beverages
Min.-extrac
tion
Agriculture
Basic metal
s
Other transport
Non met. mineral
s
Other manuf.
Professional g
oods
Wood and paper
Elec. machinery
Non elec. machinery
Motor vehicles
Chemicals-8
-6-4-202468
10
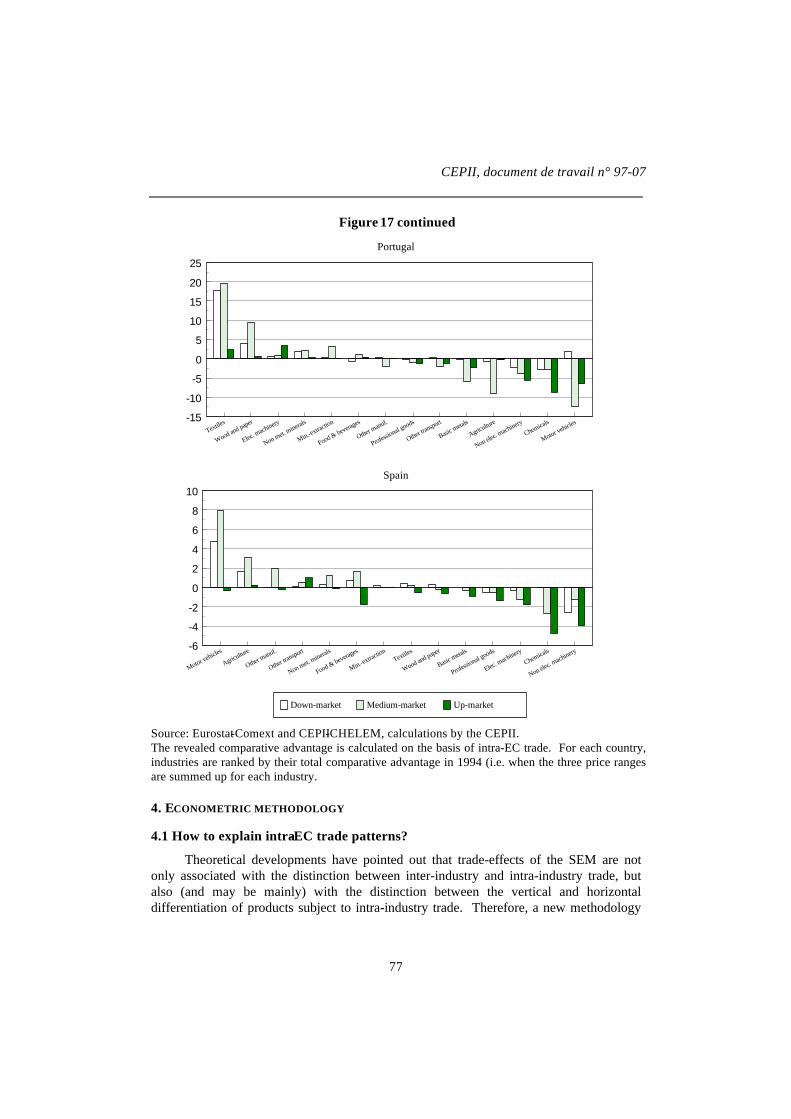
CEPII, document de travail n° 97-07
77
Figure 17 continued
Down-market Medium-market Up-market
Portugal
Textiles
Wood and paper
Elec. machinery
Non met. mineral
s
Min.-extrac
tion
Food & beverages
Other manuf.
Professional g
oods
Other transport
Basic metal
s
Agriculture
Non elec. machinery
Chemicals
Motor vehicles-15
-10
-5
0
5
10
15
20
25
Spain
Motor vehicles
Agriculture
Other manuf.
Other transport
Non met. mineral
s
Food & beverages
Min.-extrac
tionTextiles
Wood and paper
Basic metal
s
Professional g
oods
Elec. machinery
Chemicals
Non elec. machinery
-6
-4
-2
0
2
4
6
8
10
Source: Eurostat-Comext and CEPII-CHELEM, calculations by the CEPII.The revealed comparative advantage is calculated on the basis of intra-EC trade. For each country,industries are ranked by their total comparative advantage in 1994 (i.e. when the three price rangesare summed up for each industry.
4. ECONOMETRIC METHODOLOGY
4.1 How to explain intra-EC trade patterns?
Theoretical developments have pointed out that trade-effects of the SEM are notonly associated with the distinction between inter-industry and intra-industry trade, butalso (and may be mainly) with the distinction between the vertical and horizontaldifferentiation of products subject to intra-industry trade. Therefore, a new methodology

Trade patterns inside the Single Market
78
was developed, which disentangles two-way trade in horizontal differentiation and two-way trade in vertical differentiation.
4.1.1. The determinants of intra-EC trade patterns
It must be borne in mind that the consequence of this empirical evidence is ofconsiderable relevance, since the trade effects differ from IIT in horizontal differentiationand IIT in vertical differentiation: in the latter case, adjustment costs are potentially high,and specialisation along the quality spectrum inside each industry might have cumulativeeffects over time. These are potentially detrimental for countries specialising in lowerqualities.
But, at this stage, these findings must not be interpreted as the results of the SEMper se: potentially, catching-up, structural funds or exogenous explanations have played amajor role. And turning to the SEM, the relative impact of NTBs, transaction costs andFDI must be disentangled. The econometric modelling developed below will address thesequestions.
In order to isolate the impact of integration in Europe from other factors, we decidedto use econometric estimates combining country, market structure and integration asindependent variables explaining the nature of bilateral trade flows within the Community(Figure 18).
Figure 18. The determinants of bilateral trade flows
Bilateral trade flowsof products
Nature
Country
size
income
transaction costs
Industry
returns to scale
differentiation
Integration
NTBs
FDI / M&A
Exchange rate
Value
Country etc...
As referred to above, a careful measurement of the nature of trade flows -intra-industry or inter-industry trade- has to be based on the following principles:

CEPII, document de travail n° 97-07
79
(a) trade flows have to be taken into account at the bilateral level, therefore excludingtrilateral relationships for a same product, which are often identified, ambiguously,as IIT: a given flow has to be classified in the same category of trade, whatever thedeclaring country is. In short, we must cancel the traditional "geographic" bias ofaggregation.
(b) trade flows have to be measured at the most detailed level of industrialdisaggregation, in order to minimise the traditional "sectoral" bias of aggregation.
(c) IIT, when observed, must be disentangled in the trade of horizontally differentiatedproducts (in line with a SDS or Hotelling differentiation of products) and in tradeof vertically differentiated products.
(d) the share of each trade type in total trade (referred to as the "nature" of tradebelow), and the value of each trade flow, must be distinguished. For example, IITwith horizontal differentiation is both a value (for country k facing partner k’ inindustry j for year t), and a share (in total trade for country k facing partner k’ inindustry j for year t).
In accordance with these general rules, the results referred to in the previoussection, defining three types of trade, will be the basis of our econometric study: they willfeed our database of explained variables.
Two additional qualifications have to be pointed out:
(a) a time dimension has to be taken into account, covering the pre- and post-completion period;
(b) strong evidence is generally available for the market structures determinants oftrade, a feature which is extensively justified by models developed by the "NewInternational Economics". These effects have to be strictly controlled, since ourstudy covers all industries.
The next section develops the model estimated below, addressing its theoreticaljustifications. In a second section, the variables used are presented, and the choicesjustified. Another section is devoted to a panel analysis, which will identify the role of theSEM completion. The last section will go back to the industry dimension, estimatingequations industry by industry.
4.1.2. The model
Models integrating gravity variables à la Linnemann were initially developedwithout a satisfactory theoretical foundation, on a rather ad hoc basis. But they have beenextended in order to provide them with greater legitimacy.

Trade patterns inside the Single Market
80
Bergstrand (1990), in particular, was able to construct a general equilibrium model,tested in a partial equilibrium form, which permits the sign of parameters to beconstrained, and hence avoids specification errors.38
These models are often used to analyse the effects to trade preferences.39 They mayalso be used as an interesting tool in explaining the nature of trade, rather than its volume,the latter being their original object.
The advantage of this method is also to integrate explicitly a bilateral dimensioninto the analysis, as well as determining factors that are of a sectoral nature. Morespecifically, gravity principles may be applied to explain the (intra/inter-industry) natureof bilateral, intra-Community trade, i.e. shares of the different trade types, in accordancewith our methodology. Despite the progress in analysis that has been recalled here, anexplanation of the nature of trade with this type of methodology cannot be based on acomplete model constraining the parameters. This is simply because there are not one, butseveral explanations for two-way trade in similar or vertically differentiated products.
In the method used here, it is necessary to include both sectoral and countryvariables, as the combination of these explanatory categories providing generally bettereconometric results.
More fundamentally, theoretical arguments makes it impossible to ignore one or theother of these two major categories of determining factors. Indeed, when the sampleincludes countries of a different nature, as is the case here, these can participate ininternational trade on the basis of very different determinants: entry barriers ormonopolistic competition, versus comparative advantages. As a result, it is possible to putthe emphasis on sectoral variables in research based on the Helpman-Krugman-Lancasterapproach, which looks for the determinants of international trade in market structures.But it is also possible to use mainly national variables in an approach à la Bergstrand.Table 10 provides an overview of the approaches currently used in the literature in thisfield. This table points out the fact that, contrasting from other studies, the present studycombines 4 dimensions (i.e. country-partner-industry-time).
Considering these three categories of explanatory variables, namely countries,market structures and integration, the former are clearly imported from gravitationalmodels, and refer to the control of "distance" and "income" effects. These are combinedhere with variables stemming from industrial economics. Lastly, variables related tocommercial policy and foreign direct investment identify the impact of the SEM’scompletion.
The calculation of the variables presented above was constrained by the availabilityof data (e.g. concentration, product differentiation, economies of scale, FDI, NTBs) andthe potential multicolinearity between variables. Both problems have carefully beenexamined. 38 For a more detailed discussion see Péridy (1991).39 Péridy (1997), Fontagné and Péridy (1995).
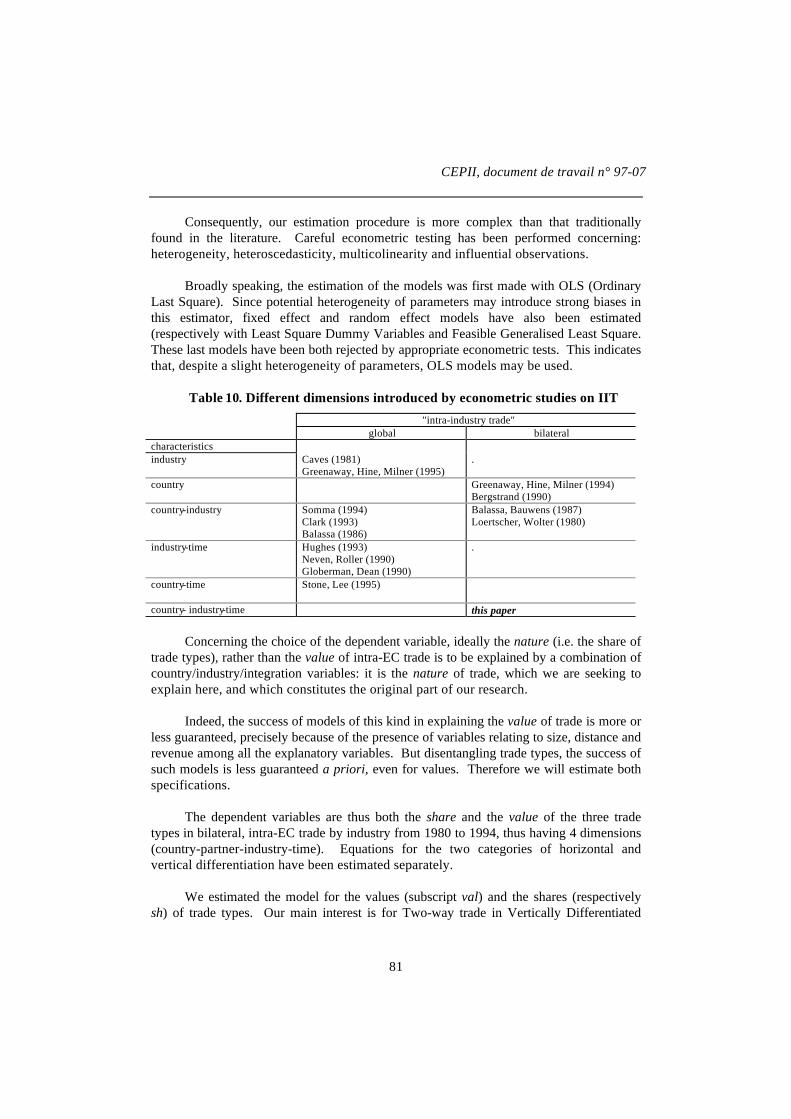
CEPII, document de travail n° 97-07
81
Consequently, our estimation procedure is more complex than that traditionallyfound in the literature. Careful econometric testing has been performed concerning:heterogeneity, heteroscedasticity, multicolinearity and influential observations.
Broadly speaking, the estimation of the models was first made with OLS (OrdinaryLast Square). Since potential heterogeneity of parameters may introduce strong biases inthis estimator, fixed effect and random effect models have also been estimated(respectively with Least Square Dummy Variables and Feasible Generalised Least Square.These last models have been both rejected by appropriate econometric tests. This indicatesthat, despite a slight heterogeneity of parameters, OLS models may be used.
Table 10. Different dimensions introduced by econometric studies on IIT
"intra-industry trade"global bilateral
characteristicsindustry Caves (1981)
Greenaway, Hine, Milner (1995).
country Greenaway, Hine, Milner (1994)Bergstrand (1990)
country-industry Somma (1994)Clark (1993)Balassa (1986)
Balassa, Bauwens (1987)Loertscher, Wolter (1980)
industry-time Hughes (1993)Neven, Roller (1990)Globerman, Dean (1990)
.
country-time Stone, Lee (1995)
country- industry-time this paper
Concerning the choice of the dependent variable, ideally the nature (i.e. the share oftrade types), rather than the value of intra-EC trade is to be explained by a combination ofcountry/industry/integration variables: it is the nature of trade, which we are seeking toexplain here, and which constitutes the original part of our research.
Indeed, the success of models of this kind in explaining the value of trade is more orless guaranteed, precisely because of the presence of variables relating to size, distance andrevenue among all the explanatory variables. But disentangling trade types, the success ofsuch models is less guaranteed a priori, even for values. Therefore we will estimate bothspecifications.
The dependent variables are thus both the share and the value of the three tradetypes in bilateral, intra-EC trade by industry from 1980 to 1994, thus having 4 dimensions(country-partner-industry-time). Equations for the two categories of horizontal andvertical differentiation have been estimated separately.
We estimated the model for the values (subscript val) and the shares (respectivelysh) of trade types. Our main interest is for Two-way trade in Vertically Differentiated

Trade patterns inside the Single Market
82
products (TWVD) and for Two-way trade in Horizontally Differentiated products (TWHD),since:
(a) the trade adjustment observed is fundamentally based on IIT;(b) One Way trade (OW) is simply a residual: parameters will "mechanically" have an
opposite sign, as compared to the two previous types of trade.40 Concerningvariables having an inverse effect on the two types of IIT, their parameters willsimply not be significant for the residual OW. Ideally, it would have been useful toestimate a simultaneous equation system explaining the three shares adding up toone, but given the high dimensionality of the econometric model, it has beenimpossible to do it. Even without this additional complexity of the model, it isdifficult to manage the problems associated with the four subscripts in the panel(declaring country / partner / product / year).
(c) OW is simply a trade flow based on the specialisation of countries if we explain itsvalue: the equation estimated is therefore simply gravitational, even if estimated atthe industry level, on panel and on bilateral basis. Such a result has strictly nointerest in the perspective of this research.
As from January 1993, in the framework of the single market completion, the intra-EC commodity flows are collected using new procedures (Intrastat System). This is one ofthe reasons41 why recorded intra-EC trade actually fell between 1992 and 1993. Thischange may have implications for trade analysis in value. Nevertheless, it is not clearwhether there is a systematic bias towards one of the trade types. In contrast, the effect onthe analysis of the shares of the trade types should be negligible.
4.2. The database of explanatory variables
4.2.1. Country variables
Market size
GDPkk' is an indicator of the size of the economies under study. Since thedependent variable is measured on a bilateral basis, it is necessary to use the average GDPas the GDP value (in current US$) of the declaring country k and its partner k', followingthe methodology put forward by Bergstrand (1990). It is to be expected that size will havea positive impact on the intensity of the division of labour, leading to a reinforcement ofthe "intra-industry" nature of intra-European trade. A greater variety of goods exists inthe "large" countries.
Difference in market size
The variable GDPDkk' is the difference in size between the countries. Inaccordance with Balassa (1986), Balassa and Bauwens (1987) and Somma (1994) thefollowing ratio is used:
40 With the exception of parameters having opposite signs for the two types of IIT.41 Other factors which are listed include the recession in Europe as well as exchange rate movements.

CEPII, document de travail n° 97-07
83
[ ]GDPD
w w w w
wGDP
GDP GDP
kk
k
k k
'
'
ln ( ) ln( )ln
= ++ − −
≡+
11 1
2
where
This indicator is of a better quality than the absolute difference in GDP, in as far asthe latter is sensitive to the absolute size of the partners. Here GDPDkk' has a valueranging from 0 to 1, which is independent of the absolute size of the trade partners. Thedifference in size is traditionally an obstacle to Two-way trade in similar products.
Standard of living
Income per capita PCIkk' is also expressed as the bilateral average in current US$.As widely established in the theoretical literature, "rich countries" should have higherlevels of two-way trade. Therefore, we expect PCIkk' would have a positive impact.
Economic distance
To obtain a proxy variable for the economic distance between two countries,PCIDkk' was originally defined in the same way as GDPDkk' . Since results obtained withthis solution at an intermediate stage where rather difficult to interpret it was finallydecided to use a very simple measure: the difference between PCIk and PCIk'. An eclecticvision of world trade à la Helpman-Krugman traditionally suggests that the economicdistance between two countries reinforces the nature of inter-industry trade in bilateraltrade: trade follows from specialisation between two countries separated by a largeeconomic distance. The variable PCIDkk' should thus have a negative impact on Two-waytrade if IIT were only based on the horizontal differentiation of products. In contrast, in acontext of vertical differentiation (Falvey-1981, Fontagné and Freudenberg-1997),exporting a quality and importing another quality of the same product is the result ofspecialisation over the price/quality spectrum if not along lines of comparative advantages.Therefore, a positive relationship is to be expected in this case.
Factor endowments and technology endowments pose different problems. Apartfrom natural resources, factor endowments and income per capita are two parts of thesame problem, namely the level of development. The inclusion of these variables in thesame specification generates important multicolinearity problems, as shown by Bergstrand(1990). In any case, as far as differences in per capita income are a proxy of economicdistance, all effects related to comparative advantage are already captured by ourspecification.
Transportation costs
The geographic distance Gdistkk' is expressed in nautical miles between the centreof gravity of the declaring country and its partner. Given that we are dealing withintra-European trade, this indicator was corrected using data from PCGlobe. The distance

Trade patterns inside the Single Market
84
between producers should lead to a reduction in two-way trade. It is to be expected thatthis variable will have a negative impact.
4.2.2. Market structure variables
These variables are introduced in order to (1) control the sectoral dimension of theproblem considered here; and (2) assess the traditional relationships between economies ofscale, barriers to entry, product differentiation and IIT.
Differentiation of products
Traditionally, differentiation is introduced in an indirect way, a wide spectrum ofsolutions being used, from the dummy (1 for the consumer industry, 0 otherwise) to aninverse proxy which is the ratio of concentration of industries (the homogeneity ofproducts drives to concentration). We tested the latter hypothesis, but the results were notsatisfactory, this being partly due to problems of data for concentration which arecompatible with our sectoral disaggregation, and being partly due to multicolinearity withother variables. Therefore, contrary to previous work, we decided not to use the traditionalC5 index (which gives the share -at the community level and per industry- of the top fivecompanies in the Community’s value added).
Lastly, the best results were obtained with an original ratio of differentiation, whichgives, industry by industry and for each year a weighted average of dispersion in unitvalues in intra-EC trade. Another advantage, from the point of view of the coherence ofthis study, lies in the fact that this proxy is an indirect output of the calculation made ontrade types.
Remember that the criteria being used to distinguish horizontal from verticaldifferentiation and to define the three European price/quality ranges are based ondifferences in unit values.
Do the thresholds of 15% have any real sense? Furthermore, the question of thedegree of dispersion of unit values needs special examination. Would it be possible tocalculate a "synthetic indicator" for such differentiation? The idea is to find an indicator ofthe dispersion of unit values. The more homogeneous a product is, the smaller should bethe variation of unit values around the European average, and vice versa, leaving asidestatistical discrepancies (as well as transport and related cost) which we tried to minimiseby "harmonising" the declarations.
The indicator we used to measure the degree of product differentiation is the(value-) weighted, average relative distance of the unit value ratio:

CEPII, document de travail n° 97-07
85
( )( )
Diff
VMAX UV UV
MIN UV UV
Vjkk
kk jkk j j
kk j j
kk j'
'' ..
' ..
'
'
,
,=
∑
∑where V stands for value and UV for unit value, and indices k representing the
declaring country, k’ the partner country and j the product. This indicator is equal orlarger than 1.
To us, compared to dispersion measures like the standard deviation, this indicator iseasier to interpret, and it can be aggregated to any desired level. For example, calculatingit at the product level (by summing up over declaring countries k and partners k’), give anaverage unit value dispersion for a given product j, therefore yielding a proxy for thevertical differentiation of a product. Of course, the indicator can also be aggregated overall products, in a given industry, to obtain the average dispersion in that industry.
Table 11 shows this proxy by industry, and Table 12 by product groups. Note thatthe aggregation levels here do not correspond to the ones used in the econometric model.They are only used as illustrations: here, CN-8 items were aggregated according to thenomenclature CHELEM of the CEPII. Leaving aside "other products", the values arehighest for chemicals and machinery, and lowest for energy. Note also the low values forvehicles (on average, the average relative distance of unit values for this industry is 26%).
If we look at product groups, we find -not surprisingly- very high values forspecialised machines, pharmaceuticals, precision instruments and telecommunicationequipment, but also for basic organic and basic inorganic chemicals, as well as for coke.At the other extreme, our indicator shows up low values for cereals, refined petroleumproducts, natural gas and crude oil, but also for cars and motorcycles (17%).
Over time, the degree of the differentiation of products changes for the industrytaken as a whole (Figure 19), but it might be due to a change in the trade structure byindustry, industries having differing levels of vertical differentiation of their products.
Our variable Diffj is integrated in the econometric model for intra-EC trade as awhole, after aggregation using our specific nomenclature. As we consider unit valuedispersion to be industry-specific, the specification finally used here has only one(industry) dimension, therefore indicating the average weighted dispersion for allcountries and partners over the whole time period.
We expect a positive relationship between this variable and the share of IIT invertical differentiation for bilateral trade flows between member states over the period;consequently a negative relationship might be observed on IIT in horizontallydifferentiated products. "Other industries" is a wide basket in which differing products areplaced. As a result, it will be necessary to run the calculation without this industry.

Trade patterns inside the Single Market
86
Table 11. Proxy for product differentiation in intra-EC trade by "filières", 1994
Industry ProxyChemicals 4.29Machinery 3.37Electronic products 2.46Electrical products 2.13Wood and paper 1.65Textiles 1.61Food & agriculture 1.45Non-ferrous metals 1.41Iron and steel 1.28Vehicles 1.26Energy 1.13
Source: Eurostat.
Table 12. Proxy for product differentiation in intra-EC trade by groups of products, 1994
Proxy Product group Proxy Product group13.89 Specialised machines 1.51 Carpets and textile furnishings12.74 Basic organic chemicals 1.49 Coal (incl. lignite and other primary energy
products)8.07 Pharmaceuticals 1.49 Construction and public work equipment3.38 Basic inorganic chemicals 1.48 Furniture3.37 Coke 1.47 Aeronautics3.27 Animal foodstuff 1.46 Large metallic structures3.27 Precision instruments 1.45 Tubes and first-stage processing products3.27 Telecommunications equipment 1.45 Leather furskins and footware3.22 Optics and photographics and cinematographic
equipment1.45 Vehicle components
3.07 Watch and clockmaking 1.44 Paper and pulp2.94 Unprocessed minerals 1.44 Articles in wood2.78 Electronic components 1.43 Rubber articles (incl. tyres)2.44 Machine tools 1.42 Iron ores and scrap2.39 Electrical apparatus (incl. passive devices) 1.41 Yarns and fabrics2.35 Ships (incl. oil rigs) 1.39 Cements2.25 Engines, turbines and pumps 1.38 Plastic articles2.15 Non-ferrous ores and scrap 1.38 Agricultural equipment2.13 Heavy electrical equipment 1.37 Domestic electrical appliances2.09 Clothing 1.35 Commercial vehicles and transport equipment2.03 Toilet products, soaps and perfumes 1.33 Consumer electronics1.94 Printing and publications 1.28 Preserved meat and fish products1.93 Computer equipment 1.28 Non-ferrous metals1.89 Toys, sports equipment and misc. manuf. art. 1.27 Other edible agricultural products1.89 Misc. hardware 1.25 Plastics, fibers and synthetic resins1.79 Paints, colourings and intermediate chemical
products1.23 Iron and steel-making
1.78 Knitwear 1.23 Cereal products1.76 Arms and weaponry 1.22 Fats (of vegetable or animal origin)1.74 Preserved fruit and vegetable products 1.22 Meat and fish1.70 Non-edible agricultural products 1.19 Sugar products (incl. chocolate)1.64 Beverages 1.19 Cereals1.64 Glass 1.17 Cars (incl. motorcycles)1.57 Manufactured tobaccos 1.13 Refined petroleum products1.57 Ceramics 1.09 Natural gas1.57 Fertilisers 1.03 Crude oil
Source: Eurostat.
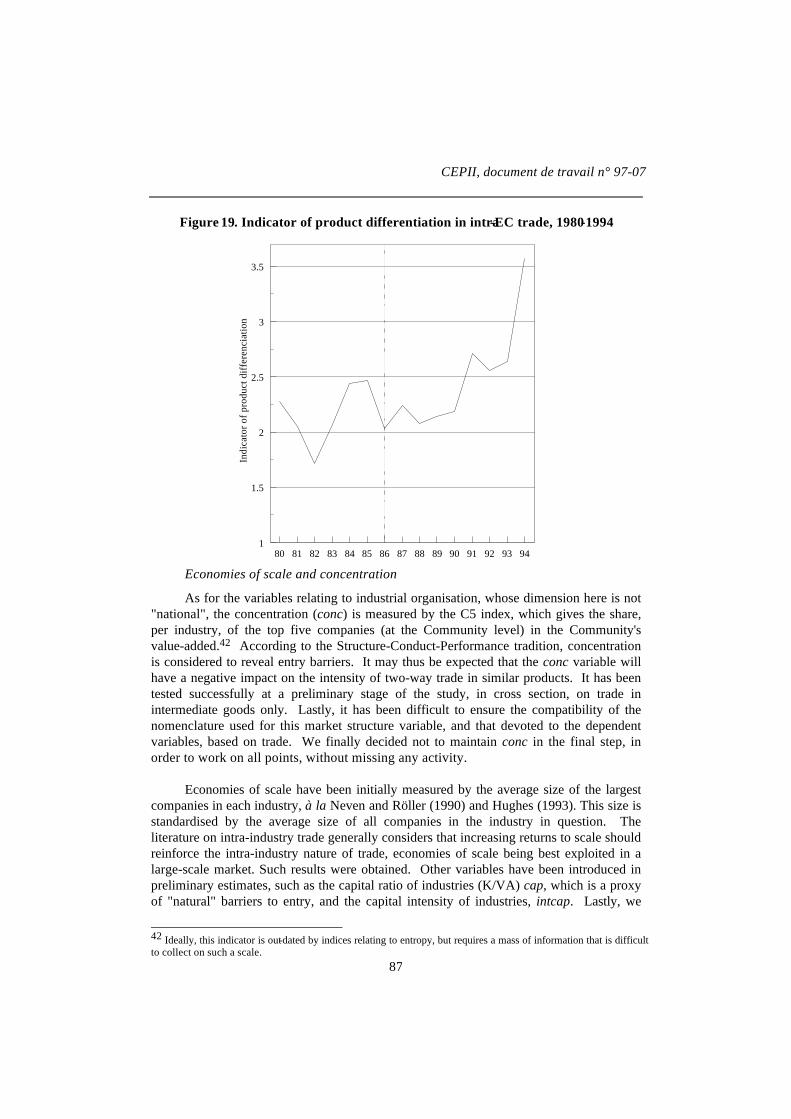
CEPII, document de travail n° 97-07
87
Figure 19. Indicator of product differentiation in intra-EC trade, 1980-1994
80 81 82 83 84 85 86 87 88 89 90 91 92 93 941
1.5
2
2.5
3
3.5
Indi
cato
r of p
rodu
ct d
iffe
renc
iatio
n
Economies of scale and concentration
As for the variables relating to industrial organisation, whose dimension here is not"national", the concentration (conc) is measured by the C5 index, which gives the share,per industry, of the top five companies (at the Community level) in the Community'svalue-added.42 According to the Structure-Conduct-Performance tradition, concentrationis considered to reveal entry barriers. It may thus be expected that the conc variable willhave a negative impact on the intensity of two-way trade in similar products. It has beentested successfully at a preliminary stage of the study, in cross section, on trade inintermediate goods only. Lastly, it has been difficult to ensure the compatibility of thenomenclature used for this market structure variable, and that devoted to the dependentvariables, based on trade. We finally decided not to maintain conc in the final step, inorder to work on all points, without missing any activity.
Economies of scale have been initially measured by the average size of the largestcompanies in each industry, à la Neven and Röller (1990) and Hughes (1993). This size isstandardised by the average size of all companies in the industry in question. Theliterature on intra-industry trade generally considers that increasing returns to scale shouldreinforce the intra-industry nature of trade, economies of scale being best exploited in alarge-scale market. Such results were obtained. Other variables have been introduced inpreliminary estimates, such as the capital ratio of industries (K/VA) cap, which is a proxyof "natural" barriers to entry, and the capital intensity of industries, intcap. Lastly, we
42 Ideally, this indicator is out-dated by indices relating to entropy, but requires a mass of information that is difficultto collect on such a scale.

Trade patterns inside the Single Market
88
decided to build new variables in a rather different way: using Eurostat Industrial Data bySize43 of Enterprises, the below indicators were calculated for the "core countries"(Germany, France, Italy and the United-Kingdom) as a whole, in 1987:
(a) the relative productivity of large firms by industry;(b) the share of large companies in the employment by industry;(c) the share of large companies in the value added by industry.
We chose the first indicator (scale), relative to productivity differentials, on thebasis of the minimisation of multicolinearity problems in the specification tested.
4.2.3. Variables associated with European integration
Six categories of variables have been used:
(a) dummies for "Southern" member states;(b) dummies trying to catch an effect on microeconomic expectations;(c) variables relative to trade barriers hindering trade between member states;(d) variables relative to Foreign Direct Investment (FDI), associated with the
completion of the Single Market;(e) transaction costs: cancellation of border formalities will reduce transaction costs; as
a result, the assumption is made that Gdist will have a decreasing impact on tradetypes and values;
(f) monetary integration (the lack of), since bilateral exchange rate fluctuationspossibly hinder trade flows on the one hand, and are potentially influential on unitvalues and thus the measurement of vertical differentiation on the other hand.
Dummies
SI (Southern countries integration): this dummy variable is expected to provideinsights on the impact of Spain’s and Portugal’s integration in the EC as of 1986. Thisvariable is highly significant and has a positive impact on intra-European trade, but we donot present these results, since they do not separate effects associated with the integrationof Southern countries into the EC from those we are interested in here.
Turning to microeconomic expectations, it is possible to take a dummy as a measureof the impact of the SEM. This dummy would take value 0 before 1986, and 1 afterwards.Alternative dates would indicate the expectation effect on private sector of the SEM.Control tests have been performed in order to ensure that this variable only reflected theimpact of the SEM; on the whole, results are poor as expected in workshops carried outduring this research, and this strategy has been dropped out: trade barriers and FDI areintellectually more satisfactory and work well.
43 Size: "large enterprises": >500 employees; "small and medium size": < 500 employees.

CEPII, document de travail n° 97-07
89
Non-tariff barriers
We have constructed two variables reflecting Non-Tariff Barriers hinderingintra-EC trade:
(a) the first is derived from the seminal work of Buigues, Ilzkowitz and Lebrun(1988)44: in a first step, following Neven and Röller (1991), we use an ordinalvariable according to the level of NTBs in intra-European trade at the NACE 3digits level.45 At this level, for example, we identify pharmaceuticals (NACE 257)or wine (NACE 425) as industries with high barriers to intra-European trade beforethe completion of the internal market. Thereafter, the values obtained are weightedby EC value added in 1987, in order to return to the nomenclature in 14 industries.
(b) a second proxy for NTBs is derived from the same study of the Commission, buttaking into account the price discrepancies in Europe, excluding taxes46. Thesedifferentials are weighted by the 1987 EC value added.
Figure 20 plots the two variables for each industry.
As far as we are interested in the impact of the SEM completion, NTBs might affectnegatively specialisation of countries along comparative advantage lines, in thepre-completion period: our hypothesis is that the first wave of integration in Europe wasassociated with IIT in horizontally differentiated products, precisely because these barriershinder specialisation between industries or inside industries along the quality spectrum.Therefore, a negative impact of NTBs on inter-industry trade before the completion,combined with a positive impact as a result of the completion, is to be expected. The samereasoning applies to IIT, in vertically differentiated products. Conversely, NTBs mightboost IIT in horizontally differentiated products before the completion. During thecompletion, the latter influence is expected to decline sharply over time. In any case,when interpreting the results associated with these types of explanatory variables, it mustbe kept in mind that our NTBs have no time dimension, due to lack of information.Therefore, of the sign must be cautiously interpreted, when comparing the pre- and postcompletion stages, while the key information is certainly the evolution of parametersduring the period considered here.
44 The authors establish their classification using Nerb (1988), Commission (1988) and MAC (1988). These threesources give information derived respectively from a questionnaire (11,000 European firms), sectoral studies and astudy on technical barriers, which are used as a basis for classification of industries into 3 groups at the NACE 3-digitlevel. The second one is related to industries where "(..) the principal obstacles are differences in standards oradministrative and technical controls. (..) However, these barriers do not prevent intra-Community trade." In contrast,the third one groups industries "(..) in which the public sector is the main purchaser and those in which differences instandards present a considerable obstacle to intra-Community trade" (Buigues and Ilzkowitz, 1988, p. 21).45 Ranging from 2 to 4; 1 was not taken as lower value as far as we use logarithms in the econometric model46 The data base of prices gathered by Eurostat is traditionally used to calculate PPP. Buigues, Ilzkowitz and Lebrun[1988] base their calculus on an original exploitation of this data base: they highlight the fact that domesticdiscrepancies, which might be considered as "natural" are far less than inter-country intra-European ones. Moreover,these discrepancies have grown over the 1975-85 period in sectors heavily affected by NTBs.

Trade patterns inside the Single Market
90
Figure 20. Non Tariff Barriers on intra-EC trade associatedwith the pre-completion period
electricalmachinery
motor vehicles
chemicals
non metallic mineralproducts
other industries
textile, apparel,leather
non-electricalmachinery
professionalgoods
other transportequipment
food, beverages,tobacco
basic metallindustries
agric. hunt forestry,mining, quarrying,petroleum, wood,
paper, printing
3
5
7
9
11
13
15
17
1.5 2 2.5 3 3.5 4
Level of intra-EC NTBs before the SEM
Dispersion of prices excl. taxes inside the EC
It must be pointed out that the two variables are relatively co-linear: we do not aimat introducing them simultaneously into our equations, but rather to use each one indifferent specifications, explaining different trade types. For example, the second onemight pose problems for vertically differentiated products.
Foreign direct investment
Foreign Direct Investment (FDI), which is on the frontier of international tradetheory and industrial economics, is another bilateral variable that has to be considered. Itis difficult to obtain reliable data for FDI on a bilateral basis for all member states, and ona sectoral basis.

CEPII, document de travail n° 97-07
91
Using data issued from balance of payments statistics, one faces not only differencesof methodology between declaring countries, but also problems associated with theregistration of flows itself. Concerning the first problem, all countries do not use the samedefinitions of the link between the investor and the enterprise (10% or other levels..); inaddition, some countries do integrate indirect links between firms, whereas other countriesdo not. Reinvested earnings are not taken into account in the same way everywhere.Credits are not accounted for along unified principles. In case of multinational firms, orfor holdings the question of allocation of flows is to be considered: if a firm in country Ainvest in country C while financing this investment through a subsidiary belonging tocountry B, one will face asymmetries in registrations between A and B on the one hand,and B and C on the other hand. This problem is generally referred to be important betweenNetherlands, the United Kingdom and United States47.
Data published by Eurostat in 1994 are a useful basis, since flows and registrationmethodologies are unified as far as possible. Despite these efforts, flows are steadilyhighly asymmetric between countries, as a result of the way these flows are collectedinitially. Nevertheless, these are useful statistics as long as one tries to disentangle theimpact of the single market on FDI and the general trend in FDI for European countries:these statistics do not cover only intra-EC FDI but also FDI flows with third country. Inany case, these statistics have been published on a bilateral basis over 1984-1991 (with theexception of countries like Ireland or Greece), but not adding the two dimensions - sectoraland geographic- of the problem. Information is available by industry but at a ratheraggregated level (energy plus seven industries) but on a multilateral basis.
Flows over 1984-1991 were deflated with gross prices indexes (IMF financialstatistics, various issues) and cumulated, in order to cancel the very high inter-annualvariability of data. Two matrix have then been constructed, giving outflows and inflows ona bilateral basis.
The first question to address is to know whether the big push in intra-European FDIbefore the completion has been the result of private expectations, firms "preparing" thesingle market, or more generally has been impulse by an increasing trend in FDI inEurope. The figure below highlights -until 1991- a large increase in the ratio (EC to ECdivided by EC to Third Countries): the single market has induced -relatively- larger FDIflows between European countries. But private actors belonging to third countries havealso had motives to invest in Europe as a result of the Single Market: the figure belowindicates that this phenomenon has been clearly overwhelmed by intra-EC investment overthe period.
47 See for example "Les investissements directs de la Communauté Européenne 1984-91", Eurostat, 1994, p.25.
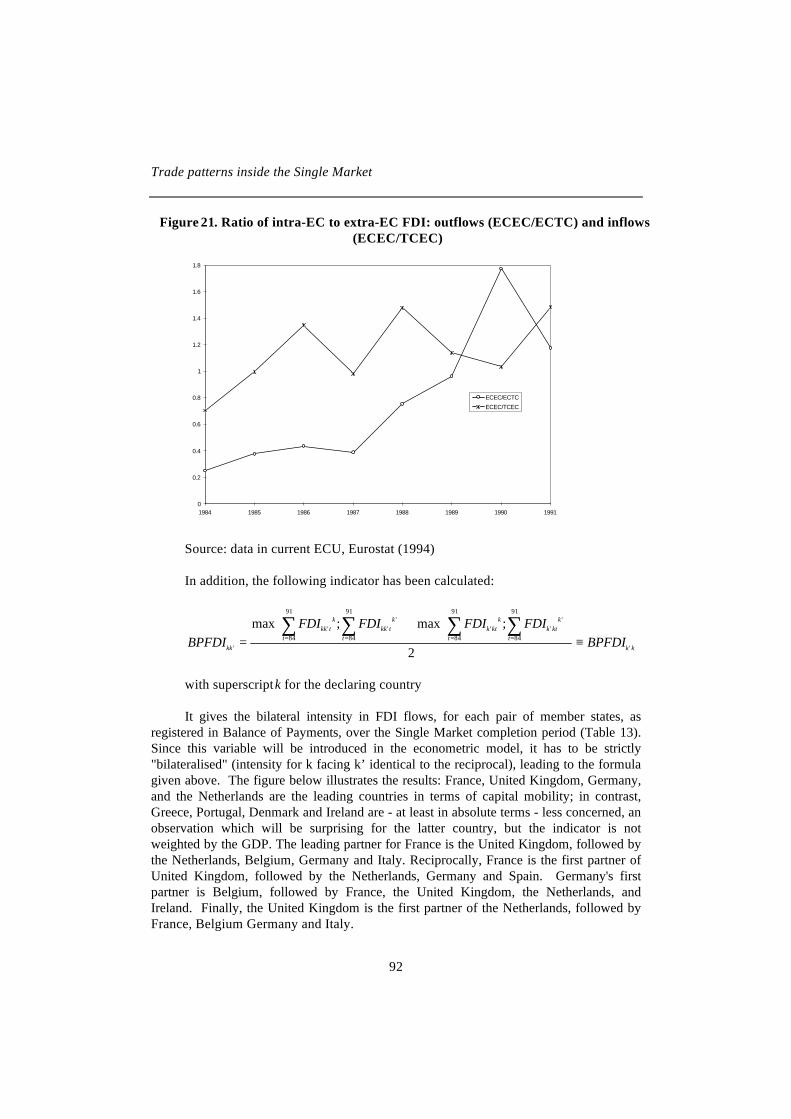
Trade patterns inside the Single Market
92
Figure 21. Ratio of intra-EC to extra-EC FDI: outflows (ECEC/ECTC) and inflows(ECEC/TCEC)
0
0.2
0.4
0.6
0.8
1
1.2
1.4
1.6
1.8
1984 1985 1986 1987 1988 1989 1990 1991
ECEC/ECTC
ECEC/TCEC
Source: data in current ECU, Eurostat (1994)
In addition, the following indicator has been calculated:
BPFDIFDI FDI FDI FDI
BPFDIkk
kk tk
tkk t
k
tk kt
k
tk kt
k
tk k'
' ''
' ''
'
max ; max ;=
+
≡= = = =∑ ∑ ∑ ∑
84
91
84
91
84
91
84
91
2
with superscript k for the declaring country
It gives the bilateral intensity in FDI flows, for each pair of member states, asregistered in Balance of Payments, over the Single Market completion period (Table 13).Since this variable will be introduced in the econometric model, it has to be strictly"bilateralised" (intensity for k facing k’ identical to the reciprocal), leading to the formulagiven above. The figure below illustrates the results: France, United Kingdom, Germany,and the Netherlands are the leading countries in terms of capital mobility; in contrast,Greece, Portugal, Denmark and Ireland are - at least in absolute terms - less concerned, anobservation which will be surprising for the latter country, but the indicator is notweighted by the GDP. The leading partner for France is the United Kingdom, followed bythe Netherlands, Belgium, Germany and Italy. Reciprocally, France is the first partner ofUnited Kingdom, followed by the Netherlands, Germany and Spain. Germany's firstpartner is Belgium, followed by France, the United Kingdom, the Netherlands, andIreland. Finally, the United Kingdom is the first partner of the Netherlands, followed byFrance, Belgium Germany and Italy.

CEPII, document de travail n° 97-07
93
Table 13. Intra-EU bilateral FDI (1984-1991, ECU million, 1985 prices)
Belgium Nether-lands
Germany Italy UnitedKingdom
Ireland Denmark Greece Portugal Spain
France 5790 6957 5237 4146 8780 304 631 186 325 3722Belgium 5577 9274 2010 2770 314 141 42 135 787Netherlands 3332 2787 7914 302 499 98 124 2247Germany 2411 5025 2929 387 161 220 2420Italy 2442 27 83 39 37 803United Kingdom 758 637 73 682 4618Ireland 142 0 15 47Denmark 0 36 122Greece 1 7Portugal 653
Source: authors’ calculation, Eurostat data.
As referred to above, FDI in BoP might been subject to registration bias. In order tointegrate the factor mobility dimension of European integration, controlling for the bias ofregistration in BoPs, another indicator has been calculated, based on a completely differentset of data: Mergers and Acquisitions (M&As). For this data, we are deeply indebted toEric Vanhaelewyn48 who kindly computed year-by-year information, on a bilateral countrybasis over 1986-94. The data base was then used in order to define 2 variables. Inaccordance with Eric Vanhaelewyn we decided to use the number of M&A, since theinformation on value seems to be of poor quality. The good results obtained with thevariables referred to below is encouraging.
First of all, four variables have been defined:
(a) NFDIkk’: the share of country k’ in the outward M&A of country k;(b) NFDIk’k: the share of country k’ in the inward M&A in country k;(c) ZFDIkk’: the share of country k’ in the total M&A engaged by firms of country k;(d) ZFDIk’k: the share of country k’ in the total M&A concerning firms of country k.
The equations were also controlled, showing that each variable is significantindividually.
In a second step, and in as far as we ran our econometric model on a bilateral basis,we defined two variables which were used to obtain the final results presented below, inthe same way as for FDI in balance of payments statistics:
( ) ( )NFDI NFDI NFDI ZFDI ZFDI ZFDIkk k k kk k k= + = +05 05. .' ' ' ' and It should be noticed that even if each of these variables has been computed on a
yearly basis, the results presented below use values of NFDI and ZFDI for the 1986-94period taken as a whole. A decomposition by year is of no interest, since we do not have 48 Commission of the European Communities, DG for Economic and Financial Affairs
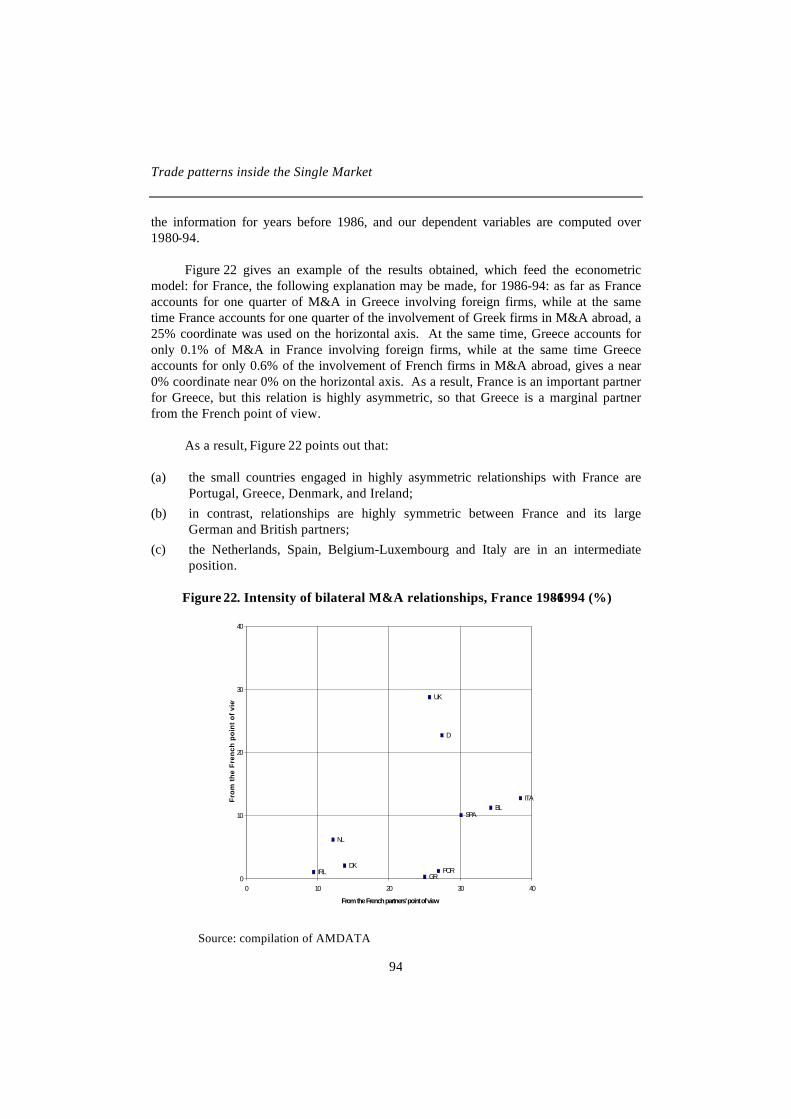
Trade patterns inside the Single Market
94
the information for years before 1986, and our dependent variables are computed over1980-94.
Figure 22 gives an example of the results obtained, which feed the econometricmodel: for France, the following explanation may be made, for 1986-94: as far as Franceaccounts for one quarter of M&A in Greece involving foreign firms, while at the sametime France accounts for one quarter of the involvement of Greek firms in M&A abroad, a25% coordinate was used on the horizontal axis. At the same time, Greece accounts foronly 0.1% of M&A in France involving foreign firms, while at the same time Greeceaccounts for only 0.6% of the involvement of French firms in M&A abroad, gives a near0% coordinate near 0% on the horizontal axis. As a result, France is an important partnerfor Greece, but this relation is highly asymmetric, so that Greece is a marginal partnerfrom the French point of view.
As a result, Figure 22 points out that:
(a) the small countries engaged in highly asymmetric relationships with France arePortugal, Greece, Denmark, and Ireland;
(b) in contrast, relationships are highly symmetric between France and its largeGerman and British partners;
(c) the Netherlands, Spain, Belgium-Luxembourg and Italy are in an intermediateposition.
Figure 22. Intensity of bilateral M&A relationships, France 1986-1994 (%)
IRLDK
NL
POR
UK
SPABL
ITA
D
GR0
10
20
30
40
0 10 20 30 40
From the French partners' point of view
Fro
m t
he
Fre
nch
po
int
of
view
Source: compilation of AMDATA
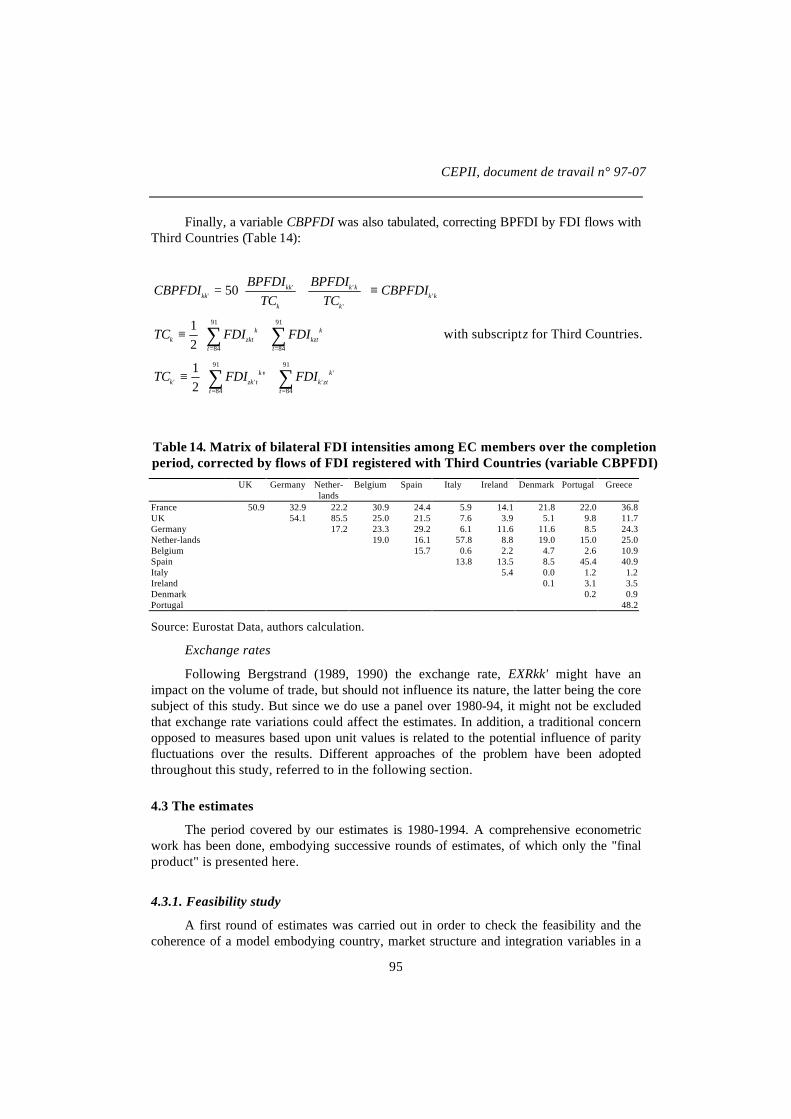
CEPII, document de travail n° 97-07
95
Finally, a variable CBPFDI was also tabulated, correcting BPFDI by FDI flows withThird Countries (Table 14):
CBPFDIBPFDI
TCBPFDI
TCCBPFDI
TC FDI FDI
TC FDI FDI
kkkk
k
k k
k
k k
k zktk
tkzt
k
t
k zk tk
tk zt
k
t
'' '
'
'
' ' '''
= +
≡
≡ +
≡ +
= =
= =
∑ ∑
∑ ∑
50
12
12
84
91
84
91
84
91
84
91
with subscript z for Third Countries.
Table 14. Matrix of bilateral FDI intensities among EC members over the completionperiod, corrected by flows of FDI registered with Third Countries (variable CBPFDI)
UK Germany Nether-lands
Belgium Spain Italy Ireland Denmark Portugal Greece
France 50.9 32.9 22.2 30.9 24.4 5.9 14.1 21.8 22.0 36.8UK 54.1 85.5 25.0 21.5 7.6 3.9 5.1 9.8 11.7Germany 17.2 23.3 29.2 6.1 11.6 11.6 8.5 24.3Nether-lands 19.0 16.1 57.8 8.8 19.0 15.0 25.0Belgium 15.7 0.6 2.2 4.7 2.6 10.9Spain 13.8 13.5 8.5 45.4 40.9Italy 5.4 0.0 1.2 1.2Ireland 0.1 3.1 3.5Denmark 0.2 0.9Portugal 48.2
Source: Eurostat Data, authors calculation.
Exchange rates
Following Bergstrand (1989, 1990) the exchange rate, EXRkk' might have animpact on the volume of trade, but should not influence its nature, the latter being the coresubject of this study. But since we do use a panel over 1980-94, it might not be excludedthat exchange rate variations could affect the estimates. In addition, a traditional concernopposed to measures based upon unit values is related to the potential influence of parityfluctuations over the results. Different approaches of the problem have been adoptedthroughout this study, referred to in the following section.
4.3 The estimates
The period covered by our estimates is 1980-1994. A comprehensive econometricwork has been done, embodying successive rounds of estimates, of which only the "finalproduct" is presented here.
4.3.1. Feasibility study
A first round of estimates was carried out in order to check the feasibility and thecoherence of a model embodying country, market structure and integration variables in a

Trade patterns inside the Single Market
96
specification explaining the volume and the nature of bilateral trade flows, whiledisentangling total trade by trade types:
(a) IIT associated with horizontal differentiation: more precisely Two-way trade inHorizontally Differentiated products (TWHD);
(b) IIT associated with vertical differentiation: more precisely Two-way trade inVertically Differentiated products (TWVD)
(c) inter-industry trade, respectively One Way trade (OW).
Since a specification combining the variables referred to above was quite powerfulin explaining not only the value of trade, which is quite easy, but also the nature of trade,i.e. the respective shares of TWHD, TWVD and OW in bilateral trade flows by industry, atthe same time, it was necessary to address the questions of heteroscedasticity,multicolinearity and heterogeneity of parameters.
The latter problem of heterogeneity of the parameters occurs whenever a sample ofobservations has more than one dimension. The most common case is when the sample ismade of two dimensions (individual and time). In this case, the OLS model may be biasedsince the value of the estimated parameters may vary among individuals and/or over time.
The model presented here is a panel data model with four dimensions: time,industry, reference countries and partner countries. Complete tests of heterogeneity areunfortunately impossible in our case for several reasons: first, the theoretical econometricliterature is limited to 2 (and most recently 3) dimensions. Second, and consequently,econometric software is limited to 2 dimensions. Lastly the size our dataset (at theminimum 463,200 values) is such that the stratification variables frequently contain toomany individuals for the software used (LIMDEP).
Despite these problems, we have been able to test for heterogeneity across countries .It appears that despite the conclusion of heterogeneity of the parameter, the re-estimationof the model through Least Square Dummy Variable (LSDV) or Generalised Least Square(GLS) in fixed or random effects, gives results extremely close to the OLS pooledestimates. Thus, on the basis of this test, the heterogeneity bias due to countries isnegligible.
These results have led us to a second round of estimates, in which a change of thevariable associated with economic distance was decided: we finally turned to a simpledifference which is not standardised, contrary to the one chosen for differences in the sizeof countries. In addition, we decided neither to use proxies associated with the productionfunction, nor the proxy for barriers to entry. More generally, despite these choices, and asthe results referred to below will point out, market structure variables are a source ofmulticolinearity: economies of scale have something to do with product differentiation,fixed assets have something to do with barriers to entry and economies of scale, etc. Themodel was ran without exchange rates, given the poor theoretical evidence of its impact on

CEPII, document de travail n° 97-07
97
trade type shares, whereas parameters estimates were controlled in a further step forexchange rate variations.
4.3.2. The final model
A third round of estimates has finally been ran, in order to look more carefully attwo questions: FDI, exchange rates.
Concerning FDI, NFDI (Mergers & Acquisitions) has been tentatively changed forBPFDI (bilateral flows of FDI as reported in Balance of Payments, after harmonisation),the latter offering the possibility to control for European FDI with Third Countries duringthe completion period. Results obtained with NFDI are slightly statistically better thanthose obtained with BPFDI, a result that might reflect the problems associated with theregistration of FDI flows in BoPs. It has been checked that parameter estimates are robustto this change. Given this result, the supplementary BPFDI corrected by FDI flows(variable CBPFDI) with Third Countries has therefore not been tested. Finally, equationshave been estimated using M&A, i.e. NFDI.
The bilateral exchange rate was introduced systematically, in absolute term(variable EXR), in the model. Since there was in principle no theoretical foundation for arelationship between IIT and variations in the type of model we use, exchange rate hadbeen initially dropped out of the model. This choice raised concerns from the Commissionand the academic panel, as a story based upon unit values might be sensitive to exchangerate variations and pricing to market strategies. As a result, the second round of estimatehad been done with and without exchange rates, whereas results were given extensivelyonly for the "without" option, facing similar parameter estimates. It appeared that largevariations in exchange rates, i.e. the lack of monetary integration in Europe, had adverseimplications: losses in trade, increased specialisation, etc. These findings weresupplemented by a paper recently issued (Ricci, 1996) leading to a similar diagnosis on thebasis of a theoretical model. Finally, it is the matter of a trade-off between adding newvariables in the model, which leads to increased multicolinearity, or having a thinnermodel, that fits better statistical tests. Again, it has been checked that all parameterestimates are robust to this change; in addition, the condition numbers (which give us anindication of the degree of multicolinearity 49), are only slightly increased. Consideringthese encouraging results, the exchange rates were finally systematically introduced in thethird round of estimates feeding results below.
Finally, the equations of the final model are the following, using a log-logspecification50:
49 Square root of the ratio of the maximum to the minimum eigenvalues of the X‘X matrix. See Belsley, Kuh andWelsh (1980), section 3.50 The six equations for the three types of trade in value or share, have been finally estimated using variables ofTable 15 in logarithmic form:(a) for the 1980-94 panel, all countries, all industries;(b) for the 1980-94 panel, all countries less Portugal and Spain, all industries;(c) for each country, all industries;

Trade patterns inside the Single Market
98
y GDP GDPD PCI PCID Gdist Scale Diff
NTB NFDI EXR
withy TWHD TWVD OW TWHD TWVD OW
jkk kk kk kk kk kk j j
j kk kk
val val val sh sh sh
t t t t t
t
' ' ' ' ' '
' '
:, , , , ,
= + + + + + + +
+ + +
=
α α α α α α α
α α α ε1 2 3 4 5 6 7
8 9 10
2
Table 15. Explanatory variables for the final model
Characteristics Variable Indicator
Country Size GDPkk’ Average of Gross Domestic Products of the twocountries
Differences in size GDPDkk’ Normalised difference in GDPsIncome per capita PCIkk’ Average income per capita of the two countriesEconomic Distance(comparative advantage)
PCIDkk’ Differences in incomes per capita
Geographic distance GDistkk’ Distance between capital citiesMarket structures Economies of scale Scalej Relative productivity of larger firms, by industry
(France-Germany-Italy-United kingdom)Differentiation Diffj Average relative distance of unit value ratios
Integration Non tariff barriers NTB1 Along Buigues et alii (1988)NTB2 Differences in prices excl. taxes among member
statesExchange rates EXRkk’t Bilateral (absolute value of) exchange rateForeign investment NFDIkk’ Average of (share of country k’ in outward M&A
of country k) and of (share of country k’ in theinward M&A of country k), over the completionperiod
5. TRADE PATTERNS AND THE SINGLE MARKET
The reasoning behind the measures associated with the completion of the singlemarket was that liberalisation would tend to lower prices through increased competition,induce market structure transformations and foster a concentration of resources in moreefficient uses. These effects would translate into sizeable welfare gains, increases in GDP,and an increased competitiveness vis-à-vis non-member countries.
At the same time, it was expected -as was put forward in a series of ex-ante studiestrying to estimate the effects of these measures- that not all sectors and member stateswould be affected in the same way. For sensitive sectors with important NTBs in the"pre-completion" situation, conversion costs, implying factor mobility and possibly sunkcosts, were therefore predicted. To overcome the potential problem of cohesion in theCommunity, Structural Funds were boosted in order to foster a convergence in real incomeand to facilitate industrial conversions in sensitive sectors.
As the conventional view of trade based on differences between countries has beenchallenged by the new international economics, it is necessary to carefully integrate thesenew developments in our empirical estimates.
(d) for each industry, all countries.On the whole, it gives (2x6) + (13x6) + (11x6) equations; these 150 equations have been ran in a systematic manner,using exactly the same specification, in order to authorise comparisons of their results.

CEPII, document de travail n° 97-07
99
5.1. The potential effects of the Single Market
On the ground that the bulk of contemporary trade is based on similarities,imperfect competition, or consumer preferences, these new theoretical developmentsemphasise increased gains of integration, including efficiency through increasing returnsalong with greater welfare based on increased product variety on the one hand andincreased competition on the other hand.
Turning to assessments of the Single Market, even if the structure of trade was notthe core of ex-ante studies (focused on its volume), the implicit assumption was that theremoval of (non-tariff) barriers to internal trade would translate into an increase in intra-industry trade flows inside the Union. Nevertheless, recent theoretical developments pointout that economic integration will have different consequences between partners in aregion characterised by a large differences in per capita income, and more generally byvarying economic structures. These developments not only take into account "traditional"increasing returns to scale, but emphasises the difference between horizontal and verticaldifferentiation of products and shed light on potential agglomeration effects andtransaction costs. As a result a theoretical scheme associating intra-industry trade withgains of variety and inter-industry trade with specialisation is no longer valid. Thus, threeimportant points have to be underlined:
(a) to the extent that the presence of less developed states inside the Union leads tolarge differences in economic structures, an in-depth study would suggest a refinedscenario associating intra-industry trade with "North-North" or "South-South"scenario, and inter-industry trade to a "North-South" one.
(b) increasing returns may translate into inter-industry trade, and not intra-industrytrade, as far as industries exhibit external economies of scale or agglomerationeffects;
(c) intra-industry trade is anything but a monolithic phenomenon: an importantdimension which must be carefully taken into account is the distinction betweenhorizontal and vertical differentiation.
Lastly, inter-industry trade (implying a displacement of resources betweenindustries), intra-industry trade of vertically differentiated products (associated with aspecialisation along quality ranges), and intra-industry trade of similar products(respectively along brands or characteristics sets, excluding quality) have differentimplications.
The single market might have at least implications on trade which are twofold:
(a) since it is a step forward in the regional integration, the single market might lead totrade creation effects but also to trade diversion effects, detrimental to Thirdcountries. Reasons for such an ambiguous mechanism are well known (see forexample Viner, 1950) and do not deserve more developments; what is morestriking is the possibility of capturing such types of mechanisms using themethodology chosen here.

Trade patterns inside the Single Market
100
(b) since it is a step forward toward free trade among European countries, the singlemarket will led to alterations of intra-EC trade, per se, i.e. independently fromtrade creation of diversion issues. Obviously, this throw some shadow on welfareconclusions for Member States, as underlined by Bhagwati (1971).
The first implication is clearly out of purpose here, for at least two reasons:
(a) Since this study is strictly bilateral -a methodological choice which has beenjustified above- it has to focus on intra-EC flows. Even if it is possible to captureEC trade vis-à-vis Third country using EC members as declaring countries, it isimpossible to integrate bilateral flows among third countries themselves (at least atthe level of disaggregation implemented here). What this study aims at presenting,is an exhaustive database on bilateral trade flows, what disqualifies the possibilityof integrating Third countries. In addition, even if the Single market might haveimplications on trade types in trade relationships between EC-12 and Thirdcountries, it might be far or less insignificant compared to the implications forintra-EC trade. Once again, the implications vis-à-vis Third countries are certainlymore a trade diverting issue than a trade type one.
(b) The type of econometrics used here, even useful for trade types, is clearlydisqualified by the recent literature in as far as trade creation or trade diversion isconcerned. Obviously, it would be possible to integrate an "in/out" set of dummieswhen explaining the value of the different types of trade, if our database wasextended to relationships between EC members and third countries. Unfortunately,it would disqualify other explanatory variables in order to maintain multicolinearityin acceptable bounds, and firstly market structures ones. Turning as a resulttowards traditional gravity models (even if adjacency, common language etc. arenot in the model) we would face the difficulty of assessing trade diversion effectswith such a type of specification., a point that deserves larger developments.
It is well known that results obtained with such models vary greatly over authorsand specifications: Haveman and Hummels (1996) list the results for the EC: Bikker(1987) find an extra-EC bias for the early years and nothing later whereas Aitken (1973),Brada and Mendez (1983) or Bayoumi and Eichengreen (1995) raised a symmetricconclusion. Finally, Frankel and Wei (1993) did not reach clear conclusions. In addition,the short run implications have to be distinguished from the medium run ones since tradediversions generally lead to negotiations resulting in liberalisation compensations forThird countries.51
A first explanation for these disappointing results lies in the omission of explanatoryvariables, a problem partially solved by Bayoumi and Eichengreen who use an equationestimated in first differences: it allows to omit fixed effects, but is useless for time-varyingomitted variables.
51 See Fontagné (1995).
CEPII, document de travail n° 97-07
101
A second explanation is associated with the very basis of the model, as demonstratedby Haveman and Hummels: having defined, randomly, trade blocs of ten countries, theyreplicate the traditional in/out methodology and highlight fooling results. Even if blocs aredefined randomly, there is an intra-bloc trade diversion effect. This might be due to thefact that the size of multilateral trade is not controlled in the equations estimated.
Using bilateral trade shares, therefore controlling for omitted variables, theyhighlight, contrary to previous econometric results, that the EC has a strong extra-EC bias,i.e. might not be trade diverting. In addition, this might be due to trade distorting issues,as the Common Agricultural Policy, leading countries like France to trade more with therest of the world than suggested by « natural » determinants of trade.
This debate suggest that neither our database, nor our econometric specification arewell designed to address the trade creation/diversion issue.
As a result, our empirical estimates aim at giving a clear assessment of:
(a) the determinants of the nature (i.e. the structure by trade types) of bilateral trade inEurope: what are the respective influences of comparative advantages of membercountries, of returns to scale, of (Non-tariff) barriers to trade, of exchange ratefluctuations?
(b) the impact of the SEM, not only in its trade liberalisation dimensions (NTBs andborder formalities phasing out), but also looking at the impact of capital flows.
Thus, the econometric modelling aims at answering the following questions:
(a) has the SEM led to an in depth specialisation of member countries alongcomparative advantages (a positive relationship between the completion of the SEMand inter-industry trade, respectively a negative relationship with IIT)?
(b) has the SEM led to an in depth specialisation of member countries alongagglomeration economies, potentially detrimental to small (in GDP terms)countries (positive relationship between differences in size and inter-industrytrade)?
(c) what kind of effects might have had corrective instruments have, such as structuralfunds?
(d) has convergence led to more IIT or more specialisation?
But, in addition to these question, one has to address the issue associated with thetwofold nature of IIT: driven by a horizontal differentiation of products, IIT leads to gainsof variety and potential economies of scale, without implying high reconversion costs formember countries. At the opposite of this smooth path towards integration, inter-industrytrade, and the associated specialisation of countries has a cost in terms of resourcesdisplacement, along comparative advantages, or more accurately to the benefit of largecountries in case of agglomeration economies. Between these two polar cases, IITassociated with a vertical differentiation of products leads to specialisation along the

Trade patterns inside the Single Market
102
quality spectrum, as a result of R&D expenses, endowments in human capital, or simplyadvertising. In this case, IIT might be associated with a costly displacement of resources,as inter-industry trade under specialisation.
Finally, capital mobility potentially leads to intra-firm trade, which can be of eithertypes, but might also give the opportunity to discriminate among markets, to realise highmark-ups as a result of M&A leading to higher concentration of market structures,implications which might raise into doubt the gains associated with more IIT. If M&Awere associated with a strong positive impact on IIT in horizontally differentiatedproducts, it would raise the question of the opportunity of a tighter control ofmicroeconomic practices, through a strict internal competition policy. But this issue goesfar further the assessment of this study.
Looking at all this questions, an important problem emerges: since many problemsare potentially associated with the difference in income per capita between member states,it must be pointed out that two "Southern" European countries combine an evolutionassociated with the accession, and an evolution associated with the SEM, and this only forsimple agenda purposes. It will be necessary to disentangle what relies upon each of thesetwo events.
5.2. The general determinants of intra-EC trade patterns
5.2.1. Overview of the results
Table 16 summarises the principle results, for IIT. All signs are conventional,except for NTBs, a question which will be clarified below. Levels of significance are high.Detailed results and interpretation by type of trade are given in the following sections.
Table 16. Main results for IIT: intra-EC bilateral trade flows; panel data 1980-94
Country variables Marketstructure
Integration
All industries andcountries
GDP GDPD PCI PCID GDist SCALE Diff NTB NFDI EXR
value TWHD ++ -- ++ --# -- ++ -- ++ ++ --TWVD ++ -- ++ ++ -- ++ ns# ++ ++ --
share TWHD ++ -- ++ --# -- ++ -- ++ ++ --TWVD ++ ns ++ ++ -- ++ ++# ++ ++ --
++ positive parameter, significant at the 1% level-- negative parameter, significant at the 1% levelresp. + or - at the 5% levelns: parameter not significant at the 5% level# after solving for problems of multicolinearity with other variables

CEPII, document de travail n° 97-07
103
5.2.2. Intra-industry trade in horizontal differentiation
Concerning IIT based upon horizontal differentiation of products, the followingresults are obtained:
(a) Concerning the value of trade flows (Table 17), IIT increases with the size ofcountries, size leading to a greater variety, as systematically referred to in theliterature based on SDS preferences.
(b) In contrast, differences in sizes between trade partners hinder IIT in similarproducts, since the potential for gains in variety is reduced. Consequently, theexpected convergence of Southern European countries should lead to a strong risein this type of trade.
(c) IIT increases with the standard of living, as predicted by traditional models, richercountries offering more variety to consumers.
(d) The economic distance, i.e. the difference in factor endowments between countries,proxied here by the difference in per capita income, creates more opportunities forspecialisation along comparative advantage lines and therefore reduces IIT.
(e) Transaction costs have also a negative influence, which is trivial here, since valuesof flows are considered: its simply a gravitational impact, independent of the natureof trade flows.
(f) The vertical differentiation of products reduces IIT for horizontally differentiatedproducts, coincidentally with its (expected) positive impact on the IIT of productslocated differently on the quality spectrum (i.e. vertically differentiated products).
(g) Lastly, FDI, a proxy of an in-depth integration of economies, leads to greater tradein horizontally differentiated products. Reciprocal M&A have led to more trade:factor and products flows have been complements rather than substitutes during theintegration. This increase in trade flows cannot be interpreted in terms of tradecreation, as one does neither control for trade flows with Third countries, nor forM&A with Third Countries. In addition, this increase in Intra-EC trade flowsmight be associated for a large part to an increase in intra-firm trade flows, as aresult of M&A.
(h) Currency depreciation leads to specialisation, the share of inter-industry tradeincreasing, and conversely for the IIT share, whereas reducing values of trade of alltypes.
(i) The latter effect is particularly acute for IIT stemming from horizontaldifferentiation.
On the whole, keeping in mind that we have around 20,000 observations, theadjusted R2 is 76%, there is no heteroscedasticity (see χ 2 ), and there are few problems ofmulticolinearity, following the Belsley, Kuh and Welsh test: we have treated the mainproblem of multicolinearity, namely between the economic distance (PCID) andeconomies of scale (scale), a problem which led to the non-significance of PCID, while thesign was contradictory to theoretical reasoning. We have re-estimated this equation

Trade patterns inside the Single Market
104
without scale, considering that it did not disqualify PCID, but was due to multicolinearity,as expected the former variable has the correct sign and is significant at the 1% level.
Table 17. Panel data: results for values of bilateral intra-EC trade flows; 1980-94
Intra-Industry Trade Inter-Industry Trade
Horizontal Differentiation Vertical Differentiationparameter stand err sign. level parameter stand err sign. level parameter stand err sign. level
GDP 2.7259 0.0576 0.0001 1.6928 0.0352 0.0001 1.2898 0.0150 0.0001GDPD -2.7361 0.1427 0.0001 -1.1309 0.0870 0.0001 -0.8353 0.0372 0.0001PCI 0.4809 0.0961 0.0001 0.7556 0.0590 0.0001 0.0652 0.0251 0.0093PCID - # # 0.0001# 0.1580 0.0212 0.0001 -0.11634 0.0090 0.0001GDist -2.7167 0.0436 0.0001 -1.7466 0.0291 0.0001 -0.0675 0.0114 0.0001SCALE 23.9673 0.9383 0.0001 23.8527 0.6710 0.0001 15.2037 0.2448 0.0001Diff -0.9309 0.0576 0.0001 ns# # ns -0.0999 0.0150 0.0001NTB 3.3528 0.0987 0.0001 7.8213 0.1586 0.0001 1.4544 0.0257 0.0001NFDI 0.5055 0.0173 0.0001 0.5017 0.0106 0.0001 0.1340 0.0045 0.0001EXR -0.0039 0.0007 0.0001 -0.0016 0.0004 0.0003 -0.0005 0.0002 0.0140n 19034 19034 19034adj R2 0.7569 0.9257 0.9886F value 5926.6 1631.1 165434.0Prob>F 0.1% 0.1% 0.1%X2 3850.2 1589.6 1010.2Prob >X2 0.1% 0.1% 0.1%cond.numb.
32 / 29 # 33 / 29 # 32 / 29 #
#: after solving for multicolinearity problemsns: statistically not significant
Turning to shares (Table 17), the results are quite similar and therefore thoseexpected looking at the theory; the case for NTBs will be addressed below. The adjustedR2 is fairly high (46%), considering we are explaining the variance in the shares of tradetypes, not the values of trade flows, and there is no heteroscedasticity, nor are there fewproblems of multicolinearity: the latter are restricted to multicolinearity between PCID andGDist or Scale. Testing these two problems separately, PCID gets a correct signsignificant at the 1% level.

CEPII, document de travail n° 97-07
105
Table 18. Panel data: results for shares of trade types in bilateral intra-EC trade flows;1980-94
Intra-Industry Trade Inter-Industry Trade
Horizontal Differentiation Vertical Differentiationparameter stand err sign. level parameter stand err sign. level parameter stand err sign. level
GDP 0.9874 0.0362 0.0001 0.2572 0.0250 0.0001 -0.1758 0.0053 0.0001GDPD -1.0527 0.0896 0.0001 ns ns ns 0.5078 0.0132 0.0001PCI 0.3669 0.0608 0.0001 0.8604 0.0420 0.0001 # # #PCID - # - # 0.0001 0.1316 0.0151 0.0001 -0.0465 0.0032 0.0001GDist -1.7942 0.0300 0.0001 -0.7871 0.0207 0.0001 0.6108 0.0044 0.0001SCALE 16.2240 0.6912 0.0001 5.2562 0.4771 0.0001 # # #Diff -0.4903 0.0364 0.0001 + # # 0.0001 # 0.0227 0.0054 0.0001NTB 4.7200 0.1633 0.0001 3.1109 0.1127 0.0001 ns ns nsNFDI 0.3218 0.0109 0.0001 0.3421 0.0075 0.0001 # # #EXR -0.0024 0.0005 0.0001 -0.0008 0.0003 0.0104 0.0002 0.0001 0.0020n 19034 19034 19034adj R2 0.4614 0.6636 0.9890F value 1631.1 3755.8 170730.0Prob>F 0.1% 0.1% 0.1%X2 4096.8 1549.2 1987.0Prob >X2 0,1% 0.1% 0.1%cond. numb. 33 / 29 # 33 / 29 # 33 / 29 #
# : after solving for multicolinearity problemsns : statistically non significant
5.2.3. Intra-industry trade in vertical differentiation
Turning to IIT in products differentiated by quality, and explaining the value oftrade flows over 1980-94, the model leads to the following conclusions.:
(a) The size of countries, a variable which is often associated with the potential foreconomies of scale, ceteris paribus, and for greater variety of differing qualities forthe same product, has a positive effect on IIT in vertically differentiated products.
(b) The difference in GDPs, as under IIT in horizontal differentiation, has an oppositeeffect, due to the fact that we consider values of trade, largely affected bygravity-related explanations.
(c) As the demand for differentiation is expected to increase with income, therelationship between PCI and TWVDval is positive.
(d) Conversely, the economic distance proxying differences in factor endowments(PCID) has a positive effect: this relationship is symmetric with the one observedfor horizontally differentiated products, as expected on the basis of an interpretationof IIT with vertical differentiation in terms of specialisation.

Trade patterns inside the Single Market
106
(e) Transaction costs exhibit the expected negative sign, and conversely for scale.NTBs have the same impact for horizontal differentiation, as does FDI.
(f) As for IIT with horizontal differentiation, currency depreciation leads tospecialisation, and the IIT share decreases, a phenomenon which is less accuratethan for horizontal differentiation.
The adjusted R2 is very high, which is not so surprising since values of trade flowsare explained; there is no heteroscedasticity and few problems of multicolinearity. Thelatter are in fact concentrated on the Diff variable, accounting for the verticaldifferentiation of products. We have estimated the model without Scale and NTB in orderto cancel this problem, Diff becoming non-significant and having a negligible parameter.In contrast, the latter result proves that IIT with vertical differentiation and pricedispersion inside industries are not one and the same thing, despite our measurementmethodology for IIT based on unit values.
The explanation of the share of IIT with vertical differentiation in bilateral tradeflows of member countries gives quite interesting results. The adjusted R2 is high (66%),since we explain shares of trade types, there is no heteroscedasticity and littlemulticolinearity. First of all, and contrary of what was observed for the share of IIT withhorizontal differentiation, the difference of country sizes has a positive effect on TWVDsh:large countries are largely engaged in IIT with vertical differentiation, but are moreinvolved in the latter type of trade with respect to small countries than large ones.However, this relation is significant only at the 10% level, which casts doubts on the aboveexplanation. The second interesting point is related to the differentiation of products:taking into account multicolinearity between Diff and NTB, Scale and NFDI, whenre-estimating the model without these three variables, Diff is significant at the 1% leveland exhibits a positive relationship with the explained variable.
5.2.4. Inter-industry trade
It is necessary to control that inter-industry trade leads to a set of parameterestimates compatible with the one referred to above for IIT, bearing in mind that the sumof the three shares necessarily equal 100%: this third round of parameters is notindependent of the two previous ones. All parameters have the correct signs and aresignificant at the 1% level, except for NTBs which are not significant for explaining thisresidual share. For example, parameters associated with GDP or NTBs were previouslypositive in both cases, and the corresponding ones for inter-industry trade are necessarilynegative; those associated with transport costs were negative; the corresponding one isnow positive etc. Nevertheless, these principles are complicated by multicolinearitybetween PCI, Scale and FDI.
Lastly, turning to inter-industry trade in value, the model is simply an (largelyimproved !) gravitational explanation of bilateral trade flows associated with thespecialisation of member countries: therefore there is no reason for parameters to beconstrained by previous estimations. One can check that transport costs hinder trade, that

CEPII, document de travail n° 97-07
107
large countries trade more with large countries, that trade flows increase with income, thatFDI is complementary to trade etc.
The reader will also notice that the sign associated with PCID is rather surprising:since this explaining variable is supposed to be a proxy for the economic distance, i.e. forthe comparative advantage, it should be associated with a positive parameter; the resultobtained here might indicate that comparative advantage is not a basis for trade as long asintra-European trade is concerned, the specialisation playing more among quality rangesof products, inside industries, than inside industries. However, this might not be the case,as the origin for this result is twofold:
(a) Concerning values, trade between rich and poor countries is low for reasons which,obviously, are not simply limited to comparative advantage.
(b) Turning to shares, we detected a colinearity with the geographical distance. Evenfor inter-industry trade, countries trade more with their neighbours: France morewith Germany than with Greece, for example. As a result a high economic distancehas similar effects as transportation costs.
In contrast, GDPD -the difference in sizes of countries- has a negative impact on thevalue of inter-industry trade - as expected, and a positive one for the share of this type oftrade. Since differences in sizes are a proxy of differences in the potential for externaleconomies of scale -along arguments issuing from the new international economics- thisnegative sign should be interpreted as capturing the agglomeration effects referred toabove in the theoretical section: larger country can specialise -even against theircomparative advantage- for industries subject to high economies of scale, potentiallydetrimental to smaller countries, a phenomenon potentially distorting the structure of tradetowards inter-industry trade.
5.3. The impact of the Single Market
5.3.1. What do we know about the story?
At this stage, results provided by the methodology developed here are twofold:
(a) Section 4 has pointed out the large increase in IIT during the completion period;(b) Disentangling trade types, the first phenomenon is clearly associated with an
increasing share IIT based upon a vertical differentiation of products;
Nevertheless, it is impossible to assess the impact of SEM completion per se in thisevolution of trade patterns: catching-up, growth in Europe or long term trends might haveplayed an important role. To say it simply, it is impossible to establish a link between thecompletion and the rise in IIT in vertically differentiated products, on the basis of theanalysis developed in Section 4.

Trade patterns inside the Single Market
108
In addition, the current Section, while controlling for market structures, growth, realconvergence, and integration variables, has led to the identification of the followingresults:
(a) Larger countries trade more among them than with smaller ones, a phenomenonthat has to be controlled if one wants to assess the impact of the single market.
(b) There is no evidence that traditional determinants based upon comparativeadvantage of nations, have been at work for inter-industry trade and specialisationof member countries among industries; in contrast, comparative advantages haveclearly had a positive impact on IIT52 through a specialisation of countries along« fine » comparative advantages inside industries, for certain range of products. Anincrease in the economic distance (here PCID) among member states leads to lessIIT of similar products, and more IIT for vertically differentiated products andmore inter-industry trade.
(c) Agglomeration economies, based upon economies of scale beneficial to largercountries have had a positive impact on the share of trade associated with aspecialisation of countries; looking at the previous result, we can conclude thatinter-industry trade has been more driven by economies of scale than by thecomparative advantage.
(d) Economies of scale, directly measured at the firm level, confirm this interpretation:they have led to more inter-industry trade (in value). In addition, they have had ahigh impact on IIT of the both types, even if trade of horizontally differentiatedproducts is more sensitive to economies of scale than trade of verticallydifferentiated ones.
(e) FDI highlights a positive influence on both types of IIT, and a very smooth oneupon inter-industry trade. This prevalence of intra-firm trade in trade flowsassociated with the surge in FDI during the completion period leads to thefollowing question: is this IIT of an intra-firm nature or not? if yes, will this intra-firm trade lead to a reduction in welfare gains traditionally associated with varietygains, as a result of higher mar-ups potentially being the result of a higherconcentration of the market? it will be impossible to answer such questions here,given the type of data used.
(f) Industries with high Non-Tariff barriers have, over the period considered, beenceteris paribus subject to more IIT of both types. The latter result is of high concernin the perspective of an appraisal of the single market; it has now to be refined andexplained.
This effects being controlled, the following section will highlight effects of the SEMper se.
52 Through TWVD, which does not exclude, obviously, the expected negative impact on IIT based upon a horizontaldifferentiation of products.

CEPII, document de travail n° 97-07
109
5.3.2. Synthesis
Let us start by briefly giving the results which will be developed below (Table 19).
(a) the cancellation of NTBs might not be the main vector of integration associatedwith the internal market programme. Since these barriers did hinderspecialisation53 among European countries, intra-industry trade has been boosted toartificially high levels before the completion of the SEM. In contrast, cancellingNTBs has largely reduced this effect and has led to more inter-industry trade. Thiseffect is clearly dated (around 1986); IIT in horizontally differentiated products hasbeen more concerned than IIT in vertically differentiated ones. But at this stage, allthe benefits of this measures seem not have been obtained.
(b) by comparison, the cancellation of border formalities, by reducing transactioncosts, has had an impressive influence on trade: this measure has largely increasedtrade among member states. But it has led to intra-industry trade, of the both types(horizontal and vertical differentiation). Therefore, border formalities were not ahindrance to specialisation along comparative advantage lines in Europe. Wherecomparative advantages were the basis for trade, differences in costs were largeenough to overcome additional transaction costs54 in the pre-completion period.
(c) lastly, mechanisms associated with FDI have been complementary to trade: thelarge increase of M&A activity associated with the expectation of the completionhas led to large increases in intra-industry trade, potentially intra-firm (but this lastqualification cannot be checked here).
Notwithstanding these direct effects associated with NTBs and border formalities, orFDI, the SEM has had indirect effects which might be counteracting:
(a) a general impact of the SEM, largely underlined in the ex-ante studies, was anexpected increase in GDPs: here, growth translates in more IIT;
(b) at the same time, in order to foster convergence, structural funds were implementedin Europe: since they might have led to a decrease in differences of per capitaincome in the Community, their impact on trade flows might have been pro-IIT inhorizontal differentiation and reciprocally for IIT in vertical differentiation;
(c) last but not least, necessary adjustments of bilateral exchange rates in Europe haveled to less IIT and more specialisation along comparative advantage lines, i.e. moreinter-industry trade.
The empirical evidence of Section 5 is therefore the result of these complexrelationships.
53 Along comparative advantages.54 Symmetrically, IIT based on a horizontal differentiation of products is very sensitive to price differentials (1.5 morethan IIT based on vertical differentiation).

Trade patterns inside the Single Market
110
Table 19. The impact of the SEM: synthesis of econometric results
intra-industrytrade
inter-industrytrade
verticaldifferentiation
horizontaldifferentiation
NTBs cancellation Increased competition - +Border formalitiescancellation
Reduced transaction costs + +Microeconomicadjustment
FDI + +SEM completion Growth + +Structural funds Convergence of GDP - +(EMU) Currency depreciation - - +5.3.3. Where NTBs boosted IIT
First of all, taking into account panel data referred to above, a powerful result of oureconometric modelling is the fact that, before the completion of the Single Market, NTBsdid hinder specialisation along comparative advantage lines: as a result they had amechanical, positive impact on IIT, a parameter that is clearly ascertained by ourestimates.
How can one interpret this unexpected result? To the benefit of NTBs, Europeanfirms were maintained artificially on the market, and might have differentiated theirproducts in order to reinforce the non contestability of markets.
Therefore, the cancellation of NTBs associated with the completion of the SEM hasraised inter-industry trade: markets becoming more contestable, countries have specialisedalong the lines of their comparative advantages, notwithstanding the traditional increasein IIT associated with trade liberalisation among rich countries55.
In order to date this phenomenon, we have re-estimated the model following, overtime, the evolution of parameters associated with NTBs. The panel has been cut intosub-periods, designed to smooth their inter-annual high variations. Due tomulticolinearity, these estimates have been done without scale, diff and Exr.
55 Variables related to NTBs, which are considered here as characteristics of industries, might have captured effectsassociated with general features of these industries (as economies of scope etc.) rather than to commercial policies. Inthis case, the perturbing causes might be strong enough to overcome effects associated to barriers per se. A firstargument suggesting that this point must not be excluded lies in the multicolinearity problems encountered betweenFDI, Scale and NTB. These multicolinearity problems are particularly accurate for the vertical differentiation, in valueas in share. But estimating the model with or without any combination of the related variables leads to similar results.This proves that we do not face an artefact.

CEPII, document de travail n° 97-07
111
Figure 23 highlights the fact that the role of NTBs in explaining IIT with verticaldifferentiation is continuously declining. No effect of the SEM per se is captured: it mightbe the result of external factors, which are not controlled for here.
In contrast, turning to horizontal differentiation (Figure 24), we clearly capture theimpact of the SEM: whatever the initial level of the parameter is -considering that otherfactors might bias it upwards at a given moment of time- it is absolutely clear that thepositive impact of NTBs on TWHD is declining with the completion of the single market.NTB1 highlights two sub-periods of sharp decline just after 1986 and during the years1988-1993.
Since the share of inter-industry trade is not affected, values of inter-industry tradehighlight a large impact of SEM completion: Figure 25 points out the negative impact ofNTBs before the mid-eighties. After this turning point (whatever the proxy for NTBs is)this impact is positive, and increasingly positive.
This result means that the cancellation of NTBs has been associated with moreintra-European trade, and has led to more specialisation of member countries along thelines of comparative advantage. It is impossible, however, to infer any trade creation, sinceit might be simply the result of a trade diversion detrimental to third countries, whatcannot be controlled for here.
Turning to an alternative solution, which cuts the panel into two pre- andpost-completion sub-periods, similar results were obtained.
Figure 23. Impact of NTBs with vertical differentiation, all countries, all industries(1980-94, share)
0.8
1.3
1.8
2.3
2.8
3.3
3.8
4.3
NTB1
NTB2
Note: value of parameter estimates on the vertical axis; time on the horizontal axis (1980-82, then1981-83 etc.). All parameters are significant at the 1% level.

Trade patterns inside the Single Market
112
Figure 24. Impact of NTBs with horizontal differentiation, all countries, all industries(1980-94, share)
0.6
1.1
1.6
2.1
2.6
1984-1986
NTB1
NTB2
Note: value of parameter estimates on the vertical axis; time on the horizontal axis (1980-82, then1981-83 etc.). All parameters are significant at the 1% level.
Figure 25. Impact of NTBs on inter-industry trade, all countries, all industries(1986-94, value)
-1
-0.8
-0.6
-0.4
-0.2
0
0.2
0.4
0.6
0.8
1
1983-85
1984-86
NTB1
NTB2
Note: value of parameter estimates on the vertical axis; time on the horizontal axis (1980-82, then1981-83 etc.). All parameters are significant at the 1% level, obviously with the exception of theturning point.
5.3.4. The impact of reduced transaction costs
Cancellation of border formalities are another way of addressing the question of theimpact of the SEM: since transaction costs decrease, a decline in parameters associatedwith Gdist is to be expected: distance to market is less costly after in the Single Market. It

CEPII, document de travail n° 97-07
113
might have induced more trade among member states and/or may have changed the natureof trade.
Figure 26 points out the lower influence of transaction costs on trade in verticallydifferentiated products, compared with horizontally differentiated ones. The demand forthe latter is more price elastic, as qualities are similar.
Clearly, the cancellation of border formalities has resulted in more Intra IndustryTrade in Europe, by lowering transaction costs (here, the value of the negative parameteris reduced in absolute terms). In any case, this enhanced trade cannot be interpreted interms of trade creation: since this study focuses on intra-EC trade, any increase in intra-EC trade might be due either to a trade creation or to a trade diversion.
Conversely, the influence on inter-industry trade is nil: the negative impact oftransaction costs does not change over time. Where differences in production costs werelarge enough, transaction costs were not a hindrance to specialisation among membercountries, in contrast to NTBs: a foreign firm can bear transaction cost, but publicprocurement practices may not be circumvented.
The results for shares of trade types are similar: it means that the Single Market hasnot only increased trade among member states: it has also changed the nature of theirbilateral trade flows, by increasing the share of IIT in total trade.
Figure 26. The influence of transaction costs on values of IIT inside the EC (1980-94)
-4.5
-4
-3.5
-3
-2.5
-2
-1.5
1982-84
1985-87
TWHD
TWVD
Note: value of parameter estimates on the vertical axis; time on the horizontal axis (1980-82, then1981-83 etc.). All parameters are significant at the 1% level.

Trade patterns inside the Single Market
114
Figure 27. Influence of transaction costs on shares of IIT inside the EC (1980-94)
-2.5
-2
-1.5
-1
-0.5
0
TWHD
TWVD
Note: value of parameter estimates on the vertical axis; time on the horizontal axis (1980-82, then1981-83 etc.). All parameters are significant at the 1% level.
5.3.5. Where size matters
Turning to industries, it is possible to estimate the model on a panel basis, industryby industry, over the period considered here. Therefore equations for values and shares oftrade types have been estimated with around 1,600 observations each. Statistical test havebeen implemented for each equation. The estimates were ran without scale, due tomulticolinearity problems.
Obviously, all these results can not be presented in detail here, and only threedimensions will be presented below: the relationship associating respectively country sizeand differences in size, transaction costs and FDI with IIT in horizontal or verticaldifferentiation.
First of all, country size allows for the completion of economies of scale insideindustries. As a result, it may promote IIT, country specialising in different varieties orqualities of products.
On the contrary, differences in size may lead to mono-location of industries, ifexternal economies of scale/agglomeration economies play an important role. In contrastinter-industry trade would be promoted in this case.
First of all, let us consider what industries are sensitive to the market size: Figure 28points out that, for all industries, the potential for economies of scale has led to IIT inhorizontal differentiation rather than in vertical one. The reasoning behind this empiricalevidence is straightforward: competition in price is more accurate when goods aredifferentiated by characteristics but belong to the same quality range. Therefore,international trade, since it increases outputs, authorises the achievement of economies of
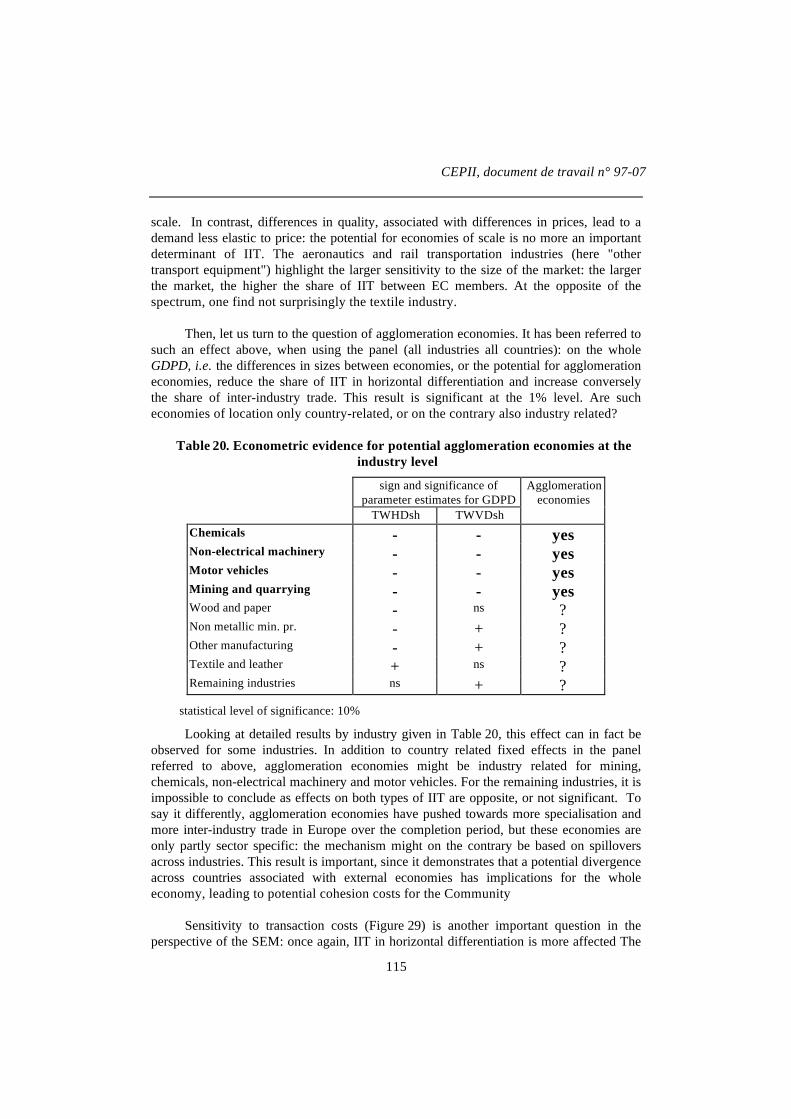
CEPII, document de travail n° 97-07
115
scale. In contrast, differences in quality, associated with differences in prices, lead to ademand less elastic to price: the potential for economies of scale is no more an importantdeterminant of IIT. The aeronautics and rail transportation industries (here "othertransport equipment") highlight the larger sensitivity to the size of the market: the largerthe market, the higher the share of IIT between EC members. At the opposite of thespectrum, one find not surprisingly the textile industry.
Then, let us turn to the question of agglomeration economies. It has been referred tosuch an effect above, when using the panel (all industries all countries): on the wholeGDPD, i.e. the differences in sizes between economies, or the potential for agglomerationeconomies, reduce the share of IIT in horizontal differentiation and increase converselythe share of inter-industry trade. This result is significant at the 1% level. Are sucheconomies of location only country-related, or on the contrary also industry related?
Table 20. Econometric evidence for potential agglomeration economies at theindustry level
sign and significance ofparameter estimates for GDPD
Agglomerationeconomies
TWHDsh TWVDshChemicals - - yesNon-electrical machinery - - yesMotor vehicles - - yesMining and quarrying - - yesWood and paper - ns ?Non metallic min. pr. - + ?Other manufacturing - + ?Textile and leather + ns ?Remaining industries ns + ?
statistical level of significance: 10%
Looking at detailed results by industry given in Table 20, this effect can in fact beobserved for some industries. In addition to country related fixed effects in the panelreferred to above, agglomeration economies might be industry related for mining,chemicals, non-electrical machinery and motor vehicles. For the remaining industries, it isimpossible to conclude as effects on both types of IIT are opposite, or not significant. Tosay it differently, agglomeration economies have pushed towards more specialisation andmore inter-industry trade in Europe over the completion period, but these economies areonly partly sector specific: the mechanism might on the contrary be based on spilloversacross industries. This result is important, since it demonstrates that a potential divergenceacross countries associated with external economies has implications for the wholeeconomy, leading to potential cohesion costs for the Community
Sensitivity to transaction costs (Figure 29) is another important question in theperspective of the SEM: once again, IIT in horizontal differentiation is more affected The

Trade patterns inside the Single Market
116
reasons are those already referred to above, associated with sensitivity to pricedifferentials. Leaving aside the unexplained estimate obtained for "non-electricalmachinery", the automobile industry and "other transport equipment" are the twoindustries mostly concerned by transaction costs and the size of the market. In contrast,trade in professional goods, concerning more specific products and a demand less elasticto prices, is not really concerned by both determinants.
Lastly, it should be noticed that FDI (Figure 30), in contrast to previousdeterminants, has had a higher impact on IIT in vertically differentiated products:professional goods, other transport equipment, non metallic mineral products, wood-paper-printing, food-beverages-tobacco, and agriculture-hunting-forestry are concerned.
Figure 28. Impact of market size on the share of IIT in intra-EC trade (1980-1994)
0
0.5
1
1.5
2
2.5
agric
hun
t for
food
bev
tob
min
ing,
pet
rol
chem
ical
s
woo
d pa
per
text
ile le
athe
r
non
met
all m
in
basi
c m
etal
l
non-
elec
trica
l mac
h
elec
trica
l mac
h
mot
or v
ehic
othe
r tra
nsp
prof
goo
dsTWHDshTWVDsh
Note: parameter estimates (1980-94) on the vertical axis. Missing values: parameter estimates notsignificant at the 10% level.

CEPII, document de travail n° 97-07
117
Figure 29. Impact of transaction costs on IIT between EC members (1980-1994)
-3
-2.5
-2
-1.5
-1
-0.5
0
0.5
agric
hun
t for
food
bev
tob
min
ing,
pet
rol
chem
ical
s
woo
d pa
per
text
ile le
athe
r
non
met
all m
in
basi
c m
etal
l
non-
elec
trica
l mac
h
elec
trica
l mac
h
mot
or v
ehic
othe
r tra
nsp
prof
goo
ds
TWHDshTWVDsh
Note: parameter estimates (1980-94) on the vertical axis. Missing values: parameter estimates not significant at the10% level
Figure 30. Impact of M&A on IIT between EC members (1980-1994)
0
0.1
0.2
0.3
0.4
0.5
0.6
agric
hun
t for
food
bev
tob
min
ing,
pet
rol
chem
ical
s
woo
d pa
per
text
ile le
athe
r
non
met
all m
in
basi
c m
etal
l
non-
elec
trica
l mac
h
elec
trica
l mac
h
mot
or v
ehic
othe
r tra
nsp
prof
goo
ds
TWHDshTWVDsh
Note: parameter estimates (1980-94) on the vertical axis. Missing values: parameter estimates notsignificant at the 10% level
Trade patterns inside the Single Market
118
5.3.6. Where FDI did not displace trade
A question recently raised by the theory is the relationship not only between tradeand factor mobility, but also factor mobility and the nature of trade. As pointed out byMarkusen (1995), an international mobility of capital -associated with multinationalcompanies- might lead to a trade displacement: in that case decreasing values of inter-industry trade would translate in an increasing share of IIT, as affiliates increase theirsales.
It has been referred to above that the completion period has been accompanied by asurge in intra-European M&A and FDI, even if when controlled for FDI relationshipsbetween the EC and Third countries. Markusen (1995) noticed that this issue had not paidmuch attention until its 1995-survey. What does our 1980-94 of intra-EC trade panel sayabout it?
It is true that the surge in M&A has been associated with an increasing share of IITin total intra-EC bilateral trade, along the Markusen’s hypothesis. In addition it is a verystrong conclusion, since parameters are statistically significant at the 1% level. But, incontrast, the trade displacement effect referred to in Markusen (1995) and Markusen andVenables (1995) cannot been observed: there is (at the 1% significance level) a positiverelationship between FDI and the value of inter-industry trade, as well as with IIT. Theonly element fitting Markusen’s intuition is the fact that this positive impact is 4 timesmore important for IIT than for inter-industry trade. It might be the case that Markusen isbasically true, but other economic elements of the multinational strategy are not capturedby his model.
This complex relationship has been checked using another specification of oureconometric equations using, as a proxy, FDI flows in bilateral Balance of Payments, inreplacement for M&A: all parameters being positive, we can conclude that FDI has notdisplaced intra-EC trade, even if its positive impact on IIT has been much more accuratethan for inter-industry trade.
5.3.7. Accession or completion?
The agenda of European integration has been crowded in the mid-1980s for Spainand Portugal: accession on the one hand, completion of the single market on the otherhand. Looking at results obtained in section 5, EC trade patterns over the completionperiod might be largely sensitive to the accession of the former countries.
More precisely, it has been highlighted that Portugal and especially Spain havetrade structures that have become more similar to the ones in the "core countries": theshare of IIT is increasing. Since the present report aims at giving an ex post appraisal ofthe Single Market, it is necessary to check that our results are not sensitive to this event.

CEPII, document de travail n° 97-07
119
One might suppose that the increasing share of these countries in European tradeflows, added to the transformation of their trade structures, would result in an increase inthe share of IIT in Intra-European trade. Therefore, what is understood here as the resultof the single market completion might be the result of the Spanish and Portugueseaccessions. Figure 31 clearly reject this hypothesis.
Figure 31. Trade types and the GL indicator in intra-EC trade, with and withoutSpain and Portugal, 1980-1994
All EC member states
8 0 8 1 8 2 8 3 8 4 8 5 8 6 8 7 8 8 8 9 9 0 9 1 9 2 9 3 9 41 5
2 0
2 5
3 0
3 5
4 0
4 5
5 0
T w o - w a y t r a d ein s imi l a r p roduc t s
T w o - w a y t r a d ein ver t ica l d i f ferent ia t ion
O n e - w a y - t r a d e
G L
EC without Spain and Portugal
8 0 8 1 8 2 8 3 8 4 8 5 8 6 8 7 8 8 8 9 9 0 9 1 9 2 9 3 9 41 5
2 0
2 5
3 0
3 5
4 0
4 5
5 0
T w o - w a y t r a d ein s imi la r p roduc t s
T w o - w a y t r a d ein ver t ica l d i f ferent ia t ion
O n e - w a y - t r a d e
G L
Source: Eurostat-Comext, calculations by the CEPII.
Nevertheless, it must be kept in mind that the model implemented here does explainbilateral trade flows of member countries, of which a large part is only slightly affected bythese new accessions, given the weight of these two countries.
It is possible to investigate these question by running the econometric model oncewith these two countries, and then again but without them. The rule of thumb is thereforeto assess if parameter estimates for the panel are largely affected by this transformation ornot, and in addition to compare statistical levels of significance.
Another solution might be to introduce dummies for these countries. As referred toabove, this kind of methodology can capture anything but the effect they are supposed tocontrol for. Therefore, such a strategy of research has been eluded.
Results given in Table 21 highlight that parameter estimates are not affected by thepresence of these two countries. Often, the quality of regressions is slightly improved, butnothing does fundamentally changed, with the exception of GDPD, an explanatoryvariable not significant with and significant without Spain and Portugal, when oneexplains the share of IIT in vertically differentiated products in total bilateral trade flows.The parameter then becomes positive, as for inter-industry trade. In addition,multicolinearity is slightly reduced.

Trade patterns inside the Single Market
120
Table 21.Comparison of parameter estimates with and without Spain and Portugal in the 1980-94 panel
valueIntra-Industry Trade Inter-Industry Trade
Horizontal Differentiation Vertical Differentiationparameter
withparameterwithout
sign. level parameterwith
parameterwithout
sign. level parameterwith
parameterwithout
sign. level
GDP 2.7259 2.6236 0.0001 1.6928 1.6735 0.0001 1.2898 1.2855 0.0001GDPD -2.7361 -2.1928 0.0001 -1.1309 -0.8773 0.0001 -0.8353 -0.8482 0.0001PCI 0.4809 0.5848 0.0001 0.7556 0.6308 0.0001 0.0652 0.0589 0.0093/
0.0359PCID - # - # 0.0001 0.1580 0.0464 0.0001 -0.1164 -0.1486 0.0001GDist -2.7167 -2.6185 0.0001 -1.7466 -1.6370 0.0001 -0.0675 -0.0479 0.0001SCALE 23.9673 23.3503 0.0001 23.8527 23.3601 0.0001 15.2037 14.9957 0.0001Diff -0.9310 -0.9006 0.0001 -0.3235 -0.2361 0.0001 -0.0999 -0.0532 0.0001/
0.0013NTB 3.3529 3.2116 0.0001 7.8213 7.6219 0.0001 1.4544 1.4354 0.0001NFDI 0.5055 0.5051 0.0001 0.5017 0.4956 0.0001 0.1340 0.1354 0.0001EXR -0.0039 -0.0066 0.0000 -0.0016 -0.0048 0.0003 -0.0005 -0.0006 0.0140/
0.0298n 19034 15672 19034 15672 19034 15672adj R2 0.7569 0.7794 0.9257 0.9372 0.9886 0.9889F value 5926.6 5536716.0 1631.1 23407 165434.0 139375Prob>F 0.1% 0.1% 0.1% 0.1% 0.1% 0.1%X2 3850.2 3013.2 1589.6 1111 1010.2 819Prob >X2 0.1% 0.1% 0.1% 0.1% 0.1% 0.1%cond. numb. 32 / 29# 31 / 28# 33 / 29 # 32 / 28# 32 / 29# 31 / 28#
shareIntra-Industry Trade Inter-Industry Trade
Horizontal Differentiation Vertical Differentiationparameter
withparameterwithout
sign. level parameterwith
parameterwithout
sign. level parameterwith
parameterwithout
sign. level
GDP 0.9874 0.9132 0.0001 0.2572 0.2338 0.0001 -0.1758 -0.1834 0.0001GDPD -1.0527 -0.6382 0.0001 ns 0.3098 ns / 0.0001 0.5078 0.5243 0.0001PCI 0.3669 0.4335 0.0001 0.8604 0.7923 0.0001 # # #PCID - # - # 0.0001 0.1316 0.0653 0.0001 -0.0465 -0.0478 0.0001GDist -1.7942 -1.7222 0.0001 -0.7871 -0.7137 0.0001 0.6108 0.6124 0.0001SCALE 16.2240 15.7165 0.0001 5.2562 5.0752 0.0001 # # #Diff -0.4903 -0.4943 0.0001 + # + # 0.0001 # 0.0227 0.0255 0.0001NTB 4.7200 4.4745 0.0001 3.1109 2.9556 0.0001 ns ns 0.0001NFDI 0.3218 0.3214 0.0001 0.3421 0.3371 0.0001 # # #EXR -0.0024 -0.0045 0.0001 -0.0008 -0.0035 0.0104 /
0.00010.0002 ns ns
n 19034 15672 19034 15672 19034 15672adj R2 0.4614 0.4635 0.6636 0.7013 0.9890 0,9876F value 1631.1 1355.0 3755.8 3680 170730.0 124990Prob>F 0.1% 0.1% 0.1% 0.1% 0.1% 0.1%X2 4096.8 3229.2 1549.2 1080 1987.0 1801Prob >X2 0,1% 0.1% 0.1% 0.1% 0.1% 0.1%cond. numb. 33 / 29# 32 / 28# 33 / 29# 32 / 28# 3 3/ 29# 32 / 28#
Source: Eurostat,calculations by the CEPII.
Turning to results by country, it is possible to run two sub panels for Spain andPortugal facing their European partners. This exercise is, from a strict econometric pointof view, of poor quality if one uses the standard specification developed here for the globalpanel: sharply reducing the number of observations necessary leads to multicolinearityproblems as the number of explaining variables remains high. In comparison with theglobal panel, we have around 2.5 times multicolinearity for Spain, whereas for Portugal itraises until 4 times more multicolinearity.

CEPII, document de travail n° 97-07
121
Concerning Portugal, multicolinearity problems for TWVDval are associated withDiff, Scale, NTB, and EXR, i.e. to market structure and integration variables. The sameproblem arises for Spain since Owval is considered. On the whole, the Diff variable workspoorly here, for all equations.
These problems of multicolinearity being handled, the picture for the two Southerncountries is slightly different from the one arising from the global panel (Table 22).
First, contrary to the general pattern of intra-EU trade, the share of IIT undervertical differentiation is negatively related to the average size (GDP) of Spain/Portugaland partner countries. The two Southern members are less engaged with large (core)countries than with other member states in this type of trade. This is confirmed by thepositive relationship between the Spanish share of IIT under horizontal differentiation andthe difference between Spanish and partner country incomes per capita. On the whole, itmeans that the expected catching up of Spain would lead to a smaller share of both typesof IIT in total Spanish trade: this result was expected for vertically differentiated productsbut not for horizontally differentiated ones. In contrast a Portuguese catching up wouldlead to an increase (not expected) in two-way trade in vertically differentiated products.
Turning to trade in value, GDP recovers the "correct" for Spain but not for Portugal.The relationship between TWHD and PCID is steadily positive for Spain. Inter-industrytrade of both Southern countries looks negatively related to the average income per capitaof partner countries, contrary to IIT; unfortunately there is a multicolinearity problembetween PCI and GDP. Turning to PCID, a proxy for the comparative advantage ofnations, a scheme of specialisation, between industries, is ascertained by the positive signfor Spain. This variable is unfortunately not significant for Portugal.
But what it is more striking, is the result for FDI: once again, FDI has not beentrade displacing; in addition, it must be pointed out that the impact of FDI is around 2 to 3times larger for the Spanish trade than for the Portuguese one, for all types of trade, whatconfirms the intuition of the leading role of factor mobility in the Spanish integration toEU-trade. Finally, it is ascertained by our estimates that FDI has led, first of all, to (intra-firm ?) IIT of horizontally differentiated products.

Trade patterns inside the Single Market
122
Table 22.Comparison of parameter estimates for Spain and Portugal (panel 1980-94, all industries)
value
Intra-Industry Trade Inter-Industry Trade
Horizontal Differentiation Vertical DifferentiationSpain Portugal sign. level
%Spain Portugal sign. level
%Spain Portugal sign.
level %GDP 1.8246 2.4508 0.0001/
0.01080.6782 -2.247882 0.0215/
0.00080.7441 1.6305 0.0001
GDPD -4.6065 ns 0.0001/ ns -2.4380 10.809358 0.0001 - # -2.1992 0.0001 # /0.0404
PCI 2.4153 ns 0.0001/ ns 2.1661 7.002669 0.0001 - # -0.4588 0.0001 # /0.0034
PCID 0.3312 ns 0.0291/ ns 0.6793 ns # 0.0001/ ns # 0.0464 ns 0.0120/ nsGDist -2.9230 -3.2336 0.0001 -1.6677 -1.923771 0.0001 0.2486 -0.1333 0.0080/
0.0001SCALE 26.2990 26.0926 0.0001 21.9310 34.623585 0.0001 9.7994 18.6592 0.0001Diff -0.9574 -1.2433 0.0001 -0.6188 -0.817830 0.0001 -0.2793 -0.4635 0.0001NTB 3.2407 4.5877 0.0001 7.7213 10.891481 0.0001 1.0731 1.4417 0.0001NFDI 1.4303 0.4474 0.0001 1.1488 0.512157 0.0001 0.5927 0.1250 0.0001EXR ns ns ns 0.0046 0.002892 0.0003/
0.0508ns ns # ns/ ns #
n n=1670 n=1670 n=1670 n=1670 n=1670 n=1670adj R2 0.50 0.50 0.80 0.80 0.99 0.99
share
Intra-Industry Trade
Horizontal Differentiation Vertical DifferentiationSpain Portugal sign. level
%Spain Portugal sign. level
%GDP 0.7551 ns 0.0101/ ns -0.3563 -2.4234 0.0863/
0.0001GDPD -3.3596 ns 0.0001/ ns -1.4355 8.3188 0.0001
PCI 1.4806 1.8381 0.0001/0.0242
1.6938 5.3043 0.0001
PCID 0.2073 ns 0.0312/ ns 0.4646 -0.7652 0.0001
GDist -2.2114 -2.3371 0.0001 -0.8273 -1.0012 0.0001
SCALE 22.6686 19.7929 0.0001 7.8959 10.8591 0.0001
Diff -0.4020 -0.4596 0.0009/0.0025
-0.2750 -0.3945 0.0011
NTB 5.6129 7.5837 0.0001 3.8005 5.6584 0.0001
NFDI 0.6237 0.2755 0.0001 0.6501 0.3495 0.0001
EXR -0.0025 ns 0.0468/ ns 0.0032 0.0025 0.0003/0.0217
n 1670 1670 1670 1670
adj R2 0.52 0.52 0.46 0.46

CEPII, document de travail n° 97-07
123
5.3.8. Single market without a single currency
The potential impact of exchange rates on the types of trade defined here has oftenbeen questioned:
(a) as far as unit values are used in order to disentangle the two types of IIT, dovariations in the value of national currencies modify the results? More specifically,would the introduction of bilateral exchange rates in an explanation of IIT based onpanel data affect the value of parameters?
(b) do exchange rate variations transform the specialisation of countries, and/or changethe respective share of IIT and inter-industry trade?
(c) do the same variations change the respective weight of the horizontal and verticaldifferentiation determinants of this IIT?
In response to these questions, three type of arguments have to be considered:
(a) first of all, an econometric model using panel data over 14 years, covering the set ofall member countries, and being designed on a bilateral basis, seems to be the idealtool in order to investigate this type of question;
(b) but at the same time, theoretical explanations addressing these questions are poor:following Bergstrand (1989, 1990), we were expecting no influence of the bilateralexchange rate on intra-industry and inter-industry shares; turning to the values oftrade, the potential impact is ambiguous, depending of the CES.
(c) finally, since our methodology of IIT measurement has something to do with unitvalues, the results might be suspected to be biased if the model did not control forexchange rates, even for shares.
Adding to these controversial issues, it must be remembered that there is nosatisfactory proxy of bilateral exchange rates: ideally, the variable related to the exchangerate would reflect absolute bilateral values of national currencies, emphasising for examplethe fact that the FF against the DM has more value than the FF against the FB. Incontrast, existing measures of exchange rates do not reach this ideal, giving informationon the evolution, not on the level, of these values. What is taken into account is the factthat FF depreciates more against DM than against FB.
Despite these difficult questions, exchange rates have been introduced in theeconometric estimates in order to assess the different types of arguments. It must be keptin mind that our model uses the value of bilateral exchange rates, year by year. Therefore,one does not include explicitly exchange rate fluctuations in the model; but since a panel isused, these variations are associated with the sign of the related parameter.
The following results are obtained.
(a) Introducing bilateral exchange rates in the panel, parameters associated with thisnew independent variable are highly statistically significant for all equations.

Trade patterns inside the Single Market
124
(b) This new specification does not change either signs nor the values of parametersassociated with other variables; there is only slight colinearity between exchangerates and PCI. Our model is therefore not biased by exchange rate fluctuations.
(c) There is a negative relationship with this new variable and all types of trade invalue, whereas this relationship is positive with inter-industry trade in share.
The interpretation of these results is the following: as a country depreciates itscurrency, the number associated with its bilateral exchange rate increases whereas thevalue of its bilateral trade registered in ECU might not change. On the contrary this value,in ECU, decreases (negative relationship) for all types of trade, i.e. for trade as a whole.As for other types of commercial policies, a currency depreciation leads to less trade. Itmight nevertheless be the result of macroeconomic policies accompanying the devaluation,and not of the variation in the exchange rate per se. Or it might be associated with pricingto market strategies: if exporters of the depreciating declaring country do not increase theirmark-up, their prices will be held constant in local currency and depreciated in ECU. Ifsales are not elastic enough, their exports will decrease in ECU, whereas their reducedimports will also push bilateral trade down.
CONCLUSION
While trade per se was not the focus of ex ante studies on the gains from Europeanintegration, the implicit assumption was that the removal of the remaining barriers to themobility of goods would translate into an increase in trade flows within the Community,and that most of this increase would be of the intra-industry type, i.e. simultaneousexports and imports within industries.56 Intra-industry trade, based upon the similarity ofnations, may lead to cost free adjustments, increased efficiency and welfare gainsassociated with variety. In contrast, inter-industry trade, traditionally associated withcomparative advantages of nations, may lead to more costly adjustments, as trade andspecialisation move factors from contested export-oriented industries. At the same time,ex ante studies expected that not all sectors and member states would be affected in thesame way.57
Any ex post evaluation on the impact of the Single European Market has to take intoaccount recent developments in international trade theory which weaken the traditionalrelationship between trade structure and the correlative adjustments in productionstructures. As a result, the debate on changes in trade patterns in Europe associated withthe Single Market is less clear than suggested by the traditional association referred toabove, i.e. painful adjustments in case of inter-industry trade, and cost free adjustments forintra-industry trade.
(a) Determinants and consequences of intra-industry trade in horizontallydifferentiated products are different from those in vertical differentiation. In theformer case (exchange of varieties), products sold at the same price are perfect
56 Emerson et al. (1990, Chap. 6).57 European Commission (1990b).

CEPII, document de travail n° 97-07
125
substitutes, while in the second (exchange of qualities) a common ranking ofconsumer preferences can be associated with differences in quality. In the lattercase, the adjustment costs associated with an increase in intra-industry trade mightbe sizeable, since it might not be equivalent to specialise in high or low qualityproducts in the same industry.
(b) Inter-industry trade is no longer exclusively based upon comparative advantages:economies of mono-location or agglomeration, spillover effects, or more generallythe country differences in size do matter. Agglomeration economies might increaseinter-industry trade, in the same manner as in the United States, where states andregions exhibit a high degree of industrial specialisation.58
(c) Concerning factor mobility, the convergence hypothesis59 leads to a complexrelationship between FDI, trade values and trade structure: as countries converge,multinational firms might displace trade. As pointed out by Markusen (1995), aninternational mobility of capital -associated with multinational companies- mightlead to a trade displacement: in that case decreasing values of inter-industry tradewould translate in an increasing share of IIT, as affiliates increase their sales.Therefore, an important issue is whether factor mobility has been, or not, asubstitute to trade flows (due to increasing affiliates' sales) as a result of the singlemarket completion.
As a result, this study has first addressed the following questions:
(a) What evolution of intra-EC trade patterns can be observed over 1980-1994? Has thecompletion of the SEM been associated with increased trade flows among memberstates on an inter-industry or intra-industry basis?
(b) In case of an increase in intra-industry trade, does it concern mostly horizontally orvertically differentiated goods?
(c) On which price/quality segments are the member states positioned?
These questions are important as variations in trade patterns among member statesare expected to provide important information about the nature and the size of the effectsof the Single Market on production structures, and thereby give indirect indications aboutthe magnitude of efficiency gains achieved so far.
Trade patterns were measured using information on values and unit values forbilateral trade flows for some 10,000 products over 1980 to 1994. In total, some12 million bilateral trade flows were taken into account. This analysis of intra-EC tradefrom 1980 to 1994 has confirmed what is generally found in the empirical literature: intra-EC trade is characterised by an increase in intra-industry trade, especially from the mid-1980s onwards.
The most important trade type in the beginning of the 1980s was one-way trade(with a share of some 45% in intra-EC trade). It started to decline from the mid-1980s 58 Krugman (1993).59 Markusen and Venables (1995).
Trade patterns inside the Single Market
126
onwards: the preparation phase of the SEM was accompanied by a decrease in the shareof inter-industry trade in Europe. This, however, does not mean that SEM per se hascaused this event; it could be associated with other determinants which may have playedsimultaneously.
But in contrast to what is often implicitly assumed, the rise in intra-industry tradein intra-EC trade does not concern horizontally differentiated products, but productswhich are vertically differentiated. In fact, two-way trade in similar products remainsrather stable, whereas two-way trade in vertically differentiated products -associated with aqualitatively division of labour- increased significantly and represented the most importanttrade type in 1994.
Even if the rise in two-way trade (be it in horizontal or vertical productdifferentiation) is most pronounced for Spain and Portugal, the overall rise in intra-industry trade within the EC cannot be attributed to these two countries, as the EC-averagehardly changes once Spain and Portugal are excluded.
For each member country, two-way trade in vertically differentiated products ismore important than two-way trade in similar products. However, this pre-eminentfeature of intra-European trade has received little attention in the theoretical literature. Itunderlines the particular interest of the question on which market segment differentmember states are positioned, as this might have important consequences in terms ofincome distributions. From a policy point of view, it must be borne in mind, wheninterpreting such a pattern of trade, that high "quality" (as revealed by prices) can beattributed to more R&D, higher qualified labour, the specific organisation of firms'internal procedures, or large investments in advertising. Therefore, the range on whichcountries specialise is not "neutral", especially as far as catching-up is concerned.
The difference between Northern and Southern countries is striking once overallstrengths in price/quality ranges are analysed. While Northern countries show upcomparative advantages in up-market products (Ireland and Germany), in the medium-and up-market range (France) or in medium-market goods (United Kingdom, Netherlands,Belgium-Luxembourg and Denmark), Southern countries are specialised in the lowerquality range: down-or medium-market goods for Spain and Greece, and down-marketproducts for Italy and Portugal.
But over time things have changed for Southern countries: in the early nineties,their comparative advantage for down-market products fell, whereas specialisation turnedeither towards top or medium quality products. Evidence does not support the scenario ofan integration based on "residual" specialisation on down-market products with itscorrelative adverse consequences for catching-up.
One possible argument against an indicator based on relative unit values used in thisstudy concerns the impact of bilateral exchange rates variations on relative prices.Substantial depreciations can lead domestic producers to a higher competitiveness due tolower export prices, a phenomenon which in our methodology might be incorrectly
CEPII, document de travail n° 97-07
127
interpreted as "lower quality". For example the overall specialisation in down-marketproducts which can be found for Italy in 1994 can be raised into doubt since it may be theresult of the depreciation of the lira. However, an analysis at the industry level shows thatcurrency depreciation has not led Italy to down-market specialisation in its key industries:its first comparative advantage still concerns up-market textiles. The same remark can bemade for the United Kingdom, showing up an up-market specialisation for chemicals in1994.
The large increase in IIT, and the importance of intra-European trade in verticallydifferentiated products are two phenomenon which might be associated with SEMcompletion, but also with other features of the European economy, such as growth,convergence of countries etc. As a result, SEM completion and the rise in IIT might onlybe simultaneous events; moreover, the Single Market might have had own effectscounteracting with natural trends in European trade patterns.
Most determinants act in the same way on IIT in both types of productdifferentiation, i.e. they either increase or reduce their respective share in total bilateraltrade.
Among the factors which increase the share of IIT both for horizontally andvertically differentiated products are:
(a) Market size, which leads both to a greater product variety (horizontaldifferentiation) and a larger quality spectrum (vertical differentiation): intra-EC IITthus may rise the consumers' welfare and producers’ efficiency.
(b) Average per capita income of declaring and partner countries has a similar effect,since richer countries offer more variety as well as a larger quality spectrum toconsumers.
(c) Returns to scale, as suggested by ex ante studies, boost IIT of both types.(d) Foreign direct investment, an integration variable, leads to a greater share of IIT of
both types.(e) Intensity of Non Tariff Barriers in intra-EC trade before the SEM completion leads
to a greater share of IIT in bilateral trade, a relationship statistically highlysignificant; possibly, these barriers hindered the exhaustion of returns to scale,leading to a greater variety of products.
In contrast, factors which reduce the share of both types of intra-industry trade are:
(a) Transportation costs have a negative influence on both types of IIT, independentlyfrom the traditional gravitational impact, since shares of trade are considered:therefore, any change in transportation, and more generally transaction costs, maychange not only the value but also the patterns of intra-European trade, aphenomenon which has to be considered in the perspective of the SEM completion.

Trade patterns inside the Single Market
128
(b) Currency depreciation leads to specialisation, the share of intra-industry trade isdecreasing. The latter effect is particularly acute for IIT stemming from horizontaldifferentiation.
Lastly, some factors act in different directions on the share of IIT, depending on thenature of product differentiation, thus underlining the important distinction between two-way trade in horizontal and in vertical product differentiation:
(a) Differences in market size reduce the share of IIT in horizontally differentiatedproducts. The related explanation is twofold. One the one hand, the potential forgains in variety is reduced as country sizes are different. On the other hand, anegative relationship between differences in market size and the share of IIT can beinterpreted as the result of agglomeration economies at the country level: externaleconomies of scale, or spillover effects at the country level, might have led to inter-industry trade.
(b) In contrast, differences in factor endowments (i.e. the economic distance proxied bydifferences in per capita income) creates more opportunities for specialisation inindustries, or along the quality spectrum inside industries: therefore it reduces(increases) the share of IIT in horizontally (vertically) differentiated products.
(c) The vertical differentiation of products reduces IIT in horizontally differentiatedproducts contrary to IIT in vertically differentiated products.
Having identified these determinants of intra-EC trade patterns, they can becontrolled for in order to address the question of an anti-monde. How could trade patternshave evolved without the completion of the SEM? Some measures such as thecancellation of NTBs have directly led to a reduced share of IIT, contrary to thecancellation of border formalities. But the SEM completion as a whole (which alsoembodies a mutual recognition of norms, a deregulation etc.), and accompanying measuressuch as structural funds, might have fuelled growth in the EC and led to incomeconvergence, leading to potentially counteracting indirect effects. Finally, the growingshare of IIT -especially in vertical differentiation- is the result of i) exogenous events,ii) direct effects of the SEM, and iii) indirect effects of the SEM.
Finally, the major direct effects of the SEM are the following:
(a) Since Non-Tariff Barriers were obstacles for a clear-cut specialisation amongEuropean countries, intra-industry trade had been boosted to artificially high levelsbefore the completion of the SEM. In contrast, cancelling NTBs largely reducedthis effect, leading to less intra-industry trade. This effect took place around 1986.
(b) In contrast, the cancellation of border formalities, while reducing transaction costs,has boosted intra-industry trade: border formalities were not an obstacle tospecialisation along comparative advantages in Europe. Where comparativeadvantages were the basis for trade, differences in costs were large enough toovercome additional transaction costs in the pre-completion period: contrary topublic procurement practices, transaction costs were not a major hindrance to trade

CEPII, document de travail n° 97-07
129
when differences in production costs between Member states were large enough. Incontrast, any extra transaction costs would hinder trade for similar products.
(c) Turning to microeconomic expectations and adjustments, trade has not beendisplaced by FDI, thus not fulfilling Markusen’s convergence hypothesis. The largeincrease of M&As associated with the private expectation of the completion of theSEM has led to large increases in intra-industry trade. FDI in Balance of Paymentsstatistics has had the same effect.
(d) The evolution referred to above where associated to the completion, not to theaccession of Spain and Portugal in the dataset. Controls were carried out showingthat the results are not affected by the inclusion of both countries.
(e) Taking into account bilateral exchange rates variations does not affect the panelestimates.
(f) Agglomeration economies -potentially associated with the combination ofincreasing returns to scale and factor mobility, a pattern of integration potentiallydetrimental to the cohesion of the Community- have been identified for someindustries: the difference in market size has clearly led to a reduced share of IIT intotal trade for chemicals, non electrical machinery, motor vehicles, mining andquarrying.
In addition, the SEM has had indirect effects:
(a) a general impact of the SEM, largely underlined in the ex ante studies, was anexpected increase in GDPs: here, growth translates in more intra-industry trade, aslarger countries achieve returns to scale.
(b) at the same time, in order to foster real convergence, structural funds wereimplemented in Europe: they might have led to a decrease in differences in incomewithin the Community. Nevertheless, as far as differences in per capita income aretaken into account the real convergence over 1986-94 is far from clear60, forexample for Spain vis-à-vis core European countries. Thus, over the completionperiod, real convergence might not have reduced intra-industry trade in verticallydifferentiated products to the benefit of intra-industry trade in horizontallydifferentiated ones.
Thus, the empirical evidence on the nature of intra-EC trade is the result of complexrelationships, influencing trade types with different intensities. On the whole,intra-European trade has been changed in the following ways, to the benefit of the internalmarket programme:
(a) cancellation of border formalities has increased intra EC trade flows and has led toa greater share of IIT in bilateral intra-European trade flows;
60 The effective convergence in real incomes is considered here; it does not exclude catching-up, as a result ofstructural funds, openness, structural changes etc. But asymmetric shocks might have hindered an effective decrease inper capita income dispersion within Europe over the short period taken into account (Hénin and Le Pen, 1995).

Trade patterns inside the Single Market
130
(b) cancellation of NTBs has opened the door to a specialisation of countries alonglines of comparative advantages: but this latter phenomenon might have playedincompletely;
(c) FDI, potentially associated with microeconomic expectations -as suggested by thedifferentially high increase in intra-European FDI flows and the wave of M&Aduring the completion period- has finally be a complement rather than a substituteto trade flows, the latter being increased on an IIT basis. It has not been tradedisplacing.
(d) potential agglomeration economies have played, but have not been sector specific.On the contrary they have been based on spillover effects potentially detrimental tosmaller economies.
Thus, the SEM has acted through several channel —namely the cancellation ofborder formalities, cuts in transaction costs and, increased factor mobility— influencingtrade patterns in opposite ways, thus disqualifying a clear-cut diagnosis. The evidence oflimited agglomeration economies and the pre-eminence of IIT in vertically differentiatedproducts suggest that so far the implementation of the SEM has neither validated thepessimism of a scenario associating integration with a boost in specialisation, norreplicated the optimistic conclusions emphasised in ex ante studies, focusing on gains ofincreased trade in varieties.

CEPII, document de travail n° 97-07
131
APPENDIX : NOMENCLATURES
All calculations for trade types, price/quality ranges and the proxy for productdifferentiation are done at the elementary level of the Eurostat "Combined nomenclature"(11 countries-10 partners-about 10,000 products-15 years). Only then the figures areaggregated to an industry level: on the one hand for the presentation of the main results,and on the other hand to introduce trade types as dependent variables in the econometricmodel (country-partner-industry-year).
The most obvious way would be to link our trade data to a production nomenclature (e.g.the NACE), thereby permitting to incorporate industry statistics into the model.
Unfortunately, there are no tables of correspondence on a systematic, year-by-year basisbetween the Nimexe or HS and the Nace or Nace Rev.1 or any other. There are someincomplete tables, but we would loose information on those products which are notdefined.
We therefore propose using the information that already exists for each product, i.e. keepthe first 2 digits of 6-digit Nimexe and 8-digit CN products which already defined as"99 Chapters" by Eurostat. These Chapters are then in turn aggregated to 14 industries,partly in interaction with production data available for the econometric analysis.
Table A-23. Table of correspondence of Eurostat CN-2 Chapters and our14 industries
Industry CN-2 Eurostat 2-digit chapters (Combined nomenclature)
Agriculture, hunting, forestry (AA)01 live animals02 meat and edible meat offal03 fish and crustaceans, molluscs and other aquatic invertebrates04 dairy produce; birds' eggs; natural honey; edible products of animal origin, not elsewhere specified or
included05 products of animal origin not elsewhere specified or included06 live trees and other plants; bulbs, roots and the like; cut flowers and ornamental foliage07 edible vegetables and certain roots and tubers08 edible fruit and nuts; peel of citrus fruits or melons09 coffee, tea, mate and spices10 cereals11 products of the milling industry; malt; starches; inulin; wheat gluten12 oil seeds and oleaginous fruits; miscellaneous grains, seeds and fruit; industrial or medical plants; straw and
fodder13 lacs; gums, resins and other vegetable saps and extracts14 vegetable plaiting materials; vegetable products not elsewhere specified or included
Food, Beverages, toabacco (AB)15 animal or vegetable fats and oils and their cleavage products; prepared edible fats; animal or vegetable waxes16 preparations of meat, fish or crustaceans, molluscs or other aquatic invertebrates17 sugars and sugar confectionery18 cocoa and cocoa preparations19 preparations of cereals, flour, starch or milk; pastrycooks' products
.../...

Trade patterns inside the Single Market
132
.../...20 preparations of vegetables, fruit, nuts or other parts of plants21 miscellaneous edible preparations22 beverages, spirits and vinegar23 residues and waste from the food industries; prepared animal fodder24 tobacco and manufactured tobacco substitutes
Mining, quarrying, petroleum (B)25 salt; sulphur; earths and stone; plastering material, lime and cement26 ores, slag and ash27 mineral fuels, mineral oils and products of their distillation; bituminous substances; mineral waxes
Chemicals (CD)28 inorganic chemicals: organic or inorganic compounds of precious metals, of rare-earth metals(...)29 organic chemicals30 pharmaceutical products31 fertilizers32 tanning or dyeing extracts; tannins and their derivatives; dyes, pigments and other colouring matter (...)33 essential oils and resinoids; perfumery, cosmetic or toilet preparations34 soaps, organic surface-active agents, washing preparations, lubricating preparations, artificial waxes, (...)35 albuminous substances; modified starches; glues; enzymes36 explosives; pyrotechnic products; matches; pyrophoric alloys; combustible materials37 photographic or cinematographic products38 miscellaneous chemical products39 plastics and plastic products40 rubber and articles thereof
Wood, paper, printing (E)44 wood and articles of wood; wood charcoal45 cork and articles of cork46 wickerwork and basketwork47 pulp of wood or of other fibrous cellulosic material; waste and scrap of paper or paperboard48 paper and paperboard; articles of paper pulp, paper or paperboard49 books, newspapers, pictures and other products of the printing industry; manuscripts, typescripts and plans
Textiles, leather (FD)41 hides and skins (other than furskins) and leather42 articles of leather; saddlery and harness; travel goods, handbags and similar containers;(...)43 furskins and artificial fur; articles thereof50 silk51 wool, fine and coarse animal hair; yarn and fabrics of horsehair52 cotton53 other vegetable textile fibres; paper yarn and woven fabrics of paper yarn54 man-made filaments55 man-made staple fibres56 wadding, felt and nonwovens; special yarns; twine, cordage, rope and cable and articles thereof57 carpets and other textile floor coverings58 special woven fabrics; tufted textile products; lace; tapestries; trimmings; embroidery59 impregnated, coated, covered or laminated textile fabrics; articles for technical use, of textile materials60 knitted or crocheted fabrics61 articles of apparel and clothing accessories, knitted or crocheted62 articles of apparel and clothing accessories, not knitted or crocheted63 other made up textile articles; sets; worn clothing and worn textile articles; rags
.../...

CEPII, document de travail n° 97-07
133
.../...64 footwear, gaiters and the like; parts of such articles65 headgear and parts thereof66 umbrellas, sun umbrellas, walking-sticks, seat-sticks, whips, riding-crops and parts thereof67 prepared feathers and down and articles made of feathers or of down; artificial flowers; articles of human hair
Non metallic mineral products (G)68 articles of stone, plaster, cement, asbestos, mica or similar materials69 ceramic products70 glass and glassware71 natural or cultured pearls, precious or semi-precious stones, precious metals,(...)72 iron and steel
Basic metals and fabricated metals products (HI)73 articles of iron or steel74 copper and articles thereof75 nickel and articles thereof76 aluminium and articles thereof78 lead and articles thereof79 zinc and articles thereof80 tin and articles thereof81 other base metals; cermets; articles thereof82 tools, implements, cutlery, spoons and forks, of base metal; parts thereof of base metal83 miscellaneous articles of base metal
Non electrical machinery (JA)84 nuclear reactors, boilers, machinery and mechanical appliances; parts thereof
Electrical machinery (JB)85 electrical machinery and equipment and parts thereof; sound recorders and reproducers, television image (...)
Motor vehicles (KA)87 vehicles other than railway or tramway rolling-stock, and parts and accessories thereof
Other transport equipment (KB)86 railway or tramway locomotives, rolling-stock and parts thereof; railway or tramway track fixtures (...)88 aircraft, spacecraft, and parts thereof89 ships, boats and floating structures
Professional goods (LA)90 optical, photographic, cinematographic, measuring, checking, precision, medical or surgical instruments (...)91 clocks and watches and parts thereof92 musical instruments; parts and accessories for such articles
Other industries (N)93 arms and ammunition; parts and accessories thereof94 furniture; medical and surgical furniture; bedding, mattresses, mattress supports, cushions (...)95 toys, games and sports requisites; parts and accessories thereof96 miscellaneous manufactured articles97 works of art, collectors' pieces and antiques98 components of complete industrial plants of chapter 63: power production, (...)99 other products
Note: The chapters in the NIMEXE nomenclature (until 1987) change slightly compared to those inthe CN. Their aggregation towards the 14 industries takes into account these differences..

Trade patterns inside the Single Market
134
Table A-24. Table of correspondance of ISIC and our 14 industries
Industry Code ISIC
Agriculture, hunting and forestry AA 1000Food, beverages and tobacco AB 31Mining, quarrying and petroleum B 2000+353+354Chemical products CD 35 - 353-354Wood, paper and printing E 33+34-332Textiles and leather FD 32Non metallic mineral products G 36Basic metall industries HI 37+381Non electrical machinery JA 382Electrical machinery JB 383Motor vehicles KA 3843+3844Other transp equipment KB 384-3843-3844Professional goods LA 385Other manufacturing nes N 39

CEPII, document de travail n° 97-07
135
Figure A-32. Share of trade types in bilateral trade, 1994
Two-way trade in similar productsF BL NL D I UK IRE DK G P E UE12
F 29.0 13.4 28.2 22.9 24.3 1.6 5.6 1.4 13.4 24.5 24.1BL 29.0 31.4 24.6 14.3 8.7 4.2 2.6 0.6 2.9 10.2 23.2NL 13.4 31.4 20.7 7.4 16.4 6.7 7.5 0.7 4.0 5.7 18.9D 28.2 24.6 20.7 15.5 18.1 1.9 11.9 6.3 4.8 18.0 20.5I 22.9 14.3 7.4 15.5 11.4 1.2 2.5 5.2 3.5 25.7 16.2UK 24.3 8.7 16.4 18.1 11.4 13.0 8.2 2.1 4.0 19.9 16.5IRE 1.6 4.2 6.7 1.9 1.2 13.0 2.6 1.5 3.7 7.9DK 5.6 2.6 7.5 11.9 2.5 8.2 2.6 0.4 1.4 2.6 8.1G 1.4 0.6 0.7 6.3 5.2 2.1 0.4 0.2 1.6 3.7P 13.4 2.9 4.0 4.8 3.5 4.0 1.5 1.4 0.2 11.1 7.5E 24.5 10.2 5.7 18.0 25.7 19.9 3.7 2.6 1.6 11.1 18.9UE12 24.1 23.2 18.9 20.5 16.2 16.5 7.9 8.1 3.7 7.5 18.9 19.2
Two-way trade in vertically differentiated productsF BL NL D I UK IRE DK G P E UE12
F 41.3 42.4 54.8 38.2 44.4 23.5 25.9 17.0 23.4 38.9 44.3BL 41.3 43.7 42.3 30.0 55.4 22.0 28.8 7.9 18.7 28.4 42.0NL 42.4 43.7 44.3 27.8 51.1 14.2 36.2 4.9 12.3 27.1 41.9D 54.8 42.3 44.3 43.3 56.8 29.5 38.8 12.5 23.6 42.2 46.9I 38.2 30.0 27.8 43.3 42.7 16.1 18.1 7.7 18.6 30.2 36.9UK 44.4 55.4 51.1 56.8 42.7 46.4 32.7 12.6 15.1 31.1 47.9IRE 23.5 22.0 14.2 29.5 16.1 46.4 17.5 3.9 8.6 34.4DK 25.9 28.8 36.2 38.8 18.1 32.7 17.5 4.9 9.4 13.8 31.9G 17.0 7.9 4.9 12.5 7.7 12.6 4.9 1.5 5.5 10.3P 23.4 18.7 12.3 23.6 18.6 15.1 3.9 9.4 1.5 37.1 23.9E 38.9 28.4 27.1 42.2 30.2 31.1 8.6 13.8 5.5 37.1 35.2UE12 44.3 42.0 41.9 46.9 36.9 47.9 34.4 31.9 10.3 23.9 35.2 42.3
One-way tradeF BL NL D I UK IRE DK G P E UE12
F 29.7 44.2 17.0 38.9 31.3 74.9 68.5 81.7 63.2 36.5 31.6BL 29.7 24.9 33.1 55.7 35.9 73.9 68.7 91.6 78.4 61.4 34.8NL 44.2 24.9 35.0 64.9 32.5 79.0 56.4 94.4 83.7 67.2 39.3D 17.0 33.1 35.0 41.2 25.1 68.5 49.3 81.3 71.6 39.8 32.6I 38.9 55.7 64.9 41.2 45.9 82.7 79.4 87.1 77.9 44.1 46.9UK 31.3 35.9 32.5 25.1 45.9 40.7 59.1 85.3 80.9 49.0 35.6IRE 74.9 73.9 79.0 68.5 82.7 40.7 79.8 94.6 87.7 57.7DK 68.5 68.7 56.4 49.3 79.4 59.1 79.8 94.8 89.2 83.6 60.0G 81.7 91.6 94.4 81.3 87.1 85.3 94.8 98.4 92.9 86.0P 63.2 78.4 83.7 71.6 77.9 80.9 94.6 89.2 98.4 51.8 68.6E 36.5 61.4 67.2 39.8 44.1 49.0 87.7 83.6 92.9 51.8 45.9UE12 31.6 34.8 39.3 32.6 46.9 35.6 57.7 60.0 86.0 68.6 45.9 38.5
The sum of the three part of the trade types add up to 100 percent for each couple.

Trade patterns inside the Single Market
136
BIBLIOGRAPHY
ABD-EL-RAHMAN K.S. (1984), Echanges intra-sectoriels et échanges de spécialisationdans l'analyse du commerce international: le cas du commerce intra-C.E.E. debiens manufacturés, thèse de doctorat d'Etat, Université de Paris X - Nanterre.
ABD-EL-RAHMAN K.S. (1986a), "Réexamen de la définition et de la mesure deséchanges croisés de produits similaires entre les nations," Revue économique, n° 1.
ABD-EL-RAHMAN K.S. (1986b), "La 'différence' et la 'similitude' dans l'analyse de lacomposition du commerce international," Revue économique, n° 2.
ABD-EL-RAHMAN K.S. (1987), "Hypothèses concernant le rôle des avantagescomparatifs des pays et des avantages spécifiques des firmes dans l'explication deséchanges croisés des produits similaires," Revue d'économie politique, n° 2.
ABD-EL-RAHMAN K.S. (1991), "Firms' Competitive and National ComparativeAdvantages as Joint Determinants of Trade Composition," WeltwirtschaftlichesArchiv, n° 1.
AGLIETTA, M. (1995), "The Transition to EMU: structural and strategic aspects",Federal Reserve Bank of New York Research Paper, no. 9511.
AITKEN N. (1973), « The effect of the EEC and EFTA on European trade: a temporal cross-section analysis » American Economic Review, (63), p. 881-892.
AQUINO A. (1978), "Intra-industry Trade and Inter-industry Specialization as ConcurrentSources of International Trade in Manufactures," Weltwirtschaftliches Archiv, vol.114, n° 2.
BALASSA B. (1965), Trade Liberalization and Revealed Comparative AdvantageManchester School of Economics and Social Studies.
BALASSA B. (1986a), "Intra-industry Specialisation: A Cross-section Analysis,"European Economic Review, vol. 30, n° 1.
BALASSA B. (1986b), "Intra-industry Trade Among Exporters of Manufactured Goods,"in Greenaway and Tharakan (1986a).
BALASSA B. & BAUWENS L. (1987), "Intra-industry Specialization in a Multi-Countryand Multilateral Framework," The Economic Journal, (97), pp.923-939.
BALDWIN, R.E. & VENABLES, T. (1995), Regional economic integration" en G.M.Grossman y K. Rogoff (eds.), Handbook of International Economics, vol. III. North-Holland, 1995.
BAYOUMI T., EICHENGREEN B. (1995), « Is regionalism simply a diversion? Evidencefrom the evolution of the EC and EFTA » NBER Working Paper n° 5283.
BECUWE S. and C. MATHIEU (1990), "Stratégies de prix des firmes automobileseuropéennes," Cahiers d'études et de recherche n° 90-16, Ecole Centrale, Paris.
BELSLEY D.A., KUH E., WELSH R.E. (1980), Regression diagnostics: identifyinginfluential data and sources of multicolinearity John Wiley & Sons, New York.

CEPII, document de travail n° 97-07
137
BERGSTRAND J. H. (1990), "The Heckscher-Ohlin-Samuelson Model, the LinderHypothesis and the Determinants of Bilateral Intra-industry Trade," The EconomicJournal, p.1216-29, n° 3.
BHAGWATI J. (1971), "Trade diverting customs unions and welfare improvement: aclarification", The Economic Journal, (81), p. 580-587.
BIKKER J. (1987), "An international trade flow model with substitution: an extension of thegravity model", Kyklos, (40), p.315-337.
BRADA J. MENDEZ J. (1983), "Regional economic integration and the volume of intra-regional trade: a comparison of developed and developing country experiences", Kyklos,(36), p. 589-603.
BRAINARD S.L. (1993), "A simple theory of multinational corporations and trade with atrade-off between proximity and concetration", NBER working paper, 4269,February.
BRANDER J.A. & P. KRUGMAN (1983), "A reciprocal dumping model of internationaltrade," Journal of International Economics, 15, pp. 313-321.
CAVES R. (1981), "IIT and Market Structure in the Industrial Countries," OxfordEconomic Papers, 32, (2), pp.203-223.
CAVES, R. (1982), Multinational Enterprise and Economic Analysis. Cambridge UniversityPress.
CHIPMAN J.S. (1966), "A survey of the Theory of International Trade: Part 3: theModern Theory," Econometrica, 34 (1), pp. 18-76.
CLAIR C., O. GAUSSENS and D.-L. PHAN (1984), "Le commerce internationalintra-branche et ses déterminants d'après le schéma de concurrence monopolistique:une vérification empirique," Revue Economique, vol 35, n°2, mars.
CLARK D.P. (1993), "Recent Evidence on Determinants of IIT," WeltwirtschaftlichesArchiv, 129 (2).
COMMISSION DES COMMUNAUTES EUROPEENNES (1988), "1992: la nouvelleéconomie européenne," Economie Européenne, n° 35, mars.
COMMISSION DES COMMUNAUTES EUROPEENNES (1990a), "Marché unique,monnaie unique," Economie Européenne, n° 44, octobre.
COMMISSION DES COMMUNAUTES EUROPEENNES (1990b), "L'impact sectoriel dumarché intérieur sur l'industrie : les enjeux pour les Etats membres," EconomieEuropéenne : Economie Sociale, numéro spécial.
Commission of the European Communities (1988), « ‘the Economics of 1992’, anassessment of the potential effects of completing the internal market of theEuropean Community », European Economy, 35, March.
DIXIT A.K. and J. STIGLITZ (1977), "Monopolistic Competition and Optimum ProductDiversity," American Economic Review, vol.67, juin.

Trade patterns inside the Single Market
138
EATON J. and H. KIERZKOWSKI (1984), "Oligopolistic Competition, Product Variety,and International Trade," in KIERZKOWSKI (1984a).
ENCAOUA D. (1989), "Différenciation des produits et structures de marché : un tourd'horizon" Annales d'Économie et de Statistique, n°15/16 pp.51-83.
ERKEL ROUSSE H. (1995), "Détection de la multicolinéarité dans un modèle linéaireordinaire: quelques éléments pour un usage averti des indicateurs de Belsley, Kuhet Welsch" Revue Statistique Appliquée, n°4, pp.19-42
ETHIER W.J. (1974), "Some of the Theorems of International Trade with Many Goodsand Factors", Journal of International Economics 4, pp. 199-206.
ETHIER W.J. (1979), "International Decreasing Costs and World Trade," Journal ofInternational Economics 9, 1, pp. 1-24.
ETHIER W.J. (1982), "Decreasing Costs in International Trade and Frank Graham'sArgument for protection," Econometrica, 50 pp. 1243-1268.
FALVEY R. E. (1981), « Commercial Policy, and Intra-industry Trade », Journal ofInternational Economics, (11), pp.495-511.
FALVEY R.E., KIERZKOWSKI H.(1984), "Product Quality, Intra-industry Trade and(Im)perfect Competition," Discussion Paper, Graduate Institute of InternationalStudies, Genève.
FALVEY, R.E. & KIERZKOWSKI, H. (1987), "Product Quality Intra-industry Trade and(im)perfect competition", in KIERZKOWSKI, H. (ed.), Protection and Competition inInternational Trade.
FONTAGNÉ L. (1991-a). Biens intermédiaires et division internationale du travail, Paris,Economica.
FONTAGNÉ L. (1991-b), "Échange international d'inputs intermédiaires : un bilan desimplications positives et normatives" Revue d'Economie Politique vol 101, n°3,1991, mai-juin, pp.317-399.
FONTAGNÉ L. (1994), "Concurrence imparfaite, interdépendance des préférences etpolitiques commerciales". Revue Économique, mai.
FONTAGNÉ L. (1995), « Why NAFTA might be discriminatory », CEPII working paper,95-12.
FONTAGNÉ L. & M. FREUDENBERG (1997), "IIT: methodological issuesreconsidered," CEPII Working Paper 97-1.
FONTAGNÉ L., D. ÜNAL-KESENCI and M. FREUDENBERG (1995), "Régionalisationet échanges de biens intermédiaires," CEPII Working paper 95-11.
FRANKEL J. WEI S.J. (1993), « Trade blocs and currency blocs » , NBER working paper,4335

CEPII, document de travail n° 97-07
139
FREUDENBERG M. and F. MÜLLER (1992), "France et Allemagne : quellesspécialisations commerciales ?", Economie prospective internationale, n° 52, 4etrimestre.
GIERSCH H. (ed.), (1979). On the Economics of Intra-industry Trade, Tübingen, Mohr.
GLOBERMAN S. and J.W. DEAN, (1990), "Recent Trends in IIT and their Implicationsfor Future Trade Liberalization," Weltwirtschaftliches Archiv, 126, (3).
GREENAWAY D. (1984). "The Measurement of Product Differentiation in EmpiricalStudies of Trade Flows," in KIERZKOWSKI (1984a).
GREENAWAY D. and C. MILNER (1986). The Economics of Intra-industry Trade,Oxford, Basil Blackwell.
GREENAWAY D. and P.K.M. THARAKAN (ed.), (1986). Imperfect Competition andInternational Trade, Wheatsheaf Books, Sussex and Humanities Press, New Jersey.
GREENAWAY D., R. HINE and C. MILNER (1994), "Country-Specific Factors and thePattern of horizontal and Vertical Intra-industry Trade in the UK,"Welwirtschaftliches Archiv, 130, (1)
GREENAWAY D., R. HINE and C. MILNER (1995), "Vertical and Horizontal Intra-industry Trade: A Cross Industry Analysis for the United Kingdom," The EconomicJournal, 105, November.
GROSSMAN G. and E. HELPMAN (1990), "Comparative Advantage and Long-RunGrowth," American Economic Review, vol 80, n°4, september, pp.796-815.
GRUBEL H.G. and P.J. LLOYD (1975), Intra-industry Trade, the Theory andMeasurement of International Trade in Differentiated Products, London,McMillan.
HAVEMAN J., HUMMELS D. (1996), « Trade creation and trade diversion: new empiricalresults » Paper presented at the International conference on globalisation andregionalisation, Sorbonne, Paris, 29-30 May.
HELPMAN E. (1981), "International Trade in the Presence of Product Differentiation,Economies of Scale, and Monopolitic Competition: A Chamberlin-Hecksher-OhlinApproach," Journal of International Economics, n 11.
HELPMAN E. and P.R. KRUGMAN (1985), Market Structure and Foreign Trade.Wheatsheef Books, Harvester Press, MIT.
HENIN P.Y., LE PEN Y. (1995), "Les épisodes de la convergence européenne", Revueéconomique, p. 667-677.
HUGHES K.S. (1993), « IIT in the 80’s: A Panel Study », Welwirtschaftliches Archiv,123, (3).
HUMMELS, D.L. and STERN, R.M. (1994), "Evolving Patterns of North AmericanMerchandise Trade and Foreign Direct Investment, 1960-1990", The World Economy,pp. 5-29.

Trade patterns inside the Single Market
140
HUMMELS D. and J.A. LEVINSOHN J. (1993), "Monopolistic competition andinternational trade: Reconsidering the evidence," NBER Working Paper 4389.
JACQUEMIN A. and A. SAPIR (1988). "International Trade and Integration of theEuropean Community: An Econometric Analysis," European Economic Review,vol 32.
JACQUEMIN A. and A. SAPIR (1989). "Une analyse sectorielle des échangesintra-communautaires dans la perspective de l'achèvement du marché intérieureuropéen," in LAUSSEL and MONTET (1989a).
JASKOLD-GABSZEWICZ J., A. SHAKED, J. SUTTON and J.F. THISSE (1981),"International Trade in Differentiated Products," International Economic Review,vol. 22, n°3, pp.527-35.
JONES R.W. (1992), "Factor Scarcity, Factor Abundance and Attitudes TowardsProtection: the 3 x 3 Model," Journal of International Economic Integration vol. 7n°1, pp. 1-19.
KIERZKOWSKI H. (ed.), (1984a). Monopolistic Competition and International Trade,Oxford University Press.
KRUGMAN P. (1979), "Increasing Returns, Monopolistic Competition, and InternationalTrade," Journal of International Economics, 9, November, 469-479.
KRUGMAN P. (1980), "Scale Economies, Product Differentiation, and the Pattern ofTrade," American Economic Review, 70, 950-959.
KRUGMAN P. (1981), "Intraindustry Specialization and the Gains from Trade," Journalof Political Economy, 89,5, pp.959-973.
KRUGMAN P. (1987), "Increasing Returns and the Theory of International Trade" inAdvances in Economic Theory, Fifth World Congress, T.F.BEWLEY ed.,CambridgeUniversity Press, reprinted in Rethinking International Trade MITPress, Cambridge, 1990 pp.63-89.
KRUGMAN, P. (1991), Geography and Trade. The MIT Press.
LAFAY G. (1987), "Avantage comparatif et compétitivité," Economie prospectiveinternationale, n° 29.
LAFAY G. (1990), "La mesure des avantages comparatifs révélés," Economie prospectiveinternationale, n° 41, 1er trimestre. Reprinted as "The Measurement of RevealedComparative Advantages," in M.G. Dagenais and P.-A. Muet, International TradeModelling, 1994, London, Chapman & Hall.
LANCASTER K. (1980), "Intra-industry Trade under Perfect Monopolistic Competition,"Journal of International Economics, vol.10, n°2,mai.
LASSUDRIE-DUCHENE B. (1971), "La demande de différence et l'échangeinternational," Cahiers de l'ISEA, Economies et Sociétés, série relationsinternationales, n°6, juin.

CEPII, document de travail n° 97-07
141
LASSUDRIE-DUCHÊNE B. and J.-L. MUCCHIELLI (1979), "Les échangesintra-branche et la hiérarchisation des avantages comparés dans le commerceinternational," Revue économique.
LAUSSEL D. and C. MONTET (ed.), (1989), Commerce international en concurrenceimparfaite, Paris, Economica.
LEAMER E.D. (1987), "Path of Developement in the Three-Factor n-Good GeneralEquilibrium Model," Journal of Political Economy, vol. 95 n°5 pp. 961 999.
LEE, M.L.; LIU, B. Ch. and WANG, P. (1994), "Growth and equity with endogenous humancapital: Taiwan's economic miracle revisited", Southern Economic Journal, vol. 61, nº 2,pp. 435-444.
LINDER S.B. ( 1961), An Essay on Trade and Transformation, New York, John Wiley &Sons.
LIPSEY, R.E. and WEISS, M.Y. (1984), "Foreign Production and Exports of IndividualFirms", Review of Economics and Statistics, vol. 66, pp. 304-308.
LOERTSCHER R. and F. WOLTER (1980), "Determinants of Intra-industry TradeAmong Countries and Across Industries," Weltwirtschaftliches Archiv, (116), p.281-293.
MAC (1988), « The cost of non-Europe: technical barriers in six industries », Research onthe cost of non-Europe, Vol. 3, Document series, CEC.
MARKUSEN J.R. (1981), "Trade and the Gains from Trade with ImperfrectCompetition," Journal of International Economics, 11, nov., pp.531-551.
MARKUSEN, J.R. (1995), "The Boundaries of Multinational Enterprises and the Theory ofInternational Trade", Journal of Economic Perspectives, vol. 9, pp. 169-189.
MARKUSEN, J.R. and VENABLES A.J. (1995), "Multinational firms and the new tradetheory", NBER working paper, 5036, February.
MC KENZIE L.W. (1955), "Equality of Factor Prices in World Trade," Econometrica, 23(3), pp 239-257.
MOTTA M., J.F. THISSE and A. CABRALES (1995), "On the persistence of leadershipor leapfrogging in international trade," CEPR Discussion paper N° 1106.
MOTTA, M. (1990), "Recent models of international trade and distribution gains fromintegration", Revista Internacionale de Scienze Economiche e Commerciale, vol. 37, pp.713-736.
MUNDELL, J. (1957), "International trade and factor mobility", American Economic Reviewvol. 47, pp. 321-325.
NERB G. (1988), « The completion of the internal market: a survey of Europeanindustry’s perception of the likely effects ». Research on the Cost of Non-Europe,Vol 1, Document series, CEC.

Trade patterns inside the Single Market
142
NEVEN D.J. and L.H. RÖLLER (1990), "European Integration and Trade Flows,"European economic Review, 35, pp.1295-1309.
PERIDY N. (1992), "Trade Preference Effects of EC-Morocco Trade since 1969; theApplication of Temporal-Cross-Sectional Generalized Gravity Models," PhD.Dissertation, European University Institute.
PERIDY N. (1997), "L’impact de l’adhésion de l’Espagne à la CEE sur les spécialisationsespagnoles", Revue d'économie régionale et urbaine, vol. 2.
RICCI L.A. (1996), « Exchange rate regimes and location » Paper presented at theInternational conference on globalisation and regionalisation, Sorbonne, Paris, 29-30May.
SHAKED A. and J. SUTTON (1984), "Natural Oligopolies and International Trade" inH.KIERZKOWSKI ed. Monopolistic Competition and International Trade, OxfordUniversity Press and Clarendon Press.
SIMONNARD M. (1966), Linear Programming, Englewood Cliffs, N.J. Prentice Hall.
STIGLITZ, J.E. (1987), "The causes and consequences of the dependence of Quality of Price",The Journal of Economic Literature, vol. 25, pp. 1-48.
STONE J.A., LEE H.H. (1995), « Determinants of Intra-industry Trade: A Longitudinal,Cross-Country Analysis », Weltwirtschaftliches Archiv, (131), 1, pp.67-85.
THARAKAN P.K.M. (ed.), (1983), Intra-industry Trade: Empirical and MethodologicalAspects, Amsterdam, North-Holland.
THARAKAN P.K.M. and J. Kol (1989), Intra-industry Trade, Theory, Evidence andExtensions, MacMillan.
VINER, J. (1950), The Customs Union Issue, NewYork, Carnegie Endowment for InternationalPeace.

CEPII, document de travail n° 97-07
143
LIST OF WORKING PAPERS RELEASED BY CEPII61
1997
"The Exchange Rate Policy of the Euro: A Matter of Size", Philippe Martin, document detravail n° 97-06, avril.
"Ces taux de change réels qui bifurquent", Pierre Villa, document de travail n° 97-05,avril.
"Chômage non-qualifié et imitation : les raisons d'un accord international sur la propriétéintellectuelle", Lionel Fontagné & Jean-Louis Guérin, document de travail n° 97-04, mars.
"Symmetry and Asymmetry of Supply and Demand Shocks in the European Union aDynamic Analysis", Laurence Boone, document de travail n° 97-03, février.
"Interest Rates in East Asian Countries: Internal Financial Structures and InternationalLinkages", Isabelle Bensidoun, Virginie Coudert et Laurence Nayman, document detravail n° 97-02, janvier.
"Intra-Industry Trade: Methodological Issues Reconsidered", Lionel Fontagné, Michael Freudenberg,document de travail n° 97-01, janvier.
1996
"The Cost of Fiscal Retrenchment Revisited: How Strong is the Evidence?",Philippine Cour, Eric Dubois, Selma Mahfouz & Jean Pisani-Ferry, document de travailn° 96-16, décembre.
"Les dynamique sectorielles de la croissance en Europe centrale", Françoise Lemoine,document de travail 96-15, décembre.
"Growth and Agglomeration", Philippe Martin & Gianmarco I.P. Ottaviano, document detravail n° 96-14, décembre.
"La coordination interne et externe des politiques économiques : une analyseedynamique", Fabrice Capoen et Pierre Villa, document de travail n° 96-13, décembre.
"L'intégration asymétrique au sein du continent américain : un essai de modélisation",Philippine Cour et Frédéric Rupprecht, document de travail n° 96-12, octobre.
"Croissance et contrainte financière dans les PED", Pierre Villa, document de travailn° 96-11, octobre.
61 Working papers are circulated free of charge as far as stocks are available; thank you to send your request toCEPII, Sylvie Hurion, 9 rue Georges Pitard, 75015 Paris, or by fax: +33 1 53 55 03.

Trade patterns inside the Single Market
144
"Bulgaria From Entreprise Indiscipline to Financial Crisis", Roumen Avramov et JérômeSgard, document de travail n° 96-10, juillet.
"Potentialities and Opportunities of the Euro as an International Currency", AgnèsBénassy-Quéré, document de travail n° 96-09, août.
"Credit Crisis and the Role of Banks During Transition: a Five-Country Comparison",Jérôme Sgard, document de travail n° 96-08, août.
"Exchange Rate Regimes and Policies in Asia", Agnès Bénassy-Quéré, document detravail n° 96-07, juillet.
"France in the Early Depression of the Thirties", Pierre Villa, document de travailn° 96-06, juillet.
"Pays émergents, emploi defficient ?", Olivier Cortès et Sébastien Jean, document detravail n° 96-05, mars.
"Trade with Emerging Countries and the Labor Market : the French Case", Olivier Cortès,Sébastien Jean et Jean Pisani-Ferry, document de travail n° 96-04, mars.
"The Transmission of Monetary policy in the European Countries", Fernando Barran,Virginie Coudert et Benoit Mojon, document de travail n° 96-03 , février.
"Trade Policy and Trade Patterns During Transition : A Comparison Between China andCEECs", Françoise Lemoine, document de travail n° 96-02, février.
"Financial Markets Failures and Systemic Risk", Michel Aglietta, document de travailn° 96-01, janvier
1995
"Why NAFTA Might be Discriminatory", Lionel Fontagné, document de travail n° 95-12,décembre.
"Régionalisation et échanges de biens intermédiaires", Lionel Fontagné, MichaelFreudenberg et Deniz Ünal-Kesenci, document de travail n° 95-11, décembre.
"The Geography of Multi-speed Europe", Philippe Martin et Gianmarco I.P Ottaviono,document de travail n° 95-10, novembre.
"The Political Economy of French Policy and the Transmission to EMU", Christian deBoissieu et Jean Pisani-Ferry, document de travail n° 95-09, octobre (épuisé).
"L'importance des exclus de l'intégration monétaire en Europe", Philippe Martin,document de travail n° 95-08, novembre.

CEPII, document de travail n° 97-07
145
"Asymétries financières en Europe et transmission de la politique monétaire", VirginieCoudert et Benoit Mojon, document de travail n° 95-07, septembre (épuisé).
"La mesure du capital éducatif", Pierre villa, document de travail n° 95-06, septembre.
"Capital humain, mobilité des capitaux et commerce international", Pierre Villa, documentde travail n° 95-05, juin.
"L'Europe à géométrie variable : une analyse économique", Jean Pisani-Ferry, documentde travail n° 95-04, avril.
"Comparaison de l’efficacité énergétique des pays d’Europe centrale et orientale avec celledes pays de l’OCDE", Nina Kounetzoff, document de travail n° 95-03, mars.
"L'organisation de la politique économique dans un cadre stratégique", Pierre Villa,document de travail n °95-02, mars.
"Interest Rates, Banking, Spreads and Credit Supply: The Real Effects", Fernando Barran,Virginie Coudert, Benoît Mojon, document de travail n° 95-01, mars.