Embed Size (px)
Citation preview
The Space Congress® Proceedings 1970 (7th) Technology Today and Tomorrow
Apr 1st, 8:00 AM
Trade Off Analysis of Pulse Compression for a Satellite Radar Trade Off Analysis of Pulse Compression for a Satellite Radar
Altimeter Altimeter
Charles J. Mundo Program Scientist, Raytheon Company, Wayland, Massachusetts
Follow this and additional works at: https://commons.erau.edu/space-congress-proceedings
Scholarly Commons Citation Scholarly Commons Citation Mundo, Charles J., "Trade Off Analysis of Pulse Compression for a Satellite Radar Altimeter" (1970). The Space Congress® Proceedings. 4. https://commons.erau.edu/space-congress-proceedings/proceedings-1970-7th/session-5/4
This Event is brought to you for free and open access by the Conferences at Scholarly Commons. It has been accepted for inclusion in The Space Congress® Proceedings by an authorized administrator of Scholarly Commons. For more information, please contact [email protected].

TRADE OFF ANALYSIS OFPULSE COMPRESSION FOR A SATELLITE
RADAR ALTIMETER
Dr. Charles J. Mundo Program Scientist Raytheon Company Wayland, Massachusetts
ABSTRACT
The Trade off Analyses of Pulse Compression for satellite radar altimeters conclude that when 10 cm accuracy in altitude measurement is sought, pulse compression results in in creased instrument life and greater power efficiency. When accuracy requirements ex ceed two meters, it is no longer required.
INTRODUCTION
This study was made to establish the contri bution that pulse compression could make to implementing a radar altimeter for a geodesy satellite. We are presenting this study to you because there is a substantial advantage to the use of pulse compression when high accuracy altimetry is sought from satellite altitudes.
Before we enter into the technical analysis, let me address a few words to the question of why satellite altimetry is useful in geodesy. The aim of geodesy is to measure the shape of the geoid. The surface of the ocean would repre sent the shape of geoid if it was not disturbed by meteoroceanographic effects. Measure ments of the shape of the geoid will lead to a knowledge of the crustal structure of the earth and possible mineralogical wealth that it may possess, (2)as well as monitoring changes in shape of the ocean surface which may provide warning of potential natural disasters. Kaula( 3 ) has already prepared maps of the geoid such as are shown in Figure 1 based upon observing how
This study was sponsored by Office of Space Science & Applications, NASA, Hq. Contract NASW-1709
perturbing forces alter the simple elliptical orbits predicted by Keppler. These maps are probably no better than 20 meters in estimating the departure of the geoid from the spheroid. It is currently anticipated that GEOS C, the first satellite that will carry a radar altimeter into space, will result in the reduction of this uncertainty to 5 meters and future satellite altimeters will reduce that error even further to 1 meter and perhaps even 10 cm. The radar altimeter measures the altitude of the satellite by measuring the transit time of a pulse that is reflected from the ocean surface at the subsatellite point. Pulse compression is a technique whereby the radar pulse signal returns that are extend ed in time can be processed to give a shorter duration pulse. This pulse has the ranging accuracy and resolution of the shorter pulse, but reduces peak power required to overcome interference from thermal noise by a factor proportional to the compression ratio.
TRADE OFF ANALYSIS
The purpose of the study is a trade off which is based upon the accuracy, power and life object ives of the system. However, this trade off must be performed in the light of hardware that is available and sound fundamental physics. The physics is presented in detail in the report upon which this study is based.
The organization of thought in this study is shown in Figure 2. It may be helpful to the reader to use this figure as a tour guide as he progresses through the study.
6-49

ACCURACY
Pulse length and signal strength are the prime factors in determining the system accuracy. How the accuracy of the altimeter depends upon pulse length is shown in Figure 3 and the factors that contribute to this accuracy estimate are called out in Table 1.
The black bar graphs represent two specific designs, one with a 10 ns pulse length which will provide a 10 cm accuracy and the second with a 50 ns pulse length which will provide a 30 cm accuracy.
The errors that according to our analysis limit the ultimate performance of the system to 10 cm are independent of pulse length. They are:
1. Tropospheric Refractivity2. Timing Reference Base3. RF Power Source Jitter
The errors that depend upon pulse length are: bias and wave form errors which increase linearity with pulse length; sea clutter which increases as t 3/4. ancj receiver noise which increases as t *-/2 m
t = compressed pulse length
Errors specifically related to pulse compression have also been considered such as side lobe, altitude rate ambiguity and hardware imple mentation.
Power Requirements for Providing Improved Accuracy. Accuracy demands larger peak power unless pulse compression is used to spread the transmitted pulse in time. We will show the specific relationships between peak power re quirement and accuracy. The key to more accuracy is shortening the pulse width. This is clear from the error analysis. There are fixed errors such as: atmospherics, timing refer ence and sea state, which, in our current thinking, would limit us from trying immediately for better than 0. 1 meters. The other errors, as seen from Figure 3, are pulse length de pendent and decrease at least as fast as t •*•' .
For this decrease in pulse length, a price must be paid in terms of increasing peak power. This price is inversely proportional to the square of pulse length if S/N ratio is maintained constant.
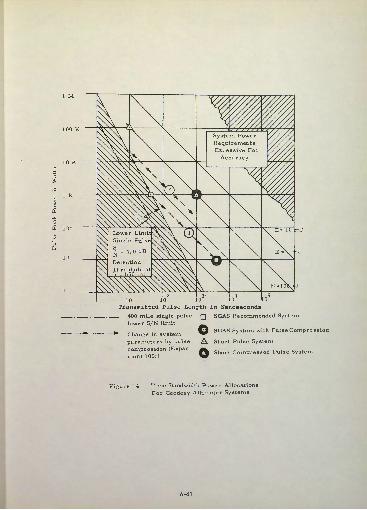
Figure 4 can be used as a focus for thinking about this problem. It shows the requirements for power and the alternatives that pulse com pression offers for providing it. The shaded area to the left represents a lower limit of peak power in a single pulse that must be available for efficient integration incoherently. This line is determined from the single pulse signal to noise ratio (S/N) n
SN
PKBW 1
or for a matched filter system
'• N dJt = PPK Ko
S • • N dl = PAV t Ko r
Where:
P = Peak Power Transmitted Pulse PK
P = Average Power Transmitted j\. v
G = Antenna Gain
h = Satellite Altitude
K = Boltzman Constant
T = Absolute Temperature
Q- = Cross Section of Ocean Surface o
c = Velocity of Light
\ = Wave Length of Transmitted Signal
L = Losses in Radar
6-50

The solid parametric lines represent contours of constant energy per pulse. The specific conditions for which this particular minimum power curve was derived is given in Table B-l of the Space Geodesy Altimetry Study
Pulse compression added to a system would cause the point describing the system to be moved by a distance proportional to the com pression ratio D along one of these iso energy lines, E = const. The system that was con figured for GEOS-D in SGAS study is represented by a point Q on the lower limit line. If the de signer wished to shorten the pulse, say by a factor of 5 on this system, it would be necessary to increase the average power by a like amount in order that the system would not fall below the single pulse lower limit boundary. Hence, the peak power supplied to this system would be increased by a factor of 25 from 1 kw recom mended in the SGAS report to 25 kw when the system has its pulse length shortened by 5. Now, if this system were to have pulse compression added to it, the transmitted pulse would be ex panded in time along an isopower contour ( f3 on Figure 5). The peak power could then be reduced by the compression ratio, a factor of 100 to 250 watts. This time expansion of the pulse length would not result in an improved signal to noise ratio nor a decrease in the accuracy of the system. The pulse could have been expanded before it was shortened ( ^^ on Figure 5). In this case, the final power could have been 10 watts. The signal to noise ratio would not have changed and the system accuracy would not have been improved beyond its initial value. The latter case suggests that under the constraint of maintaining SGAS accuracy, size and weight might possibly be reduced by going to a solid state transmitter. In summary, we can say for radar altimeters:
1. Peak power increase is required to improve accuracy.
2. The more accurate system must incorporate broader bandwidth.
3. Pulse compression at a fixed signal to noise ratio and energy can only be used to reduce the peak power requirements.
Comparison of Pulse Compression with High Power RF Sources What price must be paid if we attempt to use peak power alone to improve accuracy? There are three types of broadband microwave power tubes, magnetrons, Crossed Field Amplifiers, and Traveling Wave Tubes. The magnetron operated at the required power level has a short life expectancy, 500 hrs, and is subject to problems of both jitter and pulse stability. This uncertainty alone could amount to more than 2 ns (40 cm). The CFA is not subject to the short life problem but does have the jitter problem associated with magnetrons. However, it is a heavy device, approximately 50 pounds, and has a low power gain, 10 dB. As a consequence, it would have to be driven by a TWT that had a larger peak power rating than the TWT that could be used as a power output stage if pulse compression were to be incorpora ted into the system.
Let us turn to the use of a TWT as a power output stage. The problem here is that, at low duty factors, high power TWT's have low DC to RF conversion efficiency because of the large filament power requirements. This ques tion of power efficiency is illustrated in Figure 5. The average power requirements of the radar altimeter will be under 10 watts.
If one examines the parametric curve of 10 watts, one sees that for TWT's with peak powers greater than 1 KW, the efficiency of the tube is low. For peak powers below 1 KW, the efficiency increases dramatically. Equally important as efficiency is the question of reliability. From Figure 5, it is also apparent that a decrease in peak power by a factor of 100 increases the MTBF by a factor of 8.
We can conclude therefore, that if we are seek ing 10 cm accuracy, a TWT operated at a lower peak power with pulse compression appears to be a better alternative than any of the other RF sources, that are currently available, operated at higher peak power without pulse compression.
Comparison of Pulse Compression with Integra tion Techniques. Pulse compression provides a larger signal-to-noise ratio for a given expendi ture of energy than any other type of system that spreads the energy in time. Two other systems
6-51

are the coherent integration system used in the SGAS study and straightforward integration of incoherent pulses. The coherent integration of pulses is limited to less than the compression ratio of 100 by the doppler from satellite motion.
The number of pulses Na that can be integrated coherently is determined by two factors: decorrelation time (t^) and prf (fr ). The de- correlation time is the time that must pass for vehicle to travel a sufficient distance to provide independent radar samples of the surface. The maximum allowable prf is determined by the fact that successive pulses must be sufficiently spaced
in time that they are not simultaneously illumin ating the ground.
N d r(max)
1•x 20,000
650
= 33
If the same Na = 33 pulses were incoherently integrated by an ideal pof t detection device, the resultant improvement of the signal to noise ratio would be less than 33. This loss in integrationefficiency is caused by the non linear action of the second detector which converts some of the signal energy to noise. (5)Influence of Other Operational Parameters Do the other operational parameters that have not been considered affect the trade off con clusions? The answer is "no". We have con sidered accuracy, power and life in reaching our conclusions. The weight and volume of the pulse compression components are 200 gm and 100 cc respectively. The weight and volume saved in the modulator and the receiver would be about 2 kg and 1000 cc respectively.
The availability is dependent upon the time re quired to package and space-qualify components that are already available. This should be about one year.
Selection of a Method for Pulse Compression Pulse compression can be accomplished in a number of different ways; the task that has been addressed here is the selection of a technique for pulse compression that is compatible with the stringent restraints on size, weight, reliability and freedom from adjustment that are imposed by
satellite operation. The FM chirp surface-wave dispersive delay-line matched filter offers the most promise as a result of these studies. Further design studies have been made on this system to develop it to a point that it can be compared with the short pulse system that was developed in the parent study'"*).
Six specific pulse compression implementations have been selected for comparison from the point of view of the practical applicability of the hard ware involved and performance expectations. The consideration has been limited to those parts of systems that are directly concerned with pulse compression, the components for the initial expansion of the signal, the receiver, and the pulse compression components. The transmitter and processor will not be differentially affected by the various systems under consideration and hence have not been reviewed in the initial selec tion of approach.
The six systems that have been studied are:
1. FM* - Perpendicular-Diffraction Dispersive Delay-Line Matched Filter
2. FM* - Surface-Wave Dispersive Delay-Line Matched Filter
3. FM* - Correlation Receiver (Serrodyne Mixing)
4. Discrete Coded - Binary Phase Coding (Barker Sequences)
5. Discrete Coded - Staggered Spacing Pulse Groups
6. Discrete Coded - Stepped Frequency Sequences
The advantages that could accrue from pulse compression are increasing the bandwidth of the system so that an improved altitude resolu tion capability can be achieved; and increasing the possible time-bandwidth product so that lower peak powers can be realized. This de crease in peak power in turn would reflect in less weight and power consumption as well as improved reliability in the modulator trans mitter parts of the satellite altimeter.
* Continuously Swept
6-62

Increasing the bandwidth, or in effect shortening the pulse to improve resolution, could undoubted ly improve accuracy materially at lower sea state levels; however, it has yet to be demonstrated that at higher sea states (e. g. , 5 on Beaufort scale), where the effective pulse width is shorter than the wave height, a specific improvement would result. This latter question can only be answered when sufficient impulse response data is available from the aircraft flight test.
Turning next to the possible reduction in peak power by increasing the time -bandwidth product, the increased duration of the transmitted signal means that the average power required for de tecting the signal return may be maintained while the peak power is reduced. If this peak power can be reduced from the present 1 kw to 5 watts, a solid state transmitter now would become a possibility. This would result in less trans mitter weight and longer life expectancy of the transmitter and modulator. There are currently available TWT's and magnetrons that could be used for pulsed application, that have life guarantees on the order of 500 hours, while solid state devices could be expected to provide a life in excess of 2000 hours. However, it should be pointed out that it is well within the state of the art to develop a TWT of comparable life expectancy, although no such qualified tube is currently available. It will become apparent in the ensuing parts of the report that these im provements are paid for by increasing the basic complexity of the system.
The six systems that were specifically considered in the part of the study are compared in Table 2.
The accuracy goals of the parent study have been used to define the resolution requirements and, in turn, the minimum bandwidth requirement of 20 MHz. If an improvement in resolution can be shown to improve the accuracy performance of the system, the selected pulse compression system should afford the possibility of increasing the bandwidth to 100 MHz. The time-bandwidth product or dispersion ratio of 100 is readily achievable by all of the systems that we have chosen to consider.
FM Chirp Matched Filter Techniques Of the two approaches noted above, the one in the most advanced state of development employs matched filter chirp techniques. The trans mitted waveform for a chirp system can be generated actively, by sweeping a voltage- controlled oscillator (VCO), or passively, by impulsing a dispersive network. The systems shown in Figure 7 use a dispersive network to expand and to compress the pulse.
There are various methods for achieving dis persive delay devices; only two, however, have sufficient bandwidth (at least 20 MHz) and time-bandwidth product (at least 100) to be of value in the application at hand. They are perpendicular diffraction delay lines and lithium niobate surface dispersive delay lines. Perpendicular-diffraction delay lines utilizing a quartz medium are readily capable of 20 MHz bandwidths and dispersion ratios of at least 100. Experimental models have been built having bandwidths approaching 100 MHz.
Range sidelobes would most probably have to be suppressed by the addition of a weighting function in the receiver or by transmitting a nonlinear FM chirp. Sidelobe suppression by weighting the received signal would decrease the resolution of the radar by a factor of one and a half to two and also increase the power requirements for signal detection. Therefore, to achieve the same resolution as the present short pulse system, a bandwidth of consider ably more than 20 MHz would be necessary. The requirement of increased bandwidth would also apply to a nonlinear chirp case.
Even though perpendicular-diffraction delay lines show promise of sufficient bandwidth, their bulkiness (see Figure 6) and high loss (typically 50 to 60 dB) would make them un attractive for satellite applications.
A recent development at Raytheon 1 s Research Division shows a great deal of potential for producing small, lightweight dispersive delay lines in the very near future^. These devices have interdigital arrays printed on lithium niobate and use surface-wave rather than bulk-wave techniques. Besides being small and lightweight, these delay lines would be relatively inexpensive and highly reproducible and would have much less loss than bulk wave type devices.
6-53

Typically, the surface wave lines have usable dispersive bandwidths of thirty to forty percent of their center frequency. The upper limitation on center frequency is dictated by present photo lithographic techniques; however, a line with a 300 MHz center frequency and 100 MHz band width seems quite feasible. These new lines offer good possibilities for chirp systems much smaller (see Figure 6) than many which have been built to date.
Phase-Coded Systems A conceptual diagram of a phase-coded pulse compression system is shown in Figure 7. There exists a veritable infinity of optimum and suboptimum discrete coded sequences of which phase coded sequences are one group(7). Most discrete coded wave
forms can be disregarded either from the stand point of poor sidelobe performance or from the standpoint of rather complex implementation. Another disadvantage that can be inferred from Figure 8 is that the tapped delay lines will con stitute a size and weight problem.
The use of longer suboptimum codes to achieve higher compression ratios or the use of poly phase rather than binary phase codes to achieve better sidelobe performance does not alleviate the system problem, in that they would make the system prohibitively large and/or complex. In summary, the only sequences which show promise for the present application are the Barker sequences.
The maximum length, Barker sequence (N=13), has a theoretical sidelobe level of approximately -23 dB; and therefore, a modest amount of weighting may still be necessary, since it would be difficult to space the taps any closer than 50 nsec. The binary phase-coded system would not provide any increased resolution over the short pulse system, but would only serve to reduce the transmitter peak power (by a factor of 13:1 with the maximum length sequence). In comparison with the other coding systems dis cussed here, the binary phase-coded system would seem to be the least attractive approach because of the difficulties involved in operating the trans mitter in a phase discontinuous mode.
As a result of the investigation of different forms of pulse compression, it is concluded that the lithium nobate surface dispersive line best meets the requirements of a satellite altimetry.
CONCLUSIONS
The analyses of this study have led to the following conclusions:
1. Altimetry power requirements differ from those of normal radar in that peak power must be increased as the inverse square of pulse length, because of the variation of target cross section with pulse width.
The accuracy of an altimeter operating at a pre-established signal to noise ratio is
10 cm 1 meter
for for
10 ns pulses 50 ns pulses
Pulse compression (increases the duty factor and reduces peak power) for 10 cm accuracy sufficiently that tubes with greater efficiency and longer life expectancy can be specified and EMI is reduced.
The reduction in power requirements for accuracy design goals of 2 meters does not justify the added complexity of pulse compression.
The Rayleigh clutter of the return signal does not destroy the compression charac teristics of the signal.
ACKNOWLEDGEMENT
This study was made possible by the support of Mr. Jerome Rosenberg of NASA-Satellite Geodesy Program Office, Washington, D. C. The cooperation, support and contribution of the following people at Raytheon led to the success of this study:
D. K. Barton T. Berger (Dr. ) L. F. Coppenrath W. Glaven E. F. Hudson M. Kolker
A. McConchie F. F. Reed H. R. Ward, Jr. D. Winsor (Dr. ) J. T. Zimmer
6-54

REFERENCES
(1) Space Geodesy Altimetry - PulseCompression Radar Study Final Report NASW 1709, August 1969, Raytheon R69-4346
(2) Frey, Harrington, and Von Arx, "Study of Satellite Altimetry for Geophysical and Oceanographic Measurement", Proceedings, XVI IAF Symposium, Athens, 1965
(3) Kaula, W. M. , "Theory of SatelliteGeodesy" Applications of Satellites to Geodesy, Blaisdell Publishing Company,1966
(4) Space Geodesy Altimeter Study Final Report NASW 1709, October 1968, Raytheon R68-4459
(5) Introduction to Radar Systems,Skolnik, M., Page 36, McGraw Hill, 1962
(6) Trancell, R. H. , Schulz, M. B. , Barrett, H. H. , Davis, L. , Jr. , and Holland M. G. , "Dispersive Delay Lines Using Ultrasonic Surface Waves, "Proc IEEE, Vol. 57, page 1211, 1969
(7) Cook, C.E. and Bernfeld, M. Radar Signals, Academic Press, New York1967
6-55

Table 1
Error Summary
Error Item
1.
2.
3.
4.
5.
6.
7.
8.
9.
10.
11.
12.
13.
Total
Receiver Noise
Sea Clutter
Sea State
Refractivity
Integration
Bias
WaveformVariations
Amplitude Variation
Digital Counting
Multipath
Range SL
Altitude Rate
Attitude
(rss)
SGAS Radar Errors
Estimated with Data Corrections
. 009 m
. 04 m
. 01 m
. 1 m
0
. 2 m
. 1 m
. 05 m
. 1 m
0
NA
0
0
. 26 m
Estimated Error with Either Short or Com pressed Pulse System
. 01 m
.01 m
. 01 m
. 05 m
0
. 05 m
. 05 m
. 01 m
. 05 m
0
. 02 m
. 015 m
. 02 m
.llm
6-56

Systems Comparison
Table 2
System
SurfaceWave Disp.Delay Line
SerrodyneTechnique
Perpendicular Diff.Dis. DelayLine
DiscreteFrequencySequences
BarkerCode(N --, 13)
StaggeredSpacingPulseGroups
Max. BW
100 MHz
200 MHz
100 MHz
20 MHz
20 MHz
20 MHz
Time Bandwidth
or Disp. Prod.
200
400
200
N2
13
M''"
Relative Size
1
1.3
3. 5
0. 5N+ 1
2. 3
ocT**
Relative Weight
1
1.3
5
0. 5N + 1
2. 3
«!•**
Remarks
Good resolution;high disp. prod. ,small, lightweight
Good resolution,high disp. prod. ,small, lightweight
Good resolution,high disp. prod. ,delay lines arelarge, and heavy
Requires Nmatched filters,marginal resolutions
Requires tappeddelay lines,marginal resolution, low disp.prod.
Requires tapped delay lines, marginalresolution, low disp.prod, unless M islarge.
M = Number of pulses in ensemble
T = Duration of ensemble
6-57

Oi
00
Figure 1
Geoid
heig
hts,
in
meters,based
on the
spherical
harmonic coefficients th
roug
h th
e sixth
degree of
Anderle
(196
6).

Sel
ecti
on o
f P
uls
e C
om -
pre
ss)
on
Met
hod
Co
nfi
gura
tio
n
Des
ign
ofP
uls
e C
om
pre
ssio
n
Fig
ure
2 St
udy
Flow
Dia
gram

0.1
-
o is o
0.01
to J-l 0) I a W 0) 1 • i
-C
4J
5
0.0
01
-^C
ompo
site
of
err
ors
th
at a
re i
ndep
ende
nt o
f pu
lse
leng
th
4 R
efra
ctiv
ity
_
. 9
Dig
ital
cou
ntin
g
1 ns
-!'C
ompo
site
of
err
ors
th
at a
re l
inea
rly
de
pe
nden
t on
pul
se l
engt
h6
Bia
s7
Wav
e fo
rm v
aria
tio
n
Am
plit
ude
var
iati
on
Sea
Clu
tter
Err
or
ecei
ver
Noi
se E
rro
r
Mag
netr
on S
yste
m A
ccur
acy
®
Sho
rt P
uls
e 10
ns
(O)
Lon
g P
uls
e 10
0 ns
10 n
s 10
0 ns
Len
gth
of C
om
pre
ssed
Puls
e in
Nan
osec
onds
(#U
se w
ith
Tab
le
1)
Acc
ura
cy I
mpr
ovem
ent
Res
ulti
ng f
rom
Sho
rten
ing
Puls
e at
Con
stan
t P
Fig
ure
3
av
1 M
100 K
10 K
0)Ok 100
10
System Power Requirements Excessive For
Accuracy
Lower Limi Single Pulse V\
- = 4. 0 dB
Threshold a
10Transmitted Pulse Length in Nanoseconds
400 mile single pulse lower S/N limit
Change in system parameters by pulse compression (Expan- sion) 100:1
[7] SGAS Recommended System
SGAS System with Pulse Compression
Short Pulse System
CQ sscd Pulse System
Figure 4 Time Bandwidth Power Allocations For Geodesy Altimeter Systems
6-61

PQ H 2
5x10
5x10
500
g •C £<U C
H u H -2
*- 50 w = Pav
- 20 w = Pav
10 w = Pav
5 w = Pav
1 w - Pav
Iw 10 100 IK 10K System Peak Power Requirement in Watts
10
Figure 5 TWT Efficiency & Tube Lifefor Different Power Levels
(Generated from data provided by Dr. D. Winsor of Raytheon
Power Tube Division)
6-62

o* & CO
Tx -
Rx
Tim
ing 1
Tx Tim
ing
Fro
m R
F
Am
plif
ier
Spec
trum
Gen
erat
or
Seco
nd
Mix
er
i \
Loc
al
Osc
illa
tor
——
——
— fr
——
——
— »
Dio
de
Switc
htk
Pre
- Am
pli
fi
er
Fil
ter
Dri
ve
Am
plif
ier
Surf
a
Del
ay
ce W
ave
oers
ive
Lin
e
Wei
gl
Fii
t A
mp 1iti
ng
er
lifi
er
f
Det
ecto
r-
Vid
eo
Am
plif
ier
* ——
——
Pos
t D
elay
Am
plif
ier
1t
Dio
de
Switc
h
To
——
Pro
cesi
Tx-
Rx
t- Tim
ing
To
Tra
nsm
tr.
lor
Fig
ure
6
FM
Chir
p S
yst
em w
ith
Surf
ace
Wav
e D
isp
ersi
ve
Del
ay L
ine

Tx
Tim
ing
Sum
mat
ion
Net
wor
k A
mpl
ifie
r
To
Tra
nsm
itte
r
Tap
ped
Del
ay L
ine
Dec
oder
Fro
m R
F
Am
plif
ier
Seco
nd
Mix
erP
re-A
mpl.
F
ilte
r
A
Loc
al
Osc
illa
tor
1 1 1 I 1 L_
1 5^ r f>rw
T -4 1
2 r
Y
T -1 1>, f
Y V -<t i
1 » _ i
Sum
mat
ion
Net
wor
k A
mpl
ifie
rW
eigh
ting
Det
ecto
r jo
^
Fil
ter-
„
^
Vid
eo
. ——
A
mpl
ifie
r A
mpl
ifie
r P
roce
sso
r
Fig
ure
7 P
hase
Cod
ed P
ulse
Com
pres
sion