Embed Size (px)
Citation preview
Trade Competitiveness of theMiddle East and North Africa
Policies for Export Diversification
José R. López-Cálix, Peter Walkenhorst, and Ndiamé DiopEditors
D I R E C T I O N S I N D E V E L O P M E N T
Trade

Trade Competitiveness of the Middle East and North Africa

Trade Competitiveness of theMiddle East and North Africa Policies for Export Diversification
José R. López-Cálix, Peter Walkenhorst, and Ndiamé DiopEditors
© 2010 The International Bank for Reconstruction and Development / The World Bank1818 H Street, NWWashington, DC 20433Telephone 202-473-1000Internet www.worldbank.orgE-mail: [email protected]
All rights reserved.
1 2 3 4 :: 13 12 11 10
This volume is a product of the staff of the International Bank for Reconstruction andDevelopment / The World Bank. The findings, interpretations, and conclusions expressed in thisvolume do not necessarily reflect the views of the Executive Directors of The World Bank or thegovernments they represent.
The World Bank does not guarantee the accuracy of the data included in this work. The bound-aries, colors, denominations, and other information shown on any map in this work do not implyany judgement on the part of The World Bank concerning the legal status of any territory or theendorsement or acceptance of such boundaries.
Rights and PermissionsThe material in this publication is copyrighted. Copying and/or transmitting portions or all ofthis work without permission may be a violation of applicable law. The International Bank forReconstruction and Development / The World Bank encourages dissemination of its work andwill normally grant permission to reproduce portions of the work promptly.
For permission to photocopy or reprint any part of this work, please send a request with com-plete information to the Copyright Clearance Center Inc., 222 Rosewood Drive, Danvers,MA 01923, USA; telephone: 978-750-8400; fax: 978-750-4470; Internet: www.copyright.com.
All other queries on rights and licenses, including subsidiary rights, should be addressed to theOffice of the Publisher, The World Bank, 1818 H Street NW, Washington, DC 20433, USA; fax:202-522-2422; e-mail: [email protected].
ISBN: 978-0-8213-8074-1eISBN: 978-0-8213-8075-8DOI: 10.1596/978-0-8213-8074-1
Cover photos: Bunyad Dinc/World Bank (Istanbul market street), Julio Etchart/World Bank(Agadir port)
Cataloging-in-Publication data is available from the Library of Congress.
v
Acknowledgments xixContributors xxi
Chapter 1 Trade Reforms for Export Competitiveness: What Are the Issues for the Middle East and North Africa? 1Ndiamé Diop, José R. López-Cálix, and
Peter Walkenhorst
Export Diversification 3Services Trade 5Relations with China and India 6Regional Integration 8Note 9References 9
PART I Export Diversification
Chapter 2 FDI Flows and Export Diversification: Looking at Extensive and Intensive Margins 13Julien Gourdon
Contents
Export Diversification in the Middle East and North Africa 14
The Potential Impact of FDI on Export Diversification 22
The Model 26Conclusions 35Annex 36Notes 44References 44
Chapter 3 Promoting New Exports: Experience from Industry Case Studies 47Claudia Nassif
Export Diversification in “Resource-Poor” Countries in the Region 48
Case Studies 51Designing Proactive Policies to Encourage
Experimentation and Imitation 57Conclusion 60Notes 61References 61
Chapter 4 Export Diversification in Algeria 63Ricardo Hausmann, Bailey Klinger, and
José R. López-Cálix
The Structure of the Algerian Economy 64Why Is Algeria So Dependent on
Hydrocarbons? 68Applying a New Methodological Approach to
Export Diversification 74Using the Product Space to Scan the Possibility
Space for Algerian Exports 81Policy Implications of the New Methodology
for Industrial Strategy 88Annex 96Notes 100References 101
vi Contents
PART II Services Trade
Chapter 5 Emerging Export Services: Where Does Tunisia Stand? 105Olivier Cattaneo, Ndiamé Diop, and
Peter Walkenhorst
Can Emerging Export Services Contribute to Growth and Poverty Reduction? 105
How Has Tunisia Performed in Emerging Export Services? 110
Are Tunisia’s Emerging Export Services Internationally Competitive? 117
What Needs to be Done to Strengthen Competitiveness? 124
References 132
Chapter 6 Anchoring Services Reform: The European Neighborhood Policy and Morocco 135Ndiamé Diop
Liberalization Reforms and the Openness of Morocco’s Services Sectors 137
The Need to Strengthen the Regulatory Framework 137
Options for Regulatory Convergence with the European Union in Selected Sectors 140
Implementing Competition Policies 155Notes 157References 160
Chapter 7 Services Trade as an Engine of Development: Situation and Prospects in Algeria 163Olivier Cattaneo, Said Ighilahriz,
José R. López-Cálix, and Peter Walkenhorst
Quantifying the Importance of Services for Algeria 163
Trade in Services: An Important but Often Poorly Understood Concept 169
Contents vii

Strengthening the Economy by Bolstering Trade in Services 175
Issues for Policy Makers 185Notes 187References 188
PART III Relations with China and India
Chapter 8 Economic Growth in China and India: Challenges and Opportunities for the Middle East and North Africa 193Elena Ianchovichina, Maros Ivanic, and
Will Martin
Messages from the Literature 194Methodology, Data, and Simulation Design 203Results 206Concluding Comments 214Annex 217Notes 221References 222
Chapter 9 Globalization and Competition from China and India: Policy Responses in the Middle East and North Africa 227Paul Brenton, Lulu Shui, and Peter Walkenhorst
Globalization and the Export Performance of Countries in the Middle East and North Africa 228
Imports from China and India 239Gaining Access to Overseas Markets 241Exploitation of Existing Opportunities for
Export Growth 247Conclusions and Policy Messages 250Annex: Export Growth and Constant Market
Share Analysis 251Notes 264References 264
viii Contents
PART IV Regional Integration
Chapter 10 Regional Integration: Status, Developments, and Challenges 267Lulu Shui and Peter Walkenhorst
Reasons for the Failure of Past Integration Attempts 269
Open Regionalism 294References 295
Chapter 11 Economic Gains of Regional Agreements in theMaghreb: Deeper versus Wider Integration 299Paloma Anos Casero and
Ganesh Kumar Seshan
Some Conceptual Issues 300Some Methodological Issues 302Scenarios 303Conclusions 312Annex: Methodology 313Notes 327References 328
Index 331
Boxes 3.1 How Entrepreneurship Makes a Difference 533.2 Spurring Exports in Tunisia through FAMEX 595.1 Promoting Exports through a Technology Park 1306.1 Major Directives Governing the Telecommunications
Sector in the European Union 1416.2 Liberalization of the Telecommunications Sector
in Estonia 1456.3 Reform of Port Services in Romania 1527.1 Missed Opportunities in the Algerian Legal Market 1797.2 French Entry into the Algerian Supermarket Sector 1817.3 Why Liberalization Often Produces Disappointing
Results: Sequencing, Regulation, and Access Policies 186
Contents ix
10.1 The Long History of Integration in the Middle East and North Africa 270
Figures2.1 Theil Index for Trade in Several Countries 162.2 Herfindahl Index for Trade in Several Countries 172.3 Gini Index for Trade in Several Countries 192.4 Theil “Within” Index for Selected Groups of Countries,
1988–2006 202.5 Theil “Between” Index 212.6 Actual and Potential FDI Flows in Selected Countries,
1990–95 and 2000–05 232.7 FDI Inflows and Export Concentration in
Developing Regions 262.8 Coefficients Measuring the Impact of FDI on Export
Concentration 342.A.1 Shares of Within and Between Components in Overall
Theil Index 393.1 Herfindahl-Hirschmann Index of Export
Concentration, 1990 and 2005 494.1 Per Capita Oil Exports and Oil Exports as Percentage
of Total Exports in Selected Countries, 2004 664.2 Non-Oil EXPY of Selected Countries, 1986–2004 674.3 Algeria’s Real Effective Exchange Rate, 1980–2006 694.4 Volatility of Real Exchange Rate (1996–2006) and
Exports per Capita (log) 704.5 Top Business Constraints Identified in the 2007
Investment Climate Assessment of Algeria 724.6 Relationship between Number of Products
Exported and Doing Business Ranking in Selected Countries 73
4.9 Relationship between Open Forest and GDP per Capita in Selected Countries, 2004 79
4.10 Most Optimistic Open Forest Calculations in Selected Countries, 2006 80
4.13 New Products 2 Standard Deviations above Average Density, Weighted by World Trade 84
4.14 New Products 2 Standard Deviations above Average Density, Weighted by Strategic Value 85
x Contents
4.15 New Products 1.5 Standard Deviations above Average Density, Weighted by World Trade 86
4.16 New Products 1.5 Standard Deviations above Average Density, Weighted by Strategic Value 87
4.17 Unoccupied Products 1 Standard Deviation above Average Density, Weighted by World Trade 88
4.18 Unoccupied Products 1 Standard Deviation above Average Density, Weighted by Strategic Value 89
4.19 Sectors Targeted under Government of Algeria’s New Strategy 91
4.A.1 Relationship between Export Sophistication and GDP per Capita in Selected Countries, 2004 97
5.1 World Services Exports, by Type, 1995–2006 1065.2 Offshoring Potential of Selected Service Industries 1075.3 Offshore, Onshore, and Insourced Call Center
Activity in the United States, United Kingdom, and France, 2006 108
5.4 Number of Call Center Seats Serving Francophone Clients, by Country, 2006 108
5.5 Size Distribution of ICT Companies in Tunisia, France, and the United States, 2004 115
5.6 Activities of ICT Companies in Tunisia, 2004 1165.7 Index of Tunisia’s Share of World Export
Receipts, 2000–05 1165.8 Multidimensional Attractiveness of Offshoring 1175.9 Engineering Graduates as Percentage of
Economically Active Population in Selected Countries, 2004 118
5.10 Cost of Operating a Call Center in Selected Francophone Countries, 2005 120
5.11 ICT Professionals’ Perceptions of Strengths of Tunisia as Exporter 120
5.12 Impediments to Exports Cited by ICT Professionals in Tunisia 123
5.13 ICT Professionals’ Perceptions of Administrative and Financial Obstacles Facing Tunisian Firms 132
6.1 Openness of Telecommunications, Air Transport, Banking, and Accounting Sectors in Selected Countries 138
7.1 Value-Added by Sector in Algeria, 1995 and 2005 164
Contents xi
7.2 Annual Growth in the Value Added of Services in Algeria, 1990–2005 165
7.3 Service Sector Employment in Algeria, by Industry, 2004 167
7.4 Distribution of Female Employment in North Africa, 2006 168
7.5 Female Share of Sectoral Employment in North Africa, 1996 and 2006 168
7.6 Composition of Algerian Service Sector Output, by Industry, 2005 169
7.7 Balance of Trade in Algerian Service Sectors, 2005 1707.8 Composition of Algerian Service Sector Trade, by
Industry, 2005 1717.9 Service Sector Imports and Exports by Algeria,
2000–05 1727.10 Worker Remittances and Mean Wages of Algerians
Temporarily Working Abroad, 1990–2004 1767.11 Algerian Firms Slated for Privatization, by Sector 1778.1 Projected Changes in Volume of Exports from the
Middle East and North Africa Associated with Extra Growth in China and India 211
8.2 Projected Changes in Volume of Resource-Based Manufactured Exports Associated with Extra Growth in China and India 212
8.3 Projected Changes in Volume of Manufactured Exports Associated with Extra Growth in China and India 213
8.4 Projected Changes in Export Volumes Associated with Extra Growth in China and India under Growth and Growth and Quality Scenarios 215
9.1 Average Tariffs in the Middle East and North Africa, 1997–2007 236
9.2 Average Tariffs in the Middle East and North Africa, by Country, 2007 237
9.3 Overall Logistics Performance Index of Countries in the Middle East and North Africa 238
9.4 Tariffs in China, India, and Selected Countries in the Middle East and North Africa, 2006 239
9.5 Number of Domestic Tariff Peaks on Imports from China and India in Agadir Agreement Countries, 2006 240
xii Contents
9.6 Number of Agadir Country Exports Experiencing Import Surges from China and India, by Country, 1998–2006 241
9.7 Clothing Exports by Countries in the Middle East and North Africa, 1995–2006 242
9.8 Exports of Knitted and Nonknitted Clothing by Egypt, Jordan, Morocco, and Tunisia, by Importing Country, 1995 and 2006 243
9.9 Average Tariffs in China and India, 1997–2007 2479.10 Bilateral Import-Weighted Average of Import Duties
by China and India on Exports from the Middle East and North Africa, 2006 248
10.1 The Number of Regional Agreements Grew Strongly over the Past Two Decades 268
10.2 The Network of MENA Regional Agreements Is Dense 271
10.3 Many MENA Countries Have Increased Their Intraregional Trade over Time 273
10.4 Exports to the Region Remain Generally of Minor Significance 274
10.5 MENA Destinations Are of Some Importance for Non-Oil Exports 275
10.6 Exports of Parts and Components Have Increased in Some Maghreb Countries 277
10.7 Import Tariffs Vary Markedly Across MENA 28110.8 Nontariff Measures are Highly Restrictive in MENA
Countries 28310.9 Trade Procedures in MENA Are Cumbersome 28410.10 Trade Procedures in MENA Are Time Consuming 28510.11 The Logistics Performance of Most MENA
Countries Is Below Expectations 28610.12 Logistics Performance Varies Within Country
Groups and Across Components 28710.13 GATS Commitments Illustrate Varying Reform
Mindedness across the Region 28810.14 Major Services Exporters Have Significantly
Increased Their Output 28910.15 MENA Contains Both Net Exporters and Net
Importers of Services 290
Contents xiii

10.16 Total and Intra-MENA Tourism Exports Have Grown Strongly 291
10.17 Inward FDI Stocks Have Expanded Substantiallyin Resource-Poor Countries 292
10.18 Remittances Flows Are in Line with Labor Endowments 29311.1 Projected Real per Capita Income in Maghreb
Countries, 2005 and 2015 30311.2 Projected Real per Capita Income under Regional
Trade Agreement with European Union, 2005 and 2015 306
11.3 Projected Non-Oil Exports in Maghreb Countries under Regional Trade Agreement with European Union, 2005 and 2015 307
11.4 Projected Real per Capita Income in Maghreb Countries Given Service Liberalization and Investment Climate Reforms, 2005 and 2015 309
11.5 Projected Value of Non-Oil Exports in Maghreb Countries Given Service Sector Reforms, 2005 and 2015 310
11.6 Projected FDI Stock in Maghreb Countries Given Service Liberalization and Investment Climate Reforms, 2005 and 2015 311
11.7 Projected per Capita Income in Maghreb Countries Given Maghreb Regional Trade Agreement, EU Regional Trade Agreement, and Service Sector Reforms, 2005 and 2015 312
Tables2.1 Motives behind Foreign Direct Investment in the
Middle East and North Africa 252.2 Determinants of Export Diversification 312.A.1 Coefficients for Shares of Within and Between
Components in Overall Theil Index 402.A.2 GMM Estimations to Control for Endogeneity 412.A.3 Approaches to Defining New Exports 423.1 Decomposition of Export Growth into Intensive
and Extensive Margins in Selected Countries, 1995–2005 50
4.1 Doing Business 2008 Indicators for Countries in the Middle East and North Africa 71
xiv Contents

4.2 Potential Up-Market Export Sectors in Algeria, 2006 814.A.1 Contributors to Algeria’s EXPY, 2004 985.1 Number of Foreign Patients and Volume of
Exports in Tunisia, by Nationality, 2004 1115.2 Costs of Most Popular Cosmetic Surgery
Procedures in Selected Countries, 2005 1215.3 Potential Regulatory Obstacles to Trade in
Professional Services in Tunisia 1276.1 Short- and Medium-Term Provisions for Financial
Services in European and Accession Partnerships, by Country 149
6.2 Regulatory Reform Options for Morocco 1537.1 Growth Rates and Percentage of Small and
Medium-Size Enterprises in Algeria’s Service Sector, by Subsector, 2006 166
7.2 Urban and Rural Employment in Algeria, by Sector, 2008 166
7.3 FDI Flows to the Middle East and North Africa, by Economy, 1997–2006 173
7.4 Home Country of Foreign Companies Established in Algeria, 2006 174
7.5 Examples of Foreign Service Providers Established or Investing in Algeria 175
7.6 Household Spending in Algeria, Morocco, Tunisia, and France, by Sector 180
7.7 Average Percentage Change in Consumer Price Index for Selected Goods and Services, 2001–05 180
7.8 Examples of Bilateral, Regional, and Multilateral Agreements 184
8.1 Correlation of Export Shares of India, China, and the Middle East and North Africa 198
8.2 Impacts of Extra Growth in China and India on Selected Economies 207
8.3 Projected Changes in World Commodity Prices Associated with Extra Growth in China and India 209
8.A.1 Annual Baseline Growth Rates in Selected Economies, 2005–20 217
8.A.2 Changes in Exports Caused by Extra Growth in China and India, 2005–20 218
Contents xv
8.A.3 Changes in Output Caused by Extra Growth in China and India, 2005–20 219
8.A.4 Changes in Exports Caused by Extra Growth in China and India with the Assumption of Improvements in Quality and Variety 220
9.1 Rate of Export Growth and Change in Global Market Share in the Middle East and North Africa, by Country, 1995–2006 229
9.2 Growth in Exports to and Change in Market Share of European Union, by Country, 1995–2006 229
9.3 Intensive and Extensive Margins of Export Growth of Countries in the Middle East and North Africa, 1995–2005 231
9.4 Index of Export Market Penetration, by Country, 1995 and 2005 248
9.5 Bilateral Index of Export Market Penetration for Selected Countries 249
9.A.1 Key Contributors to Export Growth and Decline at the Intensive Margin 251
9.A.2 Key Contributors to Export Growth and Decline at the Extensive Margin 255
9.A.3 Constant Market Share Analysis of MENA Countries’ Exports to the European Union, 1995–2006 259
10.1 Bilateral Treaties within the Middle East and North Africa 272
10.2 Trade with Partners in Regional Agreements, 2006 27610.3 Bilateral Trade Complementarity within the
Middle East and North Africa, 2006 27911.1 Projected Impact of Unit Increase in Service
Reform Index on Annual per Capita Real GDP Growth in Maghreb Countries 308
11.2 Projected Impact of Unit Increase in Service Reform Index on FDI Stock in Maghreb Countries 311
11.A.1 Economies Used in FDI Regression 31511.A.2 Regional Model of the Level of FDI Stock 31611.A.3 Actual and Predicted FDI Stock to GDP in
Algeria, Morocco, and Tunisia 31711.A.4 Growth in FDI Stock to GDP Implied by
Creation of a Maghreb Regional Market 317
xvi Contents
11.A.5 South-South Regional Trade Agreements 31811.A.6 Documentation of Data Used in Panel Analysis
for Service Reforms 31911.A.7 Fixed-Effects Panel Estimates of FDI Stock to
GDP on Service Sector Reforms, 1990–2004 32011.A.8 Impact of Unit Increase in Reform Index on
Stock of FDI-to-GDP Ratio, 1990–2004 32111.A.9 Impact of Unit Increase in Reform Index on
Real Export Growth, 1990–2004 32211.A.10 Fixed Effects Panel Estimates of per capita GDP
growth and Service Sector Policies, 1990–2004 323
11.A.11 Impact of Unit Increase in Service Reform Index on Annual per Capita Real GDP Growth, 1990–2004 325
11.A.12 Definition of 4.3 Ranking on Reform Indices 32511.A.13 Country Fixed-Effects Growth Regression,
1980–2004 32611.A.14 Fixed-Effects Panel Estimates of (Log) Real
Export Value on RTA Market 327
Contents xvii

xix
This book was prepared by a team of contributors led by José R. López-Cálix, Peter Walkenhorst, and Ndiamé Diop. The names of the teammembers and their affiliations can be found on pages xxi–xxii. The teamreceived overall guidance from Ritva Reinikka, who also contributedextensive revisions to chapter 1. The team would like to thank peerreviewers Mona Haddad and Juan Sebastian Saez for their detailed sug-gestions on the content of individual chapters and to Farrukh Iqbal for histimely support and strong encouragement to the team. William (Bill)Shaw, supported by Clemence Vergne, did precious editorial work andhelped the team assemble the pieces. Khalid Alouane and Sheela Reddiperformed marvelous desktop publishing for the report, while ImaneIkkez provided a valuable contribution in finding the pictures for thecover. Financial support from the Multidonor Trust Fund for Trade andDevelopment is gratefully recognized.
Acknowledgments


xxi
José R. López-Cálix, co-editor, is sector leader and lead economist in theLatin America and Caribbean Region at the World Bank, Washington, DC.
Peter Walkenhorst, co-editor, is division manager in the ResearchDepartment of the African Development Bank, Tunis-Belvedère, Tunisia.
Ndiamé Diop, co-editor, is senior country economist and head of theWorld Bank Country Office, Tunis-Belvedère, Tunisia.
Paloma Anos Casero is senior economist in the Latin America andCaribbean Region at the World Bank, Washington, DC.
Paul Brenton is lead economist for trade and regional integration in theAfrica Region at the World Bank, Washington, DC.
Olivier Cattaneo is research associate with the Groupe d’EconomieMondiale des Sciences Politiques, Paris, France.
Julien Gourdon is an economist in the International Trade Department atthe World Bank, Washington, DC.
Ricardo Hausmann is director of the Center for InternationalDevelopment and professor of the Practice of Economic Development atHarvard University, Cambridge, Massachusetts.
Contributors

Elena Ianchovichina is lead economist in the chief economist’s office of theMiddle East and North Africa Region at the World Bank, Washington, DC.
Said Ighilahriz is an international consultant for the World Bank. He isbased in Algiers, Algeria.
Maros Ivanic is research economist in the Development Research Groupat the World Bank, Washington, DC.
Bailey Klinger is an international consultant for the World Bank withextensive research on nontraditional exports growth and small andmedium enterprises finance in developing countries.
Ganesh Kumar Seshan is an international consultant for the World Bank,Washington, DC.
Will Martin is research manager for Agriculture and Rural Developmentin the Development Research Group at the World Bank, Washington, DC.
Claudia Nassif is country and trade economist in the Middle East andNorth Africa Region at the World Bank, Washington, DC.
Lulu Shui is junior professional associate in the International TradeDepartment at the World Bank, Washington, DC.
xxii Contributors
1
International trade was deeply affected by the global financial and eco-nomic crisis. Mimicking worldwide trends, imports from and exports tothe Middle East and North Africa dropped significantly in 2009.
This sudden decline in global trade should not divert attention awayfrom four major developments in global economic integration that haveshaped the region’s trade policies and performance over the past decade:the emergence of global supply chains, the growth of trade in services, therise of China and India as major international trading powers, and regionalintegration. Each of these issues is discussed in detail in this book.
The first development is the rise of global production networks inwhich different stages of the production of a single good occur at differ-ent locations. As a result of this development, consumer products oftencontain parts, components, and inputs from a large number of countries.This development, driven by reductions in trade barriers and advances intransport and telecommunications, has significantly changed the meaning
C H A P T E R 1
Trade Reforms for ExportCompetitiveness: What Are theIssues for the Middle East andNorth Africa?
Ndiamé Diop, José R. López-Cálix, and Peter Walkenhorst
2 Diop, López-Cálix, and Walkenhorst
of competitiveness. Being competitive now requires not just being able toproduce at low cost but also being able to establish state-of-the-art supplyand logistics chains, including high-performing transport, customs, com-munications, and financial services. Countries that succeed in readyingthemselves for integration into global production chains have goodprospects of breaking into new markets and developing a more diverseproduction and export structure.
The second major trend relates to trade in services. With the wave ofliberalization and of information and communications-related techno-logical developments, offshoring in services such as back-office workprocesses, call center operations, medical transcription, accounting, andlegal research has boomed. India is a good example of a country that hashugely benefited from this trend. This development offers a promisingavenue for trade diversification and job creation in the region and otherdeveloping countries.
The third important development is the emergence of China and Indiaas new trade, innovation, and growth poles alongside the United Statesand Europe. The formidable growth of these countries, notably China, hasled to a significant increase in demand for and the price of naturalresource-based goods exported by countries in the Middle East and NorthAfrica. At the same time, these countries face major competitive chal-lenges from China, both at home and in third-country markets such asthe United States and the European Union (World Bank 2009a).
The fourth development is the increase in regional and preferentialtrade agreements, which have been proliferating, not least becauseprogress in multilateral trade negotiations under the auspices of theWorld Trade Organization has been slow. Integration with selected part-ners can help countries reap benefits from international integration whileavoiding the large-scale adjustment needs that are often associated withbroader-based trade reforms. Of course, preferential integration with var-ious partners runs the risk of introducing a variety of technical standards,customs requirements, and rules of origin provisions that are cumbersomeand costly to administer, and of depriving local producers and consumersof efficient, low-cost supplies from nonpartner countries.
The Middle East and North Africa comprises countries that areresource-poor but labor-abundant, resource-rich and labor-abundant, andresource-rich and labor-importing, each displaying its own idiosyncrasies.The four developments in global trade described above, together withnatural resource endowments, have influenced trade policy and diversifi-cation outcomes across all of these types of countries.
Trade Reforms for Export Competitiveness 3
Like other developing countries, the countries in the Middle East andNorth Africa increased the pace of trade integration reforms to harnessthe opportunities offered by the changed global market. Reform has beenlimited compared with that of other regions, however. In East Asia andEastern Europe, trade reforms have focused mainly on industrial goods,leaving out agriculture and services, both of which affect the countries ofthe Middle East and North Africa. No clear attempts have been made tostrategically exploit the rise of China and India (for example, no countryin the region has signed a free trade agreement with China). A recentWorld Bank report on private sector development finds that the privatesector in the Middle East and North Africa is constrained by public sectorgovernance, discretion, and privilege (World Bank 2009b). Increased com-petition would allow more firms to enter, helping expand trade and jobcreation. Taken together, these factors explain the relatively limited exportdiversification that has occurred in the region.
The 11 chapters of this volume examine the region’s trade policyreforms and performance by focusing on the four key developments ininternational trade, with a twist. Instead of examining production chains assuch, the volume focuses on export diversification (part I), a major devel-opment challenge in the region, especially for oil exporters. It then exploresservices trade (part II), the relations with China and India (part III), andregional integration (part IV).
Export Diversification
Part I is devoted to emerging lessons for export diversification. Countriesnaturally seek to diversify into production and export activities that providea higher return to the labor and capital resources employed. At the sametime, a more diverse structure of exports reduces a country’s vulnerabil-ity to pronounced price swings in international markets. The importanceof this effect has been evident during the financial and economic crisis,when many developing countries and emerging economies—including alarge number of countries in the Middle East and North Africa that relyheavily on fuel and commodity exports for their income—experienced amarked drop in export prices and a corresponding deterioration in theirterms of trade.
In chapter 2, Gourdon takes stock of the degree of export concentra-tion in different groups of countries and examines how it has evolvedover time. Resource-rich countries continue to show highly concentratedexport structures and very little change toward diversification, in both

4 Diop, López-Cálix, and Walkenhorst
total exports and nonfuel exports. In contrast, resource-poor, labor-abundant countries are significantly more diversified in their exportsand have been able to broaden their export portfolio since the 1980s.Econometric analysis suggests that this increased diversification is drivenby foreign investments in nontraditional export products, which gainedimportance in the overall portfolio over time. In contrast, the diversifica-tion that occurred in resource-rich countries was often driven by foreigninvestors developing new, nontraditional product lines for export. Thisdiversification was more modest and often insignificant.
Chapter 3, by Nassif, investigates the emergence of new export prod-ucts by drawing on the findings of a set of country case studies. Theauthor analyzes 23 successful cases in the Arab Republic of Egypt, Jordan,Lebanon, Morocco, and Tunisia to assess the factors that trigger or con-strain the discovery of new exports at the firm level. Although severalfactors were found to play a role, the most important element in the dis-covery process turned out to be a combination of information about newbusiness opportunities and a willingness to take risks and adopt newtechnologies and management techniques. Conversely, the high cost ofgathering important information and the resulting uncertainty werereported to be major obstacles to initiating a new export activity. Firstmovers were not concerned about competition from domestic followers.In fact, they often facilitated and even encouraged imitation throughknowledge sharing and collaboration to achieve essential economies ofscale in branding and marketing.
Producer clusters and the degree of similarity of skills and tasks in dif-ferent export activities are also at the core of the analysis of Hausmann,Klinger, and López-Cálix in their assessment of export diversification inAlgeria, in chapter 4. Drawing on a new methodological approach, theauthors identify a list of products that could serve as targets for industrialdevelopment, based on the tradeoffs among several factors: whether thenew product requires capabilities similar to those used to produce existingproducts, so that switching to the new product is relatively easy (“proxim-ity”); whether the new product increases the level of technology of theexport basket, a key determinant of growth (“sophistication”); andwhether the new product facilitates the export of additional new prod-ucts, because they require capabilities similar to those used to producethe new product (“strategic value”). This analysis generates a list of prod-ucts that would be the most efficient targets of industrial policy.Agroindustry, aluminum smelting, and steel and metal works are found tohave high potential and substantial strategic value. This perspective also
Trade Reforms for Export Competitiveness 5
underlines the importance of providing sector-specific public goods thatare selected in consultation with the private sector in a transparent man-ner. Simply removing general barriers to competition, although impor-tant, is not sufficient to achieve the structural transformation required forsustained growth.
Services Trade
Part II examines developments with respect to services trade. For a longtime, most services were considered to be nontradable, but innovationsin information and communication technologies have led to a fragmen-tation that has made it possible for many more services to be providedat a distance, including across borders. Indeed, services exports fromcountries in the Middle East and North Africa have grown dynamicallyin recent years, driven by the ongoing trend in industrial countries ofoutsourcing back office and information technology functions to takeadvantage of advanced skills and to reduce the labor costs of specializedservice providers. Other modes of services trade—consumption abroad(tourism), commercial presence (foreign direct investment) and the tem-porary movement of workers—are equally, if not even more, importantfor the economies of the region.
In chapter 5, Cattaneo, Diop, and Walkenhorst assess the prospects foremerging services exports in Tunisia. They identify a number of significantstrengths that have driven growth in services exports, including the largepool of skilled engineers willing to work at relatively low wages and thegeographical and cultural proximity of Europe. The authors note a num-ber of impediments that could hamper further expansion and warrant theattention of policy makers. Lack of competition in fixed-line telecommuni-cations and restrictions on the entry of foreigners into professional servicesdrive up the costs of service providers; poor payment discipline of publicprocurement services exacerbates the financial difficulties facing smalland medium-sized firms; and weaknesses in selected areas of educationand training, such as nursing and managerial education, create staffingbottlenecks for aspiring exporters. The authors see substantial potentialfor growth in medical tourism, back-office outsourcing, and informationtechnology-enabled services for Tunisia.
In addition to being a key area of export growth potential, services arealso important for economic efficiency and growth. In chapter 6, Dioplooks at several “backbone” services (telecommunications, banking, and airand maritime transport) in Morocco. These services play critical roles in

6 Diop, López-Cálix, and Walkenhorst
determining the production costs and competitiveness of all producers inthe economy. The author examines the entry and competition regulatory“distance” of these sectors from the European Union (EU) and argues thatgradual regulatory alignment with the European Union in the context ofthe European Neighborhood Policy offers Morocco the opportunity toanchor productivity-enhancing reforms, particularly in air transport, roadtransport, and energy. A particular challenge is that convergence with EUrules requires acceptance of important principles regarding competitionpolicy and state aid, which Morocco would need to accommodate in itspolicy framework. Effective reform of Morocco’s backbone services sec-tors would help reduce production costs, increase foreign direct invest-ment, promote vertical knowledge spillovers, and expand markets, all ofwhich would enhance competitiveness.
Converting services trade into an engine for growth requires identifyingthe key priorities of a comprehensive reform agenda. Algeria is preparingits services sectors for international integration. In chapter 7, which isbased on international experience and research supported by local dataand interviews, Cattaneo, Ighilahriz, López-Cálix, and Walkenhorst iden-tify those policies that promise to boost the further development of serv-ice trade in Algeria. First, an ambitious privatization program has beenannounced; about half of the enterprises that are to be shifted from pub-lic to private ownership are active in the services sector. The authors findthat more openness in private services resulting from this program is essen-tial to attract sufficient know-how and investment capital from domesticand foreign sources. Second, a tourism development strategy has beenlaunched that aims at better exploiting the country’s natural and culturalendowments, improving the quality of services and the reputation of thecountry, and rehabilitating tourism infrastructure. Third, desired changestoward an enhanced regulatory regime for services should expand thedomestic market and promote an improved efficiency of domestic produc-ers. Fourth, international trade agreements may play a complementary roleby serving as anchors for the reform process and shielding the governmentfrom domestic lobbies.
Relations with China and India
Part III investigates the emergence of China and India as major interna-tional trading powers and the implications for the region. The extent towhich the countries in the region can cope with the challenges and takeadvantage of the opportunities that the rise of China and India present will
Trade Reforms for Export Competitiveness 7
likely have a significant impact on their recovery from the global financialand economic crisis and, more generally, their development prospects.
In chapter 8, Ianchovichina, Ivanic, and Martin quantify the expectedtrade effects of the rise of China and India on the Middle East and NorthAfrica. Using a computable general equilibrium model calibrated to thebase year 2004, they assess the impact of continuing strong growth of theAsian Giants on the imports and exports of countries in the Middle Eastand North Africa through 2020. They find that the region would likelybenefit substantially from the growth of China and India: an increase inthe Giants’ growth rate of 2 percentage points a year over the 15-yearbaseline projection would raise real incomes in the region by $24 billionat 2004 prices. Most of these gains stem from improvements in the termsof trade as a result of increased demand for energy. In volume terms, totalexports from the Middle East and North Africa are projected to fall, asthe increase in fuel exports is more than offset by the decline in exportsof manufactures and services caused by stronger competition fromChina and India in third markets. Imports of manufactures and servicesinto the region are also projected to increase. The effects at the coun-try level are mixed across countries, with fuel exporters experiencingconsiderable gains and resource-poor countries projected to face sub-stantial adjustment in their manufacturing and services sectors. Policiesaimed at facilitating social and economic adjustments are thus impor-tant to reduce the costs associated with competition from China.
What should the policy response of countries in the region be to theemerging trade challenges posed by the Asian Giants? In chapter 9,Brenton, Shui, and Walkenhorst argue that it is not entirely clear thatincreased imports from the two Asian countries come at the expense ofdomestic producers. They find evidence of import surges from China andIndia into the Middle East and North Africa, but most of them coincidewith strong import reductions from alternative import suppliers, suggest-ing that the emergence of China and India leads primarily to an adjust-ment in the structure of imports. Also, although some countries in theregion have seen their share of international manufactures exports fall,others have been able to expand their exports to the European Union andthe United States by taking advantage of trade preferences. The authorsconclude that rather than implement policy measures specifically tar-geted at China and India, policy makers in the region should continueto reduce the antiexport bias in their trade regimes and reduce logistics-related trade transactions costs to make it possible for their exporters totake full advantage of the proximity to the large European market.
8 Diop, López-Cálix, and Walkenhorst
Regional Integration
Part IV looks at the status and prospects for regional integration. Therehas been no shortage of regional trade and investment agreements amongthe region’s countries. Such agreements include many bilateral prefer-ences, the Pan-Arab Free Trade Area, the Arab Maghreb Union, and theAgadir Agreement. The impact of these preferential integration effortshas been disappointing, however, because of the narrow focus in terms ofpreferential trade coverage on industrial goods, insufficient political com-mitments to live up to the spirit of the agreements, and administrativechallenges of implementation.
In chapter 10, Shui and Walkenhorst show that there are substantialuntapped opportunities from regional integration by the countries ofthe Middle East and North Africa, particularly through expansion ofcoverage of preferential agreements to agricultural products, services,foreign direct investment, and labor flows. The authors identify theproliferation of agreements in the region as a challenge for effectiveimplementation and highlight the need for high-level political supportto ensure that free-trade provisions in regional agreements are imple-mented. They view regional integration as a complement rather thanan alternative to integration into global markets.
Quantifying the benefits and costs of regional integration initia tivesprovides policy makers with a sense of the direction and magnitudeof prospective changes in production, income, and employment. In chapter 11, Anos-Casero and Seshan compare shallow integration,which includes preferential reforms for merchandise trade only, withdeep integration, which also opens services sectors to partner trade andincludes regulatory reforms to strengthen competition and marketcontestability. Their findings show that shallow integration is likely togenerate very limited gains but that benefits would multiply if deepintegration were pursued. If the EU serves as the external anchor forservices integration and investment climate reforms, reforms couldhave an even greater effect.
In conclusion, this book shows that the Middle East and North Africaregion has yet to seize all the opportunities offered by the four recentglobal trends that shape trade policy and performance around theworld. It also identifies additional reforms that could strengthen globalproduction networks, allow countries to benefit more from trade inservices, better capture the opportunities offered by the rise of Chinaand India, and harness the potential of regional integration. All of thesereforms could help boost growth and job creation in the region.

Note
The authors acknowledge valuable suggestions and active encouragement on ear-lier drafts of this chapter by Ritva Reinikka.
References
World Bank. 2009a. Strengthening MENA’s Trade and Investments Links withChina and India. Washington, DC: World Bank.
———. 2009b. From Privilege to Competition: Unlocking Private-Led Growth in theMiddle East and North Africa. Washington, DC: World Bank.
Trade Reforms for Export Competitiveness 9

PA R T I
Export Diversification

13
Identifying the determinants of export diversification in the countries ofthe Middle East and North Africa (MENA) should yield valuable researchand policy recommendations regarding the room for active governmentinterventions and their expected outcomes. Surprisingly, few researchershave studied this issue. Notable exceptions are Imbs and Wacziarg 2003,who explore the link between development, as measured by per capitaincome, and production concentration, and Martincus and Estevadeordal2005, who investigate the role of trade policy. Therefore, for MENAcountries, the level of export diversification would be a matter of levelof development or trade policy, although other explanations should betaken into account to explain their level of export diversification inMENA countries. Of particular interest is the impact of foreign directinvestment (FDI) on export diversification. Since 2000, both FDI andexport diversification have increased in the region, suggesting that theincrease in FDI may have been a motor behind export diversification.
This chapter is organized as follows. The first section addresses theextent of export concentration, as measured by three commonly usedindexes (Theil, Herfindahl, and Gini), and decomposes trends in export
C H A P T E R 2
FDI Flows and ExportDiversification: Looking atExtensive and Intensive Margins
Julien Gourdon
diversification into traditional versus new product lines. The second sec-tion measures the potential impact of FDI inflows on diversification inMENA. It briefly reviews recent trends in FDI inflows, presents an econo-metric model of the determinants of diversification, and estimates themodel using data from MENA. The last section summarizes the chapter’smain findings.
Export Diversification in the Middle East and North Africa
According to a vast body of empirical literature, export diversificationhas a strong, positive impact on growth, through various channels. First,export diversification increases productivity through knowledge spillovers(Feenstra and Kee 2004). Indeed, new economic growth models arguethat new export products may represent innovations that are precededby creative effort and new knowledge. Unlike goods and factors, ideasand knowledge can be freely used even if restricted by property rights.Such knowledge spillovers help the economy as a whole accumulateknowledge—the stock of useful ideas—allowing it to then grow withoutlimits (Hausmann and Klinger 2006; Hwang 2006; Hausmann, Hwang,and Rodrik 2007). Second, a more diversified export structure stimu-lates new industries and expands existing industries elsewhere in theeconomy, simply by adding new production opportunities for industries.This is particularly the case if diversification takes place by adding newexports to the existing export basket. Third, in the presence of externaleconomies, diversification can lead to stronger links and the developmentof products as cost reductions are passed on to downstream industries.Fourth, export diversification reduces the volatility of export revenue. Byreducing dependence on a limited number of products that are subjectto major price and volume fluctuations (such as agriculture and oil), acountry can increase its export and terms-of-trade stability (Acemogluand Zilibotti 1997; Bertinelli, Salins, and Strobl 2006; Levchenko andGiovanni 2006).
Export diversification in MENA countries has been limited, withcountries in the region underperforming other countries with similarincome levels in discovering new exports.1 All countries in the regionrely heavily on a few export commodities. In addition, exports are gen-erally produced with low levels of skill and are unsophisticated: only 21percent of exports from the MENA5 (the Arab Republic of Egypt,Jordan, Lebanon, Morocco, and Tunisia) are classified as medium or
14 Gourdon
high-technology, compared with almost 37 percent of exports in otheremerging economies.. This technology structure hurts productivity inMENA, which is low given its countries’ income levels. The export struc-ture also constrains export growth: most MENA countries would haveenjoyed more rapid export growth in the 1990s if their product orienta-tions had better matched global demand.
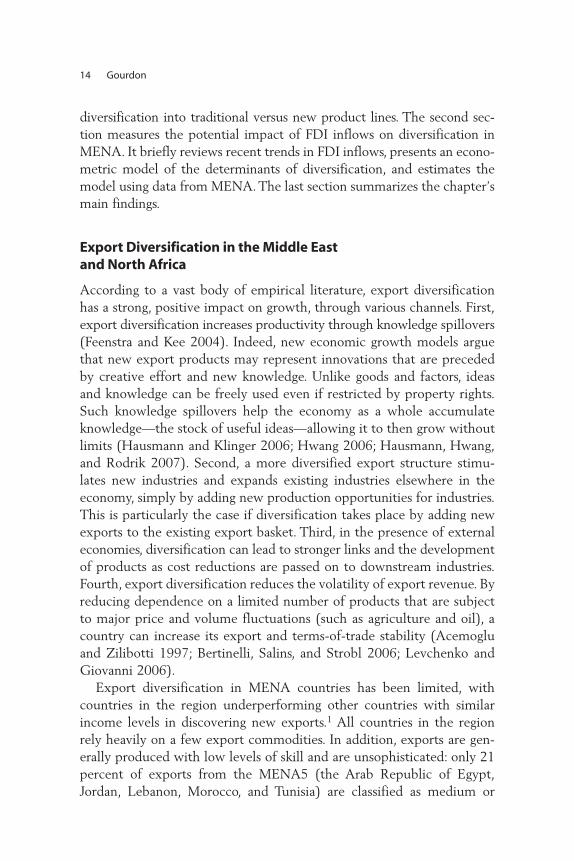
Trends in Export Diversification Concentration ratios, as measured by the Theil, Herfindahl, and Giniindexes (see annex for descriptions), reveal the high export concentrationin MENA. According to the Theil index (see figure 2.1), which is influ-enced most by changes in the share of small export sectors, exports fromthe MENA10 countries (that is, all MENA countries except those in theGulf Cooperation Council [GCC]) show a high but slightly decreasingtrend in concentration since 1988. A clear difference can be seen in thelevel and trend of export concentration in resource-poor labor-abundant(RPLA) and resource-rich labor-abundant (RRLA) countries. SomeRPLA countries (Lebanon, Morocco, and Tunisia) have low levels ofexport concentration compared with Asian countries; Jordan has reducedits export concentration from high levels at the end of the 1980s. In con-trast, RRLA country exports are highly concentrated (even if oil sectorsare excluded), with some decline in concentration since the late 1980s.GCC countries also show a high level of concentration, which has declinedvery little since 1990.
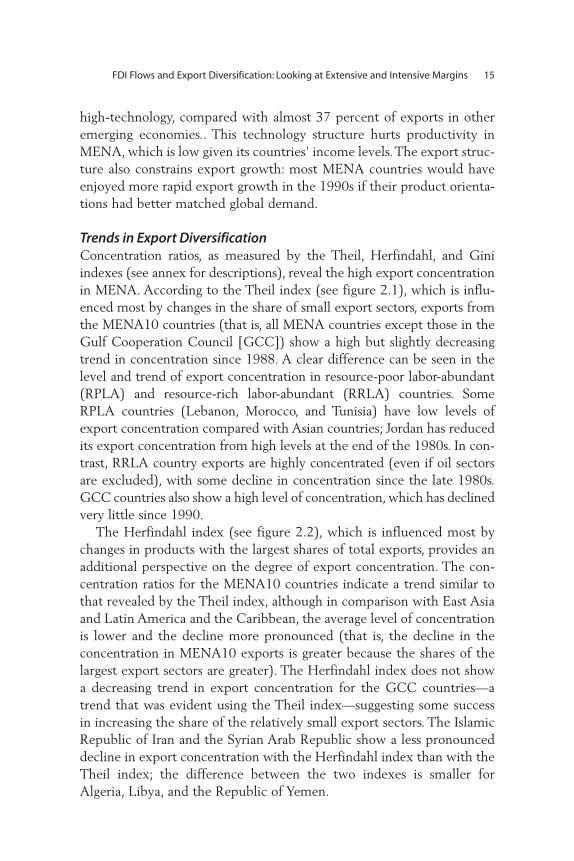
The Herfindahl index (see figure 2.2), which is influenced most bychanges in products with the largest shares of total exports, provides anadditional perspective on the degree of export concentration. The con-centration ratios for the MENA10 countries indicate a trend similar tothat revealed by the Theil index, although in comparison with East Asiaand Latin America and the Caribbean, the average level of concentrationis lower and the decline more pronounced (that is, the decline in theconcentration in MENA10 exports is greater because the shares of thelargest export sectors are greater). The Herfindahl index does not showa decreasing trend in export concentration for the GCC countries—atrend that was evident using the Theil index—suggesting some successin increasing the share of the relatively small export sectors. The IslamicRepublic of Iran and the Syrian Arab Republic show a less pronounceddecline in export concentration with the Herfindahl index than with theTheil index; the difference between the two indexes is smaller forAlgeria, Libya, and the Republic of Yemen.
FDI Flows and Export Diversification: Looking at Extensive and Intensive Margins 15
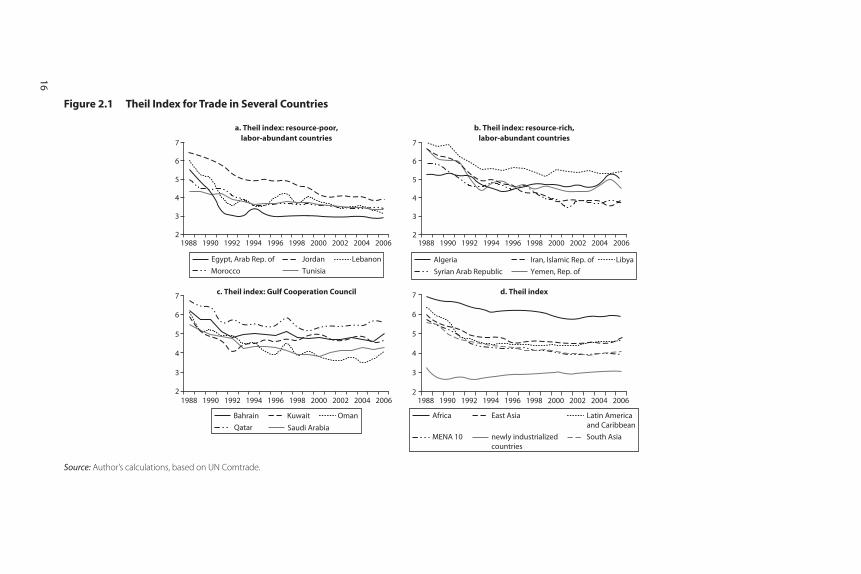
Figure 2.1 Theil Index for Trade in Several Countries
2
3
4
5
6
7
a. Theil index: resource-poor,labor-abundant countries
c. Theil index: Gulf Cooperation Council d. Theil index
b. Theil index: resource-rich,labor-abundant countries
2
3
4
5
6
7
1988 1990 1992 1994 1996 1998 2000 2002 2004 2006 1988 1990 1992 1994 1996 1998 2000 2002 2004 2006
1988 1990 1992 1994 1996 1998 2000 2002 2004 20061988 1990 1992 1994 1996 1998 2000 2002 2004 20062
3
4
5
6
7
2
3
4
5
6
7
Morocco Tunisia
LebanonEgypt, Arab Rep. of Jordan
Qatar Saudi Arabia
OmanKuwaitBahrain
Syrian Arab Republic Yemen, Rep. of
LibyaAlgeria Iran, Islamic Rep. of
Latin Americaand Caribbean
Africa East Asia
newly industrializedcountries
MENA 10 South Asia
Source: Author’s calculations, based on UN Comtrade.
16
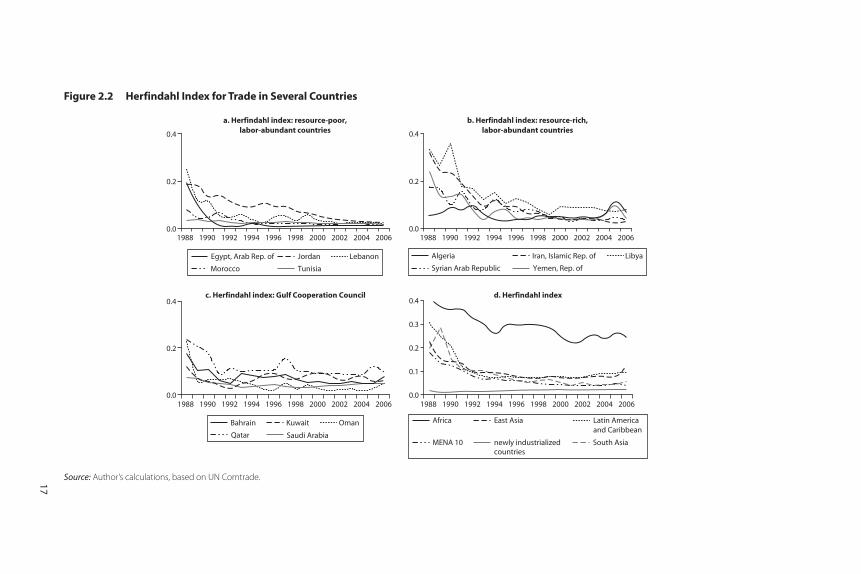
Figure 2.2 Herfindahl Index for Trade in Several Countries
Source: Author’s calculations, based on UN Comtrade.
b. Herfindahl index: resource-rich,labor-abundant countries
0.0
0.2
0.4
a. Herfindahl index: resource-poor,labor-abundant countries
0.0
0.2
0.4
1988 1990 1992 1994 1996 1998 2000 2002 2004 2006 1988 1990 1992 1994 1996 1998 2000 2002 2004 2006
1988 1990 1992 1994 1996 1998 2000 2002 2004 20061988 1990 1992 1994 1996 1998 2000 2002 2004 2006
c. Herfindahl index: Gulf Cooperation Council
0.0
0.2
0.4d. Herfindahl index
0.0
0.1
0.2
0.3
0.4
Morocco Tunisia
LebanonEgypt, Arab Rep. of Jordan
Qatar Saudi Arabia
OmanKuwaitBahrain
Syrian Arab Republic Yemen, Rep. of
LibyaAlgeria Iran, Islamic Rep. of
Latin Americaand Caribbean
Africa East Asia
newly industrializedcountries
MENA 10 South Asia
17
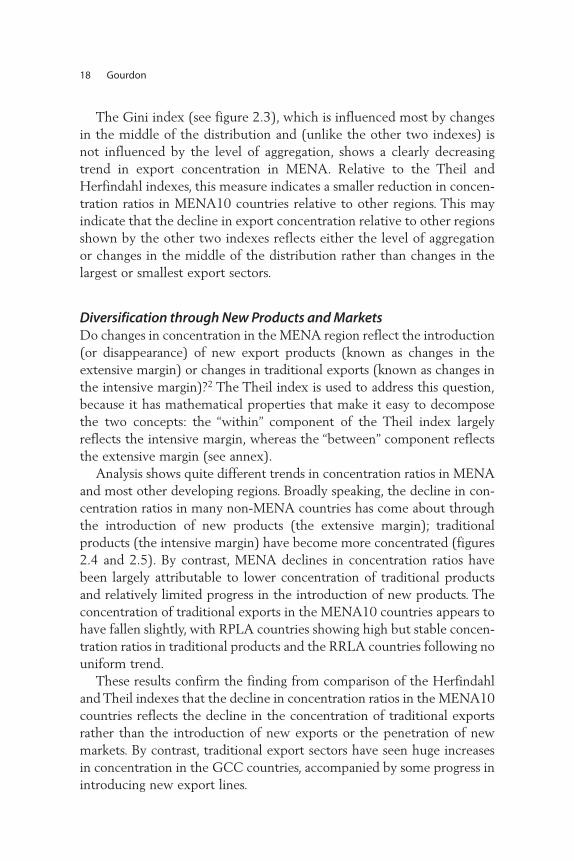
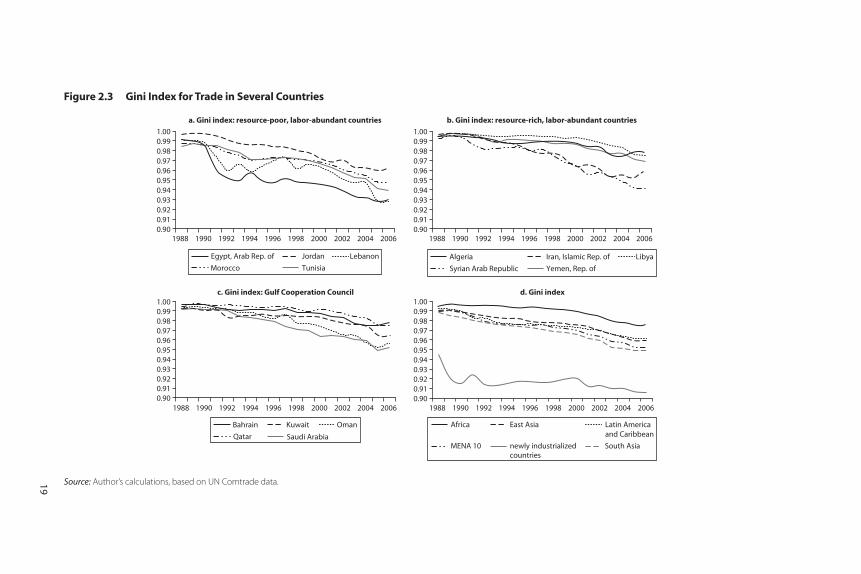
The Gini index (see figure 2.3), which is influenced most by changesin the middle of the distribution and (unlike the other two indexes) isnot influenced by the level of aggregation, shows a clearly decreasingtrend in export concentration in MENA. Relative to the Theil andHerfindahl indexes, this measure indicates a smaller reduction in concen-tration ratios in MENA10 countries relative to other regions. This mayindicate that the decline in export concentration relative to other regionsshown by the other two indexes reflects either the level of aggregationor changes in the middle of the distribution rather than changes in thelargest or smallest export sectors.
Diversification through New Products and MarketsDo changes in concentration in the MENA region reflect the introduction(or disappearance) of new export products (known as changes in theextensive margin) or changes in traditional exports (known as changes inthe intensive margin)?2 The Theil index is used to address this question,because it has mathematical properties that make it easy to decomposethe two concepts: the “within” component of the Theil index largelyreflects the intensive margin, whereas the “between” component reflectsthe extensive margin (see annex).
Analysis shows quite different trends in concentration ratios in MENAand most other developing regions. Broadly speaking, the decline in con-centration ratios in many non-MENA countries has come about throughthe introduction of new products (the extensive margin); traditionalproducts (the intensive margin) have become more concentrated (figures2.4 and 2.5). By contrast, MENA declines in concentration ratios havebeen largely attributable to lower concentration of traditional productsand relatively limited progress in the introduction of new products. Theconcentration of traditional exports in the MENA10 countries appears tohave fallen slightly, with RPLA countries showing high but stable concen-tration ratios in traditional products and the RRLA countries following nouniform trend.
These results confirm the finding from comparison of the Herfindahland Theil indexes that the decline in concentration ratios in the MENA10countries reflects the decline in the concentration of traditional exportsrather than the introduction of new exports or the penetration of newmarkets. By contrast, traditional export sectors have seen huge increasesin concentration in the GCC countries, accompanied by some progress inintroducing new export lines.
18 Gourdon
19
Figure 2.3 Gini Index for Trade in Several Countries
Source: Author’s calculations, based on UN Comtrade data.
b. Gini index: resource-rich, labor-abundant countries
0.900.910.920.930.940.950.960.970.980.991.00
a. Gini index: resource-poor, labor-abundant countries
0.900.910.920.930.940.950.960.970.980.991.00
1988 1990 1992 1994 1996 1998 2000 2002 2004 2006 1988 1990 1992 1994 1996 1998 2000 2002 2004 2006
1988 1990 1992 1994 1996 1998 2000 2002 2004 20061988 1990 1992 1994 1996 1998 2000 2002 2004 2006
c. Gini index: Gulf Cooperation Council
0.900.910.920.930.940.950.960.970.980.991.00
d. Gini index
0.900.910.920.930.940.950.960.970.980.991.00
Morocco Tunisia
LebanonEgypt, Arab Rep. of Jordan
Qatar Saudi Arabia
OmanKuwaitBahrain
Syrian Arab Republic Yemen, Rep. of
LibyaAlgeria Iran, Islamic Rep. of
Latin Americaand Caribbean
Africa East Asia
newly industrializedcountries
MENA 10 South Asia
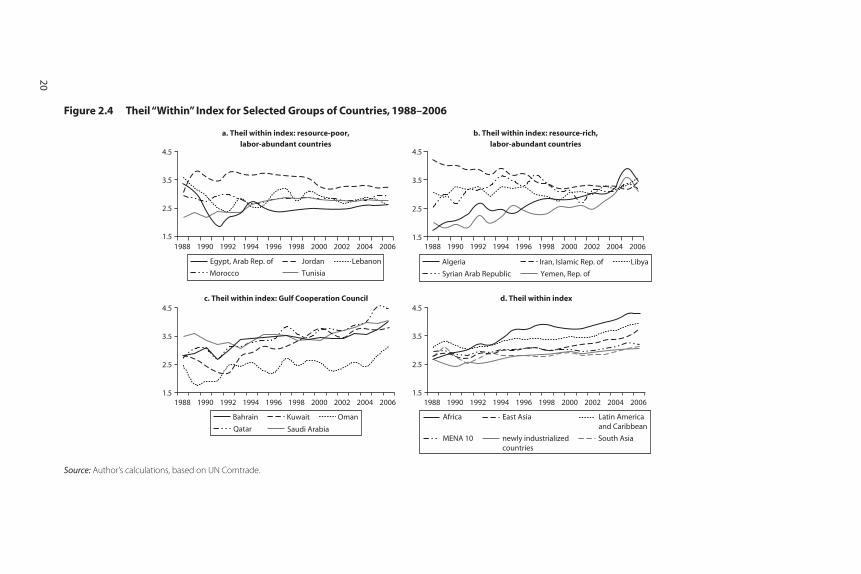
Figure 2.4 Theil “Within” Index for Selected Groups of Countries, 1988–2006
b. Theil within index: resource-rich,labor-abundant countries
1.5
2.5
3.5
4.5
a. Theil within index: resource-poor,labor-abundant countries
1.5
2.5
3.5
4.5
1988 1990 1992 1994 1996 1998 2000 2002 2004 2006 1988 1990 1992 1994 1996 1998 2000 2002 2004 2006
1988 1990 1992 1994 1996 1998 2000 2002 2004 20061988 1990 1992 1994 1996 1998 2000 2002 2004 2006
c. Theil within index: Gulf Cooperation Council
1.5
2.5
3.5
4.5d. Theil within index
1.5
2.5
3.5
4.5
Morocco Tunisia
LebanonEgypt, Arab Rep. of Jordan
Qatar Saudi Arabia
OmanKuwaitBahrain
Syrian Arab Republic Yemen, Rep. of
LibyaAlgeria Iran, Islamic Rep. of
Latin Americaand Caribbean
Africa East Asia
newly industrializedcountries
MENA 10 South Asia
Source: Author’s calculations, based on UN Comtrade.
20

21
Figure 2.5 Theil “Between” Index
b. Theil between index: resource-rich,labor-abundant countries
0
1
2
3
4
5
a. Theil between index: resource-poor,labor-abundant countries
0
1
2
3
4
5
1988 1990 1992 1994 1996 1998 2000 2002 2004 2006 1988 1990 1992 1994 1996 1998 2000 2002 2004 2006
1988 1990 1992 1994 1996 1998 2000 2002 2004 20061988 1990 1992 1994 1996 1998 2000 2002 2004 2006
c. Theil between index: Gulf Cooperation Council
0
1
2
3
4
5d. Theil between index
0
1
2
3
4
5
Morocco Tunisia
LebanonEgypt, Arab Rep. of Jordan
Qatar Saudi Arabia
OmanKuwaitBahrain
Syrian Arab Republic Yemen, Rep. of
LibyaAlgeria Iran, Islamic Rep. of
Latin Americaand Caribbean
Africa East Asia
newly industrializedcountries
MENA 10 South Asia
Source: Author’s calculations, based on UN Comtrade.
The Potential Impact of FDI on Export Diversification
MENA countries cannot rely on their own forces alone: they need todeepen integration with the world to obtain the resources for develop-ment they cannot generate on their own. FDI inflows are expected toincrease a country’s output and productivity, encourage local investment,and stimulate the development and dispersion of technology (Alfaro andothers 2004). Although horizontal FDI (market-seeking investment aimedprimarily at the domestic market in the host country) is most prevalent,vertical FDI (efficiency-seeking investment to minimize global costs) isgrowing, even in MENA countries. This type of FDI is likely to have agreater impact on export diversification (positive or negative), dependingon whether the foreign-owned plant is producing different or similargoods than other exporting firms in the host country.
FDI can lead to diversification of the host country’s exports, directly orindirectly. It can do so directly by entering the nontraditional export sec-tor (because foreign firms possess certain ownership advantages thatmake them more capable of exporting than domestic firms) or indirectly(by increasing exports of traditional exports with the lowest share).
Trends in FDI InflowsUntil recently, MENA countries were not very successful in attracting FDI.Net FDI inflows to MENA stagnated between 1985 and 1999, a periodduring which FDI inflows as a percentage of GDP grew sixfold in mostother regions (Chan and Gemayel 2004). Many MENA countries sharedsimilar characteristics that deter FDI, including political instability, therestriction of FDI to a few sectors, the requirement that foreign firms workwith local partners and hold only a minority ownership stake, and the rel-atively slow pace of privatization (Eid and Paua 2003). Other factors thatcontributed to low FDI flows in several MENA countries included heavyreliance on oil, government monopolization of the oil sector, and appreci-ated exchange rates, which discourage manufacturing activity; weak infra-structure; state dominance of the economy; low level of integration withthe world; underdeveloped financial and capital markets; underdevelopedinstitutions; and low rates of return on human and physical capital (Bashirand Hassan 2002; Makdisi, Fattah, and Liman 2002).
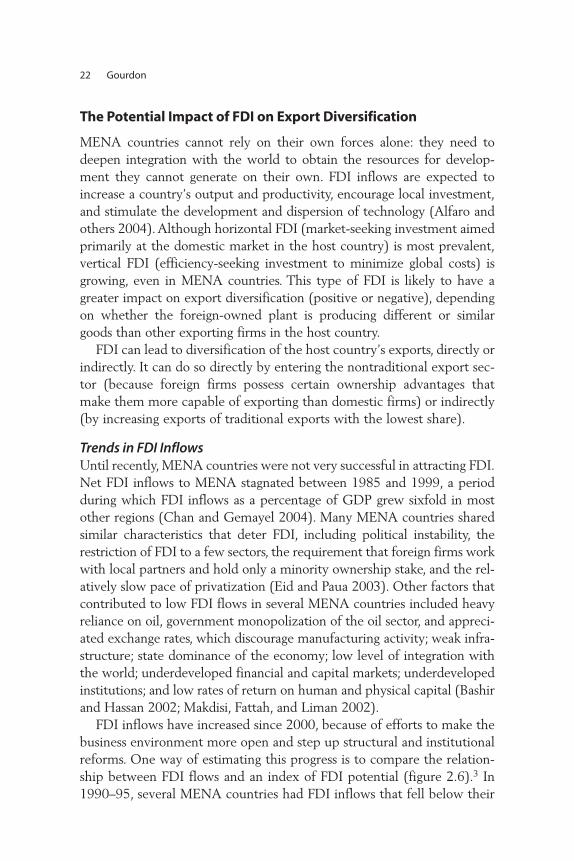
FDI inflows have increased since 2000, because of efforts to make thebusiness environment more open and step up structural and institutionalreforms. One way of estimating this progress is to compare the relation-ship between FDI flows and an index of FDI potential (figure 2.6).3 In1990–95, several MENA countries had FDI inflows that fell below their
22 Gourdon

potential (those above the 45 degree line in figure 2.4); by 2000–05,almost all MENA countries’ FDI inflows exceeded their potential (insome GCC countries, FDI inflows remain below their potential levels).Jordan and Lebanon among RPLA countries and Iran and Algeria amongRRLA countries enjoyed particularly high levels of FDI.
Impact of FDI on Export Diversification The impact of FDI on export diversification is a priori ambiguous. If FDIis directed mainly to the exploitation of natural resources, it should leadto a more concentrated output and export structure. This may be the case
FDI Flows and Export Diversification: Looking at Extensive and Intensive Margins 23
Figure 2.6 Actual and Potential FDI Flows in Selected Countries, 1990–95 and 2000–05
Source: Author’s calculations based on UNCTAD Investment Report and WDI.
EGYJORLBN
MAR
TUNDZA
IRN
SYRYEM
BHR
KWT OMN
SAU
DEU
a. 1990–95
b. 2000–05
ESP
FRA
GBR
GRC
ITA
NLD
PRT
ARGBRA
CHN
IND
MEX
MYSTHA
TUR
0.1
0.2
0.3
0.4
0.5
po
ten
tial
FD
I (U
NC
TAD
)
16 18 20 22 24
FDI net inflows, log
EGY
JORLBN
MAR
TUNDZA
IRN
SYRYEM
BHR
KWT
OMN
SAU
DEU
ESP
FRA
GBR
GRC ITA
NLD
PRT
ARG BRA
CHN
IND
MEX
MYS
THA
TUR
0.1
0.2
0.3
0.4
0.5
po
ten
tial
FD
I (U
NC
TAD
)
16 18 20 22 24 26
FDI net inflows, log
23
24 Gourdon
for oil-exporting countries in the sample (that is, the RRLA and GCCcountries). Alternatively, foreign firms may invest in order to serve themarket in the host country (referred to as market-seeking or horizontalFDI). Here the impact on export concentration should be nil or even neg-ative if domestic costs rise as a consequence of the foreign capital inflows(Aizenman and Marion 2004).
Firms also undertake FDI to reduce production costs (referred to as efficiency-seeking or vertical FDI), where output is often produced for over-seas markets. This form of FDI often increases export diversification indeveloping countries, for several reasons. First, if the foreign-owned plantproduces export products that differ from those of other exporting firms inthe host country, efficiency-seeking FDI will affect the composition of theexport bundle. Because vertical FDI is often used to establish integrated,cross-border production chains in products that otherwise could not be pro-duced in the host country, export diversification may rise. Second, foreignfirms often possess certain ownership advantages—such as higher levels oftechnological skills, better marketing skills, and international orientation—that make them more capable of exporting than domestic firms in the sameindustry. Third, firms in some sectors find it difficult to export because ofhigh fixed costs (the costs of informing potential customers in the globaleconomy, for example, or meeting standards set in importing markets). FDIin these sectors can reduce these costs. Because such sectors tend to havelimited or no exports, FDI leads to diversification of exports.
The evidence on the importance of these different types of FDI, andtherefore the impact of FDI on export diversification, is mixed. Surveysindicate that access to domestic markets is an important motivation for for-eign investment in MENA (table 2.1). The second-most-cited motive forinvestment is proximity to markets and customers, which could refer eitherto the host country or to neighboring countries. The European Union andSub-Saharan Africa are both relatively accessible from MENA, and MENAis increasingly playing a role in trade to both regions (World Bank 2009).Because market-seeking FDI is often directed to countries with high tradebarriers and barriers to trade have been declining in MENA (especially inRPLA countries), this form of FDI may be becoming less important.
The impact of FDI on export diversification varies within the region.Studies emphasize the importance of low wages in making the regioncompetitive (Iqbal and Nabli 2004). This would suggest the potential forefficiency-seeking (vertical) FDI in the region, at least in RPLA countries,that might affect the structure of exports. The impact of FDI throughownership advantages of foreign investors may be particularly important

in host countries in which several sectors have to be discovered, which isthe case for RPLA and particularly RRLA countries. The role of FDI inreducing fixed costs is likely to be particularly important in countries thathave already discovered several export sectors but have not fully devel-oped them (for example, RPLA countries). Egypt and Syria have largemarkets and expanding manufacturing sectors, providing incentives forFDI in the manufacturing sector (for export or domestic production). Inthe GCC countries, the expanding service sector is a significant determi-nant of FDI. It may therefore be more difficult to observe the impact ofFDI on the export structure of manufacturing for these countries.
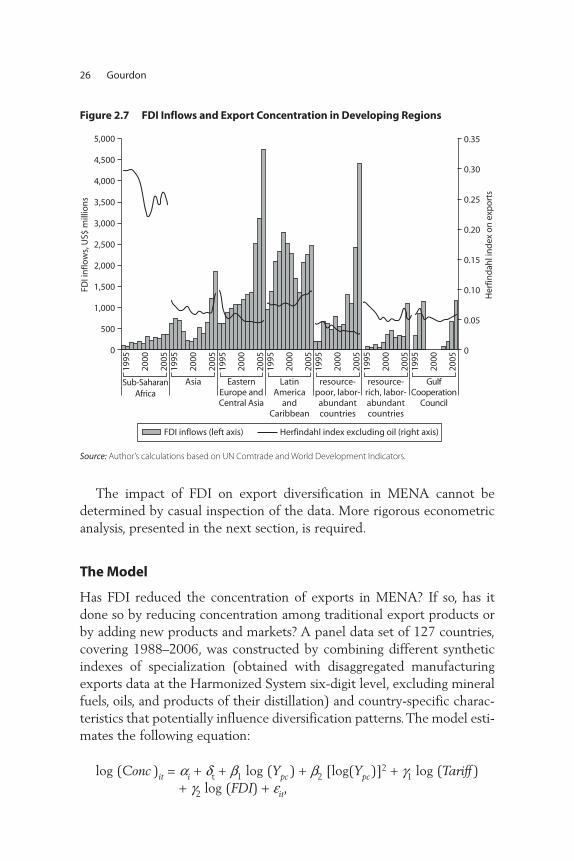
Simple observation of the data reveals that MENA countries experi-enced some decline in export concentration (measured by the Herfindahlindex) between 1995 and 2005, when net FDI inflows were rising(figure 2.7). This is most pronounced for RPLA countries, where therise in FDI took off from a very low level. Net FDI inflows for GCCcountries are variable, in part because these countries have significantFDI outflows. The confluence of declining export concentration and ris-ing FDI is also seen in Sub-Saharan Africa and Eastern Europe andCentral Asia. In Asia and in Latin America and the Caribbean, this rela-tionship is less clear. Nevertheless, there is a large variation in FDIinflows and export concentration across countries, both within MENAand in other regions.
FDI Flows and Export Diversification: Looking at Extensive and Intensive Margins 25
Table 2.1 Motives behind Foreign Direct Investment in theMiddle East and North Africa Percentage of respondents citing
Domestic market growth potential 27Proximity to markets or customers 25Finance incentives or taxes or funding 8Infrastructure and logistics 8Lower costs 6Attractiveness and quality of life 6Information and communications infrastructure 4Investment promotion agency or government
support 4Regulations or business climate 4Skilled workforce availability 2Natural resources 2Industry cluster and critical mass 2
Source: OCO Monitor data 2007.
26 Gourdon
Figure 2.7 FDI Inflows and Export Concentration in Developing Regions
Source: Author’s calculations based on UN Comtrade and World Development Indicators.
0
500
1,000
1,500
2,000
2,500
3,000
3,500
4,000
4,500
5,000
1995
2000
2005
1995
2000
2005
1995
2000
2005
1995
2000
2005
1995
2000
2005
1995
2000
2005
1995
2000
2005
Sub-SaharanAfrica
Asia EasternEurope andCentral Asia
resource-poor, labor-abundantcountries
resource-rich, labor-abundantcountries
GulfCooperation
Council
LatinAmerica
andCaribbean
FDI i
nflo
ws,
US$
mill
ion
s
0
0.05
0.10
0.15
0.20
0.25
0.30
0.35
Her
find
ahl i
nd
ex o
n e
xpo
rts
FDI inflows (left axis) Herfindahl index excluding oil (right axis)
The impact of FDI on export diversification in MENA cannot bedetermined by casual inspection of the data. More rigorous econometricanalysis, presented in the next section, is required.
The Model
Has FDI reduced the concentration of exports in MENA? If so, has itdone so by reducing concentration among traditional export products orby adding new products and markets? A panel data set of 127 countries,covering 1988–2006, was constructed by combining different syntheticindexes of specialization (obtained with disaggregated manufacturingexports data at the Harmonized System six-digit level, excluding mineralfuels, oils, and products of their distillation) and country-specific charac-teristics that potentially influence diversification patterns. The model esti-mates the following equation:
log (Conc )it = ai + dt + b1 log (Ypc ) + b2 [log(Ypc)]2 + g1 log (Tariff )
+ g2 log (FDI) + eit,
where Concit is the concentration index of export concentration for coun-try i at time t; Ypc is GDP per capita; Tariff is the share of import dutieson total imports; FDI is FDI inflows in dollars; ai represents fixed coun-try effects; and dt represents time effects.
Export concentration is measured by the Herfindahl, Theil, and Giniindexes. The impact of changes in per capita GDP on diversification maydepend on the level of income. According to Imbs and Wacziarg (2003),when income rises, the opportunities for risk diversification increasethrough sectorally diversified investment. On the consumption side,nonhomothetic preferences push in the same direction. However, asincome grows beyond some threshold, the impetus to diversificationdeclines: richer economies tend to be economically and institutionallymore stable, which reduces business risks and thus the need for diversi-fication, while economies of scale may push toward greater specializa-tion. Nevertheless, rich economies are characterized by higher totalfactor productivity and a better business climate, so that entrepreneursmay have greater opportunities to broaden their productive mix. Thus,the impact of per capita income on diversification is an empirical mat-ter. Imbs and Wacziarg (2003) find that per capita income growth has apositive impact on diversification for countries with low incomes, butthat at relatively high per capita income levels, further growth in incomeis related to greater concentration.
The level of tariffs reflects, among other things, a country’s competi-tiveness and its integration in international markets. Its impact on diver-sification is ambiguous. Low tariffs that improve productivity may facilitatethe development of new lines of production, thus boosting diversification,or enable the exploitation of increasing returns to scale, thus reducingdiversification (Martincus and Estevadeordal 2005). A study by the WorldBank (2009) finds that tariff protection is a major obstacle to exportdiversification in MENA countries.
FDI refers to net FDI inflows in dollars. Other studies have used otherdefinitions, including the ratio of FDI to GDP and FDI per capita (theprecise concept used is not always clear). Different concepts can have dif-fering implications for policy and the validity of empirical studies. A highFDI/GDP ratio may not be desirable, because of the risks of dependencyand impaired sovereignty. Moreover, GDP and the size of the populationcan influence the extent of export diversification. Thus, if the dependentvariable is the ratio of FDI to GDP (or population), it may be difficult tomeasure the separate effects on export diversification of FDI and GDP(or population).
FDI Flows and Export Diversification: Looking at Extensive and Intensive Margins 27
A dummy variable for the time trend is included to pick up the impactof the growth of world trade over time. The impact of world trade growthon diversification is ambiguous: the availability of a larger number of finalgoods through imports could promote specialization of domestic produc-tion and export, or the increase in the bundle of intermediate goods avail-able through trade could encourage the production and exports of newdomestic goods, thus increasing diversification.
The model includes several additional variables, which control for theinfluence on diversification of factors that are not the primary goals ofthe study:
• Access to credit, the quality of infrastructure, and the gross investmentratio are indicators of macroeconomic efficiency that enhance thegrowth prospects of firms (the implications for export diversificationremain an open theoretical question).
• The size of GDP and population are included because larger countriestend to have more diversified economic structures. Krugman (1981)and Helpman and Krugman (1985) argue that market size directly affects the degree of product differentiation. Models of monopolisticcompetition imply that larger countries can produce a wider range ofproducts. Hummels and Klenow (2005) find that economic size ispositively related to the degree of specialization.
• The distance from major markets (New York, Rotterdam, and Tokyo)and the climate zone (latitude) are included as proxies for transportcosts that may affect a country’s ability to diversify. Economic geogra-phers (Amiti and Venables 2002; Venables and Limao 2002) suggestthat proximity to world markets and other geographical characteris-tics are important in determining economic structure. The influenceof distance on trade has been shown through the long empirical tradi-tion of gravity models (Deardorff 1984; Brun and others 2005).
• A measure of spatial correlation captures the impact of proximityto potential trade partners. Spatial correlation may affect trade pat-terns because countries in close proximity may share a common institutional framework (as a result of “cultural spillovers” and inte-gration agreements) (Greene 2008). Each country’s specializationpattern is assumed to depend substantially on the degree of special-ization of other countries. This influence is more pronounced in geographically closer countries. An index was constructed using a
28 Gourdon

spatial weighing scheme using a symmetric matrix W (N × N) withelements wij (i and j refer to single countries).4 This index yields thefollowing formula:5
Estimating the impact on FDI of distance to market, lack of access tothe sea (landlocked), and latitude, which are invariant over time, pres-ents an econometric challenge. The problem is that one of these fixedeffects will pick up the impact of all variables that are time invariant.The equation could be estimated using random effects, but doing sowould assume that all explanatory variables are uncorrelated with theindividual specific effects, which is unrealistic. A Hausman test run afterthe random-effects estimation always rejects the hypothesis of no corre-lation between individual effects and some explanatory variable, such asGDP per capita and population. Moreover, the Breush-Pagan test showsthat random effects are not heteroscedastic, whatever concentrationindex is used.
The Hausman-Taylor estimator allows time-invariant effects to be esti-mated without imposing the strong assumption that all variables areuncorrelated with individual specific effects. The main challenge in thisestimator is determining which of the variables are correlated with indi-vidual specific effects and which are not. Based on the Hausman test, GDPper capita, population, infrastructure, and spatial correlation of specializa-tion are considered endogenous variables (that is, possibly correlated withother political, social, historical, cultural, or economic aspects not includedin the model and captured by the individual specific effects).
Empirical ResultsThe dependent variables are the three concentration indexes, with the Theilindex decomposed between its within (intensive margin) and between(extensive margin) components. The independent variables include percapita income, tariffs, and FDI, plus fixed time and country dummies.
As expected, the impact of per capita income on export concentrationfollows a U-shaped pattern, declining first as a function of income and ris-ing afterward (as shown by the negative sign on the level of per capitaincome and the positive sign on the level of per capita income squared).Second, tariffs have a positive impact on the level of concentration. At
Spat W SpecCorr ij jt
j
N
it=
=∑
1
FDI Flows and Export Diversification: Looking at Extensive and Intensive Margins 29
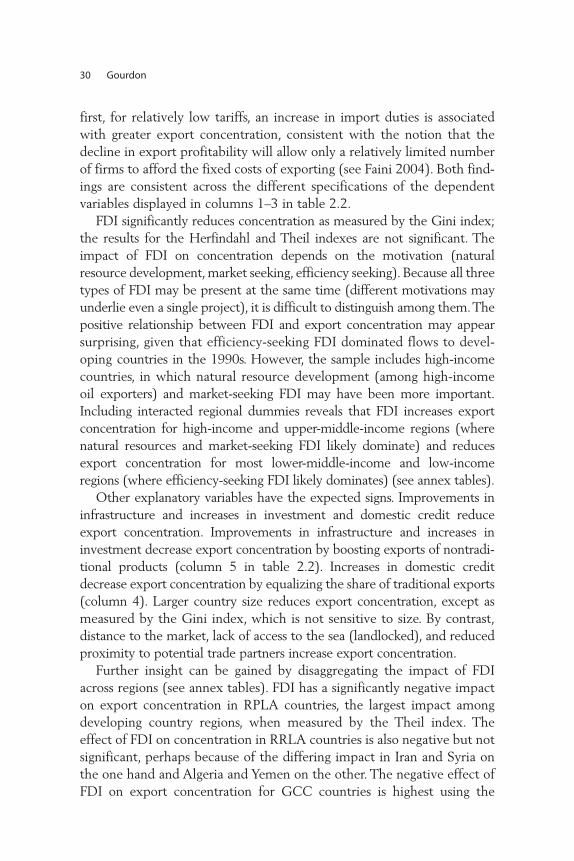
first, for relatively low tariffs, an increase in import duties is associatedwith greater export concentration, consistent with the notion that thedecline in export profitability will allow only a relatively limited numberof firms to afford the fixed costs of exporting (see Faini 2004). Both find-ings are consistent across the different specifications of the dependentvariables displayed in columns 1–3 in table 2.2.
FDI significantly reduces concentration as measured by the Gini index;the results for the Herfindahl and Theil indexes are not significant. Theimpact of FDI on concentration depends on the motivation (naturalresource development, market seeking, efficiency seeking). Because all threetypes of FDI may be present at the same time (different motivations mayunderlie even a single project), it is difficult to distinguish among them. Thepositive relationship between FDI and export concentration may appearsurprising, given that efficiency-seeking FDI dominated flows to devel-oping countries in the 1990s. However, the sample includes high-incomecountries, in which natural resource development (among high-incomeoil exporters) and market-seeking FDI may have been more important.Including interacted regional dummies reveals that FDI increases exportconcentration for high-income and upper-middle-income regions (wherenatural resources and market-seeking FDI likely dominate) and reducesexport concentration for most lower-middle-income and low-incomeregions (where efficiency-seeking FDI likely dominates) (see annex tables).
Other explanatory variables have the expected signs. Improvements ininfrastructure and increases in investment and domestic credit reduceexport concentration. Improvements in infrastructure and increases ininvestment decrease export concentration by boosting exports of nontradi-tional products (column 5 in table 2.2). Increases in domestic creditdecrease export concentration by equalizing the share of traditional exports(column 4). Larger country size reduces export concentration, except asmeasured by the Gini index, which is not sensitive to size. By contrast,distance to the market, lack of access to the sea (landlocked), and reducedproximity to potential trade partners increase export concentration.
Further insight can be gained by disaggregating the impact of FDIacross regions (see annex tables). FDI has a significantly negative impacton export concentration in RPLA countries, the largest impact amongdeveloping country regions, when measured by the Theil index. Theeffect of FDI on concentration in RRLA countries is also negative but notsignificant, perhaps because of the differing impact in Iran and Syria onthe one hand and Algeria and Yemen on the other. The negative effect ofFDI on export concentration for GCC countries is highest using the
30 Gourdon
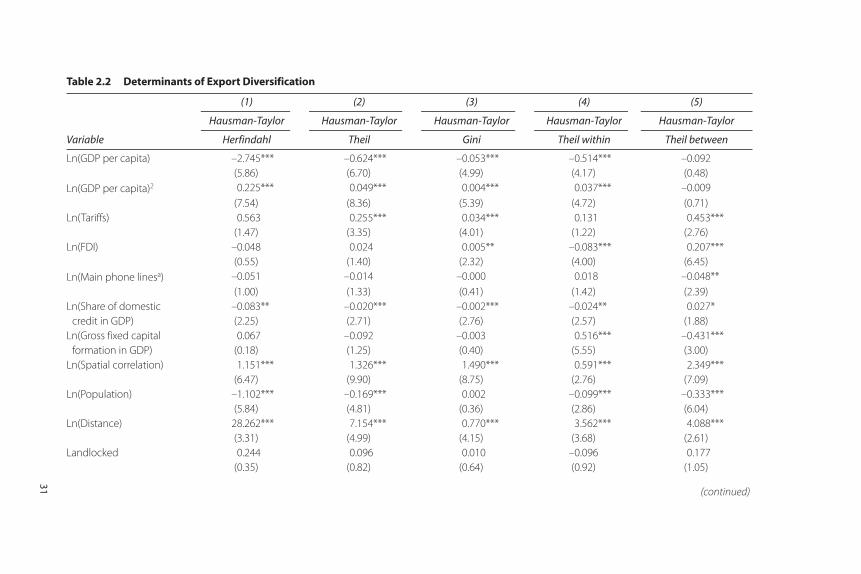
31
Table 2.2 Determinants of Export Diversification
Variable
(1) (2) (3) (4) (5)
Hausman-Taylor Hausman-Taylor Hausman-Taylor Hausman-Taylor Hausman-Taylor
Herfindahl Theil Gini Theil within Theil between
Ln(GDP per capita) –2.745*** –0.624*** –0.053*** –0.514*** –0.092 (5.86) (6.70) (4.99) (4.17) (0.48)
Ln(GDP per capita)2 0.225*** 0.049*** 0.004*** 0.037*** –0.009 (7.54) (8.36) (5.39) (4.72) (0.71)
Ln(Tariffs) 0.563 0.255*** 0.034*** 0.131 0.453*** (1.47) (3.35) (4.01) (1.22) (2.76)
Ln(FDI) –0.048 0.024 0.005** –0.083*** 0.207*** (0.55) (1.40) (2.32) (4.00) (6.45)
Ln(Main phone linesa) –0.051 –0.014 –0.000 0.018 –0.048** (1.00) (1.33) (0.41) (1.42) (2.39)
Ln(Share of domestic credit in GDP)
–0.083** (2.25)
–0.020*** (2.71)
–0.002*** (2.76)
–0.024** (2.57)
0.027* (1.88)
Ln(Gross fixed capital formation in GDP)
0.067 (0.18)
–0.092 (1.25)
–0.003 (0.40)
0.516*** (5.55)
–0.431*** (3.00)
Ln(Spatial correlation) 1.151*** 1.326*** 1.490*** 0.591*** 2.349*** (6.47) (9.90) (8.75) (2.76) (7.09)
Ln(Population) –1.102*** –0.169*** 0.002 –0.099*** –0.333*** (5.84) (4.81) (0.36) (2.86) (6.04)
Ln(Distance) 28.262*** 7.154*** 0.770*** 3.562*** 4.088*** (3.31) (4.99) (4.15) (3.68) (2.61)
Landlocked 0.244 0.096 0.010 –0.096 0.177 (0.35) (0.82) (0.64) (0.92) (1.05)
(continued)
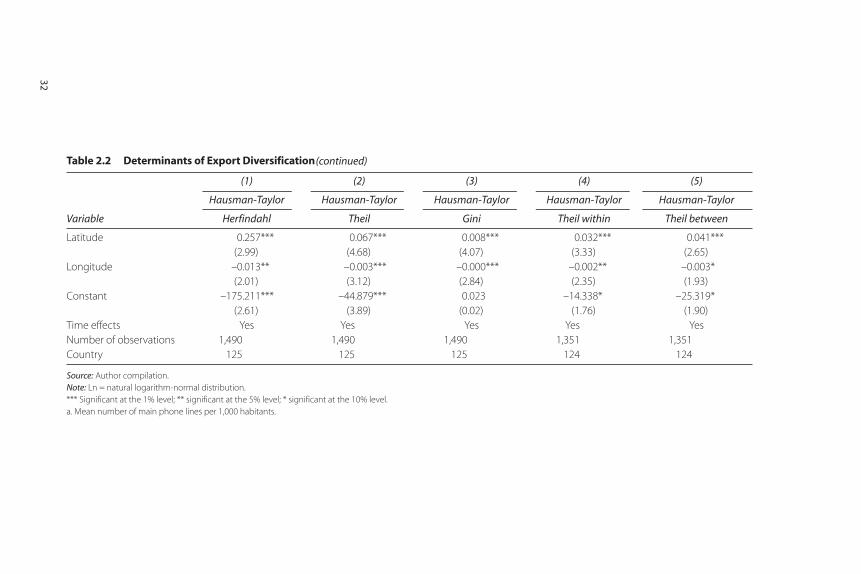
32
Table 2.2 Determinants of Export Diversification
Variable
(1) (2) (3) (4) (5)
Hausman-Taylor Hausman-Taylor Hausman-Taylor Hausman-Taylor Hausman-Taylor
Herfindahl Theil Gini Theil within Theil between
Latitude 0.257*** 0.067*** 0.008*** 0.032*** 0.041*** (2.99) (4.68) (4.07) (3.33) (2.65)
Longitude –0.013** –0.003*** –0.000*** –0.002** –0.003* (2.01) (3.12) (2.84) (2.35) (1.93)
Constant –175.211*** –44.879*** 0.023 –14.338* –25.319* (2.61) (3.89) (0.02) (1.76) (1.90)
Time effects Yes Yes Yes Yes YesNumber of observations 1,490 1,490 1,490 1,351 1,351Country 125 125 125 124 124
Source: Author compilation.Note: Ln = natural logarithm-normal distribution.*** Significant at the 1% level; ** significant at the 5% level; * significant at the 10% level. a. Mean number of main phone lines per 1,000 habitants.
(continued)

Herfindahl index; and it is not significant with the Theil index, suggestingthat FDI led to diversification by decreasing the share of the larger sec-tors rather than increasing the share of the smaller export sectors. Whenconcentration is measured by the Gini index, Sub-Saharan Africa, SouthAsia, and some countries in Latin America and the Caribbean show astronger negative effect.
The impact of FDI on concentration can be disaggregated into theimpact on existing product lines (the within component of the Theilindex) and new product lines (the between component of the Theilindex) (figure 2.8). For the full sample, FDI appears to reduce export con-centration by equalizing the shares of existing product lines (column 5 intable 2.2) and to increase concentration by increasing the share of tradi-tional products relative to new products. Trade barriers significantly raiseexport concentration by impeding the development of new products andmarkets rather than by equalizing the shares of traditional exports.
FDI reduces export concentration in RPLA countries by equalizing theshares of traditional exports (as in South Asia). In RRLA countries, FDIreduces concentration by boosting new exports (as in Sub-Saharan Africa).The nonsignificant FDI coefficient for the within component for RRLAmay reflect the diversity among these countries. In high-income countries,FDI tends to reduce the share of new products, which are potentially lessand less important for already diversified countries, and to diversify exportvalues among traditional exports. For countries in East Asia and Pacific, FDIincreases export concentration along both extensive and intensive margins.
Robustness A potential problem is that FDI and GDP per capita may be endoge-nous (that is, in part determined by export concentration, the depend-ent variable). If this is the case, their coefficients will be biased. Aninstrumental variable procedure is adopted to control for the possibleendogeneity of FDI, using the FDI potential index, as computed by theUnited Nations Conference on Trade and Development (UNCTAD), asan instrument. Although the results obtained are the same as in the firsttwo estimations, the usual tests reject the instrumentation. Moreover,the model includes no valid instrument for GDP. A generalizedmoments method estimator is therefore used, which yields essentiallythe same results (see annex table 2.A.2).
To check the robustness of the results to other definitions of tradi-tional versus nontraditional export products, one could order theexport product shares from smallest to largest and define traditional
FDI Flows and Export Diversification: Looking at Extensive and Intensive Margins 33
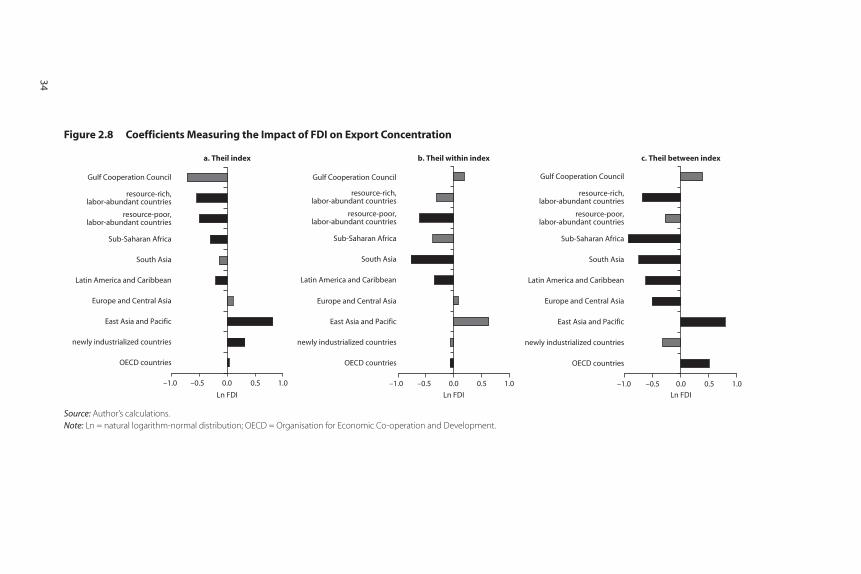
Source: Author’s calculations.Note: Ln = natural logarithm-normal distribution; OECD = Organisation for Economic Co-operation and Development.
Figure 2.8 Coefficients Measuring the Impact of FDI on Export Concentration
a. Theil index
–1.0 –0.5 0.0
Ln FDI Ln FDI Ln FDI
0.5 1.0 –1.0 –0.5 0.0 0.5 1.0 –1.0 –0.5 0.0 0.5 1.0
OECD countries
newly industrialized countries
East Asia and Pacific
Europe and Central Asia
Latin America and Caribbean
South Asia
Sub-Saharan Africa
resource-poor,labor-abundant countries
resource-rich,labor-abundant countries
Gulf Cooperation Council
OECD countries
newly industrialized countries
East Asia and Pacific
Europe and Central Asia
Latin America and Caribbean
South Asia
Sub-Saharan Africa
resource-poor,labor-abundant countries
resource-rich,labor-abundant countries
Gulf Cooperation Council
OECD countries
newly industrialized countries
East Asia and Pacific
Europe and Central Asia
Latin America and Caribbean
South Asia
Sub-Saharan Africa
resource-poor,labor-abundant countries
resource-rich,labor-abundant countries
Gulf Cooperation Council
b. Theil within index c. Theil between index
34

goods as the top half of the distribution and nontraditional goods asthe bottom half. A problem with this approach is that it cannotaccount for goods that switch categories. A second possibility wouldbe to consider the goods that make up the top 95 percent of exportshares as traditional exports and the bottom 5 percent as nontradi-tional. A problem with this approach is that it would not identifyproducts that are really new. A third idea would be to define nontra-ditional export products as “discoveries” (as in Klinger and Lederman2004). We adopt this approach, identifying as nontraditional exportsproducts whose exports exceeded $1 million in 2003–06 and totaledless than $10,000 in 1990–93.
All of these approaches yield essentially the same results (seeannex table 2.A.3): FDI reduces concentration through the withincomponent of the Theil index (the intensive margin) but increasesconcentration through the between component (the extensive mar-gin); high tariffs increase concentration by impeding the develop-ment of the extensive margin; and infrastructure, investment, anddomestic credit reduce concentration. The only difference concernsthe impact of GDP per capita on concentration: In the extendedmodel, the relationship between GDP per capita and export concen-tration as defined by the between component of the Theil index wasnot significant. By contrast, when nontraditional exports are definedusing the approach in Klinger and Lederman (2004), the relationshipbetween GDP per capita and export concentration follows an invertedU-shaped curve. Using the two other approaches yields the expectedU-shaped curve.
Conclusions
Export concentration in MENA has declined over time. The changereflects some decrease in the concentration among sectors that initiallyhad the highest shares of exports; reductions in the share of products thatinitially had the highest share of exports; and some rise in the share ofproducts that were initially small or nonexistent, indicating some successin the development of new export product lines.
The results of an econometric model suggest that removing impedi-ments to FDI has been an efficient means of improving export diversifi-cation for resource-poor countries in the region. Removal of impedimentsto FDI should be intensified in resource-abundant countries, to determinewhether it has a significant and efficient effect there as well.
FDI Flows and Export Diversification: Looking at Extensive and Intensive Margins 35
FDI has helped new export sectors but not small traditional export sec-tors. Future research should try to determine whether the failure of thesesectors to attract FDI reflects their lack of competitiveness. FDI flows havenot succeeded in developing new exports in the GCC countries.
Annex
Indicators of Export Diversification
This annex describes three indexes used to measure export diversifica-tions. It decomposes one of them, the Theil index, into two components.
The Herfindahl and Theil IndexesThe Herfindahl index is a flow-weighted concentration index, whichimplies that it can be decomposed according to the shares of total flows ofeach group. The weight given to each group depends on the trade share ofeach group. The Herfindahl index is normalized to range between 0 and 1:
(2.A.1)
where is the share of export line k in total exports, and n is the numberof export lines (5,012 in HS6).
The Theil entropy coefficient (T) is also a flow-weighted concentrationindex. It is given by
(2.A.2)
where The main difference between H and T is that H is a
convex function on the shares of total export flows and T is a concavefunction on the shares.
The Herfindahl index emphasizes the importance of larger export sec-tors by assigning a greater weight to them than to smaller export sectors. Itgives almost no weight to export sectors with very small proportions oftotal exports. The Theil index assigns higher weight to those export sectors.This implies that the Herfindahl index is influenced more by changes in the
x
x
n
k
k
n
= =∑
1 .
T1
1n ,1
= ⎛⎝⎜
⎞⎠⎟
=∑n
xx
xx
k
k
n
k
H
1/
1 1/,
2
=−
−
∑( )s n
n
k
k
36 Gourdon
share of large export sectors, whereas the Theil index is influenced more bychanges in the share of small export sectors.
Comparison of the evolution of these two indexes may yield someimportant information on which export sectors (small or large) haveexperienced changes in their shares. If, for example, T is relatively con-stant through time and H increases, the increase in concentration occursmainly within the group of export sectors that have a large share of totalexport flows. In this sense, the concave property of T may be of particu-lar interest for studying the evolution of export sectors that have smallershares of total export flows.
The within component of the Theil index captures the concentrationof exports. When the mean value of exports goes up for a country, thewithin component of Theil’s index goes down mechanically, even if allgroups are unaffected. Because traditional products account for at least95 percent of all products and the means of traditional and new prod-ucts do not differ greatly, the within component is largely dominated bythe index of the traditional products group. This index is therefore usedas a (more intuitive) approximation of the within index. If diversifica-tion is mostly along the intensive margin, individual export values con-verge, largely among traditional products, which on average account for99 percent of all active export lines (for example, all exports are at anindustrial scale).
Action along the extensive margin will be reflected only in thebetween component of the index. Unlike the within component, thebetween component does not involve individual values; it is a function ofgroup means and sizes only. It is zero when average export values areequal across all groups, irrespective of their distribution inside groups, andpositive if, and only if, group means differ. If diversification occurs mostlyat the extensive margin, convergence occurs in average export valuesacross groups. Two effects may contribute to this convergence. First, asmore product lines become active in exports, the size of the group ofinactive export lines shrinks; because this group has a very differentmean from the other group, its shrinkage mechanically reduces thebetween component. Second, new products are launched at higher levels,approaching that of traditional ones.
The main shortcoming of the Herfindahl and Theil entropy indexes forthe research presented here is that they are sensitive to the number ofobservations. Although this may be a desirable property, it may be mis-leading here, because the number of products also varies with the avail-ability of data.
FDI Flows and Export Diversification: Looking at Extensive and Intensive Margins 37
The Gini IndexThe Gini index is not sensitive to the number of observations: regardless ofthe number of sectors in the sample, a change in the number of sectors doesnot affect the value of the indicator. Brown’s formula is used: for eachcountry and year, the sample is sorted by export lines, indexed by k, byincreasing order of trade value x, so that xk < xk + 1. Cumulative export
shares are . Cumulative shares in the number of export
lines are simply k/n. Brown’s formula for the Gini coefficient is then
(2.A.3)
The weight granted to each product line in the Gini coefficientdepends on its rank and not its absolute value. Consequently, the Ginicoefficient translates a function sensitive to variation in rank more than tothe variations of export share. If the share of an export sector increasesbut does not lead to a progression in the ranking of the export sectors, itwill not be fully translated in the index.
Gini coefficients are very high, corresponding to Lorenz curves thatare almost right angles. The reason has to do with the level of disaggre-gation rather than any conceptual difference between trade, produc-tion, and employment shares. At that level of disaggregation, there area large number of product lines with small trade values, a relativelylimited number of which account for the bulk of all countries’ trade(especially in developing countries but also for industrial ones). Thus,the data include a large number of economically irrelevant observa-tions, and economically important categories in machinery, vehicles,computer equipment, and other industries are lumped together in“mammoth” lines. High Gini indexes are thus to be expected for allcountries. (The interest here is in the evolution of the Gini index, notits level.)
Decomposition of the Theil IndexFollowing Cadot, Carrère, and Strauss-Kahn (forthcoming), let us nowlook at concentration measures within and between three groups of prod-ucts indexed by j (each group being country specific): traditional prod-ucts (products exported by the country for at least two years), newproducts (products that were not active in the country’s export trade in
G 1 / .1
= − −( ) −( )( )−
=∑ X X k nk k
k
n
1 2 1
X x xk l
l
k
l
l
n
== =
∑ ∑1 1
/
38 Gourdon
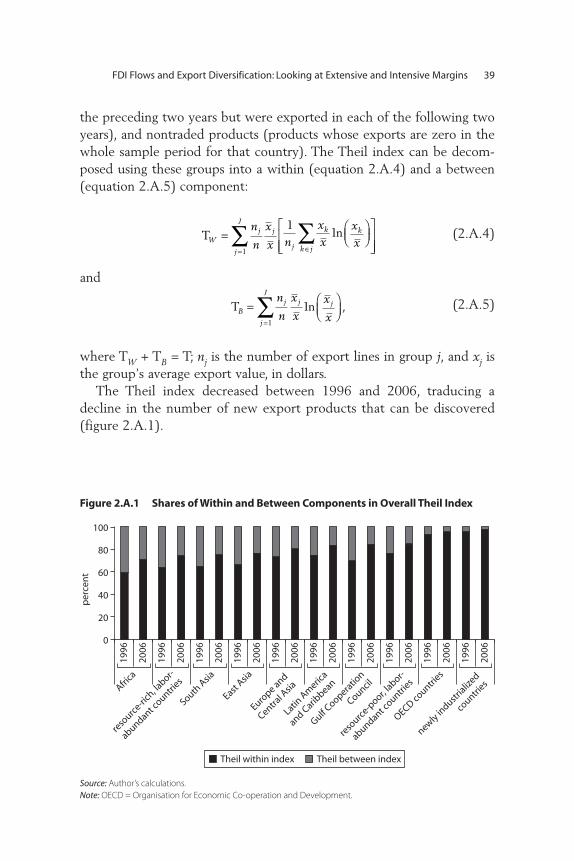
the preceding two years but were exported in each of the following twoyears), and nontraded products (products whose exports are zero in thewhole sample period for that country). The Theil index can be decom-posed using these groups into a within (equation 2.A.4) and a between(equation 2.A.5) component:
(2.A.4)
and
(2.A.5)
where TW + TB = T; nj is the number of export lines in group j, and xj isthe group’s average export value, in dollars.
The Theil index decreased between 1996 and 2006, traducing adecline in the number of new export products that can be discovered(figure 2.A.1).
T n1
Bj j j
j
J n
n
x
xx
x= ⎛
⎝⎜⎞⎠⎟
=∑ 1 ,
T n1
Wj j
j
k k
k jj
J n
n
x
x nxx
xx=
⎛⎝⎜
⎞⎠⎟
⎡
⎣⎢⎢
⎤
⎦⎥⎥
∑∑=
11
∈
FDI Flows and Export Diversification: Looking at Extensive and Intensive Margins 39
Figure 2.A.1 Shares of Within and Between Components in Overall Theil Index
Source: Author’s calculations.Note: OECD = Organisation for Economic Co-operation and Development.
0
20
40
60
80
100
1996
2006
1996
2006
1996
2006
1996
2006
1996
2006
1996
2006
1996
2006
1996
2006
1996
2006
1996
2006
Africa
per
cen
t
reso
urce-ri
ch, la
bor-
abundant countri
es
reso
urce-p
oor, labor-
abundant countri
es
South A
sia
East Asia
Europe and
Central A
sia
Latin A
meric
a
and Carib
bean
Gulf Coopera
tion
Council
OECD countri
es
newly industr
ialized
countri
es
Theil within index Theil between index
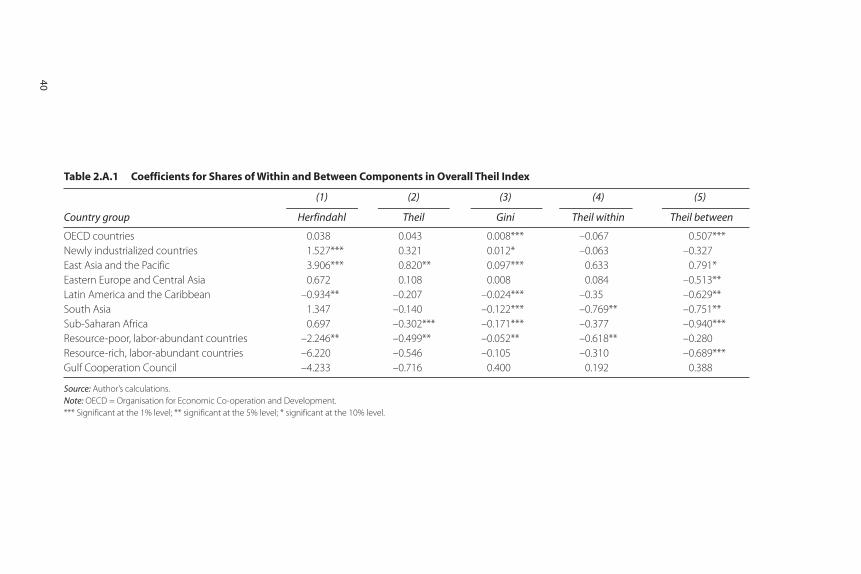
Table 2.A.1 Coefficients for Shares of Within and Between Components in Overall Theil Index
Country group
(1) (2) (3) (4) (5)
Herfindahl Theil Gini Theil within Theil between
OECD countries 0.038 0.043 0.008*** –0.067 0.507***Newly industrialized countries 1.527*** 0.321 0.012* –0.063 –0.327East Asia and the Pacific 3.906*** 0.820** 0.097*** 0.633 0.791*Eastern Europe and Central Asia 0.672 0.108 0.008 0.084 –0.513**Latin America and the Caribbean –0.934** –0.207 –0.024*** –0.35 –0.629**South Asia 1.347 –0.140 –0.122*** –0.769** –0.751**Sub-Saharan Africa 0.697 –0.302*** –0.171*** –0.377 –0.940***Resource-poor, labor-abundant countries –2.246** –0.499** –0.052** –0.618** –0.280Resource-rich, labor-abundant countries –6.220 –0.546 –0.105 –0.310 –0.689***Gulf Cooperation Council –4.233 –0.716 0.400 0.192 0.388
Source: Author’s calculations.Note: OECD = Organisation for Economic Co-operation and Development.*** Significant at the 1% level; ** significant at the 5% level; * significant at the 10% level.
40
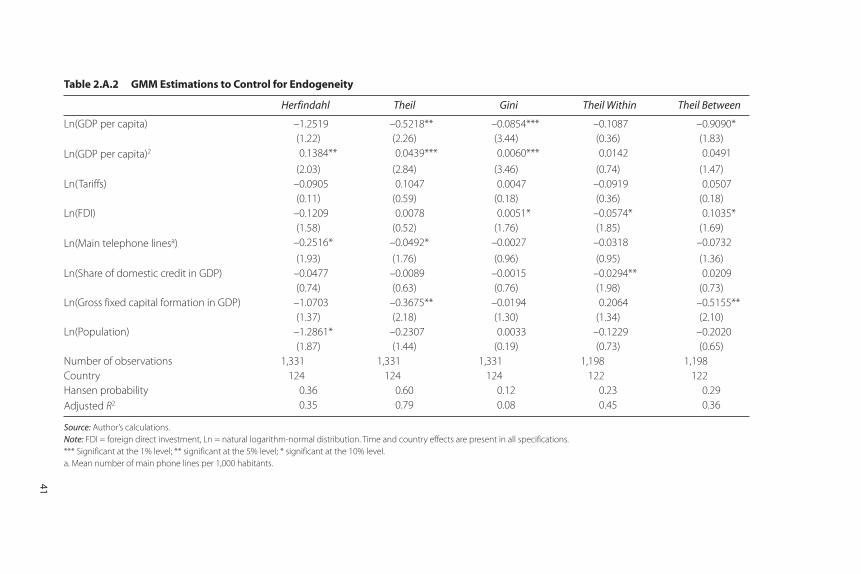
Table 2.A.2 GMM Estimations to Control for Endogeneity
Herfindahl Theil Gini Theil Within Theil Between
Ln(GDP per capita) –1.2519 –0.5218** –0.0854*** –0.1087 –0.9090*(1.22) (2.26) (3.44) (0.36) (1.83)
Ln(GDP per capita)2 0.1384** 0.0439*** 0.0060*** 0.0142 0.0491
(2.03) (2.84) (3.46) (0.74) (1.47)Ln(Tariffs) –0.0905 0.1047 0.0047 –0.0919 0.0507
(0.11) (0.59) (0.18) (0.36) (0.18)Ln(FDI) –0.1209 0.0078 0.0051* –0.0574* 0.1035*
(1.58) (0.52) (1.76) (1.85) (1.69)Ln(Main telephone linesa) –0.2516* –0.0492* –0.0027 –0.0318 –0.0732
(1.93) (1.76) (0.96) (0.95) (1.36)Ln(Share of domestic credit in GDP) –0.0477 –0.0089 –0.0015 –0.0294** 0.0209
(0.74) (0.63) (0.76) (1.98) (0.73)Ln(Gross fixed capital formation in GDP) –1.0703 –0.3675** –0.0194 0.2064 –0.5155**
(1.37) (2.18) (1.30) (1.34) (2.10)Ln(Population) –1.2861* –0.2307 0.0033 –0.1229 –0.2020
(1.87) (1.44) (0.19) (0.73) (0.65)Number of observations 1,331 1,331 1,331 1,198 1,198Country 124 124 124 122 122Hansen probability 0.36 0.60 0.12 0.23 0.29Adjusted R2 0.35 0.79 0.08 0.45 0.36
Source: Author’s calculations.Note: FDI = foreign direct investment, Ln = natural logarithm-normal distribution. Time and country effects are present in all specifications. *** Significant at the 1% level; ** significant at the 5% level; * significant at the 10% level. a. Mean number of main phone lines per 1,000 habitants.
41
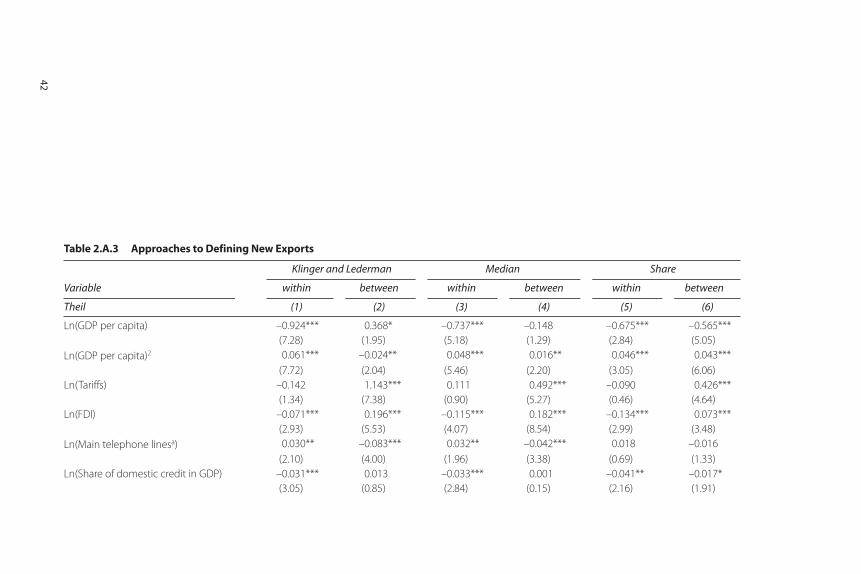
Table 2.A.3 Approaches to Defining New Exports
Variable
Klinger and Lederman Median Share
within between within between within between
Theil (1) (2) (3) (4) (5) (6)
Ln(GDP per capita) –0.924*** 0.368* –0.737*** –0.148 –0.675*** –0.565*** (7.28) (1.95) (5.18) (1.29) (2.84) (5.05)
Ln(GDP per capita)2 0.061*** –0.024** 0.048*** 0.016** 0.046*** 0.043*** (7.72) (2.04) (5.46) (2.20) (3.05) (6.06)
Ln(Tariffs) –0.142 1.143*** 0.111 0.492*** –0.090 0.426*** (1.34) (7.38) (0.90) (5.27) (0.46) (4.64)
Ln(FDI) –0.071*** 0.196*** –0.115*** 0.182*** –0.134*** 0.073*** (2.93) (5.53) (4.07) (8.54) (2.99) (3.48)
Ln(Main telephone linesa) 0.030** –0.083*** 0.032** –0.042*** 0.018 –0.016 (2.10) (4.00) (1.96) (3.38) (0.69) (1.33)
Ln(Share of domestic credit in GDP) –0.031*** 0.013 –0.033*** 0.001 –0.041** –0.017* (3.05) (0.85) (2.84) (0.15) (2.16) (1.91)
42
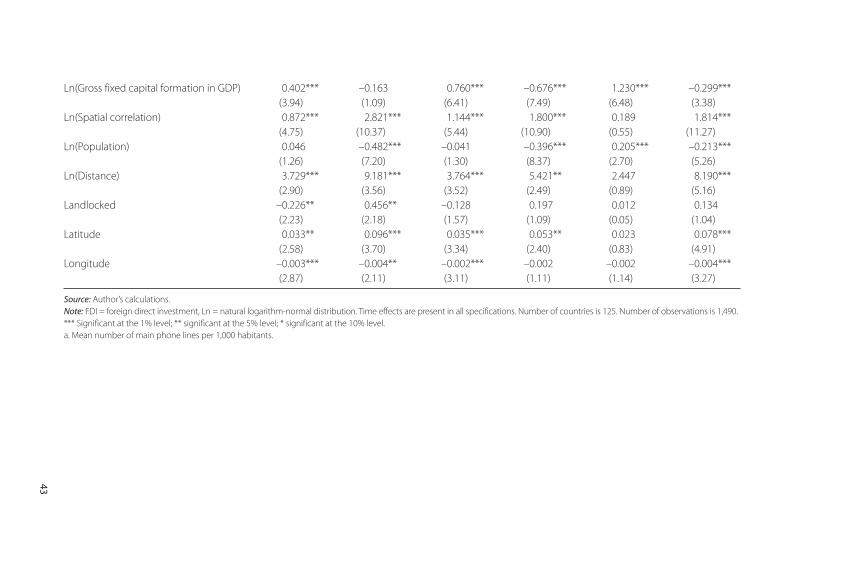
Ln(Gross fixed capital formation in GDP) 0.402*** –0.163 0.760*** –0.676*** 1.230*** –0.299*** (3.94) (1.09) (6.41) (7.49) (6.48) (3.38)
Ln(Spatial correlation) 0.872*** 2.821*** 1.144*** 1.800*** 0.189 1.814*** (4.75) (10.37) (5.44) (10.90) (0.55) (11.27)
Ln(Population) 0.046 –0.482*** –0.041 –0.396*** 0.205*** –0.213*** (1.26) (7.20) (1.30) (8.37) (2.70) (5.26)
Ln(Distance) 3.729*** 9.181*** 3.764*** 5.421** 2.447 8.190*** (2.90) (3.56) (3.52) (2.49) (0.89) (5.16)
Landlocked –0.226** 0.456** –0.128 0.197 0.012 0.134 (2.23) (2.18) (1.57) (1.09) (0.05) (1.04)
Latitude 0.033** 0.096*** 0.035*** 0.053** 0.023 0.078*** (2.58) (3.70) (3.34) (2.40) (0.83) (4.91)
Longitude –0.003*** –0.004** –0.002*** –0.002 –0.002 –0.004*** (2.87) (2.11) (3.11) (1.11) (1.14) (3.27)
Source: Author’s calculations.Note: FDI = foreign direct investment, Ln = natural logarithm-normal distribution. Time effects are present in all specifications. Number of countries is 125. Number of observations is 1,490.*** Significant at the 1% level; ** significant at the 5% level; * significant at the 10% level. a. Mean number of main phone lines per 1,000 habitants.
43
Notes
1. The following discussion is based on World Bank (2007a).
2. Following Cadot, Carrère, and Strauss-Kahn (forthcoming), we define theintensive margin as including products that have been exported by a countryfor at least two years and the extensive margin as including products thatwere not exported by the country in the preceding two years but wereexported in each of the following two years and products that were notexported to a particular market in the preceding two years but were exportedto that market in the following two years.
3. The Inward FDI Potential Index captures several factors (apart from marketsize) that are expected to affect the attractiveness of an economy to foreigninvestors. It is an average of the values (normalized to yield a score betweenzero, for the lowest-scoring country, and one, for the highest) of the following12 variables (no weights are attached in the absence of a priori reasons toselect particular weights): GDP per capita; the rate of GDP growth; the shareof exports in GDP; the average number of telephone lines and mobile per1,000 inhabitants; commercial energy use per capita; the share of R&D spend-ing in GDP; the share of tertiary students in the population; a measure ofcountry risk; the world market share in exports of natural resources; the worldmarket share of imports of parts and components for automobiles and elec-tronic products; the world market share of exports of services; the share ofworld FDI inward stock; and a broad indicator of the attractiveness andabsorptive capacity for FDI and the investment climate.
4. The index is based on a bilateral distances matrix from the French Center forInternational Economic Studies (CEPII).
5. Depending on the outcome variable, “Spec” can be a Herfindahl, Theil, orGini index.
References
Acemoglu, D., and F. Zilibotti. 1997. “Was Prometheus Unbound by Chance? Risk,Diversification, and Growth.” Journal of Political Economy 105 (4): 709–51.
Aizenman, J., and M. Marion. 2004. “The Merits of Horizontal versus Vertical FDIin the Presence of Uncertainty.” Journal of International Economics 62 (1):125–48.
Alfaro J., A. Chanda, S. Kalemli-Ozcan, and S. Sayek. 2004. “FDI and EconomicGrowth: The Role of Financial Markets.” Journal of International Economics64 (1): 89–112.
Amiti, M., and A. J. Venables. 2002. “The Geography of Intra-Industry Trade.” InFrontiers of Research in Intra-Industry Trade, ed. P. J. Lloyd and H.-H. Lee.Basingstoke, U.K.: Palgrave Macmillan.
44 Gourdon
Bashir, A. H., and K. Hassan. 2002. “Financial Development and EconomicGrowth in the Middle East.” Working Paper, University of New Orleans, LA.
Bertinelli, L., V. Salins, and E. Strobl. 2006. “Export Diversification and PriceUncertainty in Sub-Saharan Africa and Other Developing Countries: APortfolio Theory Approach.” Working Paper, Université de Luxembourg,Université de Paris X, Ecole Polytechnique, Paris.
Brun J.-F., C. Carrère, P. Guillaumont, and J. De Melo. 2005. “Has Distance Died?Evidence from a Panel Gravity Model.” World Bank Economic Review 19 (1):99–120.
Cadot O., C. Carrère, and V. Strauss-Kahn. Forthcoming. “Export Diversification:What’s Behind the Hump?” Review of Economics and Statistics.
Chan, K., and E. R. Gemayel. 2004. “Risk Instability and the Pattern of ForeignDirect Investment in the Middle East and North Africa Region.” WorkingPaper 04/139, International Monetary Fund, Washington, DC.
Deardorff, A. V. 1984. “Testing Trade Theories.” In Handbook of InternationalEconomics, ed. R. Jones and P. Kennen. Amsterdam: North-Holland.
Eid, F., and F. Paua. 2003. “FDI in the Arab World: The Changing Invest -ment Landscape.” In The Arab World Competitiveness Report 2002–2003, ed.P. Cornelius. Geneva: World Economic Forum.
Faini, R. 2004. “Export Concentration and Export Diversification: The Pattern ofExport Structure.” World Bank, Middle East and North Africa Region,Washington, DC.
Feenstra, R., and H. L. Kee. 2004. “Export Variety and Country Productivity.”Policy Research Working Paper 3412, World Bank, Washington, DC.
Greene, W. H. 2008. Econometric Analysis, 6th ed. Upper Saddle River, NJ:Prentice Hall.
Hausmann, R., J. Hwang, and D. Rodrik. 2007. “What You Export Matters.”Journal of Economic Growth 12 (1): 1–25.
Hausmann, R., and B. Klinger. 2006. “Structural Transformation and Patterns ofComparative Advantage in the Product Space.” Harvard University,Cambridge, MA.
Helpman, E., and P. Krugman. 1985. Market Structure and Foreign Trade.Cambridge, MA: MIT Press.
Hummels, D., and P. J. Klenow. 2005. “The Variety and Quality of a Nation’sExports.” American Economic Review 95 (3): 704–23.
Hwang, J. 2006. “Introduction of New Goods, Convergence and Growth.”Informal paper. Department of Economics, Harvard University, Cambridge,MA.
Imbs, J., and R. Wacziarg. 2003. “Stages of Diversification.” American EconomicReview 93 (1): 63–86.
FDI Flows and Export Diversification: Looking at Extensive and Intensive Margins 45
Iqbal, F., and M. K. Nabli. 2004. Trade, Foreign Direct Investment and Develop -ment in the Middle East and North Africa. The Middle East and North AfricaRegion: The Challenges of Growth and Globalization. Washington DC:International Monetary Fund Institute and World Bank.
Klinger, B., and D. Lederman. 2004. “Discovery and Development: An EmpiricalExploration of ‘New’ Products.” Policy Research Working Paper 3450, WorldBank, Washington, DC.
Krugman, P. 1981. “Intraindustry Specialisation and the Gains from Trade.” Journalof Political Economy 89 (5): 959–73.
Levchenko, A. A., and J. di Giovanni. 2006. “The Risk Content of Exports.”International Monetary Fund, Washington, DC.
Makdisi, S., Z. Fattah, and I. Liman. 2002. “Determination of Growth in theMENA Countries.” Working Paper, Arab Planning Institute, Safat, Kuwait.
Martincus, C., and A. Estevadeordal. 2005. “Specialization and DivergingManufacturing Structures: The Aftermath of Trade Policy Reform inDeveloping Countries.” Development Studies Working Paper 220, CentroStudi Luca d’Agliano, Milan, Italy.
OCO Monitor [database]. OCO Consulting, Belfast, Northern Ireland.
UNCTAD (United Nations Conference on Trade and Development). 2007. WorldInvestment Report. Geneva: UNCTAD.
Venables, A., and N. Limao. 2002. “Geographical Disadvantage: A Heckscher-Ohlin-von Thünen Model of International Specialization.” Journal ofInternational Economics 58 (2): 239–63.
World Bank. 2007a. Export Diversification in Egypt, Jordan, Lebanon, Morocco, andTunisia. Report 40497-MNA. Washington, DC: World Bank.
World Bank. 2007b. World Development Indicators. Washington, DC: World Bank.
———. 2009. Strengthening China’s and India’s Investments Ties in the Middle Eastand North Africa. Washington, DC: World Bank.
46 Gourdon

47
Over the past 15 years, many non-oil-exporting countries in the MiddleEast and North Africa (MENA) have made strides in liberalizing trade,stabilizing the macroeconomic situation, and improving the investmentclimate. Supported by a favorable external environment, they have enjoyedremarkable export performance. In many of these countries, export growthoutperformed the world average, reaching impressive yearly growth ratesof 12–25 percent since 2000. Yet, with the exception of Tunisia, countriesin the region enjoyed only half the export growth recorded by otheremerging economies. Consequently, they have not strengthened their posi-tion in the world market; their shares in global manufacturing exportswere less than 0.2 percent in 2005. Moreover, although there has beensome progress, especially in new exports, exports remain concentrated ina few commodities.
Faced with the challenge of stepping up the development of exports,many governments in the region are looking for more proactive ways topromote exports. In this context, it is useful to investigate how export pro-motion can be designed to spur not only growth but also diversification.
C H A P T E R 3
Promoting New Exports: Experience from Industry Case Studies
Claudia Nassif
In an effort to better understand the processes underlying export diver-sification through new exports, the World Bank (2007) conducted ananalysis of export diversification in the Arab Republic of Egypt, Jordan,Lebanon, Morocco, and Tunisia. As part of the analysis, 23 cases of success-ful export discoveries in the five countries were studied. The objective ofthe case studies was to learn what triggers or constrains the discovery ofnew exports at the firm level, what makes an entrepreneur take the riskof exporting a new product that has no track record in the economy, andwhat makes imitators pick up on the new export activity.
This chapter addresses these issues. The first section provides anoverview of export diversification in the five MENA countries included inthe World Bank study. The second section discusses the case studies. Thethird section makes recommendations for designing proactive policies thatencourage experimentation and imitation. The last section derives furtherimplications from the case study results for export promotion.
Export Diversification in “Resource-Poor” Countries in the Region
At the structural level, exports in MENA are concentrated. Even thenon-oil countries rely heavily on a few export commodities, and diversi-fication levels are lower than in other countries of comparable incomeand size (figure 3.1). Most exports are unsophisticated. The technologi-cal structure of exports in the “resource-poor” countries falls short of thatof comparable countries in other regions: on average, only 21 percent ofthe region’s exports entail medium or high technology, while almost37 percent of exports in other emerging economies fall into these cate-gories.1 This technology structure hurts productivity in MENA coun-tries, which is low compared with other countries of similar incomelevels in other regions.
The trade structure in the resource-poor MENA countries is undergo-ing changes, albeit slowly. This is indicated by the unusual fact that exportgrowth in many of the region’s countries has been heavily driven by theextensive margin (that is, the change in export flows resulting from exportflows to new markets and new products) (table 3.1). The extensive mar-gin accounted for just 17 percent of the export growth of all lower-middle-income countries on average and 24 percent of the growth of allupper-middle-income countries; it accounted for more than 38 percent inMENA countries. This is partly explained by the magnitude of the declinein existing flows and the disappearance of exports of particular products
48 Nassif

to particular markets.2 If Egypt, for example, had maintained its exportflows that declined or disappeared, export growth would have been morethan 30 percent higher. But even if one discounts for statistical effects, theincidence of new export activities remains high (World Bank 2009).
The differences in country outcomes are difficult to ascertain. Theyresult partly from a proliferation of preferential trade agreements, espe-cially with the European Union and the United States, and partly fromresponses to shifts in competition patterns on international markets. Forsome exports, such as pistachios in the Islamic Republic of Iran, the sameproduct is responsible for a decline in some markets and an increase inothers, which indicates trade diversion effects in traditional export mar-kets. Finally, some countries in the region started with fewer export flows,which explains why exports at the extensive margin are more pronounced(World Bank 2009).
Promoting New Exports: Experience from Industry Case Studies 49
0
0.1
0.2
0.3
0.4
0.5
0.6 AlgeriaEgypt, Arab Rep. of
Jordan
Lebanon
Morocco
Syrian Arab Republic
Tunisia
Turkey
Hungary
PolandRomania
France
Italy
Portugal
Spain
China
India
Mexico
Malaysia
1990 2005
Figure 3.1 Herfindahl-Hirschmann Index of Export Concentration, 1990 and 2005
Source: World Bank 2007.Note: The Herfindahl-Hirschmann index is a measure of the degree of product concentration, normalized to obtain values from 0 (minimum concentration) to 1 (maximum concentration). It implies that countries with anindex closer to zero (middle point) are more diversified.
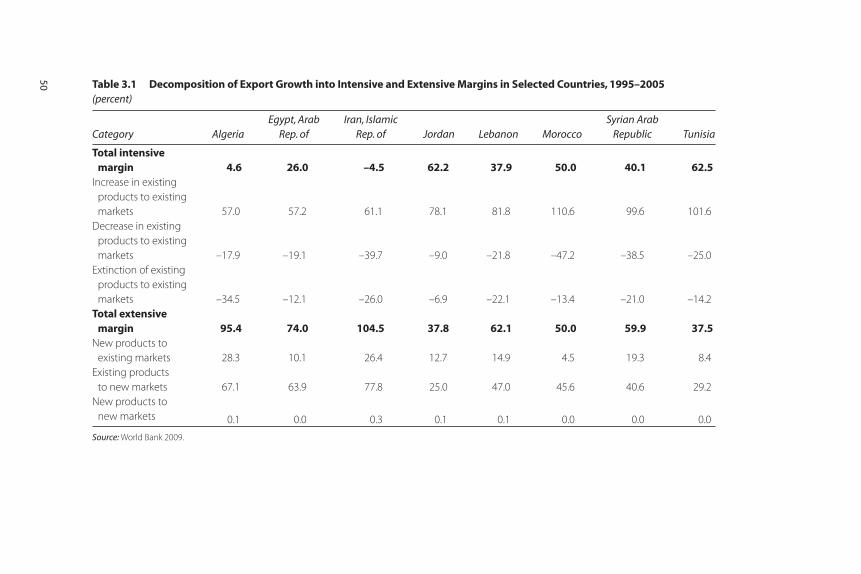
Table 3.1 Decomposition of Export Growth into Intensive and Extensive Margins in Selected Countries, 1995–2005 (percent)
Category AlgeriaEgypt, Arab
Rep. ofIran, Islamic
Rep. of Jordan Lebanon MoroccoSyrian Arab
Republic Tunisia
Total intensive margin 4.6 26.0 –4.5 62.2 37.9 50.0 40.1 62.5
Increase in existing products to existing markets 57.0 57.2 61.1 78.1 81.8 110.6 99.6 101.6
Decrease in existing products to existing markets –17.9 –19.1 –39.7 –9.0 –21.8 –47.2 –38.5 –25.0
Extinction of existing products to existing markets –34.5 –12.1 –26.0 –6.9 –22.1 –13.4 –21.0 –14.2
Total extensive margin 95.4 74.0 104.5 37.8 62.1 50.0 59.9 37.5
New products to existing markets 28.3 10.1 26.4 12.7 14.9 4.5 19.3 8.4
Existing products to new markets 67.1 63.9 77.8 25.0 47.0 45.6 40.6 29.2
New products to new markets 0.1 0.0 0.3 0.1 0.1 0.0 0.0 0.0
Source: World Bank 2009.
50
Case Studies
MethodologyThe case studies are narratives based on interviews that included bothstandard and open-ended questions. More than 100 interviews were con-ducted with first movers and subsequent entrants. The selection of thecase studies was based on a statistical identification and then through areality test in which the selected exports were vetted with export and busi-ness associations.
The statistical identification of the export discoveries in the case stud-ies follows the methodology described by Klinger and Lederman (2009).For each country, export data at the six-digit Harmonized System (HS)level were filtered for export discoveries. Export discoveries were definedas products that had not been sold abroad (or sold only in very limitedamounts) at the beginning of the period (1989) that were consistentlyexported in large quantities by the end of the period (2004).
Identification of first movers and followers was fairly simple. In mostcases, only a few firms were engaged in the export activity of interest.Because most of the businesses had started no earlier than 1990, informa-tion on diffusion was easy to track (for example, through interviews withindustry analysts or business chambers). In all but two cases, informationabout the sequence of the development of industry was consistent acrosssources. The case studies were examined for commonalities in observations,which in many cases were striking, to obtain the results discussed below.
Obviously, this methodology is open to selection bias: 23 case studiesin five countries hardly make a case for a representative sample. Theresults should therefore be treated with the same caution applicable to allqualitative analysis.
Triggers for New Export ActivitiesExport discoveries can consist of genuine innovation, technological adap-tation, customization, or licensed production of foreign-owned products.The case studies covered all of these types of innovation, with discoveriesbased on technology adaptation the most frequent. The case studies foundsix possible triggers for export discovery.
• An external, unpredicted shock: An unanticipated event, such as a war,can change the profitability of existing businesses and force firms tochange strategy. Such a trigger might include changes in globaldemand or supply that push multinationals to relocate part of theirproduction to stay competitive.
Promoting New Exports: Experience from Industry Case Studies 51

• Market evolution: The emergence of a new market or a change in theexisting market structure can create an opportunity for new business.Market liberalization is a key example.
• Capacity to produce in excess of domestic demand: A firm oriented toward a domestic market learns how to export its excess production.
• Research: A technology-oriented firm or person can commercialize apatented invention as a result of research.
• News: A discovery is driven by new information about business opportunities.
• Random walk: High-risk entrepreneurs can create businesses throughtrial and error or by seizing a one-time opportunity.
In many cases, more than one trigger was at play. The most decisivetrigger was the combination of information about new business opportu-nities with an entrepreneur willing to take high risks and adopt new tech-nologies and management techniques (box 3.1). Information normallycame from business travels, previous study, or work experiences abroad.In a few cases, the process of obtaining information and translating it intobusiness-relevant activities was supported by private sector networks. Thesimilarity of the background, experiences, and attitudes of the entrepre-neurs was striking, especially in contrast to the most predominant type offirm owners and managers within their societies, who usually lead a fam-ily business and were conservative and rent seeking.
In contrast to characteristics associated with individual entrepreneurs,the case studies did not establish a clear pattern of firm type or size.Discoveries occurred in small and large firms, and they occurred in firmsthat sold products domestically first and, through various iterations ofproduction changes, learned to export. Sometimes newly discoveredproducts were added to an existing export portfolio; often firms werebuilt up from scratch with the onset of the discovery. Most of the firmshad one thing in common, however: they were all domestic, in the sensethat they were rarely a result of foreign direct investment (FDI). Thismakes sense, considering that foreign investors base their investmentdecision on existing comparative advantages for exports and factors thatinclude, among others, a certain skill level, infrastructure, or local produc-tion experience. Investments are less risky in industries in which countrieshave already proven export or production capacity. Moreover, researchand development activities that potentially could lead to the discovery ofnew products typically do not take place in subsidiaries or productionfacilities of multinational companies.
52 Nassif

Promoting New Exports: Experience from Industry Case Studies 53
Box 3.1
How Entrepreneurship Makes a Difference
Egypt’s leading private exporter association, ExpoLink, organizes firms in industry
clusters to promote exports by taking domestic producers with export potential
to international fairs, bringing in international consultants, and organizing sup-
port networks of successful exporters to work with new entrants. Most firm-level
success stories in the furniture industry come from domestically focused producers
that were pulled into the export market by ExpoLink.
One example is Meuble El Chark, a family firm that traces its history back to 1944.
As of the mid-1990s, the company produced entirely for the domestic market,
mainly for restaurants and hotels in Egypt. But as growth in the tourism sector
slowed in the late 1990s, Ahmed Helmy, the new chief executive officer (CEO),
began looking to the export market for growth. Mr. Helmy had little information
about foreign demand. Initially, he thought that with his company’s deep knowl-
edge of furniture production and Egypt’s status as a medium-technology manufac-
turer, he might compete in other MENA markets; he never envisioned competing in
the highly sophisticated European or U.S. markets.
Mr. Helmy had no idea how to begin; he feared his idea would never get off
the ground. An ExpoLink meeting with similar firms encouraged him to enter
new markets and change his production toward more customized furniture that
meets international standards. The other firms were similar to his—family firms
with long histories in the domestic market, headed by a new generation with
their eyes on exports. Benefiting from the others’ experiences, from trips to trade
fairs in Europe and the United States, and from international consultants organ-
ized by ExpoLink, Mr. Helmy changed his production and began exporting to
European markets. His original goal was to export a small percentage of his out-
put to diversify market risk; he now exports more than 65 percent of production.
The same type of assistance did not bring success to Egypt’s domestic shoe
industry. Despite substantial support and many of the same natural advantages
the furniture industry had, the leather shoe industry did not prove competitive in
the international market. The biggest difference between leather manufacturers
and those in furniture was the personal characteristics of their leaders. When
ExpoLink reached out to the furniture sector, it found a new generation of CEOs
with international experience and a desire to push into new markets. In contrast,
the leaders of the shoe manufacturers had developed their businesses in the era
of large-scale exports to East Germany and the Soviet Union—exports driven by
(continued)
FDI was important in some cases for increasing exports to a more sig-nificant level. In Jordan, for instance, FDI, attracted by the incentives pro-vided in special economic zones, triggered a surge in textile exports.Similarly, motivated by domestic call-center activities, the government ofMorocco heavily promoted the country as an attractive location for for-eign investment, which subsequently contributed to the successful devel-opment of the new export sector; today Morocco is a frontrunner infrancophone call-center services. However, the role of FDI in export diver-sification is ambiguous; it is discussed in chapter 2 of this book.
Factors Constraining the Development of New Export ActivitiesFirst movers were asked about the problems they faced at the earlieststage of the export development, in an attempt to identify constraints toexport discoveries. The inherent weakness of this approach is that it indi-cates the constraints only of entrepreneurs who were able to overcomethem, not of entrepreneurs who failed to succeed for reasons other thanthose reported. Failures are difficult to observe, because the discoveriesnever emerge. The constraints reported by successful entrepreneurs canbe regarded as the best proxy.
The findings suggest that uncertainty is the major factor constrainingthe discovery of new export activities. Uncertainty can be caused by alack of information about demand in specific markets and the price newproducts or services can command. It may also be hampered by insuffi-cient information about how to produce quality goods and services whilemaintaining price competitiveness. Neither type of knowledge is easy toobtain, because a product is new to the domestic economy and the knowl-edge does not yet exist. Gauging potential success in a new export busi-ness becomes a shot in the dark. The high cost of gathering the required
54 Nassif
Box 3.1 (Continued)
politics rather than demand. With little understanding of foreign demand or
experience in penetrating new markets, they floundered in more competitive
environments. Many international consultants hired by ExpoLink complained
that the leather firms refused to change their production methods or machinery,
instead sticking to traditional techniques.
information is thus the greatest hurdle in initiating a new export activity(Klinger 2007).
Entrepreneurs in the case studies overcame these uncertainties in fourways:
• Some entrepreneurs partnered with firms that had the requiredknowledge by entering a formal licensing agreement or forming a jointventure.
• Other entrepreneurs resolved uncertainty through subsidies from theinput supplier, who was motivated by cultivating downstream demand.
• Many entrepreneurs simply assumed the higher risks and absorbed thecosts of uncertainty alone.
• In a few cases, public support—in the form of export promotion, tech-nical assistance for firm restructuring, or knowledge transfer—wascritical in the initial stages of business, predominantly for the (few)entrepreneurs with no previous knowledge of the export business orforeign demand.
Exporters did not mention any policy-induced business constraints.The only pertinent investment climate constraint for new export discov-eries cited in the case studies was limited access to finance. Almost allentrepreneurs reported difficulties in acquiring financial resources to starttheir new business within the domestic financial system. Although all theentrepreneurs eventually obtained the necessary financing—mostly fromprivate resources—the financing constraints had several consequences,including delayed investment, high personal risk, and dependence on infor-mal financial resources.
Except in the few cases mentioned above, government support playedonly a minimal role in the discovery process. One could therefore concludethat public support is not critical during the discovery phase. However,many entrepreneurs pointed out that initial support—through export pro-motion schemes, competitiveness programs, innovation grants, and soforth—was just not available to them.
Diffusion and the Fear of ImitationFrom a social perspective, the imitation of a successful export discoveryis desirable, because it fosters the development of export sectors andeconomic growth. But as Klinger and Lederman (2009) note, the incen-tives for exporters to experiment may be reduced by the possibility that
Promoting New Exports: Experience from Industry Case Studies 55
imitators will appropriate part of the returns produced by the new ven-ture. Free entry into the new market could thus undercut the incentiveto search for new business opportunities, producing a market failure inwhich the market produces fewer discoveries than is socially desirable.
In stark contrast to the assumption that fear of competition discour-ages market entry, none of the first movers in the case studies regardeddomestic followers as competitors. In fact, they often facilitated or evenencouraged imitation though knowledge sharing and collaboration. Thefirst mover and imitators in the call-center business in Egypt, for instance,regularly met to discuss how to jointly organize trade fair participationand lobby for better telecommunication regulations; they even sharedbusiness by lending one another agent positions. In Morocco, the firstmover in strawberry exports openly shared information about farmingtechniques with neighboring farms. In Egypt, medical equipment suppli-ers joined forces to target geographic markets, visit trade fairs in a group,and engage in national branding. To improve the image of Egyptian med-ical equipment abroad, the suppliers applied self-regulation, allowingonly quality-certified firms to participate in group marketing activitieswhile helping one another achieve the required certifications. How canthis be explained?
One explanation could be the limitations of the methodology, which didnot allow observation of examples of failed export discoveries; informationon failed discoveries would offer more insight into whether the appropri-ation problem led to market exit. Another explanation is that the firstmovers weighed the impact of appropriation by followers against thebenefits of cooperation—building reputation in export markets, exploit-ing scale economies, lobbying for better regulations or infrastructureimprovements—and found the benefits greater than the losses.
Imitation in geographically limited domestic markets is a problem,because firms compete for input suppliers and buyers. The cost of imitationis lower in export markets, where firms compete without geographicallimitations. Competition for imported inputs is relatively minor, andinternational demand is theoretically unlimited. Some first movers con-jectured, though, that competition could become more critical as produc-tion expands and input supply (especially labor) becomes scarcer forindividual producers.
The first movers in the case studies did fear competition from othercountries, particularly countries with a strong market presence. Althoughthe fear of imitation as a cause of market failure cannot be excluded, thecases imply that the benefits of cooperation or coordination can outweighthe potential loss from imitation.
56 Nassif

The lack of coordinated or collective action might actually explain whyexport discoveries in many cases remained individual instances and didnot contribute much to the development of new export industries. Thediffusion process in the five study countries is fairly fragmented, withweak links between firms and public or private institutions or educationfacilities and research centers that could catalyze knowledge. Most of thefollowers interviewed for the case studies said that they did not actupon—or even receive—a signal from a first mover. Instead, export dis-coveries occurred as parallel phenomena, with simultaneous market entryor the development of differentiated products triggered by the same setof similar factors that drove the first mover. This finding implies that mar-kets in these countries lack the necessary transparency to enable (fast)information exchange. In cases in which FDI was a factor, investorsreceived a general signal about the comparative advantages of the coun-try, usually obtained through market studies. In cases in which followersacted upon signals, they were usually catalyzed by a cluster of firms, infor-mal networks, or an association. This finding bears important implicationsfor countries, like the five studied here, in which knowledge diffusion ishindered by weak private sector organization.
Designing Proactive Policies to Encourage Experimentation and Imitation
Countries will not be able to diversify their exports unless the economicenvironment is favorable to trade and investment. Diversification requiresshifting resources across sectors or investing in new economic activity.This is unlikely to happen unless the economic environment allows forcompetitive production of goods and services. Export promotion shouldtherefore always be based on policies that reduce antiexport bias, macro-economic imbalances, and behind-the-border constraints and improvetrade facilitation and access to services. Beyond these steps is a continuumof possibilities for proactive policies to foster export growth and diversi-fication if externalities cause an underinvestment in productive activities.However, especially when the objective is to promote diversificationthrough new export activities, policy instruments need to be designed toaddress the specific constraints first movers face at the very early stagesof the discovery process (from the idea to the market). This is not a triv-ial requirement: assessment of the policy instruments used in the fivecountries studied here reveals that the eligibility criteria for most initia-tives, such as matching grants for marketing activities, business develop-ment assistance, or even start-up schemes, favor exporters of traditional
Promoting New Exports: Experience from Industry Case Studies 57
goods and services or those that are considered strategic in terms of theirmarket potential.
Such policies may make economic sense, because the observable andquantifiable returns on such interventions, when effective, are higher thanthe returns that could be expected from risky business activities that arenew to the economy.3 In this respect, governments act with the samelogic as private investors, who calculate the risks against their expectedreturns. However, this approach naturally discriminates against new activ-ities, because their actual return consists mainly of externalities that areintan gible in nature and difficult to measure, such as information aboutthe feasibility and productivity of the activity. This approach does nottake into account the valuable information for the economy producedby the new activity even if it fails. Failures provide other firms with les-sons on activities not to pursue and how not to do business. It could evenbe argued that public support should focus on promoting new activities.If the production or marketing of a new export proves successful, in theabsence of other market frictions, the information about business viabil-ity and profitability should be incentive enough for imitators to investeven without subsidies of any kind.
Shifting substantial resources to riskier projects with outcomes that aredifficult to measure may not be politically viable. It may also be difficultto establish the right balance between promoting growth in existing tradeflows (which may have a large impact in the short and medium terms) andsupporting new trade flows (with possible large impacts in the long term).Nevertheless, in countries with low levels of diversification, it may be worthassessing the incentives of export promotion programs and evaluating theirimpact on both export growth and diversification. Shifting some of theexport promotion resources for traditional activities to programs that favornew activities could help achieve diversification objectives.
The way to encourage entrepreneurs to move into foreign and unknownfields is based on a very basic principle: reduce the cost of experimenta-tion. There are different ways of doing this. In Egypt, for example, theprivate export association ExpoLink actively addressed producers of tra-ditional products, identified those with a strong desire for change andentrepreneurial attitude, formed small business clusters, and pulled theminto previously unexplored market segments by taking them on studytours abroad and bringing in international consultants to help transformthe business. In the furniture business, which has a long history of pro-ducing traditional, hand-crafted furniture, ExpoLink helped small-scaleproducers move into the international market for modern, customized
58 Nassif

furniture for restaurants and hotels. In Tunisia, success has been achievedwith an export promotion program known as FAMEX (Export MarketAccess Fund), which provides matching grants and technical assistanceto firms with no previous export experience, to exporters of new prod-ucts, and to exporters who seek to penetrate new markets (box 3.2).
The development of high-tech exports is intrinsically linked to thecapacity of the national innovation system and its links to the private sec-tor. The success stories of China and Taiwan, China, are in large part sto-ries of a long-term strategy focus on fostering indigenous innovation andtechnology capacity. Some impressive, albeit still limited, results havebeen achieved in Jordan through public seed money for establishing a
Promoting New Exports: Experience from Industry Case Studies 59
Box 3.2
Spurring Exports in Tunisia through FAMEX
The creation of the Tunisian Export Market Access Fund (FAMEX) in April 2000
marked an important shift of focus for export promotion in Tunisia, away from a
trade promotion organization model led by the government to a public-private
sector participatory approach. Acknowledging that firms, not countries, com-
pete, the Tunisian government placed emphasis on individual exporters and their
associations.
FAMEX helped individual firms implement a systematic strategy to enter,
sustain, and expand export markets. The $10 million fund was set up by CEPEX
(Tunisia’s export promotion agency) with World Bank assistance. It was privately
managed by international and local experts. FAMEX encouraged firms, especially
small and medium enterprises, to enter export markets by temporarily covering
up to half of the cost of consultant services and providing technical assistance.
Services were offered by local consultants and international experts in response
to demand from private firms.
In the five years that it existed, FAMEX helped 700 firms become exporters, export
new products and services, or enter new markets. Estimates indicate that each $1 of
FAMEX assistance generated more than $20 of additional exports. A recent survey
indicates that 60 percent of the firms that benefited from FAMEX assistance are now
willing to pay, or are already paying, full market price for export services (FAMEX
2008). Small export consulting industry has also been created as a result of the pro-
gram. FAMEX thus served as a catalyst to develop business-to-business markets.
Source: Project documents provided by FAMEX.

high-tech business incubator, iPark. The incubator provides a range of serv-ices, actively helping innovative entrepreneurs tap financial resources forresearch and development and create strategic links to investors. Underlyingthe success of iPark is a business model that relies on achieving financialself-sufficiency through tenant rentals and revenue sharing. Egyptachieved some success, notably in textiles, through seed financing of self-sufficient, industry-specific technology centers with smart business mod-els based on buying expensive international knowledge and disseminatingit at lower costs to domestic producers.
Fostering imitation without undermining the emergence of new exportactivities requires another set of instruments. Imitation in the case studycountries was rare in countries and industries with weak private sectororganizations; it occurred more frequently where clusters and networkshelped diffuse information. The lesson is to support collective action bycreating clusters and networks and by strengthening the role of businessassociations in export promotion. Building on the experiences of Expo-Link, the Egyptian government reformed its traditional export promotionmodel into a cluster-based system driven by the private sector. It providesincentives for coordinated and concerted action such as branding initia-tives or knowledge sharing through programs that fund export promotionactivities to business clusters. Cluster creation in this system remainsdriven by the private sector, supported by ExpoLink. In some cases, theformation of private associations emerged from the cluster activities thatprovided export promotion services to their members.
There is an obvious risk to rent-seeking behavior and state capturewhen firms coordinate their activities. This puts public support of col-lective action at odds with the objective of reducing barriers to export.These risks are real, and governments should be aware of them as theyencourage firms to cooperate. However, the risks can be minimized byenforcing transparency, firmly fostering trade liberalization, and provid-ing a regulatory balance between the creative industries’ interest andsociety as whole.
Conclusion
The specific export diversification experience of the five countries in thecase studies provides some interesting lessons. First, theory or empiricalevidence does not always conform with realities on the ground, even if itoffers guidance ex ante. In some countries, especially those with weakexport flows, the extensive margin may play a larger role in growing exports
60 Nassif

than it does in other countries. The relevance of developing new exportsor exporting to new markets should therefore not be underestimated. Bythe same token, where social objectives seem to undermine those of indi-vidual initiative, solutions can be found to overturn fear of imitation if itsbenefits can be practically demonstrated.
Second, export diversification is a function of export growth. Amongthe five countries studied, those with the most conducive environmentfor trade were also those that made the greatest progress in diversifica-tion. Achieving export diversification should therefore not be the onlygoal. At the same time, export promotion policies need to be carefullyassessed for their ability to induce entrepreneurs to move into new prod-ucts or markets that are associated with much higher risks than tradi-tional export activities. At the least, export promotion policies should notundermine diversification efforts, by favoring one sector over another, forexample, because its growth potential or economic relevance is consid-ered to be higher.
Finally, institutional experiences, such as that of FAMEX in Tunisia,may be replicable in other countries if the lessons can be harvested. Doingso requires a rigorous evaluation of export promotion polices and instru-ments that has yet to be conducted in most countries.
Notes
1. Resource-poor countries are those countries where a majority of exports arenot oil based.
2. The contribution of each margin to export growth is, because of the nature ofsuch decomposition, influenced by the strength of the other margin. Weakgrowth at the intensive margin tends to elevate the contribution of the exten-sive margin.
3. Returns on interventions are measured, for example, by the number and vol-umes of contracts following participation in a subsidized trade fair or by thenumber of viable start-ups.
References
FAMEX (Export Market Access Fund). 2008. “Etude d’evaluation mi-parcours duProgramme Famex II: Rapport de synthese.” FAMEX, Tunis, Tunisia.
Klinger, B. 2007. “Uncertainty in the Search for New Exports.” Graduate Studentand Postdoctoral Fellow Working Paper 16, Center for InternationalDevelopment, Harvard University, Cambridge, MA.
Promoting New Exports: Experience from Industry Case Studies 61

Klinger, B. and D. Lederman. 2009. “Diversification, Innovation, and Imitation ofthe Global Technological Frontier.” In Breaking into New Markets: EmergingLessons for Export Diversification, ed. Richard Newfarmer, William Shaw, andPeter Walkenhorst, 101–10. Washington, DC: World Bank.
World Bank. 2007. “Export Diversification in Egypt, Jordan, Lebanon, Morocco,and Tunisia”. Report 40497–MNA, World Bank, Washington, DC.
———. 2009. Strengthening China’s and India’s Trade and Investment Ties to theMiddle East and North Africa. Washington, DC: World Bank.
62 Nassif

63
This chapter applies new methodologies to examine the history of andfuture opportunities for export diversification in Algeria. The first sectionexamines Algeria’s productive structure, which is highly concentrated inthe hydrocarbons sector. It shows that this pattern of specialization isinconsistent with the country’s endowment of hydrocarbon resources.The lack of export diversification is suggestive of an inefficient distortion,reversal of which should be a clear policy priority.
The second section reviews some of the traditional explanations for alack of export diversification in an oil-exporting country and shows thatthese explanations do not seem to hold for Algeria. It offers an alternativeexplanation, based not on macroeconomic volatility or real exchange rateappreciation but on the specificity of productive capabilities in the oilsector and their substitutability to other activities. This explanationunderlies the notion of a “product space,” in which structural transforma-tion occurs.
The third section introduces a new methodology to export diversifica-tion in Algeria, which is shown to be specialized in a highly peripheralpart of the product space. Even activities that compose the non-oil exportbasket are highly peripheral in the product space, which helps explain thesevere lack of export diversification.
C H A P T E R 4
Export Diversification in Algeria
Ricardo Hausmann, Bailey Klinger, and José R. López-Cálix
The fourth section applies product space data to Algeria’s industrialstrategy, using the methodology to identify high-potential export sectors.This data-driven approach has the benefit of systematically scanning theentire set of potential export goods using an empirically validated method-ology. It complements other more qualitative and contextual approaches.This section uses the same methodology to review the sectors alreadyidentified by the Algerian government in the new industrial policy.
The last section discusses the policy implications of this analysis.A wide variety of methodologies can be used to generate lists of high-potential export sectors; more difficult is determining what to do withsuch lists. The section offers a few specific policy recommendations anddiscusses some best practices. But the fact that most required publicgoods and constraints to investment are sector specific means that recom-mendations cannot be made at the macro level.
Throughout the chapter, the focus is on the export sector, for a varietyof reasons. First, exports are not limited by the small size of the domesticmarket and hence can grow much more significantly, becoming enginesof growth. Second, exports tend to be the most productive activities in acountry, so that an increase in their relative size raises overall productiv-ity. Third, the competitiveness of exports is based on the availability in thecountry of nontradable inputs, because tradable inputs can be imported.A strategy of export growth thus promotes the development of the non-tradable sector, albeit in a different way. One important drawback of theapproach is that it considers only the goods sector. It ignores trade in serv-ices, because data on international trade in services are inadequate. Giventhe emerging role services exports are playing, this is unfortunate.
This chapter is meant to be a technical input for country experts.Efforts have been made to distil the empirical results into an intuitivepresentation; relevant citations and an annex are provided for those seek-ing further technical detail.
The Structure of the Algerian Economy
Algeria has made steady progress toward macroeconomic stability and anopen, more private sector–oriented economy. Reforms are underway inthe electricity and telecommunications sectors. Foreign direct investment(FDI) flows increased substantially over the past decade, with more thanhalf dedicated to the services sector.1 However, productivity has onlyturned positive in the mid 2000s, after remaining negative for anextended period of time (IMF 2009a). Unemployment is high, particularly
64 Hausmann, Klinger, and López-Cálix
among the young. The share of the private sector in gross domestic prod-uct (GDP) fell from 22 percent in 1995 to about 13 percent in 2004, andpublic investment has been high and increasing in recent years.
Algeria remains weakly integrated into the global economy. Despite itsmassive hydrocarbon exports, Algeria’s trade openness, as measured bythe ratio of non-oil exports and imports of goods and services to GDP (21percent), is the lowest in the Maghreb region (the other Maghreb coun-tries average more than 45 percent [Nabli 2007]). Trade integration isweak. More than half of Algerian products are exported to the EuropeanUnion, suggesting not only that proximity is the main determinant ofcompetitiveness but also that Algeria is extremely vulnerable to shifts inEuropean market access. Algeria and Libya are the only Maghreb coun-tries that have not completed accession to the World Trade Organization(WTO). Financial integration is also weak.
Algeria is highly specialized in hydrocarbons. The sector accounts forabout half of total output, three-quarters of fiscal revenues, and 98 per-cent of exports—the highest export concentration in Harmonized System(HS) 27 (mineral fuels, oils, and products of their distillation) of anycountry in the world. The Herfindahl index for the export basket in 2004was 0.42, among the 10 highest in the world. Even if one uses a simplecount of the number of exported products, Algeria is among the lowestin the world, at 184 (the figures are 336 in Saudi Arabia, 1,120 inMorocco, 2,849 in Indonesia, and 3,266 in Mexico [World Bank staff esti-mates]). Algeria has increased the share of oil in exports over the past30 years, while other oil exporters, such as the Islamic Republic of Iran,Oman, Saudi Arabia, and the Républica Bolivariana de Venezuela (untilthe late 1990s), have diversified away from hydrocarbons.
The manufacturing sector represents a relatively small percentage oftotal output and is small in absolute terms, even for an oil-concentratedeconomy. Manufacturing output per capita is half of that of the ArabRepublic of Egypt and less than one-fifth of that of Saudi Arabia.
Given this pattern of specialization, it is not surprising that aggregategrowth in Algeria is driven in large part by hydrocarbon prices. After adecade of sustained growth, output per capita began to fall in the early1980s, as oil prices declined; it was further reduced by the civil conflict inthe early 1990s. Although output per capita recovered, surpassing its his-torical peak, it did so in the context of a decline in the rate of populationgrowth, meaning that the working-age population grew faster than thetotal population. Output per working-age adult in Algeria, a better meas-ure of productivity per worker, is currently at the level it was in 1970, a
Export Diversification in Algeria 65
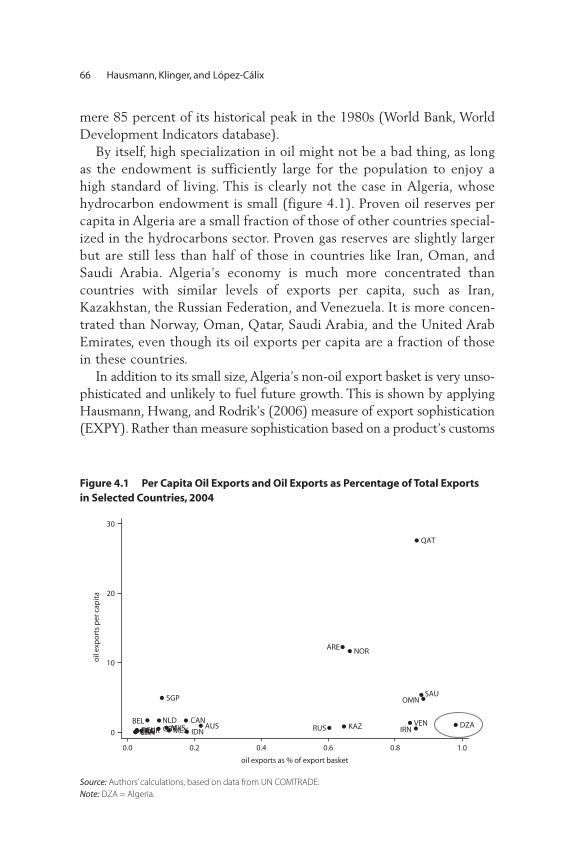
mere 85 percent of its historical peak in the 1980s (World Bank, WorldDevelopment Indicators database).
By itself, high specialization in oil might not be a bad thing, as longas the endowment is sufficiently large for the population to enjoy ahigh standard of living. This is clearly not the case in Algeria, whosehydrocarbon endowment is small (figure 4.1). Proven oil reserves percapita in Algeria are a small fraction of those of other countries special-ized in the hydrocarbons sector. Proven gas reserves are slightly largerbut are still less than half of those in countries like Iran, Oman, andSaudi Arabia. Algeria’s economy is much more concentrated thancountries with similar levels of exports per capita, such as Iran,Kazakhstan, the Russian Federation, and Venezuela. It is more concen-trated than Norway, Oman, Qatar, Saudi Arabia, and the United ArabEmirates, even though its oil exports per capita are a fraction of thosein these countries.
In addition to its small size, Algeria’s non-oil export basket is very unso-phisticated and unlikely to fuel future growth. This is shown by applyingHausmann, Hwang, and Rodrik’s (2006) measure of export sophistication(EXPY). Rather than measure sophistication based on a product’s customs
66 Hausmann, Klinger, and López-Cálix
Figure 4.1 Per Capita Oil Exports and Oil Exports as Percentage of Total Exports in Selected Countries, 2004
Source: Authors’ calculations, based on data from UN COMTRADE.Note: DZA = Algeria.
ARE
AUSBEL CAN
CHNDEUDZA
FRA GBR IDN IRNKAZKOR MEXMYS
NLD
NOR
OMN
QAT
RUS
SAUSGP
USAVEN
0
10
20
30
oil
exp
ort
s p
er c
apit
a
0.0 0.2 0.4 0.6 0.8 1.0
oil exports as % of export basket

classification, research and development (R&D) content, or any other apriori notion, EXPY measures sophistication as the GDP per capita of thetypical country with that export basket. By construction, rich countrieshave a high EXPY and poor countries have a low EXPY. But if one con-trols for GDP per capita, EXPY is a highly significant determinant of sub-sequent growth. Countries that have managed to export a relativelyrich-country export basket, given their level of development, grow morerapidly than countries that do not. Countries “become” what they export,converging to the level of income of their competitors. The content of acountry’s export package is thus important for growth.
Algeria’s overall EXPY (exact formula provided in the annex) is unin-formative given the country’s extreme concentration in hydrocarbons.We therefore calculate the EXPY of the non-oil export basket2 and com-pare it with the EXPY of non-oil exports for other oil exporters (figure4.2).3 As of 2004, the non-oil export package of Algeria does not com-pare favorably to other oil exporters. Particularly over the 1990s, otheroil-exporting countries, such as Indonesia, Mexico, Saudi Arabia, andeven Ecuador, upgraded their non-oil export package. In contrast,Algeria’s non-oil exports remained stagnant.
Export Diversification in Algeria 67
Figure 4.2 Non-Oil EXPY of Selected Countries, 1986–2004
Source: Authors’ calculations, based on UN COMTRADE and Feenstra and others 2005. Note: EXPY is the Hausmann, Hwang, and Rodrik (2006) measure of export sophistication. All calculations drop#27 from HS data and #33 and #34 from Standatd Industrial Track Classification (SITC) data.
4
6
8
10
12
14
16
exp
ort
s p
er y
ear (
tho
usa
nd
s o
f do
llars
)
18
19851986
19871988
19891990
19911992
19931994
19951996
19971998
19992000
20012002
20032004
AlgeriaAzerbaijan Ecuador IndonesiaMexico Saudi Arabia Venezuela, R. B. de
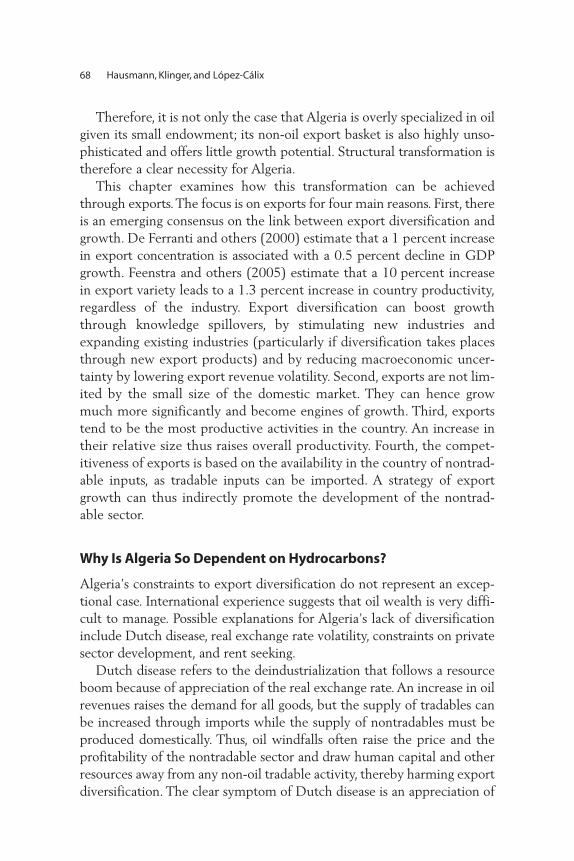
Therefore, it is not only the case that Algeria is overly specialized in oilgiven its small endowment; its non-oil export basket is also highly unso-phisticated and offers little growth potential. Structural transformation istherefore a clear necessity for Algeria.
This chapter examines how this transformation can be achievedthrough exports. The focus is on exports for four main reasons. First, thereis an emerging consensus on the link between export diversification andgrowth. De Ferranti and others (2000) estimate that a 1 percent increasein export concentration is associated with a 0.5 percent decline in GDPgrowth. Feenstra and others (2005) estimate that a 10 percent increasein export variety leads to a 1.3 percent increase in country productivity,regardless of the industry. Export diversification can boost growththrough knowledge spillovers, by stimulating new industries andexpanding existing industries (particularly if diversification takes placesthrough new export products) and by reducing macroeconomic uncer-tainty by lowering export revenue volatility. Second, exports are not lim-ited by the small size of the domestic market. They can hence growmuch more significantly and become engines of growth. Third, exportstend to be the most productive activities in the country. An increase intheir relative size thus raises overall productivity. Fourth, the compet-itiveness of exports is based on the availability in the country of nontrad-able inputs, as tradable inputs can be imported. A strategy of exportgrowth can thus indirectly promote the development of the nontrad-able sector.
Why Is Algeria So Dependent on Hydrocarbons?
Algeria’s constraints to export diversification do not represent an excep-tional case. International experience suggests that oil wealth is very diffi-cult to manage. Possible explanations for Algeria’s lack of diversificationinclude Dutch disease, real exchange rate volatility, constraints on privatesector development, and rent seeking.
Dutch disease refers to the deindustrialization that follows a resourceboom because of appreciation of the real exchange rate. An increase in oilrevenues raises the demand for all goods, but the supply of tradables canbe increased through imports while the supply of nontradables must beproduced domestically. Thus, oil windfalls often raise the price and theprofitability of the nontradable sector and draw human capital and otherresources away from any non-oil tradable activity, thereby harming exportdiversification. The clear symptom of Dutch disease is an appreciation of
68 Hausmann, Klinger, and López-Cálix
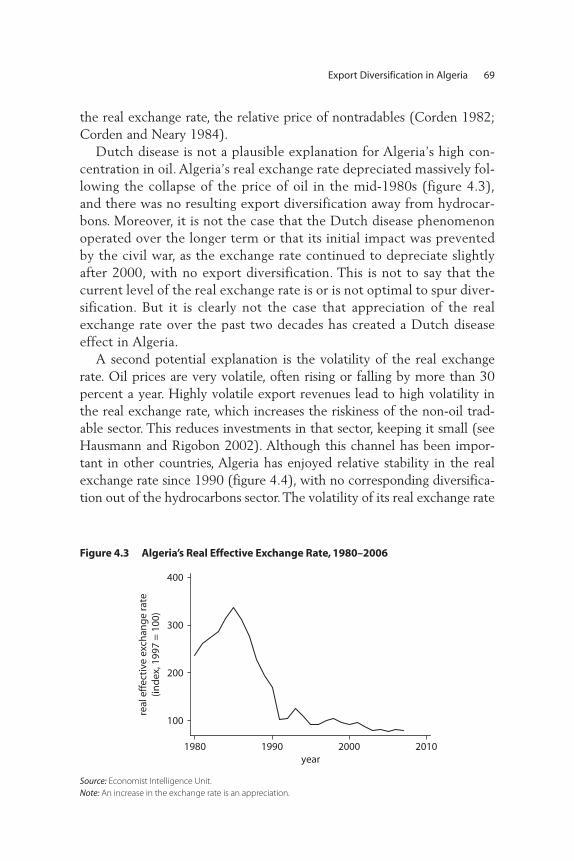
the real exchange rate, the relative price of nontradables (Corden 1982;Corden and Neary 1984).
Dutch disease is not a plausible explanation for Algeria’s high con-centration in oil. Algeria’s real exchange rate depreciated massively fol-lowing the collapse of the price of oil in the mid-1980s (figure 4.3),and there was no resulting export diversification away from hydrocar-bons. Moreover, it is not the case that the Dutch disease phenomenonoperated over the longer term or that its initial impact was preventedby the civil war, as the exchange rate continued to depreciate slightlyafter 2000, with no export diversification. This is not to say that thecurrent level of the real exchange rate is or is not optimal to spur diver-sification. But it is clearly not the case that appreciation of the realexchange rate over the past two decades has created a Dutch diseaseeffect in Algeria.
A second potential explanation is the volatility of the real exchangerate. Oil prices are very volatile, often rising or falling by more than 30percent a year. Highly volatile export revenues lead to high volatility inthe real exchange rate, which increases the riskiness of the non-oil trad-able sector. This reduces investments in that sector, keeping it small (seeHausmann and Rigobon 2002). Although this channel has been impor-tant in other countries, Algeria has enjoyed relative stability in the realexchange rate since 1990 (figure 4.4), with no corresponding diversifica-tion out of the hydrocarbons sector. The volatility of its real exchange rate
Export Diversification in Algeria 69
Figure 4.3 Algeria’s Real Effective Exchange Rate, 1980–2006
Source: Economist Intelligence Unit.Note: An increase in the exchange rate is an appreciation.
100
200
300
400
real
eff
ecti
ve e
xch
ang
e ra
te(in
dex
, 199
7 =
100
)
1980 1990 2000 2010year
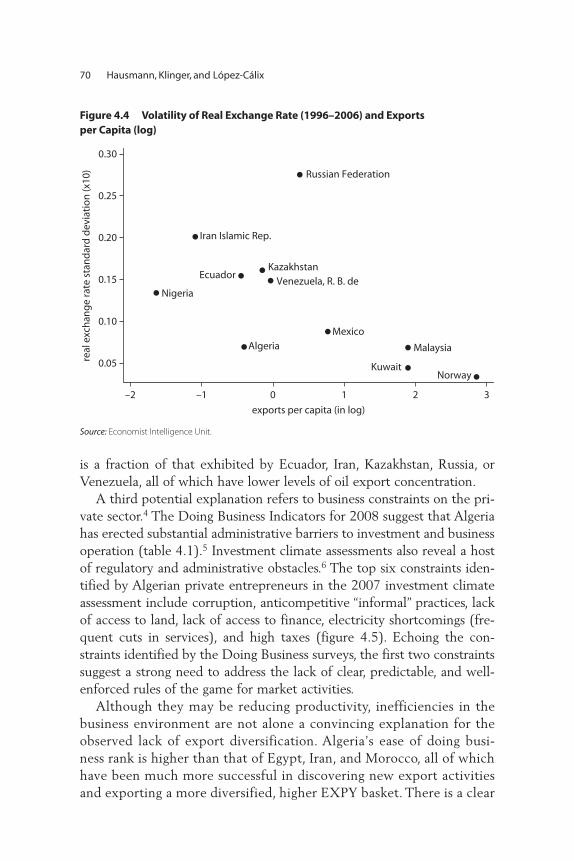
is a fraction of that exhibited by Ecuador, Iran, Kazakhstan, Russia, orVenezuela, all of which have lower levels of oil export concentration.
A third potential explanation refers to business constraints on the pri-vate sector.4 The Doing Business Indicators for 2008 suggest that Algeriahas erected substantial administrative barriers to investment and businessoperation (table 4.1).5 Investment climate assessments also reveal a hostof regulatory and administrative obstacles.6 The top six constraints iden-tified by Algerian private entrepreneurs in the 2007 investment climateassessment include corruption, anticompetitive “informal” practices, lackof access to land, lack of access to finance, electricity shortcomings (fre-quent cuts in services), and high taxes (figure 4.5). Echoing the con-straints identified by the Doing Business surveys, the first two constraintssuggest a strong need to address the lack of clear, predictable, and well-enforced rules of the game for market activities.
Although they may be reducing productivity, inefficiencies in thebusiness environment are not alone a convincing explanation for theobserved lack of export diversification. Algeria’s ease of doing busi-ness rank is higher than that of Egypt, Iran, and Morocco, all of whichhave been much more successful in discovering new export activitiesand exporting a more diversified, higher EXPY basket. There is a clear
70 Hausmann, Klinger, and López-Cálix
Figure 4.4 Volatility of Real Exchange Rate (1996–2006) and Exports per Capita (log)
Source: Economist Intelligence Unit.
Algeria
Ecuador
Iran Islamic Rep.
Kazakhstan
Kuwait
Malaysia
Mexico
Nigeria
Norway
Russian Federation
Venezuela, R. B. de
0.05
0.10
0.15
0.20
0.25
0.30
real
exc
han
ge
rate
sta
nd
ard
dev
iati
on
(x10
)
–2 –1 0 1 2 3
exports per capita (in log)
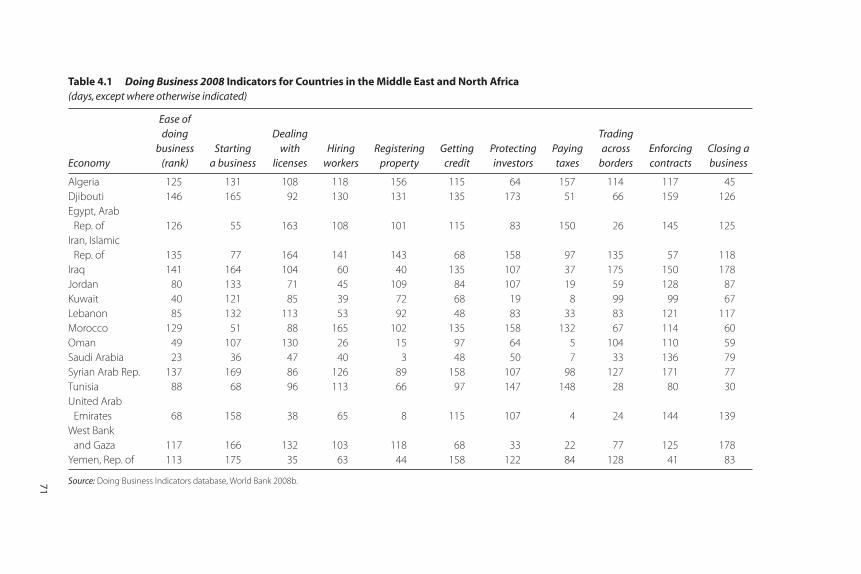
Table 4.1 Doing Business 2008 Indicators for Countries in the Middle East and North Africa (days, except where otherwise indicated)
Economy
Ease of doing
business (rank)
Starting a business
Dealing with
licensesHiring
workersRegistering
propertyGetting
creditProtecting investors
Paying taxes
Trading across
bordersEnforcing contracts
Closing a business
Algeria 125 131 108 118 156 115 64 157 114 117 45Djibouti 146 165 92 130 131 135 173 51 66 159 126Egypt, Arab
Rep. of 126 55 163 108 101 115 83 150 26 145 125Iran, Islamic
Rep. of 135 77 164 141 143 68 158 97 135 57 118Iraq 141 164 104 60 40 135 107 37 175 150 178Jordan 80 133 71 45 109 84 107 19 59 128 87Kuwait 40 121 85 39 72 68 19 8 99 99 67Lebanon 85 132 113 53 92 48 83 33 83 121 117Morocco 129 51 88 165 102 135 158 132 67 114 60Oman 49 107 130 26 15 97 64 5 104 110 59Saudi Arabia 23 36 47 40 3 48 50 7 33 136 79Syrian Arab Rep. 137 169 86 126 89 158 107 98 127 171 77Tunisia 88 68 96 113 66 97 147 148 28 80 30United Arab
Emirates 68 158 38 65 8 115 107 4 24 144 139West Bank
and Gaza 117 166 132 103 118 68 33 22 77 125 178Yemen, Rep. of 113 175 35 63 44 158 122 84 128 41 83
Source: Doing Business Indicators database, World Bank 2008b.71
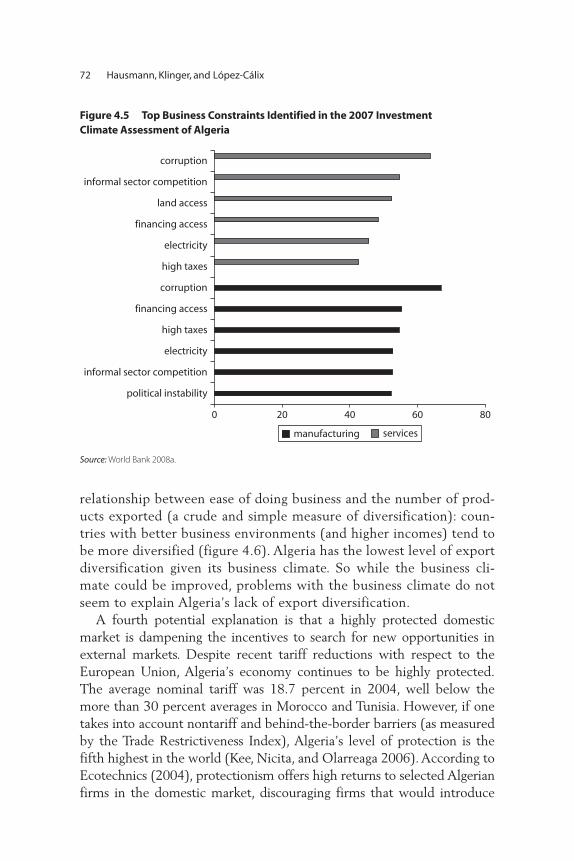
relationship between ease of doing business and the number of prod-ucts exported (a crude and simple measure of diversification): coun-tries with better business environments (and higher incomes) tend tobe more diversified (figure 4.6). Algeria has the lowest level of exportdiversification given its business climate. So while the business cli-mate could be improved, problems with the business climate do notseem to explain Algeria’s lack of export diversification.
A fourth potential explanation is that a highly protected domesticmarket is dampening the incentives to search for new opportunities inexternal markets. Despite recent tariff reductions with respect to theEuropean Union, Algeria’s economy continues to be highly protected.The average nominal tariff was 18.7 percent in 2004, well below themore than 30 percent averages in Morocco and Tunisia. However, if onetakes into account nontariff and behind-the-border barriers (as measuredby the Trade Restrictiveness Index), Algeria’s level of protection is thefifth highest in the world (Kee, Nicita, and Olarreaga 2006). According toEcotechnics (2004), protectionism offers high returns to selected Algerianfirms in the domestic market, discouraging firms that would introduce
72 Hausmann, Klinger, and López-Cálix
Figure 4.5 Top Business Constraints Identified in the 2007 Investment Climate Assessment of Algeria
0 20 40 60 80
political instability
informal sector competition
electricity
high taxes
financing access
corruption
high taxes
electricity
financing access
land access
informal sector competition
corruption
servicesmanufacturing
Source: World Bank 2008a.

new export products. This may dull incentives to search for new exportactivities, but it does not eliminate them, particularly for potential newentrants to the private sector, outsiders, or domestic-focused firms wish-ing to expand beyond the small domestic market. It is therefore not a con-vincing explanation for the lack of export diversification in Algeria.
A related explanation is that the availability of rents from the oil sec-tor diverts entrepreneurs’ attention from other export activities. When asubstantial share of a country’s wealth is allocated by the government,there is always a danger of diverting entrepreneurs from productive activ-ities to competition for government resources (see Baland and François2000 on rent-seeking because of oil). Obtaining data on this phenomenonis extremely difficult, but it is reasonable that these rents, as with a pro-tected domestic market, may be dulling (but not eliminating) the incen-tives for private sector investment in new export activities.
Beginning in the 1960s, Algeria, like other countries in theregion, embarked on an ambitious economic program with strong
Export Diversification in Algeria 73
Figure 4.6 Relationship between Number of Products Exported and Doing Business Ranking in Selected Countries(average of all years)
Source: Doing Business Indicators database, World Bank 2008b.Note: DZA = Algeria; RCA = revealed comparative advantage. Ease of doing business ranking is the country averagerank for all years for which data are available. The number of exported products with a revealed comparative advantage greater than 1 was calculated using 2000 UN Comtrade data.
ALB
DZA
ARG
ARM
AUS
AUT
AZEBHR BGDBLR
BLZ
BEN
BOL
BRA
BFA
BDI
CMR
CAN
CAF
CHL
CHN
COL
CRI
HRV
CZE
DNK
DOMECU
EGY
SLV
EST
ETH
FJI
FIN
GAB
GEO
GHA
GRC
GTM
GIN
GUY
HTI
HND
HUN
ISL
INDIDN
IRN
IRL
ISR
ITA
JAM
JPN
JOR
KAZKEN
LVA LBN
LTU
MDG
MWI
MYS
MLIMUS
MEX
MDA
MNG
MAR
MOZNPL
NLD
NZL
NIC
NER
NGA
NOR
OMN
PAKPAN
PNG
PRY
PER
PHL
POL
PRTROM
RWA
WSM
SAU
SEN
SLE
SGP
SVN
ZAF
ESP
LKA
SDN
SWE
SYRTJK
TZA
THA
TGO
TUR
UGA
UKR
URY
VEN
ZMB
ZWE
2
3
4
5
6
nu
mb
er o
f pro
du
cts
exp
ort
ed w
ith
RC
A>
1 (lo
g)
0 50 100 150 200
ease of doing business ranking
state intervention in all sectors of the economy. The period featurednationalizations and investment in newly formed state-owned enterprisesin priority sectors (often heavy industry but also in light manufacturing).The dominance of the economy by the government repressed the privatesector, with entrepreneurs continuously searching for niches of opportuni-ties in the “shadow” of state dirigisme.7 The breadth of these niches varies,but the extent of business opportunities for the few entrepreneurs allowedto exploit them could still be large. In contrast to the experiences in othertransition economies, the incomplete first-generation reforms and limitedopenness undertaken in Algeria have not resulted in the emergence of alarge and diversified new business elite or driven out of business (or mod-ernized) previously protected and privileged entrepreneurs deeplyentrenched in the state. In this political context, export diversification cansucceed only if a reinvigorated second wave of liberalization reforms, likethe ones Algeria implemented between the late 1990s and mid-2000s,allow for an expanded business elite.
Rent-seeking not a convincing explanation of the lack of diversificationof the Algerian economy. A great many countries have much largerendowments of oil—and therefore much higher rents to capture. Many ofthe countries shown in figure 4.1, such as Kazakhstan and Russia, featuresignificant state intervention in the economy but nevertheless have muchmore diversified export baskets. In some cases, movement to these newsectors was even spurred by such dirigisme.
These more traditional explanations do not seem to capture the spe-cial situation of Algeria as a hyperspecialized oil exporter without a com-mensurate endowment. This is not to say that an inefficient businessenvironment, protectionism, state intervention in the economy, or realexchange rate volatility are good things; addressing these issues mightvery well improve economic performance. But to understand why Algeriahas suffered such lagging export diversification, one must look elsewhere.
Applying a New Methodological Approach to Export Diversification
This section introduces a new methodology to export diversification inAlgeria. The country is shown to be specialized in a highly peripheral partof the product space—and not only because of its concentration in hydro-carbons. Even the activities that compose the non-oil export basket arehighly peripheral in the product space, which helps explain the severelack of export diversification.
74 Hausmann, Klinger, and López-Cálix
Rather than a consequence of exchange rate dynamics and a protectedand rent-rich domestic market, Algeria’s pattern of specialization may bethe principal cause of lagging export diversification. In standard trade the-ory, changes in the export basket are passive consequences of changingcomparative advantage based on factor accumulation. To grow, countriesaccumulate physical or human capital or improve the way they are mixedtogether (total factor productivity). These fundamental changes result ina different export mix, with the assumption being that there is always aproduct or set of products through which a country can express its fac-tors of production (see, for example, Leamer 1987). Put in another way,structural transformation will be a passive consequence of a countryincreasing its education, financial resources, overall productivity, and soon. One can therefore forget the world of products and instead focus onthe underlying fundamentals.
Export diversification may be more complicated than this picture sug-gests, for many reasons. Factors such as industry-specific learning by doing(Arrow 1962; Bardhan 1970) or industry externalities (Jaffe 1986) maycreate market failures in changing the export mix. There may also betechnological spillovers among industries (Jaffe, Trajtenberg, andHenderson 1993). The process of finding out which of the many poten-tial products best express a country’s changing comparative advantagemay create information externalities (Hausmann and Rodrik 2003;Klinger 2007). These hypotheses suggest that moving to new exportproducts may not be a passive consequence of factor accumulation or asmooth process that occurs along a continuum.
Hausmann and Klinger (2006, 2007) investigate the process by whichcountries move to new export activities and motivate the concept of a“product space.” In this space, some products are very near one anotherand others are far apart; countries change their export mix by moving tonew export activities that are near their current activities.
The notion is based on the idea that every product requires capabilitiesthat are highly specific to that activity. Knowledge, physical assets, inter-mediate inputs, labor-training requirements, infrastructure needs, propertyrights, regulatory requirements, and so on are not homogeneous. Rather,there are knowledge, physical assets, intermediate inputs, and labor skillsspecific to the production of each sector. The capabilities required toproduce wine are very different from those used to produce cotton.Established industries have already sorted out the many potential failuresinvolved in ensuring the presence of all of these inputs, which are thenavailable to subsequent entrants in the industry. Firms that venture into
Export Diversification in Algeria 75
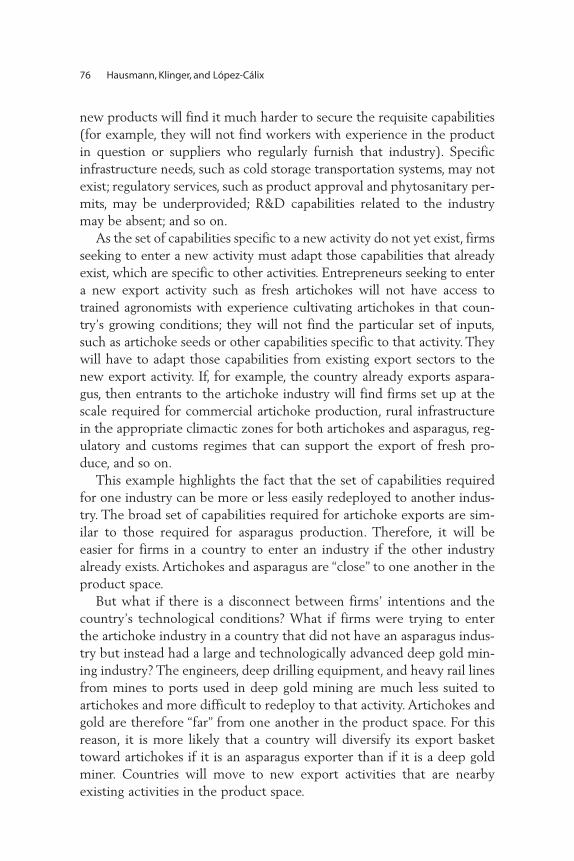
new products will find it much harder to secure the requisite capabilities(for example, they will not find workers with experience in the productin question or suppliers who regularly furnish that industry). Specificinfrastructure needs, such as cold storage transportation systems, may notexist; regulatory services, such as product approval and phytosanitary per-mits, may be underprovided; R&D capabilities related to the industrymay be absent; and so on.
As the set of capabilities specific to a new activity do not yet exist, firmsseeking to enter a new activity must adapt those capabilities that alreadyexist, which are specific to other activities. Entrepreneurs seeking to entera new export activity such as fresh artichokes will not have access totrained agronomists with experience cultivating artichokes in that coun-try’s growing conditions; they will not find the particular set of inputs,such as artichoke seeds or other capabilities specific to that activity. Theywill have to adapt those capabilities from existing export sectors to thenew export activity. If, for example, the country already exports aspara-gus, then entrants to the artichoke industry will find firms set up at thescale required for commercial artichoke production, rural infrastructurein the appropriate climactic zones for both artichokes and asparagus, reg-ulatory and customs regimes that can support the export of fresh pro-duce, and so on.
This example highlights the fact that the set of capabilities requiredfor one industry can be more or less easily redeployed to another indus-try. The broad set of capabilities required for artichoke exports are sim-ilar to those required for asparagus production. Therefore, it will beeasier for firms in a country to enter an industry if the other industryalready exists. Artichokes and asparagus are “close” to one another in theproduct space.
But what if there is a disconnect between firms’ intentions and thecountry’s technological conditions? What if firms were trying to enterthe artichoke industry in a country that did not have an asparagus indus-try but instead had a large and technologically advanced deep gold min-ing industry? The engineers, deep drilling equipment, and heavy rail linesfrom mines to ports used in deep gold mining are much less suited toartichokes and more difficult to redeploy to that activity. Artichokes andgold are therefore “far” from one another in the product space. For thisreason, it is more likely that a country will diversify its export baskettoward artichokes if it is an asparagus exporter than if it is a deep goldminer. Countries will move to new export activities that are nearbyexisting activities in the product space.
76 Hausmann, Klinger, and López-Cálix
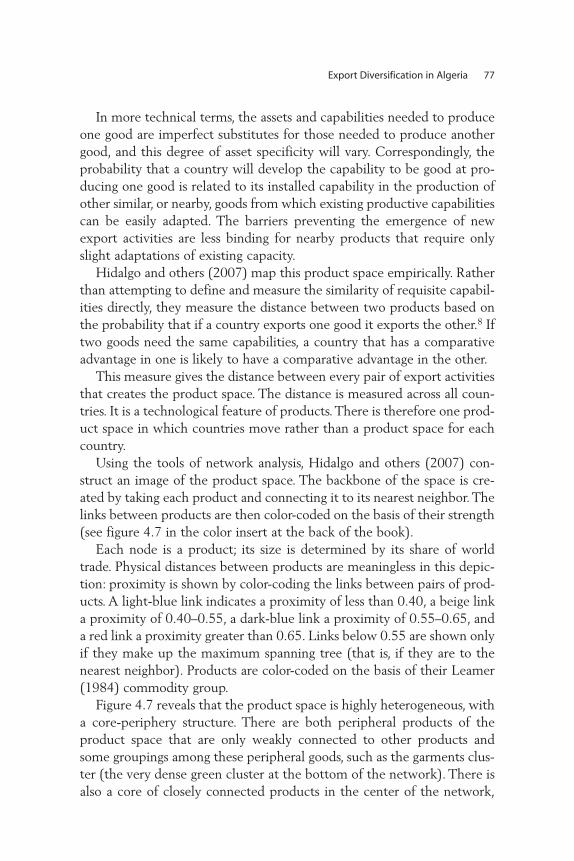
In more technical terms, the assets and capabilities needed to produceone good are imperfect substitutes for those needed to produce anothergood, and this degree of asset specificity will vary. Correspondingly, theprobability that a country will develop the capability to be good at pro-ducing one good is related to its installed capability in the production ofother similar, or nearby, goods from which existing productive capabilitiescan be easily adapted. The barriers preventing the emergence of newexport activities are less binding for nearby products that require onlyslight adaptations of existing capacity.
Hidalgo and others (2007) map this product space empirically. Ratherthan attempting to define and measure the similarity of requisite capabil-ities directly, they measure the distance between two products based onthe probability that if a country exports one good it exports the other.8 Iftwo goods need the same capabilities, a country that has a comparativeadvantage in one is likely to have a comparative advantage in the other.
This measure gives the distance between every pair of export activitiesthat creates the product space. The distance is measured across all coun-tries. It is a technological feature of products. There is therefore one prod-uct space in which countries move rather than a product space for eachcountry.
Using the tools of network analysis, Hidalgo and others (2007) con-struct an image of the product space. The backbone of the space is cre-ated by taking each product and connecting it to its nearest neighbor. Thelinks between products are then color-coded on the basis of their strength(see figure 4.7 in the color insert at the back of the book).
Each node is a product; its size is determined by its share of worldtrade. Physical distances between products are meaningless in this depic-tion: proximity is shown by color-coding the links between pairs of prod-ucts. A light-blue link indicates a proximity of less than 0.40, a beige linka proximity of 0.40–0.55, a dark-blue link a proximity of 0.55–0.65, anda red link a proximity greater than 0.65. Links below 0.55 are shown onlyif they make up the maximum spanning tree (that is, if they are to thenearest neighbor). Products are color-coded on the basis of their Leamer(1984) commodity group.
Figure 4.7 reveals that the product space is highly heterogeneous, witha core-periphery structure. There are both peripheral products of theproduct space that are only weakly connected to other products andsome groupings among these peripheral goods, such as the garments clus-ter (the very dense green cluster at the bottom of the network). There isalso a core of closely connected products in the center of the network,
Export Diversification in Algeria 77

mainly of machinery and other capital-intensive goods, as well as a clus-ter of electronics (light blue products at the top-right of the space) thatis well connected to the core.
This heterogeneous structure of the product space has importantimplications for export diversification. If a country is producing goods ina dense part of the product space, the process of export diversification ismuch easier, because the set of acquired capabilities can be easily rede-ployed to other nearby products. In contrast, if a country is specialized inperipheral products, redeployment is more challenging, because there isnot a set of nearby products requiring similar capabilities. Hausmann andKlinger (2007) and Hidalgo and others (2007) show very strongly thatcountries move toward nearby activities over time; it is rare to observejumps across large distances in this space.
An important feature of this space from Algeria’s perspective is thelarge red nodes at the outer-left periphery of the product space. These arehydrocarbons, which are poorly connected to the rest of the productspace. This is not surprising, as oil exporters are well known to have con-centrated export baskets and suffer poor export diversification. But thisidea of the product space and the structure of the space observed in thedata give a much more finegrained explanation for this lack of diversifi-cation. The hydrocarbons sector uses a particular set of productive capa-bilities (in addition to the raw natural resource endowment), such as acentral authority, which can secure the extraction site and transmissionlines and grant property rights to extraction firms; the physical capital toextract and ship the oil to a port; and so on. These capabilities are verydifficult to redeploy to other sectors: artichokes and asparagus cannot besent down an oil pipeline. The process of export diversification is inhib-ited because most new activities are very far away in the space andrequire a completely new set of capabilities.
Figure 4.8 (see color insert) shows Algeria’s exports in this productspace in 1975 and again 25 years later by placing a black square ontop of every product in which the country had comparative advantagethat year. Not surprisingly, there is almost complete specialization ina very peripheral set of sectors, with little movement to new exportactivities.
Unlike other oil exporters with higher connectedness for their non-oilexports, Algeria does not have a comparative advantage in any otherexport sectors located in a more connected part of the product space thatcould fuel export diversification. It is in an extremely sparse part of thespace, suggesting that export diversification will be a major challenge.
78 Hausmann, Klinger, and López-Cálix

Hausmann and Klinger (2006) develop a metric that summarizes theoverall level of connectedness of a country’s export basket in this space inone number. This “open forest” measure (see annex) is a strong determi-nant of a country’s ability to diversify its exports and move to new, moresophisticated export activities over time (Hausmann and Klinger 2006).Different countries have different opportunities for export diversifica-tion; some are specialized in very well-connected export baskets, othersare not. Algeria has the least-connected export basket of any country inthe sample (figure 4.9).
This is not a new development. Compared with other countries in theregion, also oil exporters worldwide, and even least-developed oilexporters, Algeria has been specialized in a very unconnected part of theproduct space. This is not only because of oil. The country’s non-oilexport basket is also very peripheral in the product space. Figure 4.10takes oil out of the export basket and assumes that Algeria has a compar-ative advantage in every single product it exports. Even this most opti-mistic open forest that can be calculated for Algeria remains very lowrelative to other countries.
Export Diversification in Algeria 79
Figure 4.9 Relationship between Open Forest and GDP per Capita in Selected Countries, 2004
Source: Authors’ calculations, using data from UN COMTRADE and World Development Indicators.Note: DZA = Algeria, PPP = purchasing power parity.
ARG AUS
AUT
AZE
BDI
BEL
BEN
BFA
BGD
BGRBLR
BOL
BRA CANCHE
CHL
CHN
COL
CZE DEUDNK
DZA
ECU
EGY
ESP
FIN
FRAGBR
GEO
GRC
GTMHKG
HND
HUNIDNIND
IRN
ISR
ITA
JPN
KAZ
KEN
KHM
KOR
MAR
MDG
MEX
MWI
MYS
NER
NIC
NLD
PERPHL
POLPRT
PRY
ROM
RUS
SAU
SDN
SEN
SLV
SVK SWETHA
TUN
TUR
TZA
UGA
UKR
USA
VEN
ZAF
ZMB
12
13
14
15
16
op
en fo
rest
(lo
g)
6 7 8 9 10 11
real GDP per capita (log, PPP)
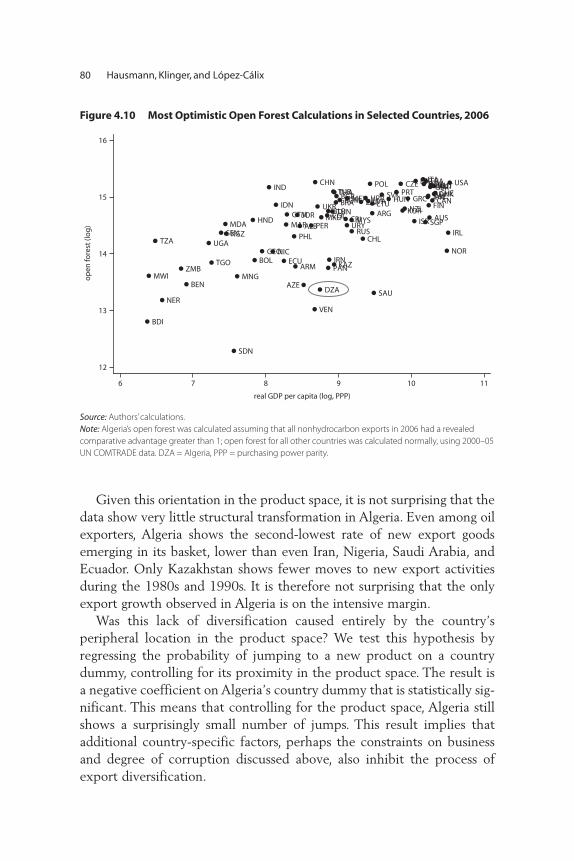
Given this orientation in the product space, it is not surprising that thedata show very little structural transformation in Algeria. Even among oilexporters, Algeria shows the second-lowest rate of new export goodsemerging in its basket, lower than even Iran, Nigeria, Saudi Arabia, andEcuador. Only Kazakhstan shows fewer moves to new export activitiesduring the 1980s and 1990s. It is therefore not surprising that the onlyexport growth observed in Algeria is on the intensive margin.
Was this lack of diversification caused entirely by the country’speripheral location in the product space? We test this hypothesis byregressing the probability of jumping to a new product on a countrydummy, controlling for its proximity in the product space. The result isa negative coefficient on Algeria’s country dummy that is statistically sig-nificant. This means that controlling for the product space, Algeria stillshows a surprisingly small number of jumps. This result implies thatadditional country-specific factors, perhaps the constraints on businessand degree of corruption discussed above, also inhibit the process ofexport diversification.
80 Hausmann, Klinger, and López-Cálix
Figure 4.10 Most Optimistic Open Forest Calculations in Selected Countries, 2006
Source: Authors’ calculations.Note: Algeria’s open forest was calculated assuming that all nonhydrocarbon exports in 2006 had a revealedcomparative advantage greater than 1; open forest for all other countries was calculated normally, using 2000–05UN COMTRADE data. DZA = Algeria, PPP = purchasing power parity.
ALB
ARG
ARM
AUS
AUT
AZE
BDI
BEL
BEN
BGR
BLR
BOL
BRA CANCHE
CHL
CHN
COL CRI
CZE DEUDNK
ECU
ESP
FIN
FRAGBR
GEO
GRC
GTMHND
HRV HUNIDN
IND
IRL
IRN
ISR
ITA
JOR
JPN
KAZ
KGZ
KORLTULVA
MARMDA
MEX
MKD
MNGMWI
MYS
NER
NIC
NLD
NOR
NZL
PAN
PER
PHL
POLPRT
ROM
RUS
SAU
SDN
SENSGP
SVK SWE
TGO
THA
TUN
TUR
TZA UGA
UKR
URY
USA
VEN
ZAF
ZMB
DZA
12
13
14
15
16
op
en fo
rest
(lo
g)
6 7 8 9 10 11
real GDP per capita (log, PPP)
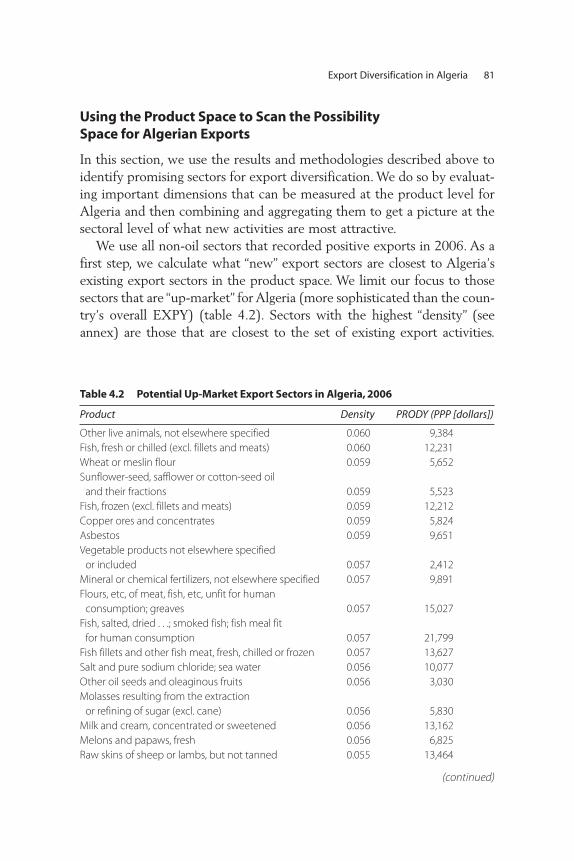
Using the Product Space to Scan the Possibility Space for Algerian Exports
In this section, we use the results and methodologies described above toidentify promising sectors for export diversification. We do so by evaluat-ing important dimensions that can be measured at the product level forAlgeria and then combining and aggregating them to get a picture at thesectoral level of what new activities are most attractive.
We use all non-oil sectors that recorded positive exports in 2006. As afirst step, we calculate what “new” export sectors are closest to Algeria’sexisting export sectors in the product space. We limit our focus to thosesectors that are “up-market” for Algeria (more sophisticated than the coun-try’s overall EXPY) (table 4.2). Sectors with the highest “density” (seeannex) are those that are closest to the set of existing export activities.
Export Diversification in Algeria 81
Table 4.2 Potential Up-Market Export Sectors in Algeria, 2006
Product Density PRODY (PPP [dollars])
Other live animals, not elsewhere specified 0.060 9,384Fish, fresh or chilled (excl. fillets and meats) 0.060 12,231Wheat or meslin flour 0.059 5,652Sunflower-seed, safflower or cotton-seed oil
and their fractions 0.059 5,523Fish, frozen (excl. fillets and meats) 0.059 12,212Copper ores and concentrates 0.059 5,824Asbestos 0.059 9,651Vegetable products not elsewhere specified
or included 0.057 2,412Mineral or chemical fertilizers, not elsewhere specified 0.057 9,891Flours, etc, of meat, fish, etc, unfit for human
consumption; greaves 0.057 15,027Fish, salted, dried . . .; smoked fish; fish meal fit
for human consumption 0.057 21,799Fish fillets and other fish meat, fresh, chilled or frozen 0.057 13,627Salt and pure sodium chloride; sea water 0.056 10,077Other oil seeds and oleaginous fruits 0.056 3,030Molasses resulting from the extraction
or refining of sugar (excl. cane) 0.056 5,830Milk and cream, concentrated or sweetened 0.056 13,162Melons and papaws, fresh 0.056 6,825Raw skins of sheep or lambs, but not tanned 0.055 13,464
(continued)

82 Hausmann, Klinger, and López-Cálix
Table 4.2 Potential Up-Market Export Sectors in Algeria, 2006 (continued)
Product Density PRODY (PPP [dollars])
Fruit juices (incl. grape must) and vegetable juices, unfermented 0.055 7,766
Citrus fruit, fresh or dried 0.055 9,485Wood sawn or chipped lengthwise, sliced or peeled,
>6mm thick 0.054 13,218Unmanufactured tobacco; tobacco refuse 0.054 2,166Sugar confectionery (incl. white chocolate),
not containing cocoa 0.054 10,513Natural cork; waste cork; crushed, granulated
or ground cork 0.054 14,283Live sheep and goats 0.054 3,489Yeasts; other single-cell micro-organisms, dead;
prepared baking powders 0.053 12,714Manganese ores and concentrates, with a
manganese content of >20% 0.053 13,713Wool, not carded or combed 0.052 17,921Potatoes, fresh or chilled 0.052 14,878Builders’ joinery and carpentry of wood, including
cellular wood panels, not elsewhere specified 0.052 15,190Wood in the rough or roughly squared 0.051 12,728Tomatoes prepared or preserved otherwise than
by vinegar or acetic acid 0.051 12,611Preparation of vegetables, fruit, nuts or other parts
of plants 0.051 14,370Animal products, not elsewhere specified;
dead of chapters 1 and 3, unfit for human consumption. 0.051 12,633
Toilet paper. . ., bed sheets, etc, articles of clothing, of paper. . . 0.050 14,540
Other manufactured tobacco and substitutes; homogenized or reconstituted tobacco; tobacco extracts and essences 0.050 27,836
Iron ores and concentrates, including roasted iron pyrites 0.050 13,762
Hydrogen chloride (hydrochloric acid) 0.050 14,632Electrical energy 0.050 16,264Bread, pastry, cakes, etc; communion wafers,
rice paper, etc 0.050 13,803Uncoated kraft paper and paperboard, in rolls or sheets 0.049 20,124Fuel wood, in logs. . ., etc; wood chips or particles;
sawdust, etc 0.049 13,609Cereal groats, meal and pellets 0.049 12,690
Source: Authors’ calculations, based on UN COMTRADE and Algerian Ministry of External Trade data.Note: Table shows all products not exported in 2006 for which PRODY (product sophistication) is greater thanEXPY. PPP = purchasing power parity.
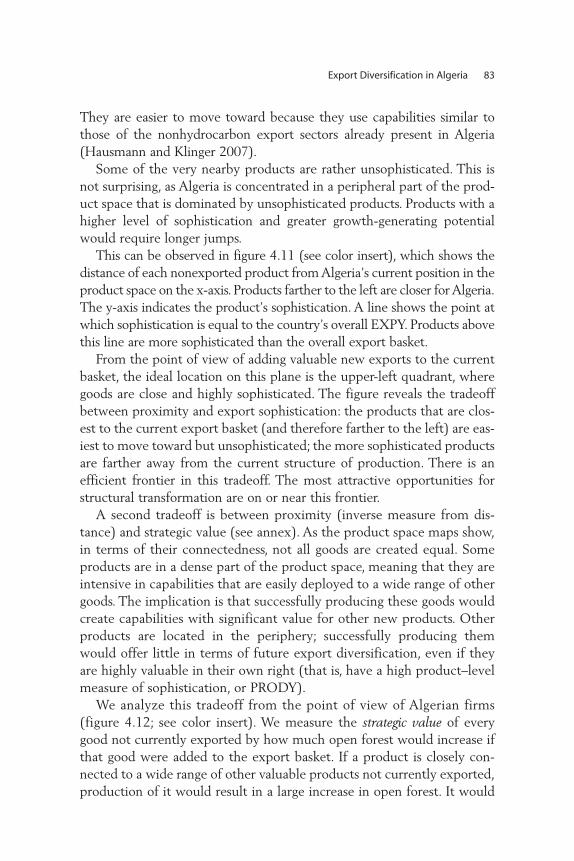
They are easier to move toward because they use capabilities similar tothose of the nonhydrocarbon export sectors already present in Algeria(Hausmann and Klinger 2007).
Some of the very nearby products are rather unsophisticated. This isnot surprising, as Algeria is concentrated in a peripheral part of the prod-uct space that is dominated by unsophisticated products. Products with ahigher level of sophistication and greater growth-generating potentialwould require longer jumps.
This can be observed in figure 4.11 (see color insert), which shows thedistance of each nonexported product from Algeria’s current position in theproduct space on the x-axis. Products farther to the left are closer for Algeria.The y-axis indicates the product’s sophistication. A line shows the point atwhich sophistication is equal to the country’s overall EXPY. Products abovethis line are more sophisticated than the overall export basket.
From the point of view of adding valuable new exports to the currentbasket, the ideal location on this plane is the upper-left quadrant, wheregoods are close and highly sophisticated. The figure reveals the tradeoffbetween proximity and export sophistication: the products that are clos-est to the current export basket (and therefore farther to the left) are eas-iest to move toward but unsophisticated; the more sophisticated productsare farther away from the current structure of production. There is anefficient frontier in this tradeoff. The most attractive opportunities forstructural transformation are on or near this frontier.
A second tradeoff is between proximity (inverse measure from dis-tance) and strategic value (see annex). As the product space maps show,in terms of their connectedness, not all goods are created equal. Someproducts are in a dense part of the product space, meaning that they areintensive in capabilities that are easily deployed to a wide range of othergoods. The implication is that successfully producing these goods wouldcreate capabilities with significant value for other new products. Otherproducts are located in the periphery; successfully producing themwould offer little in terms of future export diversification, even if theyare highly valuable in their own right (that is, have a high product–levelmeasure of sophistication, or PRODY).
We analyze this tradeoff from the point of view of Algerian firms(figure 4.12; see color insert). We measure the strategic value of everygood not currently exported by how much open forest would increase ifthat good were added to the export basket. If a product is closely con-nected to a wide range of other valuable products not currently exported,production of it would result in a large increase in open forest. It would
Export Diversification in Algeria 83
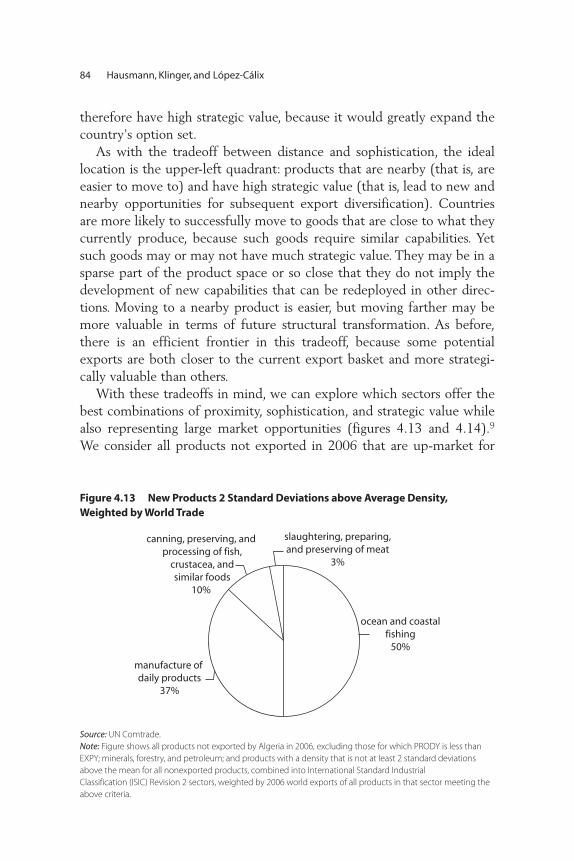
therefore have high strategic value, because it would greatly expand thecountry’s option set.
As with the tradeoff between distance and sophistication, the ideallocation is the upper-left quadrant: products that are nearby (that is, areeasier to move to) and have high strategic value (that is, lead to new andnearby opportunities for subsequent export diversification). Countriesare more likely to successfully move to goods that are close to what theycurrently produce, because such goods require similar capabilities. Yetsuch goods may or may not have much strategic value. They may be in asparse part of the product space or so close that they do not imply thedevelopment of new capabilities that can be redeployed in other direc-tions. Moving to a nearby product is easier, but moving farther may bemore valuable in terms of future structural transformation. As before,there is an efficient frontier in this tradeoff, because some potentialexports are both closer to the current export basket and more strategi-cally valuable than others.
With these tradeoffs in mind, we can explore which sectors offer thebest combinations of proximity, sophistication, and strategic value whilealso representing large market opportunities (figures 4.13 and 4.14).9
We consider all products not exported in 2006 that are up-market for
84 Hausmann, Klinger, and López-Cálix
manufacture of daily products
37%
canning, preserving, and processing of fish,
crustacea, andsimilar foods
10%
ocean and coastalfishing
50%
slaughtering, preparing,and preserving of meat
3%
Figure 4.13 New Products 2 Standard Deviations above Average Density, Weighted by World Trade
Source: UN Comtrade. Note: Figure shows all products not exported by Algeria in 2006, excluding those for which PRODY is less thanEXPY; minerals, forestry, and petroleum; and products with a density that is not at least 2 standard deviationsabove the mean for all nonexported products, combined into International Standard Industrial Classification (ISIC) Revision 2 sectors, weighted by 2006 world exports of all products in that sector meeting theabove criteria.
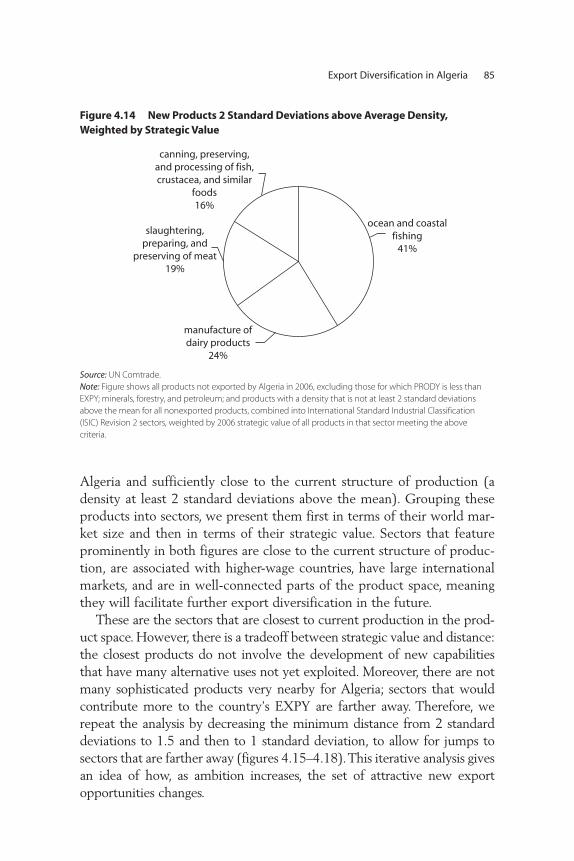
Algeria and sufficiently close to the current structure of production (adensity at least 2 standard deviations above the mean). Grouping theseproducts into sectors, we present them first in terms of their world mar-ket size and then in terms of their strategic value. Sectors that featureprominently in both figures are close to the current structure of produc-tion, are associated with higher-wage countries, have large internationalmarkets, and are in well-connected parts of the product space, meaningthey will facilitate further export diversification in the future.
These are the sectors that are closest to current production in the prod-uct space. However, there is a tradeoff between strategic value and distance:the closest products do not involve the development of new capabilitiesthat have many alternative uses not yet exploited. Moreover, there are notmany sophisticated products very nearby for Algeria; sectors that wouldcontribute more to the country’s EXPY are farther away. Therefore, werepeat the analysis by decreasing the minimum distance from 2 standarddeviations to 1.5 and then to 1 standard deviation, to allow for jumps tosectors that are farther away (figures 4.15–4.18). This iterative analysis givesan idea of how, as ambition increases, the set of attractive new exportopportunities changes.
Export Diversification in Algeria 85
Figure 4.14 New Products 2 Standard Deviations above Average Density, Weighted by Strategic Value
Source: UN Comtrade. Note: Figure shows all products not exported by Algeria in 2006, excluding those for which PRODY is less thanEXPY; minerals, forestry, and petroleum; and products with a density that is not at least 2 standard deviationsabove the mean for all nonexported products, combined into International Standard Industrial Classification(ISIC) Revision 2 sectors, weighted by 2006 strategic value of all products in that sector meeting the above criteria.
ocean and coastalfishing
41%
manufacture ofdairy products
24%
slaughtering,preparing, and
preserving of meat19%
canning, preserving,and processing of fish,crustacea, and similar
foods16%

These figures indicate that the following sectors, in order of priority,are among the most attractive nearby export opportunities for Algeria:
• Meat milk, and fishing products• Other agroindustrial products and chemicals• Steel and aluminum, metal products, and shipbuilding.
This method of identifying high-potential export sectors has numerousadvantages:
• It is highly systematic and evaluates all potential export activities beyond a certain threshold.
• It is customized to Algeria, as it is based on each of the country’s currentnon-oil export activities and its links to all other potential activities.These links, in turn, are based on the product-level export experience
86 Hausmann, Klinger, and López-Cálix
Figure 4.15 New Products 1.5 Standard Deviations above Average Density, Weighted by World Trade
Source: UN Comtrade. Note: Figure shows all products not exported by Algeria in 2006, excluding those for which PRODY is less thanEXPY; minerals, forestry, and petroleum; and products with a density that is not at least 1.5 standard deviationsabove the mean for all nonexported products, combined into International Standard Industrial Classification(ISIC) Revision 2 sectors, weighted by 2006 world exports of all products in that sector meeting the above criteria.
manufacture ofbakery products
24%
ocean and coastalfishing23%
manufacture ofdairy products
17%
canning andpreserving of fruits
and vegetables15%
canning, preserving,and processing of fish, crustacea, and
similar foods5%
spinning, weaving,and finishing of textiles
5%
tobacco manufactures4%
agricultural andlivestock production
3%
slaughtering, preparing,and preserving of meat
3%
manufacture of foodproducts not
elsewhere classified2%
manufacture of basicindustrial chemicals
except fertilizer0%
of all countries in the world, meaning a significant amount of informa-tion is applied to the evaluation.
• It is based on the systematic relationships that sophistication and dis-tance have with structural transformation and growth that are robustlyestablished in the data.
Compared with other methodologies, this methodology is rigorous,systematic, data driven, empirically supported, and objective.
One important drawback of the approach is that it considers only thegoods sector. Trade in services is ignored, because Algerian data on tradein services are partial and inadequate. Given the emerging role servicesexports are playing, this is unfortunate.10 Because of this approach’sdrawbacks, some of which do not affect the methodologies, it shouldcomplement rather than substitute for traditional approaches.
Export Diversification in Algeria 87
Source: UN Comtrade. Note: Figure shows all products not exported by Algeria in 2006, excluding those for which PRODY is less thanEXPY; minerals, forestry, and petroleum; and products with a density that is not at least 1.5 standard deviationsabove the mean for all nonexported products, combined into International Standard Industrial Classification(ISIC) Revision 2 sectors, weighted by 2006 world exports of all products in that sector meeting the above criteria.
slaughtering,preparing, and
preserving of meat14%
canning andpreserving of fruits
and vegetables14%
ocean and coastalfishing
13%
manufacture of basicindustrial chemicals
except fertilizer9%
manufacture of bakeryproducts
9%
tobaccomanufactures
9%
manufacture of foodproducts not
elsewhere classified8%
agricultural andlivestock production
8%
manufacture of dairyproducts
7%
canning, preserving, andprocessing of fish, crustacea,
and similar foods5%
spinning, weaving, andfinishing of textiles
4%
Figure 4.16 New Products 1.5 Standard Deviations above Average Density, Weighted by Strategic Value
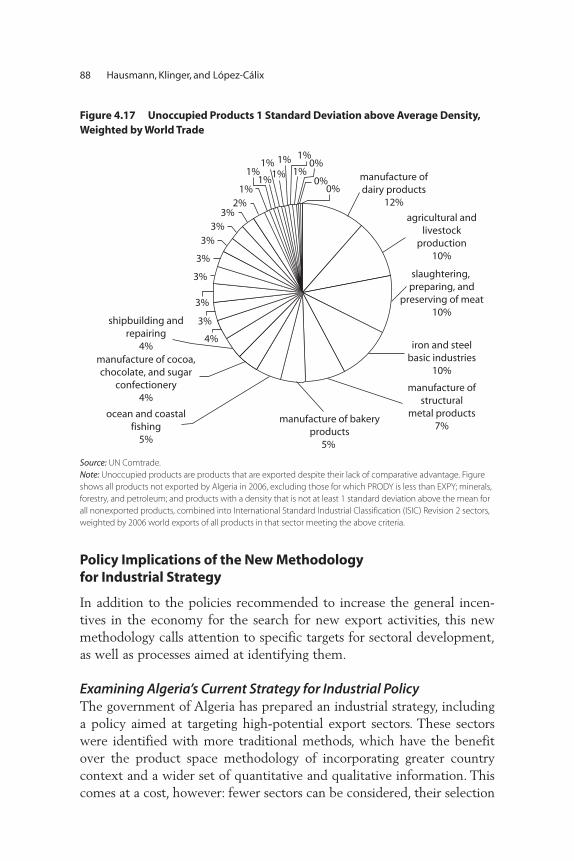
Policy Implications of the New Methodology for Industrial Strategy
In addition to the policies recommended to increase the general incen-tives in the economy for the search for new export activities, this newmethodology calls attention to specific targets for sectoral development,as well as processes aimed at identifying them.
Examining Algeria’s Current Strategy for Industrial PolicyThe government of Algeria has prepared an industrial strategy, includinga policy aimed at targeting high-potential export sectors. These sectorswere identified with more traditional methods, which have the benefitover the product space methodology of incorporating greater countrycontext and a wider set of quantitative and qualitative information. Thiscomes at a cost, however: fewer sectors can be considered, their selection
88 Hausmann, Klinger, and López-Cálix
Figure 4.17 Unoccupied Products 1 Standard Deviation above Average Density,Weighted by World Trade
Source: UN Comtrade. Note: Unoccupied products are products that are exported despite their lack of comparative advantage. Figureshows all products not exported by Algeria in 2006, excluding those for which PRODY is less than EXPY; minerals,forestry, and petroleum; and products with a density that is not at least 1 standard deviation above the mean forall nonexported products, combined into International Standard Industrial Classification (ISIC) Revision 2 sectors,weighted by 2006 world exports of all products in that sector meeting the above criteria.
manufacture ofdairy products
12%
agricultural andlivestock
production10%
slaughtering, preparing, and
preserving of meat10%
iron and steelbasic industries
10%
manufacture ofstructural
metal products7%
manufacture of bakeryproducts
5%
ocean and coastalfishing
5%
manufacture of cocoa,chocolate, and sugar
confectionery4%
shipbuilding andrepairing
4%4%
3%
3%
3%
3%
3%3%
3%2%
1%
1%1%1%1%
1%1% 1%
0%
0%
0%
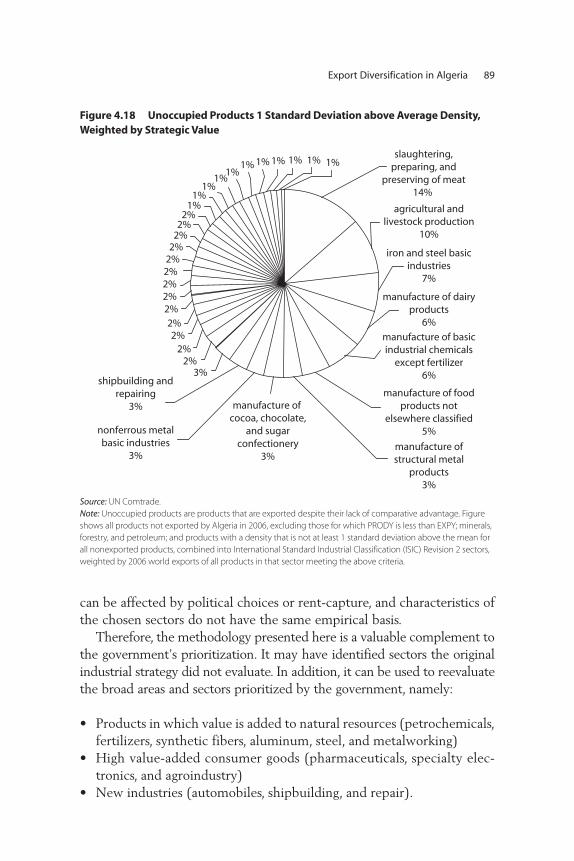
can be affected by political choices or rent-capture, and characteristics ofthe chosen sectors do not have the same empirical basis.
Therefore, the methodology presented here is a valuable complement tothe government’s prioritization. It may have identified sectors the originalindustrial strategy did not evaluate. In addition, it can be used to reevaluatethe broad areas and sectors prioritized by the government, namely:
• Products in which value is added to natural resources (petrochemicals,fertilizers, synthetic fibers, aluminum, steel, and metalworking)
• High value-added consumer goods (pharmaceuticals, specialty elec-tronics, and agroindustry)
• New industries (automobiles, shipbuilding, and repair).
Export Diversification in Algeria 89
Figure 4.18 Unoccupied Products 1 Standard Deviation above Average Density,Weighted by Strategic Value
Source: UN Comtrade. Note: Unoccupied products are products that are exported despite their lack of comparative advantage. Figureshows all products not exported by Algeria in 2006, excluding those for which PRODY is less than EXPY; minerals,forestry, and petroleum; and products with a density that is not at least 1 standard deviation above the mean forall nonexported products, combined into International Standard Industrial Classification (ISIC) Revision 2 sectors,weighted by 2006 world exports of all products in that sector meeting the above criteria.
slaughtering,preparing, and
preserving of meat14%
agricultural andlivestock production
10%
iron and steel basicindustries
7%
manufacture of dairyproducts
6%
manufacture of basicindustrial chemicals
except fertilizer6%
manufacture of foodproducts not
elsewhere classified5%
manufacture ofstructural metal
products3%
manufacture of cocoa, chocolate,
and sugarconfectionery
3%
nonferrous metalbasic industries
3%
shipbuilding andrepairing
3%
3%2%
2%2%
2%2%2%2%2%2%2%2%2%2%
1%1%
1%1%
1%1% 1% 1% 1% 1% 1%
Are these sensible targets? Agroindustry, steel and aluminum, and ship-building were identified independently using both methodologies, whichis very encouraging. We analyze each of the government’s priority sectors,by highlighting all targeted sectors in terms of both distance versussophistication and distance versus strategic value tradeoffs (figure 4.19).11
At a first pass, the selections seem sensible. The selected targets tendto be on the efficient frontier in both distance versus sophistication anddistance versus strategic value tradeoffs. Several targeted sectors are wellinside this frontier, however, and many frontier sectors are ignored, par-ticularly those at the upper end of the distance versus sophisticationtradeoff (sectors that are somewhat far from current production but nofarther than many of the selected sectors while at the same time at amuch higher level of sophistication).
We now consider both tradeoffs sector by sector, again indicating thetargeted sectors in black. Starting with the nearest sectors, we see that fer-tilizers are low-hanging fruit: they are very close to current production.However, they have an extremely low EXPY and low strategic value. Thissuggests that although this sector might be an easy win, there seems to belittle benefit from developing it. In contrast, agroindustry is as close tocurrent production as fertilizers, but many of the targeted activities in thissector have a much higher level of sophistication and strategic value. Thissector therefore seems like a very sensible priority.
Aluminum products are definitely on Algeria’s efficient frontier. Steelproducts and metal working are as well, albeit to a lesser extent (particu-larly on the sophistication margin). Compared with these sectors, petro-chemicals are farther from the efficient frontier. Some are of a high levelof sophistication and strategic value, but most are farther away fromAlgeria’s current structure of production than other sectors with a higherlevel of sophistication and strategic value.
Automobiles and shipbuilding are farther away from current produc-tion. The automobile sector does not represent the best choice in termsof sophistication, although it is close to the strategic value efficient fron-tier. Shipbuilding has equivalent levels of sophistication but is muchcloser to the current structure of production. This implies that shipbuild-ing is nearer to current production and therefore easier to move toward.Producing automobiles would be much more difficult, although successwould create many more opportunities for export diversification.
Compared with the other targets, pharmaceuticals and specialty elec-tronics are far from both efficient frontiers, largely because they are sodistant from current production. Given such low densities, it is unlikelythat these sectors will emerge any time soon in Algeria. Other sectors that
90 Hausmann, Klinger, and López-Cálix
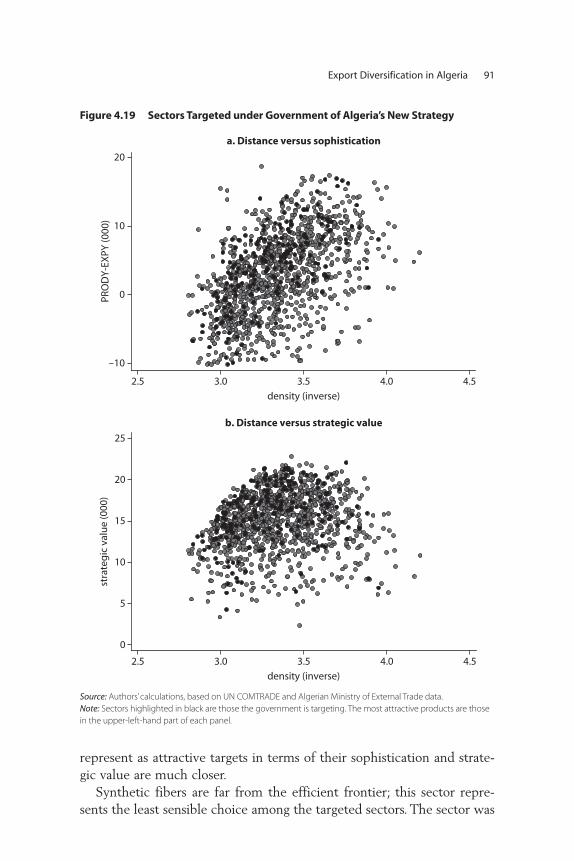
Export Diversification in Algeria 91
Figure 4.19 Sectors Targeted under Government of Algeria’s New Strategy
Source: Authors’ calculations, based on UN COMTRADE and Algerian Ministry of External Trade data.Note: Sectors highlighted in black are those the government is targeting. The most attractive products are thosein the upper-left-hand part of each panel.
–10
0
10
20
PRO
DY
-EX
PY (0
00)
2.5 3.0 3.5 4.0 4.5
density (inverse)
a. Distance versus sophistication
b. Distance versus strategic value
2.5 3.0 3.5 4.0 4.5
density (inverse)
0
5
10
15
20
25
stra
teg
ic v
alu
e (0
00)
represent as attractive targets in terms of their sophistication and strate-gic value are much closer.
Synthetic fibers are far from the efficient frontier; this sector repre-sents the least sensible choice among the targeted sectors. The sector was
probably chosen because synthetic fibers are downstream products fromhydrocarbons. But petrochemicals are also shown to be poorly selectedtargets. Looking downstream from existing production is a very poorguide to identifying high-potential export sectors. Most countries do notmove down production chains over time; they are more successful atmoving to other activities that require similar sets of productive capabil-ities rather than those that are simply related in an input-output relation-ship (Klinger 2008). As such, the government should reconsider itsidentification of priorities based on links, particularly synthetic fibers.
Unfolding the Process of Structural Transformation: Policy ConsiderationsDefining a framework for state intervention in industrial policy isalways controversial. Algeria’s new industrial policy is part of a wave ofnew industrial policies emerging in the Middle East and North Africaregion. These strategies move from more neutral policies (essentiallytransversal ones ) to more selective interventions. World Bank (2008b)offers an exhaustive summary of the debate surrounding these strate-gies and a typology of state interventions.
Industrial strategies can be represented in four groups, depending onthe extent to which they depart from neutrality. The first group is purelyneutral industrial policies. They aim to improve the business and macroenvironment. The second group addresses coordination failures, favoringsector-specific or “enclave” approaches and not involving price subsidies.The third group involves market interventions that directly address mar-ket failures and modify equilibrium prices and quantities (subsidizedcredit lines, industrial land subsidies, energy subsidies). The fourth type ofintervention is selective policies that combine some sort of subsidies, pro-tection, or tax breaks. The usual justification is the traditional infantindustry argument. As shown below, the policy proposal suggested in thischapter mostly combines group I and II policies, under a dynamic andinteractive process.
The product space methodology and results have implications for thekinds of policies that are most appropriate in fueling structural transfor-mation. Identifying high-potential sectors is the easy part; the more diffi-cult and important question is what to do with these lists (and asimportant, what not to do with them). These questions are explored here.
Overall, the structure of the product space suggests that the capabili-ties required by different sectors are highly specific. The infrastructureand labor skills required by oil are very different from those required by
92 Hausmann, Klinger, and López-Cálix
fresh fruit or garments; fostering the development of such sectors requiresmore than merely providing more education and investing more in gen-eral infrastructure. The types of these and other public goods that thegovernment wishes to provide must be decided, and this will have sector-specific consequences. Seven interrelated tasks are proposed.
The first task of industrial strategy should be to identify the sector- specific public goods that new activities require and provide them. Thistask also involves identifying regulations that prevent the new activitiesfrom emerging and reforming them.
This should be easier for nearby activities than for activities that are faraway. Nearby sectors are, international evidence suggests, the most likely toemerge. This implies that there is likely some presence in these sectorsalready, such as domestic production with a small amount of exports,exporters in related industries that are exploring the new industry, or for-eign firms seeking to invest in these activities. These actors will be demand-ing public goods, many of which are specific to their particular activitiesand prerequisites for success.
An appropriate policy approach is to orient the government for dia-logue with private sector actors. The dialogue should have a single pur-pose: to identify the necessary sector-specific public goods they requireand find a vehicle to provide them. Such a dialogue was likely part of thegovernment’s process in identifying high-potential export activities inthe first place.
In organizing a dialogue to identify missing sector-specific public goodsand sector-specific constraints to investment, one should keep in mindcertain principles. First, rather than forcing actors in the private sector toline up according to a predefined aggregated sector, it is better to let pro-moters self-organize based on shared interest in a particular constraintand come forward. For example, one group of agroindustry producersmay have a particular need for port infrastructure, another may require achange in property rights in a particular area. Requiring the two groupsto speak with one voice will likely obscure their real needs. Instead, theyshould have to settle on the few constraints that are shared, though likelynot the most binding (for example, tax reduction). For this reason, it isbest if the groupings are not predefined but instead coalesce around com-mon needs.
Another design principle for this dialogue is to explore the needfor cofinancing to filter requests from private entrepreneurs for truly productivity-enhancing investments and to avoid rent-seeking. The privatesector’s willingness to pay is correlated with the social returns to the
Export Diversification in Algeria 93
provision of the public input, so cofinancing will help the public sectorallocate scarce resources to their best use. For a further reduction of rent-seeking and capture, such a dialogue should be highly transparent, with allrequests made public to discipline the proposals put forth. Moreover, itshould be clear that the proposals put forward must be solely for produc-tivity-enhancing investments through the provision of public inputs, notsubsidies to compensate for low productivity.
This type of dialogue will allow for the identification of investmentsdemanded by nearby emerging activities to allow the nearby emergingactivities to grow more rapidly. This responsive approach is more likely towork for nearby activities, such as fishing, milk, meat products, fertilizers,and other agroindustries. Moreover, this responsiveness need not be lim-ited to the preidentified high-potential export activities but can extend toany new activities the private sector identifies.
The downside to such an approach is that it is less likely to work forsectors that are farther away, such as aluminum and shipbuilding. Thesekinds of sectors are much less likely to emerge on their own, because theyrequire new sets of capabilities that are unlike those already existing inAlgeria. For these sectors, few firms are active in related activities, andfew international firms are knocking on the government’s door. Simplyorganizing for dialogue is less likely to be sufficient, as there will proba-bly not be anyone on the other side of the conversation and the needswill be significant.
For these distant activities, the second task is to explore the establish-ment of new institutions specialized in the search for new activities andin the overcoming of related obstacles. One way this could be done isthrough a public venture capital fund. Development banks are tradition-ally conceived as a solution to failures in the financial market. They areoften set up to channel money to existing activities and measure perform-ance by the volume of loans they give. A public venture capital fundcould be set up to fund new business models and initiatives that couldtrigger significant future entry. The idea is to create an incentive forpotential investors in activities that involve many unknown costs andrequire potentially new public inputs. Such a fund would give the gov-ernment access to those ideas, analyze the obstacles they face, and informpublic policy, so that the requisite public inputs could be provided ifdeemed reasonable. The idea is to help trigger investment into areas thatare more distant while minimizing the risk that these investments will failbecause of inadequate public inputs. Performance of the fund would bebased on the amount of “crowded-in” investment from private sources,
94 Hausmann, Klinger, and López-Cálix
even if the second movers into the sector are not funded by the venturecapital fund. Guidelines for institutional design can be found inHausmann, Rodrik, and Sabel (2008).
Few institutions in the world have been designed from scratch withthis purpose, but several have stumbled into performing this function.Fundación Chile is a good example of an institution that has invested innew products and business models that have had transformative effects.Its best-known success is farmed salmon, a subsector in which Chile nowhas a leading position.
Another example is the Industrial Development Corporation in SouthAfrica, which includes such venture capital operations as one of its func-tions. Many years ago it funded the development of synthetic fuels out ofcoal; its holdings in that firm (Sasol) now constitute an important part ofits asset base. More recently, it has funded investments into new agricul-tural products, such as cashews and the export of fresh fruit.
Another type of institution that could accomplish this task is the indus-trial park (if possible supported by logistical export corridors). The idea isto attract investors by providing specific public inputs within the park orby informing and lobbying government for those that cannot be directlyprovided. Although industrial parks are often created with some specificactivities in mind, experience suggests that once they start looking forinvestors they are forced to cast a much wider net and include other sec-tors that were not anticipated at the outset, but turn out to be quite prof-itable. In the process, they become active searchers of the space ofcapabilities and obstacles.
Algeria opened a logistical corridor for the export of dates in 2007. Thegovernment created special procedures for processing paperwork, passingcustoms, and obtaining required export logistical facilities. This so farexceptional experience proves that even under a very constrained busi-ness environment, some Algerian entrepreneurs have found a way tobypass constraints. Replicating such experience is the challenge ahead.
This chapter offers guidelines for organizing dialogue to identify theneeds of new sectors and to more proactively search for and provide thebroad set of capabilities required by more distant activities. The guide-lines are, and must be, general rather than specific policy proposals: theentire underlying logic of the product space is that constraints are specificto each sector and activity. The identification of high-potential nearbyactivities gives policy makers some indication of where to begin lookingfor sector-specific constraints, but this is the limit of what can be donewith such data. Policy reforms at the macro level would complement the
Export Diversification in Algeria 95
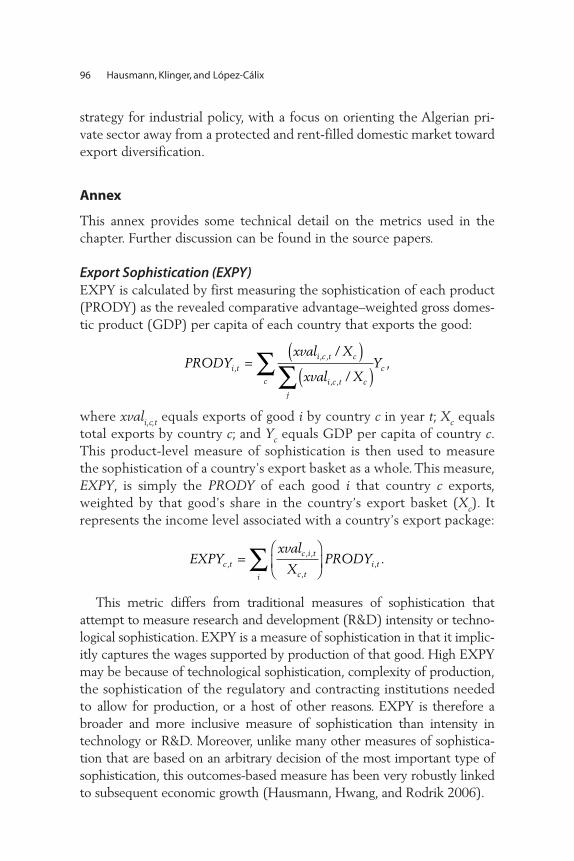
strategy for industrial policy, with a focus on orienting the Algerian pri-vate sector away from a protected and rent-filled domestic market towardexport diversification.
Annex
This annex provides some technical detail on the metrics used in thechapter. Further discussion can be found in the source papers.
Export Sophistication (EXPY)EXPY is calculated by first measuring the sophistication of each product(PRODY) as the revealed comparative advantage–weighted gross domes-tic product (GDP) per capita of each country that exports the good:
where xvali,c,t equals exports of good i by country c in year t; Xc equalstotal exports by country c; and Yc equals GDP per capita of country c.This product-level measure of sophistication is then used to measurethe sophistication of a country’s export basket as a whole. This measure,EXPY, is simply the PRODY of each good i that country c exports,weighted by that good’s share in the country’s export basket (Xc). Itrepresents the income level associated with a country’s export package:
This metric differs from traditional measures of sophistication thatattempt to measure research and development (R&D) intensity or techno-logical sophistication. EXPY is a measure of sophistication in that it implic-itly captures the wages supported by production of that good. High EXPYmay be because of technological sophistication, complexity of production,the sophistication of the regulatory and contracting institutions neededto allow for production, or a host of other reasons. EXPY is therefore abroader and more inclusive measure of sophistication than intensity intechnology or R&D. Moreover, unlike many other measures of sophistica-tion that are based on an arbitrary decision of the most important type ofsophistication, this outcomes-based measure has been very robustly linkedto subsequent economic growth (Hausmann, Hwang, and Rodrik 2006).
EXPYxval
XPRODYc t
c i t
c ti
i t,, ,
,, .=
⎛
⎝⎜
⎞
⎠⎟∑
PRODYxval X
xval XYi t
i c t c
i c t c
j
c
c,, ,
, ,
/
/,=
( )( )∑∑
96 Hausmann, Klinger, and López-Cálix

Figure 4.A.1 calculates EXPY conventionally; table 4.A.1 lists themain products contributing to Algeria’s EXPY. Given that Algeria’sexport basket is highly concentrated in a narrow range of hydrocarbonproducts, this metric is of limited use. This is why the body of this chapter
Export Diversification in Algeria 97
Figure 4.A.1 Relationship between Export Sophistication and GDP per Capita inSelected Countries, 2004
Source: Authors’ calculations, based on UN COMTRADE.Note: DZA = Algeria, PPP = purchasing power parity.
ALB
ARGARM
AUS
AUT
AZE
BDI
BEL
BENBFA
BGD
BGRBLR
BLZ
BOL
BRA
CAN
CHE
CHL
CHN
COL
CPV
CRI
CYPCZE
DEU
DMA
DNK
DZA
ECUEGY
ESPEST
FINFRA
GAB
GBR
GEO
GMB
GRC
GRDGTM
GUY
HKG
HND
HRV
HUN
IDNIND
IRL
IRN
ISLISRITA
JAM
JOR
JPN
KAZ
KEN
KGZ
KHM
KNA
KOR
LBNLCA
LTU
LUX
LVA
MARMDA
MDG
MEX
MKD
MLT
MNG
MUS
MWI
MYS
NER
NIC
NLD
NOR
NZL
PAN
PER
PHLPOL PRT
PRY
ROMRUS
SAU
SDNSEN
SGP
SLV
SVKSVN SWE
TGO
THA
TTOTUN
TUR
TZA
UGA
UKR
URY
USA
VCT
VEN
ZAF
ZMB
DZA
8
8.5
9
9.5
10
EXPY
(lo
g, P
PP)
6 7 8 9 10 11
GDP per capita (log, PPP)
a. All countries
b. Selected countries
DZA
AZE
BRA
CHN
DZA
IDNIND
KEN
MEXPHL
ROM
RUS
SDN
THA
UKR
VEN
ZAF
9
9.2
9.4
9.6
EXPY
(lo
g, P
PP)
7.0 7.5 8.0 8.5 9.0 9.5
GDP per capita (log, PPP)

98 Hausmann, Klinger, and López-Cálix
Table 4.A.1 Contributors to Algeria’s EXPY, 2004
Product Exports (US$ million) PRODY
Petroleum gases and other gaseous hydrocarbons 11,000 12,169Ammonia, anhydrous or in aqueous solution 105 10,247Flat-rolled products of iron/nonalloy
steel, ≥ 600 mm wide, hot-rolled, not clad/plated/coated 40 10,300
Flat-rolled products of iron/nonalloy steel, ≥ 600 mm wide, clad/plated/coated 23 16,788
Hydrogen, rare gases and other nonmetals 24 14,726Unwrought zinc 25 13,559Acyclic alcohols and their halogenated . . . or
nitrosated derivatives 18 12,743Articles of natural cork 9 16,602Flat-rolled products of iron/nonalloy
steel, ≥ 600 mm wide, cold-rolled, not clad/plated/coated 10 11,284
Motor vehicles for the transport of goods 5 16,016Buttermilk, curdled milk and cream, yogurt, etc 5 15,889Coal; briquettes, ovoids and similar solid fuels
manufactured from coal 5 13,600Silicates; commercial alkali metal silicates 5 12,042Cocoa butter, fat and oil 5 10,587New pneumatic tires, of rubber 5 18,662Interchangeable tools for hand tools, whether
or not power-operated 3 19,975Accessory parts suitable for machinery 3 19,342Agglomerated cork and articles
of agglomerated cork 3 17,683Motor vehicles for the transport of passengers,
public transport 3 13,519Semi-finished products of iron or non-alloy steel 4 11,149
Source: Authors’ calculations, based on UN COMTRADE data.
focuses only on non-oil EXPY. Because it is not suitable to compare non-oil EXPY for Algeria with total EXPY of other countries, the body of thechapter examines the non-oil export baskets of oil-exporting comparators.
DistanceThe inverse measure of distance between goods i and j in year t, whichwe call proximity, equals
ϕ i j t i t j t j t i tP x x P x x, , , , , ,min | , | ,= ( ) ( ){ }
where for any country c
and the conditional probability is calculated using all countries in year t.The conditional probabilities are calculated using disaggregated exportdata across a large sample of countries from the world trade flows datafrom Feenstra and others (2005) and UN COMTRADE.
Open forest is calculated first by measuring the density of the currentexport basket of a country around any good. This is the distance of goodi from country c’s export basket at time t, calculated as the sum of allpaths leading to the product in which the country is present, divided bythe sum of all paths leading to the product. Density varies from 0 to 1,with higher values indicating that the country has achieved comparativeadvantage in many nearby products and should therefore be more likelyto export that good in the future:
Hausmann and Klinger (2007) show that this measure of density isindeed highly significant in predicting how a country’s productive struc-ture will shift over time: countries are much more likely to move to prod-ucts that have a higher density, meaning they are closer to their currentproduction.
We aggregate this measure of density, which is for a country aroundany single product, to an overall measure of the connectedness of acountry’s export basket. This country-level measure is called open forest.A higher value indicates that the current export basket is in a part ofthe product space that is well connected to other new and valuableopportunities for structural transformation. A high value of open forestindicates that the country is located in a dense part of the productspace; a low value of open forest indicates that the country is special-ized in a sparse, unconnected part of the product space. In essence, thisvalue summarizes the visual analysis conducted above with the productspace maps.
density
x
i c t
i k t c k t
k
i k t
k
, ,
, , , ,
, ,
.=
⎛
⎝
⎜⎜⎜⎜
⎞
⎠
⎟⎟⎟⎟
∑∑
ϕ
ϕ
xif RCA
otherwisei c ti c t
, ,, ,=
>⎧⎨⎩
1
01
Export Diversification in Algeria 99
Open forest is calculated as follows:
Notes
1. Statement is based on a list of projects made available by the EuroMediterranean Network of Investment Promotion Agencies.
2. Non-oil EXPY is calculated by eliminating #33 and #34 from the 1975–2000Standard International Trade Classification (SITC) data and #27 from the2000+ Harmonized System (HS) data.
3. The conventional calculation of EXPY is shown in the annex. According tothat metric, export sophistication in Algeria is moderate. However, more than95 percent of the country’s export basket is hydrocarbons. EXPY as tradition-ally measured is simply the revealed comparative advantage–weighted aver-age GDP per capita of oil exporters. For this reason, it is more relevant toconsider non-oil EXPY. For consistency, this should be compared only withother oil exporters’ non-oil export baskets.
4. This paragraph was based on World Bank 2008b.
5. The Doing Business Indicators focus on the time and money costs and thecomplexity or completeness of key procedures. Many indicators measureeither the formal procedure described in national law or the cost and timetaken for a prototypical enterprise of specified characteristics.
6. Investment Climate Assessment surveys capture the actual experience andattitudes of active business managers.
7. This argument is based on World Bank (2008b).
8. The distance between any two products is the minimum of the pairwise condi-tional probabilities of having comparative advantage. See the annex for details.
9. Interesting and useful extensions to this analysis would match export data toinvestment climate or household survey data to measure each sector’s inten-sity in labor or match them with imphis is done.
10. For a recent study exploring the increasing market for services in Algeria, seechapter 7 of this volume.
11. The identification of targeted sectors was graciously provided by M. Boulkia.As above, this analysis is only on merchandise exports, and cannot considerservices (such as ship repair). Furthermore, we limit our focus to “new” sec-tors: those in which the country has not yet achieved comparative advantage(some of the targeted sectors, such as hydraulic binders, are already exportedwith comparative advantage).
open forest x x PRODYc ti j t
i j t
i
c j t c i t j t_ ,, ,
, ,
, , , , ,= −( )⎡
⎣
⎢⎢⎢∑
ϕ
ϕ1
⎢⎢
⎤
⎦
⎥⎥⎥⎥
∑∑ji
.
100 Hausmann, Klinger, and López-Cálix

References
Arrow, K. 1962. “The Economic Implications of Learning by Doing.” Review ofEconomic Studies 29 (3): 155–73.
Baland, J., and P. François. 2000. “Rent-Seeking and Resource Booms.” Journal ofDevelopment Economics 61 (2): 527–42.
Bardhan, P. 1970. Economic Growth, Development, and Foreign Trade. New York:Wiley-Interscience.
Corden, W. M. 1982. “Exchange Rate Policy and the Resources Boom.” EconomicRecord 58 (160): 18–31.
Corden, W. M., and J. P. Neary. 1984. “Booming Sector and De-Industrialisation ina Small Open Economy.” Economic Journal 92 (366): 825–48.
De Ferranti, D. G. E. Perry, I. S. Gill, and L. Serven. 2000. Securing Our Future ina Global Economy. Washington, DC: World Bank.
Doing Business Indicators (database). http://www.doingbusiness.org/. World Bank,Washington, DC.
Ecotechnics. 2004. Potentiel d’exportation hors hydrocarbures. Algiers: Ecotechnics.
Feenstra, R., R. Lipsey, H. Deng, A. Ma, and H. Mo. 2005. “World Trade Flows:1962–2000.” NBER Working Paper 11040, National Bureau of EconomicResearch, Cambridge, MA.
Hausmann, R., J. Hwang, and D. Rodrik. 2006. “What You Export Matters.” NBERWorking Paper 11905, National Bureau of Economic Research, Cambridge,MA.
Hausmann, R., and B. Klinger. 2006. “Export Diversification and Patterns ofComparative Advantage in the Product Space.” Harvard University Center forInternational Development Working Paper 128, Cambridge, MA.
———. 2007. “The Structure of the Product Space and the Evolution ofComparative Advantage.” Harvard University Center for InternationalDevelopment Working Paper 146 (extended and revised version of WorkingPaper 128), Cambridge, MA.
Hausmann, R., and R. Rigobon. 2002. “An Alternative Interpretation of the‘Resource Curse’: Theory and Policy Implications.” NBER Working Paper9424, National Bureau of Economic Research, Cambridge, MA.
Hausmann, R., and D. Rodrik. 2003. “Economic Development as Self-discovery.”Journal of Development Economics 72 (2): 603–33.
Hausmann, R., D. Rodrik, and C. Sabel. 2008. “Reconfiguring Industrial Policy: AFramework with an Application to South Africa.” HKS Faculty ResearchWorking Paper Series RWP08-031, John F. Kennedy School of Government,Harvard University, Cambridge, MA.
Hidalgo, C., B. Klinger, A. Barabasi, and R. Hausmann. 2007. “The Product SpaceConditions the Development of Nations.” Science 317 (5837): 482–87.
Export Diversification in Algeria 101
Hwang, J. 2006. “Introduction of New Goods, Convergence and Growth.”Department of Economics, Harvard University, Cambridge, MA.
IMF (International Monetary Fund). 2006a. “Algeria’s Business Climate: TaxReforms for Faster Job Creation.” Supplement on Selected Issues. SM/O6/13.IMF, Washington DC.
———. 2006b. IMF Article IV. Country Report. Report 07/61,Washington, DC.
Jaffe, A. 1986. “Technological Opportunity and Spillovers of R&D: Evidence fromFirm’s Patents, Profits, and Market Value.” American Economic Review 76 (5):984–1001.
Jaffe, A., M. Trajtenberg, and R. Henderson. 1993. “Geographic Localization ofKnowledge Spillovers as Evidenced by Patent Citations.” Quarterly Journal ofEconomics 108 (3): 577–98.
Kee, H., A. Nicita, and M. Olarreaga. 2006. “Estimating Trade RestrictivenessIndices.” PRWP WPS 3840, World Bank, Washington, DC.
Klinger, B. 2007. “Uncertainty in the Search for New Exports.” Harvard Center forInternational Development Graduate Student and Postdoctoral FellowWorking Paper 16, Cambridge, MA.
———. 2008. “Forward Linkages and Structural Transformation.” John F. KennedySchool of Government, Harvard University, Cambridge, MA.
Leamer, Edward, E. 1984. Sources of Comparative Advantage: Theory and Evidence.Cambridge, MA: MIT Press.
———. 1987. “Paths of Development in the Three Factor, n–Good GeneralEquilibrium Model.” Journal of Political Economy 95 (5): 961–99.
Ministère de l’Industrie et de la Promotion des Investissements de l’Algérie. 2007.Document de la stratégie industrielle. Algiers.
Nabli, Mustapha. 2007. Breaking the Barriers to Higher Economic Growth.Washington, DC: World Bank.
Sensenbrenner, G. 2006. “Algeria’s Business Climate: Tax reforms for Faster JobCreation.” IMF Selected Issues, International Monetary Fund, Washington, DC.
World Bank. 2008a. Algérie: Rapport sur l’enquête climat des affaires. MENA/MNSED Report. Washington, DC: World Bank.
———. 2008b. Doing Business 2009. Washington, DC: World Bank.
102 Hausmann, Klinger, and López-Cálix
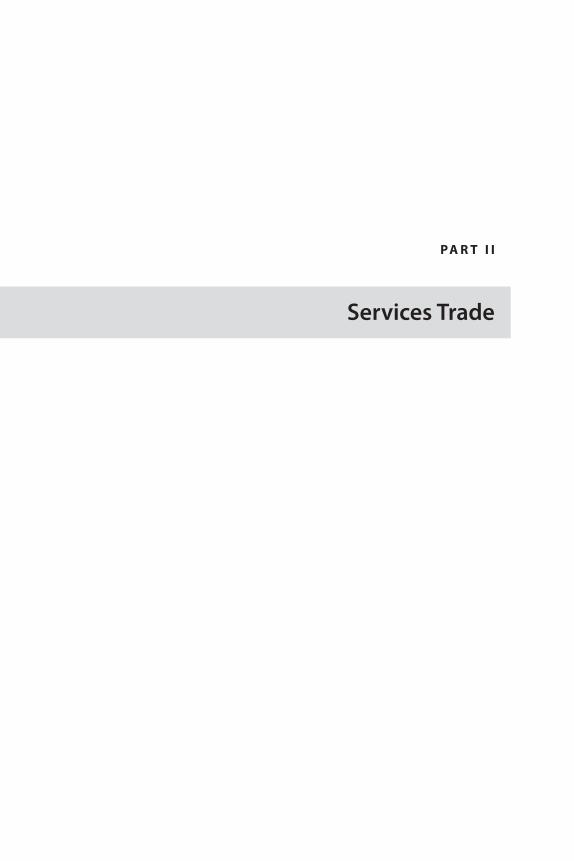
PA R T I I
Services Trade


105
Can Emerging Export Services Contribute to Growth and Poverty Reduction?
The global services market offers rapidly increasing opportunities to gen-erate export revenues. International trade in commercial services morethan doubled between 1995 and 2006, outpacing exports of agriculturalproducts and manufactures (figure 5.1). Rapid advances in informationand communication technologies (ICT) and the ongoing global liberaliza-tion of trade and investment in services have increased the tradability ofmany service activities and created new kinds of tradable services, partic-ularly as the production of services has become increasingly location inde-pendent. Because demand for services has a high income elasticity, thepotential for further increases in services exports remains as economiesgrow richer.
Offshoring as a Driver of TradeProfessional and ICT-enabled services are among the most dynamicgrowth segments of the global services sector. Firms in high-income
C H A P T E R 5
Emerging Export Services: Where Does Tunisia Stand?
Olivier Cattaneo, Ndiamé Diop, and Peter Walkenhorst
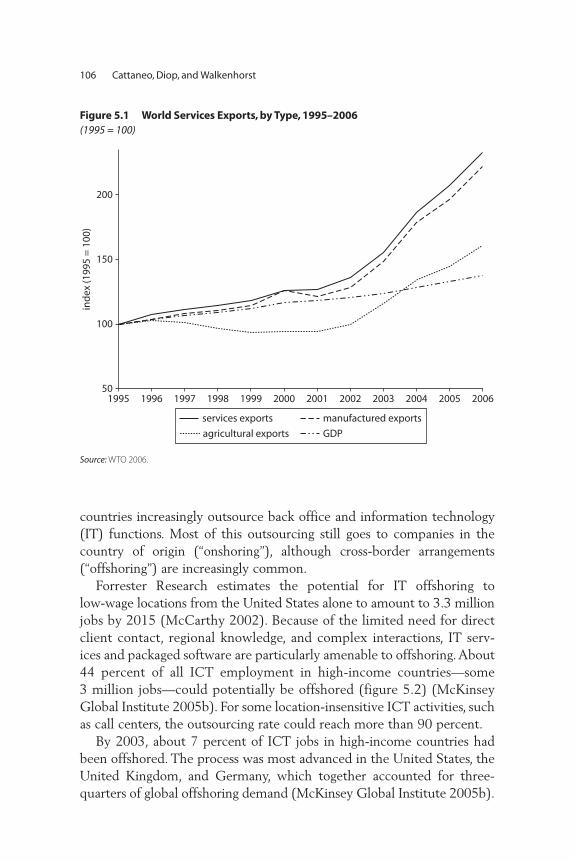
countries increasingly outsource back office and information technology(IT) functions. Most of this outsourcing still goes to companies in thecountry of origin (“onshoring”), although cross-border arrangements(“offshoring”) are increasingly common.
Forrester Research estimates the potential for IT offshoring to low-wage locations from the United States alone to amount to 3.3 millionjobs by 2015 (McCarthy 2002). Because of the limited need for directclient contact, regional knowledge, and complex interactions, IT serv-ices and packaged software are particularly amenable to offshoring. About44 percent of all ICT employment in high-income countries—some3 million jobs—could potentially be offshored (figure 5.2) (McKinseyGlobal Institute 2005b). For some location-insensitive ICT activities, suchas call centers, the outsourcing rate could reach more than 90 percent.
By 2003, about 7 percent of ICT jobs in high-income countries hadbeen offshored. The process was most advanced in the United States, theUnited Kingdom, and Germany, which together accounted for three-quarters of global offshoring demand (McKinsey Global Institute 2005b).
106 Cattaneo, Diop, and Walkenhorst
Figure 5.1 World Services Exports, by Type, 1995–2006(1995 = 100)
Source: WTO 2006.
50
100
150
ind
ex (1
995
= 1
00)
200
1995 1996 1997 1998 1999 2000 2001 2002 2003 2004 2005 2006
services exports manufactured exports
agricultural exports GDP
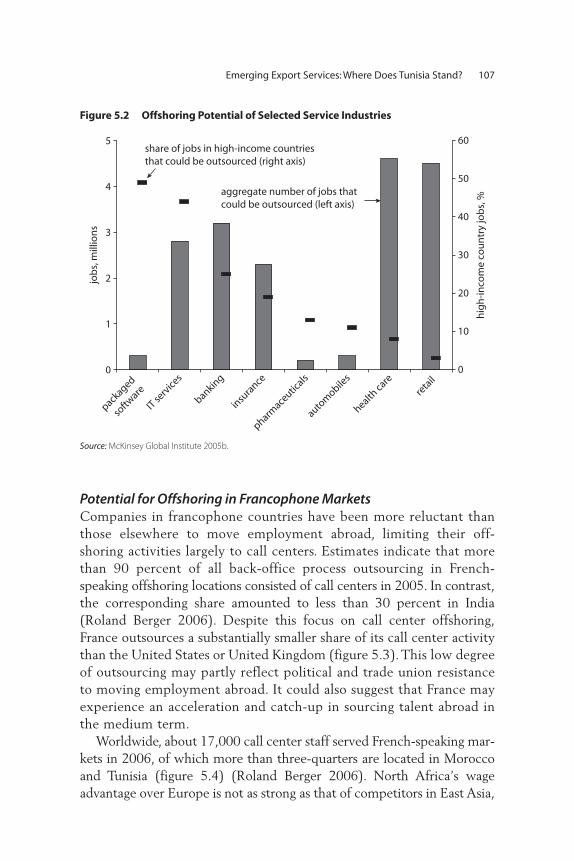
Potential for Offshoring in Francophone Markets Companies in francophone countries have been more reluctant thanthose elsewhere to move employment abroad, limiting their off-shoring activities largely to call centers. Estimates indicate that morethan 90 percent of all back-office process outsourcing in French-speaking offshoring locations consisted of call centers in 2005. In contrast,the corresponding share amounted to less than 30 percent in India(Roland Berger 2006). Despite this focus on call center offshoring,France outsources a substantially smaller share of its call center activitythan the United States or United Kingdom (figure 5.3). This low degreeof outsourcing may partly reflect political and trade union resistanceto moving employment abroad. It could also suggest that France mayexperience an acceleration and catch-up in sourcing talent abroad inthe medium term.
Worldwide, about 17,000 call center staff served French-speaking mar-kets in 2006, of which more than three-quarters are located in Moroccoand Tunisia (figure 5.4) (Roland Berger 2006). North Africa’s wageadvantage over Europe is not as strong as that of competitors in East Asia,
Emerging Export Services: Where Does Tunisia Stand? 107
Figure 5.2 Offshoring Potential of Selected Service Industries
Source: McKinsey Global Institute 2005b.
0
1
2
3
4
5
packaged
softw
are
IT serv
ices
banking
insu
rance
pharmace
uticals
autom
obiles
health ca
rere
tail
job
s, m
illio
ns
0
10
20
30
40
50
60
hig
h-i
nco
me
cou
ntr
y jo
bs,
%
share of jobs in high-income countriesthat could be outsourced (right axis)
aggregate number of jobs thatcould be outsourced (left axis)
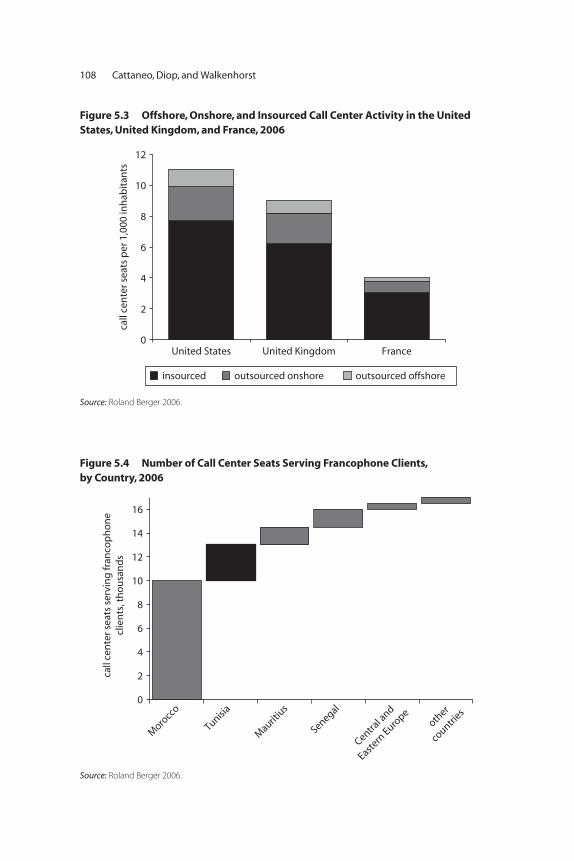
108 Cattaneo, Diop, and Walkenhorst
Figure 5.3 Offshore, Onshore, and Insourced Call Center Activity in the UnitedStates, United Kingdom, and France, 2006
Source: Roland Berger 2006.
0
2
4
6
8
10
call
cen
ter s
eats
per
1,0
00 in
hab
itan
ts
12
United States United Kingdom France
insourced outsourced onshore outsourced offshore
Figure 5.4 Number of Call Center Seats Serving Francophone Clients, by Country, 2006
Source: Roland Berger 2006.
call
cen
ter s
eats
ser
vin
g fr
anco
ph
on
ecl
ien
ts, t
ho
usa
nd
s
0
2
4
6
8
10
12
14
16
Moro
cco
Tunisia
Maurit
ius
Senegal
Central a
nd
Eastern
Europe
other
countri
es
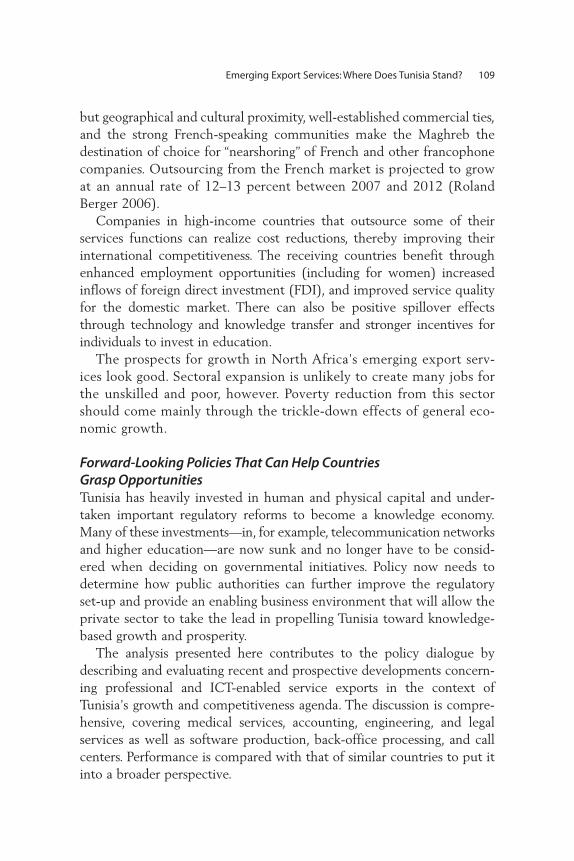
Emerging Export Services: Where Does Tunisia Stand? 109
but geographical and cultural proximity, well-established commercial ties,and the strong French-speaking communities make the Maghreb thedestination of choice for “nearshoring” of French and other francophonecompanies. Outsourcing from the French market is projected to growat an annual rate of 12–13 percent between 2007 and 2012 (RolandBerger 2006).
Companies in high-income countries that outsource some of theirservices functions can realize cost reductions, thereby improving theirinternational competitiveness. The receiving countries benefit throughenhanced employment opportunities (including for women) increasedinflows of foreign direct investment (FDI), and improved service qualityfor the domestic market. There can also be positive spillover effectsthrough technology and knowledge transfer and stronger incentives forindividuals to invest in education.
The prospects for growth in North Africa’s emerging export serv-ices look good. Sectoral expansion is unlikely to create many jobs forthe unskilled and poor, however. Poverty reduction from this sectorshould come mainly through the trickle-down effects of general eco-nomic growth.
Forward-Looking Policies That Can Help Countries Grasp OpportunitiesTunisia has heavily invested in human and physical capital and under-taken important regulatory reforms to become a knowledge economy.Many of these investments—in, for example, telecommunication networksand higher education—are now sunk and no longer have to be consid-ered when deciding on governmental initiatives. Policy now needs todetermine how public authorities can further improve the regulatoryset-up and provide an enabling business environment that will allow theprivate sector to take the lead in propelling Tunisia toward knowledge-based growth and prosperity.
The analysis presented here contributes to the policy dialogue bydescribing and evaluating recent and prospective developments concern-ing professional and ICT-enabled service exports in the context ofTunisia’s growth and competitiveness agenda. The discussion is compre-hensive, covering medical services, accounting, engineering, and legalservices as well as software production, back-office processing, and callcenters. Performance is compared with that of similar countries to put itinto a broader perspective.

The rest of the chapter is divided into three sections. The next sectiondiscusses Tunisia’s recent performance in professional and ICT-enabledservices, paying special attention to structural peculiarities of the subsectors.The following section examines the international position of providers ofemerging export services. The last section addresses issues that warrant theattention of policy makers.
How Has Tunisia Performed in Emerging Export Services?
Professional and ICT-enabled services are important inputs to the econ-omy. Provision of efficient services is essential to maintaining Tunisia’scompetitiveness and productivity gains. At the same time, consumersshould be protected against deceptive practices. The government musttherefore strike the right balance between liberalization (which encour-ages competition, cost effectiveness, and improved quality of service) anddomestic regulation.
The experience of Eastern and Central Europe shows that the open-ing of service sectors to foreign competition and the adoption ofregional/international standards can help reduce prices and enhance thevariety and quality of services offered to local consumers. Outdatedrules—including restrictions on advertising, recommended fee scales, andentry into professions—resulted in seriously damaging anticompetitivepractices and price-fixing in Europe, according to the EuropeanCommission (COM 2004). Although regulation is justified, flexibilityis required to accommodate the evolution of the profession andclients’ needs.
Medical ServicesTunisia has a long tradition of exports of medical services, in particularto its neighbor Libya. These flows have remained limited, however.With the emergence of “medical tourism,” prospects for services growthhave improved.
Many countries compete for foreign patients, who spend more thanregular tourists (on fees paid to surgeons and hospitals, stays in five-starhotels, excursions, and so forth). Tunisia is a front-runner in the Maghrebregion, although a latecomer compared with Asia or Latin America.
The two main Tunisian tour operators in the field are EsthetikaTour and Cosmetica Travel, both established in 2004, each of whichattracts only about 30 foreign patients a month. The bulk of patients(80 percent of whom are from Libya) come to private clinics in
110 Cattaneo, Diop, and Walkenhorst

Tunisia without depending on an intermediary. A few have beentreated for diseases or problems that occurred in the course of theirstay in Tunisia.
Based on a survey of clinics, one study estimates that in 2003, Tunisiahosted more than 42,000 foreign patients, who generated revenues ofabout TD27 million (about 24 percent of the clinics’ total revenues)(Lautier 2008). Based on these figures, the study extrapolates the totalvalue of Tunisia’s medical services exports at TD69 million. These exportscreated more than 10,000 jobs (half of them in the health sector) andgenerated total revenues (including accommodations and other expenses)of TD133 million (table 5.1).
Engineering About 12,000 engineers and 1,000 architects were employed in Tunisiain 2004, and about 2,000 companies specialized in design, engineering,and consulting services. Some of these companies, such as SCET Tunisia,STUDI, and COMETE, have emerged as leading engineering firms inthe region.
For more than two decades, Tunisian engineering firms have exportedtheir services—traditionally to other North and Sub-Saharan Africancountries, now to the Middle East and elsewhere. This early successresulted from the combination of several factors:
• Foreign participation through capital and technological transfers, includ-ing qualified personnel and know-how, which resulted in higher stan-dards and a reputation for quality
• An initially largely protected domestic market, which enabled localfirms to reach a critical size, gain experience, and then export
Emerging Export Services: Where Does Tunisia Stand? 111
Table 5.1 Number of Foreign Patients and Volume of Exports in Tunisia, by Nationality, 2004
Nationality of patientNumber of
foreign patientsExports
(TD million)
Exports/Total clinics’ output
(TD million)
Libyan 34,034 22.35 19.50Algerian 1,320 0.84 0.70European 4,484 2.80 2.40Other 2,373 1.68 1.50Total 42,211 27.67 24.14
Source: Lautier 2008. Note: Based on a 2003 survey of 79 private clinics in Tunisia.

• A voluntary donors’ policy to short-list African engineering firms forprojects in the region.
Engineering in Tunisia is the most open of all professional servicessectors and also the most successful in international markets. Majorcompanies achieve double-digit growth rates, and trade takes placeunder all four modes of delivery (cross-border supply, consumptionabroad, commercial presence, and presence of natural persons).
Accounting As of 2004, Tunisia had 464 accountants (working in 110 accountingfirms) belonging to the Ordre des Experts Comptables and 160 declaredtax advisers, 40 of whom belong to the Chambre Nationale des ConseilsFiscaux. The profession has grown rapidly, with a doubling of the numberof accountants between 1997 and 2004. Access to the profession remainsvery selective, however, with only about 30 of more than 1,000 candi-dates passing the exam each year.
The Big Four (KPMG, PricewaterhouseCoopers, Ernst & Young,Deloitte & Touche) account for almost all of Tunisia’s international tradein accounting. The Tunisian offices of these companies are entirelyTunisian. However, they have no foreign capital or foreign accountantsprimarily because of nationality requirements. The presence of these for-eign names has been extremely beneficial to the profession in Tunisia,contributing to raising standards and to training a number of accountantswho could later launch successful individual high-caliber practices. Thesefirms employ a large number of accountants and staff (more than 100for the largest of them).
Because of the limited size of the Tunisian market, trade is essential tothe accounting profession: expansion (or even survival) requires exportopportunities. It takes place under all four modes of delivery. Up to athird of the Big Four’s clientele are outside Tunisia. These clients arereached through modes 1 (through e-mail) and 4 (through movement ofaccountants and staff abroad). More than half of their clientele areforeigners (20 percent of trade takes place under mode 2). Mode 3 isthe least developed mode; only five Tunisian firms have offices abroad(in France).
Trade flows in the sector are not measured. Accounting is one of themost promising candidates for statistics improvement. Accountants andauditors are required to declare some specific missions to the Ordre desExperts Comptables (although firms have not diligently done so). This
112 Cattaneo, Diop, and Walkenhorst

information could be collected to determine how much of their busi-ness is conducted with foreigners. The Ordre des Experts Comptableshas recently started offering a service in which it handles visa applica-tions to the French Embassy for accountants planning business travelabroad. Information about visa requests could help determine theimportance of mode 4 for the profession. It could also help determinewhether the profession is facing serious obstacles to mobility.
Outsourcing could create new trade opportunities for Tunisianaccountants and bookkeepers. So far, only three or four accounting firmsare processing data for accountants based in France. These activitiesmight expand in the future, because of technological progress and poten-tial savings for French companies. Obstacles remain, however, and newsoftware applications already threaten the core activity of this trade(data processing).
Legal ServicesTunisia had about 5,000 lawyers in 2004, and the number is expectedto double by 2012. The Ordre National des Avocats has suggestedtightening access to the profession (through creation of a new profes-sional school, discussed below), with a view to limiting the flow ofnew entrants.
The profession remains dominated by individual practices. Only adozen specialized law firms have emerged with significant interna-tional practice; up to 90 percent of this practice is with foreign clients(modes 1 and 2). These firms remain very small, and they serve largelyas correspondents of major global law firms (mode 1 exports), with-out being fully integrated. Only one law firm has offices abroad(mode 3 exports).
The profession is strictly regulated and largely closed to foreign practi-tioners. However, this lack of openness does not prevent global law firmsfrom doing business with Tunisian firms: some major companies presentin Tunisia seek legal advice abroad. Mode 1 has become a substitute formode 3, increasing leakages in legal services trade.
ICT-Enabled ServicesThe government has undertaken several initiatives in the areas of infra-structure upgrading, human resource development, and regulatory reformto meet its ambitious objectives for the ICT sector. Examples includemajor telecommunications reforms (such as the licensing of private mobilephone and Internet access providers), institutional innovations (such as
Emerging Export Services: Where Does Tunisia Stand? 113

the establishment of the Institut National des Télécommunications andthe Agence Nationale des Fréquences), and public promotion programs(such as family computer programs and Internet connection of allschools). Tunisia hosted the World Summit of the Information Society in2005, which provided an international showcase for the country’s achieve-ments in the ICT sector and its commitment for further development.
Between 1997 and 2005, the number of ICT firms almost tripled.The sector’s contribution to GDP increased from 4.6 percent in 2002to 7.0 percent in 2005, with employment in the sector rising from40,200 to 55,200 over the same period. Export revenues surged fromTD23.8 million in 2002 to TD51.0 million in 2005.
Most employment and revenues in the sector are generated by a fewlarge public sector firms. Tunisie Telecom alone accounts for about two-thirds of sectoral revenues, and only 40 percent of the remaining revenuesare estimated to accrue to private telecommunications and Internetaccess providers (IDATE 2005). The almost 1,300 private sector IT enter-prises, which employed about 10,000 people in 2005, accounted for onlyabout 20 percent of total sectoral output.
Within the telecommunications subsector, the establishment of callcenters initially lagged developments in other Euro-Mediterranean coun-tries, notably Morocco, but quickly caught on. After the first two call cen-ters were set up, in 1999, the number of centers and related employmentincreased steadily. In 2005, 65 call centers were in operation, providingemployment for 5,200 phone operators.
Despite the growth of the ICT sector, the impact on employmentremains limited. About 1.8 percent of the economically active populationwork in the sector. Hence, although a continuing strong expansion wouldprovide opportunities for underemployed graduates of technical schoolsand universities, it would have only a modest effect on the overall unem-ployment rate. Nevertheless, strong growth of ICT jobs could make anindirect contribution to poverty reduction, as the value added per ICTemployee is about four times the national average. ICT expansion wouldthus add considerable purchasing power to the economy, which couldraise demand for goods and services that are or could be produced by thepoor and underemployed.
Most ICT firms in Tunisia are relatively young and small: about 80 per -cent have fewer than 50 employees (figure 5.5). Tunisia has fewer companies with fewer than 10 employees than high-income countries,however. This structural peculiarity may reflect the fact that private sec-tor demand for ICT-enabled services is still nascent in Tunisia, which
114 Cattaneo, Diop, and Walkenhorst
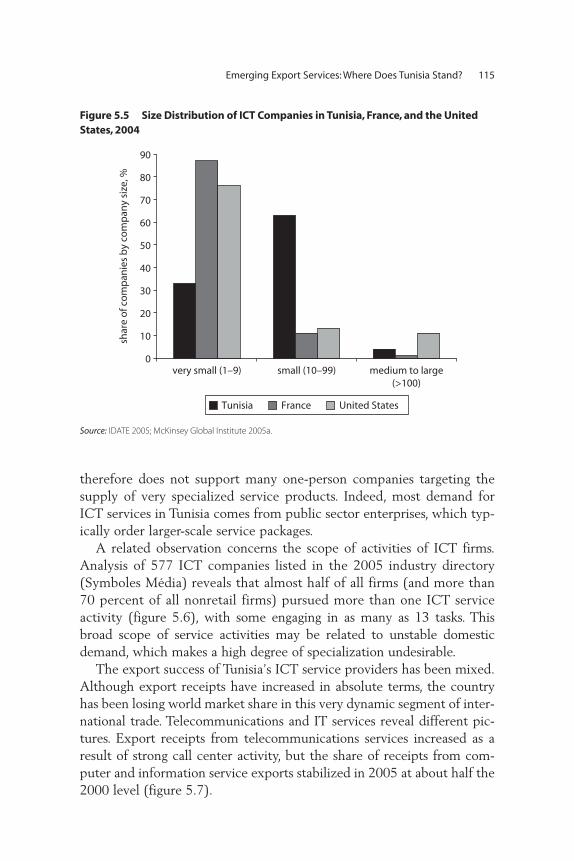
therefore does not support many one-person companies targeting thesupply of very specialized service products. Indeed, most demand forICT services in Tunisia comes from public sector enterprises, which typ-ically order larger-scale service packages.
A related observation concerns the scope of activities of ICT firms.Analysis of 577 ICT companies listed in the 2005 industry directory(Symboles Média) reveals that almost half of all firms (and more than70 percent of all nonretail firms) pursued more than one ICT serviceactivity (figure 5.6), with some engaging in as many as 13 tasks. Thisbroad scope of service activities may be related to unstable domesticdemand, which makes a high degree of specialization undesirable.
The export success of Tunisia’s ICT service providers has been mixed.Although export receipts have increased in absolute terms, the countryhas been losing world market share in this very dynamic segment of inter-national trade. Telecommunications and IT services reveal different pic-tures. Export receipts from telecommunications services increased as aresult of strong call center activity, but the share of receipts from com-puter and information service exports stabilized in 2005 at about half the2000 level (figure 5.7).
Emerging Export Services: Where Does Tunisia Stand? 115
Figure 5.5 Size Distribution of ICT Companies in Tunisia, France, and the UnitedStates, 2004
Source: IDATE 2005; McKinsey Global Institute 2005a.
0
10
20
30
40
50
60
70
80
90
very small (1–9) small (10–99) medium to large(>100)
shar
e o
f co
mp
anie
s b
y co
mp
any
size
, %
Tunisia France United States
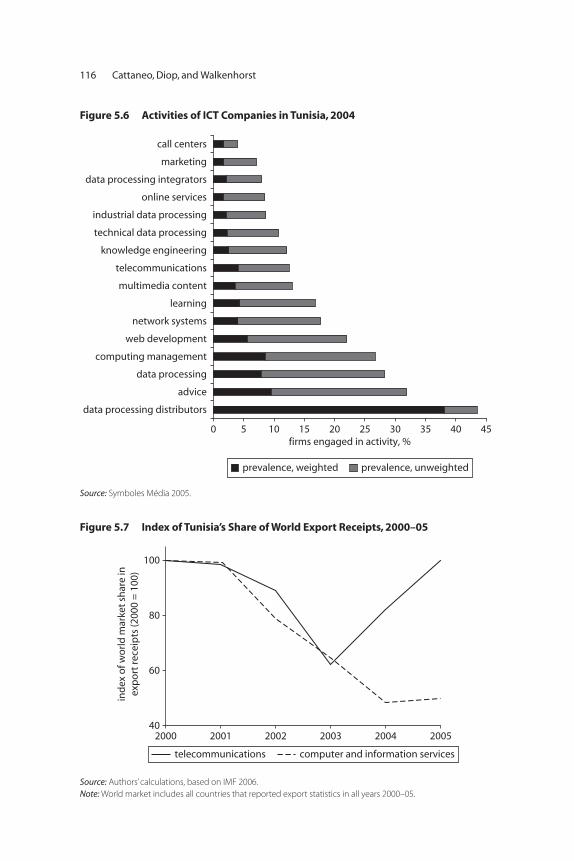
116 Cattaneo, Diop, and Walkenhorst
Figure 5.6 Activities of ICT Companies in Tunisia, 2004
Source: Symboles Média 2005.
0 5 10 15 20 25 30 35 40 45
data processing distributors
advice
data processing
computing management
web development
network systems
learning
multimedia content
telecommunications
knowledge engineering
technical data processing
industrial data processing
online services
data processing integrators
marketing
call centers
firms engaged in activity, %
prevalence, weighted prevalence, unweighted
Figure 5.7 Index of Tunisia’s Share of World Export Receipts, 2000–05
Source: Authors’ calculations, based on IMF 2006.Note: World market includes all countries that reported export statistics in all years 2000–05.
40
60
80
100
ind
ex o
f wo
rld
mar
ket
shar
e in
exp
ort
rece
ipts
(200
0 =
100
)
2000 2001 2002 2003 2004 2005
telecommunications computer and information services
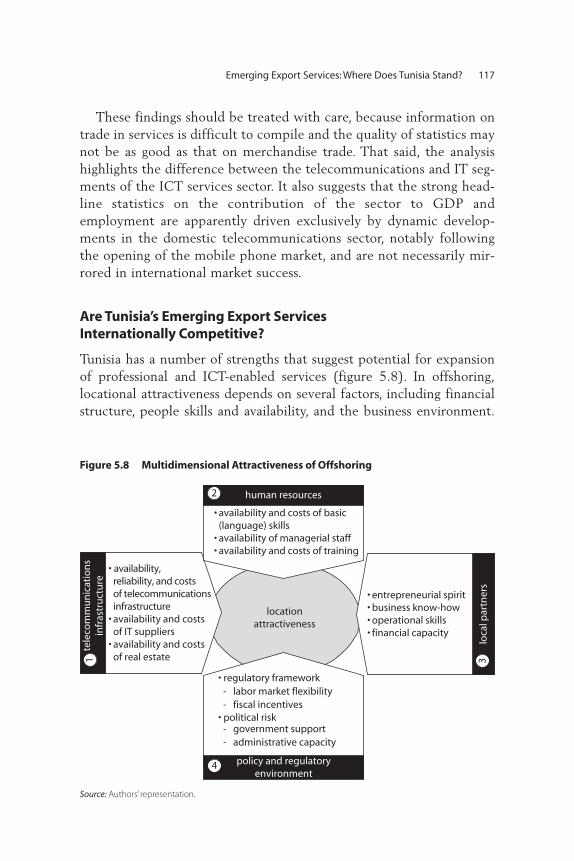
Emerging Export Services: Where Does Tunisia Stand? 117
These findings should be treated with care, because information ontrade in services is difficult to compile and the quality of statistics maynot be as good as that on merchandise trade. That said, the analysishighlights the difference between the telecommunications and IT seg-ments of the ICT services sector. It also suggests that the strong head-line statistics on the contribution of the sector to GDP andemployment are apparently driven exclusively by dynamic develop-ments in the domestic telecommunications sector, notably followingthe opening of the mobile phone market, and are not necessarily mir-rored in international market success.
Are Tunisia’s Emerging Export Services Internationally Competitive?
Tunisia has a number of strengths that suggest potential for expansionof professional and ICT-enabled services (figure 5.8). In offshoring,locational attractiveness depends on several factors, including financialstructure, people skills and availability, and the business environment.
Figure 5.8 Multidimensional Attractiveness of Offshoring
Source: Authors’ representation.
• availability and costs of basic (language) skills• availability of managerial staff• availability and costs of training
• availability, reliability, and costs of telecommunications infrastructure• availability and costs of IT suppliers• availability and costs of real estate
locationattractiveness
• regulatory framework- labor market flexibility- fiscal incentives
• political risk- government support- administrative capacity
- système judiciaire
•
policy and regulatoryenvironment
• entrepreneurial spirit• business know-how• operational skills• financial capacity
human resources
tele
com
mu
nic
atio
ns
infr
astr
uct
ure
1
4
23
loca
l par
tner
s
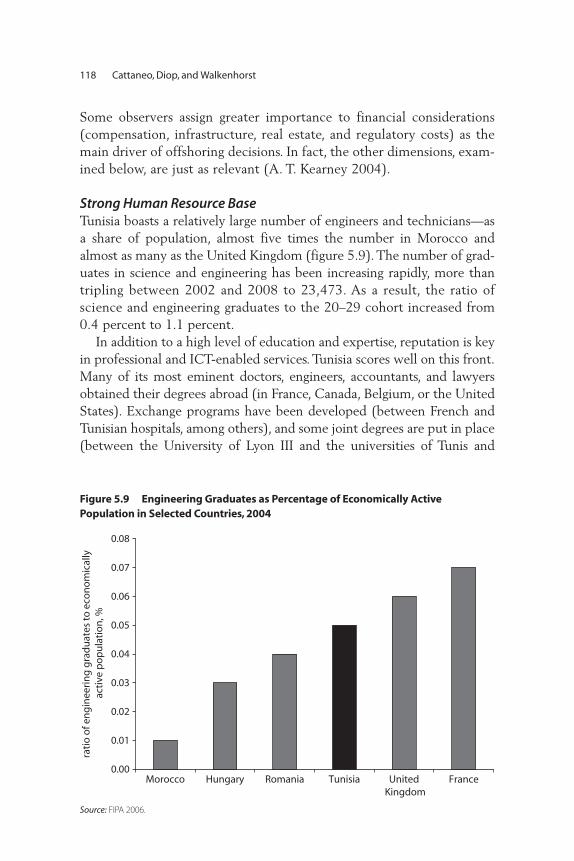
Some observers assign greater importance to financial considerations(compensation, infrastructure, real estate, and regulatory costs) as themain driver of offshoring decisions. In fact, the other dimensions, exam-ined below, are just as relevant (A. T. Kearney 2004).
Strong Human Resource BaseTunisia boasts a relatively large number of engineers and technicians—asa share of population, almost five times the number in Morocco andalmost as many as the United Kingdom (figure 5.9). The number of grad-uates in science and engineering has been increasing rapidly, more thantripling between 2002 and 2008 to 23,473. As a result, the ratio ofscience and engineering graduates to the 20–29 cohort increased from0.4 percent to 1.1 percent.
In addition to a high level of education and expertise, reputation is keyin professional and ICT-enabled services. Tunisia scores well on this front.Many of its most eminent doctors, engineers, accountants, and lawyersobtained their degrees abroad (in France, Canada, Belgium, or the UnitedStates). Exchange programs have been developed (between French andTunisian hospitals, among others), and some joint degrees are put in place(between the University of Lyon III and the universities of Tunis and
118 Cattaneo, Diop, and Walkenhorst
Figure 5.9 Engineering Graduates as Percentage of Economically Active Population in Selected Countries, 2004
Source: FIPA 2006.
0.00
0.01
rati
o o
f en
gin
eeri
ng
gra
du
ates
to
eco
no
mic
ally
act
ive
po
pu
lati
on
, %
0.02
0.03
0.04
0.05
0.06
0.07
0.08
Morocco Hungary Romania Tunisia United Kingdom
France

Sousse in accounting, for example). According to the Ministry of HigherEducation, about 13,000 Tunisian nationals were studying abroad in2004, 9,000 of them in France. Studies leading to professional services areparticularly popular among these students: half of the scholarships grantedto Tunisian students in France are in engineering (France in Tunisia,http://www.ambassade france-tn.org/france_tunisie/). This exposure hascontributed to a harmonization of standards between France and Tunisia,helped build networks across the Mediterranean, and strengthenedTunisia’s reputation as a provider of high-quality services.
Standards are also essential. In accounting, Tunisia (along with Canada)is one of the most advanced francophone countries in the implementationof the International Financial Reporting Standards (although some lacunaeremain in the adoption of the most recent updates and the presentationof accounts required by the Tunisian government). One Tunisian account-ing firm even obtained the Public Company Accounting Oversight Boardcertification, which is required for auditing U.S. firms. The leading engi-neering firms are also certified by the International Organization forStandardization (ISO). In contrast, most health clinics have neglected toadopt international standards, putting them at a disadvantage with respectto their competitors in Asia, which are systematically ISO certified. A strat-egy to develop medical tourism will need to remedy this neglect.
Competitive Compensation CostsWith its rich supply of well-trained technical graduates willing to workat moderate wages, Tunisia is in a relatively strong position as an exporterof services. Operating a call center in Tunisia costs about 50–70 percentas much as doing so in France (Roland Berger 2006). Tunisia has a slightcost advantage over its main competitor, Morocco, and is only marginallymore expensive than Mauritius and Senegal, which tend to provide lesssophisticated services (figure 5.10).
Industry surveys frequently cite low wage costs as a competitiveadvantage for Tunisian service providers (figure 5.11). Combined withproximity to Europe and good infrastructure, this cost advantage makesTunisia a serious potential contender in the services sector.
Tunisia’s professional services seem equally cost competitive. Tunisiancompanies can provide high-quality engineering services at a lower pricethan their European competitors: according to the Association Nationaledes Bureaux d’Etudes et d’Ingénieurs Conseils (ANBEIC), on average,Tunisian engineers are paid one-third less than their European counter-parts. As a result, Tunisian engineering firms can offer their services at asubstantially lower price than European competitors.
Emerging Export Services: Where Does Tunisia Stand? 119
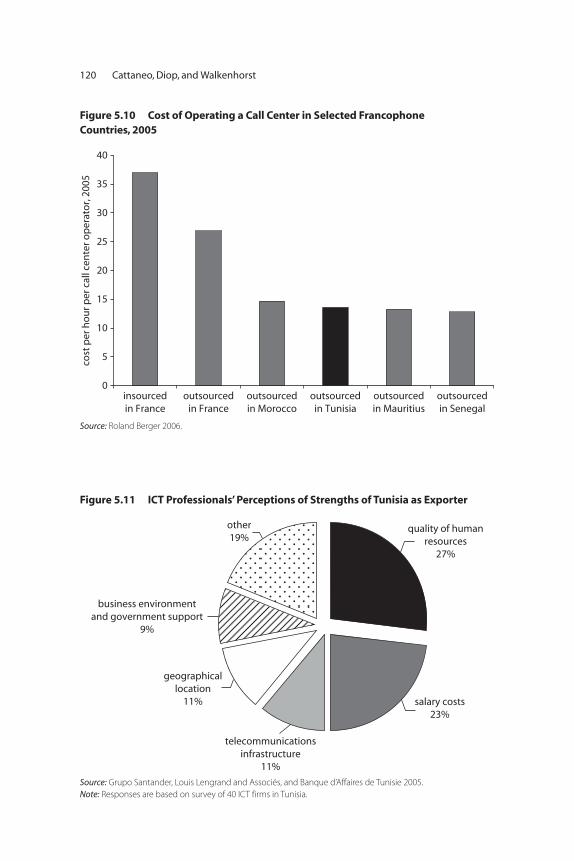
120 Cattaneo, Diop, and Walkenhorst
Figure 5.10 Cost of Operating a Call Center in Selected Francophone Countries, 2005
Source: Roland Berger 2006.
0
5
10
15
20
25
30
35
40
insourcedin France
outsourcedin France
outsourcedin Morocco
outsourcedin Tunisia
outsourcedin Mauritius
outsourcedin Senegal
cost
per
ho
ur p
er c
all c
ente
r op
erat
or,
2005
Figure 5.11 ICT Professionals’ Perceptions of Strengths of Tunisia as Exporter
Source: Grupo Santander, Louis Lengrand and Associés, and Banque d’Affaires de Tunisie 2005.Note: Responses are based on survey of 40 ICT firms in Tunisia.
quality of humanresources
27%
salary costs23%
telecommunicationsinfrastructure
11%
geographicallocation
11%
business environmentand government support
9%
other19%

Other developing countries (for example, China) appear to be morecompetitive than Tunisia for less technically challenging tasks. Tunisia’sadvantage appears to be in the provision of higher value-added services.Therefore, any sector development strategy should focus on improvingthe supply of highly trained professionals, to keep salaries low relative toEurope without attempting to compete in low value- added segments ofthe market.
Comparison of prices of the most common cosmetic surgery proce-dures around the world leads to the same conclusion: Tunisia is lessexpensive than Europe (including Central and Eastern Europe and Turkey)but more expensive than some Latin American and Asian countries(table 5.2). The country’s attractiveness rests mainly on cultural and
Emerging Export Services: Where Does Tunisia Stand? 121
Table 5.2 Costs of Most Popular Cosmetic Surgery Procedures in Selected Countries, 2005
Rhinoplasty (nose reshaping)
Breast augmentation
Alteration ofupper and
lower eyelids Facelift
Europe and United States Belgium 2,400–4,200 3,000–5,000 2,400 2,400–4,500Croatia 1,700–2,200 3,400 2,100 4,000Czech Republic 2,700 3,500 1,800 3,000France 2,500–3,500 4,000 2,000–3,000 4,500–6,000Germany 5,100 4,500 2,800 5,100–9,000Spain 3,600 4,400 3,100 4,800Turkey 2,400 2,600 2,000 2,400United Kingdom 4,500–6,000 5,200–7,500 3,000–5,500 6,000–9,000United States 6,500 and up 6,500 and up 4,000 and up 8,000–12,000AfricaEgypt, Arab Rep. of 2,200 3,000 1,800 3,100Morocco 1,500 2,000 1,200 2,200–2,900South Africa 3,100 3,300 2,700 4,900Tunisia 1,800–1,900 2,300–2,600 1,400–1,800 2,700–3,600Latin AmericaBrazil 2,300 3,500 2,300 3,000Costa Rica 1,200 2,200 1,200 2,400AsiaIndia 1,300–2,400 2,000–3,900 1,500–1,800 2,700–4,200Philippines 800–1,800 2,000–3,300 1,300 1,300–2,400Thailand 1,600–2,200 1,800–2,300 800–1,200 2,600–2,800
Source: Web sites of selected private clinics. Note: Prices were collected from Web sites of clinics offering plastic surgery procedures; they do not necessarilyreflect the complete range of prices.
linguistic ties to France, proximity to Europe (2.5-hour flight from Paris),and the quality of the service provided (because of highly trained medicalprofessionals and efficient travel operators.).
Lack of Scale and Poor TelecommunicationsThe small size of businesses is a feature of professional services in thedeveloping world. Tunisia is an extreme case, however, with a predomi-nance of family-owned businesses. This often results in management andmarketing problems. Access to credit (including export credit) is limited,because these enterprises lack physical collateral. For the professionalservice sector as a whole, credit represents just 5 percent of output (thefigure is 10 percent in tourism or manufacturing).
Lack of sufficient scale characterizes all professional services in Tunisia:
• In the medical services sector, the number of beds per clinic is limited.As a result, clinics cannot offer a complete range of services, and theyoften lack the size needed to become major exporters of medicalservices. By contrast, some private hospitals in Thailand are listed onthe stock exchange.
• In the engineering sector, only three firms provide services to interna-tional markets, and even they are relatively small (hundreds of employees compared with thousands in other countries). There areabout 2,000 microfirms that will never reach the critical size to becomesignificant exporters.
• In the accounting sector, only the Big Four are large enough to exportservices.
• In the legal sector, the number of specialized law firms is very limited(about a dozen), each with a maximum of 40 lawyers. By comparison,Morocco has attracted a dozen foreign law firms, each employing upto 250 lawyers.
In the ICT sector, the government has made substantial efforts to pro-mote computer and Internet use by households and in the public sphere(schools, government agencies). As a result, IT penetration has increasedsteadily, reaching 15 Internet subscriptions and 50 computers per thou-sand inhabitants in 2005. In comparison with high-income countries,however, the level of IT use remains low, and IT spending per capita isonly a fraction of that in most Organisation of Economic Co-operationand Development (OECD) countries. The private domestic market forIT products is thus small.
122 Cattaneo, Diop, and Walkenhorst
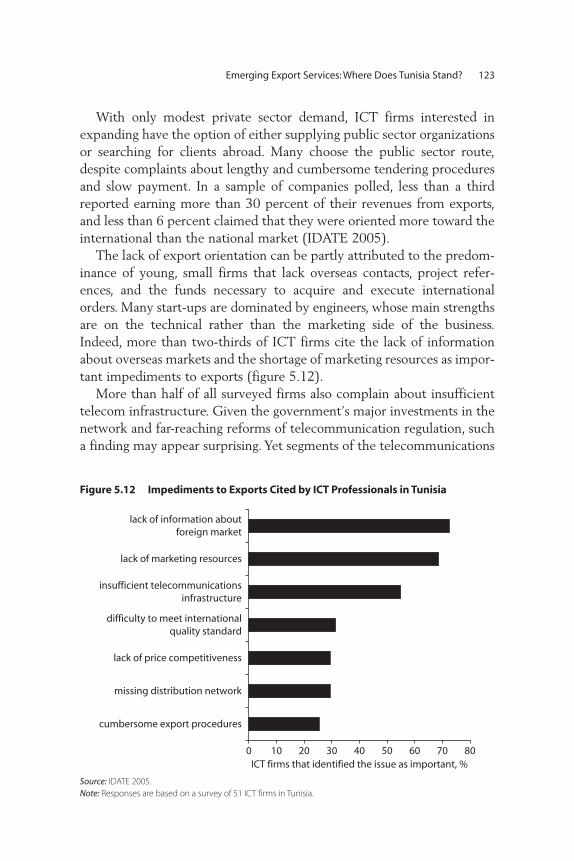
With only modest private sector demand, ICT firms interested inexpanding have the option of either supplying public sector organizationsor searching for clients abroad. Many choose the public sector route,despite complaints about lengthy and cumbersome tendering proceduresand slow payment. In a sample of companies polled, less than a thirdreported earning more than 30 percent of their revenues from exports,and less than 6 percent claimed that they were oriented more toward theinternational than the national market (IDATE 2005).
The lack of export orientation can be partly attributed to the predom-inance of young, small firms that lack overseas contacts, project refer-ences, and the funds necessary to acquire and execute internationalorders. Many start-ups are dominated by engineers, whose main strengthsare on the technical rather than the marketing side of the business.Indeed, more than two-thirds of ICT firms cite the lack of informationabout overseas markets and the shortage of marketing resources as impor-tant impediments to exports (figure 5.12).
More than half of all surveyed firms also complain about insufficienttelecom infrastructure. Given the government’s major investments in thenetwork and far-reaching reforms of telecommunication regulation, sucha finding may appear surprising. Yet segments of the telecommunications
Emerging Export Services: Where Does Tunisia Stand? 123
Figure 5.12 Impediments to Exports Cited by ICT Professionals in Tunisia
Source: IDATE 2005.Note: Responses are based on a survey of 51 ICT firms in Tunisia.
0 10 20 30 40 50 60 70 80
cumbersome export procedures
missing distribution network
lack of price competitiveness
difficulty to meet internationalquality standard
insufficient telecommunicationsinfrastructure
lack of marketing resources
lack of information aboutforeign market
ICT firms that identified the issue as important, %

sector have not undergone any significant liberalization, and the monop-olistic power of the incumbent service provider seems to result in poorservice quality. Indeed, the general manager of a call center visited by aWorld Bank team reported that he had a phone service outage for manyhours the previous day (and similar service cuts over the previous year).He was furious about the lack of responsiveness of the telecom operatorand even more upset about his lack of alternative providers.
What Needs to be Done to Strengthen Competitiveness?
One area of cross-cutting importance concerns the quality of statisticsabout structures and developments in trade in services that is available topolicy makers. Better statistics are needed to enable the government todesign suitable sectoral trade promotion strategies, including strategiesfor cooperation at the interministerial level. International statisticalguidelines and good practices are contained in the Manual onStatistics of International Trade in Services, developed and publishedjointly by the European Commission, the International MonetaryFund, the OECD, the United Nations, the United Nations Conferenceon Trade and Development, and the World Trade Organization (WTO).(The document—UN document ST/ESA/STAT/SER.M/86—is availableon the Web sites of the six organizations.)
Tunisia has multiple tools in hand with which to develop trade profes-sional and ICT-enabled services. Most progress could be achieved throughunilateral reforms. Bilateral agreements—conventions on health, mutualrecognition of diplomas or qualifications, and facilitation of the movementof people, for example—have also proven to be a useful and pragmaticapproach to opening foreign markets. Regional negotiations could help pro-mote a deeper integration of professional services within the Maghrebregion and with Europe: beyond the removal of obstacles to trade, this levelof negotiations facilitates harmonization of standards, practices, and regula-tory frameworks. Tunisia could use the WTO to trade existing and prospec-tive reforms for further market access with its major trading partners. Itcould use international commitments to anchor domestic reforms, protectthe government against future pressure of interest groups, and send a posi-tive signal to foreign investors. Specific areas of reform are described below.
Strengthen University Training and Professional Standards Professional and ICT-enabled services are among the high value-addedactivities that Tunisia could develop to diversify its exports and avoid falling
124 Cattaneo, Diop, and Walkenhorst
into the trap of directly competing with low-paid and low-qualified work-ers in other developing countries. Significant investments in education andstandards improvement are needed if it is to do so.
Professional education and training in Tunisia have some shortcomings(World Bank 2007). For some university degrees (management, finance,law), the number of graduates greatly exceeds the absorption capacity ofthe labor market. As a result, more than two-thirds of all law graduatesremain unemployed 18 months after finishing their studies (World Bank2007). To remedy the problem, the universities need to find ways toimprove the employability of their students and channel more of theminto career paths with good employment prospects, such as engineering.
In all professional services sectors, efforts are being made to reformtraining. For example, in May 2006 a new law created a professionalschool dedicated to training lawyers. This school supplements otherteaching institutions. Admission to the school is open to students withundergraduate law degrees who successfully pass an entry examination.The reform was intended to provide entrants to the legal profession withspecialized knowledge and training, thereby improving the quality of newlawyers. This reform is welcome. The profession has concerns, however,about the independence of the new school (and the profession), which isunder the government’s supervision. Lack of independence could be aserious drawback for the profession and trade.
The quality of Tunisian medical doctors is good, but the training ofnurses, midwives, and other support and paramedical staff is often inade-quate. A reform of nurses’ training was initiated in 2006 to recruit at thebaccalauréat level and provide three years’ training in nursing schools (atthe university level). More effort must be made to teach languages ifTunisia wants to develop medical tourism activities. Paramedical disci-plines (for example, thalassotherapy, nutrition, physiotherapy) could bedeveloped to meet the needs of health and well-being tourism.
Looking forward, the government should maintain the pace of reformsin professional education to preserve the reputation of the Tunisian work-force for solid qualifications and high-quality service. It should adapttraining to the needs of the global market and introduce internationalstandards where appropriate.
Review Restrictions to Market AccessLiberalizing and opening professional services is not about suppressingdomestic regulations: on the contrary, the maintenance of high-qualityservice and the protection of consumers against malpractice are essential
Emerging Export Services: Where Does Tunisia Stand? 125
to the reputation and trade success of a country. Sometimes liberalizingmeans adopting new rules. Some rules are more restrictive than neces-sary to achieve legitimate policy objectives (such as the protection ofconsumers), however.
In Tunisia, the interests of professionals seem to prevail over those ofconsumers. The lack of openness limits competition on the domesticmarket, with the most efficient firms primarily supplying their servicesabroad (duality of the market). Tunisian consumers and businesseswould therefore be the main beneficiaries of the removal of unnecessaryobstacles to trade in professional services.
Some obstacles (for example, nationality requirements) are commonto most professional services; others are sector specific. The restrictive-ness index developed by Nguyen-Hong (2000) indicates that regulationof professional services is strict in Tunisia relative to other countries(table 5.3). Creating a census of all rules that affect trade in each sectorwould be useful in the context of regional and multilateral negotiations.(Morocco completed this exercise in the lead-up to its free trade agreementwith the United States.)
Medical services. Many countries providing medical services to foreign-ers attract big names from abroad to promote their facilities. Tunisia’srequirement that only nationals can practice medicine in Tunisia has anegative impact on medical tourism. Foreign doctors can provide andreceive training in Tunisia, with the authorization of the Ministry ofEducation and the Ordre des Médecins, but they cannot practice inTunisia. These nationality requirements largely defeat the purpose ofagreements on the mutual recognition of diplomas.
These restrictions apart, Tunisia suffers more from a lack than anexcess of rules on medical tourism. The government could take a newlook at the corpus of rules to adjust it to the needs of this new form oftrade and ensure respect of medical ethics and good practices.
Engineering. Engineering is the most open of all professional services sectors in Tunisia, a common feature in many countries (architectureremains more regulated). Nationality requirements are a problem, andforeigners face limitations in practicing engineering in Tunisia. Manyengineering firms provide consulting services, however, which foreignersare permitted to provide. Some foreigners hold managerial positions inleading Tunisian engineering firms. Diplomas are more readily recognizedacross borders than in other professions.
126 Cattaneo, Diop, and Walkenhorst
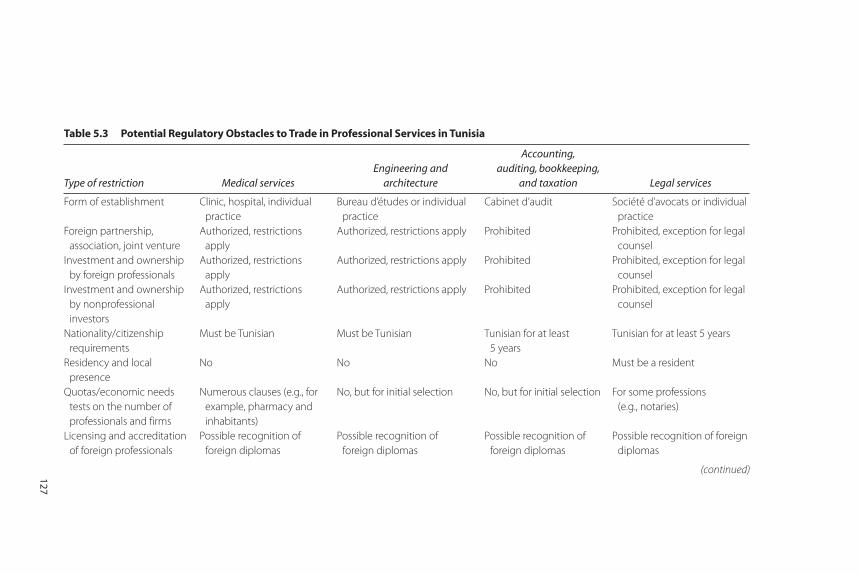
Table 5.3 Potential Regulatory Obstacles to Trade in Professional Services in Tunisia
Type of restriction Medical servicesEngineering and
architecture
Accounting, auditing, bookkeeping,
and taxation Legal services
Form of establishment Clinic, hospital, individual practice
Bureau d’études or individual practice
Cabinet d’audit Société d’avocats or individualpractice
Foreign partnership, association, joint venture
Authorized, restrictions apply
Authorized, restrictions apply Prohibited Prohibited, exception for legalcounsel
Investment and ownership by foreign professionals
Authorized, restrictions apply
Authorized, restrictions apply Prohibited Prohibited, exception for legalcounsel
Investment and ownership by nonprofessional investors
Authorized, restrictions apply
Authorized, restrictions apply Prohibited Prohibited, exception for legalcounsel
Nationality/citizenship requirements
Must be Tunisian Must be Tunisian Tunisian for at least 5 years
Tunisian for at least 5 years
Residency and local presence
No No No Must be a resident
Quotas/economic needs tests on the number of professionals and firms
Numerous clauses (e.g., for example, pharmacy and inhabitants)
No, but for initial selection No, but for initial selection For some professions (e.g., notaries)
Licensing and accreditation of foreign professionals
Possible recognition of foreign diplomas
Possible recognition of foreign diplomas
Possible recognition of foreign diplomas
Possible recognition of foreigndiplomas
127
(continued)
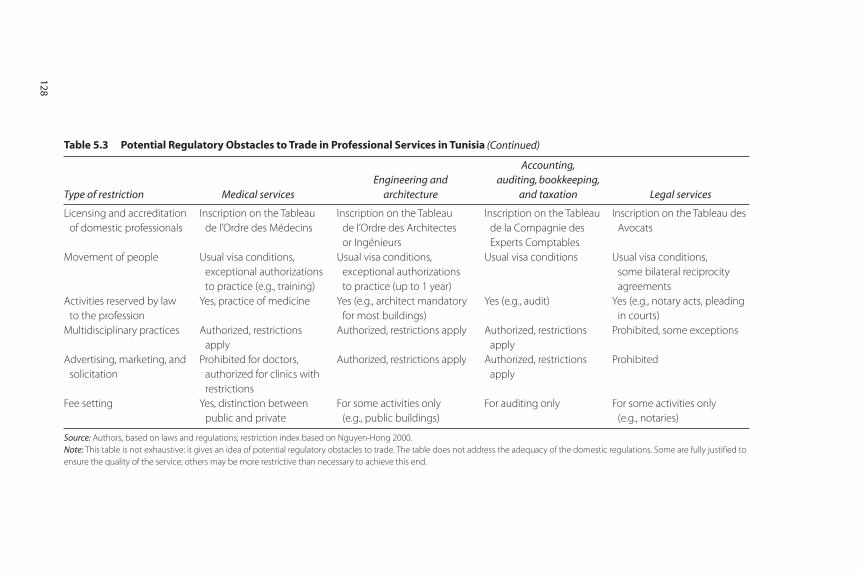
Table 5.3 Potential Regulatory Obstacles to Trade in Professional Services in Tunisia
Type of restriction Medical servicesEngineering and
architecture
Accounting, auditing, bookkeeping,
and taxation Legal services
Licensing and accreditation of domestic professionals
Inscription on the Tableau de l’Ordre des Médecins
Inscription on the Tableau de l’Ordre des Architectes or Ingénieurs
Inscription on the Tableau de la Compagnie des Experts Comptables
Inscription on the Tableau desAvocats
Movement of people Usual visa conditions, exceptional authorizations to practice (e.g., training)
Usual visa conditions, exceptional authorizations to practice (up to 1 year)
Usual visa conditions Usual visa conditions, some bilateral reciprocityagreements
Activities reserved by law to the profession
Yes, practice of medicine Yes (e.g., architect mandatory for most buildings)
Yes (e.g., audit) Yes (e.g., notary acts, pleadingin courts)
Multidisciplinary practices Authorized, restrictions apply
Authorized, restrictions apply Authorized, restrictions apply
Prohibited, some exceptions
Advertising, marketing, and solicitation
Prohibited for doctors, authorized for clinics with restrictions
Authorized, restrictions apply Authorized, restrictions apply
Prohibited
Fee setting Yes, distinction between public and private
For some activities only (e.g., public buildings)
For auditing only For some activities only (e.g., notaries)
Source: Authors, based on laws and regulations; restriction index based on Nguyen-Hong 2000.Note: This table is not exhaustive: it gives an idea of potential regulatory obstacles to trade. The table does not address the adequacy of the domestic regulations. Some are fully justified toensure the quality of the service; others may be more restrictive than necessary to achieve this end.
128
(Continued)

The regulation that most affects trade in engineering services pertains topublic tenders for construction projects. A 2003 reform raised concernsamong the Tunisian engineering community because of the increasedweight of prices in the selection process (and the concomitant reduction inemphasis on quality). Some firms interviewed suggested that this regulationprevented new engineering firms from emerging and exporting after gain-ing enough experience on the domestic market. According to some Tunisianengineers, most reputable Tunisian firms can no longer compete, despitegood quality, because of the low prices offered by foreign competitors. Theregulation suggests that different rules be applied for “complex orders,” butadministrative burdens attached to these orders have prevented any publicbody from characterizing a tender as “complex.” Harmonization of theserules with those of European Union or African countries could be useful.
Accounting. To become an accountant in Tunisia, a person needs to havebeen a Tunisian national for at least five years. This regulation restricts theestablishment of foreign firms, although the Big Four have opened officesowned and staffed entirely by Tunisians (these firms use the name of aforeign company but are fully Tunisian).
Auditing is subject to strict price controls, aimed at ensuring that thecost of compliance with auditing requirements is not excessive for busi-nesses. Some firms interviewed suggested that the market could ade-quately regulate prices and that the rules do not promote improvementsin quality. Some flexibility could be introduced to take better account ofthe difficulty of certain audits. Opening the profession could also helppromote higher quality at a lower price.
Legal services. Legal services are the most regulated of all professionalservices in Tunisia, where it is impossible for foreign firms to practice law.Only one foreign law firm has opened an office in Tunis (with great dif-ficulties), with a practice limited to “legal counseling” (a profession that isnot regulated).
Barriers to trade vary within the legal services sector. Notaries are evenmore heavily regulated than lawyers. The result is a closed sector that hasnot taken off, despite signs of dynamism and legal services trade in moreopen neighboring countries.
Throughout the world, the specificity of national laws makes it diffi-cult for legal professionals to practice in foreign countries. However, thelevel of protection in place in Tunisia is not justified on consumer protec-tion grounds. The government could revise rules in the light of theprospects for rapid growth in the worldwide services market.
Emerging Export Services: Where Does Tunisia Stand? 129
Encourage Structural Consolidation The small size of most professional services and ICT firms and the lackof large offshoring companies means that Tunisian professional and ICTservices have low visibility abroad. A structural approach that balances astrong small and medium-size enterprise sector with scale-efficientnational firms and affiliates of multinational companies seems to becalled for.
The government recognizes the size-related obstacles to developmentof the ICT sector and has been trying to establish technology clusters inorder to promote information exchange and business contacts. It hasestablished five regional cyber parks to promote the creation of ICT clus-ters within office complexes that can accommodate 50–80 technicalemployees each (box 5.1). By 2005, the five complexes together housed48 ICT companies (software development, Web site maintenance, callcenters), with a total staff of about 300.
In the professions, scaling up is a necessary step to international com-petitiveness: trade has to play a major role in the structural consolidation
130 Cattaneo, Diop, and Walkenhorst
Box 5.1
Promoting Exports through a Technology Park
The 65-hectare El Gazala technology park, outside Tunis, has been in operation
since December 2001. It serves as an incubator for new enterprises, providing
advice and financial support during the start-up phase, establishing an industry
network and contacts with universities and international firms, organizing train-
ing and information exchanges, and managing the common infrastructure and
property. By 2005, El Gazala housed 38 companies, including affiliates of four
multinationals (Alcatel, Ericsson, Huawei, and ST Microelectronics), and employed
about 1,000 people.
The ICT companies in El Gazala appear to be more export oriented than the
industry average. This may reflect the administrative and managerial support avail-
able as well as the greater opportunities for international contacts that the park
provides. More than a third of the companies installed in the park, employing half
of all staff, work exclusively for export. Another sixth export at least a third of their
output. Further development of the park could foster ICT service exports and help
overcome the scale disadvantage many Tunisian firms face when trying to export.
Source: Elgazala Pole of Communication Technologies, http://www.elgazalacom.nat.tn.
of the sector. The accounting and engineering sectors suggest that partner-ships with foreign firms help promote the sector’s concentration andcompetitiveness. This, however, is not enough to ensure the long-termgrowth of the sectors. Private sector efforts must be supported by coherentgovernmental policies.
In the medical services sector, structural consolidation should start atthe government level. Countries that have been the most successful in thehealth tourism race, such as Thailand and India, have dedicated horizontaladministrative structures that ensure coherence of strategies across min-istries and actors. In 2004, for example, Thailand’s ministries of commerceand health collaborated to design a five-year strategic plan for medicaltourism. An integrated approach would also ensure that key (and scarce)human resources are not diverted from the domestic market. The costsand benefits of an offshore approach to health tourism could be balancedwith alternatives such as the authorization of private hospitals open toboth foreigners and locals (along the Asian model). In the legal sector, thepartial liberalization of trade could be an integral part of legal and judicialreforms (including legal training).
Address Administrative and Financing Constraints Because of their limited managerial resources, small-scale enterprises,such as professional and ICT firms in Tunisia, are particularly vulnerableto the administrative burdens placed on them by regulatory requirementsand strict conditions for access to credit. Indeed, in an enterprise survey,respondents cited administrative and financing obstacles as major factorslimiting business and export development (figure 5.13). Recent univer-sity graduates with good business plans are held back by administrativerequirements and lack of credit.
The government has set up risk capital schemes (the Sociétésd’Investissement à Capital Risque [SICAR]), but the take-up by ICTfirms has been weak because of substantial collateral and guaranteerequirements. At the same time, the Tunisian banking system is reluctantto grant credit to producers of services. Proactive efforts to strengthen thecapital base of small-scale services firms and improve their access tocredit appear called for to improve the business environment for profes-sional and ICT services firms.
One opportunity for government action concerns public tenders.Procedures are cumbersome, 40 percent of public tenders are latercancelled, and payments are often delayed for several months (GrupoSantander, Louis Lengrand and Associés, and Banque d’Affaires de
Emerging Export Services: Where Does Tunisia Stand? 131
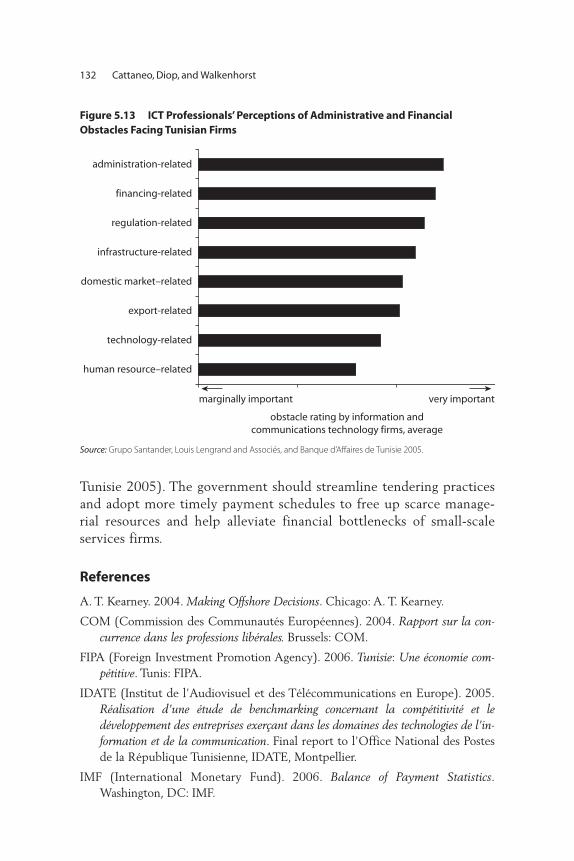
Tunisie 2005). The government should streamline tendering practicesand adopt more timely payment schedules to free up scarce manage-rial resources and help alleviate financial bottlenecks of small-scaleservices firms.
References
A. T. Kearney. 2004. Making Offshore Decisions. Chicago: A. T. Kearney.
COM (Commission des Communautés Européennes). 2004. Rapport sur la con-currence dans les professions libérales. Brussels: COM.
FIPA (Foreign Investment Promotion Agency). 2006. Tunisie: Une économie com-pétitive. Tunis: FIPA.
IDATE (Institut de l’Audiovisuel et des Télécommunications en Europe). 2005.Réalisation d’une étude de benchmarking concernant la compétitivité et ledéveloppement des entreprises exerçant dans les domaines des technologies de l’in-formation et de la communication. Final report to l’Office National des Postesde la République Tunisienne, IDATE, Montpellier.
IMF (International Monetary Fund). 2006. Balance of Payment Statistics.Washington, DC: IMF.
132 Cattaneo, Diop, and Walkenhorst
Figure 5.13 ICT Professionals’ Perceptions of Administrative and Financial Obstacles Facing Tunisian Firms
Source: Grupo Santander, Louis Lengrand and Associés, and Banque d’Affaires de Tunisie 2005.
human resource–related
marginally important
obstacle rating by information andcommunications technology firms, average
very important
technology-related
export-related
domestic market–related
infrastructure-related
regulation-related
financing-related
administration-related

Grupo Santander, Louis Lengrand and Associés, and Banque d’Affaires de Tunisie.2005. Etude “meilleures pratiques” sur l’integration du secteur privé dans leschaines mondialisées de production, de distribution et d’export dans le domainedes TIC. Final report to the l’Office National des Postes de la RépubliqueTunisienne, Grupo Santander, Louis Lengrand and Associés, and Banqued’Affaires de Tunisie, Tunis.
Lautier, M. 2008. “Export of Health Services from Developing Countries: TheCase of Tunisia.” Social Science & Medicine 67 (1): 101–10.
McCarthy, J. C. 2002. 3.3 Million US Services Jobs to Go Offshore. ForresterResearch, Cambridge, MA. http://www.forrester.com/ER/Research/Brief/Excerpt/0,1317,15900,00.html.
McKinsey Global Institute. 2005a. The Emerging Global Labor Market: TheDemand for Offshore Talent in IT Services. San Francisco: McKinsey GlobalInstitute.
———. 2005b. The Emerging Global Labor Market: How Supply and Demand forOffshore Talent Meet. San Francisco: McKinsey Global Institute.
Nguyen-Hong, D. 2000. Restrictions on Trade in Professional Services. StaffResearch Paper, Productivity Commission, Melbourne, Australia.
OECD (Organisation for Economic Co-operation and Development). 2006.Potential Impact of International Sourcing on Different Occupations.DSTI/ICCP/IE(2006) 1/FINAL. Paris: OECD.
Roland Berger Strategy Consultants. 2006. Latest Trends in Call Center Offshoringin France. Paris: Roland Berger Strategy Consultants.
Symboles Média. 2005. Les technologies de l’information et de la communication enTunisie. Business Registry, Tunis.
World Bank. 2007. République Tunisienne: Dynamique de l’emploi et adequation dela formation parmi les diplômes universitaires. Washington, DC: World Bank.
WTO (World Trade Organization). 2006. International Trade Statistics 2005.Geneva: WTO.
Emerging Export Services: Where Does Tunisia Stand? 133

135
Backbone services—telecommunications, financial services, transport, andso forth—are crucial to the productivity and international competitive-ness of Moroccan firms. They are critical inputs for both the domesticeconomy and the export sector. Opening them to competition and tradecan help reduce production costs, increase foreign direct investment(FDI), promote vertical knowledge spillovers, and expand markets, all ofwhich enhance competitiveness. Backbone services also affect the abilityto competitively export goods and services. Efficient ports and maritimeservices, for example, are crucial for competitively exporting goods suchas textile products; the ability to participate in business process outsourc-ing and to export information and communication technology(ICT)–enabled services (such as call centers) depends on the state of tele-com services. Reducing restrictions on key backbone services can enhancecompetitiveness and lead to more choice, lower prices, and greater effi-ciency in general.
Morocco has made significant progress in its reform program, but per-formance in opening backbone services to private sector competition has
C H A P T E R 6
Anchoring Services Reform: The European Neighborhood Policy and Morocco
Ndiamé Diop
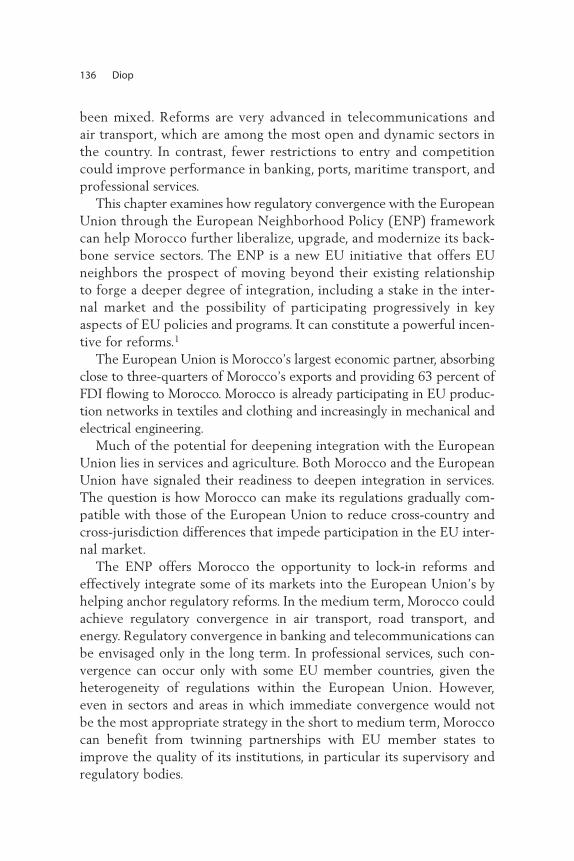
been mixed. Reforms are very advanced in telecommunications andair transport, which are among the most open and dynamic sectors inthe country. In contrast, fewer restrictions to entry and competitioncould improve performance in banking, ports, maritime transport, andprofessional services.
This chapter examines how regulatory convergence with the EuropeanUnion through the European Neighborhood Policy (ENP) frameworkcan help Morocco further liberalize, upgrade, and modernize its back-bone service sectors. The ENP is a new EU initiative that offers EUneighbors the prospect of moving beyond their existing relationshipto forge a deeper degree of integration, including a stake in the inter-nal market and the possibility of participating progressively in keyaspects of EU policies and programs. It can constitute a powerful incen-tive for reforms.1
The European Union is Morocco’s largest economic partner, absorbingclose to three-quarters of Morocco’s exports and providing 63 percent ofFDI flowing to Morocco. Morocco is already participating in EU produc-tion networks in textiles and clothing and increasingly in mechanical andelectrical engineering.
Much of the potential for deepening integration with the EuropeanUnion lies in services and agriculture. Both Morocco and the EuropeanUnion have signaled their readiness to deepen integration in services.The question is how Morocco can make its regulations gradually com-patible with those of the European Union to reduce cross-country andcross-jurisdiction differences that impede participation in the EU inter-nal market.
The ENP offers Morocco the opportunity to lock-in reforms andeffectively integrate some of its markets into the European Union’s byhelping anchor regulatory reforms. In the medium term, Morocco couldachieve regulatory convergence in air transport, road transport, andenergy. Regulatory convergence in banking and telecommunications canbe envisaged only in the long term. In professional services, such con-vergence can occur only with some EU member countries, given theheterogeneity of regulations within the European Union. However,even in sectors and areas in which immediate convergence would notbe the most appropriate strategy in the short to medium term, Moroccocan benefit from twinning partnerships with EU member states toimprove the quality of its institutions, in particular its supervisory andregulatory bodies.
136 Diop

Liberalization Reforms and the Openness of Morocco’s Services Sectors
The reform of Morocco’s backbone services is well under way. Almost allbackbone services have opened up to a certain degree in recent years,with many restrictions that once constrained private sector participa-tion and competition reduced unilaterally. Morocco’s initial offer inthe Doha Round represents a major improvement over its GeneralAgreement on Trade in Services (GATS) commitments in terms of sig-naling and reform credibility, even if it merely consolidates recent unilat-eral reforms. It increases the sectoral coverage of commitments from 7 inits Uruguay Round Agreement schedule to 10. In the free trade agree-ment with the United States, Morocco went even farther, making newcommitments under cross-border supply (mode 1) in 66 percent of theservice sectors included in GATS and under commercial presence(mode 3) in 53 percent (Roy, Marchetti, and Lim 2006). Important con-cessions to U.S. services suppliers and investors were made, in particularin banking and insurance.
A World Bank study (World Bank 2007a) benchmarks the degree ofopenness of Morocco’s service sectors against other countries usingrestrictiveness indices. It indicates that telecommunications, air transport,and accounting are Morocco’s most open backbone services sectors(figure 6.1). The greater market contestability and competition in thesesectors has had beneficial effects in the economy: better and more diverseservices, lower prices, and spillover effects to the rest of the economy.Banking, engineering, and shipping services have an intermediate degreeof restrictions and competition. Morocco scores worst in the shipping andports sectors, in which regulation is very restrictive (World Bank 2007b).The score for maritime and ports is likely to change in the near future, asMoroccan ports are being reformed and private sector participation isexpected to increase. These indicators are consistent with those calculatedby a World Bank survey (World Bank 2007a) and by the Forum Européendes Instituts de Sciences Economiques (FEMISE 2007).
The Need to Strengthen the Regulatory Framework
The ENP covers a wide range of policy issues, both economic and noneco-nomic. On the economic front, it aims to build solid foundations fordeepening economic integration between Europe and its neighbors toenhance trade, investment, and growth. Unlike the EU accession process,
Anchoring Services Reform: The European Neighborhood Policy and Morocco 137

Figure 6.1 Openness of Telecommunications, Air Transport, Banking, and Accounting Sectors in Selected Countries
0 5 10 15 20 25 30
Australia
Chile
Japan
Estonia
Morocco
Lithuania
Latvia
Brazil
Malaysia
Zambia
Russian Federation
Bulgaria
Romania
Tunisia
Moldova
Albania
Bosnia and Herzegovina
Thailand
Serbia and Montenegro
Macedonia, FYR
Vietnam
a. Telecommunications b. Air transport
price impact, %
0.0 1.0 2.0 3.0 4.0 5.0 6.0
Korea, Rep. of
Finland
Italy
New Zealand
Morocco
Portugal
Mexico
Poland
Turkey
Slovak Republic
Greece
Ireland
Czech Republic
Tunisia
Hungary
restrictiveness index
domestic foreign
138
Source: World Bank 2007a.Note: Figures are for 2005–07.
0.0 0.1 0.2 0.3 0.4 0.5 0.6 0.7
Albania
Croatia
Estonia
Macedonia, FYR
Moldova
Lithuania
Bulgaria
Australia
Zambia
Serbia and Montenegro
Latvia
Russia
Chile
Thailand
Morocco
Tunisia
Brazil
Vietnam
China
Malaysia
restrictiveness index
0.0 0.5 1.0 1.5 2.0 2.5 3.0 3.5 4.0 4.5
Finland
Norway
Tunisia
Netherlands
Mexico
Spain
New Zealand
Korea, Rep. of
Hungary
Austria
Czech Republic
Morocco
Turkey
Slovak Republic
Japan
Greece
Germany
Luxembourg
Canada
Italy
restrictiveness index
c. Banking d. Accounting
domestic foreign
139
which requires that candidates harmonize their regulations with theEuropean Union by adopting the entire acquis communautaire, the ENPallows Morocco and other nonaccession countries to choose à la cartefrom the acquis, implementing only those regulations that are expectedto yield significant benefits at low costs.2
The ENP offers a variety of new opportunities, including the following:
• Greater integration with the European Union, including the possibil-ity of participating progressively in key aspects of EU policies andprograms
• Convergence of economic legislation, which, combined with the con-tinued reduction of trade barriers, should stimulate investment andgrowth
• Targeted technical assistance and twinning schemes, with a view topreparing convergence with EU legislation in the areas covered by theaction plan (see below)
• Increased financial support from the European Union for implemen-tation of all the sections of the association agreement and operationsidentified in the action plan, support from the European InvestmentBank for infrastructure investment and private sector development,and partnership through the Facility for Euro-Mediterranean Invest-ment and Partnership (FEMIP) facility.3
Morocco officially adopted an ENP action plan to achieve the reformsenvisioned in the ENP in October 2005. The plan, currently being imple-mented, sets out priority reforms on both economic and noneconomicfronts, including the negotiation of an agreement on services, participationof Morocco in select areas of the internal market (such as the EU transportnetwork), and reforms aimed at reinforcing the investment climate inMorocco.
Options for Regulatory Convergence with the European Union in Selected Sectors
The action plan considers the integration of the service sectors a precon-dition for deeper integration in other spheres. It is not, however, specificon how to achieve progressive and selective participation in the EU inter-nal market. This section shows how the ENP tools can be used to anchorreforms in seven backbone service sectors. (For a discussion of the reformprogram in each sector, see World Bank 2007a.)
140 Diop
TelecommunicationsParticipating in the EU telecommunications market would requireconverging to the regulations indicated by the directives that govern theEU market (box 6.1). Doing so is necessarily a long-term effort, giventhe regulatory distance between Morocco and the European Union.
Anchoring Services Reform: The European Neighborhood Policy and Morocco 141
Box 6.1
Major Directives Governing the Telecommunications Sector in the European Union
More than 20 years after gradually opening the sector, the European Union enjoys
fully competitive telecommunications markets in all member states except
Ireland, Greece, Luxembourg, Portugal, and Spain. The abolition of barriers to
entry into the sector has allowed the European Commission to focus, since 2002,
on ensuring a common regulatory framework, competition principles, and com-
petition practices for electronic communications, including telecommunications,
media, and information technology services. Efforts have been made through five
major rules: the framework directive, the authorization directive, the access direc-
tive, the universal service directive, and the local loop unbundling regulation. (For
details, see the EU telecom page, at http://ec.europa.eu/information_society/
topics/telecoms/index_en.htm.)
The framework directive emphasizes the independence of national regulatory
authorities, which member states must guarantee; the right to appeal decisions
by national regulatory authorities; mechanisms for imposing ex ante regulation
on firms with significant market power; market definition and market analysis
procedures; and national regulatory authorities’ duties to resolve disputes within
four months when negotiations on access and interconnections fail. The directive
also introduces the principle of technological neutrality—the principle that there
shall be no separation between different means of transmission for regulatory
purposes. Equivalent rules apply to all telecommunications networks (fixed or
wireless) and broadcast networks (terrestrial, satellite, and cable).
The authorization directive abolishes individual licensing and establishes a
system of general authorization. Older licensing schemes for different telecom-
munications services (that is, public voice and data providers) and facilities-based
and resale providers were removed within the European Union. The directive
indicates that member states may require at most a notification. No permissions
(continued)

142 Diop
Box 6.1 (Continued)
or other administrative barriers to entry can be imposed, and applications must
be finalized within certain time limits. Obtaining a general authorization is as sim-
ple as it can be. However, if the undertaking does not comply with the general
conditions laid down by the national regulatory authorities, it may be subject to
financial penalties or be prohibited from providing services. To prevent the use of
licensing as a barrier (as in the previous system), the directive indicates that the
tariff requested for any license should reflect only the costs incurred by the national
regulatory authorities while issuing it.
The access directive stresses the possibility for new entrants to interconnect
with the incumbent network and other operators’ networks at reasonable cost
and conditions. Member states cannot restrict private negotiations between
undertakings for interconnections. Operators, except for those with significant
market power, cannot be obliged to discriminate between different undertak-
ings for equivalent services. They are obliged to negotiate interconnection
when asked to do so (when necessary, national regulatory authorities can impose
obligations on an operator to facilitate interconnections). The obligations may be
imposed only on an objective, transparent, proportionate, and nondiscriminatory
basis. National regulatory authorities can impose additional measures related to
access on operators with significant market power by permission of the European
Commission.
The universal service directive states that “the current regulatory framework
requires national regulatory agencies to place obligations on network opera-
tors to ensure that a defined minimum set of services of a specified quality are
available to all, independent of their geographical location, at an affordable
price.” Universal service, as defined in EU legislation, includes the provision of
voice telephony, fax, and voice band data transmission via modems (that is,
access to the Internet).
These directives are the core regulations with which member states must
comply in order to participate in the EU common telecom market. They are at
various stages of transposition pending adoption by member countries.
The local loop unbundling regulation aims at facilitating access to the least
competitive segments of the liberalized telecommunications market. It recog-
nizes that new entry to the fixed-line infrastructure market is very difficult and
that existing infrastructure was financed by state-controlled monopolies, using
public funds. In the framework of Regulation 2887/2000, notified operators are
obliged to meet reasonable requests for unbundled access to the local loop
(continued)
Morocco’s regulatory system differs from that of the EuropeanUnion in many ways. First, whereas European regulation establishesthat member states can no longer use individual licenses to regulate thesector, the Moroccan government has a regime of licenses and classlicenses, which it awards one by one, thereby determining how manyoperators can operate in the market. Adopting the EU system wouldrequire establishing a general authorization for all types of electroniccommunication services and networks, including fixed and mobile net-works and service, data and voice services, broadcasting transmissionnetworks, and related services.
Second, the European Commission identifies product markets in thetelecommunications industry, within which national regulators definegeographic or additional product markets for their localities. Within eachproduct market, regulators also assess the effectiveness of competition,including whether companies have single or joint market dominance. Ifthey do not, the regulator may remove existing obligations or, at the least,decide not to impose new obligations. In this case, companies with single-market dominance are subject to ex ante regulation (such as accountingseparation and cost orientation proportionate to their level of dominance).Under Moroccan Law 55-01, the Agence Nationale de Réglementationdes Télécommunications (ANRT), the Moroccan telecommunicationsregulator, has been given the responsibility of defining markets and assess-ing market power; it has largely applied the EU framework (the applica-tion was only to the wholesale market). However, whereas the EU systemdefined 18 product markets for regulation, Morocco selected only 4—mobile, fixed, leased lines, and Internet—for treatment.
Anchoring Services Reform: The European Neighborhood Policy and Morocco 143
Box 6.1 (Continued)
under transparent, fair, and nondiscriminatory conditions. According to the
regulation, the national regulatory authorities have the responsibility to iden-
tify “notified operators” as those that have significant market power in fixed
public telephone networks, to ask notified operators to publish a reference of-
fer for unbundled access to their local loops and related facilities, and to supervise
notified operators with regard to a cost-based pricing and a transparent, fair,
and nondiscriminatory unbundled access provision for other operators to the
local loop.
Source: European Commission. “Telecoms in the European Union.” http://ec.europa.eu/information_society/policy/ecomm/index_en.htm.

Third, whereas in the European Union prices are set by the marketcompetitively, Morocco requires firms, including those that do not dom-inate the market, to submit tariffs to the regulator for approval. In theEuropean Union, the regulator checks for general competitiveness in themarket but does not regulate prices. Price regulation is decried as amechanism that slows down the market.
Fourth, participating in the EU common market would mean an insti-tutional adjustment for the sharing of regulatory responsibility betweenthe government, the ANRT, and the European Commission. With theconstitution of a common telecommunications market at the EU level,responsibility for regulation is now shared by the European Commission,which publishes directives and guidelines; national governments, whichimplement appropriate legislations; and national regulatory agencies,which implement the full framework. The European Commission playsan important role in ensuring that rules are applied consistently in allmember states, in cooperation with other national regulatory agencies.National regulatory agencies in particular have to assess the degree ofeffective competition in relevant markets and decide which regulatoryobligations to impose on players with significant market power.
Short- to medium-term priority in Morocco should perhaps be givento further developing infrastructure to meet the rapidly growing demandfor high-speed Internet services and developing the data segment of themarket. Unbundling the local loop would allow new service providers toreach end users through the existing network. Subscribers would then beable to choose freely among all operators without having to have a sub-scription with Maroc Telecom. The ANRT’s objective is to achieve fullunbundling in the medium term.
The ANRT could benefit from technical assistance in the form of twin-ning from the European Union for the purpose of converging gradually tothe EU framework. It could, for instance, further improve the governanceof the sector by incorporating the most recent trends in the EuropeanUnion in managing, allocating, and pricing the radio spectrum. The regu-latory gaps identified above could gradually be closed as appropriatethrough technical cooperation. Estonia provides a convincing exampleof the importance and benefits of using EU technical assistance andtwinning (box 6.2).
Air Transport Fully participating in the EU acquis in air transport is challenging forMorocco, because the European Union has the most deeply integrated
144 Diop
regional air transport market in the world. Air transport between mostcountries in the world is governed by the Chicago Civil AviationConvention.4 Liberalization consists of increasing the number of weeklyflights, the number of entry and exit airports, and the list of national carri-ers within tightly defined reciprocal arrangements. Within the EuropeanUnion, all regulatory distinctions between international and domesticservices have been abolished; bilateral air traffic agreements betweenEU member countries no longer exist, and national ownership restric-tions have been eliminated. National airlines in the European Union are
Anchoring Services Reform: The European Neighborhood Policy and Morocco 145
Box 6.2
Liberalization of the Telecommunications Sector in Estonia
As a small country with limited natural resources, Estonia recognized the strategic
importance of developing and liberalizing its service sector. In January 2001,
when it ended the monopoly of Eesti Telecom in fixed-line telephone services, it
became the first country in Central and Eastern Europe to completely liberalize its
telecommunications market.
Estonia made extensive use of EU technical assistance and advice, including
the twinning program, to strengthen the institutional capacity of the Estonian
National Communications Board as an independent regulator. The EU accession
process mechanisms also provided an efficient monitoring instrument for the
liberalization process, mostly in the form of regular reports on progress toward
accession.
The liberalization and privatization of the telecommunications services sector
led to several positive developments, including modernization of the communi-
cations infrastructure, higher FDI, and better access of consumers to telephone
services, especially in rural areas (through broader access to mobile phones, lower
prices, and greater reliability in telephony and data transmission). The number of
mobile phone users increased by a factor of almost 50 between 1995 and 2005.
By 2005, mobile penetration exceeded 100 percent, and Internet penetration
topped 50 percent, placing Estonia among Europe’s leaders (Rannu 2003; Estonia
Telecoms Market 2006).
Establishment of a modern and reliable telecommunications network laid the
foundation for the development of the information society in Estonia. Exports of
communications and computer and information services increased more than
fivefold between 1997 and 2004 (IMF 2005).
Source: Paul Budde Communications (2006).

thus no longer shielded from competition from other EU companies(Muller-Jentsch 2007a).
The Morocco-EU open skies agreement, which seeks to harmonizeMorocco’s air transport regulatory framework with that of the EuropeanUnion, entails major regulatory reforms for Morocco. The major changesrequired include enhancing flight safety and security; harmonizing compe-tition, state aid, and consumer protection rules with those of the EuropeanUnion; and providing environmental protection. These changes requiremodification, to varying degrees, of two dozen regulations and directives.
Morocco has already implemented a number of measures bringingsecurity and safety norms up to EU standards. In other cases, EU rulesapply only beyond certain thresholds that Morocco will not cross in theshort to medium term. Such examples include airport noise (which kicksin only above a certain number of departures), competition in groundhandling (which applies only above a certain number of passengers orlevel of cargo), and rules on slot allocation (in the case of capacity limita-tions). However, the alignment of national legislation with the open skiesagreement requirements entails substantial, detailed legal reforms ofnational aviation code and by-laws.
Some adjustments to the governance structure of the sector may becalled for in the medium term. According to international best practices,aviation policy is the responsibility of transport ministries, and anautonomous civil aviation authority is in charge of safety and economicregulation. Like any regulatory agency, the civil aviation authority shouldbe given full political and institutional independence. The EU acquisrequires that air traffic control also be handled by a separate entity. Allother operational functions—such as airline, airport, and ground-handlingservices—should be separated from both the line ministry and the regu-lator (Muller-Jentsch 2007a).
Morocco and the European Union have agreed to implement openskies in two phases. During the first phase, scheduled to last two years,Morocco will gradually integrate the EU aviation rules—aviation safety,air traffic management, environment, consumer protection, computerreservation systems—into the regulatory regime of its aviation sector.Market access restrictions will also be partially lifted during this phase,with unrestricted third and fourth freedoms for both Moroccan andEU carriers—the right to carry passengers and cargo between Moroccoand the European Union. The first phase will begin once the agree-ment is ratified by all parties (that is, Morocco and the 27 memberstates of the European Union) and safety arrangements are deemed
146 Diop

satisfactory (a few EU countries have yet to ratify the agreement, so itis still not operational).
A second phase—which will begin when the relevant EU regula-tions and directives scheduled for the first phase are satisfactorilyimplemented— aims at further improving market access. It should cul-minate by giving fifth-freedom passenger rights to Moroccan carriers in theEuropean Union and fifth-freedom passenger rights to EU carriers extend-ing beyond Morocco to countries involved in the Neighborhood Policy.5
In other words, Moroccan air carriers will be able fly to and through anyairport in Europe, provided that they depart from Morocco. Reciprocally,EU airlines departing from Europe will be able to operate without restric-tion between any point in Europe and any point in Morocco.
Morocco benefits from EU assistance in aligning domestic regulationswith the air transport provisions of the acquis communautaire. Morocco’sregulatory reform is indeed supported by an EU program with a set ofagreed-upon actions tying disbursement with implementation of a shortbut detailed list of EU directives and regulations. Cooperation betweenMorocco and the European Union in air transport is perhaps the best illus-tration of what the ENP can offer: participation in the EU internal market,deeper integration convergence, and financial and technical assistancefrom the European Union.
BankingThe ENP action plan for Morocco sets very general goals and initiativesfor the financial sector. Two main objectives are developing a regulatoryframework that brings financial markets in line with those of theEuropean Union and reinforcing the supervisory authorities in accor-dance with international standards. The EU regulatory framework isbased on the principles of the Basel Committee on Banking Supervision.Morocco’s efforts to comply with changes in the banking sector regula-tions thus broadly serve both EU and international standards: the newbanking law and the new status of Morocco’s central bank, both of whichwent into effect in 2006, aim at aligning Morocco’s legislation withinternational standards.
In the longer term, deeper integration or participation in the EU inter-nal banking market will require converging to the European Union’sSecond Banking Directive, adopted in 1989 by Council directive andimplemented in 1993. This directive has three major components. First, itdefines exactly what is meant by banking. In addition to traditional bank-ing activities, credit institutions can engage in all forms of transactions in
Anchoring Services Reform: The European Neighborhood Policy and Morocco 147
securities, including transactions for their own accounts or for the accountsof customers in all types of securities, participation in share issues, andportfolio management and advice. This component of the directive thusimplies that Morocco would have to lift its current restrictions on foreignbanks’ participation to the securities market.
Second, it defines the principle of home-country control, or mutualrecognition. According to this principle, each country acknowledges theregulation of its partners and accepts service provision by foreign institu-tions as if they were domestic entities. Hence, banks are regulated by, andconform to, the regulation and legislation of their home country. If abank does business in another EU country, the regulatory authorities ofthe host country recognize the primacy of the home country. Because theEuropean Union has more open regulation of foreign banks, Moroccowould have to reciprocate.
The Second Banking Directive also outlines the concept of a singlepassport. Mutual recognition of the single banking “license” eliminates theneed for EU banks to obtain a local banking charter from the host coun-try for branches or bank products permitted by their home-country bankregulations. A bank licensed to do business in any EU country is allowedto do business in any other EU country on whatever basis it considersmost advantageous. The host country is not allowed to impose any barri-ers to such action. The implication is that Morocco will have to close thegap between the degree of openness of its banking sector and that of theEuropean Union.
Morocco would have to adopt many other directives to participate inthe EU internal banking market. According to the capital adequacy direc-tives, credit institutions are subject to prudential requirements withrespect to supervision of solvency, adequacy of own funds to covermarket risks, and large exposures calculated on a consolidated basis, if theparent group is a financial holding company. Generally, the supervisoryauthority of the member country that authorized the parent company ofthis group is responsible for consolidated supervision of the group,although the capital adequacy directive does permit delegation to othercompetent authorities in certain circumstances. This provision is toosophisticated for Morocco’s banking sector; its adoption would raise thecost of compliance for Moroccan banks, which are smaller than those inthe European Union. In addition to the above provisions, the EuropeanUnion could ask Morocco to include provisions on money laundering,capital movements, and related issues, as it did in the case of Europeanand accession partnerships (table 6.1).
148 Diop
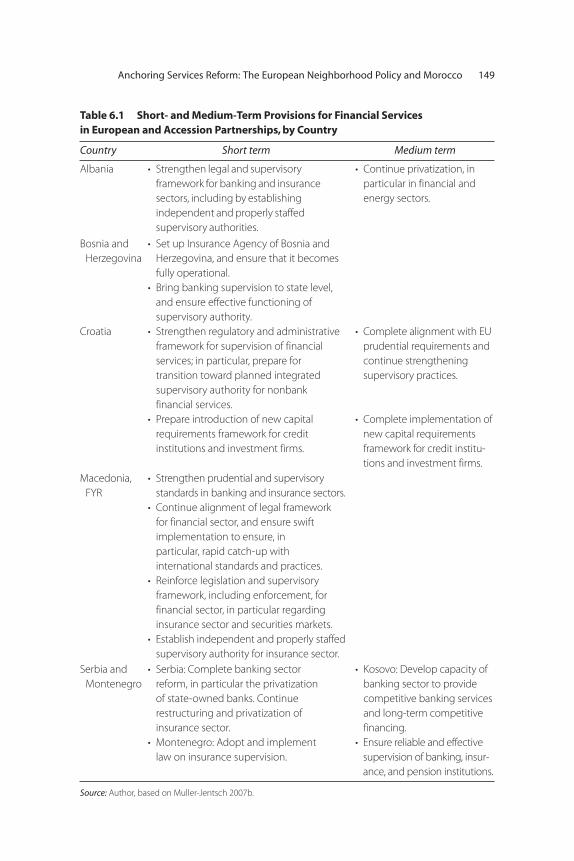
Anchoring Services Reform: The European Neighborhood Policy and Morocco 149
Table 6.1 Short- and Medium-Term Provisions for Financial Services in European and Accession Partnerships, by Country
Country Short term Medium term
Albania • Strengthen legal and supervisoryframework for banking and insurancesectors, including by establishingindep endent and properly staffedsupervisory authorities.
• Continue privatization, in particular in financial and energy sectors.
Bosnia and Herzegovina
• Set up Insurance Agency of Bosnia andHerzegovina, and ensure that it becomes fully operational.
• Bring banking supervision to state level, and ensure effective functioning of supervisory authority.
Croatia • Strengthen regulatory and administrativeframework for supervision of financial services; in particular, prepare for transition toward planned integrated supervisory authority for nonbank financial services.
• Prepare introduction of new capital requirements framework for credit institutions and investment firms.
• Complete alignment with EUprudential requirements andcontinue strengthening supervisory practices.
• Complete implementation ofnew capital requirementsframework for credit institu-tions and investment firms.
Macedonia, FYR
• Strengthen prudential and supervisory standards in banking and insurance sectors.
• Continue alignment of legal framework for financial sector, and ensure swift implementation to ensure, in particular, rapid catch-up with international standards and practices.
• Reinforce legislation and supervisory framework, including enforcement, for financial sector, in particular regarding insurance sector and securities markets.
• Establish independent and properly staffedsupervisory authority for insurance sector.
Serbia and Montenegro
• Serbia: Complete banking sector reform, in particular the privatization of state-owned banks. Continue restructuring and privatization of insurance sector.
• Montenegro: Adopt and implement law on insurance supervision.
• Kosovo: Develop capacity ofbanking sector to provide competitive banking servicesand long-term competitive financing.
• Ensure reliable and effective supervision of banking, insur-ance, and pension institutions.
Source: Author, based on Muller-Jentsch 2007b.
The convertibility of the Moroccan dirham, which is convertible onlyfor current transactions, is also an issue: full integration within the EUbanking market is not conceivable without full convertibility. Moroccohas decided to gradually move toward full convertibility and to allowfreer capital movements. However, the authorities recognize the need tostrengthen the sector as a precondition for the successful liberalization ofcapital flows. They also fear that capital account liberalization may leadto capital flight and corruption, as foreign banks may be used as an easychannel for capital drain.
The challenge for participating in the EU banking acquis is daunting.The gap between Moroccan and EU regulation is wide, a reflection ofthe development gap between the two entities. In the short term, it isdesirable to focus on implementing the regulatory reforms in the 2006banking law. On the supervision side, a priority is to strengthen the creditinstitutions’ supervision directorate at the central bank and to reinforcecoordination of the supervisory authorities for the banking, insurance, andstock market operations. The ENP’s other instrument, twinning, seemsmore suitable to help strengthen the independence and effectiveness ofthe banking and insurance markets.
Maritime Transport and Port ServicesMorocco’s ENP action plan emphasizes the need to increase the compet-itiveness of the maritime sector, promote short sea shipping, introducecompetition in port services, strengthen the maritime authorities, trainseafarers with regard to safety and the prevention of sea pollution, imple-ment relevant international conventions, and continue to align maritimelegislation with that of the European Union. Although convergence to EUmaritime legislation is cited among the goals, the action plan is not spe-cific about what regulatory convergence with the EU acquis in maritimetransport means. In the short term, convergence with EU maritime regu-lations is a daunting task.6 Regulation 4055/86, for example, wouldrequire the phasing out of any national restrictions that reserve the car-riage of goods or passengers between countries to vessels flying thenational flag (the transport of goods or passengers between states is notcovered by this regulation). Existing cargo-sharing arrangements in bilat-eral agreements with non-EU countries are to be adjusted or phased outaccording to this regulation. If such agreements are not phased out, theyhave to be brought into conformity with EU law.
Regulation 954/79 provides that the cargo-sharing formula containedin the maritime code shall not be applied between EU member states or,
150 Diop
on a reciprocal basis, between EU members and other Organisation forEconomic Co-operation and Development (OECD) countries that areparties to the code. Cargo-sharing arrangements in future bilateral agree-ments with nonmember countries will be limited to those member stateswhose shipping companies would not otherwise have an opportunity toply for trade to and from the particular nonmember country. This is rel-evant for Morocco, which has cargo-sharing schemes with many partnercountries.
The EU framework for port services remains unclear, making it diffi-cult for Morocco to move toward further integration. In 2003, theEuropean Parliament rejected the European Commission’s proposal for adirective on market access to port services. The Commission’s subsequentproposal, which to a large extent reiterates the principles in the earlierversion, has been going through the legislative process.
Conforming to the above set of regulations will be challenging forMorocco in the short run. Adoption of the EU acquis could reduce themarket share of Moroccan shipping companies, unless they enter intostrategic alliances and partnerships with large foreign companies. Thetwinning instrument therefore presents the best opportunity to supportregulatory reforms in the short run. Twinning could be used as an instru-ment for designing measures to upgrade Moroccan shipping companiesand support their efforts to overcome liberalization challenges. In portservices, the National Agency for Ports, the new port regulatory agencythat was split off from the National Port Operations Office, could bene-fit greatly from a twinning partnership with an EU member state to helpit secure genuine independence and carry out its responsibilities.Twinning would be the first step toward regulatory convergence, ascapacity needs to be strengthened for effective implementation ofsuperior regulations. The Romanian port Constantza provides an exam-ple of how openness, combined with institutional strengthening throughtwinning and the inflow of foreign capital, can strengthen maritimeservices (box 6.3).
Professional ServicesCreating an EU common market in the professions is a long, cumbersome,and still largely unfinished process. Traditionally, rights of establishment ofcompanies across Europe have been more strongly enforced than rights ofindividuals to move within the European Union to supply services. As aresult, for a long time, labor mobility within the European Union wasmuch weaker than capital mobility and goods trade (Messerlin 2001).
Anchoring Services Reform: The European Neighborhood Policy and Morocco 151
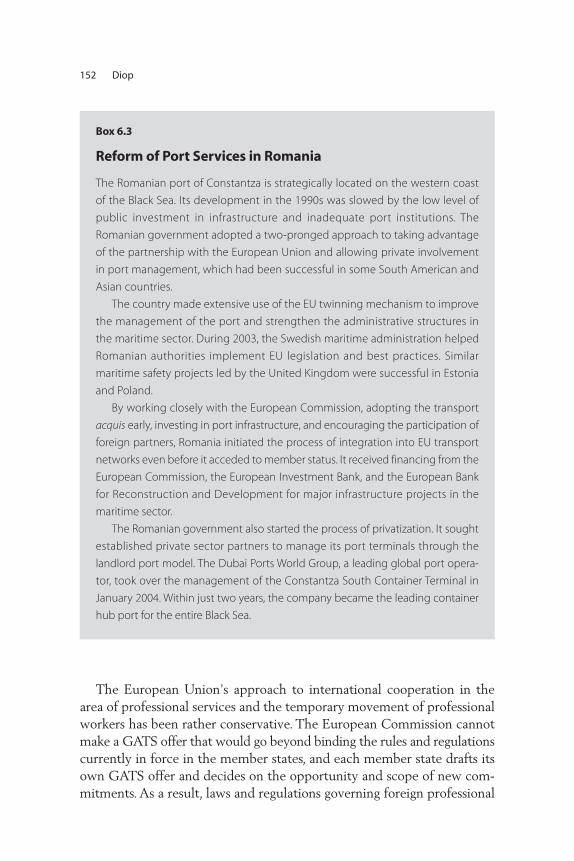
The European Union’s approach to international cooperation in thearea of professional services and the temporary movement of professionalworkers has been rather conservative. The European Commission cannotmake a GATS offer that would go beyond binding the rules and regulationscurrently in force in the member states, and each member state drafts itsown GATS offer and decides on the opportunity and scope of new com-mitments. As a result, laws and regulations governing foreign professional
152 Diop
Box 6.3
Reform of Port Services in Romania
The Romanian port of Constantza is strategically located on the western coast
of the Black Sea. Its development in the 1990s was slowed by the low level of
public investment in infrastructure and inadequate port institutions. The
Romanian government adopted a two-pronged approach to taking advantage
of the partnership with the European Union and allowing private involvement
in port management, which had been successful in some South American and
Asian countries.
The country made extensive use of the EU twinning mechanism to improve
the management of the port and strengthen the administrative structures in
the maritime sector. During 2003, the Swedish maritime administration helped
Romanian authorities implement EU legislation and best practices. Similar
maritime safety projects led by the United Kingdom were successful in Estonia
and Poland.
By working closely with the European Commission, adopting the transport
acquis early, investing in port infrastructure, and encouraging the participation of
foreign partners, Romania initiated the process of integration into EU transport
networks even before it acceded to member status. It received financing from the
European Commission, the European Investment Bank, and the European Bank
for Reconstruction and Development for major infrastructure projects in the
maritime sector.
The Romanian government also started the process of privatization. It sought
established private sector partners to manage its port terminals through the
landlord port model. The Dubai Ports World Group, a leading global port opera-
tor, took over the management of the Constantza South Container Terminal in
January 2004. Within just two years, the company became the leading container
hub port for the entire Black Sea.
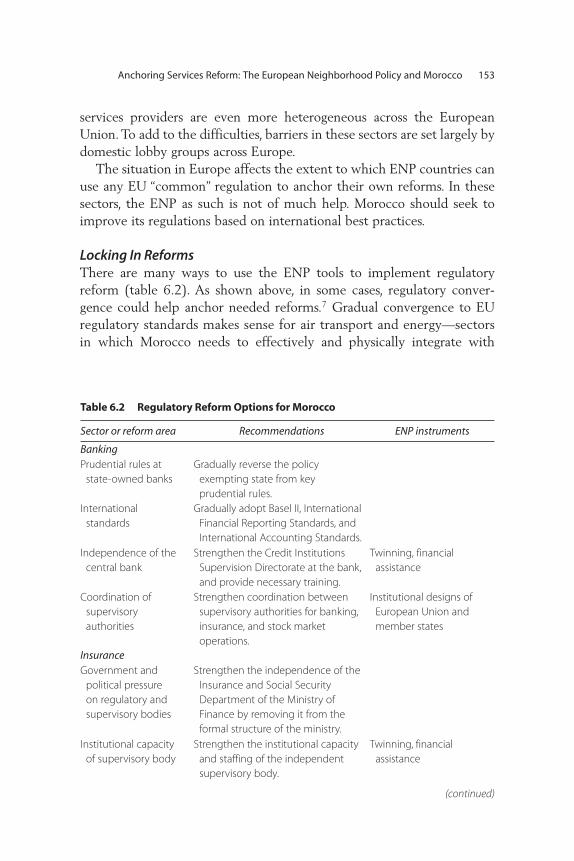
services providers are even more heterogeneous across the EuropeanUnion. To add to the difficulties, barriers in these sectors are set largely bydomestic lobby groups across Europe.
The situation in Europe affects the extent to which ENP countries canuse any EU “common” regulation to anchor their own reforms. In thesesectors, the ENP as such is not of much help. Morocco should seek toimprove its regulations based on international best practices.
Locking In Reforms There are many ways to use the ENP tools to implement regulatoryreform (table 6.2). As shown above, in some cases, regulatory conver-gence could help anchor needed reforms.7 Gradual convergence to EUregulatory standards makes sense for air transport and energy—sectorsin which Morocco needs to effectively and physically integrate with
Anchoring Services Reform: The European Neighborhood Policy and Morocco 153
Table 6.2 Regulatory Reform Options for Morocco
Sector or reform area Recommendations ENP instruments
BankingPrudential rules at
state-owned banksGradually reverse the policy
exempting state from key prudential rules.
International standards
Gradually adopt Basel II, InternationalFinancial Reporting Standards, andInternational Accounting Standards.
Independence of thecentral bank
Strengthen the Credit Institutions Supervision Directorate at the bank,and provide necessary training.
Twinning, financialassistance
Coordination of supervisory authorities
Strengthen coordination betweensupervisory authorities for banking,insurance, and stock market operations.
Institutional designs of European Union and member states
InsuranceGovernment and
political pressure on regulatory and supervisory bodies
Strengthen the independence of theInsurance and Social Security Department of the Ministry of Finance by removing it from the formal structure of the ministry.
Institutional capacity of supervisory body
Strengthen the institutional capacityand staffing of the independentsupervisory body.
Twinning, financial assistance
(continued)
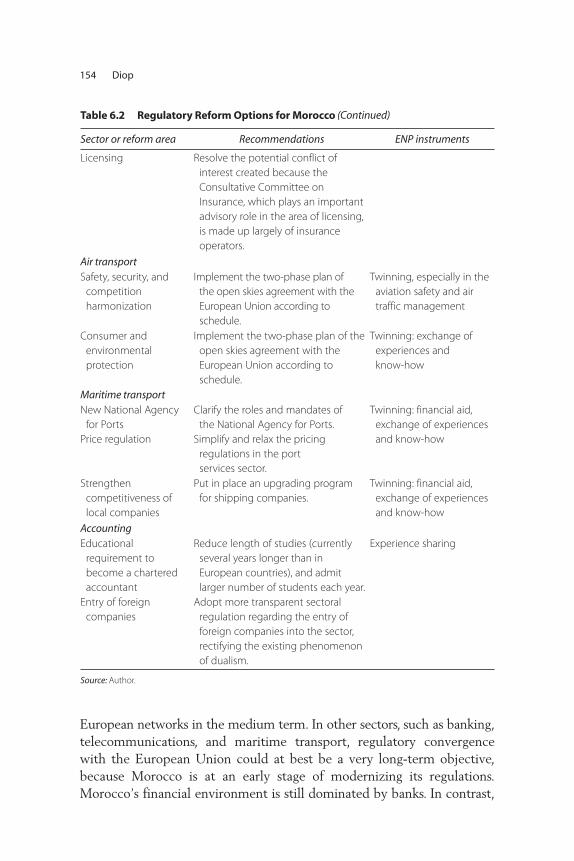
European networks in the medium term. In other sectors, such as banking,telecommunications, and maritime transport, regulatory convergencewith the European Union could at best be a very long-term objective,because Morocco is at an early stage of modernizing its regulations.Morocco’s financial environment is still dominated by banks. In contrast,
154 Diop
Table 6.2 Regulatory Reform Options for Morocco
Sector or reform area Recommendations ENP instruments
Licensing Resolve the potential conflict ofinterest created because theConsultative Committee onInsurance, which plays an importantadvisory role in the area of licensing,is made up largely of insuranceoperators.
Air transportSafety, security, and
competition harmonization
Implement the two-phase plan of the open skies agreement with theEuropean Union according to schedule.
Twinning, especially in theaviation safety and air traffic management
Consumer and environmental protection
Implement the two-phase plan of theopen skies agreement with theEuropean Union according to schedule.
Twinning: exchange of experiences and know-how
Maritime transportNew National Agency
for Ports Price regulation
Clarify the roles and mandates of the National Agency for Ports.
Simplify and relax the pricingregulations in the port services sector.
Twinning: financial aid, exchange of experiencesand know-how
Strengthen competitiveness of local companies
Put in place an upgrading program for shipping companies.
Twinning: financial aid, exchange of experiencesand know-how
AccountingEducational
requirement to become a chartered accountant
Reduce length of studies (currentlyseveral years longer than in European countries), and admit larger number of students each year.
Experience sharing
Entry of foreign companies
Adopt more transparent sectoralregulation regarding the entry offoreign companies into the sector,rectifying the existing phenomenonof dualism.
Source: Author.
(Continued)
EU regulations include complex rules for securities and equities markets.Morocco could adopt some international standards (such as Basel II), butfor banking, as well as maritime transport, greater economic integrationwith the European Union is possible without full regulatory convergencein the short run.
In the professions, regulatory convergence with the European Union asa regional entity is inappropriate, because EU member countries are stilltrying to agree on common policies and national regulations are still het-erogeneous. In these sectors, Morocco should be selective about whichEU country has regulatory features that are suitable for it and seek bilat-eral agreements with those countries. At the same time, Morocco shouldcontinue to monitor key developments in these sectors in the EuropeanUnion. The ongoing discussions on the mobility of patients within theEuropean Union, for example, could have important repercussions for thecompetitiveness of Morocco’s health services.
Even in sectors in which immediate convergence would not be themost appropriate strategy, Morocco could benefit from twinning partner-ships with EU member states to improve the quality of Moroccan insti-tutions, especially its supervisory and regulatory bodies. Twinning is aninitiative of the European Commission that was launched in 1998 in thecontext of the preparation for enlargement of the European Union. It wasconceived as an instrument for targeted administrative cooperation tohelp candidate countries strengthen their administrative and judicialcapacity to implement Community legislation as future member states ofthe European Union.8
Implementing Competition Policies
Policies governing competition also offer challenges to Morocco’s integra-tion with the European Union. International trade and economic integra-tion can provide both the rationale and the opportunities for firms toengage in anticompetitive behavior. In the absence of effective competi-tion policy, firms can collude to keep domestic and foreign competitorsout of their markets, counteracting the benefits of market opening.Multinational and other exporting firms can abuse their dominantposition in foreign markets by dividing those markets among them-selves. Mergers and acquisitions (including those between foreign anddomestic firms) can create firms that dominate specific markets.
A related issue is public aid or special treatment targeted to improvethe performance of domestic import-competing or exporting firms. Such
Anchoring Services Reform: The European Neighborhood Policy and Morocco 155

subsidies can distort competition and are therefore relevant issues to dis-cuss as Morocco seeks to integrate more deeply with the European Union.
Competition policies were included in the Morocco–European Unionassociation agreement signed in 1996; they have been in force since2000. Morocco’s ENP action plan specifically refers to implementing theprovisions of the agreement in these two areas. The action plan, however,is not specific.
Morocco’s 1996 Constitution proclaims the principle of freedom to dobusiness. It serves as the basis for the adoption of Law 06-99, on pricingfreedoms and competition, and its implementing decree.9 The competi-tion law establishes the principles of pricing freedom and pricing basedon free competition and spells out circumstances and areas in which thegovernment has the right to intervene, including monopoly situations,supply difficulties, legislative or regulatory provisions, disasters or abnor-mal market situations, and excessive price fluctuations.10 At the requestof professional organizations or at the initiative of the government, pricesmay be subject to approval. The law also sets out rules on transparency;prohibits restrictive practices among economic operators;11 prohibitsconcerted action, agreements, understandings, or collusive action and theabuse of a dominant position when the objective is to prevent, restrict, ordistort competition (with the exceptions of small and medium-size enter-prises, agricultural and handicrafts cooperatives, and export promotion);and requires submission of economic concentration projects liable toprejudice competition to the Competition.
These laws are useful, but Morocco’s Competition Council, responsiblefor implementing them, is not effective. The Competition Council playsan advisory role regarding concentration, anticompetitive practices,and pricing; it has no decision-making authority. It may be consultedby Parliament; the government; regional councils; urban communities;chambers of commerce, industry, and services and professional chambers;trade union and professional organizations; and consumers’ associations.12
It cannot, however, act on its own initiative or at the instigation of anenterprise. Recommended sanctions usually fall within the competence ofthe courts. The prime minister may, however, decide not to have recourseto the courts, instead, on the recommendation of the Competition Council,ordering that the anticompetitive practices be terminated within a specifiedperiod or imposing special conditions (WTO 2003).
As far as integration with the European Union is concerned, theMorocco–European Union association agreement leaves the precise com-petition rules to be determined by the Association Council.13 But unlike
156 Diop
many other Mediterranean agreements, it explicitly refers to the corelegislation of EU competition and state aid policy (Article 36.3 of theagreement).14 This means that practices that run counter to Article 36.1,which covers collusive behavior, abuse of dominance, and state aid, willbe assessed on the basis of Articles 81, 82, and 87 of the Treaty of theEuropean Community. This direct reference to European Communitylaw means that Morocco has committed to adopt EU legislation where itconcerns competition or state aid that could touch on trade with theEuropean Union. The time frame implementing the rules is five yearsafter the agreements enter into force (that is, 2011).
Morocco would greatly benefit from the ENP tools in the area ofcompetition policy, both regulatory convergence and twinning. The ENPaction plan is quite specific about cooperation with the European Unionin the area of competition. It calls for implementing Article 36(3) of theassociation agreement;15 exchanging experience and know-how; buildingadministrative capacity for the enforcement of the competition law;identifying other possible cooperation measures (market analysis tech-niques, conduct of competition investigations, merger control, dealingwith disputes, and so forth); developing legislation and an enforcementmechanism compatible with those in the European Union; and ensuringthe right of appeal to independent courts against antitrust decisions andthe specialized training of judges dealing with competition cases.
Improvement of the legislative texts and the strengthening of theadministrative capacity and decision-making power of the CompetitionCouncil would be good places to start, because many disputes over com-petition have been brought before the courts in recent years. Examplesinclude confusion and disputes regarding the right of entry of a new oper-ator in maritime transport, a dispute between partners in the retailing sec-tor, distribution monopoly issue in petroleum products, and abuse of adominant position case in aerated beverages.16
Notes
1. The ENP covers a wide range of policy issues. The initiative’s most novel andfar-reaching aspect is progressive participation in the EU internal market tocreate an economically integrated space with participating EU neighbors,including Morocco. These countries can adopt part of the acquis and, throughthis harmonization, share the benefits associated with the relevant elementsof the European Union’s internal market. To operationalize the ENP, Moroccoadopted an ENP action plan in October 2005.
Anchoring Services Reform: The European Neighborhood Policy and Morocco 157
2. The à la carte approach entails some risks. Indeed, piecemeal liberalizationmay disappoint, as many sectors are closely linked. Liberalizing one sectormay not bring the expected benefits if others remain protected.
3. The European Commission’s new European Neighborhood and PartnershipInstrument (ENPI) also covers the key issue of cross-border and transnationalcooperation between Morocco and the European Union. This chapter ana-lyzes only the nonfinancial instruments of the ENP.
4. The Convention on International Civil Aviation (also called the ChicagoConvention) was the first attempt to initiate a global civil transport regime—that is, a framework within which civil air transport could develop. TheChicago Convention introduced nine freedoms of the air (from the right tofly across the territory of a state to the right to transport cabotage trafficwithin a foreign state) for states that adopted the convention and entered intobilateral treaties that may grant certain rights or privileges for scheduled inter-national air services. Because only the first five “freedoms” have been officiallyrecognized by international treaties, the International Civil AviationOrganization considers the remaining “freedoms” “so-called.” The first free-dom is the right to fly across the territory of either state without landing. Thesecond freedom allows planes to land in either state for nontraffic purposes(for example, refueling without boarding or disembarking passengers). Thethird freedom is the right to land in the territory of the first state and disem-bark passengers coming from the home state of the airline company. Thefourth freedom is the right to land in the territory of the first state and boardpassengers travelling to the home state of the airline. The fifth freedom is theright to land in the territory of the first state and board passengers travellingon to a third state in which passengers disembark (for example, a scheduledflight from the United States to France could pick up passengers in the UnitedKingdom and take them to France (sometimes termed beyond rights). “Beyondfifth freedom” gives airlines the right to carry passengers from a second coun-try to a third country. “Intermediate fifth freedom” gives airlines the right tocarry passengers from the third country to the second country.
5. Economies affected included Algeria, Armenia, Azerbaijan, Belarus, theArab Republic of Egypt, Georgia, Israel, Jordan, Lebanon, Libya, Moldova,Morocco, the West Bank and Gaza, the Syrian Arab Republic, Tunisia, andUkraine. Two subcategories are distinguished within the fifth freedom: beyondand intermediate.
6. These include Regulation 4055/86 on freedom to provide services to mar-itime transport, Regulation 4056/86 on competition, Regulation 4057/86 onunfair pricing practices, and Regulation 4058/86 on coordinated action tosafeguard access to cargoes.
7. EU “laws” come in the form of regulations (legally binding for all memberstates upon entry into force) and directives (general principles to be trans-posed into national law). The full acquis communautaire is the body of EU law.
158 Diop
8. In the context of the ENP, twinning was introduced as a cooperationinstrument for the countries of the south and east Mediterranean and theMiddle East (called MEDA countries). MEDA countries like Moroccohave started to benefit from the program. The process is similar to the onefor the transition economies: twinning project funding is given to EUmember states to work with partner EU neighboring countries on institu-tion building (legislation, administration, and implementation) and infra-structure strengthening (systems and equipment). Projects usually last oneto two years and require a resident twinning adviser (project manager) tobe stationed in the country for the duration. Short-term experts from theEuropean Union provide technical inputs to the various components.Twinning has been very successful in Central and Eastern Europe; Moroccoshould take advantage of these opportunities. By early 2008, Morocco hadsigned three twinning projects with the European Union: one with theMinistry of Environment, one to strengthen the maritime regulatory body(the Direction de la Marine Marchande), and one to upgrade and harmonizecustoms procedures.
9. The law, which went into effect in 2001, replaces Law 008-71 on price reg-ulations and controls and requirements for stocking and selling productsand goods.
10. Exceptions to the freedom of price fixing exist for a list of activities. For serv-ices, price regulation was supposed to remain in force for a transitional periodof five years as of the date of entry into force of Law 06-99 (2001). In fact,they remained in force for two additional years for many products, and reg-ulation is still in place for electricity; passenger and freight road and railtransport; domestic air transport of passengers; urban passenger transport;pilot and towing services in ports; compulsory car insurance; commissioning ofinsurance intermediaries; acts by midwives and nurses in the private sector;physicians’ and veterinarians’ fees; dental surgery; medical analyses; and legal,judicial, and administrative announcements and notices.
11. Practices deemed restrictive include the following: practices that affect theconsumer’s freedom of choice; restrict trade relations among professionals (theobligation to provide an invoice and to communicate price lists and terms ofsale, a ban on compulsory minimum resale prices, discriminatory practices,refusal to meet buyers’ requests and tied sales); and relate to storage ofgoods (the law combats smuggling and speculation by prohibiting “clandes-tine storage”).
12. The Competition Council must be consulted on regulatory texts that mayrestrict competition, before the fixing of prices and terms of sale, and on thegranting of state or local authority aid.
13. The association agreement created formal structures, such as the AssociationCouncil (ministerial level), which is supposed to meet once a year; theAssociation Committee (senior official level); and subcommittees at expert
Anchoring Services Reform: The European Neighborhood Policy and Morocco 159
levels for the effective and continued implementation of the agreement anddiscussion of professional matters as they arise.
14. Association agreements between the European Union and Algeria andLebanon do not include such a provision; the European Union’s agreementswith Jordan, Tunisia, and the Palestinian Authority contains similar provisions.
15. This article sets out a long list of rules to promote cooperation and coordi-nation between the parties in the application of their competition laws toensure that restrictions on competition do not block or cancel out the bene-fits that should be ensured following the progressive liberalization of tradebetween the European Community and Morocco.
16. Related to competition policy, cooperation in the field of consumer protec-tion is also called for in the Action Plan, which aims to exchange experienceand know-how on enforcing Moroccan consumer protection law and, in theframework of the relevant subcommittee, to discuss measures accompanyingthe establishment and strengthening of administrative capacity for the imple-mentation of consumer protection rules.
References
Paul Budde Communications. 2006. “Estonia–Telecoms Market.” Paul BuddeCommunications, Bucketty, Australia.
Dee, P., and N. Diop. Forthcoming. Comparing the Impact of Liberalization ofBackbone Services in Morocco and Tunisia. Washington, DC: World Bank.
European Commission. 2005. Twinning: A Tested Experience in a Broader EuropeanContext. Brussels, Belgium: European Commission.
———. “Telecoms in the European Union.” http://ec.europa.eu/information_society/policy/ecomm/index_en.htm.
FEMISE [Forum Euroméditerranéen des Instituts de Sciences Économiques]. 2007.“The Role of Business Services on Innovation, Productivity, Employment andExports of Spanish, Turkish and Moroccan Manufacturing Firms.” Researchreport. FEMISE, Marseille, France.
IMF (International Monetary Fund). 2005. Balance of Payments Statistics.Washington, DC: IMF.
Messerlin, P. A. 2001. Measuring the Costs of Protection in Europe. Washington, DC:Institute for International Economics.
Muller-Jentsch, D. 2007a. “The European Common Aviation Area and the WesternBalkans: Domestic Reforms and Regional Integration in Air Transport.”European Commission and World Bank, Office for South East Europe, Brussels,Belgium.
160 Diop

———. 2007b. “Financial Sector Restructuring and Regional Integration in theWestern Balkans.” European Commission and World Bank, Office for SouthEast Europe, Brussels, Belgium.
Rannu, R. 2003. “Mobile Services in Estonia.” Working Paper 8, PRAXIS Centerfor Policy Studies, Tallinn, Estonia.
Roy, M., J. Marchetti, and H. Lim. 2006. “Services Liberalization in the NewGeneration of Preferential Trade Agreements (PTAs): How Much Further thanthe GATS?” Staff Working Paper ERSD-2006-07, World Trade Organization,Geneva.
Van Hooydonk, Eric. 2005. “The European Port Services Directive: The Good orthe Last Try? Journal of International Maritime Law 11(3): 188–220.
World Bank. 2007a. Morocco’s Backbone Services Sectors: Reforms for HigherProductivity and Deeper Integration with Europe. Report 39755. Washington, DC:World Bank.
———. 2007b. Port Reform Toolkit: Effective Support for Policymakers andPractitioners, 2nd ed. Washington, DC: World Bank.
WTO (World Trade Organization). 2003. Trade Policy Review, Kingdom ofMorocco, Rapport du Secrétariat. WT/TPR/S/116. Geneva: WTO.
Anchoring Services Reform: The European Neighborhood Policy and Morocco 161

163
Trade in services can make a substantial contribution to economic devel-opment, by improving the availability, efficiency, and quality of servicesin the domestic market and increasing the supply and efficiency of inputsto production. Services are often the most rapidly growing sector indeveloping economies. They are a major source of employment and canhelp improve export diversification (for example, through tourism andintegration with the global economy). The purpose of this chapter is toraise awareness of critical issues in Algeria and help the governmentdefine priorities for policy reform.
Quantifying the Importance of Services for Algeria
Statistics on trade in services are weak in Algeria, as in many coun-tries, developed and developing. The collection of data is complicatedby the nature of the exchange and the different modes of deliverycommonly used, as described in the General Agreement on Trade inServices (GATS): cross-border (mode 1), consumption abroad (mode 2),
C H A P T E R 7
Services Trade as an Engine ofDevelopment: Situation andProspects in Algeria
Olivier Cattaneo, Said Ighilahriz, José R. López-Cálix, and Peter Walkenhorst
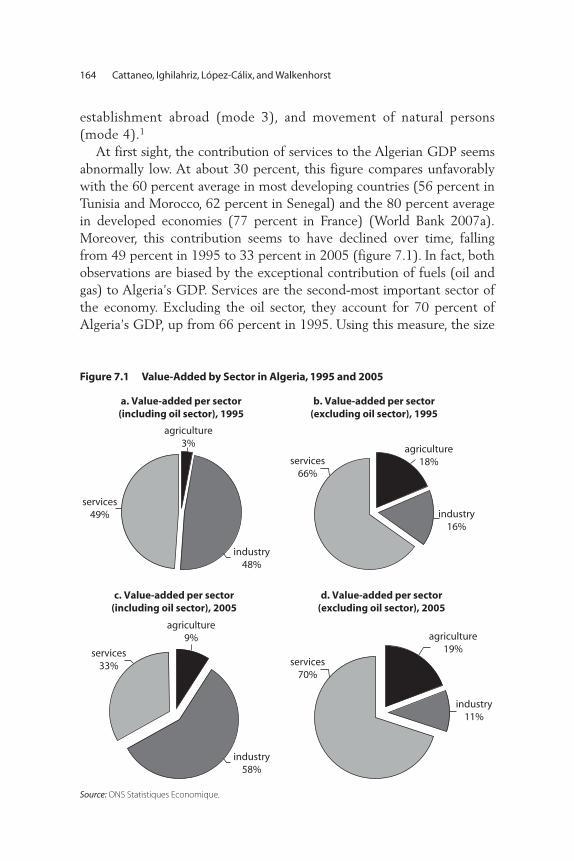
establishment abroad (mode 3), and movement of natural persons(mode 4).1
At first sight, the contribution of services to the Algerian GDP seemsabnormally low. At about 30 percent, this figure compares unfavorablywith the 60 percent average in most developing countries (56 percent inTunisia and Morocco, 62 percent in Senegal) and the 80 percent averagein developed economies (77 percent in France) (World Bank 2007a).Moreover, this contribution seems to have declined over time, fallingfrom 49 percent in 1995 to 33 percent in 2005 (figure 7.1). In fact, bothobservations are biased by the exceptional contribution of fuels (oil andgas) to Algeria’s GDP. Services are the second-most important sector ofthe economy. Excluding the oil sector, they account for 70 percent ofAlgeria’s GDP, up from 66 percent in 1995. Using this measure, the size
164 Cattaneo, Ighilahriz, López-Cálix, and Walkenhorst
a. Value-added per sector(including oil sector), 1995
agriculture3%
services49%
b. Value-added per sector(excluding oil sector), 1995
agriculture18%
industry16%
c. Value-added per sector(including oil sector), 2005
agriculture9%
industry58%
services33%
d. Value-added per sector(excluding oil sector), 2005
agriculture19%
industry11%
services70%
industry48%
services66%
Figure 7.1 Value-Added by Sector in Algeria, 1995 and 2005
Source: ONS Statistiques Economique.
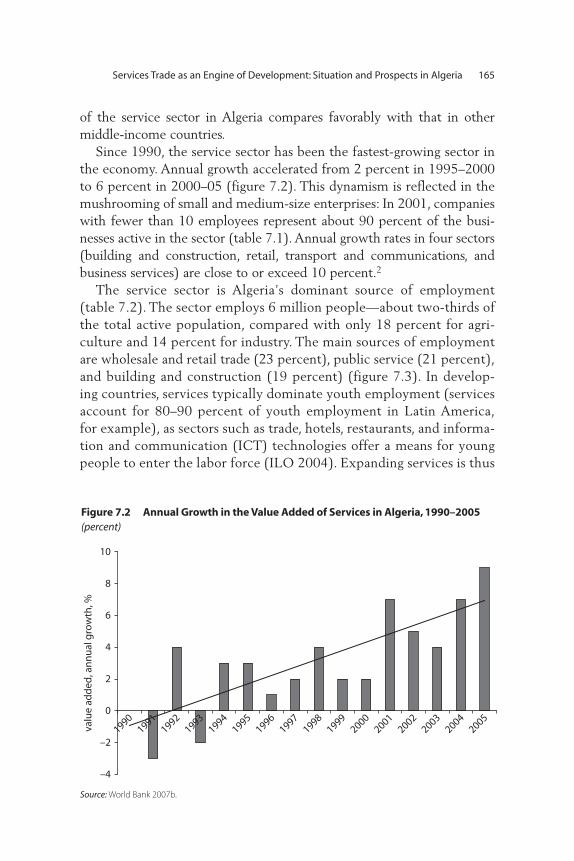
of the service sector in Algeria compares favorably with that in other middle-income countries.
Since 1990, the service sector has been the fastest-growing sector inthe economy. Annual growth accelerated from 2 percent in 1995–2000to 6 percent in 2000–05 (figure 7.2). This dynamism is reflected in themushrooming of small and medium-size enterprises: In 2001, companieswith fewer than 10 employees represent about 90 percent of the busi-nesses active in the sector (table 7.1). Annual growth rates in four sectors(building and construction, retail, transport and communications, andbusiness services) are close to or exceed 10 percent.2
The service sector is Algeria’s dominant source of employment(table 7.2). The sector employs 6 million people—about two-thirds ofthe total active population, compared with only 18 percent for agri-culture and 14 percent for industry. The main sources of employmentare wholesale and retail trade (23 percent), public service (21 percent),and building and construction (19 percent) (figure 7.3). In develop-ing countries, services typically dominate youth employment (servicesaccount for 80–90 percent of youth employment in Latin America,for example), as sectors such as trade, hotels, restaurants, and informa-tion and communication (ICT) technologies offer a means for youngpeople to enter the labor force (ILO 2004). Expanding services is thus
Services Trade as an Engine of Development: Situation and Prospects in Algeria 165va
lue
add
ed, a
nn
ual
gro
wth
, %
–4
–2
0
2
4
6
8
10
19901991
19921993
19941995
19961997
19981999
20002001
20022003
20042005
Figure 7.2 Annual Growth in the Value Added of Services in Algeria, 1990–2005(percent)
Source: World Bank 2007b.

one means of addressing Algeria’s high youth unemployment rate(about 30 percent for people under 25, twice the total unemploymentrate). Services also employ a disproportionate share of women inNorth Africa, accounting for 55 percent of all female employment(women hold 26 percent of all service sector jobs) (ILO 2007) (figures 7.4 and 7.5).
166 Cattaneo, Ighilahriz, López-Cálix, and Walkenhorst
Table 7.1 Growth Rates and Percentage of Small and Medium-Size Enterprises in Algeria’s Service Sector, by Subsector, 2006
Subsector
Number of small and
medium-sizeenterprises
Percentage of total
Annual growth rate
(percent)
Building and construction 86,590 33.4 12.3Retail and distribution 44,639 17.2 11.0Transport and communications 23,245 9.0 9.2Services provided to households 18,863 7.3 6.9Hotels and restaurants 15,630 6.0 6.4Business services 13,167 5.1 13.9Services provided to the oil sector 171 0.0 —Financial services 830 0.0 —Real estate services 704 0.0 —Services provided to collectivities 1,584 0.0 —Subtotal for services 205,423 78.0 —Other sectors (agriculture and industry) 53,859 22.0 —Total 259,282 100.0 —
Source: Ministère de la Petite et Moyenne Entreprise et de l’Artisanat 2006.Note: Data are based on first half of year. — = Not available.
Table 7.2 Urban and Rural Employment in Algeria, by Sector, 2008
Sector Urban Rural Total
Percentage of total
employment
Agriculture 303,639 1,305,994 1,609,633 18.1Industry 839,568 424,023 1,263,591 14.2Services 4,147,388 1,848,193 5,995,560 67.6
Construction and public works 744,737 512,967 1,257,703 14.2
Commerce, other services, and administration 3,402,651 1,335,226 4,737,877 53.4
Total 5,290,595 3,578,209 8,868,804 100.0
Source: ONS Statistiques Economique.

In 2005, an estimated 1.3 million service sector employees in Algeriawere working in the informal sector—about one worker in four (one inthree if public administration is excluded). Informality is particularlyacute in the service sector: in 1996, the Ministry of Labor estimated thatthe retail sector was most affected (35.0 percent informal employment),followed by other services (31.7 percent) and construction (25.6 percent)(by way of comparison, “only” 7.6 percent of the workforce in the indus-trial sector is employed by the informal sector) (CNES 2006).3 This trendseems to be growing: informal employment grew at an average rate of8.2 between 1999 and 2003—almost twice the 4.6 percent annualgrowth rate of total employment.
The high rate of informality in the service sector means that the bulkof the workforce is not properly insured and the government does notharvest all the fruits of growth in the form of income taxes. The problemalso affects the attractiveness of Algeria for foreign investors. A surveysponsored by the World Bank and the United Nations Development
Services Trade as an Engine of Development: Situation and Prospects in Algeria 167
repartition of employment in the services sector
0
1
1
1
2
3
4
5
8
12
19
21
23
extraterritorial organizations and bodies
private households with employed persons
financial intermediation
real estate, renting, and business activities
electricity, gas, and water
hotels and restaurants
other community, social, andpersonal service activities
health and social work
transport, storage, and communication
education
construction
public administration and defense;compulsory social security
wholesale and retail trade
Figure 7.3 Service Sector Employment in Algeria, by Industry, 2004(percent of total services employment)
Source: ILO 2004.
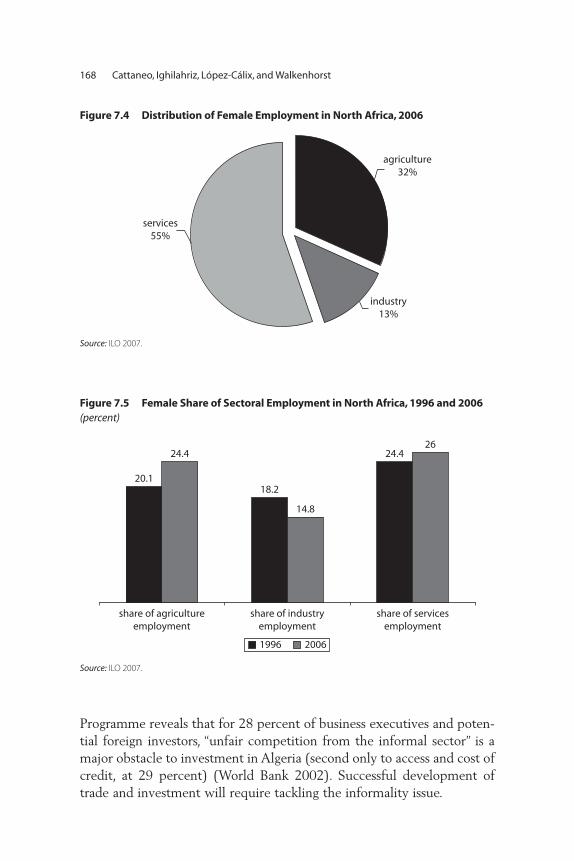
Programme reveals that for 28 percent of business executives and poten-tial foreign investors, “unfair competition from the informal sector” is amajor obstacle to investment in Algeria (second only to access and cost ofcredit, at 29 percent) (World Bank 2002). Successful development oftrade and investment will require tackling the informality issue.
168 Cattaneo, Ighilahriz, López-Cálix, and Walkenhorst
agriculture32%
industry13%
services55%
Figure 7.4 Distribution of Female Employment in North Africa, 2006
Source: ILO 2007.
20.1
24.4
18.2
14.8
24.426
share of agricultureemployment
share of industryemployment
share of servicesemployment
20061996
Figure 7.5 Female Share of Sectoral Employment in North Africa, 1996 and 2006(percent)
Source: ILO 2007.

Trade in Services: An Important but Often Poorly Understood Concept
Algeria’s service sector is mostly inward looking—that is, dedicated to sat-isfying the basic needs of the domestic population (figure 7.6). Retail rep-resented 31 percent, transport and telecommunications 28 percent, andbuilding and construction 24 percent of sector output in 2005.4 Althoughthese sectors can have important export potential (as shown by the suc-cess abroad of South African retail stores, Egyptian telecom companies,and Turkish construction companies), Algerian companies have so farconcentrated on their home market, struggling to meet rapidly growingdomestic demand.
Together with the $19 billion deficit in non-oil goods, Algeria’s tradedeficit in the service sector, which exceeded $2 billion in 2005, wasfinanced by $45.6 billion in oil exports (figure 7.7). The deficit in serv-ices reflects rapid growth in economic activity, as the most importantimported services (transport, engineering services, and building andconstruction) are direct inputs to the productive sector. To the extentthat it is sustainable, this deficit is therefore a sign of the good health ofthe economy.
For most sectors, trade in services remains small. However, the datashould be interpreted with care. Transport accounts for the largest share of
Services Trade as an Engine of Development: Situation and Prospects in Algeria 169
water andenergy
4%services in the
oil sector3%
building andconstruction
24%
transports and telecoms
28%
retail31%
hotels, restaurants,and cafes
3%
businessservices
3%
householdservices
4%
Figure 7.6 Composition of Algerian Service Sector Output, by Industry, 2005
Source: ONS Statistiques Economique.
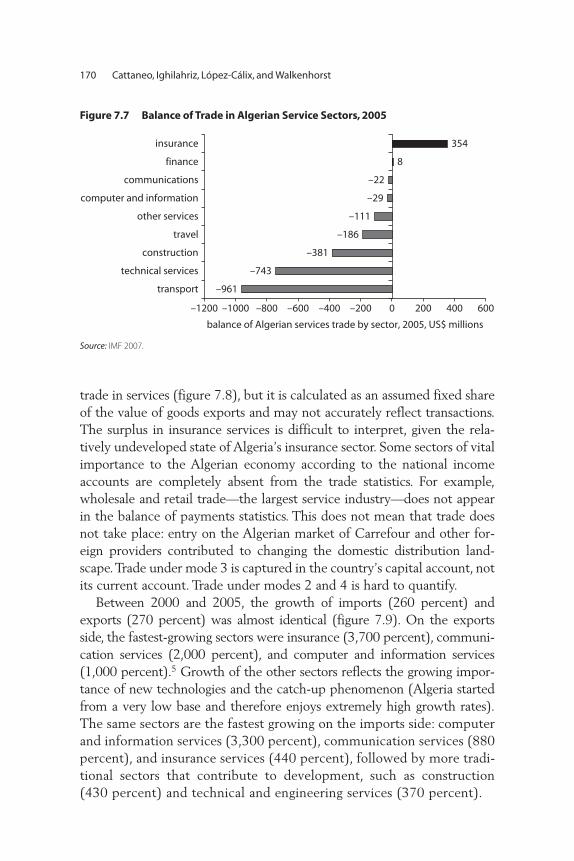
170 Cattaneo, Ighilahriz, López-Cálix, and Walkenhorst
trade in services (figure 7.8), but it is calculated as an assumed fixed shareof the value of goods exports and may not accurately reflect transactions.The surplus in insurance services is difficult to interpret, given the rela-tively undeveloped state of Algeria’s insurance sector. Some sectors of vitalimportance to the Algerian economy according to the national incomeaccounts are completely absent from the trade statistics. For example,wholesale and retail trade—the largest service industry—does not appearin the balance of payments statistics. This does not mean that trade doesnot take place: entry on the Algerian market of Carrefour and other for-eign providers contributed to changing the domestic distribution land-scape. Trade under mode 3 is captured in the country’s capital account, notits current account. Trade under modes 2 and 4 is hard to quantify.
Between 2000 and 2005, the growth of imports (260 percent) andexports (270 percent) was almost identical (figure 7.9). On the exportsside, the fastest-growing sectors were insurance (3,700 percent), communi-cation services (2,000 percent), and computer and information services(1,000 percent).5 Growth of the other sectors reflects the growing impor-tance of new technologies and the catch-up phenomenon (Algeria startedfrom a very low base and therefore enjoys extremely high growth rates).The same sectors are the fastest growing on the imports side: computerand information services (3,300 percent), communication services (880percent), and insurance services (440 percent), followed by more tradi-tional sectors that contribute to development, such as construction(430 percent) and technical and engineering services (370 percent).
balance of Algerian services trade by sector, 2005, US$ millions
–961
–743
–381
–186
–111
–29
–22
8
354
–1200 –1000 –800 –600 –400 –200 0 200 400 600
transport
technical services
construction
travel
other services
computer and information
communications
finance
insurance
Figure 7.7 Balance of Trade in Algerian Service Sectors, 2005
Source: IMF 2007.
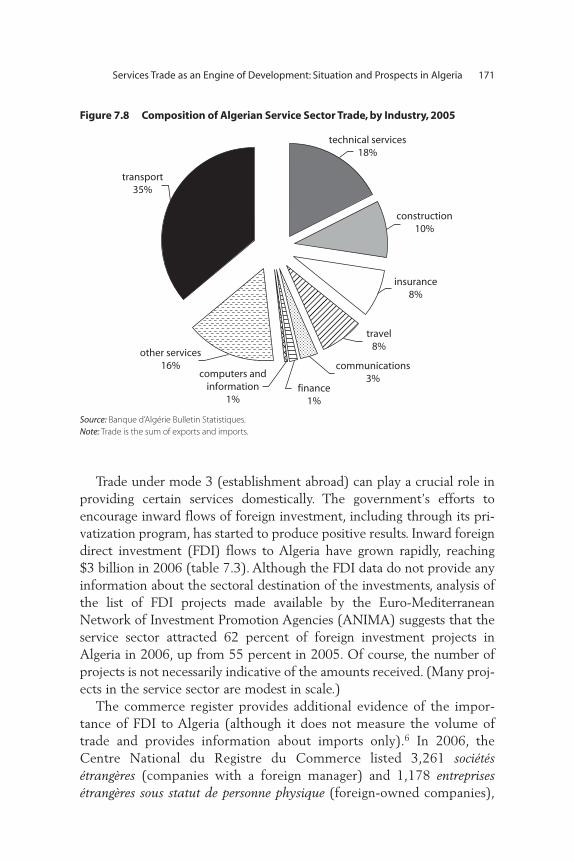
Trade under mode 3 (establishment abroad) can play a crucial role inproviding certain services domestically. The government’s efforts toencourage inward flows of foreign investment, including through its pri-vatization program, has started to produce positive results. Inward foreigndirect investment (FDI) flows to Algeria have grown rapidly, reaching$3 billion in 2006 (table 7.3). Although the FDI data do not provide anyinformation about the sectoral destination of the investments, analysis ofthe list of FDI projects made available by the Euro-MediterraneanNetwork of Investment Promotion Agencies (ANIMA) suggests that theservice sector attracted 62 percent of foreign investment projects inAlgeria in 2006, up from 55 percent in 2005. Of course, the number ofprojects is not necessarily indicative of the amounts received. (Many proj-ects in the service sector are modest in scale.)
The commerce register provides additional evidence of the impor-tance of FDI to Algeria (although it does not measure the volume oftrade and provides information about imports only).6 In 2006, theCentre National du Registre du Commerce listed 3,261 sociétésétrangères (companies with a foreign manager) and 1,178 entreprisesétrangères sous statut de personne physique (foreign-owned companies),
Services Trade as an Engine of Development: Situation and Prospects in Algeria 171
transport35%
technical services18%
construction10%
insurance8%
travel8%
communications3%
finance1%
computers andinformation
1%
other services16%
Figure 7.8 Composition of Algerian Service Sector Trade, by Industry, 2005
Source: Banque d’Algérie Bulletin Statistiques.Note: Trade is the sum of exports and imports.
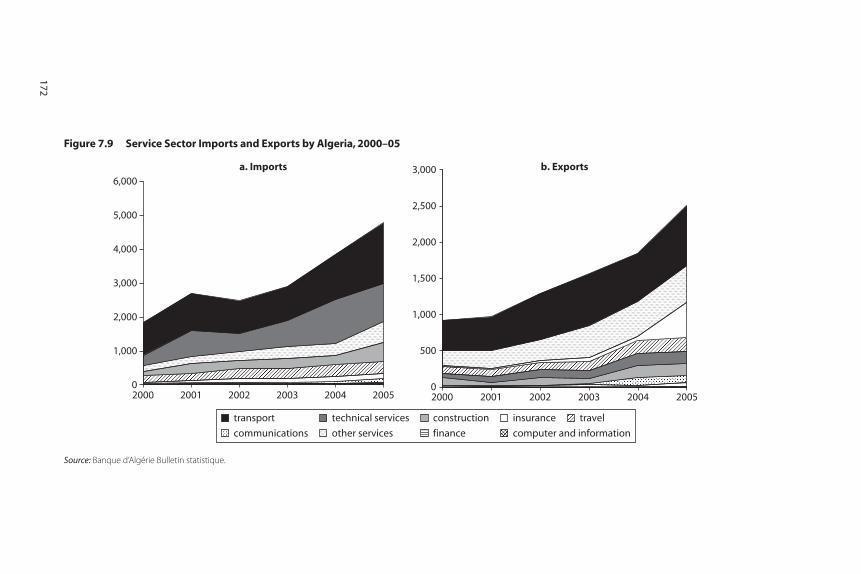
0
1,000
2,000
3,000
4,000
5,000
6,000
a. Imports b. Exports
2000 2001 2002 2003 2004 20050
500
1,000
1,500
2,000
2,500
3,000
2000 2001 2002 2003 2004 2005
transport technical services construction insurance travel
communications other services finance computer and information
Figure 7.9 Service Sector Imports and Exports by Algeria, 2000–05
Source: Banque d’Algérie Bulletin statistique.
172
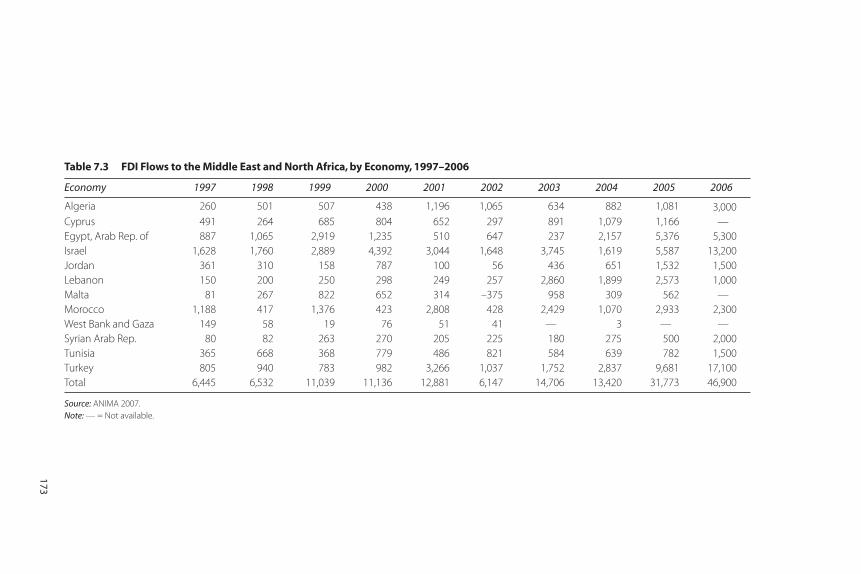
Table 7.3 FDI Flows to the Middle East and North Africa, by Economy, 1997–2006
Economy 1997 1998 1999 2000 2001 2002 2003 2004 2005 2006
Algeria 260 501 507 438 1,196 1,065 634 882 1,081 3,000Cyprus 491 264 685 804 652 297 891 1,079 1,166 —Egypt, Arab Rep. of 887 1,065 2,919 1,235 510 647 237 2,157 5,376 5,300Israel 1,628 1,760 2,889 4,392 3,044 1,648 3,745 1,619 5,587 13,200Jordan 361 310 158 787 100 56 436 651 1,532 1,500Lebanon 150 200 250 298 249 257 2,860 1,899 2,573 1,000Malta 81 267 822 652 314 –375 958 309 562 —Morocco 1,188 417 1,376 423 2,808 428 2,429 1,070 2,933 2,300West Bank and Gaza 149 58 19 76 51 41 — 3 — —Syrian Arab Rep. 80 82 263 270 205 225 180 275 500 2,000Tunisia 365 668 368 779 486 821 584 639 782 1,500Turkey 805 940 783 982 3,266 1,037 1,752 2,837 9,681 17,100Total 6,445 6,532 11,039 11,136 12,881 6,147 14,706 13,420 31,773 46,900
Source: ANIMA 2007.Note: — = Not available.
173
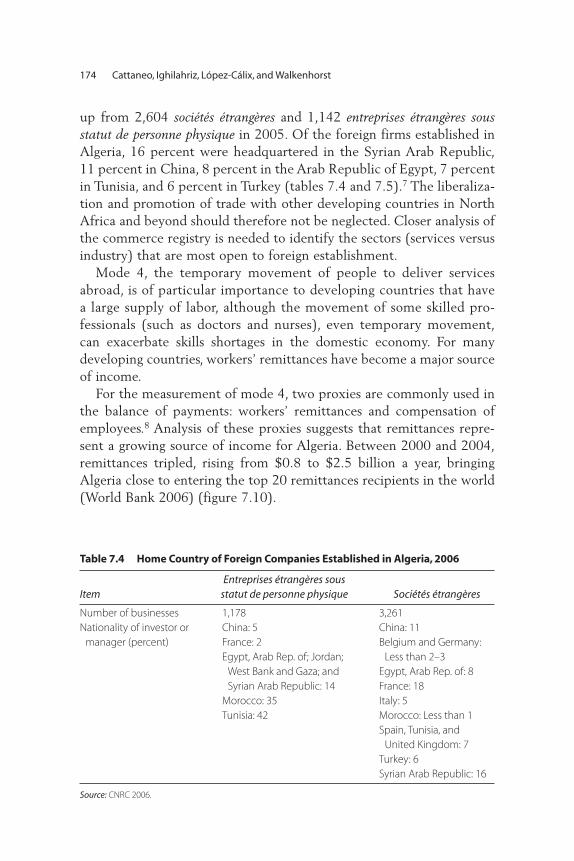
up from 2,604 sociétés étrangères and 1,142 entreprises étrangères sousstatut de personne physique in 2005. Of the foreign firms established inAlgeria, 16 percent were headquartered in the Syrian Arab Republic,11 percent in China, 8 percent in the Arab Republic of Egypt, 7 percentin Tunisia, and 6 percent in Turkey (tables 7.4 and 7.5).7 The liberaliza-tion and promotion of trade with other developing countries in NorthAfrica and beyond should therefore not be neglected. Closer analysis ofthe commerce registry is needed to identify the sectors (services versusindustry) that are most open to foreign establishment.
Mode 4, the temporary movement of people to deliver servicesabroad, is of particular importance to developing countries that havea large supply of labor, although the movement of some skilled pro-fessionals (such as doctors and nurses), even temporary movement,can exacerbate skills shortages in the domestic economy. For manydeveloping countries, workers’ remittances have become a major sourceof income.
For the measurement of mode 4, two proxies are commonly used inthe balance of payments: workers’ remittances and compensation ofemployees.8 Analysis of these proxies suggests that remittances repre-sent a growing source of income for Algeria. Between 2000 and 2004,remittances tripled, rising from $0.8 to $2.5 billion a year, bringingAlgeria close to entering the top 20 remittances recipients in the world(World Bank 2006) (figure 7.10).
174 Cattaneo, Ighilahriz, López-Cálix, and Walkenhorst
Table 7.4 Home Country of Foreign Companies Established in Algeria, 2006
ItemEntreprises étrangères sous
statut de personne physique Sociétés étrangères
Number of businesses 1,178 3,261Nationality of investor or
manager (percent)China: 5 France: 2 Egypt, Arab Rep. of; Jordan;
West Bank and Gaza; and Syrian Arab Republic: 14
Morocco: 35 Tunisia: 42
China: 11 Belgium and Germany:
Less than 2–3 Egypt, Arab Rep. of: 8 France: 18 Italy: 5 Morocco: Less than 1 Spain, Tunisia, and
United Kingdom: 7 Turkey: 6 Syrian Arab Republic: 16
Source: CNRC 2006.
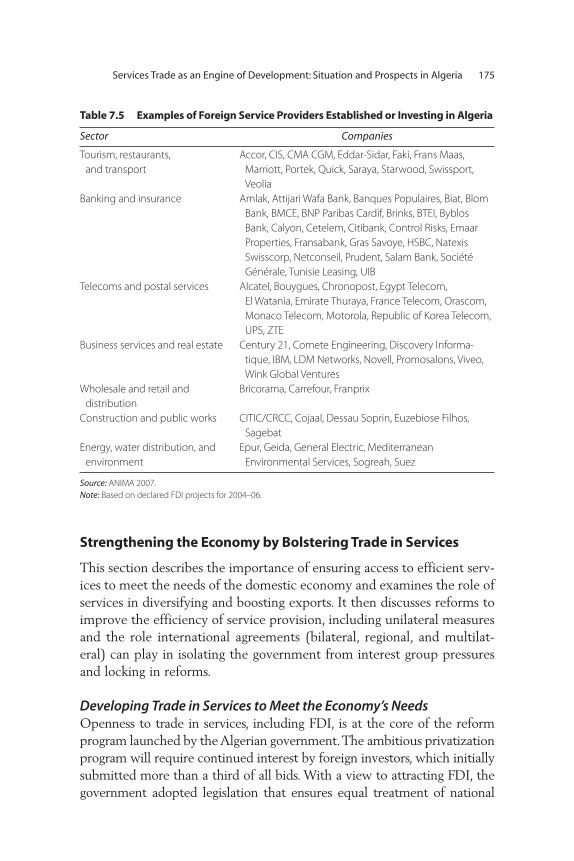
Strengthening the Economy by Bolstering Trade in Services
This section describes the importance of ensuring access to efficient serv-ices to meet the needs of the domestic economy and examines the role ofservices in diversifying and boosting exports. It then discusses reforms toimprove the efficiency of service provision, including unilateral measuresand the role international agreements (bilateral, regional, and multilat-eral) can play in isolating the government from interest group pressuresand locking in reforms.
Developing Trade in Services to Meet the Economy’s Needs Openness to trade in services, including FDI, is at the core of the reformprogram launched by the Algerian government. The ambitious privatizationprogram will require continued interest by foreign investors, which initiallysubmitted more than a third of all bids. With a view to attracting FDI, thegovernment adopted legislation that ensures equal treatment of national
Services Trade as an Engine of Development: Situation and Prospects in Algeria 175
Table 7.5 Examples of Foreign Service Providers Established or Investing in Algeria
Sector Companies
Tourism, restaurants, and transport
Accor, CIS, CMA CGM, Eddar-Sidar, Faki, Frans Maas, Marriott, Portek, Quick, Saraya, Starwood, Swissport, Veolia
Banking and insurance Amlak, Attijari Wafa Bank, Banques Populaires, Biat, BlomBank, BMCE, BNP Paribas Cardif, Brinks, BTEI, ByblosBank, Calyon, Cetelem, Citibank, Control Risks, EmaarProperties, Fransabank, Gras Savoye, HSBC, NatexisSwisscorp, Netconseil, Prudent, Salam Bank, SociétéGénérale, Tunisie Leasing, UIB
Telecoms and postal services Alcatel, Bouygues, Chronopost, Egypt Telecom, El Watania, Emirate Thuraya, France Telecom, Orascom,Monaco Telecom, Motorola, Republic of Korea Telecom,UPS, ZTE
Business services and real estate Century 21, Comete Engineering, Discovery Informa-tique, IBM, LDM Networks, Novell, Promosalons, Viveo,Wink Global Ventures
Wholesale and retail and distribution
Bricorama, Carrefour, Franprix
Construction and public works CITIC/CRCC, Cojaal, Dessau Soprin, Euzebiose Filhos,Sagebat
Energy, water distribution, and environment
Epur, Geida, General Electric, Mediterranean Environmental Services, Sogreah, Suez
Source: ANIMA 2007.Note: Based on declared FDI projects for 2004–06.
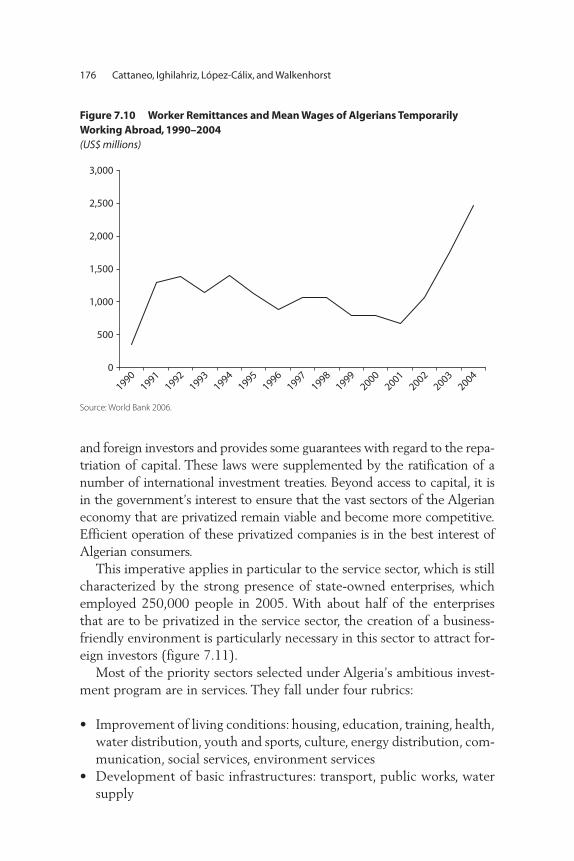
and foreign investors and provides some guarantees with regard to the repa-triation of capital. These laws were supplemented by the ratification of anumber of international investment treaties. Beyond access to capital, it isin the government’s interest to ensure that the vast sectors of the Algerianeconomy that are privatized remain viable and become more competitive.Efficient operation of these privatized companies is in the best interest ofAlgerian consumers.
This imperative applies in particular to the service sector, which is stillcharacterized by the strong presence of state-owned enterprises, whichemployed 250,000 people in 2005. With about half of the enterprisesthat are to be privatized in the service sector, the creation of a business-friendly environment is particularly necessary in this sector to attract for-eign investors (figure 7.11).
Most of the priority sectors selected under Algeria’s ambitious invest-ment program are in services. They fall under four rubrics:
• Improvement of living conditions: housing, education, training, health,water distribution, youth and sports, culture, energy distribution, com-munication, social services, environment services
• Development of basic infrastructures: transport, public works, watersupply
176 Cattaneo, Ighilahriz, López-Cálix, and Walkenhorst
0
500
1,000
1,500
2,000
2,500
3,000
19901991
19921993
19941995
19961997
19981999
20002001
20022003
2004
Figure 7.10 Worker Remittances and Mean Wages of Algerians Temporarily Working Abroad, 1990–2004(US$ millions)
Source: World Bank 2006.

• Support to economic development: tourism, small and medium-sizeenterprises
• Development and modernization of public services: postal services,new information and communication technologies, justice, trade.
Trade has an important role to play in improving the productivity ofpublic spending in all of these sectors. In construction, public operators(37 enterprises) are under budgetary constraint, and the private sector isgrowing rapidly to satisfy the high demand. Foreign services providershave played a key role in the sustainability of the investment program:highly competitive Chinese companies have won many constructiondeals, and a number of companies from the Middle East and Turkey havebeen selected to promote or implement the projects.
Trade could contribute to improving the quality and efficiency of serv-ices that are critical to productivity. Algeria’s service sector is dominatedby microenterprises (often family owned) that show little specialization.
Services Trade as an Engine of Development: Situation and Prospects in Algeria 177
construction andpublic work services
17%
diverseservices
5%
regionalEPL-SGP
31%agro-business
16%
siderurgy andmetalurgy
5%
constructionmaterials
7%
electric andelectronicindustries
2%
manufacturingindustries
10%
mechanicalindustries
4%
mines and carriers1% pharmaceutical and
chemical industries2%
Figure 7.11 Algerian Firms Slated for Privatization, by Sector
Source: Ministère de la Participation et de la Promotion des Investissements 2006. Note: The black segments represent the service sectors (regional Entreprises Publiques Locales Societés de Gestion des Participations).
Opening to international competition could prompt concentration andrestructuring, allowing the resulting units to reach the size necessary tobenefit from economies of scale. This process should be accompanied byappropriate regulatory reforms, such as ensuring competition on thedomestic market, improving the business environment, and facilitatingaccess to credit.
The availability of competitive, high-quality services from foreignsources can also help strengthen the business environment. Restrictions ontrade such as nationality requirements can impede access to appropriatelegal services and discourage the return of expatriate lawyers (box 7.1).Under the European Union’s Statutory Audit Directive and the UnitedStates’ Sarbanes-Oxley Act, multinational firms are bound to use interna-tional standards for accounting. Absent the availability of domesticaccountants fully qualified to audit accounts in accordance with thesestandards, domestic subsidiaries of multinationals have to outsource theseservices. The operation of multinationals thus depends on a regulatoryregime that facilitates access to foreign accounting services (which couldmean allowing foreign accounting firms to establish offices in Algeria).
Increased trade could help satisfy the growing demand for a larger andmore diversified supply of services. Absent trade, new resources (humanand capital) would have to be dedicated to services through training(which often takes time) and by shifting resources from other activities.Thus, relying wholly on domestic sources of services can create bottle-necks and generate inflationary pressures.
Rising prices in housing (construction), transportation, and communi-cation suggest the need for more government attention to improving theregulatory framework, as dominant suppliers would otherwise take advan-tage of their market power (table 7.7). Rapid economic growth oftenresults in the import of services (where permitted), which then deceleratesover time as domestic suppliers come on stream (assuming the businessenvironment is conducive). In a third phase, domestic suppliers exporttheir services, first to other developing countries at an earlier stage ofdevelopment and then to the rest of the world.
With high growth over the past decade, Algerian consumers havereduced the share of their expenditures on foodstuffs while increasingthe shares on housing and medical care (table 7.6). However, a full tran-sition to a developed economy consumption model (and a services-driven economy, in which services represent more than 80 percent ofGDP), is still far from being achieved: spending on education and enter-tainment, transportation and communications, and other servicesremains very low compared with France, for example, even though some
178 Cattaneo, Ighilahriz, López-Cálix, and Walkenhorst
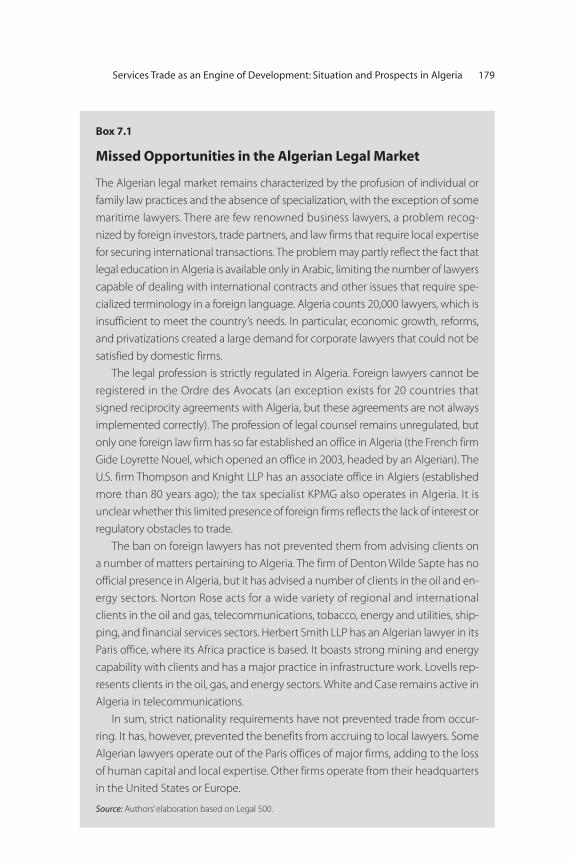
Services Trade as an Engine of Development: Situation and Prospects in Algeria 179
Box 7.1
Missed Opportunities in the Algerian Legal Market
The Algerian legal market remains characterized by the profusion of individual or
family law practices and the absence of specialization, with the exception of some
maritime lawyers. There are few renowned business lawyers, a problem recog-
nized by foreign investors, trade partners, and law firms that require local expertise
for securing international transactions. The problem may partly reflect the fact that
legal education in Algeria is available only in Arabic, limiting the number of lawyers
capable of dealing with international contracts and other issues that require spe-
cialized terminology in a foreign language. Algeria counts 20,000 lawyers, which is
insufficient to meet the country’s needs. In particular, economic growth, reforms,
and privatizations created a large demand for corporate lawyers that could not be
satisfied by domestic firms.
The legal profession is strictly regulated in Algeria. Foreign lawyers cannot be
registered in the Ordre des Avocats (an exception exists for 20 countries that
signed reciprocity agreements with Algeria, but these agreements are not always
implemented correctly). The profession of legal counsel remains unregulated, but
only one foreign law firm has so far established an office in Algeria (the French firm
Gide Loyrette Nouel, which opened an office in 2003, headed by an Algerian). The
U.S. firm Thompson and Knight LLP has an associate office in Algiers (established
more than 80 years ago); the tax specialist KPMG also operates in Algeria. It is
unclear whether this limited presence of foreign firms reflects the lack of interest or
regulatory obstacles to trade.
The ban on foreign lawyers has not prevented them from advising clients on
a number of matters pertaining to Algeria. The firm of Denton Wilde Sapte has no
official presence in Algeria, but it has advised a number of clients in the oil and en-
ergy sectors. Norton Rose acts for a wide variety of regional and international
clients in the oil and gas, telecommunications, tobacco, energy and utilities, ship-
ping, and financial services sectors. Herbert Smith LLP has an Algerian lawyer in its
Paris office, where its Africa practice is based. It boasts strong mining and energy
capability with clients and has a major practice in infrastructure work. Lovells rep-
resents clients in the oil, gas, and energy sectors. White and Case remains active in
Algeria in telecommunications.
In sum, strict nationality requirements have not prevented trade from occur-
ring. It has, however, prevented the benefits from accruing to local lawyers. Some
Algerian lawyers operate out of the Paris offices of major firms, adding to the loss
of human capital and local expertise. Other firms operate from their headquarters
in the United States or Europe.
Source: Authors’ elaboration based on Legal 500.
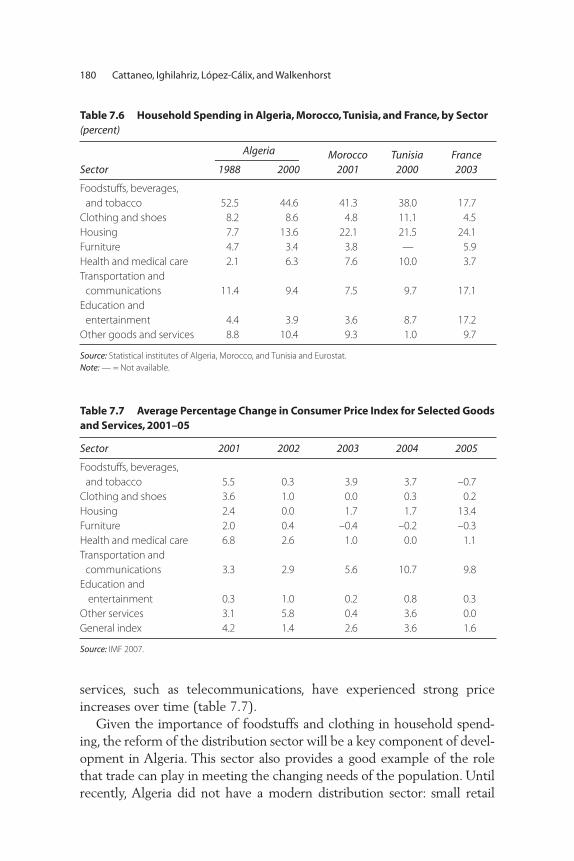
services, such as telecommunications, have experienced strong priceincreases over time (table 7.7).
Given the importance of foodstuffs and clothing in household spend-ing, the reform of the distribution sector will be a key component of devel-opment in Algeria. This sector also provides a good example of the rolethat trade can play in meeting the changing needs of the population. Untilrecently, Algeria did not have a modern distribution sector: small retail
180 Cattaneo, Ighilahriz, López-Cálix, and Walkenhorst
Table 7.6 Household Spending in Algeria, Morocco, Tunisia, and France, by Sector (percent)
Sector
Algeria Morocco 2001
Tunisia 2000
France 20031988 2000
Foodstuffs, beverages, and tobacco 52.5 44.6 41.3 38.0 17.7
Clothing and shoes 8.2 8.6 4.8 11.1 4.5 Housing 7.7 13.6 22.1 21.5 24.1 Furniture 4.7 3.4 3.8 — 5.9 Health and medical care 2.1 6.3 7.6 10.0 3.7 Transportation and
communications 11.4 9.4 7.5 9.7 17.1 Education and
entertainment 4.4 3.9 3.6 8.7 17.2 Other goods and services 8.8 10.4 9.3 1.0 9.7
Source: Statistical institutes of Algeria, Morocco, and Tunisia and Eurostat.Note: — = Not available.
Table 7.7 Average Percentage Change in Consumer Price Index for Selected Goodsand Services, 2001–05
Sector 2001 2002 2003 2004 2005
Foodstuffs, beverages, and tobacco 5.5 0.3 3.9 3.7 –0.7
Clothing and shoes 3.6 1.0 0.0 0.3 0.2Housing 2.4 0.0 1.7 1.7 13.4Furniture 2.0 0.4 –0.4 –0.2 –0.3Health and medical care 6.8 2.6 1.0 0.0 1.1Transportation and
communications 3.3 2.9 5.6 10.7 9.8Education and
entertainment 0.3 1.0 0.2 0.8 0.3Other services 3.1 5.8 0.4 3.6 0.0General index 4.2 1.4 2.6 3.6 1.6
Source: IMF 2007.
shops and markets remained predominant. Some initiatives to developlarger shops (supérettes of 250–400 square meters) in the 1960s and 1970s(Galeries Algériennes) and the 1980s (Souks el-Fellah) were unsuccessfuland led to closures in the 1990s. Attracted by a market of 33 million con-sumers, Carrefour and Auchan (French retail companies) invested inAlgeria (box 7.2).
Promoting Economic Diversification and Export GrowthTrade in services is at the heart of the government’s efforts at diversifica-tion. Algeria’s dependence on fuels, which represent more than 98 percentof exports and half of GDP, raises questions about the sustainability ofgrowth in the medium term. The government aims to boost economicgrowth and attract FDI in other sectors. Services have a key role to playtoward this end. Increasing service exports could also help reduce Algeria’s
Services Trade as an Engine of Development: Situation and Prospects in Algeria 181
Box 7.2
French Entry into the Algerian Supermarket Sector
The first Carrefour supermarket opened in Algiers in January 2006. The 3,000-square
meter (278.7 square foot) store met with immediate success, with thousands of visi-
tors daily. The group is planning to open 18 supermarkets in Algeria by 2012.
Establishment of the initial store benefited Algeria in various ways:
• It brought in direct investment of €3 million, created 350 direct jobs, and
increased human capital through learning-by-doing and training.
• It created thousands of indirect jobs, because 70 percent of the products it
sells are produced locally.
• It provided consumers with access to higher-quality products at a lower
price.
• It created spillover effects in the food and agriculture and the consumer goods
(white goods) sectors, as producers adjusted their production standards (pack-
aging, quality, and so forth) to meet Carrefour’s standards, possibly allowing
them to start exporting their products to France or other countries.
Carrefour’s investments should also create spillover effects through competi-
tion, further investment, and the emergence of domestic competitors. Barriers
to the development of local initiatives—such as remaining constraints on the
development of commercial real estate—should be lifted to ensure that the full
benefits are reaped.
dependence on Europe and the United States for export markets, giventhe importance of trade in services flows in the Maghreb and beyond.
Trade statistics on exports are generally not detailed or accurate enoughto give a clear idea of the export potential and comparative advantages of theservice sectors. Anecdotal evidence of success stories should be the startingpoint for crafting sectoral export strategies, keeping in mind the importanceof reputation, human capital, and natural endowments. It could also be use-ful to look at success stories in neighboring countries and draw lessons fromthem for Algeria. The trade potential of the service sectors identified by thegovernment as priorities in the growth program should be confirmed, so thatthe trade dimension of these sectors is not neglected. A trade strategy shouldbe elaborated in parallel, with a view to making the government’s efforts sus-tainable (trade incomes could supplement public spending).
Among the priority sectors identified by the government, tourism is themost obviously trade oriented (all expenses by foreign tourists count asexports under mode 2). For the period 2005–09, the ComplementaryProgram to Support Growth (Programme complémentaire de soutien à lacroissance [PCSC]) allocated DA3.2 billion to the sector. In 2004, theMinistry of Tourism has identified 146 zones d’expansion touristiques andlaunched a sectoral development strategy aimed at better exploiting thecountry’s natural and cultural endowments, improving the quality of serv-ices and the reputation of the country, and rehabilitating hotels. Accordingto the ministry, the sector counts more than 300 investment projects; for-eign providers include Accor, Al Hamed, Eddar-Sidar, Marriott, andStarwood. These efforts have been supported by renewed interest by AigleAzur, Air France, Alitalia, British Airways, Lufthansa, and Qatar Airways inflying to Algeria.
Given Algeria’s size, location, coast line, infrastructure, and desert, itspotential for tourism is substantial. This potential remains largelyuntapped, however. In 2005, 1.4 million people visited Algeria, originat-ing primarily from France (34 percent), Tunisia (29 percent), Libya, Syria,and Egypt. A key to the development of tourism will be finding the rightniches. The country’s desert and cultural assets seem to be particularlypromising in this regard. A number of reforms are necessary, however, tounleash this potential. For example, 80 percent of hotels do not meetinternational norms, and there is a shortage of skilled professionals.9
The new technologies of information and communication have alsobeen identified as a priority. This sector has proven an important poten-tial source of exports for developing countries, including in the Maghreb:in Morocco and Tunisia, call centers have mushroomed, and the widermarket of business process outsourcing is even more promising.
182 Cattaneo, Ighilahriz, López-Cálix, and Walkenhorst
Algeria’s location and use of French could be major assets—if theeconomy is poised to take advantage of them. The World EconomicForum (2004) has identified Algeria as one of the countries with theslowest progress toward e-readiness. Further study could help assess thereal trade potential of Algeria in the sector and design a strategy for com-peting. The results of the new incentives adopted by the government todevelop the sector could also be reviewed.
Making the Best Use of International Trade Integration ToolsService sector reforms can typically be made unilaterally: they arefirst and foremost aimed at improving services delivered domesti-cally, and the country engaging in the reforms is the main benefici-ary. However, achieving reform through international agreements canimprove the prospects for success. The government can cite thepotential benefits from the trade agreement in arguing against vestedinterests and in making a case for the expenditures often required toimplement reforms. Entering into international commitments canalso bolster the credibility of the government’s commitments. Hence,different types of trade integration arrangements offer differentadvantages (table 7.8).
In Tunisia, the Ordre des Experts Comptables (order of certifiedaccountants) negotiated with the French consulate the right to col-lect all requests for visas from its members, which the consulateagreed to fast-track (see chapter 5). Bilateral agreements have provento be an efficient tool of negotiation for market access in many serv-ice sectors. Some negotiated bilateral agreements fail, however: basedon reciprocity, lack of implementation by one party is enough tomake the agreement void. Algeria, for example, has concluded somereciprocity agreements in the legal sector, but implementation hasproven difficult.
Domestic reform can prepare a country for subsequent interna-tional integration. Reforms by the government and the transition to amarket economy are significant steps toward Algeria’s accession to theWorld Trade Organization (WTO), which Algeria has been negotiat-ing since 1987. Anticipated benefits include the increased securityand predictability of trade transactions, which would facilitate deeperintegration in the world trading system and increase the attractivenessof investment.
Regional trade negotiations can be horizontal (for example, within theMaghreb region) or vertical (for example, between the Maghreb and theEuropean Union). They can lead to deeper integration. Regionalism can
Services Trade as an Engine of Development: Situation and Prospects in Algeria 183

be used to remove obstacles to trade and harmonize domestic rules acrossthe region (leading eventually to regional rules). The earlier analysis ofservice trade flows suggests that the regional dimension of trade in serv-ices is essential to Algeria: vertically, European countries (in particularFrance) remain the main exporters of services (including through invest-ment and establishment) to Algeria; horizontally, the large-scale invest-ments of Egyptian telecommunications companies or the opening ofTunisian engineering firms or banks in Algeria are proof of the consider-able potential of trade development within North Africa. Surprisingly,obstacles to trade, particularly obstacles to the movement of people, areoften more serious at the horizontal than at the vertical level.
Liberalizing services, in terms of both increasing domestic competi-tion and opening up to foreign providers, is often more difficult than
184 Cattaneo, Ighilahriz, López-Cálix, and Walkenhorst
Table 7.8 Examples of Bilateral, Regional, and Multilateral Agreements
Type of agreement Example
Bilateral Mutual recognition agreements for diplomas and qualifications (for example, right of lawyers to appear in domestic courts, right ofdoctors to practice on a temporary basis)
Fast-track procedures in key consulates to obtain business visas (for example, for accountants or engineers)
Bilateral treaties (for example, bilateral conventions on social security,bilateral investment treaties, open sky agreements, tax treaties)
Facilitation of the movement of key personnel through cooperation fortraining and research (for example, in the medical sector)
Regional Harmonization or mutual recognition of education curricula or qualification requirements (for example, EU higher education)
Freedom of establishment or movement of key personnel (for example, EU Lawyers Establishment Directive)
Harmonization of certain norms or standards (for example, internationalaccountancy norms (CGNC, IAS-IFRS), standards and certifications ofclinics or health processes, telecoms
Harmonization of certain rules (for example, attribution of public workcontracts, public procurement
Free-trade agreement (with Europe or within Maghreb)Multilateral Consolidation of existing reforms in the GATS in compensation for
market access abroad (subject to WTO membership)Participation in the GATS negotiations on rules (subject to WTO
membership)Participation in the negotiations on transparency of government
procurement (subject to WTO membership)
Source: Authors.Note: CGNC, Code General de la Normalisation Comptable. IAS-IFRS, International Accounting Standards—International Financial Reporting Standards.
Services Trade as an Engine of Development: Situation and Prospects in Algeria 185
liberalizing the goods sectors, for several reasons. Services transactions ofteninvolve the promise of a future service for a current payment, increasing therisk of deceitful practices that may require strong oversight. In some serv-ice sectors, the sequencing of reforms can be critical (box 7.3). Asymmetryof information (between doctors and patients, for example) is even greaterthan in the goods sector. For these reasons, it is normal to regulate access toand the supply of services in the professions.
The many issues that govern an appropriate regulatory regime forthe service sectors underline the importance of fashioning domestic reg-ulations that are suited to the market, not necessarily guided by theissues that are prominent in trade negotiations. For this reason, WTOregulations on trade in services in Article VI of the GATS are limited toensuring that. In sectors where specific commitments are undertaken,measures relating to qualification requirements and procedures, techni-cal standards, and licensing requirements do not constitute unnecessarybarriers to trade in services (that is, are based on objective and transpar-ent criteria, such as competence and the ability to supply the service);are not more burdensome than necessary to ensure the quality of theservice; and, in the case of licensing procedures, do not themselvesrestrict the supply of the service.
Recognition of the limits of trade concerns on service regulation doesnot mean that professions should be overly protected. Some professionalbodies appear to have pursued the interests of their members over theinterests of consumers. Lack of competition can result in predatory pric-ing and lower-quality services. Where a country is subject to such prac-tices, or simply falls victim to skill shortages, opening to trade is often thesafest way to restore an efficient market solution.
Issues for Policy Makers
Policy advice seems particularly fruitful in three areas. First, given thelarge and growing importance of the service sector and service trade forthe Algerian economy, improvements to the statistical system to bettercapture trends and structural changes seem highly desirable. In the shortrun, statistics should be made more readily accessible (transparency) andusable to trade policy makers (for example, by collecting information bymodes of delivery). The Banque d’Algérie could help policy makers bet-ter understand balance of payments data and their significance: How arethe transport flows computed? How can the results for the insurancesector be explained? Algerian National Investment Development could

186 Cattaneo, Ighilahriz, López-Cálix, and Walkenhorst
Box 7.3
Why Liberalization Often Produces Disappointing Results:Sequencing, Regulation, and Access Policies
Although liberalization of services has been a successful path to development for
many developing countries, it has produced disappointing results for others. Failure
can translate into lack of access to basic services and diminishing trust in reform.
Adverse results can often be explained by errors in policy making. Governments
and donor organizations sometime behave as if they have complete faith in the
power of the markets. They move aggressively, but unevenly, on the elimination of
barriers to entry, sluggishly on the development of regulations to deal with market
failure, and only notionally on the implementation of access policies.
This does not mean that governments and donors have been naive and did not
appreciate the importance of regulation and access. Rather, they did what they
could do quickly and relatively easily, which was to privatize and allow entry in
some sectors. Ironically, in some cases only limited liberalization was accomplished
in sectors in which successful outcomes could have been achieved even without
progress in the other two dimensions of reform, whereas barriers were completely
eliminated in sectors for which successful outcomes depended critically on com-
plementary reforms. Implementing comprehensive regulatory improvements can
be a slow and difficult process. The appropriate form of access policies is still not
well understood or implemented outside a few sectors.
Sometimes there is no good reason to hold back on liberalization, even when
regulatory reforms and access-widening policies take time to implement. This is
true for reforms that are “additive” (the benefit from trade reform is independent
of the benefit from domestic reforms and each can be undertaken separately).
Thus, there is no economic reason to wait to liberalize until a universal access pol-
icy is established (this is the case, for example, in telecommunications). In other
cases, reforms are “multiplicative” (a country would benefit more from trade reform
if domestic reforms were also implemented and vice versa, but the order in which
the two are implemented does not matter). For example, regulatory improve-
ments and competition in transport are mutually beneficial, but the sequence is
probably not critical. In other situations, sequencing matters: if the country imple-
ments trade reform before the necessary domestic reform, the long-term payoffs
will be lower than if the opposite sequence had been followed. In these situations,
if the complementary reform cannot be implemented for economic or political
reasons, there is a case for gradual liberalization.
Source: Adapted from Mattoo and Payton 2007.

generate data on the sectoral distribution of FDI and better measure theimportance of services in FDI flows (mode 3 trade), including the geo-graphical dispersion of trade. The Algerian Trade Registry could obtain abetter picture of foreign presence in the service sector.
In the long run, awareness needs to be raised of the trade dimensionof services among ministries, professional bodies, and statistical offices,which should be encouraged to collect statistics that would help pol-icy makers design sectoral and holistic trade promotion strategies. Forexample, what are enterprises in each sector exporting? What are themovements of key personnel? Who are the main foreign investors inthe sector?
Second, a market that is more open to foreign service providers prom-ises large benefits for the Algerian economy by overcoming domesticservices supply bottlenecks, reducing the input costs for industrial enter-prises, and offering role models for domestic services firms in terms ofquality and management. To open the market, the government shouldidentify the sectors that have already been liberalized, assess the results,and address remain obstacles to trade. This analysis could include anassessment of the appropriate sequencing of reforms. In addition, for eachsector, the strengths, weaknesses, opportunities, and threats should beanalyzed, with a view to determining Algeria’s export potential and iden-tifying obstacles to be removed and policies to be adopted.
Third, a multifaceted bilateral, regional, and multilateral integrationstrategy should be developed, to coordinate and enhance efforts to increaseaccess to foreign country markets for Algeria’s fledging services exporters.For each sector, the optimal level of negotiation for liberalization and mar-ket access (bilateral, regional, or multilateral) should be identified and theright policy tools (for example, mutual recognition, harmonization, free-dom of movement of key personnel) selected for use at each level. The risksand opportunities of opening with specific partners should also be assessed(by, for example, measuring the potential of vertical versus horizontalregional integration).
Notes
1. International efforts are underway to improve statistics on trade in services.The Manual on Statistics of International Trade in Services was developedand is published jointly by the European Commission, the InternationalMonetary Fund, the Organisation for Economic Co-operation andDevelopment, the United Nations, the United Nations Conference on
Services Trade as an Engine of Development: Situation and Prospects in Algeria 187
Trade and Development, and the World Trade Organization. It sets out aninternationally agreed-upon framework for the compilation and reportingof statistics on international trade in services in a broad sense. The manual(UN document ST/ESA/STAT/SER.M/86) is available on the Web sites ofthe six organizations.
2. These statistics are based on the database of the Caisse Nationale des AssurancesSociales, which does not include all of the enterprises registered with the CentreNational du Registre du Commerce.
3. The Conseil National Economique et Social underlines the difficulty of meas-uring and providing a definition of the informal sector. Statistics may varydepending on definitions (“uninsured workers” versus “shadow economy,” forexample).
4. The building and construction sector is often not treated as a service sector inAlgerian statistics. In accordance with common classifications used for tradepurposes, this chapter includes construction and related services in the servicesector. This may create a statistical bias, because the definition of the sector inAlgeria may includes industrial activities (cement, factories, and so forth).
5. The success of the insurance industry should be interpreted with great care.
6. The Centre National du Registre du Commerce, which inventories all firmsestablished in Algeria that are foreign owned (entreprises étrangères sous statutde personne physique) or have a foreign manager (sociétés étrangères), is themost precise statistical instrument available. Because some foreign companieshire local managers and foreign managers can be hired by strictly local com-panies, it does not exactly reflect foreign presence.
7. The number of foreign firms does not indicate the size of these firms.
8. These measures are not fully satisfactory, because they do not distinguishbetween service providers and workers in other sectors and they include trans-fers of permanent migrants (mode 4 covers only the temporary movement ofservice providers).
9. This section draws on information in Mission Economique de la France àAlger (2005).
References
ANIMA (Euro-Mediterranean Network of Investment Promotion Agencies). 2007.http://www.animaweb.org/
Banque d’Algérie. Bulletins Statistiques. http://www.bank-of-algeria.dz/bulletin_statistique.htm
CNES (Conseil National Economique et Social). 2006. Note de conjoncture du pre-mier semestre 2006. Algiers: CNES.
188 Cattaneo, Ighilahriz, López-Cálix, and Walkenhorst
CNRC (Centre National du Registre du Commerce). 2006. http://www.cnrc.org.dz/fr/index.php.
ILO (International Labour Organization). 2004. Global Employment Trends forYouth. Geneva: ILO.
———. 2007. African Employment Trends. Geneva: ILO.
IMF (International Monetary Fund). 2007. Algeria: Statistical Appendix.Washington, DC: IMF.
Legal 500. http://www.legal500.com.
Mattoo, A., and L. Payton, eds. 2007. Services Trade and Development, TheExperience of Zambia. Washington, DC, and New York: World Bank andPalgrave Macmillan.
Ministère de la Petite et Moyenne Entreprise et de l’Artisanat. 2006. Bulletin desdonnées économiques du secteur de la PME et de l’artisanat. Algiers: Ministèrede la petite et Moyenne Entreprise et de l’Artisanat.
Mission Economique de la France à Alger. 2005. Le secteur du tourisme en Algérie.Fiche de synthèse. Algiers.
ONS (Office National des Statistiques). 2001. Fichier general des établissements.Algiers: ONS.
———. Statistiques-Economique. http://www.ons.dz/Statistiques-Economique.html
World Bank. 2002. Algeria Investment Climate Assessment. Washington, DC:World Bank.
———. 2006. Global Development Prospects. Washington, DC: World Bank.
———. 2007a. World Development Indicators. Washington, DC: World Bank.
———. 2007b. World Development Report: Development and the Next Generation.Washington, DC: World Bank.
World Economic Forum. 2004. The Africa Competitiveness Report. Geneva: WorldEconomic Forum.
Services Trade as an Engine of Development: Situation and Prospects in Algeria 189

PA R T I I I
Relations with China and India


193
A key feature of the economic growth of China and India has been veryrapid growth in their trade—arguably the strongest and most direct chan-nel through which growth in China, and more recently India, is affectingother developing countries. China accounted for almost 8 percent ofworld exports of goods and services in 2007, substantially more than itsshare of world GDP at market prices (estimated at 5.9 percent)(Development Data Platform [DDP] database). China’s degree of open-ness is high for a large economy, in part because as much as a third of thevalue of its exports comes from imported inputs (Winters and Yusuf2007). India is smaller and less open, with 1.3 percent of world exportsand 2.2 percent of world GDP in 2007 (DDP database). With annualexport growth of nearly 20 percent over 1995–2005, China and Indiatogether accounted for 12.8 percent of the total growth in worldexports, more than 50 percent more than the 8 percent contributed bythe United States. Although the turbulence associated with the current
C H A P T E R 8
Economic Growth in China and India: Challenges andOpportunities for the Middle East and North Africa
Elena Ianchovichina, Maros Ivanic, and Will Martin
financial crisis seems likely to cause substantial fluctuations, the underlyingtrend rates of growth in China and India seem likely to remain strong.
An important feature of the growth of China and India has been thegrowth in their demand for natural resources, particularly energy. Thisstructural increase in world demand for energy contributed to the sharpincreases in energy prices before the emergence of the global financial cri-sis in mid-2008. It is likely to have major, long-term favorable impacts onthe economies of the Middle East and North Africa (MENA). The result-ing “Dutch disease” implications for the competitiveness of the tradedgoods sectors in MENA are likely to be of concern to many, however.
This chapter analyzes the key implications of the growth of China andIndia for MENA countries. Because modeling databases provide insuffi-cient information on these countries, it was necessary to add data on anumber of countries and regions to the database. This was a major under-taking, given the need to balance both bilateral trade flows and themacroeconomic aggregates. As a result of this effort, we were able tobreak out data for and model a number of countries in the region, includ-ing Algeria, Israel, Jordan, Lebanon, and the Syrian Arab Republic.
The chapter is structured as follows. The next section reviews the liter-ature on the nature and magnitude of these effects, examining the effectsthrough four broad channels. The second section describes the methodol-ogy used. The third section presents and discusses the results of the simu-lations. The last section summarizes the chapter’s main conclusions.
Messages from the Literature
The impact of growth in China and India on MENA countries’ trade canusefully be divided into four channels (holding policy settings constant):increases in opportunities for MENA countries to export to China andIndia, increases in opportunities for MENA countries to import fromChina and India, increases in third-market export competition fromChina and India, and indirect trade impacts.
The first interaction is typically seen as a gain, and the second one isfrequently seen politically as a loss, although both interactions unambigu-ously involve gains to MENA countries. The third interaction is the sub-ject of a great deal of attention and angst, as it invariably involves a lossto MENA countries. The fourth interaction is ambiguous in sign. Ifincreased imports by China and India raise the prices of goods that arealso imported by MENA countries, the effect can be adverse. If, by con-trast, the imports of China and India substitute for goods supplied by
194 Ianchovichina, Ivanic, and Martin
MENA, MENA could expect to gain from increases in the demand forthese imports (for example, increases in demand for oil).
Increases in Opportunities to Export to China and IndiaOpportunities to export to China and India are expanding extremely rap-idly. Between 1995 and 2008, China and India accounted for 13 percentof global growth in imports of mineral fuels. Most of this increase repre-sented a net increase in demand as millions of Chinese, and more recentlyIndian, consumers grew richer and increased their consumption ofresource-intensive goods. In metals and coal, China now ranks first in theworld, accounting for 15–33 percent of world consumption.
An important factor to take into account in analyzing this issue is thereduction in the cost of energy-intensive goods when energy efficiencyincreases—a factor that blunts the edge of energy efficiency as an approachto reducing energy consumption. As Shalizi (2007) notes, changes in theenergy intensity of growing economies can have a large impact on thedemand for energy. The energy intensity of China’s economy appears tohave declined by two-thirds between 1980 and 2003, while energy inten-sity in India remained roughly unchanged. Both the likely path of energyefficiency and its implications for industrial structure and the deriveddemand for petroleum will clearly be important in assessing the implica-tions of growth of China and India for the MENA region.
Increases in Opportunities to Import from China and IndiaThe expansion of trade by China and India is quite different from theexpansion of developing country exports considered in much of the tradi-tional development literature, which focused on the deterioration in theterms of trade associated with expanding exports of primary commodities.The growth in trade by China and India involves, for instance, two-waytrade in manufactures and services, which make the importing countriesthe beneficiaries of improvements in efficiency in their trading partners(Martin 1993). Exports by China and India also involve fragmentation andglobal production sharing, in which part of the production process is under-taken in one economy and subsequent stages are undertaken in another(Ando and Kimura 2003; Gaulier, Lemoine, and Unal-Kesenci 2004). Thisprocess can also make participants beneficiaries from, rather than victimsof, improvements in the competitiveness of their trading partners.
The growth of China and India has therefore created enormous oppor-tunities for their trading partners to benefit economically from imports oflower-priced and higher-quality goods. Although this is frequently seen as
Economic Growth in China and India 195

a political cost, it is potentially a very important source of economic gains.Amiti and Freund (2008) find that the prices of China’s exports to theUnited States fell 1.6 percent a year between 1997 and 2005.
Another notable feature of China’s exporting has been technologicalupgrading. Devlin, Estevadeordal, and Rodríguez-Clare (2006) show howhigh-tech goods have partly displaced low-tech ones within the set of man-ufactured exports. This upgrading reflects both imports of more sophisti-cated products and local improvements in product quality (Branstetter andLardy 2006). Similar improvements in the quality and variety of serviceexports have helped fuel explosive growth in exports of services from Indiain particular.
In addition, the trade patterns of growing countries tend to be quitedynamic. New trade theory recognizes that export expansion does notinvolve just increases in exports of the same products and services: rap-idly growing economies expand the range of products and services theyexport, improve the quality of exports, and export to additional mar-kets as their exports grow (Evenett and Venables 2002; Hummels andKlenow 2005). These developments generate benefits to the exportingeconomies and their trading partners, as Dimaranan, Ianchovichina,and Martin (2007) show.
Improvements in the quality of exports from an emerging market sup-plier increase the demand for their exports at any given price level andhence tend to lead to increases in the actual prices received for importsfrom these suppliers. Higher-quality goods allow importers to meet theirneeds with a smaller quantity of the good or consume more in response toa lower effective price of the good. The result is an improvement in theterms of trade and real incomes of both the emerging exporter and theimporter when the terms of trade are measured in appropriate units.1
Moreover, the increase in the number of goods supplied by the emergingmarket generates a benefit to countries that value an increase in the varietyof goods available to them—a phenomenon frequently captured using for-mulations such as Dixit-Stiglitz preferences (see, for example, Hummelsand Klenow 2005).
The magnitude of these gains depends on the extent of the improve-ment in quality, on the increase in the number of varieties of productsbeing exported, and on the extent to which importers value increases inthe variety of goods imported. If policy settings allow imported inputs tobe used in partner countries, improvements in the variety and quality ofimported inputs can be a particularly important source of dynamism inthe manufacturing sector (Amiti and Konings 2007).
196 Ianchovichina, Ivanic, and Martin
Third-Market CompetitionThe trade impacts of emerging economies today are very different fromthose that have typically been analyzed when considering the impacts ofgrowth in primary-producing developing countries. In the traditional lit-erature, a rapidly growing developing country was typically a supplier toa common set of industrial country markets of a raw agricultural or min-eral commodity produced by other developing countries. Although thisliterature was subsequently extended to take into account the rapidgrowth in exports of manufactures from developing countries, it contin-ued to consider only negative impacts from the growth of other develop-ing countries’ exports.
Third-market competition is one of four interactions determining theimpact of high growth in China and India. To the extent that the tradeinteractions between China and India and other countries involve third-market competition, the countries facing increased competition stand tolose. As Freund and Ozden (2009) and Hanson and Robertson (2009)note, some industries in some countries can and will lose from increasedcompetition from the giants.2 A key question is, which countries andwhich industries will face the most serious competition?
The answer to this question depends a great deal on the extent towhich the pattern of exports from China and India overlap with those ofMENA. Although both China and India have been successful in expand-ing their exports and imports, they have done so in very different ways(Dimaranan, Ianchovichina, and Martin 2007). India has relied muchmore heavily than China on exports of services. India’s share of commer-cial services in total goods and services exports has been much higherthan China’s, not just since the rapid expansion of exports of comput-ing services around 2000, but for the entire period since 1992 for whichcomparable estimates are available. However, both countries still haverelatively small world shares of trade in services (China accounts forjust 1.8 percent of world services exports, and India accounts for just2.8 percent), and trade in services alone is unlikely to transform India’seconomy (Winters and Yusuf 2007).
Even within merchandise trade, China’s and India’s export patternshave been radically different at the six-digit level of the HarmonizedSystem, with only one product—refined petroleum—appearing on bothcountries’ top 25 lists of products.3 Although both China’s and India’smerchandise exports have been dominated by manufactures (World Bank2003) and their shares of manufactured intermediate inputs in nonfuelimports in 2004 were very similar, the composition of these manufactures
Economic Growth in China and India 197
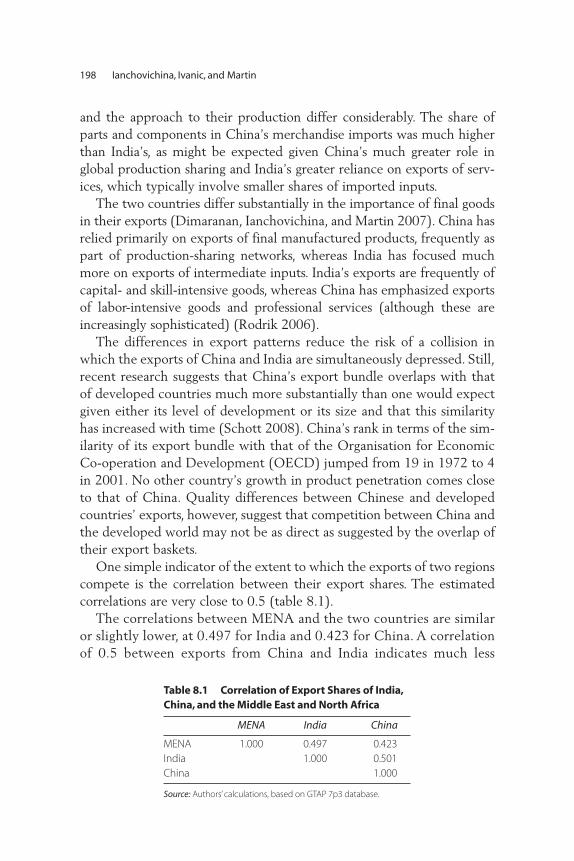
and the approach to their production differ considerably. The share ofparts and components in China’s merchandise imports was much higherthan India’s, as might be expected given China’s much greater role inglobal production sharing and India’s greater reliance on exports of serv-ices, which typically involve smaller shares of imported inputs.
The two countries differ substantially in the importance of final goodsin their exports (Dimaranan, Ianchovichina, and Martin 2007). China hasrelied primarily on exports of final manufactured products, frequently aspart of production-sharing networks, whereas India has focused muchmore on exports of intermediate inputs. India’s exports are frequently ofcapital- and skill-intensive goods, whereas China has emphasized exportsof labor-intensive goods and professional services (although these areincreasingly sophisticated) (Rodrik 2006).
The differences in export patterns reduce the risk of a collision inwhich the exports of China and India are simultaneously depressed. Still,recent research suggests that China’s export bundle overlaps with thatof developed countries much more substantially than one would expectgiven either its level of development or its size and that this similarityhas increased with time (Schott 2008). China’s rank in terms of the sim-ilarity of its export bundle with that of the Organisation for EconomicCo-operation and Development (OECD) jumped from 19 in 1972 to 4in 2001. No other country’s growth in product penetration comes closeto that of China. Quality differences between Chinese and developedcountries’ exports, however, suggest that competition between China andthe developed world may not be as direct as suggested by the overlap oftheir export baskets.
One simple indicator of the extent to which the exports of two regionscompete is the correlation between their export shares. The estimatedcorrelations are very close to 0.5 (table 8.1).
The correlations between MENA and the two countries are similaror slightly lower, at 0.497 for India and 0.423 for China. A correlationof 0.5 between exports from China and India indicates much less
198 Ianchovichina, Ivanic, and Martin
Table 8.1 Correlation of Export Shares of India,China, and the Middle East and North Africa
MENA India China
MENA 1.000 0.497 0.423India 1.000 0.501China 1.000
Source: Authors’ calculations, based on GTAP 7p3 database.

competition than might be suggested by much popular discussion.The similar or slightly lower correlation between the exports ofMENA and the two giants suggests that competition with MENA willalso be much weaker than casual reasoning might suggest.
An important concern for countries in MENA and elsewhere will bethe extent to which India and, especially, China move up market intotheir “product space.” India and China have demonstrated their ability toupgrade their performance in specific sectors. China’s export growth hasbeen accompanied by tremendous growth in product variety: China man-ufactured 9 percent of all manufacturing product categories in 1972 and70 percent in 2001 (Schott 2008). This growth at the extensive margin isan important factor, which we take into account when evaluating theimplications of rapid growth in China and India on MENA countries.
Indirect Trade ImpactsThe rapid growth of imports by China and India is likely to change theprices of many goods of interest to MENA countries, even if they do notdirectly trade them with the two countries. The signs of these effects areambiguous, because they depend on a number of factors, including the rela-tionship between the mix of these products and those exported by MENA.
The rising exports of manufactures and services from the giants arelikely to affect MENA countries even in cases in which they do not com-pete directly. As China and India increase the quality and quantity of theirexports, one would expect a decline in their prices relative to factorprices. Productivity growth or more efficient use of factors in China andIndia is raising their output and hence putting downward pressure ontheir prices. As a result, MENA countries could benefit from lower priceson their imports of these goods.
Energy and mineral products are different, in that their supply is con-strained by a fixed factor, energy resources. As incomes rise, the demandfor energy grows strongly. This tends to push up the price of energy prod-ucts relative to factor prices. Thus, MENA oil exporters enjoy substantialbenefits from the impact of China and India on the prices of theirexports. In our baseline simulation, this effect is muted but not com-pletely offset by the increase in the productivity of energy productionitself assumed in the analysis.
For agricultural goods, there are several competing influences on prices.The first is the technological change effect described above for manufac-tures and services, which tends to reduce prices. A second is the presenceof a fixed factor (land) in agricultural production, which tends to raise
Economic Growth in China and India 199
prices, because world income demand for these goods has risen, as in thecase of energy products. A third factor is the well-known Engel effect—the fact that demand for agricultural products, particularly basic foods,tends to rise more slowly than income. A fourth factor is the Rybczynskieffect: if growth is associated with increases in the capital-labor ratio, itwill tend to reduce agricultural output and raise agricultural prices.
Dimaranan, Ianchovichina, and Martin (2007) find that higher growthin China and India implies increases in output of farm and forestry prod-ucts in other countries and in output of energy, mineral, and other resource-based products in countries endowed with natural resources. As these twocountries achieve major gains in their market shares in manufacturing,most other countries experience relative declines in manufacturing out-put, especially in clothing and electronics, which are sensitive to increasedcompetition. Therefore, even if China’s and India’s success is generallygood news for other economies, there are adjustment costs that will beborne by different stakeholders within those countries.
Methodological ApproachesA number of approaches can be used to address questions about theimpact on world trade of China’s and India’s growth. DFID (2005) andJenkins and Edwards (2006) focus on bilateral trade links. Although use-ful for analyzing the direct trade impacts, this approach ignores the strongspillover effects that may occur if countries compete in the same marketsor products.
A second set of studies on the topic, including Lall and Weiss (2004),Goldstein and others (2006), and Stevens and Kennan (2006), considersglobal markets and compares the trade patterns of China with those oftheir countries of interest. These studies argue that countries with exportpatterns similar to China’s are likely to suffer losses as China grows,whereas those whose exports match China’s imports are likely to receivea boost. Although informative, this approach ignores the two-way tradethat is prevalent in trade in manufactures and services and the possibilityof gains from this trade where net trade patterns are similar.
A third group of studies uses case studies to analyze developments inparticular industries or markets. This approach can be extremely illumi-nating, although it does not readily lend itself to revealing an overallpicture. Using an approach drawing on the new economic geography,Yusuf, Nabeshima, and Perkins (2007) consider the future pattern ofmanufacturing production and exports to be likely central to develop-ment in both countries. Although services will be important to India,
200 Ianchovichina, Ivanic, and Martin
they do not suggest a completely new development model. China’sappetite for primary imports seems bound to continue growing.
Yusuf, Nabeshima, and Perkins (2007) believe that these features willcombine to favor certain mid-tech and high-tech sectors, including auto-mobiles, electronics, and domestic appliances—and in the future, pharma-ceuticals and engineering—and present case studies of these sectors. Givenrapid growth of skilled labor, it is possible for China to become a majorforce in some sophisticated sectors. Competing demand for skills in pub-lic service, general management, and education could delay the emer-gency of such technological leadership for some time. The second driverimplies the continuation of low-skilled, labor-intensive manufacturing,but this is most likely to take place inland, where large numbers of farmworkers could be trained for industrial work. India has had export successin textiles and clothing, is a growing force in pharmaceuticals, and showspotential in steel, white goods, and electronics. These studies can be usedto assess likely sectoral impacts of the growth in China and India on othercountries, but it is difficult to add up their effects across sectors.
A fourth group of studies examines the trade links between Chinaand India and their target countries, some key impacts, and the policyresponses needed to best adapt to the growth of the emerging giants.Broadman (2007) finds that the share of Asia in the exports of Sub-Saharan Africa rose from 14 percent in 2000 to 27 percent in 2004. Thisstudy highlights the importance of barriers to trade—in both Africa andAsia—that prevent both Africa and emerging Asia from taking greateradvantage of the potential synergies between them. It uses the gravitymodel to investigate resistance to trade between China, India, and Africa.A survey by Abdel-Khalik and Korayem (2007) focuses on the linksbetween China and the Middle East.
A fifth group of studies—including Dimaranan, Ianchovichina, andMartin (2007); McDonald, Robinson, and Thierfelder (2008); andIanchovichina, Ivanic, and Martin (2008)—addresses these problems byemploying computable general equilibrium (CGE) models. These modelsensure consistency while including important industry detail: eachregion’s exports of particular goods equal total imports of these goodsinto other regions (less shipping costs); global investment equals the sumof regional savings; regional output determines regional income; globalsupply and demand for individual goods balance; and demand for a fac-tor in each country or region equals supply. These accounting relation-ships and the behavioral links in the model constrain the outcomes inimportant ways not found in partial equilibrium analyses—increased
Economic Growth in China and India 201
exports from one country must be accommodated by increased importsby other countries; broad-based increases in productivity that raise com-petitiveness also raise factor prices and help offset the original increase incompetitiveness.
Dimaranan, Ianchovichina, and Martin (2007) study the impact ofaccelerated growth as a result of productivity improvements in China andIndia on global economic growth to 2020, using a scenario consistentwith the World Bank’s macroeconomic projections at that time. They findthree broad effects on other countries: countries’ exports face fiercercompetition because the giants’ costs fall; their imports from China andIndia become cheaper; and they benefit from aggregate demand increasesin China, India, and elsewhere as real incomes increase in response to effi-ciency improvements.4 The balance of these forces varies from country tocountry, but because most countries import significant amounts fromChina and India and all enjoy a share of the increase in demand, mostcountries gain overall (exceptions include some countries in SoutheastAsia, the rest of South Asia, and the European Union). In the EuropeanUnion, the rise in the price of energy causes consumption of energy todecline further. This reduction in consumption levels of a good whoseconsumption is already reduced by domestic taxes leads to an economicefficiency loss of $7.3 billion, which is enough to outweigh the $3 billiongain from the terms-of-trade improvement and to create a small overallwelfare loss.
China’s exports to other markets increase, and other countries’exports—especially manufactured products—decline. The MENA regionas a whole increases exports to China and India but loses market sharein the European Union and other markets. MENA appears to have anopportunity to strengthen its trade ties with China and India. In theabsence of policy measures to boost competitiveness, however, overallexports from the region are expected to decline 1.5 percent relative tobaseline by 2020 (Dimaranan, Ianchovichina, and Martin 2007). Themessage of this work is that many MENA countries will have to improvetheir competitiveness.5
This short survey of the burgeoning literature on the growth ofChina and India reveals a number of lessons on how to assess the likelyimplications of their growth for MENA countries. One is to pay atten-tion to the structure of MENA countries’ trade and its complementar-ity or competitiveness with that of the giants. Another is to examine thenature of the direct and indirect trade links between them to assess theextent to which gains from expanded bilateral trade can offset losses
202 Ianchovichina, Ivanic, and Martin
from competition in third markets. The implications of the growth ofChina and India for the prices of resources, particularly energy and min-eral resources, are likely to require particular examination. A key objec-tive is to help identify policy responses, both to take advantage of theopportunities created by the growth of China and India and to avoidpotential disruptions.
Methodology, Data, and Simulation Design
Like Dimaranan, Ianchovichina, and Martin (2007), we use the modifiedversion of the standard Global Trade Analysis Project (GTAP) model inIanchovichina (2004) to analyze the consequences of higher growth inChina and India on MENA countries.6 This version of the GTAP modelfeatures China’s duty exemption system, which has been a key driver ofthe rapid integration of China into global production networks, and theduty drawbacks in India, which have allowed for much deeper integrationby India into global production sharing than in the past. Ianchovichina(2004) shows that failing to take into account the presence of a dutydrawback or exemption system can lead to serious overestimation of theimpacts of trade liberalization.
The duty exemption model allows for two separate activities in eachindustry. Production of exports is represented as an activity for whichimported intermediate inputs are available duty free. Production for thedomestic market uses the same technology but requires payment of dutieson intermediate inputs. Firms engaging in production for either the domes-tic market or the export market purchase both imported and domesticintermediate inputs, which are imperfect substitutes.
Factor inputs of land, capital, skilled and unskilled labor, and, in somesectors, a natural resource factor are included in the analysis. The modeltakes into account the role of intersectoral factor mobility and overallresource constraints in determining sectoral output supply. Product dif-ferentiation between imported and domestic goods and among importsfrom different regions allows for two-way trade in each product cate-gory, depending on the ease of substitution between products from dif-ferent regions.
The model includes the explicit treatment of international trade andtransport margins, a “global” bank designed to mediate between world sav-ings and investment, and a relatively sophisticated consumer demand sys-tem designed to capture differential price and income responsivenessacross countries. As mentioned earlier, the accounting relationships and
Economic Growth in China and India 203
the behavioral link in this general equilibrium model constrain the out-comes in important ways not found in partial equilibrium analyses.
Our interest in the MENA countries required us to extend the GTAP7p3 database beyond the 93 countries and regions represented in it andto aggregate its 57 sectors into 26 sectors based on their importance inChina, India, and the MENA region (the 93 countries and regions in thedatabase included too much disaggregation outside and insufficient dis-aggregation within the MENA region). We retained all of the low- andmiddle-income countries identified within the MENA region, includingthe Arab Republic of Egypt, the Islamic Republic of Iran, Morocco, andTunisia. We separated Algeria, Israel, Jordan, Lebanon, and Syria out of thetwo GTAP regions representing the remainder of the MENA region—therest of North Africa (XNF) and the rest of West Asia (XWS). The result-ing database included eight low- and middle-income countries—Algeria,Egypt, Iran, Jordan, Lebanon, Morocco, Syria, and Tunisia—and a compositeenergy-rich “other MENA” region representing Iraq, Libya, the Republic ofYemen, and the Gulf Cooperation Council countries.
The separation procedure was based on bilateral trade and tariff datafrom MAcMaps; data on the three components of GDP (agriculture,industrial production, and services) from the World Bank’s WorldDevelopment Indicators (WDI) database; and data on imports andexports of services from the WDI database. The process of separationbegan with a domestic input-output structure for an individual countrythat mirrored the input-output structure of the relevant GTAP region.The data most critical for the analysis—such as the trade and protectiondata—were filled in directly from external sources. An optimization pro-gram filled in the remainder of the data, so that the structure of GDPapproximated the broad structure of the original economy and the totalvalue of GDP and the value of trade in each commodity equaled theobserved values. The structure of internal taxes in the original MENAregion was imposed on the newly separated countries. At the end of thisprocedure, the data for each country or region correctly reflected the sizeand the composition of its GDP, trade flows, and applied tariff rates—allessential properties for any trade-related policy study.
To examine the implications of more rapid growth in China and Indiaon the Middle East, we needed first to take account of some of the majorreforms that are transforming India’s trade structure, in particular liberal-ization of nonagricultural tariffs, improvements in infrastructure needed tosupport trade, and the introduction of duty drawbacks, which has removedthe burden of tariffs on intermediate inputs used in the production of
204 Ianchovichina, Ivanic, and Martin
exports. As in Dimaranan, Ianchovichina, and Martin (2007), we find thecorrelation between China’s and India’s exports of manufactures barelychanged in response to these key liberalization reforms in India. This find-ing suggests that India and China are likely to remain exporters of very dif-ferent sets of products and hence less likely to be subject to mutuallyadverse impacts from export expansion.
Next, we made a baseline projection to 2020, to allow for much higherexpected rates of growth in many developing countries than in themature industrial economies and a consequent greater impact of futurechanges in outcomes in developing countries. For comparability withDimaranan, Ianchovichina, and Martin (2007), we considered a 15-yearbaseline designed to replicate the widely used GTAP baseline projectionsfor labor force, human capital, and physical capital growth between 2005and 2020.7 Economywide rates of technical change were determinedendogenously in the model to ensure consistency between the exogenousvariable forecasts and the GDP growth forecasts that closely follow theWorld Bank GDP projections.
We examine the implications of higher-than-projected growth in Chinaand India to assess the direct implications of growth there on the MENAcountries. We assumed that growth rates in each region were 2 percent-age points a year higher than in the baseline. Over the 15-year baseline, thisresulted in output levels 34.6 percent higher in each region than under thebaseline scenario. Consistent with Kaldor’s (1957) stylized facts of eco-nomic growth, we increased the stock of human and physical capital in linewith overall output in these two growing economies. We allowed economy-wide productivity growth to adjust to maintain the targeted increase in therate of economic growth.
A second scenario examines the impact of additional growth supple-mented with an improvement in the quality and variety of exports, build-ing on recent evidence that suggests that economic growth of the typeconsidered in this chapter increases both the quality and the variety of thegoods exported by the growing economy.8 Using the quantity aggregatorand empirical estimates from Hummels and Klenow (2005), we specifythe reduction in effective prices associated with the combination ofincreases in variety and quality (this specification is discussed in detail inDimaranan, Ianchovichina, and Martin 2009).9 Improvements in the qual-ity of goods reduce the effective price of the goods at any given actualprice, as a smaller amount of each good is required to bring about the sameincrease in welfare. Where, as in this study, consumers value variety in theproducts they consume, an increase in the range of varieties available also
Economic Growth in China and India 205
reduces the effective price of the good at any given set of actual prices forthe goods.
Results
The effects on key variables of higher growth in China and India andhigher growth with increased variety and quality of exports are pre-sented for real incomes (welfare), export volumes, and terms-of-tradeeffects, using the standard estimate of the real income impacts of terms-of-trade changes that does not take into account second-best welfareeffects (table 8.2).10 For each variable, the effect depends on whether theincome increases in China and India result in intensive-margin growth ofthe same exports (“Growth”) or are accompanied by expansion in therange of products exported and improvements in their quality (“G&O”).Increases in real income are presented in percentage changes in equiva-lent variation, measured in 2004 dollars. Export expansion is presentedusing percentage changes in the volume of exports. The terms-of-tradeeffects are presented in 2004 dollars.
The welfare changes are expected to be largest for China and India,which benefit directly from their own growth. The gains for other coun-tries are relatively small in the absence of quality and variety improvementson exports from China and India. High-income countries gain, except EUmembers and Japan, which may lose in the growth-only scenario despiteterms-of-trade gains because of interactions between existing distortionsand changes in energy prices (see Martin, Ianchovichina, and Dimaranan2008). Many countries are expected to benefit from improved terms oftrade for their products, as China increases its imports by 28.5 percentand India increases its by 35.2 percent. Some middle- and low-incomecountries, such as the Republic of Korea, the Philippines, and countries inSouth Asia, are projected to lose, because competition with China andIndia in third markets negatively affects their terms of trade.
The improvement in the welfare of the MENA region as a whole, andin all MENA countries except Tunisia, is not associated with increases inexport volumes, except in specific cases, such as Lebanon. Oil-exportingcountries in the MENA region, represented by the “other MENA region,”experience large increases in welfare, associated with strong expectedimprovements in the prices of commodities they export. They will thusbe able to increase their consumption at any given volume of exports,reducing their need to export. Exporters of manufactures, such asLebanon and other developing countries, are expected to suffer from
206 Ianchovichina, Ivanic, and Martin

Table 8.2 Impacts of Extra Growth in China and India on Selected Economies(relative to 2020 baseline)
Region or economy
Growth G&Q
Growth G&Q Growth G&Q
EV (millions
of dollars) EV (percent)
EV (millions
of dollars) EV (percent)
Middle East and North AfricaAlgeria 2,871 1.3 3,206 1.5 –0.5 –0.6 2,435 2,695Egypt, Arab Rep. of 363 0.3 596 0.5 0.2 0.6 297 543Iran, Islamic Rep. of 2,460 0.9 3,239 1.2 0.2 1.7 2,119 2,856Jordan 864 1.2 1,067 1.5 –12.4 –14.6 261 454Lebanon 206 0.3 258 0.3 10.3 11.2 277 390Morocco 50 0.1 196 0.3 1.7 1.6 –18 144Syrian Arab Rep. 493 0.5 651 0.6 2.2 2.8 241 461Tunisia –57 –0.1 –58 –0.1 –0.5 –1.5 –31 33Other Middle East and North Africa 16,347 3.0 20,013 3.7 –1.6 –1.0 15,343 18,733MENA 23,593 1.5 29,168 1.9 –0.9 –0.4 20,923 26,309East and Southeast AsiaChina 1,033,330 28.9 1,111,113 31.1 33.3 60.9 –55,960 22,879Hong Kong, China; and Taiwan, China 2,553 0.4 9,350 1.3 1.4 3.2 2,959 9,578Indonesia 1,178 0.3 2,007 0.4 0.2 0.6 1,125 1,622Japan –1,177 0.0 6,653 0.1 3.1 5.5 2116 6,321Korea, Rep. of 4,750 0.4 11,586 1.0 3.5 5.7 –112 4,310Malaysia 2,669 1.2 5,323 2.4 –0.7 –0.6 2,118 3,399Philippines –472 –0.3 -191 –0.1 0.6 1.0 –415 –186Singapore –247 –0.1 1,878 1.0 1.8 3.2 476 2,361Thailand 409 0.1 2,050 0.4 1.2 2.4 121 1,268Vietnam 565 0.7 928 1.1 –0.5 –0.9 615 1,157Rest of Southeast Asia 450 1.9 599 2.5 –1.4 –1.9 442 583
Exports (percent)
Terms of trade (millions of dollars)
207
(continued)
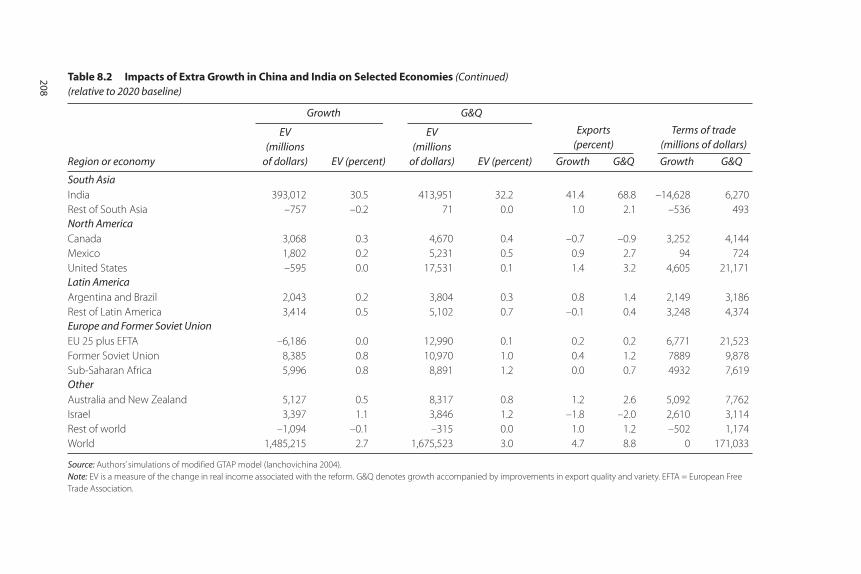
Table 8.2 Impacts of Extra Growth in China and India on Selected Economies(relative to 2020 baseline)
Region or economy
Growth G&Q
Growth G&Q Growth G&Q
EV (millions
of dollars) EV (percent)
EV (millions
of dollars) EV (percent)
South AsiaIndia 393,012 30.5 413,951 32.2 41.4 68.8 –14,628 6,270Rest of South Asia –757 –0.2 71 0.0 1.0 2.1 –536 493North AmericaCanada 3,068 0.3 4,670 0.4 –0.7 –0.9 3,252 4,144Mexico 1,802 0.2 5,231 0.5 0.9 2.7 94 724United States –595 0.0 17,531 0.1 1.4 3.2 4,605 21,171Latin AmericaArgentina and Brazil 2,043 0.2 3,804 0.3 0.8 1.4 2,149 3,186Rest of Latin America 3,414 0.5 5,102 0.7 –0.1 0.4 3,248 4,374Europe and Former Soviet UnionEU 25 plus EFTA –6,186 0.0 12,990 0.1 0.2 0.2 6,771 21,523Former Soviet Union 8,385 0.8 10,970 1.0 0.4 1.2 7889 9,878Sub-Saharan Africa 5,996 0.8 8,891 1.2 0.0 0.7 4932 7,619OtherAustralia and New Zealand 5,127 0.5 8,317 0.8 1.2 2.6 5,092 7,762Israel 3,397 1.1 3,846 1.2 –1.8 –2.0 2,610 3,114Rest of world –1,094 –0.1 –315 0.0 1.0 1.2 –502 1,174World 1,485,215 2.7 1,675,523 3.0 4.7 8.8 0 171,033
Source: Authors’ simulations of modified GTAP model (Ianchovichina 2004).Note: EV is a measure of the change in real income associated with the reform. G&Q denotes growth accompanied by improvements in export quality and variety. EFTA = European FreeTrade Association.
Exports(percent)
Terms of trade (millions of dollars)
208
(Continued)
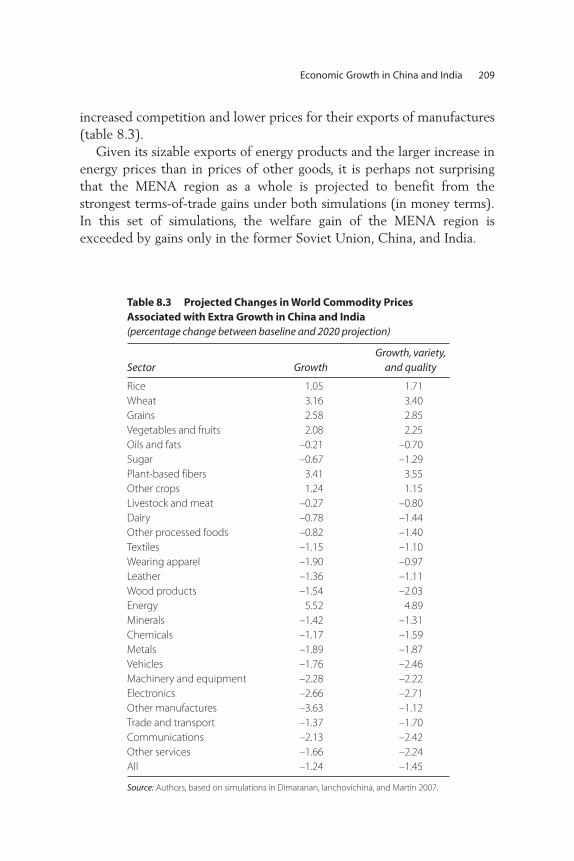
increased competition and lower prices for their exports of manufactures(table 8.3).
Given its sizable exports of energy products and the larger increase inenergy prices than in prices of other goods, it is perhaps not surprisingthat the MENA region as a whole is projected to benefit from thestrongest terms-of-trade gains under both simulations (in money terms).In this set of simulations, the welfare gain of the MENA region isexceeded by gains only in the former Soviet Union, China, and India.
Economic Growth in China and India 209
Table 8.3 Projected Changes in World Commodity Prices Associated with Extra Growth in China and India(percentage change between baseline and 2020 projection)
Sector GrowthGrowth, variety,
and quality
Rice 1.05 1.71Wheat 3.16 3.40Grains 2.58 2.85Vegetables and fruits 2.08 2.25Oils and fats –0.21 –0.70Sugar –0.67 –1.29Plant-based fibers 3.41 3.55Other crops 1.24 1.15Livestock and meat –0.27 –0.80Dairy –0.78 –1.44Other processed foods –0.82 –1.40Textiles –1.15 –1.10Wearing apparel –1.90 –0.97Leather –1.36 –1.11Wood products –1.54 –2.03Energy 5.52 4.89Minerals –1.42 –1.31Chemicals –1.17 –1.59Metals –1.89 –1.87Vehicles –1.76 –2.46Machinery and equipment –2.28 –2.22Electronics –2.66 –2.71Other manufactures –3.63 –1.12Trade and transport –1.37 –1.70Communications –2.13 –2.42Other services –1.66 –2.24All –1.24 –1.45
Source: Authors, based on simulations in Dimaranan, Ianchovichina, and Martin 2007.
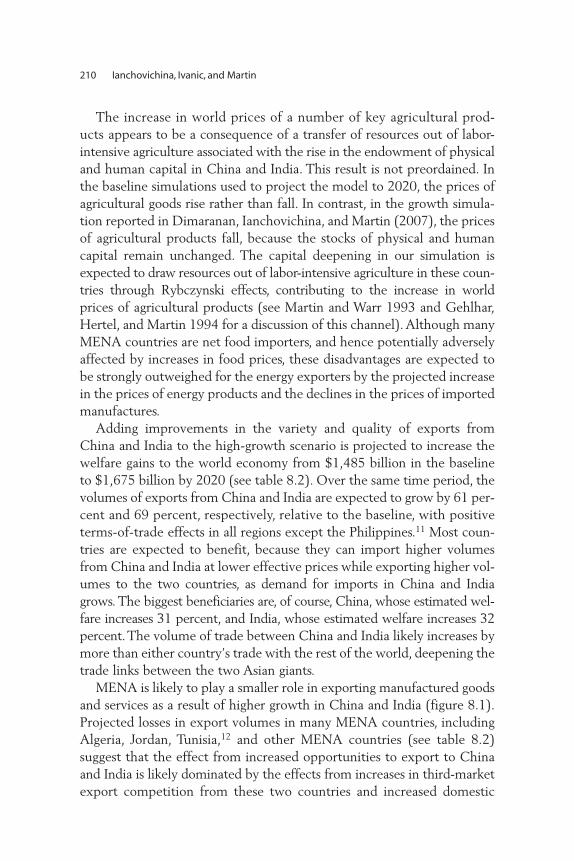
The increase in world prices of a number of key agricultural prod-ucts appears to be a consequence of a transfer of resources out of labor-intensive agriculture associated with the rise in the endowment of physicaland human capital in China and India. This result is not preordained. Inthe baseline simulations used to project the model to 2020, the prices ofagricultural goods rise rather than fall. In contrast, in the growth simula-tion reported in Dimaranan, Ianchovichina, and Martin (2007), the pricesof agricultural products fall, because the stocks of physical and humancapital remain unchanged. The capital deepening in our simulation isexpected to draw resources out of labor-intensive agriculture in these coun-tries through Rybczynski effects, contributing to the increase in worldprices of agricultural products (see Martin and Warr 1993 and Gehlhar,Hertel, and Martin 1994 for a discussion of this channel). Although manyMENA countries are net food importers, and hence potentially adverselyaffected by increases in food prices, these disadvantages are expected tobe strongly outweighed for the energy exporters by the projected increasein the prices of energy products and the declines in the prices of importedmanufactures.
Adding improvements in the variety and quality of exports fromChina and India to the high-growth scenario is projected to increase thewelfare gains to the world economy from $1,485 billion in the baselineto $1,675 billion by 2020 (see table 8.2). Over the same time period, thevolumes of exports from China and India are expected to grow by 61 per-cent and 69 percent, respectively, relative to the baseline, with positiveterms-of-trade effects in all regions except the Philippines.11 Most coun-tries are expected to benefit, because they can import higher volumesfrom China and India at lower effective prices while exporting higher vol-umes to the two countries, as demand for imports in China and Indiagrows. The biggest beneficiaries are, of course, China, whose estimated wel-fare increases 31 percent, and India, whose estimated welfare increases 32percent. The volume of trade between China and India likely increases bymore than either country’s trade with the rest of the world, deepening thetrade links between the two Asian giants.
MENA is likely to play a smaller role in exporting manufactured goodsand services as a result of higher growth in China and India (figure 8.1).Projected losses in export volumes in many MENA countries, includingAlgeria, Jordan, Tunisia,12 and other MENA countries (see table 8.2)suggest that the effect from increased opportunities to export to Chinaand India is likely dominated by the effects from increases in third-marketexport competition from these two countries and increased domestic
210 Ianchovichina, Ivanic, and Martin

demand resulting from improvements in the terms of trade. But the boostto China’s and India’s manufacturing industries is expected to createpositive spillover effects through increased demand for intermediateinputs, including minerals, energy, and farm-based natural resources.Indeed, exports of energy products will increase the most, followed byincreases in exports of farm products, and minerals.
Economic Growth in China and India 211
Figure 8.1 Projected Changes in Volume of Exports from the Middle East and North Africa Associated with Extra Growth in China and India
–4,000 –3,000 –2,000 –1,000 0 1,000
US$ millions
2,000 3,000 4,000 5,000 6,000 7,000
rice
wheat
grains
vegetables and fruits
oils and fats
sugar
plant-based fibers
other crops
livestock and meat
dairy
other processed food
energy
textiles
apparel
leather
wood products
minerals
chemicals
metals
vehicles
machinery and equipment
electronics
other manufactures
trade and transport
communication services
other services
Source: Authors, based on simulations of modified GTAP model (Ianchovichina 2004).Note: Figure shows changes in value between baseline and 2020.

The aggregate results conceal differences at the country level. The risein MENA’s mineral exports occurs because of strong export growth ofminerals and energy from Egypt, Iran, and other MENA countries (fig-ure 8.2). Strong export growth of metal products from countries in therest of the MENA region will likely be offset by a decline in exports ofmetal products from the countries shown in figure 8.2. Morocco andTunisia may expand exports of minerals and chemicals.
Exports of manufactures are projected to be hit hard in all countries. Forindustries in some countries, these effects could be substantial (figure 8.3).The declines are expected to be much smaller for industry outputs (seeannex table 8.A.3). Higher growth of exports from China implies anexpansion of its textile industry and a contraction of the textile industriesin all MENA countries except Tunisia. The projected growth of China’s
212 Ianchovichina, Ivanic, and Martin
Figure 8.2 Projected Changes in Volume of Resource-Based Manufactured ExportsAssociated with Extra Growth in China and India
–600
–400
–200
0
200
US$
mill
ion
s
400
600
800
Egypt, Ara
b Rep. of
Moro
cco
Tunisia
Algeria
rest
of MENA
Jord
an
Lebanon
Syrian A
rab Rep.
Iran, Is
lamic
Rep. of
metals minerals chemicals
Source: Authors, based on simulations of the modified GTAP model (Ianchovichina 2004). Note: Figure shows changes in value between baseline and 2020.
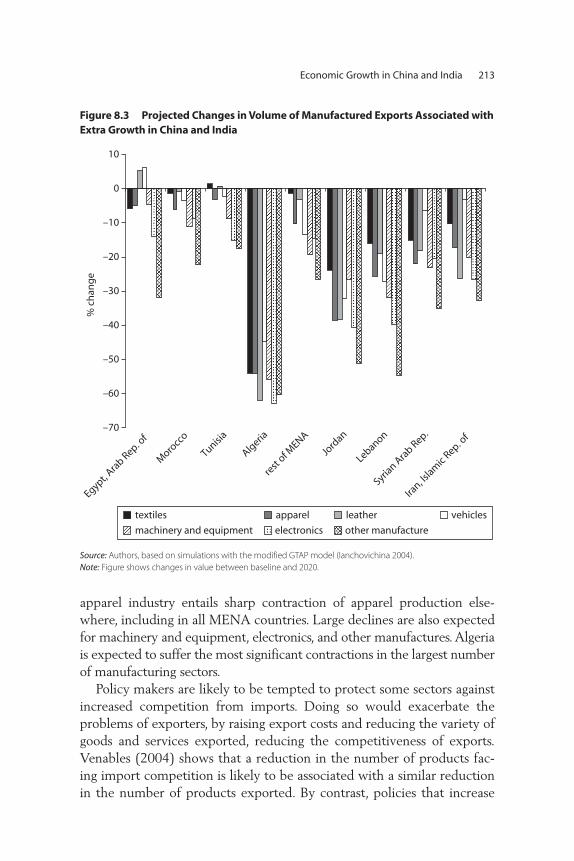
apparel industry entails sharp contraction of apparel production else-where, including in all MENA countries. Large declines are also expectedfor machinery and equipment, electronics, and other manufactures. Algeriais expected to suffer the most significant contractions in the largest numberof manufacturing sectors.
Policy makers are likely to be tempted to protect some sectors againstincreased competition from imports. Doing so would exacerbate theproblems of exporters, by raising export costs and reducing the variety ofgoods and services exported, reducing the competitiveness of exports.Venables (2004) shows that a reduction in the number of products fac-ing import competition is likely to be associated with a similar reductionin the number of products exported. By contrast, policies that increase
Economic Growth in China and India 213
Figure 8.3 Projected Changes in Volume of Manufactured Exports Associated withExtra Growth in China and India
–70
–60
–50
–40
–30
% c
han
ge
–20
–10
0
10
Egypt, Ara
b Rep. of
Moro
cco
Tunisia
Algeria
rest
of MENA
Jord
an
Lebanon
Syrian A
rab Rep.
Iran, Is
lamic
Rep. of
machinery and equipment electronics other manufacture
textiles apparel leather vehicles
Source: Authors, based on simulations with the modified GTAP model (Ianchovichina 2004).Note: Figure shows changes in value between baseline and 2020.
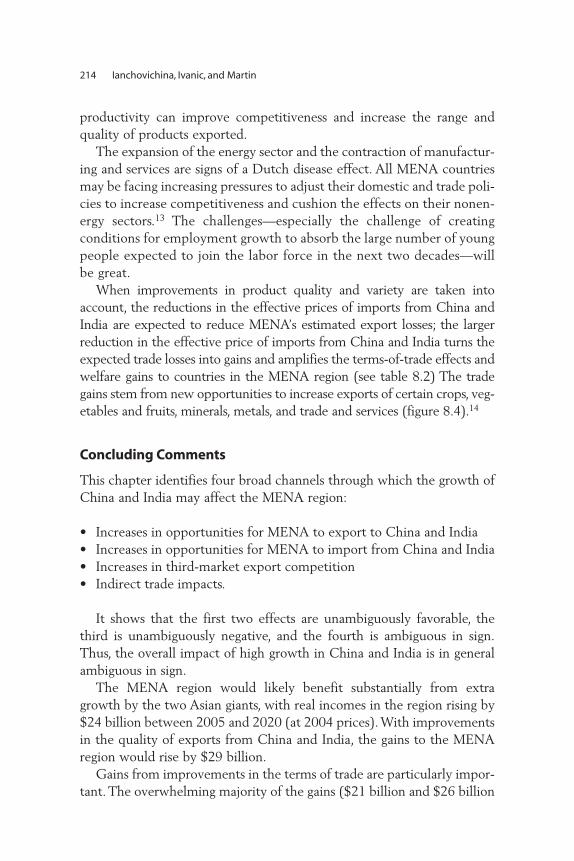
productivity can improve competitiveness and increase the range andquality of products exported.
The expansion of the energy sector and the contraction of manufactur-ing and services are signs of a Dutch disease effect. All MENA countriesmay be facing increasing pressures to adjust their domestic and trade poli-cies to increase competitiveness and cushion the effects on their nonen-ergy sectors.13 The challenges—especially the challenge of creatingconditions for employment growth to absorb the large number of youngpeople expected to join the labor force in the next two decades—willbe great.
When improvements in product quality and variety are taken intoaccount, the reductions in the effective prices of imports from China andIndia are expected to reduce MENA’s estimated export losses; the largerreduction in the effective price of imports from China and India turns theexpected trade losses into gains and amplifies the terms-of-trade effects andwelfare gains to countries in the MENA region (see table 8.2) The tradegains stem from new opportunities to increase exports of certain crops, veg-etables and fruits, minerals, metals, and trade and services (figure 8.4).14
Concluding Comments
This chapter identifies four broad channels through which the growth ofChina and India may affect the MENA region:
• Increases in opportunities for MENA to export to China and India• Increases in opportunities for MENA to import from China and India• Increases in third-market export competition• Indirect trade impacts.
It shows that the first two effects are unambiguously favorable, thethird is unambiguously negative, and the fourth is ambiguous in sign.Thus, the overall impact of high growth in China and India is in generalambiguous in sign.
The MENA region would likely benefit substantially from extragrowth by the two Asian giants, with real incomes in the region rising by$24 billion between 2005 and 2020 (at 2004 prices). With improvementsin the quality of exports from China and India, the gains to the MENAregion would rise by $29 billion.
Gains from improvements in the terms of trade are particularly impor-tant. The overwhelming majority of the gains ($21 billion and $26 billion
214 Ianchovichina, Ivanic, and Martin

Economic Growth in China and India 215
Figure 8.4 Projected Changes in Export Volumes Associated with Extra Growth in China and India under Growth and Growth and Quality Scenarios
–6,000 –4,000 –2,000 0 2,000 4,000 6,000 8,000
US$ millions
rice
wheat
grains
vegetables and fruits
oils and fats
sugar
plant-based fibers
other crops
livestock and meat
dairy
other processed food
energy
textiles
apparel
leather
wood products
minerals
chemicals
metals
vehicles
machinery and equipment
electronics
other manufactures
trade and transport
communication services
other services
growth and qualitygrowth
Source: Authors, based on simulations with the modified GTAP model (Ianchovichina 2004).Note: Figure shows changes in value between baseline and 2020.
under the two scenarios) accrues through improvements in the terms oftrade. These gains are associated with increases in the world prices ofenergy and some agricultural products. The prices of most agriculturalgoods increase, partly because of increased demand fueled by increasingincomes in China and India and partly because labor moves out of agri-culture in China and India into more capital and skill-intensive activities.

The volume of exports from the MENA region declines slightly.Exports of energy products and a few agricultural products increase, andexports of most manufactures and services decline. These effects reflectincreased competition in third markets and increased domestic demandresulting from the terms-of-trade improvements associated with thegrowth of China and India. Some countries, such as Algeria and Jordan,see relatively large reductions in their manufactured exports; others seeincreases in their exports of resource-based exports, such as metals andminerals.
Growth in China and India has mixed results for MENA.Improvements in the region’s terms of trade increase income, especiallywhen likely improvements in the quality and variety of exports fromChina and India are factored in. But increased competition in third mar-kets reduces the opportunities for MENA countries to expand theirexports of manufactures, causing exports of manufactures to decline insome cases. Finally, the expansion of the energy sector and the contrac-tion of manufacturing and services are signs of Dutch disease. All MENAcountries will face increasing pressures to adjust their domestic andtrade policies to increase competitiveness, cushion the effects on theirnonenergy sectors, and accommodate the large number of young peopleexpected to join the labor force in China and India in the next twodecades.
The following caveats are important to keep in mind. The results inthis chapter are based on thought experiments; they offer only the broad-est indications of likely effects rather than precise predictions. Theystrongly suggest that benefits will depend on adapting to the new oppor-tunities and challenges. The substantial adjustment costs of this economictransformation are not factored into the analysis. Finally, because thefocus is on the static trade aspects of growth in China and India, theanalysis ignores important link between investment and growth that mayamplify the effects discussed here and affect the welfare results.
216 Ianchovichina, Ivanic, and Martin
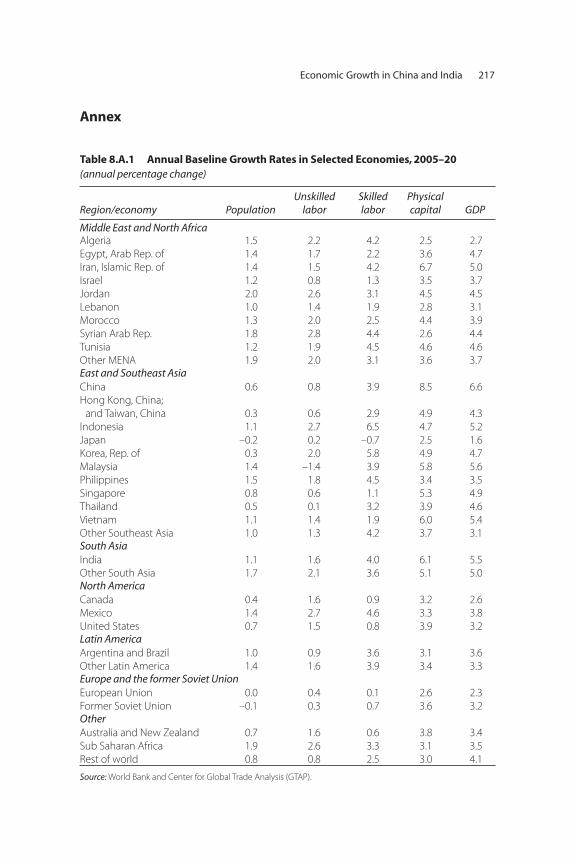
Economic Growth in China and India 217
Annex
Table 8.A.1 Annual Baseline Growth Rates in Selected Economies, 2005–20(annual percentage change)
Region/economy PopulationUnskilled
laborSkilledlabor
Physical capital GDP
Middle East and North AfricaAlgeria 1.5 2.2 4.2 2.5 2.7Egypt, Arab Rep. of 1.4 1.7 2.2 3.6 4.7Iran, Islamic Rep. of 1.4 1.5 4.2 6.7 5.0Israel 1.2 0.8 1.3 3.5 3.7Jordan 2.0 2.6 3.1 4.5 4.5Lebanon 1.0 1.4 1.9 2.8 3.1Morocco 1.3 2.0 2.5 4.4 3.9Syrian Arab Rep. 1.8 2.8 4.4 2.6 4.4Tunisia 1.2 1.9 4.5 4.6 4.6Other MENA 1.9 2.0 3.1 3.6 3.7East and Southeast AsiaChina 0.6 0.8 3.9 8.5 6.6Hong Kong, China;
and Taiwan, China 0.3 0.6 2.9 4.9 4.3Indonesia 1.1 2.7 6.5 4.7 5.2Japan –0.2 0.2 –0.7 2.5 1.6Korea, Rep. of 0.3 2.0 5.8 4.9 4.7Malaysia 1.4 –1.4 3.9 5.8 5.6Philippines 1.5 1.8 4.5 3.4 3.5Singapore 0.8 0.6 1.1 5.3 4.9Thailand 0.5 0.1 3.2 3.9 4.6Vietnam 1.1 1.4 1.9 6.0 5.4Other Southeast Asia 1.0 1.3 4.2 3.7 3.1South AsiaIndia 1.1 1.6 4.0 6.1 5.5Other South Asia 1.7 2.1 3.6 5.1 5.0North AmericaCanada 0.4 1.6 0.9 3.2 2.6Mexico 1.4 2.7 4.6 3.3 3.8United States 0.7 1.5 0.8 3.9 3.2Latin AmericaArgentina and Brazil 1.0 0.9 3.6 3.1 3.6Other Latin America 1.4 1.6 3.9 3.4 3.3Europe and the former Soviet UnionEuropean Union 0.0 0.4 0.1 2.6 2.3Former Soviet Union –0.1 0.3 0.7 3.6 3.2OtherAustralia and New Zealand 0.7 1.6 0.6 3.8 3.4Sub Saharan Africa 1.9 2.6 3.3 3.1 3.5Rest of world 0.8 0.8 2.5 3.0 4.1
Source: World Bank and Center for Global Trade Analysis (GTAP).
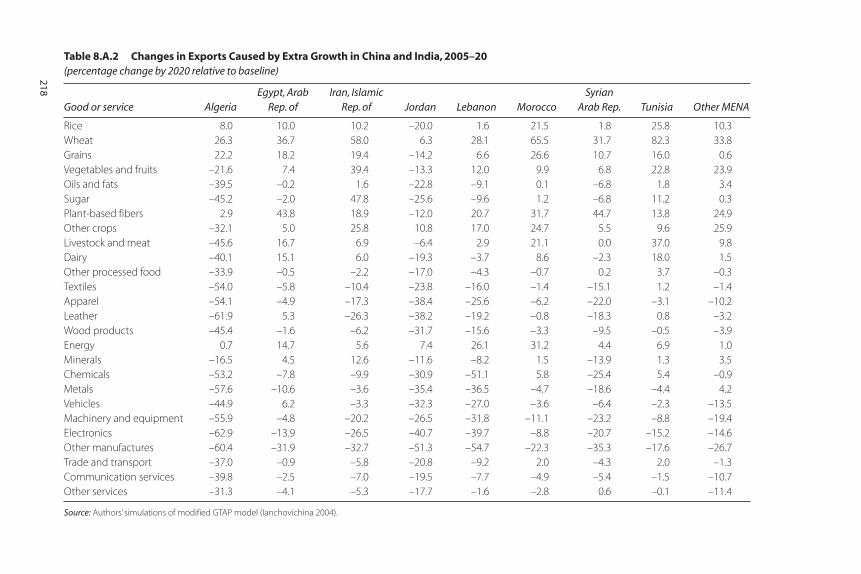
Table 8.A.2 Changes in Exports Caused by Extra Growth in China and India, 2005–20(percentage change by 2020 relative to baseline)
Good or service AlgeriaEgypt, Arab
Rep. ofIran, Islamic
Rep. of Jordan Lebanon MoroccoSyrian
Arab Rep. Tunisia Other MENA
Rice 8.0 10.0 10.2 –20.0 1.6 21.5 1.8 25.8 10.3Wheat 26.3 36.7 58.0 6.3 28.1 65.5 31.7 82.3 33.8Grains 22.2 18.2 19.4 –14.2 6.6 26.6 10.7 16.0 0.6Vegetables and fruits –21.6 7.4 39.4 –13.3 12.0 9.9 6.8 22.8 23.9Oils and fats –39.5 –0.2 1.6 –22.8 –9.1 0.1 –6.8 1.8 3.4Sugar –45.2 –2.0 47.8 –25.6 –9.6 1.2 –6.8 11.2 0.3Plant-based fibers 2.9 43.8 18.9 –12.0 20.7 31.7 44.7 13.8 24.9Other crops –32.1 5.0 25.8 10.8 17.0 24.7 5.5 9.6 25.9Livestock and meat –45.6 16.7 6.9 –6.4 2.9 21.1 0.0 37.0 9.8Dairy –40.1 15.1 6.0 –19.3 –3.7 8.6 –2.3 18.0 1.5Other processed food –33.9 –0.5 –2.2 –17.0 –4.3 –0.7 0.2 3.7 –0.3Textiles –54.0 –5.8 –10.4 –23.8 –16.0 –1.4 –15.1 1.2 –1.4Apparel –54.1 –4.9 –17.3 –38.4 –25.6 –6.2 –22.0 –3.1 –10.2Leather –61.9 5.3 –26.3 –38.2 –19.2 –0.8 –18.3 0.8 –3.2Wood products –45.4 –1.6 –6.2 –31.7 –15.6 –3.3 –9.5 –0.5 –3.9Energy 0.7 14.7 5.6 7.4 26.1 31.2 4.4 6.9 1.0Minerals –16.5 4.5 12.6 –11.6 –8.2 1.5 –13.9 1.3 3.5Chemicals –53.2 –7.8 –9.9 –30.9 –51.1 5.8 –25.4 5.4 –0.9Metals –57.6 –10.6 –3.6 –35.4 –36.5 –4.7 –18.6 –4.4 4.2Vehicles –44.9 6.2 –3.3 –32.3 –27.0 –3.6 –6.4 –2.3 –13.5Machinery and equipment –55.9 –4.8 –20.2 –26.5 –31.8 –11.1 –23.2 –8.8 –19.4Electronics –62.9 –13.9 –26.5 –40.7 –39.7 –8.8 –20.7 –15.2 –14.6Other manufactures –60.4 –31.9 –32.7 –51.3 –54.7 –22.3 –35.3 –17.6 –26.7Trade and transport –37.0 –0.9 –5.8 –20.8 –9.2 2.0 –4.3 2.0 –1.3Communication services –39.8 –2.5 –7.0 –19.5 –7.7 –4.9 –5.4 –1.5 –10.7Other services –31.3 –4.1 –5.3 –17.7 –1.6 –2.8 0.6 –0.1 –11.4
Source: Authors’ simulations of modified GTAP model (Ianchovichina 2004).
218

219
Table 8.A.3 Changes in Output Caused by Extra Growth in China and India, 2005–20(percentage change by 2020 relative to baseline)
Good or service AlgeriaEgypt, Arab
Rep. ofIran, Islamic
Rep. of Jordan Lebanon MoroccoSyrian
Arab Rep. Tunisia Other MENA
Rice 1.5 2.0 0.5 0.6 –1.2 –0.3 0.2 4.1 6.6Wheat –5.7 4.6 1.0 0.6 –0.5 3.9 0.6 4.6 10.0Grains 1.9 0.9 0.5 1.1 –0.7 1.0 0.7 3.6 1.3Vegetables and fruits 0.2 0.7 2.8 0.5 –0.1 3.0 0.3 1.4 10.0Oils and fats 0.8 –0.1 –0.9 –1.5 –0.8 0.4 0.0 1.8 3.2Sugar –9.6 –0.4 4.1 0.8 –1.2 –0.2 –0.7 0.7 0.3Plant-based fibers –2.0 10.5 0.4 –0.4 1.2 2.0 43.7 3.1 24.4Other crops –9.7 2.6 1.6 –0.3 0.1 6.7 0.3 3.9 25.4Livestock and meat –4.1 0.8 0.1 1.9 –0.4 –0.2 0.4 0.0 0.4Dairy –14.0 0.5 0.5 –0.7 –0.8 0.0 0.3 0.0 0.5Other processed food –0.5 –0.2 0.2 –1.2 –0.9 –0.3 0.2 0.5 0.4Textiles –20.4 –1.8 –6.4 –22.9 –2.5 –2.4 –2.2 –0.3 0.5Apparel 1.0 –1.2 –3.8 –23.2 –3.1 –4.7 –0.6 –2.9 –7.7Leather –10.5 0.9 –9.1 –1.5 –0.1 –0.6 –1.1 0.4 –2.4Wood products –2.7 –0.4 –2.8 –0.4 0.1 –1.1 –0.1 –0.3 0.0Energy 0.6 2.0 1.7 2.2 2.9 14.6 0.2 1.9 0.8Minerals –1.8 0.9 1.2 –0.2 –1.2 0.3 –0.6 0.4 2.9Chemicals –15.9 –3.6 –7.7 –10.8 –5.7 1.5 –3.2 2.8 –1.2Metals –12.4 –5.1 –4.5 –4.1 –9.2 –4.5 –2.7 –2.9 2.3Vehicles –23.0 0.8 –2.1 –0.1 –5.7 –1.4 0.2 –1.8 –13.5Machinery and equipment –26.8 –5.0 –8.8 –5.2 –8.7 –7.6 –14.2 –8.3 –16.3Electronics –2.4 –3.2 –5.4 –11.1 –0.1 –8.5 –1.6 –8.8 –13.8Other manufactures –0.2 –9.0 –5.0 –0.8 –2.8 –5.6 –0.7 –10.5 –21.4Trade and transport 0.3 –0.3 –0.5 0.6 –1.2 0.0 0.1 –0.3 –0.2Communication services 0.7 –1.0 –0.1 0.4 0.4 –2.0 0.4 –0.4 –4.8Other services 1.2 –0.3 0.4 1.3 0.1 –0.1 0.2 0.0 1.6
Source: Authors’ simulations of modified GTAP model (Ianchovichina 2004).
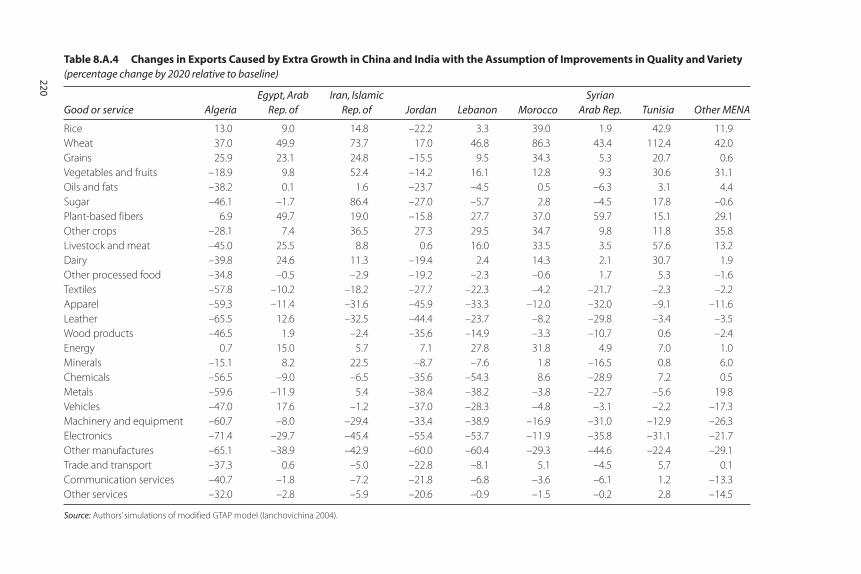
220
Table 8.A.4 Changes in Exports Caused by Extra Growth in China and India with the Assumption of Improvements in Quality and Variety(percentage change by 2020 relative to baseline)
Good or service AlgeriaEgypt, Arab
Rep. ofIran, Islamic
Rep. of Jordan Lebanon MoroccoSyrian
Arab Rep. Tunisia Other MENA
Rice 13.0 9.0 14.8 –22.2 3.3 39.0 1.9 42.9 11.9Wheat 37.0 49.9 73.7 17.0 46.8 86.3 43.4 112.4 42.0Grains 25.9 23.1 24.8 –15.5 9.5 34.3 5.3 20.7 0.6Vegetables and fruits –18.9 9.8 52.4 –14.2 16.1 12.8 9.3 30.6 31.1Oils and fats –38.2 0.1 1.6 –23.7 –4.5 0.5 –6.3 3.1 4.4Sugar –46.1 –1.7 86.4 –27.0 –5.7 2.8 –4.5 17.8 –0.6Plant-based fibers 6.9 49.7 19.0 –15.8 27.7 37.0 59.7 15.1 29.1Other crops –28.1 7.4 36.5 27.3 29.5 34.7 9.8 11.8 35.8Livestock and meat –45.0 25.5 8.8 0.6 16.0 33.5 3.5 57.6 13.2Dairy –39.8 24.6 11.3 –19.4 2.4 14.3 2.1 30.7 1.9Other processed food –34.8 –0.5 –2.9 –19.2 –2.3 –0.6 1.7 5.3 –1.6Textiles –57.8 –10.2 –18.2 –27.7 –22.3 –4.2 –21.7 –2.3 –2.2Apparel –59.3 –11.4 –31.6 –45.9 –33.3 –12.0 –32.0 –9.1 –11.6Leather –65.5 12.6 –32.5 –44.4 –23.7 –8.2 –29.8 –3.4 –3.5Wood products –46.5 1.9 –2.4 –35.6 –14.9 –3.3 –10.7 0.6 –2.4Energy 0.7 15.0 5.7 7.1 27.8 31.8 4.9 7.0 1.0Minerals –15.1 8.2 22.5 –8.7 –7.6 1.8 –16.5 0.8 6.0Chemicals –56.5 –9.0 –6.5 –35.6 –54.3 8.6 –28.9 7.2 0.5Metals –59.6 –11.9 5.4 –38.4 –38.2 –3.8 –22.7 –5.6 19.8Vehicles –47.0 17.6 –1.2 –37.0 –28.3 –4.8 –3.1 –2.2 –17.3Machinery and equipment –60.7 –8.0 –29.4 –33.4 –38.9 –16.9 –31.0 –12.9 –26.3Electronics –71.4 –29.7 –45.4 –55.4 –53.7 –11.9 –35.8 –31.1 –21.7Other manufactures –65.1 –38.9 –42.9 –60.0 –60.4 –29.3 –44.6 –22.4 –29.1Trade and transport –37.3 0.6 –5.0 –22.8 –8.1 5.1 –4.5 5.7 0.1Communication services –40.7 –1.8 –7.2 –21.8 –6.8 –3.6 –6.1 1.2 –13.3Other services –32.0 –2.8 –5.9 –20.6 –0.9 –1.5 –0.2 2.8 –14.5
Source: Authors’ simulations of modified GTAP model (Ianchovichina 2004).
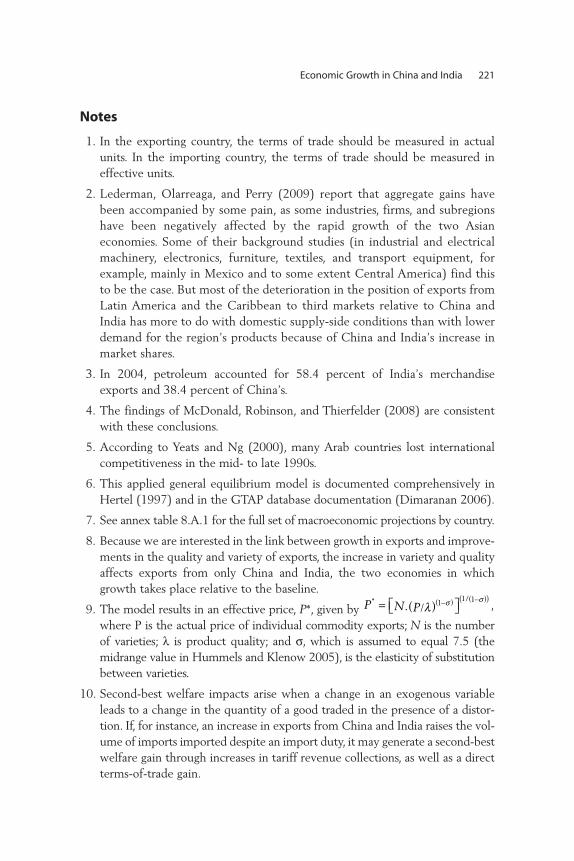
Notes
1. In the exporting country, the terms of trade should be measured in actualunits. In the importing country, the terms of trade should be measured ineffective units.
2. Lederman, Olarreaga, and Perry (2009) report that aggregate gains havebeen accompanied by some pain, as some industries, firms, and subregionshave been negatively affected by the rapid growth of the two Asianeconomies. Some of their background studies (in industrial and electricalmachinery, electronics, furniture, textiles, and transport equipment, forexample, mainly in Mexico and to some extent Central America) find thisto be the case. But most of the deterioration in the position of exports fromLatin America and the Caribbean to third markets relative to China andIndia has more to do with domestic supply-side conditions than with lowerdemand for the region’s products because of China and India’s increase inmarket shares.
3. In 2004, petroleum accounted for 58.4 percent of India’s merchandiseexports and 38.4 percent of China’s.
4. The findings of McDonald, Robinson, and Thierfelder (2008) are consistentwith these conclusions.
5. According to Yeats and Ng (2000), many Arab countries lost internationalcompetitiveness in the mid- to late 1990s.
6. This applied general equilibrium model is documented comprehensively inHertel (1997) and in the GTAP database documentation (Dimaranan 2006).
7. See annex table 8.A.1 for the full set of macroeconomic projections by country.
8. Because we are interested in the link between growth in exports and improve-ments in the quality and variety of exports, the increase in variety and qualityaffects exports from only China and India, the two economies in whichgrowth takes place relative to the baseline.
9. The model results in an effective price, P*, given by where P is the actual price of individual commodity exports; N is the numberof varieties; λ is product quality; and σ, which is assumed to equal 7.5 (themidrange value in Hummels and Klenow 2005), is the elasticity of substitutionbetween varieties.
10. Second-best welfare impacts arise when a change in an exogenous variableleads to a change in the quantity of a good traded in the presence of a distor-tion. If, for instance, an increase in exports from China and India raises the vol-ume of imports imported despite an import duty, it may generate a second-bestwelfare gain through increases in tariff revenue collections, as well as a directterms-of-trade gain.
P N P* /
,= . / − −λ σ σ( )⎡⎣ ⎤⎦
( ) ( )( )1 1 1
Economic Growth in China and India 221

222 Ianchovichina, Ivanic, and Martin
11. In the model with product quality–augmenting technical change, because theprice of relevance to the importer is the effective price, which may fall whenquality and variety increase, and the price relevant to the producer is theactual price, which rises when quality and variety increase, it is possible forthe terms of trade to improve for both importer and exporter.
12. Accounting for a quarter of its GDP, Tunisia’s industrial sector is large com-pared with the industrial sector of its neighbor Algeria. The sector producesmainly clothing and footwear, car parts, and electric machinery. All theseproducts are likely to face increased competition from China and India inthird markets, including in Tunisia’s main export market, the EuropeanUnion. As a result, the third-market competition effect is likely to dominatethe other likely effects discussed in this chapter. By contrast, the backbone ofAlgeria’s economy is the fossil fuel energy sector, which accounts for roughlya third of GDP and more than 90 percent of export earnings. As a result ofthe importance of this sector, the welfare gain is large, despite sizable contrac-tion in manufactured exports. The welfare gain is dominated by the improve-ment in the terms of trade associated with increases in energy prices.
13. Detailed results by commodity and country for export and output changesbecause of high growth in China and India are available in annex tables 8.A.2and 8.A.3.
14. Detailed results by commodity and country for export changes because ofimprovements in variety and quality in China and India are shown in annextables 8.A.4.
References
Abdel-Khalek, G., and K. Korayem. 2007. “The Impact of China on the MiddleEast.” Journal of Developing Societies 23 (4): 397–434.
Amiti, M., and C. Freund. 2008. “An Anatomy of China’s Export Growth.” PolicyResearch Working Paper 4628, World Bank, Washington, DC. http://go.worldbank.org/7ZK4OUMAO0.
Amiti, M., and J. Konings. 2007. “Trade Liberalization, Intermediate Inputs, andProductivity: Evidence from Indonesia.” American Economic Review 97 (5):1611–38.
Ando, M., and F. Kimura. 2003. “The Formation of International Production andDistribution Networks in East Asia.” Working Paper 10167, National Bureauof Economic Research, Cambridge, MA.
Branstetter, L., and N. Lardy. 2006. “China’s Embrace of Globalization.” WorkingPaper 12373, National Bureau of Economic Research, Cambridge, MA.
Broadman, H. 2007. Africa’s Silk Road: China and India’s New Economic Frontier.Washington, DC: World Bank.
DDP (Development Data Platform) (database). World Bank, Washington, DC.http://go.worldbank.org/DNBRRS9TB0.
Devlin, R., A. Estevadeordal, and A. Rodríguez-Clare. 2006. “The Emergence ofChina: Opportunities and Challenges for Latin America and the Caribbean.”David Rockefeller Center, Harvard University, Cambridge, MA.
DFID (Department for International Development). 2005. “The Effect of Chinaand India’s Growth and Trade Liberalisation on Poverty in Africa.” DCP 70,Final Report, DFID London.
Dimaranan, B. V., ed. 2006. Global Trade, Assistance, and Production: The GTAP6 Data Base. Lafayette, IN: Center for Global Trade Analysis, PurdueUniversity.
Dimaranan, B., E. Ianchovichina, and W. Martin. 2007. “Competing with Giants:Who Wins, Who Loses?” In Dancing with Giants: China, India and the GlobalEconomy, ed. L. A. Winters and S. Yusuf. Washington, DC, and Singapore:World Bank and Institute of Policy Studies.
———. 2009. “How Will Growth in China and India Affect the World Economy?”Review of World Economics 145 (3): 551–71.
Evenett, S., and A. Venables. 2002. “Export Growth in Developing Countries:Market Entry and Bilateral Trade Flows.” Working Paper, http://www.alexandria.unisg.ch/publications/22177.
Freund, C., and C. Ozden. 2009. “The Effect of China’s Exports on LatinAmerican Trade with the World.” In China’s and India’s Challenge to LatinAmerica, Opportunity or Threat? ed. D. Lederman, M. Olarreaga, and G. Perry.Washington, DC: World Bank.
Gaulier, G., F. Lemoine, and D. Unal-Kesenci. 2004. China’s Integration in AsianProduction Networks and Its Implications. Discussion Paper 04–E–033, ResearchInstitute of Economy, Trade and Industry, Tokyo. www.rieti.go.jp.
Gehlhar, M., T. Hertel, and W. Martin. 1994. “Economic Growth and theChanging Structure of Trade and Production in the Pacific Rim.” AmericanJournal of Agricultural Economics 76 (5): 1011–110.
Goldstein, A., N. Pinaud, H. Reisen, and X. Chen. 2006. The Rise of China andIndia: What’s in It for Africa? Paris: OECD Development Centre.
Hanson, G., and R. Robertson. 2009. “China and the Recent Evolution of LatinAmerica’s Manufacturing Exports.” In China and India’s Challenge to LatinAmerica: Opportunity or Threat? ed. D. Lederman, M. Olarreaga, and G. Perry.Washington, DC: World Bank.
Hertel, T. W., ed. 1997. Global Trade Analysis, Modeling and Applications.Cambridge U.K.: Cambridge University Press.
Hummels, D., and P. Klenow. 2005. “The Variety and Quality of a Nation’sExports.” American Economic Review 95 (3): 704–23.
Economic Growth in China and India 223
Ianchovichina, E. 2004. “Trade Policy Analysis in the Presence of DutyDrawbacks.” Journal of Policy Modeling 26: 353–71.
Ianchovichina, E., M. Ivanic, and W. Martin. 2008. “The Growth of China andIndia: Implications for the Other Asian Giant: Russia.” Policy ResearchWorking Paper 5065, World Bank, Washington, DC. http://go.worldbank.org/5U2UEULSU0.
Jenkins, R., and C. Edwards. 2006. “The Asian Drivers and Sub-Saharan Africa.”IDS Bulletin 37 (1): 23–32.
Kaldor, N. 1957. “A Model of Economic Growth.” Economic Journal 67 (268):591–624.
Lall, S., and J. Weiss. 2004. “China’s Competitive Threat to Latin America: AnAnalysis for 1990–2002.” Queen Elizabeth House Working Paper 120,University of Oxford, United Kingdom.
Lederman, D., M. Olarreaga, and G. Perry, eds. 2009. China and India’s Challengeto Latin America, Opportunity or Threat? Washington, DC: World Bank.
Martin, W. 1993. “The Fallacy of Composition and Developing Country Exportsof Manufactures.” World Economy 16 (2): 159–72.
Martin, W., E. Ianchovichina, and B. Dimaranan. 2008. “Economic Developmentin Emerging Asian Markets: Implications for Europe.” European Review ofAgricultural Economics 35 (3): 303–30.
Martin, W., and P. Warr. 1993. “Explaining the Relative Decline of Agriculture:A Supply-Side Analysis for Indonesia.” World Bank Economic Review 7 (3):381–401.
McDonald, S., S. Robinson, and K. Thierfelder. 2008. “Asian Growth and TradePoles: India, China, and East and Southeast Asia.” World Development 36 (2):210–34.
Rodrik, D. 2006. “What’s So Special about China’s Exports?” China and the WorldEconomy 14 (5): 1–19.
Schott, P. 2008. “The Relative Sophistication of Chinese Exports.” Economic Policy23 (53): 5–49.
Shalizi, Z. 2007. “Energy and Emissions: Local and Global Effects of the Giants’Rise.” In Dancing with Giants: China, India and the Global Economy, ed.L. A. Winters, and S. Yusuf. Washington, DC, and Singapore: World Bank andInstitute of Policy Studies.
Stevens, C., and J. Kennan. 2006. “How to Identify The Trade Impact of China onSmall Countries.” Institute of Development Studies Bulletin 37 (1): 33–42.
Venables, A. 2004. “Small, Remote, and Poor?” World Trade Review 3 (3): 453–57.
Winters, L. A., and S. Yusuf. 2007. “Introduction: Dancing with Giants.” In Dancingwith Giants: China, India and the Global Economy, ed. L. A. Winters, and
224 Ianchovichina, Ivanic, and Martin

S. Yusuf. Washington, DC, and Singapore: World Bank and Institute of PolicyStudies.
World Bank. 2003. Global Economic Prospects and the Developing Countries 2004.Washington, DC: World Bank.
Yeats, A., and F. Ng. 2000. “Beyond the Year 2000: Implications of the MiddleEast’s Recent Trade Performance.” In Catching up with the Competition:Opportunities and Threats for Arab Countries, ed. B. Hoekman and J. Zarrouk.Ann Arbor: University of Michigan Press.
Yusuf, S., K. Nabeshima, and D. Perkins. 2007. “China and India Reshape GlobalIndustrial Geography.” In Dancing with Giants: China, India and the GlobalEconomy, ed. L. A. Winters, and S. Yusuf. Washington, DC, and Singapore:World Bank and Institute of Policy Studies.
Economic Growth in China and India 225

227
The countries of the Middle East and North Africa (MENA) face grow-ing competition—and opportunities—from the rise of China and Indiaand changes in the structure of global trade. The share of China andIndia in global exports increased from about 2 percent in 1985 to morethan 5 percent in 1995 and 11.5 percent in 2005. Although China andIndia have intensified competition in global markets, they also provideadditional sources of demand. This increased demand provides newopportunities for MENA country exports and a chance to reducereliance on traditional but slow-growing markets in the EuropeanUnion (EU) and the United States.
The rise of China and India has occurred in tandem with the grow-ing importance of global production chains and the growth of trade inservices, fueled by technological change and declining transport andtelecommunication costs. Although they offer new routes to export andgrowth, these developments have increased the premium on access to low-cost inputs. Firms that have to pay more for their key inputs, including
C H A P T E R 9
Globalization and Competitionfrom China and India: PolicyResponses in the Middle East andNorth Africa
Paul Brenton, Lulu Shui, and Peter Walkenhorst
those related to backbone services, will find it increasingly difficult tointegrate into production chains or compete in global markets.
The international policy framework in which MENA countries arecompeting is evolving, with long-standing preferences in major marketseroding. At the same time, possibilities are arising from new agreementsand the opportunity to deepen existing arrangements.
This chapter examines whether the increase in competition from twomassive economic entities and changes to the nature of the global econ-omy call for radical changes in MENA countries’ trade policies or whetherthese changes reinforce existing trade policy imperatives. A key issue incoming to a judgment on appropriate policy responses to these new chal-lenges and opportunities is the size and nature of the adjustment that isrequired. Is competition from China and India leading to substantial dis-placement of resources that incur significant costs while moving to newactivities, or are there opportunities to exploit finer patterns of specializa-tion that entail less disruption? Will policies that mitigate the impact ofcompetition from China and India limit the longer-term capacity toexploit new opportunities in the global market?
Globalization and the Export Performance of Countries in the Middle East and North Africa
Some countries in the region have been successful in expanding exportsand increasing global market share in the face of increasing competitionfrom China and India; others have seen their global market share stagnateor decline (table 9.1). Between 1995 and 2006, when competition inglobal markets from India and especially China intensified, the ArabRepublic of Egypt, the Islamic Republic of Iran, and Jordan increasedtheir share of a growing market. In contrast, Morocco saw its share of theglobal market decline.
The importance of the European Union as a destination for MENAexports has diminished. In 1995, the European Union was the dominantmarket for exports by the Maghreb countries, accounting for at leastthree-quarters of exports. The EU market accounted for about half ofexports by Egypt, Iran, and the Syrian Arab Republic (table 9.2). By 2006,the European Union’s share had fallen in every country except theRepublic of Yemen and exceeded 50 percent in only three countries(Algeria, Morocco, and Tunisia).
MENA countries’ performance in exporting to the European Unionhas been mixed. Members of the Gulf Cooperation Council (GCC) saw
228 Brenton, Shui, and Walkenhorst

Globalization and Competition from China and India 229
Table 9.1 Rate of Export Growth and Change in Global Market Share in the MiddleEast and North Africa, by Country, 1995–2006
CountryAverage export growth
rate (%)Change in share of world
export (percentage points)
Algeria 10.8 0.00Egypt, Arab Rep. of 13.5 0.05Iran, Islamic Rep. of 11.6 0.03Jordan 16.1 0.02Lebanon 12.4 0.01Morocco 6.4 –0.02Syrian Arab Republic 8.3 0.00Tunisia 7.4 0.00Yemen, Rep. of 19.1 0.00Gulf Cooperation Council 15.0 0.31China 16.8 7.13India 14.2 0.37
Source: Authors’ calculations, based on UN Comtrade data. Note: Data exclude mineral fuels, ships, and planes.
Table 9.2 Growth in Exports to and Change in Market Share of European Union, by Country, 1995–2006
CountryAverage exportgrowth rate (%)
Change in share of EU market (percentage
points)
EU share oftotal exports,
1995 (%)
EU share oftotal exports,
2006 (%)
Algeria 8.5 0.0 78.9 66.1Egypt, Arab Rep. of 9.7 — 52.8 39.5Iran, Islamic Rep. of 3.8 — 56.0 29.4Jordan 4.4 0.0 19.8 6.7Lebanon 5.5 0.0 25.7 16.0Morocco 5.0 — 76.0 66.9Syrian
Arab Republic 2.4 0.0 44.6 26.2Tunisia 7.0 — 87.3 84.6Yemen, Rep. of 19.1 0.0 11.6 18.5Gulf Cooperation
Council 12.8 0.1 20.1 18.2China 20.1 5.1 14.8 20.5India 9.2 0.2 34.9 27.1Turkey 13.0 0.6 66.3 60.8
Source: Authors’ calculations, based on UN Comtrade data. Note: Data exclude mineral fuels, ships, and planes. — = Negligible.
their share of the EU market substantially increase; Egypt and Tunisia sawa more modest increase; and Iran, Morocco, and Syria experienceddeclines. Egypt, Tunisia, and the GCC, together with Turkey, increasedtheir share of the EU market while reducing the proportion of theirexports to the European Union, demonstrating strong export perform-ance in the European Union together with export market diversification.In contrast, most countries saw their share of the EU market fall orremain unchanged and the importance of the European Union as a mar-ket for exports decline.
The decline in the importance of the European Union as a market forMENA’s exports has coincided with increasing competition from Chinaand India. The following discussion takes a deeper look at the drivers ofexport growth, with a focus on the EU market.
Export growth in MENA countries has tended to be driven by theextensive margin (that is, changes that are the result of new export flows,where an export flow measures exports of a particular product to a par-ticular market). Only in Jordan and Tunisia is the contribution of theintensive margin (that is, growth related to changes in export flows thatexisted in 1995) greater than that of the extensive margin (table 9.3).
The importance of the extensive margin for these countries contrastswith that of other countries of similar income levels, where the intensivemargin has been more dominant in driving export growth (Brenton andNewfarmer 2007; Amurgo-Pacheco and Pierola 2008). On average forthe period 1995–2004, the extensive margin contributed just 17 percentof the export growth of lower-middle-income countries (32 percent ifChina is excluded) and 24 percent of the growth of higher-middle-income countries.
Declining flows of existing goods to existing markets have been a dragon export growth. Had countries been able to maintain the level of exist-ing export flows that actually declined or disappeared, export growthwould have been more than 30 percent higher for Egypt, 40 percenthigher for Tunisia, and 60 percent higher for Morocco. For the averageupper-middle-income country, the decline and disappearance of existingexports reduced export growth by 27 percent. Thus, an important factorbehind the dominance of the extensive margin in MENA appears to bethe magnitude of decline in existing flows.
A more detailed analysis of the key products and markets that havedriven changes in the intensive and extensive margins—and comparisonof those data with data on the change in China’s share of the world mar-ket for each product (see annex tables 9.A.1 and 9.A.2)—suggests a
230 Brenton, Shui, and Walkenhorst
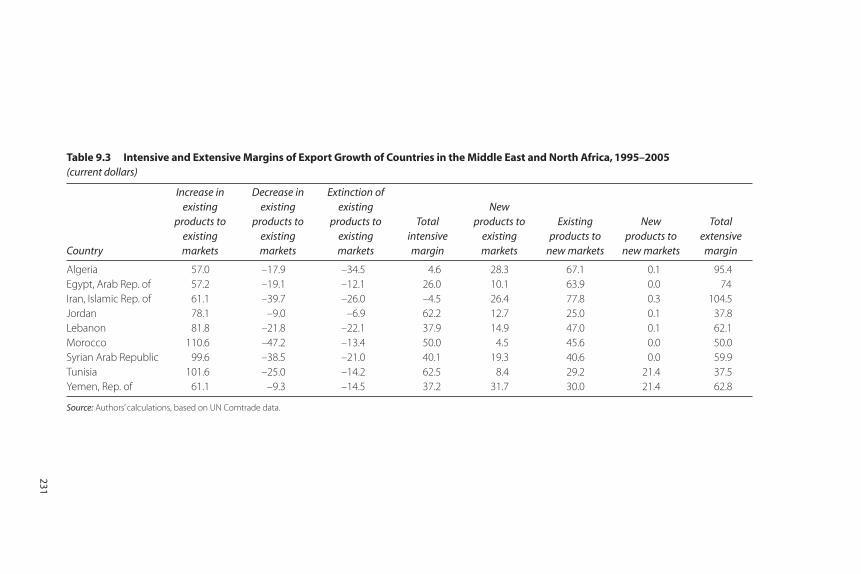
Table 9.3 Intensive and Extensive Margins of Export Growth of Countries in the Middle East and North Africa, 1995–2005(current dollars)
Country
Increase inexisting
products toexisting markets
Decrease inexisting
products toexisting markets
Extinction ofexisting
products toexisting markets
Total intensive margin
New products to
existing markets
Existing products to
new markets
New products to
new markets
Total extensive
margin
Algeria 57.0 –17.9 –34.5 4.6 28.3 67.1 0.1 95.4Egypt, Arab Rep. of 57.2 –19.1 –12.1 26.0 10.1 63.9 0.0 74Iran, Islamic Rep. of 61.1 –39.7 –26.0 –4.5 26.4 77.8 0.3 104.5Jordan 78.1 –9.0 –6.9 62.2 12.7 25.0 0.1 37.8Lebanon 81.8 –21.8 –22.1 37.9 14.9 47.0 0.1 62.1Morocco 110.6 –47.2 –13.4 50.0 4.5 45.6 0.0 50.0Syrian Arab Republic 99.6 –38.5 –21.0 40.1 19.3 40.6 0.0 59.9Tunisia 101.6 –25.0 –14.2 62.5 8.4 29.2 21.4 37.5Yemen, Rep. of 61.1 –9.3 –14.5 37.2 31.7 30.0 21.4 62.8
Source: Authors’ calculations, based on UN Comtrade data.
231
rather nuanced view of export performance and the impact of China.First, for a number of countries, the key products that have driven growthat the intensive margin have also been responsible for declining exports.In Tunisia, for example, the same product group—men’s and boy’s cottontrousers—is at the top of both the list of existing products that haveincreased exports to existing markets and the list of declining products toexisting markets. This suggests considerable change in the structure ofmarkets to which Tunisia exports this product. In Iran, pistachios havebeen a main source of increased exports to certain markets and decliningexports to other markets. The structure is similar for ammonia in Algeria,potassium chloride in Jordan, and phosphoric acid in Morocco. This pat-tern suggests that shifts in demand between markets are significant orthat competitive conditions differ by market.
Second, for many countries the products that have driven growthand those that have led to export declines are from similar industries.This is most pronounced for the clothing sector. For example, men’s andboy’s cotton trousers have been an important source of decliningexports, while women’s and girls’ cotton trousers have been drivinghigher exports. This suggests that in sectors with differentiated prod-ucts, within-industry adjustment is an important aspect of the responseto increased global competition. From a policy perspective, this raisesthe question of whether there are measures available to governments tosupport this type of adjustment.
Third, products that have led to declining exports for some countriesappear in the list of products that have been driving export growth forother countries (for example, unwrought, unalloyed aluminum in Egypt,where exports declined, and Iran, where exports increased). The mainmarkets that have been at the forefront of both increases and decreases inexports at the intensive margin are often similar. This suggests that sweep-ing statements about the impact of global competition, especially fromChina and India, on the MENA region find little support in the data andthat trade opportunities and adjustment are taking place at fairly fine lev-els within industries.
Fourth, it is not possible to identify an obvious link between com-petition from China, as measured by the increase in global marketshare, and export outcomes at the intensive margin. In many cases, theproducts that are driving export growth in MENA have seen strongincreases in the global share of China (examples include women’s andgirls’ cotton trousers in Egypt, Jordan, Morocco, and Tunisia and ignitionwiring sets in Tunisia).
232 Brenton, Shui, and Walkenhorst

Growth at the extensive margin shows the increasing importance ofintegration into global production chains for electrical and motor vehicleproducts for Morocco, Tunisia, and to a lesser extent Egypt; the domi-nance of agricultural and fisheries products for Yemen; the increasingimportance of chemical and chemical products for a number of countries;and the importance of steel products in the extensive margin for manycountries in the region (see annex table 9.A.2). For a number of productsthat have driven growth at the extensive margin, the share of China in theglobal market has increased significantly.
Hence, this analysis suggests a complicated picture of export growth atboth the intensive and extensive margins. In the following sections, we tryto distill the key policy messages that emerge from recent trade perform-ance in the face of increasing competition from China. It is clear from thisinvestigation that sweeping assertions about the impact of China onMENA countries’ exports should not be trusted and that intrasectoralmovements in resources are an important aspect of adjustment to global-ization. What, then, is an appropriate policy stance to support viable firmsin adjusting to new competition by flexibly adjusting their product linesand by exploiting emerging market niches?
Drivers of Market Share Changes in the European UnionTo take the analysis further, we look at the EU market. Exports of a num-ber of MENA countries stagnated and their share of the market fellbetween 1995 and 2006, but some countries, such as Egypt, performedwell and managed to raise their EU market share. In this section, we try toidentify the main drivers of changes in exports to the European Union,using constant market share analysis.
Annex table 9.A.3 shows the decomposition of export growth atthe eight-digit level of the Combined Nomenclature into the impactof the overall growth of the EU market, the change caused by thecommodity structure of each county’s exports (a bias toward com-modities for which demand is growing rapidly will tend to raise theoverall export growth rate), the change caused by the market struc-ture (reliance on individual EU markets that grow more slowly thanothers will tend to reduce overall growth rates), and a competitivenessterm that catches the impact of increases in market shares of individ-ual product categories.
For the sectors identified, the growth of exports to the European Unionby China exceeded the overall increase in the size of the EU market, withthe difference driven mainly by improvements in competitiveness. In a
Globalization and Competition from China and India 233
number of cases, the commodity and market composition tended to be adrag on export growth.
For the MENA countries represented, the picture has been moremixed. In the more traditional export products of MENA countries,such as clothing, export growth was slower than the increase in the sizeof the EU market, thanks largely to declining competitiveness. In a num-ber of cases, declining competitiveness was offset, to some extent, by afavorable commodity and market composition of exports. Hence, reallo-cations toward faster-growing products within sectors and towardexpanding markets have been important factors in export growth. In asmall number of cases, a favorable composition of exports was bolsteredby strong competitiveness performance (for example, machinery [mainlycar parts] in Tunisia). This pattern suggests that in general, MENA’s abil-ity to export to the European Union has been impaired by inability tocompete with dynamic exporters, such as China, but that this tendencyhas been offset somewhat by reallocation toward more rapidly growingproduct and market segments of the European Union.
Border Trade Policies in the New Global EconomyGlobalization, in particular the integration of China and India into theglobal economy, creates opportunities. The ability of MENA countries totake advantage of them hinges on enhancing competitiveness throughimprovements in productivity, quality, and design; identifying and exploit-ing niche markets; and moving resources from low- to higher-productivityactivities and toward more efficient firms both within and between sec-tors. Trade policies play a key role in crafting a competitiveness strategybased on these elements.
A growing body of research indicates that within sectors, exporters tendto be more productive than nonexporters (Wagner 2007). Thus, policychanges, such as a reduction in external protection, that encourageresources to move to exporting firms tend to raise overall productivitywithin both the sector concerned and the economy as a whole. Indeed,trade protection may limit investments that particular firms and workerswould otherwise make to restructure and raise productivity and henceimprove the long-term capacity to compete in global markets. If protec-tion varies significantly across sectors, the pattern of sectoral investmentand output will be distorted away from sectors that on average have higherproductivity and stronger growth opportunities toward lower-productivity,protected activities. Trade protection that raises the price of intermediateinputs will hamper the ability of firms to compete with firms from other
234 Brenton, Shui, and Walkenhorst
countries that can obtain these inputs at global prices. Finally, the presenceof complex protection increases the burden on customs and can hamperits role in facilitating trade. Lower and more uniform tariffs can allow cus-toms to concentrate on border control functions and, in collaboration withother agencies, address nontariff barriers.
This policy objective of ensuring that trade protection is consistentwith a strategy of global competitiveness has become more, rather thanless, imperative in the face of globalization and increasing competitionfrom China and India. Globalization has increased the penalty firms facein global markets for being unable to source inputs competitively atworld prices. It has also raised the opportunity costs to countries of bot-tling up resources in low-productivity activities and forgoing the oppor-tunities from expanding higher-productivity activities both within andbetween sectors.
The importance of maintaining low rates of protection is not a reasonfor eliminating government interventions in trade: countries may beafflicted by market and government failures that tend to constrain thesustained expansion of exports and growth. In many cases, these con-straints to competitiveness require specific interventions and institutions.These are likely to include export and investment promotion agencies(to remedy problems arising from lack of information for exporters andinvestors), standards bodies, and interventions to improve transport logis-tics performance. Trade restrictions in overseas markets can be a con-straint on reforming countries by limiting export opportunities; effectivetrade preferences (those that are comprehensive in product coverage andhave nonrestrictive rules of origin) can provide a window of opportunityto establish an export beachhead while key domestic barriers to trade areaddressed. Long-term competitiveness, however, requires eliminating bar-riers to trade.
Virtually all MENA countries participated in the global trend towardreduced trade barriers that saw the world average of import duties dropfrom 14.9 percent in 1997 to 10.8 percent in 2007. Indeed, the reductionin import duties has on average been more pronounced in the region thanin the world overall, and the MENA average has been converging towardthe world mean (figure 9.1). There is substantial diversity within theregion, however, with tariff averages ranging from about 5 percent in theGCC countries and Lebanon to more than 20 percent in Iran, Morocco,and Tunisia (figure 9.2).
The average tariff rates provide only an approximate measure of thelevel of protection. Some imports into MENA countries benefit from
Globalization and Competition from China and India 235
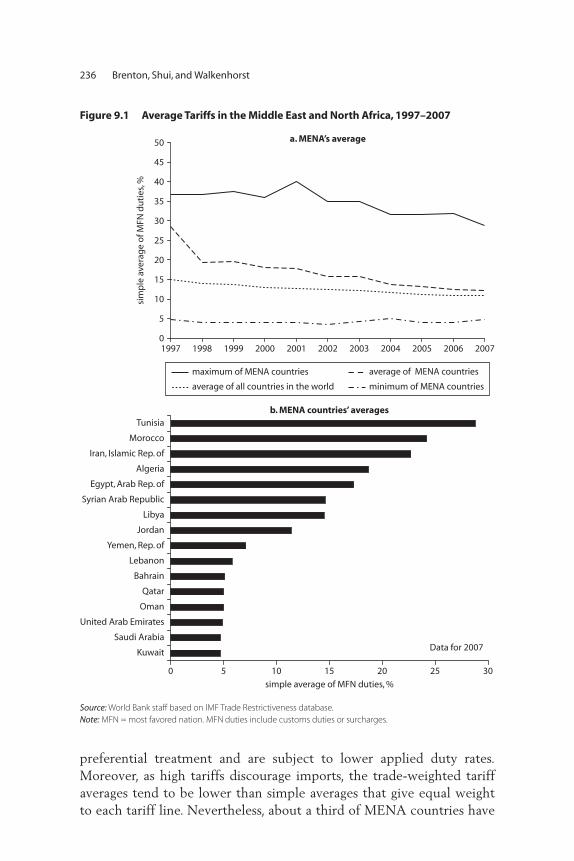
preferential treatment and are subject to lower applied duty rates.Moreover, as high tariffs discourage imports, the trade-weighted tariffaverages tend to be lower than simple averages that give equal weightto each tariff line. Nevertheless, about a third of MENA countries have
236 Brenton, Shui, and Walkenhorst
0
5
10
15
20
25
30
35
40
45
50 a. MENA’s average
b. MENA countries’ averages
1997 1998 1999
sim
ple
ave
rag
e o
f MFN
du
ties
, %
simple average of MFN duties, %
2000 2001 2002 2003 2004 2005 2006 2007
Data for 2007
0 5 10 15 20 25 30
Kuwait
Saudi Arabia
United Arab Emirates
Oman
Qatar
Bahrain
Lebanon
Yemen, Rep. of
Jordan
Libya
Syrian Arab Republic
Egypt, Arab Rep. of
Algeria
Iran, Islamic Rep. of
Morocco
Tunisia
maximum of MENA countries
average of all countries in the world minimum of MENA countries
average of MENA countries
Figure 9.1 Average Tariffs in the Middle East and North Africa, 1997–2007
Source: World Bank staff based on IMF Trade Restrictiveness database. Note: MFN = most favored nation. MFN duties include customs duties or surcharges.
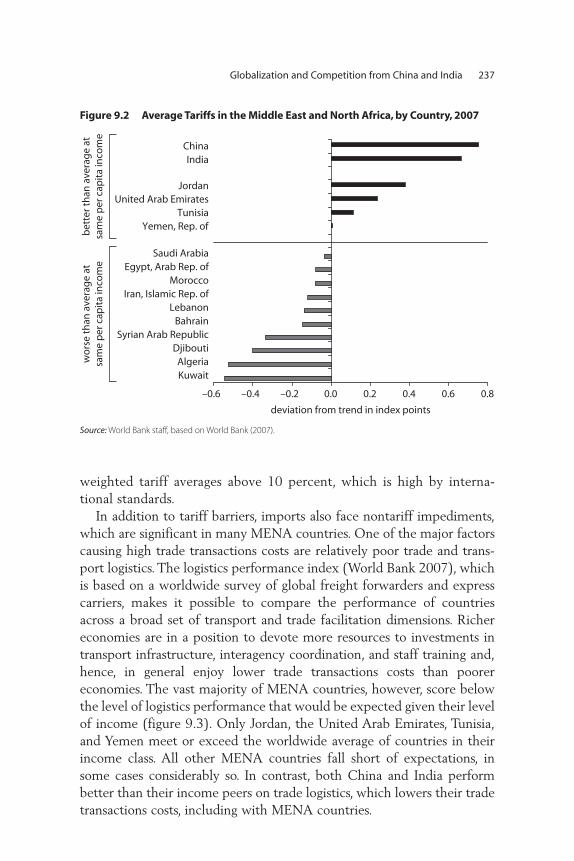
weighted tariff averages above 10 percent, which is high by interna-tional standards.
In addition to tariff barriers, imports also face nontariff impediments,which are significant in many MENA countries. One of the major factorscausing high trade transactions costs are relatively poor trade and trans-port logistics. The logistics performance index (World Bank 2007), whichis based on a worldwide survey of global freight forwarders and expresscarriers, makes it possible to compare the performance of countriesacross a broad set of transport and trade facilitation dimensions. Richereconomies are in a position to devote more resources to investments intransport infrastructure, interagency coordination, and staff training and,hence, in general enjoy lower trade transactions costs than poorereconomies. The vast majority of MENA countries, however, score belowthe level of logistics performance that would be expected given their levelof income (figure 9.3). Only Jordan, the United Arab Emirates, Tunisia,and Yemen meet or exceed the worldwide average of countries in theirincome class. All other MENA countries fall short of expectations, insome cases considerably so. In contrast, both China and India performbetter than their income peers on trade logistics, which lowers their tradetransactions costs, including with MENA countries.
Globalization and Competition from China and India 237
–0.6 –0.4 –0.2 0.0 0.2 0.4 0.6 0.8
deviation from trend in index points
wo
rse
than
ave
rag
e at
sam
e p
er c
apit
a in
com
eb
ette
r th
an a
vera
ge
atsa
me
per
cap
ita
inco
me
KuwaitAlgeria
DjiboutiSyrian Arab Republic
BahrainLebanon
Iran, Islamic Rep. ofMorocco
Egypt, Arab Rep. ofSaudi Arabia
Yemen, Rep. ofTunisia
United Arab EmiratesJordan
IndiaChina
Figure 9.2 Average Tariffs in the Middle East and North Africa, by Country, 2007
Source: World Bank staff, based on World Bank (2007).
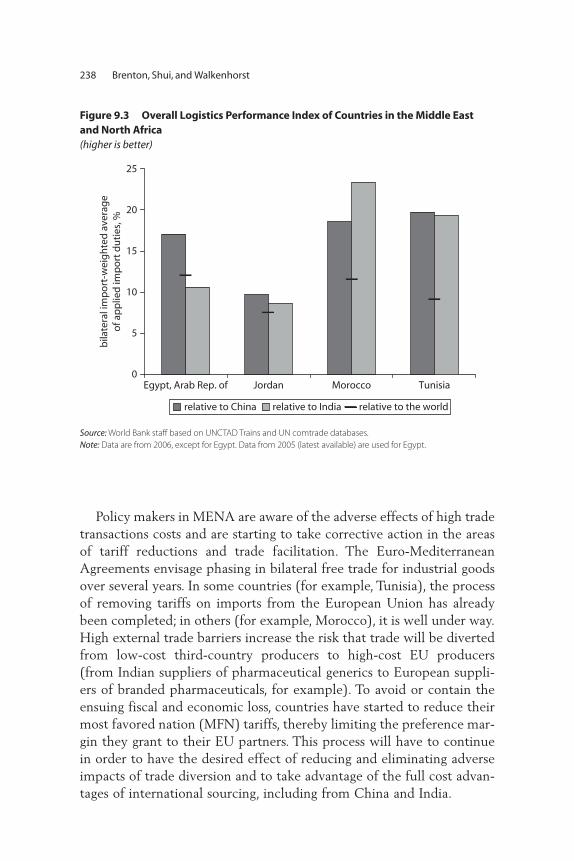
Policy makers in MENA are aware of the adverse effects of high tradetransactions costs and are starting to take corrective action in the areasof tariff reductions and trade facilitation. The Euro-MediterraneanAgreements envisage phasing in bilateral free trade for industrial goodsover several years. In some countries (for example, Tunisia), the processof removing tariffs on imports from the European Union has alreadybeen completed; in others (for example, Morocco), it is well under way.High external trade barriers increase the risk that trade will be divertedfrom low-cost third-country producers to high-cost EU producers(from Indian suppliers of pharmaceutical generics to European suppli-ers of branded pharmaceuticals, for example). To avoid or contain theensuing fiscal and economic loss, countries have started to reduce theirmost favored nation (MFN) tariffs, thereby limiting the preference mar-gin they grant to their EU partners. This process will have to continuein order to have the desired effect of reducing and eliminating adverseimpacts of trade diversion and to take advantage of the full cost advan-tages of international sourcing, including from China and India.
238 Brenton, Shui, and Walkenhorst
0
5
10
15
20
25
Egypt, Arab Rep. of
bila
tera
l im
po
rt-w
eig
hte
d a
vera
ge
of a
pp
lied
imp
ort
du
ties
, %
Jordan Morocco Tunisia
relative to China relative to India relative to the world
Figure 9.3 Overall Logistics Performance Index of Countries in the Middle Eastand North Africa(higher is better)
Source: World Bank staff based on UNCTAD Trains and UN comtrade databases.Note: Data are from 2006, except for Egypt. Data from 2005 (latest available) are used for Egypt.

Imports from China and India
Tariffs on imports from China and India are high in MENA countries:both countries export products to MENA that are subject to above-average import protection (figure 9.4). In Morocco and Tunisia, the dif-ference between average tariffs and those applied to China and India issubstantial. Indeed, among the signatories of the Agadir Agreement(Egypt, Jordan, Morocco, and Tunisia), only Egypt has bilateral tariffs onimports from India that are below the national mean.
China and India also export products to MENA countries that are sub-ject to tariff peaks (that is, very high tariffs on individual products). The tar-iff schedules of the Agadir countries show a considerable number of suchpeaks (defined as three times the tariff average). At the HarmonizedSystem six-digit level of aggregation, the national tariff schedules for2006 show 214 domestic tariff peaks in Tunisia, 58 in Morocco, 23 inJordan, and 21 in Egypt. In Morocco and Tunisia all of the tariff peaks applyto imports of agricultural products. Many tariff peaks are prohibitively high,but in some of the concerned product categories, there have been importsfrom China or India (figure 9.5). Unless the transactions benefited fromtemporary concessions or exemptions, these findings suggest that there are
Globalization and Competition from China and India 239
0
2
4
6
8
10
12
Eygpt, Arab Rep. of Jordan Morocco Tunisia
China India
nu
nb
er o
f do
mes
tic
tari
ff p
eaks
wit
h
imp
ort
s fr
om
Ch
ina
or I
nd
ia
Figure 9.4 Tariffs in China, India, and Selected Countries in the Middle East andNorth Africa, 2006(bilateral import-weighted average of applied import duties in percent)
Source: World Bank staff based on UNCTAD Trains and UN Comtrade databases.Note: Data are from 2006 or latest data available.

large differences in production costs and hence large untapped opportuni-ties from further trade integration.
Imports from China and India have increased in recent years, for someproducts considerably so. A common definition of an import surge is anincrease in import value of more than 30 percent over the average of thethree preceding years. According to this definition, during the recent past,imports from China (and to a lesser extent India) surged on a large numberof products. For example, in Egypt’s trade with China, 37 products in2006 satisfied the above-mentioned definition. However, in the over-whelming number of cases, the imports replaced imports from other coun-tries. In fact, in 2006 both total imports and imports from China surged foronly four Egyptian products, so that it seems likely that the import increasefrom China came at the extent of domestic sources of production.
Over time, the number of import surges from China has increasedslightly in Egypt, Morocco, and Tunisia. In contrast, the frequency ofimport surges from India exhibits a declining trend around strong fluctua-tions (figure 9.6). The trade data do not make it possible to assess whetherimport surges are caused by the greater efficiency of Asian suppliers or
240 Brenton, Shui, and Walkenhorst
0
1
2
3
4
5
6
nu
mb
er o
f pro
du
cts
wit
h im
po
rt in
crea
ses
of
mo
re t
han
30%
ove
r th
e p
rece
din
g 3
yea
rs
7
1998 1999 2000 2001 2002 2003 2004 2005 2006
Egypt, Arab Rep. of
Jordan Morocco
Tunisia
Agadir average
Figure 9.5 Number of Domestic Tariff Peaks on Imports from China and India inAgadir Agreement Countries, 2006
Source: World Bank staff based on UN Comtrade database.Note: Only products that account for at least 0.3 percent of total imports are considered.
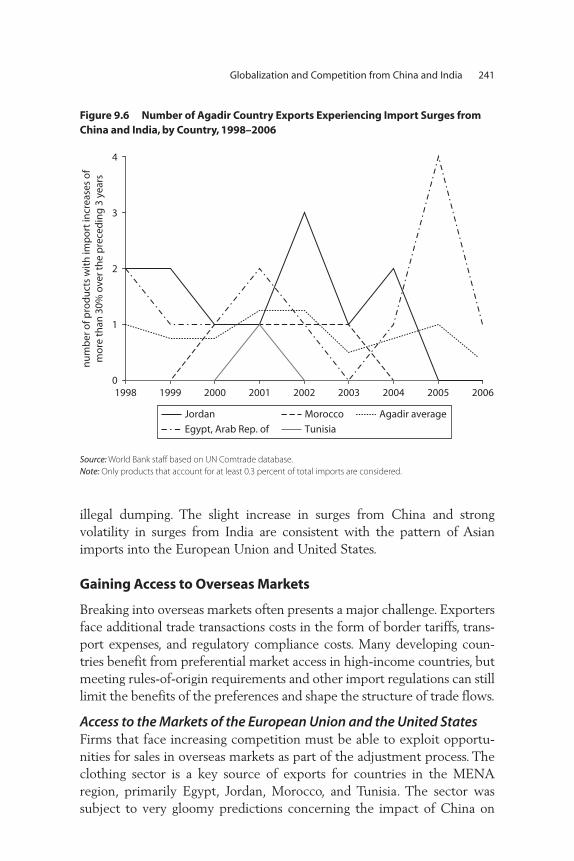
illegal dumping. The slight increase in surges from China and strongvolatility in surges from India are consistent with the pattern of Asianimports into the European Union and United States.
Gaining Access to Overseas Markets
Breaking into overseas markets often presents a major challenge. Exportersface additional trade transactions costs in the form of border tariffs, trans-port expenses, and regulatory compliance costs. Many developing coun-tries benefit from preferential market access in high-income countries, butmeeting rules-of-origin requirements and other import regulations can stilllimit the benefits of the preferences and shape the structure of trade flows.
Access to the Markets of the European Union and the United States Firms that face increasing competition must be able to exploit opportu-nities for sales in overseas markets as part of the adjustment process. Theclothing sector is a key source of exports for countries in the MENAregion, primarily Egypt, Jordan, Morocco, and Tunisia. The sector wassubject to very gloomy predictions concerning the impact of China on
Globalization and Competition from China and India 241
0
1
2
3
4
1998 1999 2000 2001 2002 2003 2004 2005 2006
nu
mb
er o
f pro
du
cts
wit
h im
po
rt in
crea
ses
of
mo
re t
han
30%
ove
r th
e p
rece
din
g 3
yea
rs
Egypt, Arab Rep. of
Jordan Morocco
Tunisia
Agadir average
Figure 9.6 Number of Agadir Country Exports Experiencing Import Surges fromChina and India, by Country, 1998–2006
Source: World Bank staff based on UN Comtrade database.Note: Only products that account for at least 0.3 percent of total imports are considered.

MENA countries. It is one in which trade policies in overseas marketshave influenced export outcomes.
The European Union and the United States removed remaining quotasagainst China and India at the end of 2004, supposedly heralding unfet-tered competition in the global clothing market (some restrictions werereimposed during 2005 for a limited period). Although the EuropeanUnion’s imports of clothing from China and India are still subject to tar-iffs, many MENA countries enjoy duty-free access to the European Unionunder the association agreements. In addition, Jordan and Morocco havesigned free trade agreements with the United States, and clothing exportsfrom both Egypt and Jordan have increased as a result of the qualifyingindustrial zones scheme linked to the free trade agreement between theUnited States and Israel.1
Egypt, Jordan, Morocco, and Tunisia achieved significant increases inexports of clothing between 1995 and 2006. Exports of knitted cloth-ing grew faster than exports of nonknitted clothing,2 with most of thegrowth in exports in both categories driven by exports to non-EU15countries (figure 9.7). The growth of clothing exports from Jordan wasdriven almost entirely by sales in the United States (figure 9.8), reflecting
242 Brenton, Shui, and Walkenhorst
0
1,000
2,000
3,000
4,000
US$
mill
ion
s
5,000
6,000
7,000
1995 1996 1997 1998 1999 2000 2001 2002 2003 2004 2005 2006
total nonknitted clothing exports of nonknitted clothing tonon-EU15 countries
exports of knitted clothing tonon-EU countries
total knitted clothing
Figure 9.7 Clothing Exports by Countries in the Middle East and North Africa,1995–2006
Source: Authors’ calculations based on UN Comtrade data.

a. exports of knitted clothing, Egypt
0
100,000
200,000
300,000
400,000
500,000
600,000
700,000
800,000
total UnitedStates
UnitedKingdom
Germany France
b. exports of nonknitted clothing, Egypt
0
100,000
200,000
300,000
400,000
500,000
600,000
700,000
800,000
total UnitedStates
UnitedKingdom
Italy Germany
c. exports of knitted clothing, Jordan
0100,000200,000300,000400,000500,000600,000700,000800,000900,000
1,000,000
total UnitedStates
Canada UnitedKingdom
Netherlands
d. exports of nonknitted clothing, Jordan
0100,000200,000300,000400,000500,000600,000700,000800,000900,000
1,000,000
total UnitedStates
Canada UnitedKingdom
Ireland
19952006
Figure 9.8 Exports of Knitted and Nonknitted Clothing by Egypt, Jordan, Morocco, and Tunisia, by Importing Country, 1995 and 2006(thousands of U.S. dollars)
(continued)
243
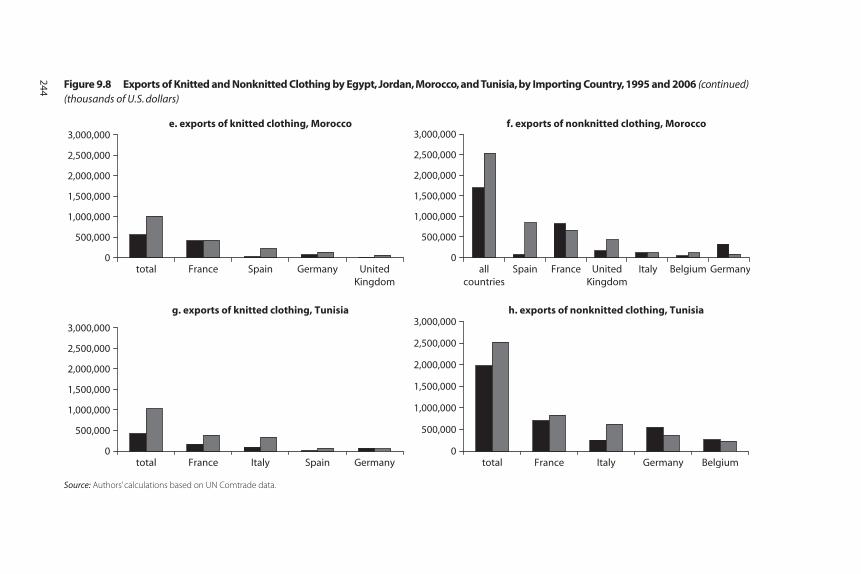
e. exports of knitted clothing, Morocco
0
500,000
1,000,000
1,500,000
2,000,000
2,500,000
3,000,000
total France Spain Germany UnitedKingdom
f. exports of nonknitted clothing, Morocco
0
500,000
1,000,000
1,500,000
2,000,000
2,500,000
3,000,000
allcountries
Spain France UnitedKingdom
Italy Belgium Germany
g. exports of knitted clothing, Tunisia
0
500,000
1,000,000
1,500,000
2,000,000
2,500,000
3,000,000
total France Italy Spain Germany
h. exports of nonknitted clothing, Tunisia
0
500,000
1,000,000
1,500,000
2,000,000
2,500,000
3,000,000
total France Italy Germany Belgium
Source: Authors’ calculations based on UN Comtrade data.
Figure 9.8 Exports of Knitted and Nonknitted Clothing by Egypt, Jordan, Morocco, and Tunisia, by Importing Country, 1995 and 2006 (continued)(thousands of U.S. dollars)
244
primarily the impact of the qualified industrial zone scheme rather thanthe free trade zone. Rapid growth in exports from Egypt to the UnitedStates also followed implementation of a qualified industrial zonescheme.3 By contrast, Morocco and Tunisia remained heavily focused onthe EU market for exports of clothing, with very little penetration ofthe U.S. market. Exports grew, but at a sluggish pace, with significantreorientation away from France and Germany toward Spain and theUnited Kingdom by Morocco and toward Italy by Tunisia.
The rules of origin under the four countries’ association agreementswith the European Union have important implications for the structureof exports and the prospects for growth. Egypt, Morocco, and Tunisia takeup about 90 percent of the preferences provided under the associationagreements; Jordan’s use of the preferences is much lower. The EU rulesof origin for clothing are strict, requiring a double transformation, mean-ing that both the weaving and making up stages must be undertaken inqualifying countries. Under the association agreements with bilateralcumulation, clothing manufacturers in MENA countries can use wovenfabrics produced in the European Union and qualify for EU preferenceson the final product.4 Indeed, the majority of imports of fabrics comefrom France, Italy, and Spain.
These rules tend to impinge more on nonknitted products than onknitwear, where technologies typically knit to shape from yarn. For nonknit-ted products, the weaving stage is distinct, and there are substantialeconomies of scale in the production of woven fabrics, which are then cutto shape. Morocco and Tunisia have specialized more in the production ofnonknitted products (the value of exports was about 2.5 times that of knitproducts in 2006). Morocco and Tunisia accounted for one-quarter of EUimports of nonknitted clothing recorded as entering the European Unionunder a trade preference program in 2005 and about 30 percent of EUimports from partners that had duty-free access. For knitwear, Morocco’sand Tunisia’s share of EU preferential imports was less than 12 percent.
The association agreements and the related rules of origin haveenabled clothing manufacturers, particularly in Morocco and Tunisia, tointegrate into European production chains. Although this has facilitateda substantial rise in exports, it also raises the issue of whether theseagreements have locked Morocco and Tunisia, and to a more limitedextent Egypt, into production structures that shelter MENA producersfrom greater competition from China in the EU market or handcuffedproducers in their ability to source inputs from new locations as a com-petitive response. An important feature of the global clothing market is
Globalization and Competition from China and India 245
the growing demand by large buyers that clothing producers take onmore activities in the value chain, especially sourcing decisions regard-ing inputs. Restrictive rules of origin limit the opportunities for globalsourcing. Compliance with these rules may leave MENA producers illequipped to compete if preference margins in the European Uniondecline on signing of a multilateral trade agreement.
In summary, preferential access to EU and U.S. markets under freetrade agreements has played a critical role in stimulating new exports ofclothing from Egypt, Jordan, Morocco, and Tunisia. These sectors nowneed to build on their success by developing strategies to boost long-termcompetitiveness, both to benefit from more diversified access to inputsand to prepare for a general reduction in tariffs that would reduce theprotection accorded by preferences.
Access to the Markets of China and IndiaThe dynamic markets of China and India present potentially importantexport destinations for products from MENA countries. However, non-fuel shipments to both countries, especially India, face substantial tradebarriers. The two giants have opened up significantly over the pastdecade, but simple averages of MFN duties remain about 10 percent inChina and more than 18 percent in India (figure 9.9).
Tariffs in China and India on imports from the MENA region are gen-erally below average. Petroleum can enter China duty free, and it is sub-ject to a relatively low duty of 10 percent in India. Nonfuel imports fromEgypt and Tunisia face higher trade-weighted average tariffs in bothChina and India; nonfuel imports from Jordan and Morocco face below-average duties in both countries (figure 9.10). An outlier is Tunisia’sexports to China, which encountered very high duties in 2005 because oflarge shipments of diammonium phosphate fertilizer, which were subjectto a 27 percent tariff.
The tariff schedules of both China and India show substantial variation,with more than 100 tariff peaks each. In China, these peaks concern agri-cultural and industrial products in about equal proportions. In India, four-fifths of all peaks fall on agricultural tariff lines. In 2005, there were importsfrom the Agadir countries into China in six peak tariff lines and shipmentsinto India in three lines, suggesting that some MENA exporters were ableto access the Chinese and Indians markets despite very high tariff barriers.5
Thus, although access to the Chinese and Indian markets has beenimproving for MENA countries, as tariffs have come down, there remainsscope for further improvements, which could facilitate higher exports
246 Brenton, Shui, and Walkenhorst
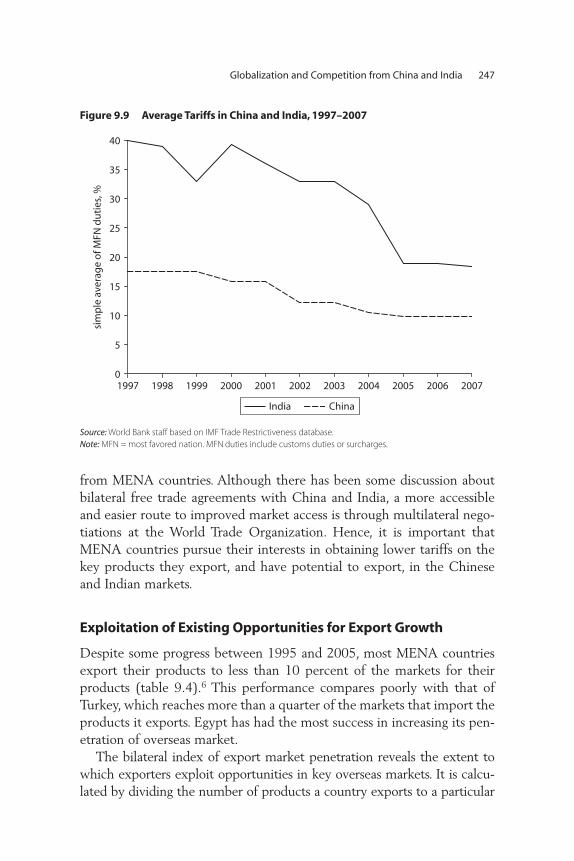
from MENA countries. Although there has been some discussion aboutbilateral free trade agreements with China and India, a more accessibleand easier route to improved market access is through multilateral nego-tiations at the World Trade Organization. Hence, it is important thatMENA countries pursue their interests in obtaining lower tariffs on thekey products they export, and have potential to export, in the Chineseand Indian markets.
Exploitation of Existing Opportunities for Export Growth
Despite some progress between 1995 and 2005, most MENA countriesexport their products to less than 10 percent of the markets for theirproducts (table 9.4).6 This performance compares poorly with that ofTurkey, which reaches more than a quarter of the markets that import theproducts it exports. Egypt has had the most success in increasing its pen-etration of overseas market.
The bilateral index of export market penetration reveals the extent towhich exporters exploit opportunities in key overseas markets. It is calcu-lated by dividing the number of products a country exports to a particular
Globalization and Competition from China and India 247
0
5
10
15
20
sim
ple
ave
rag
e o
f MFN
du
ties
, %
25
30
35
40
1997 1998 1999 2000 2001 2002 2003 2004 2005 2006 2007
India China
Figure 9.9 Average Tariffs in China and India, 1997–2007
Source: World Bank staff based on IMF Trade Restrictiveness database.Note: MFN = most favored nation. MFN duties include customs duties or surcharges.
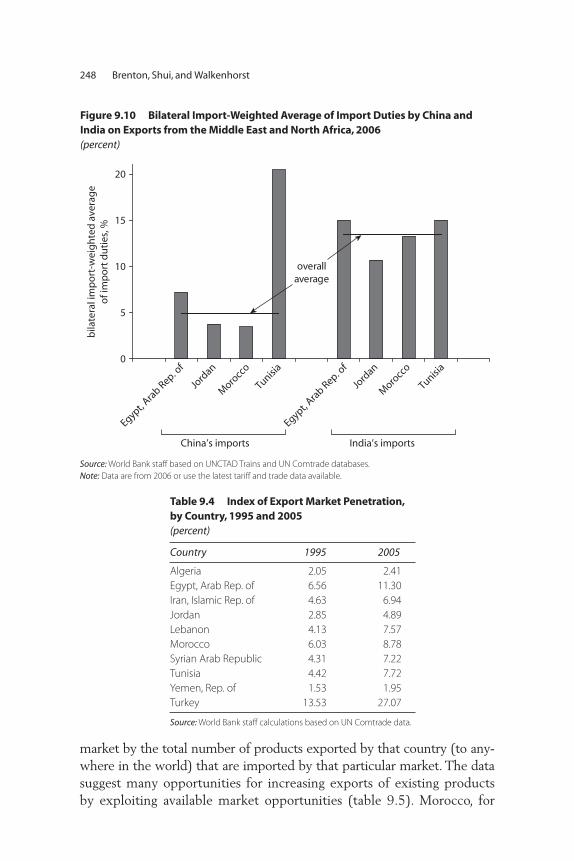
market by the total number of products exported by that country (to any-where in the world) that are imported by that particular market. The datasuggest many opportunities for increasing exports of existing productsby exploiting available market opportunities (table 9.5). Morocco, for
248 Brenton, Shui, and Walkenhorst
0
5
10
15
20
Egypt, Ara
b Rep. of
bila
tera
l im
po
rt-w
eig
hte
d a
vera
ge
of i
mp
ort
du
ties
, %
Jord
an
Moro
cco
Tunisia
Egypt, Ara
b Rep. of
Jord
an
Moro
cco
Tunisia
overallaverage
China’s imports India’s imports
Figure 9.10 Bilateral Import-Weighted Average of Import Duties by China and India on Exports from the Middle East and North Africa, 2006(percent)
Source: World Bank staff based on UNCTAD Trains and UN Comtrade databases.Note: Data are from 2006 or use the latest tariff and trade data available.
Table 9.4 Index of Export Market Penetration,by Country, 1995 and 2005 (percent)
Country 1995 2005
Algeria 2.05 2.41Egypt, Arab Rep. of 6.56 11.30Iran, Islamic Rep. of 4.63 6.94Jordan 2.85 4.89Lebanon 4.13 7.57Morocco 6.03 8.78Syrian Arab Republic 4.31 7.22Tunisia 4.42 7.72Yemen, Rep. of 1.53 1.95Turkey 13.53 27.07
Source: World Bank staff calculations based on UN Comtrade data.

Table 9.5 Bilateral Index of Export Market Penetration for Selected Countries(percent)
Importer
Exporter
Algeria
Egypt,
Arab Rep. of
Iran,
Islamic
Rep. of Jordan Lebanon Morocco
Syrian
Arab Republic Tunisia Yemen, Rep. of Turkey
Europe and the United States
Belgium 9.0 17.3 6.3 4.6 12.9 25.9 9.6 28.1 1.2 52.0France 32.5 26.6 17.7 6.1 21.8 57.3 18.5 61.3 2.6 57.0Germany 7.4 33.2 32.9 11.5 16.7 33.5 18.7 36.2 6.6 71.8Greece 1.0 22.0 3.4 3.6 9.1 7.1 11.8 6.2 0.2 61.7Italy 18.3 34.0 18.2 9.8 18.8 36.9 17.8 50.4 2.6 62.5Netherlands 4.2 18.4 13.0 7.5 7.7 20.8 7.1 15.6 1.2 51.4Portugal 3.4 7.1 3.0 1.6 2.1 19.4 0.7 11.0 — 32.2Spain 19.9 27.1 15.3 11.2 19.1 57.0 12.9 29.5 0.6 54.3United Kingdom 8.6 29.4 16.5 13.3 16.0 28.1 14.6 19.7 7.6 64.1United States 3.8 27.2 5.8 20.6 19.5 26.1 13.1 17.2 4.0 52.0Middle East and North AfricaAlgeria — 29.9 4.9 12.5 13.7 17.0 34.2 38.4 0.8 57.2Egypt, Arab Rep. of 2.6 — 4.2 26.6 18.3 2.9 19.8 4.7 10.2 43.1Jordan 1.0 38.4 8.7 — 32.5 1.6 40.5 2.9 3.8 51.8Morocco 15.5 25.2 4.9 4.4 10.7 — 17.8 23.6 — 40.6Syrian Arab
Republic 0.8 19.8 6.4 16.2 19.2 1.1 — 1.3 0.9 28.3Tunisia 11.0 18.3 2.3 4.3 6.9 24.2 14.5 — 0.8 38.2Yemen, Rep. of 0.4 26.6 7.5 18.7 12.9 1.0 29.3 1.3 — —Turkey 9.8 19.6 25.8 10.8 6.5 16.5 12.2 14.5 0.2 —Saudi Arabia 5.8 69.9 34.2 56.3 56.1 23.2 72.5 18.7 39.0 62.1Asia
China 6.3 12.8 15.0 8.0 3.1 11.2 3.5 13.1 4.6 34.7India 3.5 11.8 19.6 8.9 5.4 9.2 2.7 2.2 6.5 35.6
Source: World Bank staff, based on UNComtrade SITC Rev.2 2005 data. Note: The Islamic Republic of Iran and Lebanon did not report import data in 2005 and are not therefore included as importers. — = Negligible.
249
example, takes advantage of 57 percent of the opportunities to sell itsexport products in Spain but less than 20 percent of export opportunitiesin Portugal.
MENA countries appear to do poorly in exploiting opportunities to selltheir exports in other MENA countries. Tunisia’s (unweighted) averageexport market penetration in other MENA countries is only 13 percent.Turkey does a better job of selling its export products in the MENA regionthan MENA countries do. It uses almost 40 percent of the opportunities tosell its products in Tunisia—a far higher percentage than that of Egypt(18 percent). This raises the question of why products that have proven tobe marketable in some countries are not being exported to other nearbycountries. The low values of the index of export market penetration forMENA markets may partly reflect trade policy and logistical constraints totrade between MENA countries. They suggest the need to look at access toexport financing and the role and impact of export promotion bodies inassisting exporters in overcoming informational barriers to selling in newmarkets.
Conclusions and Policy Messages
A number of issues warrant the attention of MENA policy makers. Themain findings from the analysis suggest several directions for MENAgovernments:
• Review the regulatory and incentives environment, including labormarket regulations, with a view to facilitating intrasectoral adjust-ment, which seems to have been more important than intersectoraladjustment in the reaction of MENA firms to increased competitionfrom Asia. Continue the process of tariff reform to reduce trade diver-sion from preferential agreements and the antiexport bias of the im-port regime.
• Reduce trade transactions costs by improving trade and transportlogistics so that producers can take advantage of their geographicalproximity to the large European market.
• Broaden trade promotion efforts to nontraditional markets withinMENA and beyond to reap unexploited opportunities in geographicalexport diversification.
• Consider undertaking analytical work on the nature of import surgesand determine whether they warrant the strengthening of antidump-ing provisions.
250 Brenton, Shui, and Walkenhorst
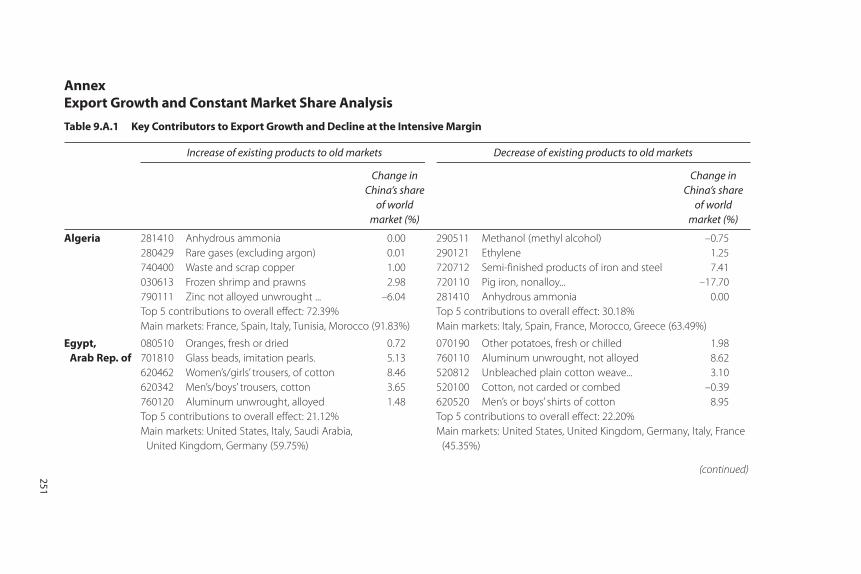
AnnexExport Growth and Constant Market Share Analysis
Table 9.A.1 Key Contributors to Export Growth and Decline at the Intensive Margin
Increase of existing products to old markets Decrease of existing products to old markets
Change in China’s share
of world market (%)
Change in China’s share
of world market (%)
Algeria 281410 Anhydrous ammonia 0.00 290511 Methanol (methyl alcohol) –0.75 280429 Rare gases (excluding argon) 0.01 290121 Ethylene 1.25 740400 Waste and scrap copper 1.00 720712 Semi-finished products of iron and steel 7.41 030613 Frozen shrimp and prawns 2.98 720110 Pig iron, nonalloy... –17.70 790111 Zinc not alloyed unwrought ... –6.04 281410 Anhydrous ammonia 0.00 Top 5 contributions to overall effect: 72.39%Main markets: France, Spain, Italy, Tunisia, Morocco (91.83%)
Top 5 contributions to overall effect: 30.18%Main markets: Italy, Spain, France, Morocco, Greece (63.49%)
Egypt, Arab Rep. of
080510 Oranges, fresh or dried 0.72 070190 Other potatoes, fresh or chilled 1.98 701810 Glass beads, imitation pearls. 5.13 760110 Aluminum unwrought, not alloyed 8.62 620462 Women’s/girls’ trousers, of cotton 8.46 520812 Unbleached plain cotton weave... 3.10 620342 Men’s/boys’ trousers, cotton 3.65 520100 Cotton, not carded or combed –0.39 760120 Aluminum unwrought, alloyed 1.48 620520 Men’s or boys’ shirts of cotton 8.95 Top 5 contributions to overall effect: 21.12% Main markets: United States, Italy, Saudi Arabia,
United Kingdom, Germany (59.75%)
Top 5 contributions to overall effect: 22.20%Main markets: United States, United Kingdom, Germany, Italy, France
(45.35%)
(continued)251
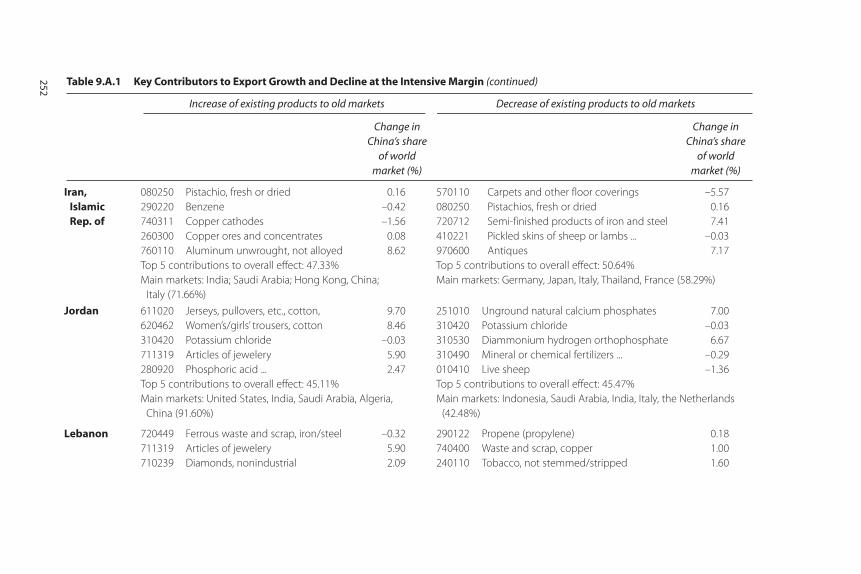
Iran, Islamic Rep. of
080250 Pistachio, fresh or dried 0.16 570110 Carpets and other floor coverings –5.57 290220 Benzene –0.42 080250 Pistachios, fresh or dried 0.16 740311 Copper cathodes –1.56 720712 Semi-finished products of iron and steel 7.41 260300 Copper ores and concentrates 0.08 410221 Pickled skins of sheep or lambs ... –0.03 760110 Aluminum unwrought, not alloyed 8.62 970600 Antiques 7.17 Top 5 contributions to overall effect: 47.33%Main markets: India; Saudi Arabia; Hong Kong, China;
Italy (71.66%)
Top 5 contributions to overall effect: 50.64%Main markets: Germany, Japan, Italy, Thailand, France (58.29%)
Jordan 611020 Jerseys, pullovers, etc., cotton, 9.70 251010 Unground natural calcium phosphates 7.00 620462 Women’s/girls’ trousers, cotton 8.46 310420 Potassium chloride –0.03 310420 Potassium chloride –0.03 310530 Diammonium hydrogen orthophosphate 6.67 711319 Articles of jewelery 5.90 310490 Mineral or chemical fertilizers ... –0.29 280920 Phosphoric acid ... 2.47 010410 Live sheep –1.36 Top 5 contributions to overall effect: 45.11%Main markets: United States, India, Saudi Arabia, Algeria,
China (91.60%)
Top 5 contributions to overall effect: 45.47% Main markets: Indonesia, Saudi Arabia, India, Italy, the Netherlands
(42.48%)
Lebanon 720449 Ferrous waste and scrap, iron/steel –0.32 290122 Propene (propylene) 0.18 711319 Articles of jewelery 5.90 740400 Waste and scrap, copper 1.00710239 Diamonds, nonindustrial 2.09 240110 Tobacco, not stemmed/stripped 1.60
Table 9.A.1 Key Contributors to Export Growth and Decline at the Intensive Margin (continued)
Increase of existing products to old markets Decrease of existing products to old markets
Change in China’s share
of world market (%)
Change in China’s share
of world market (%)
252

280920 Phosphoric acid ... 2.47 070190 Other potatoes, fresh or chilled 1.98 490199 Printed books, brochures, leaflets 11.02 710239 Diamonds, nonindustrial 2.09 Top 5 contributions to overall effect: 54.73%Main markets: Switzerland, Turkey, Saudi Arabia, United States,
Jordan (72.05%)
Top 5 contributions to overall effect: 20.50%Main markets: Saudi Arabia, France, Thailand, Egypt, United States
(50.00%)
Morocco 620462 Women’s/girls’ trousers, cotton 8.46 030759 Octopus (excluding live, fresh, or chilled) 9.61 280920 Phosphoric acid ... 2.47 280920 Phosphoric acid 2.47 251010 Unground natural calcium
phosphates 7.00 620342 Men’s/boys’ trousers, cotton 3.65
610910 T-shirts, singlets ... cotton, 4.68 310530 Diammonium hydrogenorthop’phate 6.67 070820 Beans, fresh or chilled –1.20 620640 Women’s/girls’ blouses, shirts of mmf 13.78 Top 5 contributions to overall effect: 21.34%Main markets: Spain, France, United Kingdom, Belgium,
Germany (68.15%)
Top 5 contributions to overall effect: 21.56%Main markets: France, Germany, Japan, Italy,
United Kingdom (69.44%)
Syrian Arab Republic
010410 Live sheep –1.36 520100 Cotton, not carded or combed –0.39 150910 Virgin olive oil and fractions 0.00 100300 Barley 0.01 520100 Cotton, not carded or combed –0.39 410221 Pickled skins of sheep or lambs, –0.03 010420 Live goats –0.42 847193 Storage units ... 12.13 410512 Sheep, lamb skin leather –2.22 100110 Durum wheat 0.02 Top 5 contribution to overall effect: 60.89%Main markets: Saudi Arabia, Italy, Jordan, Turkey, Spain (78.27%)
Top 5 contributions to overall effect: 54.90%Main markets: Italy, Jordan, Saudi Arabia, Morocco, Spain (52.85%)
Tunisia 620342 Men’s/boys’ trousers, cotton 3.65 620342 Men’s/boys’ trousers of cotton 3.65 854430 Ignition wiring sets 6.99 620640 Women’s/girls’ blouses, shirts, mmf 13.78 620462 Women’s/girls’ trousers, cotton 8.46 620520 Men’s or boys’ shirts, cotton 8.95 853650 Electrical switches ... 6.82 620343 Men’s/boys’ trousers, synthetic materials 3.30 621210 Brassieres 16.59 280920 Phosphoric acid 2.47
(continued)
253
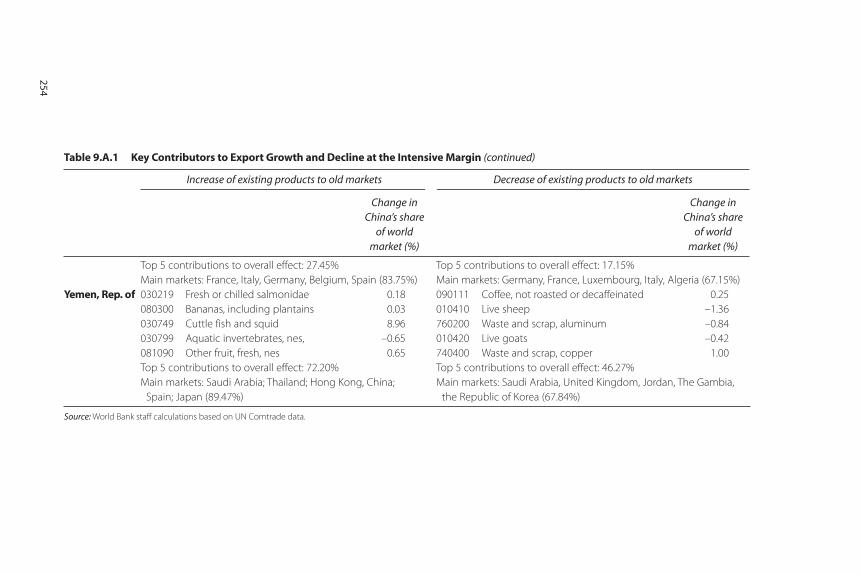
Top 5 contributions to overall effect: 27.45%Main markets: France, Italy, Germany, Belgium, Spain (83.75%)
Top 5 contributions to overall effect: 17.15%Main markets: Germany, France, Luxembourg, Italy, Algeria (67.15%)
Yemen, Rep. of 030219 Fresh or chilled salmonidae 0.18 090111 Coffee, not roasted or decaffeinated 0.25 080300 Bananas, including plantains 0.03 010410 Live sheep –1.36 030749 Cuttle fish and squid 8.96 760200 Waste and scrap, aluminum –0.84 030799 Aquatic invertebrates, nes, –0.65 010420 Live goats –0.42 081090 Other fruit, fresh, nes 0.65 740400 Waste and scrap, copper 1.00 Top 5 contributions to overall effect: 72.20%Main markets: Saudi Arabia; Thailand; Hong Kong, China;
Spain; Japan (89.47%)
Top 5 contributions to overall effect: 46.27%Main markets: Saudi Arabia, United Kingdom, Jordan, The Gambia,
the Republic of Korea (67.84%)
Source: World Bank staff calculations based on UN Comtrade data.
Table 9.A.1 Key Contributors to Export Growth and Decline at the Intensive Margin (continued)
Increase of existing products to old markets Decrease of existing products to old markets
Change in China’s share
of world market (%)
Change in China’s share
of world market (%)
254

Table 9.A.2 Key Contributors to Export Growth and Decline at the Extensive Margin
Product
Increase of existing products to new markets Increase of new products to old markets
Change in China’s share
of world market (%)
Change in China’s share
of world market (%)
Algeria 720449 Ferrous waste and scrap, iron, or steel –0.32 310280 Mixtures of urea and ammonium nitrate 0.07 281410 Anhydrous ammonia 0.00 180400 Cocoa butter, fat, and oil –0.11 720824 Flat rlld prod, i/nas, in coil, hr, 2.57 290244 Mixed xylene isomers 1.07 251020 Ground natural calcium phosphates 1.89 390110 Polyethylene having a specific grav 0.18 390120 Polyethylene having a specific grav 0.18 846694 Parts and accessories nes for use 1.37 Top 5 contributions to overall effect: 70.30% Main markets: Turkey, Morocco, the Netherlands, Germany,
India (72.05%)
Top 5 contributions to overall effect: 49.84%Main markets: France, Spain, United States, the Netherlands,
Italy (67.78%)
Egypt, Arab Rep. of
720824 Flat rlld prod, i/nas, in coil, hr, 2.57 252329 Portland cement (excluding white) 0.66 252310 Cement clinkers 12.62 720241 Ferro-chromium containing by weight –8.19 310210 Urea 5.25 721510 Bars and rods, i/nas,nfw than cold forme 0.49 390120 Polyethylene having a specific grav 0.18 841121 Turbo-propellers of a power not exc 0.26 854430 Ignition wiring sets and oth wiring set 6.99 722830 Bars and rods, alloy steel, o/t stainless 3.03 Top 5 contributions to overall effect: 30.32%Main markets: Spain, United Kingdom, United States, Saudi
Arabia, Italy (38.45%)
Top 5 contributions to overall effect: 56.20%Main markets: Sudan, Saudi Arabia, United States, United Kingdom,
Italy (73.91%)
(continued)255
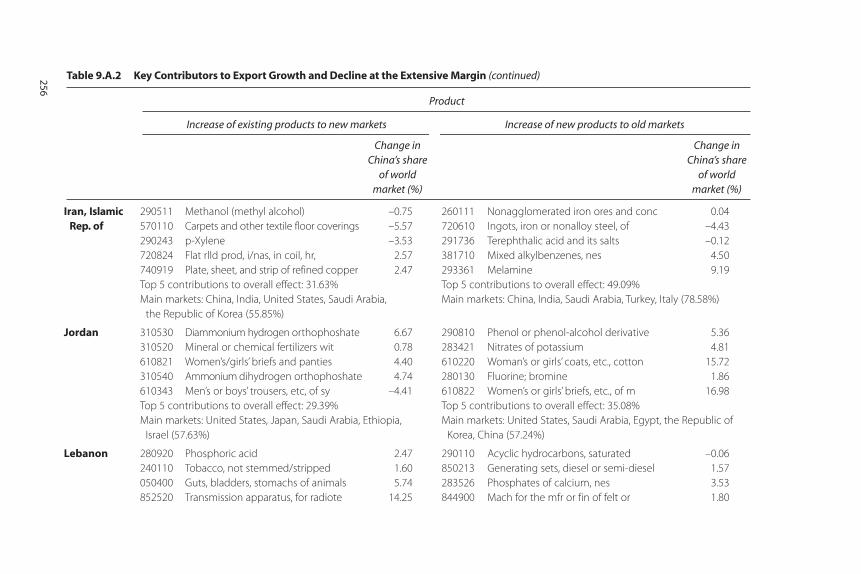
Iran, Islamic Rep. of
290511 Methanol (methyl alcohol) –0.75 260111 Nonagglomerated iron ores and conc 0.04 570110 Carpets and other textile floor coverings –5.57 720610 Ingots, iron or nonalloy steel, of –4.43 290243 p-Xylene –3.53 291736 Terephthalic acid and its salts –0.12 720824 Flat rlld prod, i/nas, in coil, hr, 2.57 381710 Mixed alkylbenzenes, nes 4.50 740919 Plate, sheet, and strip of refined copper 2.47 293361 Melamine 9.19 Top 5 contributions to overall effect: 31.63%Main markets: China, India, United States, Saudi Arabia,
the Republic of Korea (55.85%)
Top 5 contributions to overall effect: 49.09%Main markets: China, India, Saudi Arabia, Turkey, Italy (78.58%)
Jordan 310530 Diammonium hydrogen orthophoshate 6.67 290810 Phenol or phenol-alcohol derivative 5.36 310520 Mineral or chemical fertilizers wit 0.78 283421 Nitrates of potassium 4.81 610821 Women’s/girls’ briefs and panties 4.40 610220 Woman’s or girls’ coats, etc., cotton 15.72 310540 Ammonium dihydrogen orthophoshate 4.74 280130 Fluorine; bromine 1.86 610343 Men’s or boys’ trousers, etc, of sy –4.41 610822 Women’s or girls’ briefs, etc., of m 16.98 Top 5 contributions to overall effect: 29.39%Main markets: United States, Japan, Saudi Arabia, Ethiopia,
Israel (57.63%)
Top 5 contributions to overall effect: 35.08%Main markets: United States, Saudi Arabia, Egypt, the Republic of
Korea, China (57.24%)
Lebanon 280920 Phosphoric acid 2.47 290110 Acyclic hydrocarbons, saturated –0.06 240110 Tobacco, not stemmed/stripped 1.60 850213 Generating sets, diesel or semi-diesel 1.57 050400 Guts, bladders, stomachs of animals 5.74 283526 Phosphates of calcium, nes 3.53 852520 Transmission apparatus, for radiote 14.25 844900 Mach for the mfr or fin of felt or 1.80
Table 9.A.2 Key Contributors to Export Growth and Decline at the Extensive Margin (continued)
Product
Increase of existing products to new markets Increase of new products to old markets
Change in China’s share
of world market (%)
Change in China’s share
of world market (%)
256

392330 Carboys, bottles, flasks, and similar 3.30 854460 Electric conductors, for a voltage 1.63 Top 5 contributions to overall effect: 21.91%Main markets: Jordan, Egypt, Saudi Arabia, India,
United Kingdom (31.18%)
Top 5 contributions to overall effect: 28.59%Main markets: Egypt, Saudi Arabia, Jordan, United States,
Italy (62.70%)
Morocco 854441 Electric conductors, for a voltage n 15.38 701990 Glass fibers (including glass wool) 4.51 854430 Ignition wiring sets 6.99 852692 Radio remote control apparatus –2.00 854219 Monolithic integrated circuits, nes 5.14 721420 Bars and rods,i/nas,hr,hd or he,cntg in 6.22 854129 Transistors ... 8.22 940120 Seats, motor vehicles 14.89 310540 Ammonium dihydrogen orthophoshate 4.74 930690 Munitions of war and pts thereof and ot 0.10 Top 5 contributions to overall effect: 41.11%Main markets: Spain; Singapore; China; Hong Kong, China;
Italy (54.99%)
Top 5 contributions to overall effect: 16.66%Main markets: France, Spain, Algeria, Belgium, Italy (65.0%)
Syrian ArabRepublic
100110 Durum wheat 0.02 520515 Uncombed single cotton yarn, with > –1.95 520100 Cotton, not carded or combed –0.39 310210 Urea 5.25 251010 Unground natural calcium phosphates 7.00 841112 Turbo-jets of a thrust exceeding 25 1.36 610832 Women’s or girls’ pyjamas, etc., of 1.97 854459 Electric conductors, for a voltage 2.58 220210 Waters (including mineral and aerated) 0.51 520842 Colored plain cotton weave, with > 1.36 Top 5 contributions to overall effect: 31.59%Main markets: Jordan, Egypt, Sudan, Algeria, China (55.38%)
Top 5 contributions to overall effect: 34.89%Main Markets: Egypt, Italy, Jordan, Saudi Arabia, Turkey (74.3%)
Tunisia 854430 Ignition wiring sets and other wiring set
6.99 870894 Steering wheels, steering columns a 0.85
721049 Flat rolled prod, i/nas, plated or 2.61 721039 Flat rolled prod, i/nas, electro pl –0.29 870821 Safety seat belts for motor vehicle 1.91 630399 Curtains and interior blinds; curta 25.77 640340 Footwear, with a metal toe-cap, lea 15.42 630493 Furnishing articles of synthetic fi 43.89 853710 Boards, panels, including numerical 4.48 030349 Frozen tunas, nes 7.62
(continued)257
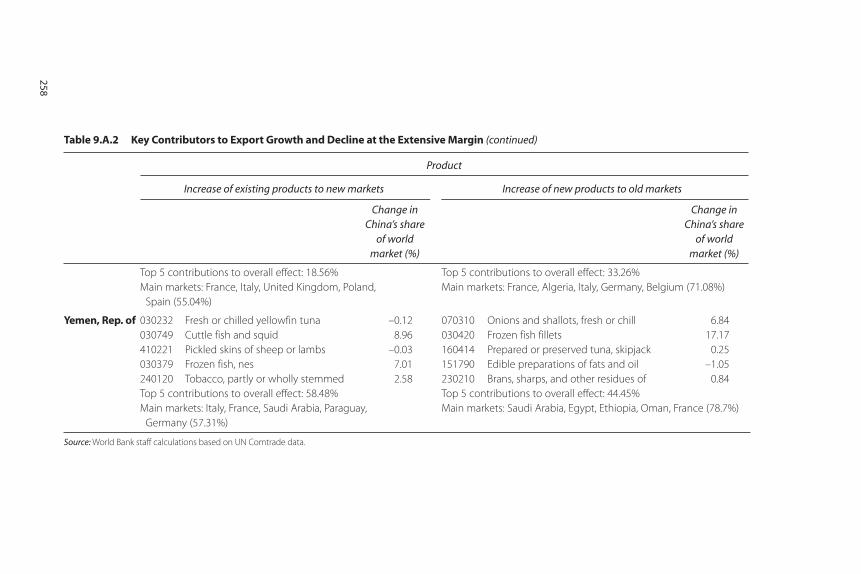
Top 5 contributions to overall effect: 18.56%Main markets: France, Italy, United Kingdom, Poland,
Spain (55.04%)
Top 5 contributions to overall effect: 33.26%Main markets: France, Algeria, Italy, Germany, Belgium (71.08%)
Yemen, Rep. of 030232 Fresh or chilled yellowfin tuna –0.12 070310 Onions and shallots, fresh or chill 6.84 030749 Cuttle fish and squid 8.96 030420 Frozen fish fillets 17.17 410221 Pickled skins of sheep or lambs –0.03 160414 Prepared or preserved tuna, skipjack 0.25 030379 Frozen fish, nes 7.01 151790 Edible preparations of fats and oil –1.05 240120 Tobacco, partly or wholly stemmed 2.58 230210 Brans, sharps, and other residues of 0.84 Top 5 contributions to overall effect: 58.48%Main markets: Italy, France, Saudi Arabia, Paraguay,
Germany (57.31%)
Top 5 contributions to overall effect: 44.45%Main markets: Saudi Arabia, Egypt, Ethiopia, Oman, France (78.7%)
Source: World Bank staff calculations based on UN Comtrade data.
Table 9.A.2 Key Contributors to Export Growth and Decline at the Extensive Margin (continued)
Product
Increase of existing products to new markets Increase of new products to old markets
Change in China’s share
of world market (%)
Change in China’s share
of world market (%)
258
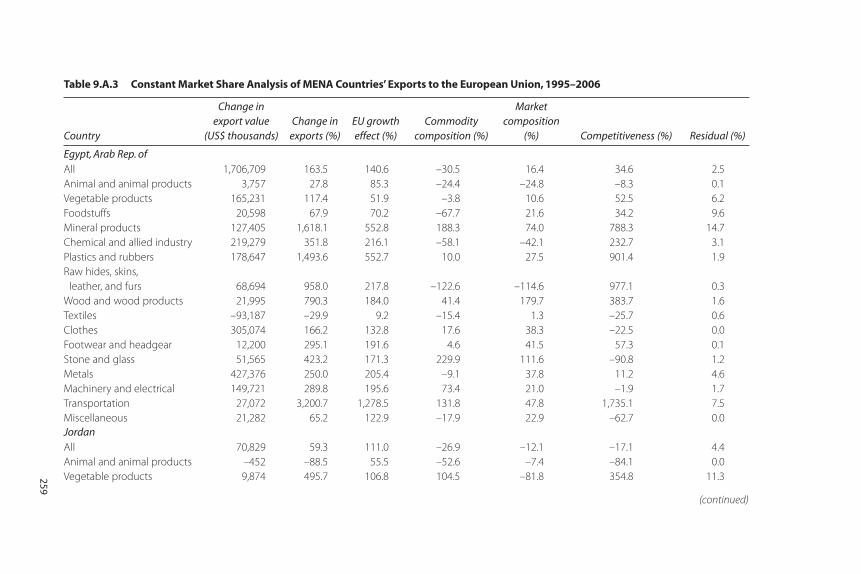
Table 9.A.3 Constant Market Share Analysis of MENA Countries’ Exports to the European Union, 1995–2006
Country
Change in export value
(US$ thousands)Change in
exports (%)EU growth effect (%)
Commodity composition (%)
Market composition
(%) Competitiveness (%) Residual (%)
Egypt, Arab Rep. ofAll 1,706,709 163.5 140.6 –30.5 16.4 34.6 2.5 Animal and animal products 3,757 27.8 85.3 –24.4 –24.8 –8.3 0.1 Vegetable products 165,231 117.4 51.9 –3.8 10.6 52.5 6.2 Foodstuffs 20,598 67.9 70.2 –67.7 21.6 34.2 9.6 Mineral products 127,405 1,618.1 552.8 188.3 74.0 788.3 14.7 Chemical and allied industry 219,279 351.8 216.1 –58.1 –42.1 232.7 3.1 Plastics and rubbers 178,647 1,493.6 552.7 10.0 27.5 901.4 1.9 Raw hides, skins,
leather, and furs 68,694 958.0 217.8 –122.6 –114.6 977.1 0.3 Wood and wood products 21,995 790.3 184.0 41.4 179.7 383.7 1.6 Textiles –93,187 –29.9 9.2 –15.4 1.3 –25.7 0.6 Clothes 305,074 166.2 132.8 17.6 38.3 –22.5 0.0 Footwear and headgear 12,200 295.1 191.6 4.6 41.5 57.3 0.1 Stone and glass 51,565 423.2 171.3 229.9 111.6 –90.8 1.2 Metals 427,376 250.0 205.4 –9.1 37.8 11.2 4.6 Machinery and electrical 149,721 289.8 195.6 73.4 21.0 –1.9 1.7 Transportation 27,072 3,200.7 1,278.5 131.8 47.8 1,735.1 7.5 Miscellaneous 21,282 65.2 122.9 –17.9 22.9 –62.7 0.0 JordanAll 70,829 59.3 111.0 –26.9 –12.1 –17.1 4.4 Animal and animal products –452 –88.5 55.5 –52.6 –7.4 –84.1 0.0 Vegetable products 9,874 495.7 106.8 104.5 –81.8 354.8 11.3 259
(continued)
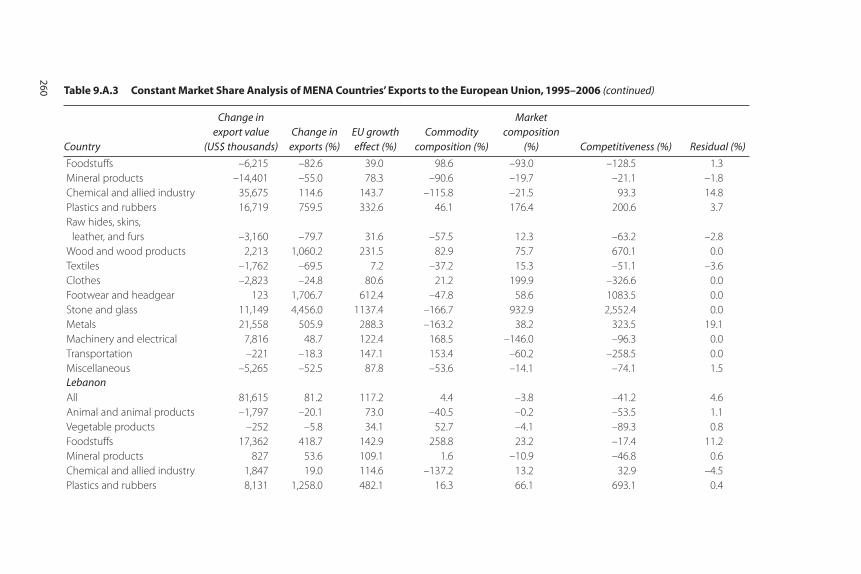
Foodstuffs –6,215 –82.6 39.0 98.6 –93.0 –128.5 1.3 Mineral products –14,401 –55.0 78.3 –90.6 –19.7 –21.1 –1.8 Chemical and allied industry 35,675 114.6 143.7 –115.8 –21.5 93.3 14.8 Plastics and rubbers 16,719 759.5 332.6 46.1 176.4 200.6 3.7 Raw hides, skins,
leather, and furs –3,160 –79.7 31.6 –57.5 12.3 –63.2 –2.8 Wood and wood products 2,213 1,060.2 231.5 82.9 75.7 670.1 0.0 Textiles –1,762 –69.5 7.2 –37.2 15.3 –51.1 –3.6 Clothes –2,823 –24.8 80.6 21.2 199.9 –326.6 0.0 Footwear and headgear 123 1,706.7 612.4 –47.8 58.6 1083.5 0.0 Stone and glass 11,149 4,456.0 1137.4 –166.7 932.9 2,552.4 0.0 Metals 21,558 505.9 288.3 –163.2 38.2 323.5 19.1 Machinery and electrical 7,816 48.7 122.4 168.5 –146.0 –96.3 0.0 Transportation –221 –18.3 147.1 153.4 –60.2 –258.5 0.0 Miscellaneous –5,265 –52.5 87.8 –53.6 –14.1 –74.1 1.5 LebanonAll 81,615 81.2 117.2 4.4 –3.8 –41.2 4.6 Animal and animal products –1,797 –20.1 73.0 –40.5 –0.2 –53.5 1.1 Vegetable products –252 –5.8 34.1 52.7 –4.1 –89.3 0.8 Foodstuffs 17,362 418.7 142.9 258.8 23.2 –17.4 11.2 Mineral products 827 53.6 109.1 1.6 –10.9 –46.8 0.6 Chemical and allied industry 1,847 19.0 114.6 –137.2 13.2 32.9 –4.5 Plastics and rubbers 8,131 1,258.0 482.1 16.3 66.1 693.1 0.4
Table 9.A.3 Constant Market Share Analysis of MENA Countries’ Exports to the European Union, 1995–2006 (continued)
Country
Change in export value
(US$ thousands)Change in
exports (%)EU growth effect (%)
Commodity composition (%)
Market composition
(%) Competitiveness (%) Residual (%)
260
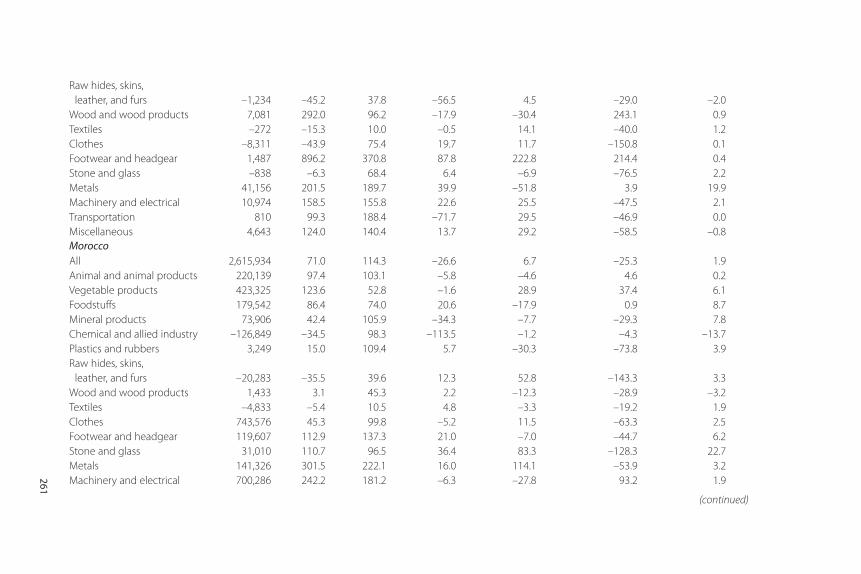
Raw hides, skins, leather, and furs –1,234 –45.2 37.8 –56.5 4.5 –29.0 –2.0
Wood and wood products 7,081 292.0 96.2 –17.9 –30.4 243.1 0.9 Textiles –272 –15.3 10.0 –0.5 14.1 –40.0 1.2 Clothes –8,311 –43.9 75.4 19.7 11.7 –150.8 0.1 Footwear and headgear 1,487 896.2 370.8 87.8 222.8 214.4 0.4 Stone and glass –838 –6.3 68.4 6.4 –6.9 –76.5 2.2 Metals 41,156 201.5 189.7 39.9 –51.8 3.9 19.9 Machinery and electrical 10,974 158.5 155.8 22.6 25.5 –47.5 2.1 Transportation 810 99.3 188.4 –71.7 29.5 –46.9 0.0 Miscellaneous 4,643 124.0 140.4 13.7 29.2 –58.5 –0.8 MoroccoAll 2,615,934 71.0 114.3 –26.6 6.7 –25.3 1.9 Animal and animal products 220,139 97.4 103.1 –5.8 –4.6 4.6 0.2 Vegetable products 423,325 123.6 52.8 –1.6 28.9 37.4 6.1 Foodstuffs 179,542 86.4 74.0 20.6 –17.9 0.9 8.7 Mineral products 73,906 42.4 105.9 –34.3 –7.7 –29.3 7.8 Chemical and allied industry –126,849 –34.5 98.3 –113.5 –1.2 –4.3 –13.7 Plastics and rubbers 3,249 15.0 109.4 5.7 –30.3 –73.8 3.9 Raw hides, skins,
leather, and furs –20,283 –35.5 39.6 12.3 52.8 –143.3 3.3 Wood and wood products 1,433 3.1 45.3 2.2 –12.3 –28.9 –3.2 Textiles –4,833 –5.4 10.5 4.8 –3.3 –19.2 1.9 Clothes 743,576 45.3 99.8 –5.2 11.5 –63.3 2.5 Footwear and headgear 119,607 112.9 137.3 21.0 –7.0 –44.7 6.2 Stone and glass 31,010 110.7 96.5 36.4 83.3 –128.3 22.7 Metals 141,326 301.5 222.1 16.0 114.1 –53.9 3.2 Machinery and electrical 700,286 242.2 181.2 –6.3 –27.8 93.2 1.9 261
(continued)
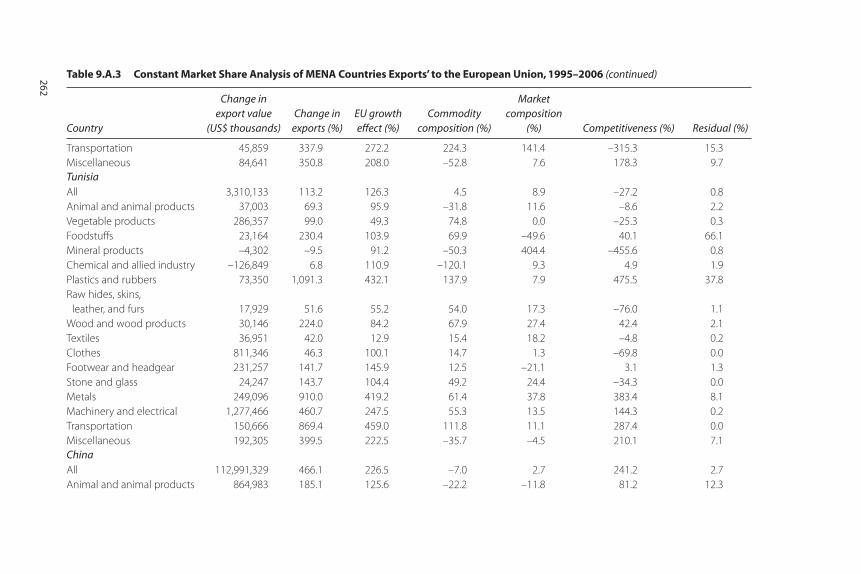
Transportation 45,859 337.9 272.2 224.3 141.4 –315.3 15.3 Miscellaneous 84,641 350.8 208.0 –52.8 7.6 178.3 9.7 TunisiaAll 3,310,133 113.2 126.3 4.5 8.9 –27.2 0.8 Animal and animal products 37,003 69.3 95.9 –31.8 11.6 –8.6 2.2 Vegetable products 286,357 99.0 49.3 74.8 0.0 –25.3 0.3 Foodstuffs 23,164 230.4 103.9 69.9 –49.6 40.1 66.1 Mineral products –4,302 –9.5 91.2 –50.3 404.4 –455.6 0.8 Chemical and allied industry –126,849 6.8 110.9 –120.1 9.3 4.9 1.9 Plastics and rubbers 73,350 1,091.3 432.1 137.9 7.9 475.5 37.8 Raw hides, skins,
leather, and furs 17,929 51.6 55.2 54.0 17.3 –76.0 1.1 Wood and wood products 30,146 224.0 84.2 67.9 27.4 42.4 2.1 Textiles 36,951 42.0 12.9 15.4 18.2 –4.8 0.2 Clothes 811,346 46.3 100.1 14.7 1.3 –69.8 0.0 Footwear and headgear 231,257 141.7 145.9 12.5 –21.1 3.1 1.3 Stone and glass 24,247 143.7 104.4 49.2 24.4 –34.3 0.0 Metals 249,096 910.0 419.2 61.4 37.8 383.4 8.1 Machinery and electrical 1,277,466 460.7 247.5 55.3 13.5 144.3 0.2 Transportation 150,666 869.4 459.0 111.8 11.1 287.4 0.0 Miscellaneous 192,305 399.5 222.5 –35.7 –4.5 210.1 7.1 ChinaAll 112,991,329 466.1 226.5 –7.0 2.7 241.2 2.7 Animal and animal products 864,983 185.1 125.6 –22.2 –11.8 81.2 12.3
Table 9.A.3 Constant Market Share Analysis of MENA Countries Exports’ to the European Union, 1995–2006 (continued)
Country
Change in export value
(US$ thousands)Change in
exports (%)EU growth effect (%)
Commodity composition (%)
Market composition
(%) Competitiveness (%) Residual (%)
262

Vegetable products 710,228 174.8 60.2 35.8 –11.2 80.2 9.7 Foodstuffs 601,714 238.6 105.6 5.3 –1.4 122.1 7.0 Mineral products 798,837 316.5 183.7 46.2 6.7 88.0 –8.1 Chemical and allied industry 3,553,712 260.1 188.1 –75.2 3.8 140.8 2.6 Plastics and rubbers 3,781,395 436.3 235.7 –5.5 –0.8 206.3 0.6 Raw hides, skins, leather,
and furs 3,097,003 163.0 75.2 43.1 0.2 44.4 0.1 Wood and wood products 2,556,944 461.1 126.0 102.4 3.1 226.9 2.6 Textiles 1,849,023 217.9 21.9 27.8 2.6 163.4 2.3 Clothes 16,263,512 411.0 199.6 –4.5 5.4 210.0 0.5 Footwear and headgear 4,894,495 316.7 198.0 –22.5 –7.8 134.9 14.1 Stone and glass 4,417,982 862.3 276.5 96.7 0.0 484.7 4.4 Metals 9,859,808 647.6 334.2 –19.3 11.9 317.6 3.2 Machinery and electrical 38,333,212 757.8 337.7 –15.3 4.0 428.1 3.2 Transportation 2,225,126 1,791.5 783.1 –20.1 –23.7 1,045.7 6.4 Miscellaneous 19,183,355 416.3 227.5 –19.0 4.3 203.0 0.4
Source: World Bank staff calculations based on Eurostat data.Note: excluding Harmonized System Codes 27, 88, and 89, and using average share in calculations.
263

264 Brenton, Shui, and Walkenhorst
Notes
1. The rules of origin for the qualified industrial zones specify a 35 percentvalue-added requirement that must be satisfied with inputs from Israel,Jordan, or the West Bank and Gaza, with a minimum of 11.7 percent fromJordan, 8.0 percent from Israel, and the remainder from any of the threeeconomies. The free trade agreement itself has a 35 percent value-added rule,all of which must be satisfied by inputs from Jordan, and a requirement thatall of the making up of the product must be undertaken in Jordan.
2. Knitted clothing (HS 61) and nonknitted clothing (HS 62) were separatedbecause of their different production technologies, which have importantimplications for the impact of rules of origin in trade agreements.
3. Egypt was less successful in increasing exports to Germany and the UnitedKingdom.
4. Under bilateral cumulation, originating materials (those that satisfy the rule oforigin that pertain to the materials) imported from a partner to the trade agree-ment, in this case textile fabrics from the European Union, can be counted assatisfying the rule of origin for qualifying inputs for the final exported product.
5. Although China had more peaks than India, India’s peak tariffs were higher.
6. This index is calculated by dividing the number of export/market bilateralflows by the number of bilateral flows that would occur if the country wereto export its products to all the markets that import such products. For details,see Brenton and Newfarmer (2009).
References
Amurgo-Pacheco, A., and M. D. Pierola. 2008. “Patterns of Export Diversificationin Developing Countries: Intensive and Extensive Margins.” Policy ResearchWorking Paper 4473, World Bank, Washington, DC.
Brenton, P., and R. Newfarmer. 2007. “Watching More than the DiscoveryChannel: Export Cycles and Diversification in Development.” Policy ResearchWorking Paper 4302, World Bank, Washington, DC.
Wagner, J. 2007. “Exports and Productivity: A Survey of the Evidence from Firm-Level Data.” World Economy 30 (1): 60–82.
World Bank. 2007. Connecting to Compete: Trade Logistics in the Global Economy,Washington DC: World Bank.
PA R T I V
Regional Integration


267
Regional trade agreements have been proliferating both in the MiddleEast and North Africa (MENA) region and globally, their number increas-ing almost sixfold over the past two decades (figure 10.1). Such agree-ments can create opportunities to expand economic links through jointaction to overcome institutional as well as policy barriers to flows ofgoods, services, capital, and labor. They can help countries reap benefitsfrom international integration while addressing their particular needsand adjustment capacities. If the reduction of intraregional trade barriersfosters partner countries to expand output and exports of products inwhich they are internationally competitive, the price of final goods or pro-duction inputs on the importing country market falls, to the benefit of con-sumers and input-purchasing producers. In this case, welfare-enhancingtrade is created.
Regional trade initiatives can also have beneficial indirect effects.Opening domestic markets to partner countries, for example, can increasecompetition in sectors with previously highly concentrated industrialstructures, reducing the monopolistic pricing power of incumbents. Suchprocompetitive impacts are particularly important for countries that haveonly nascent domestic competition policies.
Regional cooperation can also be effective in harmonizing customs pro-cedures and domestic regulations. Adopting common rules on investment,
C H A P T E R 1 0
Regional Integration: Status,Developments, and Challenges
Lulu Shui and Peter Walkenhorst

for example, has the potential to encourage increased inflows of foreigndirect investment (FDI) by enhancing the credibility of FDI policies andrestraining sudden policy reversals.
Some observers justify regional trade agreements in political econ-omy terms by viewing them as laboratories for international integra-tion, training grounds for negotiations at a broader level, and strategicmeans of making trade policy. By teaming up with regional partners,countries may be able to increase the weight of their positions ininternational trade negotiations, possibly achieving more favorablenegotiation outcomes. Regional trade agreements also make it possi-ble for countries to gain some control over the trade policy of theirpartner countries.
Pursuing regional integration is not riskless, however. Doing so can divertscarce political and administrative capacities from exploiting more prom-ising opportunities in global markets. Where several regional agreementsoverlap, differing administrative procedures—with respect to technicalstandards, customs requirements, and rules of origin—can complicate
268 Shui and Walkenhorst
Figure 10.1 The Number of Regional Agreements Grew Strongly over the Past Two Decades
Source: Authors.Note: MENA regional trade agreements are agreements that include at least one MENA country participant.
0
10
20
30
40
50
1958 1963 1968 1973 1978 1983 1988 1993 1998 2003 20080
50
100
150
200
250
300
nu
mb
er o
f new
reg
ion
al t
rad
e ag
reem
ents
cum
ula
tive
nu
mb
er o
f new
reg
ion
al t
rad
e ag
reem
ents
new regional trade agreements(left axis)
MENA world
cumulative regional trade agreements(right axis)
MENA world
transactions and raise costs for both enterprises and governments. Moreover,because regional trade agreements are inherently discriminatory, there isa risk that they cost the economy more in lost trade revenues than theyearn in increased trade, depriving local producers and consumers of effi-cient, low-cost supplies from nonpartner countries.
In dynamic regions, such as East Asia as well as parts of EasternEurope and Latin America, increased intraregional transactions precededrather than followed the conclusion of regional integration agreements(World Bank 2005). Low external trade barriers enticed producers tostrengthen their competitiveness, and the emergence of global productionnetworks in manufacturing favored specialization and cooperation withneighbors. These commercial relations were later solidified and confirmedthrough formal integration agreements.
In contrast, there are relatively few economic links across the MENAregion, and existing integration arrangements are not always effec-tively implemented. Moreover, because granting preferences to partnercountries implies discriminating against outsiders, more dynamic regionalintegration activity in regions other than MENA has left MENA exportersat a disadvantage. Thus, the region’s policy makers have an incentive topush for more ambitious and effective integration within MENA and mul-tilateral trade reform to “level the playing field.”
In fact, regional integration and active participation in global marketsdo not present exclusive or opposing choices. Many successful countrieshave built their strategy around a paradigm of “open regionalism,”which implies negotiating reciprocal preferences with regional partnerswhile opening up to international markets. Moreover, regional agree-ments can complement multilateral reforms. They can make a contribu-tion toward harmonization of rule-making. Some arrangements containprovisions in areas such as investment protection or labor migrationthat go beyond current multilateral trade law in terms of their integrativeambition (so-called WTO-plus arrangements) (OECD 2003).
Reasons for the Failure of Past Integration Attempts
MENA exhibits many economic, geographic, and cultural features thatfavor cross-country links and regional integration. Indeed, economic andpolitical integration efforts have a long history in the region (box 10.1). Themultitude of attempts to promote cross-regional links through institutionalarrangements has left a veritable spaghetti bowl of intertwined relationshipsand overlapping associations (figure 10.2). Every MENA country is a
Regional Integration: Status, Developments, and Challenges 269
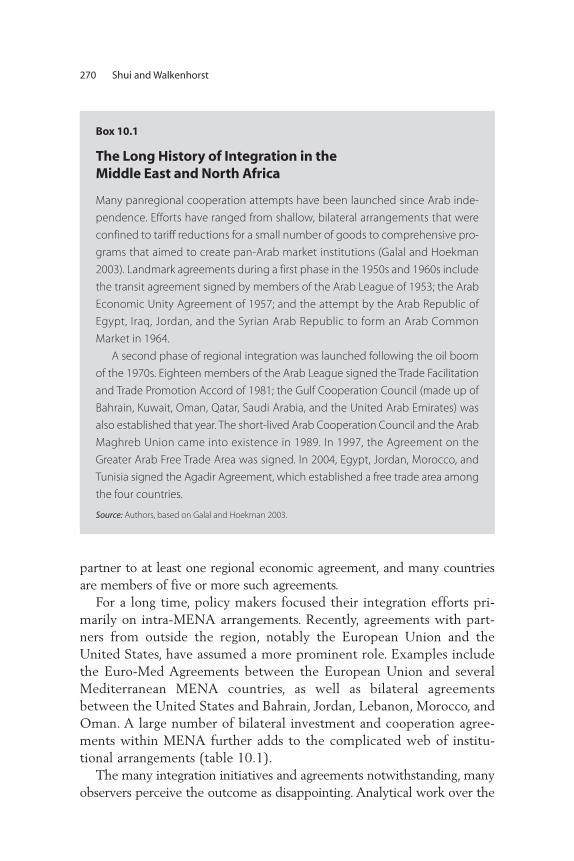
partner to at least one regional economic agreement, and many countriesare members of five or more such agreements.
For a long time, policy makers focused their integration efforts pri-marily on intra-MENA arrangements. Recently, agreements with part-ners from outside the region, notably the European Union and theUnited States, have assumed a more prominent role. Examples includethe Euro-Med Agreements between the European Union and severalMediterranean MENA countries, as well as bilateral agreementsbetween the United States and Bahrain, Jordan, Lebanon, Morocco, andOman. A large number of bilateral investment and cooperation agree-ments within MENA further adds to the complicated web of institu-tional arrangements (table 10.1).
The many integration initiatives and agreements notwithstanding, manyobservers perceive the outcome as disappointing. Analytical work over the
270 Shui and Walkenhorst
Box 10.1
The Long History of Integration in the Middle East and North Africa
Many panregional cooperation attempts have been launched since Arab inde-
pendence. Efforts have ranged from shallow, bilateral arrangements that were
confined to tariff reductions for a small number of goods to comprehensive pro-
grams that aimed to create pan-Arab market institutions (Galal and Hoekman
2003). Landmark agreements during a first phase in the 1950s and 1960s include
the transit agreement signed by members of the Arab League of 1953; the Arab
Economic Unity Agreement of 1957; and the attempt by the Arab Republic of
Egypt, Iraq, Jordan, and the Syrian Arab Republic to form an Arab Common
Market in 1964.
A second phase of regional integration was launched following the oil boom
of the 1970s. Eighteen members of the Arab League signed the Trade Facilitation
and Trade Promotion Accord of 1981; the Gulf Cooperation Council (made up of
Bahrain, Kuwait, Oman, Qatar, Saudi Arabia, and the United Arab Emirates) was
also established that year. The short-lived Arab Cooperation Council and the Arab
Maghreb Union came into existence in 1989. In 1997, the Agreement on the
Greater Arab Free Trade Area was signed. In 2004, Egypt, Jordan, Morocco, and
Tunisia signed the Agadir Agreement, which established a free trade area among
the four countries.
Source: Authors, based on Galal and Hoekman 2003.

Figure 10.2 The Network of MENA Regional Agreements Is Dense
Source: Authors.Note: Only major agreements are depicted. Agadir = Agadir Agreement for the Establishment of a Free Trade Zone between Arabic Mediterranean Nations; AMU = Arab Maghreb Union;COMESA = Common Market for Eastern and Southern Africa; ECO = Economic Cooperation Organization; EFTA = European Free Trade Association (4), includes Iceland, Liechtenstein, Norway, and Switzerland; GAFTA = Great Arab Free Trade Agreement; GCC = Gulf Cooperation Council.
United States
AMU
Algeria
Mauritania
Morocco
Tunisia
Egypt, Arab Rep. of
Libya
JordanAgadir
COMESA
LebanonWest Bank and
Gaza Iraq
Kuwait
BahrainQatar
United Arab Emirates
OmanSaudi Arabia
Sudan
GCC
Yemen, Rep. of
GAFTA MENA
Singapore
Djibouti
Burundi, Comoros,Congo (Dem. Rep. of),Eritrea, Ethiopia, Kenya,Madagascar, Malawi,Mauritius, Rwanda,Seychelles, Sudan,Swaziland, Uganda,Zambia, Zimbabwe
EFTA European Union Turkey
ECO
Iran, Islamic Rep. of
Afghanistan,Azerbaijan,Kazakhstan,Kyrgyz Republic,Pakistan,Tajikistan,Turkmenistan,Uzbekistan
regional agreements bilateral agreements
Syrian Arab Rep.
271
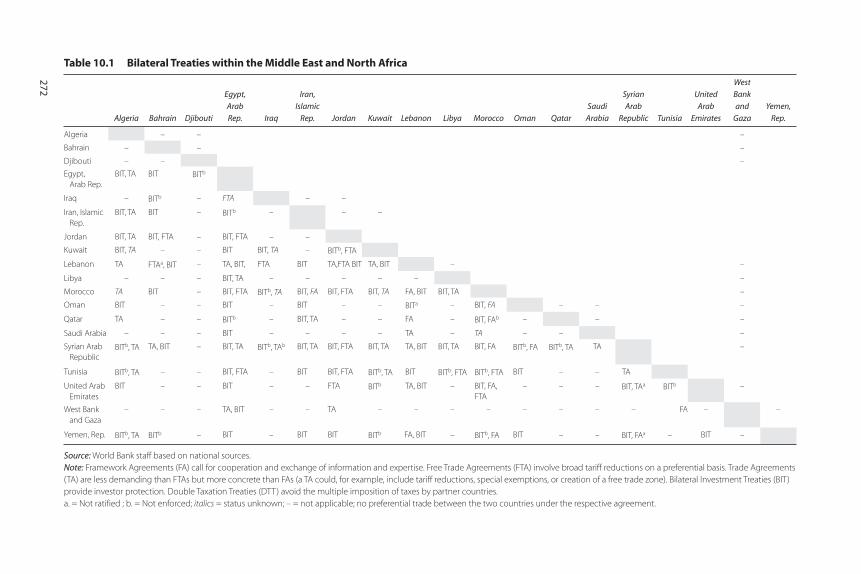
Table 10.1 Bilateral Treaties within the Middle East and North Africa
Algeria Bahrain Djibouti
Egypt,
Arab
Rep. Iraq
Iran,
Islamic
Rep. Jordan Kuwait Lebanon Libya Morocco Oman Qatar
Saudi
Arabia
Syrian
Arab
Republic Tunisia
United
Arab
Emirates
West
Bank
and
Gaza
Yemen,
Rep.
Algeria – – –
Bahrain – – –
Djibouti – – –
Egypt, Arab Rep.
BIT, TA BIT BITb
Iraq – BITb – FTA – –
Iran, IslamicRep.
BIT, TA BIT – BITb – – –
Jordan BIT, TA BIT, FTA – BIT, FTA – –
Kuwait BIT, TA – – BIT BIT, TA – BITb, FTA
Lebanon TA FTAa, BIT – TA, BIT, FTA BIT TA,FTA BIT TA, BIT – –
Libya – – – BIT, TA – – – – – –
Morocco TA BIT – BIT, FTA BITb, TA BIT, FA BIT, FTA BIT, TA FA, BIT BIT, TA –
Oman BIT – – BIT – BIT – – BITa – BIT, FA – – –
Qatar TA – – BITb – BIT, TA – – FA – BIT, FAb – – –
Saudi Arabia – – – BIT – – – – TA – TA – – –
Syrian ArabRepublic
BITb, TA TA, BIT – BIT, TA BITb, TAb BIT, TA BIT, FTA BIT, TA TA, BIT BIT, TA BIT, FA BITb, FA BITb, TA TA –
Tunisia BITb, TA – – BIT, FTA – BIT BIT, FTA BITb, TA BIT BITb, FTA BITb, FTA BIT – – TA
United ArabEmirates
BIT – – BIT – – FTA BITb TA, BIT – BIT, FA,FTA
– – – BIT, TAa BITb –
West Bankand Gaza
– – – TA, BIT – – TA – – – – – – – – FA – –
Yemen, Rep. BITb, TA BITb – BIT – BIT BIT BITb FA, BIT – BITb, FA BIT – – BIT, FAa – BIT –
Source: World Bank staff based on national sources.Note: Framework Agreements (FA) call for cooperation and exchange of information and expertise. Free Trade Agreements (FTA) involve broad tariff reductions on a preferential basis. Trade Agreements(TA) are less demanding than FTAs but more concrete than FAs (a TA could, for example, include tariff reductions, special exemptions, or creation of a free trade zone). Bilateral Investment Treaties (BIT)provide investor protection. Double Taxation Treaties (DTT) avoid the multiple imposition of taxes by partner countries. a. = Not ratified ; b. = Not enforced; italics = status unknown; – = not applicable; no preferential trade between the two countries under the respective agreement.
272

past decade indicates that integration has fallen short of expectations andlags developments in other regions. “Gravity models”—which estimatetrade potential between countries based on economic size, geographical dis-tance, and other country characteristics—consistently find that trade withinMENA is below the level project by the models (see, for example, Miniesy,Nugent, and Yousef 2004; Péridy 2005a; Achy 2006). Explanations for thislackluster integration performance include the low complementarity inproduction structures; the very uneven level of import protection across theregion; the persistence of significant nontariff barriers to trade; and the lackof coverage of services, investment, and labor mobility in past integrationefforts. The merit of these different explanations is critically assessed in thefollowing sections.
Low Complementarity and Uneven Import ProtectionThe share of intraregional trade in total merchandise trade increased overthe past two decades in many MENA countries (figure 10.3). Nevertheless,the extent of intraregional trade remains lower than in all other regionsof the world except South Asia (World Bank 2005). The ratio of
Regional Integration: Status, Developments, and Challenges 273
Figure 10.3 Many MENA Countries Have Increased Their Intraregional Trade over Time
0
10
20
30
40
50
60
1985 1990 1995 2000 2005
shar
e o
f in
tra-
MEN
A m
erch
and
ise
exp
ort
s in
tota
l mer
chan
dis
e ex
po
rts,
%
Algeria Bahrain Egypt, Arab Rep. of Iran, Islamic Rep. of
Jordan Kuwait United Arab Emirates
Source: IMF Directions of Trade database.
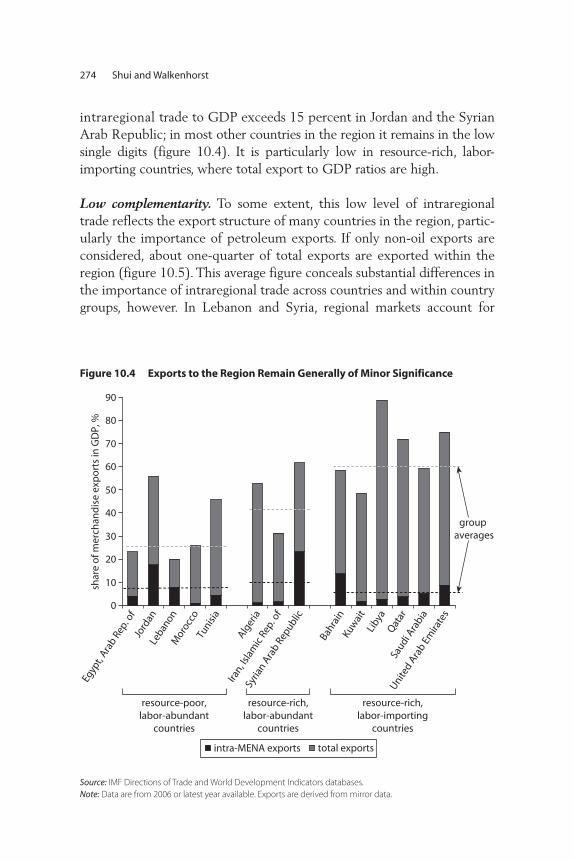
intraregional trade to GDP exceeds 15 percent in Jordan and the SyrianArab Republic; in most other countries in the region it remains in the lowsingle digits (figure 10.4). It is particularly low in resource-rich, labor-importing countries, where total export to GDP ratios are high.
Low complementarity. To some extent, this low level of intraregionaltrade reflects the export structure of many countries in the region, partic-ularly the importance of petroleum exports. If only non-oil exports areconsidered, about one-quarter of total exports are exported within theregion (figure 10.5). This average figure conceals substantial differences inthe importance of intraregional trade across countries and within countrygroups, however. In Lebanon and Syria, regional markets account for
274 Shui and Walkenhorst
Figure 10.4 Exports to the Region Remain Generally of Minor Significance
Source: IMF Directions of Trade and World Development Indicators databases.Note: Data are from 2006 or latest year available. Exports are derived from mirror data.
0
10
20
30
40
50
60
70
80
90
Egyp
t, Ara
b Rep
. of
Jord
anLe
banon
Mor
occo
Tunisi
a
Alger
ia
Iran, Is
lam
ic R
ep. o
f
Syria
n Ara
b Rep
ublic
Bahra
inKu
wai
tLi
byaQ
atar
Saud
i Ara
bia
United A
rab E
mira
tes
total exportsintra-MENA exports
resource-poor,labor-abundant
countries
resource-rich,labor-abundant
countries
resource-rich,labor-importing
countries
group averages
shar
e o
f mer
chan
dis
e ex
po
rts
in G
DP,
%
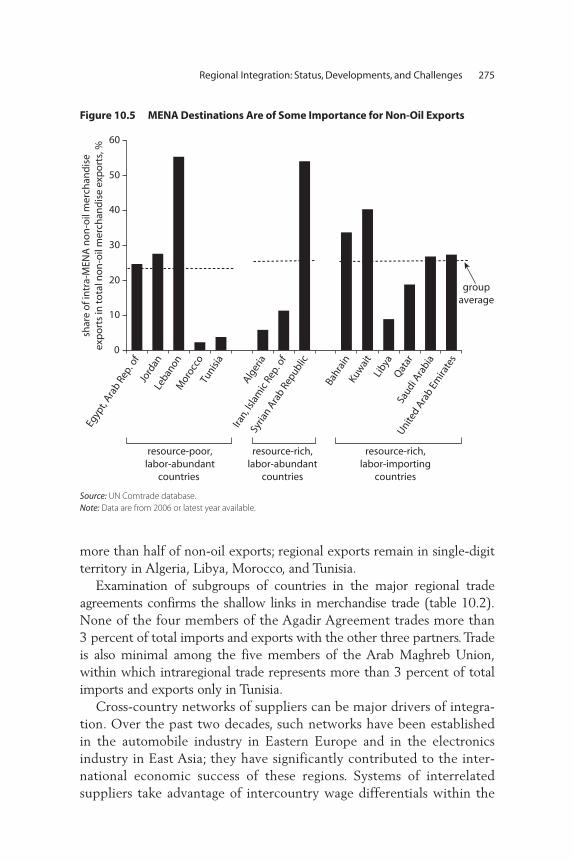
more than half of non-oil exports; regional exports remain in single-digitterritory in Algeria, Libya, Morocco, and Tunisia.
Examination of subgroups of countries in the major regional tradeagreements confirms the shallow links in merchandise trade (table 10.2).None of the four members of the Agadir Agreement trades more than3 percent of total imports and exports with the other three partners. Tradeis also minimal among the five members of the Arab Maghreb Union,within which intraregional trade represents more than 3 percent of totalimports and exports only in Tunisia.
Cross-country networks of suppliers can be major drivers of integra-tion. Over the past two decades, such networks have been establishedin the automobile industry in Eastern Europe and in the electronicsindustry in East Asia; they have significantly contributed to the inter-national economic success of these regions. Systems of interrelatedsuppliers take advantage of intercountry wage differentials within the
Regional Integration: Status, Developments, and Challenges 275
Figure 10.5 MENA Destinations Are of Some Importance for Non-Oil Exports
0
10
20
30
40
50
60
groupaverage
Egyp
t, Ara
b Rep
. of
Jord
anLe
banon
Mor
occo
Tunisi
a
Alger
ia
Iran, Is
lam
ic R
ep. o
f
Syria
n Ara
b Rep
ublic
Bahra
inKu
wai
tLi
byaQ
atar
Saud
i Ara
bia
United A
rab E
mira
tes
resource-poor,labor-abundant
countries
shar
e o
f in
tra-
MEN
A n
on
-oil
mer
chan
dis
eex
po
rts
in t
ota
l no
n-o
il m
erch
and
ise
exp
ort
s, %
resource-rich,labor-abundant
countries
resource-rich,labor-importing
countries
Source: UN Comtrade database.Note: Data are from 2006 or latest year available.
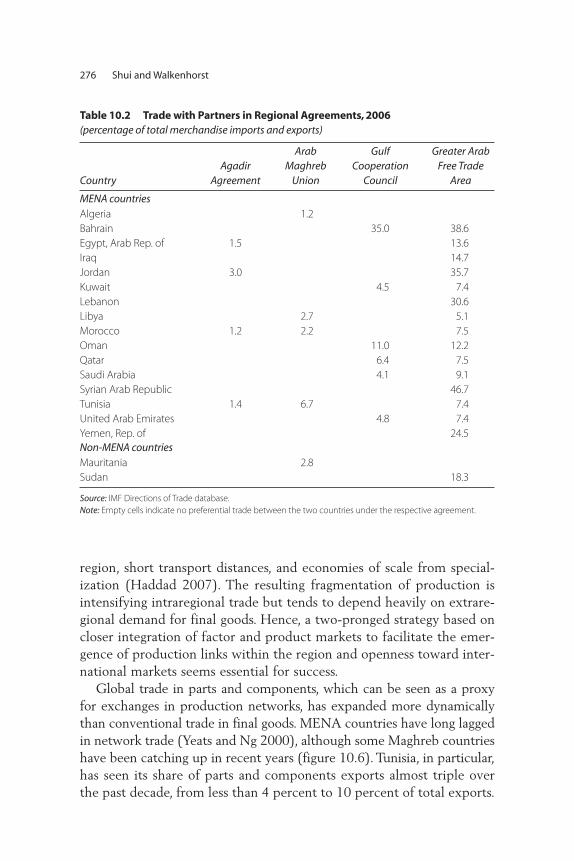
region, short transport distances, and economies of scale from special-ization (Haddad 2007). The resulting fragmentation of production isintensifying intraregional trade but tends to depend heavily on extrare-gional demand for final goods. Hence, a two-pronged strategy based oncloser integration of factor and product markets to facilitate the emer-gence of production links within the region and openness toward inter-national markets seems essential for success.
Global trade in parts and components, which can be seen as a proxyfor exchanges in production networks, has expanded more dynamicallythan conventional trade in final goods. MENA countries have long laggedin network trade (Yeats and Ng 2000), although some Maghreb countrieshave been catching up in recent years (figure 10.6). Tunisia, in particular,has seen its share of parts and components exports almost triple overthe past decade, from less than 4 percent to 10 percent of total exports.
276 Shui and Walkenhorst
Table 10.2 Trade with Partners in Regional Agreements, 2006(percentage of total merchandise imports and exports)
CountryAgadir
Agreement
ArabMaghreb
Union
GulfCooperation
Council
Greater ArabFree Trade
Area
MENA countriesAlgeria 1.2Bahrain 35.0 38.6Egypt, Arab Rep. of 1.5 13.6Iraq 14.7Jordan 3.0 35.7Kuwait 4.5 7.4Lebanon 30.6Libya 2.7 5.1Morocco 1.2 2.2 7.5Oman 11.0 12.2Qatar 6.4 7.5Saudi Arabia 4.1 9.1Syrian Arab Republic 46.7Tunisia 1.4 6.7 7.4United Arab Emirates 4.8 7.4Yemen, Rep. of 24.5Non-MENA countriesMauritania 2.8Sudan 18.3
Source: IMF Directions of Trade database.Note: Empty cells indicate no preferential trade between the two countries under the respective agreement.
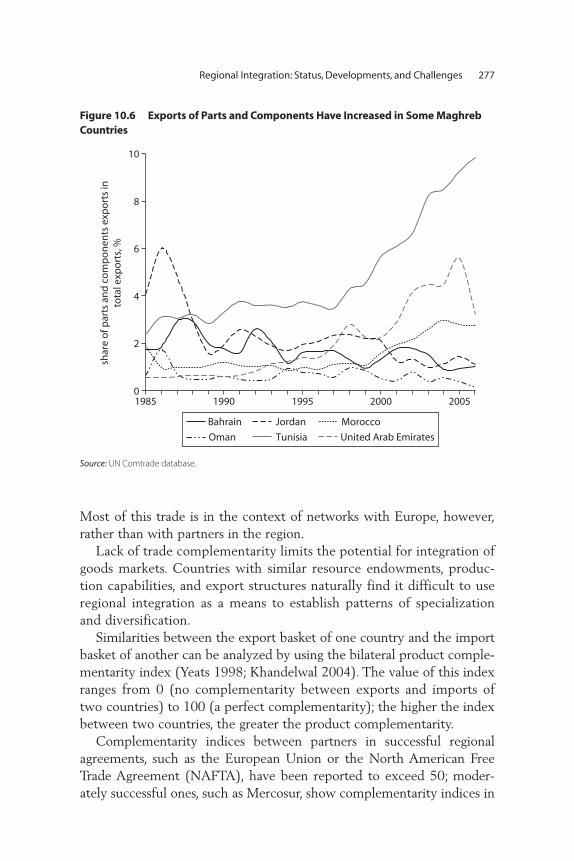
Most of this trade is in the context of networks with Europe, however,rather than with partners in the region.
Lack of trade complementarity limits the potential for integration ofgoods markets. Countries with similar resource endowments, produc-tion capabilities, and export structures naturally find it difficult to useregional integration as a means to establish patterns of specializationand diversification.
Similarities between the export basket of one country and the importbasket of another can be analyzed by using the bilateral product comple-mentarity index (Yeats 1998; Khandelwal 2004). The value of this indexranges from 0 (no complementarity between exports and imports oftwo countries) to 100 (a perfect complementarity); the higher the indexbetween two countries, the greater the product complementarity.
Complementarity indices between partners in successful regionalagreements, such as the European Union or the North American FreeTrade Agreement (NAFTA), have been reported to exceed 50; moder-ately successful ones, such as Mercosur, show complementarity indices in
Regional Integration: Status, Developments, and Challenges 277
Figure 10.6 Exports of Parts and Components Have Increased in Some MaghrebCountries
0
2
4
6
8
10
1985 1990 1995
shar
e o
f par
ts a
nd
co
mp
on
ents
exp
ort
s in
tota
l exp
ort
s, %
2000 2005
Bahrain Jordan Morocco
Oman Tunisia United Arab Emirates
Source: UN Comtrade database.
the range of 25–30 (Yeats 1998). In contrast, the bilateral complementar-ity between pairs of MENA countries is low, rarely exceeding single-digitlevels (table 10.3). In most cases, the complementarity of non-oil trade ishigher than for total trade, although it still exceeds a value of 20.
One positive outlier in the data is Bahrain, which as an importer showsvery strong complementarity with other fuel exporters in the region. Thisfinding is driven by the Bahrain Petroleum Company’s refinery, one ofthe largest processing facilities in the Middle East. The unit’s refiningcapacity is taken up only partly by processing crude petroleum thatoriginates from Bahrain’s own oil field; the remaining spare capacity isused for refining imported crude. Hence, Bahrain appears in trade sta-tistics as a large-scale petroleum importer (and large-scale exporter ofrefined petroleum products) and a complementary trading partner tothe crude petroleum exporters in the region.
The findings of overall low trade complementarity in the region areconsistent with earlier analysis (see, for example, Havrylyshyn and Kunzel2000). Some observers note that complementarity is higher with Northerntrading partners (for example, EU members and the United States) thanwith countries within the region (Péridy 2005b). Regional integrationpolicies are thus likely to change the pattern of complementarity onlygradually and over the longer term.
Uneven import protection. Another impediment to successful integrationis the uneven level of import protection across the region. Differencesin tariffs imply that industries in partner countries benefit to a differingextent from policy-generated transfers, so that the costs and benefitsof moving to freer trade are unevenly distributed. Under these circum-stances, achieving agreement to open markets among regional partnersis politically difficult.
Moreover, maintaining high most-favored-nation (MFN) tariffs is asso-ciated with a high risk of economically costly trade diversion. In particu-lar, selective opening toward regional partners can divert trade flows frommore efficient third-country producers to less efficient partner countryproducers, resulting in a loss of tariff revenues without the benefits oflower purchasing costs. Hence, high-protection countries can be adverselyaffected by regional integration. The risk of trade diversion is furtherincreased if the intensity of trade between partners before bilateral liber-alization is low, as it is in MENA.
The simple average of MFN duties in MENA countries ranges fromabout 5 percent in the Gulf Cooperation Council (GCC) countries and
278 Shui and Walkenhorst
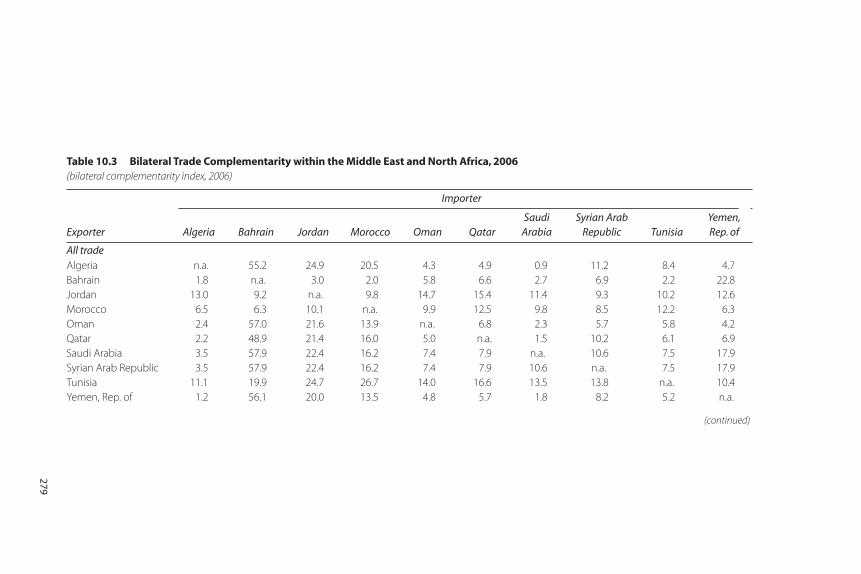
Table 10.3 Bilateral Trade Complementarity within the Middle East and North Africa, 2006 (bilateral complementarity index, 2006)
Exporter
Importer
Algeria Bahrain Jordan Morocco Oman QatarSaudi
ArabiaSyrian Arab
Republic TunisiaYemen,Rep. of
All tradeAlgeria n.a. 55.2 24.9 20.5 4.3 4.9 0.9 11.2 8.4 4.7Bahrain 1.8 n.a. 3.0 2.0 5.8 6.6 2.7 6.9 2.2 22.8Jordan 13.0 9.2 n.a. 9.8 14.7 15.4 11.4 9.3 10.2 12.6Morocco 6.5 6.3 10.1 n.a. 9.9 12.5 9.8 8.5 12.2 6.3Oman 2.4 57.0 21.6 13.9 n.a. 6.8 2.3 5.7 5.8 4.2Qatar 2.2 48.9 21.4 16.0 5.0 n.a. 1.5 10.2 6.1 6.9Saudi Arabia 3.5 57.9 22.4 16.2 7.4 7.9 n.a. 10.6 7.5 17.9Syrian Arab Republic 3.5 57.9 22.4 16.2 7.4 7.9 10.6 n.a. 7.5 17.9Tunisia 11.1 19.9 24.7 26.7 14.0 16.6 13.5 13.8 n.a. 10.4Yemen, Rep. of 1.2 56.1 20.0 13.5 4.8 5.7 1.8 8.2 5.2 n.a.
279
(continued)
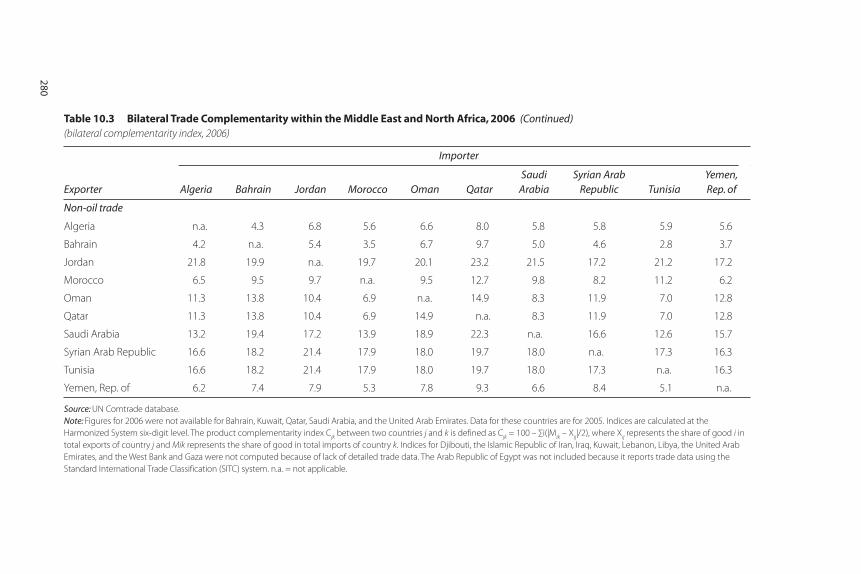
280
Non-oil trade
Algeria n.a. 4.3 6.8 5.6 6.6 8.0 5.8 5.8 5.9 5.6
Bahrain 4.2 n.a. 5.4 3.5 6.7 9.7 5.0 4.6 2.8 3.7
Jordan 21.8 19.9 n.a. 19.7 20.1 23.2 21.5 17.2 21.2 17.2
Morocco 6.5 9.5 9.7 n.a. 9.5 12.7 9.8 8.2 11.2 6.2
Oman 11.3 13.8 10.4 6.9 n.a. 14.9 8.3 11.9 7.0 12.8
Qatar 11.3 13.8 10.4 6.9 14.9 n.a. 8.3 11.9 7.0 12.8
Saudi Arabia 13.2 19.4 17.2 13.9 18.9 22.3 n.a. 16.6 12.6 15.7
Syrian Arab Republic 16.6 18.2 21.4 17.9 18.0 19.7 18.0 n.a. 17.3 16.3
Tunisia 16.6 18.2 21.4 17.9 18.0 19.7 18.0 17.3 n.a. 16.3
Yemen, Rep. of 6.2 7.4 7.9 5.3 7.8 9.3 6.6 8.4 5.1 n.a.
Source: UN Comtrade database.Note: Figures for 2006 were not available for Bahrain, Kuwait, Qatar, Saudi Arabia, and the United Arab Emirates. Data for these countries are for 2005. Indices are calculated at the Harmonized System six-digit level. The product complementarity index Cjk between two countries j and k is defined as Cjk = 100 – ∑i(|Mik – Xij|/2), where Xij represents the share of good i intotal exports of country j and Mik represents the share of good in total imports of country k. Indices for Djibouti, the Islamic Republic of Iran, Iraq, Kuwait, Lebanon, Libya, the United ArabEmirates, and the West Bank and Gaza were not computed because of lack of detailed trade data. The Arab Republic of Egypt was not included because it reports trade data using theStandard International Trade Classification (SITC) system. n.a. = not applicable.
Table 10.3 Bilateral Trade Complementarity within the Middle East and North Africa, 2006 (Continued)(bilateral complementarity index, 2006)
Exporter
Importer
Algeria Bahrain Jordan Morocco Oman QatarSaudi
ArabiaSyrian Arab
Republic TunisiaYemen,Rep. of
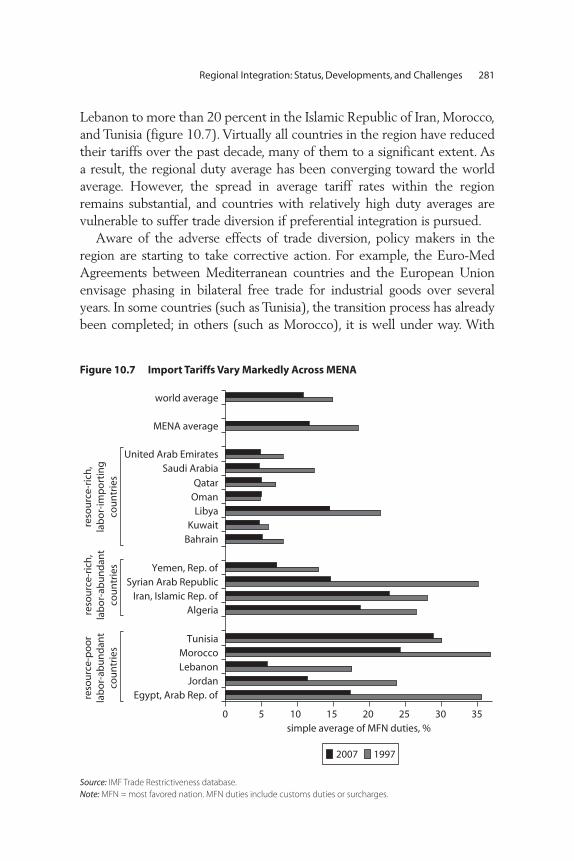
Lebanon to more than 20 percent in the Islamic Republic of Iran, Morocco,and Tunisia (figure 10.7). Virtually all countries in the region have reducedtheir tariffs over the past decade, many of them to a significant extent. Asa result, the regional duty average has been converging toward the worldaverage. However, the spread in average tariff rates within the regionremains substantial, and countries with relatively high duty averages arevulnerable to suffer trade diversion if preferential integration is pursued.
Aware of the adverse effects of trade diversion, policy makers in theregion are starting to take corrective action. For example, the Euro-MedAgreements between Mediterranean countries and the European Unionenvisage phasing in bilateral free trade for industrial goods over severalyears. In some countries (such as Tunisia), the transition process has alreadybeen completed; in others (such as Morocco), it is well under way. With
Regional Integration: Status, Developments, and Challenges 281
Figure 10.7 Import Tariffs Vary Markedly Across MENA
Source: IMF Trade Restrictiveness database.Note: MFN = most favored nation. MFN duties include customs duties or surcharges.
0 5 10 15simple average of MFN duties, %
20 25 30 35
Egypt, Arab Rep. ofJordan
LebanonMorocco
Tunisia
AlgeriaIran, Islamic Rep. of
Syrian Arab RepublicYemen, Rep. of
BahrainKuwait
LibyaOmanQatar
Saudi ArabiaUnited Arab Emirates
MENA average
world average
2007 1997
reso
urc
e-ri
ch,
lab
or-
imp
ort
ing
cou
ntr
ies
reso
urc
e-ri
ch,
lab
or-
abu
nd
ant
cou
ntr
ies
reso
urc
e-p
oo
rla
bo
r-ab
un
dan
tco
un
trie
s

high external trade barriers, there is a risk that trade is diverted fromlow-cost third-country producers (such as Indian suppliers of genericpharmaceuticals) to high-cost EU producers (such as European suppliersof branded pharmaceuticals). To avoid or contain the ensuing fiscal andeconomic loss, countries have started to reduce their MFN tariffs, limit-ing the preference margin they grant to their EU partners. This processwill have to continue if it is to have the desired effect of reducing andeliminating adverse impacts of trade diversion.
Nontariff Barriers and Poor Trade Logistics With the worldwide progress made in tariff reduction over the past twodecades, policy makers have increasingly turned their attention towardregulatory and logistical impediments to trade, which now are often morecostly than tariffs and generate no offsetting revenue. Cooperative effortsby governments to remove discriminatory regulations, improve customsprocedures, and reduce transport costs are, therefore, important aspects ofmodern regional agreements. MENA countries face substantial challengesin this area because of a legacy of restrictive nontariff measures and neg-lect of trade-facilitating efforts.
The situation is captured in recent analytical work. In particular, ateam of analysts in the World Bank’s Research Department has estimatedan Overall Trade Restrictiveness Index (OTRI). This index corresponds tothe uniform tariff that if imposed on all imports from partner countrieswould leave overall imports unchanged. The measure makes it possible todisaggregate total barriers to trade into tariff and nontariff components.The estimation is based on data for the early 2000s (Kee, Nicita, andOlarreaga 2005).
The analysis reveals that nontariff barriers to trade are more substan-tial in the MENA than in any other region of the world (figure 10.8).Nontariff barriers contribute more to trade restrictiveness than do tariffs.They are particularly pervasive and restrictive in labor-abundant MENAcountries.
In some cases, nontariff barriers can significantly reduce or even nullifythe trade preferences in regional agreements. For example, the Greater ArabFree Trade Area (GAFTA) Agreement phased in preferential tariff reduc-tions among members, leading to free intraregional trade by 2005.However, some importing countries asked exporters from partner countriesto obtain special import permits that have to be presented to the borderagencies to benefit from the preferences (Filali 2007). If an import-competing industry can be harmed by the imports, these permits are
282 Shui and Walkenhorst
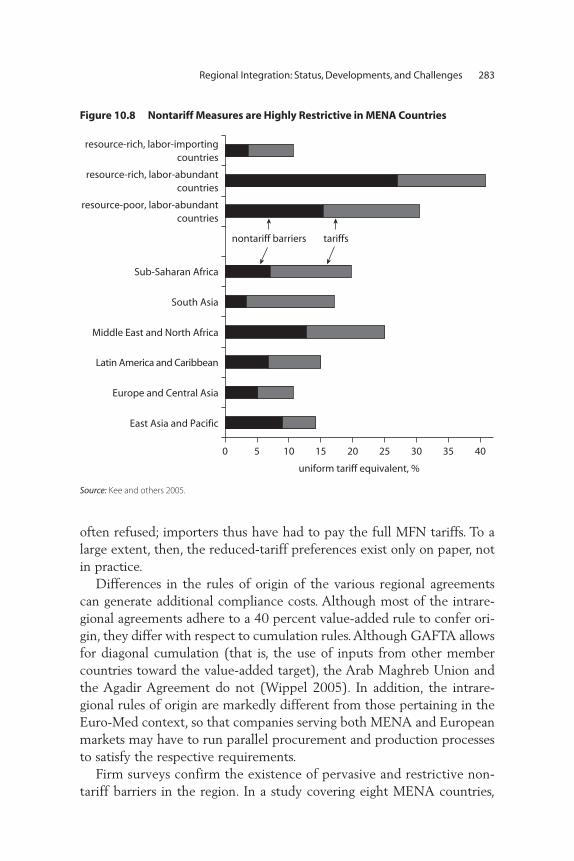
often refused; importers thus have had to pay the full MFN tariffs. To alarge extent, then, the reduced-tariff preferences exist only on paper, notin practice.
Differences in the rules of origin of the various regional agreementscan generate additional compliance costs. Although most of the intrare-gional agreements adhere to a 40 percent value-added rule to confer ori-gin, they differ with respect to cumulation rules. Although GAFTA allowsfor diagonal cumulation (that is, the use of inputs from other membercountries toward the value-added target), the Arab Maghreb Union andthe Agadir Agreement do not (Wippel 2005). In addition, the intrare-gional rules of origin are markedly different from those pertaining in theEuro-Med context, so that companies serving both MENA and Europeanmarkets may have to run parallel procurement and production processesto satisfy the respective requirements.
Firm surveys confirm the existence of pervasive and restrictive non-tariff barriers in the region. In a study covering eight MENA countries,
Regional Integration: Status, Developments, and Challenges 283
Figure 10.8 Nontariff Measures are Highly Restrictive in MENA Countries
0 5 10 15 20
uniform tariff equivalent, %
25 30 35 40
East Asia and Pacific
Europe and Central Asia
Latin America and Caribbean
Middle East and North Africa
South Asia
Sub-Saharan Africa
resource-poor, labor-abundantcountries
resource-rich, labor-abundantcountries
resource-rich, labor-importingcountries
nontariff barriers tariffs
Source: Kee and others 2005.

Zarrouk (2003) finds that companies put the costs of complying withnontariff measures at more than 10 percent of the value of goods shippedon average. Companies complain about cumbersome regulations andinefficient or inappropriate border procedures.
Indeed, importing and exporting activities appear to be more difficultto undertake in MENA countries than in other middle-income economies(figure 10.9). Although on average MENA governments require lighterimporting and exporting documentation than their counterparts inlow-income Sub-Saharan Africa or in South Asia, the number of doc-uments exceeds the average for middle-income Latin America andEast Asia. A similar picture emerges with respect to border delays andthe time required to complete the importing or exporting process(figure 10.10).
The World Bank’s new Logistics Performance Index (World Bank2007a), which is based on a worldwide survey of global freight forwardersand express carriers, makes it possible to compare countries across a broadset of transport and trade facilitation dimensions. Richer countries are in aposition to devote more resources to investments in transport infrastruc-ture, interagency coordination, and staff training; trade transactions costs in
284 Shui and Walkenhorst
Figure 10.9 Trade Procedures in MENA Are Cumbersome
5 6 7
number of documents required
8 9 10
East Asia and Pacific
Eastern Europe and Central Asia
Latin America and Caribbean
Middle East and North Africa
Sub-Saharan Africa
South Asia
East Asia and Pacific
Latin America and Caribbean
Middle East and North Africa
Europe and Central Asia
Sub-Saharan Africa
South Asia
imp
ort
do
cum
ents
exp
ort
do
cum
ents
Source: World Bank Doing Business 2008 database.

such countries therefore tend to be lower than in poorer economies.The vast majority of MENA countries score below the level of logis-tics performance that would be expected given their level of income(figure 10.11). Only Jordan, Tunisia, the United Arab Emirates, and theRepublic of Yemen meet or exceed the world average of countries intheir income class. All other MENA countries fall short of expectations,in some cases considerably so.
The Logistics Performance Index also provides information on severaldimensions of trade and transport logistics (figure 10.12). The observednumerical differences in the indicators are small, but these divergencesrepresent significant differences in logistics performance. On average,having a Logistics Performance Index that is one point lower than a comparator implies six additional days for getting imports from the portto a firm’s warehouse, three additional days for clearing exports, and afive-times-greater likelihood that a shipment is subject to physical inspec-tion at entry.
Many MENA countries score below the world average in customs andcoordination among border agencies, logistics competence, and timeliness
Regional Integration: Status, Developments, and Challenges 285
Figure 10.10 Trade Procedures in MENA Are Time Consuming
0 5 10 15 20 25
number of days required
30 35 40
Latin America and Caribbean
East Asia and Pacific
Middle East and North Africa
Europe and Central Asia
South Asia
Sub-Saharan Africa
East Asia and Pacific
Latin America and Caribbean
Middle East and North Africa
Europe and Central Asia
South Asia
Sub-Saharan Africa
imp
ort
sex
po
rts
Source: World Bank Doing Business 2008 database.

of shipments. The most marked logistics challenges are observed amongthe resource-rich labor-abundant group of countries, with particularlypronounced gaps in logistics competence and cargo tracking and tracing.This poor performance might reflect lack of pressure from the privatesector to implement institutional reforms of trade and transport proce-dures as the result of the dominance of fuel exports.
Logistics impediments affect both global and regional trade. Logisticschain analysis suggests that transport and nontransport logistics costs forexport commodities from the MENA region represent 7–25 percent oflanded product prices (Devlin and Yee 2005). It would appear that signif-icant gains could be reaped from overhauling the regulatory regime forthe trucking sector, increasing competition in port and air freight services,reorienting customs authorities toward trade facilitation, and developingcross-border transit procedures similar to the TIR (transit internationalroutier) carnets model, which provides authorized operators with the facil-ity to transport sealed containers from a customs office of departure in onecountry to a customs office of destination in another country. Addressingport congestion, improving transshipment regulation, and building an inte-grated multimodal transportation system could also yield high dividends
286 Shui and Walkenhorst
Figure 10.11 The Logistics Performance of Most MENA Countries Is Below Expectations
1.5
2.0
2.5
3.0
3.5
4.0
4.5
0 5 10 15 20 25 30 35 40 45
per capita income, US$ thousands (PPP)
ove
rall
log
isti
cs p
erfo
rman
ce in
dex
(hig
her
is b
ette
r)
Djibouti Algeria
Yemen, Rep. of
Egypt, Arab Rep. of
Morocco
Jordan
Lebanon Iran, Islamic Rep. of
Tunisia
SaudiArabia
Bahrain Kuwait
UnitedArab
Emirates trend line
Syrian Arab Republic
Source: World Bank 2007a.Note: The small diamonds are non-MENA countries. PPP = purchasing power parity.
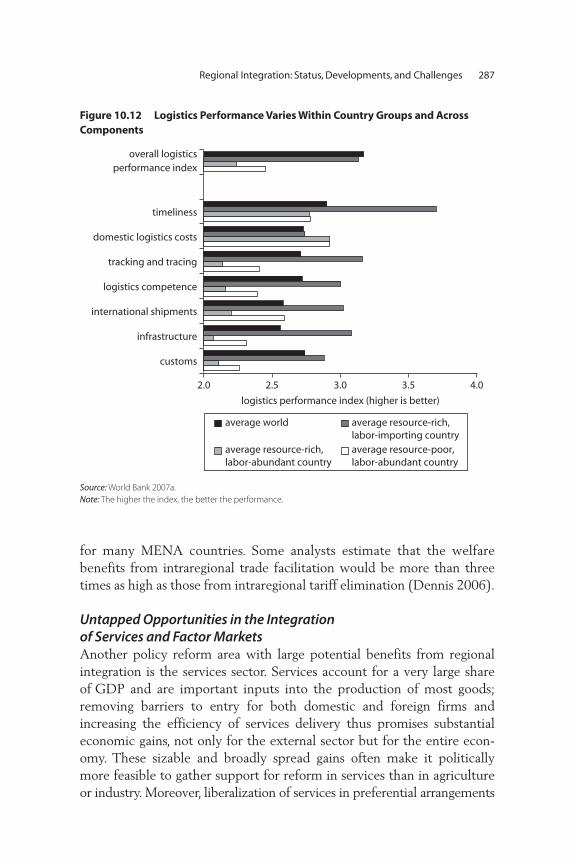
for many MENA countries. Some analysts estimate that the welfarebenefits from intraregional trade facilitation would be more than threetimes as high as those from intraregional tariff elimination (Dennis 2006).
Untapped Opportunities in the Integration of Services and Factor Markets Another policy reform area with large potential benefits from regionalintegration is the services sector. Services account for a very large shareof GDP and are important inputs into the production of most goods;removing barriers to entry for both domestic and foreign firms andincreasing the efficiency of services delivery thus promises substantialeconomic gains, not only for the external sector but for the entire econ-omy. These sizable and broadly spread gains often make it politicallymore feasible to gather support for reform in services than in agricultureor industry. Moreover, liberalization of services in preferential arrangements
Regional Integration: Status, Developments, and Challenges 287
Figure 10.12 Logistics Performance Varies Within Country Groups and Across Components
2.0 2.5 3.0
logistics performance index (higher is better)
3.5 4.0
customs
infrastructure
international shipments
logistics competence
tracking and tracing
domestic logistics costs
timeliness
overall logisticsperformance index
average world average resource-rich,labor-importing country
average resource-rich,labor-abundant country
average resource-poor,labor-abundant country
Source: World Bank 2007a.Note: The higher the index, the better the performance.

carries fewer risks of income losses than preferential merchandise trade,because lifting most common services restrictions does not cost the gov-ernment revenues; there are thus no trade diversion effects.
Quantitative analysis using economywide models suggests that in Egyptand Tunisia, comprehensive reforms of services that involve increasedcompetition and regulatory streamlining would yield benefits that are twoto three times as great as those achieved through tariff removal alone(Konan 2003). The size of the reform benefits depends, of course, on theextent of prereform openness and the efficiency of the domestic servicessector, the capacity of countries to cope with adjustment needs, and thepolitical commitment to modernization. MENA countries have in the pasttaken very different approaches toward international services integration,as illustrated by the very diverse extent of General Agreement on Trade inServices (GATS) liberalization commitments of the region’s World TradeOrganization (WTO) members (figure 10.13).
Regional integration agreements in MENA generally do not cover serv-ices trade or do so only to a minimal extent (for example, through inten-tions of cooperation in certain services sectors). Intraregional differencesin regulations, restrictions on currency convertibility, and limits on the
288 Shui and Walkenhorst
Figure 10.13 GATS Commitments Illustrate Varying Reform Mindedness across the Region
0 5 10 15 20 25 30 35 40
Bahrain
Qatar
United Arab Emirates
Kuwait
Oman
Saudi Arabia
Tunisia
Djibouti
Egypt, Arab Rep. of
Morocco
Jordan
number of subsectors covered (out of 55)
share of liberalization commitmentsshare of unbound commitments
reso
urc
e-ri
ch,
lab
or-
imp
ort
ing
cou
ntr
ies
reso
urc
e-p
oo
r,la
bo
r-ab
un
dan
tco
un
trie
s
Source: Authors, based on national GATS schedules.
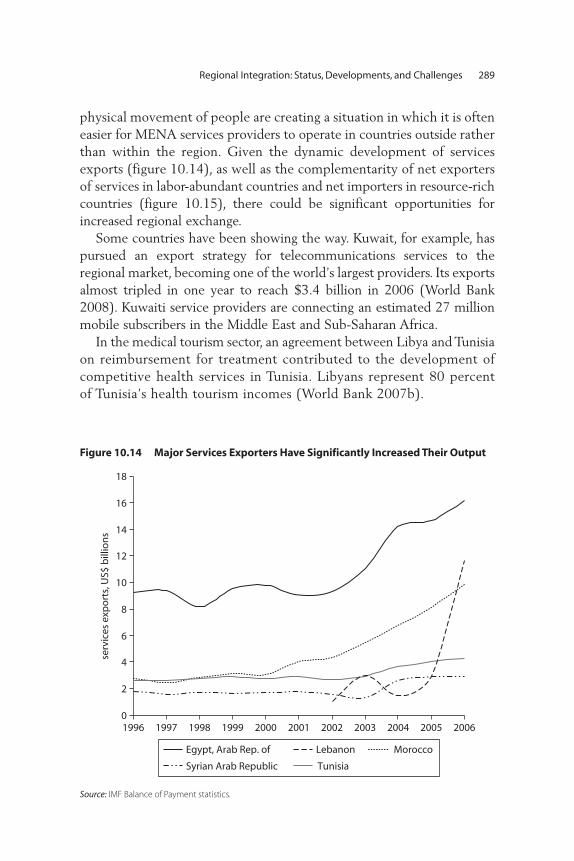
physical movement of people are creating a situation in which it is ofteneasier for MENA services providers to operate in countries outside ratherthan within the region. Given the dynamic development of servicesexports (figure 10.14), as well as the complementarity of net exportersof services in labor-abundant countries and net importers in resource-richcountries (figure 10.15), there could be significant opportunities forincreased regional exchange.
Some countries have been showing the way. Kuwait, for example, haspursued an export strategy for telecommunications services to theregional market, becoming one of the world’s largest providers. Its exportsalmost tripled in one year to reach $3.4 billion in 2006 (World Bank2008). Kuwaiti service providers are connecting an estimated 27 millionmobile subscribers in the Middle East and Sub-Saharan Africa.
In the medical tourism sector, an agreement between Libya and Tunisiaon reimbursement for treatment contributed to the development ofcompetitive health services in Tunisia. Libyans represent 80 percentof Tunisia’s health tourism incomes (World Bank 2007b).
Regional Integration: Status, Developments, and Challenges 289
Figure 10.14 Major Services Exporters Have Significantly Increased Their Output
0
2
4
6
8
10
12
14
16
18
1996 1997 1998 1999 2000
serv
ices
exp
ort
s, U
S$ b
illio
ns
2001 2002 2003 2004 2005 2006
Egypt, Arab Rep. of Lebanon Morocco
Syrian Arab Republic Tunisia
Source: IMF Balance of Payment statistics.
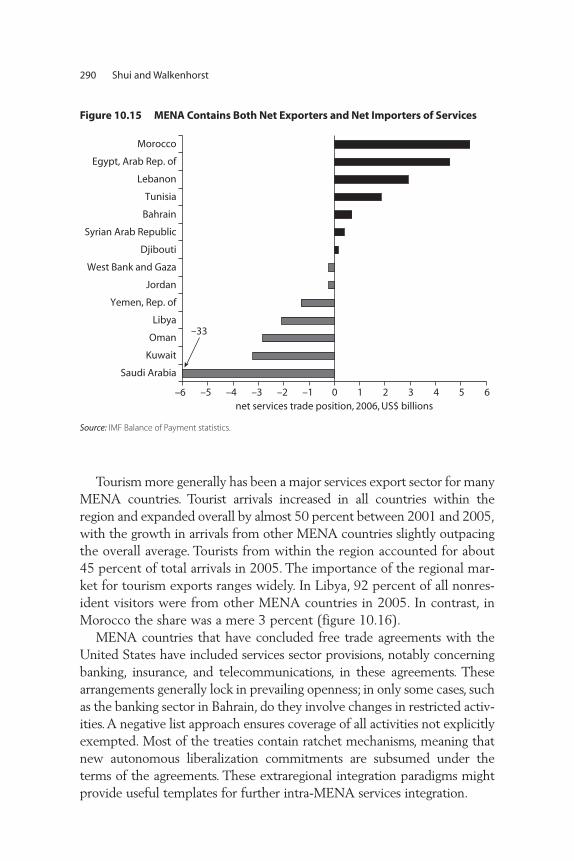
Tourism more generally has been a major services export sector for manyMENA countries. Tourist arrivals increased in all countries within theregion and expanded overall by almost 50 percent between 2001 and 2005,with the growth in arrivals from other MENA countries slightly outpacingthe overall average. Tourists from within the region accounted for about45 percent of total arrivals in 2005. The importance of the regional mar-ket for tourism exports ranges widely. In Libya, 92 percent of all nonres-ident visitors were from other MENA countries in 2005. In contrast, inMorocco the share was a mere 3 percent (figure 10.16).
MENA countries that have concluded free trade agreements with theUnited States have included services sector provisions, notably concerningbanking, insurance, and telecommunications, in these agreements. Thesearrangements generally lock in prevailing openness; in only some cases, suchas the banking sector in Bahrain, do they involve changes in restricted activ-ities. A negative list approach ensures coverage of all activities not explicitlyexempted. Most of the treaties contain ratchet mechanisms, meaning thatnew autonomous liberalization commitments are subsumed under theterms of the agreements. These extraregional integration paradigms mightprovide useful templates for further intra-MENA services integration.
290 Shui and Walkenhorst
Figure 10.15 MENA Contains Both Net Exporters and Net Importers of Services
–6 –5 –4 –3 –2 –1 0net services trade position, 2006, US$ billions
1 2 3 4 5 6
Saudi Arabia
Kuwait
Oman
Libya
Yemen, Rep. of
Jordan
West Bank and Gaza
Djibouti
Syrian Arab Republic
Bahrain
Tunisia
Lebanon
Egypt, Arab Rep. of
Morocco
–33
Source: IMF Balance of Payment statistics.
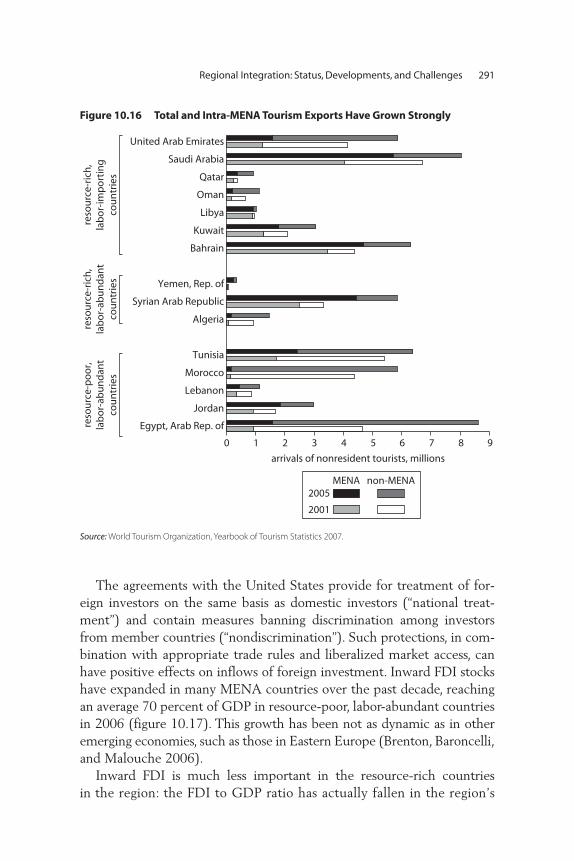
The agreements with the United States provide for treatment of for-eign investors on the same basis as domestic investors (“national treat-ment”) and contain measures banning discrimination among investorsfrom member countries (“nondiscrimination”). Such protections, in com-bination with appropriate trade rules and liberalized market access, canhave positive effects on inflows of foreign investment. Inward FDI stockshave expanded in many MENA countries over the past decade, reachingan average 70 percent of GDP in resource-poor, labor-abundant countriesin 2006 (figure 10.17). This growth has been not as dynamic as in otheremerging economies, such as those in Eastern Europe (Brenton, Baroncelli,and Malouche 2006).
Inward FDI is much less important in the resource-rich countries in the region: the FDI to GDP ratio has actually fallen in the region’s
Regional Integration: Status, Developments, and Challenges 291
Figure 10.16 Total and Intra-MENA Tourism Exports Have Grown Strongly
0 1
United Arab Emirates
2 3 4 5
arrivals of nonresident tourists, millions
6 7 8 9
Egypt, Arab Rep. of
Jordan
Lebanon
Morocco
Tunisia
Algeria
Syrian Arab Republic
Yemen, Rep. of
Bahrain
Kuwait
Libya
Oman
Qatar
Saudi Arabia
reso
urc
e-ri
ch,
lab
or-
imp
ort
ing
cou
ntr
ies
reso
urc
e-ri
ch,
lab
or-
abu
nd
ant
cou
ntr
ies
reso
urc
e-p
oo
r,la
bo
r-ab
un
dan
tco
un
trie
s
2005MENA non-MENA
2001
Source: World Tourism Organization, Yearbook of Tourism Statistics 2007.
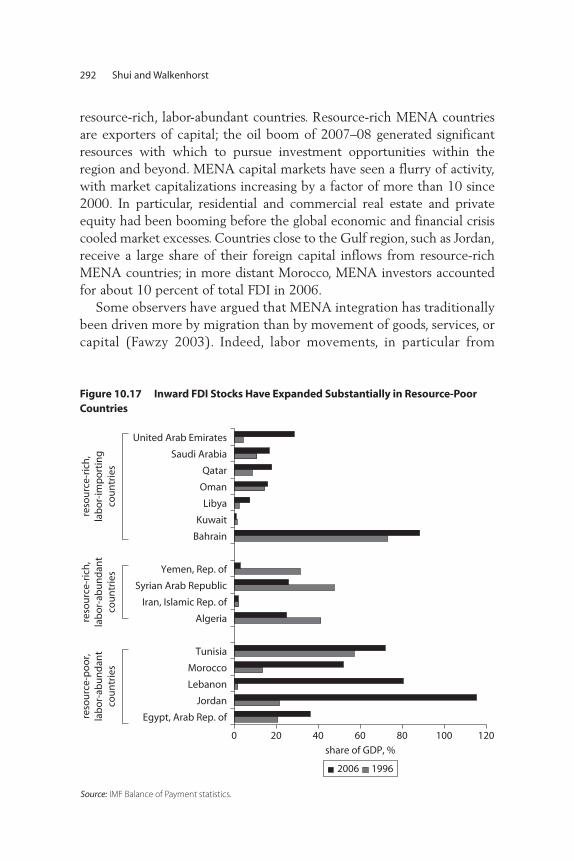
resource-rich, labor-abundant countries. Resource-rich MENA countriesare exporters of capital; the oil boom of 2007–08 generated significantresources with which to pursue investment opportunities within theregion and beyond. MENA capital markets have seen a flurry of activity,with market capitalizations increasing by a factor of more than 10 since2000. In particular, residential and commercial real estate and privateequity had been booming before the global economic and financial crisiscooled market excesses. Countries close to the Gulf region, such as Jordan,receive a large share of their foreign capital inflows from resource-richMENA countries; in more distant Morocco, MENA investors accountedfor about 10 percent of total FDI in 2006.
Some observers have argued that MENA integration has traditionallybeen driven more by migration than by movement of goods, services, orcapital (Fawzy 2003). Indeed, labor movements, in particular from
292 Shui and Walkenhorst
Source: IMF Balance of Payment statistics.
Figure 10.17 Inward FDI Stocks Have Expanded Substantially in Resource-Poor Countries
0 20 40 60
share of GDP, %
80 100 120
Egypt, Arab Rep. of
Jordan
Lebanon
Morocco
Tunisia
Algeria
Iran, Islamic Rep. of
Syrian Arab Republic
Yemen, Rep. of
Bahrain
Kuwait
Libya
Oman
Qatar
Saudi Arabia
United Arab Emirates
reso
urc
e-ri
ch,
lab
or-
imp
ort
ing
cou
ntr
ies
reso
urc
e-ri
ch,
lab
or-
abu
nd
ant
cou
ntr
ies
reso
urc
e-p
oo
r,la
bo
r-ab
un
dan
tco
un
trie
s
2006 1996
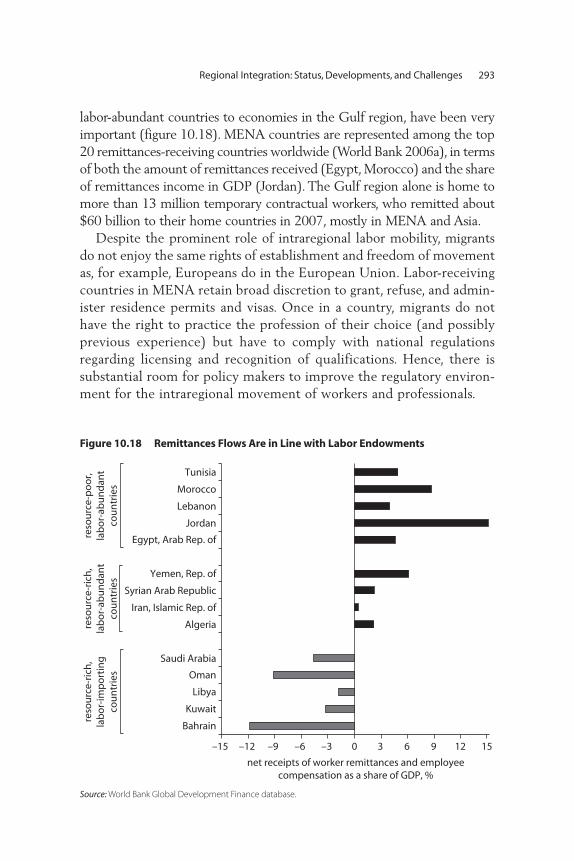
labor-abundant countries to economies in the Gulf region, have been veryimportant (figure 10.18). MENA countries are represented among the top20 remittances-receiving countries worldwide (World Bank 2006a), in termsof both the amount of remittances received (Egypt, Morocco) and the shareof remittances income in GDP (Jordan). The Gulf region alone is home tomore than 13 million temporary contractual workers, who remitted about$60 billion to their home countries in 2007, mostly in MENA and Asia.
Despite the prominent role of intraregional labor mobility, migrantsdo not enjoy the same rights of establishment and freedom of movementas, for example, Europeans do in the European Union. Labor-receivingcountries in MENA retain broad discretion to grant, refuse, and admin-ister residence permits and visas. Once in a country, migrants do nothave the right to practice the profession of their choice (and possiblyprevious experience) but have to comply with national regulationsregarding licensing and recognition of qualifications. Hence, there issubstantial room for policy makers to improve the regulatory environ-ment for the intraregional movement of workers and professionals.
Regional Integration: Status, Developments, and Challenges 293
Figure 10.18 Remittances Flows Are in Line with Labor Endowments
–15 –12 –9 –6 –3 0
net receipts of worker remittances and employeecompensation as a share of GDP, %
3 6 9 12 15
Bahrain
Kuwait
Libya
Oman
Saudi Arabia
Algeria
Iran, Islamic Rep. of
Syrian Arab Republic
Yemen, Rep. of
Egypt, Arab Rep. of
Jordan
Lebanon
Morocco
Tunisia
reso
urc
e-ri
ch,
lab
or-
imp
ort
ing
cou
ntr
ies
reso
urc
e-ri
ch,
lab
or-
abu
nd
ant
cou
ntr
ies
reso
urc
e-p
oo
r,la
bo
r-ab
un
dan
tco
un
trie
s
Source: World Bank Global Development Finance database.
Open Regionalism
Regional integration is no panacea. With limited coverage of services andmovement of production factors in existing agreements, high MFN tariffsand nontariff barriers in some countries within the region, and shares ofintraregional in total trade often in the single digits, even a doubling ofimports and exports from and to regional partners—although welcome—would not generate the economic growth rates countries in the regionaspire to meet. There are, of course, noneconomic aspects of regional inte-gration, such as security or cultural exchange, that are important in them-selves. But it seems advisable for MENA policy makers to focus first onhow to maintain and strengthen their countries’ competitiveness in theglobal market and only then to ask what contribution regional integrationcan make toward achieving this end.
Stronger regional links have a constructive role to play. Preferentialopening of markets can help export-oriented firms learn how to enter for-eign markets, find foreign suppliers and customers, and create economiesof scale that can subsequently be put to good use in global markets aswell. Exposing import-competing firms to foreign competition on a lim-ited intraregional basis might force them to upgrade their offer, which inturn might prepare them for the fierce competition in the global marketfollowing subsequent, more comprehensive trade policy reforms.
Regional agreements can also provide a training ground for policy mak-ers and senior officials, who can gain experience in negotiating highlytechnical aspects of the trade policy environment, such as rules of origin,and learn how to engage in common rule-making. Honing these skillsbefore entering into policy reform discussion with major players, such asthe European Union or the United States, or in the context of multilat-eral WTO negotiations is likely to result in outcomes that better reflectdomestic interests. Integration with similarly structured economies in theregion might also provide an opportunity to harmonize selected rules andregulations across partner countries to a greater extent than would be pos-sible at the multilateral stage and to benefit from the resulting economiesof scale for intraregional as well as extraregional trade.
Trade agreements can also help reinforce positive elements in thedomestic reform program by anchoring policy in the agreement itself.Such agreements make it more difficult for domestic lobby groups toreverse policy reforms in order to preserve or enhance their economicrents, because changes would require consent by all regional partner coun-tries. This role of enhancing policy credibility seems particularly important
294 Shui and Walkenhorst

for services and investment reforms, which often aim to attract large-scale,long-term investors.
The best-designed regional agreements are of limited value if they arenot implemented. Many regional agreements in MENA look stronger onpaper than in practice. One impediment to effective implementation is theproliferation of agreements. If different regional initiatives have differentsector and product coverage, liberalization schedules, and rules of origin,then implementation agencies, such as customs, may not have the capacityto put the agreement provisions into practice. Lack of trust and commit-ment on both the export side (with respect to the credibility of certificatesof origin, for example) and the import side (with respect to the discre-tionary application of administrative rules and requirements, for example)also hamper implementation. Well-functioning monitoring mechanismsand sustained high-level political attention to institutional improvementsconcerning reductions in tariff and behind the border barriers are essentialfor the success of regional integration initiatives.
References
Achy, L. 2006. Assessing Regional Integration Potential in North Africa. UnitedNations Economic Commission for Africa (UNECA) document ECA-NA/RABAT/ICE/XXI/3/I, 21st meeting of the Intergovernmental Committeeof Experts, UNECA, Rabat.
Brenton, P., E. Baroncelli, and M. Malouche. 2006. “Trade and InvestmentIntegration of the Maghreb.” Middle East and North Africa Working Paper 44,World Bank, Washington, DC.
Dennis, A. 2006. “The Impact of Regional Trade Agreements and TradeFacilitation in the Middle East and North Africa Region.” Policy ResearchWorking Paper 3837, World Bank, Washington, DC.
Devlin, J., and P. Yee. 2005. “Trade Logistics in Developing Countries: The Caseof the Middle East and North Africa.” World Economy 28 (3): 435–56.
Fawzy, S. 2003. “The Economics and Politics of Arab Economic Integration.”In Arab Economic Integration: Between Hope and Reality, ed. A. Galal andB. Hoekman. Cairo: Egyptian Center for Economic Studies; Washington,DC: Brookings Institution Press.
Filali, Z. 2007. Inventaire et évaluation des mesures nontarifaires au Maroc. ProjectReport, World Bank, Trade Department, Washington, DC.
Galal, A., and B. Hoekman. 2003. Arab Economic Integration: Between Hope andReality. Cairo: Egyptian Center for Economic Studies; Washington, DC:Brookings Institution Press.
Regional Integration: Status, Developments, and Challenges 295
Haddad, M. 2007. “Trade Integration in East Asia: The Role of China andProduction Networks.” Policy Research Working Paper 4160, World Bank,Washington, DC.
Havrylyshyn, O., and P. Kunzel. 2000. “Intra-Industry Trade of Arab Countries: AnIndicator of Potential Competitiveness.” In Catching Up with the Competition:Trade Opportunities and Challenges for Arab Countries, ed. B. Hoekman andJ. Zarrouk. Ann Arbor: University of Michigan Press.
Kee, H. L., A. Nicita, and M. Olarreaga. 2005. “Estimating Trade RestrictivenessIndices.” Working Paper, World Bank, Development Research Department,Washington, DC.
Khandelwal, P. 2004. “COMESA and SADC: Prospects and Challenges forRegional Trade Integration.” Working Paper 04-227, International MonetaryFund, Washington, DC.
Konan, D. E. 2003. “Alternative Paths to Prosperity: Economic Integration amongArab Countries.” In Arab Economic Integration: Between Hope and Reality, ed.A. Galal and B. Hoekman. Cairo: Egyptian Center for Economic Studies;Washington, DC: Brookings Institution Press.
Miniesy, R. S., J. B. Nugent, and T. M. Yousef. 2004. “Intra-regional TradeIntegration in the Middle East: Past Performance and Future Potential.” InTrade Policy and Economic Integration in the Middle East and North Africa:Economic Boundaries in Flux, ed. H. Hakimian and J. B. Nugent. London:Routledge Curzon.
OECD (Organisation for Economic Co-operation and Development). 2003.Regionalism and the Multilateral Trading System. Paris: OECD.
Péridy, N. 2005a. “Toward a Pan-Arab Free Trade Area: Assessing Trade PotentialEffects of the Agadir Agreement.” Developing Economies 18 (3): 329–45.
———. 2005b. “Towards a New Trade Policy between the USA and Middle-EastCountries: Estimating Trade Resistance and Export Potential.” World Economy28 (4): 491–518.
Wippel, S. 2005. The Agadir Agreement and Open Regionalism. EuroMeSCo Paper45, EuroMeSCo Secretariat, Lisbon.
World Bank. 2005. Global Economic Prospects: Trade, Regionalism, andDevelopment. Washington, DC: World Bank.
———. 2006a. Global Economic Prospects: Economic Implications of Remittancesand Migration. Washington, DC: World Bank.
———. 2006b. Is There a New Vision for Maghreb Economic Integration?Washington, DC.
———. 2007a. Connecting to Compete: Trade Logistics in the Global Economy.Washington, DC: World Bank.
296 Shui and Walkenhorst

———. 2007b. Tunisia’s Global Integration: Second Generation Reforms to BoostGrowth and Employment. Washington, DC: World Bank.
———. 2008. Strengthening MENA’s Trade and Investment Links with China andIndia. Washington, DC: World Bank.
World Tourism Organization. 2008. Yearbook of Tourism Statistics 2007. Madrid:World Tourism Organization.
Yeats, A. 1998. “What Can Be Expected from African Regional TradeArrangements? Some Empirical Evidence.” Working Paper, World Bank,International Trade Division, Washington, DC.
Yeats, A., and F. Ng. 2000. “Beyond the Year 2000: Implications of the MiddleEast’s Recent Trade Performance.” In Catching Up with the Competition:Trade Opportunities and Challenges for Arab Countries, ed. B. Hoekman andJ. Zarrouk. Ann Arbor: University of Michigan Press.
Zarrouk, J. 2003. “A Survey of Barriers to Trade and Investment in ArabCountries.” In Arab Economic Integration: Between Hope and Reality, ed. A. Galaland B. Hoekman. Cairo: Egyptian Center for Economic Studies; Washington,DC: Brookings Institution Press.
Regional Integration: Status, Developments, and Challenges 297

299
Studies have shown that regional integration in the Maghreb (Algeria,Morocco, and Tunisia) is low (World Bank 2006) and the potential forintegration of product markets is limited, given a variety of economicdisincentives relating to the structure of production, endowments, andsize of the Maghreb economies. A regional strategy based on market inte-gration of merchandise products is thus unlikely to generate a substan-tial increase in growth. At the same time, policy barriers constrain theopportunities for enhanced trade and investment in the Maghreb. Thesecountries systematically underperform, particularly in the area of policyreforms of services, the countries of Central and Eastern Europe. Thischapter argues that deeper economic integration (focused on service lib-eralization and investment climate reforms) and wider integration (withthe European Union) have the potential to generate more substantialeconomic gains than would be obtained from regional integration ofgoods markets.1
C H A P T E R 1 1
Economic Gains of RegionalAgreements in the Maghreb:Deeper versus Wider Integration
Paloma Anos Casero and Ganesh Kumar Seshan
Some Conceptual Issues
What Is “Deep” Integration? Economic integration can be regarded as a continuum from “shallow” inte-gration (based on the removal of import tariffs and quantitative restric-tions) to “deep” integration (based on explicit government actions toreduce the market-segmenting effect of domestic regulatory policies andregulations other than tariffs and formal nontariff barriers). Deep integra-tion involves policies and regulations “at the border,” such as customs clear-ance and certification that imports satisfy domestic standards of qualitycontrol. It also includes “behind-the-border” policies and regulations thatimpose a burden on business activity and affect market contestability.These deeper domestic policy reforms include horizontal policies (such astrade, exchange rate, and competition policy and other aspects of theoverall investment climate) and sector-specific policies affecting trade inservices and the efficient provision of key backbone service sectors (suchas finance, transport, telecommunications, energy, and water).
Benefits of deeper integration. The case for deeper economic integrationhas been persuasively made in the trade literature (Hoekman and Konan1999; Konan and Maskus 2003). The benefits of deep integration are esti-mated to be far greater than those from shallow integration focused onmerchandise trade liberalization. Deeper economic integration canexpand trade and opportunities for foreign direct investment (FDI),induce large productivity gains, and enhance the overall competitivenessof Maghreb economies.
Inefficiencies in the provision of key backbone services coupled withhigh transaction costs caused by regulatory constraints raise production andtrading costs. Opening up markets in telecommunications, transport,finance, and other network industries to competition and improving theoverall regulatory framework for businesses would both help firms thatengage in trade and improve the efficiency of domestic industries that pro-vide services to firms that produce and trade. Service sector and investmentclimate reforms can reduce the costs of trade-related transport, logistics, andkey production inputs, such as finance, telecommunications, distribution,and other services. These services inputs represent 10–20 percent ofproduction costs in the Maghreb (World Bank 2005). Deeper economicintegration would also improve the region’s attractiveness to multinationalenterprises. The location of multinationals is crucially affected by the scopefor effective sourcing of inputs and the ability to move inputs quickly andcheaply across national boundaries.
300 Anos Casero and Kumar Seshan
Rationale for a regional approach to deeper integration. Much of whatis needed could be pursued through unilateral action by countries; serv-ice sector and investment climate reforms are needed in their own rightin the Maghreb countries. Galal and Hoekman (2003) provide two per-suasive arguments—a political economy argument and an economicincentive argument—in favor of a regional approach to deeper integrationin the Maghreb.
First, service liberalization reforms are likely to result in contractionor elimination of domestic firms that benefit from protection, whilefirms in sectors in which the country has a comparative advantage arelikely to expand. Firms that contract tend to be larger and concentrated;firms that expand tend to be small and dispersed. The political con-straints imposed by this disparity could be overcome if the Maghrebcountries collectively agreed on a sequence of selected sector reforms.Regional cooperation in selected service sectors could also help definethe right policy sequencing and complementary actions needed toincrease competition in the selected sectors (for example, implementingdownstream privatizations before adopting upstream policy reforms;liberalizing air transport without liberalizing airport slots does not leadvery far). This type of regulatory issue tends to be ignored by nationalsectoral regulators and could be addressed more efficiently in a regionwideapproach.
Second, deeper regional integration can lead to regulatory economiesof scale or scope. Regional cooperation can help remove national entrybarriers and improve market contestability by providing a focal point forreform and mechanisms to monitor progress. Another potential area forregional cooperation is establishment of regional regulatory agencies tooversee network services (telecommunications, electricity, transport).Regional regulatory agencies could facilitate cooperation among Maghrebcountries that are investing in and managing the physical networks byissuing regionwide licenses for a market that would be large enough toattract global players. The creation of regional networks of regulatorscould facilitate the exchange of best regulatory practices (for example,through technical working groups) and ensure the consistent applicationof technical safety and environmental regulations.
Measuring the Gains from Regional IntegrationThis chapter estimates the gains from deeper and wider economic inte-gration by assessing the impact of a regional trade agreement (RTA)between the Maghreb and the European Union, drawing on the work of
Economic Gains of Regional Agreements: Deeper versus Wider Integration 301
Dee and Gali (2003). Deeper integration is proxied by a move towardservice sector liberalization and its impact on growth, exports, and FDI(this analysis draws on the work of Eschenbach and Hoekman 2005). Thegains from integration are measured by the impact on GDP between2005 and 2015 under five scenarios:
• The status quo considers no changes from current integration policies.• Shallow integration examines the situation in which an RTA is formed
that eliminates most tariffs on and other barriers to intraregional mer-chandise trade.
• Wider integration examines the situation in which Maghreb countriesform a regional merchandise trading bloc with the European Union(this scenario is compared with the gains of each country’s unilateralintegration with the European Union).
• Deeper integration examines the situation in which Maghreb coun-tries move toward service sector liberalization and investment climatereforms.
• Deeper and wider integration examines the situation in which Maghrebcountries form a regional trading bloc with the European Union andmove toward service sector liberalization and investment climate reforms.
Some Methodological Issues
Ideally, this analysis would simulate the impact of each policy scenario onthe economic performance for individual Maghreb countries, using a con-sistent model of the Maghreb economies. Limits on resources, data, andappropriate modeling frameworks force some compromise with thisideal. Instead, we rely on statistical relationships derived from studies ofworldwide experience to represent the typical impact of such integrationschemes, assuming that these relationships apply on average to theMaghreb as a whole. These scenarios should thus be viewed as illustra-tions of the gains that could be expected from regional integration, notpredictions of the likely impact. (Details on methodology, data, andeconometric results are presented in the annex to this chapter.)
This approach implies that we do not assess the marginal gains ofregional cooperation in the service sectors. This analysis is hampered bythe absence of detailed data on trade and investment in services by sec-tor, the absence of regionally comparable computable general equilibrium
302 Anos Casero and Kumar Seshan
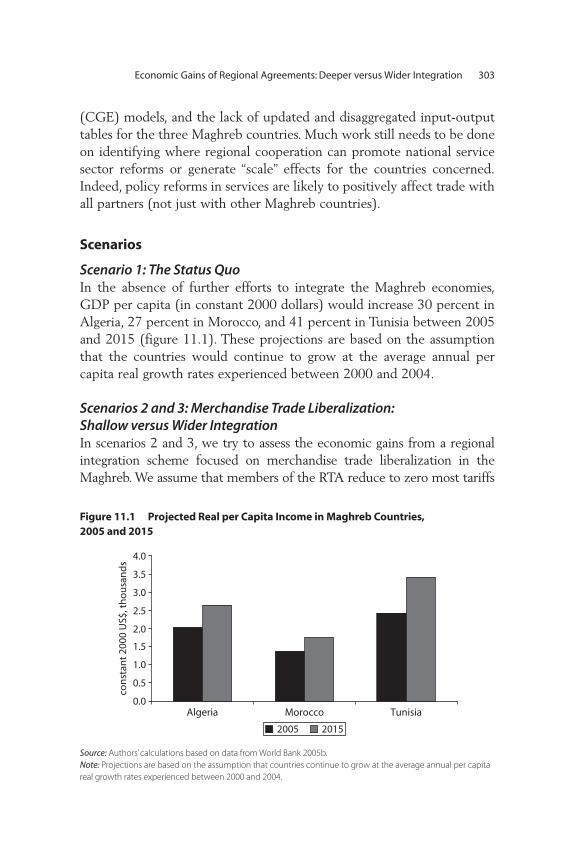
(CGE) models, and the lack of updated and disaggregated input-outputtables for the three Maghreb countries. Much work still needs to be doneon identifying where regional cooperation can promote national servicesector reforms or generate “scale” effects for the countries concerned.Indeed, policy reforms in services are likely to positively affect trade withall partners (not just with other Maghreb countries).
Scenarios
Scenario 1: The Status QuoIn the absence of further efforts to integrate the Maghreb economies,GDP per capita (in constant 2000 dollars) would increase 30 percent inAlgeria, 27 percent in Morocco, and 41 percent in Tunisia between 2005and 2015 (figure 11.1). These projections are based on the assumptionthat the countries would continue to grow at the average annual percapita real growth rates experienced between 2000 and 2004.
Scenarios 2 and 3: Merchandise Trade Liberalization: Shallow versus Wider IntegrationIn scenarios 2 and 3, we try to assess the economic gains from a regionalintegration scheme focused on merchandise trade liberalization in theMaghreb. We assume that members of the RTA reduce to zero most tariffs
Economic Gains of Regional Agreements: Deeper versus Wider Integration 303
0.0
0.5
1.0
1.5
2.0
2.5
3.0
3.5
4.0
Algeria TunisiaMorocco
con
stan
t 20
00 U
S$, t
ho
usa
nd
s
2005 2015
Figure 11.1 Projected Real per Capita Income in Maghreb Countries, 2005 and 2015
Source: Authors’ calculations based on data from World Bank 2005b.Note: Projections are based on the assumption that countries continue to grow at the average annual per capitareal growth rates experienced between 2000 and 2004.

and other barriers to trade among themselves while keeping unchangedtheir barriers to trade with counties outside the group. Members of the RTAalso adopt rules of origin to determine which goods are eligible to cross theRTA’s internal borders free of tariff. The RTA does not entail further inte-gration of the markets of the participating countries, such as free movementof capital, labor, and technology, or the harmonization of domestic policiesand regulation. Because typical RTAs focus on merchandise trade, the quan-titative models and proxies we use to assess the impact of a RTA captureprimarily the effects of merchandise trade integration.
An RTA can foster growth through a number of channels. First, bygranting access to cheaper capital goods imports, the RTA can make sav-ings and investment more effective in expanding the capital stock,thereby enhancing long-term growth. Second, the RTA can encouragethe spillover of technology through trade between advanced and lessadvanced countries, as entrepreneurs in less advanced countries learnfrom and imitate entrepreneurs in more advanced countries by observ-ing the products they produce. Third, to the extent that an RTA increasesFDI, it contributes directly to the expansion of capital stock. FDI mayalso cause greater spillovers of technology than would be possible witharms-length trade only. Our analysis, building on work by Jaumotte(2004) and detailed in the annex, suggests that a larger regional marketcan raise the level of FDI stock in the Maghreb countries. Finally, theremay be dynamic effects, as an initial increase in the level of real incomefacilitates greater savings and investment, promoting long-run growth.However, an RTA can also cause efficiency losses from trade diversion,which occurs when local firms import higher-cost (but zero-tariff) goodsfrom producers within the RTA rather than lower-cost (but subject totariff) goods from outside the RTA.
Scenario 2: Shallow integration—Maghreb RTA. We first consider theimpact on per capita GDP of scenario 2 (shallow integration). In this sce-nario, the Maghreb countries join an RTA focused on merchandise tradeliberalization. This empirical exercise draws on estimates from a panelregression analysis following Berhelon (2004), in which per capita incomegrowth depends on the market size of existing RTAs between 1980 and2004 (measured by the sum of the share of the partner countries GDP toworld GDP)2 and a set of control variables, including initial per capitaGDP, the ratio of government consumption to GDP, the investmentrate, FDI as a percentage of GDP, human capital, the share of manufac-tured exports in total exports, the ratio of total trade to GDP, an index
304 Anos Casero and Kumar Seshan
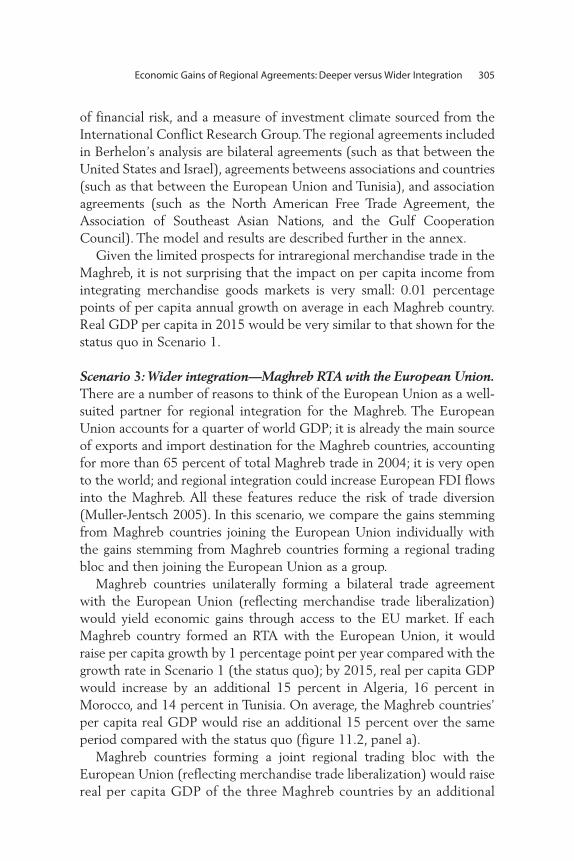
of financial risk, and a measure of investment climate sourced from theInternational Conflict Research Group. The regional agreements includedin Berhelon’s analysis are bilateral agreements (such as that between theUnited States and Israel), agreements betweens associations and countries(such as that between the European Union and Tunisia), and associationagreements (such as the North American Free Trade Agreement, theAssociation of Southeast Asian Nations, and the Gulf CooperationCouncil). The model and results are described further in the annex.
Given the limited prospects for intraregional merchandise trade in theMaghreb, it is not surprising that the impact on per capita income fromintegrating merchandise goods markets is very small: 0.01 percentagepoints of per capita annual growth on average in each Maghreb country.Real GDP per capita in 2015 would be very similar to that shown for thestatus quo in Scenario 1.
Scenario 3: Wider integration—Maghreb RTA with the European Union.There are a number of reasons to think of the European Union as a well-suited partner for regional integration for the Maghreb. The EuropeanUnion accounts for a quarter of world GDP; it is already the main sourceof exports and import destination for the Maghreb countries, accountingfor more than 65 percent of total Maghreb trade in 2004; it is very opento the world; and regional integration could increase European FDI flowsinto the Maghreb. All these features reduce the risk of trade diversion(Muller-Jentsch 2005). In this scenario, we compare the gains stemmingfrom Maghreb countries joining the European Union individually withthe gains stemming from Maghreb countries forming a regional tradingbloc and then joining the European Union as a group.
Maghreb countries unilaterally forming a bilateral trade agreementwith the European Union (reflecting merchandise trade liberalization)would yield economic gains through access to the EU market. If eachMaghreb country formed an RTA with the European Union, it wouldraise per capita growth by 1 percentage point per year compared with thegrowth rate in Scenario 1 (the status quo); by 2015, real per capita GDPwould increase by an additional 15 percent in Algeria, 16 percent inMorocco, and 14 percent in Tunisia. On average, the Maghreb countries’per capita real GDP would rise an additional 15 percent over the sameperiod compared with the status quo (figure 11.2, panel a).
Maghreb countries forming a joint regional trading bloc with theEuropean Union (reflecting merchandise trade liberalization) would raisereal per capita GDP of the three Maghreb countries by an additional
Economic Gains of Regional Agreements: Deeper versus Wider Integration 305

22 percent between 2005 and 2015 relative to the status quo—7 percent-age points more than if the three countries join the European Unionunilaterally (figure 11.2, panel b). Allocating the gains to the individualMaghreb countries using income weights from 2004, an RTA with theEuropean Union is expected to increase per capita income by an addi-tional 27 percent in Algeria, 22 percent in Morocco, and 16 percent inTunisia between 2005 and 2015.
We also consider how the two scenarios would affect the Maghrebcountries’ non-oil exports, using a model similar to that used to esti-mate the impact on per capita income. The empirical estimates appearin the annex.
Integrating the goods market of Maghreb countries would have a mar-ginal impact on real non-oil exports. Between 2005 and 2015, the valueof real non-oil exports in the Maghreb countries would increase by a totalof 3.5 percent on average compared with the status quo. If each Maghrebcountry separately forms an RTA with the European Union, the marketfor Maghreb countries’ exports would expand considerably. Between2005 and 2015, real non-oil exports would nearly double on average rel-ative to the status quo (figure 11.3).
306 Anos Casero and Kumar Seshan
0
1
2
3
4
5
6
7
8
9
10
2005 2015 2005 2015
country regional trade agreements with the EU
Maghreb regional trade agreements with the EU
Algeria Tunisia Morocco
con
stan
t 20
00 U
S$, t
ho
usa
nd
s
Figure 11.2 Projected Real per Capita Income under Regional Trade Agreementwith European Union, 2005 and 2015
Source: Authors.
Finally, if the Maghreb countries join the European Union trading blocas a group, the total export value in real terms would rise by a factor of2.5 on average between 2005 and 2015 relative to the status quo.
Scenario 4: Deeper Integration: Service Liberalization and Investment Climate ReformsGiven the limited magnitude and potential for intra-Maghreb merchan-dise trade, it is desirable to consider deeper integration, with a focus onthe service sectors. Inconsistencies across countries in the domestic regu-lations governing, for example, banking, telecommunications, and insur-ance can complicate and interfere with international transactions. It wasthe removal of such discrepancies that constituted much of the EuropeanUnion’s move toward the single market that was completed in 1992.
The case for deeper integration has been made by Hoekman andKonan (1999) in the context of Euro-Mediterranean free trade. By coor-dinating standards, regulations, and procedures along an EU model, theMaghreb countries would make it significantly easier for both local andforeign firms to operate in both markets. This would not only benefitfirms that engage in trade per se, but also help modernize and make moreefficient domestic industries in the Maghreb that provide services to firms
Economic Gains of Regional Agreements: Deeper versus Wider Integration 307
0
10
20
30
Algeria TunisiaMorocco
con
stan
t 20
00 U
S$, t
ho
usa
nd
s
2005
country regional trade agreements with the EU, 2015
union regional trade agreements with the EU, 2015
Figure 11.3 Projected Non-Oil Exports in Maghreb Countries under RegionalTrade Agreement with European Union, 2005 and 2015
Source: Authors’ calculations.
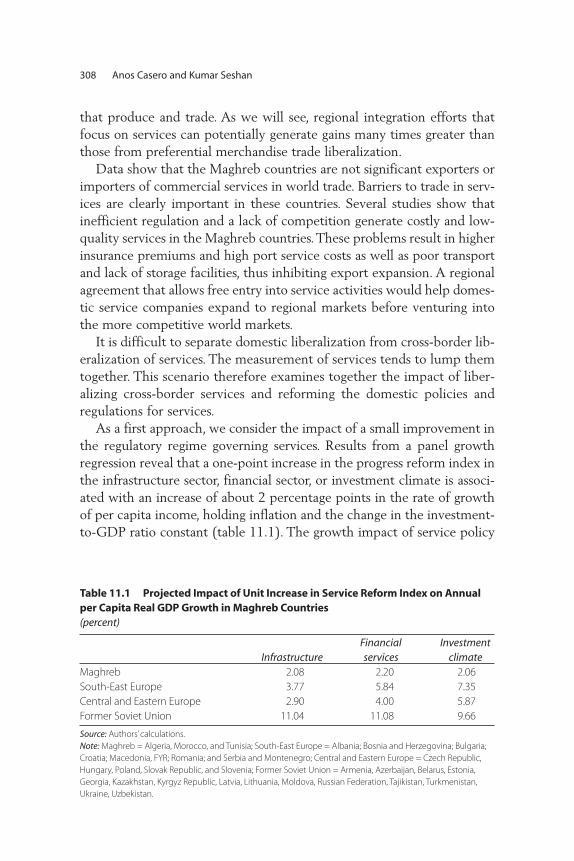
that produce and trade. As we will see, regional integration efforts thatfocus on services can potentially generate gains many times greater thanthose from preferential merchandise trade liberalization.
Data show that the Maghreb countries are not significant exporters orimporters of commercial services in world trade. Barriers to trade in serv-ices are clearly important in these countries. Several studies show thatinefficient regulation and a lack of competition generate costly and low-quality services in the Maghreb countries. These problems result in higherinsurance premiums and high port service costs as well as poor transportand lack of storage facilities, thus inhibiting export expansion. A regionalagreement that allows free entry into service activities would help domes-tic service companies expand to regional markets before venturing intothe more competitive world markets.
It is difficult to separate domestic liberalization from cross-border lib-eralization of services. The measurement of services tends to lump themtogether. This scenario therefore examines together the impact of liber-alizing cross-border services and reforming the domestic policies andregulations for services.
As a first approach, we consider the impact of a small improvement inthe regulatory regime governing services. Results from a panel growthregression reveal that a one-point increase in the progress reform index inthe infrastructure sector, financial sector, or investment climate is associ-ated with an increase of about 2 percentage points in the rate of growthof per capita income, holding inflation and the change in the investment-to-GDP ratio constant (table 11.1). The growth impact of service policy
308 Anos Casero and Kumar Seshan
Table 11.1 Projected Impact of Unit Increase in Service Reform Index on Annualper Capita Real GDP Growth in Maghreb Countries(percent)
InfrastructureFinancial services
Investment climate
Maghreb 2.08 2.20 2.06South-East Europe 3.77 5.84 7.35Central and Eastern Europe 2.90 4.00 5.87Former Soviet Union 11.04 11.08 9.66
Source: Authors’ calculations.Note: Maghreb = Algeria, Morocco, and Tunisia; South-East Europe = Albania; Bosnia and Herzegovina; Bulgaria;Croatia; Macedonia, FYR; Romania; and Serbia and Montenegro; Central and Eastern Europe = Czech Republic,Hungary, Poland, Slovak Republic, and Slovenia; Former Soviet Union = Armenia, Azerbaijan, Belarus, Estonia,Georgia, Kazakhstan, Kyrgyz Republic, Latvia, Lithuania, Moldova, Russian Federation, Tajikistan, Turkmenistan,Ukraine, Uzbekistan.
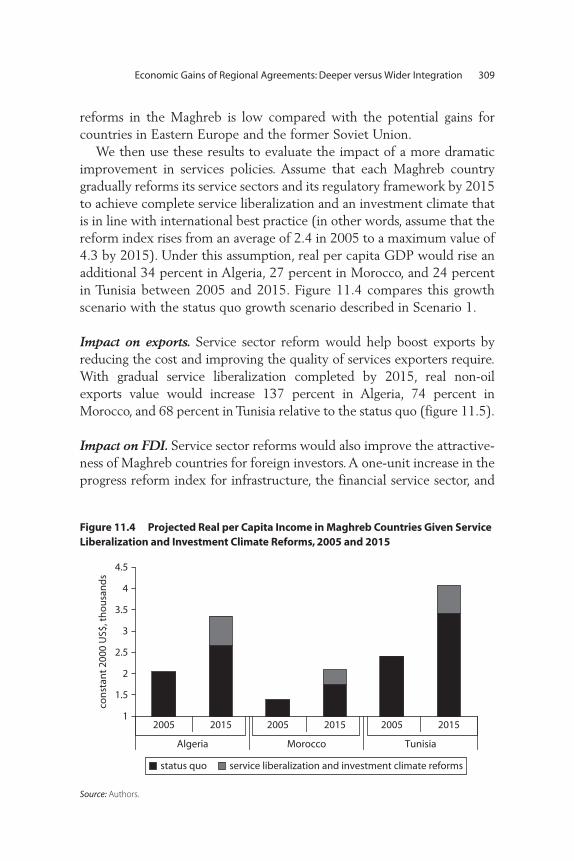
reforms in the Maghreb is low compared with the potential gains forcountries in Eastern Europe and the former Soviet Union.
We then use these results to evaluate the impact of a more dramaticimprovement in services policies. Assume that each Maghreb countrygradually reforms its service sectors and its regulatory framework by 2015to achieve complete service liberalization and an investment climate thatis in line with international best practice (in other words, assume that thereform index rises from an average of 2.4 in 2005 to a maximum value of4.3 by 2015). Under this assumption, real per capita GDP would rise anadditional 34 percent in Algeria, 27 percent in Morocco, and 24 percentin Tunisia between 2005 and 2015. Figure 11.4 compares this growthscenario with the status quo growth scenario described in Scenario 1.
Impact on exports. Service sector reform would help boost exports byreducing the cost and improving the quality of services exporters require.With gradual service liberalization completed by 2015, real non-oilexports value would increase 137 percent in Algeria, 74 percent inMorocco, and 68 percent in Tunisia relative to the status quo (figure 11.5).
Impact on FDI. Service sector reforms would also improve the attractive-ness of Maghreb countries for foreign investors. A one-unit increase in theprogress reform index for infrastructure, the financial service sector, and
Economic Gains of Regional Agreements: Deeper versus Wider Integration 309
1
1.5
2
2.5
3
3.5
4
4.5
2005 2015 2005 2015 2005 2015
Algeria TunisiaMorocco
con
stan
t 20
00 U
S$, t
ho
usa
nd
s
status quo service liberalization and investment climate reforms
Figure 11.4 Projected Real per Capita Income in Maghreb Countries Given ServiceLiberalization and Investment Climate Reforms, 2005 and 2015
Source: Authors.
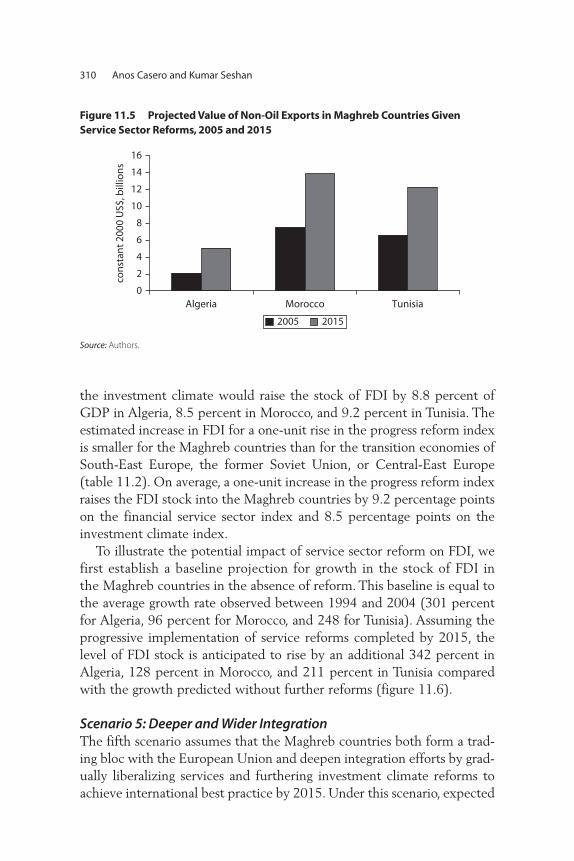
the investment climate would raise the stock of FDI by 8.8 percent ofGDP in Algeria, 8.5 percent in Morocco, and 9.2 percent in Tunisia. Theestimated increase in FDI for a one-unit rise in the progress reform indexis smaller for the Maghreb countries than for the transition economies ofSouth-East Europe, the former Soviet Union, or Central-East Europe(table 11.2). On average, a one-unit increase in the progress reform indexraises the FDI stock into the Maghreb countries by 9.2 percentage pointson the financial service sector index and 8.5 percentage points on theinvestment climate index.
To illustrate the potential impact of service sector reform on FDI, wefirst establish a baseline projection for growth in the stock of FDI inthe Maghreb countries in the absence of reform. This baseline is equal tothe average growth rate observed between 1994 and 2004 (301 percentfor Algeria, 96 percent for Morocco, and 248 for Tunisia). Assuming theprogressive implementation of service reforms completed by 2015, thelevel of FDI stock is anticipated to rise by an additional 342 percent inAlgeria, 128 percent in Morocco, and 211 percent in Tunisia comparedwith the growth predicted without further reforms (figure 11.6).
Scenario 5: Deeper and Wider IntegrationThe fifth scenario assumes that the Maghreb countries both form a trad-ing bloc with the European Union and deepen integration efforts by grad-ually liberalizing services and furthering investment climate reforms toachieve international best practice by 2015. Under this scenario, expected
310 Anos Casero and Kumar Seshan
0
2
4
6
8
10
12
14
16
Algeria
con
stan
t 20
00 U
S$, b
illio
ns
TunisiaMorocco
2005 2015
Figure 11.5 Projected Value of Non- Oil Exports in Maghreb Countries Given Service Sector Reforms, 2005 and 2015
Source: Authors.
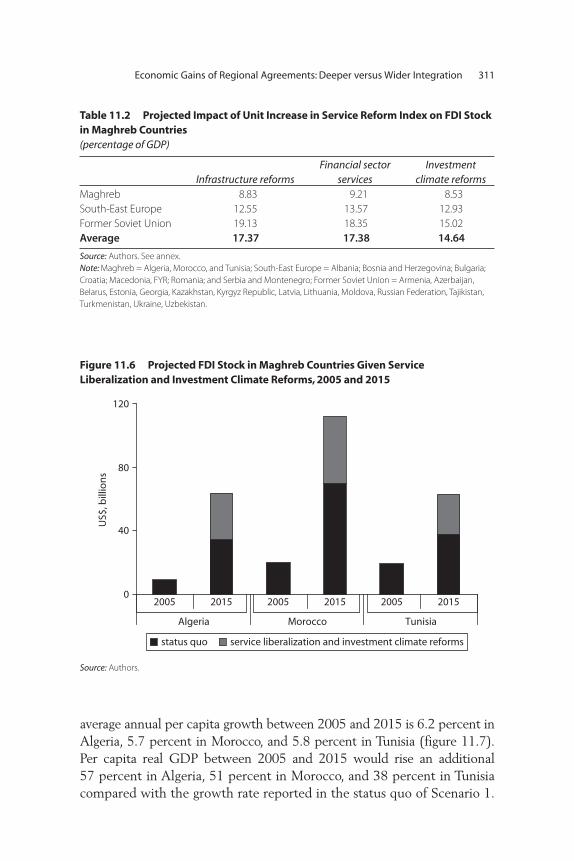
average annual per capita growth between 2005 and 2015 is 6.2 percent inAlgeria, 5.7 percent in Morocco, and 5.8 percent in Tunisia (figure 11.7).Per capita real GDP between 2005 and 2015 would rise an additional 57 percent in Algeria, 51 percent in Morocco, and 38 percent in Tunisiacompared with the growth rate reported in the status quo of Scenario 1.
Economic Gains of Regional Agreements: Deeper versus Wider Integration 311
Table 11.2 Projected Impact of Unit Increase in Service Reform Index on FDI Stockin Maghreb Countries(percentage of GDP)
Infrastructure reformsFinancial sector
servicesInvestment
climate reformsMaghreb 8.83 9.21 8.53South-East Europe 12.55 13.57 12.93Former Soviet Union 19.13 18.35 15.02Average 17.37 17.38 14.64
Source: Authors. See annex. Note: Maghreb = Algeria, Morocco, and Tunisia; South-East Europe = Albania; Bosnia and Herzegovina; Bulgaria;Croatia; Macedonia, FYR; Romania; and Serbia and Montenegro; Former Soviet Union = Armenia, Azerbaijan, Belarus, Estonia, Georgia, Kazakhstan, Kyrgyz Republic, Latvia, Lithuania, Moldova, Russian Federation, Tajikistan,Turkmenistan, Ukraine, Uzbekistan.
0
40
80
120
2005 2015 2005 2015 2005 2015
Algeria TunisiaMorocco
US$
, bill
ion
s
status quo service liberalization and investment climate reforms
Figure 11.6 Projected FDI Stock in Maghreb Countries Given Service Liberalization and Investment Climate Reforms, 2005 and 2015
Source: Authors.

This projected additional growth may overstate potential gains,because we assume that the benefits from Scenario 2 (integration withthe European Union) and Scenario 3 are additive. In fact, some of thechannels that produce the gains are the same in the two scenarios.
Conclusions
This chapter provides some evidence that the strategy that offers thegreatest economic gains for Maghreb countries is one that focuses ondeeper integration (through service sectors and investment climatereforms aimed at improving competition and market contestability) andwider integration (particularly if the Maghreb were to form a trading blocwith the European Union).
Achieving these gains is not automatic. Reaping the full benefits fromdeeper integration will require the effective adoption of regulatoryreforms to achieve economic efficiency at the national level, as well as ahigh degree of regulatory cooperation at the cross-border level. At thesame time, geographical and cultural proximity to EU markets is animportant comparative advantage for the Maghreb countries. Removingnontariff barriers to these markets—including inefficiencies in the back-bone service sectors—is critical to exploiting these advantages.
312 Anos Casero and Kumar Seshan
1
1.5
2
2.5
3
3.5
4
4.5
2005 2015 2005 2015 2005 2015
Algeria TunisiaMorocco
con
stan
t 20
00 U
S$, t
ho
usa
nd
s
status quo Maghreb regional trade agreements
Maghreb regional trade agreements with European Union service liberalization
Figure 11.7 Projected per Capita Income in Maghreb Countries Given MaghrebRegional Trade Agreement, EU Regional Trade Agreement, and Service Sector Reforms, 2005 and 2015
Source: Authors.
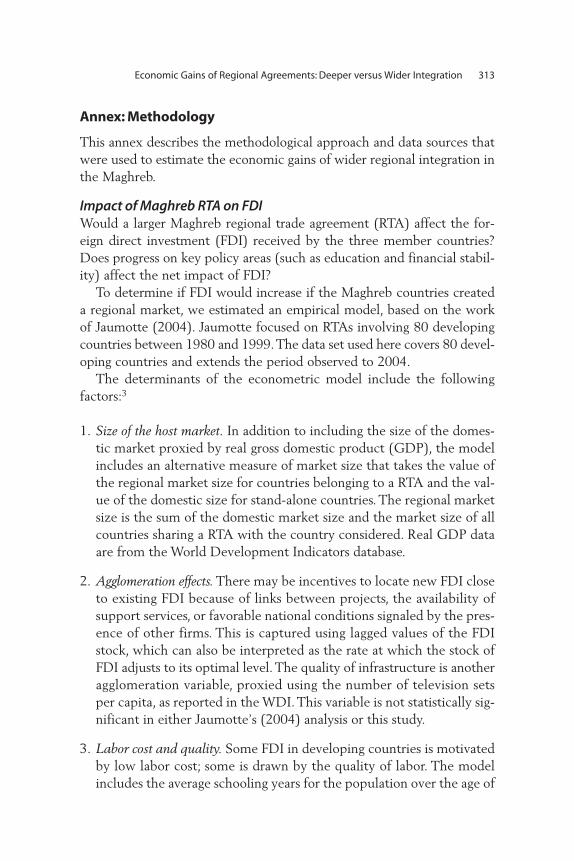
Annex: Methodology
This annex describes the methodological approach and data sources thatwere used to estimate the economic gains of wider regional integration inthe Maghreb.
Impact of Maghreb RTA on FDIWould a larger Maghreb regional trade agreement (RTA) affect the for-eign direct investment (FDI) received by the three member countries?Does progress on key policy areas (such as education and financial stabil-ity) affect the net impact of FDI?
To determine if FDI would increase if the Maghreb countries createda regional market, we estimated an empirical model, based on the workof Jaumotte (2004). Jaumotte focused on RTAs involving 80 developingcountries between 1980 and 1999. The data set used here covers 80 devel-oping countries and extends the period observed to 2004.
The determinants of the econometric model include the followingfactors:3
1. Size of the host market. In addition to including the size of the domes-tic market proxied by real gross domestic product (GDP), the modelincludes an alternative measure of market size that takes the value ofthe regional market size for countries belonging to a RTA and the val-ue of the domestic size for stand-alone countries. The regional marketsize is the sum of the domestic market size and the market size of allcountries sharing a RTA with the country considered. Real GDP dataare from the World Development Indicators database.
2. Agglomeration effects. There may be incentives to locate new FDI closeto existing FDI because of links between projects, the availability ofsupport services, or favorable national conditions signaled by the pres-ence of other firms. This is captured using lagged values of the FDIstock, which can also be interpreted as the rate at which the stock ofFDI adjusts to its optimal level. The quality of infrastructure is anotheragglomeration variable, proxied using the number of television setsper capita, as reported in the WDI. This variable is not statistically sig-nificant in either Jaumotte’s (2004) analysis or this study.
3. Labor cost and quality. Some FDI in developing countries is motivatedby low labor cost; some is drawn by the quality of labor. The model includes the average schooling years for the population over the age of
Economic Gains of Regional Agreements: Deeper versus Wider Integration 313

15 from Barro and Lee (2000) as a proxy for labor quality and to someextent an inverse proxy for labor cost.
4. Business/investment climate. The climate for business/investment affectsthe cost of doing business in a foreign country. We follow Jaumotte(2004) in using the financial risk index constructed by the Political RiskServices Group (PRSG), which measures the current account and for-eign debt position, net liquidity, and exchange rate stability.
5. Openness. Trade openness can affect FDI in a variety of ways. Lowerimport barriers can reduce tariff-jumping FDI, but may increase verti-cal FDI by facilitating the imports of inputs and machinery. Lower export barriers attract vertical FDI by facilitating the reexport ofprocessed goods; they attract horizontal FDI by expanding the marketsize. Openness is measured using the export-to-GDP ratio, correctedfor population and country size with data taken from the WDI.
6. Locational advantage. In addition to the above variables, measures thatquantify the gap between domestic and RTA education levels, finan-cial stability, and infrastructure are included. These measures aim atassessing the locational advantage of a country relative to other coun-tries in the RTA. The higher the education level, financial stability, andinfrastructure quality in a country compared with other RTA mem-bers, the higher its locational advantage for FDI within the RTA.
In its most complete form, the empirical model takes the following form:
ln FDIi,t�1 � l ln FDIit � a1 ln Yit�a2 ln REGYit � b1gYit � b2REGgY,it� g1 ln educit � g2 ln GAPeducit � d1 ln finit � d2 ln GAPfinit� f1 ln tvit � f2 ln GAPtvit �q res(X / GDP)it � mi � wt � 1 � ei,t � 1,
where FDI denotes the stock of FDI (in 2000 dollars) in country i; Ydenotes real GDP (in 2000 dollars); REGY denotes market size, extendedto include RTA market size for countries belonging to a RTA; gY denotesreal GDP growth; REGgY denotes the average real growth rate in an RTAto which the country belongs; educ denotes the average years of edu-cation of people over age 15; fin is the PRSG financial risk index; tv isthe number of television per capita; res(X / GDP) is the measure of tradeopenness (the prefix GAP denotes the ratio between the domestic valueof the variable and the average value for all countries sharing an RTAwhich country i); m denotes the country’s fixed effects; and w denotes
314 Anos Casero and Kumar Seshan
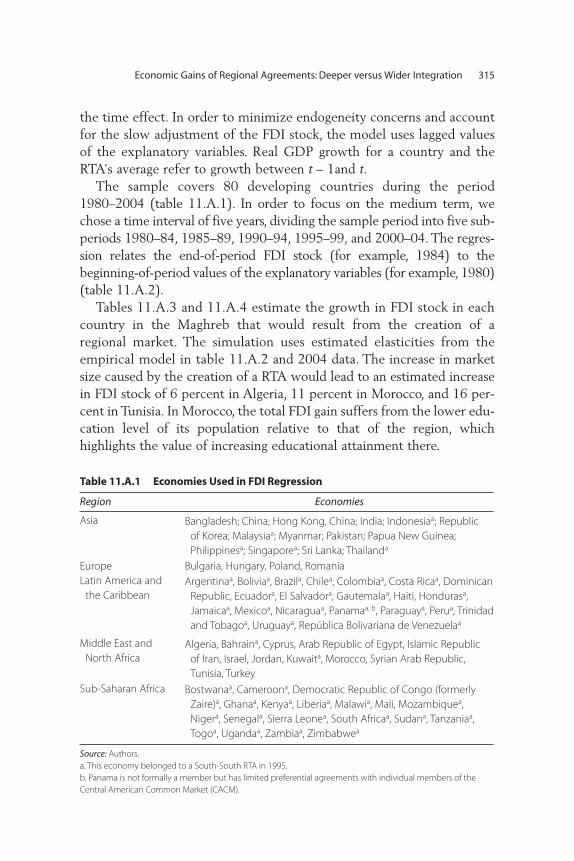
the time effect. In order to minimize endogeneity concerns and accountfor the slow adjustment of the FDI stock, the model uses lagged valuesof the explanatory variables. Real GDP growth for a country and theRTA’s average refer to growth between t – 1and t.
The sample covers 80 developing countries during the period1980–2004 (table 11.A.1). In order to focus on the medium term, wechose a time interval of five years, dividing the sample period into five sub-periods 1980–84, 1985–89, 1990–94, 1995–99, and 2000–04. The regres-sion relates the end-of-period FDI stock (for example, 1984) to thebeginning-of-period values of the explanatory variables (for example, 1980)(table 11.A.2).
Tables 11.A.3 and 11.A.4 estimate the growth in FDI stock in eachcountry in the Maghreb that would result from the creation of aregional market. The simulation uses estimated elasticities from theempirical model in table 11.A.2 and 2004 data. The increase in marketsize caused by the creation of a RTA would lead to an estimated increasein FDI stock of 6 percent in Algeria, 11 percent in Morocco, and 16 per-cent in Tunisia. In Morocco, the total FDI gain suffers from the lower edu-cation level of its population relative to that of the region, whichhighlights the value of increasing educational attainment there.
Economic Gains of Regional Agreements: Deeper versus Wider Integration 315
Table 11.A.1 Economies Used in FDI Regression
Region Economies
Asia Bangladesh; China; Hong Kong, China; India; Indonesiaa; Republic of Korea; Malaysiaa; Myanmar; Pakistan; Papua New Guinea; Philippinesa; Singaporea; Sri Lanka; Thailanda
Europe Bulgaria, Hungary, Poland, RomaniaLatin America and
the CaribbeanArgentinaa, Boliviaa, Brazila, Chilea, Colombiaa, Costa Ricaa, Dominican
Republic, Ecuadora, El Salvadora, Gautemalaa, Haiti, Hondurasa, Jamaicaa, Mexicoa, Nicaraguaa, Panamaa, b, Paraguaya, Perua, Trinidadand Tobagoa, Uruguaya, República Bolivariana de Venezuelaa
Middle East and North Africa
Algeria, Bahraina, Cyprus, Arab Republic of Egypt, Islamic Republic of Iran, Israel, Jordan, Kuwaita, Morocco, Syrian Arab Republic,Tunisia, Turkey
Sub-Saharan Africa Bostwanaa, Cameroona, Democratic Republic of Congo (formerlyZaire)a, Ghanaa, Kenyaa, Liberiaa, Malawia, Mali, Mozambiquea,Nigera, Senegala, Sierra Leonea, South Africaa, Sudana, Tanzaniaa,Togoa, Ugandaa, Zambiaa, Zimbabwea
Source: Authors.a. This economy belonged to a South-South RTA in 1995.b. Panama is not formally a member but has limited preferential agreements with individual members of theCentral American Common Market (CACM).
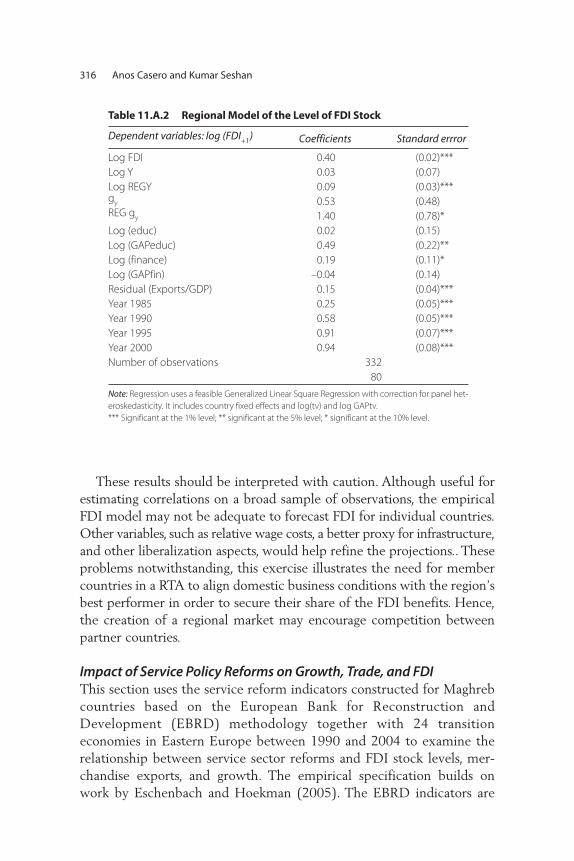
These results should be interpreted with caution. Although useful forestimating correlations on a broad sample of observations, the empiricalFDI model may not be adequate to forecast FDI for individual countries.Other variables, such as relative wage costs, a better proxy for infrastructure,and other liberalization aspects, would help refine the projections.. Theseproblems notwithstanding, this exercise illustrates the need for membercountries in a RTA to align domestic business conditions with the region’sbest performer in order to secure their share of the FDI benefits. Hence,the creation of a regional market may encourage competition betweenpartner countries.
Impact of Service Policy Reforms on Growth, Trade, and FDIThis section uses the service reform indicators constructed for Maghrebcountries based on the European Bank for Reconstruction andDevelopment (EBRD) methodology together with 24 transitioneconomies in Eastern Europe between 1990 and 2004 to examine therelationship between service sector reforms and FDI stock levels, mer-chandise exports, and growth. The empirical specification builds onwork by Eschenbach and Hoekman (2005). The EBRD indicators are
316 Anos Casero and Kumar Seshan
Table 11.A.2 Regional Model of the Level of FDI Stock
Dependent variables: log (FDI+1) Coefficients Standard errror
Log FDI 0.40 (0.02)***Log Y 0.03 (0.07)Log REGY 0.09 (0.03)***gy 0.53 (0.48)REG gy 1.40 (0.78)*Log (educ) 0.02 (0.15)Log (GAPeduc) 0.49 (0.22)**Log (finance) 0.19 (0.11)*Log (GAPfin) –0.04 (0.14)Residual (Exports/GDP) 0.15 (0.04)***Year 1985 0.25 (0.05)***Year 1990 0.58 (0.05)***Year 1995 0.91 (0.07)***Year 2000 0.94 (0.08)***Number of observations 332Number of countries 80
Note: Regression uses a feasible Generalized Linear Square Regression with correction for panel het-eroskedasticity. It includes country fixed effects and log(tv) and log GAPtv. *** Significant at the 1% level; ** significant at the 5% level; * significant at the 10% level.
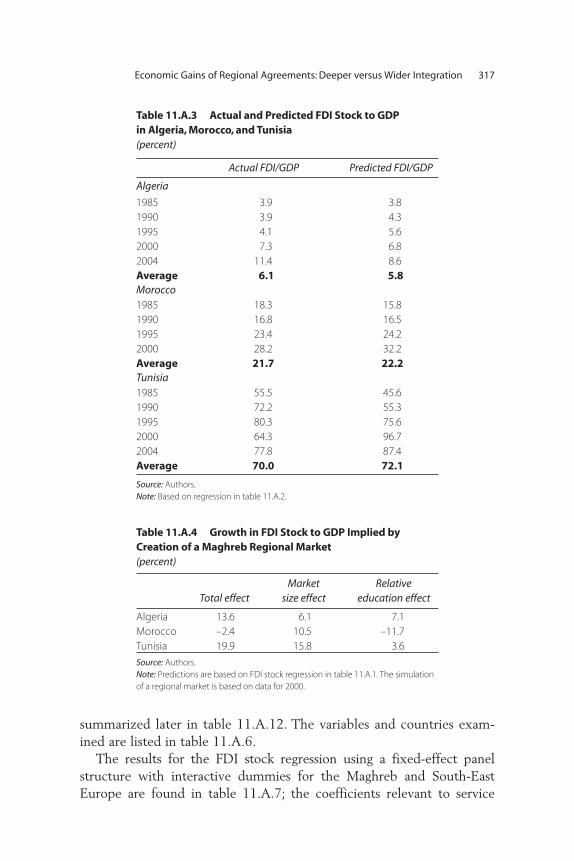
summarized later in table 11.A.12. The variables and countries exam-ined are listed in table 11.A.6.
The results for the FDI stock regression using a fixed-effect panelstructure with interactive dummies for the Maghreb and South-EastEurope are found in table 11.A.7; the coefficients relevant to service
Economic Gains of Regional Agreements: Deeper versus Wider Integration 317
Table 11.A.3 Actual and Predicted FDI Stock to GDP in Algeria, Morocco, and Tunisia(percent)
Actual FDI/GDP Predicted FDI/GDP
Algeria
1985 3.9 3.81990 3.9 4.31995 4.1 5.62000 7.3 6.82004 11.4 8.6Average 6.1 5.8Morocco1985 18.3 15.81990 16.8 16.51995 23.4 24.22000 28.2 32.2Average 21.7 22.2Tunisia1985 55.5 45.61990 72.2 55.31995 80.3 75.62000 64.3 96.72004 77.8 87.4Average 70.0 72.1
Source: Authors.Note: Based on regression in table 11.A.2.
Table 11.A.4 Growth in FDI Stock to GDP Implied by Creation of a Maghreb Regional Market(percent)
Total effectMarket
size effectRelative
education effect
Algeria 13.6 6.1 7.1Morocco –2.4 10.5 –11.7Tunisia 19.9 15.8 3.6Source: Authors.Note: Predictions are based on FDI stock regression in table 11.A.1. The simulationof a regional market is based on data for 2000.
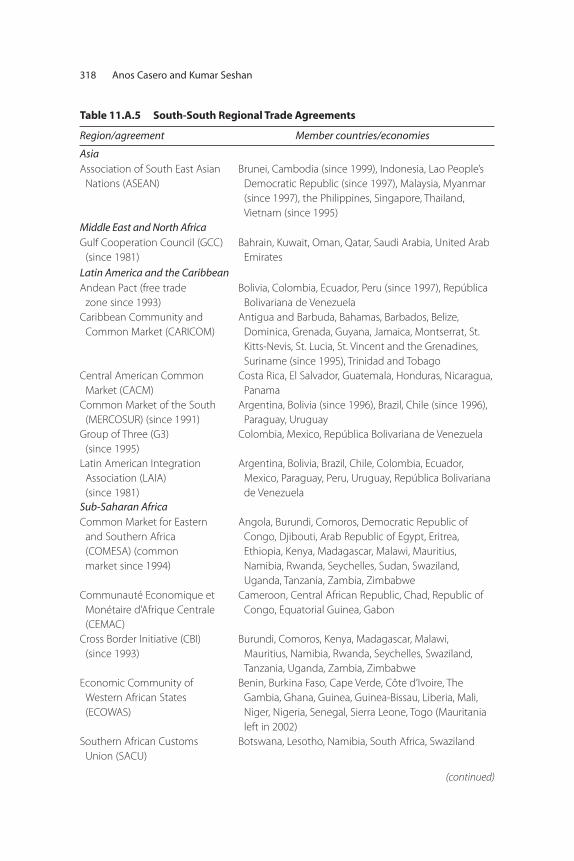
318 Anos Casero and Kumar Seshan
Table 11.A.5 South-South Regional Trade Agreements
Region/agreement Member countries/economies
AsiaAssociation of South East Asian
Nations (ASEAN) Brunei, Cambodia (since 1999), Indonesia, Lao People’s
Democratic Republic (since 1997), Malaysia, Myanmar (since 1997), the Philippines, Singapore, Thailand,Vietnam (since 1995)
Middle East and North AfricaGulf Cooperation Council (GCC)
(since 1981)Bahrain, Kuwait, Oman, Qatar, Saudi Arabia, United Arab
EmiratesLatin America and the CaribbeanAndean Pact (free trade
zone since 1993)Bolivia, Colombia, Ecuador, Peru (since 1997), República
Bolivariana de VenezuelaCaribbean Community and
Common Market (CARICOM) Antigua and Barbuda, Bahamas, Barbados, Belize,
Dominica, Grenada, Guyana, Jamaica, Montserrat, St.Kitts-Nevis, St. Lucia, St. Vincent and the Grenadines,Suriname (since 1995), Trinidad and Tobago
Central American CommonMarket (CACM)
Costa Rica, El Salvador, Guatemala, Honduras, Nicaragua,Panama
Common Market of the South(MERCOSUR) (since 1991)
Argentina, Bolivia (since 1996), Brazil, Chile (since 1996),Paraguay, Uruguay
Group of Three (G3) (since 1995)
Colombia, Mexico, República Bolivariana de Venezuela
Latin American IntegrationAssociation (LAIA) (since 1981)
Argentina, Bolivia, Brazil, Chile, Colombia, Ecuador,Mexico, Paraguay, Peru, Uruguay, República Bolivarianade Venezuela
Sub-Saharan AfricaCommon Market for Eastern
and Southern Africa (COMESA) (common market since 1994)
Angola, Burundi, Comoros, Democratic Republic ofCongo, Djibouti, Arab Republic of Egypt, Eritrea,Ethiopia, Kenya, Madagascar, Malawi, Mauritius,Namibia, Rwanda, Seychelles, Sudan, Swaziland,Uganda, Tanzania, Zambia, Zimbabwe
Communauté Economique etMonétaire d’Afrique Centrale(CEMAC)
Cameroon, Central African Republic, Chad, Republic ofCongo, Equatorial Guinea, Gabon
Cross Border Initiative (CBI) (since 1993)
Burundi, Comoros, Kenya, Madagascar, Malawi,Mauritius, Namibia, Rwanda, Seychelles, Swaziland,Tanzania, Uganda, Zambia, Zimbabwe
Economic Community ofWestern African States(ECOWAS)
Benin, Burkina Faso, Cape Verde, Côte d’Ivoire, TheGambia, Ghana, Guinea, Guinea-Bissau, Liberia, Mali,Niger, Nigeria, Senegal, Sierra Leone, Togo (Mauritanialeft in 2002)
Southern African Customs Union (SACU)
Botswana, Lesotho, Namibia, South Africa, Swaziland
(continued)
reforms impact are displayed in table 11.A.8. The stock of FDI to GDPin the Maghreb rises by 8.8 percentage points for every unit increase inthe infrastructure index, 9.2 percentage points for every unit increase inthe financial services sector index, and 8.5 percentage points for every
Economic Gains of Regional Agreements: Deeper versus Wider Integration 319
Table 11.A.5 South-South Regional Trade Agreements (continued)
Region/agreement Member countries/economies
Southern African Development Community (SADC)
Angola, Botswana, Democratic Republic of Congo (since1992), Lesotho, Malawi, Mauritius (since 1995),Mozambique, Namibia (since 1992), Seychelles (1992),South Africa (since 1994), Swaziland, Tanzania, Zambia,Zimbabwe
Union Economique et Monétaire (UEMOA)
Benin, Burkina Faso, Côte d’Ivoire, Guinea-Bissau (since1997), Mali, Niger, Senegal, Togo
Source: Authors, based on updated information from Jaumotte 2004. Note: Unless mentioned otherwise, the RTAs were in effect during the entire 1980–2004 period.
Table 11.A.6 Documentation of Data Used in Panel Analysis for Service Reforms
Variable (definition) Source of data
Growth (per capita GDP growth) World Bank, World Development Indicators databaseInvestment/GDP (gross fixed capital
formation/GDP)IMF, World Economic Outlook database
Chg Investment/GDP (change in investment/GDP)
IMF, World Economic Outlook database
Inflation (consumer price inflation) IMF, World Economic Outlook database Crisis (dummy for financial
crisis/armed conflict)n.a.
FDI/GDP (sock of FDI/GDP) UNCTAD Finance (average of EBRD
reform indexes on banking and nonbanking financial sector)
EBRD Transition Report 2004
Infrastructure (average of EBRD reform indexes on infrastructure[telecom, rail, road, water, power])
EBRD Transition Report 2004
Invclim (average of EBRD reformindexes on privatization andliberalization)
EBRD Transition Report 2004
Service (average of Invclim andinfrastructure)
EBRD Transition Report 2004
Source: Authors.Note: Country sample: Albania, Algeria, Armenia, Azerbaijan, Belarus, Bulgaria, Croatia, Czech Republic, Estonia,Georgia, Hungary, Kazakhstan, Kyrgyz Republic, Latvia, Lithuania, FYR Macedonia, Moldova, Morocco, Poland, Romania, Russian Federation, Slovak Republic, Slovenia, Tajikistan, Tunisia, Ukraine, Uzbekistan. UNCTAD = United Nations Conference on Trade and Development. n.a. = not applicable.
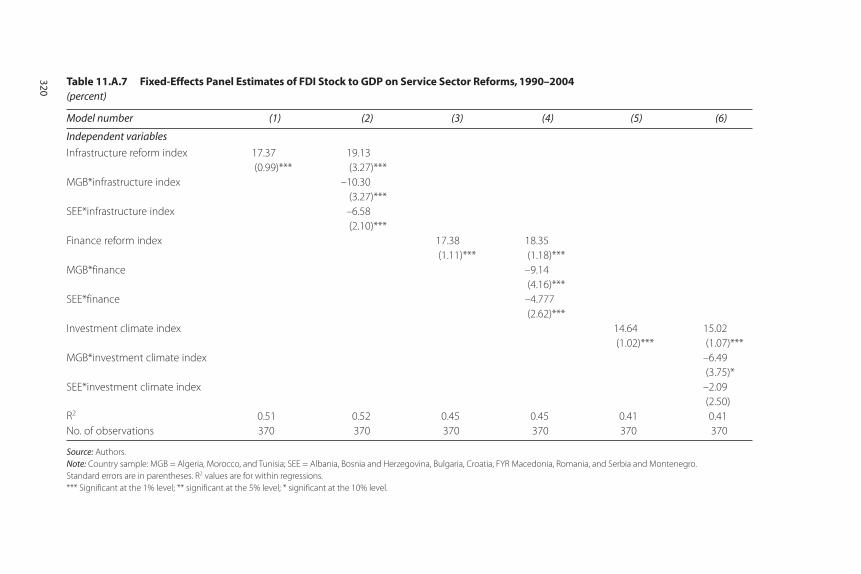
Table 11.A.7 Fixed-Effects Panel Estimates of FDI Stock to GDP on Service Sector Reforms, 1990–2004(percent)
Model number (1) (2) (3) (4) (5) (6)
Independent variables
Infrastructure reform index 17.37 (0.99)***
19.13 (3.27)***
MGB*infrastructure index –10.30 (3.27)***
SEE*infrastructure index –6.58 (2.10)***
Finance reform index 17.38 (1.11)***
18.35 (1.18)***
MGB*finance –9.14 (4.16)***
SEE*finance –4.777 (2.62)***
Investment climate index 14.64 (1.02)***
15.02 (1.07)***
MGB*investment climate index –6.49 (3.75)*
SEE*investment climate index –2.09 (2.50)
R2 0.51 0.52 0.45 0.45 0.41 0.41No. of observations 370 370 370 370 370 370
Source: Authors.Note: Country sample: MGB = Algeria, Morocco, and Tunisia; SEE = Albania, Bosnia and Herzegovina, Bulgaria, Croatia, FYR Macedonia, Romania, and Serbia and Montenegro. Standard errors are in parentheses. R2 values are for within regressions.*** Significant at the 1% level; ** significant at the 5% level; * significant at the 10% level.
320
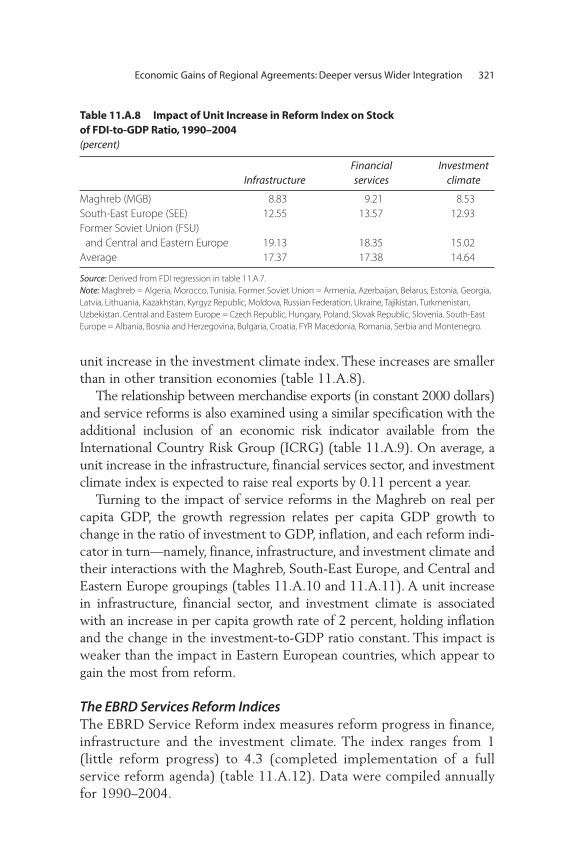
unit increase in the investment climate index. These increases are smallerthan in other transition economies (table 11.A.8).
The relationship between merchandise exports (in constant 2000 dollars)and service reforms is also examined using a similar specification with theadditional inclusion of an economic risk indicator available from theInternational Country Risk Group (ICRG) (table 11.A.9). On average, aunit increase in the infrastructure, financial services sector, and investmentclimate index is expected to raise real exports by 0.11 percent a year.
Turning to the impact of service reforms in the Maghreb on real percapita GDP, the growth regression relates per capita GDP growth tochange in the ratio of investment to GDP, inflation, and each reform indi-cator in turn—namely, finance, infrastructure, and investment climate andtheir interactions with the Maghreb, South-East Europe, and Central andEastern Europe groupings (tables 11.A.10 and 11.A.11). A unit increasein infrastructure, financial sector, and investment climate is associatedwith an increase in per capita growth rate of 2 percent, holding inflationand the change in the investment-to-GDP ratio constant. This impact isweaker than the impact in Eastern European countries, which appear togain the most from reform.
The EBRD Services Reform IndicesThe EBRD Service Reform index measures reform progress in finance,infrastructure and the investment climate. The index ranges from 1(little reform progress) to 4.3 (completed implementation of a fullservice reform agenda) (table 11.A.12). Data were compiled annuallyfor 1990–2004.
Economic Gains of Regional Agreements: Deeper versus Wider Integration 321
Table 11.A.8 Impact of Unit Increase in Reform Index on Stock of FDI-to-GDP Ratio, 1990–2004(percent)
InfrastructureFinancial services
Investment climate
Maghreb (MGB) 8.83 9.21 8.53South-East Europe (SEE) 12.55 13.57 12.93Former Soviet Union (FSU)
and Central and Eastern Europe 19.13 18.35 15.02Average 17.37 17.38 14.64
Source: Derived from FDI regression in table 11.A.7.Note: Maghreb = Algeria, Morocco, Tunisia. Former Soviet Union = Armenia, Azerbaijan, Belarus, Estonia, Georgia,Latvia, Lithuania, Kazakhstan, Kyrgyz Republic, Moldova, Russian Federation, Ukraine, Tajikistan, Turkmenistan,Uzbekistan. Central and Eastern Europe = Czech Republic, Hungary, Poland, Slovak Republic, Slovenia. South-EastEurope = Albania, Bosnia and Herzegovina, Bulgaria, Croatia, FYR Macedonia, Romania, Serbia and Montenegro.
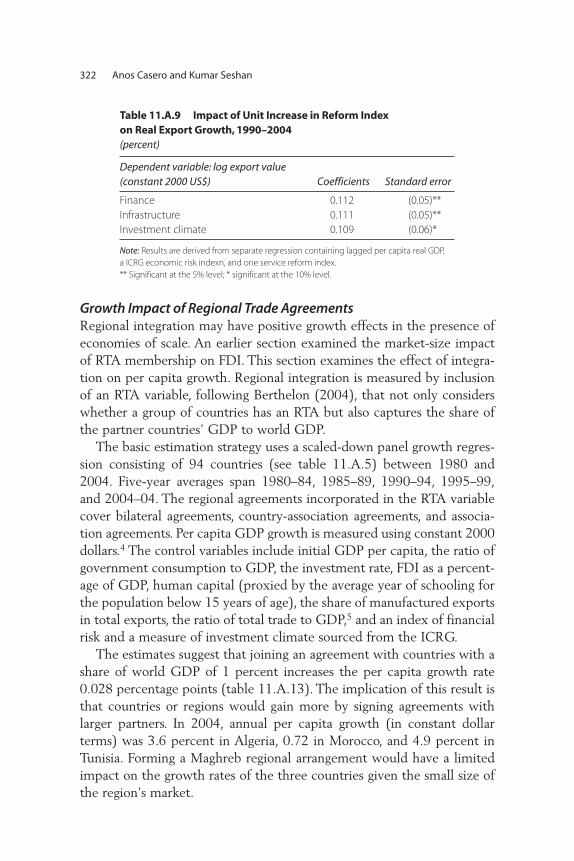
Growth Impact of Regional Trade AgreementsRegional integration may have positive growth effects in the presence ofeconomies of scale. An earlier section examined the market-size impactof RTA membership on FDI. This section examines the effect of integra-tion on per capita growth. Regional integration is measured by inclusionof an RTA variable, following Berthelon (2004), that not only considerswhether a group of countries has an RTA but also captures the share ofthe partner countries’ GDP to world GDP.
The basic estimation strategy uses a scaled-down panel growth regres-sion consisting of 94 countries (see table 11.A.5) between 1980 and2004. Five-year averages span 1980–84, 1985–89, 1990–94, 1995–99,and 2004–04. The regional agreements incorporated in the RTA variablecover bilateral agreements, country-association agreements, and associa-tion agreements. Per capita GDP growth is measured using constant 2000dollars.4 The control variables include initial GDP per capita, the ratio ofgovernment consumption to GDP, the investment rate, FDI as a percent-age of GDP, human capital (proxied by the average year of schooling forthe population below 15 years of age), the share of manufactured exportsin total exports, the ratio of total trade to GDP,5 and an index of financialrisk and a measure of investment climate sourced from the ICRG.
The estimates suggest that joining an agreement with countries with ashare of world GDP of 1 percent increases the per capita growth rate0.028 percentage points (table 11.A.13). The implication of this result isthat countries or regions would gain more by signing agreements withlarger partners. In 2004, annual per capita growth (in constant dollarterms) was 3.6 percent in Algeria, 0.72 in Morocco, and 4.9 percent inTunisia. Forming a Maghreb regional arrangement would have a limitedimpact on the growth rates of the three countries given the small size ofthe region’s market.
322 Anos Casero and Kumar Seshan
Table 11.A.9 Impact of Unit Increase in Reform Index on Real Export Growth, 1990–2004(percent)
Dependent variable: log export value (constant 2000 US$) Coefficients Standard error
Finance 0.112 (0.05)**Infrastructure 0.111 (0.05)**Investment climate 0.109 (0.06)*
Note: Results are derived from separate regression containing lagged per capita real GDP, a ICRG economic risk indexn, and one service reform index. ** Significant at the 5% level; * significant at the 10% level.
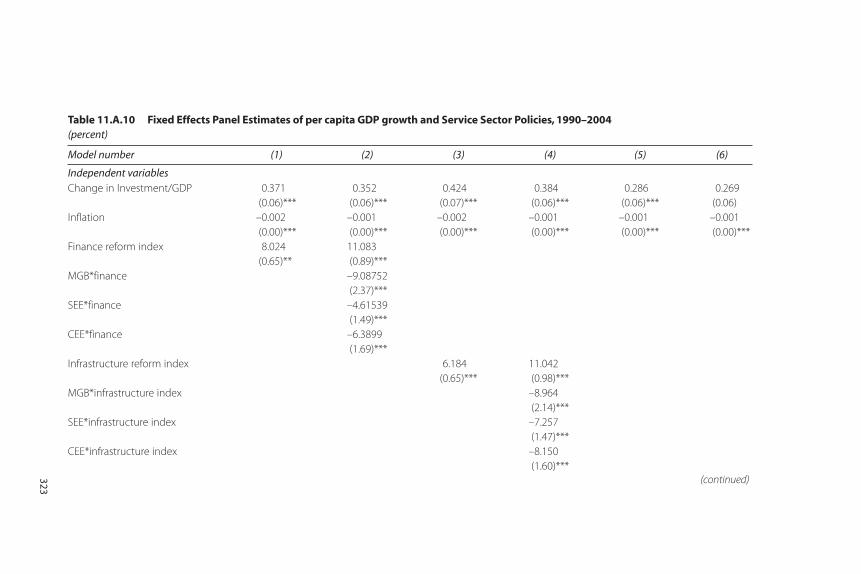
Table 11.A.10 Fixed Effects Panel Estimates of per capita GDP growth and Service Sector Policies, 1990–2004(percent)
Model number (1) (2) (3) (4) (5) (6)
Independent variables Change in Investment/GDP 0.371
(0.06)***0.352
(0.06)***0.424
(0.07)***0.384
(0.06)***0.286
(0.06)***0.269
(0.06)Inflation –0.002
(0.00)***–0.001(0.00)***
–0.002(0.00)***
–0.001(0.00)***
–0.001(0.00)***
–0.001(0.00)***
Finance reform index 8.024(0.65)**
11.083(0.89)***
MGB*finance –9.08752(2.37)***
SEE*finance –4.61539(1.49)***
CEE*finance –6.3899(1.69)***
Infrastructure reform index 6.184 (0.65)***
11.042 (0.98)***
MGB*infrastructure index –8.964(2.14)***
SEE*infrastructure index –7.257(1.47)***
CEE*infrastructure index –8.150(1.60)***
323
(continued)
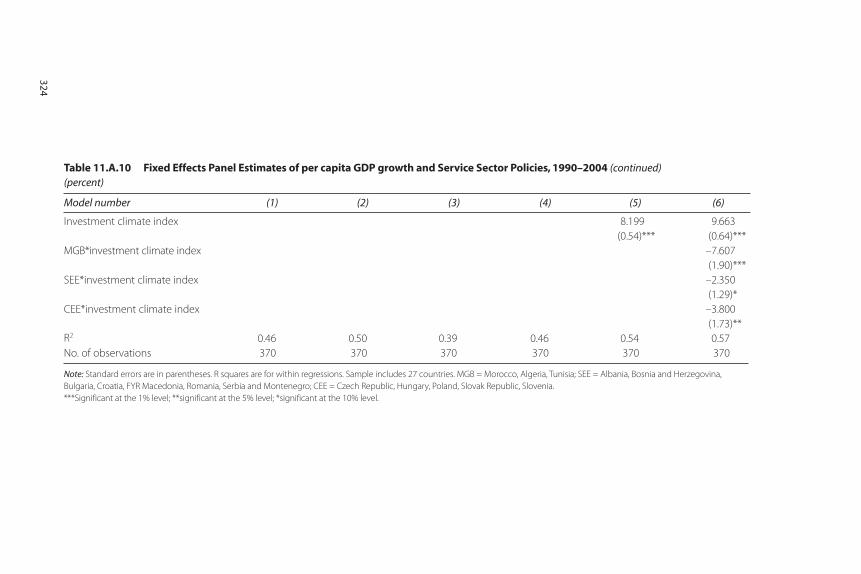
Investment climate index 8.199(0.54)***
9.663 (0.64)***
MGB*investment climate index –7.607(1.90)***
SEE*investment climate index –2.350(1.29)*
CEE*investment climate index –3.800(1.73)**
R2 0.46 0.50 0.39 0.46 0.54 0.57No. of observations 370 370 370 370 370 370
Note: Standard errors are in parentheses. R squares are for within regressions. Sample includes 27 countries. MGB = Morocco, Algeria, Tunisia; SEE = Albania, Bosnia and Herzegovina, Bulgaria, Croatia, FYR Macedonia, Romania, Serbia and Montenegro; CEE = Czech Republic, Hungary, Poland, Slovak Republic, Slovenia.***Significant at the 1% level; **significant at the 5% level; *significant at the 10% level.
Table 11.A.10 Fixed Effects Panel Estimates of per capita GDP growth and Service Sector Policies, 1990–2004 (continued)(percent)
Model number (1) (2) (3) (4) (5) (6)
324

Economic Gains of Regional Agreements: Deeper versus Wider Integration 325
Table 11.A.11 Impact of Unit Increase in Service Reform Index on Annual per Capita Real GDP Growth, 1990–2004(percent)
Infrastructure Financial services Investment climate
Maghreb (MGB) 2.08 2.20 2.06 South-East
Europe (SEE) 3.77 5.84 7.35Central and Eastern
Europe (CEE) 2.90 4.00 5.87 Former Soviet
Union (FSU) 11.04 11.08 9.66
Source: Derived from growth regression in table 11.A.10. Note: MGB = Algeria, Morocco, Tunisia; SEE = Albania, Bosnia and Herzegovina, Bulgaria, Croatia, FYR Macedonia,Romania, Serbia and Montenegro; CEE = Czech Republic, Hungary, Poland, Slovak Republic, Slovenia; FSU = Armenia, Azerbaijan, Belarus, Estonia, Georgia, Latvia, Lithuania, Kazakhstan, Kyrgyz Republic, Moldova, Russ-ian Federation, Ukraine, Tajikistan, Turkmenistan, Uzbekistan.
Table 11.A.12 Definition of 4.3 Ranking on Reform Indices
Index Components
Finance • Banking and interest rate liberalization: Full convergence of banking laws and regulations with the Bank for International Settlements (BIS)standards; provision of full set of competitive banking services
• Securities markets and nonbank financial institutions: Full convergence of securities laws and regulations with the International Organizationfor Governmental Securities Commissions (IOSCO) standards; fullydeveloped nonbank intermediation
Infrastructure • Electric power: Cost-reflective tariffs that provide adequate incentive forefficiency improvements; private sector that is heavily involved in theunbundled and well-regulated sector; fully liberalized sector, with well-functioning arrangements for network access and full competition ingeneration
• Railways: Separation of infrastructure from operations and freight frompassenger operations; full divestment and transfer of asset ownershipimplemented or planned, including infrastructure and rolling stock;establishment of rail regulator and implementation of access pricing
• Roads: Fully decentralized road administration; commercialized roadmaintenance operations competitively awarded to private companies;road user charges that reflect full costs of road use and associatedfactors, such as congestion, accidents, and pollution; widespreadprivate sector participation in all aspects of road provision; full publicconsultation on new road projects.
• Telecommunications: Effective regulation through independent entity;coherent regulatory and institutional framework to deal with tariffs,interconnection rules, licensing, concession fees, and spectrumallocation; presence of consumer ombudsman
(continued)

326 Anos Casero and Kumar Seshan
• Water and wastewater: Fully decentralized and commercialized utilities;fully autonomous regulator with complete authority to review andenforce tariff levels and quality standards; widespread private sectorparticipation through service/management/lease contracts; high-powered incentives, full concessions, or divestiture of water and wastewater services in major urban areas
Services • Average of infrastructure and financeInvestment
climate• Large-scale privatization: More than 75 percent of enterprise assets in
private ownership; significant progress on corporate governance ofthese enterprises
• Small-scale privatization: No state ownership of small enterprises;effective tradability of land
• Governance and enterprise restructuring: Effective corporate controlexercised through domestic financial institutions and markets,fostering market-driven restructuring
• Price liberalization: Complete price liberalization, with no price controloutside housing, transport, and natural monopolies
• Trade and foreign exchange system: Removal of most tariff barriers;membership in World Trade Organization
• Competition policy: Effective enforcement of competition; unrestrictedentry to most markets
Source: Authors, based on EBRD 2004.
Table 11.A.12 Definition of 4.3 Ranking on Reform Indices (continued)
Index Components
Table 11.A.13 Country Fixed-Effects Growth Regression, 1980–2004 (five-year averages)
Dependent variable: per-capita GDP growth
Log initial per-capita GDP –6.971***Government consumption to GDP (%) –0.067*Investment to GDP (%) 0.102***FDI to GDP (%) 0.053Manufacturing exports to merchandise exports (%) 0.001Human capital (average year of schooling for population
>15 years of age)0.110
Trade to GDP (%) 0.029***Financial risk index 0.049**Investment climate index 0.341***Absolute RTA 0.028***Number of country groups 94R2 (within) 0.51
Source: Authors.Note: Period dummies are not shown. *** Significant at the 1% level; ** significant at the 5% level; * significant at the 10% level.

A more promising scenario considers the formation of a Maghrebunion and its entrance into an RTA with the United States or theEuropean Union. This would generate additional per capita growth formembers of the Maghreb Union of almost 1.0 percentage point for anagreement with the United States and 0.7 percentage point for anarrangement with the European Union.
Notes
1. Investment climate reforms refer to reforms that aim at enhancing marketcontestability and openness (such as privatization, liberalization, competi-tion). Because of data limitations, the impact of labor mobility is not assessedin this analysis.
2. Typically, CGE models are used to evaluate the trade effects of an RTA. Thesemodels combine standard microeconomic assumptions with data from a sin-gle period to simulate the response to policy changes of an entire economy orgroup of economies. CGE models have a weaker empirical foundation thanmodels used for macroeconomic forecasting, because their equations are notestimated empirically from time series data. However, CGE models are ableto account for more complex general equilibrium interactions among a largernumber of sectors and markets than econometric models can. The resultsfrom the CGE models should be read with caution, given the range of esti-mates, varying their assumptions about elasticities of response and mobilityfactors that affect the model calibration.
3. For a more detailed discussion of the model, including the data source, seeJaumotte (2004).
Economic Gains of Regional Agreements: Deeper versus Wider Integration 327
Table 11.A.14 Fixed-Effects Panel Estimates of (Log) Real Export Value on RTA Market
Dependent Variable: Log export value (constant 2000 US$)
Initial per-capita Real GDP 0.813 (0.09)***FDI inflows to GDP 0.014 (0.01)**Exchange rate risk 0.042 (0.01)***Inflation 0.000 (0.00)*Investment climate index 0.022 (0.01)**Absolute RTA 0.004 (0.00)***R2 (within) 0.77Number of observations/groups 387/112
Source: Authors.Note: Standards errors are shown in parentheses.*** Significant at the 1% level; ** significant at the 5% level; * significant at the 10% level.
4. The growth impact of a RTA is similar when per capita growth is measuredusing purchasing price parity prices.
5. Additional control variables that were initially included but later discardedbecause of the lack of statistical significance arising from limited variationacross time in a fixed-effect specification were trading partner’s growth andbordering countries’ share of world GDP.
References
Barro R. J., and J.-W. Lee, 2000 “International Data on Education Attainment:Updates and Implications.” NBER Working Paper No. 7911. National Bureauof Economic Research, Cambridge, Mass.
Berthelon, M. 2004. “Growth Effects of Regional Integration Agreements.”Working Paper, Central Bank of Chile, Santiago.
EBRD (European Bank for Reconstruction and Development). 2004. EBRDTransition Report 2004. London: EBRD. http: //transitionreport.co.uk/TRO/b/transition-report/volume2004/issue1.
Dee, P., and J. Gali. 2003. “The Trade and Investment Effects of PreferentialTrading Arrangements.” Working Paper 10160, National Bureau of EconomicResearch, Cambridge, MA.
Eschenbach, F., and B. Hoekman. 2005. “Services Policy Reform and EconomicGrowth in Transition Economies, 1990–2004.” Research Working Paper 3663,World Bank, Washington, DC.
Galal, A., and B. Hoekman, eds. 2003. Arab Economic Integration: Between Hopeand Reality. Washington, DC: Brookings Institution Press.
Hoekman, B., and D. Konan. 1999. “Deep Integration, Nondiscrimination, andEuro-Mediterranean Free Trade.” Policy Research Working Paper 2130, WorldBank, Washington, DC.
Jaumotte, F. 2004. “Foreign Direct Investment and Regional Trade Agreements:The Market Size Effect Revisited.” Working Paper WP/04/206, InternationalMonetary Fund, Washington, DC.
Konan, D., and K. Maskus. 2003. “Quantifying the Impact of ServicesLiberalization in a Developing Country.” Policy Research Working Paper3193, World Bank, Washington, DC.
Müller-Jentsch, D. 2005. Deeper Integration and Trade in Services in the Euro-Mediterranean Region. World Bank/European Commission Programme onPrivate Participation in Mediterranean Infrastructure. Washington, DC:World Bank.
World Bank. 2005a. Global Economic Prospects. Washington, DC: World Bank.
328 Anos Casero and Kumar Seshan

———. 2006. Fostering Higher Growth and Employment in the Kingdom of Morocco.Washington, DC: World Bank.
World Development Indicators (database). http://data.worldbank.org/data-catalog/world-development-indicators. World Bank, Washington, DC.
World Economic Outlook database. http://www.imf.org/external/ns/cs.aspx?id=28.International Monetary Fund, Washington, DC.
Economic Gains of Regional Agreements: Deeper versus Wider Integration 329

331
A
Agadir Agreement, 8, 240f, 270b, 275,276t, 283
air transportationservices reform in Morocco, 136, 137,
144–47, 154tAlgeria
distance metrics and, 98–100EXPY metric, 96–98See also export diversification in Algeria;
services trade development in Algeriaantiexport bias, 5, 57, 250Arab League, 270bArab Maghreb Union, 8, 270b, 275–77,
276t, 283See also deep versus wide integration in
Maghreb countriesAsian Giants. See China and India
B
backbone services reform in Morocco, 5–6,135–36
implementing competition policies,155–57
liberalization reforms and service sectoropenness, 137, 138–39f
locking in reforms, 153–55options for regulatory convergence with
EU, 140–55regulatory reform options, 153–54tstrengthening regulatory framework,
137, 140banking and other financial services
services reform in Morocco, 136,147–50, 153t
Breush-Pagan test, 29
C
case studies in new export products, 4,47–48
diffusion and fear of imitation, 55–57entrepreneurs, 52, 53–54b, 54–55factors constraining development, 54–55methodology, 51overview, 48–49, 50ttriggers for new export activities,
51–54China and India
rise of, 1, 2, 3, 7, 227–28See also competition from China
and India; economic growth in Chinaand India
Index
Note: b, f, and t indicate boxes, figures, and tables, respectively.
clothing exportsoverseas market access, 242–44f, 242–46
competition from China and India, 2, 7,227–28
antiexport bias, 5average tariffs in China and India,
246f, 247faverage tariffs in MENA countries and,
235, 236f, 237, 237fconclusions and policy messages for
MENA countries, 250EU market share changes, 233–34import duties and, 235–38import surges from India, 240–41, 241flogistics performance index and, 237,
238fMENA export growth and global
market share, 228, 229tMENA exports to EU countries, 228,
229t, 230, 258–63t. See also overseasmarket access
MENA intensive and extensive margins of export growth, 230, 231t, 251–58t
MENA performance and, 228–39nontariff impediments in MENA
countries and, 237–38tariff rates and, 235–38, 239–41, 239ftrade barriers and, 235–38trade preferences, 7, 238trade protection and, 234–38trade transaction costs, 7, 237–38
competitivenessmeaning of, 1–2, 3
concentration indexesGini, 13, 15, 18, 19f, 27, 29–30, 33, 38,
42–43tHerfindahl, 13, 15, 17f, 18, 27, 29–30,
33, 36–37, 40–41tTheil, 13, 15, 16f, 18, 20f, 21f, 36–37,
38–39, 40–41t
D
deep versus wide integration in Maghrebcountries, 8, 299
conceptual issues, 300–302conclusions, 312measuring gains from, 301–2methodological issues, 302–3methodology for estimating gains,
313–27
scenarios, 302–12South-South regional trade agreements,
318–19tdistance metrics
Algeria and, 98–100Dutch disease, 68–69, 194, 214, 216
E
economic growth in China and Indiaannual baseline growth rates in selected
economies, 217tchanges in exports caused by extra
growth, 218t, 220tchanges in output caused by extra
growth, 219tconclusions, 6–7, 214–16exporting to China and
India and, 195four channels of growth, 194–203importing from China and India
and, 195–96indirect trade impacts and, 199–200key features, 193–94literature review, 194–203studies, 200–203study methodology, data, and simulation
design, 203–6study results, 6–7, 206–14third-market competition and, 197–99
Egypt, Arab Republic ofexport diversification. See case studies in
new export productsENP. See European Neighborhood Policyentrepreneurs
new export products and, 52, 53–54b,54–55
Estonialiberalization of telecommunications
sector, 145bEU. See European UnionEuro-Mediterranean Agreement, 238, 270,
281, 283European Bank for Reconstruction and
Development methodology, 316–21Service Reform index, 321, 325–26t
European Neighborhood Policy (ENP), 6,136, 137, 140
options for Morocco’s regulatory convergence with EU, 140–55
strengthening regulatory framework,137, 140
332 Index
European Union (EU)access to EU markets, 241–46acquis communautaire, 140, 147, 150–51directives governing
telecommunications, 141–43bEU market share changes, China and
India, 233–34financial services provisions for
European and accession partnerships,148, 149t, 150
MENA exports to EU countries, 228,229t, 230, 258–63t. See also overseasmarket access
Morocco’s options for regulatory convergence with, 140–55
regulatory convergence with the. See European Neighborhood Policy (ENP)
export concentration, 3–4, 13–14concentration ratios, 15, 18. See also
concentration indexesconclusions, 35–36Herfindahl index, 49findicators of export
diversification, 36–43random-effects estimation, 29
export concentration model, 26–35empirical results, 29–33, 34frobustness, 33, 35
export diversification, 3–5, 13, 14–21in Algeria. See export diversification
in Algeriacase studies, 47–48, 51–57conclusion, 60–61experimentation and imitation, 57–60impact of FDI on, 13, 14, 22–26indicators of, 36–43new product lines and markets, 14, 18,
19f, 20f, 21f, 47–48, 51–57policy design, 57–60in “resource-poor” countries, 48–49, 50ttraditional, 14, 18trends in, 15, 16f, 17f, 18
export diversification in Algeria, 4, 63–64current industrial policy strategy, 88–92dependence on hydrocarbons and, 68–74distance metrics, 98–100Dutch disease and, 68–69, 194, 214, 216EXPY metric, 96–98lack of diversification
explanations, 68–74metrics technical detail, 96–100
new methodology to, 74–80policy implications, 88–96possibility space and, 81–88, 89fprivate sector development constraints
and, 70–72product space and, 75–80product space to scan possibility space,
81–88, 89fprotectionism and, 72–73real exchange rate volatility and, 69–70rent seeking and, 73–74specialization and, 74–75structural transformation
considerations, 92–96structure of Algerian economy, 64–68
export growth and constant market shareanalysis, MENA countries, 251–65t
Export Market Access Fund (FAMEX)Tunisia, 59, 59b
export services in Morocco. See backboneservices reform in Morocco
export services in Tunisiaaccess to credit and, 131accounting, 112–13, 127–28t, 129, 131administrative and financial constraints
and, 131–32, 132fcompetitive compensation costs, 119–22considerations for growth and poverty
reduction, 5, 105–10engineering and architecture, 111–12,
118–19, 118f, 126, 127–28t, 128, 131francophone markets, 107–9human resource base and, 118–19ICT-enabled services, 5, 105–6,
107f, 113–18, 120f, 122–24, 123f, 130, 130b
impediments to exports, 5, 122–24insufficient telecom
infrastructure, 123–24international competitiveness in, 117–24lack of export orientation, 123lack of sufficient scale, 122legal services, 113, 127–28t, 129, 131market access restrictions, 125–29medical services and medical tourism, 5,
110–11, 111t, 121–22, 121t, 126,127–28t, 131
offshoring, 5, 105–6, 107–9, 107f,117–18, 117f
performance in emerging services, 110–17
policy considerations, 109–10
Index 333
professional education and training and, 124–25
professional reputation and standards in, 118–19
public tenders and, 131regulatory obstacles to professional
services trade, 125–29, 131structural consolidation and, 130–31tasks to strengthen
competitiveness, 124–32technology parks and, 130b
export sophistication (EXPY) metricAlgeria, 96–98
extensive marginchanges in, 18MENA countries, 230, 231t, 251–58t
F
FAMEX (Export Market Access Fund)Tunisia, 59, 59b
foreign direct investment (FDI)impact of Maghreb regional
market on, 313–16impact on export diversification, 13,
14, 23–26inward FDI stocks, 291–92, 292fservice liberalization and, 309–10, 311f,
311t, 316–21trends in FDI flows, 22–23
FranceFrench entry into Algerian supermarket
sector, 181b
G
General Agreement on Trade in Services(GATS), 137, 152, 163, 185, 288, 288f
Gini index, 13, 15, 18, 19f, 27, 29–30, 33,38, 42–43t
globalizationChina and India and, 234–38. See also
competition from China and Indiaconclusions and policy messages for
MENA countries, 250export growth and constant market
share analysis, 251–65tMENA countries and, 241–50MENA import duties by China and
India, 246, 248fMENA index of export market
penetration, 247, 248, 248t, 249t, 250
MENA opportunities for export growth, 247–50
open regionalism, 269, 294–95WTO-plus arrangements, 269
global supply chains or production networks, 1, 8, 203, 269
Greater Arab Free Trade Area (GAFTA)Agreement, 270b, 276t, 282, 283
Gulf Cooperation Council, 15, 204, 228,230, 270b, 276t, 278, 305
H
Hausmann-Taylor estimator, 29Hausmann test, 29Herfindahl index, 13, 15, 17f, 18, 27,
29–30, 33, 36–37, 40–41t
I
ICT services. See information and communication technologies services
imports from China and India, 239–41See also competition from China
and IndiaIndia. See China and Indiainformation and communication
technologies (ICT) servicesTunisia, 5, 105–6, 107f, 113–18, 120f,
122–24, 130, 130bintensive margin, 44n
changes in, 18MENA countries, 230, 231t, 251–58t
investment climate reforms, 307–10
J
Jordanexport diversification. See case studies in
new export products
LLebanon
export diversification. See case studies innew export products
liberalization reforms and service sectoropenness, 307–10
Estonia, 145bEstonia’s telecommunications
sector, 145bforeign direct investment and, 309–10,
311f, 311t, 316–21merchandise trade, 303–7
334 Index
Morocco, 137, 138–39fservices trade in Algeria, 186b
Logistics Performance Index, 284–86, 284f, 285f
M
Maghreb countries. See deep versus wideintegration in Maghreb countries
maritime transportationservices reform in Morocco, 136, 137,
150–51, 154tmedical services and medical tourism, 289
Tunisia, 5, 110–11, 111t, 121–22, 121t,126, 127–28t, 131
MENA (Middle East and North Africa)general information and considerations,
2–3merchandise trade
liberalization, 303–7Middle East and North Africa (MENA)
general information and considerations,2–3
See also specific countriesMorocco
export diversification. See case studies innew export products
services reforms. See backbone servicesreform in Morocco
most-favored nation tariffs and dutiesregional integration and, 236, 238, 246,
278, 281, 282, 283, 294
N
nontariff barriers and impediments,237–38, 282–84
North Africa. See Middle East and NorthAfrica (MENA); specific countries
O
offshoring, 2, 5, 117fexport services in Tunisia, 5, 105–6,
107–9, 107f, 117–18open forest calculations of distance,
99–100open regionalism, 269Overall Trade Restrictiveness Index
(OTRI), 282overseas market access
access to Chinese and Indian markets,246–47, 248f
access to EU and US markets, 241–46clothing exports, 242–44f, 242–46
P
Pan-Arab Free Trade Area, 8See also Greater Arab Free Trade Area
(GAFTA) Agreementport services
services reform in Morocco, 136, 137, 150–51
services reform in Romania, 151, 152bprivate sector development
World Bank report, 3product space, 75–80
to scan possibility space, 81–88, 89fprofessional services
reform in Morocco, 136, 137, 151–53,153–54t, 155
protectionism, 72–73proximity calculations of distance, 98–99
R
real exchange rate volatility, 69–70reforms
pace of, 3regional integration, 1, 2, 3, 8
bilateral agreements, 8, 270, 272t. See also specific agreements
gravity models, 273history of integration in MENA
countries, 269, 270bintraregional trade, 270, 273–82in Maghreb countries. See deep versus
wide integration in Maghreb countriesmost-favored nation tariffs and
duties, 236, 238, 246, 278, 281, 282, 283, 294
open regionalism, 269, 294–95partners from outside the region, 270preferential opening of markets, 294regional and preferential trade
agreements, 2, 8, 267–69, 268f, 294–95
remittances, 293, 293ftelecommunications services, 289trade diversion, 278trade preferences, 282WTO-plus arrangements, 269
regional integration failures, 269–73bilateral complementarity, 278, 279–80tlow complementarity, 274–78
Index 335
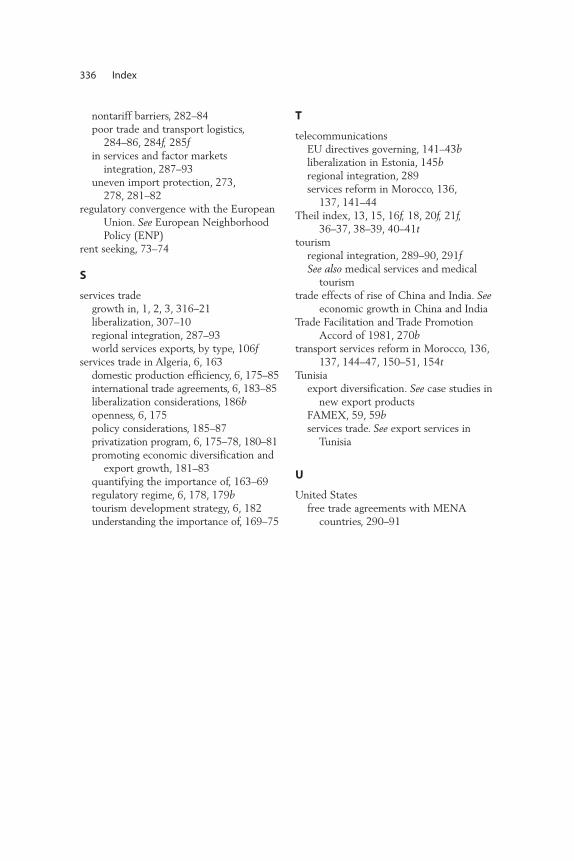
nontariff barriers, 282–84poor trade and transport logistics,
284–86, 284f, 285fin services and factor markets
integration, 287–93uneven import protection, 273,
278, 281–82regulatory convergence with the European
Union. See European NeighborhoodPolicy (ENP)
rent seeking, 73–74
S
services tradegrowth in, 1, 2, 3, 316–21liberalization, 307–10regional integration, 287–93world services exports, by type, 106f
services trade in Algeria, 6, 163domestic production efficiency, 6, 175–85international trade agreements, 6, 183–85liberalization considerations, 186bopenness, 6, 175policy considerations, 185–87privatization program, 6, 175–78, 180–81promoting economic diversification and
export growth, 181–83quantifying the importance of, 163–69regulatory regime, 6, 178, 179btourism development strategy, 6, 182understanding the importance of, 169–75
T
telecommunicationsEU directives governing, 141–43bliberalization in Estonia, 145bregional integration, 289services reform in Morocco, 136,
137, 141–44Theil index, 13, 15, 16f, 18, 20f, 21f,
36–37, 38–39, 40–41ttourism
regional integration, 289–90, 291fSee also medical services and medical
tourismtrade effects of rise of China and India. See
economic growth in China and IndiaTrade Facilitation and Trade Promotion
Accord of 1981, 270btransport services reform in Morocco, 136,
137, 144–47, 150–51, 154tTunisia
export diversification. See case studies innew export products
FAMEX, 59, 59bservices trade. See export services in
Tunisia
U
United Statesfree trade agreements with MENA
countries, 290–91
336 Index

ECO-AUDIT
Environmental Benefits Statement
The World Bank is committed to preservingendangered forests and natural resources.Trade Competitiveness of the Middle Eastand North Africa: Policies for ExportDiversification is printed on a recycledpaper made with 50-percent post-consumerwaste. The Office of the Publisher followsthe recommended standards for paper usageset by the Green Press Initiative, a nonprofitprogram supporting publishers in using fiberthat is not sourced from endangered forests.For more information, visit www.green-pressinitiative.org.
Saved:• 16 trees• 5 million BTUs of
total energy• 1,476 pounds of net
greenhouse gases • 7,108 gallons of
waste water• 432 pounds of solid
waste
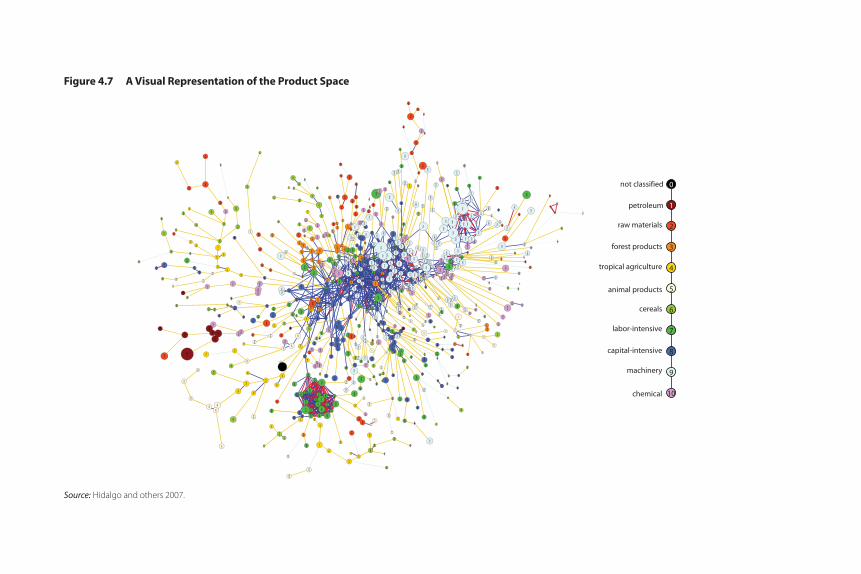
Figure 4.7 A Visual Representation of the Product Space
Source: Hidalgo and others 2007.
not classified 0
1
2
3
4
5
6
7
8
9
10
petroleum
raw materials
forest products
tropical agriculture
animal products
cereals
labor-intensive
capital-intensive
machinery
chemical
Figure 4.8a Algeria in the Product Space, 1975
Source: Authors’ calculations, using data from UN COMTRADE.
not classified 0
1
2
3
4
5
6
7
8
9
10
petroleum
raw materials
forest products
tropical agriculture
animal products
cereals
labor-intensive
capital-intensive
machinery
chemical
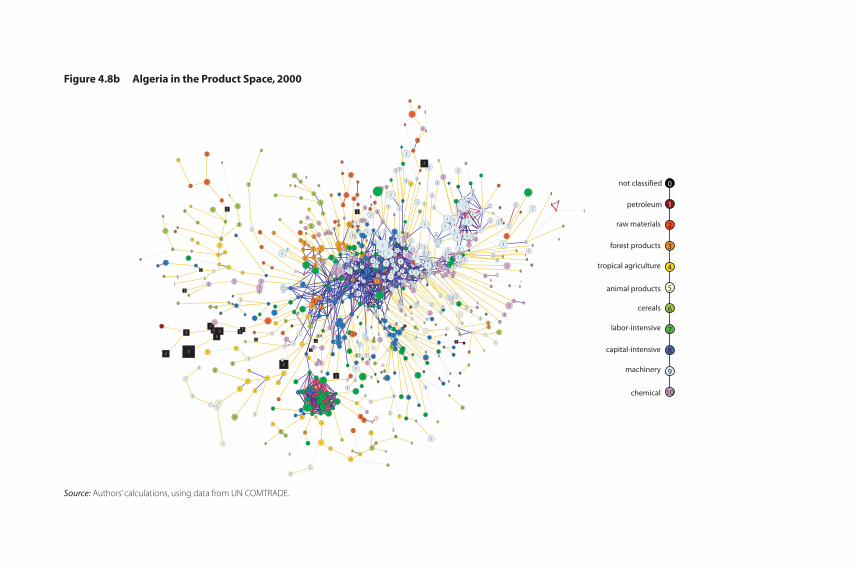
Figure 4.8b Algeria in the Product Space, 2000
Source: Authors’ calculations, using data from UN COMTRADE.
not classified 0
1
2
3
4
5
6
7
8
9
10
petroleum
raw materials
forest products
tropical agriculture
animal products
cereals
labor-intensive
capital-intensive
machinery
chemical
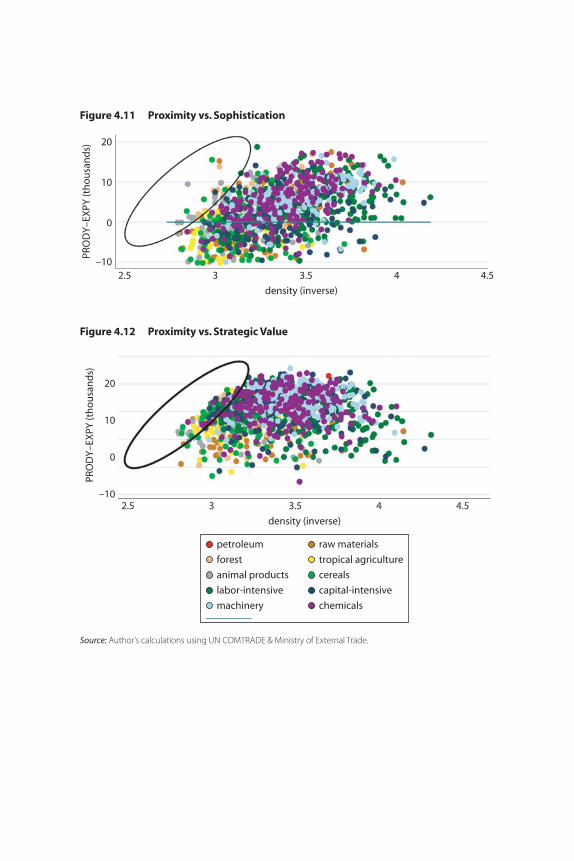
Figure 4.11 Proximity vs. Sophistication
Figure 4.12 Proximity vs. Strategic Value
PRO
DY
–EX
PY (t
ho
usa
nd
s)
2.5 3 3.5 4–10
10
20
0
4.5
density (inverse)
Source: Author’s calculations using UN COMTRADE & Ministry of External Trade.
PRO
DY
–EX
PY (t
ho
usa
nd
s)
–10
10
20
0
2.5 3 3.5 4 4.5
density (inverse)
petroleum
forest
animal products
labor-intensive
machinery
raw materials
tropical agriculture
cereals
capital-intensive
chemicals

ISBN 978-0-8213-8074-1
SKU 18074
Over the past decade, four major developments in global economic integration have
shaped trade policy and the economic performance of countries within the Middle East
and North Africa region: the emergence of global supply chains, the growth of trade in
services, the rise of China and India as major international trading powers, and regional
integration. These developments, along with the labor and natural resource endowments
of particular countries (some are resource-poor but labor-abundant, some resource-rich
and labor-abundant, and some resource-rich and labor-importing), have influenced export
diversification outcomes across the region. Yet these countries may not be taking full
advantage of all of the opportunities the four new trends offer to them.
Trade Competitiveness of the Middle East and North Africa: Policies for Export Diversification
examines the region’s trade policy agendas and their results by focusing on the countries’
response to these four key developments in international trade. As the region recovers
from the global financial and economic crises, the book identifies reforms that could allow
countries to further strengthen global production networks, benefit more from trade in
services, better compete in external markets to face the rise of China and India, and reach
the full potential of regional integration. If thoroughly implemented, especially by oil
exporters, all of these reforms could help boost growth and job creation in the region.