Embed Size (px)
Citation preview
1
Leapfrogging and Moving Closer towards Regional Partners: Rate of Transition Analysis by Digital Mosaics and Weibull Probability Distribution Model
Ejaz Gul School of Economics
Bahauddin Zakariya University, Multan, Pakistan [email protected]
Prof. Dr. Imran Sharif Chaudhry School of Economics
Bahauddin Zakariya University, Multan, Pakistan [email protected]
Abstract
Regional integration and cooperation promotes economic development of countries. Many regional blocs have been created in different regions of the globe to boost trade and socio-cultural ties between the member states. Pakistan has since been a great exponent of regional integration and cooperation. With emergence of China Pakistan Economic Corridor (CPEC), it is expected that Pakistan will move further closer to its historical ally China and other regional partners including Central Asian States. This paper investigates the gradual transition of Pakistan towards greater regional integration using data on eight selected variables from 2001 to 2015 (15 years) for ten selected countries of Asia. To ascertain the rate of transition of regional integration, digital analysis of data was carried out and digital mosaics were created with the help of latest digital software SURFER - 9. To know the effect of different variables on rate of transition of regional integration, data was analyzed by using Weibull Probability Distribution Model (WPDM). Results indicated that Pakistan is consistently moving closer to the regional countries and the rate of transition of regional integration is increasing with time. The land, air and sea routes of connectivity had greater effect on this rate of transition compared to other variables. This validated the conception that CPEC will play instrumental role in strengthening regional integration in the context of Pakistan.
Keywords: Regional, integration, connectivity, CPEC, transition, rate, digital, analysis, mosaics, Weibull, probability, distribution, model.
JEL Classification: F13, F14, F15.
1. Introduction
In the last two decades, international system has seen a sharp increase in regional blocs. The impulse towards regionalism was generated by bleak prospects for progress on multilateral agenda of globalization. Historically, Pakistan has always been pursuing closer socioeconomic ties with its regional neighbours though the journey towards regional integration and connectivity has been bumpy and leaping. A glance on the regional landscape indicates that Pakistan has been pursuing trade and investment initiatives with almost all regional partners, albeit health of these initiatives is questionable. The auxiliaries and effect multipliers like socio-cultural exchanges, pacts, treaties, regional conferences and help in emergencies have also been implemented skillfully to boost regional integration.
Furthermore, geographical location of Pakistan makes it capable to have regional connectivity with its regional allies. It has been part of almost all the regional economic and
2
trade alliances. In the same context, it has recently entered into a great venture of CPEC with China. The venture is being conceived as the apex of regional connectivity and integration. All these efforts indicate a steady transition towards greater regional integration for socioeconomic prosperity of the region. Pakistan’s clear intent towards greater regional integration notwithstanding, the real question is what has been the rate of this transition? Has this transition been slow or faster with time? What has been the effect of different socioeconomic and institutional parameters on this transition?
Focusing on these questions, an analysis was carried out to estimate the rate of transition of regional integration over time and to assess the impact of selected variables on the rate of transition of regional integration. The timeframe taken for this analysis was the first fifteen years of 21st century (from 2001 to 2015). Paper has two unique features; application of digital analysis for quantitative measurement of rate of transition of regional integration and application of Weibull probability distribution model for qualitative assessment of the rate of transition of regional integration.
2. A Prismatic Appraisal of Regional Integration
Regional integration is process by which neighbouring states willingly cooperate with each other in economic, social, cultural, political and security spheres. Many renowned researchers have worked on regional integration at the global level. Some researchers have focused on the pluses and minuses of regional integration in the context of developing countries. The new geopolitical paradigm at the global level and security concerns of countries have created renewed interest of socioeconomic and geopolitical scientists in the new regionalism. New regionalism model is not specifically trade oriented; it has expanded in goals, objectives and motives beyond trade.
Abdin has elucidated that a large number of regional blocs have surfaced on the globe from 1960 onwards with nearly every state member of one or more such arrangements. In the our regional context, formation of the South Asian Association for Regional Cooperation (SAARC), Shanghai Cooperation Organization (SCO), Economic Cooperation Organization (ECO) have emerged for the increased regional integration in South Asia (Abdin, 2009). Anthony has investigated that globalization has increased inequality in nations and regional integration is essential to reduce the harmful impact of this global inequality (Anthony, 1995). Basile investigated the productivity polarization in different regions of Europe. He concluded that regional integration can increase productivity in member states by labour and technology exchange (Basile, 2009). Banerjee has indicated in his research that development in India and Bangladesh has increased due to regional cooperation (Banerjee, 2009). Bernard carried out research on validity of convergence hypothesis and he concluded that regional integration is a basis of convergence at the regional level (Bernard, 1996). Bianchi also carried out work on convergence hypothesis and it was inferred that regional integration increases convergence (Bianchi, 1997). Borenztein has indicated that regional integration boost FDI influx in the member states because of which economic growth increases manifold (Borenztein, 1998). Bulli has elucidated that income distribution across the member states of a regional bloc converge with time (Bulli, 2001). Costantini has explained that there is stochastic convergence among European economies. This has happened due to policies of regional economies (Costantini, 2005). De has investigated the reasons of trade blocks on the borders of regional partners and neighbours. He concluded that there is a need to formulate comprehensive border management policy at the regional level to facilitate trade across the borders (De, 2011). Similarly, De has also worked on
3
the feasibility of developing strategic and economic corridors in South Asia. He concluded that development of economic corridors is an essential prerequisite for greater prosperity of states in South Asia (De, 2014). Easterly has elucidated that states should make comprehensive policies for regional integration to consolidate opportunities embedded in geographical reality of being neighbours. This will accrue economic and social benefits to regional partners (Easterly, 1993). Edwards has investigated linkage between openness, trade liberalization and growth in developing countries. He concluded that for socioeconomic growth of developing countries it is essential to focus on regional polies of trade. Regional integration can definitely foster the socioeconomic growth of partners (Edwards, 1993). Fan has carried out research on spatial economic issues in East Asia and Chinese regions. He brought out idea that exchange of skilled and unskilled labour as well as technology by regional neighbours will ensure greater socioeconomic development of regional partners. He also elucidated that this factor has played its role in consistent development of developed countries (Fan, 2003). Fujita has worked on spatial economy and it has been concluded in the study that geographical proximity of states has great advantage for economic ties of regional partners. Accordingly, policies by states are required to be aligned to optimally utilize this advantage (Fujita, 1999). Gul has elucidated that Liberia being a war hit country has developed faster in the last few years due to cooperation with regional partners. Liberia has shunned away conflicts with its neighbours and its GDP has increased faster than before (Gul, 2010). Gustavsson has investigated linkage of social welfare and economic growth with regional integration. He concluded that economic growth and social welfare increases manifold with regional integration (Gustavsson, 2004). Hanson has carried out a very interesting study on border city pairs and exemplified his case with integration of USA and Mexico. He concluded that integration and cooperation between border cities is highly beneficial for welfare and prosperity of the people in the border cities (Hanson, 1996). Similarly, Henson also worked on formulation of regional wage structure to increase labour welfare, productivity and boost the trade (Hanson, 1997). Hassan has investigated the efficacy of SAARC as economic block and concluded that SAARC objectives could not be fully achieved due divergent policies of member states (Hassan, 2001). Henrekson carried out research on effects of European integration on economic growth of member countries. He concluded that European Union has played significant role in increasing economic growth of member countries (Henrekson, 1997). Honohan has indicated that small blocs within a bigger regional bloc are not significantly beneficial as they dissipate efforts of larger regional bloc (Honohan, 2000). Ishid has elucidated that economic corridors generate special economic zones with boosted economic activities due to which economic development of countries increases (Ishid, 2009). Islam has explained lessons learnt from convergence hypothesis and concluded that regional integration should be focused by developing countries more than developed countries (Islam, 2003). Krugman elucidated that productivity and consequent returns increase with regional cooperation and economic geography at the global level has validated this fact (Krugman, 1991). Limão carried out extensive research on infrastructure and trade. He concluded that good connectivity infrastructure between countries reduces locational disadvantage and transport costs. On the other hand it increases trade between the countries (Limão, 2001). Masahiro has indicated that infrastructural connectivity increases regional cooperation more than any other factor (Masahiro, 2007). Melo conducted research on new paradigms in regional integration. He indicated that contemporary regionalism is not only for trade as it used to be conventionally. It has many motives now which include security, political harmony and geopolitical dominance (Melo, 1992). Olivier has conducted thorough research on convergence of per capita income. He
4
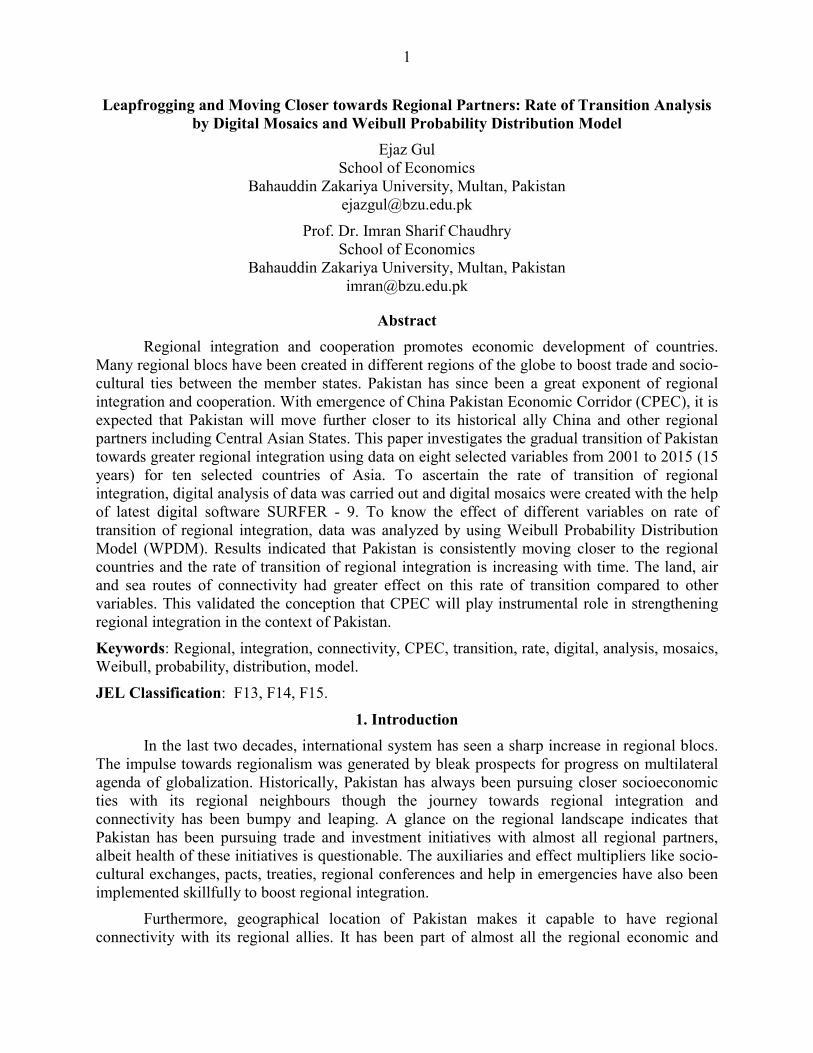
concluded that in Indian Ocean Bloc the biggest reason behind convergence of per capita income is trade between the member states (Olivier, 2011). Osvaldo elucidated that new regionalism at global landscape is an interplay of security and development (Osvaldo, 2000). Paelinck explored the supply side of regional economic cooperation. He concluded that supply of input material improves with regional cooperation due to which productivity and growth increases (1981). Quah has elucidated that development of regional clusters in Europe is outcome of policies of member countries (Quah, 1996). Rivera has explained relationship between economic integration and endogenous growth. It was concluded in the study that major benefit of economic integration is substantial increase in endogenous growth (Rivera, 1991). Romer has indicated that regional cooperation results into increasing returns and long run growth of member countries (Romer, 1986). Sengupta has investigated the scenario of regional trade and FDI in the context of SAARC. It was highlighted in the study that though regional trade and FDI has increased in some of the member states but goals of SAARC could not be fully achieved owing to geographical and political realities (Sengupta, 1997). Thisse produced the economic theory of regional blocs. He pronounced that regional clusters should be developed on geopolitical realities as well as socioeconomic needs of member states. Trade should not be only ruling criteria in development of regional blocs. (Thisse, 2000). Venables have taken critical stock of winner and losers of regional integration at global level. It was highlighted in study that new regional integration should be broad based and should encompass objectives like geopolitics, security, FDI, trade, institutional modernization, export promotion, diversification and socioeconomic transformation as shown in figure 1(Venables, 2003).
Figure 1: Objectives on regionalism
Wagner has elucidated in his study that regional economic integration is a necessity not a choice for the developing countries because developing countries can take optimal benefits from regional integration in the context of trade liberalization, FDI and institutional transformation (Wagner, 1983). Winters worked on linkage between trade liberalization and poverty. It was pronounced in the study that regional integration can be the most effective mechanism for trade liberalization and reduction in poverty, especially for developing countries where poverty ratios are high (Winters, 2004). Zon has carried out research on the relationship between endogenous
5
economic growth and regional connectivity. It was highlighted in the study that endogenous economic growth of the member states increases with regional connectivity (Zon, 2009).
The regionalism in Asia has been historically less effective than other regions. Political differences, economic disparities and a past plagued by conflict and war have historically hampered regional cooperation in South Asia. Pakistan is member of different regional arrangements and has been a great proponent of regional integration. In the same context, Pakistan has entered into a great connectivity venture, CPEC, with China. Both countries are hopeful that this venture will not only ensure greater connectivity with regional partners but will also help in socioeconomic wellbeing of the populace of both countries.
3. Inquiry Techniques
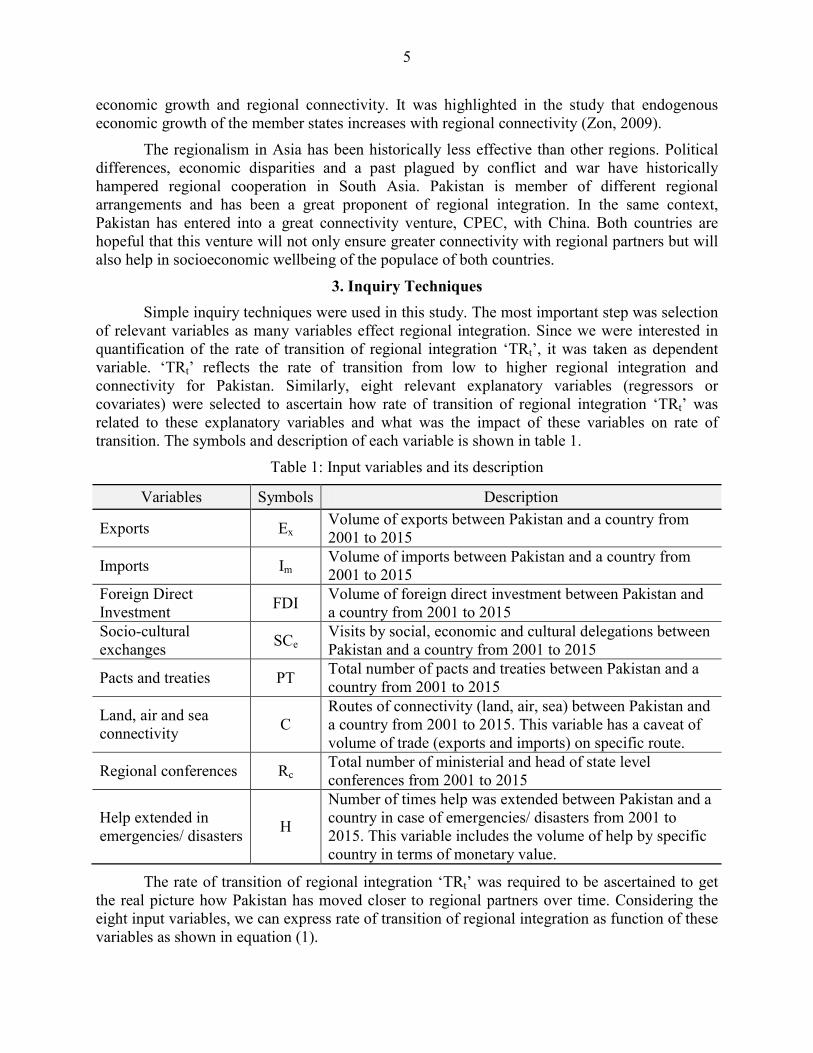
Simple inquiry techniques were used in this study. The most important step was selection of relevant variables as many variables effect regional integration. Since we were interested in quantification of the rate of transition of regional integration ‘TRt’, it was taken as dependent variable. ‘TRt’ reflects the rate of transition from low to higher regional integration and connectivity for Pakistan. Similarly, eight relevant explanatory variables (regressors or covariates) were selected to ascertain how rate of transition of regional integration ‘TRt’ was related to these explanatory variables and what was the impact of these variables on rate of transition. The symbols and description of each variable is shown in table 1.
Table 1: Input variables and its description
Variables Symbols Description
Exports Ex Volume of exports between Pakistan and a country from 2001 to 2015
Imports Im Volume of imports between Pakistan and a country from 2001 to 2015
Foreign Direct Investment
FDI Volume of foreign direct investment between Pakistan and a country from 2001 to 2015
Socio-cultural exchanges
SCe Visits by social, economic and cultural delegations between Pakistan and a country from 2001 to 2015
Pacts and treaties PT Total number of pacts and treaties between Pakistan and a country from 2001 to 2015
Land, air and sea connectivity
C Routes of connectivity (land, air, sea) between Pakistan and a country from 2001 to 2015. This variable has a caveat of volume of trade (exports and imports) on specific route.
Regional conferences Rc Total number of ministerial and head of state level conferences from 2001 to 2015
Help extended in emergencies/ disasters
H
Number of times help was extended between Pakistan and a country in case of emergencies/ disasters from 2001 to 2015. This variable includes the volume of help by specific country in terms of monetary value.
The rate of transition of regional integration ‘TRt’ was required to be ascertained to get the real picture how Pakistan has moved closer to regional partners over time. Considering the eight input variables, we can express rate of transition of regional integration as function of these variables as shown in equation (1).
6
Rateoftransitionofregionalintegration, TR� = f(E�, I�, FDI, SC�, PT, C, R�, H)………(1)
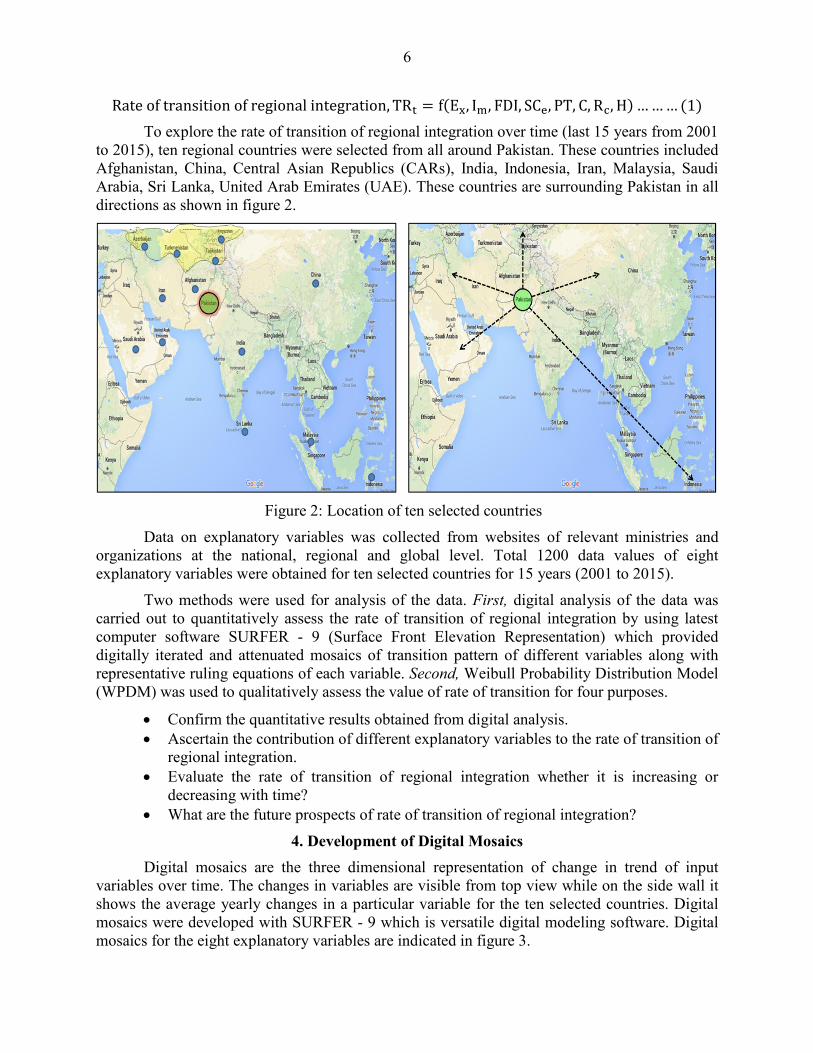
To explore the rate of transition of regional integration over time (last 15 years from 2001 to 2015), ten regional countries were selected from all around Pakistan. These countries included Afghanistan, China, Central Asian Republics (CARs), India, Indonesia, Iran, Malaysia, Saudi Arabia, Sri Lanka, United Arab Emirates (UAE). These countries are surrounding Pakistan in all directions as shown in figure 2.
Figure 2: Location of ten selected countries
Data on explanatory variables was collected from websites of relevant ministries and organizations at the national, regional and global level. Total 1200 data values of eight explanatory variables were obtained for ten selected countries for 15 years (2001 to 2015).
Two methods were used for analysis of the data. First, digital analysis of the data was carried out to quantitatively assess the rate of transition of regional integration by using latest computer software SURFER - 9 (Surface Front Elevation Representation) which provided digitally iterated and attenuated mosaics of transition pattern of different variables along with representative ruling equations of each variable. Second, Weibull Probability Distribution Model (WPDM) was used to qualitatively assess the value of rate of transition for four purposes.
Confirm the quantitative results obtained from digital analysis. Ascertain the contribution of different explanatory variables to the rate of transition of
regional integration. Evaluate the rate of transition of regional integration whether it is increasing or
decreasing with time? What are the future prospects of rate of transition of regional integration?
4. Development of Digital Mosaics
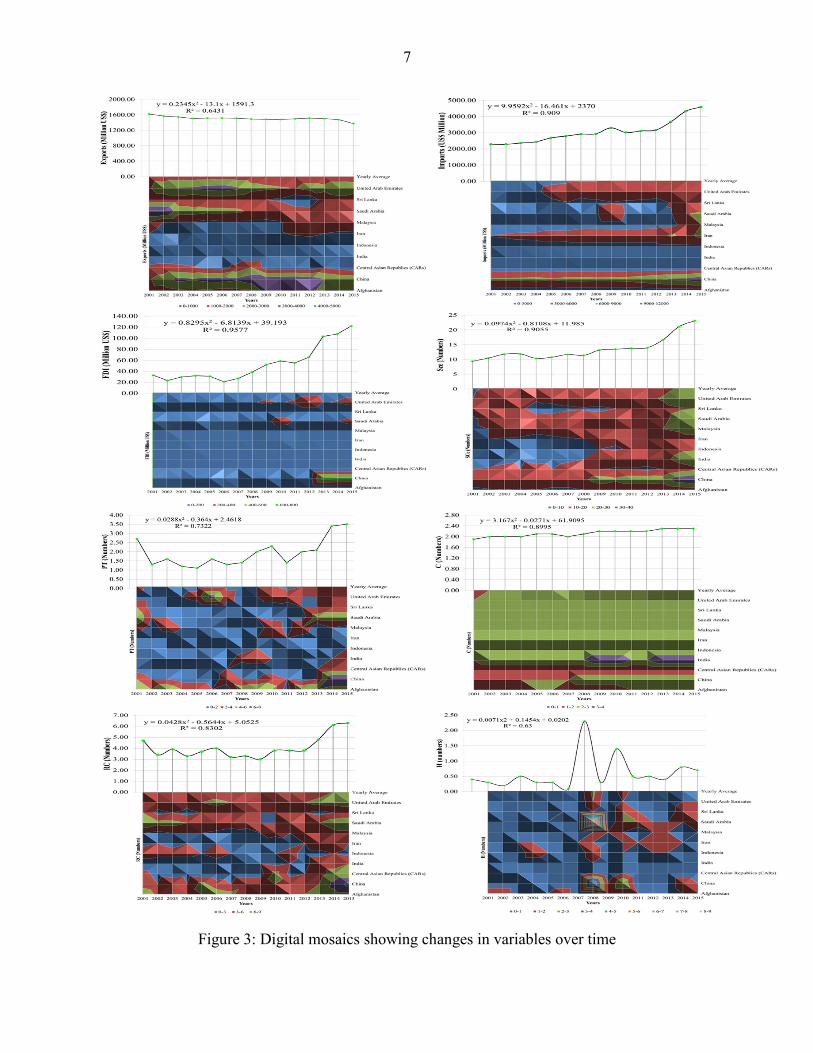
Digital mosaics are the three dimensional representation of change in trend of input variables over time. The changes in variables are visible from top view while on the side wall it shows the average yearly changes in a particular variable for the ten selected countries. Digital mosaics were developed with SURFER - 9 which is versatile digital modeling software. Digital mosaics for the eight explanatory variables are indicated in figure 3.
7
Figure 3: Digital mosaics showing changes in variables over time
8
In the digital analysis two aspects were seen; the trend of average values of input variables for ten selected countries and rate of change in the input variables over time. For example the mosaic of FDI showed that FDI from China remained within the range of 200 million US$ per year from 2001 to 2013 but from 2013 onwards there was a sharp increase in FDI from China and it attained a high range of 600-800 million US$ per year. Similarly, FDI from Saudi Arabia attained range of 200-400 million US$ per year in the year 2010 and 2015. FDI from UAE attained three peaks in 2009, 2012 and 2015. The average curve of FDI shown on the side wall of mosaic indicated three prominent dips in 2002, 2006 and 2011. From 2012 onwards, there has an increase in the average FDI per year. The digital mosaic of exports showed that our exports with China were in the range of 3000-4000 million US$ from 2003 to 2013 but from 2013 onwards it reduced to range of 2000-3000 million US$. Similarly, there has been reduction in the exports with Saudi Arabia, UAE and Afghanistan. However, there has been increase in the exports to Malaysia and Sri Lanka. The average curve of exports on the side wall of mosaic indicated that there been consistent decrease in the average exports outlay per year from 2013 onwards. Similar interpretation can be done for the digital mosaics of remaining variables.
Digital mosaics of explanatory variables provided representative trend equations with respective R2 values. These equations were analyzed in three brackets; from 2001 to 2005, from 2006 to 2010 and from 2010 to 2015 to find the value of rate of transition of regional integration in these time brackets. Suppose these values are A1, A2 and A3 respectively for the three time brackets where A1, A2 and A3 are the net sum of rate of transition values of eight variables meaning thereby that values of A1, A2 and A3 for respective time brackets were calculated by equation (2), (3) and (4).
A1 = � A�� + A��
����
����
+ A��� + A��� + A�� + A� + A�� + A� ………(2)
A2 = � A�� + A��
����
����
+ A��� + A��� + A�� + A� + A�� + A� ………(3)
A3 = � A�� + A��
����
����
+ A��� + A��� + A�� + A� + A�� + A� ………(4)
Using these three values of rate of transition, various propositions as shown in table 2 were worked out.
Table 2: Various propositions for the values of rate of transition
Propositions Connotations
A1 < A2 < A3 Rate of transition to regional integration is consistently increasing
A1 > A2 > A3 Rate of transition to regional integration is consistently decreasing
Digital analysis gave ruling equations for each variable as well as the segmented or bracketed equations for the three time brackets. These bracketed equations were extracted by the
9
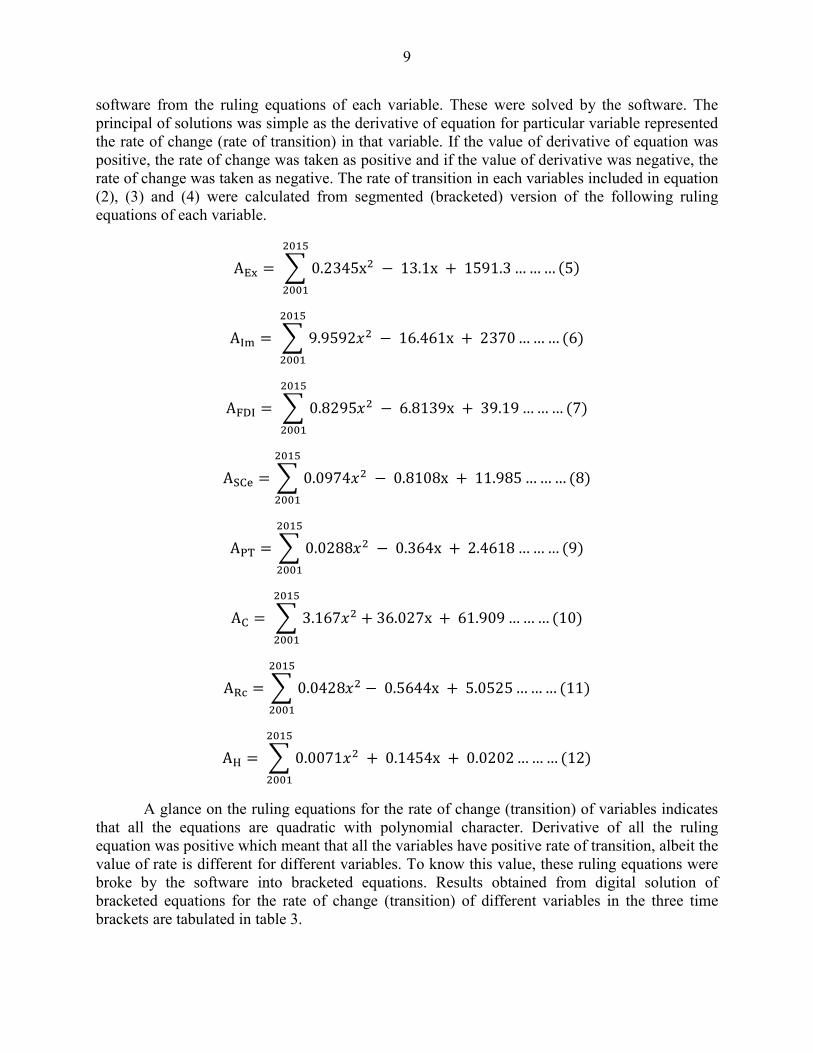
software from the ruling equations of each variable. These were solved by the software. The principal of solutions was simple as the derivative of equation for particular variable represented the rate of change (rate of transition) in that variable. If the value of derivative of equation was positive, the rate of change was taken as positive and if the value of derivative was negative, the rate of change was taken as negative. The rate of transition in each variables included in equation (2), (3) and (4) were calculated from segmented (bracketed) version of the following ruling equations of each variable.
A�� = � 0.2345x� − 13.1x + 1591.3
����
����
………(5)
A�� = � 9.9592�� − 16.461x + 2370
����
����
………(6)
A��� = � 0.8295�� − 6.8139x + 39.19
����
����
………(7)
A��� = � 0.0974�� − 0.8108x + 11.985
����
����
………(8)
A�� = � 0.0288�� − 0.364x + 2.4618
����
����
………(9)
A� = � 3.167�� + 36.027x + 61.909
����
����
………(10)
A�� = � 0.0428�� − 0.5644x + 5.0525
����
����
………(11)
A� = � 0.0071�� + 0.1454x + 0.0202
����
����
………(12)
A glance on the ruling equations for the rate of change (transition) of variables indicates that all the equations are quadratic with polynomial character. Derivative of all the ruling equation was positive which meant that all the variables have positive rate of transition, albeit the value of rate is different for different variables. To know this value, these ruling equations were broke by the software into bracketed equations. Results obtained from digital solution of bracketed equations for the rate of change (transition) of different variables in the three time brackets are tabulated in table 3.
10
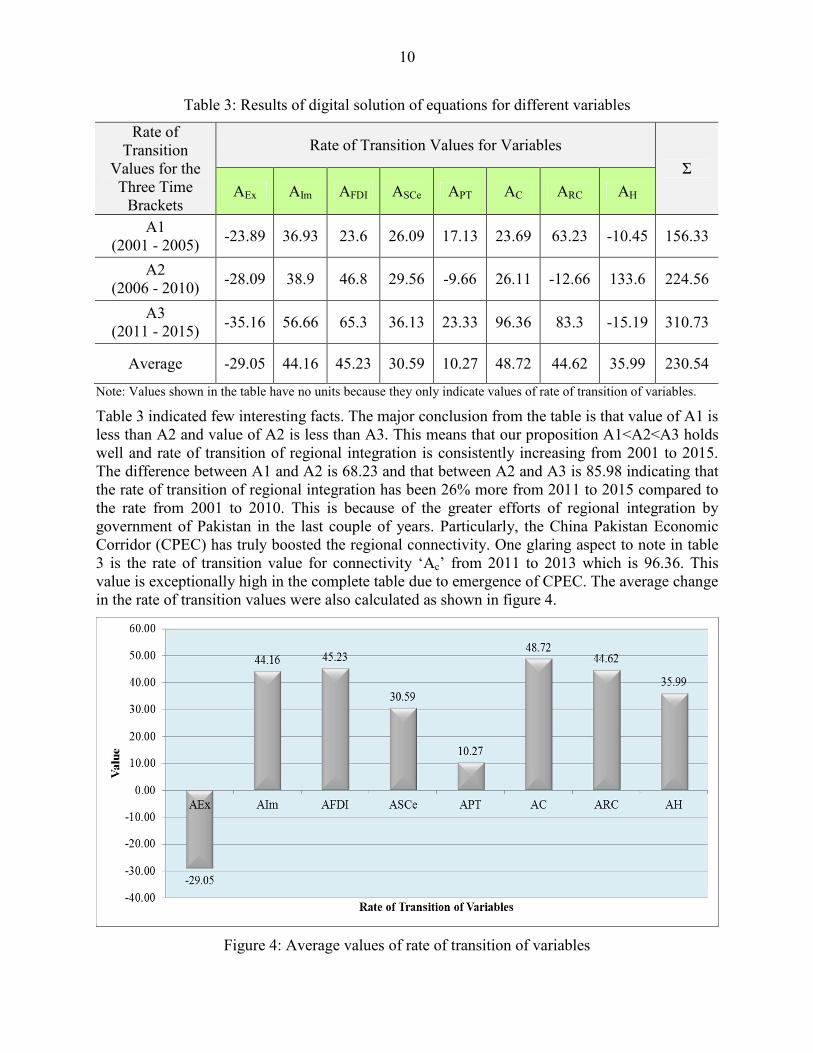
Table 3: Results of digital solution of equations for different variables
Rate of Transition
Values for the Three Time
Brackets
Rate of Transition Values for Variables
Ʃ
AEx AIm AFDI ASCe APT AC ARC AH
A1 (2001 - 2005)
-23.89 36.93 23.6 26.09 17.13 23.69 63.23 -10.45 156.33
A2 (2006 - 2010)
-28.09 38.9 46.8 29.56 -9.66 26.11 -12.66 133.6 224.56
A3 (2011 - 2015)
-35.16 56.66 65.3 36.13 23.33 96.36 83.3 -15.19 310.73
Average -29.05 44.16 45.23 30.59 10.27 48.72 44.62 35.99 230.54
Note: Values shown in the table have no units because they only indicate values of rate of transition of variables.
Table 3 indicated few interesting facts. The major conclusion from the table is that value of A1 is less than A2 and value of A2 is less than A3. This means that our proposition A1<A2<A3 holds well and rate of transition of regional integration is consistently increasing from 2001 to 2015. The difference between A1 and A2 is 68.23 and that between A2 and A3 is 85.98 indicating that the rate of transition of regional integration has been 26% more from 2011 to 2015 compared to the rate from 2001 to 2010. This is because of the greater efforts of regional integration by government of Pakistan in the last couple of years. Particularly, the China Pakistan Economic Corridor (CPEC) has truly boosted the regional connectivity. One glaring aspect to note in table 3 is the rate of transition value for connectivity ‘Ac’ from 2011 to 2013 which is 96.36. This value is exceptionally high in the complete table due to emergence of CPEC. The average change in the rate of transition values were also calculated as shown in figure 4.
Figure 4: Average values of rate of transition of variables
11
Some glaring inferences can be drawn from figure 4. For example the rate of transition value of exports is consistently decreasing by a number 29.05 on the average per year from 2001 to 2015. This number has no unit as it is only the measure of rate of transition and not the exports itself. This decrease in the rate of transition value for exports is a worrisome factor. Government has to look into it and volume of exports per year needs to be increased. The highest average value of rate of transition is for connectivity (48.72). This is due to significant impact of CPEC. Similarly, FDI and regional conferences ‘RC’ have higher average values of rate of transition per year which is a good sign as this will increase economic development and regional integration. However, the higher average value of rate of transition for imports ‘AIm’ is again worrisome. This needs to be reduced and preferably should be less than the exports. Presently average value of rate of transition of exports per year is negative and average value of rate of transition for imports per year is highly positive. This is not an ideal situation and requires major policy shift. The overall average value of rate of transition of regional integration contributed by all variables for the last fifteen years is 230.54 which is more than the rate of transition value from 2001 to 2010 and less than the rate of transition value from 2011 to 2015. This validates that rate of transition of regional integration has been more from 2011 to 2015.
5. Weibull Probability Distribution Model (WPDM)
Weibull probability distribution model (WPDM) is parametric model that is used for rate of transition from one qualitative state to another. We cannot use exponential probability model to assess the rate of transition of regional integration because it assumes a constant transition rate independent of time but rate of transition of regional integration ‘TRt’ is not constant over time. Therefore, we need to evaluate duration dependence and Weibull probability distribution model considers duration dependence. Transition from low to higher regional integration was taken as an event in the model. Rate of transition was estimated by model as continuous time analysis since transition was observed along a time continuum from 2001 to 2015.
Now suppose rate of regional integration of Pakistan is studied through time ‘T’ (measured in years). If we treat ‘T’ as continuous variable, then accumulative probability distribution function ‘C’ of ‘T’ can be given as shown in equation (2).
C� = p(T ≤ t)………(2)
Equation (2) gives the probability that transition from low to higher regional integration has occurred by time ‘t’. We can obtain the density function of ‘Ct’ by differentiating it as shown in equation (3).
C�� =
d{C�}
dt……… (3)
The probability that Pakistan will co-exist with high regional integration beyond time ‘t’ is given by consistency function ‘Qt’ which is given by equation (4).
Q� = 1 − C� = P(T > t)………(4)
The probability that Pakistan has transited from low to higher regional integration by time ‘t’ is given by transition rate function ‘TRt’ which is given by equation (5).
TR� =C��
Q�………(5)
12
Equation (5) shows the transition rate function is the ratio of density function and consistency function. Simply, it gives the probability that Pakistan has transited from low to higher regional integration at ‘t’ and will co-exist with high integration level past time ‘t’.
As we have already described that a probability distribution that considers time dependence is Weibull probability distribution. From this model, density function of regional integration is given by equation (6)
Densityfunctionofregionalintegration, C�� = μβt���e�(��)
�………(6)
Where µ > 0 and β > 0. If β > 1, the transition rate increases monotonically and if β < 1, the transition rate decreases monotonically. If β = 1, we obtain Ctʹ = µ i-e, no time dependence.
Suppose we say that this high rate of transition of regional integration will survive past ‘t’, then the consistency function is given by equation (7).
Consistencyfunctionofregionalintegration, Q� = e�(��)� ………(7)
We know that transition rate function is the ratio of density function and consistency function. Therefore, putting values in equation (5) we get the value of rate of transition of regional integration as shown by equation (8) and (9).
RateofTransition, TR� = μβt���e�(��)
�
e�(��)�
………(8)
RateofTransition, TR� = μβt��� ………(9)
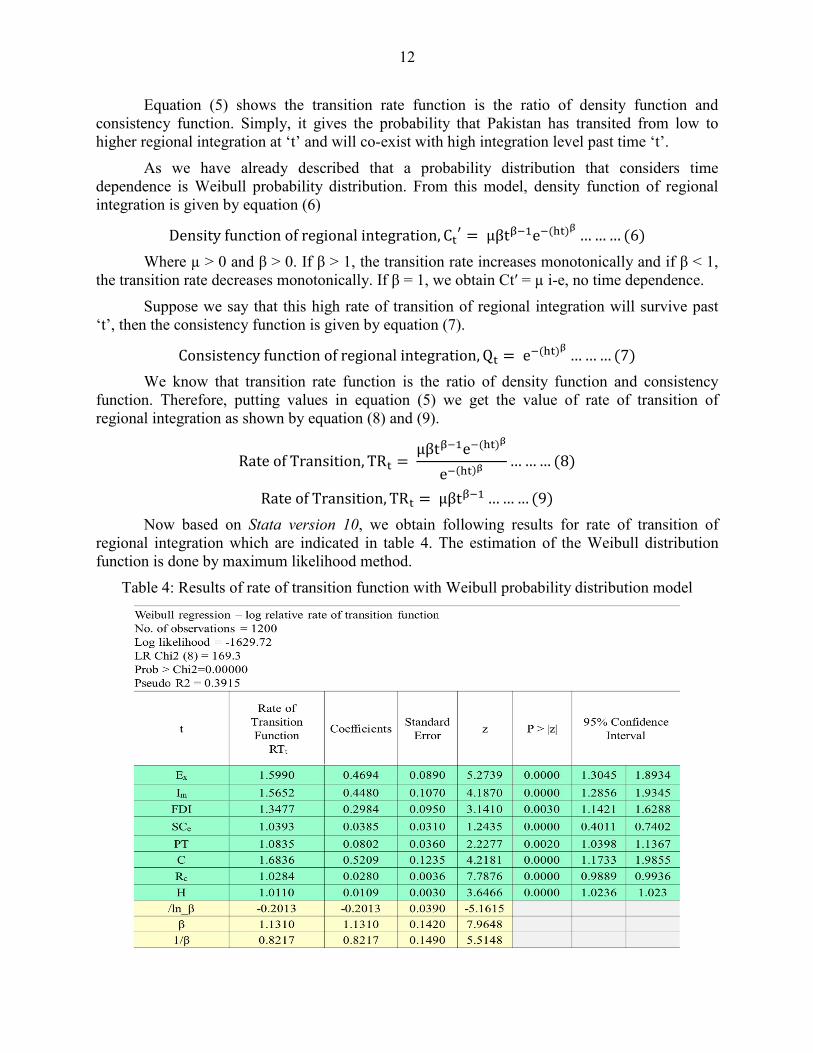
Now based on Stata version 10, we obtain following results for rate of transition of regional integration which are indicated in table 4. The estimation of the Weibull distribution function is done by maximum likelihood method.
Table 4: Results of rate of transition function with Weibull probability distribution model
13
6. Analysis of Results
Arithmetic shown in column 2 of table 2 were actually ratios of rate of transition which were exponential of regression coefficients in the fitted model as shown in column 3 of the same table. Simply, if we took the natural log of values in column 2, we got the values of coefficients in column 3. The ratio of rate of transition resembled the “odds ratio” in classical sense as it represented the ratio of high transition rate to low transition rate. These ratios are indicated in the table 2 for each covariate alongwith their coefficients, standard error and the Z values or the Wald Statistics. Z value was ratio of the estimated coefficient divided by its standard error. The statistical significance of coefficients of variables was measured by calculation of Z values which had an asymptotic standard distribution and was used to test the null hypothesis that the true rate of transition was zero or the combined effect of all the parameters on rate of transition was zero. In our results, Z statistic values for each covariate showed that these were individually statistically highly significant with their ‘p’ values being practically zero.
The likelihood ratio (LR) statistic followed the chi square distribution with degree of freedom equals to the number of covariates (in our case eight). In our results the values of this statistic was 169.3 which was highly significant, suggesting that the overall fit of model is quite good. Moreover, the significant LR ratio also refuted the null hypothesis that effect of all the parameters on rate of transition is simultaneously zero.
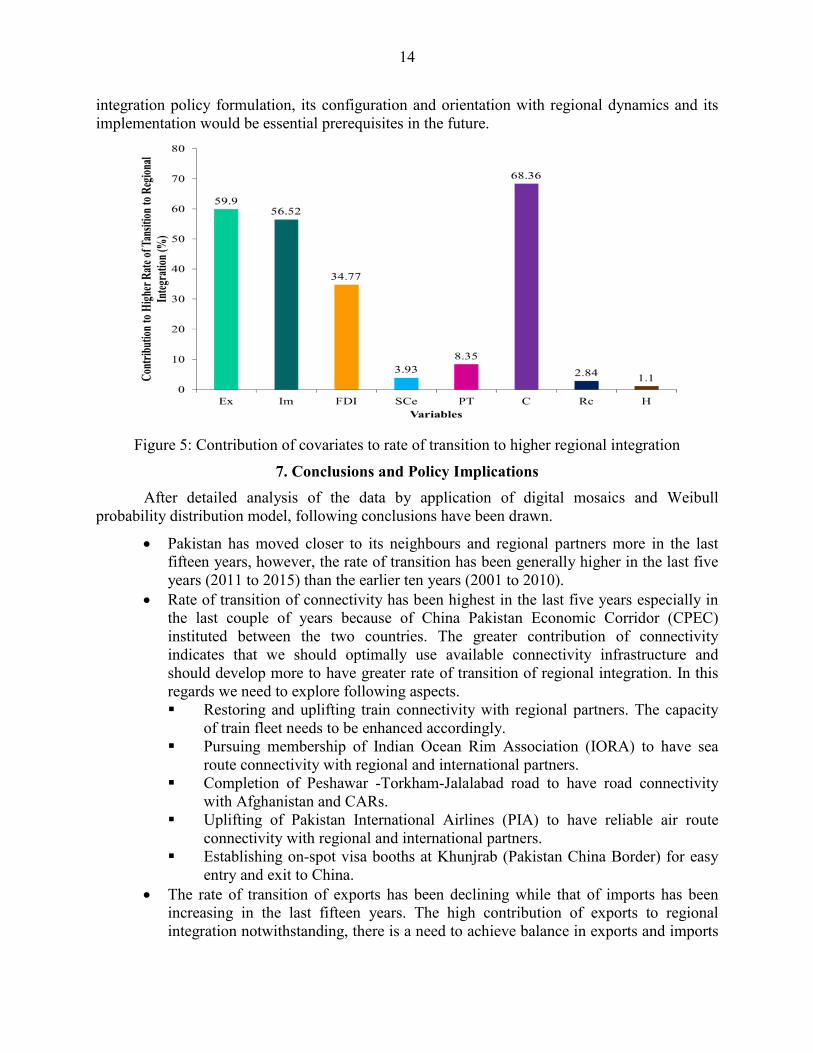
A rate of transition ratio of a covariate greater than 1 indicated increased rate of transition, holding values of other covariates constant. In our results, all the covariates had rate of transition ratio greater than 1 thus indicating that all the covariates have contributed and are still contributing to rate of transition of regional integration. For example, connectivity through land, air or sea routes had the highest rate of transition ratio of 1.68 which means that this parameter has played key role in regional integration and in the future an increase in route of connectivity by 1 increases the rate of transition by 68%. This indicated the importance of connectivity through various routes for increasing the regional connectivity. This also validated the possibility that Pakistan will move further closer to its regional partners after construction of China Pakistan Economic Corridor (CPEC). Similarly, transition rate ratio of 1.59 and 1.56 indicated that exports and imports (in other words trade volume) have also played greater role in increasing rate of transition by 59% and 56% respectively. Although rate of transition of exports have been declining even then its contribution in regional integration is more than imports. The contribution of selected eight covariates is shown in figure 5. The greater contribution of connectivity indicates that we should optimally use available connectivity infrastructure and should develop more to have greater rate of transition of regional integration.
A rate of transition ratio of less than 1 indicated decreased rate of transition due to that particular variable, ceteris paribus. In our results, none of the variable had rate of transition ratio of less than 1. A rate of transition ratio of 1 or closer to 1 indicated no association between the particular covariate and rate of transition, keeping values of other variables constant. Our results indicated that parameters such as socio-cultural exchanges (SCe), regional conferences (Rc) and help in emergencies (H) had marginal effect on the rate of transition.
The value of coefficient, β (1.13) is also statistically significant. Its value is greater than 1 which indicates that the rate of transition of regional integration is increasing over time (positive time dependence) by about 13% per year, provided these eight selected covariates contribute to rate of transition as shown in table 2. To achieve this rate of transition, a timely regional
14
integration policy formulation, its configuration and orientation with regional dynamics and its implementation would be essential prerequisites in the future.
Figure 5: Contribution of covariates to rate of transition to higher regional integration
7. Conclusions and Policy Implications
After detailed analysis of the data by application of digital mosaics and Weibull probability distribution model, following conclusions have been drawn.
Pakistan has moved closer to its neighbours and regional partners more in the last fifteen years, however, the rate of transition has been generally higher in the last five years (2011 to 2015) than the earlier ten years (2001 to 2010).
Rate of transition of connectivity has been highest in the last five years especially in the last couple of years because of China Pakistan Economic Corridor (CPEC) instituted between the two countries. The greater contribution of connectivity indicates that we should optimally use available connectivity infrastructure and should develop more to have greater rate of transition of regional integration. In this regards we need to explore following aspects. Restoring and uplifting train connectivity with regional partners. The capacity
of train fleet needs to be enhanced accordingly. Pursuing membership of Indian Ocean Rim Association (IORA) to have sea
route connectivity with regional and international partners. Completion of Peshawar -Torkham-Jalalabad road to have road connectivity
with Afghanistan and CARs. Uplifting of Pakistan International Airlines (PIA) to have reliable air route
connectivity with regional and international partners. Establishing on-spot visa booths at Khunjrab (Pakistan China Border) for easy
entry and exit to China. The rate of transition of exports has been declining while that of imports has been
increasing in the last fifteen years. The high contribution of exports to regional integration notwithstanding, there is a need to achieve balance in exports and imports
15
by re-orientation and re-configuration of trade policy. Regional markets are required to be explored and reached meaningfully; especially markets of CARs have sufficient space for trade by Pakistan.
FDI has significant contribution in regional integration. While FDI from China has increased in the last five years, there is a need to attract FDI from the other regional partners especially from Saudi Arabia and UAE.
Socio-cultural exchanges, pacts and treaties, regional conferences and help extended in case of emergencies and disasters contribute to higher rate of transition of regional integration.
Values of rate of transition have been calculated quantitatively by equations obtained from digital mosaics as well as qualitatively by Weibull Probability Distribution Model. Results from both methods generally complement and validate each other.
Regional integration is imperative for resolution of disputes between partners and for forestalling exploitation and discrimination by developed and influential nations.
Many regional trade blocs are stagnant due to inadequate infrastructural capacity of smaller economies and in the same context CPEC is truly a step towards strong regional integration and consequent high development of Pakistan due to higher regional connectivity. There seems many opposite factors working against CPEC but we should not forget that these elements lend credence to the phenomenon which see the world divided into two parts i.e. one of “peace, wealth and democracy” and the other of “turmoil, war and devastation”. Against all the odds, we must complete CPEC for greater prosperity of our homeland and the region at large.
16
References
Abdin, J. (2009). Need for Economic Integration of South Asia. SSRN Electronic Journal. doi:10.2139/ssrn.1399987
Anthony, V. (1995). Globalization and the Inequality of Nations. Quarterly Journal of Economics, 110 (4), 857–80.
Basile, R. (2009). Productivity Polarization across Regions in Europe: The Role of Nonlinearities and Spatial Dependence. International Regional Science Review, 32(1), 92-115. doi:10.1177/0160017608326944.
Banerjee, P. (2009). Sub-regional Co-operation in Eastern India and Bangladesh: Prospects, Problems and Policies. Review of Market Integration, 1(1), 11-35. doi:10.1177/097492920900100102.
Bernard, A. (1996). Interpreting tests of the convergence hypothesis. Journal of Econometrics, 71(1-2), 161-173. doi:10.1016/0304-4076(94)01699-2.
Bianchi, M. (1997). Testing for convergence: evidence from non‐parametric multimodality tests. Journal of Applied Economics, 12(4), 393-409. doi:10.1002/(sici)1099-1255(199707)12:4.
Borensztein, E. (1998). How does foreign direct investment affect economic growth? Journal of International Economics, 45(1), 115-135. doi:10.1016/s0022-1996(97)00033-0.
Bulli, S. (2001). Distribution Dynamics and Cross-Country Convergence: A New Approach. Scottish J Political Economy, 48(2), 226-243. doi:10.1111/1467-9485.00196.
Costantini, M. (2005). Stochastic convergence among European economies. Economics Bulletin, 3(38), 1–17.
De, P. (2011). Why is trade at borders a costly affair in South Asia? An empirical investigation. Contemporary South Asia, 19(4), 441-464. doi:10.1080/09584935.2011.602666.
De, P. (2014). Developing Economic Corridors in South Asia. Mandaluyong City, Philippines: Asian Development Bank, 123-196
Easterly, W. (1993). Good policy or good luck? Country growth performance and temporary shocks. Journal of Monetary Economics, 32 (3), 459–483.
Edwards, S. (1989). Openness, Outward Orientation, Trade Liberalization and Economic Performance in Developing Countries. Journal of Economic Literature, 31(3), 1358–1393. doi:10.3386/w2908.
Fan, C. (2009). Industrial Agglomeration and Development: A Survey of Spatial Economic Issues in East Asia and a Statistical Analysis of Chinese Regions. Economic Geography, 79(3), 295-319. doi:10.1111/j.1944-8287.2003.tb00213.x.
Fujita, M. (2000). The Spatial Economy: Cities, Regions, and International Trade. Southern Economic Journal, 67(2), 491-493. doi:10.2307/1061487.
Gul, E. (2010). Case Study of Liberian Economic Growth: Pertinent Lessons for Developing Countries. MPRA Paper No. 48462, 1-9.
17
Gustavsson, R. (2004). Potential Growth and Welfare Effects of Regional Integration. Working Paper Department of Economics, Lund University, S-220 07 LUND, 1-17.
Hanson, G. (1996). U.S.-Mexico Integration and Regional Economies: Evidence from Border- City Pairs, 236-239. doi:10.3386/w5425.
Hanson, G. H. (1997). Increasing Returns, Trade and The Regional Structure of Wages. Economic Journal, 107(440), 113-133. doi:10.1111/1468-0297.00145.
Hassan, M. (2001). Is SAARC a viable economic block? Evidence from gravity model. Journal of Asian Economics, 12(2), 263-290. doi:10.1016/s1049-0078(01)00086-0.
Henrekson, M. (1997). Growth effects of European integration. European Economic Review, 41(8), 1537-1557. doi:10.1016/s0014-2921(97)00063-9.
Honohan, P. (2000). Miniblocs and Fringe Currencies of the EMU. Journal of Economic Integration, 15(1), 47-75. doi:10.11130/jei.2000.15.1.47.
Ishid, M. (2009). Special economic zones and economic corridors. Discussion Paper Series. Jakarta: Economic Research Institute for ASEAN and East Asia, 67-76.
Islam, N. (2003). What have we learnt from the convergence debate? Journal of Economic Survey, 17(3), 309–362.
Krugman, P. (1990). Increasing Returns and Economic Geography. Journal of Political Economy, 99 (1), 483-499. doi:10.3386/w3275.
Limao, N. (2001). Infrastructure, Geographical Disadvantage, Transport Costs, and Trade. The World Bank Economic Review, 15(3), 451-479. doi:10.1093/wber/15.3.451.
Masahiro, K. (2007). Infrastructure and regional cooperation. ADBI Discussion Paper No. 76. Asian Development Bank Institute, Tokyo, 76-96.
Melo, J. (1992). Regional Integration Old and New: Issues and Evidence, Stencil, World Bank, Washington D.C., 123-166.
Olivier P. (2011). Trade and convergence of per capita income in the Indian Ocean Zone, 1950–2008. Annals Regional Science, 16(3), 69-113. doi:10.1007/s00168-011-0462-4.
Osvaldo, S. (2000). The New Regionalism and Future of the Security and Development, New York, 233-269. doi:10.1007/978-1-137-11498-3.
Paelinck, J. (1981). Supply effects in regional economic models. Canadian Journal of Regional Science, 4 (2), 145–67.
Quah, D. T. (1996). Regional convergence clusters across Europe. European Economic Review, 40(3-5), 951-958. doi:10.1016/0014-2921(95)00105-0.
Rivera, L. (1990). Economic Integration and Endogenous Growth. Quarterly Journal of Economics, 56(2), 531–555. doi:10.3386/w3528.
Romer, P. M. (1986). Increasing Returns and Long-Run Growth. Journal of Political Economy, 94(5), 1002-1037. doi:10.1086/261420.
Sengupta, N. (1997). Regional trade and investment: Case of SAARC. Economic and Political Weekly, 32 (4), 2930–31.
18
Thisse, J. (2000). An Economic Theory of Regional Clusters. Journal of Urban Economics, 48(1), 158-184. doi:10.1006/juec.1999.2161.
Venables, A. J. (2003). Winners and losers from regional integration agreements. Economic Journal, 113(490), 747-761. doi:10.1111/1468-0297.t01-1-00155.
Wagner, N. (1983). Regional economic integration between developing countries. Intereconomics, 18(6), 270-277. doi:10.1007/bf02928230.
Winters, L. A. (2004). Trade Liberalization and Poverty: The Evidence So Far. Journal of Economic Literature, 42(1), 72-115. doi:10.1257/002205104773558056.
Zon A. V. (2009). Endogenous Economic Growth through Connectivity. UNU-MERIT Working Papers Series, ISSN 1871-9872, Maastricht Economic and Social Research and Training Centre on Innovation and Technology, 6-26.


![Slater - Geopolitical Imagination[1]](https://img.pdfslide.us/doc/110x75/55cf98f9550346d0339ac99a/slater-geopolitical-imagination1.jpg)