Embed Size (px)
Citation preview
1196 | Integr. Biol., 2015, 7, 1196--1211 This journal is©The Royal Society of Chemistry 2015
Cite this: Integr. Biol., 2015,7, 1196
Traction stress analysis and modeling reveal thatamoeboid migration in confined spaces isaccompanied by expansive forces and requires thestructural integrity of the membrane–cortexinteractions†
Ai Kia Yip,a Keng-Hwee Chiam*ab and Paul Matsudaira*bc
Leukocytes and tumor cells migrate via rapid shape changes in an amoeboid-like manner, distinct from
mesenchymal cells such as fibroblasts. However, the mechanisms of how rapid shape changes are
caused and how they lead to migration in the amoeboid mode are still unclear. In this study, we
confined differentiated human promyelocytic leukemia cells between opposing surfaces of two pieces
of polyacrylamide gels and characterized the mechanics of fibronectin-dependent mesenchymal versus
fibronectin-independent amoeboid migration. On fibronectin-coated gels, the cells form lamellipodia
and migrate mesenchymally. Whereas in the absence of cell–substrate adhesions through fibronectin,
the same cells migrate by producing blebs and ‘‘chimneying’’ between the gel sheets. To identify the
orientation and to quantify the magnitude of the traction forces, we found by traction force microscopy
that expanding blebs push into the gels and generate anchoring stresses whose magnitude increases
with decreasing gap size while the resulting migration speed is highest at an intermediate gap size. To
understand why there exists such an optimal gap size for migration, we developed a computational
model and showed that the chimneying speed depends on both the magnitude of intracellular pressure
as well as the distribution of blebs around the cell periphery. The model also predicts that the optimal
gap size increases with weakening cell membrane to actin cortex adhesion strength. We verified this
prediction experimentally, by weakening the membrane–cortex adhesion strength using the ezrin inhibitor,
baicalein. Thus, the chimneying mode of amoeboid migration requires a balance between intracellular pressure
and membrane–cortex adhesion strength.
Insight, innovation, integrationA leukocyte can translocate across a surface by either a mesenchymal or amoeboid mechanism. While integrin-dependent mesenchymal migration is wellunderstood, little is known about the nature of the traction forces required for amoeboid migration in the absence of cell–matrix adhesions. Here, we havecombined 3-dimensional traction force microscopy with a confinement assay, where neutrophil-like cells are confined between two pieces of polyacrylamidegels. In the absence of cell–matrix adhesions, confined cells migrate by ‘‘chimneying’’, that is, generate traction by applying forces against opposing surfaces.The chimneying speed was fastest at an intermediate spacing between the two gels. A computational model explains that the chimneying speed depends onboth the magnitude of the intracellular pressure and the location where blebs form as determined by the membrane–cortex adhesion strength.
Introduction
Cell migration is a crucial process during embryonic develop-ment,1–3 wound closure,4,5 and as part of the body’s immuneresponse.6,7 During cancer cell metastasis, cancer cells alsomigrate into and out of the lymphatic and blood vessels tocause secondary growth.8,9 The study of cell migration mechan-isms is therefore important in developing therapies to restore
a A*STAR Bioinformatics Institute, 30 Biopolis Street, #07-01 Matrix, Singapore
138671, Singapore. E-mail: [email protected]; Tel: +65 6478-8264b MechanoBiology Institute, National University of Singapore, Singaporec Department of Biological Sciences, NUS Centre for BioImaging Sciences, National
University of Singapore, 14 Science Drive 4, Singapore 117543, Singapore.
E-mail: [email protected]; Tel: +65 6516-2692
† Electronic supplementary information (ESI) available. See DOI: 10.1039/c4ib00245h
Received 24th October 2014,Accepted 20th May 2015
DOI: 10.1039/c4ib00245h
www.rsc.org/ibiology
Integrative Biology
PAPER
Publ
ishe
d on
27
May
201
5. D
ownl
oade
d by
Nan
yang
Tec
hnol
ogic
al U
nive
rsity
on
12/1
1/20
15 0
3:58
:39.
View Article OnlineView Journal | View Issue
This journal is©The Royal Society of Chemistry 2015 Integr. Biol., 2015, 7, 1196--1211 | 1197
normal functioning of the organisms, or to stop cancer cellsfrom spreading to secondary sites.
Studies of cell migration originated first from observationsof the unicellular protozoa, amoeba. The amoeba migrates via asterotypic manner by extending its pseudopodia forward andcoordinating cytoplasmic streaming.10–16 Recent studies havealso shown that cells from multicellular organisms, such asleukocytes, zebrafish primordial germ cells and selected tumorcells, also exhibit amoeboid-like movements.9,17–21 These cellsform round bleb-like protrusions and change their shapesrapidly, similar to the amoeba.9,17,21 The rapid shape changesallow the cells to squeeze through pre-existing gaps in thethree-dimensional (3D) matrix without having to degrade theextracellular matrix (ECM)9,18 or adhere to the ECM.19,22
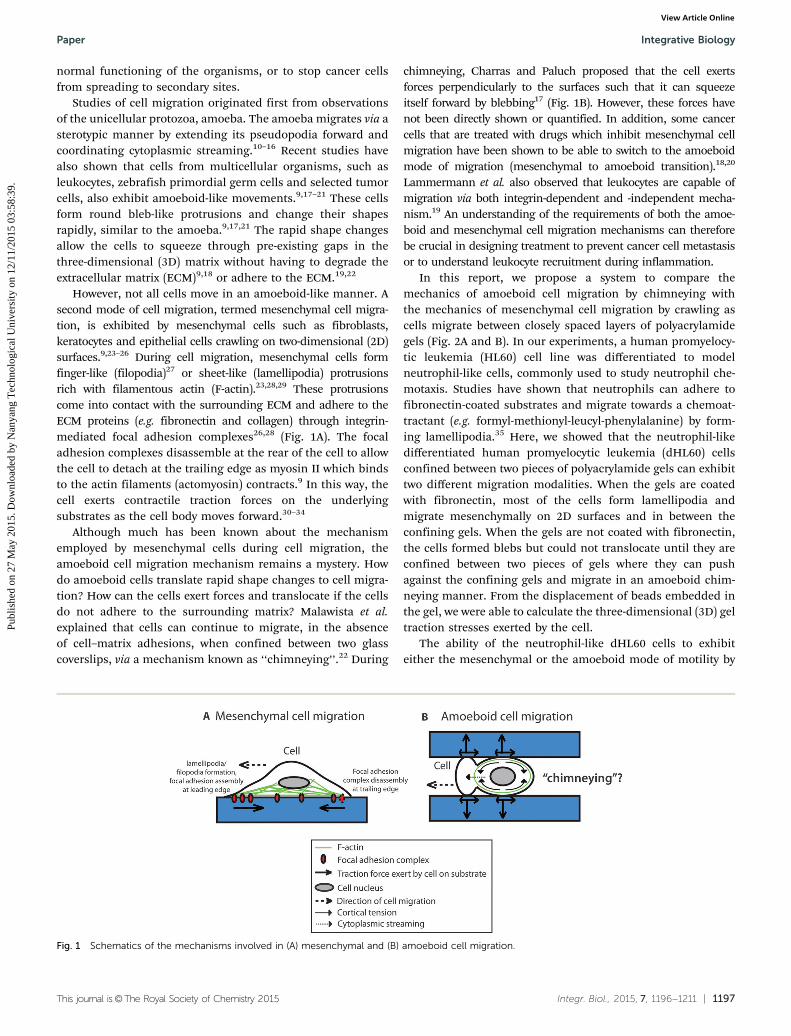
However, not all cells move in an amoeboid-like manner. Asecond mode of cell migration, termed mesenchymal cell migra-tion, is exhibited by mesenchymal cells such as fibroblasts,keratocytes and epithelial cells crawling on two-dimensional (2D)surfaces.9,23–26 During cell migration, mesenchymal cells formfinger-like (filopodia)27 or sheet-like (lamellipodia) protrusionsrich with filamentous actin (F-actin).23,28,29 These protrusionscome into contact with the surrounding ECM and adhere to theECM proteins (e.g. fibronectin and collagen) through integrin-mediated focal adhesion complexes26,28 (Fig. 1A). The focaladhesion complexes disassemble at the rear of the cell to allowthe cell to detach at the trailing edge as myosin II which bindsto the actin filaments (actomyosin) contracts.9 In this way, thecell exerts contractile traction forces on the underlyingsubstrates as the cell body moves forward.30–34
Although much has been known about the mechanismemployed by mesenchymal cells during cell migration, theamoeboid cell migration mechanism remains a mystery. Howdo amoeboid cells translate rapid shape changes to cell migra-tion? How can the cells exert forces and translocate if the cellsdo not adhere to the surrounding matrix? Malawista et al.explained that cells can continue to migrate, in the absenceof cell–matrix adhesions, when confined between two glasscoverslips, via a mechanism known as ‘‘chimneying’’.22 During
chimneying, Charras and Paluch proposed that the cell exertsforces perpendicularly to the surfaces such that it can squeezeitself forward by blebbing17 (Fig. 1B). However, these forces havenot been directly shown or quantified. In addition, some cancercells that are treated with drugs which inhibit mesenchymal cellmigration have been shown to be able to switch to the amoeboidmode of migration (mesenchymal to amoeboid transition).18,20
Lammermann et al. also observed that leukocytes are capable ofmigration via both integrin-dependent and -independent mecha-nism.19 An understanding of the requirements of both the amoe-boid and mesenchymal cell migration mechanisms can thereforebe crucial in designing treatment to prevent cancer cell metastasisor to understand leukocyte recruitment during inflammation.
In this report, we propose a system to compare themechanics of amoeboid cell migration by chimneying withthe mechanics of mesenchymal cell migration by crawling ascells migrate between closely spaced layers of polyacrylamidegels (Fig. 2A and B). In our experiments, a human promyelocy-tic leukemia (HL60) cell line was differentiated to modelneutrophil-like cells, commonly used to study neutrophil che-motaxis. Studies have shown that neutrophils can adhere tofibronectin-coated substrates and migrate towards a chemoat-tractant (e.g. formyl-methionyl-leucyl-phenylalanine) by form-ing lamellipodia.35 Here, we showed that the neutrophil-likedifferentiated human promyelocytic leukemia (dHL60) cellsconfined between two pieces of polyacrylamide gels can exhibittwo different migration modalities. When the gels are coatedwith fibronectin, most of the cells form lamellipodia andmigrate mesenchymally on 2D surfaces and in between theconfining gels. When the gels are not coated with fibronectin,the cells formed blebs but could not translocate until they areconfined between two pieces of gels where they can pushagainst the confining gels and migrate in an amoeboid chim-neying manner. From the displacement of beads embedded inthe gel, we were able to calculate the three-dimensional (3D) geltraction stresses exerted by the cell.
The ability of the neutrophil-like dHL60 cells to exhibiteither the mesenchymal or the amoeboid mode of motility by
Fig. 1 Schematics of the mechanisms involved in (A) mesenchymal and (B) amoeboid cell migration.
Paper Integrative Biology
Publ
ishe
d on
27
May
201
5. D
ownl
oade
d by
Nan
yang
Tec
hnol
ogic
al U
nive
rsity
on
12/1
1/20
15 0
3:58
:39.
View Article Online
1198 | Integr. Biol., 2015, 7, 1196--1211 This journal is©The Royal Society of Chemistry 2015
simply changing the ECM adhesivity allowed us to explore howcells migrating in the two modes of migration respond differ-ently to mechanical changes of the ECM. By varying the gelrigidity and spacing of the gap between the gels, our resultsshowed that the amoeboid chimneying speed is biphasic withrespect to gap distance but independent of gel rigidity. We havealso developed a computational model to explain the
relationship between the gel gap spacing and the symmetryof blebbing. Our model explains how the balance between twoforces, intracellular pressure and membrane–cortex adhesionstrength, determines the speed of migration. To test the model,we perturbed the membrane–cortex with the ezrin inhibitor,baicalein, and observed the predicted shift by the biphasiccurve to an increased gap size. Although our experimental
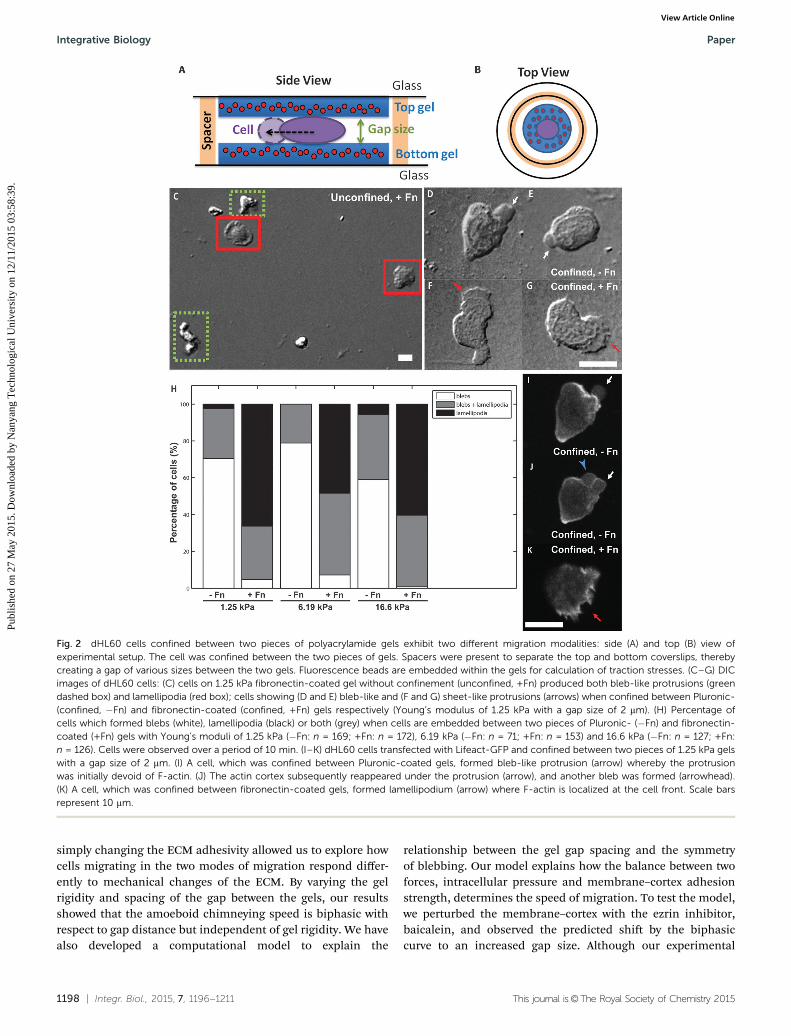
Fig. 2 dHL60 cells confined between two pieces of polyacrylamide gels exhibit two different migration modalities: side (A) and top (B) view ofexperimental setup. The cell was confined between the two pieces of gels. Spacers were present to separate the top and bottom coverslips, therebycreating a gap of various sizes between the two gels. Fluorescence beads are embedded within the gels for calculation of traction stresses. (C–G) DICimages of dHL60 cells: (C) cells on 1.25 kPa fibronectin-coated gel without confinement (unconfined, +Fn) produced both bleb-like protrusions (greendashed box) and lamellipodia (red box); cells showing (D and E) bleb-like and (F and G) sheet-like protrusions (arrows) when confined between Pluronic-(confined, �Fn) and fibronectin-coated (confined, +Fn) gels respectively (Young’s modulus of 1.25 kPa with a gap size of 2 mm). (H) Percentage ofcells which formed blebs (white), lamellipodia (black) or both (grey) when cells are embedded between two pieces of Pluronic- (�Fn) and fibronectin-coated (+Fn) gels with Young’s moduli of 1.25 kPa (�Fn: n = 169; +Fn: n = 172), 6.19 kPa (�Fn: n = 71; +Fn: n = 153) and 16.6 kPa (�Fn: n = 127; +Fn:n = 126). Cells were observed over a period of 10 min. (I–K) dHL60 cells transfected with Lifeact-GFP and confined between two pieces of 1.25 kPa gelswith a gap size of 2 mm. (I) A cell, which was confined between Pluronic-coated gels, formed bleb-like protrusion (arrow) whereby the protrusionwas initially devoid of F-actin. (J) The actin cortex subsequently reappeared under the protrusion (arrow), and another bleb was formed (arrowhead).(K) A cell, which was confined between fibronectin-coated gels, formed lamellipodium (arrow) where F-actin is localized at the cell front. Scale barsrepresent 10 mm.
Integrative Biology Paper
Publ
ishe
d on
27
May
201
5. D
ownl
oade
d by
Nan
yang
Tec
hnol
ogic
al U
nive
rsity
on
12/1
1/20
15 0
3:58
:39.
View Article Online
This journal is©The Royal Society of Chemistry 2015 Integr. Biol., 2015, 7, 1196--1211 | 1199
results were obtained based on a neutrophil-like cell line, themodel mechanisms proposed could provide generic insightsregarding amoeboid cell migration in confined environments.
ResultsConfined vs. unconfined cell migration on polyacrylamidesubstrates
To characterize cell migration between closely spaced sub-strates, we first examined unconfined cell migration on a 2Dsheet of polyacrylamide gel. When the gels were coated with ahydrophilic, non-ionic surfactant, 0.1% Pluronic F127 (Pluronic-coated gel), the dHL60 cells were unable to adhere to thesurfaces. The non-adherent cells in suspension changed shapewith rapid blebbing but there was no translocation of the cell. Incontrast, when cells were seeded on a single piece of fibronectin-coated (100 mg ml�1) gel (unconfined conditions), the dHL60cells adhered to the gel surface and exhibited mesenchymal-typemigration with the lamellipodia-like protrusions at their leadingedge (Fig. 2C, solid boxes). We also observed some non-adherentcells in suspension and they also formed bleb-like protrusions(Fig. 2C, dashed boxes).
The dHL60 cells can also be confined between two pieces ofgels when the distance between a top and bottom gel (gapspacing) is smaller than the cell diameter (2–8 mm, confinedconditions). We quantified the type of motility as a function ofsubstrate coating on polyacrylamide gels with Young’s moduliof 1.25 to 16.6 kPa. When the cells were confined between twopieces of Pluronic-coated gels (16.6 kPa), separated by a 2–8 mmgap, where the dHL60 cells were in contact with but notadherent to opposing Pluronic-coated gels, we found that59.1% of the cells migrated in an amoeboid-like manner byproducing bleb-like protrusions (Fig. 2D and E). 5.5% of the cellpopulation formed sheet-like protrusion resembling lamellipo-dia. The remaining 35.4% of cell population switched betweenbleb- and lamellipodia-type motility during imaging. On theother hand, lamellipodia-based mesenchymal migration wasfound to be the dominant mode (60.3%) of cell migration whencells are confined between fibronectin-coated gels (Fig. 2F andG). Cells which formed blebs, or switched between bleb- andlamellipodia-type motility during imaging, constituted only0.8% or 38.9% of the cell population respectively (Fig. 2H).Similar results were also observed on the softer gels (1.25 kPaand 6.19 kPa, Fig. 2H).
To confirm that the protrusions of cells confined betweenPluronic-coated gels were blebs and not lamellipodia or filopo-dia, we visualized the F-actin localization within the dHL60cells after transfection with Lifeact-GFP. When cells that wereconfined between Pluronic-coated gels formed the bleb-likeprotrusions, the blister-like protrusion was seen to be initiallydevoid of F-actin (Fig. 2I, arrow). Subsequently, F-actin reap-peared underneath the cell membrane (Fig. 2J, arrow, Movie S1,ESI†)21,36,37 before the formation of another new bleb (Fig. 2J,arrowhead). This is similar to previous reports that the cellmembrane initially separates from the actin cortex during bleb
formation and reforms under the cell membrane during blebretraction.17,21,36,38 Conversely, F-actin localization in cellsconfined between fibronectin-coated gels was seen to be alwaysenriched at the cell front where the sheet-like protrusionsformed (Fig. 2K, arrow, Movie S2, ESI†), in agreement withprevious observations of the lamellipodia.9,25,36,37
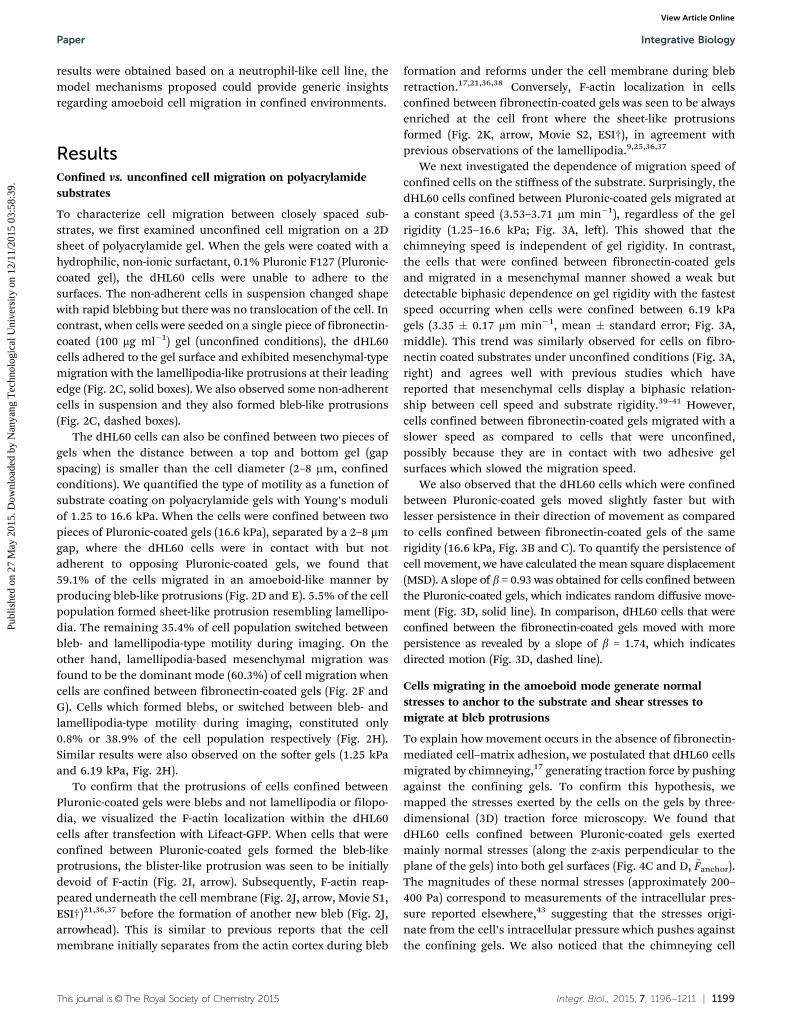
We next investigated the dependence of migration speed ofconfined cells on the stiffness of the substrate. Surprisingly, thedHL60 cells confined between Pluronic-coated gels migrated ata constant speed (3.53–3.71 mm min�1), regardless of the gelrigidity (1.25–16.6 kPa; Fig. 3A, left). This showed that thechimneying speed is independent of gel rigidity. In contrast,the cells that were confined between fibronectin-coated gelsand migrated in a mesenchymal manner showed a weak butdetectable biphasic dependence on gel rigidity with the fastestspeed occurring when cells were confined between 6.19 kPagels (3.35 � 0.17 mm min�1, mean � standard error; Fig. 3A,middle). This trend was similarly observed for cells on fibro-nectin coated substrates under unconfined conditions (Fig. 3A,right) and agrees well with previous studies which havereported that mesenchymal cells display a biphasic relation-ship between cell speed and substrate rigidity.39–41 However,cells confined between fibronectin-coated gels migrated with aslower speed as compared to cells that were unconfined,possibly because they are in contact with two adhesive gelsurfaces which slowed the migration speed.
We also observed that the dHL60 cells which were confinedbetween Pluronic-coated gels moved slightly faster but withlesser persistence in their direction of movement as comparedto cells confined between fibronectin-coated gels of the samerigidity (16.6 kPa, Fig. 3B and C). To quantify the persistence ofcell movement, we have calculated the mean square displacement(MSD). A slope of b = 0.93 was obtained for cells confined betweenthe Pluronic-coated gels, which indicates random diffusive move-ment (Fig. 3D, solid line). In comparison, dHL60 cells that wereconfined between the fibronectin-coated gels moved with morepersistence as revealed by a slope of b = 1.74, which indicatesdirected motion (Fig. 3D, dashed line).
Cells migrating in the amoeboid mode generate normalstresses to anchor to the substrate and shear stresses tomigrate at bleb protrusions
To explain how movement occurs in the absence of fibronectin-mediated cell–matrix adhesion, we postulated that dHL60 cellsmigrated by chimneying,17 generating traction force by pushingagainst the confining gels. To confirm this hypothesis, wemapped the stresses exerted by the cells on the gels by three-dimensional (3D) traction force microscopy. We found thatdHL60 cells confined between Pluronic-coated gels exertedmainly normal stresses (along the z-axis perpendicular to theplane of the gels) into both gel surfaces (Fig. 4C and D,
-
Fanchor).The magnitudes of these normal stresses (approximately 200–400 Pa) correspond to measurements of the intracellular pres-sure reported elsewhere,43 suggesting that the stresses origi-nate from the cell’s intracellular pressure which pushes againstthe confining gels. We also noticed that the chimneying cell
Paper Integrative Biology
Publ
ishe
d on
27
May
201
5. D
ownl
oade
d by
Nan
yang
Tec
hnol
ogic
al U
nive
rsity
on
12/1
1/20
15 0
3:58
:39.
View Article Online
1200 | Integr. Biol., 2015, 7, 1196--1211 This journal is©The Royal Society of Chemistry 2015
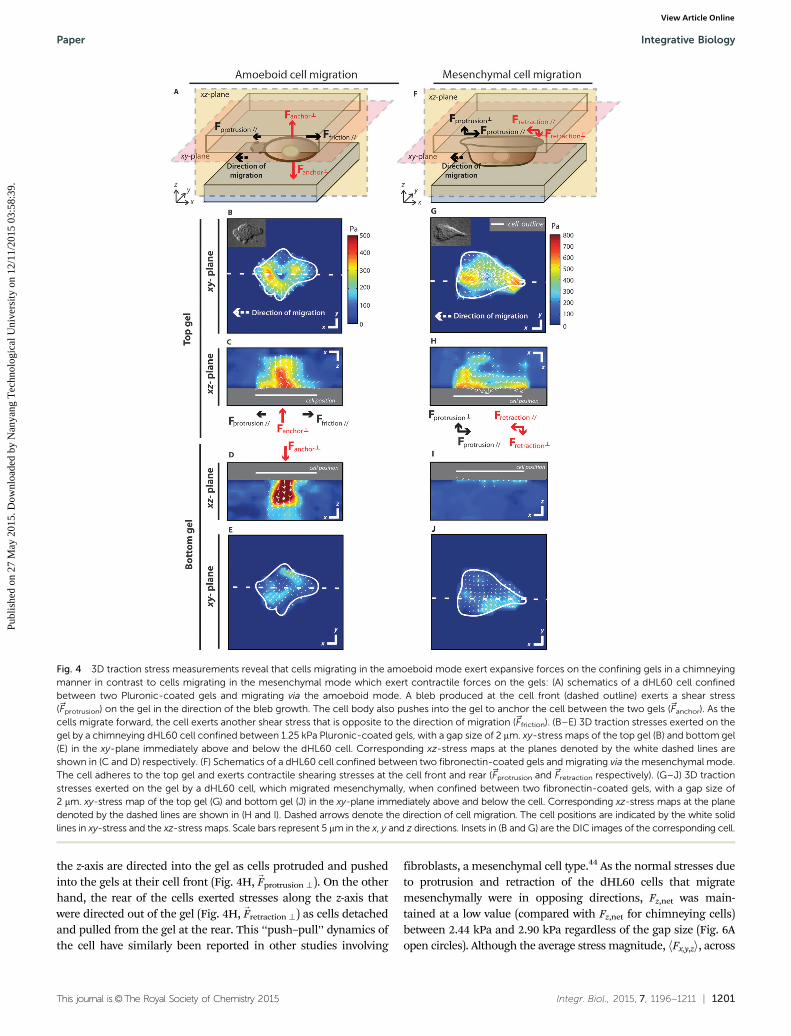
exerts expansive shear stresses along the xy-plane pointingaway from the cell body at both the front and the rear end ofthe cell (Fig. 4B). We postulate that these stresses arise due tothe bleb protrusion at the cell front (
-
Fprotrusion) and the frictionbetween the cell and the gel at the cell rear as actomyosincontraction drives the cell forward (
-
Ffriction). The combinationof the normal and shear stresses helped to anchor the cellsbetween the gels in the absence of cell–matrix adhesion, andcreate the friction necessary to allow the cell to migrate.
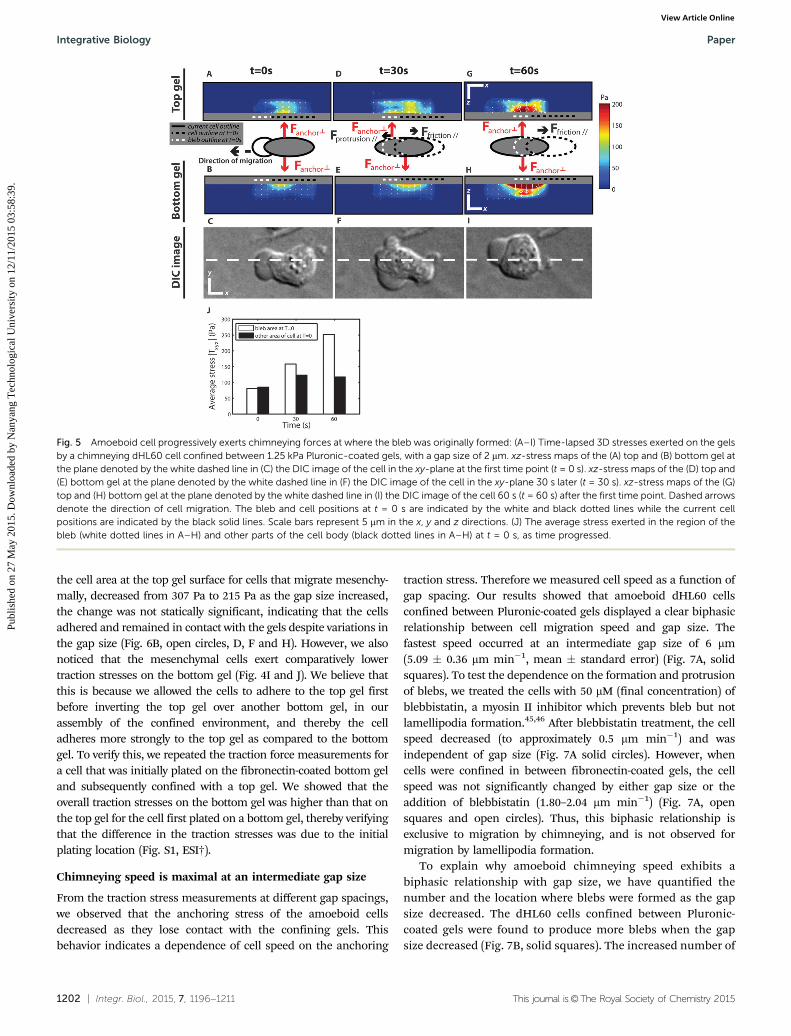
To fully characterize the chimneying behaviour of the amoe-boid cell, we performed a time-lapse traction force measure-ment during amoeboid cell migration. We observed that whena bleb is produced, very weak stresses are initially seen at thebleb region. Instead, the cell exerted anchoring stresses whichwere directed perpendicularly to the gels (Fig. 5A–C) at regionsaway from the bleb. However, as the cell cortex reformedunderneath the bleb during bleb retraction, the cell squeezeditself forward and gradually anchored at the region where thebleb used to be located. This was seen as new anchoringstresses at the region where the bleb was previously located(Fig. 5D–F). The anchoring stresses subsequently moved fullyinto the region at a later time frame (Fig. 5G–I). We also notethat shear stresses directed opposite to the direction of cellmigration appeared at the rear of the cells and this could bedue to friction which opposes motion as the cell push off thegel surface (Fig. 5D and G).
To verify our hypothesis that amoeboid cells chimney byprogressively exerting forces at the regions where the blebswere formed, we evaluated the average stress exerted, on thesurface of the top and bottom gel, at the region where the blebwas initially observed at t = 0 s (dotted line). We compared thisstress with the average stress exerted elsewhere in the cell bodyas time progressed (Fig. 5J). Indeed we found that as timeprogressed, the average stress in the region where the bleb wasinitially located increased as the cell migrates into the region,thereby resulting in a decrease in average stress at where otherparts of the cell body were originally located.
We also hypothesized that as the gap size between the topand bottom gels increased, the chimneying cell will lose contactwith the confining gels and the anchoring normal stresses willdecrease. Indeed, the magnitude of the net normal stresses overthe whole cell at the z-plane immediately next to the cell (Fz,net
as defined in the methods) was found to decrease significantlyfrom 9.28 kPa to 3.06 kPa as the gap size increased from 2 mmto 8 mm (Fig. 6A, solid circles, C, E, G). Similarly, with theincreasing gap size, we observed that the average stress magnitude,hFx,y,zi, across the cell area at the top gel surface, was decreasedfrom 302 Pa to 124 Pa (Fig. 6B, solid circles, C, E, and G). Theseresults indicate that the cell pushes on the confining gels with asmaller force as the gap size increased.
Unlike the expansive and outwardly divergent traction stres-ses exerted by the chimneying cells, traction stresses exertedduring mesenchymal migration were contractile and inwardlyconvergent in nature. These cells exerted large opposing shearingstresses on the top gels at the cell front and rear (Fig. 4G and H,-
Fprotrusion J and-
Fretraction J respectively). Additional stresses along
Fig. 3 Amoeboid cell migration is independent of gel rigidity and showslow persistence: (A) mean speed of migrating dHL60 cells versus gelrigidity on Pluronic- (�Fn) and fibronectin- (+Fn) coated gels. Cells areconfined between gels with gap sizes of 2–8 mm. Error bars representstandard error of the mean. *, **, and *** represents p o 0.05, p o 0.01,and p o 0.001 respectively. n.s. denotes non-significant (confined �Fn:n = 254, 64, and 328 for gel rigidity of 1.25, 6.19, and 16.6 kPa respectively;confined +Fn: n = 289, 98, and 157 for gel rigidity of 1.25, 6.19, and16.6 kPa respectively; unconfined +Fn, n = 41, 53, and 17 for gel rigidity of1.25, 6.19, and 16.6 kPa respectively). (B and C) Representative trajectoriesof 7 cells confined within (B) Pluronic-, and (C) fibronectin-coated gels,with a rigidity of 16.6 kPa and gap size of 2–8 mm. x- and y-axes are in unitsof mm. (D) Mean squared displacement (MSD) versus time interval, Dt,for cells confined between Pluronic- (�Fn, solid circles) and fibronectin-(+Fn, open squares) coated gels with a Young’s modulus of 16.6 kPa anda gap size of 2–8 mm. Linear fits to the data are represented by the solidand dashed lines respectively (�Fn: n = 26; +Fn: n = 33).
Integrative Biology Paper
Publ
ishe
d on
27
May
201
5. D
ownl
oade
d by
Nan
yang
Tec
hnol
ogic
al U
nive
rsity
on
12/1
1/20
15 0
3:58
:39.
View Article Online
This journal is©The Royal Society of Chemistry 2015 Integr. Biol., 2015, 7, 1196--1211 | 1201
the z-axis are directed into the gel as cells protruded and pushedinto the gels at their cell front (Fig. 4H,
-
Fprotrusion>). On the otherhand, the rear of the cells exerted stresses along the z-axis thatwere directed out of the gel (Fig. 4H,
-
Fretraction>) as cells detachedand pulled from the gel at the rear. This ‘‘push–pull’’ dynamics ofthe cell have similarly been reported in other studies involving
fibroblasts, a mesenchymal cell type.44 As the normal stresses dueto protrusion and retraction of the dHL60 cells that migratemesenchymally were in opposing directions, Fz,net was main-tained at a low value (compared with Fz,net for chimneying cells)between 2.44 kPa and 2.90 kPa regardless of the gap size (Fig. 6Aopen circles). Although the average stress magnitude, hFx,y,zi, across
Fig. 4 3D traction stress measurements reveal that cells migrating in the amoeboid mode exert expansive forces on the confining gels in a chimneyingmanner in contrast to cells migrating in the mesenchymal mode which exert contractile forces on the gels: (A) schematics of a dHL60 cell confinedbetween two Pluronic-coated gels and migrating via the amoeboid mode. A bleb produced at the cell front (dashed outline) exerts a shear stress(~Fprotrusion) on the gel in the direction of the bleb growth. The cell body also pushes into the gel to anchor the cell between the two gels (~Fanchor). As thecells migrate forward, the cell exerts another shear stress that is opposite to the direction of migration (~Ffriction). (B–E) 3D traction stresses exerted on thegel by a chimneying dHL60 cell confined between 1.25 kPa Pluronic-coated gels, with a gap size of 2 mm. xy-stress maps of the top gel (B) and bottom gel(E) in the xy-plane immediately above and below the dHL60 cell. Corresponding xz-stress maps at the planes denoted by the white dashed lines areshown in (C and D) respectively. (F) Schematics of a dHL60 cell confined between two fibronectin-coated gels and migrating via the mesenchymal mode.The cell adheres to the top gel and exerts contractile shearing stresses at the cell front and rear (~Fprotrusion and~Fretraction respectively). (G–J) 3D tractionstresses exerted on the gel by a dHL60 cell, which migrated mesenchymally, when confined between two fibronectin-coated gels, with a gap size of2 mm. xy-stress map of the top gel (G) and bottom gel (J) in the xy-plane immediately above and below the cell. Corresponding xz-stress maps at the planedenoted by the dashed lines are shown in (H and I). Dashed arrows denote the direction of cell migration. The cell positions are indicated by the white solidlines in xy-stress and the xz-stress maps. Scale bars represent 5 mm in the x, y and z directions. Insets in (B and G) are the DIC images of the corresponding cell.
Paper Integrative Biology
Publ
ishe
d on
27
May
201
5. D
ownl
oade
d by
Nan
yang
Tec
hnol
ogic
al U
nive
rsity
on
12/1
1/20
15 0
3:58
:39.
View Article Online
1202 | Integr. Biol., 2015, 7, 1196--1211 This journal is©The Royal Society of Chemistry 2015
the cell area at the top gel surface for cells that migrate mesenchy-mally, decreased from 307 Pa to 215 Pa as the gap size increased,the change was not statically significant, indicating that the cellsadhered and remained in contact with the gels despite variations inthe gap size (Fig. 6B, open circles, D, F and H). However, we alsonoticed that the mesenchymal cells exert comparatively lowertraction stresses on the bottom gel (Fig. 4I and J). We believe thatthis is because we allowed the cells to adhere to the top gel firstbefore inverting the top gel over another bottom gel, in ourassembly of the confined environment, and thereby the celladheres more strongly to the top gel as compared to the bottomgel. To verify this, we repeated the traction force measurements fora cell that was initially plated on the fibronectin-coated bottom geland subsequently confined with a top gel. We showed that theoverall traction stresses on the bottom gel was higher than that onthe top gel for the cell first plated on a bottom gel, thereby verifyingthat the difference in the traction stresses was due to the initialplating location (Fig. S1, ESI†).
Chimneying speed is maximal at an intermediate gap size
From the traction stress measurements at different gap spacings,we observed that the anchoring stress of the amoeboid cellsdecreased as they lose contact with the confining gels. Thisbehavior indicates a dependence of cell speed on the anchoring
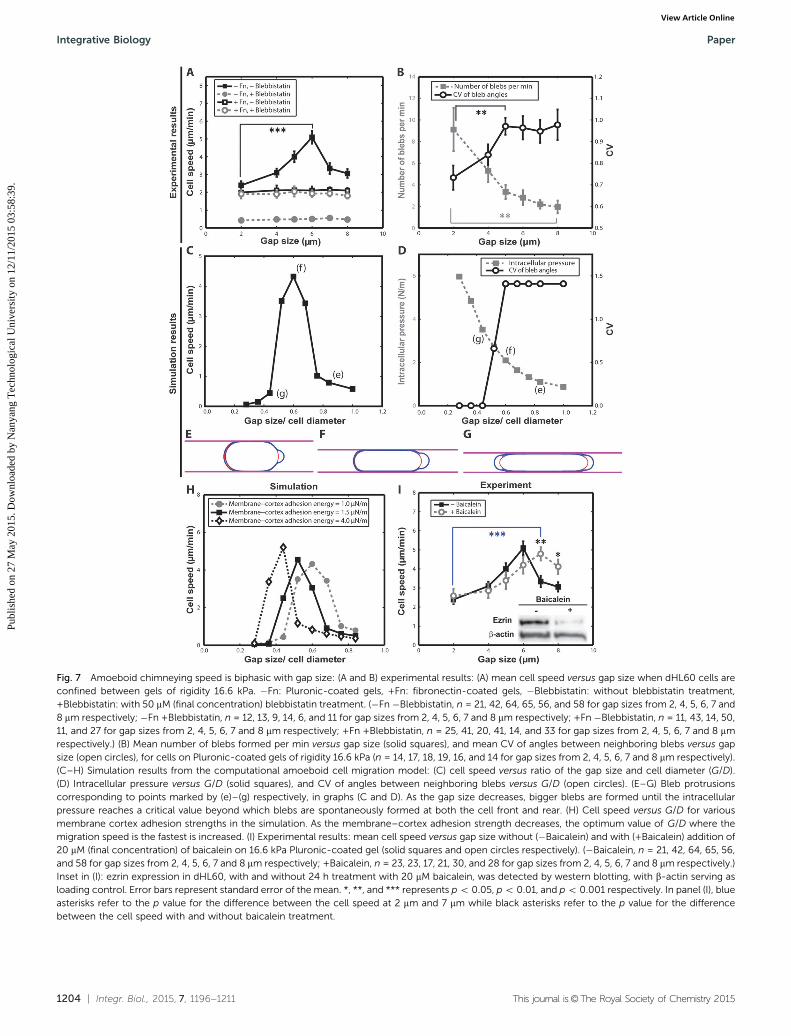
traction stress. Therefore we measured cell speed as a function ofgap spacing. Our results showed that amoeboid dHL60 cellsconfined between Pluronic-coated gels displayed a clear biphasicrelationship between cell migration speed and gap size. Thefastest speed occurred at an intermediate gap size of 6 mm(5.09 � 0.36 mm min�1, mean � standard error) (Fig. 7A, solidsquares). To test the dependence on the formation and protrusionof blebs, we treated the cells with 50 mM (final concentration) ofblebbistatin, a myosin II inhibitor which prevents bleb but notlamellipodia formation.45,46 After blebbistatin treatment, the cellspeed decreased (to approximately 0.5 mm min�1) and wasindependent of gap size (Fig. 7A solid circles). However, whencells were confined in between fibronectin-coated gels, the cellspeed was not significantly changed by either gap size or theaddition of blebbistatin (1.80–2.04 mm min�1) (Fig. 7A, opensquares and open circles). Thus, this biphasic relationship isexclusive to migration by chimneying, and is not observed formigration by lamellipodia formation.
To explain why amoeboid chimneying speed exhibits abiphasic relationship with gap size, we have quantified thenumber and the location where blebs were formed as the gapsize decreased. The dHL60 cells confined between Pluronic-coated gels were found to produce more blebs when the gapsize decreased (Fig. 7B, solid squares). The increased number of
Fig. 5 Amoeboid cell progressively exerts chimneying forces at where the bleb was originally formed: (A–I) Time-lapsed 3D stresses exerted on the gelsby a chimneying dHL60 cell confined between 1.25 kPa Pluronic-coated gels, with a gap size of 2 mm. xz-stress maps of the (A) top and (B) bottom gel atthe plane denoted by the white dashed line in (C) the DIC image of the cell in the xy-plane at the first time point (t = 0 s). xz-stress maps of the (D) top and(E) bottom gel at the plane denoted by the white dashed line in (F) the DIC image of the cell in the xy-plane 30 s later (t = 30 s). xz-stress maps of the (G)top and (H) bottom gel at the plane denoted by the white dashed line in (I) the DIC image of the cell 60 s (t = 60 s) after the first time point. Dashed arrowsdenote the direction of cell migration. The bleb and cell positions at t = 0 s are indicated by the white and black dotted lines while the current cellpositions are indicated by the black solid lines. Scale bars represent 5 mm in the x, y and z directions. (J) The average stress exerted in the region of thebleb (white dotted lines in A–H) and other parts of the cell body (black dotted lines in A–H) at t = 0 s, as time progressed.
Integrative Biology Paper
Publ
ishe
d on
27
May
201
5. D
ownl
oade
d by
Nan
yang
Tec
hnol
ogic
al U
nive
rsity
on
12/1
1/20
15 0
3:58
:39.
View Article Online

This journal is©The Royal Society of Chemistry 2015 Integr. Biol., 2015, 7, 1196--1211 | 1203
bleb protrusions was accompanied by a larger anchoring stress(Fig. 6A, solid circles, C, E, G). However, we also observed thatat extremely small gap sizes (2–4 mm), blebs were formed onopposing sides of the cell that potentially slowed migration(compare Movies S3 and S4, ESI†). As a measure of protrusionasymmetry, we measured the angles formed between neighbor-ing blebs and quantified the coefficient of variance (CV) asdescribed in the methods. A large CV indicates protrusionasymmetry, with blebs generally formed on one side of the cell(polarized blebs). On the other hand, a CV value of 0 indicatessymmetric protrusions whereby blebs are formed on opposingsides of the cell (non-polarized blebs). We found that the CV ofangles between neighboring blebs decreased as the gap sizesdecreased (Fig. 7B, open circles). More non-polarized blebs
formed on opposing sides of the cell reduce motility at verysmall gap sizes.
Computational modeling reveals that intracellular pressureand membrane–cortex adhesion strength determine optimumgap size
Finally, to provide an in-depth understanding of the mechan-isms involved in amoeboid cell migration in a confinedenvironment, we developed a computational model of a 2Dcell47,48 (Fig. S5 and ESI†). The model of the cell, surrounded byan incompressible viscous fluid and confined between twochannel walls of different spacing, is described by the 2DStokes equation with no-slip boundary condition. The cell iscomprised of an elastic cell membrane that is connected,
Fig. 6 Chimneying stresses decrease with increasing gap size between the confining gels: (A) magnitude of the vector sum of~Fz (Fz,net) exerted by thedHL60 cells on the top gels versus gap size. (B) The average stress magnitude, hFx,y,zi, across the cell area at the top gel surface exerted by dHL60 cellsversus gap size. (Amoeboid: n = 11, 9, 10 and 11 for gap sizes from 2, 4, 6, and 8 mm respectively; mesenchymal: n = 7, 8, 6 and 7 for gap sizes from 2, 4, 6,and 8 mm respectively.) Error bars represent standard error of the mean. *, **, and *** represent p o 0.05, p o 0.01, and p o 0.001 respectively.n.s. denotes non-significant. (C–H) xz-stress maps of a plane in the top gel for dHL60 cells which migrate in the amoeboid (C, E and G) and mesenchymal(D, F and H) mode, with gap sizes of: (C and D) 2 mm, (E and F) 4 mm, and (G and H) 8 mm. The gels have a Young’s modulus of 1.25 kPa. Cells migratingin the amoeboid or mesenchymal modes were on Pluronic- or fibronectin-coated gels respectively. Dashed arrows denote the direction of migration.Cell and nuclei positions are indicated by the white and black lines respectively. Scale bars represent 5 mm in the x and z directions.
Paper Integrative Biology
Publ
ishe
d on
27
May
201
5. D
ownl
oade
d by
Nan
yang
Tec
hnol
ogic
al U
nive
rsity
on
12/1
1/20
15 0
3:58
:39.
View Article Online
1204 | Integr. Biol., 2015, 7, 1196--1211 This journal is©The Royal Society of Chemistry 2015
Fig. 7 Amoeboid chimneying speed is biphasic with gap size: (A and B) experimental results: (A) mean cell speed versus gap size when dHL60 cells areconfined between gels of rigidity 16.6 kPa. �Fn: Pluronic-coated gels, +Fn: fibronectin-coated gels, �Blebbistatin: without blebbistatin treatment,+Blebbistatin: with 50 mM (final concentration) blebbistatin treatment. (�Fn �Blebbistatin, n = 21, 42, 64, 65, 56, and 58 for gap sizes from 2, 4, 5, 6, 7 and8 mm respectively; �Fn +Blebbistatin, n = 12, 13, 9, 14, 6, and 11 for gap sizes from 2, 4, 5, 6, 7 and 8 mm respectively; +Fn �Blebbistatin, n = 11, 43, 14, 50,11, and 27 for gap sizes from 2, 4, 5, 6, 7 and 8 mm respectively; +Fn +Blebbistatin, n = 25, 41, 20, 41, 14, and 33 for gap sizes from 2, 4, 5, 6, 7 and 8 mmrespectively.) (B) Mean number of blebs formed per min versus gap size (solid squares), and mean CV of angles between neighboring blebs versus gapsize (open circles), for cells on Pluronic-coated gels of rigidity 16.6 kPa (n = 14, 17, 18, 19, 16, and 14 for gap sizes from 2, 4, 5, 6, 7 and 8 mm respectively).(C–H) Simulation results from the computational amoeboid cell migration model: (C) cell speed versus ratio of the gap size and cell diameter (G/D).(D) Intracellular pressure versus G/D (solid squares), and CV of angles between neighboring blebs versus G/D (open circles). (E–G) Bleb protrusionscorresponding to points marked by (e)–(g) respectively, in graphs (C and D). As the gap size decreases, bigger blebs are formed until the intracellularpressure reaches a critical value beyond which blebs are spontaneously formed at both the cell front and rear. (H) Cell speed versus G/D for variousmembrane cortex adhesion strengths in the simulation. As the membrane–cortex adhesion strength decreases, the optimum value of G/D where themigration speed is the fastest is increased. (I) Experimental results: mean cell speed versus gap size without (�Baicalein) and with (+Baicalein) addition of20 mM (final concentration) of baicalein on 16.6 kPa Pluronic-coated gel (solid squares and open circles respectively). (�Baicalein, n = 21, 42, 64, 65, 56,and 58 for gap sizes from 2, 4, 5, 6, 7 and 8 mm respectively; +Baicalein, n = 23, 23, 17, 21, 30, and 28 for gap sizes from 2, 4, 5, 6, 7 and 8 mm respectively.)Inset in (I): ezrin expression in dHL60, with and without 24 h treatment with 20 mM baicalein, was detected by western blotting, with b-actin serving asloading control. Error bars represent standard error of the mean. *, **, and *** represents p o 0.05, p o 0.01, and p o 0.001 respectively. In panel (I), blueasterisks refer to the p value for the difference between the cell speed at 2 mm and 7 mm while black asterisks refer to the p value for the differencebetween the cell speed with and without baicalein treatment.
Integrative Biology Paper
Publ
ishe
d on
27
May
201
5. D
ownl
oade
d by
Nan
yang
Tec
hnol
ogic
al U
nive
rsity
on
12/1
1/20
15 0
3:58
:39.
View Article Online
This journal is©The Royal Society of Chemistry 2015 Integr. Biol., 2015, 7, 1196--1211 | 1205
through elastic membrane–cortex adhesion bonds, to a permeableelastic actin cortex. Detachment of the cell membrane from theactin cortex, by breaking the membrane–cortex adhesion bonds,resulted in bleb growth. Subsequently, actin monomers movedtowards the detached cell membrane at a constant speed to reformthe actin cortex underneath the cell membrane, and the blebsretract. Although the cell in the computational model does notadhere to the channel walls through a specific cell–substrateinteraction (e.g. integrin–fibronectin adhesion bond), a no-slipboundary condition was imposed on the fluid in contact with thewalls. In this way, the walls interact with the cell membranehydrodynamically and provide the friction to resist relative motionat the channel walls.
Similar to experimental observations, the computationalmodel revealed a biphasic relationship between the cell migrationspeed and the extent of cell confinement. The maximal cell speedpredicted by the model occurred at an intermediate gap size (ratioof gap size to cell diameter (G/D) 4 0.6 (Fig. 7C)). The dHL60 celldiameter is experimentally measured to be approximately 9.21 �0.088 mm (mean � standard error) (Fig. S3, ESI†). It was alsoobserved that as the gap size decreased, intracellular pressureincreased due to an increase in the extent of cell confinement(Fig. 7D, solid squares). At higher intracellular pressures largerblebs form at the cell front and lead to faster chimneying speeds(Fig. 7E and F). The model also predicted that when the intracel-lular pressure exceeded a critical threshold at very small gap sizes(G/D o 0.6), non-polarized blebs would be formed at both ends ofthe cell (Fig. 7G), hence lowering the CV of the angles betweenneighboring blebs (Fig. 7D, open circles). As a result, the cellspeed decreased. These computational results agreed with ourexperimental observations of a biphasic relationship between theamoeboid chimneying speed and the gap size.
In addition, the model predicted that the optimum gap size,where the amoeboid chimneying speed is the fastest, could beincreased by weakening the cell membrane to actin cortexadhesion strength (Fig. 7H). This membrane–cortex adhesionstrength is mediated by proteins such as ezrin, radixin, andmoesin (known collectively as the ERM proteins).17,49,50 Themodel prediction was tested experimentally by inhibiting ezrinexpression and phosphorylation using the inhibitor, baicalein(20 mM, final concentration).51 We have verified using westernblotting that the total ezrin expression levels in dHL60 cellsdecreased after 24 h of treatment with baicalein (inset inFig. 7I). When dHL60 cells were treated with baicalein for24 h and subsequently confined between Pluronic-coated gels,the optimum gap size where chimneying speed peaked wasincreased from 6 mm to 7 mm (Fig. 7I), in agreement with themodel prediction.
Discussions
Previous studies proposed that in the absence of cell–matrixadhesion, cells can migrate when confined between two glasscoverslips or in a thin micro-fluidic channel by chimneying.17
During chimneying, the cell is hypothesized to exert forces
perpendicularly to the confining surfaces as the cell squeezeitself forward. This mechanism is supported by the observa-tions of Malawista et al.,22 where leukocytes with b2-integrinadhesion deficiency were seen to migrate in confined environ-ments in between two glass coverslips. However, there have beenno reports of how chimneying actually works in amoeboid-likecells. In this study, we have shown how a balance of normal andshear stresses to opposing surfaces generates traction forces neces-sary for cell migration in the absence of fibronectin-dependentcell–matrix adhesions.
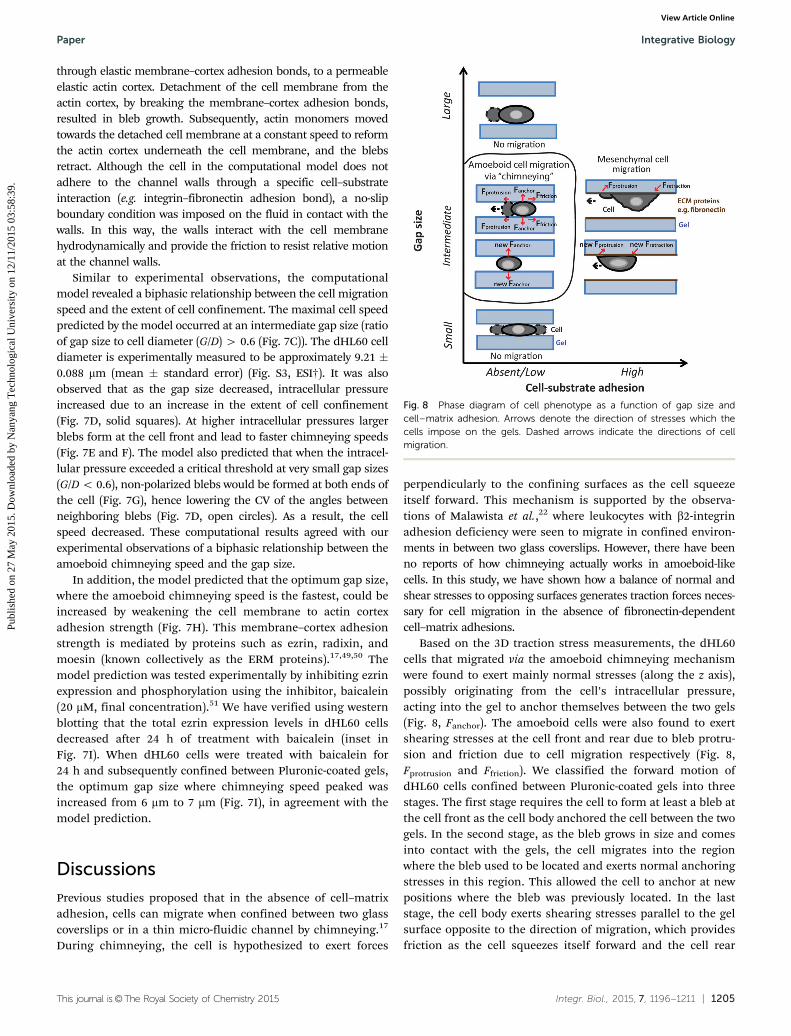
Based on the 3D traction stress measurements, the dHL60cells that migrated via the amoeboid chimneying mechanismwere found to exert mainly normal stresses (along the z axis),possibly originating from the cell’s intracellular pressure,acting into the gel to anchor themselves between the two gels(Fig. 8, Fanchor). The amoeboid cells were also found to exertshearing stresses at the cell front and rear due to bleb protru-sion and friction due to cell migration respectively (Fig. 8,Fprotrusion and Ffriction). We classified the forward motion ofdHL60 cells confined between Pluronic-coated gels into threestages. The first stage requires the cell to form at least a bleb atthe cell front as the cell body anchored the cell between the twogels. In the second stage, as the bleb grows in size and comesinto contact with the gels, the cell migrates into the regionwhere the bleb used to be located and exerts normal anchoringstresses in this region. This allowed the cell to anchor at newpositions where the bleb was previously located. In the laststage, the cell body exerts shearing stresses parallel to the gelsurface opposite to the direction of migration, which providesfriction as the cell squeezes itself forward and the cell rear
Fig. 8 Phase diagram of cell phenotype as a function of gap size andcell–matrix adhesion. Arrows denote the direction of stresses which thecells impose on the gels. Dashed arrows indicate the directions of cellmigration.
Paper Integrative Biology
Publ
ishe
d on
27
May
201
5. D
ownl
oade
d by
Nan
yang
Tec
hnol
ogic
al U
nive
rsity
on
12/1
1/20
15 0
3:58
:39.
View Article Online
1206 | Integr. Biol., 2015, 7, 1196--1211 This journal is©The Royal Society of Chemistry 2015
contracts. These observations are, to the best of our knowledge,the first detailed description of how an amoeboid cell migratesin confined environments via chimneying.
In addition, we found that the anchoring stresses exerted bythe cells decrease with increasing gap size as the cells losecontact with the surface of the confining gels. We also note thatamoeboid chimneying can only occur if the dHL60 cells are inconfined spaces such as in a 3D matrix. Cells do not migrate inthe amoeboid mode on unconfined 2D substrates in theabsence of cell–matrix adhesion, as they cannot anchor ontoa surface to exert forces necessary for migration, even thoughthey continue to form blebs (Fig. 8, Movie S5, ESI†). Althoughthe extending bleb protrusion would displace the cell’scentre of mass forward, subsequent bleb retraction woulddo the opposite thereby leading to zero net displacement.However, in the presence of cell–matrix adhesions, thedHL60 cells can migrate on unconfined 2D substrates via themesenchymal mode, by adhering to the substrate and forminglamellipodia.
We also report that the expansive divergent stresses exertedby amoeboid chimneying cells are distinct from the contractile‘‘push–pull’’ dynamics exhibited by the dHL60 cells thatmigrate mesenchymally, as well as by other adherent mesenchymalcells such as the fibroblasts.44 These expansive stresses observed inamoeboid cell migration resemble a divergent force dipole (point-ing away from the cell body) in contrast to the contractile orconvergent force dipole (pointing towards the cell body)52 duringmesenchymal cell migration. The differences in the 3D tractionstresses not only offer a mechanistic understanding of the migra-tion processes, it could quantitatively differentiate between themesenchymal and amoeboid modes of cell migration. Currently,cell migration is classified by subjective morphological differences(e.g. cell shape and the presence of constriction rings)18,19 or thelocalization of labeled F-actin to distinguish between blebs orlamellipodia,21,36,37 but the latter will be challenging in cell-typesthat are difficult to transfect. We propose that a dipole summary of3D traction stress measurements44,53–57 can provide the advantageof a quantitative classification of amoeboid and mesenchymal cellmigration.
We have shown that integrin-mediated cell–matrix adhe-sions, although crucial in mesenchymal cell migration, aredispensable in amoeboid cell migration. In the absence ofcell–matrix adhesion, dHL60 cells can continue to migrate inconfined spaces by employing the amoeboid chimneyingmechanism. However, when the dHL60 cells are allowed toadhere to the fibronectin-coated gels, we found that most of thecells formed lamellipodia during migration. Similarly, Bergert et al.reported that a suspension subline of Walker 256 carcinosarcomacells transit from producing bleb-like protrusions to lamellipodia-like protrusions upon crossing from a region without cell–substrateadhesion to a region with cell–substrate adhesion and vice versa.62
These findings suggest that transitions between amoeboid andmesenchymal cell migration can be controlled by changes incell–matrix adhesivity.
Our results also revealed that unlike mesenchymal cell migrationwhich is known to be altered by ECM rigidity,30–34,39–41,58–61 rigidity
does not seem to play an important role in determining the amoeboidchimneying speed. This is not unexpected as researchers havehypothesized that mesenchymal cells sense the ECM rigidity throughproteins related to the focal adhesion complexes.32,59,63 In the absenceof integrin-mediated cell–matrix adhesions where focal adhesioncomplexes are absent, cells migrating in the amoeboid manner willunlikely be able to ‘‘feel’’ the matrix rigidity if the rigidity sensor isrelated to the focal adhesion complexes.
However, we found that the amoeboid chimneying speedshowed a biphasic relationship with the amount of confine-ment experienced by the cells. Our computational modelpredicts that the critical gap size before non-polarized blebsbegin to form is determined by the membrane–cortex adhesionstrength, which is mediated by the ERM proteins.17,50 Thisprediction was verified experimentally by treating dHL60 cellswith the ezrin inhibitor baicalein. We suggest that reducingmembrane–cortex adhesion strength can inhibit directedamoeboid cell migration through narrow pores in the 3DECM. In agreement with our hypothesis, Diz-Munoz et al. havedemonstrated that when the membrane–cortex adhesionstrength mediated by ezrin is weakened in zebrafish mesoderm–endoderm germ-layer progenitor cells, cells produced more blebsand are less directed than wild-type cells.36 We propose that theinhibition of ERM activity may cause more non-polarized blebs toform which hampers the cell’s ability to squeeze through narrowpores in the ECM in a directed manner. This could present apotential target for inhibiting cancer cell metastasis where cellsutilize the amoeboid mode to migrate. During cancer progression,cells may over-express ERM proteins that strengthen themembrane–cortex adhesion strength and reduce non-polarizedbleb formation, thereby allowing cells to migrate efficientlybetween narrow pores in the 3D ECM. Indeed, reports have shownthat over-expression of ezrin is important in the dissemination oftwo pediatric tumors (rhabdomyosarcoma and osteosarcoma).64,65
Ezrin has also been found to be significantly over-expressed inpancreatic and breast cancer.64–67 However, research on the ERMproteins with regard to cancer progression thus far has focusedmainly on modulation of cell survival pathways due to ezrinsignaling.68 Ezrin’s role in cell migration, particularly during cancermetastasis, remains largely unknown.
Conclusions
By optimizing the confining conditions that promote themaximum speed of amoeboid migration, we have detected andmeasured expansive forces responsible for traction and protrusion.3D traction stress measurements revealed that these cells exertnormal stresses directed away from the cell body and into the gels,to anchor themselves between the two pieces of gels. Theseexpansive and divergent chimneying stresses are distinct fromthe contractile and convergent ‘‘push–pull’’ stresses exerted bycells migrating with the mesenchymal mode of migration. Inaddition, we show that the mesenchymal and amoeboid cellmigration modes are regulated by different physical propertiesof the ECM. While cells that migrate in the mesenchymal
Integrative Biology Paper
Publ
ishe
d on
27
May
201
5. D
ownl
oade
d by
Nan
yang
Tec
hnol
ogic
al U
nive
rsity
on
12/1
1/20
15 0
3:58
:39.
View Article Online
This journal is©The Royal Society of Chemistry 2015 Integr. Biol., 2015, 7, 1196--1211 | 1207
manner show the expected biphasic response to changes inECM adhesiveness and rigidity, the speed of cells migrating in theamoeboid chimneying manner is independent of ECM adhesive-ness and rigidity. Instead, the chimneying cells show a biphasicresponse to changes in the extent of cell confinement. Theseobservations led us to propose that mechanisms leading toamoeboid and mesenchymal cell migration are mutually exclusiveand independently regulated by different physical parameters inthe ECM. It could be possible that a cell senses the physicalproperties of its environment and choose the migratory mode mostfavorable to navigate through the ECM. This reiterates the impor-tance of understanding the detailed mechanisms that cells employto sense their physical environment. Such knowledge will be crucialin identifying potential drug targets for cancer therapy to preventcancer cell metastasis. Although more work remains to be done inorder to elucidate the detailed mechanisms involved, our studyhere has revealed that intracellular pressure and membrane–cortexadhesion strength are important factors that determined theefficiency of amoeboid cell migration in confined environments.Whether and how an amoeboid cell alters its membrane–cortexadhesion strength in response to a chemoattractant or mechanicalperturbations in the ECM would therefore be an interesting focusfor future studies.
Methods and materialsCell culture, differentiation and transfection of HL60 cells
Human promyelocytic leukemia (HL60) cells (ATCC, Manassas,VA) were maintained at 37 1C and 5% CO2 in Roswell ParkMemorial Institute medium (RPMI, ATCC) supplemented with10% fetal bovine serum (GIBCO, Grand Island, NY) and 1%penicillin–streptomycin (GIBCO). The HL60 cells were differ-entiated into neutrophils (dHL60 cells) by culturing cells inculture media containing 1.3% dimethylsulfoxide (DMSO) for6 days, following published protocols.69–71 Approximately 72%of the 300 cells counted had differentiated into neutrophils asdetected by the nitrobluetetrazolium (NBT) reduction test69,70
(Fig. S2, ESI†). The diameter of the dHL60 cells was estimatedby fitting circles to phase contrast images of the suspendeddHL60 cells in MATLAB (imfindcircles) (Fig. S3, ESI†). Thediameter of the dHL60 cells was found to be 9.21 � 0.088 mm(mean � standard error, n = 306).
The dHL60 cells were transfected with Lifeact-GFP byelectroporation (Neon Transfection System) at 1350 V, 35 ms,1 pulse, to visualize F-actin localization within the cells with-out compromising actin dynamics.37 To investigate the role ofmyosin contractility during cell migration, the cell migrationspeeds were measured (refer to section on quantification ofcell migration speed below) immediately after treatment with50 mM (final concentration) blebbistatin (Tocris Bioscience,Bristol, United Kingdom). Ezrin-mediated association of theactin cortex to the cell membrane was disrupted by treatingcells with 20 mM (final concentration) baicalein (Sigma-Aldrich, St. Louis, MO) and measuring the cell migrationspeed 24 h later.
Preparation of polyacrylamide gels bonded to glass surfaces
Polyacrylamide gels were prepared at three acrylamide : bisacry-lamide ratios 5 : 0.05, 8 : 0.1, and 8 : 0.2% w/v (Bio-Rad, Hercules,CA) and mixed with a 1/25 volume of 0.2 mm diameter redfluorescent (lEx 580 nm, lEm 605 nm respectively) beads (2%suspension FluoSpheres; Invitrogen, Carlsbad, CA). Polymeriza-tion was initiated with 10% ammonium persulfate (Bio-Rad) andcatalyzed with N,N,N0,N0-tetramethylethlenediamine (Bio-Rad).6 ml of the gel solution was placed on the activated glass-bottomed dish or coverslip (see paragraph below), and coveredwith an unactivated circular coverslip (12 mm diameter). Afterpolymerization, the top coverslip was carefully removed andthe gel was rinsed with 50 mM 4-(2-hydroxyethyl)-1-piperazin-eethanesulfonic acid (HEPES, pH 8.5; Sigma-Aldrich). The fullyhydrated gels from a 6 ml drop were approximately 50–60 mmthick. The Young’s moduli of the polymerized gels prepared atthe three acrylamide : bisacrylamide ratios were measured byatomic force microscopy (refer to the ESI† and Table S3) andthe obtained values (1.25 � 0.016 kPa (mean � standard error),6.19 � 0.053 kPa, and 16.6 � 0.13 kPa) corresponded withprevious measurements.39
Polyacrylamide gels were bonded to activated glass surfaceswhich were prepared following the method previouslydescribed by Pelham and Wang.30 20 mm-diameter glass insertsin 35 mm-diameter dishes (ibidi GmbH, Planegg, Germany)and 15 mm-diameter circular coverslips were activated with3-aminopropyltrimethoxysilane (Sigma-Aldrich) for 5 min, washedwith distilled water, covered with 0.5% glutaraldehyde (Sigma-Aldrich) in phosphate buffered saline (PBS) for 30 min, washedtwice with distilled water, and left to dry.
The polymerized polyacrylamide gels were functionalizedwith either fibronectin or a hydrophilic and non-ionic surfac-tant to control cell–substrate adhesion. Fibronectin-coated gelswere prepared by modifying the gel surface with a 0.5 mg ml�1
solution of the crosslinker, sulfo-succinimidyl-6-(4-azido-2-nitrophenyl-amino) hexanoate (sulfo-SANPAH; Pierce, Rock-ford, IL), in 50 mM HEPES (pH 8.5), followed by exposure toultra-violet (UV) light in a sterile hood for 15 min. The darkenedsulfo-SANPAH solution was removed and gels were rinsed twicewith HEPES for 15 min each. The gels were then covered by100 mg ml�1 fibronectin (Sigma-Aldrich) in PBS for 2 h at roomtemperature on a rocker. To compare adhesion and non-adhesion-dependent cell migration, we prepared gels to whichcells were unable to attach, by immersing gels in 0.1% PluronicF127 (BASF, Ludwigshafen, Germany), a hydrophilic and non-ionicsurfactant, for 1 h at room temperature on a rocker (Pluronic-coated gels).72 The gels (both fibronectin- and Pluronic-coated gels)were then rinsed with PBS, sterilized by exposure to UV light in asterile hood for 15 min, and incubated for 30 min in cell culturemedia at 37 1C before cells were transferred to the gels.
Assembly of an in vitro cell motility assay to study migration ina confined environment
To mimic a confined 3D environment where cells have to migratethrough pores in the ECM, the 9.2 mm-diameter dHL60 cells were
Paper Integrative Biology
Publ
ishe
d on
27
May
201
5. D
ownl
oade
d by
Nan
yang
Tec
hnol
ogic
al U
nive
rsity
on
12/1
1/20
15 0
3:58
:39.
View Article Online
1208 | Integr. Biol., 2015, 7, 1196--1211 This journal is©The Royal Society of Chemistry 2015
sandwiched between a top and bottom polyacrylamide gel (Fig. 1Aand B) separated by a 120 mm thick spacer (Secure-Seal; Invitrogen).Cells were sandwiched between either fibronectin-coated surfacesto study adhesion-dependent motility or Pluronic-coated surfacesto study adhesion-independent motility. The cells were first allowedto settle onto a fibronectin- or Pluronic-coated gel surface for15 min. To ensure that only adherent cells were studied, thefibronectin-coated gel, which was attached to a coverslip, wasinverted over a spacer on a glass-bottomed dish containing anotherfibronectin-coated bottom gel. In the case where adhesion-independent motility was studied, a second Pluronic-coated gel,attached to a coverslip, was overlaid onto a spacer on the glassbottom dish containing cells on the Pluronic-coated gel. Thespacing between the top and bottom gels (gap size) was measuredby confocal microscopy of the fluorescent beads embedded withinthe gel (Fig. S6, ESI†). The gap sizes were determined to be thedistance between the first focused plane of the beads on the topand bottom gels and the measured distance was rounded off to thenearest micrometer. Gaps between 0 and 15 mm were observed dueto variations in gel thickness across the sample. However, the rangeof gap sizes used in these experiments was 2–8 mm. A small weight(3 g) was placed above the top coverslip to minimize drifting of thetop gel during image acquisition.
Microscopy
Neutrophil-like migration of dHL60 cells was induced by 100 nM(final concentration) of the chemokine, formyl-methionyl-leucyl-phenylalanine (FMLP; Sigma-Aldrich), as prior studies havefound FMLP to induce polarization and migration of dHL60cells.42,73 Indeed, we observed that more dHL60 cells on uncon-fined fibronectin-coated substrates adhered to the substrates toform lamellipodia when exposed to a uniform concentration of100 nM FMLP (Fig. S4C and D, ESI,† red boxes). However, fordHL60 cells on substrates without fibronectin coating (Pluronic-coated), adding FMLP does not induce cells to adhere to thesubstrate or form lamellipodia (Fig. S4A and B, ESI†). Differen-tial interference contrast (DIC) images of the live cells wereobtained every 30 s for 10 min using the Perkin Elmer Ultraviewmounted on an Olympus IX-81 microscope with a 60� waterobjective lens (NA 1.2). Temperature (37 1C), humidity (100%)and carbon dioxide concentration (5%) was maintained by enclo-sure in a plastic box. The cell nuclei were stained with 1 mg ml�1
Hoechst 34580 (Invitrogen) to enable calculations of the cellmigration speed. 3D image stacks of the fluorescent beadsembedded within the polyacrylamide gels were also acquired forcalculations of the 3D stress imposed by the cells onto the gels.
Quantification of cell migration speed, number of blebs andprotrusion asymmetry
The cell migration speed was determined from time-lapsedimages of the dHL60 cell nuclei recorded every 30 s, over aperiod of 10 min. Images of the cell nuclei were segmented inMATLAB by applying a threshold value determined by Otsu’smethod.74 Nuclei which contacted the edges of the image framewere removed and the nuclei centroid positions (-r(t)) weredetermined. A MATLAB tracking program, which computes
the correlation of the nuclei centroid positions between timeframes, was then applied to obtain the cell trajectories.75 Thetotal distance travelled by the cell during the time period of10 min was obtained by summing the displacements of thenuclei centroid between each 30 s time frame. The cell speedwas calculated by dividing the total distance travelled by thecells with the time period observed (10 min).
The mean squared displacement (MSD) of the cell wascalculated as
MSD(Dt) = h[-r(t + Dt) � -r(t)]2i, (1)
where Dt is the time interval used to calculate the cell displace-ment, and h i represents a moving average.39,42 The MSD versusDt was then plotted as a log–log plot, and the slope of the data(b), which characterizes the persistence of the motion, wasmeasured.
MSD(Dt) p Dtb (2)
A value of b = 1 describes random and diffusive motion whilethe theoretical upper limit of b = 2 describes ballistic, directedmotion at a constant speed.
The number of blebs produced by the dHL60 cells perminute was obtained from the DIC time-lapse images bymanual counting of the total number of blebs produced percell over a period of 10 min. The centroid positions of each blebwere marked manually and the angle between neighboring blebswas defined by the positions of the bleb centroids relative to thenucleus centroid. For each cell, a coefficient of variance (CV) wasevaluated as the ratio of the standard deviation of the anglesbetween neighboring blebs to the mean of the angles betweenneighboring blebs. This CV measures the degree of protrusionasymmetry, with a value of 0 indicating no protrusion asymmetryand a larger value indicating more asymmetric protrusions.
3D traction stress calculations
The 3D traction stresses exerted by the cells on the polyacryl-amide gels were calculated using the digital volume correlation(DVC) algorithm first described by Franck et al.44,53,76 Twovolumes of the 3D image stacks of the beads’ position withinthe unstrained (where cells were more than 20 mm away) andthe strained gels were obtained and divided into sub-volumes O.The fluorescence intensity of the beads in each 3D sub-volume ofthe unstrained and the strained gel was represented by f (x1,x2,x3)and g(x1,x2,x3) respectively, where x1, x2, and x3 correspond to theCartesian coordinates along the x, y, and z axes.
The displacement vectors u between each corresponding sub-volumes were estimated from the locations where the cross-correlation, m(u), value is maximum. The cross-correlation functionis defined by:
mðuÞ ¼ðf ðxÞgðxþ uÞdOx (3)
The cross correlation function can be efficiently computed withFourier transforms as denoted by eqn (4),
m(u) = F�1{F [ f (x)]* F [ g (x)]}, (4)
Integrative Biology Paper
Publ
ishe
d on
27
May
201
5. D
ownl
oade
d by
Nan
yang
Tec
hnol
ogic
al U
nive
rsity
on
12/1
1/20
15 0
3:58
:39.
View Article Online
This journal is©The Royal Society of Chemistry 2015 Integr. Biol., 2015, 7, 1196--1211 | 1209
where the Fourier transform of f (x) is defined by
F ½ f ðxÞ� ¼Ðf ðxÞe�ikxdOx, * denotes the complex conjugate,
and F�1 denotes the inverse Fourier transform.The mean displacement at cell-free regions, where the cell was
at least 5 mm away, was also subtracted from the calculateddisplacement vectors to correct for sample drift during imageacquisition. The resultant displacement matrix u approximatesthe local gel deformation for each sub-volume which best fit thestrained image to the unstrained image. After obtaining u, adisplacement-gradient technique was applied to obtain the straintensor e by minimizing the vector S in a least square fashion,53
S ¼X3i¼1
X3j¼1
X3k¼1
uijk � uijk� �
2; (5)
where uijk(x1,x2,x3) represents the calculated displacement anduijk(x1,x2,x3) represents the theoretical displacement given byuijk(x1,x2,x3) = ax1 + bx2 + cx3 + d. The constants a, b, c, and dwere determined by the least square minimization of eqn (5) witha 3� 3� 3 pixel kernel. The strain tensor e was obtained from theconstants a, b, c, and d and can be written in a matrix form:
e ¼
e11 e12 e13
e21 e22 e23
e31 e32 e33
0BBB@
1CCCA ¼
a 12ðaþ bÞ 1
2ðaþ cÞ
12ðaþ bÞ b 1
2ðbþ cÞ
12ðaþ cÞ 1
2ðbþ cÞ c
0BBB@
1CCCA:
(6)
Assuming that the material is linearly elastic, isotropic andincompressible, the material stress tensor r was then determinedfrom the materials constitutive relation:
r = Ee/(1 + v), (7)
where E is the Young’s modulus of the gel and v is the Poisson’sratio of the gel (v = 0.5).
The traction stress vector F was calculated at the surface ofthe gel using the Cauchy relationship,
F = r�n, (8)
where n is the surface normal vector.44
The stresses exerted by the cells were quantified by Fz,net
which represents the magnitude of the net vector sum ofstresses in the z-direction (
-
Fz), at the first z-plane of the gelimmediately next to the cells (k = 0.25 mm).
Fz;net ¼Xmi¼1
Xnj¼1
F!
zði; j; 0:25Þ�����
����� (9)
where m and n denote the number of sub-volumes in the x andy directions respectively.
We also calculated the average stress magnitude over the cellarea hFx,y,zi, at the first z-plane denoted by k = 0.25 mm(eqn (10)).
Fx;y;z
� �¼
Pmi¼1
Pnj¼1
ffiffiffiffiffiffiffiffiffiffiffiffiffiffiffiffiffiffiffiffiffiffiffiffiffiffiffiffiffiffiffiffiffiffiffiffiffiffiffiffiffiffiffiffiffiffiffiffiffiffiffiffiffiffiffiffiffiffiffiffiffiffiffiffiffiffiffiffiffiffiffiffiffiffiffiffiffiffiffiffiffiffiffiF!
xði; j; kÞ��� ���2þ F
!yði; j; kÞ
��� ���2þ F!
zði; j; kÞ��� ���2
r
mn
(10)
Modeling of amoeboid cell migration in confinedenvironments
Details of the computational model have been described elsewhere47
and elaborated in the ESI.† The physical and numerical parametersof the model are listed in Tables S1 and S2 (ESI†) respectively. Aschematic diagram of the model is also shown in Fig. S5 (ESI†).
Briefly, a 2D cell was represented by an elastic actin cortexconnected to an elastic cell membrane, through elasticmembrane–cortex adhesion proteins. The cell cytoplasm andextracellular fluid were modeled as incompressible and viscousfluids with the same viscosity. At any instance of time, thevelocity and the pressure field of the cytoplasmic fluid isdescribed by the Stokes equation (eqn (S1), ESI†) with no-slipboundary condition imposed on the fluid in contact with thewalls, and the equation of continuity (eqn (S2), ESI†).
The site of bleb formation was initiated by a disruption of15 out of the 200 membrane–cortex adhesive bonds, at one end ofthe cell in the middle of the channel. Even though the initial siteof bleb nucleation was pre-assigned, the growth of the bleb wasspontaneously driven by cytoplasmic pressure. The disruption ofthe membrane–cortex adhesive bonds reduced local pressure andcaused the cytoplasmic fluid to flow down a pressure gradientinto the region. Bleb growth was supported by the bending andstretching of the detached cell membrane, and further delamina-tion of the cell membrane from the cortex when the length of thesprings representing membrane–cortex adhesion bonds exceededa critical length lc. The cell cortex was allowed to reform under-neath the cell membrane when a bleb was formed. Imaginarydiffusive cortical elements were introduced when a region of themembrane was detached from the cortex. These elements repre-sent the actin monomers which reform the cortex underneath thebleb membrane during bleb retraction and would move towardsthe bleb membrane with a speed Vc. Once the elements reacheda distance Dequil from the membrane, the membrane–cortexadhesive springs that were previously broken were reattachedand integrated into the cortex of the main cell body. The tensionin the cell cortex then drove the bleb to retract as the cell returnsto its original shape before bleb formation.
During the process of bleb formation and retraction, netdisplacement of the cell can be achieved because the shapechange of the cell during bleb formation is different from thatduring bleb retraction. The difference in the cell shape changeallowed the cell to propel itself forward in the absence ofadhesion to the gel surfaces. The resultant cell speed wasobtained by dividing the net displacement of the cell’s centreof mass with the time taken. The time taken is fixed at 2.5 minfor all simulations as it is the typical time taken for a bleb togrow and retract completely.
The cell’s intracellular pressure was defined as the cytoplas-mic fluid pressure prior to any blebbing events.
Statistical analysis
Statistical analyses of the data were performed using the2-tailed Student’s t test. p o 0.05 (*), p o 0.01 (**), or p o 0.001(***) were considered significant.
Paper Integrative Biology
Publ
ishe
d on
27
May
201
5. D
ownl
oade
d by
Nan
yang
Tec
hnol
ogic
al U
nive
rsity
on
12/1
1/20
15 0
3:58
:39.
View Article Online
1210 | Integr. Biol., 2015, 7, 1196--1211 This journal is©The Royal Society of Chemistry 2015
Immunoblot analysis
Cells were washed in ice-cold PBS twice before being solubi-lized with ice cold RIPA buffer (Pierce) for 30 min. Lysates werecentrifuged at 14 000 � g for 15 min at 4 1C to pellet the celldebris. The supernatants were then mixed with 2� Laemmlisample buffer (Bio-Rad) and heated at 95 1C for 5 min. Thesamples were then loaded on 10% sodium dodecyl sulfatepolyacrylamide gel, separated via electrophoresis and trans-ferred onto a polyvinylidene difluoride (PVDF) membrane. Theblot was then incubated at room temperature for 1 h with 5%bovine serum albumin in Tris-buffered saline with 0.1% Tween(TBST) to block non-specific binding. Subsequently, the blotwas incubated with antibodies specific for ezrin (Santa Cruz,Dallas, Texas) and b-actin (Santa Cruz), which were diluted with5% bovine serum albumin in TBST, for 1 h at room temperature.b-Actin was used as a protein loading control. The blot waswashed 3 times in TBST, for 5 min each, before and afterincubating with a HRP-conjugated secondary antibody (SantaCruz). The signal was then developed using Amersham ECLPrime Western Blotting Detection Reagent (GE Healthcare LifeSciences, Uppsala, Sweden) and imaged using the ChemiDoc MPimaging system (Bio-Rad).
Acknowledgements
We thank Fong Yin Lim and Yen Ling Koon for help with thecomputational model, Huiling Chen for help with the 3D tractionforce calculations, and insightful discussions with Chwee Teck Lim.
References
1 R. Keller, Curr. Opin. Cell Biol., 2005, 17, 533–541.2 R. Keller, Science, 2002, 298, 1950–1954.3 D. C. Weiser, U. J. Pyati and D. Kimelman, Genes Dev., 2007,
21, 1559–1571.4 T. J. Shaw and P. Martin, J. Cell Sci., 2009, 122, 3209–3213.5 A. J. Singer and R. A. F. Clark, N. Engl. J. Med., 1999, 341, 738–746.6 P. Friedl and B. Weigelin, Nat. Immunol., 2008, 9, 960–969.7 A. O. Anderson and N. D. Anderson, Immunology, 1976, 31,
731–748.8 P. Friedl and D. Gilmour, Nat. Rev. Mol. Cell Biol., 2009, 10,
445–457.9 P. Friedl and K. Wolf, Nat. Rev. Cancer, 2003, 3, 362–374.
10 The Biology of Amoeba, ed. K. W. Jeon, Academic Press, 1973.11 R. D. Allen and N. S. Allen, Annu. Rev. Biophys. Bioeng., 1978,
7, 469–495.12 P. Bruyn, Q. Rev. Biol., 1947, 22, 1–24.13 S. O. Mast, J. Morphol. Physiol., 1926, 41, 347–425.14 D. L. Taylor, M. Fechheimer and D. M. Shotton, Philos.
Trans. R. Soc. London, Ser. B, 1982, 299, 185–197.15 E. Evans, Biophys. J., 1993, 64, 1306–1322.16 G. M. Odell and H. L. Frisch, J. Theor. Biol., 1975, 50, 59–86.17 G. Charras and E. Paluch, Nat. Rev. Mol. Cell Biol., 2008, 9,
730–736.
18 K. Wolf, I. Mazo, H. Leung, K. Engelke, U. H. von Andrian,E. I. Deryugina, A. Y. Strongin, E. B. Brocker and P. Friedl,J. Cell Biol., 2003, 160, 267–277.
19 T. Lammermann, B. L. Bader, S. J. Monkley, T. Worbs,R. Wedlich-Soldner, K. Hirsch, M. Keller, R. Forster,D. R. Critchley, R. Fassler and M. Sixt, Nature, 2008, 453, 51–55.
20 E. Sahai and C. J. Marshall, Nat. Cell Biol., 2003, 5, 711–719.21 H. Blaser, M. Reichman-Fried, I. Castanon, K. Dumstrei,
F. L. Marlow, K. Kawakami, L. Solnica-Krezel, C. Heisenbergand E. Raz, Dev. Cell, 2006, 11, 613–627.
22 S. E. Malawista, A. B. Chevance and L. A. Boxer, Cell Motil.Cytoskeleton, 2000, 46, 183–189.
23 G. Giannone, B. J. Dubin-Thaler, O. Rossier, Y. Cai, O. Chaga,G. Jiang, W. Beaver, H. G. Dobereiner, Y. Freund, G. Borisyand M. P. Sheetz, Cell, 2007, 128, 561–575.
24 M. Abercrombie and J. E. Heaysman, Exp. Cell Res., 1953, 5,111–131.
25 M. Abercrombie, J. E. Heaysman and S. M. Pegrum, Exp. CellRes., 1970, 59, 393–398.
26 S. Munevar, Y. L. Wang and M. Dembo, Mol. Biol. Cell, 2001,12, 3947–3954.
27 P. K. Mattila and P. Lappalainen, Nat. Rev. Mol. Cell Biol.,2008, 9, 446–454.
28 T. D. Pollard and G. G. Borisy, Cell, 2003, 112, 453–465.29 T. Lai and K.-H. Chiam, Phys. Rev. E: Stat., Nonlinear, Soft
Matter Phys., 2011, 84, 061907.30 R. J. Pelham and Y. L. Wang, Proc. Natl. Acad. Sci. U. S. A.,
1997, 94, 13661–13665.31 M. Dembo and Y.-L. Wang, Biophys. J., 1999, 76, 2307–2316.32 C. M. Lo, H. B. Wang, M. Dembo and Y.-L. Wang, Biophys. J.,
2000, 79, 144–152.33 A. K. Yip, K. Iwasaki, C. Ursekar, H. Machiyama, M. Saxena,
H. Chen, I. Harada, K.-H. Chiam and Y. Sawada, Biophys. J.,2013, 104, 19–29.
34 J. P. Califano and C. A. Reinhart-King, Cell. Mol. Bioeng.,2010, 3, 68–75.
35 H. Kress, J. Park, C. O. Mejean, J. D. Forster, J. Park,S. S. Walse, Y. Zhang, D. Wu, O. D. Weiner, T. M. Fahmyand E. R. Dufresne, Nat. Methods, 2009, 6, 905.
36 A. Diz-Munoz, M. Krieg, M. Bergert, I. Ibarlucea-Benitez,D. J. Muller, E. Paluch and C. P. Heisenberg, PLoS Biol.,2010, 8, e1000544.
37 J. Riedl, A. H. Crevenn, K. Kessenbrock, J. H. Yu, D. Neukirchen,M. Bista, F. Bradke, D. Jenne, T. A. Holak, Z. Werb, M. Sixt andR. Wedlich-Soldner, Nat. Methods, 2008, 5, 605–607.
38 M. Le Berre, J. Aubertin and M. Piel, Integr. Biol., 2012, 4,1406–1414.
39 K. M. Stroka and H. Aranda-Espinoza, Cell Motil. Cytoskeleton,2009, 66, 328–341.
40 M. H. Zaman, L. M. Trapani, A. L. Sieminski, D. MacKellar,H. Gong, R. D. Kamm, A. Wells, D. A. Lauffenburger andP. Matsudaira, Proc. Natl. Acad. Sci. U. S. A., 2006, 103, 10889–10894.
41 S. R. Peyton and A. J. Putnam, J. Cell. Physiol., 2005, 204, 198–209.42 P. W. Oakes, D. C. Patel, N. A. Morin, D. P. Zitterbart,
B. Fabry, J. S. Reichner and J. X. Tang, Blood, 2009, 114,1387–1395.
Integrative Biology Paper
Publ
ishe
d on
27
May
201
5. D
ownl
oade
d by
Nan
yang
Tec
hnol
ogic
al U
nive
rsity
on
12/1
1/20
15 0
3:58
:39.
View Article Online
This journal is©The Royal Society of Chemistry 2015 Integr. Biol., 2015, 7, 1196--1211 | 1211
43 M. P. Stewart, J. Helenius, Y. Toyoda, S. P. Ramanathan,D. J. Muller and A. A. Hyman, Nature, 2011, 469,226–230.
44 S. A. Maskarinec, C. Franck, D. A. Tirell and G. Ravichandran,Proc. Natl. Acad. Sci. U. S. A., 2009, 106, 22108–22113.
45 K. A. Beningo, K. Hamao, M. Dembo, Y. Wang andH. Hosoya, Arch. Biochem. Biophys., 2006, 456, 224–231.
46 J. Jacobelli, F. C. Bennett, P. Pandurangi, A. J. Tooley andM. F. Krummel, J. Immunol., 2009, 182, 2041–2050.
47 F. Y. Lim, Y. L. Koon and K.-H. Chiam, Comput. MethodBiomec., 2013, 1–12.
48 F. Y. Lim, K.-H. Chiam and L. Mahadevan, Europhys. Lett.,2012, 100, 28004.
49 A. Lorentzen, J. Bamber, A. Sadok, I. Elson-Schwab andC. J. Marshall, J. Cell Sci., 2010, 124, 1256–1267.
50 G. T. Charras, M. Coughlin, T. J. Mitchison andL. Mahadevan, Biophys. J., 2008, 94, 1836–1853.
51 B. Wu, J. Li, D. Huang, W. Wang, Y. Chen, Y. Liao, X. Tang,H. Xie and F. Tang, BMC Cancer, 2011, 11, 527.
52 U. S. Schwarz and S. A. Safran, Rev. Mod. Phys., 2013, 85,1327–1381.
53 C. Franck, S. A. Maskarinec, D. A. Tirrell and G. Ravichandran,PLoS One, 2011, 6, e17833.
54 T. M. Koch, S. Munster, N. Bonakdar, J. P. Butler andB. Fabry, PLoS One, 2012, 7, e33476.
55 S. S. Hur, Y. Zhao, Y.-S. Li, E. Botvinick and S. Chien, Cell.Mol. Bioeng., 2009, 2, 425–436.
56 W. R. Legant, J. S. Miller, B. L. Blakely, D. M. Cohen,G. M. Genin and C. S. Chen, Nat. Methods, 2010, 7, 969–973.
57 W. R. Legant, C. K. Choi, J. S. Miller, L. Shao, L. Gao, E. Betzigand C. S. Chen, Proc. Natl. Acad. Sci. U. S. A., 2013, 110, 881–886.
58 W. H. Guo, M. T. Frey, N. A. Burnham and Y.-L. Wang,Biophys. J., 2006, 90, 2213–2220.
59 M. Prager-Khoutorsky, A. Lichtenstein, R. Krishnan,K. Rajendran, A. Mayo, Z. Kam, B. Geiger andA. D. Bershadsky, Nat. Cell Biol., 2011, 13, 1457–1466.
60 S. P. Palecek, J. C. Loftus, M. H. Ginsberg, D. A. Lauffenburgerand A. F. Horwitz, Nature, 1997, 385, 537–540.
61 R. A. Jannat, M. Dembo and D. A. Hammer, J. Phys.:Condens. Matter, 2010, 22, 194117.
62 M. Bergert, S. D. Chandradoss, R. A. Desai and E. Paluch,Proc. Natl. Acad. Sci. U. S. A., 2012, 109, 14434–14439.
63 B. Geiger, J. P. Spatz and A. D. Bershadsky, Mol. Cell. Biol.,2009, 10, 21–33.
64 C. Khanna, J. Khan, P. Nguyen, J. Prehn, J. Caylor, C. Yeung,J. Trepel, P. Meltzer and L. Helman, Cancer Res., 2001, 61,3750–3759.
65 Y. Yu, J. Khan, C. Khanna, L. Helman, P. S. Meltzer andG. Merlino, Nat. Med., 2004, 10, 175–181.
66 B. E. Elliott, J. A. Meens, S. K. SenGupta, D. Louvard andM. Arpin, Breast Cancer Res., 2005, 7, R365–R373.
67 Y. Meng, Z. Lu, S. Yu, Q. Zhang, Y. Ma and J. Chen, J. Transl.Med., 2010, 8, 61.
68 A. Gautreau, P. Poullet, D. Louvard and M. Arpin, Proc. Natl.Acad. Sci. U. S. A., 1999, 96, 7300–7305.
69 C. W. Wei, C. C. A. Hu, C. H. A. Tang, M. C. Lee andJ. J. Wang, FEBS Lett., 2002, 531, 421–426.
70 S. J. Martin, J. G. Bradley and T. G. Cotter, Clin. Exp.Immunol., 1990, 79, 448–453.
71 F. Gieseler, P. Meyer, D. Schiffmann and K. Wilms, Blut,1989, 58, 159–163.
72 J. L. Tan, J. Tien, D. M. Pirone, D. S. Gray, K. Bhadriraju andC. S. Chen, Proc. Natl. Acad. Sci. U. S. A., 2002, 100,1484–1489.
73 K. Wong, O. Pertz, K. Hahn and H. Bourne, Proc. Natl. Acad.Sci. U. S. A., 2006, 103, 3639–3644.
74 N. Otsu, IEEE T. Syst. Man Cyb., 1979, 9, 62–66.75 J. C. Crocker and E. R. Weeks, Particle tracking using IDL,
Online, http://www.physics.emory.edu/Bweeks/idl/, accessedMarch 2008.
76 C. Franck, S. Hong, S. A. Maskarinec, D. A. Tirell andG. Ravichandran, Exp. Mech., 2007, 47, 427–438.
Paper Integrative Biology
Publ
ishe
d on
27
May
201
5. D
ownl
oade
d by
Nan
yang
Tec
hnol
ogic
al U
nive
rsity
on
12/1
1/20
15 0
3:58
:39.
View Article Online