Embed Size (px)
Citation preview
DOI: 10.1002/cphc.201402374
Tracking Conformational Dynamics of Polypeptides byNonlinear Electronic Spectroscopy of Aromatic Residues: AFirst-Principles Simulation StudyArtur Nenov,*[a] Silvio a Beccara,[d] Ivan Rivalta,[c] Giulio Cerullo,[e] Shaul Mukamel,*[b] andMarco Garavelli*[a, c]
1. Introduction
Proteins are complex systems, the functions of which includeligand binding, enzymatic reactivity, and allosteric signalingthat are regulated by their thermal fluctuations. The characteri-zation of the dynamic properties is, therefore, fundamental forunderstanding protein function and for numerous applicationssuch as rational drug design and protein engineering. Two-di-mensional (2D) optical spectroscopy using ultrashort laserpulses[1–3] can be used to investigate dynamics in complex bio-logical systems with high temporal and spectral resolution. Ex-tending the technique to electronic transitions in the ultravio-
let (UV) spectral regime (2D UV) has only been achieved recent-ly.[4–8] In particular, the p–p* transitions of protein residues witharomatic side chains [phenylalanine (Phe), tyrosine (Tyr), andtryptophan (Trp)] generate signals in the near-UV (NUV) range(250–300 nm),[9] thus providing native local probes for trackingprotein dynamics in solution with femtosecond time resolu-tion. 2D UV electronic spectroscopy can target the p–p* transi-tions of aromatic residues in oligopeptides and proteins with-out isotopic labeling. We have recently shown how 2D elec-tronic spectra in the NUV distinguish between two differentconfigurations of a model peptide, that is, Cys-Tyr-Phe-Cys(CYFC, in which Cys = cysteine, Figure 1), with distant and vici-nal aromatic side chains.[10] Although our earlier simulations of2D spectra in solution have clearly indicated that 2D UV spec-troscopy is able to distinguish between a folded (cyclic peptidewith a disulfide bridge; Figure 1, Structure I) and an unfolded(open peptide with broken disulfide bridge; Figure 1, Structur-e III) structure of the small oligopeptide, the capacity of thistechnique to resolve aromatic interactions during the dynamicsof a folding/unfolding process remains unexplored. In thisstudy, we investigated the sensitivity of 2D UV spectroscopy toaromatic interactions in proteins by following the unfolding/unstacking of the cyclic CYFC tetrapeptide by using simula-tions based on the dominant reaction pathway (DRP) ap-proach.[11–13] The DRP allows for an efficient exploration of thereactive path space and offers a variational basis for the deter-mination of the most probable pathway in the unbiased dy-namics. Simulations of linear absorption (LA) and time-resolvednonlinear spectroscopy are used to correlate the relative posi-
The ability of nonlinear electronic spectroscopy to track fold-ing/unfolding processes of proteins in solution by monitoringaromatic interactions is investigated by first-principles simula-tions of two-dimensional (2D) electronic spectra of a modelpeptide. A dominant reaction pathway approach is employedto determine the unfolding pathway of a tetrapeptide, whichconnects the initial folded configuration with stacked aromaticside chains and the final unfolded state with distant noninter-acting aromatic residues. The p-stacking and excitonic cou-pling effects are included through ab initio simulations basedon multiconfigurational methods within a hybrid quantum me-chanics/molecular mechanics scheme. It is shown that linear
absorption spectroscopy in the ultraviolet (UV) region isunable to resolve the unstacking dynamics characterized bythe three-step process: T-shaped!twisted offset stacking!unstacking. Conversely, pump–probe spectroscopy can beused to resolve aromatic interactions by probing in the visibleregion, the excited-state absorptions (ESAs) that involvecharge-transfer states. 2D UV spectroscopy offers the highestsensitivity to the unfolding process, by providing the disentan-glement of ESA signals belonging to different aromatic chro-mophores and high correlation between the conformationaldynamics and the quartic splitting.
[a] Dr. A. Nenov, Prof. M. GaravelliDipartimento di Chimica “G. Ciamician”Universit� di Bologna, V. F. Selmi 2, 40126 Bologna (Italy)E-mail : [email protected]
[b] Prof. S. MukamelDepartment of ChemistryUniversity of California, Irvine, California 92697-2025 (USA)E-mail : [email protected]
[c] Dr. I. Rivalta, Prof. M. GaravelliLaboratoire de Chimie�cole Normale Sup�rieure de Lyon46 All�e d’Italie, 69364 Lyon Cedex 07 (France)
[d] Dr. S. a BeccaraInterdisciplinary Laboratory for Computational ScienceFBK-CMM and University of Trento, 38123 Trento (Italy)
[e] Prof. G. CerulloIFN-CNR, Dipartimento di FisicaPolitecnico di Milano, Piazza L. da Vinci 32, 20133 Milano (Italy)
Supporting Information for this article is available on the WWW underhttp://dx.doi.org/10.1002/cphc.201402374.
� 2014 Wiley-VCH Verlag GmbH & Co. KGaA, Weinheim ChemPhysChem 2014, 15, 1 – 10 1
These are not the final page numbers! ��
CHEMPHYSCHEMARTICLES
tions of the aromatic side chains of Tyr (Y) and Phe (F) aminoacids during the unfolding process with the correspondingelectronic spectra. The electronic spectra were obtained byusing our sum-over-states and quantum mechanics/molecularmechanics (SOS//QM/MM) method,[14] which combinesa hybrid QM/MM scheme based on a wavefunction methodthat explicitly accounts for environmental effects and inter-chromophore coupling with nonlinear response theory. Thisapproach allows one to characterize the solvent effect and todirectly associate the time-dependent fluctuations of the elec-tronic spectra with the atomistic details of the conformationalchanges occurring during the unfolding process. The capabilityof ultrafast electronic spectroscopy to follow folding/unfoldingprocesses of proteins in solution is demonstrated.
Methodology
The time-dependent spectroscopic signals were obtained usingour recently developed SOS//QM/MM[14] protocol, which consists ofthe following steps: 1) configurational space sampling using mo-lecular dynamics simulations, 2) snapshot selection, 3) refinementof the selected geometries at mixed QM/MM level, 4) calculation ofexcitation energies and transition dipole moments (TDMs), and5) generation of linear and nonlinear electronic spectra. The appli-cation of the individual steps to CYFC is discussed below.
Molecular Dynamics Simulations and Snapshot Selection
Trajectories for the folded to unfolded transition were generatedaccording to the DRP approach.[11–13] The reaction pathway con-necting given initial and final molecular configurations Xi and Xf ischosen by maximizing the Onsager–Machlup functional SOM, whichcan be shown to be proportional to the probability of the pathway[Eq. (1)]:
SOM X; t½ � ¼Z
t
odtX
Nm
i¼1
b
4 gimi½mi€xi þmigi _xi þriUðXÞ�2 ð1Þ
in which b= (kBT)�1, X = (xi … xN) is the configuration vector of theN-atom molecule, U(X) is the molecular potential energy, and mi
and gi are the mass and friction constant of the i-th atom. Thisfunctional strictly applies to systems treated in the implicit solventapproximation. In the present work a generalization of the ap-proach described in Ref. [13] to explicit solvent was used. Detailsare available in the Supporting Information.
The initial Xi and the final Xf geometries were obtained as theglobal minima of 50 ns classical molecular dynamics simulations ofthe folded cyclic (i.e. with a�S�S� bond) CYFC with a T-shaped ar-rangement of the aromatic side chains (Figure 1, structure I) andthe unfolded (i.e. with saturated S atoms) CYFC with distant nonin-teracting aromatic residues (Figure 1, structure III), as described inRef. [10]. We assume that the unfolding is initiated by the photoin-duced cleavage of the �S�S� bond.[15] Multiscale simulations byNieber et al.[16] indicate that ultrafast intramolecular recombinationin the sub-picosecond range[17] may be the dominant path in solu-tion, which would prevent the unfolding. On the other hand, suc-cessfully dissociated S�S bonds can participate in intermolecularH transfer with the solvent,[16] which would facilitate the unfold-ing.[15] In this work we assume that both sulfur radicals are immedi-ately saturated by hydrogen atoms from the water molecules intheir close vicinity and the saturation is fast compared with the un-folding/unstacking dynamics. To achieve this we broke the disul-fide bond in the folded CYFC geometry and saturated the sulfuratoms with hydrogen atoms. Subsequently, a loose geometry relax-ation at the molecular dynamics level was conducted to reducethe repulsion between the sulfhydrylic groups. This geometry wasthen used as initial molecular configuration Xi. It must be pointedout, though, that intramolecular recombination of the sulfur radi-cals will aggravate the spectroscopic detection of the unstacking/unfolding. Fingerprint signals of the T-shaped CYFC coming fromrecombined (i.e. still folded) species will obscure the unfolding.
To find the optimal pathway, an ensemble of trajectories compati-ble with the boundary conditions is generated by means of ratch-et-and-pawl biased molecular dynamics (rMD).[18] By using the rMDalgorithm we produced an ensemble of 48 trial unfolding trajecto-ries. The least-action condition was then used to select a single un-folding pathway. Thirty-one snapshots were extracted out of theunfolding pathway covering the dynamics up to an interchromo-phore separation of 8.5 �. We note that due to the nature of theDRP the time interval between consecutive snapshots is notknown.
QM/MM Refinement
A two-step QM/MM refinement was performed with our softwarepackage Cobramm:[19] an initial Hartree–Fock energy minimizationrun for 30 steps was followed by a complete active space self-con-sistent field (CASSCF)[20] minimization. An active space of eightelectrons and eight orbitals (i.e. CAS(8,8)) was selected for theCASSCF optimization. The software MOLPRO 2010[21] was employedthrough an interface with Cobramm. The 6-31G* basis set[22] wasused for the optimizations. Electrostatic QM/MM interactions weretreated through an electrostatic embedding scheme. The link-atomtechnique and redistribution of residual charges among nearestneighbors were used[23] with both aromatic side chains included inthe QM layer and the remaining atoms treated classically. The H-atom link was located along the Ca�Cb bond axis of the aromaticside chains. To preserve the intrinsic conformation of each snap-shot, the peptide backbone and the solvent were kept frozenduring optimization. Only the water molecules involved in hydro-gen bonds with the hydroxyl group of the phenol were allowed to
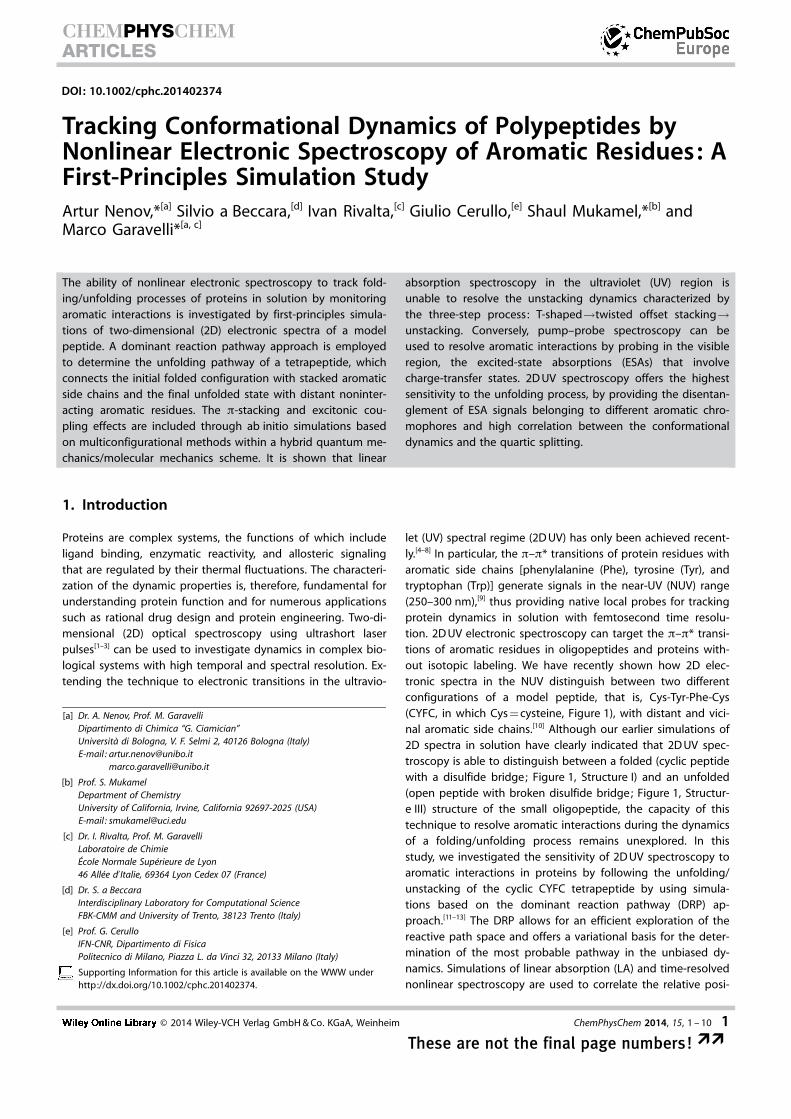
Figure 1. Conformational dynamics of CYFC: after the photoinduced cleav-age of the disulfide bond, the sulfur radicals get saturated on an ultrashorttimescale. Subsequently, the peptide unfolds. The simultaneous unstackingof the aromatic side chains of Tyr and Phe is probed with different spectro-scopic techniques. The color image is in the Supporting Information.
� 2014 Wiley-VCH Verlag GmbH & Co. KGaA, Weinheim ChemPhysChem 0000, 00, 1 – 10 &2&
These are not the final page numbers! ��
CHEMPHYSCHEMARTICLES www.chemphyschem.org
move. The suitability of the QM/MM refinement for capturing theinstantaneous conformation coded in each snapshot is discussedin the Results section.
Excited-State Calculations
Excited-state calculations of the refined snapshots were performedwith Molcas 7.7[24] at the state-averaged (SA)-CASSCF level includ-ing all valence p electrons and p orbitals of both chromophores inthe active space (i.e. CAS(14,13)). The generally contracted ANO-Lbasis set was utilized[25] and the following contraction scheme wasadopted: C,O/[3s2p1d] and H/[2s1p]. Subsequent energy refine-ment was done perturbationally with the multiconfigurationalcounterpart of the Møller–Plesset method, denoted as CASPT2,[26]
in its single-state (SS) version. An imaginary shift of 0.2 wasused.[27] An ionization potential–electron affinity (IPEA) shift[28] of0.0 was found to give better agreement with experimental datathan the default value of 0.25.[10] A set of 13 extravalence orbitalswith higher angular momentum (six p* orbitals in benzene, sevenp* orbitals in phenol) were localized among the virtual orbitalsthrough a procedure described elsewhere[10] and discarded in theperturbation treatment. This approach was found to reproduce ex-perimental data for valence transitions and was also validatedagainst state-of-the-art calculations for benzene and phenol.[10] Sev-enty states were included in the state-averaging procedure. Thenumber of roots was chosen to include excitations that, uponCASPT2 correction, lie in the energy ranges reported in the elec-tronic spectra. Only states with significant TDM magnitude wereselected for the CASPT2 correction, and the threshold was set to0.03 a.u. This is possible as TDMs are calculated at the CASSCFlevel. The preselection reduced by half the number of states towhich CASPT2 was applied. The MM part of each snapshot wastreated as external point charges in both CASSCF and CASPT2 cal-culations. The Cholesky decomposition approximation was used tospeed up the calculation of two-electron integrals.[24]
Electronic Spectroscopy
Using the computed SS-CASPT2 energies and the SA-CASSCFTDMs, LA spectra, pump–probe (PP) spectra, and quasi-absorptive2D UV spectra were computed for each snapshot by the SOS ap-proach[29] in the dipole approximation with Spectron 2.7.[30] The ex-perimental setups for PP and 2D UV spectroscopy use three pulseswith wavevectors k1, k2, and k3 and a local oscillator kLO. Herein, wereport quasi-absorptive spectra obtained by summing signals re-corded for the rephasing kI (kLO =�k1 + k2 + k3) and non-rephasingkII (kLO = + k1�k2 + k3) conditions.[30–32] This can be achieved experi-mentally through the partially collinear PP setup with two collinearpump pulses and a noncollinear self-heterodyne probe pulse (i.e.k1 = k2 and kLO = k3). A constant line broadening of 200 cm�1 isused throughout. All calculated signals use the nonchiral xxxxpulse polarization configurations and are plotted on a logarithmicscale. Ground-state bleaching (GSB) and stimulated emission (SE)contributions appear as negative (white) peaks, and excited-stateabsorptions (ESAs) appear as positive (black) peaks in the 2D spec-tra. A compendium on LA, PP, and 2D UV spectroscopies is provid-ed in the Supporting Information.
2. Results and Discussion
2.1. Analysis of the Unfolding Pathway
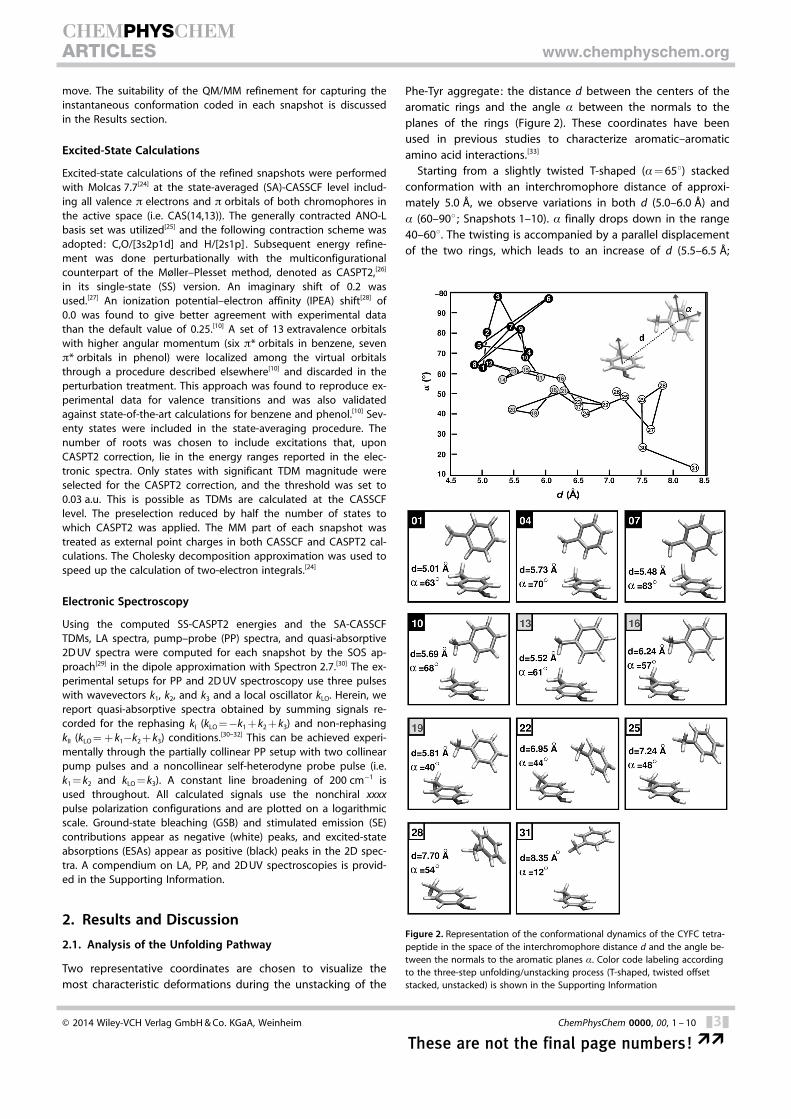
Two representative coordinates are chosen to visualize themost characteristic deformations during the unstacking of the
Phe-Tyr aggregate: the distance d between the centers of thearomatic rings and the angle a between the normals to theplanes of the rings (Figure 2). These coordinates have beenused in previous studies to characterize aromatic–aromaticamino acid interactions.[33]
Starting from a slightly twisted T-shaped (a= 658) stackedconformation with an interchromophore distance of approxi-mately 5.0 �, we observe variations in both d (5.0–6.0 �) anda (60–908 ; Snapshots 1–10). a finally drops down in the range40–608. The twisting is accompanied by a parallel displacementof the two rings, which leads to an increase of d (5.5–6.5 �;
Figure 2. Representation of the conformational dynamics of the CYFC tetra-peptide in the space of the interchromophore distance d and the angle be-tween the normals to the aromatic planes a. Color code labeling accordingto the three-step unfolding/unstacking process (T-shaped, twisted offsetstacked, unstacked) is shown in the Supporting Information
� 2014 Wiley-VCH Verlag GmbH & Co. KGaA, Weinheim ChemPhysChem 0000, 00, 1 – 10 &3&
These are not the final page numbers! ��
CHEMPHYSCHEMARTICLES www.chemphyschem.org
Snapshots 11–21). Subsequently, the rings continue to driftaway (d>6.5 �), which allows for a to decrease down to ap-proximately 08 (Snapshots 22–31). Eventually, the rings sepa-rate completely and the distance/angle correlation is lost (notshown). Thus, the unstacking dynamics can be summarized asa three-step process: T-shaped!twisted offset stacked!un-stacked. An interesting observation is the recurrence of close-contact interactions (Snapshots 5, 8, 14, and 20). It is, therefore,of particular interest to find out if our electronic spectroscopysimulations can reveal these recurrences.
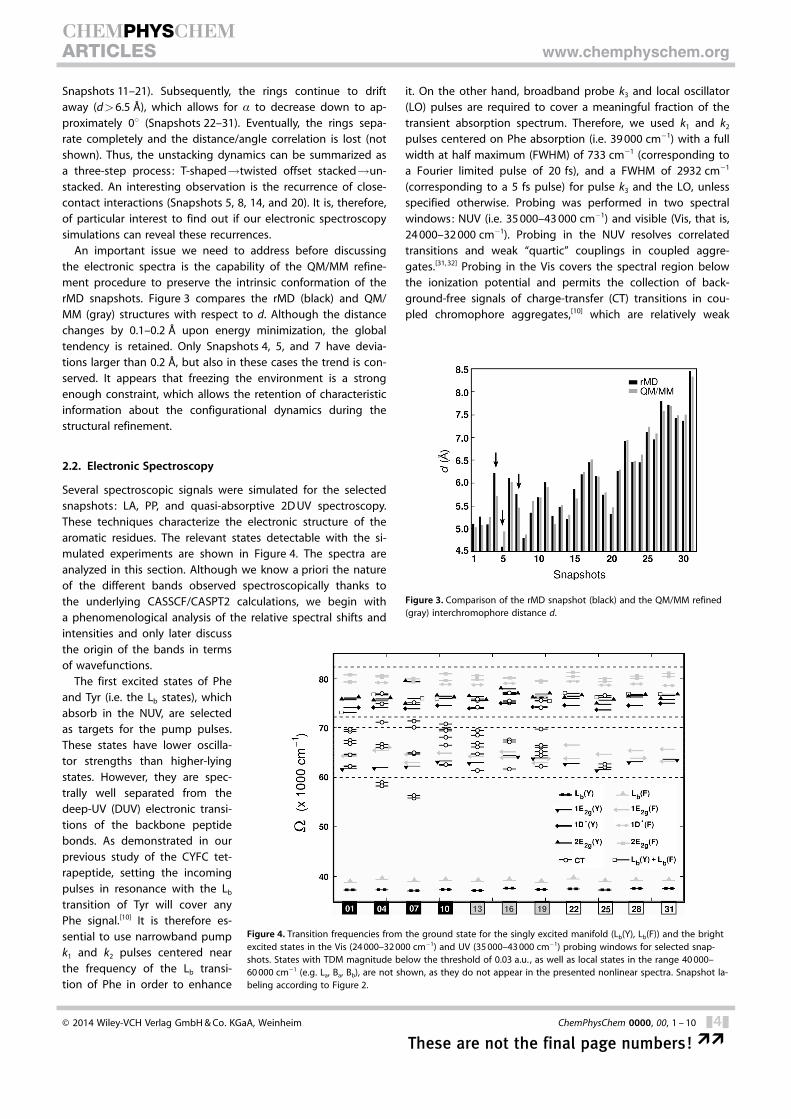
An important issue we need to address before discussingthe electronic spectra is the capability of the QM/MM refine-ment procedure to preserve the intrinsic conformation of therMD snapshots. Figure 3 compares the rMD (black) and QM/MM (gray) structures with respect to d. Although the distancechanges by 0.1–0.2 � upon energy minimization, the globaltendency is retained. Only Snapshots 4, 5, and 7 have devia-tions larger than 0.2 �, but also in these cases the trend is con-served. It appears that freezing the environment is a strongenough constraint, which allows the retention of characteristicinformation about the configurational dynamics during thestructural refinement.
2.2. Electronic Spectroscopy
Several spectroscopic signals were simulated for the selectedsnapshots: LA, PP, and quasi-absorptive 2D UV spectroscopy.These techniques characterize the electronic structure of thearomatic residues. The relevant states detectable with the si-mulated experiments are shown in Figure 4. The spectra areanalyzed in this section. Although we know a priori the natureof the different bands observed spectroscopically thanks tothe underlying CASSCF/CASPT2 calculations, we begin witha phenomenological analysis of the relative spectral shifts andintensities and only later discussthe origin of the bands in termsof wavefunctions.
The first excited states of Pheand Tyr (i.e. the Lb states), whichabsorb in the NUV, are selectedas targets for the pump pulses.These states have lower oscilla-tor strengths than higher-lyingstates. However, they are spec-trally well separated from thedeep-UV (DUV) electronic transi-tions of the backbone peptidebonds. As demonstrated in ourprevious study of the CYFC tet-rapeptide, setting the incomingpulses in resonance with the Lb
transition of Tyr will cover anyPhe signal.[10] It is therefore es-sential to use narrowband pumpk1 and k2 pulses centered nearthe frequency of the Lb transi-tion of Phe in order to enhance
it. On the other hand, broadband probe k3 and local oscillator(LO) pulses are required to cover a meaningful fraction of thetransient absorption spectrum. Therefore, we used k1 and k2
pulses centered on Phe absorption (i.e. 39 000 cm�1) with a fullwidth at half maximum (FWHM) of 733 cm�1 (corresponding toa Fourier limited pulse of 20 fs), and a FWHM of 2932 cm�1
(corresponding to a 5 fs pulse) for pulse k3 and the LO, unlessspecified otherwise. Probing was performed in two spectralwindows: NUV (i.e. 35 000–43 000 cm�1) and visible (Vis, that is,24 000–32 000 cm�1). Probing in the NUV resolves correlatedtransitions and weak “quartic” couplings in coupled aggre-gates.[31, 32] Probing in the Vis covers the spectral region belowthe ionization potential and permits the collection of back-ground-free signals of charge-transfer (CT) transitions in cou-pled chromophore aggregates,[10] which are relatively weak
Figure 3. Comparison of the rMD snapshot (black) and the QM/MM refined(gray) interchromophore distance d.
Figure 4. Transition frequencies from the ground state for the singly excited manifold (Lb(Y), Lb(F)) and the brightexcited states in the Vis (24 000–32 000 cm�1) and UV (35 000–43 000 cm�1) probing windows for selected snap-shots. States with TDM magnitude below the threshold of 0.03 a.u. , as well as local states in the range 40 000–60 000 cm�1 (e.g. La, Ba, Bb), are not shown, as they do not appear in the presented nonlinear spectra. Snapshot la-beling according to Figure 2.
� 2014 Wiley-VCH Verlag GmbH & Co. KGaA, Weinheim ChemPhysChem 0000, 00, 1 – 10 &4&
These are not the final page numbers! ��
CHEMPHYSCHEMARTICLES www.chemphyschem.org
and require regions free of the background given by intenselocal absorptions.
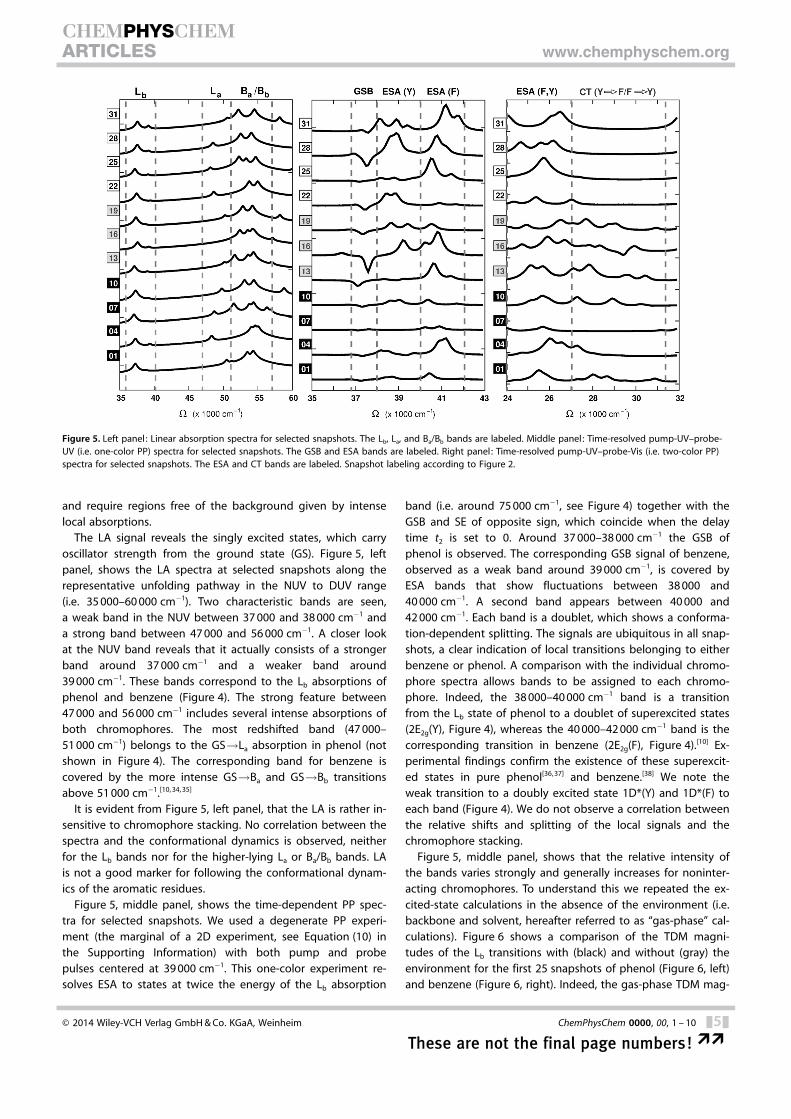
The LA signal reveals the singly excited states, which carryoscillator strength from the ground state (GS). Figure 5, leftpanel, shows the LA spectra at selected snapshots along therepresentative unfolding pathway in the NUV to DUV range(i.e. 35 000–60 000 cm�1). Two characteristic bands are seen,a weak band in the NUV between 37 000 and 38 000 cm�1 anda strong band between 47 000 and 56 000 cm�1. A closer lookat the NUV band reveals that it actually consists of a strongerband around 37 000 cm�1 and a weaker band around39 000 cm�1. These bands correspond to the Lb absorptions ofphenol and benzene (Figure 4). The strong feature between47 000 and 56 000 cm�1 includes several intense absorptions ofboth chromophores. The most redshifted band (47 000–51 000 cm�1) belongs to the GS!La absorption in phenol (notshown in Figure 4). The corresponding band for benzene iscovered by the more intense GS!Ba and GS!Bb transitionsabove 51 000 cm�1.[10, 34, 35]
It is evident from Figure 5, left panel, that the LA is rather in-sensitive to chromophore stacking. No correlation between thespectra and the conformational dynamics is observed, neitherfor the Lb bands nor for the higher-lying La or Ba/Bb bands. LAis not a good marker for following the conformational dynam-ics of the aromatic residues.
Figure 5, middle panel, shows the time-dependent PP spec-tra for selected snapshots. We used a degenerate PP experi-ment (the marginal of a 2D experiment, see Equation (10) inthe Supporting Information) with both pump and probepulses centered at 39 000 cm�1. This one-color experiment re-solves ESA to states at twice the energy of the Lb absorption
band (i.e. around 75 000 cm�1, see Figure 4) together with theGSB and SE of opposite sign, which coincide when the delaytime t2 is set to 0. Around 37 000–38 000 cm�1 the GSB ofphenol is observed. The corresponding GSB signal of benzene,observed as a weak band around 39 000 cm�1, is covered byESA bands that show fluctuations between 38 000 and40 000 cm�1. A second band appears between 40 000 and42 000 cm�1. Each band is a doublet, which shows a conforma-tion-dependent splitting. The signals are ubiquitous in all snap-shots, a clear indication of local transitions belonging to eitherbenzene or phenol. A comparison with the individual chromo-phore spectra allows bands to be assigned to each chromo-phore. Indeed, the 38 000–40 000 cm�1 band is a transitionfrom the Lb state of phenol to a doublet of superexcited states(2E2g(Y), Figure 4), whereas the 40 000–42 000 cm�1 band is thecorresponding transition in benzene (2E2g(F), Figure 4).[10] Ex-perimental findings confirm the existence of these superexcit-ed states in pure phenol[36, 37] and benzene.[38] We note theweak transition to a doubly excited state 1D*(Y) and 1D*(F) toeach band (Figure 4). We do not observe a correlation betweenthe relative shifts and splitting of the local signals and thechromophore stacking.
Figure 5, middle panel, shows that the relative intensity ofthe bands varies strongly and generally increases for noninter-acting chromophores. To understand this we repeated the ex-cited-state calculations in the absence of the environment (i.e.backbone and solvent, hereafter referred to as “gas-phase” cal-culations). Figure 6 shows a comparison of the TDM magni-tudes of the Lb transitions with (black) and without (gray) theenvironment for the first 25 snapshots of phenol (Figure 6, left)and benzene (Figure 6, right). Indeed, the gas-phase TDM mag-
Figure 5. Left panel : Linear absorption spectra for selected snapshots. The Lb, La, and Ba/Bb bands are labeled. Middle panel : Time-resolved pump-UV–probe-UV (i.e. one-color PP) spectra for selected snapshots. The GSB and ESA bands are labeled. Right panel: Time-resolved pump-UV–probe-Vis (i.e. two-color PP)spectra for selected snapshots. The ESA and CT bands are labeled. Snapshot labeling according to Figure 2.
� 2014 Wiley-VCH Verlag GmbH & Co. KGaA, Weinheim ChemPhysChem 0000, 00, 1 – 10 &5&
These are not the final page numbers! ��
CHEMPHYSCHEMARTICLES www.chemphyschem.org
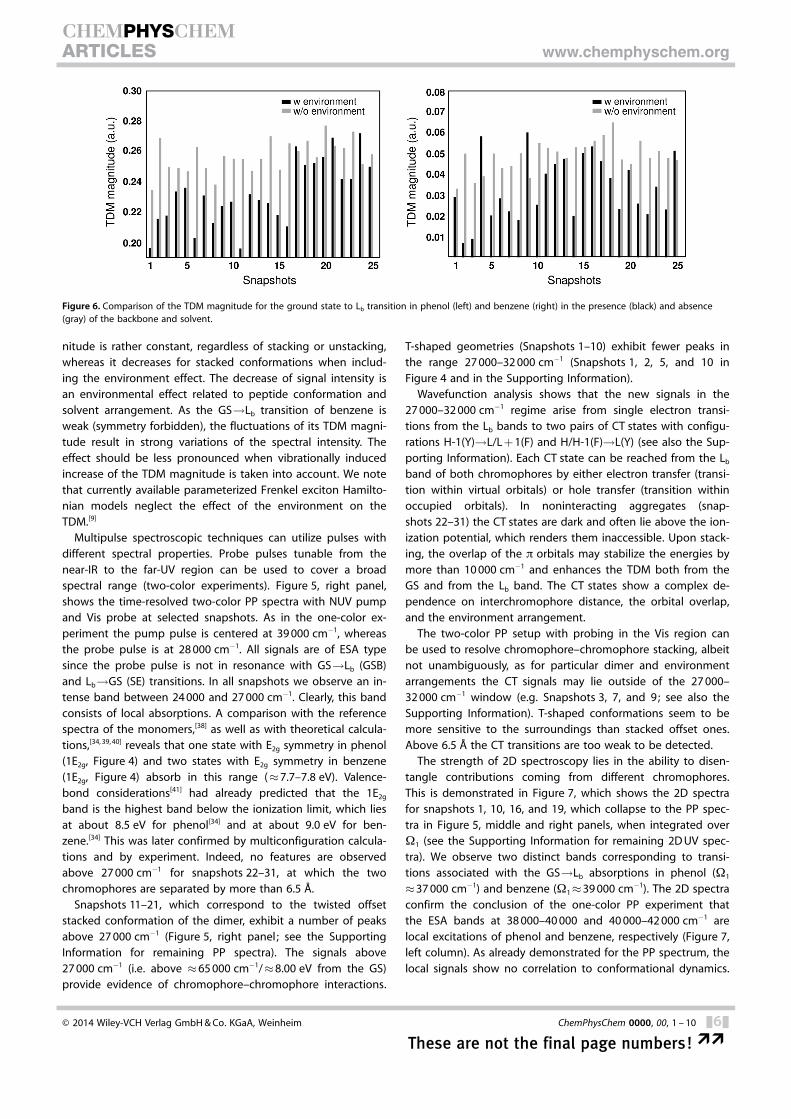
nitude is rather constant, regardless of stacking or unstacking,whereas it decreases for stacked conformations when includ-ing the environment effect. The decrease of signal intensity isan environmental effect related to peptide conformation andsolvent arrangement. As the GS!Lb transition of benzene isweak (symmetry forbidden), the fluctuations of its TDM magni-tude result in strong variations of the spectral intensity. Theeffect should be less pronounced when vibrationally inducedincrease of the TDM magnitude is taken into account. We notethat currently available parameterized Frenkel exciton Hamilto-nian models neglect the effect of the environment on theTDM.[9]
Multipulse spectroscopic techniques can utilize pulses withdifferent spectral properties. Probe pulses tunable from thenear-IR to the far-UV region can be used to cover a broadspectral range (two-color experiments). Figure 5, right panel,shows the time-resolved two-color PP spectra with NUV pumpand Vis probe at selected snapshots. As in the one-color ex-periment the pump pulse is centered at 39 000 cm�1, whereasthe probe pulse is at 28 000 cm�1. All signals are of ESA typesince the probe pulse is not in resonance with GS!Lb (GSB)and Lb!GS (SE) transitions. In all snapshots we observe an in-tense band between 24 000 and 27 000 cm�1. Clearly, this bandconsists of local absorptions. A comparison with the referencespectra of the monomers,[38] as well as with theoretical calcula-tions,[34, 39, 40] reveals that one state with E2g symmetry in phenol(1E2g, Figure 4) and two states with E2g symmetry in benzene(1E2g, Figure 4) absorb in this range (�7.7–7.8 eV). Valence-bond considerations[41] had already predicted that the 1E2g
band is the highest band below the ionization limit, which liesat about 8.5 eV for phenol[34] and at about 9.0 eV for ben-zene.[34] This was later confirmed by multiconfiguration calcula-tions and by experiment. Indeed, no features are observedabove 27 000 cm�1 for snapshots 22–31, at which the twochromophores are separated by more than 6.5 �.
Snapshots 11–21, which correspond to the twisted offsetstacked conformation of the dimer, exhibit a number of peaksabove 27 000 cm�1 (Figure 5, right panel ; see the SupportingInformation for remaining PP spectra). The signals above27 000 cm�1 (i.e. above �65 000 cm�1/�8.00 eV from the GS)provide evidence of chromophore–chromophore interactions.
T-shaped geometries (Snapshots 1–10) exhibit fewer peaks inthe range 27 000–32 000 cm�1 (Snapshots 1, 2, 5, and 10 inFigure 4 and in the Supporting Information).
Wavefunction analysis shows that the new signals in the27 000–32 000 cm�1 regime arise from single electron transi-tions from the Lb bands to two pairs of CT states with configu-rations H-1(Y)!L/L + 1(F) and H/H-1(F)!L(Y) (see also the Sup-porting Information). Each CT state can be reached from the Lb
band of both chromophores by either electron transfer (transi-tion within virtual orbitals) or hole transfer (transition withinoccupied orbitals). In noninteracting aggregates (snap-shots 22–31) the CT states are dark and often lie above the ion-ization potential, which renders them inaccessible. Upon stack-ing, the overlap of the p orbitals may stabilize the energies bymore than 10 000 cm�1 and enhances the TDM both from theGS and from the Lb band. The CT states show a complex de-pendence on interchromophore distance, the orbital overlap,and the environment arrangement.
The two-color PP setup with probing in the Vis region canbe used to resolve chromophore–chromophore stacking, albeitnot unambiguously, as for particular dimer and environmentarrangements the CT signals may lie outside of the 27 000–32 000 cm�1 window (e.g. Snapshots 3, 7, and 9; see also theSupporting Information). T-shaped conformations seem to bemore sensitive to the surroundings than stacked offset ones.Above 6.5 � the CT transitions are too weak to be detected.
The strength of 2D spectroscopy lies in the ability to disen-tangle contributions coming from different chromophores.This is demonstrated in Figure 7, which shows the 2D spectrafor snapshots 1, 10, 16, and 19, which collapse to the PP spec-tra in Figure 5, middle and right panels, when integrated overW1 (see the Supporting Information for remaining 2D UV spec-tra). We observe two distinct bands corresponding to transi-tions associated with the GS!Lb absorptions in phenol (W1
�37 000 cm�1) and benzene (W1�39 000 cm�1). The 2D spectraconfirm the conclusion of the one-color PP experiment thatthe ESA bands at 38 000–40 000 and 40 000–42 000 cm�1 arelocal excitations of phenol and benzene, respectively (Figure 7,left column). As already demonstrated for the PP spectrum, thelocal signals show no correlation to conformational dynamics.
Figure 6. Comparison of the TDM magnitude for the ground state to Lb transition in phenol (left) and benzene (right) in the presence (black) and absence(gray) of the backbone and solvent.
� 2014 Wiley-VCH Verlag GmbH & Co. KGaA, Weinheim ChemPhysChem 0000, 00, 1 – 10 &6&
These are not the final page numbers! ��
CHEMPHYSCHEMARTICLES www.chemphyschem.org
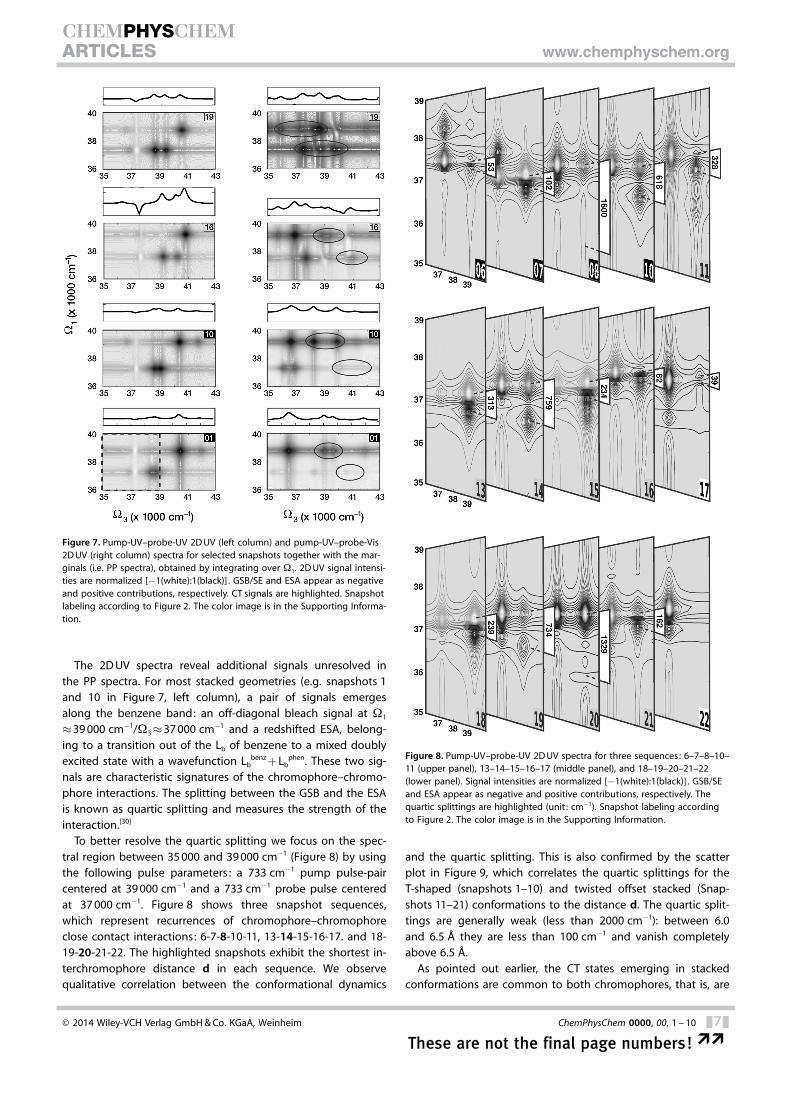
The 2D UV spectra reveal additional signals unresolved inthe PP spectra. For most stacked geometries (e.g. snapshots 1and 10 in Figure 7, left column), a pair of signals emergesalong the benzene band: an off-diagonal bleach signal at W1
�39 000 cm�1/W3�37 000 cm�1 and a redshifted ESA, belong-ing to a transition out of the Lb of benzene to a mixed doublyexcited state with a wavefunction Lb
benz + Lbphen. These two sig-
nals are characteristic signatures of the chromophore–chromo-phore interactions. The splitting between the GSB and the ESAis known as quartic splitting and measures the strength of theinteraction.[30]
To better resolve the quartic splitting we focus on the spec-tral region between 35 000 and 39 000 cm�1 (Figure 8) by usingthe following pulse parameters : a 733 cm�1 pump pulse-paircentered at 39 000 cm�1 and a 733 cm�1 probe pulse centeredat 37 000 cm�1. Figure 8 shows three snapshot sequences,which represent recurrences of chromophore–chromophoreclose contact interactions: 6-7-8-10-11, 13-14-15-16-17. and 18-19-20-21-22. The highlighted snapshots exhibit the shortest in-terchromophore distance d in each sequence. We observequalitative correlation between the conformational dynamics
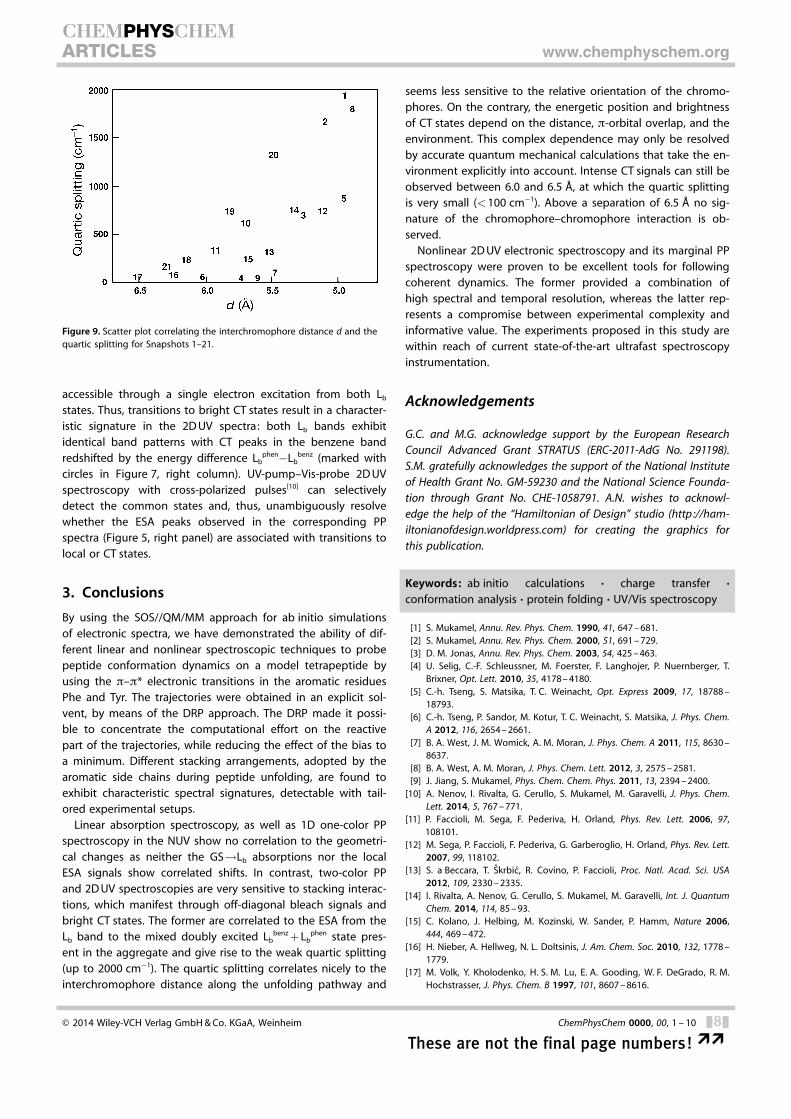
and the quartic splitting. This is also confirmed by the scatterplot in Figure 9, which correlates the quartic splittings for theT-shaped (snapshots 1–10) and twisted offset stacked (Snap-shots 11–21) conformations to the distance d. The quartic split-tings are generally weak (less than 2000 cm�1): between 6.0and 6.5 � they are less than 100 cm�1 and vanish completelyabove 6.5 �.
As pointed out earlier, the CT states emerging in stackedconformations are common to both chromophores, that is, are
Figure 7. Pump-UV–probe-UV 2D UV (left column) and pump-UV–probe-Vis2D UV (right column) spectra for selected snapshots together with the mar-ginals (i.e. PP spectra), obtained by integrating over W1. 2D UV signal intensi-ties are normalized [�1(white):1(black)] . GSB/SE and ESA appear as negativeand positive contributions, respectively. CT signals are highlighted. Snapshotlabeling according to Figure 2. The color image is in the Supporting Informa-tion.
Figure 8. Pump-UV–probe-UV 2D UV spectra for three sequences: 6–7–8–10–11 (upper panel), 13–14–15–16–17 (middle panel), and 18–19–20–21–22(lower panel). Signal intensities are normalized [�1(white):1(black)] . GSB/SEand ESA appear as negative and positive contributions, respectively. Thequartic splittings are highlighted (unit : cm�1). Snapshot labeling accordingto Figure 2. The color image is in the Supporting Information.
� 2014 Wiley-VCH Verlag GmbH & Co. KGaA, Weinheim ChemPhysChem 0000, 00, 1 – 10 &7&
These are not the final page numbers! ��
CHEMPHYSCHEMARTICLES www.chemphyschem.org
accessible through a single electron excitation from both Lb
states. Thus, transitions to bright CT states result in a character-istic signature in the 2D UV spectra: both Lb bands exhibitidentical band patterns with CT peaks in the benzene bandredshifted by the energy difference Lb
phen�Lbbenz (marked with
circles in Figure 7, right column). UV-pump–Vis-probe 2D UVspectroscopy with cross-polarized pulses[10] can selectivelydetect the common states and, thus, unambiguously resolvewhether the ESA peaks observed in the corresponding PPspectra (Figure 5, right panel) are associated with transitions tolocal or CT states.
3. Conclusions
By using the SOS//QM/MM approach for ab initio simulationsof electronic spectra, we have demonstrated the ability of dif-ferent linear and nonlinear spectroscopic techniques to probepeptide conformation dynamics on a model tetrapeptide byusing the p–p* electronic transitions in the aromatic residuesPhe and Tyr. The trajectories were obtained in an explicit sol-vent, by means of the DRP approach. The DRP made it possi-ble to concentrate the computational effort on the reactivepart of the trajectories, while reducing the effect of the bias toa minimum. Different stacking arrangements, adopted by thearomatic side chains during peptide unfolding, are found toexhibit characteristic spectral signatures, detectable with tail-ored experimental setups.
Linear absorption spectroscopy, as well as 1D one-color PPspectroscopy in the NUV show no correlation to the geometri-cal changes as neither the GS!Lb absorptions nor the localESA signals show correlated shifts. In contrast, two-color PPand 2D UV spectroscopies are very sensitive to stacking interac-tions, which manifest through off-diagonal bleach signals andbright CT states. The former are correlated to the ESA from theLb band to the mixed doubly excited Lb
benz + Lbphen state pres-
ent in the aggregate and give rise to the weak quartic splitting(up to 2000 cm�1). The quartic splitting correlates nicely to theinterchromophore distance along the unfolding pathway and
seems less sensitive to the relative orientation of the chromo-phores. On the contrary, the energetic position and brightnessof CT states depend on the distance, p-orbital overlap, and theenvironment. This complex dependence may only be resolvedby accurate quantum mechanical calculations that take the en-vironment explicitly into account. Intense CT signals can still beobserved between 6.0 and 6.5 �, at which the quartic splittingis very small (<100 cm�1). Above a separation of 6.5 � no sig-nature of the chromophore–chromophore interaction is ob-served.
Nonlinear 2D UV electronic spectroscopy and its marginal PPspectroscopy were proven to be excellent tools for followingcoherent dynamics. The former provided a combination ofhigh spectral and temporal resolution, whereas the latter rep-resents a compromise between experimental complexity andinformative value. The experiments proposed in this study arewithin reach of current state-of-the-art ultrafast spectroscopyinstrumentation.
Acknowledgements
G.C. and M.G. acknowledge support by the European ResearchCouncil Advanced Grant STRATUS (ERC-2011-AdG No. 291198).S.M. gratefully acknowledges the support of the National Instituteof Health Grant No. GM-59230 and the National Science Founda-tion through Grant No. CHE-1058791. A.N. wishes to acknowl-edge the help of the “Hamiltonian of Design” studio (http://ham-iltonianofdesign.worldpress.com) for creating the graphics forthis publication.
Keywords: ab initio calculations · charge transfer ·conformation analysis · protein folding · UV/Vis spectroscopy
[1] S. Mukamel, Annu. Rev. Phys. Chem. 1990, 41, 647 – 681.[2] S. Mukamel, Annu. Rev. Phys. Chem. 2000, 51, 691 – 729.[3] D. M. Jonas, Annu. Rev. Phys. Chem. 2003, 54, 425 – 463.[4] U. Selig, C.-F. Schleussner, M. Foerster, F. Langhojer, P. Nuernberger, T.
Brixner, Opt. Lett. 2010, 35, 4178 – 4180.[5] C.-h. Tseng, S. Matsika, T. C. Weinacht, Opt. Express 2009, 17, 18788 –
18793.[6] C.-h. Tseng, P. Sandor, M. Kotur, T. C. Weinacht, S. Matsika, J. Phys. Chem.
A 2012, 116, 2654 – 2661.[7] B. A. West, J. M. Womick, A. M. Moran, J. Phys. Chem. A 2011, 115, 8630 –
8637.[8] B. A. West, A. M. Moran, J. Phys. Chem. Lett. 2012, 3, 2575 – 2581.[9] J. Jiang, S. Mukamel, Phys. Chem. Chem. Phys. 2011, 13, 2394 – 2400.
[10] A. Nenov, I. Rivalta, G. Cerullo, S. Mukamel, M. Garavelli, J. Phys. Chem.Lett. 2014, 5, 767 – 771.
[11] P. Faccioli, M. Sega, F. Pederiva, H. Orland, Phys. Rev. Lett. 2006, 97,108101.
[12] M. Sega, P. Faccioli, F. Pederiva, G. Garberoglio, H. Orland, Phys. Rev. Lett.2007, 99, 118102.
[13] S. a Beccara, T. Skrbic, R. Covino, P. Faccioli, Proc. Natl. Acad. Sci. USA2012, 109, 2330 – 2335.
[14] I. Rivalta, A. Nenov, G. Cerullo, S. Mukamel, M. Garavelli, Int. J. QuantumChem. 2014, 114, 85 – 93.
[15] C. Kolano, J. Helbing, M. Kozinski, W. Sander, P. Hamm, Nature 2006,444, 469 – 472.
[16] H. Nieber, A. Hellweg, N. L. Doltsinis, J. Am. Chem. Soc. 2010, 132, 1778 –1779.
[17] M. Volk, Y. Kholodenko, H. S. M. Lu, E. A. Gooding, W. F. DeGrado, R. M.Hochstrasser, J. Phys. Chem. B 1997, 101, 8607 – 8616.
Figure 9. Scatter plot correlating the interchromophore distance d and thequartic splitting for Snapshots 1–21.
� 2014 Wiley-VCH Verlag GmbH & Co. KGaA, Weinheim ChemPhysChem 0000, 00, 1 – 10 &8&
These are not the final page numbers! ��
CHEMPHYSCHEMARTICLES www.chemphyschem.org
[18] C. Camilloni, R. Broglia, G. Tiana, J. Chem. Phys. 2011, 134, 045105.[19] P. Alto�, M. Stenta, A. Bottoni, M. Garavelli, Theor. Chem. Acc. 2007, 118,
219 – 240.[20] B. O. Roos, Ab Initio Methods in Quantum Chemistry: Part II, Wiley, Chi-
chester, 1987.[21] H. J. Werner, P. J. Knowles, G. Knizia, F. R. Manby, M. Schutz, Wiley Inter-
discip. Rev. Comput. Mol. Sci. 2012, 2, 242 – 253.[22] M. M. Francl, W. J. Pietro, W. J. Hehre, J. S. Binkley, D. J. DeFrees, J. A.
Pople, M. S. Gordon, J. Chem. Phys. 1982, 77, 3654 – 3665.[23] U. C. Singh, P. A. Kollman, J. Comput. Chem. 1986, 7, 718 – 730.[24] F. Aquilante, L. De Vico, N. Ferre, G. Ghigo, P. A. Malmqvist, P. Neogrady,
T. B. Pedersen, M. Pitonak, M. Reiher, B. O. Roos, L. Serrano-Andres, M.Urban, V. Veryazov, R. Lindh, J. Comput. Chem. 2010, 31, 224 – 247.
[25] P. O. Widmark, P. A. Malmqvist, B. O. Roos, Theor. Chim. Acta 1990, 77,291 – 306.
[26] K. Andersson, P. A. Malmqvist, B. O. Roos, A. J. Sadlej, K. Wolinski, J.Phys. Chem. 1990, 94, 5483 – 5488.
[27] G. Ghigo, B. O. Roos, P. A. Malmqvist, Chem. Phys. Lett. 2004, 396, 142 –149.
[28] N. Forsberg, P. A. Malmqvist, Chem. Phys. Lett. 1997, 274, 196 – 204.[29] G. H. Chen, S. Mukamel, D. Beljonne, J. L. Bredas, J. Chem. Phys. 1996,
104, 5406 – 5414.[30] D. Abramavicius, B. Palmieri, D. V. Voronine, F. Sanda, S. Mukamel, Chem.
Rev. 2009, 109, 2350 – 2408.
[31] S. Mukamel, Principles of Nonlinear Optics and Spectroscopy, Oxford Uni-versity Press, Cambridge, 1999.
[32] P. Hamm, M. Zanni, Concepts and Methods of 2D Infrared Spectroscopy,Cambridge University Press, Cambridge, 2011.
[33] R. Chelli, F. L. Gervasio, P. Procacci, V. Schettino, J. Am. Chem. Soc. 2002,124, 6133 – 6143.
[34] J. Lorentzon, P. A. Malmqvist, M. Fulscher, B. O. Roos, Theor. Chim. Acta1995, 91, 91 – 108.
[35] D. M. Rogers, J. D. Hirst, J. Phys. Chem. A 2003, 107, 11191 – 11200.[36] C. P. Schick, P. M. Weber, J. Phys. Chem. A 2001, 105, 3725 – 3734.[37] C. P. Schick, P. M. Weber, J. Phys. Chem. A 2001, 105, 3735 – 3740.[38] N. Nakashima, M. Sumitani, I. Ohmine, K. Yoshihara, J. Chem. Phys. 1980,
72, 2226 – 2230.[39] T. Hashimoto, H. Nakano, K. Hirao, J. Chem. Phys. 1996, 104, 6244 – 6258.[40] T. Hashimoto, H. Nakano, K. Hirao, J. Mol. Struct. THEOCHEM 1998, 451,
25 – 33.[41] K. Hirao, H. Nakano, K. Nakayama, M. Dupius, J. Chem. Phys. 1996, 105,
9227 – 9239.
Received: May 28, 2014
Published online on && &&, 2014
� 2014 Wiley-VCH Verlag GmbH & Co. KGaA, Weinheim ChemPhysChem 0000, 00, 1 – 10 &9&
These are not the final page numbers! ��
CHEMPHYSCHEMARTICLES www.chemphyschem.org

ARTICLES
A. Nenov,* S. a Beccara, I. Rivalta,G. Cerullo, S. Mukamel,* M. Garavelli*
&& –&&
Tracking Conformational Dynamics ofPolypeptides by Nonlinear ElectronicSpectroscopy of Aromatic Residues: AFirst-Principles Simulation Study
On the right track: A quantum me-chanics/molecular mechanics approach,coupled to the dominant reaction path-way dynamics method, is used to re-solve aromatic interactions during pro-tein folding/unfolding by means of sim-ulations of nonlinear electronic spectraof a model system. Quartic splittings,which correlate to the interchromo-phore distance, are resolved.
� 2014 Wiley-VCH Verlag GmbH & Co. KGaA, Weinheim ChemPhysChem 0000, 00, 1 – 10 &10&
These are not the final page numbers! ��