Embed Size (px)
Citation preview
Water SA 47(4) 446–455 / Oct 2021https://doi.org/10.17159/wsa/2021.v47.i4.3851
Research paper
ISSN (online) 1816-7950 Available on website https://www.watersa.net
446
CORRESPONDENCEArtwell Kanda
DATESReceived: 8 September 2020Accepted: 15 October 2021
KEYWORDSgroundwaterhand-dug wellshealth riskmine tailingstrace element
COPYRIGHT© The Author(s)Published under a Creative Commons Attribution 4.0 International Licence (CC BY 4.0)
Groundwater from shallow hand-dug wells at an abandoned gold mine tailings dam was characterised for selected physicochemical parameters during dry and wet seasons of 2018 and 2019. Health risk exposure of the local population (adults and children) through ingestion and dermal exposure was assessed. Groundwater quality parameters were lower than international drinking water quality guidelines (p < 0.05). The parameters were significantly influenced by season of the year (As, Cl−, SO4
2−), nature (As, Cd, Cl−, Fe, NO3−, SO4
2−), depth (Cd, Cl−, Fe, Ni, SO4
2−) and direction of the well (Cu, Cl−, Fe, NO3−, Pb, SO4
2−) (p < 0.05) relative to the tailings dam. Groundwater did not pose non-carcinogenic risk due to studied trace elements. However, arsenic had the potential to cause medium to high cancer risk to the local population. We propose re-vegetation of the tailings dam, diversion of surface tailings drainage to a containment pond and the provision of continuous piped water supplies.
Trace elements in groundwater near an abandoned mine tailings dam and health risk assessment (NE Zimbabwe)Artwell Kanda1 , France Ncube2 and Peter Makumbe3
1Department of Environmental Science, Bindura University of Science Education, P. Bag 1020, Bindura, Zimbabwe2Department of Crop and Soil Sciences, Lupane State University, PO Box 170 Lupane, Zimbabwe3Sustainability Research Unit, Nelson Mandela University, George Campus, Madiba Drive, 6531, George, South Africa
INTRODUCTION
Groundwater is of excellent natural quality and conveniently available close to where it is required (Sujatha and Reddy, 2003). However, it is threatened by over-exploitation and pollution (Carrard et al., 2019). Groundwater quality is influenced by geogenic and anthropogenic processes (Javaid et al., 2020). It is naturally found in association with geologic minerals containing dissolved salts (Chacha et al., 2018). Human activities such as mining introduce contaminants into groundwater (Zhu et al., 2020).
Metalliferous mineral exploration and beneficiation leave behind large heaps of overburden material, waste rock and tailings rich in potentially toxic elements (PTEs) (Kiventerä et al., 2018). The nature of the PTEs in the waste streams depends on the mineralogy of the ore body and mineral recovery processes. Gold is naturally found mixed with varying proportions of other elements including Ag, As, Cu, Fe, Pb, S and Zn (Fomchenko and Muravyov, 2020), which eventually constitute mine tailings after extractive processes (Gitari et al., 2017). PTEs from mine tailings dams (MTDs) can be transported into the environment through runoff or by atmospheric dispersal. They can leach into groundwater as surface recharge. In the environment PTEs impact on the quality of air, water, soil and plants (Mohapatra and Kirpalani, 2017).
The establishment of human settlements without matching infrastructural development for water supply and wastewater treatment facilities, a seemingly common practice in small towns of low-income settings, leaves people exploiting groundwater from shallow hand-dug wells (SHDWs) for potable use, and using make-shift sanitation facilities. The quality of groundwater from SHDWs is influenced by season of the year (Ganiyu et al., 2018), depth to water level (Chuang et al., 2019) and distance (Yan et al., 2017) relative to the source of contamination. Groundwater near mine sites was reported to be contaminated with PTEs (Kim et al., 2017; Singh and Kamal, 2017; Akoto et al., 2019). Reported MTD failures (Kossoff et al., 2014; Armstrong et al., 2019) demonstrate the importance of carefully planned post-mining waste management, and the associated public health effects.
The local population that relies on groundwater from SHDWs may be exposed to PTEs through dermal contact and oral routes. Human health problems associated with exposure to As, Cd, Ni and Pb include damage to body organs and systems, and cancer (Wuana and Okieimen, 2011; Jaishankar et al., 2014). Therefore, an understanding of the variation of groundwater quality in developing settlements near abandoned mine sites without centralised water supply systems is critical to public health.
Studies on groundwater quality in Zimbabwe appear focused on peri-urban and urban informal settlements (e.g., Ndoziya et al., 2019; Zingoni et al., 2005). No local studies were done to assess the quality of groundwater near abandoned mine sites and the associated potential human health risk to PTEs. Further, there are no published cases of ill-health associated with exposure to PTEs retraced to mine wastes for the local population. This is against a background where groundwater for potable use is rarely treated and monitoring boreholes (usually > 40 m deep) placed at active mine sites are not used for monitoring groundwater quality after mine operations have ceased.
In the current work we report an investigation of the potential contamination of groundwater from SHDWs near an abandoned gold MTD and the associated human health risks to PTEs by dermal

447Water SA 47(4) 446–455 / Oct 2021https://doi.org/10.17159/wsa/2021.v47.i4.3851
and oral exposure. The selected groundwater quality parameters assessed are those normally used in similar studies, naturally associated with gold ores and tailings, or have significant health effects. It was assumed that (i) groundwater from SHDWs had higher concentrations of PTEs than international drinking water quality guidelines, and (ii) the local population living near the MTD was at health risk due to PTEs in groundwater by oral and dermal exposure.
METHODS AND MATERIALS
Description of the study site
The study area was previously described (Kanda et al., 2019). Bindura town is found 60 km within the greenstone zone of the geology of Zimbabwe in the vicinity of the Great Dyke. The greenstone contains Fe, Au, Ni and Cu (Locmelis et al., 2010). The RAN ore channels consist of granodiorite stock that intrudes meta-sediments of the Mazowe formation (Shamvanian Group)
constituting mainly quartz and plagioclase feldspar with biotite and actinolite (Kalbskopf, 2002). Gold mining operations in Bindura began in the early 1900s (RAN mine, Freda Rebecca) and nickel mining in mid-1900 (Trojan Nickel Mine). RAN mine was commissioned in 1921 and operated for 77 years. It was decommissioned without rehabilitation. The MTD (17°18’05’’S; 31°19’49’’E) is located less than 30 m from newly established human settlements (Fig. 1).
The stability of the MTD is threatened by the development of gullies due to runoff exacerbated by illegal mineral exploration activities (Fig. 2d). Tailings are eroded from bare embankments by easterly winds in dry weather (Fig. 2b) towards human settlements and a primary school. In wet weather, runoff transports eroded tailings (Fig. 2a) into the ambient environment. The toe of the MTD is not designed to receive tailings drainage and channel it away. Surface runoff from elsewhere combines with that originating from the MTD and is transported downslope to a wetland.
Figure 1. Map of the study area showing the tailings dam and sampling sites
Figure 2. Authors’ photographs showing (a) surface runoff and (b) wind erosion during wet and dry seasons, and (c) developing human settlements using (d) shallow hand-dug wells at the abandoned RAN mine tailings dam
448Water SA 47(4) 446–455 / Oct 2021https://doi.org/10.17159/wsa/2021.v47.i4.3851
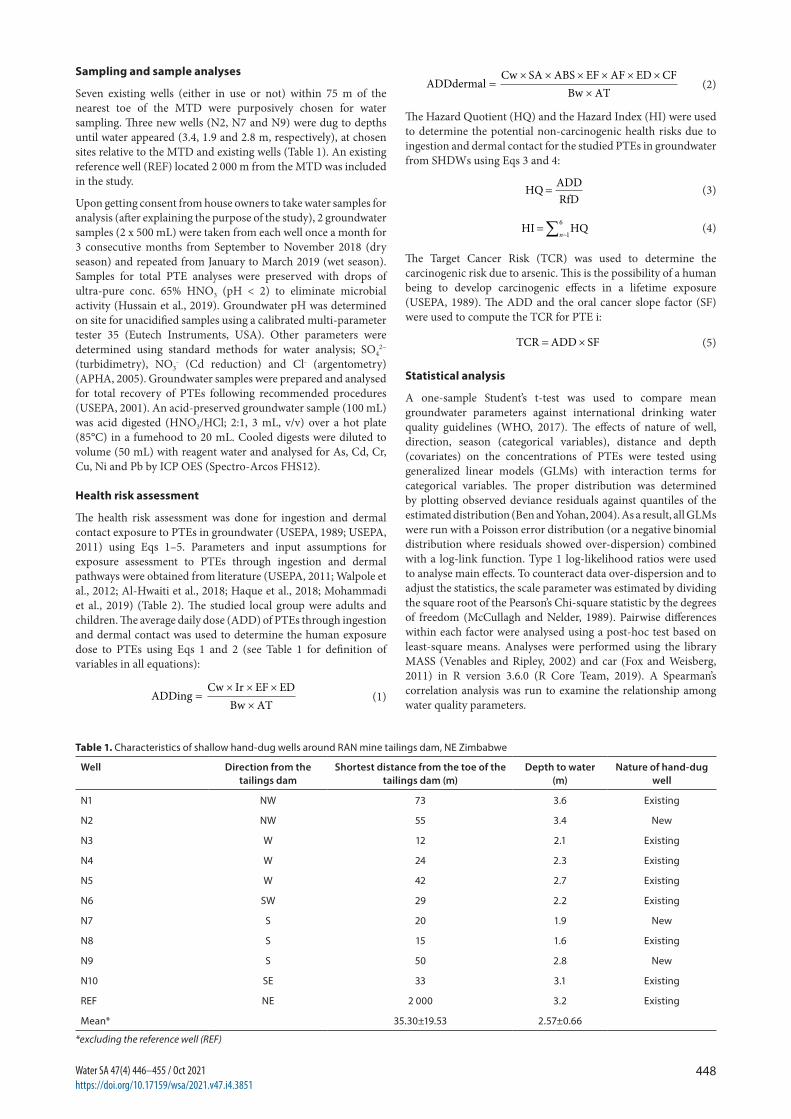
Sampling and sample analyses
Seven existing wells (either in use or not) within 75 m of the nearest toe of the MTD were purposively chosen for water sampling. Three new wells (N2, N7 and N9) were dug to depths until water appeared (3.4, 1.9 and 2.8 m, respectively), at chosen sites relative to the MTD and existing wells (Table 1). An existing reference well (REF) located 2 000 m from the MTD was included in the study.
Upon getting consent from house owners to take water samples for analysis (after explaining the purpose of the study), 2 groundwater samples (2 x 500 mL) were taken from each well once a month for 3 consecutive months from September to November 2018 (dry season) and repeated from January to March 2019 (wet season). Samples for total PTE analyses were preserved with drops of ultra-pure conc. 65% HNO3 (pH < 2) to eliminate microbial activity (Hussain et al., 2019). Groundwater pH was determined on site for unacidified samples using a calibrated multi-parameter tester 35 (Eutech Instruments, USA). Other parameters were determined using standard methods for water analysis; SO4
2− (turbidimetry), NO3
- (Cd reduction) and Cl- (argentometry) (APHA, 2005). Groundwater samples were prepared and analysed for total recovery of PTEs following recommended procedures (USEPA, 2001). An acid-preserved groundwater sample (100 mL) was acid digested (HNO3/HCl; 2:1, 3 mL, v/v) over a hot plate (85°C) in a fumehood to 20 mL. Cooled digests were diluted to volume (50 mL) with reagent water and analysed for As, Cd, Cr, Cu, Ni and Pb by ICP OES (Spectro-Arcos FHS12).
Health risk assessment
The health risk assessment was done for ingestion and dermal contact exposure to PTEs in groundwater (USEPA, 1989; USEPA, 2011) using Eqs 1–5. Parameters and input assumptions for exposure assessment to PTEs through ingestion and dermal pathways were obtained from literature (USEPA, 2011; Walpole et al., 2012; Al-Hwaiti et al., 2018; Haque et al., 2018; Mohammadi et al., 2019) (Table 2). The studied local group were adults and children. The average daily dose (ADD) of PTEs through ingestion and dermal contact was used to determine the human exposure dose to PTEs using Eqs 1 and 2 (see Table 1 for definition of variables in all equations):
ADDingCw Ir EF ED
Bw AT�
� � ��
(1)
ADDdermalCw SA ABS EF AF ED CF
Bw AT�
� � � � � ��
(2)
The Hazard Quotient (HQ) and the Hazard Index (HI) were used to determine the potential non-carcinogenic health risks due to ingestion and dermal contact for the studied PTEs in groundwater from SHDWs using Eqs 3 and 4:
HQ ADDRfD
= (3)
HI HQ���n 1
6 (4)
The Target Cancer Risk (TCR) was used to determine the carcinogenic risk due to arsenic. This is the possibility of a human being to develop carcinogenic effects in a lifetime exposure (USEPA, 1989). The ADD and the oral cancer slope factor (SF) were used to compute the TCR for PTE i:
TCR ADD SF� � (5)
Statistical analysis
A one-sample Student’s t-test was used to compare mean groundwater parameters against international drinking water quality guidelines (WHO, 2017). The effects of nature of well, direction, season (categorical variables), distance and depth (covariates) on the concentrations of PTEs were tested using generalized linear models (GLMs) with interaction terms for categorical variables. The proper distribution was determined by plotting observed deviance residuals against quantiles of the estimated distribution (Ben and Yohan, 2004). As a result, all GLMs were run with a Poisson error distribution (or a negative binomial distribution where residuals showed over-dispersion) combined with a log-link function. Type 1 log-likelihood ratios were used to analyse main effects. To counteract data over-dispersion and to adjust the statistics, the scale parameter was estimated by dividing the square root of the Pearson’s Chi-square statistic by the degrees of freedom (McCullagh and Nelder, 1989). Pairwise differences within each factor were analysed using a post-hoc test based on least-square means. Analyses were performed using the library MASS (Venables and Ripley, 2002) and car (Fox and Weisberg, 2011) in R version 3.6.0 (R Core Team, 2019). A Spearman’s correlation analysis was run to examine the relationship among water quality parameters.
Table 1. Characteristics of shallow hand-dug wells around RAN mine tailings dam, NE Zimbabwe
Well Direction from the tailings dam
Shortest distance from the toe of the tailings dam (m)
Depth to water (m)
Nature of hand-dug well
N1 NW 73 3.6 Existing
N2 NW 55 3.4 New
N3 W 12 2.1 Existing
N4 W 24 2.3 Existing
N5 W 42 2.7 Existing
N6 SW 29 2.2 Existing
N7 S 20 1.9 New
N8 S 15 1.6 Existing
N9 S 50 2.8 New
N10 SE 33 3.1 Existing
REF NE 2 000 3.2 Existing
Mean* 35.30±19.53 2.57±0.66
*excluding the reference well (REF)
449Water SA 47(4) 446–455 / Oct 2021https://doi.org/10.17159/wsa/2021.v47.i4.3851
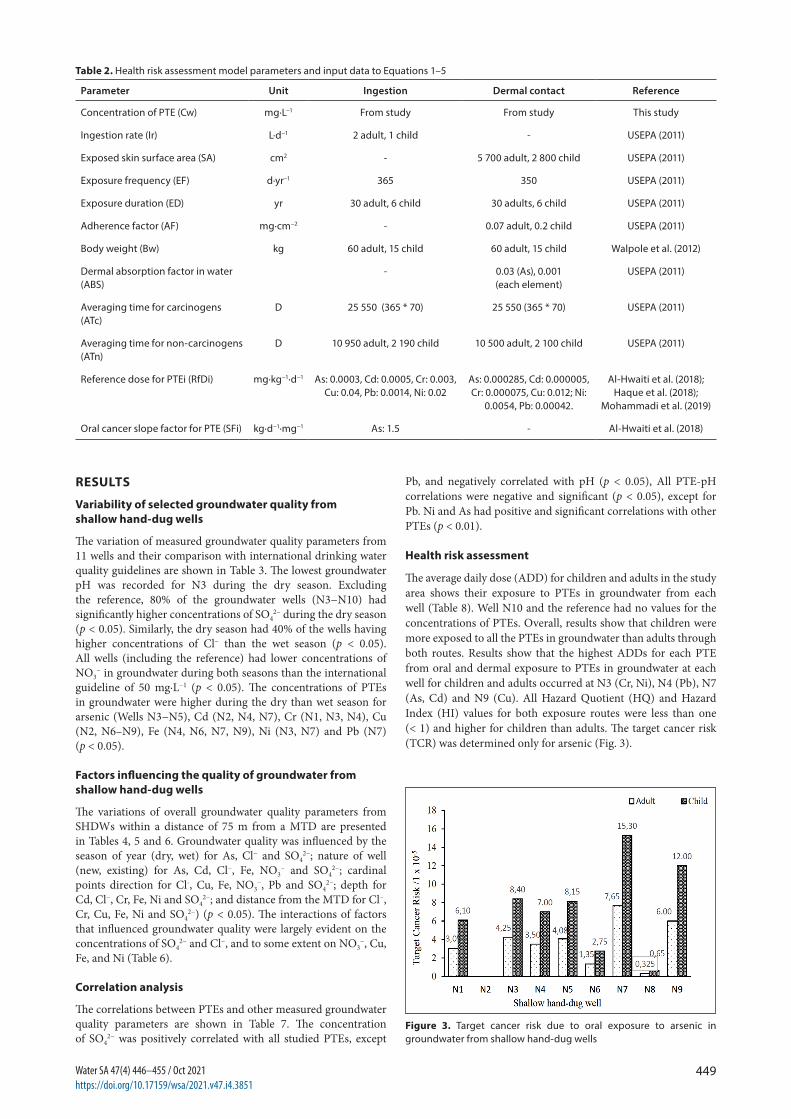
Figure 3. Target cancer risk due to oral exposure to arsenic in groundwater from shallow hand-dug wells
RESULTS
Variability of selected groundwater quality from shallow hand-dug wells
The variation of measured groundwater quality parameters from 11 wells and their comparison with international drinking water quality guidelines are shown in Table 3. The lowest groundwater pH was recorded for N3 during the dry season. Excluding the reference, 80% of the groundwater wells (N3−N10) had significantly higher concentrations of SO4
2− during the dry season (p < 0.05). Similarly, the dry season had 40% of the wells having higher concentrations of Cl− than the wet season (p < 0.05). All wells (including the reference) had lower concentrations of NO3
− in groundwater during both seasons than the international guideline of 50 mg∙L−1 (p < 0.05). The concentrations of PTEs in groundwater were higher during the dry than wet season for arsenic (Wells N3−N5), Cd (N2, N4, N7), Cr (N1, N3, N4), Cu (N2, N6–N9), Fe (N4, N6, N7, N9), Ni (N3, N7) and Pb (N7) (p < 0.05).
Factors influencing the quality of groundwater from shallow hand-dug wells
The variations of overall groundwater quality parameters from SHDWs within a distance of 75 m from a MTD are presented in Tables 4, 5 and 6. Groundwater quality was influenced by the season of year (dry, wet) for As, Cl− and SO4
2−; nature of well (new, existing) for As, Cd, Cl−, Fe, NO3
− and SO42−; cardinal
points direction for Cl-, Cu, Fe, NO3−, Pb and SO4
2−; depth for Cd, Cl−, Cr, Fe, Ni and SO4
2−; and distance from the MTD for Cl−, Cr, Cu, Fe, Ni and SO4
2−) (p < 0.05). The interactions of factors that influenced groundwater quality were largely evident on the concentrations of SO4
2− and Cl−, and to some extent on NO3−, Cu,
Fe, and Ni (Table 6).
Correlation analysis
The correlations between PTEs and other measured groundwater quality parameters are shown in Table 7. The concentration of SO4
2− was positively correlated with all studied PTEs, except
Pb, and negatively correlated with pH (p < 0.05), All PTE-pH correlations were negative and significant (p < 0.05), except for Pb. Ni and As had positive and significant correlations with other PTEs (p < 0.01).
Health risk assessment
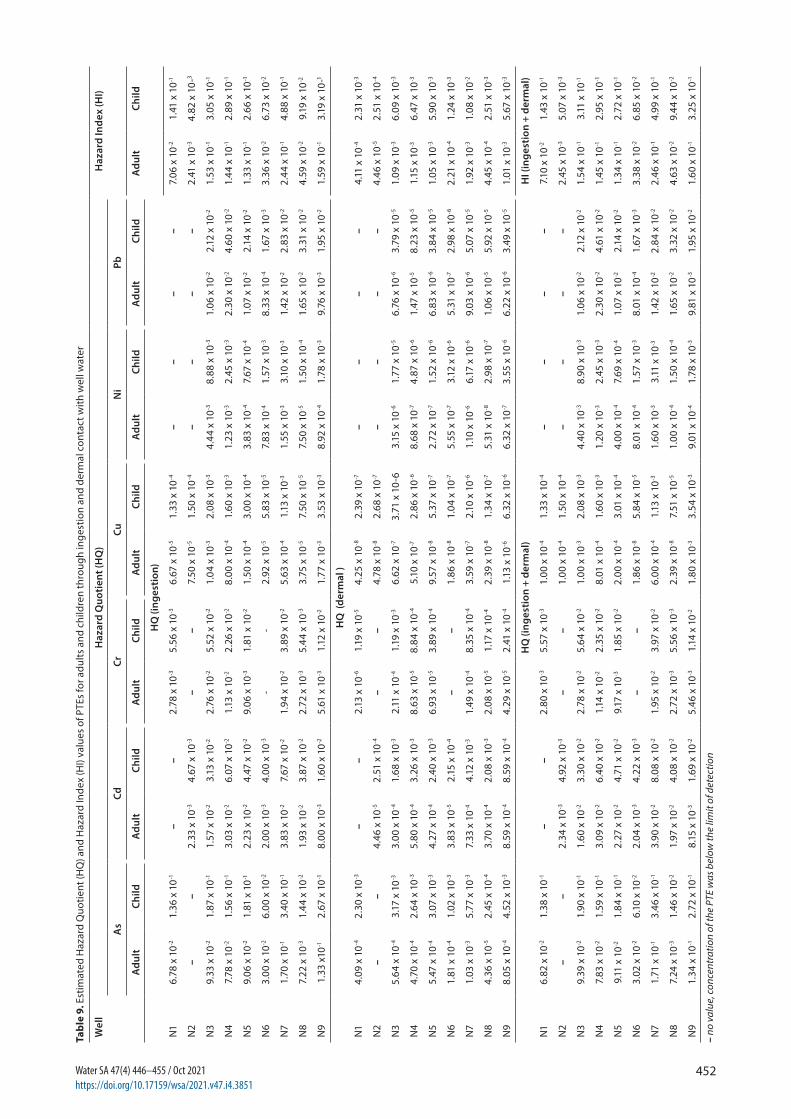
The average daily dose (ADD) for children and adults in the study area shows their exposure to PTEs in groundwater from each well (Table 8). Well N10 and the reference had no values for the concentrations of PTEs. Overall, results show that children were more exposed to all the PTEs in groundwater than adults through both routes. Results show that the highest ADDs for each PTE from oral and dermal exposure to PTEs in groundwater at each well for children and adults occurred at N3 (Cr, Ni), N4 (Pb), N7 (As, Cd) and N9 (Cu). All Hazard Quotient (HQ) and Hazard Index (HI) values for both exposure routes were less than one (< 1) and higher for children than adults. The target cancer risk (TCR) was determined only for arsenic (Fig. 3).
Table 2. Health risk assessment model parameters and input data to Equations 1–5
Parameter Unit Ingestion Dermal contact Reference
Concentration of PTE (Cw) mg∙L−1 From study From study This study
Ingestion rate (Ir) L∙d−1 2 adult, 1 child - USEPA (2011)
Exposed skin surface area (SA) cm2 - 5 700 adult, 2 800 child USEPA (2011)
Exposure frequency (EF) d∙yr−1 365 350 USEPA (2011)
Exposure duration (ED) yr 30 adult, 6 child 30 adults, 6 child USEPA (2011)
Adherence factor (AF) mg∙cm−2 - 0.07 adult, 0.2 child USEPA (2011)
Body weight (Bw) kg 60 adult, 15 child 60 adult, 15 child Walpole et al. (2012)
Dermal absorption factor in water (ABS)
- 0.03 (As), 0.001 (each element)
USEPA (2011)
Averaging time for carcinogens (ATc)
D 25 550 (365 * 70) 25 550 (365 * 70) USEPA (2011)
Averaging time for non-carcinogens (ATn)
D 10 950 adult, 2 190 child 10 500 adult, 2 100 child USEPA (2011)
Reference dose for PTEi (RfDi) mg∙kg−1∙d−1 As: 0.0003, Cd: 0.0005, Cr: 0.003,Cu: 0.04, Pb: 0.0014, Ni: 0.02
As: 0.000285, Cd: 0.000005,Cr: 0.000075, Cu: 0.012; Ni:
0.0054, Pb: 0.00042.
Al-Hwaiti et al. (2018); Haque et al. (2018);
Mohammadi et al. (2019)
Oral cancer slope factor for PTE (SFi) kg∙d−1∙mg−1 As: 1.5 - Al-Hwaiti et al. (2018)

450Water SA 47(4) 446–455 / Oct 2021https://doi.org/10.17159/wsa/2021.v47.i4.3851
Tabl
e 3.
Par
amet
ers
of g
roun
dwat
er s
ampl
es t
aken
fro
m in
divi
dual
wel
ls a
roun
d a
gold
min
e ta
iling
s da
m d
urin
g dr
y an
d w
et s
easo
ns. V
alue
s ar
e m
eans
of
3 m
onth
ly m
easu
rem
ents
exp
ress
ed a
s m
ean±
stan
dard
de
viat
ion.
Mea
n va
lues
(μg∙
L−1, u
nles
s sp
ecifi
ed) a
re c
ompa
red
to in
tern
atio
nal g
uide
lines
for d
rinki
ng w
ater
qua
lity.
Para
met
erSe
ason
N1
N2
N3
N4
N5
N6
N7
N8
N9
N10
REF
WH
O1
As
Dry
1.22
±0.
15N
D1.
04±
0.13
*1.
28±
0.07
*1.
06±
0.12
*0.
42±
0.62
1.87
±0.
190.
07±
0.01
1.55
±0.
25N
DN
D10
Wet
ND
ND
0.64
±0.
10*
0.12
±0.
05*
0.57
±0.
11*
0.12
±0.
061.
19±
0.37
0.06
±0.
020.
85±
0.18
ND
ND
CdD
ryN
D0.
07±
0.01
*0.
33±
0.06
0.66
±0.
08*
0.18
±0.
08*
ND
1.15
±0.
12*
0.05
±0.
010.
10±
0.05
ND
ND
3W
etN
DN
D0.
14±
0.06
0.25
±0.
09*
0.49
±0.
18*
0.06
±0.
02*
ND
0.53
±0.
010.
14±
0.02
ND
ND
CrD
ry0.
05±
0.01
*N
D3.
29±
0.46
*1.
18±
0.07
*0.
42±
0.57
ND
2.22
±0.
440.
40±
0.58
0.68
±0.
16N
DN
D50
Wet
ND
ND
1.68
±0.
23*
0.85
±0.
12*
1.21
±0.
13N
D1.
28±
0.18
0.09
±0.
010.
33±
0.08
ND
ND
CuD
ry0.
09±
0.02
0.18
±0.
05*
1.43
±0.
171.
03±
0.22
0.27
±0.
180.
07±
0.02
*1.
09±
0.21
*0.
09±
0.03
*2.
31±
0.18
*N
DN
D2
000
Wet
0.07
±0.
02N
D1.
06±
0.07
0.89
±0.
190.
09±
0.01
ND
0.26
±0.
09*
ND
1.93
±0.
29*
ND
ND
Fe
(g∙L
−1)
Dry
0.43
±0.
110.
85±
0.08
4.68
±0.
672.
25±
0.12
*1.
18±
0.07
0.31
±0.
03*
7.49
±0.
60*
4.25
±0.
383.
75±
0.24
*0.
99±
0.24
0.65
±0.
12N
one
Wet
0.28
±0.
020.
64±
0.10
3.79
±0.
331.
28±
0.07
*1.
15±
0.03
0.24
±0.
04*
4.64
±0.
43*
2.94
±0.
282.
14±
0.31
*0.
99±
0.22
0.60
±0.
11N
iD
ryN
DN
D3.
82±
0.63
*0.
78±
0.58
0.26
±0.
050.
47±
0.02
1.12
±0.
13*
0.06
±0.
010.
66±
0.11
ND
ND
70W
etN
DN
D1.
51±
0.24
*0.
69±
0.12
0.20
±0.
050.
47±
0.03
0.74
±0.
11*
0.03
±0.
010.
41±
0.13
ND
ND
PbD
ryN
DN
D0.
35±
0.06
1.08
±0.
180.
35±
0.10
ND
1.19
±0.
11*
0.39
±0.
550.
82±
0.66
ND
ND
10W
etN
DN
D0.
54±
0.13
0.85
±0.
080.
55±
0.07
0.07
±0.
01*
ND
ND
ND
ND
ND
Cl-
(mg∙
L−1)
Dry
47.3
±14.
677
.7±
22.1
140.
3±22
.2*
130.
7±15
.2*
88±
23*
45.3
±5.
110
9±13
*92
.3±
2479
±19.
935
±9.
917
±6.
25N
one
Wet
44.3
±8.7
39.3
±6.
547
±6.
6*41
±3*
21.7
±3.
1*34
±2
12±
3.6*
30±
326
.3±
5.5
33.3
±4
9.3±
1.55
5SO
42-
(mg∙
L−1)
Dry
59.4
±27
.125
3.2±
100
1 60
0±49
0*1
298.
3±31
5.5*
1189
.3±
303*
534.
3±16
6.2*
875.
2±24
2.7*
365.
3±10
0.1*
915±
327.
5*47
3±10
8.8*
261.
3±72
.5N
one
Wet
12.8
±2.
810
.4±
2.0
122.
7±4.
2*83
.7±
5.9*
62±
4.58
*47
±4*
143.
7±8.
6*10
2±4.
58*
72±
3*21
5±7.
6*13
4±8
NO
3-
(mg∙
L−1)
Dry
2.25
±0.
091.
20±
0.07
0.08
±0.
030.
15±
0.07
0.06
±0.
01*
1.87
±0.
44*
1.39
±0.
07*
1.23
±0.
06*
1.59
±0.
13*
1.36
±0.
090.
43±
0.12
50W
etN
DN
D0.
09±
0.02
0.12
±0.
060.
14±
0.03
*0.
06±
0.01
*2.
77±
0.15
*0.
46±
0.22
*3.
06±
0.15
*N
DN
DpH
(-)
Dry
7.23
±0.
066.
90±
0.10
5.60
±0.
10*
6.50
±0.
10*
5.17
±0.
326.
67±
0.31
6.77
±0.
15*
6.73
±0.
155.
83±
0.71
6.63
±0.
217.
07±
0.15
Non
eW
et7.
00±
0.10
7.00
±0.
104.
43±
0.15
*5.
13±
0.31
*6.
23±
0.15
6.73
±0.
315.
47±
0.23
*6.
07±
0.65
5.70
±0.
106.
63±
0.15
7.20
±0.
101 W
HO
(201
7) G
uide
lines
for D
rinki
ng W
ater
Qua
lity;
ND
– n
ot d
etec
ted;
Non
e –
no h
ealth
-bas
ed g
uide
line
is p
ropo
sed
in d
rinki
ng w
ater
; *de
note
s sig
nific
antly
diff
eren
t par
amet
er v
alue
s for
the
dry
and
wet
seas
ons w
ithin
a ro
w fo
r a p
artic
ular
pa
ram
eter
for a
wel
l (p
< 0.
05)
Tabl
e 4.
Effe
cts
of s
easo
n, n
atur
e of
wel
l, di
rect
ion
and
thei
r int
erac
tions
on
grou
ndw
ater
qua
lity
para
met
ers
arou
nd a
n ab
ando
ned
min
e ta
iling
s da
m. V
alue
s ar
e ex
pres
sed
as m
ean±
SD o
f rep
licat
es
(ug∙
L−1 u
nles
s ot
herw
ise
spec
ified
).
Fact
orLe
vel
S042-
(mg∙
L−1)
pHCl
- (mg∙
L−1)
NO
3-A
sCd
CuFe
(g∙L
−1)
CrN
iPb
Seas
onW
et91
.38±
10.2
76.
56±
0.09
30.7
6±2.
220.
96±
0.28
0.51
±0.
090.
19±
0.04
0.70
±0.
171.
70±
0.25
0.91
±0.
140.
52±
0.11
0.51
±0.
09D
ry71
2.11
±91
.19
6.06
±0.
1678
.33±
7.09
1.06
±0.
130.
94±
0.13
0.36
±0.
090.
73±
0.15
2.44
±0.
391.
18±
0.25
0.96
±0.
280.
70±
0.11
Nat
ure
of w
ell
Exis
ting
410.
58±7
4.08
6.32
±0.
1253
.54±
5.67
0.64
±0.
120.
54±
0.09
0.25
±0.
040.
50±
0.10
1.63
±0.
211.
02±
0.19
0.75
±0.
210.
52±
0.07
New
378.
21±
96.6
26.
28±
0.16
57.2
2±8.
662.
00±
0.21
1.14
±0.
160.
37±
0.14
1.15
±0.
233.
25±
0.58
1.13
±0.
220.
73±
0.08
1.01
±0.
19D
irect
ion
from
ta
iling
s da
mS
481.
88±
98.6
76.
03±
0.13
65.0
4±8.
801.
35±
0.22
0.87
±0.
140.
34±
0.09
1.09
±0.
173.
59±
0.38
0.88
±0.
140.
56±
0.08
0.87
±0.
11W
745.
75±
213.
815.
36±
0.20
74.2
5±14
.14
0.10
±0.
010.
83±
0.07
0.28
±0.
090.
69±
0.18
2.70
±0.
481.
65±
0.33
1.45
±0.
450.
45±
0.04
SW29
0.67
±117
.12
6.70
±0.
1139
.67±
2.91
0.97
±0.
420.
27±
0.17
0.06
±0.
010.
07±
0.01
0.27
±0.
02N
D0.
05±
0.01
0.07
±0.
01N
W83
.95±
32.6
47.
03±
0.04
52.1
7±5.
741.
73±
0.24
0.24
±0.
060.
07±
0.01
0.11
±0.
020.
55±
0.07
0.05
±0.
01N
DN
DSE
270.
83±
41.0
86.
88±
0.09
23.6
7±3.
620.
89±
0.21
ND
ND
ND
0.81
±0.
07N
DN
DN
DSe
ason
x
Dire
ctio
nW
et x
S10
0.33
±8.3
36.
43±0
.13
27.3
3±3.
271.
60±0
.40
0.56
±0.1
50.
15±0
.03
1.03
±0.2
52.
75±0
.38
0.64
±0.1
40.
47±0
.09
0.85
±0.0
4W
et x
W92
.33±
13.6
5.92
±0.1
534
.33±
5.96
0.12
±0.0
10.
61±0
.04
0.31
±0.0
90.
53±0
.23
2.47
±0.6
01.
45±0
.12
0.86
±0.3
00.
55±0
.04
Wet
x S
W47
.00±
2.31
6.73
±0.1
834
.00±
1.15
0.06
±0.0
030.
12±0
.03
0.06
±0.0
1N
D0.
24±0
.02
ND
0.05
±0.0
20.
07±0
.02
Wet
x N
W11
.61±
1.03
7.07
±0.0
841
.83±
3.03
ND
ND
ND
0.07
±0.0
090.
46±0
.09
ND
ND
ND
Wet
x S
E17
4.50
±18.
336.
85±0
.11
21.3
3±5.
48N
DN
DN
DN
D0.
80±0
.10
ND
ND
ND
Dry
x S
863.
42±1
19.0
75.
63±0
.17
102.
75±7
.40
1.09
±0.1
71.
19±0
.21
0.49
±0.1
41.
13±0
.24
4.43
±0.5
81.
12±0
.23
0.65
±0.1
40.
87±0
.14
Dry
x W
1399
.17±
173.
764.
80±0
.19
114.
17±1
4.37
0.07
±0.0
11.
05±0
.05
0.26
±0.0
40.
85±0
.27
2.93
±0.8
01.
86±0
.67
2.04
±0.8
10.
35±0
.03
Dry
x S
W53
4.33
±95.
966.
67±0
.18
45.3
3±2.
961.
87±0
.25
0.42
±0.3
6N
D0.
07±0
.01
0.31
±0.0
2N
D0.
05±0
.09
ND
Dry
x N
W15
6.28
±50.
927.
0±0.
0462
.40±
9.64
1.73
±0.0
30.
24±0
.02
0.07
±0.0
10.
13±0
.02
0.64
±0.1
00.
05±0
.001
ND
ND
Dry
x S
E36
7.17
±58.
136.
92±0
.14
26.0
0±5.
030.
89±0
.11
ND
ND
ND
0.82
±0.1
0N
DN
DN
D
ND
– n
ot d
etec
ted

451Water SA 47(4) 446–455 / Oct 2021https://doi.org/10.17159/wsa/2021.v47.i4.3851
Table 5. Variation of water quality parameters with depth of well and distance from the tailings dam
Factor SO42− Cl- Cd Cu Cl Cr Ni
Depth R −0.78 −0.63 −0.81 −0.85 −0.75 −0.78R2 0.61 0.40 0.66 0.72 0.56 0.61
Distance R −0.83 −0.7 −0.79 −0.77 −0.79 −0.70R2 0.69 0.49 0.62 0.59 0.6241 0.49
Significant (p < 0.05) regression results with at least 50% variation being explained by the model
Table 6. Generalized linear model results with negative binomial errors. Values are log likelihood ratios (LRT) with level of significance.
Model SO42− Cl- NO3
− As Cd Cu Fe Cr Ni PbSeason 1 109.9*** 358.97 *** 4.29*Nature 7.24* 22.11*** 9.17 **** 9.83 * 9.83* 9.17*Direction 100.92*** 20.16*** 5.13 *** 2.67* 10.18 *** 5.51*Depth 151.97 *** 60.48*** 10.61 ** 10.01* 6.59* 6.1*Distance 478.65*** 237.87*** 6.20* 29.39 *** 16.51*** 23.53***Distance x direction 6.78*** 18.80*** 5.41** 4.84* 3.93* 5.66*Distance x depth 119.26*** 49.46 **** 6.7**Direction x depth 18.31*** 15.82***Distance x season 14.69*** 14.90***Direction x season 11.3*** 5.67*
*significant at p < 0.05; **significant at p < 0.001; ***significant at p < 0.0001
Table 7. Spearman’s correlation coefficient (r) of groundwater parameters at RAN mine
SO42− pH Cl− NO3
− As Cd Cu Fe Cr NipH −0.55**Cl- 0.55** −0.54**NO3
- −0.06 0.30* −0.24As 0.55** −0.50** 0.32* 0.18Cd 0.32* −0.59** 0.33* −0.09 0.67**Cu 0.43** −0.57** 0.32* 0.02 0.54** 0.09Fe 0.48** −0.66** 0.34** 0.10 0.45** 0.20 0.60**Cr 0.39* −0.49** 0.23 −0.30 0.43** 0.65** 0.24 0.56**Ni 0.42** −0.54** 0.37* −0.08 0.63** 0.58** 0.58** 0.59** 0.76**Pb 0.26 −0.16 0.26 0.52** 0.53** 0.56** 0.24 0.28 0.11 0.30
*significant at p < 0.05; **significant at p < 0.01
Table 8. Estimated average daily dose (ADD, mg∙kg−1∙d−1) of PTEs for adults and children through ingestion and dermal contact with groundwater from shallow hand-dug wells
Well As Cd Cr Cu Ni Pb
Adult Child Adult Child Adult Child Adult Child Adult Child Adult Child
Ingestion
N1 2.03 x 10⁻⁵ 4.07 x 10⁻⁵ - - 8.33 x 10⁻⁶ 1.67 x 10⁻⁵ 2.67 x 10⁻⁶ 5.33 x 10⁻⁶ - - - -
N2 - - 1.17 x 10⁻⁶ 2.33x 10⁻⁶ - - 3.00 x 10⁻⁶ 6.00 x 10⁻⁶ - - - -
N3 2.80 x 10⁻⁵ 5.60 x 10⁻⁵ 7.83 x 10⁻⁶ 1.57 x 10⁻⁵ 8.28 x 10⁻⁵ 1.66 x 10⁻⁴ 4.15 x 10⁻⁵ 8.30 x 10⁻⁵ 8.88 x 10⁻⁵ 1.78 x 10⁻⁴ 1.48 x 10⁻⁵ 2.97 x 10⁻⁵
N4 2.33 x 10⁻⁵ 4.67 x 10⁻⁵ 1.52 x 10⁻⁵ 3.03 x 10⁻⁵ 3.38 x 10⁻⁵ 6.77 x 10⁻⁵ 3.20 x 10⁻⁵ 6.40 x 10⁻⁵ 2.45 x 10⁻⁵ 4.90 x 10⁻⁵ 3.22 x 10⁻⁵ 6.43 x 10⁻⁵
N5 2.72 x 10⁻⁵ 5.43 x 10⁻⁵ 1.12 x 10⁻⁵ 2.23 x 10⁻⁵ 2.72 x 10⁻⁵ 5.43 x 10⁻⁵ 6.00 x 10⁻⁶ 1.20 x 10⁻⁵ 7.67 x 10⁻⁶ 1.53 x 10⁻⁵ 1.50 x 10⁻⁵ 3.00 x 10⁻⁵
N6 9.00 x 10⁻⁶ 1.80 x 10⁻⁵ 1.00 x 10⁻⁶ 2.00 x 10⁻⁶ - - 1.17 x 10⁻⁶ 2.33 x 10⁻⁶ 1.57 x 10⁻⁵ 3.13 x 10⁻⁵ 1.17 x 10⁻⁶ 2.33 x 10⁻⁶
N7 5.10 x 10⁻⁵ 1.02 x 10⁻⁴ 1.92 x 10⁻⁵ 3.83 x 10⁻⁵ 5.83 x 10⁻⁵ 1.17 x 10⁻⁴ 2.25 x 10⁻⁵ 4.50 x 10⁻⁵ 3.10 x 10⁻⁵ 6.20 x 10⁻⁵ 1.98 x 10⁻⁵ 3.97 x 10⁻⁵
N8 2.17 x 10⁻⁶ 4.33 x 10⁻⁶ 9.67 x 10⁻⁶ 1.93 x 10⁻⁵ 8.17 x 10⁻⁶ 1.63 x 10⁻⁵ 1.50 x 10⁻⁶ 3.00 x 10⁻⁶ 1.50 x 10⁻⁶ 3.00 x 10⁻⁶ 2.32 x 10⁻⁵ 4.63 x 10⁻⁵
N9 4.00 x 10⁻⁵ 8.00 x 10⁻⁵ 4.00 x 10⁻⁶ 8.00 x 10⁻⁶ 1.68 x 10⁻⁵ 3.37 x 10⁻⁵ 7.07 x 10⁻⁵ 1.41 x 10⁻⁴ 1.78 x 10⁻⁵ 3.57 x 10⁻⁵ 1.37 x 10⁻⁵ 2.73 x 10⁻⁵
Dermal contact
N1 1.17 x 10⁻⁷ 6.55 x 10⁻⁷ - - 1.59 x 10⁻¹⁰ 8.95 x 10⁻¹⁰ 5.10 x 10⁻¹⁰ 2.86 x 10⁻⁹ - - - -
N2 - - 2.23 x 10⁻¹⁰ 1.25 x 10⁻⁹ - - 5.74 x 10⁻¹⁰ 3.22 x 10⁻⁹ - - - -
N3 1.61 x 10⁻⁷ 9.02 x 10⁻⁷ 1.50 x 10⁻⁹ 8.41 x 10⁻⁹ 1.58 x 10⁻⁸ 8.90 x 10⁻⁸ 7.94 x 10⁻⁹ 4.46 x 10⁻⁸ 1.70 x 10⁻⁸ 9.54 x 10⁻⁸ 2.84 x 10⁻⁹ 1.59 x 10⁻⁸
N4 1.34 x 10⁻⁷ 7.52 x 10⁻⁷ 2.90 x 10⁻⁹ 1.63 x 10⁻⁸ 6.47 x 10⁻⁹ 3.63 x 10⁻⁸ 6.12 x 10⁻⁹ 3.44 x 10⁻⁸ 4.69 x 10⁻⁹ 2.63 x 10⁻⁸ 6.15 x 10⁻⁹ 3.45 x 10⁻⁸
N5 1.56 x 10⁻⁷ 8.75 x 10⁻⁷ 2.14 x 10⁻⁹ 1.20 x 10⁻⁸ 5.20 x 10⁻⁹ 2.92 x 10⁻⁸ 1.15 x 10⁻⁹ 6.44 x 10⁻⁹ 1.47 x 10⁻⁹ 8.23 x 10⁻⁹ 2.87 x 10⁻⁹ 1.61 x 10⁻⁸
N6 5.17 x 10⁻⁸ 2.90 x 10⁻⁷ 1.91 x 10⁻¹⁰ 1.07 x 10⁻⁹ - - 2.23 x 10⁻¹⁰ 1.25 x 10⁻⁹ 3.00 x 10⁻⁹ 1.68 x 10⁻⁸ 2.23 x 10⁻¹⁰ 1.25 x 10⁻⁹
N7 2.93 x 10⁻⁷ 1.64 x 10⁻⁶ 3.67 x 10⁻⁹ 2.06 x 10⁻⁸ 1.12 x 10⁻⁸ 6.26 x 10⁻⁸ 4.30 x 10⁻⁹ 2.42 x 10⁻⁸ 5.93 x 10⁻⁹ 3.33 x 10⁻⁸ 3.79 x 10⁻⁹ 2.13 x 10⁻⁸
N8 1.24 x 10⁻⁸ 6.98 x 10⁻⁸ 1.85 x 10⁻⁹ 1.04 x 10⁻⁸ 1.56 x 10⁻⁹ 8.77 x 10⁻⁹ 2.87 x 10⁻¹⁰ 1.61 x 10⁻⁹ 2.87 x 10⁻¹⁰ 1.61 x 10⁻⁹ 4.43 x 10⁻⁹ 2.49 x 10⁻⁸
N9 2.30 x 10⁻⁷ 1.29 x 10⁻⁶ 7.65 x 10⁻¹⁰ 4.30 x 10⁻⁹ 3.22 x10⁻⁹ 1.81 x 10⁻⁸ 1.35 x 10⁻⁸ 7.59 x 10⁻⁸ 3.41 x 10⁻⁹ 1.92 x 10⁻⁸ 2.61 x 10⁻⁹ 1.47 x 10⁻⁸
452Water SA 47(4) 446–455 / Oct 2021https://doi.org/10.17159/wsa/2021.v47.i4.3851
Tabl
e 9.
Est
imat
ed H
azar
d Q
uotie
nt (H
Q) a
nd H
azar
d In
dex
(HI)
valu
es o
f PTE
s fo
r adu
lts a
nd c
hild
ren
thro
ugh
inge
stio
n an
d de
rmal
con
tact
with
wel
l wat
er
Wel
lH
azar
d Q
uoti
ent (
HQ
)H
azar
d In
dex
(HI)
As
CdCr
CuN
iPb
Adu
ltCh
ildA
dult
Child
Adu
ltCh
ildA
dult
Child
Adu
ltCh
ildA
dult
Child
Adu
ltCh
ild
HQ
(ing
esti
on)
N1
6.78
x 1
0-21.
36 x
10-1
––
2.78
x 1
0-35.
56 x
10-3
6.67
x 1
0-51.
33 x
10-4
––
––
7.06
x 1
0-21.
41 x
10-1
N2
––
2.33
x 1
0-34.
67 x
10-3
––
7.50
x 1
0-51.
50 x
10-4
––
––
2.41
x 1
0-34.
82 x
10-
3
N3
9.33
x 1
0-21.
87 x
10-1
1.57
x 1
0-23.
13 x
10-2
2.76
x 1
0-25.
52 x
10-2
1.04
x 1
0-32.
08 x
10-3
4.44
x 1
0-38.
88 x
10-3
1.06
x 1
0-22.
12 x
10-2
1.53
x 1
0-13.
05 x
10-1
N4
7.78
x 1
0-21.
56 x
10-1
3.03
x 1
0-26.
07 x
10-2
1.13
x 1
0-22.
26 x
10-2
8.00
x 1
0-41.
60 x
10-3
1.23
x 1
0-32.
45 x
10-3
2.30
x 1
0-24.
60 x
10-2
1.44
x 1
0-12.
89 x
10-1
N5
9.06
x 1
0-21.
81 x
10-1
2.23
x 1
0-24.
47 x
10-2
9.06
x 1
0-31.
81 x
10-2
1.50
x 1
0-43.
00 x
10-4
3.83
x 1
0-47.
67 x
10-4
1.07
x 1
0-22.
14 x
10-2
1.33
x 1
0-12.
66 x
10-1
N6
3.00
x 1
0-26.
00 x
10-2
2.00
x 1
0-34.
00 x
10-3
--
2.92
x 1
0-55.
83 x
10-5
7.83
x 1
0-41.
57 x
10-3
8.33
x 1
0-41.
67 x
10-3
3.36
x 1
0-26.
73 x
10-2
N7
1.70
x 1
0-13.
40 x
10-1
3.83
x 1
0-27.
67 x
10-2
1.94
x 1
0-23.
89 x
10-2
5.63
x 1
0-41.
13 x
10-3
1.55
x 1
0-33.
10 x
10-3
1.42
x 1
0-22.
83 x
10-2
2.44
x 1
0-14.
88 x
10-1
N8
7.22
x 1
0-31.
44 x
10-2
1.93
x 1
0-23.
87 x
10-2
2.72
x 1
0-35.
44 x
10-3
3.75
x 1
0-57.
50 x
10-5
7.50
x 1
0-51.
50 x
10-4
1.65
x 1
0-23.
31 x
10-2
4.59
x 1
0-29.
19 x
10-2
N9
1.33
x10
-12.
67 x
10-1
8.00
x 1
0-31.
60 x
10-2
5.61
x 1
0-31.
12 x
10-2
1.77
x 1
0-33.
53 x
10-3
8.92
x 1
0-41.
78 x
10-3
9.76
x 1
0-31.
95 x
10-2
1.59
x 1
0-13.
19 x
10-
1
HQ
(de
rmal
)
N1
4.09
x 1
0-42.
30 x
10-3
––
2.13
x 1
0-61.
19 x
10-5
4.25
x 1
0-82.
39 x
10-7
––
––
4.11
x 1
0-42.
31 x
10-3
N2
––
4.46
x 1
0-52.
51 x
10-4
––
4.78
x 1
0-82.
68 x
10-7
––
––
4.46
x 1
0-52.
51 x
10-4
N3
5.64
x 1
0-43.
17 x
10-3
3.00
x 1
0-41.
68 x
10-3
2.11
x 1
0-41.
19 x
10-3
6.62
x 1
0-73.
71 x
10-
63.
15 x
10-6
1.77
x 1
0-56.
76 x
10-6
3.79
x 1
0-51.
09 x
10-3
6.09
x 1
0-3
N4
4.70
x 1
0-42.
64 x
10-3
5.80
x 1
0-43.
26 x
10-3
8.63
x 1
0-58.
84 x
10-4
5.10
x 1
0-72.
86 x
10-6
8.68
x 1
0-74.
87 x
10-6
1.47
x 1
0-58.
23 x
10-5
1.15
x 1
0-36.
47 x
10-3
N5
5.47
x 1
0-43.
07 x
10-3
4.27
x 1
0-42.
40 x
10-3
6.93
x 1
0-53.
89 x
10-4
9.57
x 1
0-85.
37 x
10-7
2.72
x 1
0-71.
52 x
10-6
6.83
x 1
0-63.
84 x
10-5
1.05
x 1
0-35.
90 x
10-3
N6
1.81
x 1
0-41.
02 x
10-3
3.83
x 1
0-52.
15 x
10-4
––
1.86
x 1
0-81.
04 x
10-7
5.55
x 1
0-73.
12 x
10-6
5.31
x 1
0-72.
98 x
10-6
2.21
x 1
0-41.
24 x
10-3
N7
1.03
x 1
0-35.
77 x
10-3
7.33
x 1
0-44.
12 x
10-3
1.49
x 1
0-48.
35 x
10-4
3.59
x 1
0-72.
10 x
10-6
1.10
x 1
0-66.
17 x
10-6
9.03
x 1
0-65.
07 x
10-5
1.92
x 1
0-31.
08 x
10-2
N8
4.36
x 1
0-52.
45 x
10-4
3.70
x 1
0-42.
08 x
10-3
2.08
x 1
0-51.
17 x
10-4
2.39
x 1
0-81.
34 x
10-7
5.31
x 1
0-82.
98 x
10-7
1.06
x 1
0-55.
92 x
10-5
4.45
x 1
0-42.
51 x
10-3
N9
8.05
x 1
0-44.
52 x
10-3
8.59
x 1
0-48.
59 x
10-4
4.29
x 1
0-52.
41 x
10-4
1.13
x 1
0-66.
32 x
10-6
6.32
x 1
0-73.
55 x
10-6
6.22
x 1
0-63.
49 x
10-5
1.01
x 1
0-35.
67 x
10-3
HQ
(ing
esti
on +
der
mal
)H
I (in
gest
ion
+ de
rmal
)
N1
6.82
x 1
0-21.
38 x
10-1
––
2.80
x 1
0-35.
57 x
10-3
1.00
x 1
0-41.
33 x
10-4
––
––
7.10
x 10
-21.
43 x
10-1
N2
––
2.34
x 1
0-34.
92 x
10-3
––
1.00
x 1
0-41.
50 x
10-4
––
––
2.45
x 1
0-35.
07 x
10-3
N3
9.39
x 1
0-21.
90 x
10-1
1.60
x 1
0-23.
30 x
10-2
2.78
x 1
0-25.
64 x
10-2
1.00
x 1
0-32.
08 x
10-3
4.40
x 1
0-38.
90 x
10-3
1.06
x 1
0-22.
12 x
10-2
1.54
x 1
0-13.
11 x
10-1
N4
7.83
x 1
0-21.
59 x
10-1
3.09
x 1
0-26.
40 x
10-2
1.14
x 1
0-22.
35 x
10-2
8.01
x 1
0-41.
60 x
10-3
1.20
x 1
0-32.
45 x
10-3
2.30
x 1
0-24.
61 x
10-2
1.45
x 1
0-12.
95 x
10-1
N5
9.11
x 1
0-21.
84 x
10-1
2.27
x 1
0-24.
71 x
10-2
9.17
x 1
0-31.
85 x
10-2
2.00
x 1
0-43.
01 x
10-4
4.00
x 1
0-47.
69 x
10-4
1.07
x 1
0-22.
14 x
10-2
1.34
x 1
0-12.
72 x
10-1
N6
3.02
x 1
0-26.
10 x
10-2
2.04
x 1
0-34.
22 x
10-3
––
1.86
x 1
0-85.
84 x
10-5
8.01
x 1
0-41.
57 x
10-3
8.01
x 1
0-41.
67 x
10-3
3.38
x 1
0-26.
85 x
10-2
N7
1.71
x 1
0-13.
46 x
10-1
3.90
x 1
0-28.
08 x
10-2
1.95
x 1
0-23.
97 x
10-2
6.00
x 1
0-41.
13 x
10-3
1.60
x 1
0-33.
11 x
10-3
1.42
x 1
0-22.
84 x
10-2
2.46
x 1
0-14.
99 x
10-1
N8
7.24
x 1
0-31.
46 x
10-2
1.97
x 1
0-24.
08 x
10-2
2.72
x 1
0-35.
56 x
10-3
2.39
x 1
0-87.
51 x
10-5
1.00
x 1
0-41.
50 x
10-4
1.65
x 1
0-23.
32 x
10-2
4.63
x 1
0-29.
44 x
10-2
N9
1.34
x 1
0-12.
72 x
10-1
8.15
x 1
0-31.
69 x
10-2
5.46
x 1
0-31.
14 x
10-2
1.80
x 1
0-33.
54 x
10-3
9.01
x 1
0-41.
78 x
10-3
9.81
x 1
0-31.
95 x
10-2
1.60
x 1
0-13.
25 x
10-1
– no
val
ue, c
once
ntra
tion
of th
e PT
E w
as b
elow
the
limit
of d
etec
tion

453Water SA 47(4) 446–455 / Oct 2021https://doi.org/10.17159/wsa/2021.v47.i4.3851
DISCUSSION
Overall results show that groundwater had higher concentrations of contaminants during the dry than the wet season. This is consistent with earlier studies for the concentrations of Cl−, NO3
− and SO4
2− (Ganiyu et al., 2018) and NO3− (Bexfield and Jurgens,
2014). This could be attributed to change in the intensity of hydrochemical processes (e.g., evaporation, redox and mineral precipitation) in the dry season (Aladejana et al., 2020). Wells are over-exploited during the dry season to meet high water demand which is usually offset by rainfall during the wet season. This reduces groundwater recharge and lowers the water table (Guo et al., 2018). Further, it influences the direction and magnitude of the horizontal and vertical gradients that drive contaminants to wells, changing groundwater quality (Bexfileld and Jurgens, 2014; Mohapatra and Kirpalani, 2017).
The main source of NO3− in groundwater was agricultural
activities. This conclusion was also reached in a groundwater assessment study in Andhra Pradesh, India (Sunitha and Reddy, 2019). Urban agriculture is associated with intensive use of artificial fertilisers on small pieces of land (Stewart et al., 2013). Nitrate causes methaemoglobinaemia, significant in children (WHO, 2017). High concentrations of SO4
2- in groundwater could be from the oxidation of sulphidic material in tailings. Leaching from tailings results in an increase of oxyanions (e. g. SO4
2−) in solution (Dold, 2014; Kim et al., 2017). Acidic pH (less than 6) recorded in Wells N3, N5 and N9 could result in dissolution of the redox-sensitive Fe (Gad et al., 2016). According to WHO (2017), drinking water quality has no health-based guideline values for pH, Fe, Cl− and SO4
2−. However, at some elevated concentrations, Fe, SO4
2− and Cl− influence the taste of water. The current study had groundwater of slightly acidic, neutral to slightly alkaline pH. This could be a result of either natural or enhanced neutralising potential by treatment of the mine tailings (Petronijević et al., 2020).
Groundwater sampled in open wells (25–30 m deep) during summer near an active coal mine in Dhanbad, India (Prasad et al., 2014), had higher concentrations of Cd, Cr, Cu, Fe and Pb when compared to the current study. Coal mining is generally associated with acid mine drainage laden with PTEs which can leach deep into groundwater (Li et al., 2021). Zhuang et al. (2014) showed that well water from sources near a mining area of Dabaoshan, Guangdon, southern China, had higher concentrations of Cd, Cu and Pb than those found in the current study. Analysis of the hair of local residents showed higher concentrations of Cd and Pb than an unexposed population. However, comparison of the concentration of PTEs in groundwater from various studies may present challenges due to variations in mineral exploitation activities and duration, local climate and geology, soil and well characteristics. Nevertheless, comparing with the maximum allowable limit for drinking water quality guidelines allows water quality assessments and monitoring.
The area between the sector formed by NW and S directions within 75 m from the nearest MTD toe (135°) recorded the highest concentrations of contaminants in groundwater. Surface runoff erodes PTEs downslope to the south during the rainy season (Fig. 2a). In dry weather, long-range atmospheric deposition (Barandovski et al., 2015) accounts for PTE dispersal into open SHDWs (Fig. 2b) through the prevailing easterly winds (Kanda et al., 2019). High concentrations of SO4
2−, Cl−, Cd and Fe were recorded at relatively shallow wells. This is in agreement with observations made by Rajmohan et al. (2017) in a hydrochemical evaluation of 44 wells in the Ramganga Sub-Basin, India, for the same groundwater quality parameters. They attributed the higher concentrations in shallow wells (average 12 m) than in deep wells (average 35 m) to other sources of contamination than mineral
dissolution alone. Dash et al. (2010) showed that salinity of groundwater was high at shallow groundwater depths.
The three new wells recorded higher concentrations of contaminants (except for SO4
2−) than existing wells. However, these wells were not of the same depth, distance and direction relative to the MTD, which all influence groundwater quality. The concentration of SO4
2− in groundwater was considered less prone to sorption, precipitation and geochemical reduction (Kim et al., 2017). Erickson et al. (2018) observed that the concentration of As in groundwater from new wells was highly variable relative to that found when sampled months later. Although the concentrations of PTEs were lower than the drinking water quality guidelines (WHO, 2017), some (e.g. Cd and Pb) are cumulative poisons (Jaishankar et al., 2014) while Ni is considered carcinogenic (Wuana and Okieimen, 2011).
The negative and significant correlation of PTEs with pH (p < 0.05) may suggest that pH influences the concentration of PTEs in solution (Palansooriya et al., 2020). Generally, strong positive correlations among PTEs may suggest that they originate from the same source or have similar hydrochemical behaviour (Tepanosyan et al., 2017). However, further multivariate statistical analyses are needed for their source apportionment.
Health risk assessment data showed that both HQi and HI were less than one. This implies that there is no possibility that non-carcinogenic impacts may occur to the local population (USEPA, 2011). The use of PTE concentrations for the dry season, when concentrations of PTEs are maximum, to estimate health risk exposure may represent the worst-case exposure scenario. However, average values (dry and rainy season) may represent a more realistic exposure scenario. Although Cd and Ni are human carcinogens (IARC, 1993), they have no established oral carcinogenic slope factors for groundwater, and Pb is a probable carcinogen. The TCR values recorded for arsenic (10−4) in some wells indicate medium to high cancer risk levels (Grade V: 10−4, 5 x 10⁻⁴) which require the willingness to invest in managing them (Li et al., 2017). According to Tepanosyan et al. (2017) if TCR or total TCR is less than 10−6 no carcinogenic risk is expected to health. Further, values greater than 10−4 suggest high risk (USEPA, 1989).
Limitations of the study
The use of the USEPA-recommended risk assessment model in local scenarios may introduce uncertainties. However, local values were used in the model where applicable. The model assumes continuous use of water from the same source in a year and does not indicate when potential risk symptoms may start to show. There were no established local background values for PTEs. A local reference point was used to provide background concentrations.
Concentrations of most PTEs were below the detection limit. Since groundwater quality is influenced by a number of changing local factors, our results may be interpreted with caution for generalisation to similar scenarios. However, they provide a basis for further monitoring and may influence relevant practices and policy for local authorities.
CONCLUSION
The study highlights the importance of monitoring abandoned mine sites and the ambient environment even years after mineral exploration activities have ended. It encourages the effective enforcement of urban councils’ by-laws for human settlement and environmental regulations that govern mining and waste disposal. The findings stress the importance of seasonality in similar studies as the population appears exposed to higher concentrations of potentially toxic elements during the dry than
454Water SA 47(4) 446–455 / Oct 2021https://doi.org/10.17159/wsa/2021.v47.i4.3851
the wet season. Although the concentrations of potentially toxic elements in groundwater placed no restriction for potable use and posed no significant non-carcinogenic health risks to the local population, arsenic poses medium to high cancer risk. We encourage municipalities of small towns in low-income settings to provide water and sewerage systems to new human settlements before habitation. We propose the establishment of vegetation on slopes of the MTD to reduce erosion by wind and runoff, and prevent the oxidation of pyrite and the mobility of PTEs. Eroded tailings material downslope of the tailings dam may be contained by silt-catchment paddocks. Further studies could be done to investigate the acid generating potential of the tailings and the potential human health risk to potentially toxic elements through inhalation for the local population.
DISCLOSURE STATEMENT
The authors declare no conflicts of interest with the contents of this article. This study did not receive any external funding.
ETHICAL CONSIDERATIONS
No human subjects were directly involved. However, verbal consent to take water samples from wells at some households was sought.
ORCID
Artwell Kanda https://orcid.org/0000-0001-7910-8222
France Ncube https://orcid.org/0000-0003-0364-1754
Peter Makumbe https://orcid.org/0000-0002-5541-9533
REFERENCESAKOTO O, TEKU JA and GASINU D (2019) Chemical characteristics
and health hazards of heavy metals in shallow groundwater: case study Anloga community, Volta Region, Ghana. Appl. Water Sci. 9 (2) 36. https://doi.org/10.1007/s13201-019-0914-z
ALADEJANA JA, KALIN RM, SENTENAC P and HASSAN I (2020) Assessing the impact of climate change on groundwater quality of the shallow coastal aquifer of eastern Dahomey Basin, southwestern Nigeria. Water. 12 (1) 224. https://doi.org/10.3390/w12010224
AL-HWAITI MS, BRUMSACK HJ and SCHNETGER B (2018) Heavy metal contamination and health risk assessment in waste mine water dewatering using phosphate beneficiation processes in Jordan. Environ. Earth Sci. 77 (19) 661. https://doi.org/10.1007/s12665-018-7845-0
APHA (American Public Health Association) (2005) Standard Methods for the Examination of Water and Wastewater (21st edn.) APHA, Washington.
ARMSTRONG M, LANGRENE N, PETTER R, CHEN W and PETTER C (2019) Accounting for tailings dam failures in the valuation of mining projects. Resour. Polic. 63 101461. https://doi.org/10.1016/j.resourpol.2019.101461
BARANDOVSKI L, FRONTASYEVA MV, STAFILOV T, ŠAJN R and OSTROVNAYA T (2015) Multi-element atmospheric deposition in Macedonia studied by the moss biomonitoring technique. Environ. Sci. Pollut. Res. 22 (20) 16077–16097. https://doi.org/10.1007/s11356-015-4787-x
BEN MG and YOHAI V (2004) Quantile-quantile plot for deviance residuals in the generalised linear model. J. Comput. Graphics Stat. 13 (1) 36–47. https://doi.org/10.1198/1061860042949_a
BEXFIELD LM and JURGENS BC (2014) Effects of seasonal operation on the quality of water produced by public supply wells. Groundwater. 52 (S1) 10–24. https://doi.org/10.1111/gwat.12174
CARRARD N, FOSTER T and WILLETTS J (2019) Groundwater as a source of drinking water in southeast Asia and the Pacific: A multi-country review of current reliance and resource concerns. Water. 11 (8) 1605. https://doi.org/10.3390/w11081605
CHACHA N, NJAU KN, LUGOMELA GV and MUZUKA ANN (2018) Hydrogeochemical characteristics and spatial distribution of groundwater quality in Arusha well fields, Northern Tanzania. Appl. Water Sci. 8 (4) 118. https://doi.org/10.1007/s13201-018-0760-4
CHUANG Y-H, HUANG W-J, NGUYEN KLP, CHEN WY, YU R-F and CHEN H-W (2019) Redundancy analysis for characterizing the groundwater quality in coastal industrial areas. Environ. Forensics. 20 (1) 77–91. https://doi.org/10.1080/15275922.2019.1566292
DASH JP, SARANGI A and SINGH DK (2010) Spatial variability of groundwater depth and quality parameters in the national capital territory of Delhi. Environ. Manage. 45 (3) 640–650. https://doi.org/10.1007/s00267-010-9436-z
DOLD B (2014) Evolution of acid mine drainage formation in sulphidic mine tailings. Minerals. 4 (3) 621–641. https://doi.org/10.3390/min 4030621
ERICKSON ML, MALENDA HF and BERQUIST EC (2018) How or when samples are collected affects measured arsenic concentration in new drinking water wells. Groundwater. 56 (6) 921–933. https://doi.org/10.1111/gwat.12643
FOMCHENKO N and MURAVYOV M (2020) Sequential bioleaching of pyritic tailings and ferric leaching of nonferrous slags as a method for metal recovery from mining and metallurgical wastes. Minerals. 10 (12) 1097. https://doi.org/10.3390/min10121097
FOX JA and WEISBERG S (2011) An R Companion to Applied Regression (2nd edn.) Sage Publications, Thousand Oaks, CA. 449 pp.
GAD M, DAHAB K and IBRAHIM H (2016) Impact of iron concentration as a result of groundwater exploitation on the Nubian sandstone aquifer in El Kharga Oasis, western desert, Egypt. NRIAG J. Astron. Geophys. 5 (1) 216–237. https://doi.org/10.1016/j.nrjag.2016.04.003
GANIYU SA, BADMUS BS, OLURIN OT and OJEKUNLE ZO (2018) Evaluation of seasonal variation of water quality using multivariate statistical analysis and regression parameter indices in Ajakanga area, Ibadan, Nigeria. Appl. Water Sci. 8 (1) 35. https://doi.org/ 10.1007/s13201-018-0677-y
GITARI MW, AKINYEMI SA, THOBAKGALE R, NGOEJANA PC, RAMUGONDO L, MATIDZA M, MHLONGO SE, DACOSTA FA and NEMAPATE N (2017) Physicochemical and mineralogical characterization of Musina mine copper and New Union gold mine tailings: Implications for fabrication of beneficial geopolymeric construction materials. J. Afr. Earth Sci. 137 218–228. https://doi.org/10.1016/j.jafrearsci.2017.10.016
GUO X, ZUO R, MENG L, WANG J, TENG Y, LIU X and CHEN M (2018) Seasonal and spatial variability of anthropogenic and natural factors influencing groundwater quality based on source apportionment. Int. J. Environ. Res. Public Health. 15 (2) 279. https://doi.org/10.3390/ijerph15020279
HAQUE A, JEWEL A, FERDOUSHI Z, BEGUM M, HUSAIN I and MONDAL S (2018) Carcinogenic and non-carcinogenic human health risk from exposure to heavy metals in surface water of Padma River. Res. J. Environ. Toxicol. 12 (1) 18–23. https://doi.org/10.3923/rjet.2018.18.23
HUSSAIN S, HABIB-UR-REHMAN M, KHANAM T, SHEER A, KEBIN Z and JIANJUN Y (2019) Health risk assessment of different heavy metals dissolved in drinking water. Int. J. Environ. Res. Public Health. 16 (10) 1737. https://doi.org/10.3390/ijerph16101737
IARC (International Agency for Research on Cancer) (993) IARC Monographs on the Evaluation of Carcinogenic Risks to Humans. Vol 58. IARC, Lyon.
JAISHANKAR M, TSETEN T, ANBALAGAN N, MATHEW BB and BEEREGOWDA KN (2014) Toxicity, mechanism and health effects of some heavy metals. Interdisc. Toxicol. 7 (2) 60–72. https://doi.org/10.2478/intox-2014-0009
JAVAID MS, KHALID L and ZESHAN KHALID MZ (2020) Analytical study of environmental impacts and their effects on groundwater hydrology. Groundwater Hydrol. https://doi.org/10.5772/intechopen. 88002
KALBSKOPF G (2002) Economic geology of the country around Bindura. Zimbabwe Geological Survey No. 97. Zimbabwe Geological Survey, Harare.
KANDA A, NCUBE F, GADAGA T, DUDU VP, MAKUMBE P and NYAMADZAWO G (2019) Contamination of soil around an abandoned gold mine tailings dam with trace elements in a small town, northeastern Zimbabwe. Int. J. Glob. Enviro. Issues 18 (4) 283–302. https://doi.org/10.1504/IJGENVI.2019.110429

455Water SA 47(4) 446–455 / Oct 2021https://doi.org/10.17159/wsa/2021.v47.i4.3851
KIM D-M, YUN S-T, CHO Y, HONG J-H and BATSAIKHAM B (2014) Hydrochemical assessment of environmental status of surface and groundwater in mine areas in South Korea: Emphasis on geochemical behaviours of metals and sulphate in groundwater. J. Geochem. Explor. 183 33–45. https://doi.org/10.1016/j.gexplo.2017.09.014
KIVENTERÄ J, LANCELLOTTI I, CATAURO M, POGGETTO FD, LEONELLI C and ILLIKAINEN M (2018) Alkali activation as new option for gold mine tailings inertization. J. Clean. Prod. 187 76–84. https://doi.org/10.1016/j.jclepro.2018.03.182
KOSSOFF D, DUBBLIN WE, ALFREDSSON M, EDWARDS SJ, MACKLIN MG and HUDSON-EDWARDS KA (2014) Mine tailings dams: characteristics, failure, environmental impacts and remediation. Appl. Geochem. 57 229–245. https://doi.org/10.1016/j.apgeochem.2014.09.010
LI C, ZHENG L, JIANG C, CHEN X and DING S (2021) Characteristics of leaching of heavy metals from low-sulfur coal gangue under different conditions. Int. J. Coal Sci. Technol. 8 780–789. https://doi.org/10.1007/s40789-021-00416-6
LI F, QIU Z, ZHANG J, LIU C, CAI Y and XIAO M (2017) Spatial distribution and fuzzy health risk assessment of trace elements in surface water from Honghu Lake. Int. J. Environ. Res. Public Health. 14 (9) 1011. https://doi.org/10.3390/ijerph14091011
LOCMELIS M, MELCHER F and OBERTHUR T (2010) Platinum-group element distribution in the oxidised main sulphide zone, Great Dyke, Zimbabwe. Miner Deposita. 45 93–109. https://doi.org/ 10.1007/s00126-009-0258-y
McCULLAGH P and NELDER JA (1989) Generalized Linear Models (2nd edn). Chapman and Hall, London.
MOHAMMADI AA, ZAREI A, MAJIDI S, GHADERPOURY A, HASHEMPOUR Y, SAGHI MH, ALINEJAD A, YOUSEFI M, HOSSEINGHOLIZADEH N and GHADERPOORI M (2019) Carcinogenic and non-carcinogenic health risk assessment of heavy metals in drinking water of Khorramabad, Iran. MethodsX. 6 1642–1651. https://doi.org/10.1016/j.mex.2019.07.017
MOHAPATRA DP and KIRPALANI DM (2017) Process effluents and mine tailings: sources, effects and management and role of nanotechnology. Nanotechnol. Environ. Eng. 2 (1). https://doi.org/ 10.1007/s41204-016-0011-6
NDOZIYA AT, HOKO Z and GUMINDOGA W (2019) Assessment of the impact of pit latrines on groundwater contamination in Hopley settlement, Harare, Zimbabwe. J. Water Sanit. Hyg. Dev. 9 (3) 464–476. https://doi.org/10.2166/washdev.2019.170
PALANSOORIYA KN, SHAHEEN SM, CHEN SS, TSANG DCW, HASHIMOTO Y, HOU D, BOLANH NS, RINKLEBE J and OK YS (2020) Soil amendments for immobilization of potentially toxic elements in contaminated soils: A critical review. Environ. Int. 134 105046. https://doi.org/10.1016/j.envint.2019.105046
PETRONIJEVIĆ N, STANKOVIĆ S, RADOVANOVIĆ D, SOKIĆ M, MARKOVIĆ B, STOPIĆ SR and KAMBEROVIĆ Ž (2019) Application of the flotation tailings as an alternative material for an acid mine drainage remediation: A case study of the extremely acidic Lake Robule (Serbia). Metals. 10 (1) 16. https://doi.org/10. 3390/met10010016
PRASAD B, KUMARI P, BANO S and KUMARI S (2014) Groundwater quality evaluation near mining area and development of heavy metal pollution index. Appl. Water Sci. 4 11–17. https://doi.org/10.1007/s13201-013-0126-x
R CORE TEAM (2019) R: A language and environment for statistical computing. Version 3.6.0. [Software]. R Foundation for Statistical Computing, Vienna. URL: https://www.R-project.org/ (Accessed 3 October 2019).
RAJMOHAN N, PATEL N, SINGH G and AMARASINGHE UA (2017) Hydrochemical evaluation and identification of geochemical processes in the shallow and deep wells in the Ramganga Sub-Basin, India. Environ. Sci. Pollut. Res. 24 (26) 21459–21475. https://doi.org/10.1007/s11356-017-9704-z
SINGH G and KAMAL RK (2017) Heavy metal contamination and its indexing approach for groundwater of Goa mining region, India. Appl. Water Sci. 7 (3) 1479–1485. https://doi.org/10.1007/s13201-016-0430-3
STEWART R, KORTH M, LANGER L, RAFFERTY S, DA SILVA N and VAN ROOYEN C (2013) What are the impacts of urban agriculture programs on food security in low and middle-income countries? Environ. Evidence. 2 (1) 7. https://doi.org/10.1186/2047-2382-2-7
SUJATHA D and REDDY BR (2003) Quality characterization of groundwater in the south-eastern part of the Ranga Reddy district, Andhra Pradesh. India. Environ. Geol. 44 (5) 579–586. https://doi.org/10.1007/s00254-003-0794-1
SUNITHA V and REDDY YS (2019) Hydrogeochemical evaluation of groundwater in and around Lakkireddipalli and Ramapuram, Y.S.R District, Andhra Pradesh, India. HydroResearch 2 85–96. https://doi.org/10.1016/j.hydres.2019.11.008
TEPANOSYAN G, MAGHAKYAN N, SAHAKYAN L and SAGHATELYAN A (2017) Heavy metals pollution levels and children health risk assessment of Yerevan kindergartens soil. Ecotoxicol. Environ. Saf. 142 257–265. https://doi.org/10.1016/j.ecoenv.2017.04.013
USEPA (United States Environmental Protection Agency) (1989) Risk assessment guidance for Superfund, Human Health Evaluation Manual. EPA/540/1-89/002 Vol. I. Office of Emergency and Remedial Response, USEPA, Washington (DC). URL: https://www.epa.gov/sites/production/files/2015-09/documents/part_e_final_revision_10-03-07.pdf (Accessed 19 July 2019).
USEPA (United States Environmental Protection Agency) (2001) Method 200.7: Trace elements in water, solids and biosolids by inductively coupled plasma –atomic emission spectrometry. Revision 5.0. Office of Science and Technology, USEPA, Washington (DC).
USEPA (United States Environmental Protection Agency) (2011) Expo-sure Factors Handbook (2011 edn). EPA/600/R-09/052F. National Center for Environmental Assessment, USEPA, Washington DC. http://www.epa.gov/ncea/efh (Accessed 28 Oct 2019).
VENABLES WN and RIPLEY BD (2002) Modern Applied Statistics with the S-Plus (4th edn). Springer, UK.
WALPOLE SC, PRIETO-MERINO D, EDWARDS P, CLELAND J, STEVENS G and ROBERTS I (2012) The weight of nations: an estimation of adult human biomass. BMC Public Health. 12 (1) 439. https://doi.org/10.1186/1471-2458-12-439
WHO (World Health Organisation) (2017) Chapter 12: Chemical fact sheets. Guidelines for Drinking-Water Quality (4th edn). Incorporating the first addendum. WHO, Geneva. URL: https://apps.who.int/iris/bitstream/handle/10665/254637/9789241549950-eng.pdf?sequence=1 (Accessed 28 October 2019).
WUANA RA and OKIEIMEN FE (2011) Heavy metals in contaminated soils: a review of sources, chemistry, risks and best available strategies for remediation. ISRN Ecology. 2011 Article ID 402647. https://doi.org/10.5402/2011/402647
YAN B, STUTE M, PANETTIERI RA Jr, ROSS J, MAILLOUX B, NEIDELL MJ, SOARES L, HOWARTH M, LIU X, SABERI P and CHILLRUD SN (2017) Association of groundwater constituents with topography and distance to unconventional gas wells in NE Pennsylvania. Sci. Total Environ. 15 577 195–201. https://doi.org/ 10.1016/j.scitotenv.2016.10.160
ZHU H, ZHOU J, SONG T, FENG H, LIU Z, LIU H and REN X (2020). Influences of natural and anthropogenic processes on the groundwater quality in the Dagujia River Basin in Yantai, China. J. Water Suppl. Res. Technol. 69 (2) 184–196. https://doi.org/10.2166/aqua.2019.113
ZHUANG P, LU H, LI Z, ZOU B and MCBRIDE MB (2014) Multiple exposure and effects assessment of heavy metals in the population near mining area in South China. PLoS ONE. 9 (4) e94484. https://doi.org/10.1371/journal.pone.0094484
ZINGONI E, LOVE D, MAGADZA C, MOYCE W and MUSIWA K (2005) Effects of a semi-formal urban settlement on groundwater quality Epworth (Zimbabwe): Case study and groundwater quality zoning. Phys. Chem. Earth. 30 (11–16) 680–688. https://doi.org/ 10.1016/j.pce.2005.08.008


![Control of acid mine drainage from an abandoned mine in ... · exploitation of Moroccan phosphates ... groundwater [46, 47] ... rotary kilns during production of cement clinker [40]](https://img.pdfslide.us/doc/110x75/5adb97d47f8b9ae1768eb9da/control-of-acid-mine-drainage-from-an-abandoned-mine-in-of-moroccan-phosphates.jpg)