Embed Size (px)
Citation preview
Journal of Geoscience and Environment Protection, 2019, 7, 275-293 http://www.scirp.org/journal/gep
ISSN Online: 2327-4344 ISSN Print: 2327-4336
DOI: 10.4236/gep.2019.75020 May 31, 2019 275 Journal of Geoscience and Environment Protection
Geochemical Investigation of Metals and Trace Elements around the Abandoned Cu-Ni Mine Site in Selibe Phikwe, Botswana
Fiona S. Motswaiso, Kengo Nakamura, Noriaki Watanabe, Takeshi Komai
Graduate School of Environmental Studies, Tohoku University, Sendai, Japan
Abstract Metals and trace elements may occur naturally in rocks and soils, but elevated quantities of them are gradually released into the environment by anthropo-genic activities such as mining. The current study aims at characterizing the spatial distribution of trace elements and evaluate site-specific geochemical background concentrations of trace elements in the mine soils and river se-diments and also to discriminate between lithogenic and anthropogenic sources of enrichment around a copper-nickel mining town in Selibe-Phikwe, Botswana. A total of 43 soil, 30 river sediments, and 9 river water samples were collected from an area of 500 m2 within the precincts of the mine. The total concentration of Cu, Ni, Cr, As, Co and Zn in soils and sediments were determined using ED-XRF while river water samples were analyzed by ICP-AES. Geochemical pollution indices such as Geo-accumulation Index (Igeo), Enrichment Factor (EF) and Integrated Pollution Index (IPI) were employed for the assessment of metal and trace element contamination. The average metal concentration in soil of Cu, Ni, Cr, As, Co and Zn in the study area were 109.8, 107.1, 72.0, 2.3, 7.8 and 36.1 mg/kg, respectively. To calculate the geochemical baseline, Relative cumulative frequency curves and the 4 s -outlier test methods suggested by Matschullat et al. (2000) were incorpo-rated. The estimated average baseline concentrations of Cr, Cu, Ni, Co, Zn and As are 53.8, 51.85, 53.95, 5.6, 32.36 and 4.27 mg∙kg1, respectively. Soil leachate, sediment leachate and river water pH levels ranged from basic (9) to very acidic (3) in areas closer to the mine. There is high variation in heavy metal concentration, e.g. Cu, depicting regional natural background concen-trations while others depict anthropogenic sources. The calculated Igeo values revealed moderate pollution level by the same metals. The result of integrated pollution indices suggested a generally deteriorating site quality. The results of chemical analysis also indicate that the trace elements in soils decreased
How to cite this paper: Motswaiso, F. S., Nakamura, K., Watanabe, N., & Komai, T. (2019). Geochemical Investigation of Met-als and Trace Elements around the Aban-doned Cu-Ni Mine Site in Selibe Phikwe, Botswana. Journal of Geoscience and En-vironment Protection, 7, 275-293. https://doi.org/10.4236/gep.2019.75020 Received: February 25, 2019 Accepted: May 28, 2019 Published: May 31, 2019
F. S. Motswaiso et al.
DOI: 10.4236/gep.2019.75020 276 Journal of Geoscience and Environment Protection
with respect to distance from the mine; controlled mainly by water move-ment, wind direction, and topography.
Keywords Soil Contamination, Geochemical Baseline, Pollution Indices, Trace Elements
1. Introduction
Mining activities are responsible for different types of environmental problems all over the world. Heavy metals often find their way in the vicinity of high Cu, Ni and Zn sulphides ores, (Barrie et al. 2008), and their exploitation and processing (Ngole & Ekosse, 2012). In contrast to other pollutants such as petro-leum hydrocarbons and domestic or municipal litter which may visibly build up in the environment, heavy metals in the environment often accumulate unno-ticed to toxic levels. They tend to settle on river beds or persist in streams or land for long periods of time, providing a long-term source of contamination to the surrounding inhabitants. These heavy metals have the potential to harm the environment and human health as they continue causing damage long time after mining has ceased. Due to the deterioration of water and soil quality due to the impacts of heavy metals, there was a need to study the heavy metals around the defunct copper mining at Selibe Phikwe to establish their levels of concentration and dispersion in the area, as well as their source.
Numerous reports and publications have discussed the issue of anthropogenic contamination of soils in mining districts (e.g., Dudka & Adriano, 1997). The environmental degradation of the BCL mining area is poorly quantified in spa-tial terms because the availability of high precision and up-to-date regional geo-chemical data for both unpolluted and polluted regions is limited. Nonetheless, a study by Likuku et al. have examined the status of soil pollution and degree of pollution in this area, however, the research was mainly based on a few metals in soils but not in river sediments and water; information which in itself is limiting considering that the river might be receiving considerable amounts of heavy metal inputs from the mine, and therefore contaminated with many other metals as well. In addition, there is no information on ecological and health risk as-sessment of metal contaminants around the BCL mine. These assessments are essential as they provide policy makers with information on the extent of aquatic ecosystem contamination and are used as early-warning signals of ecological challenges. In order to assess the real heavy metal contamination status of sur-face sediments and surrounding soils of Selebi Phikwe area, we have carried out an investigation in this region. To achieve a comprehensive assessment of the impacts of heavy metals, we characterized the spatial distribution of trace ele-ments in soils, sediments and river water and different indexes were applied in-cluding geo-accumulation index (Igeo), pollution load index (PLI) were applied. The main objective of this study is to get more information on the heavy metal
F. S. Motswaiso et al.
DOI: 10.4236/gep.2019.75020 277 Journal of Geoscience and Environment Protection
pollution status in this area by characterizing the spatial distribution of trace elements and investigating the degree of contamination of Cu, Ni and Zn in soils around the Selebi Phikwe Cu-Ni mine and provide guidance for dredging and remediation projects after mine closure.
2. The Survey Area 2.1. Description of the Study Area
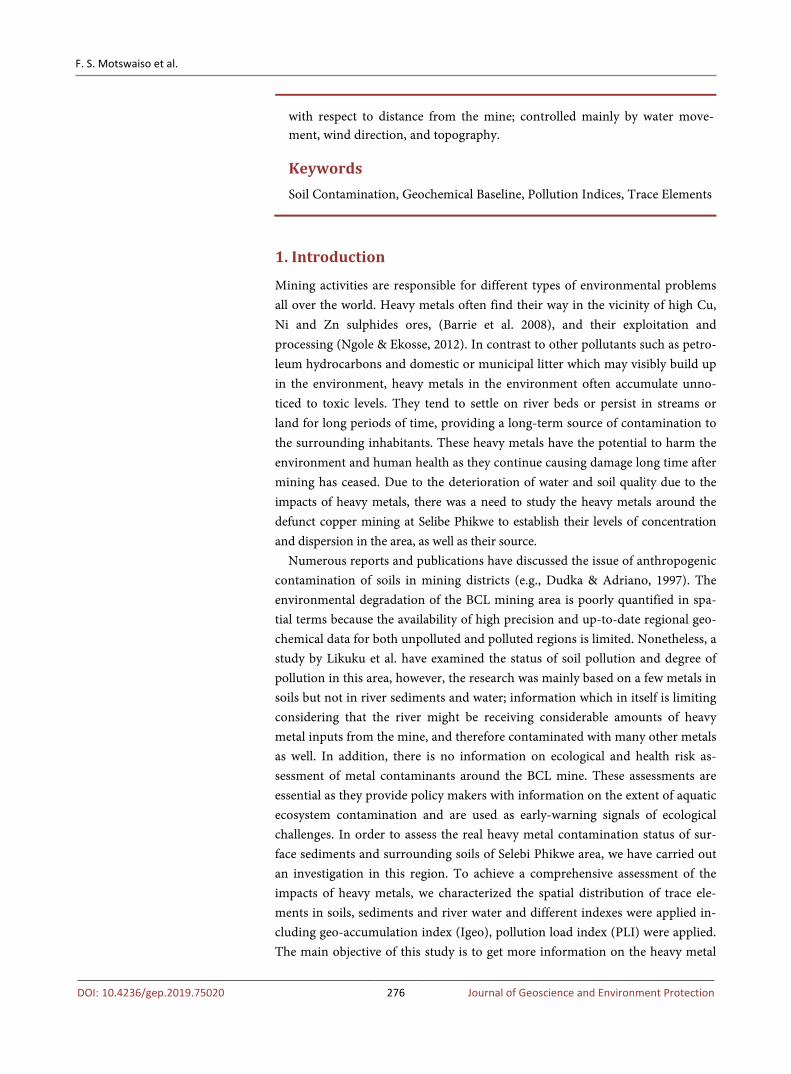
The study area is located in the eastern part of Botswana along the Motloutse River from Mmadinare in the west to Tobane in the south, roughly between la-titudes 21˚50' and 22˚0' and longitudes 27˚45' and 28˚00' (Figure 1). Selibe Phikwe area receives an average annual rainfalls of 418 mm, 90% of which is concentrated between October and March. The mean maximum temperature varies from low in June (13.0˚C) to a high of 39˚C in October. The mean mini-mum temperature ranges from 5˚C in July to 20˚C in January. The area is cha-racterized by soils weathered from metamorphic and acid igneous rocks, as well as soils derived from alluvial sediments. The four main soil types are ferric luvi-sols, haplic luvisols eutric regosols as shown on Figure 2. Most of the soils in the area have a rustic moisture regime (between humid and aridic) (De Wit & Bekker, 1990).
2.2. Geology
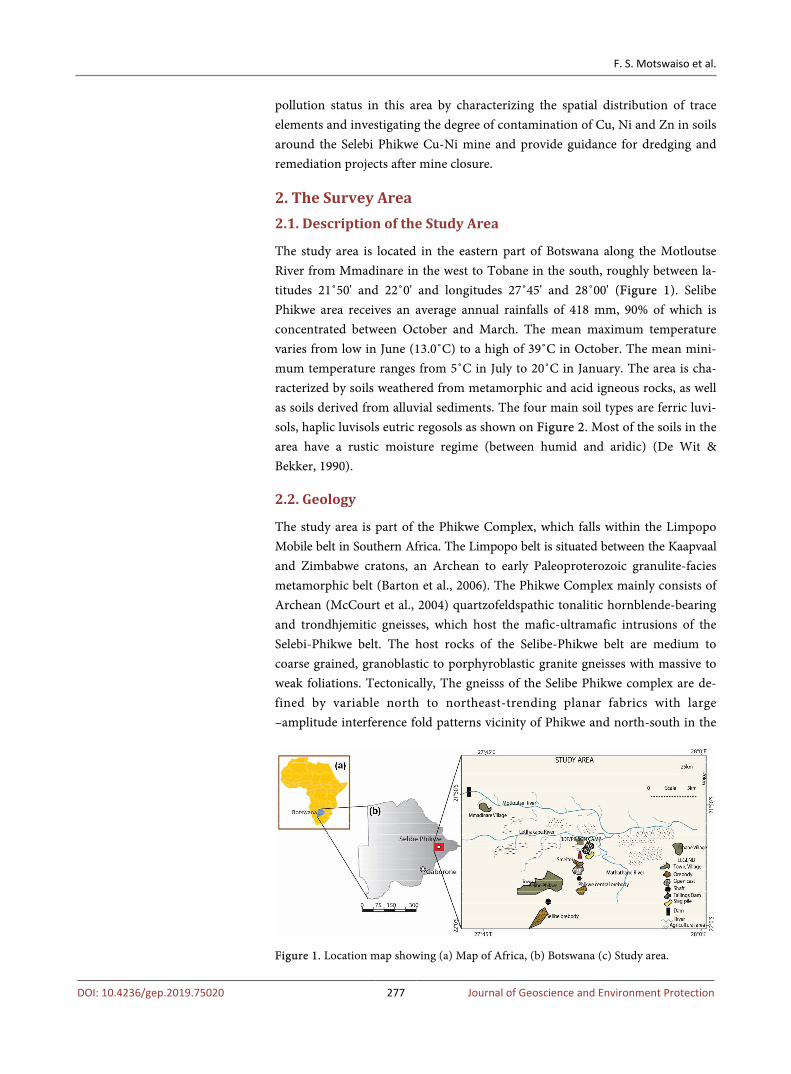
The study area is part of the Phikwe Complex, which falls within the Limpopo Mobile belt in Southern Africa. The Limpopo belt is situated between the Kaapvaal and Zimbabwe cratons, an Archean to early Paleoproterozoic granulite-facies metamorphic belt (Barton et al., 2006). The Phikwe Complex mainly consists of Archean (McCourt et al., 2004) quartzofeldspathic tonalitic hornblende-bearing and trondhjemitic gneisses, which host the mafic-ultramafic intrusions of the Selebi-Phikwe belt. The host rocks of the Selibe-Phikwe belt are medium to coarse grained, granoblastic to porphyroblastic granite gneisses with massive to weak foliations. Tectonically, The gneisss of the Selibe Phikwe complex are de-fined by variable north to northeast-trending planar fabrics with large –amplitude interference fold patterns vicinity of Phikwe and north-south in the
Figure 1. Location map showing (a) Map of Africa, (b) Botswana (c) Study area.
F. S. Motswaiso et al.
DOI: 10.4236/gep.2019.75020 278 Journal of Geoscience and Environment Protection
Figure 2. Detailed geological map of the study area showing different lithologies. southern part of the complex. McCourt et al. (2004) estimated the age of granit-ic-gneisses to be between 2.6 and 2.65 billion years (Ga). The Phikwe copper deposit is one of the intrusions comprising the Selebi, central Phikwe and Selebi North deposits. Pyrrhotite, pentlandite and chalcopyrite are the main sulfide minerals in the study area (Maier et al., 2008). Bravoite, pyrite, marcasite and pyrite forms part of minor sulfides (Maier et al., 2008). Magnetite constitutes up to 20 volume percentage (vol. %) of the opaque fraction in the form of euhedral and anhedral grains. Most of the host rocks of the Selebi-Phikwe belt contain < 200 mg/kg sulphur, but sedimentary rocks with higher S contents reaching sev-eral 1000 mg/kg occur locally (Maier et al., 2008).
3. Materials and Methods 3.1. Sampling Procedures
In the present study, stratified regular sampling method was adopted for soil sample collection as in geo-assessment of the variables estimated; the stratified regular sampling is more suitable because this kind of sampling draws homo-genous error (Burges & Webster, 1980; Burges et al., 1981). The global position-ing system (GPS) was used to identify the precise locations of all sampling sites. A total of 45 topsoil samples were collected from an area of about 500 km2 to evaluate the spatial distributions of the heavy metals in the vicinity of the mine. Sampling locations are presented on Figure 3.
Two topsoil samples were taken away from the sampling area, far from people or industrial activity, representing soil background values. Soil samples were
F. S. Motswaiso et al.
DOI: 10.4236/gep.2019.75020 279 Journal of Geoscience and Environment Protection
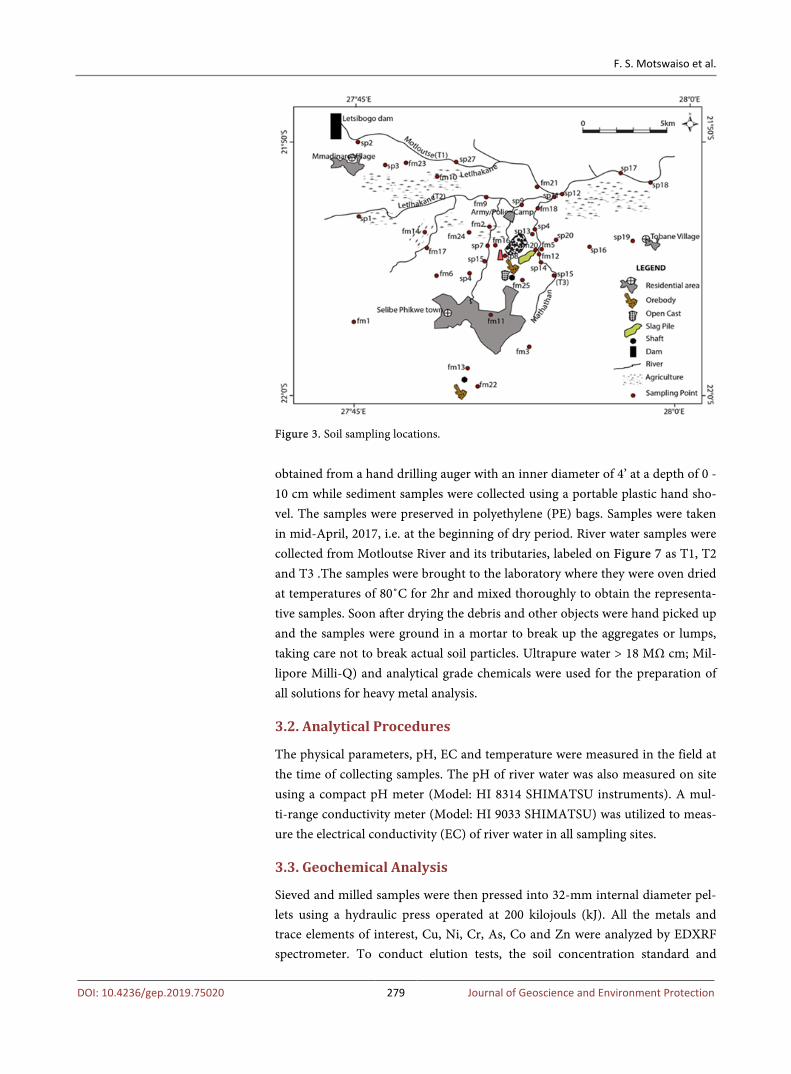
Figure 3. Soil sampling locations.
obtained from a hand drilling auger with an inner diameter of 4’ at a depth of 0 - 10 cm while sediment samples were collected using a portable plastic hand sho-vel. The samples were preserved in polyethylene (PE) bags. Samples were taken in mid-April, 2017, i.e. at the beginning of dry period. River water samples were collected from Motloutse River and its tributaries, labeled on Figure 7 as T1, T2 and T3 .The samples were brought to the laboratory where they were oven dried at temperatures of 80˚C for 2hr and mixed thoroughly to obtain the representa-tive samples. Soon after drying the debris and other objects were hand picked up and the samples were ground in a mortar to break up the aggregates or lumps, taking care not to break actual soil particles. Ultrapure water > 18 MΩ cm; Mil-lipore Milli-Q) and analytical grade chemicals were used for the preparation of all solutions for heavy metal analysis.
3.2. Analytical Procedures
The physical parameters, pH, EC and temperature were measured in the field at the time of collecting samples. The pH of river water was also measured on site using a compact pH meter (Model: HI 8314 SHIMATSU instruments). A mul-ti-range conductivity meter (Model: HI 9033 SHIMATSU) was utilized to meas-ure the electrical conductivity (EC) of river water in all sampling sites.
3.3. Geochemical Analysis
Sieved and milled samples were then pressed into 32-mm internal diameter pel-lets using a hydraulic press operated at 200 kilojouls (kJ). All the metals and trace elements of interest, Cu, Ni, Cr, As, Co and Zn were analyzed by EDXRF spectrometer. To conduct elution tests, the soil concentration standard and
F. S. Motswaiso et al.
DOI: 10.4236/gep.2019.75020 280 Journal of Geoscience and Environment Protection
soil-leaching standard were carried out. Soil concentration standard involves acid elution which represents direct ingestion from soil or sediment, while soil leaching standard entails pure water elution which relates to groundwater inges-tion from soil or sediments. The procedures were performed adopting the guide-lines presented by Nakamura et al. (2016), 1.5 g of soil/sediment sample was mixed with 50 mL HCl (1.0 M), then shaken in a 200 rpm shaker for two hours to conduct the soil concentration standard tests. The soil leaching standard tests were performed by adding 50 ml pure water to 5 g soil sample, shaking in a 200 rpm shaker for six hours, then solutions were then filtered to 0.45 μm membrane filter (Nakamura et al., 2016). Afterwards, the elements were analyzed in AIST, Geological Survey of Japan, Department of Geo-resources and Environment la-boratory with Inductively Coupled Plasma Atomic Emission Spectrometry (ICP-AES, SPS 3500DD, SII) using internal standard concentration. The pH and Electrical Conductivity (EC) of the soil and sediment-water elution filtrate were measured.
3.4. Pollution Assessment Indices
In this study, five different indices or criteria were used to properly assess heavy metal pollution in the environment around the BCL mine.
Baseline determination The baseline was computed by incorporating the cumulative frequency me-
thod and the Iterative-2std-DEV technique both proposed by Matschullat et al. (2000). Matschullat et al. (2000) explained the 2std-DEV technique as a more radical and mathematically less robust method, that’s why the two methods were incorporated to comprehend each other.
Geoaccumulation index, Igeo Geoaccumulation index, Igeo indicates the degree of pollution of soil or sedi-
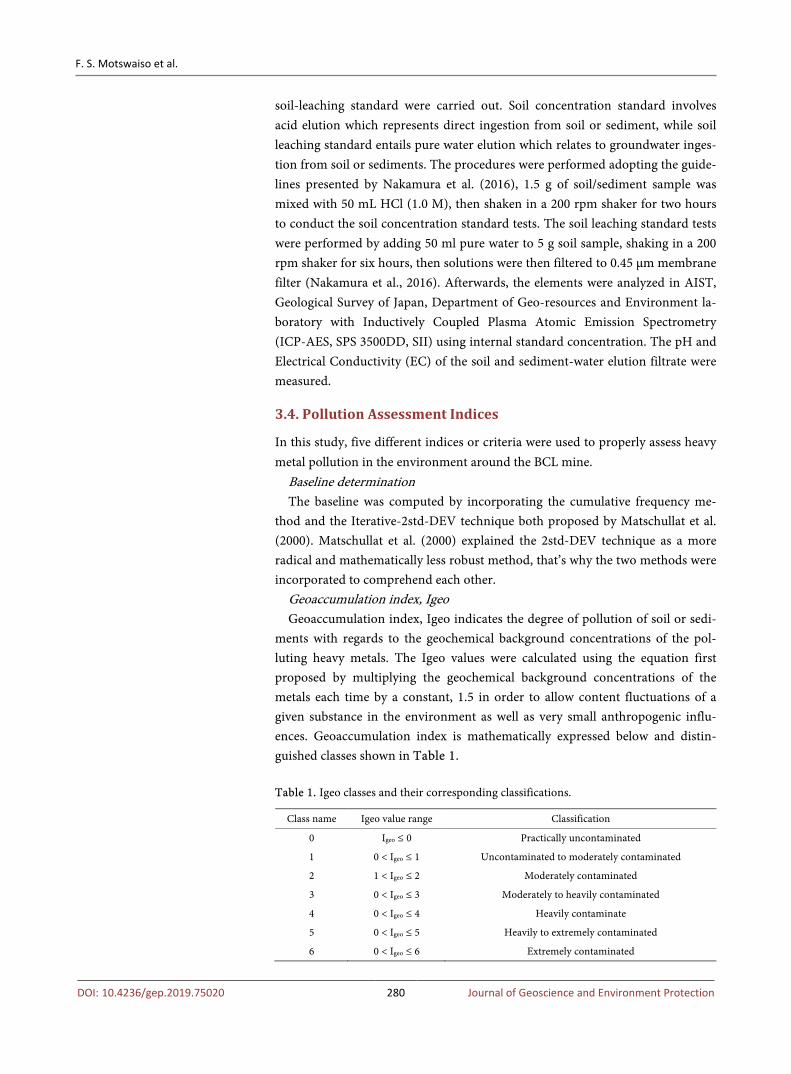
ments with regards to the geochemical background concentrations of the pol-luting heavy metals. The Igeo values were calculated using the equation first proposed by multiplying the geochemical background concentrations of the metals each time by a constant, 1.5 in order to allow content fluctuations of a given substance in the environment as well as very small anthropogenic influ-ences. Geoaccumulation index is mathematically expressed below and distin-guished classes shown in Table 1.
Table 1. Igeo classes and their corresponding classifications.
Class name Igeo value range Classification
0 Igeo ≤ 0 Practically uncontaminated
1 0 < Igeo ≤ 1 Uncontaminated to moderately contaminated
2 1 < Igeo ≤ 2 Moderately contaminated
3 0 < Igeo ≤ 3 Moderately to heavily contaminated
4 0 < Igeo ≤ 4 Heavily contaminate
5 0 < Igeo ≤ 5 Heavily to extremely contaminated
6 0 < Igeo ≤ 6 Extremely contaminated
F. S. Motswaiso et al.
DOI: 10.4236/gep.2019.75020 281 Journal of Geoscience and Environment Protection
2log1.5
n
n
CB
Igeo
=
(1)
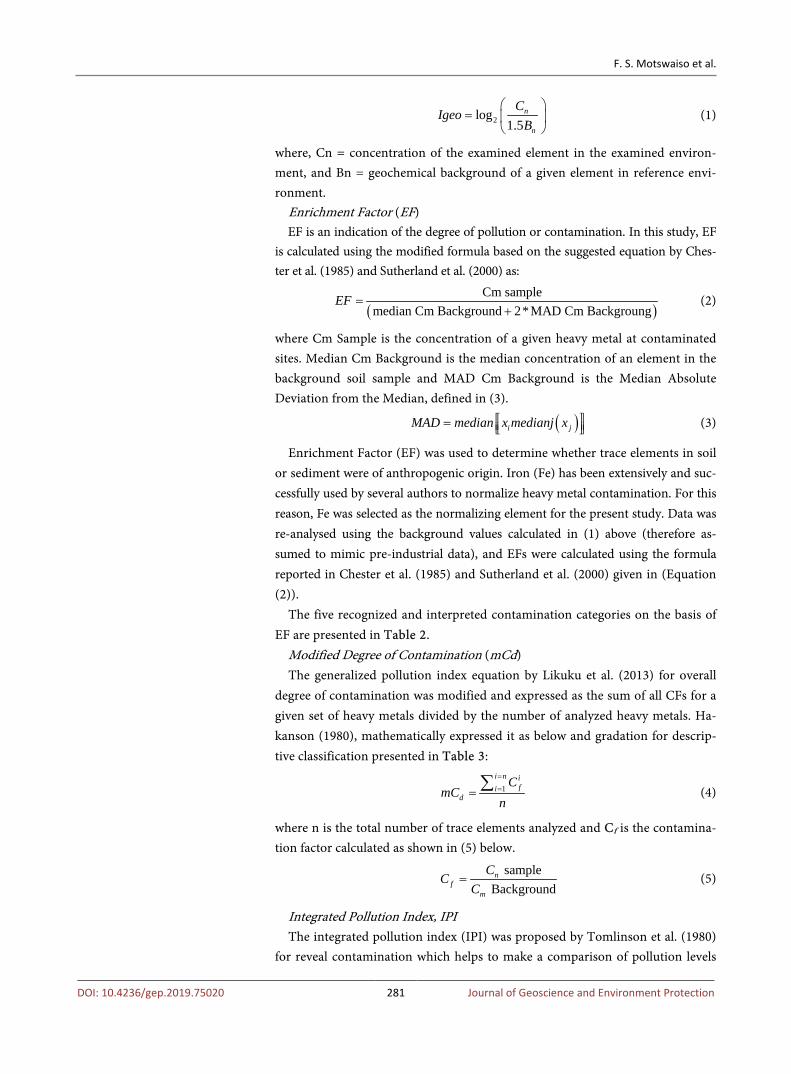
where, Cn = concentration of the examined element in the examined environ-ment, and Bn = geochemical background of a given element in reference envi-ronment.
Enrichment Factor (EF) EF is an indication of the degree of pollution or contamination. In this study, EF
is calculated using the modified formula based on the suggested equation by Ches-ter et al. (1985) and Sutherland et al. (2000) as:
( )Cm sample
median Cm Background 2*MAD Cm BackgroungEF =
+ (2)
where Cm Sample is the concentration of a given heavy metal at contaminated sites. Median Cm Background is the median concentration of an element in the background soil sample and MAD Cm Background is the Median Absolute Deviation from the Median, defined in (3).
( )i jMAD median x medianj x=
(3)
Enrichment Factor (EF) was used to determine whether trace elements in soil or sediment were of anthropogenic origin. Iron (Fe) has been extensively and suc-cessfully used by several authors to normalize heavy metal contamination. For this reason, Fe was selected as the normalizing element for the present study. Data was re-analysed using the background values calculated in (1) above (therefore as-sumed to mimic pre-industrial data), and EFs were calculated using the formula reported in Chester et al. (1985) and Sutherland et al. (2000) given in (Equation (2)).
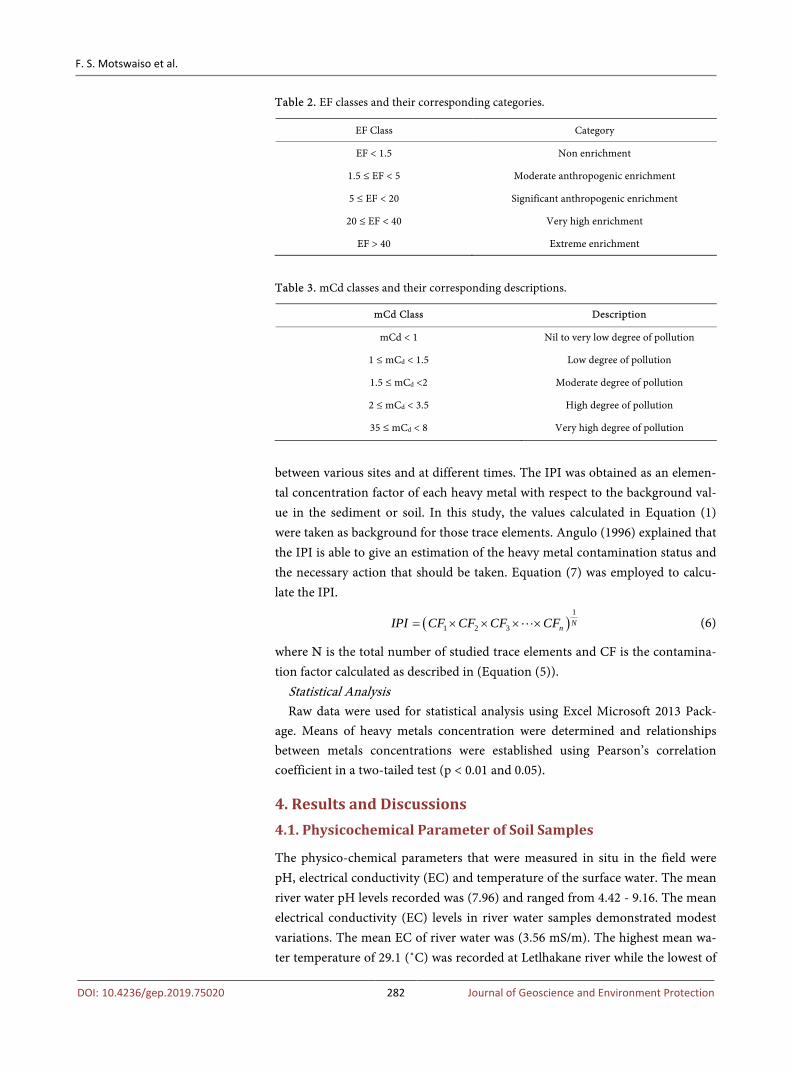
The five recognized and interpreted contamination categories on the basis of EF are presented in Table 2.
Modified Degree of Contamination (mCd) The generalized pollution index equation by Likuku et al. (2013) for overall
degree of contamination was modified and expressed as the sum of all CFs for a given set of heavy metals divided by the number of analyzed heavy metals. Ha-kanson (1980), mathematically expressed it as below and gradation for descrip-tive classification presented in Table 3:
1i n i
fid
CmC
n
=
== ∑ (4)
where n is the total number of trace elements analyzed and Cf is the contamina-tion factor calculated as shown in (5) below.
sample Background
n
mf
CC
C = (5)
Integrated Pollution Index, IPI The integrated pollution index (IPI) was proposed by Tomlinson et al. (1980)
for reveal contamination which helps to make a comparison of pollution levels
F. S. Motswaiso et al.
DOI: 10.4236/gep.2019.75020 282 Journal of Geoscience and Environment Protection
Table 2. EF classes and their corresponding categories.
EF Class Category
EF < 1.5 Non enrichment
1.5 ≤ EF < 5 Moderate anthropogenic enrichment
5 ≤ EF < 20 Significant anthropogenic enrichment
20 ≤ EF < 40 Very high enrichment
EF > 40 Extreme enrichment
Table 3. mCd classes and their corresponding descriptions.
mCd Class Description
mCd < 1 Nil to very low degree of pollution
1 ≤ mCd < 1.5 Low degree of pollution
1.5 ≤ mCd <2 Moderate degree of pollution
2 ≤ mCd < 3.5 High degree of pollution
35 ≤ mCd < 8 Very high degree of pollution
between various sites and at different times. The IPI was obtained as an elemen-tal concentration factor of each heavy metal with respect to the background val-ue in the sediment or soil. In this study, the values calculated in Equation (1) were taken as background for those trace elements. Angulo (1996) explained that the IPI is able to give an estimation of the heavy metal contamination status and the necessary action that should be taken. Equation (7) was employed to calcu-late the IPI.
( )1
1 2 3 NnIPI CF CF CF CF= × × × × (6)
where N is the total number of studied trace elements and CF is the contamina-tion factor calculated as described in (Equation (5)).
Statistical Analysis Raw data were used for statistical analysis using Excel Microsoft 2013 Pack-
age. Means of heavy metals concentration were determined and relationships between metals concentrations were established using Pearson’s correlation coefficient in a two-tailed test (p < 0.01 and 0.05).
4. Results and Discussions 4.1. Physicochemical Parameter of Soil Samples
The physico-chemical parameters that were measured in situ in the field were pH, electrical conductivity (EC) and temperature of the surface water. The mean river water pH levels recorded was (7.96) and ranged from 4.42 - 9.16. The mean electrical conductivity (EC) levels in river water samples demonstrated modest variations. The mean EC of river water was (3.56 mS/m). The highest mean wa-ter temperature of 29.1 (˚C) was recorded at Letlhakane river while the lowest of
F. S. Motswaiso et al.
DOI: 10.4236/gep.2019.75020 283 Journal of Geoscience and Environment Protection
18.2 (˚C) was obtained at downstream of Motloutse river. Stream and river temperatures varied relatively with response to environmental fluctuations of ambient air temperatures.
The mean pH of the soil was 7.9 (ranging from 3.79 to 7.70). Sampling sites located NW of the smelter, which is also the windward direction, had the lowest pH values. The average EC of soil in the studied area was 11.40 mS/m. Soil EC and other soil parameters are especially crucial in soil processes responsible for transportation and solubility of trace elements in soil (Matthews-amune & Ka-kulu, 2012).
The pH values of the stream sediments samples in all the sites ranged from 4.37 to 8.90 with a mean value of 7.65. pH values decreased with distance from the mine, indicating that mining activities play an essential role in the acidity of sediments.
4.2. Total Concentration and Spatial Distribution of Heavy Metal in Soils, River Sediments and Rocks
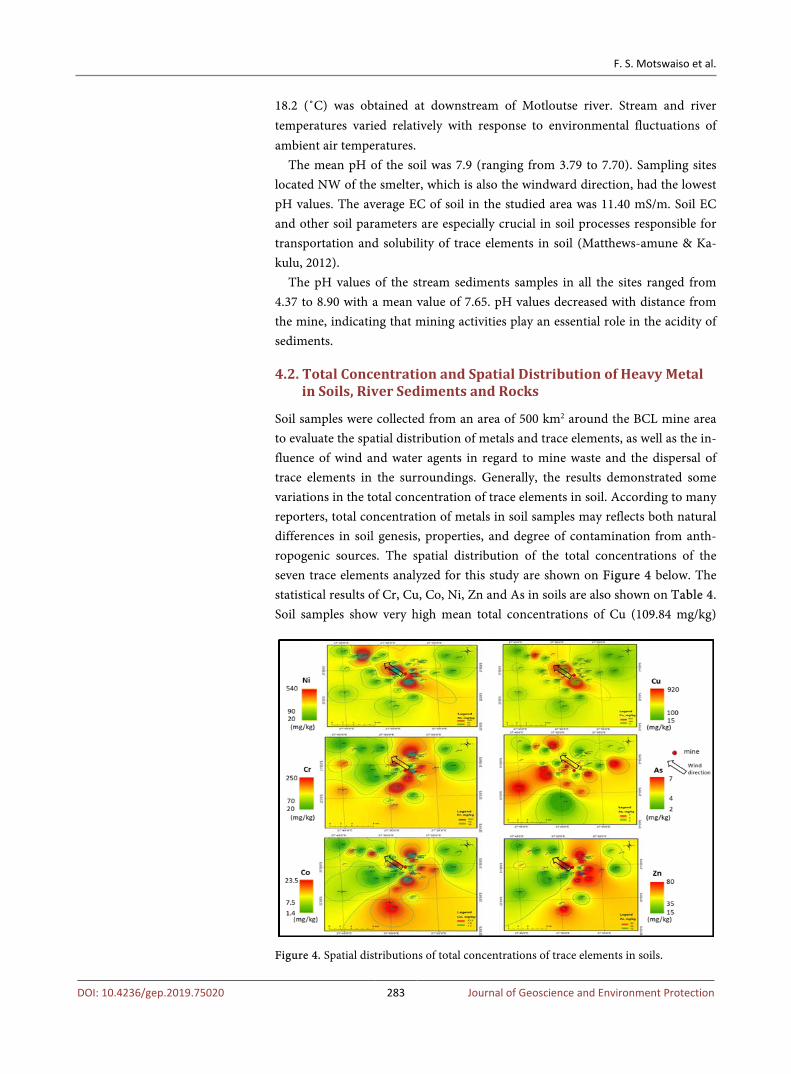
Soil samples were collected from an area of 500 km2 around the BCL mine area to evaluate the spatial distribution of metals and trace elements, as well as the in-fluence of wind and water agents in regard to mine waste and the dispersal of trace elements in the surroundings. Generally, the results demonstrated some variations in the total concentration of trace elements in soil. According to many reporters, total concentration of metals in soil samples may reflects both natural differences in soil genesis, properties, and degree of contamination from anth-ropogenic sources. The spatial distribution of the total concentrations of the seven trace elements analyzed for this study are shown on Figure 4 below. The statistical results of Cr, Cu, Co, Ni, Zn and As in soils are also shown on Table 4. Soil samples show very high mean total concentrations of Cu (109.84 mg/kg)
Figure 4. Spatial distributions of total concentrations of trace elements in soils.
F. S. Motswaiso et al.
DOI: 10.4236/gep.2019.75020 284 Journal of Geoscience and Environment Protection
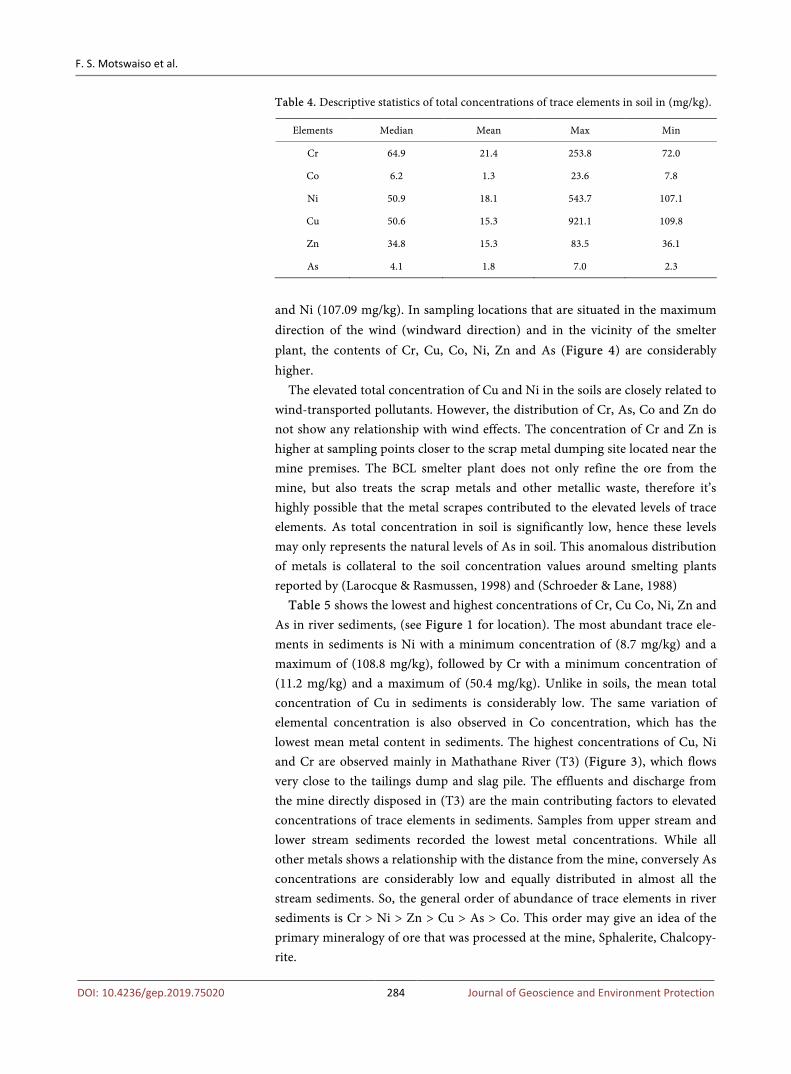
Table 4. Descriptive statistics of total concentrations of trace elements in soil in (mg/kg).
Elements Median Mean Max Min
Cr 64.9 21.4 253.8 72.0
Co 6.2 1.3 23.6 7.8
Ni 50.9 18.1 543.7 107.1
Cu 50.6 15.3 921.1 109.8
Zn 34.8 15.3 83.5 36.1
As 4.1 1.8 7.0 2.3
and Ni (107.09 mg/kg). In sampling locations that are situated in the maximum direction of the wind (windward direction) and in the vicinity of the smelter plant, the contents of Cr, Cu, Co, Ni, Zn and As (Figure 4) are considerably higher.
The elevated total concentration of Cu and Ni in the soils are closely related to wind-transported pollutants. However, the distribution of Cr, As, Co and Zn do not show any relationship with wind effects. The concentration of Cr and Zn is higher at sampling points closer to the scrap metal dumping site located near the mine premises. The BCL smelter plant does not only refine the ore from the mine, but also treats the scrap metals and other metallic waste, therefore it’s highly possible that the metal scrapes contributed to the elevated levels of trace elements. As total concentration in soil is significantly low, hence these levels may only represents the natural levels of As in soil. This anomalous distribution of metals is collateral to the soil concentration values around smelting plants reported by (Larocque & Rasmussen, 1998) and (Schroeder & Lane, 1988)
Table 5 shows the lowest and highest concentrations of Cr, Cu Co, Ni, Zn and As in river sediments, (see Figure 1 for location). The most abundant trace ele-ments in sediments is Ni with a minimum concentration of (8.7 mg/kg) and a maximum of (108.8 mg/kg), followed by Cr with a minimum concentration of (11.2 mg/kg) and a maximum of (50.4 mg/kg). Unlike in soils, the mean total concentration of Cu in sediments is considerably low. The same variation of elemental concentration is also observed in Co concentration, which has the lowest mean metal content in sediments. The highest concentrations of Cu, Ni and Cr are observed mainly in Mathathane River (T3) (Figure 3), which flows very close to the tailings dump and slag pile. The effluents and discharge from the mine directly disposed in (T3) are the main contributing factors to elevated concentrations of trace elements in sediments. Samples from upper stream and lower stream sediments recorded the lowest metal concentrations. While all other metals shows a relationship with the distance from the mine, conversely As concentrations are considerably low and equally distributed in almost all the stream sediments. So, the general order of abundance of trace elements in river sediments is Cr > Ni > Zn > Cu > As > Co. This order may give an idea of the primary mineralogy of ore that was processed at the mine, Sphalerite, Chalcopy-rite.
F. S. Motswaiso et al.
DOI: 10.4236/gep.2019.75020 285 Journal of Geoscience and Environment Protection
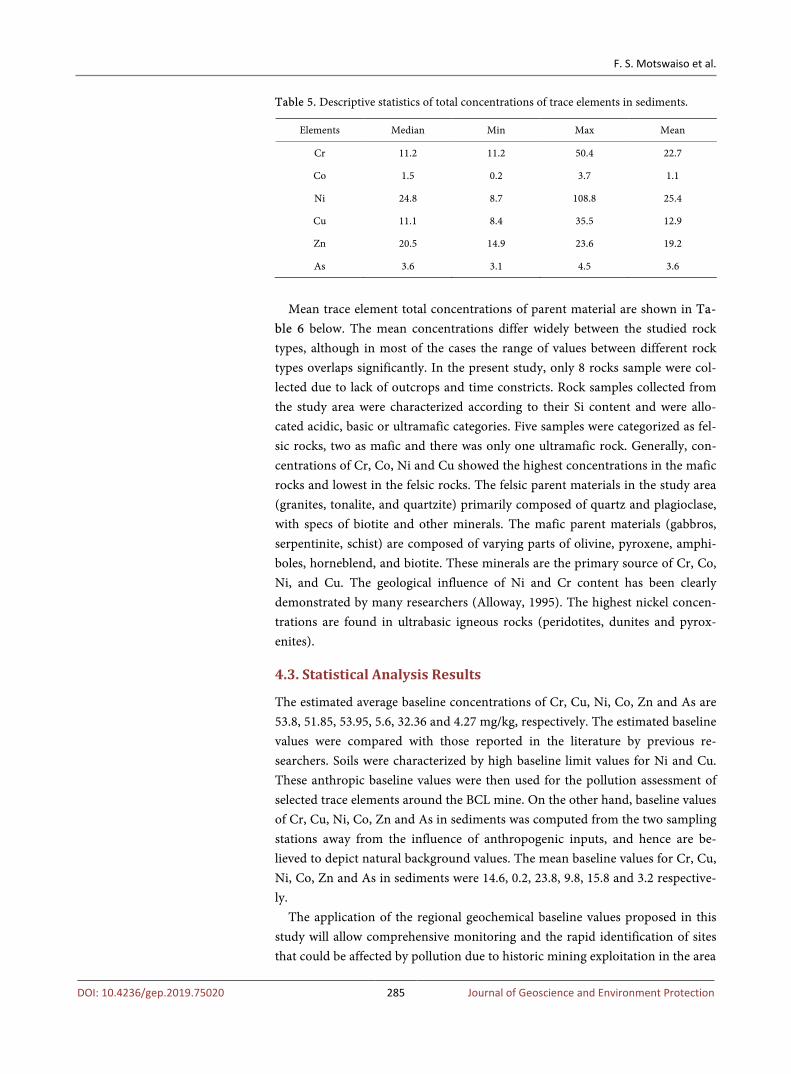
Table 5. Descriptive statistics of total concentrations of trace elements in sediments.
Elements Median Min Max Mean
Cr 11.2 11.2 50.4 22.7
Co 1.5 0.2 3.7 1.1
Ni 24.8 8.7 108.8 25.4
Cu 11.1 8.4 35.5 12.9
Zn 20.5 14.9 23.6 19.2
As 3.6 3.1 4.5 3.6
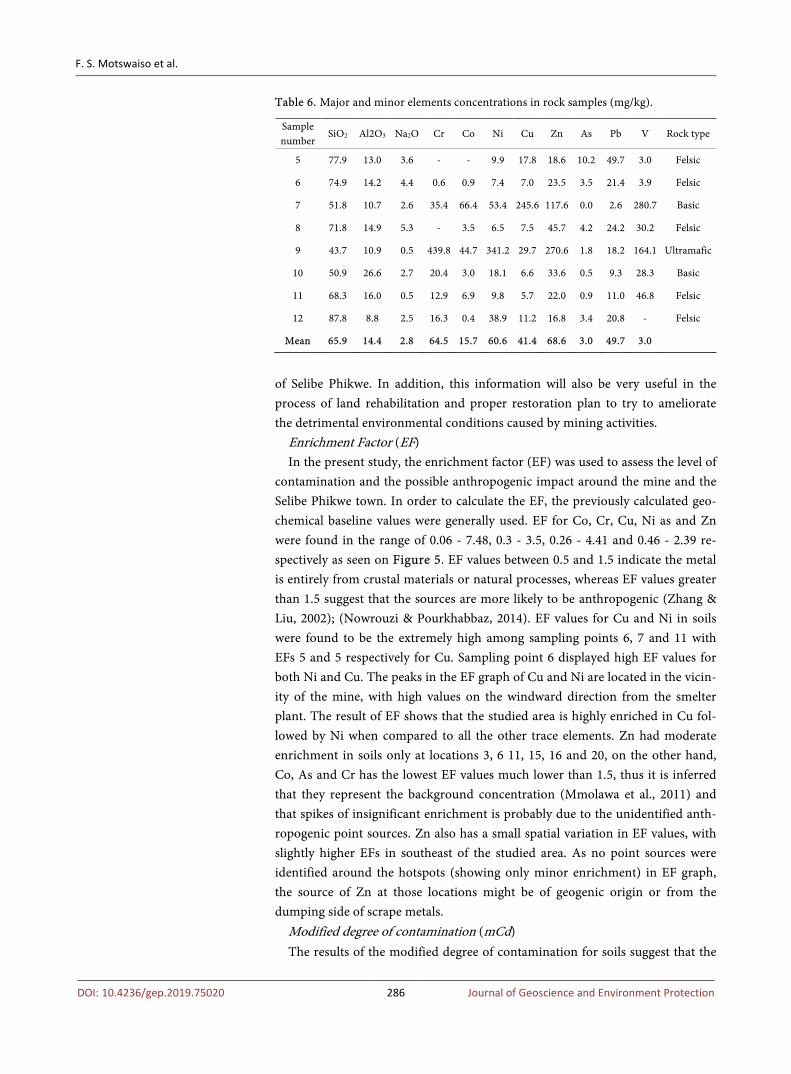
Mean trace element total concentrations of parent material are shown in Ta-
ble 6 below. The mean concentrations differ widely between the studied rock types, although in most of the cases the range of values between different rock types overlaps significantly. In the present study, only 8 rocks sample were col-lected due to lack of outcrops and time constricts. Rock samples collected from the study area were characterized according to their Si content and were allo-cated acidic, basic or ultramafic categories. Five samples were categorized as fel-sic rocks, two as mafic and there was only one ultramafic rock. Generally, con-centrations of Cr, Co, Ni and Cu showed the highest concentrations in the mafic rocks and lowest in the felsic rocks. The felsic parent materials in the study area (granites, tonalite, and quartzite) primarily composed of quartz and plagioclase, with specs of biotite and other minerals. The mafic parent materials (gabbros, serpentinite, schist) are composed of varying parts of olivine, pyroxene, amphi-boles, horneblend, and biotite. These minerals are the primary source of Cr, Co, Ni, and Cu. The geological influence of Ni and Cr content has been clearly demonstrated by many researchers (Alloway, 1995). The highest nickel concen-trations are found in ultrabasic igneous rocks (peridotites, dunites and pyrox-enites).
4.3. Statistical Analysis Results
The estimated average baseline concentrations of Cr, Cu, Ni, Co, Zn and As are 53.8, 51.85, 53.95, 5.6, 32.36 and 4.27 mg/kg, respectively. The estimated baseline values were compared with those reported in the literature by previous re-searchers. Soils were characterized by high baseline limit values for Ni and Cu. These anthropic baseline values were then used for the pollution assessment of selected trace elements around the BCL mine. On the other hand, baseline values of Cr, Cu, Ni, Co, Zn and As in sediments was computed from the two sampling stations away from the influence of anthropogenic inputs, and hence are be-lieved to depict natural background values. The mean baseline values for Cr, Cu, Ni, Co, Zn and As in sediments were 14.6, 0.2, 23.8, 9.8, 15.8 and 3.2 respective-ly.
The application of the regional geochemical baseline values proposed in this study will allow comprehensive monitoring and the rapid identification of sites that could be affected by pollution due to historic mining exploitation in the area
F. S. Motswaiso et al.
DOI: 10.4236/gep.2019.75020 286 Journal of Geoscience and Environment Protection
Table 6. Major and minor elements concentrations in rock samples (mg/kg).
Sample number
SiO2 Al2O3 Na2O Cr Co Ni Cu Zn As Pb V Rock type
5 77.9 13.0 3.6 - - 9.9 17.8 18.6 10.2 49.7 3.0 Felsic
6 74.9 14.2 4.4 0.6 0.9 7.4 7.0 23.5 3.5 21.4 3.9 Felsic
7 51.8 10.7 2.6 35.4 66.4 53.4 245.6 117.6 0.0 2.6 280.7 Basic
8 71.8 14.9 5.3 - 3.5 6.5 7.5 45.7 4.2 24.2 30.2 Felsic
9 43.7 10.9 0.5 439.8 44.7 341.2 29.7 270.6 1.8 18.2 164.1 Ultramafic
10 50.9 26.6 2.7 20.4 3.0 18.1 6.6 33.6 0.5 9.3 28.3 Basic
11 68.3 16.0 0.5 12.9 6.9 9.8 5.7 22.0 0.9 11.0 46.8 Felsic
12 87.8 8.8 2.5 16.3 0.4 38.9 11.2 16.8 3.4 20.8 - Felsic
Mean 65.9 14.4 2.8 64.5 15.7 60.6 41.4 68.6 3.0 49.7 3.0
of Selibe Phikwe. In addition, this information will also be very useful in the process of land rehabilitation and proper restoration plan to try to ameliorate the detrimental environmental conditions caused by mining activities.
Enrichment Factor (EF) In the present study, the enrichment factor (EF) was used to assess the level of
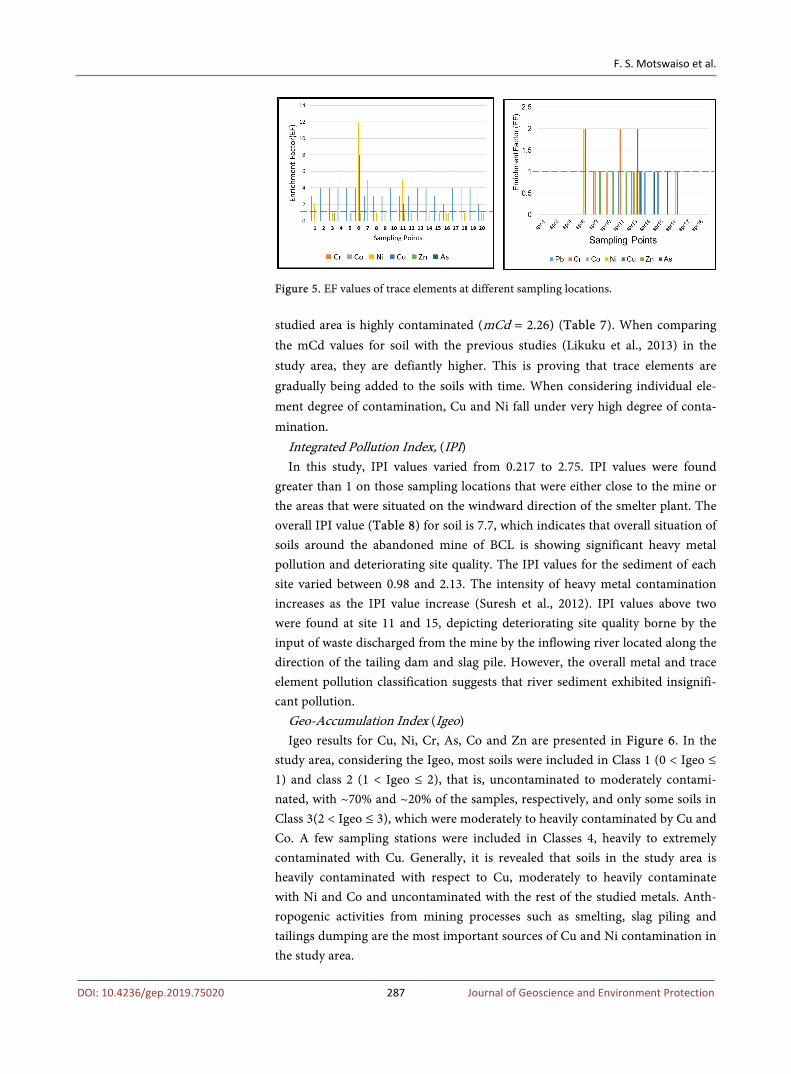
contamination and the possible anthropogenic impact around the mine and the Selibe Phikwe town. In order to calculate the EF, the previously calculated geo-chemical baseline values were generally used. EF for Co, Cr, Cu, Ni as and Zn were found in the range of 0.06 - 7.48, 0.3 - 3.5, 0.26 - 4.41 and 0.46 - 2.39 re-spectively as seen on Figure 5. EF values between 0.5 and 1.5 indicate the metal is entirely from crustal materials or natural processes, whereas EF values greater than 1.5 suggest that the sources are more likely to be anthropogenic (Zhang & Liu, 2002); (Nowrouzi & Pourkhabbaz, 2014). EF values for Cu and Ni in soils were found to be the extremely high among sampling points 6, 7 and 11 with EFs 5 and 5 respectively for Cu. Sampling point 6 displayed high EF values for both Ni and Cu. The peaks in the EF graph of Cu and Ni are located in the vicin-ity of the mine, with high values on the windward direction from the smelter plant. The result of EF shows that the studied area is highly enriched in Cu fol-lowed by Ni when compared to all the other trace elements. Zn had moderate enrichment in soils only at locations 3, 6 11, 15, 16 and 20, on the other hand, Co, As and Cr has the lowest EF values much lower than 1.5, thus it is inferred that they represent the background concentration (Mmolawa et al., 2011) and that spikes of insignificant enrichment is probably due to the unidentified anth-ropogenic point sources. Zn also has a small spatial variation in EF values, with slightly higher EFs in southeast of the studied area. As no point sources were identified around the hotspots (showing only minor enrichment) in EF graph, the source of Zn at those locations might be of geogenic origin or from the dumping side of scrape metals.
Modified degree of contamination (mCd) The results of the modified degree of contamination for soils suggest that the
F. S. Motswaiso et al.
DOI: 10.4236/gep.2019.75020 287 Journal of Geoscience and Environment Protection
Figure 5. EF values of trace elements at different sampling locations. studied area is highly contaminated (mCd = 2.26) (Table 7). When comparing the mCd values for soil with the previous studies (Likuku et al., 2013) in the study area, they are defiantly higher. This is proving that trace elements are gradually being added to the soils with time. When considering individual ele-ment degree of contamination, Cu and Ni fall under very high degree of conta-mination.
Integrated Pollution Index, (IPI) In this study, IPI values varied from 0.217 to 2.75. IPI values were found
greater than 1 on those sampling locations that were either close to the mine or the areas that were situated on the windward direction of the smelter plant. The overall IPI value (Table 8) for soil is 7.7, which indicates that overall situation of soils around the abandoned mine of BCL is showing significant heavy metal pollution and deteriorating site quality. The IPI values for the sediment of each site varied between 0.98 and 2.13. The intensity of heavy metal contamination increases as the IPI value increase (Suresh et al., 2012). IPI values above two were found at site 11 and 15, depicting deteriorating site quality borne by the input of waste discharged from the mine by the inflowing river located along the direction of the tailing dam and slag pile. However, the overall metal and trace element pollution classification suggests that river sediment exhibited insignifi-cant pollution.
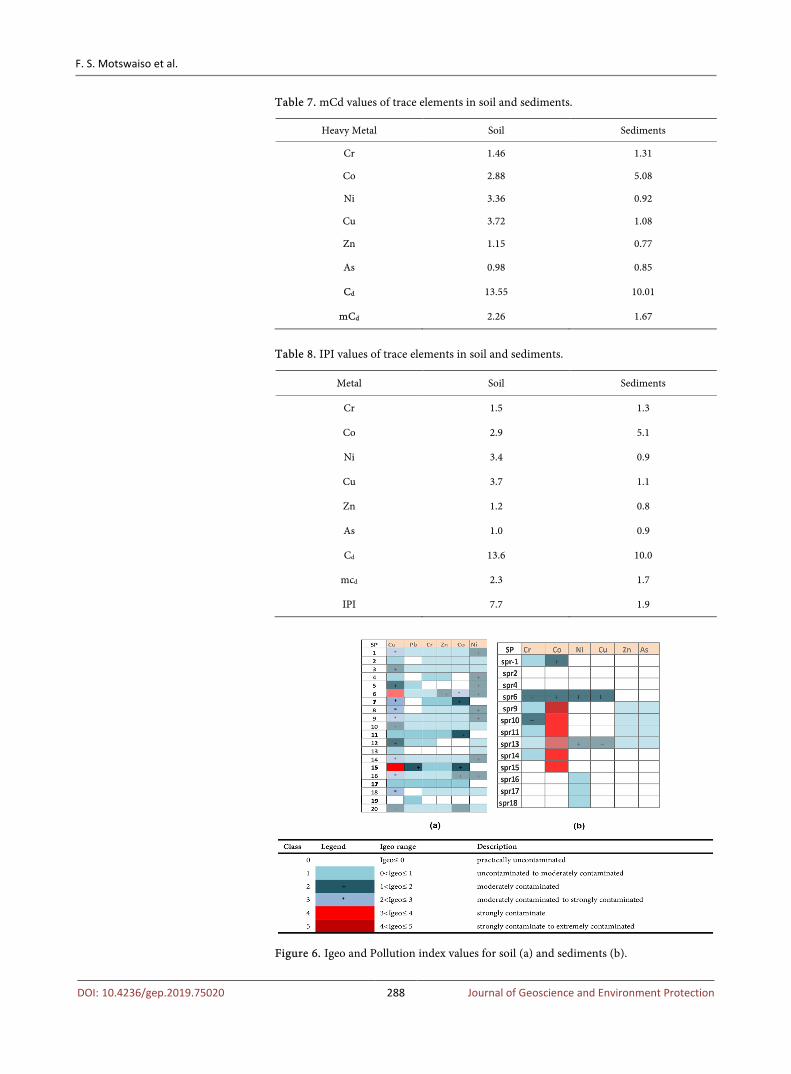
Geo-Accumulation Index (Igeo) Igeo results for Cu, Ni, Cr, As, Co and Zn are presented in Figure 6. In the
study area, considering the Igeo, most soils were included in Class 1 (0 < Igeo ≤ 1) and class 2 (1 < Igeo ≤ 2), that is, uncontaminated to moderately contami-nated, with ~70% and ~20% of the samples, respectively, and only some soils in Class 3(2 < Igeo ≤ 3), which were moderately to heavily contaminated by Cu and Co. A few sampling stations were included in Classes 4, heavily to extremely contaminated with Cu. Generally, it is revealed that soils in the study area is heavily contaminated with respect to Cu, moderately to heavily contaminate with Ni and Co and uncontaminated with the rest of the studied metals. Anth-ropogenic activities from mining processes such as smelting, slag piling and tailings dumping are the most important sources of Cu and Ni contamination in the study area.
F. S. Motswaiso et al.
DOI: 10.4236/gep.2019.75020 288 Journal of Geoscience and Environment Protection
Table 7. mCd values of trace elements in soil and sediments.
Heavy Metal Soil Sediments
Cr 1.46 1.31
Co 2.88 5.08
Ni 3.36 0.92
Cu 3.72 1.08
Zn 1.15 0.77
As 0.98 0.85
Cd 13.55 10.01
mCd 2.26 1.67
Table 8. IPI values of trace elements in soil and sediments.
Metal Soil Sediments
Cr 1.5 1.3
Co 2.9 5.1
Ni 3.4 0.9
Cu 3.7 1.1
Zn 1.2 0.8
As 1.0 0.9
Cd 13.6 10.0
mcd 2.3 1.7
IPI 7.7 1.9
Figure 6. Igeo and Pollution index values for soil (a) and sediments (b).
F. S. Motswaiso et al.
DOI: 10.4236/gep.2019.75020 289 Journal of Geoscience and Environment Protection
River sediments showed low Igeo values of Ni when compared to soils (Figure 6(b)), except for sampling location 6, 13, 16, 17 and 18. Most of these locations are upstream and downstream of Motloutse River. The Igeo values for copper revealed moderate contamination of sediments at sampling location 6 and 13. These sites are located at the streams flowing very close to the tailings and slag pile. Cr, Zn and As showed uncontaminated to moderate contamination. Co is the only trace element that showed strongly to extreme contamination for most sampling points.
Value of Maximum Allowable Limits for Trace elements in Soil (mg/kg) from Different Countries as Compared to the Present Study
Among the sampling sites, maximum total concentrations of all trace ele-ments except Zn and As surpassed their corresponding background limits, the highest concentrations of Cu, Co and Ni were about 2.35, 2.4, and 1.6 times their corresponding standard limits Table 9. The concentrations of Cu and Ni at over 75% of the studied sites were beyond the values of all the referenced countries guideline limits as well as upper continent crustal values. When comparing the Chinese soil standard and results from this study, Cu and Ni demonstrated ob-vious trace element pollution around the Selibe Phikwe area. However, in com-parison to the Japanese and Canadian limits, the concentrations of Cr was of a similar magnitude while Co and As were much less. When compared with upper crustal values , the concentrations of the eight priority trace elements were ob-viously higher, which was especially true for Co, Cu, Ni, which were 1.6, 2.3, and 2.4 times higher than their respective local background levels. The excessive loadings of trace elements respective to local background values might be a due to anthropogenic activities, more specifically from mining activities.
5. Conclusion
Metals and trace elements assessment and source discrimination are essential for environmental improvement and protection strategy, especially for mineral re-source producing countries. In the present study, selected trace element content in soil, sediments and water samples collected around the abandoned mine of BCL Cu-Ni mine has been studied. Comprehensive and robust environmental assessment methods were applied to carry out the geochemical analysis of the study area. These methods encompass contamination assessment, geochemical analysis, and spatial distribution of Cu, Ni, Cr, Co, Zn and As. The representa-tive sampling points were meticulously chosen around the mine and along Letl-hakane River and its tributaries. The geochemical baseline and the heavy metal contents in respective samples were evaluated. The mean geochemical baseline concentration of Cu, Ni, Cr, Co, Zn and As in soil samples were 38.23, 49.23, 65, 6.22, 34.93 and 3.93 mg/kg, respectively. Out of 42 soil-sampling stations, 14 lo-cations had the values higher for Cu and Ni, 16 sites for Zn, 19 stations for Cr, 17 locations for Co and 19 for As than that of the geochemical baseline values, which may affect to a potential danger for the environment and the community of Selibe Phikwe mining town. Lower values for pH and higher levels of EC are
F. S. Motswaiso et al.
DOI: 10.4236/gep.2019.75020 290 Journal of Geoscience and Environment Protection
Table 9. Total average of soil trace elements and comparisons with local background val-ues in upper crust and different countries.
Trace elements Total average
valuesa
Local background limit valuesa
UCCb Chinac Japan Canada
Cr 79 89.8 35 200 - 75
Co 16 9.9 11.60 40 50 250
Ni 181 74.8 18.60 50 100 100
Cu 193 81.9 14.30 100 125 100
Zn 37 42.92 52 52 250 400
As 4 6.75 2 25 - 200
found in waters sampled immediately downstream of effluents passing through tailing dam and slag pile.
Enrichment factor, Geo-accumulation index, Pollution index were computed to assess the contamination status of the study area. Results of EF, Igeo and PI revealed that soil samples in the wind direction and central part of the study area where is close to the Copper Smelter and the waste dumps, respectively have higher contamination degree than the other soil samples. Soil samples located on the lee side and away from the waste dumps showed no significant anthropo-genic sources, exhibiting minimum EF, Igeo and PI values for all analyzed met-als. This fact reveals the adverse effects of anthropogenic sources (BCL Copper Smelter and BCL Copper Nickel mine) in the study area in the aspect of heavy metal pollution state. Results of EFs revealed a high degree of enrichment of Cu and Ni in soil and sediment. The outcomes of Igeo and EF were in agreement indicating a higher degree of metal pollution in the northwestern part of the windward direction of the study area. New indices, integrated pollution index (IPI) and modified degree of contamination (mCd) were proposed to assess metal pollution state in the study area based on trace element baseline values and their toxicity degree Results of integrated indices (IPI and mCd) confirmed more metal pollution, and deteriorating site quality in the windward direction and on areas closer to the waste dumps when compared with other parts of the study area. Based on the application of different indices, it could be concluded that the primary anthropogenic sources of metals including BCL Copper smelter and abandoned BCL Copper mine had an adverse effect on metal pollution in soil and sediments samples. Comparing the concentration of trace elements with the other mining areas of the world, it can be concluded that the soils of the study area is moderately contaminated with trace elements, but if rehabilitation process is not commenced, the concentration of metals will increase to intolera-ble limits, which may create severe impacts on the soil environment and finally to the food chain.
6. Recommendations
Based on the findings of the present study, the following recommendations has
F. S. Motswaiso et al.
DOI: 10.4236/gep.2019.75020 291 Journal of Geoscience and Environment Protection
been drawn It is recommended to establish national soil and sediment contamination
standard as well as soil and sediment background to examine and monitor the contamination level of the mine surroundings
There is need for regular and periodic monitoring of soil surface and groundwater quality in order to ensure that the standards of trace elements constitutes as set by WHO are not exceeded.
It is highly recommended to monitor elemental concentrations in surface soils routinely in future and accordingly to take necessary initiative by the local authority and government of Botswana.
Study the potential human health risk for both non carcinogenic and carci-nogenic risk of Cu, Ni, Cr, Co, Zn and As.
Acknowledgements
We gratefully acknowledge the financial and social support of Japan Interna-tional Cooperation Agency (JICA) for my three years staying in Sendai, Japan, Graduate School of Environmental Sciences, Tohoku University, as well as Ge-ology department in University of Botswana for their unwavering support dur-ing field work.
Conflicts of Interest
The authors declare no conflicts of interest regarding the publication of this pa-per.
References Alloway, B. J. (1995). Heavy Metals in Soils. Glasgow, UK.
Angulo, E. (1996). The Tomlinson Pollution Load Index Applied to Heavy Metal, “Mus-sel-Watch” Data: A Useful Index to Assess Coastal Pollution. Sci. Total Environmen, 187, 19-56. https://doi.org/10.1016/0048-9697(96)05128-5
Barton, J. M. J., Klemd, R., & Zeh, A. (2006). The Limpopo Belt: A Result of Archean to Proterozoic, Turkic-Type Orogenesis? In Process. Early Earth Geol. Soc. Am. Spec. Pap. (Vol. 405, pp. 315-332). https://doi.org/10.1130/2006.2405(16)
Chester, R., Kudoja, W. M., Thomas, A., & Towner, J. (1985). Pollution Reconnaissance in Stream Sediments Using Non-Residual Trace Metals. Environ. Pollution. Ser. B, Chem. Phys., 10, 213-238. https://doi.org/10.1016/0143-148X(85)90044-8
De Wit, R. P., & Bekker, R. (1990). Soil Mapping and Advisory Services Botswana Expla-natory Note on the Land Systems Map of Botswana Food and Agriculture Organization of the United Nations United Nations Development Programme Government of Bots-wana.
Dudka, S., & Adriano, D. C. (1997). Environmental Impacts of Metal Ore Mining and Processing: A Review. J Env. Qual. https://doi.org/10.2134/jeq1997.00472425002600030003x
Hakanson, L. (1980). An Ecological Risk Index for Aquatic Pollution Control. A Sedi-mentological Approach. Water Res., 14, 975-1001.
F. S. Motswaiso et al.
DOI: 10.4236/gep.2019.75020 292 Journal of Geoscience and Environment Protection
https://doi.org/10.1016/0043-1354(80)90143-8
Larocque, A. C. L., & Rasmussen, P. E. (1998). An Overview of Trace Metals in the Envi-ronment, from Mobilization to Remediation. Environ. Geol., 33, 85-91. https://doi.org/10.1007/s002540050227
Likuku, A. S., Mmolawa, K. B., & Gaboutloeloe, G. K. (2013). Assessment of Heavy Metal Enrichment and Degree of Contamination around the Copper-Nickel Mine in the Se-lebi Phikwe Region, Eastern Botswana. Environ. Ecol. Res, 1, 32-40.
Liu, Y., & Vekerdy, Z. (2003). Possibilities of Assessing Heavy Metal Contamination in the Sajó River Flood Plains (Hungary) Using Reflectance Spectroscopy. Wrs MSc, 81.
Maier, W. D., Barnes, S. J., Chinyepi, G., Barton, J. M., Eglington, B., & Setshedi, I. (2008). The Composition of Magmatic Ni-Cu-(PGE) Sulfide Deposits in the Tati and Selebi-Phikwe Belts of Eastern Botswana. Miner. Depos., 43, 37-60. https://doi.org/10.1007/s00126-007-0143-5
Matschullat, J., Ottenstein, R., & Reimann, C. (2000). Geochemical Background—Can We Calculate It? Environ. Geol., 39, 990-1000. https://doi.org/10.1007/s002549900084
Matthews-Amune, O. C., & Kakulu, S. (2012). Heavy Metals Pollution in Agricultural Soil of Adogo in Ajaokuta Local Government Area of Kogi State, Nigeria. International Journal of Pure & Applied Sciences & Technology, 11, 126-131.
McCourt, S., Kampunzu, A. B., Bagai, Z., & Armstrong, R. A. (2004). The Crustal Archi-tecture of Archaean Terranes in Northeastern Botswana. South African J. Geol., 107, 147-158. https://doi.org/10.2113/107.1-2.147
Mmolawa, K. B., Likuku, A. S., & Gaboutloeloe, G. K. (2011). Assessment of Heavy Metal Pollution in Soils along Major Roadside Areas in Botswana. Afr. J. Environ. Sci. Tech-nol., 5, 186-196.
Nakamura, K., Kuwatani, T., Kawabe, Y., & Komai, T. (2016). Extraction of Heavy Metals Characteristics of the 2011 Tohoku Tsunami Deposits Using Multiple Classification Analysis. Chemosphere, 144, 1241-1248. https://doi.org/10.1016/j.chemosphere.2015.09.078
Ngole, V. M., & Ekosse, G. I. E. (2012). Copper, Nickel and Zinc Contamination in Soils within the Precincts of Mining and Landfilling Environments. Int. J. Environ. Sci. Technol., 9, 485-494. https://doi.org/10.1007/s13762-012-0055-5
Nowrouzi, M., & Pourkhabbaz, A. (2014). Application of Geoaccumulation Index and Enrichment Factor for Assessing Metal Contamination in the Sediments of Hara Bios-phere Reserve, Iran. Chem. Speciat. Bioavailab., 26, 99-105. https://doi.org/10.3184/095422914X13951584546986
Schroeder, W. H., & Lane, D. A. (1988). The Fate of Toxic Airborne Pollutants: The At-mosphere Plays a Major Role in Their Transformation and Transport. Environ. Sci. Technol., 22, 240-246. https://doi.org/10.1021/es00168a001
Suresh, G., Sutharsan, P., Ramasamy, V., & Venkatachalapathy, R. (2012). Assessment of Spatial Distribution and Potential Ecological Risk of the Heavy Metals in Relation to Granulometric Contents of Veeranam Lake Sediments, India. Ecotoxicol. Environ. Saf., 84, 117-124. https://doi.org/10.1016/j.ecoenv.2012.06.027
Sutherland, R. A., Tolosa, C. A., Tack, F. M. G., & Verloo, M. G. (2000). Characterization of Selected Element Concentrations and Enrichment Ratios in Background and Anth-ropogenically Impacted Roadside Areas. Arch. Environ. Contam. Toxicol., 38, 428-438.
Tomlinson, D. L., Wilson, J. G., Harris, C. R., & Jeffrey, D. W. (1980). Problems in the Assessment of Heavy-Metal Levels in Estuaries and the Formation of a Pollution Index.
F. S. Motswaiso et al.
DOI: 10.4236/gep.2019.75020 293 Journal of Geoscience and Environment Protection
Helgoländer Meeresuntersuchungen, 33, 566-575. https://doi.org/10.1007/BF02414780
Zhang, J., & Liu, C. L. (2002). Riverine Composition and Estuarine Geochemistry of Par-ticulate Metals in China—Weathering Features, Anthropogenic Impact and Chemical Fluxes. Estuar. Coast. Shelf Sci., 54, 1051-1070. https://doi.org/10.1006/ecss.2001.0879