Embed Size (px)
Citation preview

Trace analysis with gas chromatography using on-lineenrichment and large volume injectionCitation for published version (APA):Mol, J. G. J. (1995). Trace analysis with gas chromatography using on-line enrichment and large volumeinjection. Technische Universiteit Eindhoven. https://doi.org/10.6100/IR443688
DOI:10.6100/IR443688
Document status and date:Published: 01/01/1995
Document Version:Publisher’s PDF, also known as Version of Record (includes final page, issue and volume numbers)
Please check the document version of this publication:
• A submitted manuscript is the version of the article upon submission and before peer-review. There can beimportant differences between the submitted version and the official published version of record. Peopleinterested in the research are advised to contact the author for the final version of the publication, or visit theDOI to the publisher's website.• The final author version and the galley proof are versions of the publication after peer review.• The final published version features the final layout of the paper including the volume, issue and pagenumbers.Link to publication
General rightsCopyright and moral rights for the publications made accessible in the public portal are retained by the authors and/or other copyright ownersand it is a condition of accessing publications that users recognise and abide by the legal requirements associated with these rights.
• Users may download and print one copy of any publication from the public portal for the purpose of private study or research. • You may not further distribute the material or use it for any profit-making activity or commercial gain • You may freely distribute the URL identifying the publication in the public portal.
If the publication is distributed under the terms of Article 25fa of the Dutch Copyright Act, indicated by the “Taverne” license above, pleasefollow below link for the End User Agreement:www.tue.nl/taverne
Take down policyIf you believe that this document breaches copyright please contact us at:[email protected] details and we will investigate your claim.
Download date: 14. Aug. 2021

Trace analysis with gas chromatography
using on-line enrichment and
large volume injection
Hans Mol
TRACE ANALYSIS WITH GAS CHROMATOGRAPHY
USING
ON-LINE ENRICHMENT AND LARGE VOLUME INJECTION
PROEFSCHRIFT
ter verkrijging van de graad van doctor aan de Technische Universiteit Eindhoven,
op gezag van de Rector Magnificus, prof.dr. J.H. van Lint,
voor een cornmissie aangewezen door het College van Dekanen
in het openbaar te verdedigen op dinsdag 19 september 1995 om 16.00 uur
door
Johannes Gerardus Jacobus Mol
geboren te Helmond

Dit proefschrift is goedgekeurd door de promotoren:
prof.dr.ir. C.A.M.G. Cramers en
prof.dr. U.A.Th. Brinkman
copromotor: dr.ir. J.G.M. Janssen

wie reist, leeft dubbel
(B. Aafjes)
aan mijn ouders

/"""'}
NU'O Het onderzoek beschreven in dit prnefschrift werd financieel ondersteund door de Nederlandse organisatie voor Wetenschappelijk Onderzoek (project nr. 700-344-009).
Onderstaande bedrijven hebben financieel bijgedragen aan de publikatie van dit proefschrift:
iGERSTEe1 GERSTEL Benelux B.V., Brielle, Nederland. Analytical Equipment
<•·· ·Lt_ ATAS B.V., Veldhoven, Nederland. j I ~S 1'----L_e_v_e_rancier van Ai Cambridge apparatuur voor gaschromatografie.
- .
CIP-GEGEVENS KONINKLIJKE BIBLIOTHEEK, DEN HAAG
Mol, Johannes Gerardus Jacobus
Trace analysis with gas chromatography using on-line enrichment and large volume injection I Johannes Gerardus Jacobus Mol. - Eindhoven : Technische Universiteit Eindhoven Proefschrift Technische Universiteit Eindhoven. - Met samenvatting in· het Nederlands ISBN 90-386-0336-3 Trefw. : gaschromatografie I sporenanalyse.

CONTENTS
1 Introduction and scope . . . . . . . . . . . . . . . . . . . . . . . . . . . . . . . . . . . . . . . . 9
2 Gas chromatographic trace analysis of aqueous samples using •
on-line enrichment and large volume injection: an overview . . . . . . 15
2.1 Large volume injection in capillary GC .. . . ..................... . .. 20
2.2 Direct water injection . . ... . . ..... .. .. ..... .. . . . . . . ...... . .... 30
2.3 Indirect water injection: phase switching .... . .... . ................. 34
2.4 Indirect water injection: sorption/thermal desorption . . .. .. ... ... .. ..... 45
3 Large volume injection in capillary gas chromatography using
programmed temperature vaporizing (PTV} injectors
3.1 Principles of PTV large volume injection and implications of liner diameter .. 61
3 .2 Inertness of packing materials . .. ..... .. . ... . ..... ... ........... . 81
3.3 Environmental applications . .................. ... ............... 93
3.4 The PTV injector as universal interface for large volume injection ..... . .. 113
4 Water analysis by sorption/thermal desorption in the PTV injector ... 125
5 On-line enrichment-Ge using open-tubular extraction columns
5.1 Principles and theoretical considerations . . .... ... .. ..... .. ... . . .
5.2 Enhancement of retention power using swelling agents ..... .... . ..... .
5.3 Increase of sampling flow rate using geometrically deformed capillaries
137
157
171
6 Conclusions and prospects ....... . . . . . .. . . .. .... .. ... ... .... .. 187
Summary.
Samenvatting
193
197
Dankwoord . ....... . . .. . . ... . .... . . . . ..... . . ........ . . . .. . ..... 201
Curriculum Vitae ... .... . ..... .. . .. .. .. ..... ... .... . .. ... . ... . .. .
Author's publications on chromatography . . . ........................... .
203
204

Introduction and scope
9
1 Introduction and Scope
Chromatographic techniques such as liquid, supercritical and gas chromatography, play a
dominant role in trace analysis. They are employed to separate (amongst others) complex
environmental, biological and food mixtures. Among the chromatographic techniques, gas
chromatography is the method to be preferred due to the favourable speed of analysis and
the high separation efficiency. The availability of a number of sensitive and selective
detection devices is another reason to select gas chromatography as the separation
technique.
The fundamentals of gas chromatography (GC) are well understood and the use of
capillary columns is becoming the standard in routine laboratories all over the world.
Because it is such an attractive separation method, much effort has been devoted to extend
its application range. Thennolabile analytes can be derivatized to make them GC
amenable. High temperature GC has been developed in order to be able to analyse
compounds of low volatility. Here the synthesis of (polar) stationary phases with good
thermostability has been an important topic. Further, much attention has been devoted to
the synthesis of chiral stationary phases.
Nowadays most work · is directed to the development of analytical methods and
instrumentation and their application. Selectivity is a keyword in this respect, because the
peak capacity of the GC column is insufficient -despite the high separation efficiency- for
the complex samples that analytical chemists have to deal with. Fortunately, there are
several possibilities to enhance the selectivity. One way is to use multidimensional GC [1].
Here unresolved peak clusters from the first column are further separated on a second
column coated with a stationary phase of different selectivity (polarity). The use of on-line
coupled (normal phase) LC-GC in principle is a similar approach. Here, in the LC column,
the mixture is separated into classes of compounds with the same functionalities, which
are next separated into the individual compounds by means of GC [1,2]. Another way to
enhance selectivity is the use of selective detectors. The recently introduced (improved)
optical detectors such as the atomic emission detector (AED) [3], the pulsed flame
photometric detector (PFPD) [4] and the sulphur chemiluminescence detector (SCD) [5]
are very useful additions to the existing range of such detectors. However, probably the
most valuable detector is the mass spectrometer (MS) which enables both selective
detection and unambiguous identification and quantification. Instrumental developments in
GC-MS are directed to the miniaturization of sophisticated mass spectrometers into bench
top GC detectors. An example is GC-MS-MS analysis with ion-trap instruments (6].

Despite the availability of selective detectors most analytical problems can not be solved
without pretreatment of the sample because sample matrices (soil, water, tissue) often are
not compatible with GC. Moreover, the required determination limits often are far below
the detection limits of the chromatographic system if no preconcentration is carried out.
Therefore sample pretreatment is necessary for the isolation and preconcentration of the
analytes before their introduction into the GC system. Techniques routinely used for this
purpose include liquid-liquid extraction, soxhlet extraction and solid-phase extraction [7].
In addition, sample pretreatment may also include clean-up procedures, as an extra means
of enhancing the selectivity.
Method development in GC analysis currently focuses on two main issues: (i) the
increase of sample throughput by simplification and/or automation of sample pretreatment
and (ii) further improving the reliability and detection limits (in concentration units in the
sample) in order to meet the demands dictated by environmental and health legislation.
These issues are also the main objectives of the present thesis, with emphasis on the
analysis of aqueous samples. The presence of organic micropollutants in water has a great
impact on the quality of the aquatic environment. In addition to this, surface water is an
important source of drinking water. As a consequence, there is a high demand for the
determination of organic micropollutants in surface and ground water. Both higher sample
throughput as well as improved reliability and detection limits can be achieved using
systems in which isolation/preconcentration of the analytes from the water is on-line
coupled to the GC. An overview of on-line methods used for the trace level GC analysis
of micropollutants in aqueous samples is given in Chapter 2. The techni!Jues are classified
as either direct or indirect methods. Due to the unfavourable chell\ical and physical
properties of water, direct injection is only possible in a limited number of applications.
For the majority of the compounds indirect methods, in which water is eliminated prior to
introduction into the GC column, have to be used. In on-line systems the injection of large
sample volumes into the GC is an important step forward . Therefore an outline of large
volume injection techniques is included in the overview.
Both in on-line sample pretreatment-Ge and in conventional off-line approaches, the
introduction of large volumes into a capillary GC can effectively simplify sample handling
and improve determination limits. In fact, the most important shortcoming of gas
chromatography, and the main reason why preconcentration is necessary in the first place,
is that a capillary GC normally can handle volumes of 1-2 µl only. Large volume injection
enables a better use of the sample and helps to eliminate time-consuming and labour
intensive evaporative concentration steps. Grob [8] made it possible to inject large
volumes in GC by using uncoated deactivated precolumns (retention gaps). In the past ten
years several techniques based on the use of uncoated precolumns ha\fe been applied in

many research laboratories. However, these techniques still are considered to be quite
difficult, and large volume injection is hardly applied in routine laboratories. An
alternative means of large volume injection is the use of temperature programmable (PTV)
injectors [9]. The development of simple and rugged large volume injection techniques
using the PTV injector is described in Chapter 3. The principles of large volume PTV
injection and the implications of the liner diameter are described in Section 3.1. The use of
relatively wide packed bore liners allows rapid injection of large sample volumes. In
addition optimization is straightforward and instrumentation simple. For polar and labile
analytes the inertness of the packing material is a critical aspect. This is evaluated in
Section 3.2. Several inert general-purpose materials were found. The applicability of large
volume PTV injection for real-life samples is discussed in Section 3.3. Sample
pretreatment procedures for the analysis of polar nitrogen/phosphorus-containing pesticides
and organochlorine pesticides in river water samples and polycyclic aromatic hydrocarbons
in river sediment can be simplified when using large volume PTV injection. Although
PTV solvent split injection covers a wide application area, large volume on-column
injection is better suited for determination of thermolabile compounds. For the latter type
of application the PTV can be equipped with a special on-column insert, enabling large
volume on-column injection without the need for an on-column injector. Hence, two
important techniques for large volume sample introduction into capillary GC can be
integrated into one injection device (Section 3.4).
The application of PTV solvent split injection is not restricted to sample extracts in
non-polar solvents such as hexane and ethyl acetate. In principle even the direct injection
of aqueous samples is possible. This option is discussed in Chapter 4. Here water is
eliminated via the split exit while the analytes are trapped in a Tenax-packed liner. Two
injection modes, i.e. evaporative and non-evaporative, are compared. After complete water
removal the analytes are thermally desorbed and transferred to the analytical column.
Sample volumes up to l ml can be analysed this way.
Direct injection of water samples into the PTV-GC system is an attractive option for
limited volwnes of clean water samples. For more complex samples, however, phase
switching, i.e. transfer of analytes from the aqueous to an organic phase, prior to
introduction into the GC system is desirable. Systems in which phase switching and GC
analysis are coupled on-line have a great potential for fully automated water analysis.
Often on-line phase switching is performed by using extraction columns. Here the analytes
are sorbed from the aqueous sample onto the stationary phase of the column. Before
desorption water remaining in the extraction column after sampling has to be removed to
facilitate efficient desorption and to prevent the introduction of water into the GC. Water
removal is generally done by purging with nitrogen. Then the analytes are desorbed by an
organic solvent which is ·directly introduced into the GC system. Chapter 5 is devoted to
the u5e of open-tubular columns -in fact short GC columns- as extraction columns. The
main advantage over sorbent packed cartridges (see Chapter 2) is that water removal is
much easier and more reliable. First theoretical aspects with regard to the use of open
tubular extraction columns are discussed in Section 5.1, with emphasis on the dimensions
of the column and the sampling flow rate. Section 5.2 deals with the tetention power of
extraction capillaries. Retention can be greatly enhanced by swelling the stationary phase
with a suitable organic solvent prior to sampling. The final section of the chapter deals
with the possibility of increasing the, radial diffusion limited, sampling flow rate by using
geometrically deformed extraction capillaries. In such deformed capillaries a secondary
flow is generated which enhances radial dispersion. This enables the use of sampling flow
rates up to 4 ml/min with short columns without breakthrough of the analytes.
Finally, in Chapter 6, guidelines are given for the selection of the large volume
injection technique best suited for specific applications. In addition several promising
methods for on-line water analysis are discussed and compared.
References
[I] H.J. Cortes, J. Chromatogr. 626 (1992) 3.
[2) G.W. Kelly, K.D. Bartle, J. High Res. Chromatogr. 17 (1994) 390.
[3] B.D. Quimby, J.J. Sullivan, Anal. Chem. 62 (1990) 1027.
[4] S.A. Scheppers, J.J. Robinson, H. Kem, in P. Sandra (Ed.), Proc. 16th Int. Symp. Capillary
Chromatogr., Riva del Garda, Htlthig, Heidelberg, 1994, p 1347.
[5] R.L. Shearer, D.L. O'Neal, R. Rios, M.D. Baker, J. Chromatogr. Sci. 28 (1990) 24 .
[6] R.E. March, Org. Mass. Spectrom. 26 (1991) 627.
[7] C.F. Poole, S.K. Poole, Chromatography Today, Elsevier, Amsterdam, 1991.
(8) K. Grob, On line coupled LC-GC, Htlthig, Heidelberg, 1991.
(9] W. Vogt, K. Jacob, H.W. Obwexer, J. Chromatogr. 174 (1979) 437.

Gas chromatographic
trace analysis of aqueous samples
using on-line enrichment and large volume injection:
an overview

2 Gas chromatographic trace analysis of aqueous samples using on-line enrichment and large volume injection: an overview1
>
Summary
15
In this chapter an overview of methods for the analysis of aqueous samples with capillary gas chromatography is presented. The methods can be classified into two approaches: a direct approach in which water is directly introduced onto the GC column, and an indirect approach in which water is eliminated, i.e. by liquid-liquid extraction or solid-phase extraction, prior to introduction of the analytes onto the GC column. The emphasis is on methods in which sample preparation and GC analysis are combined on-line. An outline of methods for large volume injection is also presented as the use of on-line systems often involves the introduction of large volumes of sample extract.
Introduction
The presence of organic micro-contaminants in various compartments of the environment
constitutes a growing source of concern for human health and the natural environment. As
a consequence there is a rapid increase in the demand for the determination of these
micro-pollutants in air, soil and sludge, and water. In this respect especially the analysis of
water samples is of utmost importance as many of the organic contaminants of interest are
either directly introduced into the aquatic environment or eventually turn up in this
compartment due to aquatic run-off of agricultural and industrial sites or transfer from the
atmosphere into surface water. As surface water is a vital source of drinking water, water
quality has received considerable attention in environmental legislation and stringent
regulations for surface water as well as drinking water were issued by legislation agencies.
For example, current European Union (EU) directives dictate that the concentration of,
e.g., individual pesticides in drinking water should not exceed a maximum admissible
concentration of 0.1 µg/l [ l]. Quantitative analysis of such levels is already a challenging
task for analytical chemists. More stringent regulations which will without any doubt be
issued in the not too distant future will force analysts to develop new methods for the
•J H.G.J. Mo!, H.-G .M. Janssen, C.A. Cramers, J.J. Vreuls, U.A.Th. Brinkman, J. Chromatogr., 703 (1995) 277-307.

16 Gas chromatographic trace analysis of aqueous samples
accurate and reliable determination of ever lower concentrations of contaminants in
aqueous samples.
Pue to the complex nature of aqueous environmental samples, powerful separation
methods, such as for example capillary gas chromatography (GC) or high performance
liquid chromatography (LC), are indispensable for the analytical determination of
contaminants. A preferred arrangement is a combination of the separation method with an
identification technique such as for example mass spectrometry. The high efficiency, the
favourable speed of analysis and the ease of combination with spectrometric detection
devices render especially capillary GC a powerful analytical technique in water analysis.
In this respect one of the most important advantages of GC over any of the other
separation methods clearly is the availability of a wide range of sensitive and selective
detection devices. The combination of the excellent separation capability of capillary GC
with sensitive selective detection enables the measurement of low concentrations of
different components in complex sample matrices. Selective detectors have become
increasingly popular in recent years due to the fact that they partially eliminate the need
for laborious and time-consuming sample preparation. Moreover, selective detection also
reduces the risk of false-positive identifications. Finally, the use of selective detection at
least in principle simplifies the demands that have to be posed on the separation itself. If
selective detection is applied, target compounds can be determined while other co-eluting
components are not sensed. The most powerful selective detector is the mass spectrometer
which allows a truly positive identification of target compounds whereas selective
detectors merely reveal the presence of certain hetero-atoms in the eluting molecules. A
survey of some of the characteristics of a number of selective GC detectors frequently
used in environmental analysis is presented in Table I (2).
Table I. Overview of detection limits and linear dynamic ranges of various GC detectors. Adopted from ref. [2).
Detector
Flame ionization detector (FID) Electron capture detector (ECD) Nitrogen-phosphorus detector (NPD) Flame photometric detector (FPD) Mass Spectrometer (MS)
- full scan - single ion monitoring
• Linearized response from quadratic output.
Minimmn detectable amount [g]
5.10·11
10·12
Io·11
5.10·12
Linear dynamic range
I06
10•
I03
IO"
I03
I03
The minimum detectable amounts for the various detectors presented in Table I represent
the quantity of a component required to obtain a peak with a signal-to-noise ratio of three
under optimum experimental conditions. For reliable peak integration, especially in case of
real-life samples, peak heights of approximately 25 times the noise level are required
which results in determination limits which are approximately I 0 times higher than the
detection limits specified in Table I. From this it is clear that in order to meet the
detection limits dictated by the EU regulations, the total analyte content of at least an
equivalent of some 0.1 to I ml of water has to be introduced into the GC system. The
direct introduction of aqueous samples of this size suffers from a number of experimental
difficulties. Firstly, upon evaporation, the water sample forms a very large volume of
vapour. Discharge of this vapour volume via the column is a tedious and time consuming
process. Moreover, because of the polar nature of water, the stationary phase is essentially
non-wettable by water which makes water a poor solvent with regard to the creation of a
solvent film required for band focusing. Thirdly, large volumes of water can have an
adverse effect on the deactivation layer and the stationary phase of the chromatographic
column due to hydrolysis of siloxane bonds. Finally, water is not compatible with most of
the flame-based detection devices frequently used in GC nor with spectroscopic
identification systems such as infrared detectors.
To eliminat~ the problems encountered in the direct methods for water analysis,
various indirect methods were developed. In these methods the compounds of interest are
isolated from the water sample prior to introduction into the GC column. Basically, three
approaches for the indirect analysis of water samples can be distinguished. Gas phase
stripping is applied in techniques such as, e.g., (dynamic) headspace analysis or purge and
trap techniques. In headspace analysis the gas phase in equilibrium with the aqueous phase
is analysed. In the purge and trap technique a purge gas is used to strip volatile analytes
from the water sample. The components isolated from the sample are then collected in a
cryotrap and reinjected into the chromatographic column. Purge and trap analysis as well
as other (gas stripping) techniques for the determination of volatile components in aqueous
samples are nowadays well developed and frequently used in water quality control
laboratories all over the world. For a review of methods for the analysis of volatiles in
water the reader is referred to two excellent recent papers [3,4] and the literature cited
there. This chapter is restricted to a survey of methods for the determination of
contaminants with unfavourable water/gas distribution coefficients due to either a too low
volatility or a too polar nature. These solutes can not be isolated from the water sample
using gas phase stripping techniques but require the use of other isolation methods such as
those described below.

A second group of techniques for the isolation of analytes from aqueous samples relies on
transfer of the analytes of interest from the aqueous phase into an organic solvent with
more favourable properties for GC sample introduction. 1bis procedure, which is generally
called phase switching, can be performed using either liquid-liquid extraction (LLE) or
solid-phase extraction (SPE). In both methods the water is eliminated prior to the injector
of the GC. Very often a phase-switching step yields an additional advantage, viz.
preconcentration, because fairly large volumes of water can be extracted using a much
smaller volume of the organic solvent.
A third method for water elimination is based on sorption of the apalytes of interest
from the aqueous phase onto a solid sorbent or an immobilised liquid with subsequent
thermal desorption. In solid phase rnicroextraction (SPME), one of the sorption-thermal
desorption techniques for water elimination, the water is eliminated prior . to introduction of
the compounds of interest into the GC instrument. In other techniques SPE with
subsequent thermal desorption takes place inside of the injector of the GC. A schematic
representation of the various methods for water analysis is shown in Figure 1.
Direct
injection
Water Sample
Phase switching
LLE SPE OTE
Indirect
inj~ction
SPME
STD
Vap.OF SPE/TD OTE/TD
Figure 1. Schematic representation of methods for the analysis of aqueous samples. STD = sorption-thermal desorption; LLE = liquid-liquid extraction; SPE = solid-phase extraction; OTE = open-tubular extraction; SPME = solid-phase microextraction; Vap.OF = vapour overflow; SPEfrD = solid-phase extraction/thermal desorption; OTE!rD = open-tubular extraction/thermal desorption.
Most of the sample preparation methods described above can be performed in an on-line
as well as in an off-line fashion. On-line combination of the sample preparation and the
chromatographic analysis has a number of significant advantages over an off-line
approach. Firstly, as no intermediate sample handling step is required, the risk of sample
contamination or analyte loss is reduced. Moreover, on-line combination igreatly simplifies

automation thereby allowing the construction of a fully automated pretreatment module
connected on~line with the gas chromatograph. Additionally, an on-line set-up generally
yields improved detection limits since the total amount of component introduced into the
analytical system is actually transferred to the chromatograph. Despite the inherent
advantages of on-line sample pretreatment-chromatographic analysis, this technique is not
yet widely accepted in water analysis. In part this is due to the lack of commercial
instrumentation. Besides, analytical chemists in many water quality control laboratories
obviously are not familiar with the state-of-the-art in on-line water analysis.
In this chapter an overview of the various direct and indirect methods for the analysis
of water samples is presented. Each of the various techniques shown in Figure 1 will be
discussed in detail in subsequent sections. Emphasis will be on methods in which sample
preparation and analysis are combined on-line. Because many of the on-line systems for
indirect analysis rely on the introduction of large volumes of organic solvents into the GC
system, an outline of methods for large volume sampling is presented in section 2.1.

20 Gas chromatographic trace analysis of aqueous samples
2.1 Large volume injection in capillary GC
In order to be able to meet the required determination limits for micropollutants in water
analysis, the total amount of analyte present in 0.1 to 1 ml of water will have to be
transferred to the GC instrument. With a typical GC injection volume o,f 1 µl this would
imply that the volume ratio of water over organic solvent u~ed in the phase-switching
procedure should be between 1: 100 and 1: 1000. This means that 100 to 1000 µl of water
have to be extracted with only 1 µl of organic solvent. In daily practice, these ratios are
impractically large due to (partial) miscibility of the organic solvent and water in case of
liquid-liquid extraction and the unfavourable extraction yields obtained at such large ratios,
or due to the large dead volumes of the packed sorbent beds in (SPE) cartridges. Most of
the extraction methods currently in use in water analysis rely on the use; of large volumes
of extraction solvents. The required preconcentration is obtained by means of time
consuming evaporation which easily causes losses of volatile compounds [5]. The
introduction of a larger fraction of the extract is an attractive alternative.
In recent years several injection techniques have been developed that allow the
injection of samples of up to at least 100 µl in capillary GC. Techniques that have been
developed to this end -and have also been used to couple column liquid chromatography
on-line with GC, i.e. for LC-GC [6]- are partially concurrent solvent evaporation (PCSE)
using an on-column interface [7], fully concurrent solvent evaporation (FCSE) with a loop
type interface [8] and, more recently, the programmed temperature vaporizer (PTV)
injection technique.
Optimization of the processes during and after the actual injection is the key to
successful large volume injection. Essentially, these processes are the same for each of the
large volume injection techniques referred to above. During injection of the sample most
or all of the solvent is evaporated and as little solvent (vapour) as is pos~ible should reach
the stationary phase in the analytical column. It is evident that increruling the retention
power at the site of evaporation during the solvent elimination step will greatly improve
the recovery of volatile analytes. Although in principle several routes are open to achieve
increased retention, creation of a temporary solvent film on the wall of an uncoated
capillary column acting as injection zone, or on the wall of the injector liner is of most
interest. During injection this solvent film is an efficient trap for the volatile analytes,
while, once evaporated, it leaves behind a bare wall with low retention. In case of PTV
injection cooling of the injection zone to sub-ambient temperatures is often used.
Furthermore, in order to speed up the evaporation process and to protect the detector
from the large solvent cloud, the solvent vapour is generally released from the GC system
through an exit, either via a split vent as with PTV sampling or via ! an early solvent

vapour exit as with the other two injection techniques. For the PTV injection system the
exit is part of the injector itself, while for large volume injection with both the on-column
and the loop-type interface the exit is positioned after an uncoated capillary. Generally, a
short piece of coated GC column, the so-called retaining precolumn [9] is installed
between the uncoated capillary and the solvent vapour exit which prevents the volatile
analytes from being vented with the solvent. However, especially with on-column injection
it is still necessary to optimize the time of 'solvent release system open' after completion
of the injection in order not to loose the early eluting compounds and at the same time to
transfer an as small as possible amount of solvent to the analytical column and detector. A
detailed discussion of the three techniques applied for large volume sample introduction
will be presented below.
On-column injection
Large volume injection through an on-column injector became possible due to the
development of deactivated uncoated fused silica or glass capillaries, so-called retention
gaps [ 10, 11]. The introduction of the analyte-containing solvent has to take place at a
temperature below the solvent boiling point, in order to prevent back flush of solvent
vapour into the injector. The introduction speed is usually above the evaporation rate. This
guarantees the formation of a solvent film on the surface of the retention gap provided, of
course, that the retention gap can be wetted by the liquid.
Until recently rather long retention gaps, viz. 10 meters or longer, were used, in order
not to allow the liquid film to reach the stationary phase of the analytical column. The
developments reported by Munari et al. for eluent transfer from LC to GC under PCSE
conditions (12] opened the route to the injection of much larger volumes. In PCSE some
90% of the solvent that is injected is evaporated during the injection. Because only a
minor part is introduced as a liquid, which floods the retention gap, retention gaps could
be drastically decreased in length (13]. A system for on-column large volume injection is
schematically depicted in Figure 2. The main advantage of the on-column interface is that
it can be used for non-volatile as we!l as volatile analytes, while alternative techniques for
large volume sampling such as those described below are restricted to compounds eluting
at relatively high temperatures. After large volume on-column injection the analytes are
spread out over several meters of uncoated capillary. These broad bands are refocused by
solvent trapping and phase-ratio focusing (14-16]. With solvent trapping relatively volatile
solutes are reconcentrated because the solvent film evaporates from the rear to the front
and the analytes are retained by the liquid film, i.e. analytes start to migrate with
evaporation of the rear end of the film but are trapped again in the liquid film ahead. Less
volatile compounds do not evaporate with the solvent and remain spread out over the wall
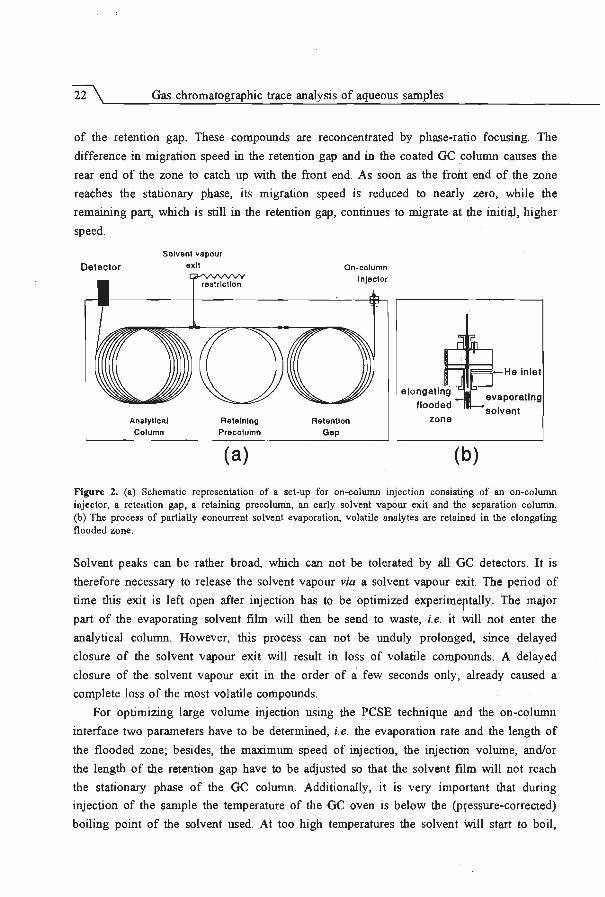
22"\~~~~-G_as~c_hr_o_m~a_to~gr~ap~hi_._c_tr_a_c_e_an~al~y-~_·s~of~a~qu_e_o_us~s_am--'p_l_es~~~~~~~~~~~
of· the retention gap. These compounds are reconcentrated by phase-ratio focusing. The
difference in migration speed in the retention gap and in the coated GC lcolunm causes the
rear end of the zone to catch up with the front end. As soon as the froht end of the zone
reaches the stationary phase, its migration speed is reduced to nearly zero, while the
remaining part, which is still in the retention gap, continues to migrate at the initial, higher
speed.
Detector
Solvent vapour
exit
Analytical Column
restriction
Retaining
Precolumn
(a)
On-column
Injector
Retention
Gap
zone
(b)
evaporating
solvent
Figure 2. (a) Schematic representation of a set-up for on-column injection consisting of an on-column injector, a retention gap, a retaining precolurnn, an early solvent vapour exit and the separation column. (b) The process of partially concurrent solvent evaporation, volatile analytes are retained in the elongating flooded zone.
Solvent peaks can be rather broad, which can not be tolerated by all de detectors. It is
therefore necessary to release the solvent vapour via a solvent vapour exit. The period of
time this exit is left open after injection has to be optimized experimeptally. The major
part of the evaporating solvent film will then be send to waste, i.e. it Will not enter the
analytical column. However, this process can not be unduly prolonged, since delayed
closure of the solvent vapour exit will result in loss of volatile compounds. A delayed
closure of the solvent vapour exit in the order of a few seconds only' already caused a
complete loss of the most volatile compounds.
For optimizing large volume injection using the PCSE technique and the on-column
interface two parameters have to be determined, i.e. the evaporation rate and the length of
the flooded zone; besides, the maximum speed of injection, the injection volume, and/or
the length of the retention gap have to be adjusted so that the solvent film will not reach
the stationary phase of the GC column. Additionally, it is very important that during
injection of the sample the temperature of the GC oven is below the (p~essure-corrected)
boiling point of the solvent used. At too high temperatures the solvent Will start to boil,

which can create backflush into the injector and eventually into the carrier gas lines. Two
relevant examples of calculating the length of retention gap and the maximum injection
volume in the on-column injection technique are presented in Table II.
Table II. Examples of adjusting parameters when using the on-column interface for large volume injection.
Length of retention gap for 100 µl injection?
Evaporation rate lnjection speed Flooded zone
55 µI/min 120 µI/min
10 cm/µl'J
Residual liquid per min 65 µI/min
Transfer time ~ (100/120) "'0.83 min
Length required ~ (65 x 10 x 0.83)"' 540 cm
Maximum injection volume in 150 cm retention gap?
Evaporation rate lnjection speed Flooded zone
55 µI/min 60 µI/min 20 cm/µl•J
Maximum amount as liquid (150120) "'7.5 µI Residual liquid per min (60 - 55) "" 5 µl
Maximum injection volume (7.5/5) x 60 "'90 µl
•J typical value for 0.53 mm i.d. retention gap •J typical value for 0.32 mm i.d. retention gap
The recent introduction of commercial instruments for large volume on-column injection
will help this technique to become applied in routine analysis. If the optimization has been
carried out carefully, very reproducible results can be obtained at low concentration levels.
An optimization strategy was described by Vreuls et al. [13]. The same authors used 100-
µl injections with an autosarnpler for confirmatory GC-MS with full scan acquisition of
various compounds at the sub-µg/l level in water extracts [ 17]. Polycyclic aromatic
hydrocarbons could be detected in surface water samples at the 5 ng/l level after extraction
of 1 1 of sample with 2 times 0.8 ml of n-hexane. The presence of atrazine was confirmed
in drinking water at a level of 0.05 µg/l after off-line SPE of 100 ml of sample with
subsequent desorption with 2 ml of ethyl acetate. In both cases, the injection volume was
100 µI.
By adapting the insertion depth of the syringe needle in the autosampler vial, it is also
possible to perform in-vial extraction. To that end Venema and Jelink [ 18] added 1 ml of
n-pentane to a 2.5-ml autosampler vial containing 1 ml of aqueous sample, which then was
closed with a crimpcap. The contents was shaken for 3 min and placed in the autosarnpler;
140 µl of the extract were injected. With this procedure the authors were able to detect
hexachlorobutadiene and hexachlorobenzene at 6 ng/l using mass spectrometry with
selected ion recording (RSD about 10%). At higher levels the RSD values were
significantly better, viz. 2-3%. A similar approach was used for the determination of
phenolic compounds in water [19].

24\ Gas chromatographic trace analysis of aqueous samples '--~~~~~~~~"--_;;_~~~~~;..._~~.....;:_~~~---=~~--'-~~~~~~~~~~
Loop-type injection
A second interface that can be used for large volume sample introd1-1ction in capillary
GC is the loop-type interface [8], which was originally designed for on-line LC-GC. This
interface is schematically shown in Figure 3. The heart of this interface is a 10-port valve
with two loops, one being used for injection of the sample and the oVier for adding an
internal standard or a wash solvent. The (carrier gas supply line and thE; retention gap are
attached to other parts of this valve. When both loops are filled, the valves are switched
and now the carrier gas pushes the eluent into the part of the retention gap located inside
the GC oven, which is kept at a temperature slightly above the solvent boiling point. The
pressure built up by the evaporating solvent will stop the plug of liquid from further
penetration into the retention gap. Using these FCSE conditions, the solvent is thus
evaporated during transfer into the GC system. Volumes of up to several millilitres can be
transferred in a relatively short period of time, the record being 20 ml in less than 20 min
[9]. Since there is no liquid film on the capillary wall, volatile compounds will be lost
together with the solvent. As a result, the set-up can only be used for the determination of
compounds with rather high GC elution temperatures, i.e. compounds elutirtg at .1
temperatures some l OO- I 20°C above the transfer temperature. Refocusmg of the analytes
occurs due to phase-ratio focusing.
--------------------------wall
----------------Deposition Hl111 boilers
Va.pol.I' PfBSSU'B
Carrier gas
l 1GC oven wall
Sani>le
Evat>oratlng solvent 'p lus volatiles
Figure 3. Schematic representation of the loop-type interface consisting of two valves, a gas supply system, and a retention gap.

In principle, there is only one parameter which has to be optimized, viz. the transfer
temperature. When the temperature is too low, liquid will enter the GC column, which will
result in broad and distorted peaks [20). When the transfer temperature is too high,
excessive analyte losses will occur rendering the application range very narrow.
Furthermore, the evaporation process will be more difficult to control due to delayed
evaporation. The temperature needed for correct transfer becomes lower the longer
becomes the retention gap. For many GC amenable solvents and solvent mixtures, Grob
and Laubli [21] have determined minimum transfer temperatures for FCSE conditions
which allow the liquid to penetrate a 3-m retention gap for 1-1.5 m.
As described earlier for large volume injection through the on-column interface, an
early vapour exit can be installed after the retention gap and a retaining precolumn to
speed up solvent evaporation. For standard use of the loop-type interface it is not very
critical to close the solvent vapour exit exactly in time. AH compounds retained in the
retention gap and on the top of the retaining precolurnn during the actual transfer into the
GC system are not lost when the solvent vapour exit is kept open for a few more minutes
after the injection has been completed. However, when applying the co-solvent trapping
technique [22,23] the moment of closing the solvent vapour exit becomes very important.
This technique is used to reduce losses of volatile analytes normally encountered with
. FCSE. To the main solvent a co-solvent is added. The co-solvent should have a boiling
point which is higher than that of the main solvent. Further the co-solvent should be
miscible with the main solvent and wet the retention gap. While the main solvent
evaporates during introduction into the GC, a layer of co-solvent remains in the retention
gap which serves as a temporary stationary phase in which the volatiles analytes are
trapped. With evaporation of the co-solvent, the volatile analytes are no longer retained
and lost if the solvent vapour exit is not closed in time.
Recently, large volume injection using the loop-type interface has successfully been
combined with GC-AED [24-28] The technique was used for the confirmation of GC-MS
data and for element specific screening, with limits of detection below 1 µg/l. Ground, tap
and surface water samples were analysed.
Programmed Temperature Vaporizing injection
The use of temperature-programming techniques for sample introduction in capillary
GC was proposed in 1964 by Abel (29). In 1979 Vogt and co-workers (30-32] constructed
a PTV injector and used it to introduce large sample volumes (up to 250 µl) in biomedical
and environmental studies. In 1981 Schomburg [33] and Poy et al. [34] demonstrated that
temperature-programmed sample introduction offers many advantages compared to hot
injection techniques. Injection into a cold chamber greatly reduces the discrimination of

26 Gas chromatographic trace analysis of aqueous samples_
less volatile components. Moreover, thermal degradation is minimized, because the
residence time of the components at elevated temperatures is reduced compared with
conventional split and splitless injection. The quantitative performance of PTV injection
systems appears to be comparable to that of on-column injection while at the same time
column contamination due to the presence of residue components in the sample, which is
frequently observed in on-column sample introduction, is absent [35]. Despite the good
results obtained by Vogt using the PTV injector in early large volume sampling
experiments, there was hardly any interest in the PTV injector for large volume sampling
in the decade following that publication. PTV injection has, however, received
considerable attention as a means of discrimination-free injection or for the injection of
thermally unstable molecules.
Large volume sampling using PTV injectors is based on selective elimination of the
sample solvent from the liner of the PTV injector while simultaneously trapping the
components with a much lower volatility in the cold liner. When solvent elimination has
reached completion, the components are transferred to the column in the splitless mode by
rapid temperature-programmed heating of the injector.
A schematic representation of a PTV injector is given in Figure 4. The basic set-up of
a PTV injector closely resembles that of a conventional split/splitless injector. As in.
conventional split/splitless injectors the liner is the heart of the ittjectiort system. The mal.rt
difference between conventional split/splitless injectors and PTV injectors is in the
temperature control. In PTV injectors the vaporization chamber can be heated or cooled
rapidly. Temperature control is provided by a sophisticated control box that allows
controlled heating and cooling of the liner. Heating can be performed either by direct or
indirect resistive heating, by using heater cartridges or by means of preheated compressed
air. Cooling can be performed using cold air, a Peltier elemertt, eXpanding C02, or liquid
nitrogen. Temperature-programmable injectors are highly flexible inj~otion devices for
capillary GC. Various injection modes including cold and hot split and 'splitless operation
can all be performed using the same injector.
In the injection mode that is used for the introduction of large sample volumes, the
solvent split mode, enrichment of the analytes occurs in the liner of the injector. First, the
liquid sample is introduced into the liner of the injector at a controlled rate. Speed
controlled sampling is necessary because the capacity of the liner to retain liquid is
limited. Upon introduction the solvent is selectively eliminated and solvent vapours 'are
discharged via the split line while less volatile solutes are retained in the liner. During
sample introdu{;tion the liner temperature is well below the boiling point of the solvent.
Next, the components retained in the liner are transferred to the column in the splitless
mode. The initial inlet conditions have to be carefully optimized to avoid (or minimize) I

losses of volatile sample constituents [36]. For optimum performance the speed of sample
introduction should equal the rate of solvent elimination [37]. If the sample introduction
rate exceeds the evaporation rate, the excess liquid will accumulate in the liner which
eventually will result in flooding or overloading of the liner and, thus, in severe losses of
both volatile and non-volatile components. Contrary to this, too low sample introduction
rates will result in a lengthy sampling procedure and in severe losses of volatile sample
constituents. The use of liners packed with an adsorbent has been reported to be an
efficient means to minimize losses of volatiles [38].
Injection needle
Carrier gas Septumless head
--> -="''""' Split line
Heating
Capillary column
Figure 4. Schematic representation of a PTV type injector.
The large number of experimental parameters involved in PTV-based large volume
sampling makes optimization of the sampling process, especially with regard to
minimizing losses of volatile compounds by co-evaporation with the solvent, a tedious and
time-consuming process. Optimization of PTV large volume injection has been the subject
of a number of studies. Herraiz and co-workers reported the use of chemometrical
strategies for the optimization of, e.g., sample volume, initial PTV temperature, speed of
sample introduction, carrier gas flow rate during sample introduction, and the nature of the
adsorbent packed in the liner [39,40]. Further work by this group focused on large volume
PTV injections in food analysis [ 40,41 ]. Reliable determinations of volatile alcohols and
ethyl esters of fatty acids at sub-µg/l concentrations were obtained using a flame ionization

28'\~~~~_G_as~c_hr~o_m_a_t_o~gr_a~p_hi_._c_tr_a_c_e_an~al~y~s_i_s_o_f_a_q~u_e_o_u_s_s_a_m~p~l_e_s~~~~~~~~~~~-
detector without the need for prior enrichment of the analytes [39]. Sam.pies of up to
approx. 500 µI of ethanol-water (50:50, v/v) were introduced at an initial PTV temperature
of 9°C and a sample introduction rate of 11 µIfs. Losses of volatiles were avoided by
using a liner packed with a mixture of Tenax TA and Gas Chrom 220.
A theoretical model to predict the optimum combination of lspeed of sample
introduction, initial liner temperature and carrier gas flow rate was proposed by Staniewski
and Rijks [37]. The solvent elimination flow rate was shown to de~end on, amongst
others, the vapour pressure of the solvent, the liner temperature and the design of the liner.
It was found that the solvent elimination rate could be increased by increasing the carrier
gas flow rate through the injector during sampling and/or by a decrease in the inlet
pressure. Enlargement of the gas-liquid contact area in the liner by packing the liner with
glass wool was found to improve the process of saturation of the purg~ gas with solvent
vapour which resulted in higher maximum allowable sampling rates. With a special
porous-bed liner components with a boiling point equal to or higher than that of dodecane
were quantitatively recovered from a 250 µI sample of test comppnents in hexane
introduced at a sampling rate of 25 µI/min and at a PTV initial temperature of -30°C [42].
The half-open liner was found to yield optimum conditions for wetting and evaporation at
a low back pressure. Further work of Staniewski et al. on the use of PTV injectors for
large volume sample introduction in GC included the application of large volume injection
in environmental analysis [43], the development of a multi-dimensional ;QC technique for
the introduction of large volumes of dichloromethane in capillary GC with ECD detection
[44] and the construction of a two-dimensional set-up for large volun;ie sampling [45].
With the latter system solvent vapours are discharged via a precolumn instead of via the
split exit. This system provided an elegant way of eliminating losses of volatiles in PTV
based large volume sampling. Components as volatile as nonane could! be quantitatively
retained from a 100 µI test sample containing over 90 priority pollutants in hexane.
In their pioneering work on large volume sampling using PTV technigues both Herraiz
et al. and Staniewski et al. applied speed-controlled sample introduction. Once fully
optimized the use of this technique in principle enables the introduction of unlimited
sample volumes. The only parameter that restricts the volume to be injected to a certain
upper value is the maximum allowable sampling rate or, directly related to this, the total
time required to introduce the sample. With these systems micropollutants were
determined at the sub-µg/l level after miniaturized LLE, as was shown for polycyclic
aromatic hydrocarbons and several nitrogen-containing pesticides [ 46]. With a slightly
modified system for PTV large volume sampling Trisciani et al. [ 47] were able to
determine organophosphorus pesticides and barbiturates at the low µg/l level in extracts of
various samples.

Recently, Mo/ et al. proposed an alternative method for PTV-based large volume sampling
in capillary GC [48,49]. By applying liners with a much larger inner diameters (3 .5 mm in
stead of the usual 1 mm) the volume of liquid sample that can be retained in a packed
insert was increased to some 150 µl, i.e. sample volumes up to approx. 150 µl can be
introduced rapidly without flooding the liner. This means that for sample volumes smaller
than 150 µl there is no need to optimize and control the speed of sample introduction.
This, in tum, greatly simplifies method development and the need for costly speed
programmable (auto)samplers. Preliminary results indicate that with this approach losses of
volatiles can be reduced significantly [50]. A more detailed description of this simplified
way of large volume PTV injection is presented in Chapter 3.

JO'\~~~-Gas~~c_hr_o_m~at_o_gr_a_p_hi_·c~tr_a_c_e_an~fil_y_s_is_o_f~aq_u_e_o_u_s_s_am~p_le_s~~~~~~~~~~~
2.2 Direct water injection
In the introduction to this chapter two basic approaches for water anfilysis were
distinguished. With the direct methods the aqueous sample is directly introduced onto the
GC column; with the indirect methods the water is eliminated prior to transfer of the
anfilytes of interest to the GC column. At first sight, direct aqueous injection seems to be a
very straightforward way of anfilysing water samples by means of GC. There is no
possibility of errors associated with, e.g., poor extraction efficiency and losses of anfilytes
by evaporation. Since the sample is directly injected into the GC, the procedure is rapid
and reliable. However, as outlined in the introduction, water is a very unfavourable solvent
for injection into GC. Another inherent disadvantage of direct aqueous injection is that
sfilts and involatile matrix constituents are introduced into the GC system which will lead
to deterioration of the system's performance. For these reasons, there are few applications
only; most of these defil with the anfilysis of volatiles in clean water samples. In the
following sections three different methods for direct water sampling will be discussed: on
column injection, loop-type injection and multidimensionfil GC.
On-column injection
Using highly sensitive detectors, such as the ECD and ion trap MS, injection of a few
microlitres of sample is sufficient for obtaining the desired detection lil;nits. Gurka et al.
[51] injected 0.2-5 µl of water samples containing polar volatile organic compounds
(rucohols, nitriles). Most of these compounds are not easily extracted from water and are
often not amenable to gas stripping methods. In their study Gurka et 'al. used ion trap
mass spectrometry for detection. Although detection limits at the µg/l level were obtained,
precision was hampered by severe tailing of some of the peaks. This indicates insufficient
inertness of the liner of the injector and the column upon water injection. Middleditch et
al. [52] filso applied direct aqueous injection for the anfilysis of polat volatile organic
compounds in water. The use of severfil detectors was evfiluated. As most of the anfilytes
did not contain hfilogen atoms, sensitive detection could not be achieved by using an ECD
detector. With the FID detector low detection limits could be achieved but the flame had
to be reignited after elution of the solvent peak.
A typicfil example of direct introduction of the water samples is in the determination
of volatile hfilocarbons (dichloroethylene, chloroform) in water using GC-ECD [53,54]
(Figure 5). The anfilytes are readily soluble in water, which renders their extraction from
water criticfil. In addition, some of the hfilocarbons elute close to solvents such as pentane
and carbon disulphide. Alternative methods, such as purge and trap methods, are generfilly
more critical in terms of quantification. Hence direct water sampling is ~ good choice for

this particular application. The most important requirement in direct aqueous injection GC- ·
ECD is that water should elute as rapidly and completely as possible ahead of the
analytes. The water peak should be well separated from the peaks of the target compounds
because water can significantly reduce the sensitivity of the ECD. For this reason non
polar columns are used at initial oven temperatures slightly above the boiling point of
water. In order to maintain sufficient separation between _ the halocarbons and water, on
column injections of sample volumes not exceeding 2-3 µI have to be performed using
thick film columns. Under optimal conditions detection limits down to 0.02 µg/I can be
achieved [S3]. In the quoted study long-term operation was seriously hampered by
increased retention of water caused by a slowly increasing column activity and the
deposition of salts in the column. This led to tailing of the water peak and a reduced ECD
sensitivity.
CCI 4 - con1aminated ground water
Figure 5. Direct on-column injection-GC-ECD of CCl,-contaminated ground water. Peak assignment: (1) /, 1-dichloroethylene 0.7 µg/1 , (2) dichloromethane 0.2 µg/1, (3) l , J,J-trichloroethane 0.02 µg/1, (4) trichloromethane 0.12 µg/l, (5) tetrachloromethane 2.8 µg/1, (6) trichloroethylene 0.16 µg/l , (7) tetrachloroethylene 0.18 µg/l. Reprinted from (53].
On-column injection of large volumes of aqueous samples has achieved considerable
attention in the field of on-line reversed-phase LC-GC where deactivated uncoated
precolumns [6] are used. Although the work done so far does not deal with real-life water
samples, interesting results have been obtained which are worth mentioning here. The key
problems in direct water introduction using uncoated precolumns are the poor wettability
of deactivated glass surfaces by water, and the destruction of the deactivation layer of the
retention gap by water. The wettability problem was solved by the addition of a (water
miscible) organic solvent to the water sample. This greatly improves the wetting
characteristics of the solvent in uncoated precolumns, thus enabling the application of
retention gap techniques through the on-column interface [SS]. The requirement is that

32 Gas chromatographic trace analysis of aqueous samples
water must evaporate more rapidly than the organic solvent. This is achieved by adding an
organic solvent with a boiling point higher than water or by adding ,an organic solvent
with which water evaporates azeotropically [55,56]. In the latter case,: the water content
after addition of the organic solvent should be below that of the azeotropic mixture, e.g.,
below 16 wt.% for acetonitrile and 28 wt.% for 1-propanol. With addit,ion of propanol to I
water (final concentration 75% propanol) methyl esters of fatty acids ! down to C8 were
successfully reconcentrated after a 50 µl on-column injection.
Loop-type injection
Originally developed for on-line LC-GC, the loop-type interface is also used for direct
injection of aqueous samples. Direct water introduction into the GC column is possible
because with FCSE there is no need for good wettability characteristics of the solvent
[57]. However, due to the high temperatures needed for FCSE of water (l 10-140°C) and
the very large volume of vapour formed, even fairly high boiling analytes are lost (if an
early vapour exit is installed) or appear as severely broadened peaks. Therefore, this
method can only be used for compounds with elution temperatures of 230-260°C or
higher. As an illustration the determination of atrazine in tap water is shown in Figure 6.
The applicability for more volatile analytes can be extended by the addition of an organic
co-solvent with a higher boiling point than water [58] . During transfer of the mixture to
the GC under FCSE conditions, a layer of organic solvent remains in the retention gap in
which the analytes are trapped. For the injection of I ml of water containing 20% of
butoxyethanol analyte losses through the vapour exit could be prevented for methyl esters
of alkanoic acids down to C14. Without co-solvent trapping methyl esters as high as C20
were (partly) lost. Sofar direct injection of real-life water samples by applying FCSE has
not been reported.
transfer
112'C
0. 0.
0 0
0. 0.
~ ~ <=
> sample
exit closed
-----e'/•in -----270°C
Figure 6. Chromatogram of tap water spiked with 100 ng/l of atrazine. The in~eit shows part of a chromatogram of a tap water spiked at the 15 ng/l level. Reprinted from ref. [57] . I

Multi-dimensional GC
Most of the problems associated with direct introduction of water samples can be
solved by using two-dimensional GC systems, as was shown already several years ago
[59]. Up to 200 µl of water sample could be injected onto a Tenax-packed GC column at
a temperature above the solvent boiling point, the water being eluted while the analytes
(cresols/alcohols) were retained. With the two-oven system, the analytes were transferred
in the split mode from the Tenax-packed precolumn (in the first oven) to a capillary GC
column (located in the second oven) by heating the first oven with a steep gradient. This
interesting approach has not resulted in the development of systems for routine water
analysis. Recently, as a result of the developments in large volume injection using PTV
injectors, there has been a renewed interest in this approach. Here the first dimension, i.e.
the packed precolurnn, is incorporated in the liner of the PTV injector (see section 2.4).
Despite the inherent advantages of methods for direct water analysis, the unfavourable
properties of water with regard to large volume sampling as well as the aggressive nature
of water restricts the application of direct sampling to a narrow range of compounds. An
overview of the characteristics and application areas of the different methods for direct
water analysis is presented in Table Ill
Table III. Summary of applications for water analysis based on direct introduction of the sample onto the GC column.
Analytes Matrix Injection Detector Limit of detection Reference technique
direct water injection
Water soluble alcohols Ground water On-column Fr-IR» 2.5-50 mg/ml [51] low MW (hazardous waste) (2 µI) ITD'l 4-200 µg/l
Volatile polar comp. Drinking water On-column FlD 5 µg/l [52] (acetone, MEK, THF) (4 µl)
Volatile halocarbons Drinking water On-column ECD 0.02 µg/l [53] Ground water (2 µI)
Volatile halocarbons Drinking water On-column ECD 0.017 µg/l [54] (3-5 µl)
•) FT-IR: fourier transform infrared detection b) lTD: ion trap detector

34 Gas chromatographic trace analysis of aqueous samples
2.3 Indirect water injection: phase switching
In extraction-based methods for water analysis the compounds of interest are transferred
from the aqueous sample to an organic solvent which is more favourable for GC sample
introduction. These techniques are often referred to as phase-switching ~ethods . The most
simple phase-switching method is liquid-liquid extraction (LLE). Here ~e compounds are
directly transferred from the water phase to a water-immiscible organic phase. In solid
phase extraction (SPE) and open-tubular extraction (OTE) phase switching occurs via
intermediate trapping of the compounds onto/into a solid phase or an idunobilized liquid, I
respectively. The three methods are discussed below.
Liquid-liquid extraction
LLE is basically an equilibrium distribution technique where the solutes of interest
partition between the aqueous phase and an organic phase. The extraction efficiency, 8,
can be written as:
1 e 1 - -----
1 + K (VORG) v,.Q
(1)
where K is the distribution constant, and V ORG and V AQ are the volumes of the organic and
the water phase, respectively. Eqn. 1 shows that extraction yields are higher the larger is
the phase ratio (=VoRaN AQ) and the higher is the distribution constant.
On-line LLE can be performed by periodically injecting the aqueous sample into a
stream of organic solvent. Because it takes some time before the extraction reaches
equilibrium, several meters of PTFE or fused silica tubing are used, in which a segmented
flow is formed. After extraction, phase separation is achieved using ~ semi-permeable
membrane [60] or a sandwich-type phase separator [61]. The GC amenable phase is
directed to an interface for large volume sampling and a portion in the order of 100-500 µl
is transferred into the GC system. The total on-line set-up has successfully been used for
e.g. the LLE-GC analysis of halocarbons in seawater [60], hydrocarbons in municipal
sewage water [62] (see Figure 7) and organochlorine pesticides in ground water [63].
Recently, Goosens et al. [64] introduced on-line LLE-GC with simultaneous
derivatization for the determination of organic acids and chlorinated anilines in aqueous
samples. The organic acids and chlorinated anilines were alkylated and acylated,
respectively, in a two-phase reaction. In the two-phase derivatization of acids, the analyte
is associated with a tetra-alkylammonium ion in the water phase. The io~-pair is extracted

into the organic phase, where alkylation takes place. Acylation of the anilines occurs at the
boundary between the phases. With this on-line LLE derivatization set-up the authors were
able to enhance the extraction yield and to improve the chromatographic behaviour of the
polar solutes. A disadvantage of the on-line system is the excess of reagent present in the
organic solvent, which shows up as a large and broad peak in the GC chromatogram.
r· !
A min
i A
J B
Figure 7. GC-FID chromatogram of (A) municipal sewage waste-water after continuous LLE-GC and (B) the solvent blank (n-pentane with 30 µg/l of dodecane as internal standard). Peaks A and B in chromatogram (A) represent a level of ca. 200 and 50 ng/l, respectively. Reprinted from (62].
A continuous extraction system with and without two-phase derivatization was developed
by Ballesteros et al. and was used for the determination of phenols (65] and carbamate
pesticides (66]. Phenolic compounds in water were extracted by mixing the water with
ethyl acetate and with n-hexane plus 8 vol.% of acetic anhydride for simultaneous
extraction and derivatization. After extraction, and derivatization, the extract was stored in
a loop and introduced into the GC injector by the carrier gas via. a heated transfer line.
Because of the use of FID detection and, more importantly, of low injection volumes of
only 4 µI, detection limits were fairly high (mg/I range). The relative standard deviations
(RSDs) were satisfactory. The same set-up was used for the determination of carbarnate
pesticides. Using a basic sodium hydroxide solution as aqueous phase, · aryl N
methylcarbarnates were hydrolysed to the corresponding phenols. The FID responses
obtained for six pesticides were linear in the 0.1-160 mg/I range with RSD values of 1.9-
3 .9%. In a further study, the use of ECD detection and pentafluoropropionic anhydride as
derivatization reagent improved the detection limits to the low µg/l level (67].
36 Gas chromatographic trace analysis of aqueous samples
Solid-phase extraction - liquid desorption
In SPE, the aqueous sample is loaded onto a porous packed b~d. The trace-level
analytes of interest, but also some less desirable sample constituents, ·accumulate on the
particles while the water is flushed out. After washing with HPLC-grade water the
analytes are desprbed by an organic solvent and collected in a vial . Next, the extract is
injected into the GC system and separation proceeds. In most instances, the extraction
cartridges are packed with a hydrophobic material such as a C18- or C8-bonded silica or a
polystyrene-divinylbenzene copolymer. With these packing materials, sensitivity can be
increased dramatically (high analyte retention), but selectivity is only slightly improved
(non-selective hydrophobic interaction). Improved selectivity can be obtained by
introducing proper flushing steps during desorption where undesirable compounds are
eluted prior to or after the analytes of interest. The use of more selective sorbents
containing, e.g., immobilized antibodies [68] is a good alternative.
If on-line SPE trace enrichment techniques are used, the extraction cartridges are
usually called precolumns. In this approach, a small column with dimetlsions of, typically,
1-4.6 mm I.D. and 2-10 mm length, replaces the conventional injection loop of a six- or
ten-port valve. Using a second pump, a large sample volume of 1-10 ml! is loaded onto the
precolumn at a flow rate of 1-10 ml/min. Before desorption/transfer to the Ge-column can
take place water remaining in the precolumn has to be removed. The main reason for this
is that the introduction of even small amounts of water destroys the ddactivation layer of
the retention gap.
Noroozian et al. [69] were the first to use SPE-GC for the analysis of a series of
chlorinated pesticides and PCBs in surface water samples. They used a' four-valve system
and a 4 mm x 1 mm I.D. micro-precolumn which was built-in in a six-port valve. After
sample loading and drying by means of a nitrogen purge, the analytes were desorbed with
n-hexane using the PCSE technique. Recoveries of more than 95% were observed for the
majority of the analytes. The method was applied to the SPE-GC-ECD !!Ilalysis of I ml of
river water samples. Detection limits of the chlorinated compounds were in the order of 1
ng/l in Amstel river water. With a somewhat modified loop-type interface for the final
introduction of the extract, and using 12 ml instead of 1 ml of sample, Noy et al. obtained
similar detection limits for the same group of compounds [70].
In subsequent studies it proved to be beneficial to use more pelar solvents than
n-hexane for the desorption of more polar analytes. When using n-prop~ol the desorption
of compounds such as nitrobenzene and m-cresol could be carried out \Yith only 50 µl of
solvent [71]. However, the desorption of non-polar compounds s~ch as 2-methyl
naphthalene and acenaphthene needed 150 µl of solvent. Such a large volume could not be
introduced in one fraction, because this would result in flooding of the pc column. Ethyl

acetate was found to be a good compromise between the non-polar n-hexane and the polar
n-propanol. Vreuls et al. [72] showed that 30-50 µl of this solvent were sufficient to
desorb seven test solutes of varying polarity from 10 x 2 mm ID precolumns, and to
transfer them to the GC system. In actual practice, 75 µl were used to prevent probiems
regarding memory effects and to create a safety margin. With SPE-GC-FID several rather
polar test compounds could be detected and quantified in 1 ml of river water sample at the
0.1-0.4 µg/l level. More than 14{) analyses were carried out without exchanging any part
of the system.
With the above set-ups, careful optimization of the desorption and transfer procedure
was necessary. An early start of the transfer would result in injection of water into the
deactivated retention gap, while a late start would result in loss of analytes. Although the
system could be used for the automated analysis of aqueous samples, peak tailing of high
boiling analytes due to adsorption in the retention gap was sometimes observed. The active
sites responsible for the adsorption are created by the repeated introduction of small
amounts of water still present in the first few droplets of ethyl acetate which are
introduced into the retention gap. The water evaporates azeotropically with ethyl acetate,
but its very presence suffices to partly destroy the deactivated surface of the retention gap
by hydrolysis. In order to overcome the possible introduction of even traces of water, the
precolumn-GC system was made more robust by inserting a drying step, which
quantitatively removes the residual water. Two systems were described by Vreuls et al.
[73]. Either water is removed from the precolumn by means of a nitrogen purge (at
ambient temperature; 15-30 min), or the traces of water are retained by physical/chemical
interaction during desorption (cf below).
With the former alternative, the use of so-called membrane extraction disks -which
typically contain ca. 90 wt.% of a polymeric or alkyl-bonded silica packing enmeshed in a
PTFE matrix (10 wt.%) [74]- instead of conventional packed precolumns, appeared to be
beneficial [75]. This because the formation of channels during drying with a gas, which
may occur with conventional packed cartridges, is highly unlikely with membrane-disk
precolumns. After loading the sample onto a cartridge containing three 0.5-mm thick,
4.2-mm diameter polymer-containing extraction disks, drying was performed by 10-15 min
purging with a stream of nitrogen at ambient temperature. SPE-GC-NPD was used for the
determination of organophosphorus pesticides in tap water and water from several
European rivers. With only 2.5 ml of sample, detection limits were 10-30 ng/1 in tap water
and about 50-100 ng/1 in river water with RSDs of 2-4%. The total procedure was linear
over the concentration range of 0.06-3 µg/1.
Physical/chemical removal of water was achieved using the set-up of Figure 8. The
eluate containing the desorbed analyte is led through a cartridge containing silica or

38 Gas chromatographic trace analysis of aqueous samples
sodium sulphate, which is incorporated in the transfer line to the retention gap. After each
transfer the cartridge is regenerated by heating under a small heliun;i purge flow. The
device was successfully tested with 10-ml aqueous solutions containing 2-0.3 µg/l of
s-triazine herbicides. Because of its higher capacity for water, sodium sulphate was
preferably used. The drying cartridge option was further evaluated by 'Pico et al. [76,77]
who used silica, sodium sulphate and copper sulphate as drying agents. All drying agents
had rather wide application ranges. Several limitations, however, were also reported. Silica
interacted with some highly chlorinated phenols, and copper sulphat~ with all triazine
herbicides. When sodium sulphate was used, it is recommended to exchange the cartridge
every 20 analyses to prevent disintegrated particles to be transferred into the retention gap.
The SPE-drying cartridge-Ge system was used to determine organophosphorus and
-sulphur pesticides and triazines at sub-µg/l levels using detectors such as the NPD and
FPD (phosphorus and sulphur mode). Lauter et .al. [78] successfully tested the drying
agent set-up for more volatile solvents such as methyl acetate. The mef!iod can now also
be used for volatile compounds such as toluene and methylated benzenes.
waste
solvent delivery valve
1 water COIUlYl
2-6 sarrples
to GC
Figure 8. Schematic diagram of a system for on-line SPE-GC. A PLRP-S packed precolumn is used for trace enrichment; a solvent selection valve for choosing the appropriate solvent, viz. ~ater for conditioning, the sample and water for some clean-up. Four switching valves are used for subsequent functions in the procedure: flushing of the SPE system, drying of the PLRP-S cartridge, desorption of the analytes and transfer of the desorption solvent into the GC system. Reprinted from ref. [73].
Coupling MS detection to the SPE-GC system yields a hyphenated system that combines
the automation potential of the SPE-GC system and the selectivity and sensitivity of MS
detection [79,80]. The connection between the GC column and the ion source of the mass
spectrometer was made via a 2 m x l SO µm I.D. deactivated fusee\ silica restriction
capillary which was permanently mounted in the transfer line to the mass spectrometer.
This ensures that, during transfer, i.e. when the solvent vapours are released via the
solvent vapour exit, less solvent enters the ion source than under I standard GC-MS

operating conditions. The left hand side of Figure 9 illustrates the use of the system for
the low ng/1-level target analysis of atrazine and simazine in I ml river water samples
using multiple ion detection [79,80]. The right hand side shows that I 0 ml suffices to
identify the analytes (at the same concentration level) under full scan acquisition
conditions [80]. auai:lne almu:l11e
(c) g g (d) ; ... ; j w l
<
: ~
ml• ml•
m/l. 200
mJz 201
r.Jl :100
mJr 201
0
(a) f:=
10 1• 20 10 16 20
Tlmo (min) Time (min)
Figure 9. Chromatograms obtained after on-line SPE-GC-MS of (a) 1 ml of river Meuse water using selected ion recording of eight ions and (b) 10 ml of the same sample using full-scan acquisition. The inserts show the ion traces of m/z 200 and 201 for target analysis of atrazine and simazine, respectively. Mass spectra recorded for (c) atrazine and (d) simazine. Reprinted from [80].
The SPE-GC-MS system was further improved by fully integrating and automating the
SPE and GC-MS system. The benchtop instrument consisted of a PROSPEKT for trace
enrichment, and a GC-MS system for separation and detection/identification [81]. Analysis
of IO ml of river Rhine water under full-scan conditions enabled the detection of
organophosphorus pesticides at the 0.1 µg/l level. Next to the target compounds, an
unknown analyte was identified, viz. triphenylphosphine oxide. The system was also used
for the rapid identification of benzothiale in a river water at a level of I µg/l [27]. The
result was confirmed by analysing an SPE extract of the sample off-line by means of by
large volume injection GC-AED apparatus.
AED detection, which in principle allows the selective detection of any element except
helium, is a relative newcomer in the field of GC detectors. Using AED coupled to SPE
GC, Rinkema et al. [26,82] used organophosphorus pesticides as test compounds and were

40 Gas chromatographic trace analysis of aqueous samples
able to obtain good recovery, precision and linearity data in spiked surface water samples.
Detection limits as low as 5-20 ng/l for the analysis of I 0-ml sample were obtained using
the P-channel. The potential of the technique was further demonstrated ~y analysing waste
water samples. Figure 10 shows the comparison of chromatograms obtl\ined from influent
and effluent samples of a municipal sewage waste water treatment plant. :
~I. lilE4 c 193
4 .lilE4
• • c g_3.lilE4
• • ~ gZ .lilE4 I.I a:
llHllillil
lil B 10 IZ 16'
Tt m• (11tln . )
1400 p 186
IZ00
• ~ 100111 0 ...
800 • • ~ a 600 I.I a:
400
Z00
I I l iC ,_L.L,A_,..__
I ,D 0
8 18 IZ 14 Tim• (ffttn.)
Figure 10. On-line SPE-GC-AED of 10-ml municipal waste-water samples using (A, B) the carbon 193 nm, and (C, D) the phosphorus 186 nm channels, respectively. Chromatograms A and C show the influent, while B and D show the effluent water samples. Reprinted from (82] .
Noy and van der Kooi [83) used a loop-type interface rather than an on-column interface
for automated pesticide analysis involving SPE-GC-NPD. The loop-type interface was
preferred over the on-column interface because it is more rugged. 28 polar
organophosphorus and -nitrogen pesticides were selected as test compounds. The SPE
module and the procedure for trace enrichment were identical to the one described above.
Desorption of the analytes was now carried out into one of the two loops of the interface
using 500 µl of solvent. When tert-butyl-methyl ether was used for desorption the
application range included compounds less volatile than ethoprophos. !Pesticides such as
dichlorovos, mevinphos and methamidophos were (partly) lost. The on-line procedure gave
better recoveries for the more polar solutes in the test set than an approach where SPE was
carried out in an off-line fashion. This is due to a better sorbent:sample volume ratio, viz.
0.015 and 0.002 for the on-line and off-line approach, respectively.
In conclusion, SPE-GC is a highly interesting approach for the rapid trace-level
detection and quantification of the wide range of Ge-amenable compounds that have to be
monitored in, e.g., surface, ground and drinking water.
Open-tubular extraction - liquid desorption
An alternative to trapping analytes by means of SPE is trapping m the coating of a
short piece of capillary GC column. Compared to the use of packed SPE cartridges, the
main advantage of applying open-tubular extraction (OTE) columns is that complete
removal of water remaining in the column after sampling can be obtained by simply
purging a short plug of gas through the capillary. The main disadvantage of OTE columns
is that their retention power is much lower than that of SPE cartridges. Furthermore, the
flow rate during the sorption step is rather critical with short columns (e.g. 2 m). OTE
columns were used by Zlatkis et al. [84] for the off-line extraction of large volumes of
water samples. On-line systems for water analysis based on OTE columns were described
by Mot et al. [85,86]. In their system the analytes were trapped in a 2 m x 0.32 mm I.D.
OTE column coated with a 5 µm dimethylsiloxane stationary phase. Water was removed
by brief purging with a low flow of nitrogen. Next, desorption into the GC system was
carried out with an organic solvent. Transfer to the GC system was done using a PTV
injector as the interface.
It can be derived theoretically that breakthrough of an analyte through an OTE column
will occur when [86]:
(2)
where Va is the breakthrough volume and K the distribution constant of the analyte, Vs
the volume of the stationary phase, F the sorption flow rate, DM the diffusion coefficient
of the analyte in water, and L the length of the trapping column. Obviously, the sorption
flow rate should not exceed a certain threshold value or breakthrough will occur
immediately. Sampling flow rates that can be used in practice depend on the length of the
OTE column and are ca. 0.2 ml/min and 1 ml/min, for 2 m and IO m columns,
respectively [86,87]. Recently it was demonstrated that geometrical deformation of the
OTE column allows much higher sampling flow rates. This because in deformed
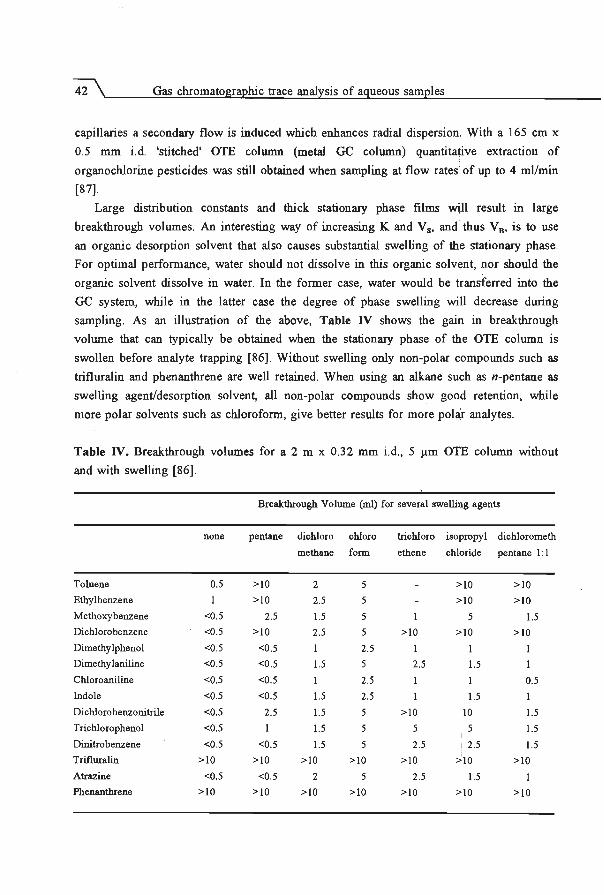
42 Gas chromato ra hie trace anal sis of a ueous samples
capillaries a secondary flow is induced which enhances radial dispersion. With a 165 cm x
0.5 mm i.d. 'stitched' OTE column (metal GC column) quantitative extraction of
organochlorine pesticides was still obtained when sampling at flow rates of up to 4 ml/min
[87].
Large distribution constants and thick stationary phase films ~ll result in large
breakthrough volumes. An interesting way of increasing Kand V5 , and thus V8 , is to use
an organic desorption solvent that also causes substantial swelling of the stationary phase.
For optimal performance, water should not dissolve in this organic solvent, nor should the
organic solvent dissolve in water. In the former case, water would be transferred into the
GC system, while in the latter case the degree of phase swelling will decrease during
sampling. As an illustration of the above, Table IV shows the gain in breakthrough
volume that can typically be obtained when the stationary phase of the OTE column is
swollen before analyte trapping [86]. Without swelling only non-polar compounds such as
trifluralin and phenanthrene are well retained. When using an alkane such as n-pentane as
swelling agent/desorption solvent, all non-polar compounds show good retention, while
more polar solvents such as chloroform, give better results for more polar analytes.
Table IV. Breakthrough volumes for a 2 m x 0.32 mm i.d., 5 µm OTE column without
and with swelling [86].
Breakthrough Volume (ml) for several swelling agents
none pentane dichloro chloro trichloro isopropyl dichlorometh
methane form ethene chloride pentane I: I
Toluene 0.5 >IO 2 5 >10 >IO
Ethyl benzene 1 >IO 2.5 5 >IO >10
Methoxybenzene <0.5 2.5 1.5 5 5 1.5
Dichloro benzene <0.5 >10 2.5 5 >IO >IO >IO
Dimethylphenol <0.5 <0.5 I 2.5
Dimethylaniline <0.5 <0.5 1.5 5 2.5 1.5
Chloroaniline <0.5 <0.5 2.5 I 0.5
Indole <0.5 <0.5 1.5 2.5 1.5
Dichlorobenzonitrile <0.5 2.5 1.5 5 >IO IO 1.5
Trichlorophenol <0.5 I 1.5 5 5 5 1.5
Dinitrobenzene <0.5 <0.5 1.5 5 2.5 I 2.5 1.5
Trifluralin >IO >IO >IO >IO >IO >10 >IO
Atrazine <0.5 <0.5 2 5 2.5 1.5
Phenanthrene >10 >10 >IO >IO >IO >10 >10

The OTE-GC-FID system was used to determine the test compounds from Table IV m
spiked river water, urine and serum samples. In all cases analyte recoveries were
satisfactory with RSD values for the total analysis of l-l0%. Figure 11 shows the analysis
of river water spiked at the 5 µg/I level. Detection limits were estimated to be in the ng/l
to µg/I range, depending on the amount of sample taken and the FID response of the
analytes.
5
4 6
2 8 3
v 10 "-' i:l 0 7 9 13 0.. 11 "-' 14 ~ 1 12
Cl ...... ~
6 10 14 min 18
Figure 11. On-line OTE-GC of 2.25 ml river water spiked at 5 µg/l of various organic compounds. Swelling agent: chloroform. Peak assignment: I) toluene, 2) ethylbenzene, 3) methoxybenzene, 4) p-dichlorobenzene, 5) dimethylphenol, 6) dimethylaniline, 7) chloroaniline, 8) indole, 9) dichlorobenzonitrile, 10) trichlorophenol, 11) dinitrobenzene, 12) trifluralin, 13) atrazine, and 14) phenanthrene. Reprinted from [86].
Table V presents a summary of the applications reported using the various phase
switching procedures. It is evident that a wide range of compounds can be covered,
including fairly volatile as well as high boiling, and non-polar as well as rather polar
analytes. On-line LLE-GC is an attractive option when a derivatization step is part of the
sample pretreatment procedure. SPE-cartridges offer high breakthrough volumes while the
use of OTE columns eliminate~ the need for prolonged drying steps and/or the necessity to
incorporate drying columns in the set-up.

44\ Gas chromatographic trace analysis of aqueous samples
Table V. Summary of applications for analysis of aqueous samples based on on-line phase switching.
UE-GC Analyte Matrix Interface" Detector Limit. of detection Ref.
Halocarbons Seawater LT! ECD 0.5 nSfl [60] Nafta Municipal sewage LT! FID 0.1 µg/1 [62]
water Hexachlorocyclohexanes Ground water LT! ECD 0.1 µ!0 [63] Carboxylic acids Water standard LT! FID 0.1 µsJI [64) Chlorinated anilines Water standard LT! ECD 0.01 µg/1 [64) Phenolic compounds Water standard Splitless inj. FID 0.2-().3 mg/l [65) Carbamates Water standard Splitless inj. FID 0.2-0.3 mg/I [66]
Milk Splitless inj. ECD 2-20 ng/1 [67)
SPE-liquid desorption Analyte Matrix Interface Detector Limit 'of detection Ref.
Organochlorine pesticides River water OCI ECD 1 ng/1 [68) Organochlorine pesticides Water standard modified LT! ECD 1 ng/1 [70) Medium polar analytes Water standard OCI Fill 0.1 µg/1 [71)
River water [72) Triazines Water standard OCI Fill 0.02-0.03 µg/1 [73) P-pesticides River water OCI NPD 0.01 ·0.05 µg/1 [75) P- and S-pesticides River water OCI Fill/NPD 0.02-0. I µg/1 [76) P- and S-pesticides Tap water OCI Fill/NPD/ 0,001~0.03 µg/1 [77) triazines FPD
Atrazine, simazine River water OCI MS (Sllvf) 3 ng/l [79) MS (FS) O.Q3 µg/1
Various pesticides, River water OCI MS (Sllvf) 3 ng/1 [80) organic contaminants MS (FS) O.o3 µg/1
P-pesticides River water OCI MS 0.02-0.05 µg/1 [81) P-pesticides River water OCI AED 0.005-0.02 µg/1 [82) Priority pesticides River water LT! NPD 0.01-0.2 µg/l (83)
GTE-liquid desorption Analyte Matrix Interface Detector Limit of detection Ref.
Volatile organic comp. Drinking water Splitless inj. FID Not reported (84) PAHs Water/MeOH PTV FID 0.3 µg/1 (85)
standards Volatile organic comp. River water, PTV FID 0.1-1 µg/1 (86) medium polar comp. drinking water, herbicides urine, serum
Organochlorine pesticides Drinking water PTV FID 0.01 µg/1 [87)
" L TI = loop-type interface, OCI = on-column interface, PTV = programmed temperature vaporizing injector.

2.4 Indirect water injection: sorption-thermal desorption
In contrast to the situation in phase-switching-based extraction procedures, no organic
solvents are needed for desorption in sorption-thermal desorption methods. In the latter
case the analytes are again sorbed onto/into a solid phase or an immobilized liquid. After
drying of the sorbent, the solutes are desorbed thermally and transferred to the GC column
in the gaseous phase. Sorption into a liquid phase occurs in SPME and in the OTE
approach. A solid sorbent is used in techniques based on SPEffD and vapour overflow.
Each of these methods will be outlined in more detail below.
Solid-phase microextraction
In solid-phase rnicroextraction (SPME), which is a relatively new technique for
sorption-thermal desorption [88], a small-diameter fibre coated with a polymeric phase is
placed in an aqueous sample. The analytes partition into the stationary phase and are then
thermally desorbed in the injector of the gas chromatograph. The 1-cm fibre is glued to
the stainless steel plunger of a syringe in such a way that the fibre is drawn into the
syringe needle when the plunger is retracted. This facilitates introduction of the fibre
through the septum of a sample vial or the GC injector. After extraction the syringe is
transferred to the GC injector for thermal desorption of the analytes. For volatile analytes
cryofocusing prior to GC separation may be necessary in order to eliminate band
broadening caused by a relatively slow desorption. The technique can be automated by
mounting the SPME modified syringe in an autosampler.
In contrast to packed SPE or OTE procedures, the extraction process in SPME is not
exhaustive. The amount of analyte that will be extracted can be calculated from:
(3)
where ns is the number of moles of analyte sorbed m the stationary phase, K the
distribution constant of the analyte, Vs the volume of the stationary phase, and CAQ the
analyte concentration in the aqueous sample. From eqn. 3 it is obvious that the lowest
detection limits are obtained for analytes with high distribution constants [89] using fibres
coated with thick stationary phase films. For Eqn. 3 to be valid it is required that an
equilibrium is reached for the target analytes. The time needed for reaching the
equilibrium is affected by the film thickness of the coating, the distribution constant, the
vial diameter, and the degree of agitation of the sample solution. For a detailed discussion
of the kinetics of the SPME process, the reader is referred to ref. [90]. Equilibrium times
can vary from less than 2 min to over 60 min. High distribution constants and thick
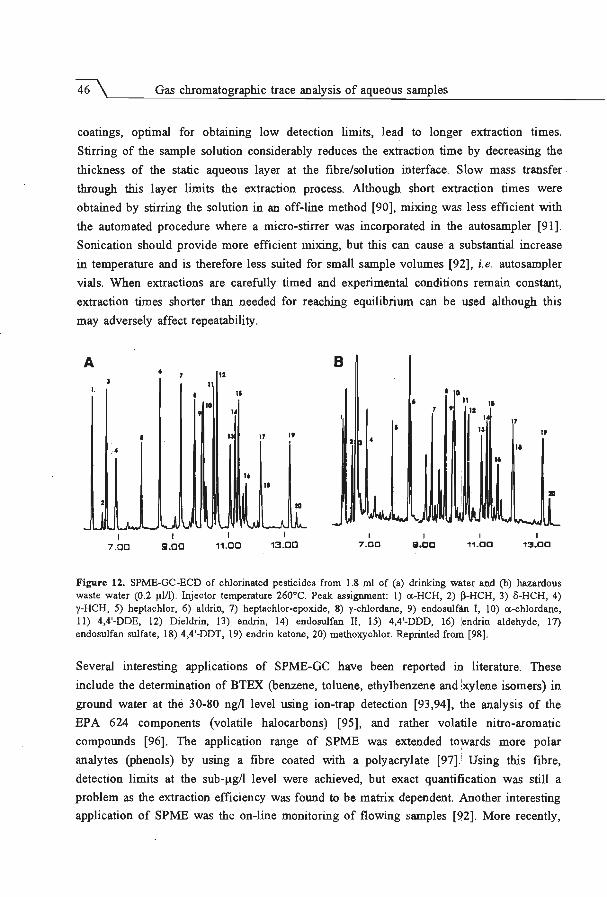
46 Gas chromatographic trace analysis of aqueous samples
coatings, optimal for obtaining low detection limits, lead to longer extraction times.
Stirring of the sample solution considerably reduces the extraction time by decreasing the
thickness of the static aqueous layer at the fibre/solution interface. Slow mass transfer
through this layer limits the extraction process. Although short extraction times were
obtained by stirring the solution in an off-line method [90], mixing was less efficient with
the automated procedure where a micro-stirrer was incorporated in the autosampler [9 l].
Sonication should provide more efficient mixing, but this can cause a substantial increase
in temperature and is therefore less suited for small sample volumes [92], i.e. autosampler
vials. When extractions are carefully timed and experimental conditions remain constant,
extraction times shorter than needed for reaching equilibrium can be used although this
may adversely affect repeatability.
Figure 12. SPME-GC-ECD of chlorinated pesticides from 1.8 ml of (a) drinking water and (b) hazardous waste water (0.2 µI/I). Injector temperature 260°C. Peak assignment: I) a.-HCH, 2) ~-HCH, 3) 8-HCH, 4) y-HCH, 5) heptachlor, 6) aldrin, 7) heptachlor-epoxide, 8) y-chlordane, 9) endosulfan I, I 0) a-chlordane, 11) 4,4'-DDE, 12) Dieldrin, 13) endrin, 14) · endosulfan II, 15) 4,4'-DDD, 16) :endrin aldehyde, 17) endosulfan sulfate, 18) 4,4'-DDT, 19) endrin ketone, 20) methoxychlor. Reprinted from (98] .
Several interesting applications of SPME-GC have been reported in literature. These
include the determination of BTEX (benzene, toluene, ethylbenzene and !xylene isomers) in
ground water at the 30-80 ng/l level using ion-trap detection [93,94], the analysis of the
EPA 624 components (volatile halocarbons) [95], and rather volatile nitro-aromatic
compounds [96]. The application range of SPME was extended to:vvards more polar
analytes (phenols) by using a fibre coated with a polyacrylate [97r Using this fibre,
detection limits at the sub-µg/l level were achieved, but exact quantification was still a
problem as the extraction efficiency was found to be matrix dependent Another interesting
application of SPME was the on-line monitoring of flowing samples [92]. More recently,

SPJ\.1E has been applied for the determination of chlorinated and organophosphorus
pesticides in water [98,99]. Figure 12 shows the analysis of some chlorinated pesticides
(concentration level; 0.2 µg/l) in waste water. The combination of ECD detection and the
high extraction efficiencies obtained for these non-polar solutes resulted in low detection
limits. For some more polar pesticides [100,101] the unfavourable distribution coefficients
made analysis at the sub-µg/l almost impossible even with a rather sensitive detector such
as the NPD. With the highly sensitive ion trap detector [102] it was possible to detect
polar pesticides at the 0.2 µg/l level. Experimental difficulties were encountered in the
determination of derivatized butyl-, phenyl- and cyclohexyltin compounds in water [103].
Extraction times of 30 min or more were necessary to obtain equilibrium conditions. RSD
values were in the range of 20-70%. Moreover, up to 20% carry over was observed.
Although the experience with SPJ\.1E-GC at this moment still is somewhat limited, it is
clear that it is an interesting technique for the screening of water samples.
Vapour overflow technique
The vapour overflow technique was initially described for PTV splitless injection
[104]. More recently, it was applied to conventional (hot) splitless injection of large
sample volumes [105,106]. In the vapour overflow method the entire sample is injected
rapidly at high temperatures into a large-bore liner packed with Tenax. The split vent is
closed during the solvent evaporation period, whereas the septum purge is opened wide.
Driven by its expansion and high vapour pressure, the solvent vapour flows backwards and
leaves the system through the septum purge. The Tenax bed is cooled by the rapid
evaporation of the solvent. Due to this cooling low to medium volatility solutes are
trapped in the Tenax-packed liner. More volatile solutes evaporate along with the solvent
and are lost. After solvent evaporation is completed, the septum purge is closed, the
packed bed regains its high temperature and the trapped analytes are released into the
column.
The vapour overflow technique is simple and rugged but for application to water
samples the system had to be modified [107]. In order to deal with the very large vapour
volumes generated by the injection of aqueous samples a rotary valve was incorporated in
the gas supply system. By switching this valve the carrier gas supply could be interrupted
during solvent evaporation. This prevented vapours from penetrating the gas regulation
system and kept the pressure increase of the injector to a minimum. Additionally, after a
short section of the column (coated precolumn), a T-piece was installed with a fused silica
tubing leaving the instrument (early vapour exit). With the modified system, triazines were
analysed in drinking water using direct injection of the sample [108]. The injector
temperature was 310°C. During injection the syringe needle, which had a side-port hole,
48 Gas chromatographic trace analysis of aqueous samples
was turned one or two times in order to obtain a homogeneous distribution of the sample
in the packed bed inside the liner. Up to 400 µl of water could be i~troduced this way.
During injection the flow of carrier gas was interrupted, the vapour e,Pt opened, and the
column temperature was maintained at 130°C to prevent condensation of water vapour in the GC column. After 30 s, when most of the water had left the system via the septum
purge, the carrier gas was introduced again by switching the rotary valve. The vapour exit
was kept open for another 1.5 min to eliminate residual water fro111 the packed bed.
During this step triazines which desorb from the Tenax packing are trapped in the GC
precolumn. Recoveries depended on the volume injected and ranged from 17 to 88% (RSD
6-13%) for the different triazines. Using NPD detection, detection limits of 0.5 µg/l were
achieved. Interestingly, the presence of salts neither affected the peak shapes nor the
recoveries. However, after numerous injections, the Tenax bed was foWJ-d to become more
solid. As with FCSE of water, the application range of the method is restricted to
compounds eluting above approx. 200°C.
Solid-phase extraction - thermal desorption
The concept of on-line SPE on a sorbent held in the liner of a PTjV. called SPE-GC
using thermal desorption (SPE!TD), was studied by Vreu/s et a/. [109,110] and in a
somewhat modified form, by Mo/ et al. [111]. The sample is directly percolated through
the packed liner of a PTV injector. After removal of the water and dry,ng the packing by
purging with a high flow of carrier gas the analytes are thermally desorbed by a rapid
increase of the injector temperature and, subsequently, analysed by ~. The carrier gas
supply is modified in order to be able to apply a counterflow from the GC column to the
injector. This modification prevents water from entering the GC column during sampling
and drying.
Tenax sorbents were found to have the best all-over characteristics, i.e. sufficient
retention power for analytes in the liquid phase during sorption, poor interaction with
water for optimal drying and good thermal stability during desorption. Other packing
materials that had suitable. characteristics were carbon phases. The problem encountered
with all carbon phases tested [11 O] was the rather narrow application range due to loss of
analytes on both the 'volatile' and 'non-volatile' end. The loss of volatile compounds was
the result of low retention during drying, while incomplete thermal desorption of non
volatile compounds caused low or no recovery for these particular analytes. Figure 13
shows the analysis of a I 0 µg/l standard solution of chlorinated benzenes and phenols.
If the injection speed with which the water sample is injected into the packed liner is
below the evaporation rate, sorption of the analytes onto the packing material occurs from
the gaseous state [111,112]. Compared to sorption of the analytes from ilie liquid state the

sampling step now is rather long, since the evaporation rate of water is low, viz. 12 µI/min
(at 30°C). The advantage of water injection in this so-called fully evaporative mode, is
that the technique can be applied to compounds with high water solubility. In addition, for
several packing materials, literature data concerning breakthrough volumes are available.
The technique was applied to the determination of pesticides and industrial pollutants in
surface water samples. From several packing materials tested, Tenax TA was found to be
the best choice. Recoveries of the most volatile analytes and chemically/thermally labile
compounds (dimethoate, methamidophos) were below 50%. For most of the other
compounds recoveries ranged from 70 to 110% (RSD 2 to 10%). As deposition of salts
and suspended matter in the insert may lead to discrimination of chemically labile solutes,
a frequent change of insert was suggested when injecting real samples [112].
(a)
(b)
3 l 2
10
l' .2' 3'
,.
Time (min)
5'
6' /
20
6
Figure 13. SPEffD-GC-FID chromatograms obtained for a JOO µI water spiked with (a) a chlorobenzene and (b) a chlorophenoi mixture at the JO µg/l level. Tenax-GR was used as sorbent in the packed liner. Peak assignment: (J) ChlorotoJuene; (2) m-dichJorobenzene; (3) o-dichJorobenzene; (4) 2,3,4-trichJorobenzene; (5) 2,3,4,5-tetrachlorobenzene; (6) hexachJorobenzene; (J ') 2,6-dichlorophenol; (2') 2,4,6-trichlorophenol; (3') 2,3,5-trichlorophenol; (4') 2,3,6-trichlorophenol; (5') 2,3,4-trichlorophenol. For details, see ref. (J JO] .
Open-tubular extraction - thermal desorption
The use of crosslinked silicone stationary phases held m glass, fused silica or, more
recently, metal capillaries is an attractive alternative to the use of classical solid
adsorbents. The advantages of these materials, as used in capillary GC, are thermal
stability, inertness, and well documented retention properties. Moreover, the materials have
a homogeneous structure and displacement effects, which are frequently encountered with

50 Gas chromatographic trace analysis of aqueous samples
porous sorbents, are less likely to occur since retention is based on dissolution rather than
adsorption. In addition, water removal after sampling is easy. The mll.in disadvantage in
comparison with porous adsorbents, however, is the much weaker retention power.
Large, non-polar analytes, such as polycyclic aromatic hydrocarbons, are easily trapped
on coated capillaries [113]. In fact, the GC column itself can be used for extracting these
compounds from the water sample. It is evident that for such experiments the column has
to be removed from the GC or at least disconnected from the detector. After installation of
the column, the trapped analytes were analysed, either directly [114] or after refocusing at
the column entrance [115]. The method was used to determine PAHs in up to 5 ml water
samples. More polar compounds, like benzaldehyde and n-ketones, and lindane were
extracted from up to 0.4 ml water samples into the stationary phase of a 50 m GC column.
Analytes were cryofocused prior to GC separation. For lindane detection limits were at the
ng/l level when using an ECD detector [116].
The use of the same GC column for both extraction and separation of the analytes is
rather inconvenient. The use of separate trapping and analytical columns in a two-oven
system is a distinct improvement. Such a system, which is shown ~ Figure 14, was
described by Blomberg and Roeraade [117]. Here a 95 µm thick film trap, located in the
first oven, was used to extract volatile (halo)carbons from up to 8 ml water samples. By
means of a rotary valve, also located in the first oven, the analytes co~d be desorbed in
the backflush mode. The material released from the first column was refocused in the inlet
of the analytical column located in the second oven.
H H
G
F F
Figure 14. Schematic diagram of the on-line OTE-Gc set-up: (A) thick-film trap, (B) rotary valve , (C) heated tubular aluminium interface, (D) cold trap, (E) GC colwnn, (F) activated charcoal traps, (G) molecular sieve, (H) pressure regulator, (I) outlet vent. Reprinted from (117).
As an illustration Figure 15 shows a chromatogram obtained after extraction of 8 ml of a
spiked water sample. A chromatogram of a blank of the procedure Without sampling is I

shown for comparison. A similar application, although not on-line, was described by
Burger et al. [118]. Volatile (halo)carbons were determined at the 0.1 µg/l level using FID
detection. At levels below I µg/l problems were encountered for xylenes, p-cymene and
less volatile solutes due to interference of artefact peaks produced by decomposition of the
polysiloxane trap lining.
B 1 I
Figure 15. (A) Chromatogram obtained after on-line OTE-GC-FID by percolation through a thick-film trap at 0.8 ml/min of 8 ml of a spiked water sample (2-10 µ1/1). Peak assignment: (1) chlorofomi, (2) 1,2-dichloroethane, (3) cyclohexane, (4) heptane, (5) 1.1IBK, (6) toluene, (7) ethylbenzene, (8) p-xylene, (9) oxylene, (JO) nonane, (11) isopropylbenzene, and (12) octanol. (B) background from thick film trap (thermal desorption I 10°C, 20 min). Reprinted from [117].
Although the application range of sorption-thermal desorption techniques is narrower than
that of to the phase-switching techniques, a large number of solutes can be determined.
SPME is a valuable technique for screening of aqueous samples. It is, however, less suited
for trace analysis of polar pesticides. The use of OTB/thermal desorption is limited to
either volatile- or higher boiling non-polar analytes, depending on the film thickness of the
OTE colwnn. The vapour overflow technique is only applicable to analytes of intermediate
volatility (i.e. triazines), more volatile compounds are lost during solvent elimination, less
volatile compounds can not be desorbed. The application range of SPE/thermal desorption
is larger than that of the vapour overflow technique. Both vapour overflow and
SPE/thermal desorption are less suited for chemically/thermally labile analytes. It has to be
emphasized here that for all four techniques there has been relatively little experience with
real-life samples. An overview of applications of the various methods for sorption-thermal
desorption to analytical problems related to water analysis is presented in Table VI.

52 Gas chromatographic trace analysis of aqueous samples
Table VI Summary of applications for water analysis using sorptio'n-thermal desorption techniques.
SPME Analyte Matrix Detector Limit of detection Ref.
Volatile organic comp. Drinking water FID 1 µg/l [88] BTEX Drinking water FID 0.3 µg/l [91] BTEX Parking lot run-off !TD 1-15 µg/l [93]
water, drinking water Caffeine Beverages MS Not reported [94] Volatile hydrocarbons House hold water, !TD 0.001 - 3 µg/l (95] volatile halocarbons landfill leachate
Volatile nitro-aromatics Lake water FID 9-15 µg/l (96] Volatile organic comp. Ground water FID low µg/l range (98) Chlorinated pesticides Hazardous waste ECD low ng/l range (98)
water ?-pesticides Water standard AED 0.5-4 µg/l (99] (Volatile) P AHs River water FID 0.03-2 µg/l (100] Organotin compounds Drinking water FPD low µg/l range (103]
Vapour Overflow Analyte Matrix Detector Limit of detection Ref.
Triazines Drinking water NPD 0.5 µg/l (108)
SPE-thennal desorption Analyte Matrix Detector Limit of detection Ref.
Chlorobenzenes, Water standard FID 1 µg/l (110) chlorophenols
BTEX, herbicides Water standard FID 0.1 µg/l [ll l] priority pollutants
Pesticides, Drinking water, ECD 0.01-0.5 µg/l [ 112) nitro-arornatics surface water NPD
OTE-thennal desorption Analyte Matrix Detector Limit of detection Ref.
PAHs Drinking water FID Not reported (114) High boiling organics FID 0.02 µg/l (116] (e.g. PAHs) BTEX, vol. organic comp. Drinking water FID 0.02 µg/l (117) BTEX, heptane, Drinking water FID 0.01 µg/l (118) p-cumene etc.

Concluding remarks
The determination of organic micropollutants in aqueous samples is a true challenge for
the analytical chemist. Extremely low concentrations of target compounds have to be
determined in a complex matrix. This requires the use of sensitive as well as selective
detection devices that -for routine use- are only available in combination with gas
chromatographic separation systems. On-line combination of sample preparation and
analysis is mandatory in order to be able to meet the requirements regarding ease of
automation, reliability and sensitivity.
The techniques applied for the analysis of aqueous samples can be classified as either
direct or indirect methods. The application of direct introduction of the aqueous sample
into the GC column is restricted to the determination of low molecular weight, volatile
components. In principle also high molecular weight components in water can · be
determined directly, by using loop-type injection, but no applications of this approach have
been reported sofar. For the vast majority of components indirect methods, in which the
water is eliminated prior to introduction of the analytes onto the GC column, have to be
used. Elimination of the water can take place either in the injector of the GC system or
before introduction of the sample into the GC injector.
Many indirect on-line methods for water analysis have been described in literature.
Liquid-liquid extraction was the first technique that was applied for on-line water analysis
in research laboratories. Following the trend in off-line sample preparation, systems for
coupled solid-phase extraction/liquid desorption-Ge were developed. To circumvent
problems associated with drying of packed cartridges, open-tubular extraction columns
were used as an alternative. Problems with the introduction of large volumes of organic
solvents gave rise to a renewed interest in sorption-thermal desorption based methods for
water elimination. Open-tubular extraction and solid-phase extraction with subsequent
thermal desorption, vapour overflow and, the more recently introduced technique SPME,
allow the determination of sub-ppb concentration of pollutants in water without an
intermediate liquid desorption step.
In the selection of an analytical method for water analysis both analyte characteristics
as well as type and concentration of interfering compounds in the water sample have to be
considered. Solute characteristics that are important in this respect are volatility (or
molecular weight), polarity and water solubility. At first glance, the diversity of methods
available might give the impression that the selection of the proper technique for a given
solute- and water type is a difficult task. A closer look reveals, however, that there is a
large degree of overlap between the various methods. Components of intermediate
volatility and polarity can be addressed by each of the methods described in this chapter.

54 Gas chromatographic trace analysis of aqueous samples
It is only in the case of a very low or very high volatility or polarity ¢.at a more careful
selection of the method is required. Also if compared on the basis of analyte detectability
and ease of automation, differences exist between the different methods. Each of the
various methods, however, is capable of meeting the detectability requirements specified
by regulatory institutions. In the hands of an experienced operator (but not necessarily a
true expert), fully automated and on-line analysis of a very wide range of contaminants in
water samples from different origins is nowadays possible. This has convincingly been
demonstrated by the many references cited in this chapter.
References [!] EEC Drinking Water guidelines, 801779/EEC No. L229/11-29, EEC, Brussels, August 30, 1980. [2] Th.H.M. Noy, PhD thesis, Eindhoven, The Netherlands, 1988. [3] J. Namie!mik, T. G6recki, M. Biziuk, L. Torres, Anal. Chim. Acta 237 (1990) I. [4] S.M. Abee!, AK. Vickers, D. Decker, J. Chromatogr. Sci. 32 (1994) 328. [5] K. Grob, E. Muller, J. Chromatogr. 404 (1987) 297. . [6] K. Grob, in W. Bertsch, W.G. Jennings and P. Sandra (eds.), "On-line coupled LC-GC", HUthig,
Heidelberg, 1991, p. 27-69 . [7] K. Grob, D. Frohlich, B. Schilling, H.-P. Neukom, P. Nllgeli, J. Chromatogr. 295 (1984) 55. [8] K. Grob, J.-M. Stoll, J. High Res. Chromatogr. & Chromatogr. Commun. 9 (1986) 518. [9] K. Grob, H.-G. Schrnarr, A. Mosandl, J. High Res. Chromatogr. 12 (1989) 375. [10] K. Grob, G. Karrer, M.-L . Riekkola, J. Chrornatogr. 334 (1985)129. [11] K. Grob, in W. Bertsch, W.G. Jennings and P. Sandra (eds.), "On-Column Injection in Capillary Gas
Chromatography", HUthig, Heidelberg, 1987. [12] F. Munari, A. Trisciani, G. Mapelli, S. Trestianu, K. Grob, J.M. Colin, J. High Res. Chromatogr. &
Chromatogr. Commun. 8 (1985) 601. [13] J.J. Vreuls, H.G.J. Mo!, J. Jagesar, R. Swen, R.E. Hessels, U.A.Th. Brinkman, in P. Sandra (ed.),
"Proc. 16th Internal. Symp. Capillary Chrornatogr.", Riva de! Garda, Huthig, Heidelberg, 1994, p. 1181.
(14] K. Grob, J. Chromatogr. 279 (1983) 225 . ( 15] K. Grob, J. Chrornatogr. 237 (1982) 15. (16] K. Grob, R. MUiler, J. Chromatogr. 244 (1 982) 185 . [17] J.J. Vreuls, S. Parnalko, M. de Jong, U.A.Th. Brinkman, poster presented at the 16th Internal. Symp.
Capillary Chroma to gr., Riva de! Garda, Italy . [18] A. Venema, J.T. Jelink, in P. Sandra (ed.), "Proc. 16th Internal. Symp. Capillary Chromatogr." , Riva
de! Garda, HUthig, Heidelberg, 1994, p. 1035. (19] F. Munari, P.A. Colombo, P. Magni, G. Zolioli, S. Trestianu, K. Grob, in P. Sandra (ed.), "Proc. 16th
Internal. Symp. Capillary Chromatogr.", Riva de) Garda, HUthig, Heidelberg, 1994, p. 1212. [20] K. Grob, J. High Res. Chromatogr. & Chromatogr. Commun. 10 (1987) 297. [21] K. Grob, Th. Lllubli, J. High Res. Chromatogr. & Chromatogr. Commun. 10 (1987) 435. [22] K. Grob, E. Muller, J. High Res. Chromatogr. & Chromatogr. Commun. 11 (1988) 388. [23] K. Grob, E. Muller, J. High Res. Chromatogr. & Chromatogr. Commun. 11 (l 98S) 560. (24] E.C. Goosens, D. de Jong, G.J. de Jong, F.D. Rinkerna, U.A Th. Brinkman, J. High Res. Chromatogr.
18 (1995) 38. [25] F.D. Rinkema, Th. Hanckemeier, A.J.H. Louter, U.A.Th. Brinkman, in P. Sandra (ed.), "Proc. 16th
Internal. Symp. Capillary Chrornatogr.", Riva de1 Garda, Huthig, Heidelberg, 1994, p. 1422. [26] F.D. Rinkema, A.J.H. Louter, U.A.Th. Brinkman, J. Chromatogr. 678 (1994) 289. [27] A.J.H. Louter, F.D. Rinkema, R.T. Ghijsen, U.A.Th. Brinkman, Intern. J. Environ. Anal . Chem. :S6
(1994) 49. [28] A.J.H. Louter, F.D. Rinkema, U.A.Th. Brinkman, in P. Sandra (ed.), "Proc. :16th Internal. Symp.
Capillary Chromatogr.", Riva de1 Garda, Hnthig, Heidelberg, 1994, p. 1423 .

[29] K. Abel, J. Chromatogr. 13 (1964) 14. [30] W. Vogt, K. Jacob, H.W. Obwexer, J. Chromatogr. 174 (1979) 437. [31] W. Vogt, K. Jacob, A.-B. Ohnesorge, H.W. Obwexer, J. Chromatogr. 186 (1979) 197. [32] W. Vogt, K. Jacob, in P. Sandra (ed.), "Sample Introduction in Capillary Gas Chromatography", Vol.
I, Huthig, Heidelberg, 1985, p. 99-121. [33) G. Schomburg, in RE. Kaiser (ed.), "Proc. 4th Internal. Symp. Capillary Chromatogr.", Hindelang,
Huthig, Heidelberg, 1981, p. 921A. [34) F. Poy, S. Visani, F. Terrosi, J. Chromatogr. 217 (1981) 81. [35] H.-M. MUiler, H.-J. Stan, J. High Res. Chromatogr. 13 (1990) 697. [36) J. Staniewski, J.A. Rijks, in P. Sandra (ed.), "Proc. 13th Internal. Symp. Capillary Chromatogr.", Riva
del Garda, Huthig, Heidelberg, 1991, p. 1334. [37) J. Staniewski, J.A. Rijks, J. Chromatogr. 623 (1992) 105. [38] J. Staniewski, J.A. Rijks, J. High Res. Chromatogr. 16 (1993) 182. [39] F.J. Seiiorans, J. Tabera, J. Villen, M. Herraiz, G. Reglero, J. Chromatogr. 648 (1993) 407. [40] J. Villen, F.J. Seflorans, M. Herraiz, G. Reglero, J. Tabera, J. Chromatogr. Sci. 30 (1992) 261. [41) I. Medina, F. Linares, J.L. Garrido, J. Chromatogr. 659 (1994) 472. [42) J. Staniewski, J.A. Rijks, J. High Res. Chromatogr. 16 (1993) 182. [ 43] J. Staniewski, H.-G. Janssen, C.A. Cramers, J.A. Rijks, J. Microcol: Sep. 4 (1992) 331. [43] J. Staniewski, H.-0. Janssen, J.A. Rijks, C.A. Cramers, J. Microcol. Sep. 5 (1993) 429. [45) J. Staniewski, H.-G. Janssen, C.A. Cramers, in P. Sandra (ed.), "Proc. 15th Internal. Symp. Capillary
Chrornatogr.", Riva de! Garda, HUthig, Heidelberg, 1993, p. 808. [46) J. Staniewski, in P. Sandra (ed.), "Proc. 16th Internal. Symp. Capillary Chrornatogr.", Riva del Garda,
Huthig, Heidelberg, 1994, p. I 071. [47) A. Trisciani, F. Munari, S. Trestianu, in P. Sandra (ed.), "Proc. 16th Internal. Symp. Capillary
Chromatogr.", Riva del Garda, Huthig, Heidelberg, 1994, p. 1220. [48] H.G.J. Mo!, H.-G. Janssen, C.A. Cramers, U.A.Th. Brinkman, J. High Res. Chrornatrogr. 18 (1995)
19. [49] H.G.J. Mo!, H.-G. Janssen, C.A. Cramers, U.A.Th. Brinkman, J. High Res. Chromatrogr. 18 (1995)
124. [50) H.G.J. Mol, H.-G. Janssen, C.A. Cramers, U.A.Th. Brinkman, in P. Sandra (ed.), "Proc. 16th Internal.
Symp. Capillary Chromatogr.", Riva de! Garda, Huthig, Heidelberg, 1994, p. 1124. [51) D.F. Gurka, S.M. Pyle, R. Titus, Anal. Chem. 64 (1992) 1749. [52) B.S. Middleditch, N.-J. Sung, A. Zlatkis, G. Settembre, Chrornatographia 23 (1987) 273. [53] K. Grob, J. Chrornatogr. 299 (1984) I. [54] D. Carmichael, W. Holmes, J. High Res. Chromatogr. 13 (1990) 267. [55) K. Grob, z. Li, J. Chromatogr. 473 (1989) 391. [56) E.C. Goosens, D. de Jong, G.J. de Jong, U.A.Th. Brinkman, J. Microcol. Sep. 6 (1994) 207. [57) K. Grob, Z. Li, J. Chrornatogr. 473 (1989) 423. [58] K. Grob, E. Muller, J. Chromatogr. 473 (1989) 411. [59] G. Schomburg, E. Bastian, H. Belau, H. Husmann. F. Weeke, M. Oreans, F. MUiler, J. High Res.
Chromatrogr. & Chromatogr. Commun. 7 (1984) 4. [60] E. Fogelqvist, M. Krysell, L.-G. Danielsson, Anal. Chem. 58 (1986) 1516. [61] C. de Ruiter, J.H. Wolf, U.A.Th. Brinkman, R.W. Frei, Anal. Chim. Acta 192 (1987) 267. [62] J. Roeraade, J. Chromatogr. 330 (1985) 263. [63] E.C. Goosens, R.G. Bunschooten, V. Engelen, D. de Jong, J.H.M. van den Berg, J. High Res.
Chromatogr. 13 (1990) 438. [64] E.C. Goosens, M.H. Broekman, M.H. Wolters, R.E. Strijker, D. de Jong, G.J. de Jong, U.A.Th.
Brinkman, J. High Res. Chromatogr. 15 (1992) 242. [65] E. Ballesteros, M. Gallego, M. Valcarcel, Anal. Chem. 62 (1990) 1587. [66] E. Ballesteros, M. Gallego, M. Valcarcel, J. Chromatogr. (1993) 169. [67) E. Ballesteros, M. Gallego, M. Valcarcel, Anal. Chem. 65 (1993) 1773. [68] A. Farjam, G.J. de Jong, R.W. Frei, U.A.Th. Brinkman, W. Haasnoot, A.R.M. Hamers, R. Schilt, F.A.
Huf, J. Chromatogr. 452 (1988) 419. [69] E. Noroozian, F.A. Maris, M.W.F. Nielen, R.W. Frei, G.J. de Jong, U.A.Th Brinkman, J. High Res.
56'\~~~~-Gas~_c_hr_o_m~a_to~gr'---'ap~h_i_c_tr_a_c_e_an~fil~y-s_is~o-f_aq~u-e_o_u_s_s_am---'p~l-e_s~~~~~~~~~~~
Chromatogr. & Chromatogr. Commun. 10 (1987) 17. [70] T.H.M. Noy, E. Weiss, T. Herps, H. van Cruchten, J. Rijks, J. High Res. Chromatogr. & Chromatogr.
Commun. 11 (1988) 181. [71] J.J. Vreuls, W.J.G.M. Cuppen, E. Dolecka, F.A. Maris, G.J. de Jong, U.A.Th Brinkman, J. High Res.
Chromatogr. 12 (1989) 807. [72] J.J. Vreuls, W.J.G.M. Cuppen, J. de Jong, U.A.Th Brinkman, J. High Res. Chromatogr. 13 (1990)
157. [73] J.J. Vreuls, R.T. Ghijsen, J. de Jong, U.A. Th Brinkman, J. Chromatogr. 625 (1992) 237. (74] E.R. Brouwer, H. Lingeman, U.A.Th. Brinkman, Chromatographia 29 (1990) 41,5. (75] P.J.M. Kwak.man, J.J. Vreuls, U.A.Th. Brinkman, R.T. Ghijsen, Chromatographia 34 (1992) 41. [76] Y. Pic6, J.J. Vreuls, R.T. Ghijsen, U.A.Th. Brinkman, Chromatographia 38 (1994) 461. [77] Y. Pic6, A.J.H. Louter, J.J. Vreuls, U.A.Th. Brinkman, Analyst 119 (1994) 2025. [78] A.J.H. Louter, J.J. Vreuls, U.A . .Th. Brinkman, in P. Sandra (ed.), "Proc. ; 16th Internal. Symp.
Capillary Chromatogr.", Riva de! Garda, Hothig, Heidelberg, 1994, p. 1421. [79] J.J. Vreuls, A.-J. Bulterman, R.T. Ghijsen, U.A.Th. Brinkman, Analyst 117 (1992) 1701. [80] A.-J. Bulterman, J.J. Vreuls, R.T. Ghijsen, U.A.Th.· Brinkman, J. High Res. Chromatogr. 16 (1993)
397. [81] A.J.H. Louter, U.A.Th. Brinkman, R.T. Ghijsen, J. Microcol. Sep. 5 (1993) 303. [82] Th. Hanckemeier, A.J.H. Louter, F.D. Rinkema, U.A.Th. Brinkman, Chromatographia 40 (1995) 119. [83] Th.H.M. Noy, M.M.E. van der Kooi, in P. Sandra (ed.), "Proc. 16th Internal. Symp. Capillary
Chromatogr.", Riva de! Garda, Htlthig, Heidelberg, 1994, p. 1045. (84] A. Zlatkis, R.P.J. Ranatunga, B.S. Middleditch, Chromatographia 30 (1990) 149. (85] H.G.J. Mo!, J. Staniewski, H.-G. Janssen, C.A. Cramers, R.T. Ghijsen, lJ.A.Th. Brinkman, J.
Chromatogr. 630 (1993) 201. ' [86] H.G.J. Mo!, H.-G. Janssen, C.A. Cramers, J. High Res. Chrornatogr. 16 (1993) 413. [87] H.G.J. Mo!, H.-G. Janssen; C.A. Cramers, U.A.Th. Brinkman, J. Microcol. Sep., in press. [88] C.L. Arthur, J. Pawliszyn, Anal. Chem. 62 (1990) 2145 . [89] K. Jinno, Y. Saito, Y. Kiso, K. Yarnakuchi, T. Yarnagami, S. Magdic, M. Ort9n, J. Pawliszyn, in P.
Sandra (ed.), "Proc. 16th Internal. Symp. Capillary Chromatogr.", Riva de! Garda, Htlthig, Heidelberg, 1994, p. 325.
[90] D. Louch, S. Motiagh,.J. Pawliszyn, Anal. Chem. 64 (1992) 1187. [91] C.L. Arthur, L.M. Killiam, K.D. Buchholz, J. Pawliszyn, Anal. Chem. 64 (1992) 1960. [92] S. Motlagh, J. Pawliszyn, Anal. Chem. Acta 284 (1993) 265. [93] D.W. Potter, J. Pawliszyn, J. Chromatogr. 625 (1992) 247. [94] S.B. Harthorne, DJ. Miller, J. Pawliszyn, C.L. Arthur, J. Chromatogr. 603 (1992) 185. (95] C.L. Arthur, K. Pratt, S. Motiagh, J. Pawliszyn, R.P. Belardi, J. High Res Chromatogr. 15 (1992) 741. (96] J.-Y. Homg, S.-D. Huang, J. Chromatogr. 678 (1994) 313. (97] K.D. Buchholz, J. Pawliszyn, Environ. Sci. Technol. 27 (1993) 2844. [98] R.E. Shirley, in P. Sandra (ed.), "Proc. 16th Internal. Symp. Capillary Chromatogr.", Riva de! Garda,
HUthig, Heidelberg, 1994, p. 693. [99] R. Eisert, K. Levsen, in P. Sandra (ed.), "Proc . 16th Internal. Symp. Capillary Chromatogr.", Riva de!
Garda, Htlthig, Heidelberg, 1994, p. 1387. [100] M.M.E. van der Kooi, Th.H.M. Noy, in P. Sandra (ed.), "Proc. 16th Intemat. Symp. Capillary
Chromatogr.", Riva de! Garda, Hothig, Heidelberg, 1994, p. 1087. [IOI] T. Nilsson, F. Pelusio, L. Montanarella, R. Tilio, B.R. Larsen, S. Facchetti, J.0 .Madsen, in P. Sandra
(ed.), "Proc. 16th jntemat. Symp. Capillary Chromatogr.", Riva de! Garda, Hothig, Heidelberg, 1994, p. 1148.
[102] Z. Penton, H. Kem, in P. Sandra (ed.), "Proc. 16th Internal. Symp. Capillary Chromatogr.", Riva de! Garda, HUthig, Heidelberg, 1994, p. 1099.
[ 103] M. Morcillo, Y. Cai, C. Porte, J.M. Boyona, in P. Sandra (ed.), "Proc. 16th Intthnat. Symp. Capillary Chromatogr." . Riva de! Garda, Htlthig, Heidelberg, 1994, p. 804.
[104] K. Grob, J. High Res. Chromatogr. 1.3 (1990) 540. [105] K. Grob, S. Brem, D. Frohlich, J. High Res. Chromatogr. 15 (1992) 659. [106] K. Grob, S. Brem, J. High Res. Chromatogr. 15 (1992) 715.

[107] K. Grob, D. Frohlich, J. High Res. Chromatogr. 16 (1993) 224. (108] K. Grob, D. Frohlich, J. High Res. Chromaiogr. 17 (1994) 792. [109] J.J. Vreuls, U.A.Th. Brinkman, G.J. de Jong, K. Grob, A. Artho, J. High Res. Chromatogr. 14 (1991)
455. [110] J.J .Vreuls, R.T. Ghijsen, G.J. de Jong, U.A.Th. Brinkman, J. Microcol. Sep. 5 (1993) 317. [111] H.G.J. Mo!, H.-G. Janssen, C.A. Cramers, U.A.Th. Brinkman, J. High Res. Chromatogr. 16 (1993)
459. [112] S. Mnller, J. Efer, W. Engewald, Chromatographia 38 (1994) 694. [113] G. Goretti, M.V. Russo, E. Veschetti, J. High Res. Chromatogr. 15 (1992) 51. [114] G. Goretti, M.V. Russo, E. Veschetti, Chromatographia 35 (1993) 653. [115] R.E. Kaiser, R. Rieder, J. Chromatogr. 477 (1989) 49. [116] A. Zlatkis, F.-S. Wang, H. Shanfield, Anal. Chem. 55 (1983) 1848. [117] S. Blomberg, J. Roeraade, J. High Res. Chromatogr. 13 (1990) 509. [118] B.V. Burger, M. le Roux, J. Chromatogr. 642 (1993) 117.

Large volume injection
in capillary GC using
Programmed Temperature Vaporizing
(PTV) Injectors

61
3.1 Principles of PTV large volume injection and implications of liner diameter2>
Summary In this chapter the principles of large volume injection in capillary GC using PTV injectors are discussed. Injectors with liner diameters ranging from 1 to 3.5 mm are evaluated and compared for solvent split injection of large volumes in capiUary gas chromatography. The liner dimensions determine whether a large sample volume can be introduced rapidly or has to be introduced in a speed-controlled manner. The effect of the injection technique used on the reco.very of n-alkanes is evaluated. Furthermore the influence of the liner diameter on the occurrence of degradation of thermolabile compounds during splitless transfer to the analytical column is studied. GU.idelines are given for the selection of the PTV liner diameter best suited for specific applications.
Introduction
In trace analysis the introduction of large sample volumes is a simple and efficient way to
increase analyte detectability. In capillary gas chromatography large volume injections can
be carried out either by applying on-column injection using retention gaps [1] or by using
temperature programmable (PTV) injectors. On-column injection is relatively simple and
accurate but less suited for dirty samples as involatile sample constituents easily
contaminate the column inlet which results in a poor long-term stability of the system
[2,3]. This is especially true when dealing with large sample volumes. In this respect PTV
based large volume injection techniques are clearly advantageous because here involatile
matrix compounds remain deposited in the liner and generally cause less problems.
Already 15 years ago Vogt and co-workers [ 4,5] constructed a temperature
programmable injector and applied it for the introduction of large sample volumes (up to
250 µl) in biomedical and environmental applications. Despite their good results there has
hardly been any interest in the PTV injector for large volume sampling in the first ten
years following the publication of Vogt. In this period the PTV injector did, however,
receive considerable attention as an alternative injector to conventional hot split/splitless
injectors. The groups of Schomburg [6] and Poy et al. [7] demonstrated that temperature
programmed sample introduction offers a number of advantages in comparison with hot
2) H.G.J. Mo!, H.-G. Janssen, C.A. Cramers, U.A.Th. Brinkman, J. High Res. Chromatogr. 18 (1995)
19-27.

injection techniques. The most important one is that discrimination of high boiling analytes
is virtually absent when the sample is injected into a cold chamber. Furthermore, the
quantitative performance of PTV injection is much better compared to the hot injection
techniques. Following these early PTV developments, there has been a renewed interest in
the use of the PTV injector for large volume sample introduction in the last five years.
At present four techniques for large volume injection using PTV injectors can be
distinguished. The first technique is the solvent split injection which was presented when
the PTV injector was introduced [4,5]. Here the sample is injected with the split exit open
and at an injector temperature below the solvent boiling point. After elimination of the
solvent the analytes retained in the liner are transferred to the analytical column in the
splitless mode. The liner has to be packed, e.g. with glass wool, to prevent the liquid
sample from being pushed to the base of the injector which results in losses via the split
exit or in flooding of the column inlet. The maximum volume of liquid that can be held
within the injector depends mainly on the dimensions of the liner and the amount of
packing material. Sample volumes exceeding the maximum volume have to be introduced
in several steps or, more elegantly, in a speed-controlled manner. The j time between two
injections and the introduction speed, respectively, have to be adjusted to the solvent
evaporation rate. Variables affecting the sampling process have been extensively discussed
[8-10] . In liners packed with glass wool quantitative recoveries are found for compounds
with a boiling point above that of C13 [9]. For more volatile analytes ;liners packed with
selective adsorption materials are required or set-ups involving multidimensional GC
systems have to be used [I I, 12].
The second method for introducing large sample volumes using PTY injection devices
is the so-called large volume splitless injection [13]. The sample i:s introduced at a
temperature below or close to the pressure corrected boiling point of the solvent. During
sample introduction the split valve is closed and the solvent is vented. via the analytical
column. Volatile compounds co-evaporating with the solvent are not lost as is the case
with the solvent split method described above, but are trapped in the swollen stationary
phase of the analytical column. The flow rate through the liner is equal to the column flow
rate which makes the time needed for solvent elimination much longer than in solvent split
injection.
A third alternative for PTV large volume sampling was initially described as PTV
vapour overflow [14]. Later the technique was carried out in conventional hot
split/splitless injectors and somewhat confusingly called large volumei splitless injection
[IS,16]. In the vapour overllow technique the sample is rapidly injected into the lower part
of a packed liner at a temperature far above the boiling point of the solvent. The split exit
is closed but the septum purge outlet is wide open. A violent evapora9on causes most of

~~~~~~~~~~~~-Im_,_p_li_catt~·o_n_s_o_f_li_n_er_d_i_am~et_e_r~~~~~~~~~~~~-1~
the expanding solvent vapour (and unfortunately also most of the volatile solutes) to
escape through the septum purge outlet. Solutes of low volatility are retained at the cold
spot in the liner created by evaporation of the solvent. After solvent evaporation the
temperature of the evaporation zone rapidly returns to the injector temperature and transfer
of the analytes into the column is initiated. When the liner Is packed with glass wool
losses occur for n-alkanes up to C25 [16]. With a Tenax packed liner quantitative
recoveries were obtained for C20 and higher boiling compounds. The technique was also
applied for direct injection of aqueous samples [17]. Here the application of the method is
again restricted to higher boiling sample constituents.
The fourth technique for large volume injection using PTV injectors is solid-phase
extraction/thermal desorption (SPEffD). In contrast to the other techniques this method
can only be applied for aqueous samples. The liner is packed with an adsorption material
and the sample is pushed through the liner, in the liquid state, by a high flow of carrier
gas. The analytes are sorbed onto the adsorption material. After drying the liner, the
analytes are thermally desorbed and transferred to the analytical column. During injection
the split valve is open and the injector temperature is ambient or slightly higher. To
prevent water from entering the GC column a counter current flow from the column
towards the injector is applied. The method was applied for analysis of chlorobenzenes
and chlorophenols in 100 µl water samples [18]. Another application described the
determination of various organic compounds in water volumes up to 1 ml [19].
For the introduction of large volumes of organic solvents the SPEffD technique is not
suited. From the other three techniques large volume splitless injection is less suited
because solvent elimination is time consuming and the vapour overflow technique is only
applicable to a narrow range of relatively high boiling compounds. In other words, the
solvent split technique offers the best possibilities for large volume sample introduction
using PTV injectors.
At the time of writing PTV injectors were almost exclusively equipped with narrow
inserts (typically 1 mm internal diameter), to allow rapid vaporization of the analytes. As
these liners can only hold ca. 20 µl of liquid [13], one is often compelled to apply speed
controlled sample introduction. Here the introduction speed is a critical parameter which is
affected by many experimental variables and requires careful optimization. In this chapter
the use of PTV injectors equipped with liners with larger internal diameters, allowing
rapid introduction of larger sample volumes, are evaluated. The effect of liner i.d. on the
amount of solvent that can be held within the injector, the splitless transfer of analytes to
the analytical column and on the occurrence of thermal degradation were studied. In
addition the effect of solvent properties and PTV temperature on the recoveries of n
alkanes in large volume sampling were evaluated.

Experimental
Instrumentation
Three gas chromatographic systems equipped with three different PTV injectors were
used. The first system consisted of a gas chromatograph (model 5890, Hewlett Packard,
Avondale, PA, USA) equipped with a flame ionization detector and PTV No. 1 (PTV-1)
(Optic, Ai Cambridge, Cambridge, UK). The liner dimensions were 80 mm x 3.4 mm i.d.
and 5.1 mm o.d. Two liners with the same external dimensions but smaller internal
diameters, 1.2 and 2.2 mm, were made in house. On-column injection was possible by I
using a special on-column insert. The second GC system consisted of a gas chromatograph
(Autosystem, Perkin Elmer, Norwalk, CT, USA) provided with a flame ionization detector,
a mass spectrometric detector (Q-mass 910) and PTV No. 2 (PTV-2) (PSS =
programmable split/splitless injector, Perkin Elmer). The liner dimensions were 88 mm x I
2.3 mm i.d. x 4.0 mm i.d. The third gas chromatograph (model 5890, Hewlett Packard)
was equipped with a flame ionization detector and PTV No. 3 (PTV-3) (KAS, Gerstel,
Millheim aid Ruhr, Germany). The carrier gas inlet system was modified as described
earlier [9]. The liner dimensions were 92 mm x 1.2 mm i.d. x 2.0 mm o!d.
All liners were packed with silanized glass wool (Perkin Elmer). PTV-1 and PTV-3
could be cooled to subambient temperatures with carbon dioxide. All solvents were freshly
distilled before use. Fatty acids were silylated as follows: in a 2 ml vial 1400 µI of BSTFA
(bistrimethylsilyltrifluoracetamide) were added to a mixture of decanoic acid, tetradecanoic
acid, octadecanoic acid and docosanoic acid (10 mg each). The vial was closed and
maintained at 65°C for 30 min. Next, the contents were diluted with 10 ml of hexane.
Manual injections were carried out rapidly, i.e. within 1-2 sec, (called '•at-once injection')
using 10, 50, 100 or 250 µI syringes (Hamilton) with 50 mm needles. Speed-controlled
sample introduction was carried out with a 1 ml speed-programmable syringe (SPS,
Gerstel). For GC separation a 20 m x 0.32 mm i.d. column coated with 0.5 µm Ultra-I
was used applying helium as carrier gas. Data collection was done with an Omega
integration system (Perkin Elmer).
Temperature profiles
Temperature profiles inside the liners were measured with a thermocouple consisting
of two 0.2 mm o.d. Ni-Cr/Ni wires which were inserted into the liner from the base of the
injector, i.e. in the same manner as the column. To prevent electrical CQntact between the I
wires, one of them was inserted into a piece of 0.32 mm i.d. fused silica capillary. All
temperature measurements were carried out with a helium flow through the injector.
PTV-1 could be equipped with the standard 3.4 i.d. liner and with smalltrr i.d. but identical
o.d. liners. Because of the thicker glass wall of the latter liners the !time required for

~~~~~~~~~~~~-Im~p_li_ca_n_·o_n_s_o_f_li_n_er_d_i_am~ete~r~~~~~~~~~~~~-'~
reaching the final temperature (inside the liner) was slightly longer: heating from SO to
300°C at 8°/s took 4 seconds longer for the 1.2 mm i.d. insert than for the standard 3.4
mm i.d. insert. For P1V-2 the heating rate is limited. In case of heating ballistically from
SO to 300°C the temperature increase inside the liner was measured to be approximately
3°C/s. Hence, splitless times can be relatively long with this injector. PTV injectors
typically show a temperature gradient along the length axis of the liner. The temperatures
in the upper and bottom part of the liner are lower than in the middle section due to heat
losses to the surrounding atmosphere and the oven, respectively. Needle tip, column
entrance and packing material were all positioned in the properly heated zone inside the
liner of each PTV injector.
Results and discussion
One of the main differences in the design of classical split/splitless injectors and PTV
injectors is the vaporization chamber. To allow rapid heating, liners of most P1V injectors
are designed to have a low thermal mass. For that reason the internal diameter of PTV
liners is generally smaller than that of conventional split/splitless injectors. Very rapid
heating, i.e. faster than ca. I 0°C/s, can be useful in cold split injection. Further the use of
low-volume inserts can be beneficial when performing splitless injection using narrow-bore
columns (:::: I 00 µm i.d.). In most other applications, however, broad input bands caused
by slow transfer of compounds from the liner to the column will be refocused by either
cold trapping or solvent trapping. A disadvantage of the low internal volume of liners in
the current PTV injectors is that only some 20 µl of liquid can be injected at once. For
larger volumes losses of liquid sample via the split exit will occur and, therefore, speed
controlled sample introduction has to be applied. Although the optimization of speed
controlled sample introduction has been thoroughly discussed [8-1 O], direct rapid injection
of the sample would greatly simplify the use of PTV injectors in large volume sampling.
For classical split/splitless injectors, equipped with ca. 4 mm i.d. inserts, rapid injection of
large volumes Is possible [l S,20]. Recently two new PTV injectors equipped with liners
with larger internal diameters became commercially available. In this chapter the
performance of these injectors for large volume sampling is evaluated and the results
compared with those obtained using a PTV injector equipped with a narrow liner. The
sampling procedure for large volume injection with PTV injectors in the solvent split
mode described in this chapter consists of three steps: rapid injection of the sample,
evaporation of the solvent, and splitless transfer of the analytes to the column. To prevent
flooding of the liner the maximum sample volume has to be determined first. Then the
splitless transfer step is optimized for small sample volumes. Finally, solvent elimination
times and recoveries of analytes for large volume injections are determined.

Maximum sample volume
The maximum volume of liquid that can be injected at once into the cold PTV injector
is determined by the volume of liquid that can be retained in the injector. This depends on
the dimensions of the liner and the properties of the packing material . For a first
estimation the maximum injection volume was determined visually. The liner was packed
with glass wool and placed in the injector which was maintained at 30°,C. No column was
installed and a helium flow of 250 ml/min, leaving the injector at the base, was applied.
When injecting too large amounts of solvent, liquid was seen to occur. at the bottom end
of the injector. The maximum volumes so determined were later confirmed by analysing
increasing sample volumes and checking linearity of peak area plotted vs. injection
volume. For hexane as the solvent the maximum injection volumes were as follows:
PTV-1 (length of glass wool plug 3 cm), 20 µl for the 1.2 mm i.d. lin.er packed with 4.5
mg of glass wool, 65 µl for the 2.2 mm i.d. liner with 14.5 mg of glass wool, and 165 µl
for the 3.4 mm i.d. liner with 32.5 mg of glass wool. PTV-2 (length of glass wool plug 4
cm), 150 µl for the 2.3 mm i.d. liner packed with 34 mg of glass wool. PTV-3 (length of
glass wool plug 5 cm), 25 µl for the 1.2 mm i.d. liner packed with 6 mg of glass wool.
The values presented above should only be considered as a rough indication of the
maximum sample volume. The liners could not be packed in a very reproducible way; for
the larger i.d. liners deviations up to 25 µl were found for the maximum injection volume
after repacking with the same amount of glass wool.
A remark should be made here regarding the syringes. For the I 00 and 250 µl syringes
used it was observed that liquid leaving the syringe needle was nebulized when the
plunger was pressed down rapidly. This is probably beneficial because in this way there is
no risk that a stream of liquid "pierces" directly through the glass wool packing and is
then lost via the split exit at the bottom of the injector.
PTV splitless injection
In this chapter liners with varying internal diameters are studied for large volume
sampling. As the liner i.d. also strongly affects the splitless transfer step, a brief discussion
on some aspects important in splitless injection is appropriate here.
Injector overflow. In classical hot splitless injection injector overflow occurs when the
volume of solvent vapour is too large to be accommodated in the line~ [21]. This causes
sample constituents to leave the injector via the septum purge or to penetrate into the
carrier gas supply line. For this reason the injection volume in hot splitless injection is
restricted to some 2 µI. in cold splitless injection the sample volume is restricted by the
amount of liquid that can be retained in the liner. Here injector overflo~ can occur if the

~~~~~~~~~~~~~I_m~p_h_·c_an_·o_n_s_o_f_li_·n_e_r_d_i_am~ete~r~~~~~~~~~~~~~J~
solvent evaporates too fast. In contrast to hot splitless injection, overflow in cold splitless
injection is generally less of a problem because the analytes are vaporized after the
solvent, i.e. when the solvent vapour is escaping via the septum purge the analytes are still
deposited on the glass wool. To confirm this, splitless injections of 5-30 µl of alkane
standards (C8-C20) in five solvents were carried out using 2.3 or 3.4 mm i.d. liners and
heating rates of 3-4°C/s. Quantitative recoveries for all n-alkanes were obtained indicating
that vapour overflow is not a major source of concern here.
QI
"' c 0 c. "' ~ 0 u:
-
-
0
-
~
\ c~
4
\ \\
"\ \
" "
""' ~
B
Time (min)
' '
"""""' "-... -----3.4 mm i.d.
u 2.2 mm i.d.
c20 Cao
1 .2 mm i.d .
12 16
Figure 1. GC-FID chromatograms obtained after 2 µl splitless injections of an n-alkane standard in hexane using three liners with varying internal diameters (PTV I). The split valve was closed during the entire run. PTV: 30°C ~ 8°/s ~ 320°C. GC: 40°C (1.5 min) ~ 20°/min ~ 320°C (1.5 min), inlet pressure 55 kPa.
Sample transfer. For rapid and efficient transfer of the sample from the liner into the
column dilution of sample vapours by diffusion in and mixing with the carrier gas should
be kept to a minimum [22]. Minimum dilution is achieved by using narrow liners. This is
visualized in Figure 1 where 2 µl of an alkane mixture in hexane were injected with the
split valve closed during the entire run. Due to the higher carrier gas velocity in smaller
i.d. liners the transfer of the compounds to the column is faster. Further the transfer occurs

at a lower temperature. From Figure 2 it can be seen that 75% of triacontane is
transferred to the column at a temperature of 210°C for the 1.2 mm i.d. liner whereas
290°C is required for the 3.4 mm i.d. liner. Besides the use .of narrow liners the carrier gas
velocity can also be increased by applying higher inlet pressures durin~ splitless transfer.
Here the use of a pressure programmable gas chromatograph is advantageous. A high inlet
pressure for efficient transfer is applied during the splitless period, after which the inlet
pressure is decreased to the optimum value for separation of the analytes.
100 300 ..... 0 ~
~ 250 t... 0 .. .,
(.) 75 ID c
CD ;wo w = c 0 ! c. 50 150 ::::J w iii CD a:
100 Gi Cl.
25 E ID
pO I-
0 0 10 20 30 40 50 60
Splitless time (sec)
Figure 2. Effect of liner i.d. on transfer time and transfer temperature of C,0 from the liner to the colwnn. Conditions: see Figure I. Dashed line: actual temperature inside the liner.
Rapid splitless transfer can be important because of thermal degradation of sample
components. Labile analytes can decompose in packed inserts. Often catalytic activity of
the glass wool packing plays an important role in the degradation process [6,18]. To
illustrate the effect of liner i.d. on degradation, the response of silylated fatty acids
obtained using cold splitless injection was compared with that observed in on-column
injection. As is shown in Table I, the least volatile silyl ester completely decomposed in
all three liners. The recoveries of the other silyl esters improved as the liner i.d. decreased.
This is due to the lower number of silanol groups and the shorter residence time in the
smaller i.d. liner. Moreover, the esters leave narrow liners at a lower ~emperature. (Note:
Degradation of trimethylsilyl esters is a very stringent test for hydrolytic activity due to !
presence of silanol groups [23]).

~~~~~~~~~~~~~Im~p_li_c_an_·o_n_s_o_f_li_·n_e_r_d_iam~_eter~~~~~~~~~~~~~--'~
Table I. Recovery of silylated fatty acids after cold splitless injection lll several glass wool packed liners
RECOVERY(%)"
Liner internal diameter mo•> E14 EIS E22
3.4 mm (34 mg glass wool) 70 29 0 0
2.2 mm (14 mg glass wool) 89 59 0 0
1.2 mm (7 mg glass wool) 95 89 26 0
•>recovery of a 1 µl cold splitless injection relative to on-column injection. PTV-1, 50°C ~ 8°/s ~ 320°C, splitless time 1.5 min. •> EI 0 = trirnethylsilyl ester of decanoic acid.
Excessive solvent recondensation. With cold splitless injection it is in principle possible to
introduce much larger volumes than with hot splitless injection. However, if the initial
column temperature is below the pressure corrected solvent boiling point, excessive
recondensation of solvent vapour in the column inlet may lead to peak distortion. Peak .
distortion could be observed for splitless injection of volumes larger than 4 µl and was
most pronounced for compounds of intermediate volatility (see Figure 3a). Part of these
compounds enters the column together with the solvent. This part is spread by
recondensed vapour and appears in the chromatogram as a broad shoulder eluting before
the sharp peak. The sharp part of the peak originates from the solute fraction that entered
the column after the solvent. In contrast, the more volatile n-alkanes enter the column
together with the solvent, and sharp peaks appear in the chromatogram because the solute
bands are reconcentrated by the solvent effect. High boiling compounds are not broadened
because they leave the injector well after the solvent and do not enter the flooded column
inlet.
Peak distortion due to excessive solvent recondensation can be prevented in several
ways. The use of lower heating rates will improve peak shapes because a lower proportion
of the (intermediate volatile) analytes will enter the column together with the solvent. An
alternative is to vent the solvent via the column before heating the injector. With this
approach we found that band broadening could be prevented for splitless injections up to
100 µI. Although quantitative recovery of all analytes was achieved (98-105%, C8-C20),
venting via the column was not very time efficient. Furthermore, compatibility with the
detector may be a problem. Another way of preventing excessive solvent recondensation
was to adjust the column temperature to a few degrees below the solvent boiling point as
was also done by Grob [13]. In this case only a small volume of solvent recondenses, too
little for flooding the column but still enough for reconcentrating volatile analytes by
solvent trapping. The most convenient way to prevent excessive recondensation, however,
was the use of higher column flow rates as is illustrated in Figure 3b. Prior to splitless

injection the inlet pressure was increased to 200 kPa, corresponding to a column flow of
ca. 11 ml/min, and after 1 min the pressure was decreased again tp 50 kPa for GC
separation of the analytes. Sharp peaks are obtained because the hi~ carrier gas flow
during splitless transfer accelerates evaporation of the recondensed vaPiour in the column
inlet which reduces the length of the flooded zone. Despite these pro:roising results, for
practical reasons constant inlet pressures were used in further experiments.
ID VI c 0 a. VI ID ..... 0 u..
ID VI c 0 a. VI ID ..... 0 u..
0
A
8
-
2
c,,
c,,
I
4 6 8 10 12
Time' (min)
Figure 3. GC-FID chromatograms obtained after splitless injection of 15 µl of an n-alkane standard (C8-C
2o)
in hexane. A) inlet pressure constant at 50 kPa. B) elevated inlet pressure during sJ litless transfer: initial inlet pressure 200 kPa, after 1.0 min decreased to 50 kPa. PTV- 1 with 3.4 mm i.d. liner: 50°C ...+ 4°/s ...+ 300°C, splitless time 1.0 min. GC: 40°C (I min) -+ 20°/min -+ 2so•c.

~~~~~~~~~~~~-Im~p_lic_a_u_·o_n_s_o_f_lin_e_r_d_i_am~ere_r~~~~~~~~~~~~--'~
Solvent split injection
Cooling effects. The time needed for elimination of the solvent pnor to splitless
transfer of the analytes to the column is determined by the evaporation rate of the solvent.
The evaporation rate of the injected liquid is proportional to the mole fraction (xi) of
solvent vapour in the purge gas and to the total gas flow leaving the injector. Assuming
this gas is saturated with solvent vapour and the solvent vapour behaves as an ideal gas,
the evaporation rate can be described by:
(l)
where Fi is the evaporation rate in mol/min, F,plit the split flow in mol/min, Pi the vapour
pressure of the solvent at the initial liner temperature and Pin the inlet pressure.
Unfortunately, this equation is not very useful to calculate the real solvent elimination
rates because evaporation can cause considerable cooling of the liner. Cooling occurs
because the heat capacity of the glass wool packed liner is low and heat transfer from the
liner wall to the evaporation site is slow.
By measuring the temperature in the liner with the thermocouple (positioned just
below the syringe needle) the influence of several experimental parameters on the cooling
effect could be studied. The strongest cooling effect was measured just below (ca. 5 mm)
the tip of the syringe needle. When the solvent had been evaporated completely the
temperature returned to the initial PTV temperature. Further down in the packing the
temperature decrease was less but it took more time to return to the initial value which
indicates that vaporization talces place from the rear of the sample plug. The degree of
cooling depends on the evaporation rate which is strongly affected by the vapour pressure.
This parameter in turn is determined by the PTV temperature and the solvent injected.
Cooling effects at different initial PTV temperatures and for different solvents are shown
in Figure 4. The temperature in the liner decreases until evaporation is so slow that
cooling is compensated by heat transfer from the insert wall. The cooling effect is more
pronounced at higher initial liner temperatures and for volatile solvents. Due to cooling
calculated evaporation rates and experimental values were found to differ up to a factor of
three.
The effect of the split flow on the cooling effect and on the evaporation time is shown
in Figure 5. The higher the split flow the faster is the evaporation and the stronger is the
cooling. For hexane at an initial injector temperature of 45°C the temperature drops 22 and
40°C for split flows of 50 and 1000 ml/min, respectively.

r injection
50 a
'""" u 0
'""" '-" ii) 30 -·-·-···-··········-·-- -·--- b u 2 .. ···"" 0
'-" ii)
~ i ,_ ii) ~ c.. E
,_ ii) ~ ~ E
~ ii)
~
0 c
0 2 Time (min)
30
15
0
-15
/<·:.-:.·;.>--· /-----/ i I
: . I i \~.~/ I i
I . j ' ,,·).·l· I I I ~-, ·- ' : \ \, ! I '.J ' EtOAc MeOH ~ I
I\: iC6 Ii.I
0
\l : Ir\ j 11\ ;
{\f j 'oDCM cs
20 40 60 Time (s)
Figure 4. Temperature inside the liner after injection of 100 µI of organic solvent. Left: effect of initial PTV temperature: a) 50°C, b) 30°C and c) 0°C, solvent is hexane. Right: effect of solvent at initial PTV temperature of 30°C: c, = pentane, DCM = dichloromethane, C6 = hexane, EtOAc· = ethyl acetate and MeOH = methanol. PTV-1 with 3.4 mm i.d. liner packed with glass wool. Helium split flow 250 ml/min, ambient pressure.
45
30 G e_,
" ... ::I • ... " "" a 15 " 1-o
440 ml/min 640 ml/min
1000 ml/min
0 0 20 40 60 Time (s)
Figure S. Temperature inside the liner after injection of 100 µI of hexane at varying sP,lit flows. PTV-2 with 2.3 mm i.d. liner. Initial PTV temperature 50°C, ambient pressure.
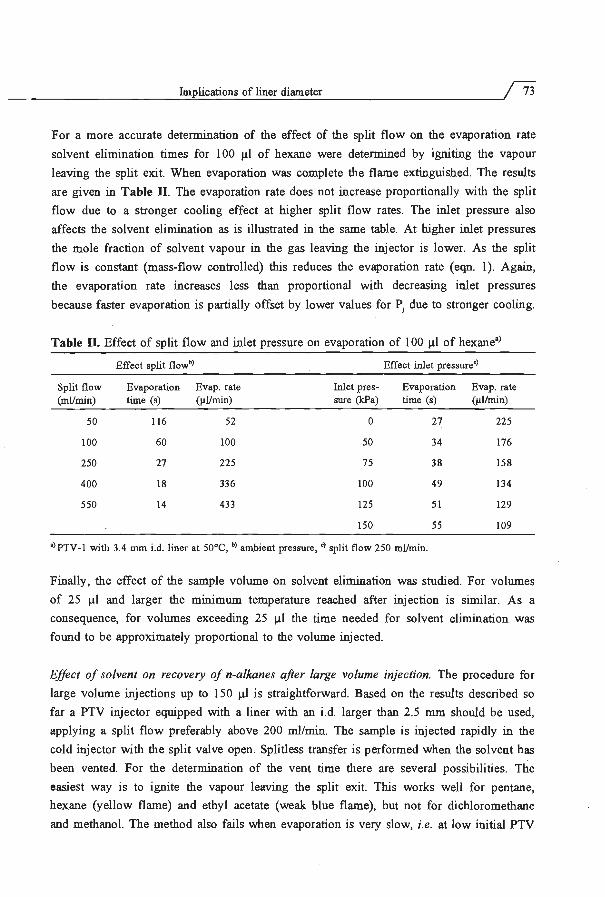
~~~~~~~~~~~~-Im~p_lic_a_u_·o_n_s_o_f_lin_e_r_d_i_am~eter~~~~~~~~~~~~~-'~
For a more accurate determination of the effect of the split flow on the evaporation rate
solvent elimination times for I 00 µl of hexane were determined by igniting the vapour
leaving the split exit. When evaporation was complete the flame extinguished. The results
are given in Table II. The evaporation rate does not increase proportionally with the split
flow due to a stronger cooling effect at higher split flow rates. The inlet pressure also
affects the solvent elimination as is illustrated in the same table. At higher inlet pressures
the mole fraction of solvent vapour in the gas leaving the injector is lower. As the split
flow is constant (mass-flow controlled) this reduces the evaporation rate ( eqn. I). Again,
the evaporation rate increases less than proportional with decreasing inlet pressures
because faster evaporation is partially offset by lower values for Pi due to stronger cooling.
Table II. Effect of split flow and inlet pressure on evaporation of I 00 µI of hexane•>
Effect split flow"l Effect inlet pressure')
Split flow Evaporation Evap. rate Inlet pres- Evaporation Evap. rate (ml/min) time (s) (µUmin) sure (kPa) time (s) (µ!/min)
50 116 52 0 27 225
100 60 100 50 34 176
250 27 225 75 38 158
400 18 336 100 49 134
550 14 433 125 51 129
150 55 109
•lPTV-1 with 3.4 mm i.d. liner at 50°C, •>ambient pressure, 0> split flow 250 ml/min.
Finally, the effect of the sample volume on solvent elimination was studied. For volumes
of 25 µI and larger the minimum temperature reached after injection is similar. As a
consequence, for volumes exceeding 25 µI the time needed for solvent elimination was
found to be approximately proportional to the volume injected.
Effect of solvent on recovery of n-alkanes after large volume injection. The procedure for
large volume injections up to 150 µl is straightforward. Based on the results described so
far a PTV injector equipped with a.liner with an i.d. larger than 2.5 mm should be used,
applying a split flow preferably above 200 ml/min. The sample is injected rapidly in the
cold injector with the split valve open. Splitless transfer is performed when the solvent has
been vented. For the determination of the vent time there are several possibilities. The
easiest way is to ignite the vapour leaving the split exit. This works well for pentane,
hexane (yellow flame) and ethyl acetate (weak blue flame), but not for dichloromethane
and methanol. The method also fails when evaporation is very slow, i.e. at low initial PTV

temperatures. A more sophisticated approach is to use a thermal conductivity detector as
monitor [9], an approach which is applicable to all solvents. An alternative is to use the
FID itself as monitor. In this case the column temperature is maintain'ed above the PTV
temperature. Solvent entering the column during solvent elimination Will reach the FID
after the column dead time. When solvent evaporation is complete the FID signal returns
to the baseline. The width of the solvent peak so obtained approximately equals the time
needed for evaporation of the solvent. The procedure is demonstrated in Figure 6 which
shows the injection of 100 µl of an alkane standard in methanol. The first solvent peak in
Figure 6 is in fact the monitor signal of the solvent elimination step; i.e. evaporation took
approximately 1 min.
CD Ill c 0 c. Ill CD .... 0 u::
-0
~
tevap ~
'-- ......
2 4
c20
c1e
c12 l • ll ........ '--~
6 8 10 min split _________ --------------------------------valve -+----+-
Figure 6. GC-FID chromatogram obtained after a 100 µl injection of a n-alkane standard (C8-C20, 0.2 µg/ml) in methanol. PTV-2 with 2.3 mm i.d. liner, initial temperature 50°C. Solvent vent time: 2.0 min, split flow 225 ml/min. Splitless transfer: PTV 50°C ballistically to 300°C, split!ess time 1.5 min. GC: 80°C (1 min) ~ 20°/min ~ 260°C, inlet pressure 80 kPa. Split valve: dashed line = open, solid line = closed.
For intermediate and high boiling solutes, which are retained in the liner by cold trapping,
the moment of closing the split valve is not very critical provided it is not closed too
early. Closing the split valve long after evaporation of the solvent will hardly cause losses
as the vapour pressure of the compounds is very low. This is illustrated in Figure 6: 2 min
after injection (1 min after completion of solvent elimination) the analytes plus traces of
residual methanol were splitlessly transferred to the column. Quantitative recovery was
obtained for C17 and higher boiling n-alkanes (see Table IV belo~). From similar
. experiments carried out at lower PTV temperatures it was found that 1 in order to retain
n-alkanes in the liner by cold trapping, the PTV temperature should be ~bout 250°C below

~~~~~~~~~~~~~Im-""p_li_c_an_·o_n_s_o_f_I_in_e_r_d_iam~e-t_er~~~~~~~~~~~~~--'~
the boiling point of the solute. This means that at 50°C quantitative recovenes are
obtained from C17, at 30°C from C16 and at 0°C from C14. It is evident that the use of
lower initial temperatures makes solvent elimination more time consuming.
When cold trapping is not sufficient for retaining the analytes during solvent
elimination (i.e. for volatile solutes), salvation of the analytes in the sample liquid in the
liner can considerably improve their recoveries. In practice this means that the split valve
should be closed slightly before the solvent has been completely eliminated because, with
the last traces of solvent, the solvent trapping effect will disappear as well. Hence, the
moment of closing the split valve is more critical. Closing the split valve too late will
result in severe losses of volatiles while too early closure can lead to peak distortion due
to excessive recondensation of solvent vapour in the column.
CD Ill c: 0 a. Ill CD .....
0 u..
0
CB
2 4 6
c20 c3o
I ... .J-'.
8 10 Time (min) 16
Figure 7. GC-FID chromatogram obtained after a 100 µI injection of a n-alkane standard (C8-C30, 0.2 µg/ml) in hexane. PTV-1 with 3.4 mm i.d. liner, initial temperature 0°C. Solvent vent time: 2.5 min at ambient pressure, split flow 250 ml/min. Splitless transfer: PTV 0°C ~ 4°/s ~ 325°C, splitless time 1.5 min. GC: 40°C (1 min) ~ 20°/min ~ 320°C, inlet pressure 100 kPa.
The effect of the vent time on the recovery of volatile n-alkanes was studied by injecting
I 00 µI of alkane standards. Optimization of the solvent vent time starts with determining
the time needed for complete evaporation of the solvent as described above. Next the vent
time is decreased in small steps. From these experiments it became clear that losses of
volatiles mainly occur during elimination of the last 5-15 µl of solvent. This is easily
explained from Figures 4-5. With evaporation of the last portion of liquid both extra cold
trapping due to the cooling effect and solvent trapping of the compounds in the liquid
layer disappear rapidly. With optimal solvent trapping, i.e. using hexane as solvent for

76\ Large volume PTV injection
n-alkanes, it is possible to retain more than 95% of nonane after a 100 µI injection in the
solvent split mode (Table IV). A low initial temperature of 0°C w~ applied here for
efficient cold trapping. Besides, retention of the analytes in the he~ane layer will be
stronger at low temperatures. To accelerate evaporation venting was pefformed at reduced
(ambient) inlet pressure. The amount of hexane left in the liner when closing the split
valve was estimated to be some 10 µI. At the PTV heating rate and the column flow
applied, splitless transfer of this volume did not lead to peak distortion due to excessive
recondensation of solvent vapour in the column (Figure 7).
Table IV. Recoveries of n-alkanes obtained after 100 µI injections using PTV injectors in the solvent split mode.
dichloro pen- ethyl meth-Solvent hexane methane tane acetate anol
PTV No. 2 3 2 2 2 2
PTV initial temp. (°C) o·i o·i 50 -30 o·i 30 30 o·> 50 50
Solvent vent time (min) 2.5 15 0.2 b)
1.75 0.5 0.1 4.0 0.5 2.0
GC initial temp. (°C) 40 40 40 40 40 30 30 40 95 80
C2m122und RI:;COVJ:;RYm)'>
Octane 87 0 65 0 75 64 93 12 d)
0
Nonane 97 7 74 11 82 76 91 53 d)
0
De cane 94 24 80 15 91 91 87 78 68 0
Undecane 98 47 83 25 93 90 90 87 81 0
Dode cane 99 78 87 47 100 95 91 92 86 17
Tridecane 99 94 89 76 103 99 93 95 91 40
Tetradecane 103 101 92 93 105 101 97 100 95 66
Pentadecane 101 100 92 98 102 102 98 100 95 80
Hexadecane 101 99 97 97 100 100 98 102 97 86
Heptadecane 102 101 101 97 100 102 100 105 99 97
Octadecane 100 104 JOO 102 97 102 105 100 101 95
Nonadecane 102 100 101 100 99 105 101 105 101 98
Eicosane 103 96 100 101 100 100 102 105 100 95
Split flow in all cases 250 ml/min. •> inlet pressure during solvent elimination: ambient. •l speed-controlled injection as in ref. [6]: 25 µI/min, after injection 45 s additional vent time. •l recovery relative to 2 µl splitless injections. dJ not separated from the solvent peak.
In Table IV the recoveries of n-alkanes, obtained after 100 µl injections of the compounds
in several organic solvents, are compared. An injection of a hexane solution at 0°C with
an excessively long vent time of 15 min was carried out to demonstrate that without
solvation n-alkanes more volatile than C14 are partially lost. As shown ~bove solvation in

hexane greatly reduces losses of the volatile alkanes, even at higher initial PTV
temperatures. For ethyl acetate and dichloromethane, which are less favourable solvents for
n-alkanes, recoveries for the most volatile solutes are worse because solvent trapping is
less efficient. For dichloromethane this is partially compensated by a stronger cooling
effect and a shorter evaporation time.
When solvation is needed for retaining the analytes during solvent elimination, vent
times are rather critical. However, even in this situation the repeatability was surprisingly
good. Relative standard deviations (RSD) were 2-8% when recoveries were below 85%
and better than 2% for higher recoveries. Only with methanol RSD values were slightly
higher, 2-5%. With correct venting times the injection volume, ranging from 25 to 150 µl,
had no noticeable effect on the recovery. Besides, for 100 µl injections no differences in
recovery were found using either the 3.4 mm iA liner (PTV-1) or the 2.3 mm i.d. liner
(PTV-2) under similar conditions. As an application the analysis of PCBs with GC-MS is
shown in Figure 8. Obviously, detection limits at the pg/ml level are readily achievable in
the SIM mode as indicated by the signal to noise ratio of the hexachlorobenzene and
major PCB congener peaks.
0
HCB
I .L I ...::: I L L ~ A u I ~ " ..
7.00 8.30 9.60 10.90 J..2.42 13.93 15 . 45 16.97 18.48 20.00
Time (min)
Figure 8. GC-MS (SIM mode) chromatogram obtained after a 100 µI injection of a hexane sample containing 20 ng/ml Aroclor 1248 and 0.8 ng/ml hexachlorobenzene (HCB). PTV-2 with 2.3 mm i.d. liner, initial temperature 50°C. Solvent vent time 30 s, split flow 260 ml/min. Splitless transfer: PTV 50°C ~ 3°/s ~ 350°C, splitless time 3.5 min. GC: column: 25 m x 0.25 mm, i.d. 0.25 µm CP-Sil-5, inlet pressure 135 kPa, 50°C (2.5 min) ~ 30°/rnin ~ 150°C (0 min) ~ 5°C/min ~ 250°C.

Comparison with speed-controlled sample introduction
For 100 µl hexane samples the at-once injection was compared with speed-controlled
injection. In order to obtain good results for volatile analytes low initial PTV temperatures
were used. At-once injection was performed as described above using the 3.4 mm i.d. liner
at 0°C. For speed-controlled injection a liner with an internal diameter of 1.2 mm was
used (PTV-3) at optimized conditions as described earlier [9], and a temperature of -30°C
was used which allowed an introduction speed of 25 µI/min. The recoveries are included
in Table IV. For the speed-controlled sample introduction it was expected that n-alkanes
from C12 would be quantitatively retained by cold trapping because of the very low
injector temperature. However, even for C13 a 25% loss was observed. On the other hand,
when injecting a small volume of 5 µl at once at -30°C, even after purging with a high
helium flow for 15 min no losses were observed for C12. Adding pure hexane at a
controlled speed after the 5 µl injection again resulted in losses. These losses increased
with the amount of hexane injected. Even the recovery of C14 was affected when more
than 100 µl of hexane were added. Consequently, the recovery of more volatile
compounds is volume dependent [25] and a lower temperature will be generally needed for
quantitative retention of the analytes in the .liner during solvent elimination in speed
controlled injection than with at-once injection. No explanation of these observations can
as yet be forwarded.
Table V. Guidelines for the selection of liner i.d. and injection mode in large volume sample introduction using PTV injectors in the solvent split mode•l
Analyte Sample volume Liner i.d. Injection mode Application range
Thermolabile < 20 µl ca. 1 mm at-once ~ c. Thermo labile > 20 µl ca. 1 mm speed controlled ~ c .. Thermostable < 150 µI ca. 2.5- 5 mm at-once ~ c. Thermostable > 150 µl ca. 1- 5 mm speed controlled ~ c ..
•l liner packed with glass wool.
Based on the results obtained in this work guidelines (Table V) can be given for the
selection of the PTV liner i.d. best suited for a given application. For thermolabile analytes
narrow liners (± 1 mm i.d.) with small amounts of glass wool are best suited because the
occurrence of degradation is kept to a minimum. The maximum volume that can be
injected at-once in these liners is restricted to ca. 20 µl, for larger volumes speed
controlled sample introduction has to be performed. For thermostable compounds the
sample volume determines the choice of the liner i.d. and the introd.uction mode. For
volumes up to 150 µl the use of PTV injectors equipped with ~ 2.5 IDiri. i.d. liners allows
at-once injection of the sample. As a consequence, no optimization of mjection speed and
~~~~~~~~~~~~~Im~p_li_c_ati_·o_n_s_o_f_l_in_er~d_i_am~ere~r~~~~~~~~~~~~---'~
no extra devices for sample introduction are required. In addition to this the application
range is extended towards more volatile analytes. For sample volumes of over
approximately 150 µl the sample has to be introduced in a speed-controlled manner. In
this case there is no restriction with regard to the i.d. of the liner.
Conclusions
Large volume sample introduction using PTV injectors in the solvent split mode is an
attractive technique to improve analyte detectability in capillary GC. Two injection modes,
i.e. at-once and speed-controlled injection, can be applied depending on the sample
volume, the volatility and also on the thermostability of the analytes. As regards the inner
diameter of the liners, larger i.d. liners are advantageous because of their higher solvent
capacity. Sample volumes up to 150 µl can be injected rapidly. In addition, due to
efficient solvent trapping, volatiles down to nonane can be quantitatively retained. On the
other hand, smaller i.d. liners are more suited when analysing thermolabile compounds.
When the sample has to be introduced in a speed-controlled way, i.e. for sample volumes
exceeding some 150 µl and also in coupled LC-GC systems, smaller i.d. liners are
advantageous because of the efficiency of the splitless transfer of the analytes to the
column.
References
[I] K. Grob, "On-line coupled LC-GC", Huthig, Heidelberg, 1991. [2] K. Grob, "On-column injection in capillary GC", HUthig, Heidelberg, 1987. [3] H.-M. Mi.Iller, H.-J. Stan, J. High Res. Chrornatogr. 13 (1990) 697-701. [4] W. Vogt, K. Jacob, H.W. Obwexer, J. Chromatogr. 174 (1979) 437-439 [5] W. Vogt, K. Jacob, A.-B. Ohnesorge, H.W. Obwexer, J. Chromatogr. 186 (1979) 197-205. [6] G. Schomburg in "Sample Introduction in Capillary Gas Chromatography", Vol. I, P. Sandra (ed.),
HUthig, Heidelberg, 1985. [7] F. Poy, L. Cobelli in "Sample Introduction in Capillary Gas Chromatography", Vol. I, P. Sandra (ed.),
Huthig, Heidelberg, 1985. [8] J. Staniewski, J.A. Rijks, J. Chromatogr. 623 (1992) 105-113. [9] J. Staniewski, J.A. Rijks, J. High Res. Chromatogr. 16 (1993) 182-187. [10] F.J. Senorans, J. Tabera, J. Villen, M. Herraiz, G. Reglero, J. Chromatogr. 648 (1993) 407-414. [11] G. Schomburg, E. Bastian, H. Belau, H. Husman, F. Weeke, M. Oreans, F. Muller, J. High Res.
Chromatogr. 7 (1984) 4-12. [12] J. Staniewski, H.-G. Janssen, C.A. Cramers in "Proceedings of the 15th Int. Symp. on Capillary
Chromatogr.", Riva del Garda, Italy, 1993, HUthig, Heidelberg, 808-813. [13] K. Grob, z. Li, J. High Res. Chromatogr. 11 (1988) 626-632. [14] K. Grob, J. High Res. Chromatogr. 13 (1990) 540-546. [15] K. Grob, S. Brem, D. Frohlich, J. High Res. Chromatogr. 15 (1992) 659-664. [16] K. Grob, S. Brem, J. High Res. Chromatogr. 15 (1992) 715-722. [ 17] K. Grob, D. Frohlich, J. High Res. Chroma to gr. 16 (1993) 224-228. [18] J.J. Vreuls, G.J. de Jong, R.T. Ghijsen, U.A.Th. Brinkman, J. Microcol. Sep. 5 (1993) 317-324.

[19] H.G.J. Mol, H.-G.M. Janssen, C.A. Cramers, U.A.Th. Brinkman, J. High Res. Chromatogr. 16 (1993) 459-463 .
[20] R. Kubinec , P. Kuraii, I. Ostrovsky, L. Soja!<, J. Chromatogr. 653 (1993) 363-368. [21] K. Grob, Th. Liiubli, B. BrechbUhler, J. High Res. Chromatogr. 11 (1988) 462-470. [22] K. Grob, "Classical split and splitless injection in capillary GC", H1lthig, Heidelberg, 1986. [23] M. Donike, Chromatographia 6 (1973) 190-195. [24] R.C. Reid, J.M. Prausnitz, T.K. Sherwood, "The properties of gases and liquids", McGraw-Hill, New
York, 1977. (25] H.G.J. Mol, J. Staniewski, H.-G. M Janssen, C.A. Cramers, RT. Ghijsen, U.A.Th. Brinkman, J.
Chromatogr. 630 (1993) 201-212.

81
3.2 Inertness of packing materials3)
Summary When using PTV injectors for large volume injection in capillary GC the liner has to be packed. The use of silylated glass wool as packing material easily causes degradation of labile or polar compounds. In this chapter liners packed with several types of material, and a specially designed 'cup' liner, are evaluated as alternatives for glass wool packed liners. In addition other aspects, such as the volume of liquid retained by the liner and the thermostability of the packing material, are evaluated. Several general purpose packing materials and some more dedicated liner types are proposed.
Introduction
Programmed temperature vaponzrng injectors (PTV) have been shown to be eminently
suited for large volume sample introduction in capillary gas chromatography [l-3]. Large
volume injection can be applied in trace analysis to improve analyte detectability. Very
often it can replace an off-line evaporation step carried out to concentrate a diluted sample
extract. In the previous chapter it was demonstrated that, for sample volumes up to 150 µl,
the procedure for large volume injection is very straightforward when using PTV injectors
equipped with liners with internal diameters larger than ca. 2.5 mm [4]. With the split
valve open and at a liner temperature below the solvent boiling point the sample can be
rapidly injected, either manually or with an autosampler equipped with a large volume
syringe. The solvent is vented via the split exit while the analytes are retained in the liner.
After the solvent elimination step the analytes are transferred to the column in the splitless
mode. For large volume sampling with PTV injectors the liner has to be packed in order
to retain the liquid sample after injection. In the previous chapter silylated glass wool was
used as packing material. With liners packed with glass wool reliable results can be
obtained for thermostable compounds such as polycyclic aromatic hydrocarbons and
polychlorobiphenyls. For thermolabile compounds, and also for polar analytes, interaction
with active sites on the glass wool surface may lead to degradation or adsorption of the
analytes in the liner, as is also known from (PTV) split/splitless injection [5-7]. The aim of
this work is to find alternatives for glass wool as packing material for use in large volume
sampling with PTV injectors. Aspects that will be discussed are the sample volume that
can be retained by the packed liner, and the inertness and thermosta:bility of the packing
material.
'> H.G.J. Mol, H.-G. Janssen, C.A. Cramers, U.A.Th. Brinkman, J. High Res. Chromatogr. 18 (1 995) 124-128.

82'\~~~~~~~~~L_ar~g_e_v_ol_um~e_P_T_V~in_j_e_ct_io_n~~~~~~~~~~~~~~~~~
Experimental
Materials and reagents
Silanized glass wool was obtained from Perkin Elmer (Norwalk, CT, USA). Quartz
wool, glass beads (60-80 mesh), Tenax TA (35-60 mesh) and Dex:sil-300 (12% coated on
Chromosorb 750, 80-100 mesh) were purchased from Chrompack (Bergen op Zoom, The
Netherlands). PTFE (Teflon) and polyimide wool were made in house from PTFE and
polyimide rods obtained from Eriks (Alkmaar, The Netherlands). The reagent used for
deactivation of the liners, polymethylhydrosiloxane (PMHS, PS122), was from Petrarch
Systems (Bristol, PN, USA). All solvents were freshly distilled before use. For the Donike
test mixture, fatty acids were silylated with bistrimethylsilyltrifluoracetamide (BSTF A) as
described elsewhere [4] . A second test mixture, containing 27 compounds (names are
indicated in the figures/tables), was made in ethyl acetate. For large volume injections this
sample was diluted in hexane or pentane.
Instrumentation
A Hewlett-Packard 5890A (Avondale, PA, USA) gas chromatograph equipped with a
flame ionization detector and a PTV injector (Optic, Ai Cambridge, Cambridge, UK) was
used. The injector could be cooled to sub-ambient temperatures with carbon dioxide. GC
separation was performed on a 25 m x 0.32 mm i.d. column coated with a 0.17 µm
Ultra-2 stationary phase (Hewlett-Packard). Helium was used as the carrier gas at an inlet
pressure of 100 kPa. The split flow was 250 ml/min. All injections were carried out
manually. For large volume injection the sample was rapidly injected, i.e. within 1-2 sec.
After solvent elimination the PTV was heated at 8°C/s to 300°C or the maximum
operation temperature of the liner used. The splitless time was 1.5 min for the empty liner,
the glass wool and quartz wool liners. For the other liners a splitless time of 2.5 min was
used. On-column injection was possible using a special on-column insert for the PTV
injector. In case of on-column injection the PTV was heated at 1°C/s. The GC temperature
programme used for all separations was as follows: 40°C (1 min) at 20°C/min to 300°C (5
min).
Liners, deactivation and conditioning
For splitless and large volume injections packed liners or a specially designed 'cup'
liner (made in house) were used (Figure 1). To keep the packing material in place, a glass
frit was made in the lower part of the 80 mm x 3.4 mm i.d. liners. This frit has a small
surface and replaces the plug of glass wool normally used. Deactivation and conditioning
of the liners was done inside the injector. During these procedures the column was
replaced by a 8 m piece of 0.32 mm i.d. fused silica. Quartz wool was deactivated by

rinsing the packed liner with a l % w/w solution of PMHS in pentane. The liner was then
placed in the injector and after pmging with a low flow of helium for 5 min heated to
290°C for two hours. The cup liner was deactivated in the same way. For all packed liners
the length of the packed bed was 25 mm. For conditioning the Tenax, Dexsil, PTFE and
polyimide packing, the packed liners were first purged for l 0 min with a high helium flow
and then heated to the maximum operation temperature (see below) for 30-60 min.
A
packing material~
glass frit ~
B
GC column
llquld
- sample
Figure I. Liners used in this work: A) packed liner, B) cup liner.
Results and Discussion
The use of glass wool as packing material in large volume sample introduction using PTV
injectors can have two disadvantages. The more important one is that glass wool is
difficult to deactivate in such a way that thermal degradation of labile analytes and
adsorption of polar analytes is completely prevented. Figure 2 illustrates the problems
encountered when (silanized) glass wool is used as packing material. Compared with on
column injection the response for a number of analytes is much lower. The most critical
compounds in the test mixture were found to be varnidothion and azinphos-methyl.
Although relatively volatile, a reduced response was also found for dinitrobenzene.
Another disadvantage of glass wool as packing material is that liners cannot be packed
in a reproducible way which may result in varying maximum sample volumes and solvent
. vent times [ 4]. For these reasons, several other packing materials were evaluated as
alternatives for glass wool. Ideally, the packing should be highly inert and thermostable.
The packed liner should not retain the high-boiling analytes too strong in order to
minimize the thermal stress applied to these compounds on splitless transfer to the column.

A
Q) U)
r:: 0 0. U) Q) .... 0 u:::
B
Q) U)
r:: 0 0. U)
~ 0 u:::
J -
0
-
-
0
Large volume PTV injection
~
8
i "E .
1 c
i ~ ~~
I
3 6 9
.. c
:i ~
0 .. c c .. .. il " c 0 .. ...
g c ;; .:..
.._ .. J t I l ..
3 6 9
Time (min)
! :
~ § e li
~·i .... c c ii c
"<C ~" . . :i~ H c
i ~- . l
I
12 15
c .. "C
~ c
" ..
c &; ~ .. ;; I- E
.. 0 Cl.
c 0 .. .. £! 0
I -= = ~ :ii ,\l c
; E
I :i ,.. .
11 u > I I .I.~ I
12 16
Figure 2. GC-FID chromatograms of 1 µl injections of a standard containing 27 analytes (concentration, 5-10 µg/ml) . A) on-column injection, B) cold splitless injection using a liner packed with silanized glass wooL
Furthermore, the packing should be compatible with common organic solvents and the
inertness should not be affected by water. A good water resistance of the liner is beneficial
for long-term stability when 'wet' extracts (i.e. ethyl acetate) or aqueous samples are
introduced. Finally, the packed liner has to retain a large volume of liqJtid sample in order
to allow rapid introduction of large sample volumes without overloaqing the liner with
liquid. Several packing materials were selected for this study. Untreat~d quartz wool and
silanized glass wool were included in order to find out for which (clas~es of) compounds
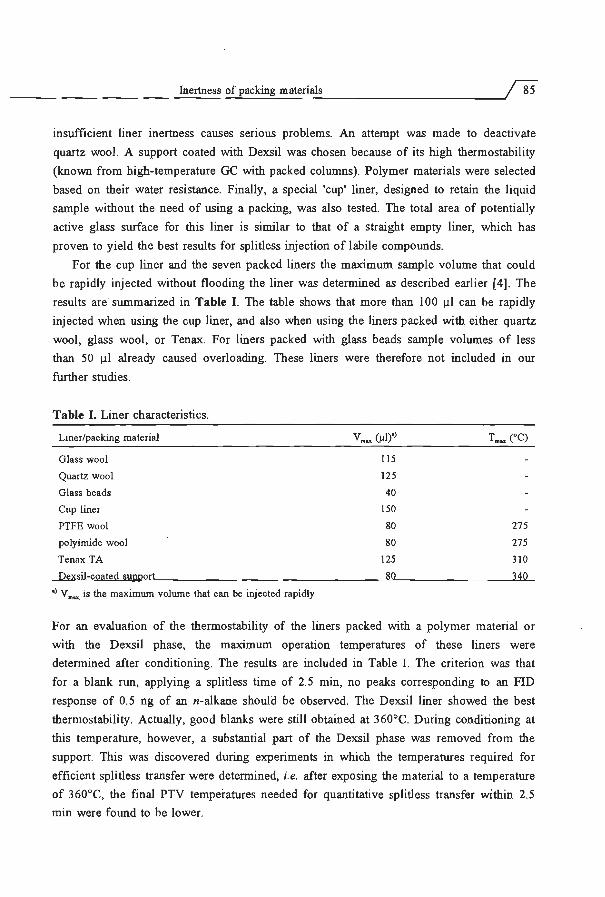
insufficient liner inertness causes serious problems. An attempt was made to deactivate
quartz wool. A support coated with Dexsil was chosen because of its high thermostability
(known from high-temperature GC with packed columns). Polymer materials were selected
based on their water resistance. Finally, a special 'cup' liner, designed to retain the liquid
sample without the need of using a packing, was also tested. The total area of potentially
active glass surface for this liner is similar to that of a straight empty liner, which has
proven to yield the best results for splitless injection of labile compounds.
For the cup liner and the seven packed liners the maximum sample volume that could
be rapidly injected without flooding the liner was determined as described earlier [4). The
results are summarized in Table I. The table shows that more than 100 µl can be rapidly
injected when using the cup liner, and also when using the liners packed with either quartz
wool, glass wool, or Tenax. For liners packed with glass beads sample volumes of less
than SO µl already caused overloading. These liners were therefore not included in our
further studies.
Table I. Liner characteristics.
Liner/packing material
Glass wool
Quartz wool
Glass beads
Cup liner
PTFE wool
polyirnide wool
Tenax TA
Dexsil-coated SU'2l)Qrt
•> V "'"' is the maximum volume that can be injected rapidly
115
125
40
150
80
80
125
80
T.,.,. (°C)
275
275
310
340
For an evaluation of the thermostability of the liners packed with a polymer material or
with the Dexsil phase, the maximum operation temperatures of these liners were
determined after conditioning. The results are included in Table I. The criterion was that
for a blank run, applying a splitless time of 2.5 min, no peaks corresponding to an FID
response of 0.5 ng of an n-alkane should be observed. The Dexsil liner showed the best
thermostability. Actually, good blanks were still obtained at 360°C. During conditioning at
this temperature, however, a substantial part of the Dexsil phase was removed from the
support. This was discovered during experiments in which the temperatures required for
efficient splitless transfer were determined, i.e. after exposing the material to a temperature
of 360°C, the final PTV temperatures needed for quantitative splitless transfer within 2.5
min were found to be lower.

Large volume PTV injection
The inertness of the liners was evaluated using two test mixtures: the Donike test mixture
[8], containing trimethylsilyl esters of fatty acids, and a test mixture of 27 compounds
which vary widely in polarity and volatility (see Figure 2). Peak areas obtained for I µI
splitless injections were compared with those obtained for on-column injections. To
distinguish between activity of the packing material and residual activity, of the liner itself,
the measurements were also carried out with a liner containing only the glass frit. The
silyl esters of the Donike mixture can degrade due to hydrolytic activity of the liner.
Silano! groups are generally thought to be responsible for this phenomenon [8] . The
recoveries of the silyl esters, relative to on-column injection, are given in Table II. In
general, for less volatile esters degradation was more pronounced because they leave the
PTV liner at a higher temperature. High recoveries were obtained for liners without a
packing material, i.e. the empty liner and the cupliner. For the Dexsil liner conditioned at
320°C, almost no degradation occurred. Conditioning at 360°C resulted in partial removal
of the Dexsil phase which in turn resulted in an increase in liner activity towards the silyl
esters. For the Tenax packed liner there was not much degradation of the silyl esters
despite the fact that the compounds are probably quite strongly retained by this material.
Untreated quartz wool caused virtually complete degradation of all ester~ ; Silylation of the
quartz wool may improve the inertness. However, based on the results obtained with
silanized glass wool, it is expected that inertness wili stili be insufficient. Deactivatiort of
quartz wool with PMHS was found to result in a significantly reduced decompositiort of
the sily 1 esters.
Table II. Recovery of trimethylsilyl esters of ,fatty acids obtained after cold splitless injection•) relative to on-column injection.
RECOVERY(%)
Liner/packing material E!Obl E14 El8 E22
Empty liner with frit 103 103 97 82
Silylated glass wool 58 lO 0 0
Quartz wool (untreated) 3 0 (j 0
Quartz wool (PMHS deact.) 102 96 83 35
Cup liner 98 102 90 69
PTFE wool 105 103 97 54
Polyimide wool JOO 99 77 13
Tenax TA 102 100 98 81
Dexsil (360°C)'> 103 100 80 33
Dexsil (320°C)dl 103 103 99 90
•> 2 µI injection, concentration: 10 µg/ml b) E lO = trimethylsilylester of decanoic acid, etc. 0> liner conditioned at 360°C, d) liner conditioned at 320°C '

For a broader evaluation of the inertness of the various liners the test mixture from
Figure 2 was used. In Figure 3 the sum of the recoveries relative to on-colwnn injection
(sum = 2700) is depicted for each liner. Apart from the empty liner, the best overall
performance was obtained for the cup liner and the liners packed with PTFE wool or
Dexsil. In contrast to the situation for the silyl esters, the Dexsil liner was found to yield
higher recoveries when conditioned at 360°C. The low overall recovery for the Tenax liner
is partly due to strong adsorption of the less volatile compounds: for analytes up to
caffeine the recoveries were below 80% only for dinitrobenzene and dimethoate. Further
experiments of evaluation were carried out with the four most inert liners as indicated by
the recoveries obtained for splitless injection of both test mixtures. The maximum sample
volume was not a decisive factor in the selection as these volwnes did not differ by more
than a factor of two.
- OPP l>'·"''H OCP
- HCA !llllllii other
2700
.. ·~ 1800 d)
> 0 () d)
a: 0 E 900
"' (/)
0 empty GW aw QWd cup PTFE Pl TNX DEX
Figure 3. Sum of recoveries of 27 compounds (indicated in Figure 2) obtained after cold splitless injection (I µl ; 5-10 µg/ml) using different liners; recoveries are relative to on-column injection (sum= 2700). OPP= organophosphorus pesticides; OCP = organochlorine pesticides; HCA = heterocyclic aromatic compounds. Liner/packing: GW = silanized glass wool; QW = quartz wool (not deactivated); QWd = quartz wool deactivated with PMHS; PI = polyimide wool; TNX = Tenax; DEX = support coated with Dexsil.
For large volume sample introduction the mixture containing the 27 test compounds was
diluted such that the amount of compound injected was the same as for the 1 µI splitless
injection described above. The diluted sample (60-100 µI) was rapidly injected with the
split valve open and at an initial PTV temperature of 0 to 40°C. The solvent vent time was
determined either by ignition of the vapours leaving the split exit or by monitoring with
the FID detector (the same as used for analyte detection) as was described previously ( 4] .
After solvent elimination the analytes retained in the liner were transferred to the GC
column in the splitless mode.

A
Gl U) c: 0 a. U) Gl ... 0 u::
B
Gl U) c: 0 a. U)
~ 0 u::
c
Gl U)
c: 0 a. ., ~ 0 u::
I'-
0
0
0
Large volume PTV injection
.. c
~ i
0
~ 0
u....--J'-l I
I<....,
3 6 9
..
1 i .
lul .. I
3 6 9
~ :i ii
g G
l l t; 0
"- l I j
3 6 9
c
! .. i ~ l
" J. 11 ~l.A.l.
12 15
c 'C ... .. ;;
c ;; c ..
• t
ti
l
,,Ill k I i 12 15
.. c .. ~
c l ~ .
j 11 I
Time (min) 15
Figure 4. GC-FID chromatograms obtained after large volume injection using PTV injectors in the solvent split mode. Details/conditions: see Table III. A) PTFE wool packed liner, 60 µl injection of a 8-16 ng/ml solution, B) Tenax packed liner, 100 µl; 50-100 ng/ml, C) Cup liner, 100 µl; 50-100 ngfml.
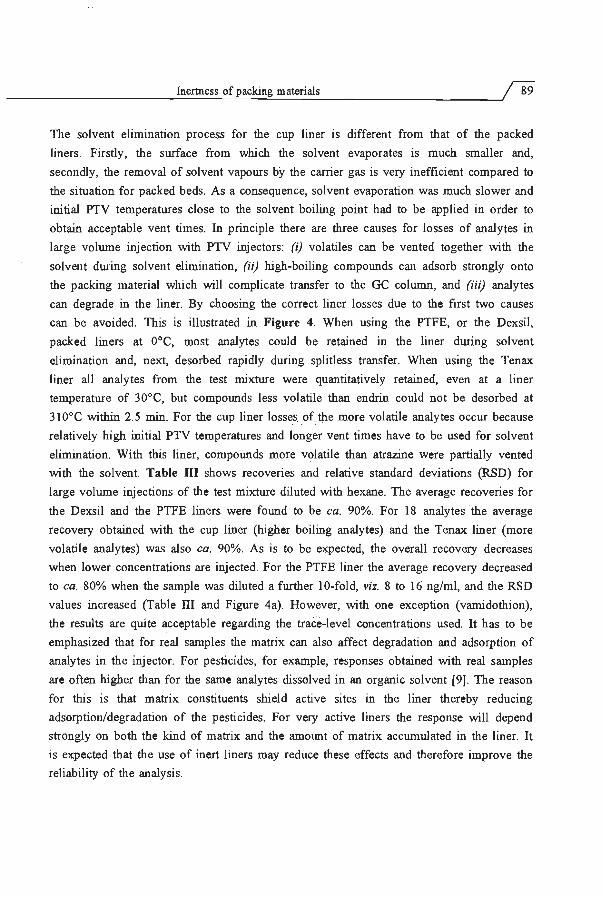
~~~~~~~~~~~~-In_e_rtn~es_s_o_f~p_a_cki_._n~g_m_a_re_n_·ru_s~~~~~~~~~~~~--',;-Bi
The solvent elimination process for the cup liner is different from that of the packed
liners. Firstly, the surface from which the solvent evaporates is much smaller and,
secondly, the removal of solvent vapours by the carrier gas is very inefficient compared to
the situation for packed beds. As a consequence, solvent evaporation was much slower and
initial PTV temperatures close to the solvent boiling point had to be applied in order to
obtain acceptable vent times. In principle there are three causes for losses of analytes in
large volume injection with PTV injectors: (i) volatiles can be vented together with the
solvent during solvent elimination, (ii} high-boiling compounds can adsorb strongly onto
the packing material which will complicate transfer to the GC column, and (iii) analytes
can degrade in the liner. By choosing the correct liner losses due to the first two causes
can be avoided. This is illustrated in Figure 4. When using the PTFE, or the Dexsil,
packed liners at 0°C, most analytes could be retained in the liner during solvent
elimination and, next, desorbed rapidly during splitless transfer. When using the Tenax
liner all analytes from the test mixture were quantitatively retained, even at a liner
temperature of 30°C, but compounds less volatile than endrin could not be desorbed at
310°C within 2.5 min. For the cup liner losses. of the more volatile analytes occur because
relatively high initial PTV temperatures and longer vent times have to be used for solvent
elimination. With this liner, compounds more vol.atile than atrazine were partially vented
with the solvent. Table III shows recoveries and relative standard deviations (RSD) for
large volume injections of the test mixture diluted with hexane. The average recoveries for
the Dexsil and the PTFE liners were found to be ca. 90%. For 18 analytes the average
recovery obtained with the cup liner (higher boiling analytes) and the Tenax liner (more
volatile analytes) was also ca. 90%. As is to be expected, the overall recovery decreases
when lower concentrations are injected. For the PTFE liner the average recovery decreased
to ca. 80% when the sample was diluted a further 10-fold, viz. 8 to 16 ng/ml, and the RSD
values increased (Table III and Figure 4a). However, with one exception (varnidothion),
the results are quite acceptable regarding the trace-level concentrations used. It has to be
emphasized that for real samples the matrix can also affect degradation and adsorption of
analytes in the injector. For pesticides, for example, responses obtained with real samples
are often higher than for the same analytes dissolved in an organic solvent [9]. The reason
for this is that matrix constituents shield active sites in the liner thereby reducing
adsorption/degradation of the pesticides. For very active liners the response will depend
strongly on both the kind of matrix and the amount of matrix accumulated in the liner. It
is expected that the use of inert liners may reduce these effects and therefore improve the
reliability of the analysis.

Table III. Percent recoveries (relative to on-column injection) of 27 compounds for large volume injection using the PTV injector in the solvent split mode.
Liner/packing
Sample volume (µJ)'>
Concentration (ng/rnl)
PTV temperature (°C)
Vent time (min)
Compound
Octanol
Napbtalene
Benzothiazole
Indole
Nicotine
p-Dinitrobenzene
Pentadecane
Dietbylpbtalate
Trifluralin
Dimethoate
Atrazine
Diazinone
Caffeine
Parathion-methyl
F enitrotbion
Cyanazine
Vamidothion
Dieldrin
Endrin
p,p'-DDT
Methoxychlor
Azinfos-methyl
Mirex
Azinfos-ethyl
Coumaphos
Octacosane
Perylene
Cup
100
50-100
40
5.0
52
41
47
54
57
57
78
85
85
90
91
97
99
86
89
94
61
JOO
88
67
71
64
91
93
95
Ill
107
rsd
7.5
7.5
4.9
12
11
II
13
11
11
8.5
8.6
7.2
2.8
5.2
3.4
1.5
4.4 c)
1.0
2.7
2.7
3.4
1.6
1.9
2.4
1.8
2.9
Tenax
JOO
50-100
30
0.7
rec
116
98
103
99
80
65
JOO
105
91
76
97
101
99
82
93
67
34
rsd
2.5
0.1
0.6
0.2
1.4
0 .7 c)
0.5
0.4
1.3
1.6
0.5
0.8
1.0
3.1
1.6
2.3
98 1.5
62 3.8
7 8.4
6 7.5
7 8.6
35 7.7
11 7.1
II II
99 2.0
6 1.6
Dexsil
60
80-160
0
2.0
rec rsd
108 6.4
85 2.4
90 2.1
90 2.6
84 1.8
56 2.3
93 ' 2.4
97 1.0
92 I.I
91 2.5
92 0.9
98 0.7
98 1.2
91 1.4
92 0.8
87 3.2
34
100
94
82
83
70
JOO
92
92
100
93
14 c)
1.6
2.9
3.9
3.5
0.8
1.8
2.1
1.2
2.2
PTFE
60
80-160
0
1.7
rec rsd
110 3. I
73 21
88 5.5
94 2.3
85 1.6
84 1.9
97 0.8
100 0.9
93 1.3
90 1.7
94 2.2
99 1.2
95 2.0
93 1.3
98 3.9
89 0.7
54
100
94
86
88
71
99
93
93
101
89
9.0 •)
0.9
0.2
I.I
2.1
1.4
0.4
I.I
1.3
4.0
rec
60
8-16
0
1.7
100
66
88
86
69
58
102
100
92
56
86
96
80
80
81
75
0
JOO
85
69
69
52
JOO
79
78
101
86
rsd
12
20
5.3
5.3
7.5
6.0
4.6
4.9
2.2
13
1.4
1.3
1.5
3.5
3.1
2.4
•)
3.1
2.4
3.3
5.6
1.7
2.9
4.3
1.4
9.0
-> Solvent: cup liner, pentane; other liners: hexane. b) rec = recovery relative to I µl on-column injection, rsd = relative standard deviation (%) (n=3). •l Pentadecane used as internal standard. dl Dieldrin used as internal standard.

~~~~~~~~~~~~~In_e_rtn~e_s_s_o_f~p_ac_ki_._ng=-m_a_te_n_·ru~s~~~~~~~~~~~~~~~
Conclusions
The use of (silylated) glass wool as packing material in large volume sample introduction
with PTV injectors can cause degradation of labile or polar compounds. In this chapter
liners packed with several types of material and a specially designed 'cup' liner were
evaluated as alternatives for glass woe! packed liners. PTFE wool and a support coated
with Dexsil were much more inert than glass wool and found to be suited as general
purpose packing material in large volume sample introduction. For samples containing
relatively volatile analytes only, liners packed with Tenax are especially suited. The cup
liner is a good option when only higher boiling analytes are of interest. In other words, by
selecting a PTV injector equipped with the proper liner, good recoveries and satisfactory
RSD values can be obtained for a wide variety of analytes in large volume injection in
GC.
Note: Recently, it was fowid that liners packed with Supelcoport (60-80 mesh, Supelco,
Bellefonte, PA, USA) showed good inertness with regard to the determination of nitrogen
and phosphorus containing pesticides. Results obtained were comparable with those found
for the Dexsil packed liners. The additional advantage of Supelcoport is that no
conditioning is required as the material is not coated with a stationary phase.
References
[l] W. Vogt, K. Jacob, H.W. Obwexer, J. Chromatogr. 174 (1979) 437-439 [2] J. Staniewski, J.A. Rijks, J. Chromatogr. 623 (1 992) 105-113. [3] J. Staniewski, J.A. Rijks, J. High Res. Chromatogr. 16 (1993) 182-187. [4] H.G.J. Mol, H.-G. Janssen, C.A. Cramers, U.A.Th. Brinkman, J. High Res. Chromatogr. 18 (1995)
19-27. [5] G. Schomburg in "Sample Introduction in Capillary Gas Chromatography", Vol. 1, P. Sandra (ed.),
Hothig, Heidelberg, Germany, 1985. [6] H.-M. Moller, H.-J. Stan, J. High Res. Chromatogr. 13 (1990) 759-763. [7] K. Grob, Ch. Wagner, J. High Res. Chromatogr. 16 (1993) 464-468. [8] M. Donike, Chromatographia 6 (1973) 190-195. [9] D.R. Emey, C.F. Poole, J. High Res. Chromatogr. 16 (1993) 501-503
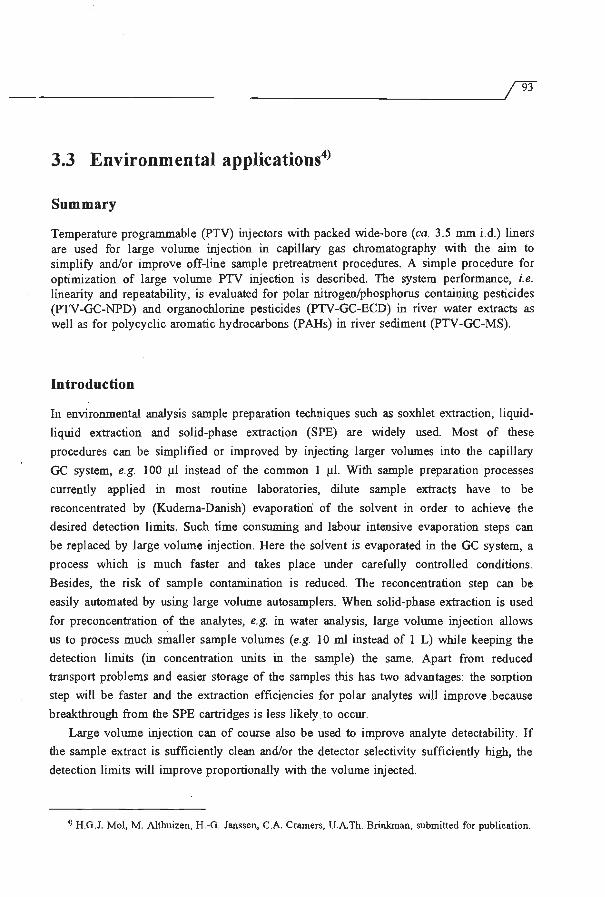
93
3.3 Environmental applications4>
Summary
Temperature programmable (PTV) injectors with packed wide-bore (ca. 3.5 mm i.d.) liners are used for large volume injection in capillary gas chromatography with the aim to simplify and/or improve off-line sample pretreatment procedures. A simple procedure for optimization of large volume PTV injection is described. The system performance, i.e. linearity and repeatability, is evaluated for polar nitrogen/phosphorus containing pesticides (PTV-GC-NPD) and organochlorine pesticides (PTV-GC-ECD) in river water extracts as well as for polycyclic aromatic hydrocarbons (PAHs) in river sediment (PTV-GC-MS).
Introduction
In environmental analysis sample preparation techniques such as soxhlet extraction, liquid
liquid extraction and solid-phase extraction (SPE) are widely used. Most of these
procedures can be simplified or improved by injecting larger volumes into the capillary
GC system, e.g. 100 µl instead of the common 1 µI. With sample preparation processes
currently applied in most routine laboratories, dilute sample extracts have to be
reconcentrated by (Kuderna-Danish) evaporation of the solvent in order to achieve the
desired detection limits. Such time consuming and labour intensive evaporation steps can
be replaced by large volume injection. Here the solvent is evaporated in the GC system, a
process which is much faster and takes place under carefully controlled conditions.
Besides, the risk of sample contamination is reduced. The reconcentration step can be
easily automated by using large volume autosamplers. When solid-phase extraction is used
for preconcentration of the analytes, e.g. in water analysis, large volume injection allows
us to process much smaller sample volumes (e.g. 10 ml instead of 1 L) while keeping the
detection limits (in concentration units in the sample) the same. Apart from reduced
transport problems and easier storage of the samples this has two advantages: the sorption
step will be faster and the extraction efficiencies for polar analytes will improve .because
breakthrough from the SPE cartridges is less likely . to occur.
Large volume injection can of course also be used to improve analyte detectability. If
the sample extract is sufficiently clean and/or the detector selectivity sufficiently high, the
detection limits will improve proportionally with the volume injected.
•l H.G.J. Mo!, M. Althuizen, H.-G. Janssen, C.A. Cramers, U.A.Th. Brinkman, submitted for publication.

94""\.~~~~~~~~~-L_ar---'-g_e_v_ol_um~e_P_T_V~i~aj_e_ct_io_n~~~~~~~~~~~~~~~~~
The techniques used for large volume sample introduction in capillary GC can be divided
into two categories: techniques based on on-column injection and techniques based on
split/splitless injection. In general, with the on-column techniques the solvent is vaporized
in a few meters of uncoated deactivated capillary (retention gap) and vented via a so
called early vapour exit [1]. On-column techniques are very accurate, especially when
thermolabile analytes or volatile analytes are concerned. On the other hand, the robustness
is less than with split/splitless techniques, because the performance can rapidly deteriorate
upon introduction of non-volatile material or traces of water [2,3]. On-column injectors
with retention gaps have been extensively used as interface in on-line systems, i.e. in
coupled LC-GC [1,4,5], and in on-line extraction-Ge systems [6-8]. Although the
advantages that large volume injection offers are also applicable to off-line sample
preparation-Ge, only few applications have been reported so far [9-13]. Large volume
injection obviously is still considered to be a complex technique [14], an impression that
may well be due to the fact that in most applications large volume injection is presented
as part of a sophisticated on-line system.
With large volume injection based on split/splitless injection the solvent is vaporized
in the liner and vented via the split exit of the injector. The use of a conventional
split/splitless injector has been reported for thi~ purpose [15], and also for large volume
injection using the vapour overflow technique [16]. In general, however, programmed
temperature vaporizing (PTV) injectors are most suited. The use of the PTV injector for
large volume sample introduction is especially useful for the analysis of relatively dirty
samples. Non-volatile matrix constituents remain in the liner which can easily be
exchanged, and will not contaminate the GC (pre)column. In most applications of large
volume PTV injection reported so far the sample volumes injected were relatively small
(10-25 µl) [17-19]. Such volumes can be rapidly injected without overloading the liner
(typically 1 mm i.d.) with liquid. The introduction of larger volumes of extract is possible
by performing speed-controlled injection. Speed-controlled injections require careful
optimization [20-22] and for introduction into the PTV injector a pump or speed
programmable autosampler is needed.
Recently we described the use of PTV injectors equipped with packed wide-bore liners
(3.5 mm i.d.) for large volume injection [23]. These packed liners can retain up to 150 µl
of liquid. This means that extract volumes up to 150 µl, which is sufficient for most
applications, can be rapidly injected. This in tum greatly simplifies both optimization and
instrumentation compared to the situation for speed-controlled sample introduction. As is
to be expected, for optimum performance with polar analytes the inertness of the packing
material was found to be an important aspect. This was evaluated in a subsequent study
and several promising materials were proposed [24]. In this chapter the applicability of

~~~~~~~~~~~~~-E_n~_·_ro_n_m_e_n_tfil~a_p_pl_ic_a_ti_o_ns~~~~~~~~~~~~--';195
PTV injectors equipped with packed wide-bore liners for large volume injection 1s
evaluated for real-life environmental samples. Three examples are given: the determination
of (i) polar nitrogen/phosphorus containing pesticides in river water, (ii) organochlorine
pesticides in river water and (iii) PAHs in river sediment, using NPD, ECD and MS
detection, respectively. The system performance, i.e. linearity and repeatability, is
evaluated for each application. In addition, the effect of the sample matrix on the (NPD)
response of the nitrogen/phosphorus pesticides is examined. For the organochlorine
pesticides, a system for on-line clean-up of the extract is presented.
Experimental
PTV-GC-NPD. The extracts of river water, in ethyl acetate, were kindly supplied by
KIWA (Nieuwegein, The Netherlands). The extracts had been 1,000-fold enriched by
solid-phase extraction (C18) of neutral and acidified river water samples from several
locations in The Netherlands. For 60 µl injections the extract was diluted 60 times in ethyl
acetate (Baker, Deventer, The Netherlands) which had been distilled before use. The
amount of matrix now introduced with each injection is equivalent to that present in I ml
of river water. Extracts were spiked with a nitrogen/phosphorus containing pesticide
standard (obtained as a gift from KIWA). Large volume injection-Ge analysis was
performed using an A TI Unicam GC (Model 4600, Cambridge, UK) equipped with a
nitrogen/phosphorus detector (NSA-25) and a PTV injector (liner i.d. 3.4 mm) (Optic, Ai
Cambridge, Cambridge, UK). A Nelson I 020 data system (Perkin Elmer, Norwalk, CT,
USA) was used for data handling.
PTV-GC-MS. Sediment samples were taken from the river Dommel in The Netherlands.
The sediment was dried at room temperature for 2 days. Soxhlet extraction using SO ml of
hexane/acetone (1 : 1) was carried out with 10 g of sieved (I mm) sediment for 8 hours.
The extract was further treated using two different methods as will be discussed in the
next section. Hexane p.a. and acetone p.a. were obtained from Baker and were distilled
before use. The PAH standard (16 PARs, SRM1647c) was obtained from Schmidt B.V.
(Amsterdam, The Netherlands). For fractionation 0.4 ml of the extract in hexane was
sampled onto an amino cartridge (Bond elut NH2, 3 ml, Analytichem Intern., Harbor City,
CA, USA) which was preconditioned with hexane. After washing with 0.6 ml of hexane,
elution was performed with 2% v/v dichloromethane in hexane. The extracts were
analysed using a GC system (Autosystem, Perkin Elmer) with mass spectrometric
detection (Q-mass 910) and a PTV injector (PSS, liner i.d. 2.3 mm). Data handling was
done using the Q-mass 910 Analytical Workstation software.

PTV-GC-ECD. River water extracts (Lekkanaal, The Netherlands) obtained after liquid
liquid extraction of 1 L of water with 200 ml of petroleum ether ( 40-60°C, nano grade,
Malinckrodt, Germany) were kindly supplied by WRK (Nieuwegein, The Netherlands) as
were the organochlorine pesticide/PCB standards. The aluminium oxide (basic, W200, ICN
Pharmaceuticals, Eschwege, Germany) used for clean-up was first actiyated overnight in
an oven at 150°C. Then 1.1 g of water was added to 8. 9 g of Al20 3 and the mixture was
allowed to homogenize for 24 hours. The system used for on-line clean-up-GC consisted
of a 6-port valve (Valeo, Houston, TX, USA), a 20 mm x 2 mm i.d. stainless steel LC
type precolumn which was (dry) packed with Al20 3, and a speed-programmable syringe
(Gerstel, Millheim aid Ruhr, Germany). GC analysis was carried out using an ATI Unicam
GC equipped with a PTV injector (liner i.d. 3.6 mm) and an ECD (make-up gas, 50 ml
N/min; detector temperature, 300°C). For data handling a Unicam 4880 chromatography
data handling system was used.
For all three applications home-made liners with a glass frit in the lower part were packed
with Dexsil-coated Chromosorb-750 (mesh 80-100, Chrompack, Bergen op Zoom, The
Netherlands). The length of the packed bed was 25-30 mm in all cases. Liners were
conditioned as described elsewhere [24] . All but the speed-controlled injections were
carried out manually using a 100 µl syringe. For speed-controlled ill,jections a speed
programmable syringe was used (Gerstel). Gas chromatographic conditions are given in the
legends to the figures.
PTV temp.
GC temp.
Split valve · · .. · · · · · · · ,__ ___ --; · · · · · · · · · · · · · · · · · .. · · · · · · · · · · · · · · · · ·. · ..
P10 (optional)
1 injection
2 solvent
venting
3
splitless
transfer
Figure I. Principle of large volume PTV injection.
GC analysis

~~~~~~~~~~~~~-E_nv_i_ro_n_m_e_n_tru~a~pp~li-·c_an_·_o_ns~~~~~~~~~~~~--'~
Results and discussion
The principle of PTV large volume injection in the solvent split mode is schematically
depicted in Figure 1. The procedure consists of three steps, injection, solvent venting, and
splitless transfer. During injection and elimination of the (bulk of the) solvent the split
valve is open and the temperature of the PTV injector is below the solvent boiling point
(typically between 0°C and 50°C). The latter ensures maximum retention of the analytes
inside the liner by cold trapping and solvent trapping, while the solvent is released via the
split exit [23] . After solvent elimination the analytes retained in the liner are transferred to
the GC column in the splitless mode. This involves closure of the split valve and a rapid
increase of the injector temperature. After the splitless transfer step the split valve is
opened again to remove residual solvent vapour from the liner. The PTV injector is
maintained at the high temperature for some time to remove high-boiling matrix
constituents from the liner; next the heating is switched off and the injector temperature
decreases. During splitless transfer the temperature of the GC oven is below the solvent
boiling point to facilitate refocusing of the analytes at the top of the analytical column
after the splitless transfer. Although not necessary, it can be advantageous to use pressure
programming if the GC is equipped with this option. In this case the inlet pressure is low
during injection and solvent elimination (increases evaporation speed), high during splitless
transfer (for efficient transfer and minimal thermal degradation [23,25]) and finally optimal
for GC separation.
Large volume PTV injection can be optimized in three steps:
(i) Selection of packing/determination Vmar· For large volume injection with PTV injectors
the liner has to be packed in order to prevent the sample from being pushed to the base of
the injector. This would result in losses of liquid sample via the split exit and/or in
flooding of the column inlet. The choice of packing material depends on the volatility and
the polarity of the analytes. A support coated with Dexsil was earlier found to be a good
general purpose packing material [24] and is used throughout this work. To keep the
packing in place, liners with a glass frit in the lower part are used. A plug of glass wool is
less suited for this purpose because of its activity and because there is a risk that the
packing will be pushed downwards. The length of the packed .bed is typically 25-30 mm.
V max is the maximum volume of liquid sample that can be rapidly injected without
flooding the liner. To determine this volume the packed liner is inserted into the PTV
injector. The column is not yet installed, i.e. when the carrier gas is supplied, it will leave
the injector at the base. The carrier gas flow rate measured at the base of the injector is
adjusted to, e.g., 150 ml/min, i.e. to the split flow to be applied in subsequent analyses.
Now V max is determined by rapid injection of increasing amounts of solvent. Flooding of

the liner is easily observed visually at the bottom of the injector. To create a safety
margin, usually I 0 µl less than the limiting volume found is injected. Liners packed with
the same amount of packing material have been found to have rather similar V max values.
(ii) Optimization of solvent elimination time. Optimization of this parameter is straight
forward [23]. A large volume injection of the pure solvent (volume < V max' rapid injection)
is performed under conditions that will be applied during subsequent :analyses. The GC
oven temperature is kept above the PTV temperature and the split exit is open. After
injection the solvent evaporates and the vapour is discharged via the split exit. Approx.
I% of solvent vapour will enter the column and reach the detector after the hold-up time
(assuming the solvent is not retained in the column). A solvent peak is obtained with most
GC detectors. The width of the solvent peak (see Figure 2) is a good estimate of the time
needed for solvent elimination .
.. .. c 0 a. .. ! c IL z
0
c 0
u • E' evaporation
time
2 3 min 4
Figure 2. Determination of the solvent elimination time by using the GC detector as a monitor detector. Detector, NPD; PTV, 30°C; split flow, 250 ml/min; GC oven; 40°C; injection, 60 µI ethyl acetate.
(iii) Sp/itless transfer .. The splitless transfer is optimized by performing standard I µl cold
splitless injections. Splitless times will generally be longer than with conventional hot
splitless injection because it takes some time for the injector to reach the final temperature.
After diluting the standard used for splitless injection e.g. 100 times and carrying out a
I 00 µl injection (assuming V max ;:: I 00 µl) the experimental analyte recoveries obtained
under large volume injection conditions can be evaluated. If the sample contains volatile
analytes and losses of these solutes are unacceptable, the solvent vent time should be
stepwise decreased. This can be repeated until peak distortion, caused by excessive
recondensation of solvent vapour in the column, occurs [23]. Optimum conditions with
regard to minimum losses of volatiles exist slightly before this point.

~~~~~~~~~~~~~~E_n_v_ir_o_nm~e_nt_ru~a_pp_l_ic_att_._o_ns~~~~~~~~~~~~~-J~
PTV-GC-NPD: nitrogen and phosphorus containing pesticides in river water
Many nitrogen and phosphorus containing pesticides are relatively polar analytes and
therefore sensitive to adsorption or degradation in packed liners. These analytes are
therefore interesting for an evaluation of the performance of large volume PTV injection.
Degradation of the pesticides in the liner was first studied by comparing I µI cold splitless
injections with I µI on-column injections (standards in ethyl acetate) (Table I).
Pesticides sensitive to adsorption/degradation include metamidophos, mevinphos,
dichlorvos, phosphamidon, metamitron, ox:ydemeton-methyl, and -as expected [26]- the
carbamates dimethoate and vamidothion. Next, a 60 µI volume of a dilute standard in
ethyl acetate was injected. The solvent vent time used was 60 s. The vent time was not
very critical, not even for the more volatile pesticides. Varying the vent time from 45 to
I SO s decreased the recoveries of dichlorvos and mevinphos by less than 25%. The
recoveries of the polar/labile pesticides obtained with large volume injection were
generally higher than for the I µI splitless injection, despite the fact that the amount of
pesticides introduced was more than ten times lower. An explanation for this is that after
large volume injection part of the pesticides is located in the lower part of the packed liner
which may well reduce thermal degradation during splitless transfer to the GC colwnn.
The relative standard deviations (RSD) were below 10% for 22 out of the 32 polar
pesticides. Not surprisingly, the ten pesticides with high RSD values included most of the
above mentioned labile pesticides. It should be emphasized here that GC analysis of
thermolabile compounds such as vamidothion can cause problems even when applying on
column injection.
With real sample extracts the matrix can affect the analyte response. For several
nitrogen/phosphorus containing pesticides the sample matrix has been found to enhance the
response relative to standard solutions in a pure . organic solvent [27,28]. The matrix
constituents obviously shield active sites in the liner, thereby reducing degradation of the
analytes. To study this effect for river water samples, extracts were spiked with the
pesticides and analysed. The response obtained after large volume injection was compared
with that of standards of the same concentration in distilled solvent. The response ratio
(matrix/distilled solvent) is given in Table I. Matrices I and 2 are extracts in ethyl acetate
obtained after solid-phase extraction of neutral and acidified river water, respectively. For
the neutral extracts significantly higher responses were observed for eight pesticides. The
effect was most pronounced for the polar/labile compounds. The effect was stronger for
the acidic extracts (significantly higher response for most compounds) which can be
attributed to the presence of larger amounts of matrix constituents (humic acids). The
matrix induced liner deactivation is only temporary, i.e. lower ('normal') responses are
again observed when analysing standard solutions.

100\ Large volume PTV injection
Table I. Performance of large volume PTV injection in determination of nitrogen and phosphorus containing pesticides.
Rec. (%)rel. to Response rel. to on-column inj .•l 60 µl standard .bJ
Compound ng inj•l 1 µl 60 µl RSD"l matr. 1 matr. 2 R2 •l
18* degradation product of 18 13 (1.2) 1.9 0.9963
I metamidophos 0.650 31 75 30 (1.2) 1.6 0.9991
2 dichlorvos 0.182 45 61 9.4 (I.I) 1.3 0.9929
3 mevinphos (trans + cis) 0.166 43 74 13 (1.2) 1.7 0.9994
4 ethoprophos 0.044 74 112 2.8 (1.0) 1.3 0~9998
5 chlorpropham 0.089 79 82 4.9 (1.0) 1.3 0.9994
desisopropyl atrazine 0.217 110 0 0 0 0 Q
6
7 desethyl atrazine 0.217 88 98 11 (I.I) (1 .2) 0.9999
8 dimethoate 0.182 58 65 22 (1.3) 2.5 0.9994
9 simazine 0.243 93 96 3.1 (I.I) I.I 0.9992
10 atrazine 0.220 96 100 5.7 (1.2) 1.2 0.9999
II propazine 0.230 100 100 6.3 (1.0) (I.I) 0.9999
12 terbutylazine 0.217 96 98 7.4 1.2 1.2 0.9998
13 phosphamidon (trans) .,
21 35 43 2.4 4.8 0.9991
14 pirimicarb 0.269 93 102 1.9 (1.0) I.I 0.9999
15 desmetryn 0.218 100 103 4.5 (I.I) 1.2 0.9999
16 metribuzin 0.218 89 92 3.9 I. I 1.5 0.9999
17 phosphamidon (cis) .,
91 115 21 (1.5) 3.0 0.9997
18 oxydemeton-methyl 0.632 16 12 60 4.5 18 0.9981
19 prometryn 0.2 18 92 95 5.8 (1.2) 1.3 0 .9994
20 terbutryn 0.222 99 109 3.1 (I.I) 1.2 0.9999
21 bromacil 1.020 80 91 4.7 2.0 1.2 0.9998
22 parathion-ethyl 0.110 92 132 6.0 (I.I) 1.3 0.9998
23 triadimefon 0.852 92 100 6.6 (1.0) (1 .0) 0.9999
24 cyanazine 0.217 IOI 91 18 (1.0) (1.0) 0.9999
25 benzolin-ethyl 0.935 87 IOI 4.0 I.I I.I 0.9999
26 penconazole 0.874 91 IOI 4.8 (1.0) (1.0) 0.9999
27 chlorfenvinphos 0.196 123 151 7.5 1.4 1.4 0.9995
28 triadimenol 0.474 73 100 8.3 (I.I) 1.3 0.9998
29 vamidothion 0.305 26 12 39 3.3 15 0.9981
30 metamitron 0.817 56 58 9.5 (I.I) 1.3 0.9988
31 oxadixyl 0.826 97 99 11 (1.0) (I.I) 0.9999
32 hexazinone 0.566 81 119 6.1 {1.02 {1.22 0.9999
•>Recoveries of pesticides obtained after a I µl cold splitless injection (0.5-12 µg/ml) and a 60 µl injection of a standard (0.73-17 ng/ml ethyl acetate). bJ Response of pesticides in spiked river water extracts relative to standard solutions in ethyl acetate (0.73-17 ng/ml); matrix I = neutral extract (n=2), matrix 2 = acidic extract (n=3); values between brackets, increase not significant (t-test). •l ng pesticide introduced with the 60 µI injections. "l RSD values (n=3) for 60 µI injections of standard solutions. •l Regression coefficients after multipoint calibration (n=9) obtained after spiking acidic river water extracts in the range 0.10-230 ng/ml. O Data not available due to co-elution with impurity in ethyl acetate. •l trans + cis, 0.277 ng.

~~~~~~~~~~~~~~E_n_v_i_ro_n_m_e_n_tal~_ap_p_li_·c_a_n_·o_n_s~~~~~~~~~~~~~~-'~
The repeatability for injections of real sample extracts was slightly better than obtained
with injection of standards (mean RSD value below 10%). Within each. group (standard,
neutral, and acidic extracts) the linearity of the response obtained after large volume
injection (concentration range in the extract 0.10-230 ng/ml) was excellent (e.g. for acidic
extracts see Table I). This means that for optimum accuracy with some of the polar/labile
pesticides, quantification should be done by using calibration curves measured in a matrix
similar to that of the sample. The detection limits obtained with the NPD were 2· 10-13 g
N/s and 5· 10-14 g Pis for nitrogen-containing pesticides and phosphorus-containing
pesticides, respectively. This corresponds with 0.03-1 ng/ml in the river water extracts. AJI
experiments were carried out using the same liner which demonstrates that one liner can
be used for at least 70 (40 of which were water extracts) large volume injections.
2
32 8
28 31
9-11 22-24 3 14-16 .....
(18•) :11 29 6 5-27 12
19-21 I
1a: I
..... 30
0 10 20 30 40 min 50
Figure 3. GC-NPD chromatograms obtained after 60 µI injections of a river water blank (lower trace) and a spiked extract (upper trace) (concentration in the extract, 0.3-7.2 ng/ml ethyl acetate). Peak numbers correspond with those in Table I. PTV: initial temperature 30°C, after 60 s solvent venting ~ 8°C/s to 300°C (10 min). Split flow 250 ml/min. GC: 25 m x 0.32 mm, 0.17 µm Ultra-2; Pu. 85 kPa; splitless time 1.5 min; temperatuie programme 40°C (2 min) ~ 20°C/min ~100°c (0 min)~ 2.5°C/min ~ 190°C (0 min) ~ 20°C/min ~ 300°C (5 min).

Figure 3 shows chromatograms obtained after 60 µl injections of a river water blank and a
spiked (0.3-7.2 ng/ml) extract. Sharp peaks are obtained .for all pesticides. Noij et al. [8]
applied large volume injection for the same type of compounds using concurrent solvent
evaporation with a loop-type interface. The use of a loop-type interface was preferred over
the on-column interface because of its ruggedness. However, with that approach the peaks
of pesticides eluting before ethoprophos were severely broadened.
PTV-GC-MS: polycyclic aromatic hydrocarbons in river sediment
Recently, Rebbert et al. [29] reported a procedure for the determination of P AHs in
river sediment. The method involves soxhlet extraction followed by evaporative
concentration of the extract to ca. 1 ml (Method 1, Figure 4). The concentrated extract is
applied to a 30 cm x 9 mm i.d. amino column for fractionation of aliphatic hydrocarbons
and PAHs. The PAH fraction is evaporatively concentrated to 1 ml and analysed by
injecting 1 µl (on-column) into a GC-MS system.
The analysis procedure is rather laborious as it includes two evaporative concentration
steps. Furthermore, when we applied the method, severe precipitation was observed after
concentration of the soxhlet extract. Therefore, an alternative method which involves large
volume injection was applied (Method 2, Figure 4).
Method 1
10 g sediment
Soxhlet l extraction
260 ml hexane/acetone (1 :1)
Kudema l Danish
0.8 ml hexane
0.4 ml NH2 column
-!! i \lt aliphatic
hydrocarbons PAHs
l evap. N,
1 ml extract
1 µI on-column Injection equivalent to 6 mg sediment
Method 2
10 g sediment
So~hlet l extraction
50 ml hexane/acetone (1:1)
LLE l water
-!! aliphatic
hydrocarbons
25 .m I hexane ,
J, 0.4 ml
NH2 cartridge
i \lt PAHs
3 ml extract
60 µI PTV Injection equivalent to 2. 7 mg sediment
Figure 4. Analytical schemes for the determination of PAHs in river sediment. Method I taken from ref. 29; Method 2, this work.
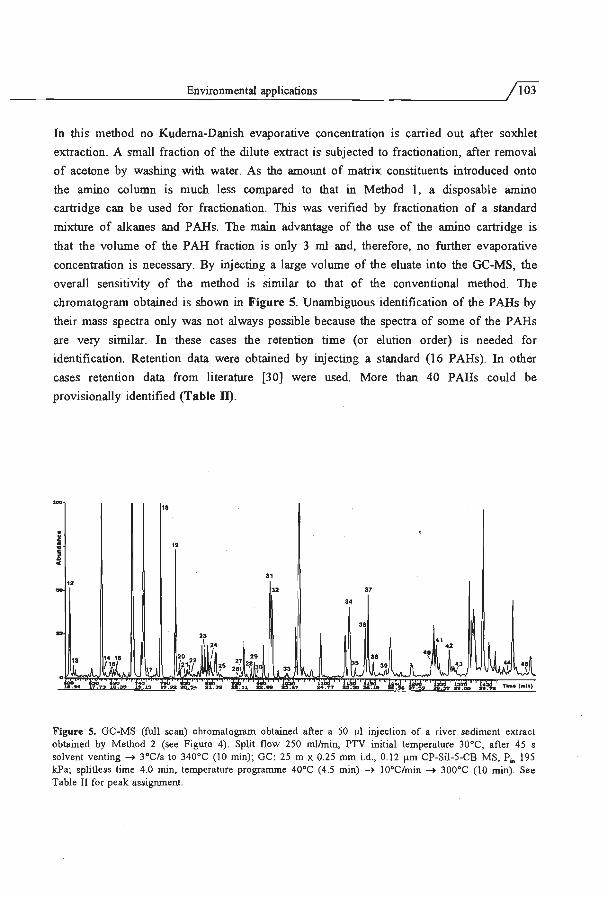
~~~~~~~~~~~~~~E_n_v_i_ro_n_m_e_n_tal~_ap_p_I_ic_a_ti_o_n_s~~~~~~~~~~~~~~-Jj'103
In this method no Kuderna-Danish evaporative concentration is carried out after soxhlet
extraction. A small fraction of the dilute extract is subjected to fractionation, after removal
of acetone by washing with water. As the amount of matrix constituents introduced onto
the amino column is much less compared to that in Method 1, a disposable amino
cartridge cari be used for fractionation . This was verified by fractionation of a standard
mixture of alkanes and PAHs. The main advantage of the use of the amino cartridge is
that the volume of the P AH fraction is only 3 ml and, therefore, no further evaporative
concentration is necessary. By injecting a large volume of the eluate into the GC-MS, the
overall sensitivity of the method is Similar to that of the conventional method. The
chromatogram obtained is shown in Figure 5. Unambiguous identification of the PAHs by
their mass spectra only was not always possible because the spectra of some of the P AHs
are very similar. In these cases the retention time (or elution order) is needed for
identification. Retention data were obtained by injecting a standard (16 PAHs). In other
cases retention data from literature [30] were used. More than 40 PAHs could be
provisionally identified (Table II) .
••
i .. c
31 t2
32 37
34
38
Figure S. GC-MS (full scan) chromatogram obtained after a 50 µI injection of a river sediment extract obtained by Method 2 (see Figure 4). Split flow 250 ml/min; PTV initial temperature 30°C, after 45 s solvent venting ~ 3°C/s to 340°C (IO min); GC: 25 m x 0.25 rtun i.d., 0.12 µm CP-Sil-5-CB MS, P., 195 kPa; splitless time 4.0 min, temperature programme 40°C (4.5 min) ~ 10°C/min ~ 300°C (10 min). See Table II for peak assignment.

104\ Large volume PTV injection
Table II. PAHs identified from a river sediment sample using PTV-GC-MS after treatment
according to Method 2.
Concentration
Peak No. t, (min) Mo I.wt. Name in sediment (µgig)
9.73 128 naphthalene 0.023
2 11.39 142 methylnaphthalene 3 12.89, 13.28 156 dimethylnaphthalene
4 13.36 152 acenaphthylene 0.003
5 13.76 154 acenaphthene 0.030
6 14.19 168 dibenzofuran 7 14.44 170 trimethy !naphthalene 8 14.96 166 fluorene 0.052
9 15.47 182 methy ldibenzofuran 10 16.57 180 9H-fluoren-9-one
II 16.79 184 dibenzothiophene
12 17.11 178 phenanthrene 0.63
13 17.20 178 anthracene 0.11 14 18.10 198 me thy ldibenzothiophene
15 18.32-18.54 192 methylphenanthrenes/methy lanthracenes
16 18.49 190 4H-cyclopenta[ d,e,f]phenanthrene 17 19.16 212 2,8-dimethyldibenzo[b,d]thiophene
18 19.93 202 fluoranthene 0.85
19 19.39 202 pyrene 0.60 20 19.47 204 1-pheny !naphthalene 21 19.50, 19.64, 19.78 218 benzo[?]naphtho[?]furans 22 19.86 220 trimethy lphenanthrene·
23 21.05, 21.27 216 benzo[?]fluorenes 24 21.41 234 retene 25 21.44, 21.70 216 methylpyrenes 26 22.33 230 dimethylpyrene 27 22.44 230 7H-benzo[ d,e ]anthracen-7-one 28 22.69 234 benzo(b ]naphtho[ 1,2-d)thiophene 29 22.78 226 benzo[g,h,i]fluoranthene 30 22.89 234 benzo[?]naphtho[?]thiophene 31 23 .27 228 benzo[ a] anthracene 0.38 32 23 .33 228 chrysene/tripheny lene 0.44 33 23 .79-24.36 242 methyl-228 34 25.70 252 benzo[x]fluoranthenes (x = b, j, and k) 0.68 35 25.89 252 benzo[a]fluoranthene 36 26.20 252 benzo[ e ]pyrene 0.27 37 26.32 252 benzo[a]pyrene 0.38 38 26.46 252 perylene 39 26.69-27.09 266 methyl-252 40 28.23 278 3 ,4-dihydrobenzo[g,h,i]pery Jene 41 28.41 276 indeno[ 1,2,3-c,d]pyrene 0.28 42 28.84 276 benzo[g,h,i]perylene 0.21 43 29.03 276 antanthrene 44 30.62 302 naphtho[ 1,2,3 ,4-d,e,f]chrysene 45 31.25 300 coronene

For quantitative analysis the MS was used in the time-scheduled SIM mode. For P AHs
more volatile than phenanthrene losses occurred during solvent elimination due to co
evaporation with the solvent. At the optimal vent time of 45 s the recoveries of
naphthalene, acenaphthylene, acenaphthene, and fluorene were 34%, 84%, 88% and 93%
respectively; the RSDs ranged from 12 to 5.2% (n = 3) for manual injections. For less
volatile PAHs the recoveries after solvent elimination were quantitative and the RSD
values better than 5%. To evaluate the linearity of the MS-SIM responses obtained after
large volume injection, extracts were spiked with naphthalene, bifluorene and
dibenz[a,h]anthracene. The regression coefficients (n = 9; concentration in the extract, 0.2-
50 ng/ml) were 0.9995, 0.9999 and 0.9996, respectively. This means that reliable
quantification is possible even for naphthalene. The detection limit was ca. 2 pg which
corresponds with 40 pg/ml in the extract and 0.75 ng/g in the sediment. The EPA priority
PAHs identified in the sediment sample were quantified using the external standard
method. The predominant PAHs (fluoranthene, phenanthrene, benz-fluoranthenes, pyrene)
were present in concentrations up to 0.85 µgig (Table II).
PTV-GC-ECD: organochlorine pesticides and PCBs in river water
The third application concerns the determination of organochlorine pesticides (OCPs)
and polychlorinated biphenyls (PCBs) in riverw,~ter. In routine methods for OCP/PCB
determination the analytes are typically extracted from 1 L of river water with 200 ml of
petroleum ether. The extract is concentrated to 1 ml by Kudema-Danish evaporation. Then
off-line clean-up is performed on an alumina column. The analytes are eluted with 5 ml of
petroleum ether which is concentrated to 1 ml. The extract is analysed by on-column
injection of 1.5 µl into the GC-ECD system. Our aim is to (i) replace the Kudema-Danish
evaporative concentration by large volume PTV injection and (ii) evaluate the possibility
of on-line clean-up.
OCPs like endrin and p,p'-DDT are sensitive to adsorption/thermal degradation in
packed liners. This aspect was evaluated by comparing the responses obtained after 2 µI
cold splitless injections (10 pg/µ!) using an empty liner with a glass frit and the Dexsil
packed liner. The empty liner with glass frit was used as a reference because in earlier
work little or no degradation was observed with such liners [23,25). Recoveries with the
packed insert were better than 75% for all OCPs which is acceptable regarding the small
amount of analyte introduced (20 pg of each pesticide).
With the PTV injector used here 100 µI of petroleum ether could be rapidly injected
without flooding the liner. The time needed for evaporation of the solvent was 30 s.
Figures 6A and B show chromatograms obtained after a 1 µI cold splitless injection and a
100 µI injection of a dilute standard, respectively.

A
B
c
D
E
§ 0 8 § 0 8 0 8 0 N ,.; ... "' '° ,..:
0
8 .,;
. + • = + =
0
8 .,;
0
~ ~
24
25
8 ll C! s :: :i
Figure 6. Comparison of different injection modes in large volwne PTV injection-GC-ECD. Sample: OCPs and PCBs in petroleum ether (peak nwnbers correspond with those in Table III). Injections: (A) cold splitless, I µI of 50 ng/rnl, (B) 'at-once': 100 µI of 0.5 ng/rnl, solvent vent time 30 s, (C) repetitive: 3 x 100 µI of 0.17 ng/ml, solvent vent time 30 s after each injection, (D) speed controlled: 300 µI of ca. 0.17 ng/ml at 200 µI/min, splitless transfer is started immediately after completion of sample introduction, (E) Speed controlled: 300 µI of ca. 0. 17 ng/ml at 300 µI/min, splitless transfer is started 30 s after completion of sample introduction. PTV initial temperature 40°C, after solvent elimination _... 12°C/s _... 300°C (till end of run); GC: 25 m x 0.31 mm i.d., 0.52 µm Ultra-I; Pin 80 kPa; split flow 250 inl/min; splitless time 1.5 min; temperature programme, 40°C (O min) _... 30°C/min _... 200°c (0 min) _... 15°C/min ..... 1290°C (I min).

Apart from some extra peaks (contamination in the sample) the chromatograms are almost
identical. No losses of. analytes occurred during solvent elimination, not even for the
relatively volatile hexachlorobutadiene. Actually, after venting for 45 s recoveries were
still quantitative and after 3 min only hexachlorobutadiene was partly lost.
If the Kudema-Danish evaporation is replaced by a 100 µ1 injection the overall
sensitivity of the method decreases. To obtain identical sensitivity at least 300 µl should
be introduced. As rapid injection of that volume would overload the liner with liquid, this
can only be done by applying other injection modes. There are two options: repetitive
injection and speed-controlled injection. In the repetitive injection mode three times 100 µl
were rapidly injected with intervals of 30 s (which is the solvent elimination time found
for a 100 µl injection of petroleum ether). The resulting chromatogram is shown in
Figure 6C. The amount of analyte introduced was 50 pg for each compound. At this low
level the sample is easily contaminated which, in this case, resulted in the appearance of
two large extra peaks in the chromatogram. Recoveries (relative to 1 µl cold splitless
injection, areas normalized to mirex) were found to range from 86% (hexachlorobutadiene)
to 133%. In practice repetitive injection is not always easy to perform because it is rather
difficult (manually as well as when using autosamplers) to fill the syringe and remo:ve air
bubbles within short times.
For speed-controlled injection the injection speed should, in principle, not exceed the
evaporation rate which is approx. 200 µI/min ( 100 µl evaporates in 3 0 s, Cf. above). The
chromatogram obtained after injection of 300 µl using an injection speed of 200 µI/min is
shown in Figure 6D. The recovery of the relatively volatile hexachlorobutadiene was
higher (101%) than with repetitive injection. Apparently solvent trapping of analytes in the
liner during injection/solvent venting is more efficient with speed-controlled injection than
with repetitive injection. The recoveries of the other analytes were between 94% and
127%.
As the liner can hold 100 µ1 of liquid sample, it is actually possible to inject at a
higher speed without flooding the liner. The amount of liquid left in the liner after
injection should of course be smaller than 100 µ1, i.e. for a 300 µl injection 200 µl have to
evaporate during injection. The maximum injection speed can now be calculated from:
(1)
where F max is the maximum allowable injection speed, V,amprc the sample volume, F, •• P the
evaporation rate of the solvent, and V1in•r the volume of liquid sample retained by the
packed liner. Calculation showed the maximum injection speed to be equal to 300 µI/min.
At this injection speed 100 µl of solvent are present in the liner after completion of
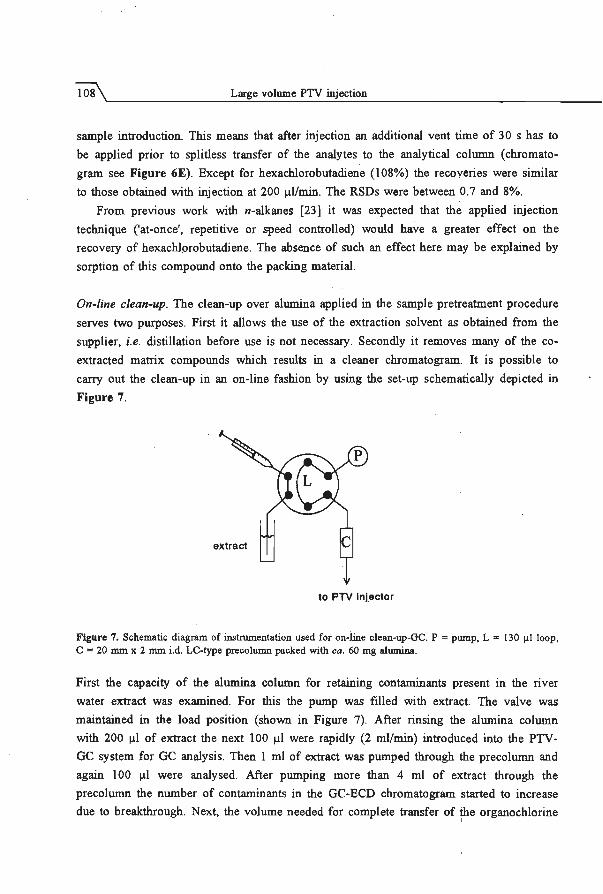
sample introduction. This means that after injection an additional vent time of 30 s has to
be applied prior to splitless transfer of the analytes to the analytical column (chromato
gram see Figure 6E). Except for hexachlorobutadiene (108%) the recoveries were similar
to those obtained with injection at 200 µI/min . The RSDs were between 0.7 and 8%.
From previous work with n-alkanes [23] it was expected that the applied injection
technique ('at-once', repetitive or speed controlled) would have a greater effect on the
recovery of hexachlorobutadiene. The absence of such an effect here may be explained by
sorption of this compound onto the packing material.
On-line clean-up. The clean-up over alumina applied in the sample pretreatment procedure
serves two purposes. First it allows the use of the extraction solvent as obtained from the
supplier, i.e. distillation before use is not necessary. Secondly it removes many of the co
extracted matrix compounds which results in a cleaner chromatogram. It is possible to
carry out the clean-up in an on-line fashion by using the set-up schematically depicted in
Figure 7.
to PTV lnj.ector
Figure 7. Schematic diagram of instrumentation used fot on-line clean-up-GC. P = pwnp, L = 130 µ!loop , C = 20 mm x 2 mm i.d. LC-type precolumn packed with ca. 60 mg alumina.
First the capacity of the alumina column for retaining contaminants present in the river
water extract was examined. For this the pump was filled with extract. The valve was
maintained in the load position (shown in Figure 7). After rinsing the alumina column
with 200 µl of extract the next 100 µl were rapidly (2 ml/min) introduced into the PTV
GC system for GC analysis. Then 1 ml of extract was pumped through the precolumn and
again 100 µl were analysed. After pumping more than 4 ml of extract through the
precolumn the number of contaminants in the GC-ECD <:hromatogram started to increase
due to breakthrough. Next, the volume needed for complete transfer of the organochlorine :

~~~~~~~~~~~~~~E_n_Vl_._ro_n_m_e_n_t_ru~ap~p~li_·c_a_n_·o_n_s~~~~~~~~~~~~~~--',!109
compounds from the loop via the alumina column into the PTV was determined. For this
the pump was filled with petroleum ether and the loop with an OCP standard solution. A
total of 400 µl (speed 200 µI/min) were needed for quantitative transfer (50 µl void
volume + 130 µl sample volume + 220 µl petroleum ether). This means that the alumina
column has to be exchanged after some ten runs.
A
••• .. ..
17
. 7 • to ..
Figure 8. GC-ECD chromatograms obtained after (A) 1 µl cold splitless injection of a 5 ng/ml standard, (B) 100 µl injection of a river water extract in petroleum ether before clean-up, (C) on-line clean-up-GC, sample: 130 µl of river water extract, total volume transferred to the PTV is 400 µl at 200 µl/min. (D) as (C) but extract spiked with 50 pg/ml of OCPs and PCBs; for peak identification, see Table III . Other conditions, see Figure 6.

Uo\ Large volume PTV injection
Table III. Analytical data on on-line clean-up-PTV-GC analysis of river water extracts
(Cf. Figure 8).
No. Name R .. > RSD (%)bl Loo•> pg/ml
hexachlorobutadiene d)
2 a.-hexachlorocyclohexane 0.9977 1.0 5
3 ~-hexachlorocyclohexane 0.9840 20 d)
4 hexachlorobenzene 0.9947 1.5 10
5 y-hexachlorocyclohexane 0.9986 7.5 5
6 PCB 28 0.9972 1.9 d)
7 heptachlor 0.9975 2.3 5
8 PCB 52 0.9971 4.2 25
9 aldrin 0.9990 6.6 10
10 heptachlor-epoxide 0.9980 3.1 10
ll o,p'-DDE 0.9996 4.6 15
12 PCB 101 0.9968 5.6 d)
13 a.-endosulfan 0.9992 3.2 10
14 p,p'-DDE 0.9993 5.3 10
15 dieldrin •) •) •)
16 o,p'-DDD •) •) •)
17 endrin 0.9981 5.8 d)
18 p,p'-DDD •) •) •)
19 o,p'-DDT •) •) •)
20 PCB ll8 15
21 PCB 153 0.9982 2.9 15
22 p,p'-DDT 0.9929 13 d)
23 PCB 138 0.9999 6.6 10
24 PCB 180 0.9977 7.7 10
25 m.irex 0.9998 5.4 15
•> R' = regression coefficient obtained after multipoint calibration (n=5); concentration in the extract: 50-500 pg/ml. bl RSD = relative standard deviation (n=3) for 200 pg/ml extracts. •) Estimated detection limit of OCP or PCB in the extract. d) data not available due to co-elution with matrix compound. •> data not available due to co-elution with other OCP or PCB.
Figure 8 illustrates the performance of the total analytical set-up inclusive of the on-line
clean-up, and applied to a spiked river water extract. The chromatogram of Figure 8A was
obtained after a 1 µl cold splitless injection of a S ng/ml standard. At this level
contaminants in the extract interfere with the .determination of many of the OCPs and
PCBs as can be seen from the chromatogram obtained after a 100 µl injection of the
extract before clean-up (Figure 8B). Chromatograms obtained after on-line clean-up-Ge of
a river water blank and a spiked extract (SO pg/ml) are shown in Figures 8C and 8D,
respectively. The clean-up clearly reduces the number of interfering matrix compounds

although some five peaks, originating from the petroleum ether, have increased due to the
larger volume injected. Despite the clean-up step interfering peaks from the matrix still
limit the sensitivity of the method for a number of OCPs and PCBs_ (e.g.
hexachlorobutadiene, ~-HCH, PCB IOI, endrin). At the low pg/ml level, more selectivity
is required for reliable quantification of all organochlorine compounds.
The linearity of the response obtained with the on-line clean-up-P1V-GC system was
evaluated by analysing extracts spiked at a concentration of 50-500 pg/ml. Regression
coefficients as well as RSD values are given in Table Ill. Taking into account the very
low concentration level, the analytical data can be considered to be satisfactory. The
detection limits depended on analyte response and matrix interference and typically were
in the low pg/ml region.
Conclusions
Large volume PTV mJection 1s a simple and rugged technique for large volume sample
introduction in capillary gas chromatography:' Optimization is straightforward and no
special instrumentation is required which enables the implementation of large volume
injection in routine laboratories. Maintenance cdnsists of periodical replacement of the
septum and the liner. The packed liner can be used for at least 70-100 large volume
injections. The technique is also applicable to more polar and volatile analytes and is
compatible with several commonly used detectors. However, with some of the polar
nitrogen/phosphorus pesticides calibration curves should be measured in a matrix similar to
the sample to obtain good accuracy.
Acknowledgment
The authors wish to thank Mrs. M. van der Kooi (KIW A) and Mr. Bijlsma/Mr. Hoofd
(WRK) for supplying the river water extracts and for stimulating discussions.
References
[l] K. Grob, "On-line Coupled LC-GC", Huthig, Heidelberg, 1991. [2] K. Grob, Anal. Chem. 66 (1994) 1009A. [3] J.J. Vreuls, R.T. Ghijsen, G.J. de Jong, U.A.Th. Brinkman, J. Chromatogr. 625 (1992) 237. [4] G.W. Kelly, K.D. Bartle, J. High Res. Chromatogr. 17 (1994) 390. [5] J. Blomberg, P.J. Schoerunakers, N. van den Hoed, J. High Res. Chromatogr. 17 (1994) 411. [6] A.J.H. Louter, U.A.Th. Brinkman, R.T. Ghijsen, J. Microcol. Sep. 5 (1993) 303. [7] E.C. Goosens, D. de Jong, G.J. de Jong, F.D. Rinkema, U.A.Th. Brinkman, J. High Res. Chromatogr.
18 (1995) 38. [8] Th.H.M. Noij, M.M.E. van der Kooi, in P. Sandra (ed.) "Proc. 16th lnternat. Symp. Capillary
Chromatogr.", Riva de! Garcia, Huthig, Heidelberg, 1994, p 1045. [9] P.L. Morabito, T. McCabe, J.F. Hiller, D. Zakett, J. High Res. Chromatogr. 16 (1993) 90. [IO] G.R. van der Hoff, R.A. Baumann, U.A.Th. Brinkman, P. van Zoonen, J. Chromatogr. 644 (1993) 367.

Large volume PTV injection
[11] F.D. Rinkema, A.J.H. Louter, U.A.Th. Brinkman, J. Chromatogr. 678 (1994) 289. [12] R. Tamilarasan, P.L. Morabito, L. Lamparski, P. Haielwood, A. Butt, J. High Res. Chromatogr. 17
(1994) 689. [13] A. Venema, J.T. Jelink, in P. Sandra (ed.) "Proc. 16th Intemat. Symp. Capillary Chromatogr.", Riva .del
Garda, Htlthig, Heidelberg, 1994, p 1035. [14] J.V. Hinshaw, LC-GC Intern. 12 (1994) 526. [15] R. Kubinec, P. Kuran, I. Ostrovsky, L. SojAk, J. Chromatogr. 653 (1993) 363. [ 16] K. Grob, Ch. Siegrist, J. High Res. Chromatogr. 17 (1994) 674 . [17] E. Strottmeister, H. Hermenau, P. Hendel, T. Welsch, W. Engewald, Fres. J. Ana:!. Chem. 340 (1991)
31. [18] M. Ceulemans, R. Lobinski, W.M.R. Dirkx, F.C. Adams, Fres. J. Anal. Chem. 347 (1993) 256. [19] M. Linkerh!igner, H.-J. Stan, G. Rimkus, J. High Res. Chromatogr. 17 (1994) 821. [20] J. Staniewski, J.A. Rijks, J. Chromatogr. 623 (1992) 105. [21] J. Staniewski, J.A. Rijks, J. High Res. Chromatogr. 16 (1993) 182. [22] F.J. Sell.orans, J. Tabera, J. Villen, M. Herraiz, G. Reglero, J. Chromatogr. 648 (1993) 407. [23] H.G.J. Mol, H.-G. Janssen, C.A. Cramers, U.A.Th. Brinkman, J. High Res. Chromatogr. 18 (1995) 19. [24] H.G.J. Mol, P.J.M. Hendriks, H.-G. Janssen, c.A. · Cramers, U.A.Th. Brinkman, J. High Res.
Chromatogr. 18 (1995) 124. [25] P.L. Wylie, K.J. Klein, M.Q. Thompson, B.W. Hermann, J. High Res. Chromatogr. 15 (1992) 763 . · · (26] H.-M. Mllller, H.-J. Stan, J. High Res. Chromatogr. 13 (1990) 759. [27) D.R. Emey, A.M. Gillespie, D.M. Gilvydis, C.F. Poole, J. Chromatogr. 638 (1993) 57. [28) D.R. Emey, C.F. Poole, J. High Res. Chromatogr. 16 (1993) 501. [29) R.E. Rebbert, S.N. Chesler, F.R. Guenther, B.J. Koster, R.M. Parris, M.M. Scli.antk, S.A. Wise, Fres. J.
· Anal. Chem. 342 (1992) 30. [30) L. Canton, J.O. Grimalt, J. Chromatogr. 607 (1992) 279.

3.4 The PTV injector as universal interface for large volume injection S)
Summary
113
The use of the programmed temperature vaporizing (PTV) injector as universal interface for large volume injection in capillary GC is proposed. By using a special on-column insert, in addition to large volume solvent split injection, also large volume on-column injection can be performed with the PTV injector. For this a construction consisting of a retention gap, a retaining precolumn and an early vapour exit is attached between the oncolumn insert and the analytical column. The performance of this set-up for large volume injection was evaluated and found to be similar to that of large volume injection using a conventional on-column injector. The technique is also compared with solvent split injection. A guideline is given for method development in large volume sample introduction in capillary GC.
Introduction
Recently, there has been an increased interest in the application of large volume injection
in capillary GC, not only for improvement of analyte detectability [1,2], but also for
simplification of sample pretreatment procedures [3-7] . Several techniques allowing the
introduction of large sample volumes (e .g. 100 µI) have been developed up to now. The
most important ones are fully concurrent solvent evaporation using a loop-type interface
[8,9], partially concurrent solvent evaporation using an on-column interface [8,1 O], and
solvent split injection using the programmed temperature vaporizing (PTV) injector [11 ~
13].
Essentially, for all techniques, the processes during and after the actual injection are
the same. First the solvent is vaporized, either in an uncoated deactivated precolumn
(retention gap), as in case of loop-type and on-column injection, or in the liner of the
injector, as in case of PTV injection. In general the solvent vapour is released from the
GC system via an exit located in front of the analytical column. This protects the detector
against large amounts , of solvent vapour and, simultaneously, accelerates the evaporation
process. With PTV injection the exit is the split exit of the injector. In case of on-column
and loop-type injection the exit, called early vapour exit, is positioned after the retention
gap and a retaining precolumn [14]. Volatile analytes can partially co-evaporate with the
'l Based on: J.C . Bosboom, H.-G. Janssen, H.G.J. Mo!, C.A. Cramers, submitted for publication

Large volume PTV injection
solvent. In order not to loose these compounds, and at the same time to transfer as small
an amount of solvent as possible to the analytical column and dete<:tor, careful
optimization of the time of 'solvent release system open' is necessary. The extent to which
volatile analytes are lost depends on the large volume injection technique applied. Losses
can be reduced or even prevented by solvent trapping. In other cases a higher boiling co
solvent can be added to the main solvent in order to reduce losses (15,16]. Additionally,
with PTV injection it is also possible to pack the liner with a selective adsorption material
[12,17].
Each large volume injection technique has . its advantages and disadvantages with
regard to the applicability to volatile and thermolabile analytes, ease of optimization,
operation, and ruggedness. The application of fully concurrent solvent evaporation using
the loop-type interface is restricted to compounds eluting at relatively high temperatures,
which stems from the fact that for this technique the injection temperl\tur~ should be above
the pressure corrected boiling point of the solvent. The application range . on the 'volatile
end' depends on the solvent, the oven temperature, and the length of the retention gap.
Typically, the method is not suited for analytes more volatile thart C17 [18].
Partially concurrent solvent evaporation using the on-column interface has the widest
application range of the three large volume injection techniques mentioned above, both in
terms of volatility and thermostability of the analytes. Injection is carried out in a speed
controlled manner and careful optimization is required for optimum performance with
regard to losses of volatiles and peak shapes. A disadvantage of the technique (or more in
general; of techniques involving the use of retention gaps) is that its performance can
rapidly deteriorate upon introduction of non-volatile material or traces of Water (19] .
The main advantage of large volume PTV injection is the ease of use. This is
especially true for sample volumes below 150 µI. For such volumes the sample can be
rapidly injected. For this, so-called, at-once injection optimization is very straightforward
and instrumentation is simple [13]. When the sample contains volatile analytes a more
careful optimization is· required (12,18] . In general, however, losses of volatile analytes are
less compared to those that occur when the loop-type interface is being used. Large
volume PTV injection is rugged and suited for the analysis of 'dirty' samples. For
thermolabile compounds the technique is less sU.ited due to possible degradation of the
compounds in the liner during splitless transfer to the analytical colum~. This is especially
true when relatively wide-bore liners packed with active materials, such as glass wool, are
used [13,17].
Obviously, the choice of the large volume injection technique to be used mainly
depends on the composition of the sample and the type of compounds to be determined.
The on-column interface is most suited for the determination of volatile i and/or thermally

~~~~~~~~~~~~~P_T_V~in~j_ec_to_r_as~un~iv_e_~_ru~in_re_n_a_c_e~~~~~~~~~~-',/115
unstable compounds. For other applications the use of the loop-type interface hardly offers
any advantages over the use of the PTV injector and, therefore, PTV solvent split injection
is the method of choice. This means that in order to cover all possible applications two
large volume injection techniques should be available in the laboratory. Up till now, two
GC systems, or at least two injectors, are necessary to change from one interface to the
other. It would be highly advantageous if both the on-column and the PTV approach could
be integrated into one injector. This offers maximum flexibility and also reduces
instrument costs for large volume sampling equipment.
In this chapter we describe the use of a special on-column insert for the PTV injector.
This allows us to perform both large volume on-column as well as solvent split injection
with one injection device. Only the liner has to be exchanged to switch from one approach
to the other. The performance of large volume on-column injection based on the PTV
injector with the on-column insert is compared with that of the standard on-column
interface. Emphasis is on the recovery of volatile n-alkanes and of compounds sensitive to
adsorption or thermal degradation. A comparison with large volume PTV injection in the
solvent split mode is also made.
Experimental
Instrumentation
The instrumental set-up for large volume injection using the on-column interface is
schematically depicted in Figure 1. Two different GC systems with FID detection were
used. The first gas chromatograph (model 8180, Carlo Erba, Milan, Italy) was equipped
with an on-column injector. In the second GC system (model 5890, Hewlett Packard,
Avondale, PA, USA) a PTV injector (Gerstel, M'ii.lheim aid Ruhr, Germany) equipped with
a special on-column insert (Gerstel) and a septumless head was installed. The same
(pre)columns were used with both GC instruments. One end of the retention gap (10 m x
0.53 mm i.d., polysiloxane deactivated, Chrompack, Bergen op Zoom, The Netherlands)
was attached to the injector. The other end was connected to a retaining precolumn (3 m x
0.32 mm i.d., 0.5 µm CP-Sil-5-CB) using a glass pressfit connection. Between the
retaining precolumn and the analytical column (22 m x 0.32 mm i.d., 0.5 µm CP-Sil-5-CB,
Chrompack) a vapour exit was installed via a glass Y-pressfit. During injection and
solvent elimination the exit is open. After closing the exit, by means of an on/off valve, a
small purge flow is obtained through a 30 cm x 50 µm i.d. fused silica capillary. This is
necessary to prevent back diffusion of solvent vapour from the exit line into the
chromatographic pathway. Helium was used as a carrier gas .at 140 kPa. Data collection
was done with an Omega integration system (Perkin Elmer, Norwalk, CT, USA).
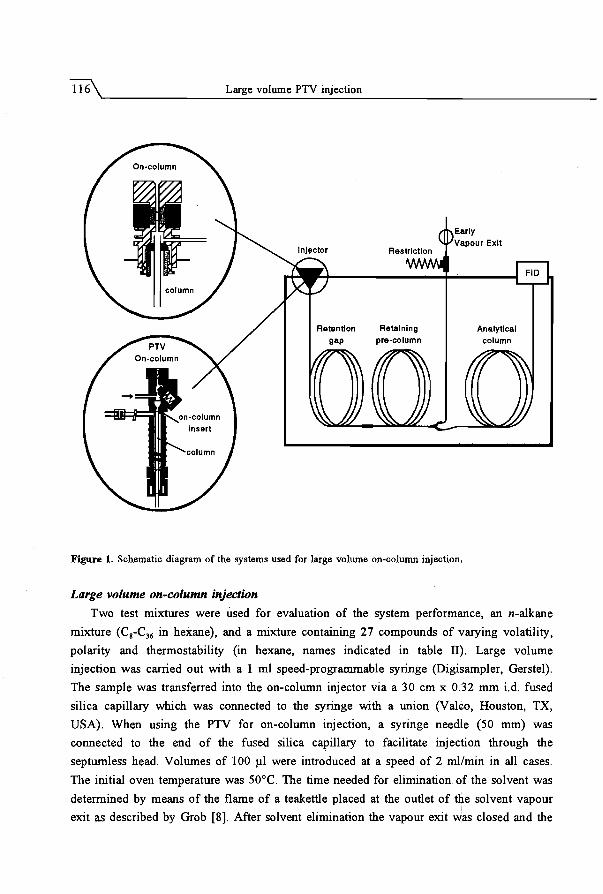
Figure l. Schematic diagram of the systems used for large volume on-colwnn injection,
Large volume on-column injection
Two test mixtures were used for evaluation of the system performance, an n-alkane
mixture (C8-C36 in hexane), and a mixture containing 27 compounds of varying volatility,
polarity and thermostability (in hexane, names indicated in table II). Large volume
injection was carried out with a I ml speed-programmable syringe (Digisampler, Gerstel).
The sample was transferred into the on-column injector via a 30 cm x 0.32 mm i.d. fused
silica capillary which was connected to the syringe with a union (Valeo, Houston, TX,
USA). When using the PTV for on-column injection, a syringe needle (50 mm) was
connected to the end of the fused silica capillary to facilitate injection through the
septurnless head. Volumes of 100 µl were introduced at a speed of 2 ml/min in all cases.
The initial oven temperature was 50°C. The time needed for elimination of the solvent was
determined by means of the flame of a teakettle placed at the outlet of the solvent vapour
exit as described by Grob [8]. After solvent elimination the vapour exit was closed and the

temperature programme was started. For separation of the n-alkane mixture the
temperature programme was: 50°C (0 min) -4 20°C/min -4 325°C (5 min). For analysis of
the other test mixture the programme was: 50°C (1 min) -4 15°C/min -4 290°C (5 min).
When applying PTV on-column injection the initial temperature of the injector was
identical to the initial GC oven temperature, and after solvent elimination the PTV was
heated to the final GC oven temperature at 2°C/s.
Results and discussion
In order to simplify optimization of large volume on-columri injection a relatively long
wide-bore retention gap was used at a temperature below the solvent boiling point. With
hexane as the solvent, and at the conditions described above, the rapid introduction of 100
µl (in 3 sec) did not lead to flooding of the retaining precolumn. Consequently, there is no
need for optimization of the introduction rate. Although the sample can also be manually
injected, the construction with the speed-programmable syringe was used instead for
practical reasons, i.e. the needle of the 100 µl syringe to be used for manual injection was
too thick to fit into the 0.53 mm i.d. retention gap. With volumes of 100 µl or smaller the
only parameter to optimize is the solvent elimination time, i.e. the time after which the
early vapour exit should be closed and the GC run started. The release of solvent vapour
from the vapour exit was monitored by means of the flame of a teakettle [8], 2.7 min were
needed for complete elimination of the solvent. After this time, octane is almost
completely vented with the solvent. Closing the exit a few seconds earlier results in a
recovery for octane of above 80%, i.e. for this compound the moment of closing the exit
is very critical. Decane is still quantitatively retained in the retention gap and/or retaining
precolumn up to 10-15 sec after solvent elimination has reached completion. As was to be
expected, the results obtained with the conventional on-column injector and the PTV on
column injector were very similar.
In Table I recoveries obtained after 100 µl on-column injections of n-alkane mixtures
in hexane are compared with those obtained afte~ PTV solvent split injection. With the
latter technique, two injection modes are distinguished, at-once injection and speed
controlled injection [13]. With speed-controlled injection losses of volatile alkanes are
most severe, despite the use of sub-ambient initial PTV temperatures. For the at-once
injection recoveries resembled those obtained for on-column injection. However, the vent
time is rather critical. When venting ca. 10 s longer than the optimum vent time,
recoveries similar to those of speed-controlled injection are obtained. Venting ca. 10 s
shorter leads to peak distortion of compounds of intermediate volatility due to excessive
recondensation of solvent vapour in the column inlet [13]. With both on-column

approaches, almost quantitative recovery is easily obtained for all compounds except
octane. A disadvantage of the on-column approach is that the system is not very rugged.
The five pressfit connections were found to be a potential source of error as leakage was
sometimes observed. Leakage affects the back pressure in the precolurnns and thus the
solvent evaporation time. The same problem is encountered when a part of the system, e.g.
the retention gap, (parts of the) early vapour exit, or even a pressfit, is replaced. In
practice this means that each time the retention gap is replaced the sy~tem performance
should be checked and, if necessary, the optimization procedure be rep~ated. In contrast,
the set-up used for PTV solvent split injection involves only one conn~ction, that of the
analytical column to the injector. For maintenance the liner is very easy to replace and in
general there is no need for repeating the optimization procedure.
Table I. Recoveries obtained after 100 µl injections of n-alkane mixture:; in hexane using different large volume injection techniques.
Large volume injection On-colwnn PTV PTV solvent split-> technique on-column speed contr. at-once
PTV liner i.d. (mm) b) 1.2 3.4
PTV temperature (0 C) 50 -30 0
Vent time (min) 2.65 2.55 •) 2.5
Oven temperature (°C) 50 50 40 40
Compound Recdl Recdl Rec Rec
Octane 85 81 0 87 Nonane 11 97 Decane 96 97 15 97 Undecane 25 98 Dode cane 98 101 47 99 Tridecane 76 99 Tetradecane 100 100 93 103 Pentadecane 98 101 Hexadecane 100 IOI 97 101 Heptadecane 97 102 Octa de cane 98 101 102 100 Nonadecane 100 102 Eicosane 101 103 IOI 103 Do co sane 101 102 Tetracosane 100 103 Octa co sane 105 109 Dotriacontane 98 107 Hexatriacontane 97 106
->data from ref [13]. bl special on-column insert. •>speed-controlled injection: 25 µI/min, additional vent time after injection: 45 sec. dJ Recovery in % relative to I µI on-column injection, areas are rtormalized to C14•

PTV injector as universal interface fi19
Table II. Comparison of performance of several large volume injection techniques.
Large volume injection technigue
PTV solvent split" On-column PTV on-column
Packing Dexsil Tenax
Sample volume (µI) 60 100 100 100
Concentration (ng/ml) 80-160 50-100 50-100 50-100
PTV temperature (°C) 0 30 50 50
Vent time (min) 2.0 0.7 2.65 2.55
Compound rec•> rsd'> rec rsd rec rsd rec rsd
Octanol 108 6.4 116 2.5 99 4.6 95 4.6
Naphthalene 85 II 98 0.1 103 2.0 89 2.0
Benzothiazole 90 2.1 103 0.6 102 1.9 95 1.9
Indole 90 2.6 99 0.2 93 2.1 98 2.1
Nicotine 84 1.8 80 1.4 86 5.8 98 11
p-Dinitrobenzene 56 2.3 65 0.7 80 1.2 104 7.8
Pentadecane 93 2.4 100 d) 100 d) 100 d)
Diethylphthalate 97 1.0 105 0.5 98 2.3 94 7.0
T riflura !in 92 1.1 91 0.4
•>94 2.3 ·>86 5.9
Dimethoate 91 2.5 76 1.3
Atrazine 92 0.9 97 1.6 90 3.1 78 2.1
Diazinone 98 0.7 101 0.5
•>98 1.5 •>94 7.4
Caffeine 98 1.2 99 0 .8
Parathion-methyl 91 1.4 82 1.0 93 2.7 92 12.1
Fenitrothion 92 0.8 93 3.1 99 3.1 87 5.7
Cyanazine 87 3.2 67 1.6 112 4.3 98 6.8
Vamidothion 34 14 34 2.3 65 3.5 71 16.9
Dieldrin 100 d) 98 1.5 101 2.4 88 8.9
Endrin 94 1.6 62 3.8 100 2.6 87 7.6
p,p'-DDT 82 2.9 7 8.4 104 4.3 88 6.0
Methoxychlor 83 3.9 6 7.5 104 3.8 87 7.7
Azinphos-methyl 70 3.5 7 8.6 98 3.8 82 8.6
Mirex 100 0 .8 35 7.7
»103 3.5 •)85 7.4
Azinphos-ethy 1 92 1.8 11 7.1
Coumaphos 92 2.1 11 II 95 3.4 85 7.9
Octacosane 100 1.2 99 2.0
•>104 5.1 •>97 8.1
Perylene 93 2.2 6
•>data from ref. [17]. •>recovery(%) relative to 1 µl on-column injection (without ret. gap/vapour exit). •>relative standard deviation(%), n=3. dl used as internal standard. •>average of sum of two co-eluting peaks.

Application to polarlthermolabile analytes
An important advantage of the use of on-column techniques over the use of the PTV
solvent split technique for large volume injection is that with on-column injection the
analytes are vaporized in an, ideally, very inert environment: a well deactivated retention
gap. This minimizes possible degradation of thermolabile analytes. When using PTV
injectors the thermal stress applied to the analytes is higher due to rapid heating of the
injector. Moreover, the inertness of the packed liner is often insufficient. This puts
limitations on the application to thermolabile analytes. In a previous study [l 7] the
inertness of several packing materials was evaluated. This was done using a test mixture
containing 27 compounds varying widely in volatility, polarity and thermo stability. In
Table II the results obtained in that work with the most inert materials, are compared with
those obtained after large volume on-column injection of the same test mixture using the
current set-ups. With both on-column techniques the recoveries of 'troublesome' analytes
like p-dinitrobenzene, dimethoate, vamidothion, and azinphos-methyl are clearly better
than with the PTV technique using packed inserts, although for vamidothion some
degradation in the retention gap is also observed. The average recovery is above 90%.
With PTV solvent split injection using the Dexsil packed liner the av¢rage recovery is
only slightly lower. However, the vent time is critical for the first five el~ting compounds.
Without sub-ambient cooling losses due to evaporation may occur for thb analytes eluting
earlier than dimethoate if the solvent is completely vented. Using the T~nax packed liner
the volatile compounds are easily retained, even at 30°C, but analytes :Jess volatile than
dieldrin can not be desorbed within 2.5 min (C28 being an exception).
Conclusions
In large volume injection in capillary GC two techniques are of main interest: on-column
injection and PTV solvent split injection. A large overlap exists between the application
areas of the two techniques. As PTV solvent split injection is more rugged and user
friendly, method development in large volume injection should ideally start with PTV
solvent split injection. If this approach is not successful, e.g. in case of very volatile or
labile analytes, then one has to resort to on-column techniques. If this proofs to be
necessary the PTV injector can easily be transformed into an on-column injector by using
a special on-column insert. With this set-up similar results can be achieved as with the
standard on-column interface. The integration of the two approaches into one injection
device offers great flexibility in method development and also reduces in~trument costs.

References [!) F.D. Rinkema, A.J.H. Louter, U.A.Th. Brinkman, J. Chromatogr. 678 (!994) 289.
[2) M. Linkerhllgner, H.-J. Stan, G. Rimkus, J. High Res. Chromatogr. 17 (1994) 821.
[3) G.R. van der Hoff, R.A. Baumann, U.A.Th. Brinkman, P. van Zoonen, J. Chromatogr. 644 (1993) 367:
[4) P.L. Morabito, T. McCabe, J.F. Hiller, D. Zakett, J. High Res. Chromatogr. 16 (1993) 90.
[5) R. Tamilarasan, P.L. Morabito, L. Lamparski, P. Hazelwood, A. Butt, J. High Res. Chromatogr. 17
(1994) 689.
[6) A. Venema, J.T. Jelink, in P. Sandra (ed.) "Proc. 16th Internal. Symp. Capillary Chromatogr.", Riva
de! Garda, Huthig, Heidelberg, 1994, pp 1035.
[7] H.G.J. Mo!, H.-G. Janssen, C.A. Cramers, U.A.Th. Brinkman, submitted for publication.
[8) K. Grob, •on-line Coupled LC-GC", HUth.ig, Heidelberg, 1991.
[9] K. Grob, J.-M. Stoll, J. High Res. Chromatogr. & Chromatogr. Commun. 9 (1986) 518.
[10) F. Munari, A. Trisciani, G. Mapelli, S. Trestianu, K. Grob, J.M. Collin, J. High Res. Chromatogr. &
Chromatogr. Commun. 8 (1985) 60 I.
[II) W. Vogt, K. Jacob, H.W. Obwexer, J. Chromatogr. 174 (1979) 197.
[12) J. Staniewski, J.A. Rijks, J. High Res. Chromatogr. 16 (1993) 182.
[13] H.G.J. Mo!, H.-G. Janssen, C.A. Cramers, U.A.Th. Brinkman, J. High Res. Chromatogr. 18 (1995) 19.
[14] K. Grob, H.-G. Schrnarr and A. Mosandl, J. High Res. Chrornatogr., 12 (1989) 375.
[15] K. Grob, E. Millier, J. High Res. Chromatogr. & Chromatogr. Commun. II (1988) 388.
[16] M. Termonia, B. Lacomblez, F. Munari, J. High Res. Chromatogr. & Chromatogr. Commun. II (1988)
890.
[17] H.G.J. Mo!, P.J.M. Hendriks, H.-G. Janssen, C.A. Cramers, U.A.Th. Brinkman, J. High Res.
Chromatogr. 18 (1995) 124.
[18] J.J. Vreuls, H.G.J. Mol, J. Jagesar, R. Swen, R.E. Hessels, U.A.Th. Brinkman, in P. Sandra (ed.)
"Proc. 16th Internal. Symp. Capillary Chromatogr.•, Riva de! Garda, Htlthig, Heidelberg, 1994, p
1181.
[19] J.J. Vreuls, R.T. Ghijsen, G.J. de Jong, U.A.Th. Brinkman, J. Chromatogr. 625 (1992) 237.

Water analysis
by sorption/thermal desorption
in the PTV injector

4 Water analysis by sorption/thermal desorption
in the PTV injector6>
Summary
125
A system is described that allows the introduction of large volumes of water samples in capillary GC. Water elimination is carried out in the solvent split mode in a PTV injector with a packed liner. Two ways of separating water and analytes, i.e. evaporative and nonevaporative (solid-phase extraction), are compared. Sampling in the solid-phase extraction mode is favourable both in terms of recovery as well as with regard to sampling time. Quantitative recovery is obtained for priority· · pollutants ranging in volatility from dimethylphenol to phenanthrene. Losses occur for more volatile compounds, but even for these compounds the repeatability of the recoveries remained acceptable. With the system described here water samples up to at least 1 ml of water can be directly analysed. The detection limits are in the sub ng/ml range.
Introduction
The possibilities for direct introduction of large volumes of aqueous samples, being either
reversed-phase LC-fractions or water samples, into capillary GC are limited. In most cases
direct injection of large volumes of aqueous solvents is incompatible with retention gap
techniques due to the physical and chemical· properties of water (I]. For that reason a
phase-switching, i.e. an on-line transfer of the analytes from the aqueous phase to an
organic phase, prior to transfer to the Ge-system is often necessary (2,3].
An alternative approach is elimination of the water in a temperature programmable
injector (PTV injector). The use of PTV-injectors for direct introduction of aqueous
solvents proceeds from early work on sorption-thermal desorption of water samples.
Pankow et al. (4] described the off-line sampling of water through a Tenax tube. After
water removal the adsorbed analytes were thermally desorbed and introduced into the GC
system. Schomburg et al. (5] demonstrated a slightly different approach. Here, water was
separated on-line using a pre-column packed with Tehax in a dual oven system. Both
approaches can also be carried out in a PTV injector, the Tenax tube being the packed .
liner of the injector. Two preliminary attempts to realize such a set-up were made only
recently. VreuJs et al. [6] used Tenax and C8- and C18-modified silica as packing materials.
6J H.G.J. Mo!, H.-G.M. Janssen, C.A. Cramers, U.A.Th. Brinkman, J. High Res. Chromatogr. 16 (1 993) 459-463.
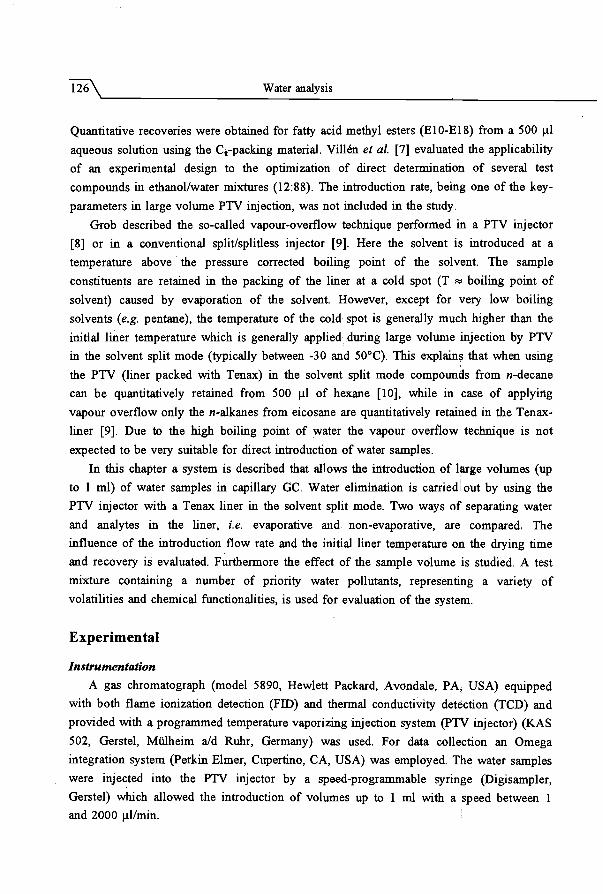
Water analysis
Quantitative recoveries were obtained for fatty acid methyl esters (ElO-El 8) from a 500 µl
aqueous solution using the C8-packing material. Villen et al. [7] evaluated the applicability
of an experimental design to the optimization of direct determination of several test
compounds in ethanol/water mixtures (12:88). The introduction rate, being one of the key
parameters in large volume PTV injection, was not included in the study.
Grob described the so-called vapour-overflow technique performed in a PTV injector
[8] or in a conventional split/splitless injector [9]. Here the solvent is introduced at a
temperature above the pressure corrected boiling point of the solv:ent. The sample
constituents are retained in the packing of the liner at a cold spot (T ~ boiling point of
solvent) caused by evaporation of the solvent. However, except for very low boiling
solvents (e.g. pentane), the temperature of the cold spot is generally much higher than the
initial liner temperature which is generally applied during large volume injection by PTV
in the solvent split mode (typically between -30 and 50°C). This explain~ that when using
the PTV (liner packed with Tenax) in the solvent . split mode compounds from n-decane
can be quantitatively retained from 500 µl of hexane [10], while in case of applying
vapour overflow only the n-alkanes from eicosane are quantitatively retained in the Tenax
liner [9]. Due to the high boiling point of water the vapour overflow technique is not
expected to be very suitable for direct introduction of water samples.
In this chapter a system is described that allows the introduction of l11rge volumes (up
to l ml) of water samples in capillary Ge. Water elimination is carried!out by using the
PTV injector with a Tenax liner in the solvent split mode. Two ways of separating water
and analytes in the liner, i.e. evaporative and non-evaporative, are compared. The
influence of the introduction flow rate and the initial liner temperature on the drying time
and recovery is evaluated. Furthermore the effect of the sample volume is studied. A test
mixture containing a number of priority water pollutants, representing a variety of
volatilities and chemical functionalities, is used for evaluation of the system.
Experimental
Instrumentation
A gas chromatograph (model 5890, Hewlett Packard, Avondale, PA, USA) equipped
with both flame ionization detection (FID) and thermal conductivity detection (TCD) and
provided with a programmed temperature vaporizing injection system (PTV injector) (KAS
502, Gerstel, MU.lheim aid Ruhr, Germany) was used. For data collection an Omega
integration system (Perkin Elmer, Cupertino, CA, USA) was employed. The water samples
were injected into the PTV injector by a speed-programmable syringe (Digisampler,
Gerstel) which allowed the introduction of volumes up to 1 ml with a speed between I and 2000 µl/min.

~~~~~~~~~~~S_o~rp~n-·o_nl_t_h_erm~a_l_d_e~so_rp~t_io_n~in_t_h_e_P_T_V~in~je_c_to_r~~~~~~~___j~
Preparation of Tenax liner
The liner (92 mm x 1.3 mm i.d.) was packed with ca. 16 mg of Tenax TA (mesh size
35-60, Chrompack, Bergen op Zoom, the Netherlands) between two plugs of glass wool to
keep it in place. The length of the Tenax bed was approximately 5 cm. A dent was made
in the liner, 2 cm from the bottom side, to reduce the amount of glass wool needed to
prevent the Tenax from being blown out of the liner. For clean-up the liner was heated to
280°C for 48 hours, Durin~ this a helium flow of 10 ml/min was applied. After this the
liner was placed in the PTV injector, purged with helium for 15 min and then heated to
310°C for 10 min. After this pretreatment excellent blanks are obtained up to temperatures
of 300°C. Acceptable blanks were obtained up to 325°C.
Operating conditions
The system is schematically depicted in Figure 1 in the configuration during water
introduction/elimination. During water sampling the back pressure regulator is by-passed
via valve V2 in order to obtain a lower inlet pressure. This enhances evaporation of the
solvent The water is pushed through the liner by the helium purge flow (adjusted to 600
ml/min). To prevent water from entering the GC column, the column was cut some 75 cm
from the injector and an additional helium flow was applied (30 ml/min) via a T-piece
(graph pack connections, Gerstel).
He co, He
V1 V2 V3
Figure I. Schematic diagram of PTV-GC system used for direct large volume water introduction. FC =flow controller, BPR = back pressure regulator, RV = reducing valve, Vl-V4 = valves, TCD = thermal conductivity detector, FID = flame ionisation detector, CT = cold trap.
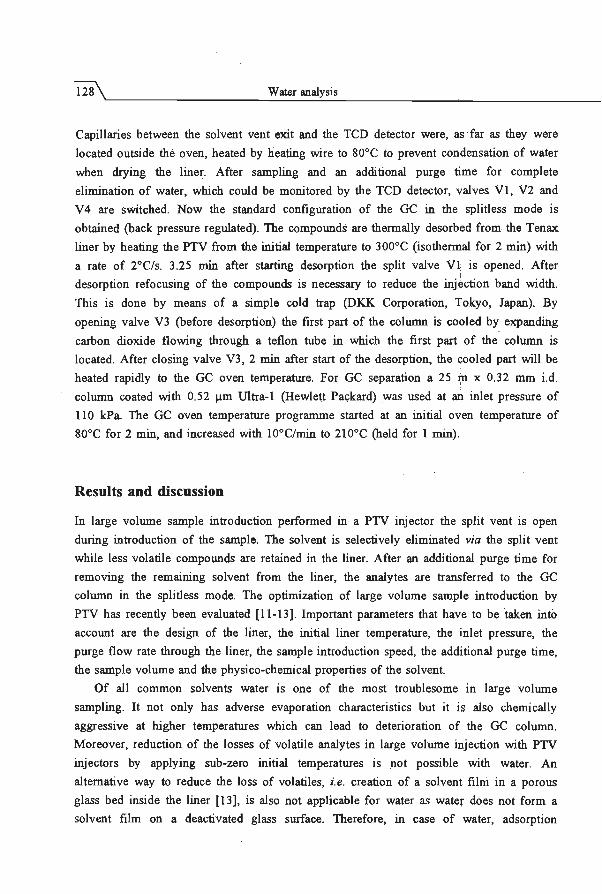
Water analysis
Capillaries between the solvent vent exit and the TCD detector were, as far as they were
located outside the oven, heated by heating wire to 80°C to prevent condensation of water
when drying the liner. After sampling and an additional purge time for complete
elimination of water, which could be monitored by the TCD detector, valves Vl, V2 and
V4 are switched. Now the standard configuration of the GC in the splitless mode is
obtained (back pressure regulated). The compounds are thermally desorbed from the Tenax
liner by heating the PTV from the initial temperature to 300°C (isothermal for 2 min) with
a rate of 2°C/s. 3.25 min after starting desorption the split valve V~ is opened. After I
desorption refocusing of the compounds is necessary to reduce the injection band width.
This is done by means of a simple cold trap (DKK Corporation, Tokyo, Japan). By
opening valve V3 (before desorption) the first part of the column is cooled by expanding
carbon dioxide flowing through a teflon tube in which the first part of the column is
located. After closing valve V3, 2 min after start of the desorption, the cooled part will be
heated rapidly to the GC oven temperature. For GC separation a 25 ¢ x 0.32 mm i.d.
column coated with 0.52 µm IBtra-1 (Hewlett Packard) was used at an inlet pressure of
110 kPa. The GC oven temperature programme started at an initial oven temperature of
80°C for 2 min, and increased with l0°C/min to 210°C (held for I min).
Results and discussion
In large volume sample introduction performed in a PTV injector the split vent is open
during introduction of the sample. The solvent is selectively eliminated via the split vent
while less volatile compounds are retained in the liner. After an additional purge time for
removing the remaining solvent from the liner, the analytes are transferred to the GC
column in the splitless mode. The optimization of large volume sample introduction by
PTV has recently been evaluated [11-13]. Important parameters that have to be taken info
account are the design of the liner, the initial liner temperature, the inlet pressure, the
purge flow rate through the liner, the sample introduction speed, the additional purge time,
the sample volume and the physico-chemical properties of the solvent.
Of all common solvents water is one of the most troublesome ' in large volume
sampling. It not only has adverse evaporation characteristics but it is also chemically
aggressive at higher temperatures which can lead to deterioration of the GC column.
Moreover, reduction of the losses of volatile analytes in large volume injection with PTV
injectors by applying sub-zero initial temperatures is not possible with water. An
alternative way to reduce the loss of volatiles, i.e. creation of a solvent filni in a porous
glass bed inside the liner [13), is also not applicable for water as water does not form a
solvent film on a deactivated glass surface. Therefore, in case of water, adsorption

~~~~~~~~~~~S_o~rp~n-·o_nl_th~erm~ru~d_e_so_rp~n-·o_n~in_th~e_P_T_V~in~je_c_to_r~~~~~~~---';'129
materials have to be used in order to prevent losses of the more volatile compounds. It is
now, however, inherent to the use of adsorption materials that there will be a restriction in
the applicability of the system for high boiling compounds because of the thermal
desorption step included in the procedure.
For large volume injection with the PTV injector, in general, the sample introduction
rate should not exceed the evaporation rate of the solvent. Too high introduction flow rates
will lead to flooding of the liner which means that part of the solvent will be eliminated
through the split vent as a liquid (containing sample compounds). This is the situation for
sampling of organic solvents. If the solvent is water, solutes can be retained even when
flooding of the liner occurs because from water many compounds will adsorb onto the
packing material.
As already mentioned before there are in prin9jple two ways to separate water from
the analytes in the liner: evaporative and non-evaporative. The packed liner is acting as a
GC-precolurnn or as a solid-phase extraction (SPE) cartridge, respectively. For evaporative
sample introduction the sampling rate should not exceed the evaporation rate of the
solvent, i.e. the water. From eqn. 1 the maximum speed of sample introduction can be
calculated assuming isothermal evaporation conditions and assuming that the gas leaving
the liner is saturated with solvent vapour (12].
~ = Fsp11t. ~ = Fsp11t. : In
(1 a)
where F,plit is the split flow (mol/m.in), xj is the mole fraction of solvent vapour in the
purge gas (at the PTV temperature) leaving the injector, Fj and pj are the evaporation rate
(mol/min) and the vapour pressure of the solvent, respectively, and Pin is the inlet pressure.
Expressing the evaporation rate and the split flow in ml/min the evaporation rate is given
by:
(1 b)
where M and p are the molecular weight and the density of the solvent, respectively, F',piit
the total gas flow rate at outlet co.nditions (T0 and P0) and R the gas constant. In Figure 2
the influence of the liner temperature on the evaporation rate of water is illustrated for
three different purge flow rates. The pressure drop over the Tenax liner increases with the
helium purge flow and the initial liner temperature and varies from 15 kPa to 96 kPa (for
100 ml/min, 10°C and 600 ml/min, 70°C, respectively). As can be seen from Figure 2,

increasing the helium purge flow leads (although partly offset by the increase of the inlet
pressure) to a considerable increase of the evaporation rate. From large volume injections
with hexane as the solvent it was seen that increasing the helium purge flow caused some
decrease in the recovery of more volatile compounds [1 O]. However, in order to minimize
sample introduction times and, in case of sampling in the SPE-mode the time required for
drying, a high purge flow of 600 ml/min was used throughout this study.
70 600 mlfmln
'2 60 ! 1 50
CD
~ 40 250 mlfmln c: .2 30 (ii 0 20 c.. 100 mlfmln as > CD 10
0 10 20 30 40 50 60 70
liner temperature (°C)
Figure 2. Evaporation rate of water as a function of liner temperature and purge flow rate.
From Figure 2 it is clear that introduction flow rates in the evaporative sampling mode are
low, e.g. about 10 µI/min at 30°C, leading to long sampling times. More rapid sampling
can be performed at higher introduction temperatures but then the aJiplicability of the
technique will be restricted to higher boiling compounds. Moreover.I in practice, the
evaporation rates will be lower than plotted in Figure 2 due to cooling of the liner by the
evaporation process.
When separating water and analytes in the SPE-mode much higher introduction flow
rates can be applied. Here, the maximum sampling speed is determined by the
experimental set up, the efficiency of the packed bed, the counter current flow from the
column to the liner (required to prevent water from entering the G<:: column during
injection) and the sample volume. In the configuration depicted in Figure 1 a counter
current flow of 30 ml/min allowed injection speeds up to at least 250 µI/min for 500 µI
samples. Lower counter current flows resulted in . the introduction of a small amount of
water into the GC column, as could be seen from a small disturbance of the FID signal
during introduction (the water contained 0.5-1% of methanol).

~~~~~~~~~~~-S_o~rp~n-· o_nl_t_h_erm~_w_d_e_s_o~rp~u-·o_n_i_n_th~e_P_T_V~in~j_ect~o_r~~~~~~~___,;1131
The effect of the sample introduction flow rate on the recovery was determined at 30°C
and 50°C for 250 µl samples. At very low flow rates water will evaporate in the top of the
liner and volatile analytes have to be trapped from the gas phase. At high flow rates water
will be pushed through the liner as a plug of liquid followed by elimination of the
remaining water by evaporation. At intermediate flow rates part of the water will evaporate
during introduction whereas the remainder will be pushed through the packing as a liquid,
probably in the form of droplets rather than as a continuous plug of liquid. More or less
'concurrent solvent evaporation' like-conditions occur at 50°C and an introduction speed of
10 µI/min . As can be seen from Figure 3,, this results in lower recoveries for the most
volatile compounds compared to sampling at higher flow rates. These low recoveries seem
to be mainly due to the long overall introduction time compared to sampling in the SPE
mode. For compounds with higher boiling points (e.g. dimethylphenol, b.p. = 203°C) the
introduction flow rate does not affect the recovery. An exception in this respect is atrazine.
For this compound the recovery decreased with increasing introduction flow rate.
Apparently, the affinity of atrazine for Tenax is limited when sampling in the SPE-mode.
Partial evaporation of the water during introduction improves the recovery of this
compound. When using evaporative sampling the recovery is quantitative as atrazine is
relatively non-volatile.
100 •;);,;,;.:,:ii .... . ·~ ·- ··i--"7"--=--~---=-=-~-dl_m_ethylphenol " .. .. .. --------~
~ 75 -,?, ~+-+--, 0
~ f "-__o Cl)
> 50 0 0
~
" ... ,, . .. ~I~'!
dlchlorobenzene " · " . ~
phenanthrene
methoxybenzene
0 25 /-6- 6 ~~~~~et~hy~lb~e=n=ze=n-e~6
6 0
0 50 100 150 200 250
introduction speed (µI/min)
Figure 3. Recovery vs. introduction speed of 250 µI water samples. PTV temperature: 50°C.
After introduction of the water sample the liner has to be purged with helium for an
additional time in order to obtain complete elimination of water before transfer of the
compounds to the GC column in the splitless mode. The drying of the liner was monitored

by splitting part of the purge flow from the solvent vent exit to a TCD detector. The
splitless transfer was started at the moment the TCD signal was back on its initial
background value. Monitoring the water elimination is very important ~ the drying times
were found to show rather strong fluctuations. This is most likely due to rearrangement of
the packing which is repetitively flooded with water and dried. Drying times for a
completely flooded liner were as follows: 10°C = 9-18 min; 30°C = 6-8.5 min; 50°C = 3.5-5 min. Incidentally drying times were much longer. This is probably due to channel
formation in the packing. In Table I average drying times for differen~ introduction flow
rates and temperatures are shown.
Table I. Additional purge time for complete elimination of water after sampling of 250 µI water.
Introduction flow rate (µI/min)
10 25 50
100 250
' Additional purge time (mirt)
3o•c
3 8 7.5 7.1 7.1
i 5o•c:
1.75 2.25 3.25 4.3 4.3
I
The effect of the initial liner temperature on the recovery and repeatability is shown in
Table II for sampling in the SPE-mode. Volatile compounds are best retained on the
Tenax liner at 10°C, although the differences with trapping at 30°C are not large. This is
possibly due to the longer drying times needed at 10°C. Quantitative trapping for most
compounds with boiling points higher than approximately 200°Ci is obtained at I
temperatures of 50°C or lower. It should be emphasized, however, that retention of the
compounds on Tenax is, of course, also affected by their chemic!tl structure. The
repeatability (relative standard deviation, RSD) is acceptable (trifluralin being an
exception), even for the volatile compounds which are not retained quantitatively.
To study the effect of the sample volume on the recovery sample sizes ranging from
25 to 1000 µI were introduced at a temperature of 3 0°C and an injection rate of 100
µI/min . The recoveries of the most volatile compounds (No. 1 to 4 in TJ.hle II) decreased
about 7% for a 1 ml injection compared to .the 250 µI injection. Also atrazine showed
higher losses for increased sample volumes which confirms the assumption that this
compound is poorly retained on Tenax from water. For atrazine the recoveries for sample
volumes of 25, 250 and 1000 µI were 88, 74 and 62% respectivelr. For the other
compounds trapping efficiencies of approximately 100% were obtained v~lumes of up to 1
ml. As an illustration a chromatogram obtained after a I ml injection of the test mixture at

~~~~~~~~~~~-S_o~rp~u_·o_n/~th_erm~_&_d_e_s_o~rp~u_·o_n_i_n_.th~e_P_T_V~in~j~e_ct_o_r~~~~~~~---';'133
the l 0 ng/ml level is shown in Figure 4. Even at this low concentration excellent signal to
noise ratios are obtained. The estimated detection limits of the current set-up are in the
sub-ng/ml range.
Table II. Recovery (Rec) and repeatability (RSD%) for several initial liner temperatures.
Injector Temperature
10°c 3o•c 50°c
Compound b.p.•c Rec•> RSD% Rec RSD% Rec RSD%
I) toluene JI 1 24 12 20 3.4 3 2) ethylbenzene 137 39 4.4 36 7.9 21 12 3) methoxybenzene 156 88 3.0 80 2.0 58 6.6 4) p-dichlorobenzene 174 80 5.5 78 2.8 66 5.0 5) 2,6-dirn.ethylphenol 203 97 1.8 IOI 1.4 98 0.5 6) 2,6-dimethylaniline 213 94 3.0 JOO 0.3 102 2.2 7) p-chloroaniline 232 88 15 98 4.0 85 3.5 8) indole 253 96 4.4 JOO 0.6 102 1.5 9) 2,6-dichlorobenzonitrile JOO 3.7 98 1.7 IOI 2.8
JO) 2,4,5-trichlorophenol 248 103 4.2 104 3.3 105 1.1 11) p-dinitrobenzene 299 97 11 103 2.6 102 1.0 12) trifluralin 74 18 81 21 65 13 13) atrazine 73 14 74 6.4 99 9.4 14) phenanthrene 340 97 6.6 102 3.3 JOO 4.1
•l Recovery in %, reference: cold splitless injection of I µl of a 20 µg/ml solution in methylene chloride. Sample: 250 µI 80 ng/ml in water, introduction rate = JOO µI/min.
5 14
3 6 12
8 0 4 (/)
= 0 2 Q.. (/)
0 9 11 ...... 7 10
Cl -i:i.. 13
0 2 4 6 8 10 12 time (min)
Figure 4. Chromatogram obtained after introduction of 1 ml water sample containing the compounds (10 ng/ml) given in Table II. Introduction rate= JOO µJ/min, PTV initial temperature = 30°C.
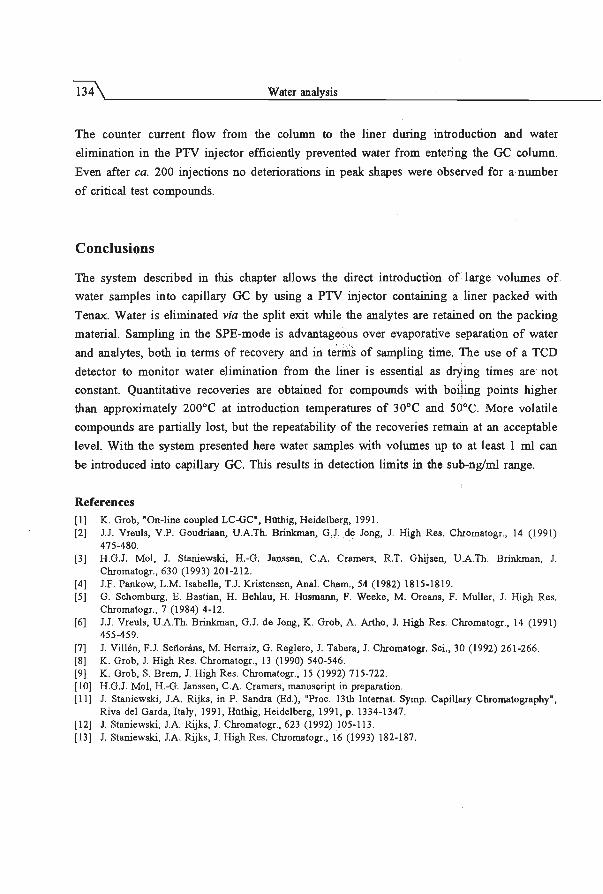
The counter current flow from the column to the liner during introduction and water
elimination in the PTV injector efficiently prevented water from entering the GC column.
Even after ca. 200 injections no deteriorations in peak shapes were observed for a number
of critical test compounds.
Conclusions
The system described in this chapter allows the direct introduction of! large volumes of
water samples into capillary GC by using a PTV injector containing a liner packed with
Tenax. Water is eliminated via the split exit while the analytes are retained on the packing
material . Sampling in the SPE-mode is advantageous over evaporative separation of water
and analytes, both in terms of recovery and in tenns of sampling time. The use of a TCD
detector to monitor water elimination from the liner is essential as drying times are not
constant. Quantitative recoveries are obtained for compounds with boiling points higher
than approximately 200°C at introduction temperatures of 30°C and S0°C. More volatile
compounds are partially lost, but the repeatability of the recoveries remain at an acceptable
level. With the system presented here water samples with volumes up to at least l ml can
be introduced into capillary GC. This results in detection limits in the sub-ng/ml range.
References [!) K. Grob, "On-line coupled LC-GC", Hilthig, Heidelberg, 1991. [2) J.J. Vreuls, V.P. Goudriaan, U.A.Th. Brinkman, G) . . de Jong, J. High Res. Chromatogr., 14 (1991)
475-480. . [3] H.G.J. Mo!, J. Staniewski, H.-G. Janssen, C.A. Cramers, R.T. Ghijsen, U.A.Th. Brinkman, J.
Chromatogr., 630 (1993) 201-212. [4] J.F. Pankow, L.M. Isabelle, T.J. Kristensen, Anal. Chem., 54 (1982) 1815-1819. ; [5) G. Schomburg, E. Bastian, H. Behlau, H. Husmann, F. Weeke, M. Oreans, F. :Muller, J. High Res.
Chromatogr., 7 (1984) 4-12. · [6] J.J. Vreuls, U.A.Th. Brinkman, G.J. de Jong, K. Grob, A. Artho, J. High Res. Chromatogr., 14 (1991)
455-459. [7] J. Villen, F.J. Sef\orans, M. Herraiz, G. Reglero, J. Tabera, J. Chromatogr. Sci., 30 (1992) 261-266. [8] K. Grob, J. High Res. Chromatogr., 13 (! 990) 540-546. [9] K. Grob, S. Brem, J. High Res. Chromatogr., 15 (1992) 715-722. [!OJ H.G.J. Mo!, H.-G. Janssen, C.A. Cramers, manuscript in preparation. [I I] J. Staniewski, J.A. Rijks, in P. Sandra (Ed.), "Proc. 13th Internal. Symp. Capillary Chromatography",
Riva de! Garda, Italy, 1991, Hilthig, Heidelberg, 1991, p. 1334-1347. [12] J. Staniewski, J.A. Rijks, J. Chromatogr., 623 (1992) .105-113. [13] J. Staniewski, J.A. Rijks, J. High Res. Chromatogr., 16 (1993) 182-187.

On-line enrichment - GC
using open-tubular extraction columns

137
5.1 Principles and theoretical considerations 7>
Summary
The applicability of open-tubular extraction columns for on-line extraction-Ge of aqueous samples is studied. The extraction process involves sorption of the analytes from an aqueous phase into the stationary phase of an open-tubular column, removal of the aqueous phase by purging the extraction capillary with nitrogen and desorption of the analytes with hexane. Water elimination carried out in this manner appears to be highly efficient. Parameters affecting the sorption and desorption process, such as column dimensions, flow rate and phase ratio, are discussed in detail. When using a 2 m x 0.32 mm i.d. column with a swollen 5 µm stationary phase, and flow rates not exceeding 200 µI/min, PAHs can be extracted quantitatively from 0.5 ml samples. For desorption 70-125 µI of hexane are needed. These volumes are easy to handle using a PTV injector in which the organic solvent is eliminated prior to transfer of the analytes to the GC column.
Introduction
A main issue in gas chromatographic analysis of water samples is the simplification and/or
automation of the analytical procedure. The most straightforward way to achieve this is the
direct injection of the water sample into the GC system. Recently attempts have been
made to introduce large volumes of aqueous samples into the GC system by using
retention gaps [1]. Several problems are encountered with this approach. Firstly, water
does not wet the surface of deactivated retention gaps, which is a prerequisite as the
retention gap technique relies on the formation of a uniform solvent film [2]. Secondly,
water has a high boiling point, requiring high solvent evaporation temperatures and it
produces a very large volume of vapour per unit volume of liquid which seriously limits
the introduction speed into the GC system. Also it is chemically aggressive at higher
temperatures because it destroys the chemically deactivated surface of pre-columns. So far,
there is no fully water-resistant deactivation procedure (3). As a consequence, for direct
injection of aqueous samples into the GC, problems with adsorption of analytes in the pre
column will arise sooner or later. Nevertheless the direct introduction of aqueous samples
has been applied in a limited number of studies, i.e. when only small volumes are
involved [ 4,5) and when applying concurrent solvent evaporation [ 6). Furthermore
introduction of water can be successful after the addition of a higher boiling organic co-
7l Based on: H.G.J. Mol, J. Staniewski, H.-G. Janssen, C.A. Crarners, R.T. Ghijsen, U.A.Th. Brinkman, J. Chrornatogr. 630 (1993) 201.

138 On-line enrichment-Ge with open-tubular extraction columns
solvent [7] and with azeotropic mixtures containing an amount of water not exceeding the
azeotropic composition [8].
Eliminating the aqueous solvent prior to introduction into the GC (pre) column is a
more promising option for automated water analysis. Removal of water can be done by
sorption/thermal desorption and phase-switching techniques. Pankow et al. [9] described a
sorption/thermal desorption system in which water was sampled through a Tenax tube. The
adsorbed analytes were thermally desorbed and introduced into the GC after refocussing.
Schomburg et al. [IO] used a similar approach based on a two-oven system. More recently
the use of a PTV injector with packed liners was studied for the same purpose [l l,12],
thereby eliminating the need for two ovens. For trace analysis of organic compounds in
water, also non-coated [13,14] or coated capillaries [15-17] or entire GC columns [18-20]
were used for extracting analytes from water. After thermal desorption and subsequent
(cryogenic) refocusing the analytes were separated.
In phase-switching techniques the analytes are transferred from the aqueous phase to
an organic phase which is introduced into the GC. Inspired by the promising results
obtained in the field of automated sample preparation of water samples [21,22], Van
Zoonen et al. [23] studied the use of on-line liquid-liquid extraction in a segmented flow
system as a means of transferring the analytes from . an aqueous phase to an organic phase.
Phase switching can also be carried out by using small packed cartridges [24,25] which
offers the additional advantage of analyte enrichment. After extracting the analytes from
the aqueous phase, the residual water has to be removed by drying with a flow of
nitrogen. Incomplete water elimination leads to reduced desorption efficiencies as part of
the pores of the packing material are blocked by residual water. The need for a drying step
can be avoided by using a desorption solvent which is (slightly) miscible with water, e.g.
ethyl acetate [26], but then again small amounts of water are transferred to the GC system.
Grob and Schilling [27] proposed the use of open-tubular extraction columns as an
alternative to the use of packed adsorption tubes. The main advantage of the use of open
tubular extraction columns is that complete removal of the remaining water can be
obtained by simply purging a short plug of gas through the capillary. Grob and Schilling's
attempts of trapping analytes on a 2 m GC column were not very successful . According to
the authors this was due to the low diffusion speeds in the liquid and insufficient retention
power of the open-tubular extraction column.
The aim of this chapter is to present a thorough study on the applicability of open
tubular extraction (OTE) columns as extraction device for on-line water analysis. The
extraction procedure subsequently involves sorption of a number of test compounds into
the stationary phase of a capillary column, removal of water from the column by means of
nitrogen gas, and desorption of the compounds with hexane which is, next, directly

Principles and theoretical considerations 139
introduced into the GC. Elimination of the bulk of the organic solvent is performed in the
PTV injector of the GC system. The extraction process was studied in two steps. First the
sorption step was examined. The effects of column dimensions, flow rates, modifier
concentrations and temperature are discussed. Secondly, starting from I 00% sorptlon
conditions, experiments concerning liquid desorption were carried out. Here the effect of
desorption flow rate and length of the OTE column on the desorption volume are
discussed. The applicability of the system is demonstrated by the analysis of a PAH
mixture.
Experimental
Instrumentation
LC experiments were carried out using a system which consisted of an LC pump (type
LKB 2150, Pharmacia, Woerden, The Netherlands), a pulse damper (Free University,
Amsterdam, The Netherlands), a six-port valve with an 11 µI loop, an open-tubular
extraction column, a fluorescence detector (LS-4, ·Perkin-Elmer, Norwalk, CT, USA) and a
recorder (type BD40, Kipp & Zn., Delft, The Netherlands). The valve and the extraction
capillary were positioned in a thermostated waterbath. The fluorescense excitation/emission
wavelengths for naphthalene, phenanthrene and pyrene were 262/330, 243/365 and
236/392 nm, respectively.
On-line phase switching-GC. The phase switching device was built around two 10-port
valves (Valeo, Houston, TX, USA). It is schematically depicted in Figure 1. The system
consisted of a sampling pump (Pl) (syringe pump; type MF-2 from Azumadenki Kogyo
Co., Japan) and a pump used for desorption (P2). This pump was a speed-programmable
syringe (Digisampler, Gerstel, Millheim aid Ruhr, Germany) which allowed the
introduction of defined volumes of up to 1 ml· with a speed of 1-2000 µI/min. A sample
loop of 0.5 ml was connected between two ports of valve 1. The open-tubular extraction
column was connected between two ports of valve 2. The extraction capillaries were cut
from GC colwnns obtained from Chrompack (Bergen op Zoom, The Netherlands). The
nitrogen flow was controlled by a flow controller adjusted to 0.6 ml/min.
A gas chromatograph (type 5890, Hewlett Packard, Avondale, PA, USA) equipped
with a flame ionisation detector (FID) and a thermal conductivity detector (TCD), and
provided with a programmed temperature vaporizing injector (PTV injector) (type KAS
502, Gerstel) was used. The PTV injector was equipped with a liner containing a porous
glass bed. The split vent was modified as described elsewhere [28,29]. By means of a
splitter, about 1 % of the purge gas ( 600 ml/min) is transferred to the TCD for monitoring
the solvent elimination. For data collection a Nelson integration system (Perkin Elmer)
was used.
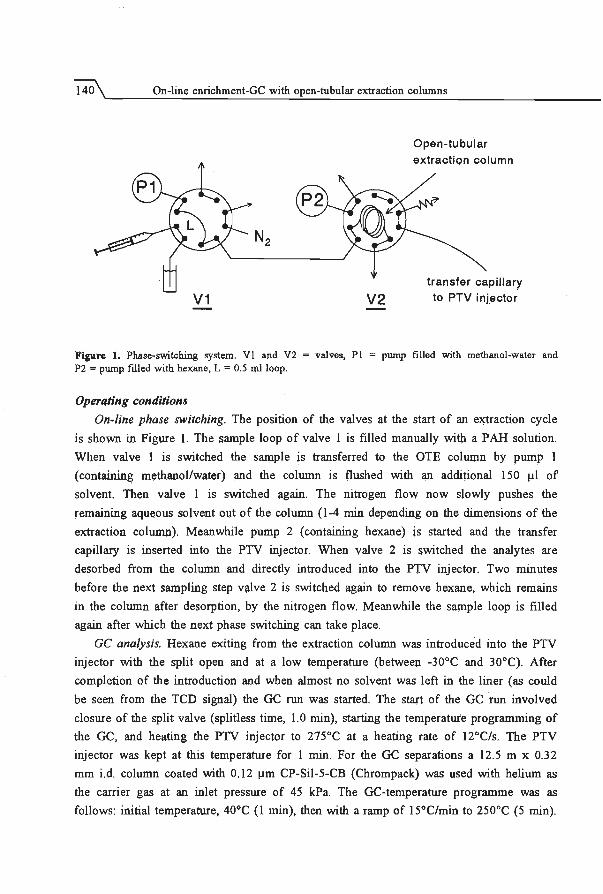
140 On-line enrichment-GC with open-tubular extraction columns
Open-tubular
extraction column
transfer capillary
V2 to PTV injector
Figure I. Phase-switching system. VI and V2 = valves, Pl = pump filled with methanol-water and P2 = pump filled with h£xane, L = 0.5 ml loop.
Oper4/ing conditions
On-line phase switching. The position of the valves at the start of an extraction cycle
is shown in Figure 1. The sample loop of valve 1 is filled manually with a PAR solution.
When valve 1 is switched the sample is transferred to the OTB column by pump 1
(containing methanol/water) and the column is flushed with an additional 150 µl of
solvent. Then valve 1 is switched again. The nitrogen flow now slowly pushes the
remaining aqueous solvent 011t of the column (1-4 min depending on the dimensions of the
extraction column). Meanwhile pump 2 (containing hexane) is started and the transfer
capillary is inserted into the PlV injector. When valve 2 is switched the analytes are
desorbed from the colllllln and directly introduced into the PTV injector. Two minutes
before the next sampling step valve 2 is switched again to remove hexane, which remains
in the column after desorption, by the nitrogen flow. Meanwhile the sample loop is filled
again after which the next phase switching can take place.
GC analysis. Hexane exiting from the extraction column was introduced into the PTV
injector with the split open and at a low temperature (between -30°C and 30°C). After
completion of the introduction and when almost no solvent was left in the liner (as could
be seen from the TCD signal) the GC run was started. The start of the GC run involved
closure of the split valve (splitless time, 1.0 min), starting the temperature programming of
the GC, and heating the PlV injector to 275°C at a heating rate of 12°C/s. The PlV
injector was kept at this temperature for 1 min. For the GC separations a 12.5 m x 0.32
mm i.d. column coated with 0.12 µm CP-Sil-5-CB (Chrompack) was used with helium as
the carrier gas at an inlet pressure of 45 kPa. The Ge-temperature programme was as
follows: initial temperature, 40°C (1 min), then with a ramp of 15°C/min to 250°C (5 min).

Principles and theoretical considerations 141
Desorption experiments. For desorption experiments PAH solutions (50 ng/ml) in
methanol-water (20:80) were sampled at a low sampling flow rate (28 µl/min). After
sorption the aqueous solvent was removed as was described above. Then desorption was
carried out applying a variety of conditions to be discussed below. Desorption profiles
were obtained by repeated sampling and subsequent desorption with a stepwise increased
volume of hexane. Compounds remaining in the colwnn were flushed to waste before the
next experiment was started.
Theoretical considerations
For maximum enrichment of the water sample by open-tubular extraction, breakthrough of
the analytes from the extraction column during sampling should be prevented. The
maximwn sample volwne for which breakthrough does not occur is the breakthrough
volume. Assuming that a solute elutes from the extraction column as a Gaussian-shaped
band, the breakthrough volume CVa) can be defined as VR - 2.326cr. Here VR is the
retention volume and a the standard deviation of the solute band. This definition implies
the acceptance of breakthrough of 1 % of the analyte (definitions of the breakthrough
volwnes corresponding with lower or higher percentages of breakthrough are included in
Table I). Analogous to ref. [30] the following equation for the breakthrough volume of a
compound from an extraction colwnn can be derived:
v = v. (1 +k) (1- 2.326) B 0 ./Fl (la)
or, in a more general form:
(lb)
where V0 is the void volume of the column, VR and k the retention volume and the
retention factor of the solute in the extraction colwnn, respectively, and N the plate
number of the extraction colwnn (with N>5.4).
The plate nwnber depends on the colwnn length and the band broadening of the
solutes in the extraction capillary. The band' broadening in an open-tubular extraction
column can be described by the Golay equation:
2 DM H=-
u
2 2
+ 1 +6k+ llk2
• .!!.:....... ·u + ~ ·-. _k_. di ·u 96(k+ 1)2 DM 3 (k+ 1)2 Ds
(2)

142 On-line enrichment-GC with open-tubular extraction columns
where OM and 0 8 (in cm2/s) are the diffusion coefficients of the solute in the mobile phase
and stationary phase, respectively, u (in emfs) the linear velocity, d0 (cm) the column
diameter, and dr (cm) the stationary phase thickness. The diffusion coefficients of the
PAHs selected as test solutes were calculated using the modified Wilke-Chang equation
[31 ]; the values are ca. 0.40· 10·5 cm.2/s (25% v/v methanol in water at 20°C). The diffusion
coefficients of the PAHs in a polysiloxane stationary phase are ca. 10·1 cm2/s [32], i.e. ,
almost two orders of magnitude lower than those in the mobile phase. As the linear
velocity is far above optimum and dr is 5 µm or less, the first and the last term on the
right-hand side of eqn. 2 can be neglected. When the retention factor is very large eqn. 2
reduces to
2 11 de
H = -·-·u 96 DM
Or, expressed in terms of the volumetric flow rate, F, through the column,
44 F H=-·-
961t Dm
(3)
(4)
As can be seen from eqn. 4, band broadening at a constant flow rate depends on OM only
and is independent of the column diameter. Substitution of eqn. 4 into eqn. 1 a, with N =
L/H, yields
(5)
Eqn. 5 shows that in order to obtain V 8 values larger than zero, F should meet the
following requirement:
F < 961t ·D L 2.3262 44 M
1.267 DM L (6)
For extraction of analytes in a 2 m. column and with a OM value of 0.40· l 0-5 cm2/s, the
maximum. allowable sampling flow rate that corresponds with an extraction efficiency of
99.0% is 61 µl/m.in . Here, the retention power and capacity of the extraction capillary are
assumed to be sufficient. Higher maximum allowable sampling flow rates are obtained
when accepting lower extraction efficiencies (see Table I).
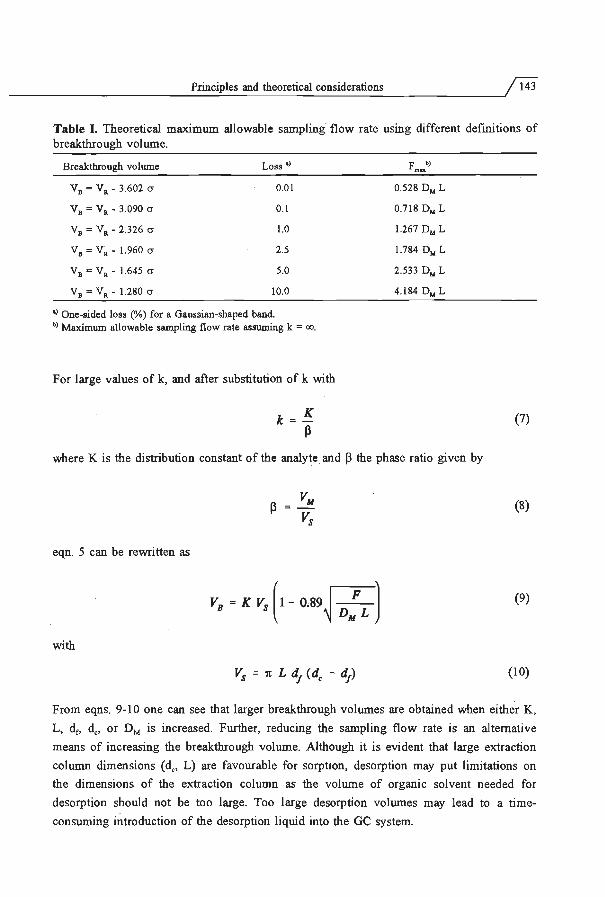
~~~~~~~~~~~~~P_nn_._c_ip_l_es~an_d~th_eo_r_e_ti_cal~co~ns_i_de_r_an_·o_n_s~~~~~~~~-Jj'l43
Table I. Theoretical maximum allowable sampling flow rate using different definitions of breakthrough volume.
Breakthrough volwne Loss•>
V 8 =Va - 3.602 cr 0.01
V 8 =Va - 3.090 cr 0.1
V8 =Va - 2.326 cr 1.0
V 8 = Va - 1. 960 cr 2.5
V8 = VR - 1.645 cr 5.0
V 8 = VR - 1.280 cr 10.0
•>One-sided loss (%) for a Gaussian-shaped band. b) Maximum allowable sampling flow rate assuming k = co.
For large values of k, and after substitution of k with
K k = -p
Fm.,_b>
0.528 DM L
0.718 D,.. L
1.267 D,.. L
1.784 D,.. L
2.533 D,.. L
4.184DML
where K is the distribution constant of the analyte and P the phase ratio given by
eqn. 5 can be rewritten as
V = K V ( 1 - Q,89 ~ F ] B s D L
M
with
(7)
(8)
(9)
(10)
From eqns. 9- l 0 one can see that larger breakthrough volumes are obtained when either K,
L, dr, de, or DM is increased. Further, reducing the sampling flow rate is an alternative
means of increasing the breakthrough volume. Although it is evident that large extraction
column dimensions (de, L) are favourable for sorption, desorption may put limitations on
the dimensions of the extraction column as the volume of organic solvent needed for
desorption should not be too large. Too large desorption volumes may lead to a time
consuming introduction of the desorption liquid into the GC system.

144 On-line enrichment-GC with open-tubular extraction columns
Results and discussion
In this section first the effect of several parameters on sorption of PAiis in OTE columns
is examined using an LC set-up. Next, parameters affecting the desorption are discussed.
Finally the performance of the on-line phase switching-Ge system is evaluated with
emphasis on the effect of the sampling flow rate.
Sorption, LC experiments
Plate numbers. The plate number of the open-tubular extraction column was
determined to assess whether the column meets the requirement of N>5.4 (see above).
Table II shows that the experimental values are up to 40% higher than the theoretical
ones. Apparently the DM values are higher than calculated. In order to have N>5.4, flow
rates should be below 100 µI/min for a 2 m column with the mobile phase used. At
(much) higher sampling flow rates the compounds no longer elute as Gaussian-shaped
bands (see Figure 2). This complicates the prediction of losses of analytes caused by
breakthrough due to too fast sampling.
Table II. ; Plate numbers for naphthalene and phenanthrene in a 2 m x 0.32 mm e*action capillary.
naphthalene (k=4) phenanthrene (k= 15)
F (µI/min) u (emfs)
10 0.21
25 0.52
50 1.04
JOO 2.07
N •> th
61
24
12
6
b) N.,.
33
15
7.3
41
17
8
4.3
Conditions: 2 m x 0.32 mm i.d., I µm CP-Sil-5-CB, methanol-water (25:75), 25°C.
N •> ... 52
21
JO
4.5
•> Calculated plate nwnbers in methanol-water (26:74) at 25°C. DM for naphthalene and phenanthrene: 0.52·10'' and 0.44·10"' cm2/s, respectively. •> Plate numbers determined from peaks obtained after injection of 11 µl 1-2 µg/ml PAH dissolved in the mobile phase.
Especially for larger sample volumes, the above mentioned sampling flow rates are rather
low in the practice of on-line extraction-Ge. For a given OTE column the only way of
increasing the sampling flow rate while keeping the breakthrough volume constant is by
increasing the diffusion coefficient of the solutes in the mobile phase. This is possible by I
increasing the temperature. DM values, calculated from the plate numbers of the P AHs ' eluting from the extraction column, were found to increase by a factor of I.5 and 2.4, I
when the temperature was increased from 25°C to 40°C and 60°C, respet tively.

~~~~~~~~~~~~~~Pn_·_nc_i_p_le_s_an~d_th~eo_re_u_·c_ru~co~n_si_d_er_an_·_o_ns~~~~~~~~~j'l45
A 13&0 iAI"*' B 1 130 iAI"*'
4&pl/mln
A I .. u c .. u .. .. (; :i Ii:
3.0 2.0 1.0 0 2.0 1.0 0
<- Vlmll <- V(mll
Figure 2. Chromatograms of PAHs obtained after injection into an OTE colwnn. Conditions: column, 2 m x 0.32 mm i.d., 5 µm CP-Sil-5-CB, at 25°C, applying different flow rates. A) naphthalene (k=7.3), methanolwater (30:70), B) phenanthrene (k=l6), acetonitrile-water (20:80).
Retention on the OTE column. P AHs were used as test compounds for evaluation of the
retention power of the extraction columns. Due to their hydrophobic character they are
easy to extract into the non-polar siloxane phase of the extraction column. On the other
hand, the hydrophobicity may lead to adsorption of the PAHs onto the inner surface of
valves and (transfer) capillaries in on-line phase-switching systems. This undesired
adsorption can be suppressed by adding an organic modifier . such as methanol to the water
sample. However, this will also affect the retention characteristics of the PAHs in the
extraction column. Therefore, in addition to phase ratio and temperature, the effect of the
modifier concentration on the retention is included in the study. For this the retention
factors of the P AHs on the OTE columns were determined using solvents that contained
different concentrations of methanol. Figure 3 shows plots of log k vs. the percentage
methanol in water for the PAHs on 2 m x 0.32 mm i.d. extraction capillaries. Although
these plots are not really linear over a large range of methanol concentrations [33],
estimated retention factors obtained by extrapolation can be safely used for estimation of
the breakthrough volumes. Especially for naphthalene the values obtained with the 1 µm
film column are low (k=16 in water without modifier). Therefore a second column was
examined with a thicker film of stationary phase (5 µm) . The phase ratio of the 5 µm
column is 14.5, which is almost five times lower as compared to the 1 µm column. It was
therefore expected that the retention factors would increase by a factor of five (eqn. 7).
The experimental retention factors, however, increased only 3.5-fold. Nevertheless, from
Figure 3 it is evident that all PAHs can easily be extracted from water using the 5 µm
film column.
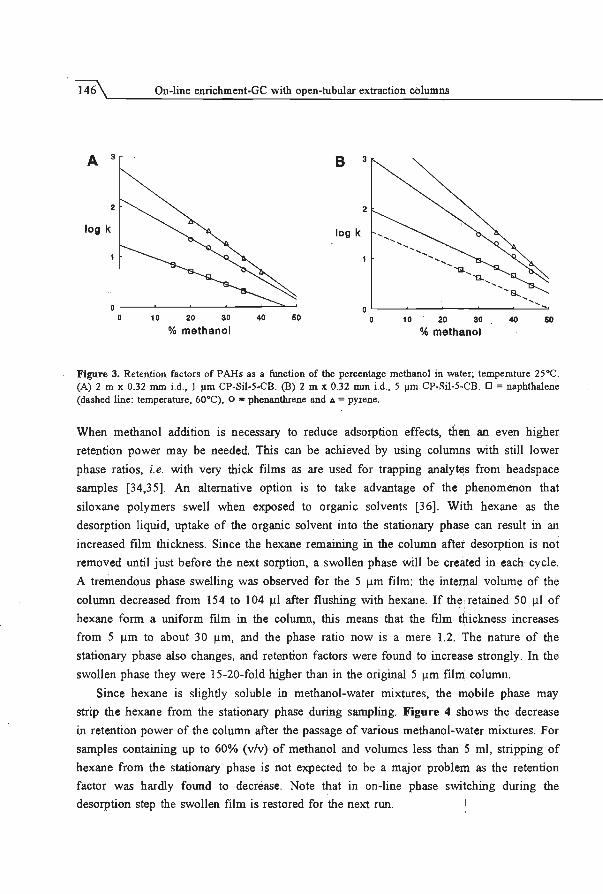
146 On-line enrichment-Ge with open-tubular extraction columns
A 3 B 3
2 2
log k log k
10 20 30 40 60 10 20 30 40 60 % methanol % methanol
Figure 3. Retention factors of PAHs as a function of the percentage methanol in water; temperature 25°C. (A) 2 m x 0.32 mm i.d., 1 µm CP-Sil-5-CB. (B) 2 m x 0.32 mm i.d., 5 µm CP-Sil-5-CB. D = naphthalene (dashed line: temperature, 60°C), o = phenanthrene and "'= pyrene.
When methanol addition is necessary to reduce adsorption effects, then an even higher
retention power may be needed. This can be achieved by using columns with still lower
phase ratios, i.e. with very thick films as are used for trapping analyt~s from headspace
samples [34,35]. An alternative option is to take advantage of the phenomenon that
siloxane polymers swell when exposed to organic solvents [36]. With hexane as the
desorption liquid, uptake of the organic solvent into the stationary phase can result in an
increased film thickness. Since the hexane remaining in the column after desorption is not
removed until just before the next sorption, a swollen phase will be cre~ted in each cycle.
A tremendous phase swelling was observed for the S µm film: the internal volume of the
column decreased from 154 to l 04 µI after flushing with hexane. If the retained SO µI of
hexane form a uniform film in the column, this means that the film thickness increases
from S µm to about 30 µm, and the phase ratio now is a mere 1.2. The nature of the
stationary phase also changes, and retention factors were found to increase strongly. In the
swollen phase they were I 5-20-fold higher than in the original S µm film column.
Since hexane is slightly soluble in methanol-water mixtures, the mobile phase may
strip the hexane from the stationary phase during sampling. Figure 4 shows the decrease
in retention power of the column after the passage of various methanolcw.ater mixtures. For
samples containing up to 60% (v/v) of methanol and volumes less than 5 ml, stripping of
hexane from the stationary phase is not expected to be a major problem as the retention
factor was hardly found to decrease. Note that in on-line phase switching during the
desorption step the swollen film is restored for the next run.

Principles and theoretical considerations
0 0 ~ 8 c 0
'E CD
i 4 0:
0 2 3 4 5 Volume (ml) of methanol-water passed
through column before injection
147
6
Figure 4. Decrease of retention factors due to stripping of hexane from a swollen stationary phase by methanol-water mixtures. Conditions: 2 m x 0.32 mm i.d., 5 µm CP-Sil-5-CB swollen by rinsing with hexane. Flow rate, 45 µI/min; temperature, 25°C. • = naphthalene, methanol-water (60:40); 0 = naphthalene, o = phenanthrene, /1 = pyrene, all three in methanol-water (70:30); .. = pyrene, methanol-water (80:20).
Effect of temperature on sorption. The breakthrough volume is affected by the temperature
via the diffusion coefficient of the analytes in the mobile phase and via the retention factor
(eqn. 5). It was found above that DM values increase with a factor of about 2.4 on
increasing the temperature from 25°C to 60°C. This increases the breakthrough volume via
the last term on the right-hand side of eqn. 5. However, on increasing the temperature, the
retention factors of the P AHs were found to decrease with a factor of 2.2-3 .4 (for an
example, see the dashed line in Figure 3), which lowers the breakthrough volume. The
overall effect depends on the applied flow rate and also on the definition of the
breakthrough volume. At flow rates well below the maximum allowable flow rate,
sampling at elevated temperature will result in smaller breakthrough volumes. As in many
cases the lack of retention power is expected to be of greater concern than the low
sampling flow rate, extraction of the analytes at room temperature is preferable over
extraction at elevated temperatures.
Desorption
In on-line extraction-Ge two aspects are of main interest where desorption is concerned:
(i) the desorption speed and (ii) the desorption volume needed for quantitative recovery of
the analytes from the extraction column. These two aspects are interrelated. Desorption of
the analytes is a chromatographic process. The volume needed for desorption depends on
the chromatographic band broadening during desorption which can be described similarly

148 On-line enrichment-GC with open-tubular extraction columns
to broadening during sorption. Instead of a breakthrough volume which corresponds with
the start of an eluting peak, a desorption volume (V0 ) corresponding with the end of an
eluting peak, now has to be used. Here V0 = VR+ 2.326cr or (Cf eqn. la):
V = V.o ( k+ 1 ) ( 1 + 2.326 ) D ./N (11)
The contribution of chromatographic band broadening to V 0 cannot be estimated reliably
because accurate values for the diffusion coefficients of the analytes in the swollen
stationary phase are not available. However, once the values for k and V 0 for the
desorption of an analyte from a column (length, L1) have been experimentally determined
(Cf below), it is possible to estimate the volume needed for desorption of that component
from a similar column of different length (Li). The following equation for the unknown
desorption volume V 02 can be derived:
(12)
As regards the retention factors, their values are determined by the distribution constant
(K) and the phase ratio (eqn. 7). During desorption the analytes partition between two very
similar phases, hexane (mobile phase) and a silicone phase strongly swollen by hexane
(stationary phase). It can therefore be expected that K will have a value of ca. l. With the
known phase ratio of l.2, the expected retention factor of the PAHs during desorption then
is about 0.8. Experimental values of retention factors can be estimated from the desorption
curves in Figure 5. The desorption volume corresponding to 50% recovery is the adjusted
retention volume (V'J of the PAHs. Introduction of the known void volume yields
experimental retention factors of about 0.45. Apparently the P AHs have a slight preference
for the pure hexane phase; K = 0.54.
The desorption volumes are dependent on the desorption speed (Cf above). This was
experimentally verified by desorbing the analytes at different flow rates. The initial band
width was assumed to be relatively small because a low flow rate was used for sorption.
The desorption profiles for two columns obtained at different desorption flow rates are
shown in Figure 5. The higher the desorption flow rate, the stronger the band broadening
and the larger the volume needed for complete desorption. Because the column is empty
when desorption starts, the volume of liquid exiting from the OTE column will be
V'0 = V 0 - V0. Using the 2 m column and applying desorption flow rates of 10, 50 and
250 µI/min, the desorption volumes (V'0 ) (>99% recovery) were 70, 80 and 125 µl,
respectively.

~~~~~~~~~~~~~~P_ri_n_ci~p_le_s_an~d_th_· _eo_re~ti_cfil~c_o_n_s1_·d_er_an_·_o_n_s~~~~~~~~--',1l49
100
80
~
*" 60 ~ GI > 0 40 ()
~
20
--0 0 50
0- 8-::~----&--- - 6---.!'.
I ,-/ //
I Ii I /
I I I I
~ / I I / /
ff / ,, , ,
I I
/ ¢ ,, / I
// /
100 160 200
desorption volume, V.' (µI)
250 300
Figure 5. Effect of desorption flow rate on the desorption profile. o = 10 µI/min, a = 50 µI/min and " = 250 µI/min. Column: 0.32 mm i.d., 5 µm film; solid line, 2 m; dashed line, 5 m. Sample : 0.5 ml of 50 ng/ml pyrene in methanol-water (20:80), sorption flow rate 28 µI/min.
Knowing the retention factors and the desorption volumes for the P AHs in the 2 m
column, the desorption volumes for longer columns can be calculated. The results are
shown in Table III. Calculated and measured V'0 values for the 5 m column are seen to
match rather well.
Table III. Effect of desorption flow rate and column length on the desorption volume and time.
Desorption volume,V0 ' in µI (desorption time in min)
Experimental•) Calculated•>
F (µI/min) 2m Sm 5m 10 m 25 m
10 60 (17) 140 (41) 260 (79) 625 (195)
50 70 (3.5) 150 150 (8.3) 280 (16) 650 (40)
250 95 (0.8) 190 195 (1.8) 340 (3.5) 750 (8.3)
•>volume of hexane needed for 95% desorption of PAHs from 0.32 mm i.d., 5 µm CP-Sil-5-CB column. •> calculated desorption volume using data for 2 m column.
In on-line extraction-Ge the desorption solvent from the extraction column is directly
introduced into the GC system. Here solvent elimination takes place either by means of a
PTV injector, as in this work, or by using retention gap techniques. In large volume
injection the introduction speed is often a critical parameter [l,29]. Consequently, for

150 On-line enrichment-GC with open-tubular extraction columns
optimal performance of the on-line system the desorption rate should be equal to the
optimum introduction rate for large volume injection. The injection speed in large volume
sample introduction in capillary GC depends on the application. With volatile analytes low
speeds have to be applied, e.g. 25 µI/min at an injector temperature of -30°C [29], which
may lead to unacceptable long desorption times. It is important to realize here that the
volume of the desorption liquid needed to transfer the analytes from the column to the
PTV injector is equal to Y0 = Y0 + Y'0 (the actual volume introduced is Y'0 ). For
example, at the conditions just mentioned, desorption from a 10 m column (swollen phase)
would take about 32 min. For less volatile analytes, on the other hand, higher
introduction/desorption speeds can be applied resulting in fully acceptable desorption times
when using a IO m column. At a desorption speed of 250 µI/min even a 25 m x 0.32 mm
i.d. extraction colwnn can be used (see Table III).
Optimum OTE-column dimensions
Ideally, for extraction with OTE columns the degree of sample enrichment should be
as high as possible, the sampling speed should be fast enough to obtain acceptable
sampling times and, for on-line OTE-GC, the desorption volume should be compatible
with the technique used for large volume injection in capillary GC. The optimum OTE
column dimensions are mainly determined by the latter two demands. As far as analyte
enrichment in the OTE colwnn is concerned, increasing the column dimensions (V 0) will
not lead to higher enrichment of the analyte because both the breakthrough volume and the
desorption volume increase approx. proportionally with Y0. In order to be compatible with
large volume sample introduction into the GC the desorption volume should be small (e.g.
100-250 µI) and, hence, Y0 should preferably be small. From the sorption point of view
the OTE colwnn should preferably be long as this allows the use of high sampling flow
rates (eqn. 6). This leads us to conclude that long narrow-bore OTE columns are best
suited for on-line OTE-GC. Practical limitations in this respect are the availability of
narrow-bore columns with low phase ratios (thick stationary phase films) and the column
pressure drop.
On-line extraction - GC
Elimination of the aqueous phase. The aqueous phase was removed from the column
with a nitrogen flow of 0.6 ml/min. Removal was carried out slowly to prevent possible
breaking up of the aqueous plug. No additional drying with nitrogen was performed, i.e.
introduction of hexane was started immediately after completion of the solvent removal.
Hexane exiting from the colwnn was directly transferred to the GC system. Elimination of
the aqueous phase appears to be satisfactory as there was no indication (irregular solvent

~~~~~~~~~~~~~~P_ri_nc_i~p_le_s_an~d_th~eo_r_e_ti_cal~c_o_n_si_d_er_a_ti_o_n_s~~~~~~~~--'j'l51
peak, peak shape of the solutes) that water entered the GC system. Chromatograms
obtained after on-line extraction were not different from those obtained after splitless
injection of a PAH solution in hexane. A more detailed study using (more polar) analytes
sensitive to adsorption or decomposition on active surfaces in the PTV liner or column is,
however, necessary to evaluate whether water is really completely removed.
Effect of sampling flow rate on recovery. In order to verify the results obtained in the
LC experiments concerning the maximum allowable sampling flow rate, the effect of the
flow rate on the recovery of pyrene after on-line extraction-Ge samples was evaluated.
The results are depicted in Figure 6.
100 • v • • •sm t 90
80
• ~ ~
70 ::§!. 0
• •2m •
>. 60 ... a>
50 > 0
• m
0 40 a> a:
30
20
10
0 0.01 0.1 4
Sampling Flow Rate (ml/min)
Figure 6. Effect of sampling flow rate and length of the extraction coluqm on recovery in on-line extraction-GC. Sample: 0.5 ml of pyrene in methanol-water (20:80). Extraction columns: 0.32 mm i.d., 5 µm CP-Sil-5-CB swollen with hexane.
In agreement with eqn. 6, for longer extraction columns higher sampling flow rates can be
applied while still obtaining quantitative extraction. However, the experimental maximum
allowable sampling flow rates obtained from Figure 6 are three to four times higher than
the theoretical values calculated using eqn. 6. This deviation is due to the fact that eqns. 5
and 6 are only valid for N > 5.4, which corresponds to flow rates below 28, 56 and 140
µl/mip for the 1, 2 and 5 m columns, respectively. When applying much higher sampling
flow rates the breakthrough volumes can no longer be predicted based on a Gaussian
shaped band (as was illustrated in Figure 2). Lovkvist and Jonsson [37] compared several
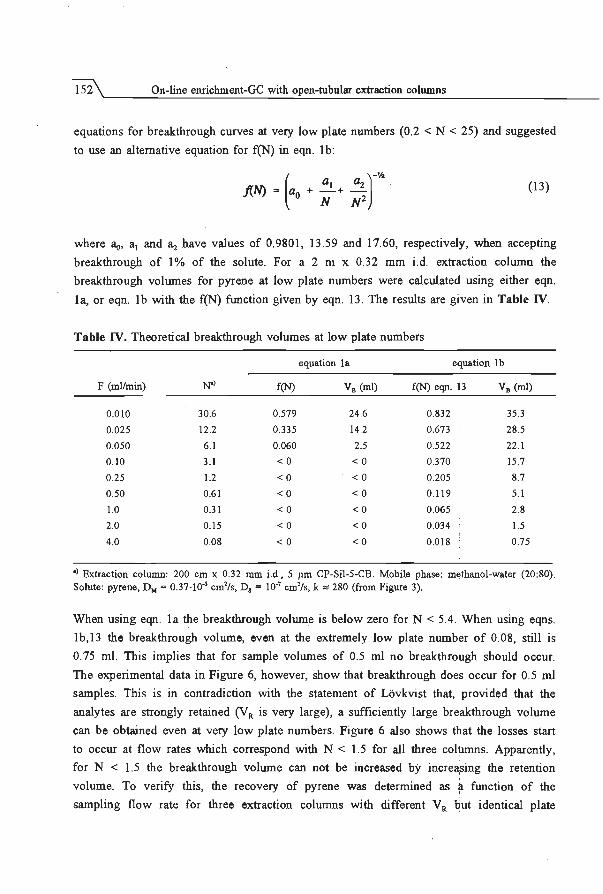
152 On-line enrichment-Ge with open-tubular extraction columns
equations for breakthrough curves at very low plate numbers (0.2 < N < 25) and suggested
to use an alternative equation for f(N) in eqn. I b:
( )-· a1 a2 . .f{N) = a + -+ -
o N N2 (13)
where ~. a1 and !Ii have values of 0.9801, 13.59 and 17.60, respectively, when accepting
breakthrough of I% of the solute. For a 2 m x 0.32 mm i.d. extraction column the
breakthrough volumes for pyrene at low plate numbers were calculated using either eqn.
I a, or eqn. I b with the f(N) function given by eqn. 13. The results are given in Table IV.
Table IV. Theoretical breakthrough volumes at low plate numbers
equation la equation lb
F (ml/min) N') f(N) Va (ml) f(N) eqn. 13 Va (ml)
0.010 30.6 0.579 24.6 0.832 35.3
0.025 12.2 0.335 14.2 0.673 28.5
0.050 6.1 0.060 2.5 0.522 22.I 0.10 3.1 <O <O 0.370 15.7
0.25 1.2 <O <O 0.205 8.7 0.50 0.61 <O <O 0.119 5.1 1.0 0.31 <O <O 0.065 2.8 2.0 0.15 <O <O 0.034 1.5 4.0 0.08 <O <O 0.Dl8 0.75
" Extraction column: 200 cm x 0.32 = i.d. , 5 µm CP-Sil-5-CB. Mobile phase: methanol-water (20:80). Solute: pyrene, DM = 0.37·!0·' cm2/s, D, = IO" cm2/s, k"" 280 (from Figure 3).
When using eqn. la the breakthrough volume is below zero for N < 5.4. When using eqns.
lb,13 the breakthrough volume, even at the extremely low plate number of 0.08, still is
0.75 ml. This implies that for sample volumes of 0.5 ml no breakthrough should occur.
The experimental data in Figure 6, however, show that breakthrough does occur for 0.5 ml
samples. This is in contradiction with the statement of Lovkvist that, provided that the
analytes are strongly retained (V R is very large), a sufficiently large breakthrough volume
can be obtained even at very low plate numbers. Figure 6 also shows that the losses start
to occur at flow rates which correspond with N < 1.5 for all three columns. Apparently,
for N < 1.5 the breakthrough volume can not be increased by incre¥ing the retention
volume. To verify this, the recovery of pyrene was determined as a function of the I
sampling flow rate for three extraction columns with different VR ~ut identical plate

~~~~~~~~~~~~~P_nn_·_c_ip_le_s_an~d_th~eo_r_en_·c_ru~c-on_s_id_er~au_·o_n_s~~~~~~~~-',/153
numbers. VR was varied by using extraction columns with different internal diameters/
stationary phase thicknesses: 0.15 m.rn/2 µm, 0.32 m.rn/5 µm and 0.50 mm/13 µm,
respectively. The length was the same for all three columns and hence, as the plate
number at constant flow rate is independent of the column diameter, the plate numbers
were equal. Although VR differed up to a factor of 21, almost identical curves for recovery
vs sampling flow rate were obtained. This leads us to conclude that for quantitative
trapping of analytes in an extraction column the plate number should always be above 1.5.
On the basis of eqn. 4, and with N = L/H ~ 1.5, one can calculate the maximum allowable
sampling flow rate for compounds with a high retention factor from:
(14)
From this equation it can be seen that at a sampling flow rate of 1 ml/min quantitative
trapping of the analytes can be obtained by using extraction columns of ca. 10 m.
Effect of modifier. The effect of the methanol percentage on recovery is illustrated in
Table V. Under the applied desorption and PTV conditions naphthalene is partially lost
during solvent elimination in the PTV. Obviously, for small sample volumes quantitative
extraction of the PAHs is obtained even for high percentages of modifier, which may be
interesting for application in coupled reversed phase LC-GC [26]. In water analysis
methanol can be added to suppress adsorption of the P AHs in valves or transfer capillaries
while still obtaining quantitative extraction. The repeatability of the on-line extraction-Ge
analysis was found to be very good. The relative standard deviation (RSD) was 2.5%
(n=3) or less both when analyte recovery was quantitative and when losses occurred. As
an example, Figure 7 shows the separation of. sixteen P AHs after phase switching from
methanol-water (50:50) to hexane. Data on recoveries (80-102%) are included in the
legend to the figure.
Table V. Effect of methanol concentration in water on recovery in on-line extraction-Ge.
RECOVERY (%)
% v/v methanol naphthalene phenanthrene pyrene
20 69 IOI 102
50 66 100 99
65 6 1 JOO 97
80 34 82 90
Column: 2 m x 0.32 mm i.d., 5 µm film. Sample: 0.5 ml 40-50 ng/ml PAH solution sampled at 110 µI/min . Desorption: 85 µl hexane at 50 µI/min. PTV initial tempernture, -10°C.

154 On-line enrichment-GC with open-tubular extraction columns
2 3
7 4
0 11, 12 -i:... 5,6
9,10 8
13 14.15, 16
0 5 15 20 25
tim'9 (min)
I Figure 7. On-line extraction-Ge of 16 PAHs and a system blank (methanol-water). ! Sample: 0.5 ml of a solution of 16 PAHs in methanol-water (50:50); concentrations 200-400 ng/ml (No. l-3) and 20-40 ng/ml (No. 4-16). Sampling flow rate, 110 µI/min. Column: 2 m x 0.32 mm i.d., 5 µm film (swollen with hexane). Desorption: 80 µl of hexane at 25 µI/min. PTV initial temperature, -30°C. GC temperatii.re programme: 40°C (2 min)-+ 10°C/min-+ 275°C. Recoveries: (1) naphthalene, 80%; (2) acenaphtylene, 98%; (3) acenaphtene, 97%; (4) fluorene, 99%; (5) phenanthrene, 100%; (6) anthracene, 97%; (7) fluoranthene, 102%; (8) pyrene, 99%; (9,10) benzo(a)anthracene + chrysene, (97%); (11,12) benzo(b)fluoranthene + penzo(k)fluoranthene, 93%; (13) benzo(a)pyrene, 92%; (14) indeno(l,2,3-cd)pyrene, 88%; (15) dibenzo(a,h)anthracene, 85%; (16) benzo(ghi)perylene, 86%.
Stability of extraction column. An important practical aspect of the use of open-tubular
extraction columns for extraction is the stability of the stationary phase on flushing with
large volumes of .methanol-water and hexane. To this end retention factors were again
determined after 5 months of continuous usage (ca. 600 ml of methanol-water passed
through the column). The decreases in the retention factors were found to vary between
20% (naphthalene) and 33% (pyrene) and are no doubt merely due to degradation and
dissolution of the stationary phase. From this it can be concluded that the solvent
resistance of the column is sufficient to ensure trouble free use for many hundreds of
extractions.

Principles and theoretical considerations 155
Conclusions
Theory allows to describe the influence of various operating conditions, such as flow rate,
column dimensions and diffusion coefficients on the extraction process. In order to extract
analytes quantitatively the sampling flow rates should not exceed a certain maximum value
which only depends on the diffusion coefficient of the analyte in the aqueous phase and
the length of the extraction column. Long OTE columns with small internal diameters are
best suited for use in on-line OTE-GC. Non-polar compounds such as PAHs are easily
retained on a 0.32 mm i.d. capillary coated with a 5 µm siloxane phase. Stationary phase
swelling due to the uptake of large amounts of desorption fluid (hexane) into the stationary
phase leads to a substantial increase of the film thickness and hence the retentive strength
of the column. Elimination of the aqueous phase from the column is easily performed by
shortly purging with nitrogen. The volume of hexane needed for desorption of the
extracted analytes can easily be handled by PTV injection devices. It can be concluded
that OTE columns are highly promising for use in on-line extraction-Ge. The system
described here also holds promise for phase-switching in coupled RPLC-GC.
References
[!] K. Grob in "On-line coupled LC-GC", HUlhig Verlag, Heidelberg, Germany, 1991. [2] K. Grob, J. Chromatogr. 473 (1989) 381-390. (3] K. Grob, A. Arlho, J. High Res. Chromatogr. 14 (1991) 212-214. [4] H.J. Cortes, C.D. Pfeiffer, G.L. Jewett, B.E. Richter, J. Microcol. Sep. I (1989) 28-34. (5] D. Duque!, C. Dewaele, M. Verzele, S. McKinley, J. High Res. Chromatogr. 11 (1988) 824-829. [6] K. Grob, Z. Li, J. Chromatogr. 473 (! 989) 423-430. [7] K. Grob, J. Chromatogr. 477 (1989) 73-86. [8] E.C. Goosens, D. de Jong, J.H.M. van den Berg, G.J.. de Jong, U.A.Th. Brinkman, J. Chromatogr. 552
(! 991) 489-500. [9] J.F. Pankow, L.M. Isabelle, T.J. Kristensen, Anal. Chem. 54 (1982) 1815-1819. [!OJ G. Schomburg, E. Bastian, H. Behlau, H. Husmann, F. Weeke, M. Oreans, F. MUller, J. High Res.
Chromatogr. 7 (! 984) 4-12. (11] J.J. Vreuls, U.A.Th. Brinkman, G.J. de Jong, K. Grob, A Arlho, J. High Res. Chromatogr. 14 (1991)
455-459. [12] H.G.J. Mo!, H.G. Janssen, C.A. Cramers, U.A.Th. Brinkman, J. High Res. Chromatogr. 16 (1993)
459-463 . [13] A. Zlatkis, R.P.J. Ranatunga, B.S. Middleditch, Anal. Chem. 62 (1990) 2471-2478. [14] A Zlatkis, R.P.J. Ranatunga, B.S. Middleditch, Chromatographia 29 (1990) 523-529. [15] D.A.M. MacKay, M.M. Hussein, J. Chromatogr. 176 (1979) 291-303. [16] M.M. Hussein, D.A.M. MacKay, J. Chromatogr. 243 (1982) 43-50. [17] S. Blomberg, J. Roeraade, J. High Res. Chromatogr. 13 (1990) 509-512. [18] A Zlatkis, F.-S. Wang, H. Shanfield, Anal. Chem. 55 (1983) 1848-1852. [19] R.E. Kaiser, R. Rieder, J. Chromatogr. 477 (1989) 49-52. [20] G. Goretti, M.V. Russo, E. Veschetti, J. High Res. Chromatogr. 15 (1992) 51 -54. [21] J. Roeraade, J. Chromatogr. 330 (1985) 263-274. [22] E. Fogelquist, M. Krysell, L.G. Danielson, Anal. Chem. 58 (1986) 1516-1520. [23] P. van Zoonen, G.R. van der Hoff, E.A. Hogendoom, J. High Res. Chromatogr. 13 (1990) 483-488.

156 On-line enrichment-Ge with open-tubular extraction columns
[24] E. Noroozian, F.A. Maris, M.W.F. Nielen, R.W. Frei, G.J. de Jong, U.A.Th. Brinkman, J. High Res. Chromatogr. I 0 (1987) I 7-20.
[25] Th. Noy , E. Weiss, T. Herps, H. van Cruchten, J. Rijks, J. High Res. Chromatogr. I I (1988) 181-186. [26] J.J. Vreuls, V.P. Goudriaan, U.A.Th. Brinkman, G.J. de Jong, J. High Res. Chromatogr. 14 (1991)
475-480. [27] K. Grob, B. Schilling, J. High Res. Chromatogr. 8 (1985) 726-733. [28] J. Staniewski, J.A. Rijks, J. Chromatogr. 623 (1992) 105-113. [29] J. Staniewski, J.A. Rijks, J. High Res. Chromatogr. 16 (1993) 182. [30] C.E. Werkhoven-Goewie, U.A.Th. Brinkman, R.W. Frei, Anal. Chem. 53 (1981) :2072-2080. [31] R.C. Reid, J.M. Prausnitz, T.K. Sherwood (Eds.) "The properties of gases and liquids" , McGraw-Hill,
London, 1977. [32] 0. van Berke!, H. Poppe, J.C. Kraak, Chromatographia 24 (1987) 739-744. [33] P.J. Schoenmakers, H.A.H. Billiet, L. de Galan, J: Chromatogr. 185 (1979) 179-195. [34] S. Blomberg, J. Roeraade, J. High Res. Chromatogr. 13 (1990) 509-512. [35] B.V. Burger, M. le Roux, Z.M. Munro, M.E. Wilka, J. Chromatogr. 552 (1991) 137-151. [36] S. Folestad, M. Larsson, J. Chromatogr. 394 (1987) 455 . [37] P. Lovkvist, J.A. Jonsson, Anal. Chem. 59 (1987) 818-821.
157
5.2 Enhancement of retention power using swelling agents8>
Summary
The applicability of open-tubular extraction columns for on-line enrichment-capillary GC analysis is evaluated. The extraction step involves sorption of the analytes from water into the stationary phase of an open-tubular extraction (OTE) column, removal of the water by purging the column with nitrogen and desorption of the analytes with an organic solvent which is directly introduced into the GC system. The effect of swelling the stationary phase with organic solvents on the retention power of the OTE column is studied. When using pentane or hexane as swelling agent breakth.iough volumes of at least 10 ml can be obtained for non-polar compounds. For a number of medium polar compounds breakthrough volumes of 5 ml can be achieved when chloroform is used as the swelling agent. The required drying time is less than 1 min. Quantitative desorption requires only 75 µl of organic solvent. Solvent elimination prior to transfer of the analytes to the GC column is carried out using a PTV injector and a multidimensional GC system. The system is applied for the analysis of river water, urine and serum samples.
Introduction
On-line extraction-capillary gas chromatography is an attractive method for the analysis of
aqueous samples. As the analytes from the entire sample volume will be quantitatively
transferred to the GC column, sample volumes from 1-10 ml are often sufficient to achieve
detection limits in the sub-ng/ml range. Several methods for on-line extraction-Ge have
been reported in literature: membrane extraction [IJ, liquid-liquid extraction in a
segmented flow [2) and solid-phase extraction with small packed cartridges [3,4) . In these
methods the compounds are transferred from the aqueous solvent to an organic solvent
which is introduced into the GC system. This procedure is often referred to as phase
switching. In membrane extraction an extraction cell containing a short length of silicon
tubing is used. Analytes are extracted from the aqueous phase through the silicon wall into
the organic solvent which flows through the tubing. Liquid-liquid extraction in a
segmented flow appears to be especially useful when on-line derivatization is desired [5,6].
Solid-phase extraction (SPE), a technique that has gained wide spread acceptance in off
line sample preparation [7], has been reported to be a useful alternative to the previous
mentioned techniques.
•> H.G.J. Mo!, H.-G. Janssen, C.A. Cramers, U.A.Th. Brinkman, J. High Res. Chromatogr. 16 (1993) 413-418.

158 On-line enrichment-Ge with open-tubular extraction columns
An important step in on-line extraction-Ge is the removal of water after sampling, as
water can adversely affect the performance of the combined system. When water is
immiscible with the desorption solvent, water remaining in the SPE-cartridge after
sampling can result in reduced desorption efficiencies. On the other hand, when water is
(partially) miscible with the desorption solvent it will be transferred to the Ge-system
deteriorating the system performance (8] . Therefore, a rigorous drying step is necessary
between sorption and desorption. Packed cartridges are generally dried by purging with
nitrogen. Drying times depend on the dimensions of the cartridge and the packing density
and may alter after prolonged usage. Typical drying times are 15-30 min. In case of long
drying times losses of more volatile analytes can occur. Due to channel formation in the
packing, complete water elimination can sometimes be difficult to obtain. A major
improvement in this respect is the use of particle loaded membranes (membrane disks) [9]
which are a very promising alternative to SPE with small cartridges filled with sorbent
particles [10,11]. Typical drying times for extraction disks are 10-20 minutes. Owing to
the rigid structure of the membrane matrix, however, channel formation is highly unlikely .
In contrast to the situation in packed SPE-cartridges, complete removal of water can
easily be achieved by using open-tubular extraction (OTE) columns. This was
demonstrated in a previous study dealing with the principles and theory of the use of OTE
columns [12]. Complete and reliable water elimination was achieved in only 1 min by
purging the column with a low flow of nitrogen.
In this chapter the applicability of wall coated open-tubular columns in on-line
extraction of organic compounds from water is studied. The effect of swelling the
stationary phase with organic solvents prior to water sampling is evaluated. A test mixture
containing priority pollutants with varying polarities is used for system evaluation. The
applicability of the system is demonstrated by a number of real-life samples including
river water, urine and serum samples.
Experimental Instrumentation
The phase-switching device was built around two 10-port valves (Valeo, Houston, TX,
USA). It is schematically depicted in Figure 1. The system consisted of a sampling pump
(Pl) (Phoenix 20, Carlo Erba, Milan, Italy) and a speed-programmable syringe which was
used for desorption (P2) (Digisampler, Gerstel, Millheim aid Ruhr, Germany). A stainless
steel sample loop of 0.5 or 2.25 ml was connected between two ports of valve 1. The
open-tubular extraction column was connected between two ports of valve 2. Columns of
2 m x 0.32 mm i.d., coated with 5 µm CP-Sil-5-CB (Chrompack, Bergen op Zoom, The
Netherlands) or 1.2 µm Carbowax (Chrompack) were used.
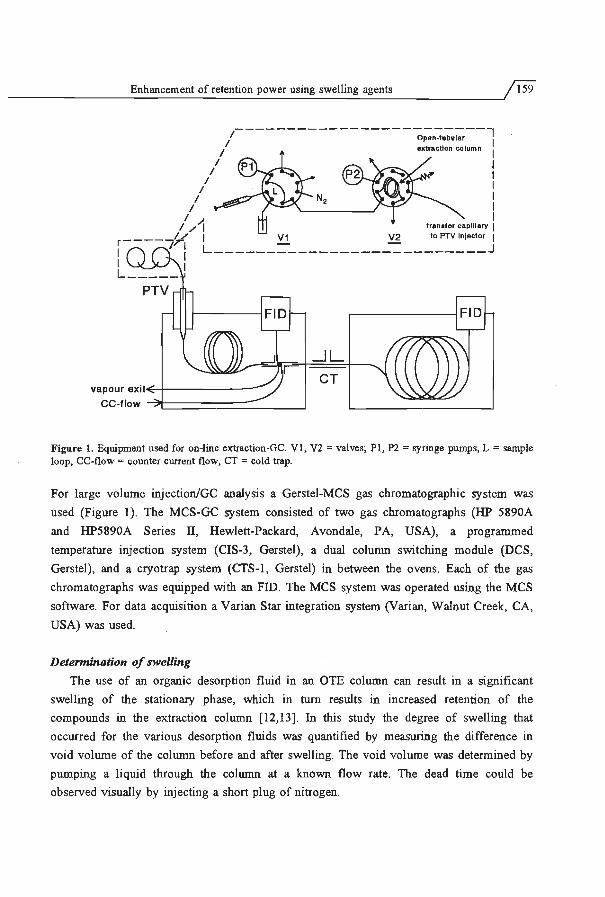
Enhancement of retention power using swelling agents
vapour exit•~+-------CC-flow -"l+--------
_JL CT
159
Figure 1. Equipment used for on-line extraction-Ge. VI, V2 =valves; Pl , P2 =syringe .pumps, L =sample loop, CC-flow = counter current flow, CT = cold trap.
For large volume injection/Ge analysis a Gerstel-MCS gas chromatographic system was
used (Figure I). The MCS-GC system consisted of two gas chromatographs (HP 5890A
and HP5890A Series II, Hewlett-Packard, Avondale, PA, USA), a programmed
temperature injection system (CIS-3, Gerstel), a dual column switching module (DCS,
Gerstel), and a cryotrap system (CTS-1 , Gerstel) in between the ovens. Each of the gas
chromatographs was equipped with an FID. The MCS system was operated using the MCS
software. For data acquisition a Varian Star integration system (Varian, Walnut Creek, CA,
USA) was used.
Determination of swelling
The use of an organic desorption fluid in an OTE column can result in a significant
swelling of the stationary phase, which in turn results in increased retention of the
compounds in the extraction column (12,13]. In this study the degree of swelling that
occurred for the various desorption fluids was quantified by measuring the difference in
void volume of the column before and after swelling. The void volume was determined by
pumping a liquid through the column at a known flow rate. The dead time could be
observed visually by injecting a short plug of nitrogen.

160 On-line enrichment-Ge with open-tubular extraction columns
On-line extraction-Ge
The test mixture used to evaluate the performance of the system contained the
following 14 compounds: toluene, ethylbenzene, methoxybenzene, p-dichlorobenzene, 2,6-
dimethylphenol, 2,6-dimethylaniline, p-chloroaniline, indole, 2,6-dichlorobenzonitrile,
2,4,5-trichlorophenol, p-dinitrobenzene, trifluralin, atrazine and phenanthrene. All solvents
were freshly distilled before use. River water was filtered through a glass filter before
sampling. Urine and serum were analysed without pretreatment.
The position of the valves at the start of an extraction cycle is shown in Figure 1. The
content of the sample loop transferred to the OTE column by pump 1 and the column is
flushed with an additional 150 µl of water. After this valve 1 is switched. The nitrogen
flow now slowly pushes the remaining water out of the column. The total drying time
used is only l min. Meanwhile pump 2 (containing an organic solvent) is started. When
valve 2 is switched the analytes are desorbed from the OTE column and introduced
directly into the PTV injector. Half a minute before the next extraction step, valve 2 is
switched back again to remove the organic solvent (remaining in the column after
desorption) by a flow of nitrogen. Meanwhile the sample loop is filled again after which
the next extraction can take place.
Large volume injection into the PTV-MCS system
For elimination of the organic solvent prior to introduction of the c9mpounds into the
analytical column a two.dimensional gaschromatographic system equipped with a PTV
injector is used [14]. The solvent is vaporized in the PTV injector at a temperature around
the solvent boiling point. The vapour is discharged via a short, wide-bore thick film GC
precolumn, located in the first oven. In this precolumn the analytes which are not retained
in the PTV injector, are trapped while the solvent. is vented through a vapour exit. After
solvent elimination the vapour exit is closed and the PTV injector and the first oven are
heated rapidly. The compounds are then refocussed in the cold trap mounted between the
two ovens. The analytical column is located in the second oven. With this set-up losses of
volatiles during solvent elimination hardly occur.
In the first oven a 5 m x 0.53 mm column with a 5 µm CP-Sil-5-CB film
(Chrompack) was installed. In the second oven a 50 m x 0.31 mm column coated with
0.17 µm Ultra-I (Hewlett-Packard) was mounted. Helium was used as the carrier gas. The
system was operated in the constant flow mode at a flow rate of 4.5 ml/min. During
solvent elimination the vapour exit was open and the carrier gas flow rate was increased to I
accelerate solvent evaporation. The conditions for large volume injection were as follows:
for pentane, dichloromethane and isopropylchloride the total helium flow rate during
introduction was 15 ml/min, the counter current flow rate 20 ml/mi~, the PTV initial

Enhancement of retention power using swelling agents 161
temperature 50°C and the initial temperature of the first oven 35°C. For chloroform these
values were 25 ml/min, 30 ml/min, 50°C and 50°C, respectively. For trichloroethene the
values were 75 ml/min, 30 ml/min, 80°C and 50°C, respectively. The initial temperature of
the cold trap was set to -l 60°C. After elimination of the solvent had reached completion,
as was monitored from the signal of the monitor FID on the first oven, the run of the
MCS was started. The start of the MCS system involved reduction of the carrier gas flow
rate to 4.5 ml/min, switching off the counter current flow, closing of the vapour exit and
starting of the temperature programmes of the injector, cryotrap and the two ovens. The
temperature programmes were as follows: PTV injector, from initial temperature to 275°C
at 2°C/s. First oven: from initial temperature to 240°C (5 min) at 30°C/min. Cryotrap: held
at its initial temperature for 4 min and then heated to 250°C at 5°C/s (10 min) followed by
heating at 1°C/s to 270°C. Second oven: from 60°C to 230°C (1 min) at l 5°C/min. In case
of the real-life samples the final temperatures of both the PTV and the second oven were
300°c.
Results and discussion
The maximum volume of sample that can be passed through an OTE column is
determined by the breakthrough volume of the solute (V8 ), defined as VR- 2.326 cr. Here
VR is the retention volume and cr the standard deviation of the Gaussian peak eluting from
the column. The breakthrough volume of a compound in an extraction column is given by
[15]:
Vs = Vo (1 +k) (1 - 2.326) {N
(I)
where V0 and N are the void volume and the plate number of the OTE column,
respectively, and k is the retention factor of the solute and N the plate number of the OTE
column (with N>5.4). Assuming a high retention factor, eqn. I can be rewritten as [12]:
Vs = K Vs [ 1 - 0.9 ~ D: L J (2)
Here K is the partition coefficient, Vs the volume of the stationary phase, F the sampling
flow rate, DM the diffusion coefficient of the compound in water and L the length of the
OTE column. From eqn. 2 it can be seen that the sampling flow rate should not exceed a
certain maximum value. This has been verified experimentally [12]. For extraction

162 On-line enrichment-GC with open-tubular extraction columns
capillaries of 2 m, as used in this study, flow rates not exceeding 100 µI/min were used in
order to prevent immediate breakthrough.
In practice the most important way to enhance the breakthrough volume with OTE
columns is through maximizing K and V8 . For extracting compound~ from water this
means that, apart from length and diameter of the OTE column, the use ~f a thick film and
a selective stationary phase is essential. In addition to this both K and V~ can be increased
by swelling the stationary phase with an organic solvent prior to water sampling. After
sampling and water removal desorption is carried out with the same organic solvent as was
used for swelling. In this way desorption and renewed phase swelling for the next
extraction is achieved in one step.
The swelling agent in the situation described above is also the desorption solvent and
the solvent to be introduced into the GC system. Therefore a suitable swelling agent
should meet the following requirements: (i) the organic solvent should swell the stationary
phase significantly, (ii) the swelling agent should have a low solubility in water because
otherwise the swelling agent is rapidly stripped from the stationary phase during water
sampling, (iii) the swelling agent should have fayourable evaporation characteristics, iv)
water should not be soluble in the swelling agent. This because water dissolved in the
organic solvent will be transferred to the GC. (v) the analytes should h~ve a high affinity
for the swelling agent.
In this study two types of stationary phases were evaluated, i.e. a dimethylsiloxane
(dr=5 µm) and a Carbowax (dr=l .2 µm) stationary phase. However, ~reliminary results ;
with the Carbowax column were, even after swelling, not very promi~ing. Experiments
were therefore continued only with the dimethylsiloxane column.
Twelve organic solvents, among which the most commonly used extraction solvents,
were tested with respect to the degree of swelling of the siloxane phase in the OTE
column. Some relevant properties of these swelling agents are given in Table I [16, 17].
The uptake of organic solvent in the stationary phase of a 2 m x 0.32 mm i.d., 5 µm CP
Sil-5-CB column was determined by measuring the void volume of the column before and
after rinsing with the organic solvent. The uptake found this way varied from 17 to 50 µl,
depending on the solvent. From the total stationary phase volume the swelling factor (eqn.
3 [13]) as well as the apparent film thickness and the. phase ratio can be calculated. The
values for the twelve organic solvents tested are given in Table I .
. Sv = volume of swollen phase - volume of original ph~ volume of original phase
(3)

Enhancement of retention power using swelling agents 163
Table I. Properties and experimental data of swelling agents.
boiling Solubility Solubility swelling phase do) F..,.,d) f
Swelling agent point°C 0 in W') WinObl factor•> ratio') (µm) µI/min
pentane 36 0.0061 0.0075 4.7 1.9 30.8 190
hexane 69 0.0014 0.0049 4.5 2.0 29.6 72
heptane 98 0.0005 0.0057 4.2 2.1 28.0 28
cyclohexane 81 0.0071 0.0079 4.4 2.0 29.1 40
ethyl acetate 77 9.7 2.7 2.4 3.7 17.8 38
ethyl ether 35 9.0 I. I 4.8 1.8 31.6 180
isopropyl ether 68 1.7 0.43 4.7 1.8 31.3 76
isopropyl chloride 36 0.35 4.2 2.1 27.8 155
dichloromethane 40 0.99 0.27 3.2 2.9 22.l 94
chloroform 61 0.55 0.11 4.4 2.0 29.0 56
trichloroethene 87 0.074 0.046 2.2 4.1 16.4 26
I, I, I-trichloroethane 74 0.098 0.045 1.3 6.0 11.9
•) solubility of the organic solvent in water [16,17]. b) solubility of water in the organic solvent [16,17] . 0> after swelling the stationary phase (5 µm CP-Sil-5-CB) with the organic solvent, eqn. 3. d) evaporation rate according to eqn. 4 [ 18] at conditions given in text.
Next, the possible removal of the organic solvent from the swollen stationary phase by
water was determined by pumping water through the OTE column and measuring the void
volume at distinct intervals. In Figure 2 the volume of organic solvent present in the
stationary phase of the OTB column is plotted against the volume of water pumped
through the column. The rate at which the swelling agent was removed form the OTE
column by water is, as expected, high for the relative polar ethyl acetate and diethylether.
In fact, the stripping rate (in µI/ml water) approximately resembles the solubility of the
organic solvent in water. From Figure 2 it can be concluded that ethyl acetate and
diethylether are not suited as swelling agents because they are removed from the column
by only half a milliliter of water. Also l , l, I-trichloroethane is not suited because phase
swelling is less pronounced for this solvent.
Another important aspect to consider in selecting a desorption/swelling agent is the
speed with which it can be introduced into the PTV injector. With the current set-up the
introduction speed should not exceed the evaporation rate of the solvent. The evaporation
rates of the swelling agent can be calculated from [ 18]:
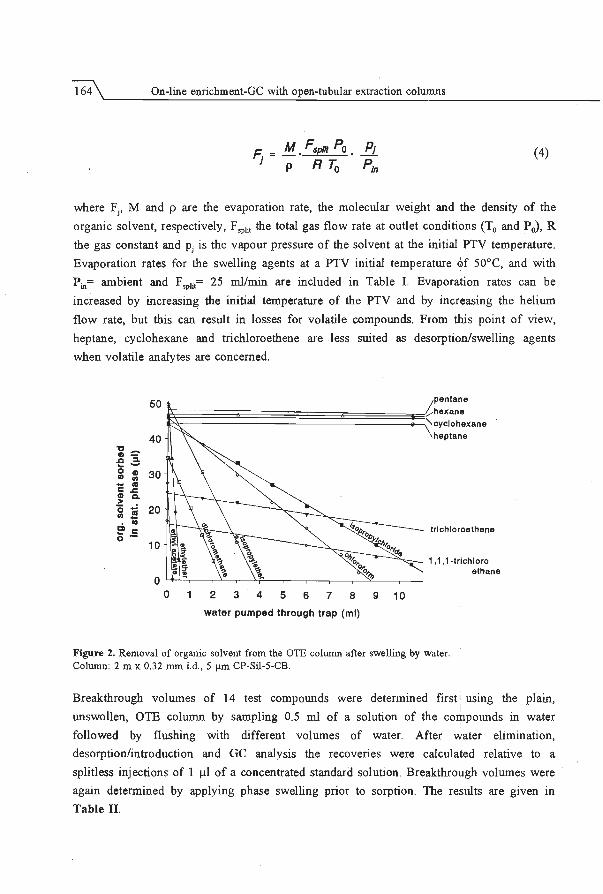
164 On-line enrichment-GC with open-tubular extraction columns
(4)
where Fi, M and p are the evaporation rate, the molecular weight and the density of the
organic solvent, respectively, F,plit the total gas flow rate at outlet conditions (T0 and P0) , R
the gas constant and Pi is the vapour pressure of the solvent at the initial PTV temperature.
Evaporation rates for the swelling agents at a PTV initial temperature 6f 50°C, and with
Pin= ambient and F,pJit= 25 ml/min are included in Table I. Evaporation rates can be
increased by increasing the initial temperature of the PTV and by increasing the helium
flow rate, but this can result in losses for volatile eompounds. From this point of view,
heptane, cyclohexane and trichloroethene are less suited as desorption/swelling agents
when volatile analytes are concerned.
50 1pentane
~~~~~~§:======~====~======:::=:!:~?-hexane 40
~ :-..c :i
~ i 30 c ~ ~ a.
2 ~ 20 • II)
l:' c 0 -
10
l '- cyclohexane
0 2 3 4 5 6 7 8 9 10
water pumped through trap (ml)
heptane
trlchloroethene
1 , 1, 1-trichloro ethane
Figure 2. Removal of organic solvent from the OTE colwnn after swelling by water. Column: 2 m x 0.32 mm i.d., 5 µm CP-Sil-5-CB.
Breakthrough volumes of 14 test compounds were determined first : using the plain,
unswollen, OTE column by sampling 0.5 ml of a solution of the compounds in water
followed by flushing with different volumes of water. After water elimination,
desorption/introduction and GC analysis the recoveries were calculated relative to a
splitless injections of 1 µl of a concentrated standard solution. Breakthrough volumes were
again determined by applying phase swelling prior to sorption. The results are given in
Table II.
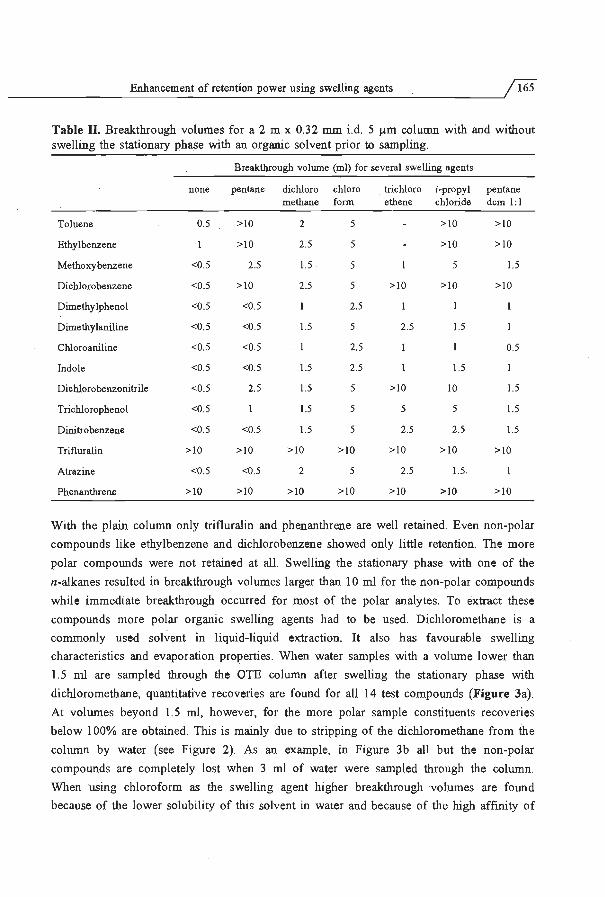
Enhancement of retention power using swelling agents 165
Table II. Breakthrough volumes for a 2 m x 0.32 mm i.d. 5 µm column with and without swelling the stationary phase with an organic solvent prior to sampling.
Breakthrough volume (ml) for several swelling agents
none pentane dichloro chloro trichloro i-propyl pentane methane form ethene chloride dcm 1:1
Toluene 0.5 >JO 2 5 >JO >10
Ethyl benzene >10 2.5 5 >10 >10
Methoxybenzene <0.5 2.5 1.5 5 5 1.5
Dichlorobenzene <0.5 >10 2.5 5 >10 >10 >10
Dime thy !phenol <0.5 <0.5 2.5
Dimethylaniline <0.5 <0.5 1.5 5 2.5 1.5
Chloroaniline <0.5 <0.5 2.5 0.5
Indole <0.5 <0.5 1.5 2.5 1.5
Dichlorobenzonitrile <0.5 2.5 1.5 5 >10 10 1.5
Trichlorophenol <0.5 1.5 5 5 5 1.5
Dinitrobenzene <0.5 <0.5 1.5 5 2.5 2.5 1.5
Trifluralin >10 >10 >10 >10 > 10 > 10 >10
Atrazine <0.5 <0.5 2 5 2.5 1.5.
Phenanthrene >10 > 10 >10 > 10 >10 >IO >10
With the plain column only trifluralin and phenanthrene are well retained. Even non-polar
compounds like ethylbenzene and dichlorobenzene showed only little retention. The more
polar compounds were not retained at all. Swelling the stationary phase with one of the
n-alkanes resulted in breakthrough volumes larger than 10 ml for the non-polar compounds
while immediate breakthrough occurred for most of the polar analytes. To extract these
compounds more polar organic swelling agents had to be used. Dichloromethane is a
commonly used solvent in liquid-liquid extraction. It also has favourable swelling
characteristics and evaporation properties. When water samples with a volume lower than
1.5 ml are sampled through the OTE column after swelling the stationary phase with
dichloromethane, quantitative recoveries are found for all 14 test compounds (Figure J a).
At volumes beyond 1.5 ml, however, for the more polar sample constituents recoveries
below 100% are obtained. This is mainly due to stripping of the dichloromethane from the
column by water (see Figure 2). As an example, in Figure 3b all but the non-polar
compounds are completely lost when 3 ml of water were sampled through the column.
When using chloroform as the swelling agent higher breakthrough volumes are found
because of the lower solubility of this solvent in water and because of the high affinity of

166 On-line enrichment-GC with open-tubular extraction columns
most of the components for the chloroform-swollen phase. Two other solvents were also
tested. Trichloroethene, because it is more polar than the alkanes and still has a low
solubility in water, and isopropylchloride because of its high solvent elimination rate in the
PTV-GC system. However, except for toluene, ethylbenzene, dichlorobenzene and
dichlorobenzonitrile, the breakthrough volumes observed for these two solvents were equal
to or lower than those obtained for chloroform. Finally, the use of a mixed swelling agent
was tested, i.e. pentane/dichloromethane 1:1, in order to create a swollen phase which is
more polar than pentane and that would have a better resistance towards stripping by water
than a dichloromethane swollen phase. For most of the polar compounds, however, the
results were not better than those of pure dichloromethane, indicating that the mixed phase
was not sufficiently polar or that dichloromethane was rapidly stripped from the
siloxane/pentane layer.
A s 6 B
3 8
12 4 7 14 14 2 4
11 10 12 12 9
13
~ I I
8 12 16 min 8 12 16 min
Figure 3. GC-FID chromatograms obtained after sampling 1 ml (A) and 3 ml (B) of water through a 2 m x 0.32 mm i.d. column with a 5 µm stationary phase swollen with dichloromethane. Sampling flow rate 100 µI/min, desorption with 75 µI dichloromethane. Compounds: 1) toluene, 2) ethylbenzene, 3) methoxybenzene, 4) p -dichlorobenzene, 5) dimethylphenol, 6) dimethylaniline, 7) p -chloroaniline, 8) indole, 9) dichlorobenzonitrile, 10) trichlorophenol, 11) dinitrobenzene, 12) trifluralin, 13) atrazine and 14) phenanthrene (ca. 40 ng/compound).
In the experiments described above a 2 m OTE column was used. If l;rrger breakthrough
volumes are required, longer columns (e.g. 5 m) can be used. This also allows the use of
higher sampling flow rates [12) which results in acceptable sampling times when analysing
sample volumes larger than 1 to 2 ml.

Enhancement of retention power using swelling agents 167
A
B 5
4 6
2 8 3
10
7 9 13 11 14
1 12
_J" l.J '''· I I. l .. Lu\
6 10 14 min 18
Figure 4. On-line extraction-Ge of water from river Dommel. -(A) 2 .25 ml river water, (B) 2.25 ml river water spiked at the 5 ng/rnl level with the compounds given in Figure 3. Swelling agent: chloroform, other conditions: see Figure 3.
After the sorption step, water is removed from the OTE column by a 1 min drying step
with a nitrogen purge flow of 1 ml/min. Next the compounds are desorbed from the
column with the desorption/swelling agent. For all solutes the volume needed for
desorption was found to be 75 µl, irrespective of which organic solvent was used. The
desorption/introduction flow rate into the PTV-GC system is determined by the volatility
of the analytes, the properties of the solvent and the PTV-GC conditions. For pentane,
dichloromethane and isopropylchloride a flow rate of 75 µI/min was used. For chloroform

168 On-line enrichment-GC with open-tubular extraction columns
and trichloroethene a desorption flow rate of 25 µI/min was applied. For elimination of the
organic solvent prior to introduction of the compounds into the analytical column a two
dimensional gaschromatographic system equipped with a PTV injector is used. Important
parameters affecting the solvent elimination process in the PTV-MCS system are the PTV
initial temperature, the temperature of the first oven, carrier gas flow rate through the GC
precolumn, introduction flow rate, sample volume and the physico-chemical properties of
the solvent [14]. Here, for large volume introduction, all compounds in the test mixture
could be quantitatively transferred to the analytical column when pentane, dichloromethane
or isopropylchloride were used as solvent. In case of chloroform, toluene was partially Jost
due to the small difference in boiling points between the solvent and this test compound.
For the same reason both toluene and ethylbenzene were partially lost when
trichloroethene was used as the solvent.
A B 1 2
2
3 3
5
4 6 4 5
8 12 16 min 20 8 12 16 20 min
Figure 5. On-line extraction-Ge of (A) 0.5 ml of urine and (B) 0.5 ml of serum spiked at the 20-40 ng/ml level. Peak assignment: I) toluene, 2) ethylbenzene, 3) p-dichlorobenzen, 4) 1,2,4-trichlorobenzene, 5) lindane, 6) heptachlor. Sorption flow rate, 100 µI/min ; swelling agent, dichloromethane; desorption volume, 75 µI.
To evaluate the applicability of on-line extraction-Ge using OTE columns for real-life
samples, river water was spiked with the compounds from the test mixture at a 5 ng/ml
level. A volume of 2.25 ml was sampled through the column which was then flushed with
0.15 ml of distilled water. Chromatograms of a blank and a spiked river water sample are
shown in Figure 4. No significant differences in recovery were observed when comparing
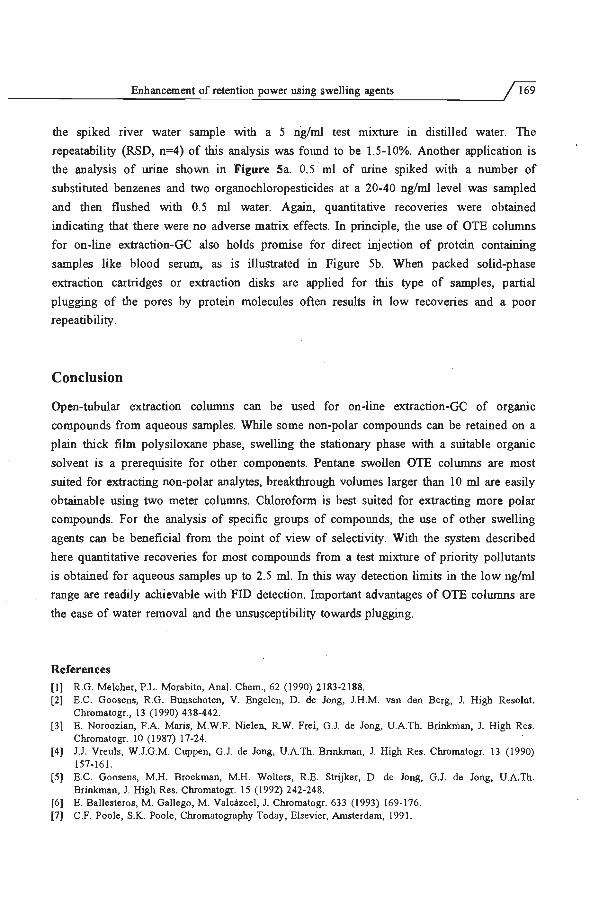
Enhancement of retention power using swelling agents 169
the spiked nver water sample with a 5 ng/ml test mixture m distilled water. The
repeatability (RSD, n=4) of this analysis was found to be 1.5-10%. Another application is
the analysis of urine shown in Figure 5a 0.5 · ml of urine spiked with a number of
substituted benzenes and two organochloropesticides at a 20-40 ng/ml level was sampled
and then flushed with 0.5 ml water. Again, quantitative recoveries were obtained
indicating that there were no adverse matrix effects. In principle, the use of OTB columns
for on-line extraction-Ge also holds promise for direct injection of protein containing
samples like blood serum, as is illustrated in Figure Sb. When packed solid-phase
extraction cartridges or extraction disks are applied for this type of samples, partial
plugging of the pores by protein molecules often results in low recoveries and a poor
repeatibility.
Conclusion
Open-tubular extraction columns can be used for on-line extraction-Ge of organic
compounds from aqueous samples. While some non-polar compounds can be retained on a
plain thick film polysiloxane phase, swelling the stationary phase with a suitable organic
solvent is a prerequisite for other components. Pentane swollen OTE columns are most
suited for extracting non-polar analytes, breakthrough volumes larger than 10 ml are easily
obtainable using two meter columns. Chloroform is best suited for extracting more polar
compounds. For the analysis of specific groups of compounds, the use of other swelling
agents can be beneficial from the point of view of selectivity. With the system described
here quantitative recoveries for most compounds from a test mixture of priority pollutants
is obtained for aqueous samples up to 2.5 ml. In this way detection limits in the low ng/ml
range are readily achievable with FID detection. Important advantages of OTE columns are
the ease of water removal and the unsusceptibility towards plugging.
References (!] R.G. Melcher, P.L. Morabito, Anal. Chem., 62 (1990) 2183-2188. (2) E.C. Goosens, R.G. Bunschoten, V. Engelen, D. de Jong, J.H.M. van den Berg, J. High Resolut.
Chromatogr., 13 (1990) 438-442. [3] E. Noroozian, F.A. Maris, M.W.F. Nielen., R.W. Frei, G.J. de Jong, U.A.Th. Brinkman, J. High Res.
Chromatogr. IO (1987) 17-24. (4] J.J. Vreuls, W.J.G.M. Cuppen, G.J. de Jong, U.A.Th. Brinkman, J. High Res. Chromatogr. 13 (1990)
157-161. [5) E.C. Goosens, M.H. Brockman, M.H. Wolters, R.E. Strijker, D. de Jong, G.J. de Jong, U.A.Th.
Brinkman, J. High Res. Chromatogr. 15 (1992) 242-248. (6] E. Ballesteros, M. Gallego, M. Valcazcel, J. Chromatogr. 633 (1993) 169-176. [7] C.F. Poole, S.K. Poole, Chromatography Today, Elsevier, Amsterdam, 1991.
170 On-line enrichment-Ge with open-tubular extraction columns
[8] J.J. Vreuls; R.T. Ghijsen, G.J. de Jong, U.A.Th. Brinkman, J. Chromatogr. 625 (1992) 237-245. [9] P.J.M. Kwakman, J.J. Vreuls, U.A.Th. Brinkman, R.T. Ghijsen, Chromatographia,34 (1992) 41-47. [10] W.P.N. Fernando, M.L. Larrive, C.F. Poole, Anal. Chem. 65 (1993) 588-595. [I I] T. McDonnell, J. Rosenfeld, J. Chromatogr. 629 (1993) 41-53 . [12] H.G.J. Mo!, J. Staniewski, H.-G. Janssen, C.A. Cramers, R.T. Ghijsen, U.A.Th. Brinkman, J.
Chromatogr., 630 (1993) 201-212. [13] S. Folestad, M. Larsson, J. Chromatogr., 394 (1987) 455-464. [14] J. Staniewski, H.-G. Janssen, C.A. Cramers, in P. Sandra (ed), "Proc. 15th Internal. Symp. Capillary
Chromatogr.", Riva de! Garda, Huthig, Heidelberg, 1993, p. 808-813. [15] C.E. Werkhoven-Goewie, U.A.Th. Brinkman, R.W. Frei, Anal. Chem., 53 (1981) 2072-2080. [16] Y. Marcus, "Introduction to liquid state chemistry", Wiley Interscience, New York, 1977. [17] H. Stephan, T. Stephan, "Solubility of inorganic and organic compounds", vol. ), part I , Pergamon,
New York, 1963. [18] J. Staniewski, J.A. Rijks, J. Chromatogr., 623 (1992) 105-113.

171
5.3 Increase of sampling flow rate using geometrically deformed capillaries9>
Summary
The effect of geometrical deformation of open-tubular extraction columns on peak dispersion of retained solutes is evaluated. By coiling or stitching of the columns peak dispersion is decreased, with a factor of two and more than five, respectively, due to secondary flow enhanced radial dispersion. This enables the increase of sampling flow rates in on-line extraction-Ge using open-tubular extraction columns to 4 ml/min while still obtaining quantitative trapping of the analytes.
Introduction On-line sample enrichment of aqueous samples for GC analysis is often based on
solid-phase extraction. Here the analytes from 1-10 ml of an aqueous sample are first
trapped in an extraction column and then desorb.ed by a small volume of organic solvent
(typically 75-125 µl) which is directly introduced into the GC system. Before desorption
can take place water, remaining in the extraction column after sampling, has to be
removed rigorously . This is necessary for efficient desorption and to prevent the transfer of
water into the GC as this can deteriorate the performance of the system [1].
The removal of water from the extraction column can be performed by purging with
nitrogen gas. For packed extraction columns drying with a gas can take 30 min or more
[2] and complete water elimination is sometimes difficult to achieve due to channel
formation in the packing [3]. Moreover, due to the high nitrogen flows used (> 100
ml/min) loss of volatile analytes may occur [4] . Therefore, as an alternative to drying with
a gas, the use of a drying column has be.en proposed [5]. In this case sampling is
immediately followed by desorption with an organic solvent in which water is (slightly)
soluble. Water from the extraction column is led to waste via a valve until the front of the
. desorption solvent has reached the valve. Then the valve is switched and the solvent is
directed to a column packed with a drying agent (an anhydrous salt or silica) . which
•J H.G.J. Mo!, H.-G. Janssen, C.A. Cramers, U.ATh. Brinkman, J. Microcol. Sep., in press.
172 On-line enrichment-Ge with open-tubular extraction columns
removes water from the solvent before introduction into the GC. Although the
incorporation of a drying column prevents the introduction of. water into the GC system,
several limitations were also reported. Silica reacted with some highly chlorinated phenols,
and with sodium sulphate disintegrated particles were transferred to the GC system when
using the drying column for more than 20 analyses.
In contrast to the situation for packed extraction columns, complete removal of water
is easily achieved when open-tubular extraction (OTE) columns are used [6). Here the
analytes are trapped in the stationary phase of a short piece of GC column. Water is
efficiently removed by purging briefly with a low flow of nitrogen gas and losses of
volatile analytes (toluene) do not occur [7]. On the other hand, the use of OTE columns
has, in principle, two · disadvantages compared with the use · of packed ·columns: (i) the
retention power is generally weaker and (ii) the sampling flow rate is limited due to slow
diffusion of the analytes in the water. In chapter 5.1 and 5.2 it was demonstrated that the
retention power of an OTE column -in fact a 2 m piece of GC column- can be greatly
enhanced by swelling the stationary phase with an organic solvent prior to sampling [7].
This enabled the practical use of OTE columns for on-line extraction-Ge of aqueous
samples up to some 2.5 ml. For larger sample volumes the sampling time became
unacceptably long due to the low sampling flow rate (ca. 200 µI/min) that had to be used.
The low sampling flow rate, needed to prevent immediate breakthrough of the analytes
from the OTE columns, stems from the slow radial mass transfer in the tube. Radial mass
transfer in open tubes can be enhanced by geometric deformation (e.g. coiling, stitching,
waving) of the tube [8-1 O]. The explanation for this is that in deformed tubes centrifugal
forces are active which generate a so-called secondary flow in radial direction. As a
consequence, the analytes are transported to the · column wall not only by molecular
diffusion but also by convection. Detailed theoretical and experimental descriptions of
peak dispersion in helically coiled columns have been published by Tijssen [8,9]. Hofmann
and Halasz [10] also evaluated peak dispersion in squeezed, twisted and waved tubes. In
chromatographic practice geometrically deformed tubes are applied to reduce peak
dispersion in open-tubular reactors used in post-column reaction systems in LC [11] and in
flow injection analysis [12,13].
In the majority of the publications dealing with deformed tubes the solutes have no
interaction with the column wall, i.e. the analytes are not or only weakly retained in the
tube (retention factor, k < 2). In this chapter peak dispersion of retained solutes (k > 2) in
geometrically deformed extraction columns is compared with that in straight extraction
columns. The aim is to increase the maximum allowable sampling flow rates in on-line
extraction-Ge using open-tubular extraction columns.

~~~~~~~~~~~~G~eo_m_e_tn_._call~y_d_e_fi_orm~e_d_e_x_tr_ac_t_io_n~ca~p_ill_an~·e_s~~~~~~~-.J~
Experimental Chemicals. Methanol and acetonitrile (HPLC grade) were obtained from Merck
(Darmstadt, Germany). Water was demineralized and purified using a Milli-Q water
purification system (Millipore, Bedford, USA). Hexane (P.A., Merck) was freshly distilled
before use. Polycyclic aromatic hydrocarbons (PAH) were from K&K Laboratories
(Plainview, NY, USA) and organochlorine pesticides were from Polyscience (Niles, IL,
USA).
Determination of peak dispersion. For the determination of peak dispersion an LC
system was used consisting of a gradient LC pump (model PU 4100 LC, Unicam,
Eindhoven, The Netherlands), a six-port valve with a 20 µI loop, an open-tubular
extraction column and a UV detector (model 785A, Separations, Hendrik Ido Ambacht,
The Netherlands). Different lengths (1-5 m) o~ th,e following GC columns were used as
extraction column: 0.32 i.d. fused silica capillaries coated with 5 µm CP-Sil-5-CB,
(Chrompack, Middelburg, The Netherlands) and 0.50 mm i.d. Ultimetal capillaries coated
with 5 or 13 µm CP-Sil-5-CB (generous gift of Chrompack). Further a 0.21 mm i.d.
stainless steel capillary was dynamically coated with 0.6 µm of crosslinked SE-54. In
experiments in which straight columns are evaluated, the columns are in fact bent into one
single loop for practical reasons. Experiments with tightly coiled columns were performed
using metal columns. The metal columns were coiled around ca. 2 mm o.d. iron rods or
stitched through a plastic frame as shown in Figure 1. Peak dispersion was calculated
from the band width of the P AH eluting from the extraction column after injection of 4-8
µg/ml solutions of the PAH dissolved in the mobile phase.
B
-2 mm -9 mm
Figure I. Geometry of coiled and stitched open-tubular extraction columns.

174 On-line enrichment-Ge with open-tubular extraction columns
On-line extraction. The system used for on-line extraction-Ge is schematically depicted in
Figure 2. The extraction unit was built around two IO-port valves (Valeo, Houston, TX,
USA). It consisted of a sampling pump (LC pump, see above) and a pump used for
desorption/introduction of the analytes into the GC system (Digisampler, Gerstel, Millheim
aid Ruhr, Germany). A 0.5 ml sample loop was connected between twp ports of valve I.
The open-tubular extraction columns were connected between two ports of valve 2. In
Figure 2 the position of the valves at the start of an extraction cycle is shown. The content
ofthe sample loop is transferred to the extraction column by pump I and the loop and the
column are flushed with an additional 0.5 ml of methanol-water (20:80). Then valve I is
switched . and nitrogen gas (I ml/min) slowly pushes the remaining; water out of the
column (0.5-2.5 min depending on the dimensions of the extraction column). Next, pump
2 is started and valve 2 is switched. Now the analytes are desorbed from the column with
hexane (225 µI/min) which is directly introduced into a PTV injector. Fbr desorption 50 to
280 µl of hexane were needed, depending on the column dimensions. Half a minute before
the next extraction, valve 2 is switched again in order to remove the organic solvent
(remaining in the column after desorption) by nitrogen. Meanwhile the sample loop is
filled again and the next extraction can take place. For extraction of the: I 0 ml samples the
loop was removed. In this case one of the eluent bottles of the gradient LC pump was
filled with 'the sample and pump I was connected to the port positioned Ort the left·hand
side of the port with the transfer line to valve 2.
V2
Opeh-tubular I
extractlo·n column
transfer capil lary
to PTV injector
Figure 2. Schematic diagram of the set-up used for on-line extraction. Vi and V2 are valves, L = 0.5 ml loop, Pl and P2 are pumps filled with methanol-water (20:80) and hexane, respectively.·
Large volume injection/GC analysis. For large volume injection/Ge analysis a gas
chromatograph (Model 5890, Hewlett Packard, Avondale, PA, USA) wi;th flame ionization
detection (FID) and equipped with a programmed-temperature injection system (PTV
injector) (CIS-3, Gerstel) was used. The PTV injector was equipped With a porous glass

~~~~~~~~~~~-G_e_o_m_e_tn_·c_all--'-y_d_e£~p_rm~ed~ex_tr_ac_t_io_n_c_a~p-ill_an_·_es~~~~~~~_,,/175
bed liner and the split vent was modified as described previously [14). Hexane entering
the PTV injector (25°C) was vaporized and eliminated via the open split exit (split flow
600 ml/min). When desorption was complete the analytes, concentrated in the liner, were
splitlessly transferred to the GC column by heating the PTV at 12°C/s to 300°C (splitless
time 1.5 min). GC separation was performed on a 25 m x 0.32 mm i.d. column coated
with 0.52 µm Ultra-I (Hewlett Packard), temperature programme: from 50°C (1 min) at
20°C/min to 300°C (1.5 min). Helium was used as the carrier gas (100 kPa). For data
collection, an Omega integration system (Perkin Elmer, Norwalk, CT, USA) was used.
Theoretical
Flow projiies. In coiled tubes centrifugal forces produce a secondary flow in radial
direction [8,9). At low velocities these forces are still weak and the secondary flow
manifests itself in the formation of two radial circular patterns which tend to divide the
cross-section of the tube into two equal parts, i.e. two parallel identical columns with d = 0.5·d. are formed. The axial velocity profile at these low velocities still resembles the
parabolic profile after Poiseuille. At higher velocities the centrifugal forces increase
shllll'lY which results in a more linear axial velocity profile. At very high velocities the
axial profile tends to plug flow while turbulence sets in. In practice, for the open-tubular
extraction columns (0.25-0.50 mm i.d., flow rates 0.1-4.0 ml/min) the velocities are low to
intermediate (0.85-135 emfs). As the Reynolds number (Re, see eqn. 7) under these
conditions is below 340, the flow profile is laminar for the experiments described in this
work.
Peak dispersion in straight open-tubular columns under laminar flow conditions can be
described by the Golay equation:
or
with
H = 2 D,., u
K f(k) d: 2 k df + ·u + -· ·-·u
2 D,., 3 (1 + 1<)2 Ds
8 H = - + c,., u +. Cs u u
f(R} 1+6k+11k2
(1 + k)2
(Ia)
(lb)
(2)

176 On-line enrichment-GC with open-tubular extraction columns
where H is the plate height (m), u the linear velocity (m·s-1), and DM and Ds (m2·s·1
) are
the diffusion coefficients of the analyte in the mobile phase and the stationary phase,
respectively, and k is the retention factor. K is a function of the shape of the velocity
profile and is called the velocity profile factor (= 1/48 for straight columns), d, is the
column diameter and dr the film thickness of the stationary phase. The B term in eqn. 1 b
represents axial molecular diffusion. The C terms represent resistance to mass transfer in
the mobile phase (~) and stationary phase (Cs). At the velocities applied during
extraction the contribution of axial molecular diffusion to peak dispersion can be
neglected. If we further neglect the stationary phase contribution to chromatographic band
broadening, eqn. 1 a can be simplified to:
2 H = 11: f(k) d.e ·u
2DM (3)
In straight tubes radial dispersion is determined by DM alone. In deformed tubes radial
dispersion is the combined effect of molecular diffusion and convection by the secondary
flow. The radial dispersion coefficient, DR , is given by [8]:
(4)
where DsF is the secondary-flow dispersion coefficient. Taking the enhanced radial mass
transport into account one has to write eqn. 3 as:
2 H = 11: f(k) de ·u
2 DR (5)
where both DR and K. are functions of the velocity. In coiled open-tubular columns theory
predicts [9) that both . K and DR are mainly dependent on the ~elocity parameter De2Sc.
Here De (Dean number) and Sc (Schmidt number) are dimensionless numbers defined as:
De = Re ./I
where Re is the dimensionless Reynolds number defined as:
Re= p u de TJ
(6)
(7)

~~~~~~~~~~~~G_e_o_m_etn~·_call---'-y_d_e_£_orm~e_d_e_xtr~act~io_n_c_a~p-ill_an~·e_s~~~~~~~_Jj'1Ti
with p (kg·m-3) and ri (cPoise = 10-3 kg·m·1-s-1
) being the mobile phase density and
dynamic viscosity, respectively. The parameter A, (aspect ratio) is the ratio of the column
radius and the coil radius:
The Schmidt number is defined as:
Sc= _TJ_ po,,,
(8)
(9)
When the linear velocity in eqn. 7 is substituted by u = F/(0.25 7t d/), F being the flow
rate, and the eqns. 6-9 are combined, the followitig expression for De2Sc can be found:
(10)
Tijssen gave qualitative and quantitative descriptions of the plate height and the radial
dispersion in coiled columns as a function of De2Sc. For De2Sc < 10, i.e. at low flow rates
and/or large coil diameters, secondary flow does not contribute to radial dispersion. Hence,
the plate height equals that of a straight column. For De2Sc > 10 secondary flow develops
gradually and is well established at De2Sc > 104. Roughly, for De2Sc numbers between 104
and 106 the plate height has a plateau value equal to ca. H.lnigh/4. This is explained by the
formation of the two identical parallel column halves which reduces the column diameter
by a factor of two. At still higher values of De2Sc, peak dispersion decreases more or less
linear to H,,0 /H,1raight = 10-4 at De2Sc = 109•
In previous work· [7] a 2 m x 0.32 mm i.d. x 0.45 mm o.d. open-tubular extraction
column was used. This column was coiled around a standard Ge-column frame {R.,.,i1 = 80
mm). The maximum allowable sampling flow rate for this column was found to be approx.
100 µI/min. If the diffusion coefficient of the solutes in water is estimated to be 0.5 ·10-5
cm2/s it can be calculated that De2Sc equals 176. This means that in this case radial
dispersion is hardly increased compared with the situation encountered for straight
columns. By coiling the column very tightly around a 2 mm o.d. rod (R,,0 i1 = 1.225 mm)
one can increase De2Sc to approx. 104 which should correspond with a reduction of peak
dispersion by a factor of about four. Alternatively, and more important for the work
described in this chapter, the sampling flow rate can be increased by a factor of four
without affecting the ·breakthrough vo1ume. This will be experimentally verified.

178 On-line enrichment-GC with open-tubular extraction columns
Results and discussion
Peak dispersion in coiled extraction columns
For evaluation of the effect of coiling on peak dispersion two short metal GC columns
of different length and diameter were used. Three polycyclic i\l'Oll).atic hydrocarbons
(naphthalene, phenanthrene and pyrene) were used as test compounds. First the band
broadening was measured for the 'straight' CR.coil > 300 mm) columns. Then the columns
were tightly coiled and the band broadening was measured again applying the same
experimental conditions. In Figure 3 the calculated and experimental plate height for a
straight column, and the experimental plate height for the same, but now tightly coiled
column, are shown as a function of the flow rate. For the straight columns the
experimental values for the plate height were ' generally in good agreement with the
theoretical values although, for low k values (k,,,,2), experimental plate heights were
sometimes lower (1.3-1.6 times) than calculated. Coiling clearly reduced band broadening
and, as expected, the effect was more pronounced at higher flow rates (eqn. 10). The
reduction in peak dispersion for naphthalene and the more strongly retained phenanthrene
was found to be similar.
4&0 A ..... 350 Naphthalene (k - 3)
300
e 250 ~ :c 200
150
100
50
Flow rate (ml/min)
/ • straight 350
300
250
e 200 ~
coiled :c ,60
100
50
B Phenanthrene (k - 8) !
coil ad
o"'-~~.---~--,.--~--.~~--,
0.00 0.25 0 ,50 0.75 1.00
Flow rate (ml/min)
Figure 3. Theoretical (dashed line) and experimental (solid line) peak dispersion in straight and tightly coiled (Rooil = 1.13 mm) open-tubular extraction columns. Column: 550 cm x 0.50 mm i.d., 5 µm CP-Sil-5 CB, mobile phase acetonitrile-water (20:80). For theoretical peak dispersion in straight columns DM was calculated using the modified Wilke-Chang equation [1 5].
According to Tijssen [8,9] radial dispersion in coiled columns mainly depends on the
velocity parameter De2Sc. It should therefore be possible to obta~n a single curve,
irrespective of the values of de, A., and DM, by plotting the relative plate height,
(H,0;/H,,,..;gh.), against De2Sc. For De < 20 this curve should also be independent of the
retention factor. This should enable us to fit the plate height data obtain'ed for the different

~~~~~~~~~~~~-G~eo_m~etn~·c_ru_ly'--d_e_fo_rm~e_d_e_x_tr_a_cn_·o_n~ca~p~il_l_an_·e_s~~~~~~~___,;'179
P AHs and extraction columns into a single graph. The resulting plot is depicted in Figure
4. Up to De2Sc values of 103 no reduction of band broadening was observed. For higher
De2Sc values the relative plate height for the coiled columns decreases with increasing
De2Sc to reach a value of ca. 0.5 at De2Sc ~ 5· 104. This obviously is more or less a
plateau situation.
• 1.00 I
& 0.75 .,,
.c .. i • 0
II .,, :c: ...,,_
0 .50 0
:cu
I • • D e • • II
0 0
0.25
o:oo 3 4 5 6
log De2Sc
Figure 4. Relative peak dispersion in coiled open-tubular extraction columns. (•) naphthalene (k=2.4) and (Y) phenanthrene (k=8.7) mobile phase: acetonitrile-w11ter (20:80), ( •) phenanthrene (k=2.3) acetonitrilewater (30:70), column: 205 cm x 0.21 mm i.d., 0.6 µm SE-54, R,.u = 1.03 mm; (O) naphthalene (k=2.8) and (.e.) phenanthrene (k=7.7) mobile phase acetonitrile-water (20:80), column: 550 x 0.50 mm i.d., 5 µm CP-Sil-5 CB, R".a = 1.13 mm.
Qualitatively, the plot of Figure 4 is rather similar to the one presented by Tijssen [13].
Quantitatively, the main difference is that the plateau value of H00;/H,tnight found for De2Sc
= 104-106, is approx. 0.50 rather than 0.25 as reported by Tijssen. Another difference is
that Tijssen reported a strong increase in H00;11II,1raigh• when the retention factor of the
solutes increased from 0 to 1.3 [9]. In the present study, where the retention factors varied
between 2.3 and 8.7, such an increase was not observed. Tijssen attributed the
unfavourable effects found for retained solutes to so-called interphase effects. Interphase
effects arise from the existence of a sublayer of mobile phase along the column wall in
which no radial dispersion due to convection takes place. In the sublayer, interphase mass
transfer is only caused by molecular diffusion. To account for the resistance to mass
transfer in the sublayer an extra term, C1 , has to be added to the C terin of the Golay
equation [9]:
(11)

180 On-line enrichment-Ge with open-tubular extraction columns
with
(12)
In coiled tubes and at higher velocities, CM is reduced due to secondary flow enhanced
radial dispersion (eqn. 5) and, hence, the cl term can become the dominating contribution
to band broadening (9,16]. C1 increases with the retention factor ([k/(1 +k)]2 term) which
explains the strong dependence of the plate height on k found by Tijssen. It probably also
explains the absence of such a dependence in our study as for k > 2.3 the C1 term
becomes virtually independent of the retention factor. As a consequence, for solutes which
are stronger retained than those of Figure 4, similar values for ~.jH,.,.igh< may be
expected.
The effect of coiling on band broadening for De2Sc values larger than 106 was not
e~amined. Higher flow rates and/or much smaller column diameters would be necessary
for obtaining these De2Sc values (see eqn. 10). Such conditions are not very practical, e.g.
with regard to column pressure drop, when applying open-tubular capillaries as extraction
columns.
Obviously, peak dispersion for retained solutes in coiled open-tubular columns can be
decreased by a factor of approx. two. Although this is less than expected, which is
probably due to slow interphase mass transfer, coiling of the extraction column should
nevertheless enable the use of 2-fold higher maximum allowable sampling flow rates.
Peak dispersion in stitched extraction columns
From the literature (1 O] it is known that more 'exotic' deformations of open tubes than
simply coiling can reduce peak dispersion much more efficiently. Geometrically deformed,
e.g. squeezed, zig-zag, serpentine, knitted or stitched tubes are widely used in liquid
chromatography in the field of post-column reaction detection (11] and as low-dispersion
connecting tubes [17]. As with coiling, the deformation of the tube results -in the
generation of a secondary flow which enhances radial dispersion. The effect is, however,
much more pronounced. It is difficult or even impossible to predict the effect of column
geometry on peak dispersion from theory and therefore optimization of the geometry has
been done by trial and error. Optimal deformation is relatively easily obtained by knitting
or stitching of the tube (11]. The continuous change in coiling direction and the bending
of the coil out of the plane leads to a continuous change in direction of the secondary
flow. This, apparently, results in a plug like flow profile which already develops at
relatively low velocities. For higher velocities peak dispersion is practically constant.

~~~~~~~~~~~~G_e_o_m_e_tn_._ca_ll~y_d_e_fo_rm~e_d_e~xtr~a~cn_·o_n_c_a~p_ill_an~·e~s~~~~~~~_,;1181
As with the coiled columns, reduction in peak dispersion with other deformed tubes is
much less pronounced (factor 2-10) for even slightly retained solutes [10). However, for
our application even a modest reduction may still be practically useful. To verify this an
extraction column was carefully stitched through a plastic frame (see Experimental) and
the peak dispersion was measured. In Figure 5 the plate height for naphthalene (k = 3)
observed with the stitched column is compared with that observed for a straight and a
coiled column. The stitched column is clearly superior to the straight and coiled columns,
despite the fact that the plate height (H = 7-40 cm) is much higher than reported in the
literature (H < 5 cm [10,11)) for unretained solutes.
450
400
350
300
e 250 .e ::c: 200
150
100
50
0 0.00 0.50 1.00 1.50 2.00
Flow rate (ml/min)
Figure 5. Peak dispersion of naphthalene (k=3) in straight, coiled and stitched 0.5 mm i.d. open-tubular extraction columns. Mobile phase: acetonitrile-water (20:80) for the straight and coiled column (5 µm CPSil-5), and (30:70) for the stitched column (13 µm CP-Sil-5).
Next, peak dispersion was studied for stronger retained analytes which is important when
using the column for extracting analytes. Peak dispersion was found to increase with the
retention factor (Figure 6), e.g., at 1 ml/min the plate heights found for naphthalene and
pyrene were 30 and 82 cm, respectively. This increase is higher than expected from the
CM term of eqn. 1 (8i,JH,..r = 1.75). As a consequence, the relative plate height,
H,.itch./H,1n1ighl> increases with k, for example, at 1 ml/min the relative plate heights were
0.14, 0.17 and 0.22, for naphthalene (k=3.3), phenanthrene (k=4.8) and pyrene (k=l 9),
respectively. Thus, analogous to the situation for coiled columns, there seems to be an
extra contribution to band broadening, possibly due to slow interphase mass transfer, for
retained compounds in stitched columns. As for the coiled tubes, this contribution levels
out with increasing values of k.

182 On-line enrichment-Ge with open-tubular extraction columns
350
300
250
e 200
~ ::i: 150
0.00 0.50
' ' ' '
' '
/pyrene ,' (k - 19)
1.00 ,., Flow rate (ml/min)
, 'naphthalene
,,'' (k - 3)
naphlhjlene
1.50 2 .00
Figure 6. Effect of retention factor on peak dispersion in a stitched open-tubular column. Column: 165 cm x 0.50 mm i.d., 13 µm CP-Sil-5-CB, mobile phase: acetonitrile-water (30:70) for naphthalene and (25:75) for pyrene.
In conclusion, peak dispersion for retained compounds in stitchecl open•wbular columns is
much higher than reported in literature for unretained solutes. Howev~r, compared with
straight and coiled columns, band broadening in stitched columns is a f~ctor of 4.5-7 less. I
Because peak dispersion is relatively independent of the flow rate, the rrl.aximum allowable I
sampling flow rates during extraction using stitched extraction columns iare expected to be
at least five times higher than those for straight extraction capillaries.
Recovery versus flow rate in on-line extraction-GC with geometrically deformed columns
In earlier work [6] on OTE-GC with straight columns the maximum allowable
sampling flow rate was found to be ca. 200 µI/min when using 2 m OTE columns. Based
on the above data on peak dispersion in geometrically deformed extraction columns it
should be possible, with 2 m columns, to use much higher sampling flow rates without
analyte losses during the extraction. This is experimentally verified in Figure 7 by plotting
the recovery of pyrene after on-line extraction vs the sampling flow rate for straight, coiled
and stitched open-tubular extraction columns. With coiled columns indeed higher flow
rates can be used than with straight columns without analyte losses during extraction.
However, the beneficial effect is only about 2-fold, as was to be expected on the basis of
the data on peak dispersion in coiled columns. Stitching of the extractior(column proves to
be much more effective. Quantitative recoveries are obtained even for sampling flow rates
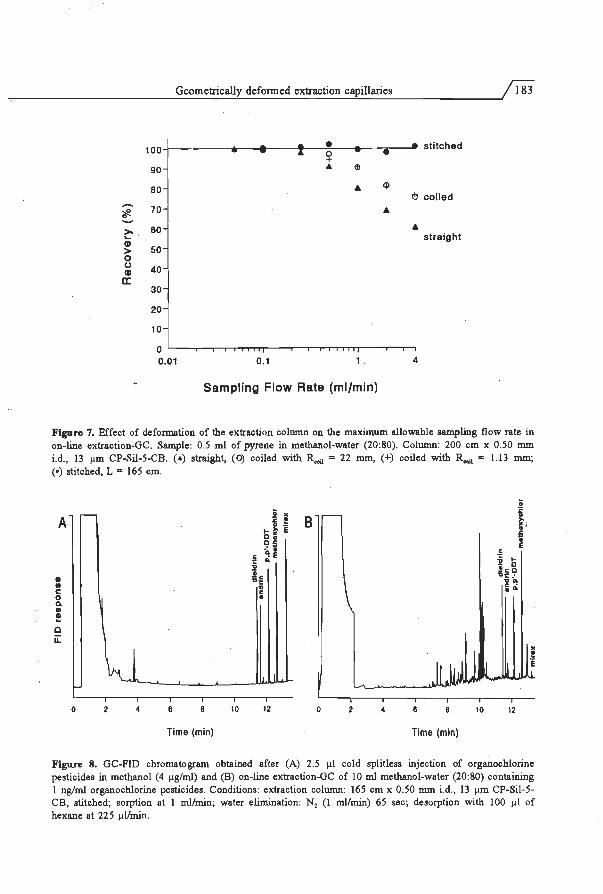
.,-~~~~~~~~~~~~G_eo_m~e_tn_'c_all~y_d_e_fo_rm~e_d_e_xtr~ac_t_io_n~c~ap~i_llari~·-es~~~~~~~----';'18'3
• stitched ~ • 100
90 • 19
• q>
l!l coiled 80
• ~
70 #.
• straight ~ · 60 CD
50 > 0 0 40 CD a:
30
20
10
0 0.01 0.1 1 . 4
Sampling Flow Rate (ml/min)
Figure 7. Effect of deformation of the extraction column on the maximum allowable sampling flow rate in on-line extraction-GC. Sample: 0.5 ml of pyrene in methanol-water (20:80). Column: 200 cm x 0.50 mm i.d., 13 µm CP-Sil-5-CB. (•.) straight, (0) coiled with R..;i = 22 mm, (+) coiled with R..;i = 1.13 mm; (•) stitched, L = 165 cm.
Ci
.!! ! :i:
A B ~I 1-f e 0
c 0 5 9~ • E ~E c .. § b
!cc .. c ll~ -·
ll 'C ... .. "
c . c c ... 0 • c. ll
f Q
ii:
tr\ .l It I -0 10 12 0 6 10 12
Time (min) Time (min)
Figure 8. GC-FID chromatogram obtained after (A) 2.5 µl cold splitless injection of organochlorine pesticides in methanol (4 µg/ml) and (B) on-line extraction-Ge of 10 ml methanol-water (20:80) containing 1 ng/ml organochlorine pesticides. Conditions: extraction column: 165 cm x 0.50 mm i.d., 13 µm CP-Sil-5-CB, stitched; sorption at 1 ml/min; water elimination: N, (1 ml/min) 65 sec; desorption with 100 µl of hexane at 225 µI/min.

184 On-line enrichment-Ge with o en-tubular extraction columns
of 4 ml/min, in other words, with a stitched OTE column it is possible to extract relative
large sample volumes within acceptable sampling times. To demonstrate this, on-line
extraction-Ge was carried out for a 10 ml drinking water sample spiked with
organochlorine pesticides (1 ng/ml) applying a sampling flow rate of 1 ml/min. The
recovery, relative to a 2.5 µI cold splitless injection of a 4 µg/ml standard, was
quantitative {96-102%, with RSD 2.3-4.0%, n=3) for dieldrin, endrin and methoxychlor
(Figure 8). The lower recoveries for p,p'-DDT and especially mirex can be attributed to
adsorption of these very non-polar analytes in the HPLC pump and the transfer lines,
which could not be prevented even by adding 20% of methanol to the sample. Obviously,
geometrical deformation of open-tubular extraction columns facilitates their practical use in
on-line extraction-Ge of relatively large volumes of aqueous samples.
Acknowledgment
Chrompack International B.V. is acknowledged for donation of the Ultimetal GC columns.
References [I] E. Noorozian, F.A. Maris, M.W.F. Nielen, R.W. Frei, Q .. J. de Jong, U.A.Th. Brinkman, J. High Res. &
Chromatogr. Co=un. 10 (1987) 17. [2] A.J.H. Louter, U.A.Th. Brinkman, R.T. Ghijsen, 'J. Microcol. Sep. 5 (1993) 303. [3] K. Grob, Z. Li, J. Chromatogr. 473 (1989) 423 . . [4] P.J.M. Kwakman, J.J. Vreuls, U.A.Th. Brinkman, R.T. Ghijsen, Chromatographia 34 (1992) 41. [5] Y. Pic6, J.J. Vreuls, R.T. Ghijsen, U.A.Th. Brinkman, Chromatographia 38 (1994) 461. [6] H.G.J. Mo!, J. Staniewski, H.-G. Janssen, C.A. Cramers, R.T. Ghijsen, U.A.Th. Brinkman, J.
Chromatogr. 630 (1993) 201. [7] H.G.J. Mo!, H.-G.M. Janssen, C.A. Cramers, J. High Res. Chromatogr. 16 (1993) 413. (8) R. Tijssen, Sep. Sci. Technol. 13 (1978) 681. (9) R. Tijssen, Ph.D. Thesis (University of Technology Delft, 1979). [ 10) K. Hofmann, !. Halasz, J. Chromatogr. 199 (1980) 3. (11) B. Lillig and H. Engelhardt, "Reaction Detection in Liquid Chromatography", LS. Krull (Ed.), Marcel
Dekker, New York, 1986, Ch. 1. (12) J.H.M. van den Berg, R.S. Deelder, H.G.M. Egbennk, Anal. Chim. Acta 114 (1980) 91. [13) R. Tijssen, Anal. Che.m. Acta 114 (1980) 71. (14] J. Staniewski, J.A. Rijks, J. Chromatogr. 623 (1992) 105. [15) R.C. Reid, J.M. Prausnitz, T.K. Sherwood (Eds.) , "The properties of gasses and liquids", McGraw-Hill,
London, 1977. [16) A.K. Wong, B.J. McCoy, R.G. Carbonell, J. Chromatogr. 199 (1976) 1. (17) E.D. Katz, R.P.W. Scott, J. Chromatogr. 268 (1983) 169. (18) P. Lovkvist, J.A. Jonsson, Anal. Chem. 59 (1.987) 818.

Conclusions and prospects

187
6 Conclusions and Prospects
One of the most important current developments in gas chromatographic trace analysis is
the introduction of large volumes of sample extracts. In off-line sample pretreatment
followed by GC analysis, large volume injection can replace laborious and time consuming
evaporative concentration (e.g. Kudema-Danish) steps. Evaporative concentration carried
out in the GC system is much faster, occurs under better controlled conditions, and is
easier to automate. Further, when introducing large sample volumes it is possible to
improve analyte detectability. Detection limits at the low ng/ml, and even the pg/ml level
can be achieved, depending on the analyte and the detector. In on-line sample
pretreatment-Ge large volume injection is an iiiherent part of the procedure.
Despite the fact that several large volume injection techniques have been studied for
over 10 years, their use is still not common practice in (routine) laboratories. The main
reason for this is that most techniques require careful optimization and lack ruggedness.
The speed of sample introduction into the GC system often is a rather critical parameter.
The introduction speed is determined by the evaporation rate of the solvent which in tum
depends on the solvent properties and on instrumental parameters such as the temperature,
carrier gas flows, and pressure. For widespread acceptance of large volume injection the
technique should be simplified and made more rugged. This can be achieved by using
PTV injectors, equipped with packed 3-4 mm i.d. liners, in the solvent split mode. With
such a set-up sample volumes up to some 150 µl can be injected 'at-once'. The
optimization of the key parameter, the solvent vent time, requires only one injection of the
solvent. Large volume PTV injection is rugged, both with regard to small fluctuations in
instrumental parameters, as well as with regard to the introduction of non-volatile matrix
constituents. The technique covers a wide application area, but is less suited for the
determination of volatile (boiling point close to that of the solvent) or thermolabile
compounds. Here one has to resort to on-column injection.
Nowadays in large volume on-column injection partially concurrent solvent
evaporation (PCSE) is the technique most often used. It requires optimization of the
injection speed and the moment of closure of an early vapour exit, which makes the
technique rather complex to unexperienced operators. The use of PCSE stems from the
development of on-line LC-GC systems involving the introduction of hundreds of micro
litres, or even 1 ml, of solvent into the GC . . However, for most applications the
introduction of sample volumes of 50-100 µl will be sufficient to obtain the desired
procedural simplification or improved detection limits. In this case there is no real need
for PCSE. A set-up consisting of a 10 m x 0.53 mm i.d. retention gap (i.e. longer than in

PCSE), a retaining precolumn, and a vapour exit allows at-once introduction of 100 µl
volumes of extract. There is no need for optimizing the injection speed, only the moment
of closing the vapour exit has to be determined. The set-up basically is the conventional
retention gap technique, with a vapour exit installed between the retention gap/retaining
precolumn and the analytical column in order to obtain acceptable solvent elimination
times and to protect the detector from large amounts of solvent vapour. Compared with the
PTV solvent split technique, the ease of optimization is now similar, the applicability
towards volatile and thermolabile analytes is better, however, the ruggedness and
applicability to 'dirty' extracts are not as good. Table I presents the main characteristics of
several large volume injection techniques, either PTV or on~column based.
Table I. Characteristics of PTV and on-column based techniques for large volume injection in capillary GC.
Loop-type Technique PTV solvent split On-column injection injection
• speed conventional Mode at-once controlled retention gap PCSE•l FCSEbl
Hardware PTV injector PTV injector on-column inj./PTV + o.c.-insert 6-port valve packed liner packed liner retention gap (L x 0.53 mm i.d.) ret. gap (L)
retaining precolUDID ret. preco lUDID vapour exit vapour exit .................................... .................................... ........................................ .................................... .....................................
3-4 mm i.d. 1-4 mm i.d. L = 10-15 m L=3m L = 3 m
Volume (µl) < 150 > 150 < 150 > 150 > 150
Main optimiz. vent time inj. speed vent time inj. speed Toe parameters vent time vent time
Ease of optimiz. + - + - +
Ruggedness + + ± - ±
Am1licability : volatility range ~c;> ~ Cn d) ~Ca·> ~Ca'> ~ C11
labile comp. - ±/- + + +
polar solvent + + - - +
'dirty' samples + + - - -•) partially concurrent solvent evaporation, b) fully concurrent solvent evaporation, 0> using sub-ambient cooling, vent time is critical for n-alkanes up to C1,, dJ losses of volatiles can be reduced as a result of interaction of the analyte with packing material, •)vent time is critical for n-alkanes up to C10.
Due to the large overlap in application area it is generally best to start method
development with .the easiest and most rugged technique: PTV injection in the solvent split
mode. Another reason to start with the PTV injector is that, if necessary, this device can

~~~~~~~~-,--~~~~C~on_c_lu_s_io_n_s~an_d-=-p_ro_s~pe_c_ts~~~~~~~~~~~~---1;'189
easily be transformed into an on-column injector by using an on-column insert. When PTV
solvent split injection is not successful and the sample volume is below 1 SO µl, the
conventional retention gap technique with vapour exit should be the method of choice.
When the sample volume exceeds 1 SO µl, fully concurrent solvent evaporation (FCSE) is
an attractive option if the compounds of interest are not too volatile. In other cases, sample
volumes above 1 SO µl have to be introduced in a speed controlled manner, either using the
PTV or the on-column interface.
PTV solvent split injection using a sorbent packed liner, in principle, allows the direct
introduction of water samples if precautions· are taken to ensure that no water enters the
GC column during injection/water elimination. Good results were obtained for water
standards up to volumes of 1 ml. However, up till now there is not much experience with
real-life samples and some limitations will. probably be encountered with this
sorption/thermal desorption based approach. The first limitation concerns the application
range. The method is only successful for analytes of intermediate volatility. Volatile
compounds are lost during sampling/drying of the packed liner. High boiling analytes can
not be desorbed from the Tenax packing, which was found to be the most suitable packing
material in several studies. Another limitation is the accumulation of salts and suspended
matter in the liner which enhances degradation of labile analytes [l]. This problem can be
solved by rinsing the liner with distilled water after sampling, but the fact remains that the
design of the PTV injector is not optimal for handling large volumes of water. A better
solution probably would be a configuration in which packed liners are sampled 'at-line' or
off-line and, after drying, inserted into the PTV injector for thermal desorption. Such a
kind of configuration would be very similar to existing thermal desorption-Ge
instrumentation (e.g. [2]). With the proposed set-up, SPE!rD is probably a good choice for
water analysis by the sorption/thermal -desorption approach.
Solid-phase microextraction (SPME) is a very attractive technique for water analysis
because of its simple instrumentation. It is an excellent technique for fast screening of
water samples. Trace level determination of non polar compounds is possible if longer
sampling times are applied. SPME is less suited for the determination of very low levels
of (medium) polar analytes [3].
The best possibilities for on-line water analysis by GC are offered by the phase-switching
techniques, i.e. techniques in which the analytes are transferred from the aqueous phase to
an organic solvent. With this approach there are no limitations with regard to the
thermostability of sorption materials or the desorption of less volatile analytes. Instead, one
now has to deal with the introduction of relatively large volumes of an organic solvent,

190\...._~~~~~-C_o_n_c_ru_s_io_n_s_an_d_,_p_ro_s~pe_c_u~~~~~~~~~~~~~~~~~~~~
but this is no longer a real problem anymore as pointed out above . . For oncline phase
switching one can choose between liquid-liquid extraction and solid-phase extraction.
Although on-line liquid-liquid extraction (segmented flow) offers some attractive
possibilities for automation of derivatization procedures, solid-phase extraction will
generally be preferrable because of its higher analyte enrichment potential. On-line solid
phase extraction involves three steps: sampling, removal of water from the extraction
column, and desorption. Up till now, the systems most often applied for on-line extraction
GC involve the use of a packed cartridge for extraction and an on-column interface for
large volume injection into the GC system. For cartridges packed with C18-bonded silica
complete water removal (by means of purging with nitrogen gas) can be troublesome.
Consequently, water may be introduced into the retention gap which then rapidly becomes
active and useless for polar analytes. This problem may be solved ' in two ways: (i)
improvement of the resistance of the large volume injection system against small amounts I
of water, (ii) improvement of the reliability of the water removal step. 'Fhe first option can
be realized by using PTV solvent split injection rather than on-column injection. However
this is no universal solution as large volume PTV injection can not be used for all
applications. The second option can be realized by using open-tubular extraction (OTE)
coluinns instead of packed cartridges. With these columns water removal 1s
straightforward. T~o initial problems of the use of OTE columns, i.e.! the low sampling
rate and the insufficient retention power, were largely solved by geometrical deformation
of the column and by swelling the stationary phase with an organic solvent prior to
sampling. In the meantime both the use of polymer packing materials instead of silica
based materials and the use of membrane extraction disks improved the reliability of water
removal with packed extraction columns, although drying times up to hiµf an hour are still I
needed. If we now compare the two approaches, SPE and OTE, then OTE offers slightly
faster sample processing and a more straightforward water removal while packed
cartridges offer a higher retention power for polar analytes.
Further experience with OTE columns has to confirm their practicality in on-line
extraction-Ge. OTE columns with thicker films or other types of stationary phases still
remain to be evaluated. Another interesting topic is the elimination or the need for LC
pumps for sampling/desorption, as the low back pressure of the OTE cblumns also allows I
sampling/desorption by means of nitrogen gas pressure.
For on-line gas chromatographic analysis of water samples the analytical chemist now has
to choose between several varieties of the phase-switching and the sorption/thermal
desorption approach, summarized in Table II. With the phase-switching approach there are
two types of extraction columns and two large volume injection techniques available.

~~~~~~~~~~~~~~C_o_nc_l_u_si_o_n_s_an~d~p~r_o~sp~e_c_ts~~~~~~~~~~~~~--';'191
Table II. Applicability of techniques for on-line enrichment-Ge analysis of water.
Sample•l Analyte characteristics
D c polarity•l volatiJity•l stabiJitydl
METHOD + ± - + ± - + -
Phase switching
extraction coj. injecg2n techn.
packed on-colwnn x x x x x x x x
open tubular PTV x x x x x x x
open tubular on-colwnn x x x x x x x x
packed PTV x x x x x x x x
Somtion/thermal desomtion
Solid-phase micro extraction ? x x x x x x ?
SPE/thermal desorption in PTV x x x x x
•l D = dirty, C = clean, •l + = polar, - = non-polar, •l + = volatile, - = high boiling, dl + = thermostable, - = thermolabile
Obviously, the choice depends on the application. Both the type of water sample and the
characteristics of the analytes have to be considered. For relatively clean samples (e.g.
drinking water, small volumes of water in which only small amounts of organic matter are
present) containing thermostable analytes of intermediate/low polarity, any of the
techniques from Table II can be successfully applied. In case of 'dirty' samples, and with
analytes which are either polar, volatile or therm.olabile, a more careful selection of the
technique is required.
-'Dirty samples'. When large amounts of involatile matrix constituents are involved, phase
switching followed by PTV large volume injection should be the method of choice. On
column injection is less suited because accumulation of matrix constituents in the retention
gap will deteriorate its performance. This is usually first recognized by peak tailing of the
polar compounds and next by band broadening of the other solutes.
-Polar analytes. For the determination of polar analytes the lowest detection limits can be
achieved by the phase-switching approach using packed extraction columns.
-Volatile analytes. For relatively volatile (non polar) analytes SPME is a very attractive
option. Alternatively, phase-switching can be applied. In this case the combination OTE
column/on-column injection is the best option because with this combination the risk of
Conclusions and prospects
analyte losses (both during the drying of the extraction column and large volume injection)
is minimal.
-Thermo/abi/e analytes. For thermolabile compounds the analysis procedure should not
involve a splitless transfer of the analytes from the injector to the GC column. Therefore,
phase-switching in combination with on-column injection is most suited.
References
[I] S. Moller, J. Efer, W. Engewald, Chromatographia 38 (1994) 694. [2] H. Wl\rmann, A. Hoffmann, in P. Sandra (ed.), "Proc. 16th Int. Symp. Capillary Chromatogr.", ,Riva del
Garda, Hnthig, Heidelberg, 1994, p. 416. [3] M.M.E. van der Kooi, Th.H.M. Noy, in P. Sandra (ed.), "Proc. 16th Int. Symp. Capillary Chromatogr.",
Riva del Garda, Hnthig, Heidelberg, 1994, p. 1087.

193
Summary
Due to more stringent regulations issued by national and international agencies there is a
rapid increase in the demand for the determination of organic micropollutants. As a
consequence, the analytical chemist has to develop procedures which provide a higher
sample throughput as well as improved analyte detectability. In chromatographic analysis,
and especially in capillary gas chromatography (GC), sample pretreatment is often the
most time consuming step in the entire procedure. Simplifying the pretreatment is
therefore an important issue. An efficient way to realize this is by introducing larger
volumes of sample extract (e.g. 100 µl instead of the common l µI) into the GC. This can
replace a time consuming evaporative concentration step which is often necessary to obtain
the desired detection limits, and will render the sample pretreatment less laborious. Large
volume injection is also an efficient way to improve analyte detectability. For a further
increase in sample throughput it is advantageous to use systems in which the sample
pretreatment and GC separation are coupled on-line, because this will facilitate automation
of the entire analytical procedure.
In this thesis the development of a simple and rugged technique for large volume
sample introduction in capillary GC is described. Programmed temperature vaporizing
(PTV) injection systems are used for this purpose. Besides this, the development of a
system for on-line water extraction-Ge is also described. Here the emphasis is on the use
of open-tubular extraction columns.
Chapter 1 opens with a general introduction. Next, an overview of on-line methods used
for the trace level GC determination of organic micropollutants in water is presented in
Chapter 2. This chapter includes a discussion on large volume injection techniques for
capillary GC because the on-line methods often involve the transfer of large volumes of
sample (extract) into the GC system.
Chapter 3 deals with the introduction of large volumes of organic solvents into the GC
using programmed temperature vaporizing (PTV) injectors as the interface. So far the PTV
injector is not used very often for large volume injection which may be attributed to the
complexity of the optimization procedure, with the injection speed being the most critical
parameter. The aim of the study is to develop a more simple and robust large volume
injection technique for capillary GC. For this PTV injectors equipped with relatively wide
bore (3.5 mm i.d.) liners packed with glass wool are used. With such injectors it is
possible to inject sample volumes up to 150 µl 'at-once' without flooding the liner. For

volumes up to 150 µl, which is sufficient for most applications, optimization is now
straightforward. Moreover losses ·of volatile analytes are less than in speed-controlled
injection. The principles of the injection technique and the experimental parameters
affecting its performance are discussed in detail in Chapter 3.1 .
A disadvantage of the use of wide-bore liners packed with glass wool is that labile
compounds may decompose on active sites ~n the glass wool. Therefore, in Chapter 3.2
several other packing materials were evaluated to replace glass wool. General-purpose
inert packing materials include Chromosorb-750 coated with Dexsil-300 and the uncoated
support Supelcoport. For samples containing only relatively volatile analytes Tenax TA is
the material of choice. A so-called cup liner, which retains the liquid sample without the
need for a packing material, is a good option when only high-boiling analytes are of
interest.
In Chapter 3.3 the real-life applicability of large volume PTV injection using wide
bore packed liners is described. The compatibility of the injection technique with a number
of selective GC detectors is also evaluated. As a first application the determination of
nitrogen- and phosphorus-containing pesticides in river water by PTV-GC-NPD is
reported. For some of these compounds, such as phosphamidon, oxydrmeton-methyl and
vamidothion, degradation is observed during transfer of the analyte$ to the analytical
column despite the use of an inert packing material. For the othe.r 26 pesticides, which
include the relatively volatile and polar methamidophos and dichlorophos, recoveries after
large volume injection were over 60%, and the linearity was excellent. betection limits of
the pesticides in the extract varied from 0.03 to I ng/ml, depending on !the compound and
the presence of interfering matrix peaks. For some labile pesticides the response depends
on the matrix. No problems with the NPD detector were encountered when injecting large
volumes of ethyl acetate. Another application deals with the determination of PAHs in
river sediment by PTV-GC-MS. If large volume injection is applied, no Kudema-Danish
evaporative concentration of the extract is required. Although naphthalene is partially lost
due to co-evaporation with the solvent, quantification of this analyte is possible because
losses are reproducible and the linearity of the response is good. A third application
describes the determination of organochlorine pesticides in river water by PTV-GC-ECD.
The conventional method is simplified by leaving out the evaporative i concentration step
and by coupling the clean-up procedure (alumina column chromatography) on-line with
GC analysis.
Large volume PTV injection covers a wide application area. The technique is simple
and robust. Non-volatile material remains in the liner, which can easily :be exchanged, and
does not contaminate the . analytical column. However, for the determination of
thermolabile and very volatile analytes on-column techniques are preferable. In this respect

it would be highly advantageous to have an interface that enables the use of both PTV and
oil-column techniques. In Chapter 3.4 it is shown that the PTV injector can be used as
such a universal interface for large voluine injection by using a special on-column insert.
Chapter 4 discusses the possibility of direct water injection into the PTV-GC system.
Obviously, this is a very straightforward way to analyse water samples. Tenax TA was
used as packing material, and two injection modes were compared, solid-phase extraction
(SPE) and the evaporative mode. SPE (sampling flow rate 100-250 µl/min) is suited for
non-polar analytes which efficiently adsorb onto the Tenax packing. For more polar
compounds, e.g. atrazine, losses occur due to breakthrough. In this case the evaporative
mode (sampling flow rate < 25 µl/min) is more useful. A disadvantage of this technique is
that sampling is more time consuming which results in more severe losses of volatile
analytes. Drinking water samples up to 1 ml were successfully analysed. However, further
experience has to reveal whether or not this approach can also be applied to more
contaminated water samples.
Chapter 5 describes an on-line system for water extraction-Ge. Here 1-10 ml water
samples are led through an extraction column. After' removal of all remaining water the
analytes retained in the column are desorbed with an organic solvent (75-1 SO µl) which is
directly introduced into the PTV-GC system. In this chapter the use of open-tubular
extraction (OTE) columns -in fact 2 to S m GC columns- is discussed. The main
advantage of the use of open tubular, rather than packed, extraction columns is the ease of
water removal. The rigorous removal of water is necessary to facilitate efficient desorption
and/or to prevent the transfer of water into the GC system.
In Chapter 5.1 several parameters affecting the sorption and desorption steps are
evaluated, both theoretically and experimentally. Then the on-line system is tested. In
agreement with expectations, water removal from OTE columns is complete, fast (1 min)
and reliable. However, initially two problems were encountered when using OTE columns
for extraction of compounds from water. The first and more important problem was that
only non-polar analytes are efficiently retained in capillaries coated with a siloxane phase.
Attempts to use OTE columns coated with more polar phases (Carbowax) in order to
retain polar analytes as well were not successful. In Chapter 5.2 an alternative way of
increasing the retention power of the OTE column is described. Here the siloxane phase is
swollen by an organic solvent, in fact the desorption liquid, prior to water sampling. Most
of the organic solvents tested caused a considerable swelling of the stationary phase, for
example, the film thickness increased from S µm to 22 µm after rinsing the column with
dichloromethane. The uptake of organic solvent not only improves the phase ratio but also

the affinity of the more polar analytes for the stationary phase. As a result breakthrough
volumes up to at least 2.5 ml can now be achieved for analytes of varyihg polarity. This is
sufficient to obtain detection limits at the low ng/ml level.
The second limitation, especially when using short OTE columns for on-line
extraction, was the low sampling flow rate. For example, with 2 m capillaries sampling
should be carried out at flow rates below 200 µI/min in order to prevent immediate
breakthrough. This low sampling flow rate stems from slow radial dispersion. In Chapter
5.3 the possibility of enhancing radial dispersion by geometrical deformation of the
extraction capillary is discussed. In such deformed capillaries a secondary flow is induced
which enhances radial dispersion of the analytes. Coiled and 'stitched' OTE columns were
studied. Especially the latter type of columns is found to be very effective. The use of a
2 m stitched OTE columns allows the use of sampling flow rates up to 4 ml/min without
breakthrough of the analytes. As a practical example the extraction j of organochlorine
pesticides from 10 ml of drinking water is reported.
Some relevant conclusions and prospects are presented in Chapter 6. In addition several
techniques for large volume injection in capillary GC and techniques available for on-line
water analysis are critically compared.
197
Sam en vatting
Met name door de steeds strenger wordende milieuwetgeving is er een sterk toenemende
vraag naar de bepaling van sporen van organische verbindingen in bijvoorbeeld water-,
lucht- en grondmonsters. Voor de analytisch chemicus betekent dit dat er per dag meer
monsters moeten worden geanalyseerd en dat de gevoeligheid van bestaande methoden
moet worden verbeterd. In de gaschromatografie (GC) is de vereiste monstervoor
behandeling vaak de meest tijdrovende stap in de totale analyseprocedure. Daarom richt de
methodeontwikkeling zich met name op vereenvoudiging van de monster-voorbehandeling.
Een effectieve manier om dit te realiseren is het injecteren van grotere volumina van een
extract in de capillaire GC (bijvoorbeeld l 00 µI in plaats van de gebruikelijke I µ!). Dit
vervangt de meestal noodzakelijke en tijdrovende indampstap en maakt de methode minder
bewerkelijk. De zogenaamde groot volume injectie kan ook worden toegepast om de
gevoeligheid van bestaande methoden te verbeteren. Een verdere verhoging van het aantal
analyses per dag kan worden bereikt door middel van automatisering. In veel gevallen
houdt dit in dat de monstervoorbewerking in-lijn gekoppeld dient te warden met de GC.
Dit proefschrift beschrijft de ontwikkeling van een eenvoudige en robuuste techniek
voor groot volume monsterintroductie in capillaire GC door gebruik te maken van
temperatuur geprogrammeerde verdampings (PTV) injectoren. Daarnaast is aandacht
besteed aan de ontwikkeling van een in-lijn systeem voor de analyse van watermonsters.
Het gebruik van extractiecapillairen staat hierbij ceritraal.
Na een korte inleiding in Hoofdstuk 1 volgt in Hoofdstuk 2 een literatuuroverzicht van
methoden, die zijn ontwikkeld voor de bepaling van sporen van organische veront
reinigingen in water. De nadruk hgt op systemen, waarbij monstervoorbehandeling (in het
algemeen een extractiestap) en GC analyse aan elkaar zijn gekoppeld. Aangezien bij
dergelijke systemen de introductie van een groot volume extract in de GC vaak deel uit
maakt van de totale procedure, wordt ook een overzicht gegeven van gangbare technieken
voor groot volume monsterintroductie in capillaire GC.
Hoofdstuk 3 beschrijft de introductie van grote volumina organisch oplosmiddel in de GC
met behulp van PTV injectoren. Tot dusver zijn deze injectoren weinig voor groot volume
injectie gebruikt, hetgeen waarschijnlijk is toe te schrijven aan het vrij lastige
optimaliseren, waarbij onder andere de injectiesnelheid een kritische parameter is. In dit
hoofdstuk is het doe! de techniek te vereenvoudigen en beter geschikt te maken voor
toepassing in een routinematige omgeving. Hiertoe wordt gebruik gemaakt van PTV

injectoren, die zijn uitgerust met liners (glazen verdampingsbuisjes) met een relatief grote
inwendige diameter (3 ,S mm). De liners worden gepakt met glaswol. Het is dan mogelijk
om monstervolumina tot ca. 1 SO µl in een keer te injecteren zonder dat er vloeistof direct
via de splituitgang wordt weggeblazen. Voor volumina tot 150 µl, wat voldoende is voor
de meeste toepassingen, is het optimaliseren nu eenvoudig en snel uit te voeren. Verder
treden er minder verliezen van vluchtige verbindingen op dan bij de snelheids
gecontroleerde methode. De techniek en de invloed van diverse experimentele parameters
worden uitgebreid behandeld in Hoofdstuk 3.1 . .
Een nadeel van het gebruik van relatief grote liners gepakt met glaswol is dat
thermolabiele verbindingen door de aanwezigheid van actieve plaatsen . op de glaswol
ontleden. Daarom zijn verscheidene andere materialen getest ter vervanging van de
glaswol. Dit is beschreven in Hoofdstuk 3.2. Inerte pakkingsmaterialen geschikt voor
algemeen gebruik zijn bijvoorbeeld Chromosorb-750 gecoat met Dexsil en het (niet
gecoate) dragerrnateriaal Supelcoport. Voor monsters met alleen relatief vluchtige
verbindingen is Tenax de beste keus. Met een speciale 'cup' liner is het mogelijk om
125 µl vloeistof vast. te houden zonder dat er een pakkingsmateriaal aanwezig is. Deze
liner is echter alleen geschikt voor minder vluchtige verbindingen.
Hoofdstuk 3.3 beschrijft de toepassing van de groot volume injectietechniek voor een
aantal milieumonsters. Tevens is de compatibiliteit van de technie~ met een aantal
selectieve detectoren getest. De eerste toepassing betreft de bepaling v'an relatief polaire
stikstof- en fosforhoudende pesticiden in rivierwaterextracten met behulp van PTV-GC
NPD. Voor een aantal van deze verbindingen, zpals fosfamidon, oxydemeton-methyl en
vamidothion, treedt ontleding in de injector op tijdens de overdracht naar de kolom,
ondanks het gebruik van een inert pakkingsmateriaal. Voor de overige 26 verbindingen,
inclusief tamelijk vluchtige en polaire verbindingen als metamidofos en 1dichloorvos, is de
opbrengst na groot volume injectie beter dan 60% en de lineariteit goed. De minimaal
detecteerbare concentratie in het extract varieert van 0,03 tot 1 ng/ml, deze hangt af van de
respons van het betreffende pesticide en wordt verder bepaald door de aanwezigheid van
pieken afkomstig uit de matrix. Voor de eerder genoemde labiele en enkele andere polaire
pesticiden is de respons matrix-athankelijk. Het injecteren van grote vohµnina ethylacetaat
in combinatie met de NPD detector levert geen problemen op. Een tweede toepassing
betreft de bepaling van polycyclische aromatische koolwaterstoffen (PAKs) in rivier
sediment met behulp van PTV-GC-MS. Door gro?t volume injectie kan de normaliter
toegepaste Kudema~Danish indampstap achterwege blijven. Hoewel naftaleen na de
injectie gedeeltelijk met het oplosmiddel wordt afgeblazen, is het toch mogelijk deze
verbinding te kwantificeren, omdat het verlies reproduceerbaar is en de respons goed
lineair. Als derde toepassing worden organochloorpesticiden in rivierwater bepaald met

behulp van PTV-GC-ECD. De bestaande methode is vereenvoudigd door de indampstap
over te slaan en de zuiveringsstap (kolom-chromatografie met aluminium oxide) in-lijn te
koppelen met de GC analyse.
PTV groot volume injectie is geschikt voor veel toepassingen. De techniek is
eenvoudig en robuust. Niet vluchtige bestanddelen uit de matrix blijven achter in de
-makkelijk te verwisselen- liner en tasten de kwaliteit van de analytische kolom niet aan.
Voor sommige toepassingen, met name in het geval van thermolabiele verbindingen en
hele vluchtige verbindingen, zijn bestaande on-column technieken echter beter geschikt.
Met het oog hierop zou het praktisch zijn om een interface te hebben, waarmee zowel de
PTV techniek als de on-column techniek kunnen worden uitgevoerd. In Hoofdstuk 3.4
wordt aangetoond dat de PTV injector als een dergelijk universeel interface kan worden
gebruikt door deze uit te rusten met een speciale on-column liner.
In Hoofdstuk 4 wordt nagegaan in hoeverre directe injectie van watermonsters mogelijk is
met de PTV injector. Voor dit doe! wordt de liner gepakt met Tenax. Twee
injectiemethoden zijn vergeleken: vaste fase extractie (SPE) en verdamping. De eerste
techniek, waarbij injectiesnelheden van l 00~250 µI/min worden gebruikt, is geschikt voor
apolaire verbindingen. Voor meer polaire verbindingen, die onvoldoende worden
vastgehouden op de Tenax pakking, voldoet de verdampingsmethode beter. Nadeel hiervan
is dat de bemonsteringsstap (injectiesnelheid < 25 µI/min) nogal tijdrovend is, hetgeen
leidt tot sterkere verliezen van vluchtige verbindingen. Drinkwatermonsters tot 1 ml · zijn
met succes geanalyseerd met het beschreven systeem. Verdere ervaring moet echter
uitwijzen of deze benadering ook bruikbaar is voor sterker verontreinigde watermonsters.
In Hoofdstuk 5 wordt een systeem beschreve11, waarin de eXtractie van water in-lijn
gekoppeld is met de GC analyse. Hierbij wordt het watermonster (1-10 ml) door een
extractiekolom gepompt. Na verwijderen van het water worden de verbindingen die in de
kolorn zijn achtergebleven gedesorbeerd met een organisch oplosmiddel (75-150 µl) dat
direct wordt geintroduceerd in het PTV-GC systeem. In dit hoofdstuk wordt het gebruik
van capillaire kolommen -in feite 2 tot 5 m lange GC kolommen- als extractiekolom
behandeld. Het belangrijkste voordeel van deze extractiecapillairen ten opzichte van de
gangbare gepakte kolommen is het gemak waarmee het water na de bemonstering uit de
kolom kan worden verwijderd. De verwijdering van water is noodzakelijk voor een
efficiente desorptie en/of om te voorkomen dat water in de GC wordt gei'ntroduceerd.
In Hoofdstuk 5.1 worden eerst diverse parameters, die van invloed zijn op de sorptie
en desorptie, zowel theoretisch als experimenteel bestudeerd. Daarna is het in-lijn systeem
getest. Conform de verwachtingen is de watereliminatie volledig, snel (1 min) en
betrouwbaar. Er zijn echter ook enige beperkingen. Het belangrijkste probleem is het

200\ Samenvatting L-----------------~----~------------------------------
beperkte retentievermogen van het extractiecapillair: aileen apolaire verbindingen worden
in voldoende mate vastgehouden in kolommen die gecoat zijn met polysiloxaanfasen.
Pogingen om ook meer polaire verbindingen te extraheren door kolommen te gebruiken,
die gecoat zijn met polaire stationaire fasen (Carbowax), waren niet succesvol. In
Hoofdstuk 5.2 wordt een manier beschreven, waarmee het retentievermogen van
extractiecapillairen wei kan worden verhoogd. Hierbij wordt de kolom v66r de
bemonstering doorgespoeld met een organisch oplosmiddel (de desorptievloeistof). Het
gevolg is dat de siloxaanfase door opname van de vloeistof sterk zwelt: zo neemt de
filmdikte in geval van dichloormethaan toe van 5 Jlm tot 22 jlm. Dit verbetert zowel de
faseverhouding als de affiniteit van de polaire verbindingen voor de stationaire fase. Op
deze manier kunnen doorbraakvolumina van minstens 2,5 ml worden bereikt met 2 m x
0,32 mrn kolomrnen, hetgeen bepaling op sub-ng/ml niveau mogelijk maakt.
Een andere beperking, die zich met name voordoet bij gebruik van korte
extractiecapillairen, is de !age bemonsteringssnelheid. Met 2 m kolomrnen moet deze
bijvoorbeeld onder de 200 jll!min liggen om directe doorbraak te voorkomen. De !age
bemonsteringssnelheid komt voort uit het trage radiale massatransport van de verbindingen
in het capillair. In Hoofdstuk 5.3 wordt de mogelijkheid beschreven om het radiale
massatransport te versnellen door geometrische vervorming van het capillair. In dergelijke
vervormde capillairen treden zogenaamde secundaire stromingen op, waardoor radiaal
massatransport, dat in rechte capillairen aileen door diffusie geschiedt, wordt versneld. Ter
vervorming worden de (metalen) extractiecapillairen om een ijzerdraad gewikkeld of zig
zag door een frame gevlochten. Met name het laatste is effectief: voor een 2 m
extractiecapillair kunnen nu bemonsteringssnelheden tot 4 ml/min worden toegepast zonder
dat dit tot doorbraak van de verbindingen leidt. Als toepassing is 10 ml drinkwater,
gespiked met organochloorpesticiden, geanalyseerd.
In Hoofdstuk 6 worden ten slotte verscheidene conclusies en verwachtingen besproken en
een aantal verschillende technieken voor groot volume injectie in capillaire GC en in-lijn
wateranalyse met elkaar vergeleken.

201
Dankwoord
Een promotieonderzoek is geen solo-activiteit. Een woord van dank aan degenen die op
enigerlei wijze hebben bijgedragen aan de resultaten van de afgelopen vier jaar, al dan niet
vermeld in dit proefschrift, is dan ook op zijn plaats.
Om te beginnen wil ik de beide promotoren Carel Crarners en Udo Brinkman
bedanken voor de vrijheid die ze mij hebben gelaten bij de opzet en uitvoering van het
onderzoek. Udo, jouw commentaar op mijn soms lange manuscripten (het begon steevast
met 'goed stuk', waarna het dan altijd een verrassing was of er nou wel of niet nog veel
moest worden veranderd) verhoogde zeker de leesbaarheid ervan.
Hoewel slechts kort betrokken bij mijn onderzoek wil ik Jacques Rijks ('senior') en
Rudi Ghijsen bedanken voor hun interesse gedurende de beginperiode. Jacek Staniewski,
to you I am grateful for sharing your knowledge about PTV injectors. In fact, the work on
large volume PTV injection described in this thesis is based on your pioneering
investigations.
Hans-Gerd Janssen, jou wil ik speciaal bedanken. Jij was het vaste klankbord op
vloer 3. Bij jou kon ik mijn wetenschappelijke belevenissen altijd direct kwijt. Ook
voorzag jij mijn 'eerste versies' meestal in recordtempo van commentaar.
Aan de uitvoering van het onderzoek hebben een aantal mensen een bijdrage geleverd
en zij mogen in dit dankwoord dan ook zeker niet ontbreken. De HLO stagiaires Mascha
Houbraken en Inge ('ik kom morgenochtend wat later want dan komt er een belangrijke
aflevering van The Bold & the Beautiful') Debe voerden een deel van het 'preliminary'
werk uit. De research-stagiaires, Bart (Simpson) van den Bosch, Mathieu Westerweele,
Roger Abels en Pascal Jongen draaiden allen enkele maanden mee met het onderzoek.
Henk Huynen en Pieter Hendriks (post AI0-2/4) hielden zich bezig met respectievelijk
PTV-GC-MS en de zoektocht naar de bruikbare pakkingsmaterialen. AI0-2 Jeroen (there
was no life like yours) Bosboom deed on-column dingen met de PTV injector.
Afstudeerster Mariken Althuizen liet zien dat groot volume PTV injectie ook werkt als het
gaat om echte monsters. Aan de Vrije Universiteit zorgden de hoofdvakstudenten Gerda
Wesenhagen en Ron Hessels, temidden van het retention gap geweld, voor het opstarten
en de toepassing van PTV monsterintroductie.
Voor ondersteuning op het instrumentele vlak dank ik de mannen van de glasblazerij
voor het maken van echte kunstwerkjes in de liners en verder Huub van Leuken.
Voor de prettige werksfeer, koffie- & vlaaisessies (de grote stukken waren vaak voor
mij, Brabantse gastvrijheid?) en gezellige borrels dank aan de (oud) TU-collega's en
andere bewoners van vloer 3: Alex Scholten, Peter van Ysacker, Manuel Mertens, Dana

202
Conron, Harry Verhulst; the Asian people Do Quang Huy, Hai Pharn Tuan, Xian Wen
Lou; Henri Snijders, Jack Rijks (Jr.), Mark van Lieshout, Gerard Rutten, Rian Straatmah,
Angela Bickel, Piet Leclercq, Jan (het waakzame oog bij destillatieopstellingen) de Haan,
Leo van der Ven, Jo Beckers, Anton Bombeeck, Harry (meer verstand van 486's)
Maathuis, Hans ('die bonnen zijn ook niet mijn idee') van Rijsewijk, Anja (AO-expert)
Huygen, Denise Tjallema en verder de diverse studenten en visiting (Tempus) scientists.
Van vloer 2 wil ik hier noemen: Marion van Straten (altijd behulpzaam tijdens rnijn
strooptochten naar LC spullen), Pim Muijselaar, Mark Bergman, Hans Vissers, Mariette
Ackermans en Janet Eleveld.
De VU-ers ben ik erkentelijk voor hun gastvrijheid tijdens mijn onderzoek aldaar in
den beginne en de bezoekjes daarna: Rene Vreuls (toeziend oog op 'mijn' VU-studenten),
Arjan Lauter, Thomas Hankemeier, Jaroslav Slobodnik, Vincent Goudriaan en Bart Zegers
(riant logeeradres in A'dam).
Aile farnilie, vrienden en bekenden bedank ik voor hun belangstelling. Met name mijn
ouders die steeds achter rnijn keuze stonden om alsmaar verder te studeren.
Na aile namen blijft er een over die er bovenuit springt. Marion, jij zorgde er voor dat
de balans niet doorsloeg naar aileen maar scheikunde. Met jou heb ik Brabant beter leren
kennen, en de weg naar India, en .....

203
Curriculum Vitae
Hans Mol werd geboren op 19 september 1966. Na het behalen van het HA VO diploma in
1984 volgde hij de hogere laboratorium opleiding aan het Bakhuis Roozeboom Instituut
(Hogeschool Alkmaar) in Beverwijk. Het afs1uitende studiejaar bestond uit een stage bij de
vakgroep Algemene en Analytische Chemie aan de Vrije Universiteit in Amsterdam. Na
het behalen van het HLO diploma (chemie) in juni 1988 begon hij aan de studie
scheikunde aan dezelfde universiteit. Het doctoraalexamen werd afgelegd in april 1991 met
als hoofdvak analytische chemie (prof.dr. U.A.Th. Brinkman) en als bijvak mo1eculaire
toxicologie (prof.dr. N.P.E. Vermeulen). Van april 1991 tot en met maart 1995 was hij als
onderzoeker in opleiding (OIO) in dienst van de stichting Scheikundig Onderzoek in
Nederland (SON). De werkzaamheden werden uitgevoerd bij de vakgroep Instrumentele
Analyse (prof.dr.ir. C.A. Cramers) aan de Technische Universiteit in Eindhoven en verder
gedurende korte tijd bij de vakgroep Algemene Analytische Chemie (prof.dr. U.A.Th.
Brinkman) aan de Vrije Universiteit in Amsterdam.

204
Author's publications on chromatography
I. P.J.M. Kwakman, J.G.J. Mol, D.A. Kamminga, R.W. Frei, U.A.Th. Brinkman, G.J. de Jong. J. Chromatogr. 459 (1988) 139-149. Rhodamine labelling reagent for the determination of chlorophenols by liquid chromatography with peroxyoxalate chemiluminescence detection.
2. J.G.J. Mol, B.N. Zegers, H. Lingeman, U.A.Th. Brinkman. Chromatographia 32 (1991) 203-210. Packed-capillary supercritical fluid chromatography of pesticides using phosphorus-selective detection. '
3. .H.G.J. Mol, J. Staniewski, H.-G. Janssen, C.A. Cramers, R.T. Ghijsen, U.A.Th. Brinkman. J. Chromatogr. 630 (1993) 201-212. Use of an open-tubular trapping column as interface in on-line coupled reversed-phase LCcapillary GC.
4. H.G.J. Mol, H.-G. Janssen, C.A. Cramers. J. High Res. Chromatogr. 16 (1993) 413-418. Use of open-tubular trapping columns for on-line extraction-capillary gas chromatograph of aqueous samples.
5. H.G.J. Mol, H.-G. Janssen, C.A. Cramers, U.A.Th. Brinkman. J. High Res. Chromatogr. 16 (1993) 459-463. Use of a temperature programmed injector with a packed liner for direct water analysis and on-line reversed phase LC-GC.
6. H.G.J. Mol, H.-G. Janssen, C.A. Cramers, U.A.Th. Brinkman. J. High Res. Chromatogr. 18 (1995) 19-27. Large volume sample introduction using temperature programmable injectors: implications of liner diameter.
7. H.G.J. Mol, P.J.M. Hendriks, H.-G. Janssen, C.A. Cramers, U.A.Th. Brinkman. J. High Res. Chromatogr. 18 (1995) 124-128. Large volume injection in capillary GC using PTV injectors: comparison of inertness of packing materials.
8. H.G.J. Mol, H.-G. Janssen, C.A. Cramers, J.J. Vreuls, U.A.Th. Brinkman. J. Chromatogr. 703 (1995) 277-307. Trace level gas chromatographic analysis of micropollutants in aqueous samples using on-line sample enrichment and large volume sampling.
9. H.G.J. Mol, H.-G. Janssen, C.A. Cramers, U.A.Th. Brinkman. J. Microcol. Sep., in press. On-line sample enrichment-capillary gas chromatography of aqueous samples using geometrically deformed open-tubular extraction columns.
10. H.G.J. Mol, H.-G. Janssen, C.A. Cramers, U.A.Th. Brinkman. submitted to J. High Res. Chromatogr. Environmental applications of large volume injection in capillary GC using PTV injectors.
11. J. Bosboom, H.-G. Janssen, H.G.J. Mol, C.A. Cramers. submitted to J. High Res. Chromatogr. The PTV injector as universal interface for several large volume injection techniques in capillary GC.
12. H.G.J. Mol, H.-G. Janssen. Trends in AnalyticaiChemistiy (manuscript in preparation).
Stelling en
I. Bij groot volume injectie in capillaire gascbromatografie is verbetering van de detekteerbaarheid wel het meest voor de band liggeode, maar oiet bet meest eenvoudig le realiseren voordeel.
2. In tegenstelling tot de veronderstelling. van Grob et al. zal het verlies aan vluchtige verbindingen bij gebruik van 'vapour overflow' injectie altijd groter zijn dan bij gebruik van PTV solvent split iojectie. . K. Grob, S. Brem, D. Frohlich, J. High Res. Chromatogr., 15 (1992) 659.
3. Kwantitatieve extractie van verbindingen met behulp van een extractiekolom onder condities waarbij de bandverbreding groter is dan de lengte van de kolom, zoals gesteld door LOvkvist en Janssen, is ook in geval van voldoende retentievermogen niet mogelijk. P. Lovkvist, J.A. JOnssen, Anal. Chem., 59 (1987) 818. Dit proefschrifi, hoofdotuk 5.1.
4. De toepassing van de 'partially concurrent solvent evaporation' techniek voor monstervolumina kleiner dan 100 µI maakt het gebruik van het on-column interface onnodig ingewikkeld.
5. Het gebruik van dezelfde benaming voor twee verschillende injectietecbnieken getuigt van weinig origioaliteit in taalgebruik en is bovendien verwarrend. K. Grob, Z. Li, J. High Rea. Chromatogr., 11 (1988) 626. K. Grob, D. Frohlich, J. High Res. Chromatogr., 17 (1994) 792.
6. Wanneer experimental designs worden gebruikt voor optimalisatie van een nieuwe analysemethode kan en dient te worden nagegaan in hoeverre de recovery van de verbindingen kwantitatief is. J. Villen, F.J. Sel\orans, M. Herraiz, G. Reglero, J. Tabera, J. Chromatogr. Sci., 30 (1992) 261.
7. Bij sporenanalyse is het risico dat de analist het monster verontreinigt groter dan het risico dat de analist verontreinigd wordi door het monster.
8. Een beperkte invoering van het beursstelsel voor promovendi naast het huidige AIOstelsel zaJ de werksfeer niet ten goede komen.
9. Met het huidige beleid van de ziektekostenverzekeraars ten aanzien van reizigers is, financieel gezien, voork6men niet beter dan genezen als het gaat om malaria.
10. ·Gezien het grote aantal dag en nacht functionerende stoplichten in de Eindhovense binnenstad zou de bijnaam 'stoplichtstad' meer toepasselijk zijn.
Hans Mol 19 september 1995