Embed Size (px)
Citation preview
D-R153 536 TOXICITY OF TNT WRSTEHRiTERS TO AQUATIC ORGAN1SNS VOLUME 1/1CHRONIC TOXICIT..(U) SRI INTERNATIONAL HENLO PARK CAHBRILEY ET AL. JUL 84 SRI-LSU-4262 DRNDi7-75-C-5056
7UNCLASSIFIED F/6 6/28 NL
-. + -7
1j.2 11112.2
lii ~111112.
- - 1111U~1.25- IIIf1.
MICROCOPY RESOLUTION TEST CHART
NATIONAL BUREAU OF SIANDARDS 1963 A
0_
,'" . . . . . . . . . . . ..."' + " " -" -"- - - - " •- - . ". ". "" . . . . .. ... . . . .+ .,.
- . '. - - - - - ., . .- -. , - -
AD
O TOXICITY OF TNT WASTEWATERS TO AQUATIC ORGANISMS
Final Report
Volume IV
Chronic Toxicity of 2,4-Dinitrotoluene and Condensate Water
LflBy
IC HOWARD C. BAILEYO RONALD J. SPANGGORD
HAROLD S. JAVITZDAVID H. W. LIU
July 1984
Supported by
U.S. ARMY MEDICAL RESEARCH AND DEVELOPMENT COMMANDFort Detrick
Frederick, MD 21701-5012
Contract DAMDl7-75-C-5056 "
SRI International A985333 Ravenswood Avenue ,;,, r
Menlo Park, California 94025 .. ,SRI Project LSU-4262
Project Officer: William H. van der Schalie,* U.S. Army Medical Bioengineering Research and Development Laboratory 3o.. Fort Detrick
Frederick, MD 21701-5010C~)LU DOD DISTRIBUTION STATEMENT
LA. Approved for public release; distribution unlimited.
The findings in this report are not to be construed as an official Department* of the Army position unless so designated by other authorized documents.
. .

SECURITY CLASSIFICATION OF THIS PAGE (When Data Entered)
READ INSTRUCTIONSREPORT DOCUMENTATION PAGE BEFORE COMPLETING FORM
1. REPORT NUMBER 2. GOVT ACCESSION NO. 3. RECIPIENT'S CATALOG NUMBER
4. TITLE (and Subtitle) 5. TYPE OF REPORT & PERIOD COVERED
TOXICITY OF TNT T ASTE,TATEP.S TO AQUATIC ORGANISMS Final Report; 15 DecemberVolume IV - Chronic Toxicity of 2,4-Dinitrotoluene 1978 to 30 April 1982and Condensate 14ater
6. PERFORMING ORG. REPORT NUMBER
7. AUTHOR(s) LSU-42628. CONTRACT OR GRANT NUMBER(s)
. Howard C. Bailey, Ronald J. Spanggord
. Harold S. Javitz, David H. W. Liu DA11D17-75-C-5056
9. PERFORMING ORGANIZATION NAME AND ADDRESS 10. PROGRAM ELEMENT, PROJECT, TASK
SRI International AREA & WORK UNIT NUMBERS
333 Ravenswood Avenue 62720A.3EI62720A835.AA.045Menlo Park, CA 94025
12. REPORT DATE 13. NO. OF PAGES11. CONTROLLING OFFICE NAME AND ADDRESS July 1984 80U.S. Army Medical Research and Development Command 15. SECURITY CLASS. (of this report)Fort Detrick, Frederick, MD 21701-5012
14. MONITORING AGENCY NAME & ADDRESS (if diff, from Controlling Office) Unclassified
U.S. Army edical Bioengineering Research and 15a. DECLASSIFICATION/DOWNGRADING
Development Laboratory SCHEDULE
Fort Detrick, Frederick, TDf) 21701-5010 NIA16. DISTRIBUTION STATEMENT (of this report)
Approved for public release; distribution unlimited.
17. DISTRIBUTION STATEMENT (of the abstract entered in Block 20, if different from report)
18. SUPPLEMENTARY NOTES
19. KEY WORDS (Continue on reverse side if necessary and identify by block number)2 ,4-dinitrotoluene fathead minnow early life stage studiescondensate wastewater rainbow trout chronic studiesDNT channel catfish water quality criteria
Daphnia magna Pimephales promelasIctalurus punctatus Salmo gairdnerii
20. ABSTRACT (Continue on reverse side if necessary and identify by block number)
Early life stage tests were performed with 2,4-dinitrotoluene and synthetic con-densate wastewater using rainbow trout, channel catfish, and fathead minnows astest organisms. Chronic toxikity studies were also performed with 2,4-dinitro-toluene and condensate water using fathead minnows and Daphnia magna as testorganisms. Another chronic toxicity study was conducted with irradiated conden-sate water using Daphnia magna. Based on data from these studies and fromprevious acute studies, water quality criteria based on US EPA recommended pro-cedures were developed for 2,4-dinitrotoluene and condensate water. For
DD FORM14 3_ _ _ _ _ _ _ _ _DDJAN 731473EDITION OF 1 NOV 65 IS OBSOLETE SECURITY CLASSIFICATION OF THIS PAGE (When Data Entered)
SP- ----- - - - - -

SECURITY CLASSIFICATION OF THIS PAGE (When Data Entered)19. KEY WORDS (Continued)
20 ABSTRACT (Continued)
2,4-dinitrotoluene, 8.1 mg/L was calculated as the maximum allowable concen-tration and 0.12 mg/L as the 24-hr average allowable concentration. A con-centration of 2.3 mg/L condensate water was calculated as the maximum allowable
* value, while 0.14 mg/L was derived as the 24-hr average allowable concentration.
D IFORM 1 BACK)DD JAN 7314 73ACKEDITION OF 1 NOV 65 IS OBSOLETE SECURITY CLASSIFICATION OF THIS PAGE (When Data Entered)

FOREWORD
The U.S. Army Medical Research and Development Command, Ft. Detrick,Frederick, MD, is conducting a research program for the purpose of developingthe scientific data base necessary for assessing the potential environmentalhazards associated with compounds unique to the munitions industry. Fromthese data, criteria will be developed that are qualitative or quantitativeestimates of the concentrations of a pollutant in ambient waters that, if notexceeded, should ensure the protection of aquatic organisms and human health.These criteria, when compared to actual or estimated environmental concen-trations, will form the basis of a hazard assessment. In addition, thesecriteria vill be used to assess the adequacy of current pollution abatementtechnologies and thus influence research and development in this area.
0 This report represents a portion of the data base being developed on2,4,6-trinitrotoluene and its associated wastewaters and should not beconstrued as a complete evaluation or as official policy of the U.S. ArmySurgeon General.
This work was conducted under the technical control and review of theU.S. Army Medical Bioengineering Research and Development Laboratory: J.Gareth Pearson and William H. van der Schalie (Aquatic Toxicology), Jesse J.Barkley, Jr. (Analytical Chemistry), and Jerry W. Highf ill (StatisticalAnalysis).
Citations of commercial organizations and trade names in this report do0 not constitute an official Department of the Army endorsement or approval of
the products or services of these organizations.

EXECUTIVE SUMMARY
This report is the last in a series of four reports on the toxicity of2,4,6-trinitrotoluene (TNT) wastewaters to aquatic organisms. The informa-tion presented in the four volumes was developed in a study performed by SRIInternational-for the U.S. Army Medical Research and Development Command(USAMRDC).under Contract No. DAMD 17-75-C-5056. The study was undertaken toassist USAMRDC in developing a data base for assessing the potential hazardsto aquatic life of wastewater from TNT manufacturing and processing plants.
This report presents and discusses the results of early life stage andchronic studies on 2,4-dinitrotoluene (2,4-DNT), condensate water, and photo-lyzed condensate water. 2,4-DNT is a major component of the condensate waste-water that results from treatment of the effluent (red water) that comes fromthe continuous production of TNT. Condensate water is a synthetic blend basedon the actual condensate wastewater and developed by SRI under a separatecontract.
Early life stage studies were conducted on 2,4-DNT and condensate waterwith rainbow trout, channel catfish and fathead minnows. Full life-cyclechronic studies were performed on 2,4-DNT and condensate water with fatheadminnows and Daphnia m nd on irradiated condensate water withy, man_.-For 2,4-DNT, the effect/no-effect concentrations from the chronic studies were0.62 and 0.28 mg/L for fathead minnows and 0.39 and 0.19 mg/L for D. magna.For condensate water, the effect/no-effect concentrations for fathead minnowswere 0.75 and 0.34 mg/L and for daphnids they were 3.68 and 2.09 mg/L. Irra-diated condensate water was similarly or slightly less toxic to daphnids thannon-irradiated condensate water. In comparing these results to those fromearlier acute studies, it appears that 2,4-DNT caused chronic effects atconcentrations 50 to 100 times less than concentrations that caused acuteeffects. Similarly, condensate water produced chronic effects at concen-trations 4 to 8 times less than those that resulted in acute effects.
Based on the results of these studies, water quality criteria for 2,4-DNTand condensate water were calculated using USEPA recommended methods. Thecriteria comprise two parts; one is a concentration that cannot be exceededin a 24-hour period, and the other is an average allowable concentration for a24-hour period. For 2,4-DNT, the maximum allowable concentration is 8.1 mg/Land the average maximum allowable 24-hour average concentration is 0.12mg/L. For condensate water, the maximum allowable concentration is 2.3 mg/Land the maximum allowable 24-hour average concentration is 0.14 mg/L.
fA 2
/.. . . . . . . . ..
mw . '- " o' ° . • p= t .'-= .'. 0" " °
" . , "• - ' =m . • . - - . ' .J
.-. " " ' "
* CONTENTS
FOREWORD ..........................................o............o............1
EXECUTIVE SUMMARY. .....................o...................................2
CONTENTS .....o.....o........... ........................o....o.............3
LIST OF TABLES ......................o.............o..........o.......o........5
LIST OF FIGURES .... ..............o.......................................8
INTRODUCTION .................................o............o.................9
MATERIALS AND EQUIPMENT ...........................................o.......10Test Materials ............................o.........o.......o...........10Teat Organiama ..................................................... 10
CDiluent Water ............o..........................................10Temperature Control ................................................. 11Toxicant Dilution Equipment ...........o..........o............o.........1
METHODS ......................o...........................o.................17Toxicity Testing...... ...........o..........o......o.........o..........17
General ..........o.................................................17Early Life Stage Studies ........o.......o.........o..................17Chronic Studiesa.................o.............................18
Chemical Analyses ......o........ ...........................o.........21Water Quality Analyses ...........o.........................o........21Statistical Analyses..................o......o..................o.....22
General........................ .......................... ...... 22Transformations ................................................... 22Unit of Analysis. .............o....................................22Series Included in the Analyses ................................... 22Statistical Teats ................................................. 23Graphics .......................................................... 23
4 Global Indices .................................................... 24
RESULTS AND DISCUSSION ................o...................................25Early Life Stage Studies ........................................... 25Channel Catfish...................................................25Rainbow Trout ..................................o...................27Fathead Minnows ................................................... 34
Chronic Studies ..................................................... 37Fathead Minnows ................................................... 372 ,4-DNTr.........................................................37Condensate Water ................................................ 47
Daphnis magna ..................................................... 56
3

2,4-DNT .. . . . . . . . . . . . . . . . . . . . . . . . . . . 56CoIrrdinate Conenst Water........................................66IratdCondensate Water...................................... 61
Calculation of Water Quality Criteria ............................... 712 4-DNT ........................o....................................71Final Acute Value ............................................... 71Final Chronic Value ............................................. 71Final Plant Value.... ...................o........................71
6Final Residue Value .......................o..........o............71Water Quality Criteria ..............................o............71
Condensate Water ...............................o...................74Final Acute Value ............................................... 74Final Chronic Value ............................................. 74Final Plant Value ............................................... 74Final Residue Value .............................o................74Water Quality Criteria .......................................... 74
CONCLUSIONS AND RECMMENDATIONS..........................................77Conclusions ..............................................o...........77Recommendations ..................................................... 77
LITERATURE CITED ...............................o..........................78
DISTRIBUTION LIST ................o........................................80
4
TABLES
1. Water Quality Characteristics of Water from HetchHetchy, San Antonio, and Calaveras Reservoirs .................... 12
2. Chemical Analysis of SRI DechlorinatedTap Water (1975) ................................................. 13
3. Mean, Range, and Standard Deviation of WaterQuality Parameters Measured Routinelyin SRI's Dechlorinated Tap Water ................................. 14
4. Effect OF 30 Days of Exposure to 2,4-DNTon Channel Catfish Eggs and Fry .................................. 25
5. Effect of 30 Days of Exposure to Condensate Wateron Channel Catfish Eggs and Fry .................................... 26
6. Egg Hatchability, Fry Survival, and Fry Growthin Rainbow Trout Exposed to 2,4-DNT for 60 Days ................... 28
7. Egg Hatchability, Fry Survival, and Fry Growthin Rainbow Trout Exposed to Condensate Water for 60 Days ......... 29
8. Effect of 2,4-DNT on Rainbow Trout Egg-Hatching Success andFry Survival and Growth During a 90-Day Exposure Period .......... 30
9. Water-Quality Data Associated With the Rainbow TroutEarly Life Stage Studies with 2,4-DNT.............................. 32
10. Water-Quality Data Associated with the Rainbow TroutEarly Life Stage Study with Condensate Water ..................... 33
11. Effect of 2,4-DNT on Fathead Minnow Egg Hatchabilityand Fry Survival and Growth During a 30-DayEarly Life Stage Study ......................................... 34
12. Effect of Condensate Water on Fathead Minnow EggHatchability and Fry Survival and Growth During a30-Day Early Life Stage Study ..................................... 35
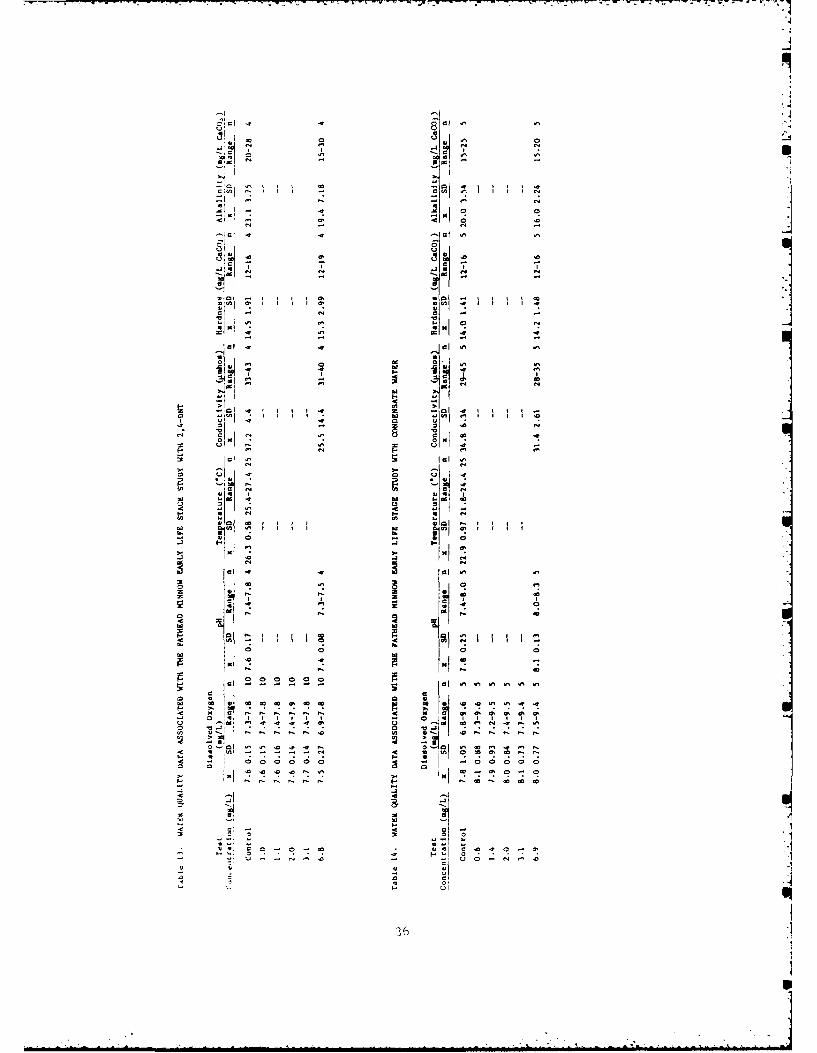
13. Water Quality Data Associated With the Fathead MinnowEarly Life Stage Study with 2,4-DNT .............................. 36-
14. Water Quality Data Associated with the Fathead MinnowEarly Life Stage Study with Condensate Water ..................... 36
15. Effect of Chronic Exposure of 2,4-DNT on Egg Hatchabilityand Fry Survival and Growth in Fathead Minnows ................... 38
16. Effect of Chronic Exposure of 2,4-DNT on ReproductiveParameters in Fathead Minnows ...................................... 39
5

17. Effect OF Chronic Exposure of 2,4-DNT on F1 Fathead Minnows ...... 41
. 18. Total Survivability and Productivity Indices in FatheadMinnows After Chronic Exposure to 2,4-DNT ........................ 44
19. Measured Chemical Concentrations Associated with theFathead Minnow Chronic Study with 2,4-DNT ........................ 45
20. Water Quality Data Associated With the FatheadMinnow Chronic Study with 2,4-DNT ................................ 46
21. The Effect of Chronic Exposure of Condensate Water on EGGHatchability and Fry Survival and Growth in Fathead Minnows ...... 48
22. The Effect of Chronic Exposure of Condensate Water onReproductive Parameters in Fathead Minnows ....................... 49
23. Effect of Chronic Exposure of Condensate Wateron F1 Fathead Minnows ...... ........ .................................... 50
24. Total Survivability and Productivity Indices in FatheadMinnows After Chronic Exposure to Condensate Water ............... 54
25. Measured Chemical Concentrations Associated with theFathead Minnow Chronic Study with Condensate Water ............... 54
26. Water Quality Data Associated with the Fathead Minnow
Chronic Study with Condensate Water .............................. 55
27. Cumulative Mortality of Daphnids During a 28-Day Exposureto 2,4-DNT ......................................................... 56
28. Average Number of Young Produced Per Individual FemaleDaphnid Exposed to 2,4-DNT ......................................... 57
29. Time to First Brood, Number of Young Produced perReproductive Day and Average Length of Surviving FemaleDaphnids Exposed to 2,4-DNT for 28 Days .......................... 58
30. Analyses of 2,4-DNT in a Daphnia Chronic Study ................... 59
31. Water Quality Data Associated with the Daphnia magnaChronic Study on 2,4-DNT .......................................... 60
32. Cumulative Mortality of Daphnids During a 28-Day Exposure
to Condensate Water .............................................. 61
33. Average Number of Young Produced per Individual FemaleDaphnid Exposed to Condensate Water .............................. 62
34. Time to First Brood, Number of Young Produced perReproductive Day and Average Length of Surviving FemaleDaphnids Exposed to Condensate Water for 28 Days ................. 63
6
35. Analyses of Condensate Water in aDaphnia Chronic Study ............................................ 64
36. Water Quality Data Associated with the Daphnia magnaChronic Study on Condensate Water ................................ 65
37. Cumulative Mortality of Daphnids During a 28-DayExposure to Irradiated Condensate Water .......................... 66
38. Average Number of Young Produced per Individual FemaleDaphnid Exposed to Irradiated Condensate Water ................... 67
39. Time to First Brood, Number of Young Produced perReproductive Day, and Average Length of Surviving FemaleFemale Daphnids Exposed to Irradiated Condensate Waterfor 28 Days ...................................................... 68
40. Chemical Analyses of IL adiated Condensate Waterin a Daphnia Chronic Study ....................................... 69
41. Water Quality Data Associated with the Daphnia magnaChronic Study on Irradiated Condensate Water ..................... 70
42. Summary of Acute Toxicity Data--LC50Values for (mg/L) 2,4-DNT ........................................ 72
43. Data Base for Freshwater Chronic Value-2,4-DNT .................. 73
44. Summary of Acute Toxicity Data--LC50 Valuesfor Condensate Water ............................................. 75
45. Data Base for Freshwater Chronic Value--Condensate Water ......... 76
7

FIGURE S
1. 2,4-DNT Total Survival Index ........................................ 42
2. 2,4-DNT Total Productivity Index .................................... 43
3. Condensate Total Survival Index ..................................... 52
4. Condensate Total Productivity Index ................................. 53
8

INTRODUCTION
The production of munitions compounds generates a significant volume ofwastewater, which has historically been discharged into the environment withlittle or no treatment. To assess the hazard of these wastewaters to humanhealth and to aquatic life, the U.S. Army Medical Research and DevelopmentCommand (USAMRDC) funded a comprehensive investigation to develop a scientificdata base comprising data from literature reviews, on-site field studies, andlaboratory investigations in mammalian and aquatic toxicology.
Of the various kinds of wastewaters produced in the manufacture and pro-cessing of munitions compounds, condensate and LAP wastewater are of majorconcern to the USAMRDC. Condensate wastewater is produced during the continu-ous process for manufacturing 2,4,6-trinitrotoluene (TNT) and comprises atleast 30 organic compounds, with 2,4-dinitrotoluene (2,4-DNT) accounting foralmost 50 percent of the total dissolved organics (Spanggord et al. 1978).LAP wastewater is produced at load, assemble and pack (LAP) facilities duringthe washing of shells and other equipment. The composition of LAP wastewaterdepends on the particular kind of explosive formulation being processed by theLAP facility. The LAP wastewater of primary concern is that produced by LAPfacilities handling an explosive formulation called Composition B (COMP B).Fhat wastewater is composed primarily of TNT and hexahydro-l,3,5-trinitro-t,3,5-triazine (RDX).
Under Contract DAMD 17-75-C-5056, SRI International conducted a labora-t.ory study to determine the acute, subchronic, and chronic toxicity to aquaticorganisms of condensate wastewater, LAP wastewater from COMP B processingplants, and selected organic components of both wastewaters. The study com-prised four phases, each with several tasks, and followed the approach pro-posed by Pearson and co-workers (1979) for toxicological evaluation of complexInlustrial wastewaters. Based on the results of numerous caemical analyses,.ynthetic wastewaters containing representative quantities of the differentconstituent chemicals were formulated and used for most of the tests designedto assess the toxicity of the authentic wastewaters. These formulations weredesignated as condensate water and LAP water to differentiate them from theactual condensate and LAP wastewaters.
The results of SRI's study are presented in a series of four reports.This report is the fourth in the series; it presents and discusses the resultsof the early life stage and chronic studies performed on 2,4-DNT, condensatewater, and photolyzed condensate water. Graphic displays of the data from thechronic studies on fathead minnows are contained in the appendix to Volume IV(Bailey et al. 1984).
rhe other reports in the series are Volume I, "3cute Toxicity of LAP4astewater and 2,4,6-lrinitrotoluene" (Liu et al. 1934), which describes theoverall testing approach and the facilities, equipment and procedures used toconduct acute toxicity and bioconcentration studies on TNT, LAP wastewater,and related materials; Volume II, "Acute Toxicity of Condensate Wastewater and2,4-i)initrotoluene" (Liu et al. 19S4); and Volume III, "Chronic Toxicity ofLAP '.astewater and 2, ,6-Trinitrotoluene" (Bailey et al. 1994).

Statistical Tests
The statistical tests were designed to detect statistically significantdifferences between control and treatment groups. It was assumed that anytreatment effect would be detrimental to the organism, so that the tests wereall one-tailed in the direction of greater mortality, smaller fry, or lowerfertility. One of two types of tests was used, depending on the type of data
analyzed:
(1) Proportional data, which included measures of egg and fry survivaland fry deformity, were analyzed in an untransformed state usingFisher's Exact Test for analysis of 2 x 2 contingency tables. Whenthe total sample size exceeded 40, the normal approximation to thehypergeometric distribution was used. Probability levels of lessthan 0.01 for each comparison (Miller, 1965) were flagged asstatistically significant, yielding experiment-wise alpha levels ofapproximately 0.05.
(2) Nonproportional data were first subjected to an analysis ofvariance, using concentration and, where there were sufficient
degrees of freedom, series and concentration-series interactions asindependent variables. The mean square error from the ANOVA was
then used to perform Dunnett's test of control-treatment differences(Dunnett, 1955).
Graphics
Two types of graphic displays were produced to aid in analyzing thedata: detailed plots on the smallest level practical (chamber, breeding pair,or batch), and aquarium-level plots with error bars (where possible). Foruntransformed data, the error bar widths were the sample standard errors(e.g., the sample standard deviations divided by the square root of the samplesize). In cases where the dependent variable underwent a variance-stabilizingtransformation, the mean point for each series was plotted in itsuntransformed state, while the error bars represented the standard deviationof the mean point of the transformed data that were inversely transformed backinto the original metric and bracketed around the untransformed point. Therationale for this approach was to provide a graphic illustration of the rawdata while at the same time displaying error bars that corresponded to thestatistical tests that were performed on the transformed data. For example,survival data were transformed by the Tukey arcsin method. A set oftheoretically correct error bars for the transformed data, based on underlyingdistribution assumptions, is given by the expression
arcsin / X/(N+l) ± 1/ / 2N
where X is the number of fry alive and N is the number that was transferredoriginally into an aquarium. When inversely transformed back into theoriginal metric, the error bars become
sin [arcsin / X/(N+l) ± 1/ / 2N 2
23

Statistical Analyses
General
Up to 31 variables were analyzed for each compound, including survivaland growth measurements, fertility measures, and, in the case of fatheadminnow chronic studies, various global or summary types of measures. Mostof these variables were tested for each series separately and for the pooledseries. Statistical analyses and graphics were produced on an IBM 3033computer using the SAS statistical package and tile VERSATEC plotter.
Trans format ions
In cases where homogeneity of variance assumptions were unwarranted,variance-stabilizing transformations were applied to variables before statis-tical tests or error-bar calculations were performed. These transformationswere of two types (Bishop et al., 1975):
(1) Tukey arcsin transformation for proportions,
Y - arcsin V/ K/-(N+l)
where XIN is the proportion to be transformed;
(2) Square root transformation,
y =
used for the F 0 fertility measures, which were assumed to bePoisson-distributed.
Unit of Analysis
The unit of analysis is the smallest experimental unit that yields asingle observation. For example, both fry length and fry survival aremeasured for each fish (note that fry survival is a Bernoulli random variablevalued 0 or 1 for each death or survival); whereas F0 biomass, being a productof a chamber mean and a chamber proportion, yields only one value perchamber. Likewise, the total survivability and total productivity indices canonly be measured on the aquarium level because they include F0 cumulativesurvival, which yields only one measurement per aquarium.
Series Included in the Analyses
In most cases, the data were analyzed for each series separately as wellas for both series pooled. The exceptions were total survivability and totalproductivity indices, for which there were insufficient degrees of freedom toanalyze the series separately.
22

one individual were measured with an ocular micrometer. Data obtained fromeach test included:
(1) Mortality at 7, 14, 21, and 28 days.(2) Total reproduction at 7, 14, 21, and 28 days.(3) Young produced per female at 7, 14, 21, and 28 days.(4) Young produced per female per reproductive day.(5) Length (to base of spine) at 28 days.(6) Days until first young produced.
Chemical Analyses
Chemical concentrations were measured weekly in each treatment level,alternating between the replicates. Stock concentrations were determinedbefore the stocks were added to the toxicant reservoirs. Twenty-four hoursafter the new stocks were added to the diluter, a sample was taken from thehighest concentration to ensure that the proper concentrations were beingdelivered. In the event of a diluter malfunction, samples were taken from allconcentrations to determine the extent to which the malfunction affected thetest concentrations. Samples were also taken 24 hours after the malfunctionwas corrected to verify that the diluter was again working properly.Analytical methods are described in detail in Volume I (Liu et al., 1984) ofthe final report series.
Water Quality Analyses
Dissolved oxygen and pH were measured daily at all treatment levels for aperiod, usually a week, until we determined that the levels were stabilized.After this, pH and dissolved oxygen were determined at weekly intervals,alternating between the replicates. Dissolved oxygen was measured with aYellow Springs Instrument dissolved oxygen probe and pH with an Orion 407AIonanalyzer. Temperature was monitored hourly in one of the control tanksusing a Honeywell thermograph and checked weekly at all concentrations with aglass mercury thermometer. Hardness, alkalinity, and acidity were determinedweekly in the diluent water using titration techniques (Hach Chemical Company,Sunnyvale, CA). Residual chlorine was also determined weekly in the diluentwater using a Fischer and Porter amperometric titrator (Arthur H. Thomas Co.,Philadelphia, PA). The diluent water was also evaluated periodically for thepresence of contaminants such as pesticides and PCBs. No detectable levels ofthese chemicals were found in any of the samples even though samples yieldingsuspicious peaks were further investigated by mass spectroscopy.
21

FU Survival F, Survival
Egg Egg
30-day fry 30-day
60-day fry 60-day
90-day fry120-day fry F1 Deformities150-day fry178-day fry
F1 Growth
F0 Growth30-day length
30-day length 30-day weight60-day length 60-day length90-day length 60-day weight
Global IndicesF0 Fry Deformities
F0 90-day cumulative fry survival
F0 Fertility Measurements F0 178-day cumulative fry survivalF0 60-day biomass
Breeding pair survival F1 60-day cumulative fry survivalSpawns per pair F1 60-day standing cropEggs per spawn Total survivability indexEggs per pair per day Total productivity indexEggs per pair
Daphnia magna. These tests were conducted in 80-L aquaria that con-
taining approximately 28 L of water. The daphnids were housed in 400-mlbeakers, each having a 2-cm-wide by 5-cm-long hole cut in the side. This holewas covered with 2 00- L Nitex screen. Ten beakers were placed in eachaquarium; seven of the 10 beakers received one daphnid each and the remaining
three beakers received five daphnids each.
Young daphnids were reared in a colony maintained under the same condi-
tions as the tests, except that individual beakers contained two adults each.Reproduction was carefully monitored in the colony to ensure that daphnidsused in the tests did not come from the first brood. Twenty-four hours beforea test was scheduled to begin, all young were removed from the beakers in therearing colony. On the day of the test, the new young were removed from thebeakers, pooled, and distributed randomly into the test beakers using a largebore pipet. This procedure was repeated the following day to start thereplicate series. If a sufficient number of young was not available toinitiate a test, this procedure was repeated until enough could be obtainedwithin a 24-hour period.
The beakers were inspected daily for mortality and young. Dead daphnidswere removed, and young were removed and counted. The daphnids exposed to2,4-DNT and condensate water were fed algae (Selenastrum capricornutum) twicedaily at the rate of 30,000 cells/mL. In the test on irradiated condensatewater, the algal diet was supplemented with a daphnid formula (Biesinger andChristensen, 1972) to increase reproduction. The tests were terminated after
28 days of exposure, and surviving daphnids from the beakers that contained
20
frozen adult brine shrimp four times per day. The food mix varied, dependingon the size of the fry. On Days 30, 60, and 90 post-hatch, the rearing
* chambers were removed from the tanks, placed on millimeter grid paper andphotographed several times. These pictures were used to determine the totallength of the fry during this period as well as provide an indication of frysurvival. After the pictures were taken at 90 days, the fry were releasedfrom the rearing chambers into the aquaria. After release, we continued toobserve the fry for signs of developing breeding characteristics in the males,
6 such as dark banding, blunt snouts, and tubercles.
When several males were obvious in all of the tanks, the fish wereremoved from the tanks and carefully segregated according to sex. Males weredetermined on the basis of banding, blunt snouts, or tubercles. Females weredifferentiated by the presence of urogenital papillae. A third category was
* reserved for fry whose sex we could not readily determine. Four males andfour females were then selected, weighed and measured, and randomly assignedas individual pairs in stainless-steel breeding qges located in the lowertwo-thirds of each tank. The remaining fish were anesthetized, weighed andmeasured, and preserved in 10% formalin according to sex.
Spawning substrates were made by coating the inside of a semicircularpiece of PVC pipe with silicone sealant and embedding fine sand into thesilicone sealant before it hardened. The pieces of PVC pipe were formed bycutting a 4-in, diameter Schedule 40 pipe in half lengthwise and then cuttingeach half into 3-in. sections. After the silicone sealant had dried, theexcess sand was brushed off and the substrates were soaked for 24 hours in
* dechlorinated tap water. One substrate 4a added to each breeding chamber.
Substrates were inspected daily for eggs. If eggs vere present, thesubstrate was replaced with a clean one and placed under a low-power micro-scope where the eggs could be removed and counted. A minimum of 35 eggs wereselected at random and placed in an egg cup to determine hatchability. If thespawn did not contain at least 35 eggs, the eggs were counted and discarded.
0 After the eggs hatched, the fry were counted and discarded or added to arearing chamber if one was available. We attempted to rear two batches of F1fry to 30 days and two batches to 60 days in each tank. If possible, each setof fry selected for rearing was obtained from a different spawning pair.
#A In addition to hatchability and mortality, records of deformities andlengths (total) and weights were taken for the F fry. Lengths and weightswere taken at the end of the exposure period, anA interim 30-day lengths weredetermined photographically on fry reared to 60 days.
Each test was terminated when no spawns occurred in any concentration forI week. The following data were prepared for statistical analysis:
19
chow ad libitum three times per day. Excess food and waste materials weresiphoned from the bottom of the tanks as necessary. The surviving fry were
0measured (total length) at the end of the exposure period. Chemicalconcentrations were determined twice weekly, alternating between thereplicates.
Fathead Minnows. These tests were initiated with 30 embryos (24 hoursold) per egg cup. Two egg cups were used per tank. The tests were generally
* terminated 30 days after initiation and, with the exception of the test oncondensate, they were performed in duplicate. After hatching, the fry werecounted and transferred into larval rearing chambers. During the post-hatchexposure period, the fry were fed brine shrimp nauplii three times daily.
Excess food and waste materials were siphoned from the bottom of the tanks asnecessary. Total fry length was determined photographically or by direct
Chemical concentrations were routinely determined prior to initiating thetest and weekly thereafter, alternating between replicates.
Rainbow Trout. These tests were initiated with 60 eggs per duplicate'4tank at each exposure level. The eggs were fertilized in the presence of the
toxicant and allowed to water-harden before they were transported to thelaboratory. In the first series of tests, a different female was used foreach concentration; in the second test series, eggs from different femaleswere randomized over the mixing containers before they were fertilized.Because a low overall fertility was observed in one of the tests in the secondseries, the test was restarted using eyed eggs obtained directly from thehatchery. The first series of tests were terminated 30 days after hatchingwas completed, and the second series were terminated after a 60-day post-hatchexposure period. Once the fry entered the swimr-up stage, they were fed acombination of Artemia nauplii, dry trout food, and frozen adult brine shrimpthree times per day. Throughout the tests, the tanks were inspected daily anddead eggs and fry were removed. At the end of the test, surviving fry wereanesthetized with MS-222 and individually weighed and measured (total length).
Chemical concentrations were determined weekly, alternating between thereplicates.
Chronic Studies
Fathead Minnows. These tests were initiated by randomly distributing aminimum of 40 eggs to each of two egg cups suspended in each tank. Theduplicate series were started approximately I week apart. During the periodof embryo development, the egg cups were inspected daily and dead eggs were
* removed. Once the fry began to hatch, the cups were not disturbed except fordaily checks to determine whether hatching had been completed. If thehatching process took longer than 24 hours to complete, brine shrimp naupliiwere added to the egg cup twice daily to ensure a food source f or the hatchedfry. When hatching was completed in all cups, deformed and normal fry werecounted, and the normal fry were transferred to rearing chambers.
Fry were maintained in the rearing chambers for 90 days. During thisperiod they were fed a mixture of brine shrimp nauplii, dry trout food, and

* METHODS
Toxicity Testing
General
Tests were performed in duplicate with six treatment levels including thecontrols. Chronic tests were performed in 30.5 x 91.4 x 30.5 cm (H x L x W)glass aquaria containing approximately 40 L of water for the fathead minnowtests and 28 L of water for the daphnid tests. Early life stage studies wereperformed in 19-L aquaria containing 15 L of test solution. Fathead minnow
* and channel catfish eggs were exposed in eggs cups made from 5-cm diameterglass or PVC tubing with one end covered with 200-pi Nitex screen. Fatheadminnow fry hatched in the egg cups were transferred to rearing chambers (30 x30 x 5 cm, H x L x W) constructed from glass except for the front panels,which were made from Nitex screen (200 11) to allow passage of water throughthe chambers. Channel catfish fry were transferred directly to the aquaria.Eggs from rainbow trout were simply placed on the bottoms of the aquariaduring exposure.
The locations of the test aquaria were randomized within each replicateseries. Nominal test temperatures were 120C for the trout early life stagestudies, 25*C for the catfish early life stage studies, 25%C for the fathead
0 minnow early life stage studies, 25*C for the fathead minnow chronic studies,and 20*C for the daphnid chronic studies. Diluter flow rates were set toprovide a minimum of four tank volumes per day; this rate was increased asnecessary to maintain water quality and/or desired chemical concentrations. Aphotoperiod of 16 hours light and 8 hours dark was used for all tests exceptthe fathead minnow chronic studies, which used an EPA-recommended variable
* photoperiod corresponding to that of Evansville, IN (EPA 1972). At the startof each series, this photoperiod corresponded to 1 December and was adjustedas appropriate at 2-week intervals.
Early Life Stage Studies
Channel Catfish. These tests were scheduled to be initiated with 30 eggsper treatment level in each of the duplicate test series. However, weencountered difficulties separating the eggs because they were past theinitial hardening stage and were easily damaged when handled. Therefore, wecut off similar-sized clumps of eggs from the original egg masses, counted theeggs in each mass, weighed them, and transferred them into the egg cups.
A problem with using this approach was that, because the eggs were notseparate, the fungus-affected eggs could not be removed to prevent the spreadof disease to other eggs. To minimize problems with fungal infection, weflushed the eggs daily with malachite green up to the time of hatching(Leitritz and Lewis, 1980). After hatching, the fry were transferred from theegg cups into the aquaria for a 30-day post-hatch exposure period. Duringthis period, the fry were fed brine shrimp nauplii (cysts obtained from SanFrancisco Bay Brand, Newark, CA), frozen adult brine shrimp, and dried trout
17

was delivered directly into the main mixing cell of the diluters used in the* daphnid chronic studies by Mariotte bottles filled from the stock barrels or
by metering pumps directly from the stock barrels. All Mount-Brungs diluterswere equipped with counters to monitor the cycling rate and to aid in ensuringthe proper function of the diluters.
-0
k"1
IJ
"0
61
I--I : 2 . : i- i.- i ) . :: : . i • - .i; i . .. . .. :: - - - . . : ..o .::, , : ,. :
other. The upper reservoir, measuring approximately 15 x 5 x 183 cm (H x W xL), was used to deliver stock solutions of the toxicant. The bottomreservoir, measuring approximately 22 x 15 x 365 cm (H x W x L), was used todeliver water.
The water reservoir was equipped with 24 adjustable flow meters capableof measuring flows up to 300 ml per minute. Water was pumped to thisreservoir from a secondary reservoir equipped with temperature-control andaeration devices and connected to the laboratory water supply through a floatvalve. Excess water in the primary reservoir was returned to the secondaryreservoir by gravity. The toxicant stock solution was recirculated by pumpbetween the toxicant reservoir and a 55-gallon polyethylene-lined steel drumin which the toxicant stock was prepared. The toxicant was metered by Tefloncapillary tubes, and the delivery rate was adjusted by increasing or
* decreasing the vertical distance of the distal end of the tube from the levelof the liquid in the toxicant reservoir.
The toxicant stock solution and water were delivered to a mixing chamberthat divided the total volume equally between two exposure chambers. Afterthe flows of toxicant and water necessary to obtain each desired toxicantconcentration were calculated, the flows were set, using a graduated cylinderand stopwatch.
Early life stage studies with fathead minnows and chronic studies withfathead minnows and D. magna were conducted using Mount-Brungs style diluters(Mount and Brungs, i1967). Each diluter delivered approximately 500 mL of
* exposure solution to each mixing cell, where it was split into two 250-mLvolumes and delivered to each of two duplicate aquaria. During the earlyrearing stage, when the fathead minnow fry were being reared in duplicaterearing chambers, the 250-mL volume was split again so that each chamberreceived approximately 125 mL.
o The delivery rates of the Mount-Brungs diluters were controlled byregulating the water flow into the diluter with a valve during the tests withfathead minnows. Because much lower flows were required for the daphnidstudies, the cycling rate of each diluter was controlled by a capillary tubeto drain the bucket that operated a microewitch controlling the incomingwater. By slowing the flow rate from the bucket, the time interval betweencycles was increased, thereby reducing the overall delivery rate.
The toxicant was usually delivered to the diluters from 55-gal poly-ethylene-lined steel drums. In the fathead minnow tests, a recirculatingsystem incorporating a toxicant head tank behind and slightly above the mainmixing cell was used. A capillary tube drained the toxicant from the head-tank into a calibrated beaker or graduated cylinder containing a glass siphon
4 connected to the water outflow from the W-1 cell. When the W-1 cell startedto drain, a vacuum started the siphon from the beaker containing the toxicant,and both diluent and toxicant entered the mixing cell. The amount of materialin the beaker could be varied by raising or lowering the beaker in relation tothe toxicant headtank. In addition, the beaker contained a drain to preventoverfilling in case the diluter cycling rate slowed or stopped. The toxicant
15
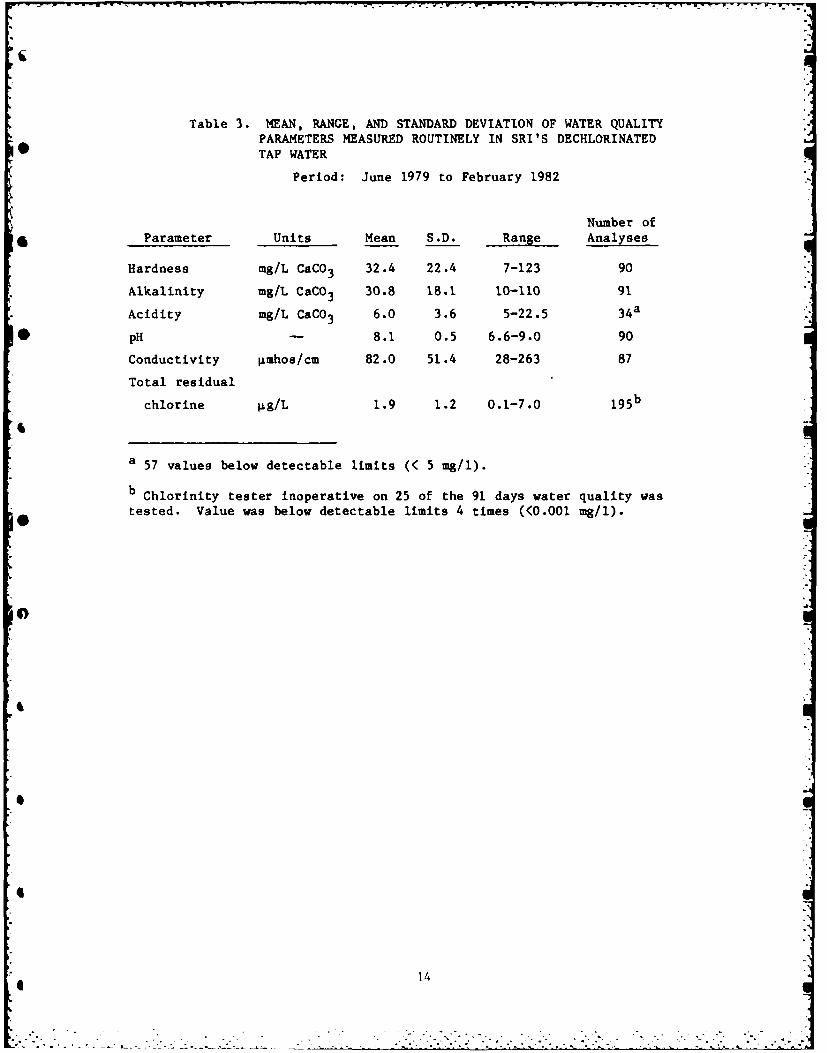
Table 3. MEAN, RANGE, AND STANDARD DEVIATION OF WATER QUALITYPARAMETERS MEASURED ROUTINELY IN SRI'S DECHLORINATEDTAP WATER
Period: June 1979 to February 1982
Number of* Parameter Units Mean S.D. Range Analyses
Hardness mg/L CaCO 3 32.4 22.4 7-123 90
Alkalinity mg/L CaCO3 30.8 18.1 10-110 91
Acidity mg/L CaCO3 6.0 3.6 5-22.5 34 a
* pH - 8.1 0.5 6.6-9.0 90
Conductivity jimhos/cm 82.0 51.4 28-263 87
Total residual
chlorine pg/L 1.9 1.2 0.1-7.0 19 5 b
a 57 values below detectable limits (< 5 mg/i).
b Chlorinity tester inoperative on 25 of the 91 days water quality was
tested. Value was below detectable limits 4 times (<0.001 mg/l).
14
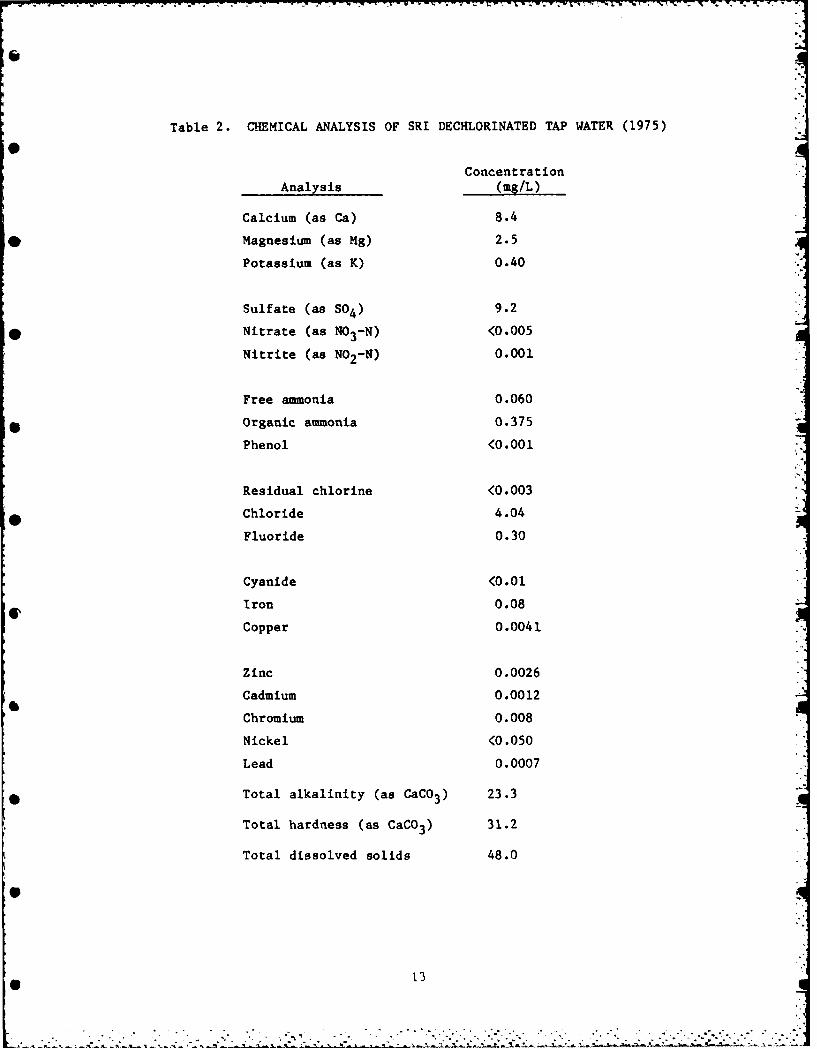
Table 2. CHEMICAL ANALYSIS OF SRI DECHLORINATED TAP WATER (1975)
ConcentrationAnalysis (mg/L)
Calcium (as Ca) 8.4
Magnesium (as Mg) 2.5
Potassium (as K) 0.40
Sulfate (as SO4) 9.2
Nitrate (as N03-N) <0.005
Nitrite (as N02-N) 0.001
Free ammonia 0.060
Organic ammonia 0.375
Phenol <0.001
Residual chlorine <0.003
Chloride 4.04
Fluoride 0.30
Cyanide <0.01
Iron 0.08
Copper 0.0041
Zinc 0.0026
Cadmium 0.0012
Chromium 0.008
Nickel <0.050
Lead 0.0007
Total alkalinity (as CaC03 ) 23.3
Total hardness (as CaCO3 ) 31.2
Total dissolved solids 48.0
13
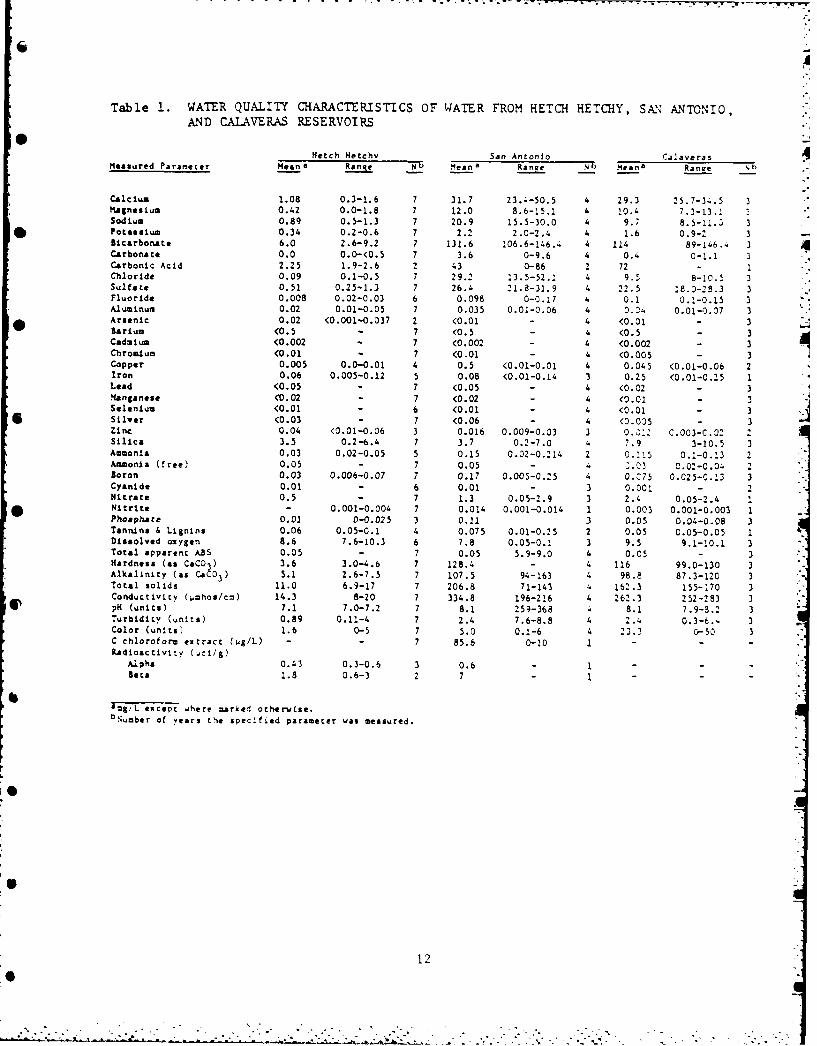
Table 1. WATER QUALITY CHARACTERISTICS OF WATER FROM HETCH HETCHY, SAN ANTONIO,AND CALAVERAS RESERVOIRS
Hetoh Hetchv San Antonio CalaverasMeasured Parameter Mean
5 Range N
b Wean
a Range Nb Hear
a Range N.
Calcium 1.08 0.3-1.6 7 31.7 23.4-50.5 4 29.3 25.7-34.5 3Magnesium 0.42 0.0-1.8 7 12.0 8.6-15.1 & 10.4 7.3-13.1Sodium 0.89 0.5-1.3 7 20.9 15.5-30.0 4 9.7 8.5-11. 3
* Potassium 0.34 0.2-0.6 7 2.2 2.0-2.4 4 1.6 0.9-I 3Bicarbonate 6.0 2.6-9.2 7 131.6 '06.6-146.4 4 114 89-146.. 3 4Carbonate 0.0 0.0-(0.5 7 3.6 0-9.6 4 0.4 0-1.1 3Carbonic Acid 2.25 1.9-2.6 2 43 0-86 2 72 - 1Chloride 0.09 0.1-0.5 7 29.2 13.5-52.1 4 9.5 8-10.5 3Sulfate 0.51 0.25-1.3 7 26.4 21.8-31.9 4 22.5 18.0-28.3 3Fluoride 0.008 0.02-0.03 6 0.098 0-0.17 4 0.1 0.1-0.15 3Aluminum 0.02 0.01-0.05 7 0.035 0.01-0.06 4 0.04 0.01-0.07 3Ar enic 0.02 <0.001-0.037 2 <0.01 - 4 <0.01 - 3arium (0.5 7 <0.5 - 4 <0.5 - 3Cadmium <0.002 7 <0.002 - 4 <0.002 - 3Chromium <0.01 -7 <0.01 - 4 <0.005 -3Copper 0.005 0.0-0.01 4 0.5 <0.01-0.01 4 0.045 <0.01-0.06 2
Iron 0.06 0.005-0.12 5 0.08 <0.01-0.14 3 0.25 <0.01-0.25 1Lead <0.05 - 7 <0.05 - 4 <0.02 - 3.&nganese <0.02 - 7 <0.02 - 4 <0.01 - 3Selenium <0.01 - 6 <0.01 - 4 <0.01 3Silver <0.03 - 7 <0.06 - 4 <0.05 - 3Zinc 0.04 <0.01-0.06 3 0.016 0.009-0.03 3 0.:: C.003-C.02 2Silica 3.5 0.2-6.4 7 3.7 0.2-7.0 4 7.9 3-10.5 3Ammonia 0.03 0.02-0.05 5 0.15 0.02-0.214 2 0.1i5 0.1-0.13 2Ammonia (free) 0.05 - 7 0.05 - ..03 0.02-0.04, 2Boron 0.03 0.006-0.07 7 0.17 0.005-0.25 4 0.C75 0.025-C.13 3Cyanide 0.01 - 6 0.01 - 3 0.001 - 2Nitrate 0.5 - 7 1.3 0.05-2.9 3 2.4 0.05-2.4 1Nitrite - 0.001-0.004 7 0.014 0.001-0.014 1 0.003 0.001-0.003 1Phoph&te 0.01 0-0.025 3 0.11 3 0.05 0.04-0.08 3Tannins & Lignins 0.06 0.05-0.1 4 0.075 0.01-0.25 2 0.05 0.05-0.05 1Dissolved oxygen 8.6 7.6-10.3 6 7.8 0.05-0.1 3 9.5 9.1-i0.1 3Total apparent ABS 0.05 - 7 0.05 5.9-9.0 4 0.05 - 3Hardness (as CaCO ) 3.6 3.0-4.6 7 128.4 - 4 116 99.0-130 3Alkalinity (as Ca2O 3 ) 5.1 2.6-7.5 7 107.5 94-163 4 98.8 87.3-120 3Total solids 11.0 6.9-17 7 206.8 71-143 4 162.3 155-170 3Conductivity (,mhos/c,) 14.3 8-20 7 334.8 196-216 4 262.3 252-283 3pH (units) 7.1 7.0-7.2 7 8.1 259-368 4 8.1 7.9-3.2 3 -Turbidity (units) 0.89 0.11-4 7 2.4 7.6-8.8 4 2.4 0.3-6.- 3Color (units) 1.6 0-5 7 5.0 0.1-6 4 23.3 C-5C 3C chloroform extract (ug/L) - - 7 85.6 0-10 1 - -
Radioactivity (uci/g)Alpha 0.43 0.3-0.6 3 0.6 1 - '"sets 1.8 0.6-3 2 7 1 -
izgi'L exce "pt:where marked othorwfse.°Number of yeat$ the s chied para er was measured.
12
12-

late spring through the fall, about 95% of the water comes from Hetch HetchyReservoir. During the winter and early spring before the snow begins to melt,the bleu. is composed primarily of water from the two low-elevationreservoirs.
The San Francisco Water Department (S "n) annually analyzes the waterfrom these reservoirs for various minerals and other constituents. Table 1presents the average and range for each of the 43 parameters measured by theSFWD during the periods 1969 to 1971 and 1975 to 1978 in water samples fromthe three reservoirs.
We performed a less comprehensive analysis of our dechlorinated tap waterin 1975. The results are presented in Table 2. In 1978, we began analyzing
the dechlorinated tap water routinely for hardness, alkalinity, acidity, pH,conductivity, and residual chlorine. Table 3 presents the average, standarddeviation, and range for each of these parameters during the study period.
Over the seven years that our aquatic toxicology facility has been inoperation, our dechlorinated tap water has been satisfactory for rearing andmaintaining a variety of aquatic animals. However, during Phases I to III ofthis study, we experienced intermittent problems with unacceptably highcontrol mortality (>20%) during tests with daphnids. When this occurred, werepeated the tests until acceptable results were obtained. The problem waslater determined to be caused by seasonal fluctuations in the hardness of the
diluent water. Depending on the mixture of waters obtained from the threestorage reservoirs, hardness dropped to levels as low as 15 mg/L (as CaC0 3 ).The periods in which the laboratory received very soft water were found tocorrespond to the periods in which we observed poor daphnid survival. Toensure that these fluctuations in the hardness of the diluent water did notadversely affect the results of the daphnid chronic studies, a solution ofmagnesium, calcium, and potassium salts (Marking and Dawson, 1973) was meteredinto each diluter at a rate sufficient to maintain a minimum hardness of 35 to
40 mg/L.
Temperature Control
To maintain the temperature of the exposure chambers at the desiredlevel, both the water and room temperatures were controlled. Roomtemperatures were controlled by thermostatically controlled heat pumps set atthe desired test temperature. In tests requiring heated diluent water, athermostatically controlled 2000-W stainless-steel immersion heater was usedto adjust the temperature of the incoming water in head tanks before the waterentered the diluter. In tests requiring water at lower-than-ambienttemperatures, chilled water was supplied to a head tank by a 9000-BTU waterchiller at the approximate test temperature and was then maintained at thedesired temperature by a thermostatically controlled 2000-W immersion heater.
Toxicant Dilution Equipment
In the early life stage studies on catfish and trout, we used a toxicantdilution system developed at SRI for conducting short-term tests. The systemis composed of two constant-head reservoirs, one located above the
11
• ,i - . , - - _. .- " : . . _ - . . -., , . . - ,: . . . ,. . - . ,-- . , - . . . -, . . .- _ - : . .

MATERIALS AND EQUIPMENT
Test Materials
The substances tested in this study were condensate water, 2,4-DNT, andphotolyzed condensate water (Cond-Irrad). The sources and purities of thetest materials and the methods used to prepare photolyzed and unphotolyzed
condensate water are described in Volume II (Liu et al. 1984).
Test Organisms
The following species of fish and invertebrates were used:
Fathead minnow (Pimephales promelas)Channel catfish (Ictalurus punctatus)Rainbow trout (Salmo gairdnerii)Water flea (Daphnia magna)
These species were selected because they represent a range of taxonomicgroups that have different habitat requirements and also exhibit varyingsensitivities to chemical toxicants. Consequently, it was felt that waterquality criteria based on tests with these species should afford a reasonabledegree of protection for most, if not all, species undergoing exposure tomunitions wastewaters. In addition, test methods for the selected species
*O were fairly well established which increased the probability of successfullyconducting the laboratory exposures.
Fathead minnows and Daphnia magna were obtained from SRI's breedingcolonies. The breeding stocks were reared under flow-through conditions at 20and 25*C for the daphnids and minnows, respectively. The adult minnows were
o fed frozen adult brine shrimp (San Francisco Bay Brand, Newark, CA), livedaphnids, and trout chow (Clark's Feed Company, Salt Lake City, UT). Adultdaphnids were fed Selenastrum capricornutum alone or in conjunction with avitamin supplement (Goulden et al., 1982). The photoperiod was set at 16hours light (100 ft. candles) and 8 hours dark. Channel catfish eggs wereobtained from Alex Fish Company, San Rafael, CA, and rainbow trout eggs wereobtained from the Mt. Lassen Trout Farm, Red Bluff, CA.
Diluent Water
We used dechlorinated tap water to culture and maintain the test animals,to prepare the stock solutions, and as the diluent water for the flow-throughtests. The water was dichlorinated by passing it through a series of columns,each containing 0.042 m of activated carbon that was renewed every 3 monthsby a local water purification firm (Culligan, Santa Clara, CA).
The laboratory tap water is a blend from the Hetch Hetchy, Calaveras, andSan Antonio Reservoirs. On the average, about 75% of the water originates
% from the Hetch Hetchy Reservoir, which is located in the Sierra Nevada. From
10
.' - -'4- . - , ." ' . : . - , -- - ' .' -. - . .- ' . . .- .- . . .-. , -, ' .. . . , .. . .-

Note that the error bars depend only on the sample size and the number alive* pooled over chambers. Consequently, in a plot of aquaria survival propor-
tions, an aquarium with widely differing survival proportions in its twochambers can have error bars similar to another aquarium where the twochambers have similar proportions.
Error bars were not plotted for the global indices of total survivability* and total productivity, two variables that are composites of several other
variables. The total survivability .lex was defined as the product of thecumulative F0 survival to 180 days, the average number of eggs per female, andthe cumulative F survival after 60 days of exposure. The total productivityindex was defined as the product of the total survivability index and theaverage weight of the F I generation after 60 days of exposure. Because an
* estimate of the variability for each aquarium would have required the ques-tionable assumption that the component variables were all mutually indepen-dent, it was decided that error bars in this case might be misleading. Notethat the statistical tests were performed using the mean squared error froma one-way ANOVA, allowing sufficient degrees of freedom for these variables.
Global Indices
In addition to the two global indices defined above, five additional suchindices were used in analyzing the data from the fathead minnow chronicstudies. These indices were defined as follows:
F0 90-day cumulative fry survival--fry survival at the end of 90 days asa proportion of the number of embryos exposed.
F 178-day cumulative fry survival--fry survival at the end of thejuvenile growth phase (up to the point where the sexes were identified andbreeding pairs established) as a proportion of the number of embryos exposed.
F0 60-day biomass--the product of length at 60 days and 60-day frysurvival.
F1 60-day cumulative fry survival--fry survival at the end of 60 days asa proportion of the number of embryos exposed.
F 1 60-day standing crop--the product of weight at 60 days and 60 day frysurvival.
24

RESULTS AND DISCUSSION
Early Life Stage Studies
ad Early life stage studies were conducted with channel catfish, rainbow
trout, and fathead minnows.
Channel Catf ish
Early life stage studies with channel catfish were not successful. The*e eggs could not be separated because of their advanced stage of development;
heavy losses occurred due to fungal infection in spite of prophylactictreatment with malachite green. In addition, because we had to start theJtests with clumps of eggs, the initial number of eggs varied markedly amongthe treatment groups. Nonetheless, data on egg hatchability and fry survivalfrom tests performed on 2,4-DNT and condensate water are shown in Tables 4 and
q 5, respectively.
Table 4. EFFECT OF 30 DAYS OF EXPOSURE TO 2,4-DNT ON CHANNEL CATFISHEGGS AND FRY
MeanMeasured Eggs Fry
Concentration Test Initial % Nuber%(mg/L) Series Number Hatched Hatched Survival
Control A 19 52.6 10 90.0B 31 67.7 21 52.4
3.4 A 57 71.9 41 34.1B 75 40.0 30 16.7
6.2 A 31 19.4 6 16.7B 53 32.1 17 29.4
8.7 A 71 29.6 21 0B 36 16.7 6 0
23.7 A 49 4.1 2 0B 51 43.1 22 0
32.6 A 67 3.0 2 0B38 0 0 0
2541
Table 5. EFFECT OF 30 DAYS OF EXPOSURE TO CO~NDENSATE WATER ONCHANNEL CATFISH EGGS AND FRY
MeanMeasured Eggs Fry
Concentration Test Initial %Number%(mg/L) Series Number Hatch Hatched Survival
Control A 23/40 57.5 23 39.1B 26/51 51.0 26 69.2
Solvent A 28/61 45.9 28 50.0*controla B 17/60 28.3 17 47.0
0.55 A 40/59 67.8 40 80.0B 37/68 54.4 37 59.4
0.92 A 19/58 32.8 19 94.7*B 35/59 59.3 35 82.8
1.72 A 38/55 60.0 33 97.0B 40/62 64.5 40 97.5
4.35 A 26/47 55.3 26 3.8*B 26/60 43.3 26 11.6
9.60 A 33/60 55.0 33 0B 11/49 22.4 11 0
a 40 WLL acetone.
4 26

Although the data are highly variable and permit only the grossestinferences to be made, 2,4-DNT appeared to reduce hatching success at concen-trations of 6.2 to 32.6 mg/L and fry survival at concentrations as low as 3.4mg/L. Condensate water did not have a demonstrable effect on egg survivalwithin an exposure range of 0.55 to 9.60 mg/L but appeared to reduce frysurvival at concentrations of 4.35 to 9.60 mg/L. In both of these tests, theeggs were exposed for approximately 10 days and the fry for the remainder ofthe 30-day exposure period.
Rainbow Trout
The effects of 2,4-DNT on egg hatchability and fry survival and growthare shown in Table 6. 2,4-DNT did not affect hatching success or fry survivalwithin the range of concentrations tested (0.10 to 2.05 mg/L). However, thepattern of effects on growth suggests a concentration-related response,particularly at the three highest concentrations (0.49 to 2.05 mg/L). Theonly exception to the overall trend was the relatively good growth thatoccurred in fish exposed to 0.23 mg/L. However, this may have been due, inpart, to the relatively few fish present at this concentration. If weconsider only the three highest concentrations, length was reduced an averageof 10.2, 20.0, and 23.2 percent, while weight was reduced by 26.6, 45.0, and51.7 percent. Although the overall density of fry in each tank was rathervariable, the overall trends in growth effects as well as the magnitude ofthese effects suggests that, at least within a concentration range of 0.49 to2.05 mg/L 2,4-DNT, the observed reductions in growth were toxicant-related.
The effect of condensate water on egg hatchability and fry survival andgrowth are shown in Table 7. Condensate water did not appear to affect egghatching success or fry survival within a concentration range of 0.10 to 1.96mg/L. However, growth was significantly affected in both series atconcentrations of 0.43 to 1.96 mg/L and in Series B at 0.22 mg/L. Theseeffects were marked. Length was reduced an average of 10.1, 13.6, and 32.3percent in the pooled series at concentrations of 0.43, 0.88, and 1.96 mg/L,respectively. Weight was similarly reduced at these concentrations by 37.8,26.9, and 62.2 percent. In Series B at 0.22 mg/L, length and weight werereduced by 8.1 and 25.0 percent, respectively, compared with the control.
27

* • " " "''... . .. - -" " ' "" '" ° " ' .. . . ." "*-" ''"
" -' ' " " -' ' b'
: -
." - -" '".
Table 6. EGG HATCHABILITY, FRY SURVIVAL, AND FRY GROWTH IN RAINBOW
TROUT EXPOSED TO 2,4-DNT FOR 60 DAYS
Average Average
Eggs Fry Fry
Concentration (mg/L) Test No. No. Fry Alive Length Weight
Mean S.D. Series Exposed Hatched at 60 Days (cm) (g)
* 0.00 - A 60 53 12 2.67 0.154
B 60 54 16 2.72 0. 167
0.10 0.03 A 60 59 23 2.57 0.12ga
B 60 59 35 2.53 0.132a
* 0.23 0.06 A 60 40 9 2 .4 5a 0.169
B 61 43 9 2.71 0.187
0.49 0.07 A 60 57 17 2 .38a 0.1 24 a
B 60 57 21 2 .4 6 a 0.119a
1.08 0.15 A 60 52 37 2 .0 7a 0 .0 7 5a
B 61 48 28 2 .24 a 0 .1 0 7a
2.05 0.23 A 60 56 33 2 .0 7a 0 .0 7 8 a
B 60 60 31 2 .0 7a 0.082a
a Statistically significant, p < 0.05.
4)
4
28

Table 7. EGG HATCHABILITY, FRY SURVIVAL AND FRY GROWTH IN RAINBOW TROUT
EXPOSED TO CONDENSATE WATER FOR 60 DAYS
Average Average
Eggs Fry Fry
Concentration (mg/L) Test No. No. Fry Alive Length Weight
Mean S.D. Series Exposed Hatched at 60 Days (cm) (g)
0.00 - A 60 57 26 2.49 0.121B 61 60 18 2.48 0.128
0.10 0.02 A 62 5 1a 11 2.68 0.172
B 60 4 9 a 22 2.57 0.137
0.22 0.05 A 61 3 9a 15 2.41 0.137B 60 3 9a 32 2 .28 a 0 .0 9 6 a
0.43 0.06 A 61 54 30 2 .26 a 0 .0 8 0 a
B 60 58 45 2 .16 a 0 .0 7 5 a
* 0.88 0.19 A 63 57 14 2 .1 1 a 0 .0 9 0a
B 61 60 15 2 . 1 4 a 0 .0 9 2a
1.96 0.42 A 62 55 24 1 . 6 6 a 0 .0 4 5aB 60 54 14 1 .67 a 0 .0 4 9 a
9aa Statistically significant, p * 0.05.
Although hatching success in these two tests was generally quite good,fry survival was relatively low, averaging 26 and 38%, respectively, for the
2,4-DNT and condensate controls over the 60-day exposure period. Because of
this occurrence and also because of problems with nonrandomization of gametes
and lack of any apparent toxicant-related effects on egg-hatching success andfry survival, another test was performed on 2,4-DNT using an extended concen-
tration range and eggs that were randomized over the treatment levels. Data
from this test are summarized in Table 8.
29

Table 8. EFFECT OF 2,4-DNT ON RAINBOW TROUT EGG HATCHING SUCCESS ANDFRY SURVIVAL AND GROWTH DURING A 90-DAY EXPOSURE PERIOD
Eggs Fry Average Average
Concentration (mg/L) Test No. No. No. No. Alive Length WeightMean S.D. Series Exposed Hatched Deformed at 90 Days (cm) (9)
0.00 - A 60 34 6 25 4.78 0.942B 60 41 1 34 4.50 0.815
0.05 0.03 A 60 46 0 32 4 54a 0 .83 0a
B 60 48 0 44 4.36 0.720
0.12 0.05 A 55 47 4 36 4 .50a 0 .7 75a
B 55 47 6 32 4.66 0.880
0.27 0.11 A 55 32 1 28 4 .56a 0.921B 55 34 1 30 4.60 0.960
0.56 0.24 A 60 41 0 30 4 .3 7a 0 .74 5 a
B 60 43 0 37 4.33 0.746
1.17 0.54 A 60 46 4 40 4 .0 8a 0 .6 65 a
B 60 45 3 42 4 .24a 0.730
2.26 0.73 A 60 52 2 46 3 .82 a 0 .4 92 a
B 60 47 2 35 3 .9 7a 0 .58 2 a
4.02 1.30 A 60 52 3 26 3 .14 a 0 .2 87a
B 60 47 1 36 3 0 3 a 0 .30 2a
a Statistically significant, p ( 0.05.
30
. ..A. . " - " ' - : " " ' ' - ' " - ' '

Although egg hatching success was appreciably lower than observed in thetwo previous tests, fry survival was much better. The lower hatching successwas probably due to the fact that the eggs were obtained late in the spawningseason which made their viability quite varible.
There were no statistically significant effects on egg survival, number
of deformed fry, or fry survival within the range of concentrations of 2,4-DNTtested (0.05 to 4.02 mg/L). However, all of the fry in both series in thehighest concentration (4.02 mg/L) were unable to swim and remained on theirsides at the bottom of the aquaria. On the basis of this observation, weconclude that 2,4-DNT at a concentration of 4.02 mg/L would have affected frysurvival under natural conditions.
Fry length 60 days after hatching was reduced in Series A at all concen-trations (0.05 to 4.02 mg/L) and in Series B at 1.17 to 4.02 mg/L. For thepooled series, the reductions in length were approximately 10.3, 16.1, and33.5 percent at concentrations of 1.17, 2.26, and 4.02 mg/L, respectively. In
Series A, the effects at 0.05, 0.12, 0.27, and 0.56 mg/L amounted toreductions of approximately 5.0, 5.9, 4.6, and 8.6 percent, respectively,compared with the control.
Fry weight was similarly affected by 2,4-DNT in this test. Significantreductions occurred in Series A at 0.05, 0.12, 0.56, 1.17, 2.26, and 4.02 mg/Land in Series B at 2.26 and 4.02 mg/L. For the pooled series, the reductionswere approximately 38.9 and 66.5 percent at 2.26 and 4.02 mg/L, respec-tively. In Series A, the reductions in weight were approximately 11.9, 17.7,20.9, and 29.4 percent at concentrations of 0.05, 0.12, 0.56, and 1.17 mg/L.Weight was also reduced in Series A at 0.27 mg/L compared with the control butthe effect was not significant.
Water-quality data associated with the trout early life stage studies on2,4-DNT and condensate water are summarized in Tables 9 and 10.
ii,
31
0q

- - -vw---~----~ ~ - - -
301 a. .n - .~ C, tn 4 N N N N N N N
a. o ~ a o a
-ci En N in r~ En En
001 in
~O~Enin.n .0.0.0 ~ .0.0
-1.1 .0 in in in in in * N N N N N N NIs6161 0 8 0 .0w. ,. .0.40 I I - -I I i i i4.0 '0 400 0 N.E 0 in N
I N N N N N N -601 N '0 '0 c '0 N a. 0 in N - in 4 -.50! 4 in in in in 4 -
4a. a. a. a. N in 0CC 'a os CO~4 4 4 4 09
al a. .q 'C C C 'C
o I 0 09 0 0 0 0 0.06] N N N in in N '0* - N N N N N N -a I I I I I I'.4s N 09 0% in IA VS 09.0 0 ~0 'C .0 C En
4 1'C ~ a. In '0~!I NN - -~ C - ~0 0 a. 0009 ~ 0N 01 M 1 in - - - - a. C in 4 'C in 194
aI~0, - NI 0'A '---I.... A.;bE ~'gj.n ~IiIIIII
~ 0
* 0
in
- gIw;~~ -
jUl 4 09 09 in in in in ~
I- Li a. 'C ~ N 09 in 'C 'CCC0 N N N N N NS N N N N NI I I I Io
2 NNNN 0a.00000022
N in C 4 'C C000000
H N N N N '0 N N N N N NUC in in EniES in N N N N N N N N
a a. 'C .C C 44 * N NOSI . N a. 'a ~0000000 000a. a. a. a.
V I I ~-I" a.a.oooo '~ NO a. a. 0I.) 'a~J . -
NN a.a.NNN~0CS4 aa. a. a. a. - a. a. a. a. a. a.'~ 0
I4~ ::~:~; ~a. a. a. a. a. a. a.
S '-I IIa
000000-ENQE a. 4% 'JO NE, C NON *0* 0 0 0 0 - N US 0.....
00
32
(
1*1
* *
I 4 4t r il l
* oo o o o
4
" N N NUD U V 0 .0.0 0 '
04!2 10101
01 4 a.. .
Jai d~d
'1 2ill
~ jl33
Fathead Minnows
The results of the 30-day early life stage study on fathead minnowsexposed to 2,4-DNT are summarized in Table 11. The data from this test werenot statistically analyzed since it was intended primarily as a range-findingtest for the subsequent chronic study. In spite of the uniformly low hatchingsuccess (approximately 50 to 60 percent), 2,4-DNT had no appreciable effect onegg hatchability and fry growth and survival except at the highest
concentration (6.8 mg/L), which markedly reduced all of these parameterscompared with the controls.
Table 11. EFFECT OF 2,4-DNT ON FATHEAD MINNOW EGG HATCHABILITY AND FRYSURVIVAL AND GROWTH DURING A 30-DAY EARLY LIFE STAGE STUDY
Chemical Concentration (mg/L) Test No. of Eggs Fry Fryx SD_ Series Hatched (out of 60) Survival Length (cm)
0 - A 34 34 1.3B 33 32 1.1
1.0 0.23 A 36 35 1.3B 48 42 1.2
1.1 0.30 A 40 35 1.2B 37 34 1.3
2.0 0.44 A 31 29 1.3B 34 33 1.2
3.1 1.16 A 31 28 1.3B 28 24 1.2
6.8 1.55 A 18 9 0.8B 16 3 0.7
A similar test was performed on condensate water. Because of insuf-ficient numbers of embryos, this test was not performed in duplicate. Thesedata are shown in Table 12. As with the test on 2,4-DNT, the data were
34
.- ' " " : "- t " . : . " . -- " " " " " ' " ". - .'_ . .. _ • . "... . "

Table 12. EFFECT OF CONDENSATE WATER ON FATHEAD MINNOW EGG HATCHABILITY ANDFRY SURVIVAL AND GROWTH DURING A 30-DAY EARLY LIFE STAGE STUDY
ChemicalConcentration (mgIL) No. of Eggs Fry Fry Fry
X SD Hatched (out of 60) Survival Length (cm) Weight (gin)
0 - 57 31 0.98 0.013
0.6 0.3 60 32 0.95 0.008
1.4 0.7 60 22 1.12 0.015
2.0 0.9 60 7 1.17 0.022
3.1 1.4 60 8 1.14 0.019
6.9 3.8 60 1 1.10 0.010
not statistically analyzed. However, condensate water had no apparent effecton egg hatchability at a concenration range of 0.6 to 6.9 mg/L. 'Fry survivalappeared reduced at 1.4 to 6.9 mg/L. There were no apparent effects on frygrowth, but such effects could have been neutralized by the reduced density offry in most of the treated aquaria. As evidenced by the large standarddeviations associated with the mean chemical concentrations, theconcentrations in the test tanks fluctuated. This was due primarily toproblems with microbial growth in reducing the flow of toxicant in thecapillary tube that connected the toxicant head tank to the toxicant meteringdevice. This tended to reduce the toxicant flow rate and lover the testconcentrations.
Water-quality data associated with these tests are summarized in Tables13 and 14.
35
.. . . - , -; . % . -, . . - . - : . - : - . - -i - - " " . "" " '°'
:I
-U, - C . I .
II
":4Ir 1
4,0 I i I iI
- m I .. . " . • " . • , I . . .
ZII a3a

Chronic Studies
Chronic studies were conducted with fathead minnows and Daphnia magna.
Fathead Minnows
2,4-DNT. The effects of 2,4-DNT on egg hatching success and fry survi-val, deformities, and growth during a 179-day period are shown in Table 15.The number of eggs that survived to hatch was reduced at concentrations of2.69 and 6.71 mg/L in series B compared with the controls. Fry survival wasreduced in Series A at concentrations of 2.69 and 6.71 mg/L over an exposureperiod of 30 to 179 days. Fry survival was reduced in Series B at a concen-tration of 6.71 mg/L over an exposure period of 30 to 179 days and at a con-centration of 2.69 mg/L after an exposure period of 179 days.
The effect of 2,4-DNT on fry length in Series A was as follows: the
reduction at a concentration of 0.29 mg/L was significant over the first 60days of exposure, but not after 90 days; the reduction at 2.69 mg/L wassignificant after the first 30 days of exposure, but not after 60 and 90 days;the reduction at 6.71 mg/L was significant over the first 60 days of exposureand there were no survivors thereafter. In Series B, the reduction in frylength was significant at concentrations of 2.69 and 6.71 mg/L over the first30 days of exposure but not at 60 or 90 days; it was also significantly
reduced at 1.31 mg/L after 30, 60, and 90 days of exposure. This reductioncould have been concentration-related because the lack of effect of growth inseries B at higher concentrations was associated with comparatively fewer fryin these tanks, which could have mitigated any small toxicant-related effecton growth.
The effect of 2,4-ONT on reproduction is shown in Table 16. These data
indicate that although the survival of the spawning pairs was not signifi-cantly affected over the range of exposure, their ability to produce eggs was
significantly reduced at concentrations as low as 1.31 mg/L. In the pooledseries, eggs per spawn was significantly reduced at 0.62 mg/L. The data alsosuggest that the reduction in reproductive capability extended to the lowestconcentration tested, 0.28 mg/L.
I
37

The survival of F1 fry exposed to condensate water for 30 days was sig-nificantly reduced for the B series at a concentration of 0.19 mgIL and forthe A series at 0.34 mgIL; at both of these concentrations, survival wassignificantly reduced when the series were pooled. However, survival inboth series at a concentration of 0.75 mg/L was similar to the control value,leading one to believe that the results in intermediate concentrations maybe related to factors other than dose level.
Survival of F1 fry reared to 60 days was significantly reduced onlyin the A series at 1a concentration of 0.34 mgIL. Because it was not sig-nificantly reduced in the B or pooled series at this level or in eitherseries at a concentration of 0.75 mg/L, there does not appear to be anyconcentration-related effect on survival.
The length and weight of F 1 fry reared to 30 days was significantlyreduced in the A series at 0.19 mgIL. This does not appear to be a dose-related effect because there is no significant reduction in length or weightrelative to controls in either series at concentrations of 0.34 and 0.75 mgIL.
The length of F 1 fry reared to 60 days was significantly reduced in theA series at concentrations of 0.19 and 0.75 mgIL, in the B series at 0.34 and0.75 mg/L and in the pooled series at 0.19, 0.34, and 0.75 mg/L, which werethe only concentrations tested. There was a definite trend toward shorterlength with increase in concentration in the B series, but such a definitetrend was not seen in the A series.
The weight of F 1 fry reared to 60 days was significantly reduced in theA series at a concentration of 0.19 mgIL, in the B series at 0.19, 0.34, and0.75 mg/L (all the concentrations tested), and in the pooled series at 0.19and 0.75 mg/L. The trends seen in length of F fry raised to 60 days wererepeated here, with the B series showing a definite downward trend in weightas concentration increased and the A series showing the most serious reductionat 0.19 mg/L, then reaching a value greater than that of the control at 0.34mg/L, and again falling lower than the control at 0.75 mg/L. Although theeffects on growth are suggestive of deleterious toxicant activity at the lowerconcentrations, interactions between growth and fry density could be responsi-ble for at least part of the observed responses.
The effects of condensate on the global indices of total survivabilityand total productivity are shown in Figures 3 and 4 and in Table 24. The Aseries shows a general trend toward diminished survivability as theconcentration levels increase, whereas the B series shows less effect. Thesame general trends are seen in the productivity index.

C'S
00000000
LH a
* -~ 0 ~ 'C
- ~ a0 -t 0 * . r- r- M.
O~ 0000~. 00t~XC 0 r0 00000
5-
- IA0
- I a ~* 'S ~. 4 .0a-' 0 0 '~ 'C0 00000000
4
.0
-, 0 0N t~ ~ N.JU 0000 N 000
~
~~ 40 s~ - r .s00
5-4a.
aa.*a 00 S
0: p.0,.
0 'U6*. a
0 -5-4
a00 C ,- ~ a4 00 00~ N U% t~ N a
z a0 0 100 5.8 a -
- A -.
0 ~ NO.0 ~ -
0 00 0 0
~
o ,Z C~ % N ~ ~ N 0 N
0 IC C
o *~. 404040404040 C C
I-a 0 0
a aa. a.
~. 'UCas ISOa aZU U Uaa-. - -
.~ *U.) 0 0' 4 S 0 t9 -hN 0 - 0 . a* 0 0 0 0 N 'S a a* ISO5- ro I
50

z
>0 10
00
0- "040 f ~
000
V4
-tl -4 .4 0
00 000
0- 0 0
0z I-' U) 0 C% LC:4 -H 4, f) M M -
o1 0 ~ >4 4 -4 .-4 tsL4
0En33 -~0 -
Cz
w 0
04 Cu
C14 WI CCI -4 4 e 4 .- - 4 iZ 4
00 -9
o0 .40 10 '0 0 ' V 0" 40
cn10%
6. >01 a , U- t0 U% r0 ! 6
ac l 4 0 4 ~ 4 % 4 ~ E9 4cn ~ ~ ~ ~ 'aA , T
-.-4 - ''0 0 0 0 m m 0
-- 1.. -A om 0.
0~ a 'DG44
en A0 wn--
En
2, 0% . n . .. . .~ . 0 .
b nE3u
=0 09 0 a'N 0
'I-,
-t Is AE E
444
17 ' 7
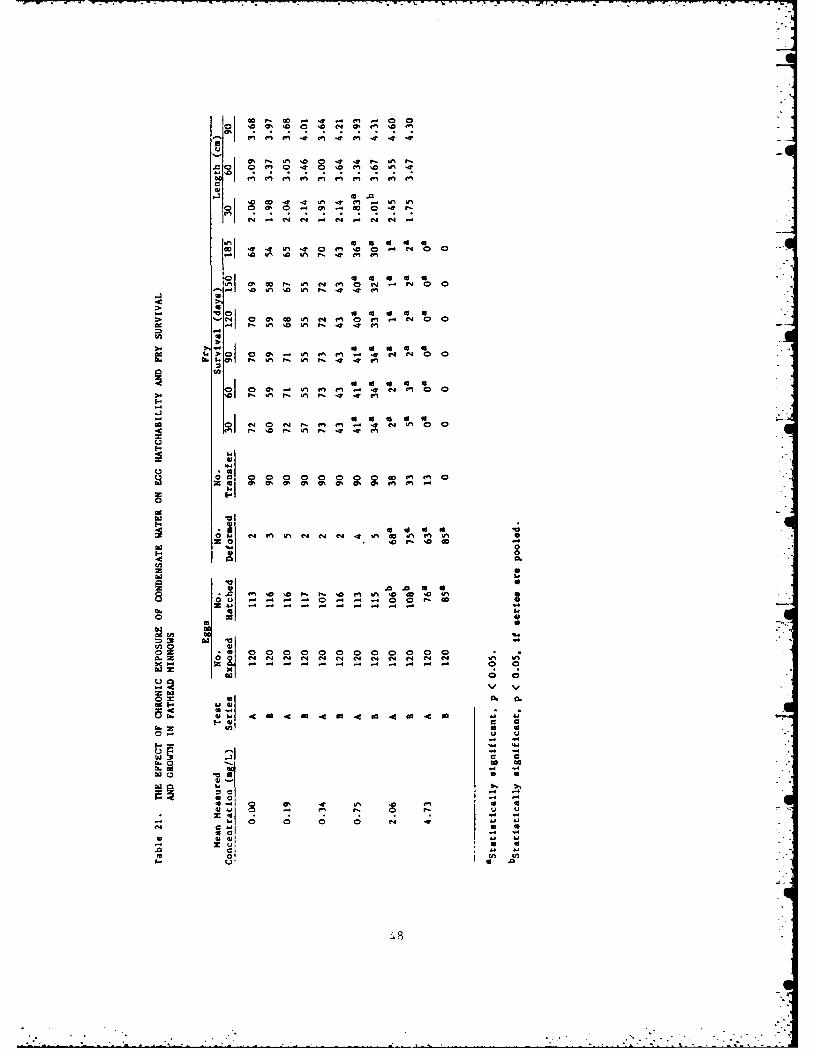
Condensate water. The effects of condensate water on egg-hatchingsuccess and on fry survival, deformities, and growth of fathead minnows during.a 135-day period are shown in Table 21. The number of eggs which survived tohatch was significantly reduced at a concentration of 4.73 mg/L in bothseries. The number of deformed F0 fry was greatly increased in concentrationsof 2.08 and 4.73 mg/L in both series. Survival of F0 fry was significantlyreduced in both series at concentrations from 0.75 to 4.73 mg/L at 30, 60, 90,120, 150, and 185 days. Length was significantly reduced in F0 fry after 30days in the A series at a concentration of 0.75 mg/L; however, this may havebeen an artifact because no significant reduction was observed at any otherconcentration or time. In fact, at 60 and 90 days there is a trend towardan increase in length with increase in concentration. This may be a densitydependent phenomenon; the number of surviving fry was reduced in the higherconcentrations.
The effect of condensate on reproduction is shown in Table 22. Spawningcould not be established in Series A at a concentration of 2.06 mg/L or ineither series at a concentration of 4.73 mg/L due to high F0 mortality atthese concentrations. Only one pair was available for spawning in the 13series at a concentration of 2.06 mg/L, and this pair produced no eggs.Consequently, there was a significant reduction, compared with controls,in productivity at this concentration as measured by all the reproductiveparameters used except the number of days that the breeders survived. Atconcentrations of 0.19, 0.34, and 0.75 there was no significant reduction,compared with controls, in spawning pair survival, spawns per pair, eggs perspawn, or eggs per pair per day in either series. There was a significantreduction in eggs per pair at a concentration of 0.19 mg/L in the A series.Hlowever, this effect does not appear to be dose-related because there is noreduction in the B series at this concentration or in either series atconcentrations of 0.34 and 0.75 mg/L.
The effect of condensate water on the F, generation is shown in Table23. The number of eggs surviving to hatch was significantly reduced in the Bseries and the pooled series at a concentration of 0.75 mg/L. No significantincrease in F1 fry deformity is seen in any concentration in which eggs wereproduced . in fact, the controls had the highest rate of deformed fry,approximately 6 percent of those that hatched.

I :I11
I'll I
S I I I I 1
-
. .. . . ..qI d * - ?-
O 1H= =
..I 0 0 0 ° , ° S
- ol~ Sn N C n S
• . .*° ,.". , .
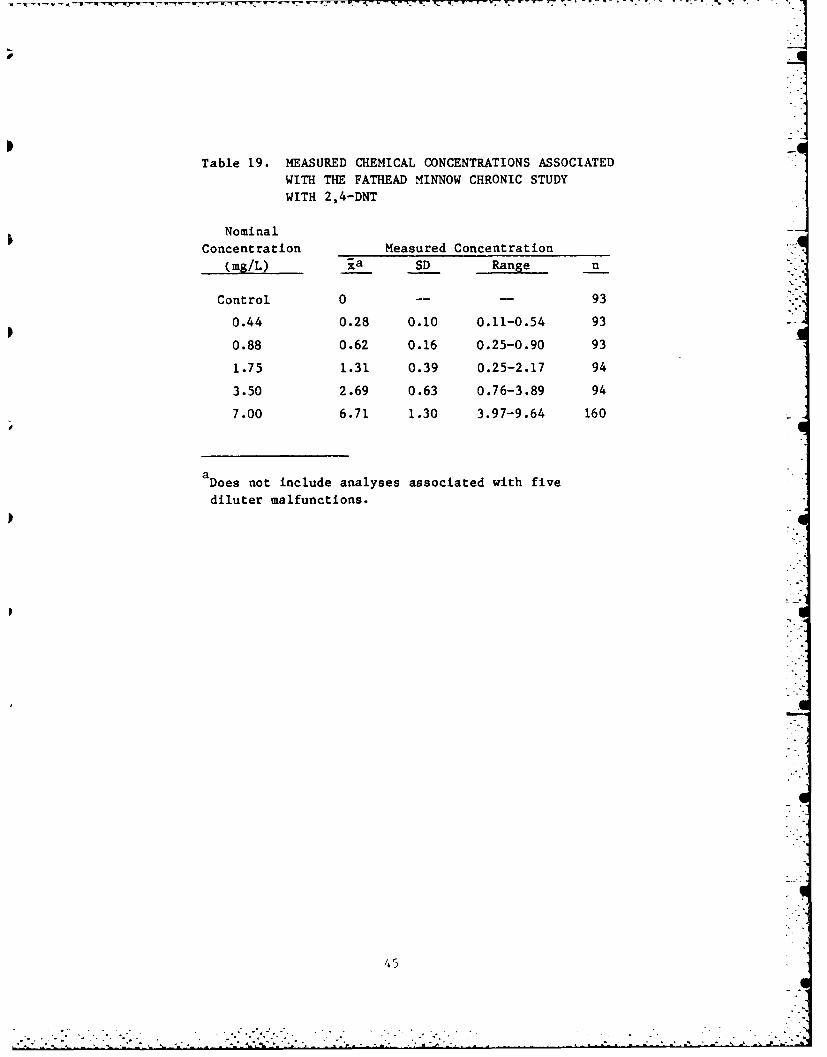
Table 19. MEASURED CHEMICAL CONCENTRATIONS ASSOCIATED
WITH THE FATHEAD MINNOW CHRONIC STUDY
WITH 2,4-DNT
NominalConcentration Measured Concentration
(mg/L) ja SD Range n
Control 0 -- - 93
0.44 0.28 0.10 0.11-0.54 93
0.88 0.62 0.16 0.25-0.90 93
1.75 1.31 0.39 0.25-2.17 94
3.50 2.69 0.63 0.76-3.89 94
7.00 6.71 1.30 3.97-9.64 160
I°
aDoes not include analyses associated with five
diluter malfunctions.
45
-. . . ' - . ' ' .. -' ... .- -. , -'-- . . - - " . . . • .. ... , -

Table 18. TOTAL SURVIVABILITY AND PRODUCTIVITY INDICES IN FATHEAD MINNOWS
AFTER CHRONIC EXPOSURE TO 2,4-DNT
Mean MeasuredConcentration Total Survivability Total Productivity
(mg/L) Series A Series B Series A Series B
0.00 1076 583 101 67
,0 0.28 718 472 83 49
0.62 561 451 66 48
1.31 274 140 22 25
2.69 49 - 4 -
*O 6.71 ........
Measured chemical concentrations and water quality parameters associatedwith the fathead minnow chrronic study with 2,4-DNT are shown in Tables 19 and20, respectively. Measurements of chemical concentrations associated withdiluter malfunctions were not included in the calculations because theproblems were short-term (< 12 hours) in duration and typically resulted inrelatively brief reductions of the concentrations in the tanks. Because ofthe short-term nature of these occurrences, including them in the calculationswould have given them appreciably greater weight than the samples takenregularly at weekly intervals.
144
0. . . - -
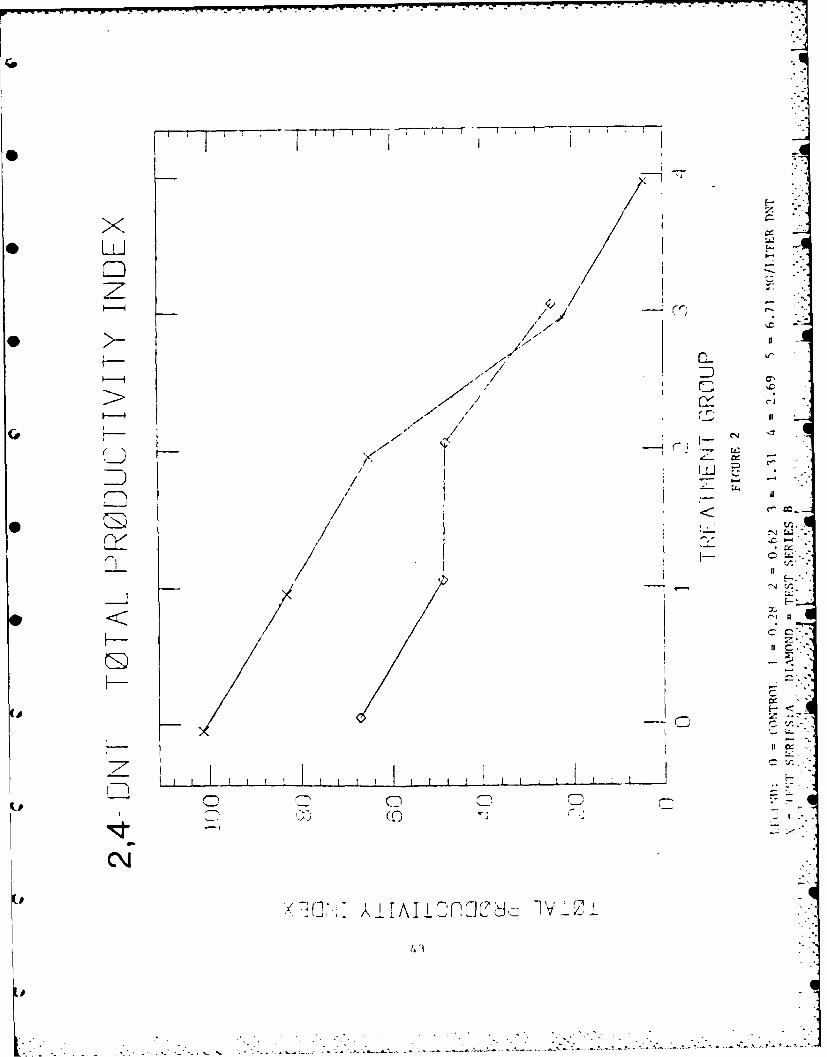
L LU
2 / / j
T* 12,iL ti
xT-T-T
j i l l I
r~ __j
/c
/ CE
0::0
L-S-
if)Ci0~~" c .-C
CD I
<-A I Al

10 -0 V. 0C
0 0 0 ; 0 0 1
14.0
10
T A 0
CC
6
0. 0 0
00 C4 in 0 .0
a. F, cn
40

The effect of 2,4-DNT on the F generation of fathead minnows is shownin Table 17. A statistically significant reduction in egg-hatching successoccurred in both series at a concentration of 2.69 mg/L. A statisticallysignificant increase in fry deformities occurred in series A at concentrationsof 0.28, 0.62, and 1.31 mg/L and in the pooled series at concentrations of0.28 and 1.31 mg/L. Although these increases were significant, the numberswere not large, constituting less than 5% of the total hatched fry.
Survival of FI fry reared to 30 days was significantly reduced in SeriesA at a concentration of 0.62 mg/L. This may be an artifact because there wasno significant reduction in survival in the B series or in the the pooledseries at this concentration and there was no effect in either series at aconcentration of 1.31 mg/L. Survival of FI fry raised to 30 days was alsosignificantly reduced in the A series at a concentration of 2.69 mg/L. (Nofry were reared at this dose level in B series.) Survival of F1 fry rearedto 60 days was significantly reduced in the A series at concentrations of 0.28and 0.62 mg/L, in the B series at a concentration of 1.31 mg/L, and in thepooled series at 0.28, 0.62 and 1.31 mg/L. Again, these results are difficultto interpret as being dose-related because there is no significant reductionin survival in the A series at concentrations of 1.31 and 2.69 mg/L but inthe B series there is a steady trend toward reduced survival with increasein concentration.
Length of F1 fry reared to 30 days was significantly reduced in the Band pooled series at 1.31 mg/L and in the A series and pooled series at 2.69mg/L. Length of F fry reared to 60 days showed a significant reduction inthe B series at 0.28 and 0.62 mg/L and in the pooled series at 2.69 mg/L.There was no concurrent significant reduction in weight after 60 days ofexposure at any concentration, although significant reductions in weightwere seen after 30 days of exposure at concentrations of 0.28, 0.62, and2.69 mg/L in the A series and at concentrations of 1.31 and 2.69 mg/L inthe pooled series. Based on the number of fry present and the lack ofeffect on length, the weight reductions at 0.28 and 0.62 mg/L could berelated to differences in fry density rather than to the toxicant.
The effects of 2,4-DNT on the global indices of total survivability andtotal productivity are graphically displayed in Figures 1 and 2, respectively,and also in Table 18. Both parameters show a trend of depression as toxicantconcentration increases.
40

I~~~ R0-R1
Cu CN e'T 0 as '0 1" . -o
04. C.J .4 a; - ..
00
~~ '00e 00 rJ 0; C0o
00
4-44
91..
0.. ~ ~ ~ r- '0 r % '0 ' 4
-4
0 t
0 4 "4 .>, e q e n cs (Wm % 0 m I eto ->-o-4 4 -
Cu 04$4IW ~ C Cu 0
oww
0- 4) w ' ~ - ~ 0 % 0 0 '0 .
U, 04 0
0...~1
-4-4
'-4 1-4
Fmm
* F39
0~~~~~ A04, ' 4 4 -

.00
C44
a o -C- . t 0 .- I-n~'
>U SO OWN0 I %n a a~ Na M0
% 0'0 W, G% 0D 'D 'S W, -a U% '
v. C4c00% co ' 000 .
1010 9 WN %0% 0%a 10 9 0 'A W%
0..
0 30
m4
uO '0 % -N4101 .
a -
a .a a
In 0 c1% C4- .(3 co
be4
toa a a
~I ~ 00 4% 1%'0- % 0% N '

CLU
F--
Luw
F--
C,
LUJ77 1
0 0J
UJC -) a-. L
X3NwVI~n vo* 52

wwrni
I- D
F- '-i
ry sw0
< L)F-A
0
CD"
(-10-Ii
oV* t- 7
0 LW~0w
uu
X30I II~~o~ I i i
53,

Table 24. TOTAL SURVIVABILITY AND PRODUCT~IVITY INDICES IN FATHEAD MINNOWSAFTER CHRONIC EXPOSURE TO CONDENSATE WATER
Average ActualConcentration Total Survivability Total Productivity
(mg/L) Series A Series B Series A Series B
0.00 1768 807 319 173
0.19 966 918 140 141
0.34 1021 926 224 147
0.75 501 468 79 66
2.06 --
* ~4.73 --
Measured chemical concentrations and water quality parameters associatedwith the fathead minnow chronic study on condensate water are shown in Table25 and 26, respectively. As indicated earlier, measured concentrationsassociated with diluter malfunctions were not included in the analyses.
Table 25. MEASURED CHEMICAL CONCENTRATIONS ASSOCIATED WITH THE FATHEADMINNOW CHRONIC STUDY WITH CONDENSATE WATER.
* NominalConcentration Measured Concentration (mgfL)
(mg/L) ___ SD Range n
Control 0.00 - -53
0.30 0.19 0.06 0.10 - 0.35 54O0 60 0.34 0.14 0.11 - 0.76 54
1.25 0.75 0.27 0.33 - 1.61 542.50 2.06 0.46 1.23 - 2.85 545.00 4.73 0.67 2.27 - 6.28 56
*Does not include analyses associated with two diluter malfunctions.
54

16, 0 C 0 0
CA 2~:a'IC'~, a '
0 "1
0! N N
-2 2 a
I- w . 4 . 4
a'
0a' au
rAMI55
Daphnia magna
*24-DNT. The effect of 2,4-DNT on the survival of daphnids is shown inTable 27. The only statistically significant reduction in survival occurredat a concentration of 0.19 mg/L when the beakers and series were pooled.Because survival was not significantly reduced at the three higher levels,this does not appear to be a dose-related effect.
*6 Table 27. CUMULATIVE MORTALITY OF DAPHNIDS DURING A 28-DAY EXPOSURETO 2,4-DNT
Mean Number Dead (n - 22)Measured Series A Series B
Concentration 14 Days 21Days 28 Days 14 Days 21 Days 28 Days
Control 0 0 0 0 0 0
0.07 0 0 0 0 0 0
0.19 0 0 4 a 0 2 2a
0.40 0 0 0 0 1 1
1.02 0 0 1 0 0 1
1.78 0 0 1 2 3 3
a Statistically significant, p < 0.05, when series are pooled.
The effect of 2,4-DNT on the reproductive success of daphnids is shown inTable 28. The number of young produced per individual female wassignificantly reduced in the following groups: at a concentration of 0.40 mg/Lin the B series and the pooled series after 21 and 28 days of exposure; at aconcentration of 1.02 mg/L in the B series and pooled series after 21 and 28days of exposure and in the A series after 28 days of exposure; and at aconcentration of 1.78 mg/L in the A and B series after 21 and 28 days ofexposure and in the pooled series after 14, 21, and 28 days of exposure.
4
56

Table 28. AVERAGE NUMBER OF YOUNG PRODUCED PER INDIVIDUAL FEMALE DAPHNIDEXPOSED TO 2,4-DNT
Mean Measured Series A Series BConcentration (mg/L) 14 Days 21 Days 28 Days 14 Days 21 Days 28 Days
Control 3.3 28.8 53.1 3.4 51.0 59.1
0.07 2.0 34.0 48.7 4.6 43.1 53.1
0.19 5.6 40.6 59.4 8.4 48.0 69.2
0.40 2.3 2 4 .7b 4 4 .3b 7.6 1 8 .4 a 4 1 .3 a
1.02 1.8 16 .4 b 25 .6 a 3.3 18 .6 a 31 .2 a
1.78 0 .b 9 .7a 2 0 .7a 1 .7b 16 .8a 28.2
a Statistically significant, p < 0.05.
b Statistically significant, p < 0.05, when series are pooled.
Data on the onset of reproduction, number of young produced per dayduring the reproductive period, and average length of surviving individual
|* females exposed to 2,4-DNT are shown in Table 29. The time to onset ofreproduction does not seem to have been affected by the presence of 2,4-DNT.The number of young produced per day was significantly reduced in the A seriesat concentrations of 1.02, and 1.78 mg/L and in the B series and pooled seriesat concentrations of 0.40, 1.02 and 1.78 mg/L. The average length of isolateddaphnids surviving the 28-day exposure period was significantly reduced in the
o QA, B, and pooled series at concentrations of 1.02 and 1.78 mg/L.
4 57
S- ., -. - .- .. . .-.. . . . . .. . . . .. . . . .

r,- w-
Table 29. TIME TO FIRST BROOD, NUMBER OF YOUNG PRODUCED PER REPRODUCTIVEDAY AND AVERAGE LENGTH OF SURVIVING FEMALE DAPHNIDS EXPOSEDTO 2,4-DNT FOR 28 DAYS
Mean Measured Test Time to First No. of Young AverageConcentration (mg/L) Series Spawn (days) Produced/Day/Female Length (mm)
0.00 A 15.2 4.2 3.5
B 12.3 3.8 3.6
0.07 A 14.4 3.6 3.6
B 12.6 3.4 3.9
0.19 A 12.0 3.7 3.5
B 12.3 3.8 3.8
0.40 A 13.4 3 .0b 3.5
B 1l..O 2 . 6 a 3.51.02 A 13.7 1 . 8 a 3 . 2 a
B 13.4 1 . 9 a 3 . 3 a
1.78 A 16.1 1 . 7 a 3.2 a
B 15.9 2 . 3 a 3.2 a
a Statistically significant, p < 0.05.
b Statistically significant, p < 0.05, when series are pooled.
The chemical analyses associated with this test are summarized in Table30. Traces of what appeared to be 2,4-DNT showed up in control samples, butno problem could be discovered in the diluter or delivery systems. This
occurred intermittently and we were frustrated in our efforts to ascertain theorigin of the peaks. Because these peaks also occurred in diluent waterblanks, we considered them as background and subtracted them from the valuesobtained for the other samples in the same series, to arrive at the actualexposure concentrations. The three lowest concentrations were 42%, 24%, and20% below their nominal values, respectively (low to high). This may havebeen caused by sorption of the toxicant or microbial or photolytic breakdownonce it reached the test vessel.
Water quality data associated with this test are summarized in Table 31.
58
Table 30. ANALYSES OF 2,4-DNT IN A DAPHNIA CHRONIC STUDY
Nominal Actual ConcentrationConcentration (mgIL) Mean S.D. n Range
0.00 0.00 - 9
0.12 0.07 0.04 7 0.0-0.12
0.25 0.19 OA 8 0.10-0.27
0.50 0.40 0.17 8 0.16-0.57
1.00 1.02 0.33 8 0.60-1.37
2.00 1.78 0.62 13 0.90-2.73
59
al
1
A l
7 I I I I m
-1 0: C;
el UC4 o 4
v i
0 u60

Condensate water (nonirradiated). The effect of condensate water on thesurvival of daphnids is shown in Table 32. There was a statisticallysignificant increase in mortality after 28 days of exposure at a concentrationof 4.16 mg/L in the A series and when the series are pooled.
Table 32. CUMULATIVE MORTALITY OF DAPHNIDS DURING A 28-DAY EXPOSURETO CONDENSATE WATER
Number Dead (n - 22)Mean Measured Series A Series B
Concentration (mg/L) 14 Days 21 Days 28 Days 14 Days 21 Days 28 Day
0.00 0 1 2 0 2 5
0.18 0 1 3 0 4 6
0.41 0 1 2 0 2 7
0.94 0 1 2 0 2 2
2.30 0 2 2 0 1 34.16 0 8 ,a 0 4 10 b
aa
a Statistically significant, p < 0.05.
b Statistically significant, p < 0.05, when series are pooled.
61

w .- ° . . . . - . . i • --- -• - -T.--- --. ----- -~ - IW i - =- ., -
The effect of condensate wastewater on the reproductive success ofdaphnids is shown in Table 33. The number of young produced was significantlyreduced at a concentration of 4.16 mg/L after 21 days of exposure in the Aseries and when the series were pooled. This effect could possibly beconsidered transitory because there was no significant reduction at thisconcentration after 28 days of exposure when compared with control value.
Table 33. AVERAGE NUMBER OF YOUNG PRODUCED PER INDIVIDUAL FEMALE DAPHNIDEXPOSED TO CONDENSATE WATER
Young Produced
Mean Measured Series A Series BC3oncentration (mg/L) 14 Days 21 Days 28 Days 14 Days 21 Days 28 Days
0.00 16.4 53.6 86.0 6.6 33.4 50.40.18 17.7 46.1 70.3 16.4 45.7 67.60.41 16.1 46.8 67.4 16.4 49.4 73.40.94 11.3 56.8. 88.3 15.1 54.4 106.62.30 11.8 38.0 61.4 7.7 31.1 60.74.16 11.5 3 4 .8a 56.8 4.8 2 1 .4 b 36.3
a Statistically significant, p < 0.05.
b Statistically significant, p < 0.05, when series are pooled.
Data on the onset of reproduction, number of young produced per dayduring the reproductive period, and average length of surviving daphnids isshown in Table 34. Condensate water had no significant effect on the time tofirst brood over the exposure range tested. At a concentration of 4.16 mg/L,the number of young produced per day per female was reduced significantly whenthe series were pooled. The average length of the surviving daphnids wassignificantly reduced in the A series and the pooled series at a concentrationof 0.41 mg/L and in the pooled series at 2.30 mg/L; because there was nosignificant effect at 0.94 or 4.16 mg/L, this reduction does not appear to beconcentration-related.
62

Table 34. TIME TO FIRST BROOD, NUMBER OF YOUNG PRODUCED PER REPRODUCTIVE DAYAND AVERAGE LENGTH OF SURVIVING FEMALE DAPHNIDS EXPOSED TOCONDENSATE WATER FOR 28 DAYS
Actual Test Time to No. of Young AverageConcentration (mg IL) Series First S pawn (Days) Produced/Day/Female Length (mm)
0.00 A 11.1 5.1 3.8
B 12.1 3.6 3.6
0.18 A 11.1 4.6 3.7
B 11.0 4.8 3.8
0.41 A 12.4 4.6 3.4 a
B 11.0 5.0 3.6 b
0.94 A 11.6 5.6 3.7
B 11.3 6.4 3.8
2.30 A 11.6 4.1 3 .6 b
B 11.6 3.7 3 .5 b
4.16 A 11.8 4.6 3.6
B 12.1 3.9 3.4
a Statistically significant, p > 0.05.
b Statistically significant, p > 0.05, when series are pooled.
The chemical analyses associated with this test are summarizedin Table 35. Again, what appeared to be the test substance showed tipsporadically in control samples. Because this also occurred in blanksamples of diluent water, the problem may have been residual toxicantin the chromatography column or spurious peaks. They were consideredas background and were subtracted from other values in each series asthey occurred. The actual concentrations were up to 40% lower than thenominal concentrations. This was likely due to microbial degradationand photolytic breakdown. Water quality data associated with this testare summarized in Table 36.
63

Table 35. ANALYSES OF CONDENSATE WATER IN A DAPHNIA CHRONIC STUDY
NominalConcentration (mg/L) Meana S.D. n Range
0.00 0.00 -- 6 --
0.30 0.18 0.09 6 0.08-0.17
0.60 0.41 0.15 6 0.23-0.61
1.25 0.94 0.38 6 0.48-1.54
2.50 2.30 0.64 6 1.54-3.26
5.00 4.16 0.97 6 2.98-5.80
aDoes not include values associated with one diluter malfunction.
64

I"
- Is,6.401
- I -
I4I~ ~
ci
8.]
*
2- c~ 4 -, - ' 4, 4,
I o ~ 0 5~ 0010 0 0 4= 5% 4=
14,NNNN
jIMK:::.
4, 4,
I.. @4 @4 @4 0 5%S
I..
0
0 00000
00000
ci 5% s, 5% 5% 5% 5%
5% s, 5, 5% r a~ 0000
I S I S Iqi ~ .0 '0 C N N
4 01- I N -. p. N N N
~ ~ 4, 0 4 N- 4, .6 4 4, 4,
00 0 0 0 0
000SN
1
I *0~ 0 000hII-
c a '0 a '0 '0 '060 j 0 0 0 0 0 0
0 0 0 0 0 04 I N
~-4 06 0000000 P
9 I C 4, - 4, - N- -i -~ N N N N 4,
.4 . ~ 0000004 0
a I os.0.0 .05%161 00*
000
4 ~0 I~ *0 I
45- I
00 40.00~*- - -

Marking, L. L., and V. K. Dawson. 1973. Toxicity of Quinoldine Sulfate to 2Fish. Investigations in Fish Control, No. 48, U.S. Fish and Wildlife Service,Washington, D.C., 8 p.
Miller, R. G. 1965. Simultaneous Statistical Inference. McGraw-Hill, NewYork, 272 p.
Mount, D. I. and W. A. Brungs. 1967. A simplified dosing apparatus for fish
toxicology studies. Water Research i, 21-29.
Pearson, J. G., L. P. Glennon, J. J. Barkley, and J. W. Highfill. 1979. Anapproach to the toxicological evaluation of a complex industrial wastewater.In Aquatic Toxicology, ASTM STP 667. L. L. Marking and R. A. Kimerle (eds.),
American Society of Testing and Materials, Philadelphia, PA, pp. 284-301.
Spanggord, R. J., B. W. Gibson, R. G. Keck, and G. W. Newell. 1978.
Mammalian Toxicological Evaluation of TNT Wastewater (Pink Water). Volume I -
Chemistry Studies. Draft Final Report, USAMRDC Contract No. DAMDI7-76-C-
6050. SRI International, Menlo Park, California.
79
. - -. . ..

LITERATURE CITED
Bailey, H. C., R. J. Spanggord, H. S. Javitz, D.C.L. Jones, and D.H.W. Liu.1984. Toxicity of TNT Wastewaters to Aquatic Organisms. Appendix to VolumeIV. Chronic Toxicity of 2,4-Dinitrotoluene and Condensate Water. DAMD 17-75-C-5056. SRI International, Menlo Park, CA.
Bailey, H. C., R. J. Spanggord, H. S. Javitz, D.C.L. Jones, and D.H.W. Liu.1984. Toxicity of TNT Wastewaters to Aquatic Organisms. Final Report, VolumeIII. Chronic Toxicity of LAP Wastewater and 2,4,6-Trinitrotoluene. DAMD 17-75-C-505(. SRI International, Menlo Park, CA, 75 pp.
Biesinger, K. E. and G. M. Christensen. 1972. Effects of various metals onsurvival, growth, reproduction, and metabolism of Daphnia magna J. Fish.Res. Bd. Canada 29, 1691-1700.
Bishop, Y.M.M., S. E. Fineberg, and P. W. Holland. 1975. DiscreteMultivariate Analysis: Theory and Practice. MIT Press, Cambridge, MA, 557 p.
Dunnett, C. W. 1955. A multiple comparison procedure for comparing severaltreatments with a control. J. Am. Stat. Assoc., Dec 1955, pp. 1096-1121.
EPA. 1980. Guidelines for deriving water quality criteria for the protectionof aquatic life and its uses--Appendix 6. Federal Register, 23 November 1980,29 pp.
EPA. 1972. Recommended bioassay procedure for fathead minnow (Pimephalespromelas) chronic tests. ERL - Duluth. Mimeo. 13 p.
Goulden, C. E., R. M. Comotto, J. A. Hendrickson, Jr., L. L. Hornig, and K. L.Johnson. 1982. Procedures and recommendations for the culture and use ofDaphnia in bioassay studies. In: Aquatic Toxicology and Hazard Assessment:Fifth Conference, ASTM STP 766. J. G. Pearson, R. B. Foster, and W. E. Bishop(eds.), American Society for Testing and Materials, pp. 139-160.
Leitritz, E. and R. C. Lewis. 1980. Trout and salmon culture. CaliforniaFish Bulletin No. 164. California Department of Fish and Game, Sacramento,CA. 197 pp.
Liu, D.H.W., R. J. Spanggord, H. C. Bailey, H. S. Javitz, and D.C.L. Jones.1934. Toxicity of TNT Wastewaters to Aquatic Organisms. Final Report, VolumeI. Acute Toxicity of LAP Wastewater and 2,4,6-Trinitrotoluene. DAMD 17-75-C-
5056. SRI International, Menlo Park, CA, 82 pp.
Liu, D.H.W., R. J. Spanggord, H. C. Bailey, H. S. Javitz, and D.C.L. Jones.1984. Toxicity of TNT Wastewaters to Aquatic Organisms. Final Report, VolumeII. Acute Toxicity of 2,4-Dinitrotoluene and Condensate Water. DAMD 17-75-C-5056. SRI International, Menlo Park, CA, 66 pp.
78

CONCLUSIONS AND RECOMMENDATIONS
Conclusions
"A comparison of the results of the acute and chronic toxicity testswith D. man and fathead minnows indicated that 2,4-DNT exhibitedchronic toxicity to organisms at average concentrations 50 to nearly100 times less than those that caused acute effects. Similarly,condensate water also shoved evidence of cumulative toxicity withchronic effects occurring at concentrations 4 to 8 times lower thanthose that caused acute effects.
" Photolyzed condensate water appeared to be no more toxic to D. magnathan condensate water under chronic exposure conditions. This resultis in agreement with that of acute studies performed on irradiated andnon-irradiated condensate water and indicates that a criterion basedon non-irradiated material should provide sufficient protectionagainst photolyzed solutions.
* Implementation of the criteria for average concentrations of 2,4-DNTand condensate water should be monitored carefully because resultsfrom long-term fish studies suggest that effects occurred belowconcentrations that produced statistically significant differencesfrom control values.
Recommendations
" For 2,4-DNT, 8.1 mg/L should be considered the maximum allowableconcentration and 0.12 mg/L should be considered the maximum allowable24-hour average concentration.
" For condensate water, 2.3 mg/L should be considered the maximumallowable concentration and 0.14 mg/L should be considered the maximumallowable 24-hour average concentration.
" Given the suggestion of chronic effects below levels that producedstatistically significant differences from the controls and the factthat the condensate standard is based on a synthetic condensatewastewater, additional work should be considered to assure theappropriateness of the criteria. Field monitoring at discharge siteswould aid in determining the occurrence of effects on localpopulations of organisms. Given the observed effects on reproductionand fry survival, such monitoring should be on a long-term basis aseffects may not be apparent for several generations. Additionalbioassays that focus on concentrations at, and below, the criteriawould also aid in determining the presence of effects at these levels.
77

*4 00 00C
00
410
c-a ~ j.~ '4(~l 4?- .-
0 -t ~40
z 0.
-4-co Cd to41
41 JJ.1
a. 0 00
1-4 C oo 0
41 60 00 41 4.
06 (A m 0 0tw 4 4 .4 10 0
0i W. .14 014 0410 U .
0 0. u (d0
-. 1
1.. U
w 40 41 4 0 0 o0) 1 0 0d c
41~~9: 4. .14' .0 W
f-4 u4 r.1
0 v-l76

to -
C1 -4
1.4 C4
[-4 >4 c
02 0
Cd 0. ca
oD >
E ,,
.0 o0~
0 1 0
u ' ui 0 c
0 JJ F. ccc
cc 0
&J~ ~ '~r- c cc O75
ILF-
Condensate Water
Final Acute Value. The data (Liu et al., 1984) used to derive the FinalAcute Value for condensate water are summarized in Table 44. Application ofthe EPA procedure gives a value of 4.8 mg/L. This value is higher than theincipient LC50-2.3 mg/L--determined for rainbow trout during a two-week flow-through test (Liu et al., 1984). Consequently, we suggest that 2.3 mg/L beconsidered as the Final Acute Value.
Final Chronic Value. The data used to calculate the Final Chronic Valuefor condensate water are summarized in Table 45. Because the guidelines forcalculating water quality criteria specify that chronic data from a minimum ofthree species must be used to determine the Final Chronic Value, we includedthe early life stage test on rainbow trout in the data base used for these %calculations. While this test had some problems associated with it, asdescribed earlier, the lack of any toxicant-related mortality within a con-centration range of 0.10-1.96 mg/L and a consistent effect on growth withina range of 0.22-1.96 mg/L support the validity of the endpoints obtained fromthis test. Had these responses been random in nature, the validity of theeffect and no-effect concentrations would have been more questionable. Acute/chronic toxicity ratios were calculated using the 96-hour LC50 estimates fromflow-through tests on rainbow trout and fathead minnows and the 48-hour LC50estimate from the flow-through tests on D. mgna divided by the appropriategeometric means from Table 44. The geometric mean of these three values--16.1--was then divided into the final acute value--2.3 mg/L--to obtain a FinalChronic Value of 0.14 mg/L. As with 2,4-DNT, some caution should be used inapplying this value because it is very close to the geometric mean obtainedfrom the trout early life stage test. In addition, there was a suggestion oftoxicant-related effects on F1 fry growth at 0.19 mg/L in the fathead minnowchronic study.
Final Plant Value. Selenastrum capricornutum was the most sensitivealgal species tested (Liu et al., 1984) The lowest concentration of conden-sate water that caused significant effects on growth was 4.8 mg/L, which istherefore the Final Plant Value.
Final Residue Value. A final Residue Value cannot be calculated for con-densate water because insufficient data are available to define the maximumpermissible tissue concentration.
Water Quality Criterion. The maximum allowable concentration of conden-sate water is the Final Acute Value-2.3 mg/L. The allowable 24-hour averageconcentration is the lowest value selected from the Final Chronic Value, theFinal Plant Value, and the Final Residue Value. In this case, the FinalChronic Value--0.14 mg/L-is the lowest value and should be considered asthe allowable 24-hour average concentration. In order for the average con-centration to be met, condensate could only be discharged between one and twohours per day at 2.3 mg/L with no discharge taking place the rest of the day.
74
. . . . . . o

,-%-
04.
'00 0i
1-4 C
@3 -
to @3 $W
a. :0. 41IS.1-4 US.di w 0 @3@3 t Cu ~440 0 (D 41>0 ~ C .14 .4 U co
Au 44 H ~ 4j 41 s-0 31 > 00 U 3 ciC uCL 0 Id Cu co 0.0 0 0
ti0 ( Cu . .4 0 0 IA% -4 -T4u 5. > - &-4 4.1
0 4. 0 0Cu
.0 @ 0 -4@3 @3 @3 .4 44
40 00 0
4.@4 @ . - -
@3 -.4 V. 14C
0 ~ ~ ~ ~ 6 to 4i- 44CS~~~~~d4 A- . . S. 0 C
Cu~~4 ccC 0 0U C00 00 00 C~ co
E4 co 3t- 00.4 U j 0 CutoC
In 4-W ruC ~.4 -. 4C 0 4.A u 0
41 3 C -1@@3 u~ .0 C @3 ul 0
Cu Cu . .0i ;
73

100
A1.4 f) L
C144
en r1.4 *d
z
w0 11
w A
o c
C.,
Go 0%0
0 04-H $
0 0caC:44
41 N Co
toj -H V) en cN m
"4 C C N c ;
4)z C1 44
IA ~ ~ - -~ t72

L
Calculation of Water-Quality Criteria
The primary purpose of developing an aquatic toxicity data base on 2,4-
DNT and condensate water is to establish water-quality criteria for thesematerials. The following procedure is taken from EPA (1980). The criteria
consists of two components. The first is the maximum allowable concentration,which is the Final Acute Value, as calculated from the results of 48- and 96-
hour acute studies. The second criterion is the maximum 24-hour average con-centration, which is the lowest of the following values: the Final ChronicValue, the Final Plant Value, and the Final Residue Value.
2 ,4-DNT
Final Acute Value--2,4-DNT. The data base (Liu et al., 1984) used toderive the Final Acute Value for 2,4-DNT is shown in Table 42. Applicationof the EPA procedure gives a Final Acute Value of 8.1 mg/L. This value isslightly lower than the lowest incipient lethal concentration (9.2 mg/L--bluegill) determined during 2-week flow-through tests on 2,4-DNT (Liu etal., 1984) and therefore appears to be a reasonable estimate of the maxirumallowable concentration.
Final Chronic Value--2,4-DNT. The data used to calculate the FinalChronic Value for 2,4-DNT are summarized in Table 43. Acute/chronic toxicityratios were calculated using the 96-hour LC50 estimates from flow-throughtests on fathead minnows and rainbow trout and the 48-hour LC50 estimate fromthe flow-through tests on D. maga divided by the appropriate geometric meansfrom Table 42. The geometric mean of these three values was then calcu-lated. This average acute/chronic ratio--70--was then divided into the FinalAcute Value-8.1 mg/L--to obtain a Final Chronic Value of 0.12 mg/L. Thisvalue should be adequate to protect aquatic organisms from appreciable effectsof chronic exposure to 2,4-DNT. However, some caution is urged in its appli-cation because effects of 2,4-DNT on growth, although relatively small (< 5%),were seen in the early life stage test on rainbow trout at the lowest concen-tration tested, 0.05 mg/L, and data on egg production in the fathead minnowchronic study suggest an effect at the lowest concentration, 0.28 mg/L.
Final Plant Value. The final plant value for 2,4-DNT is the lowestconcentration that significantly affected growth. Data from the 14-day algalassays presented in Volume II (Liu et al., 1984) indicate that Microcystisaeruginosa was the most sensitive algal species, with effects occurring atconcentrations as low as 0.5 mg/L.
Final Residue Value. A Final Residue Value cannot be calculated for 2,4-DNT because insufficient data are available to define the maximum permissibletissue concentration.
Water Quality Criteria. The maximum allowable concentration of 2,4-DNTis the Final Acute Value--8.1 mg/L. The 24-hour average concentration is thelowest value selected from the Final Chronic Value, the Final Plant Value, andthe Final Residue Value. In this case, the Final Chronic Value--O.12 mg/L--is the lowest value and is therefore the allowable 24-hour average concentra-tion. This is actually a fairly rigorous standard as 2,4-DNT could only bedischarged at the 8.1 mg/L level for 21 minutes per day followed by zerodischarge, in order to meet the 24-hour average criteria.
71 "
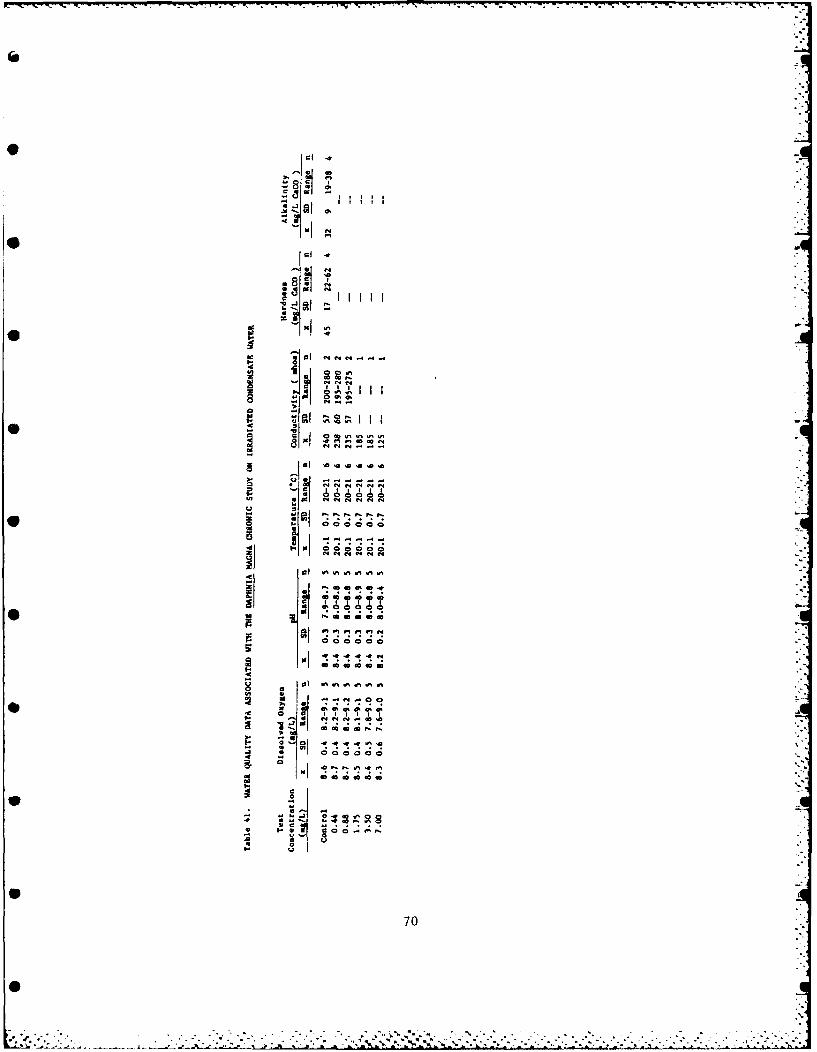
oil-
0.
-C410a - ---
a 'D
IM'. 0 -A
ccd I* gol
0~70
8 i ~III
* - ii0
I.# 0U ! 00 .' '2 .v"! 2212--
01 0 0.. ..
= f
I-?U7
- N N N N
2~MJ" ~ ~ ~ ~ ~ ~ ~ ~ ~ ~ ~ ~ U~ 000000 ' " '. " . ",. , " " .' " . . . ." ' '

Table 40. CHEMICAL ANALYSES OF IRRADIATED CONDENSATE WATER IN ADAPHNIA CHRONIC STUDY
Nominal Actual Concentration (mg/L)
Concentration (mg/L) Mean S.D. n Range
0.00 0.00 0.04 6 --
0.44 0.03 0.02 5 0.01-0.06
0.88 0.07 0.05 6 0.02-0.14
1.75 0.17 0.08 6 0.08-0.30
3.50 0.44 0.14 6 0.30-0.68
7.00 0.90 0.24 6 0.58-1.18
Based on the results of the daphnid chronic studies, it appears that thetoxicity of irradiated condensate water is similar to condensate water on anequivalent (before photolysis) basis of condensate water. This suggests thatallowable discharge concentrations for condensate water will provide suffi-cient protection from the effects of photolyzed condensate water. This con-clusion appears to be justified on the basis of results obtained from themortality, reproduction, and growth parameters. Specifically, the effect/noeffect concentrations for mortality were 2.09-3.68 and 3.5-7.0 mg/L for con-densate water and Cond-Irrad, respectively. Length was not affected in thehighest concentrations tested (3.68 and 7.00 mg/L) for either of the twomixtures. Finally, the effect/no-effect concentrations for condensate water,based on reproduction, were 2.09-3.68 mg/L compared to the effect/no effectconcentrations for Cond-Irrad which, while not as definitive, probably werebetween 3.50 and 7.00 mg/L.
6966
i6 •
6"

Table 39. TIME TO FIRST BROOD, NUMBER OF YOUNG PRODUCED PER REPRODUCTIVEDAY AND AVERAGE LENGTH OF SURVIVING FEMALE DAPHNIDS EXPOSED TO
* IRRADIATED CONDENSATE WATER FOR 28 DAYS
Concentration Test Time to No. of Young Average(mg/L) Series First Brood (days) Produced/Day/Female Length (mm)
0.00 A 10.6 6.8 3.6B 14.0 12.2 4.2
0.44 A 10.0 6.6 3.9B 13.0 9.2 4.3
0.88 A 10.3 4 8b 3.5B14.6 7 :9 b 4.0
1.75 A 11.6 5.1 3.5B 12.0 10.8 4.2
3.50 A 10.6 4 2b 3.7B 11.8 10 :2 b 4.2
7.00 A 10.0 6 .4b 3.6B 12.5 6 .9a 4.3
a Statistically significant, p < 0.05.
bStatistically significant, p < 0.05, when series are pooled.
4P The chemical analyses associated with this test are summarized in Table40. The actual concentrations are low because the condensate vater wasirradiated. The ratio of each concentration to the next higher one (- 1:2)shows the diluter was performing well. What appeared to be toxicant showed upin the controls but also showed up in blank diluent water samples, indicating
* that the problem may have been contamination of the chromatography column orspurious peaks. Again, these values were considered as background and weresubtracted from other values in the same series of concentrations.
Water quality data associated with this test are summarized in Table 41.
68

Table 38. AVERAGE NUMBER OF YOUNG PRODUCED PER INDIVIDUAL FEMALE DAPHNIOEXPOSED TO IRRADIATED CONDENSATE WATER
Nominal Young ProducedConcentration Series A Series B
(mg/L) 14 Days 21 Days 28 Days 14 Days 21 Days 28 Days
0.00 28.7 53.0 111.3 7.4 63.3 171.3
0.44 40.4 78.1 120.0 6.3 48.6 137.7
0.88 25.6 4 1 .0 b 6 1 .0 b 5.0 2 3 .0 a a
1.75 26.3 47.4 83.1 8.8 88.0 172.4
3.50 13.3 35.8 72.3 13.1 62.3 163.6 -
7.00 38.1 75.0 93.1 b 7.0 44.7 9 5 .7a
a Statistically significant, p > 0.05.
b Statistically significant, p > 0.05, when series are pooled.
The effects of Cond-Irrad on the onset of reproduction, number ofyoung produced per day during the reproductive period, and average lengthof surviving daphnids are shown in Table 39. Length of surviving daphnidsand time to first brood were not significantly different from controlvalues over the range of concentrations tested (0.44 to 7.00 mg/L). Thenumber of young produced per reproductive day per isolated female wassignificantly reduced at concentrations of 0.88 and 3.50 mg/L when theseries are pooled and at 7.00 mg/L in the B series and in the pooledseries. This response, especially at 0.88 mg/L, does not appear to beconcentration-related because there was no significant effect at 1.75mg/L. In addition, the significant pooled effect appears largely due torelatively low values in Series A (compared to the control) atconcentrations of 0.88-3.50 mg/L. Since the young/day value at 7.00 mg/Lnearly approaches the control value in Series A, it would appear that thelower values seen in 0.88-3.50 mg/L were not toxicant-related.
67
67
.* ..
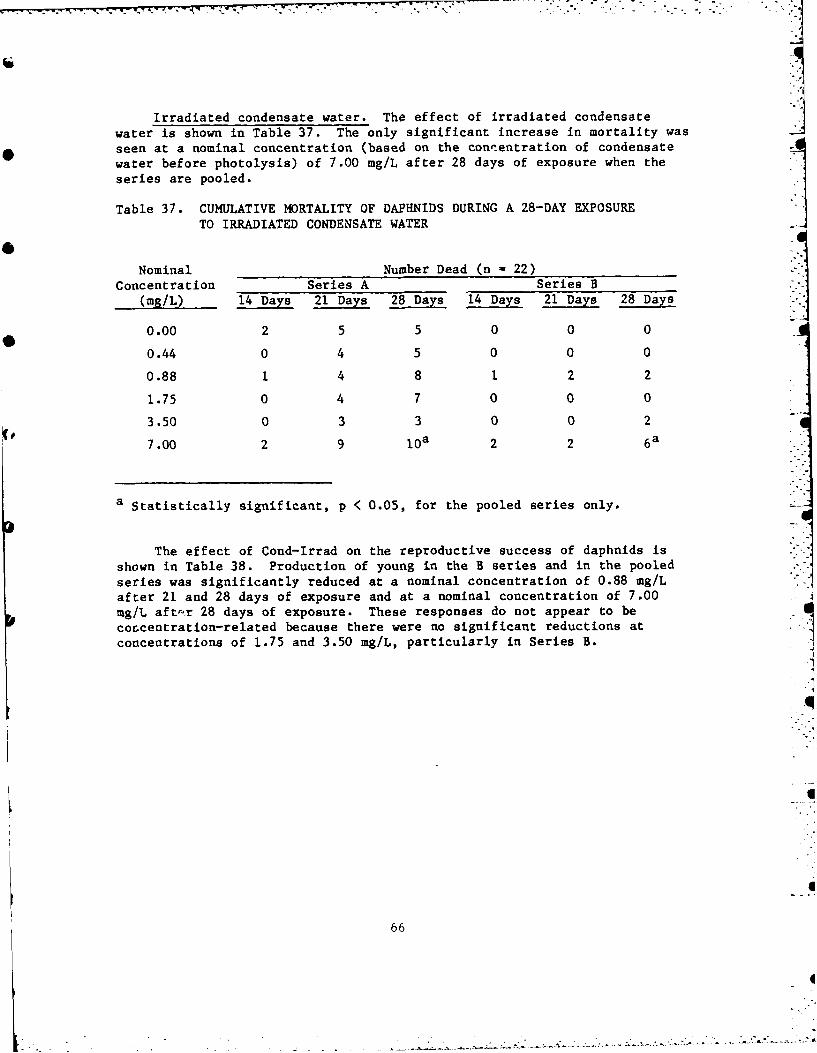
Irradiated condensate water. The effect of irradiated condensatewater is shown in Table 37. The only significant increase in mortality wasseen at a nominal concentration (based on the conieentration of condensatewater before photolysis) of 7.00 mg/L after 28 days of exposure when theseries are pooled.
Table 37. CUMULATIVE MORTALITY OF DAPHNIDS DURING A 28-DAY EXPOSURETO IRRADIATED CONDENSATE WATER
Nominal Number Dead (n - 22)Concentration Series A Series B
(mg/L) 14 Days 21 Days 28 Days 14 Days 21 Days 28 Days
0.00 2 5 5 0 0 0
0.44 0 4 5 0 0 0
0.88 1 4 8 1 2 2
1.75 0 4 7 0 0 0
3.50 0 3 3 0 0 2
7.00 2 9 i0a 2 2 6
a Statistically significant, p < 0.05, for the pooled series only. --
The effect of Cond-Irrad on the reproductive success of daphnids is
shown in Table 38. Production of young in the B series and in the pooledseries was significantly reduced at a nominal concentration of 0.88 mg/Lafter 21 and 28 days of exposure and at a nominal concentration of 7.00mg/L after 28 days of exposure. These responses do not appear to beconcentration-related because there were no significant reductions atconcentrations of 1.75 and 3.50 mg/L, particularly in Series B.
q
o
66
S " " " •.. .. .. .. .. .. .. ..-... ......... -. " .- . -.... , 'L... 7..i, ......"i

DISTRIBUTION LIST
25 copies CommanderATTN : SGRD-UBG
US Army Medical Bioengineering Researchand Development Laboratory
Fort Detrick, Frederick, MD 21701-5010
4 copies CommanderUS Army Medical Research and Development Command
ATTN: SGRD-RMS
Fort Detrick, Frederick, MD 21701-5012
12 copies Defense Technical Information Center (DTIC)
Attn: DTIC-DDACCameron StationAlexandria, VA 22304-6145
1 copy Dean
School of MedicineUniformed Services University of the
Health Sciences4301 Jones Bridge RoadBethesda, MD 20814-4799
1 copy CommandantAcademy of Health Sciences, US Army
ATTN: AHS-CDM
Fort Sam Houston, TX 78234-6100
1 copy CommanderUS Army Medical Bioengineering Research
and Development LaboratoryATTN: SGRD-UBD-A/LibrarianFort Detrick, Frederick, MD 21701-5010
80
80

9O .
A I
FILMED
-" 6-85
DTIC0
- ---