Embed Size (px)
Citation preview
Revie
w C
opy
1
Multi-level assessment of chronic toxicity of estuarine sediments with the amphipod
Gammarus locusta: I. Biochemical endpoints
Teresa Neuparth*, Ana D. Correia, Filipe O. Costa, Gláucia Lima, Maria Helena Costa
IMAR–Centro de Modelação Ecológica, DCEA, F.C.T., Univ. Nova de Lisboa,
2829-516 Caparica, PORTUGAL
*Corresponding author. Tel: +351-212948300 ext. 10113; fax: +351-212948554.
E-mail address: [email protected] (T. Neuparth).
1 of 32
Monday , March 15, 2004
Elsevier
Revie
w C
opy
2
Abstract
We report on biomarker responses conducted as part of a multi-level assessment of the
chronic toxicity of estuarine sediments to the amphipod Gammarus locusta. A companion
article accounts for organism and population-level effects. Five moderately contaminated
sediments from two Portuguese estuaries, Sado and Tagus, were assessed. Three of them were
muddy and two were sandy sediments. The objective was to assess sediments that were not
acutely toxic. Three of the sediments met this criterion, the other two were diluted (50% and
75%) with clean sediment until acute toxicity was absent. Following 28-d exposures, the
amphipods were analyzed for whole-body metal bioaccumulation, metallothionein induction
(MT), DNA strand breakage (SB) and lipid peroxidation (LP). Two of the muddy sediments
did not cause chronic toxicity. These findings were consistent with responses at organism and
population levels that showed higher growth rates and improvement of reproductive traits for
amphipods exposed to these two sediments. Two other sediments, one muddy and one sandy,
exhibited pronounced chronic toxicity, affecting SB, MT induction (in muddy sediment),
survival and reproduction. Potential toxicants involved in these effects were identified. The
last sandy sediment exhibited some loss of DNA integrity, however growth was also
enhanced. Present results, together with the organism/population-level data, and also benthic
communities information, were analysed under a weight-of-evidence approach. By providing
evidence of exposure (or lack of it) to contaminants in sediments, the biomarkers here applied
assisted in distinguishing toxicants’ impacts in test organisms from the confounding influence
of other geochemical features of the sediments.
2 of 32
Monday , March 15, 2004
Elsevier
Revie
w C
opy
3
Keywords: Biomarker, Chronic toxicity, Estuarine sediments, Weight-of-evidence, Amphipod,
Metallothionein, DNA damage, Lipid peroxidation, Sado, Tagus
1. Introduction
The recognition of the complexity of sediment biogeochemistry and of technical
difficulties in the evaluation of the ecological impact of sediment contamination, has led to
increasing support for the application of multiple lines of evidence (LOE) in sediment quality
assessments, integrated in a weight-of-evidence (WOE) approach (Chapman, McDonald, &
Lawrence, 2002; Wenning & Ingersoll, 2002). Sediment toxicity tests are recognized as an
essential tool of the WOE approach, although with their inherent strengths and weaknesses.
Among the limitations are the recurrent difficulties in discriminating the contaminant-induced
impacts in test organisms from those responses attributable to other non-contaminant factors
(Wenning & Ingersoll, 2002). In particular, sediment’s geochemical properties are known not
only to regulate contaminants’ bioavailability, but also to be able to directly influence
responses of test organisms in various ways (Gunnarsson, Granberg, Nilsson, Rosenberg, &
Hellman, 1999; USEPA-USACE, 2001; Wenning & Ingersoll, 2002). Most of the response
criteria used in chronic toxicity tests (such as those based on growth and reproduction
endpoints) lack specificity, and consequently can be affected both by contaminants and other
sediment features (e.g. grain size, amount and quality of organic matter). In this context,
additional LOE within the toxicity test are required to determine exposure of test organisms to
sediment’s contaminants.
Molecular biomarkers provide evidence of exposure to toxicants, and their detection in
natural populations provide information about the contaminants bioavailability (Shugart, 2000;
Hyne & Maher, 2003). A number of biomarkers have been developed and applied sucessfully
3 of 32
Monday , March 15, 2004
Elsevier
Revie
w C
opy
4
to various invertebrate species (Langston & Bebianno, 1998; Livingstone, 2001; Hyne &
Maher, 2003), but they have been rarely integrated in conventional sediment toxicity tests
and/or linked to population-level effects. However, the application of biomarkers in chronic
sediment tests can be advantageous for providing evidence of the cause-effect relationship
between exposure to sediments’ contaminants and ultimate organism and population
responses.
Technical difficulties can be one of the reasons for the scarcity of biomarkers in
conventional sediment toxicity tests: test organisms must have a short life-cycle in order to
assess growth and reproductive effects in a short period and, simultaneously, they must provide
large enough biomass for biomarker analysis. In order to fulfil these requirements we selected
the amphipod Gammarus locusta (L.), a widely distributed species in coastal Atlantic Europe,
which groups a number of advantages for application in ecotoxicological studies (Costa &
Costa, 2000). Recently, specific methodologies were developed for application of known
biomarkers in ecotoxicological studies with this amphipod, namely metallothionein (MT)
induction, lipid peroxidation (LP) (Correia, Lima, Costa, & Livingstone, 2002) and DNA
strand breakage (SB) (Costa, Neuparth, Costa, Theodorakis, & Shugart, 2002).
Given the critical role that the DNA molecule plays in the life and reproduction of each
organism, a number of studies focused on biomarkers of DNA damage to detect genotoxicity in
aquatic organisms (Shugart, 1999, 2000). Compared to other techniques used to assess DNA
damage, detection of DNA strand breakage by agarose gel electrophoresis has the advantage of
determining insult to DNA integrity both qualitatively (single strand-breaks versus double
strand-breaks) and quantitatively (number of strand breaks). In addition it can also be applied
to DNA extracted from whole organisms, thus not requiring manipulation of the amphipods to
collect specific tissues (Costa et al., 2002). Malondialdehyde (MDA), a breakdown product of
lipid endoperoxides, is an expression of lipid peroxidation and has been used with success in
4 of 32
Monday , March 15, 2004
Elsevier
Revie
w C
opy
5
aquatic invertebrates as a general indicator of toxicant stress derived from various types of
contamination (Livingstone, 2001). Metallothioneins (MT) are an widely used biomarker of
exposure to metallic contaminants (e.g. Cd, Cu, Zn and Hg) which has been applied in
numerous aquatic invertebrates, particularly mollusks (Langston & Bebianno, 1998;
Livingstone, 2001) and more recently in crustaceans (Moksnes, Lindahl, & Haux, 1995; Barka,
Pavillon, & Amiard, 2001; Correia et al., 2002).
Our recent research efforts have been directed to the integration of these biomarkers in
sediment toxicity tests, by assessing multiple biological effects at several levels of biological
organization - from molecular to organism and population levels. This type of approach has
been previously tested in laboratory chronic toxicity tests with copper-spiked sediments
(Correia, Costa, Neuparth, Diniz, & Costa, 2001; Correia, 2002) and we are now aiming to
investigate its usefulness in chronic tests with field-contaminated sediments. Therefore, the
goal of the current study was to conduct sediment tests with the amphipod G. locusta,
integrating biomarker alterations (namely MT, SB and LP) with effects on growth,
reproductive performance and recruitment. Here we report biomarker responses, while
organism and population-level endpoints were analysed in a parallel paper (Costa et al.,
submitted this issue). These results were integrated with sediment chemistry and benthic
community data in a WOE framework, and discussed in view of the potential of biomarker
responses to link sediment’s contamination with higher-level endpoints (organism/ population-
level).
5 of 32
Monday , March 15, 2004
Elsevier
Revie
w C
opy
6
2. Material and Methods
2.1. Sediment collection and processing
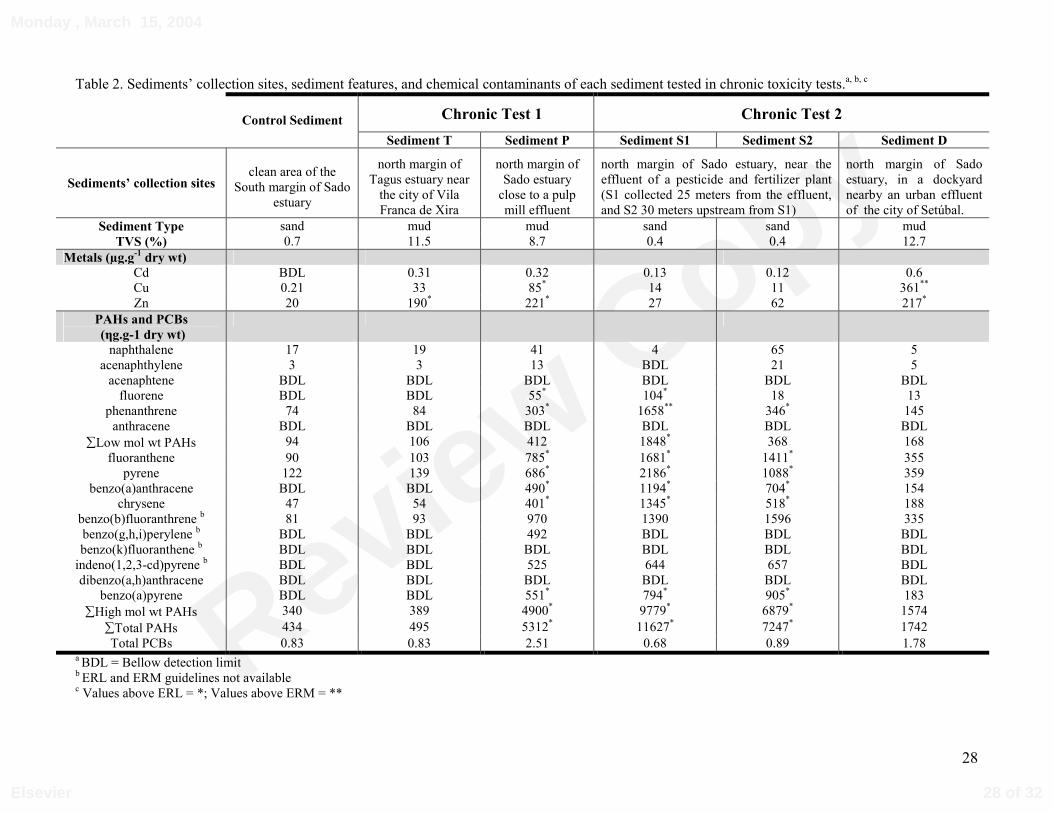
Control and test sediments were collected from Sado and Tagus estuaries. Figure 1
indicates the locations of the sediments to be analysed and Table 2 summarizes the relevant
features of the collection sites. Only one sediment was collected in Tagus estuary, all others
were collected in the lower Sado estuary. Test sediments from Sado estuary were collected in
several points along the north margin, all located in the euhaline section of estuary. Control
sediment was collected in the opposite south margin. The salinity at the collection sites is very
close for all sediments and average 32‰, with the exception of sediment P that is about 27‰
(Mucha, 1997). At each site, intertidal surface sediments were sampled using a scoop. In the
laboratory, sediments were sieved though a 1500 µm screen to remove macrofauna, and stored
at 4ºC for a maximum of 72 h before the initiation of the chronic sediment bioassays. Before
the beginning of the assays all test sediments were homogenized for 15 min. with the
assistance of a mechanic mixer, after which samples of each sediment were collected for
geochemical analysis.
2.2. Sediment geochemical analysis
Sediments were analysed for organic matter content (expressed as percentage of total
volatile solids - TVS), bulk concentration of heavy metals (Cd, Cu, and Zn), polynuclear
aromatic hydrocarbons (PAHs) and polychlorinated biphenyls (PCBs). The TVS were
determined as the percentage weight loss after ignition of dry sediment at 550 °C for 4 hours
(Correia & Costa, 2000).
Heavy metal analyses were performed on aliquots of the solid fraction that were freeze-
dried, homogenized by grinding, and digested with a mixture of acids according to the method
6 of 32
Monday , March 15, 2004
Elsevier
Revie
w C
opy
7
described by Rantala and Loring (1977). The digested material was then analysed by air-
acetylene flame to determine the concentrations Zn and a pyrolytic graphite furnace equipped
with a L’vov platform to establish the concentration of Cu and Cd. The total PAHs were
quantified using 16 individual congeners (acenaphthylene, acenaphtene, fluorine,
phenanthrene, anthracene, fluoranthene, pyrene, benzo(a)anthracene, chrysene,
benzo(b)fluoranthrene, benzo(g,h,i)perylene, benzo(k)fluoranthene indeno(1,2,3-cd)pyrene,
dibenzo(a,h)anthracene and benzo(a)pyrene). PAHs were extracted from frozen sediment
samples using soxhlet extraction, after lyophilization and sift. The sediment extracts were
further clean up and fractionated by silica column chromatography, concentrated and
quantified by capillary gas chromatography / mass spectrometry / electron capture detection
(GC-MS/GC-ECD). PCBs were extracted from frozen sediment samples by first lyophilizing
to remove water. Subsequently, the samples were Soxhlet extracted for 16h in hexane. The
sediment extracts were cleaned up using Florisil and HCl. Separation of PCBs compounds
from non-polar interferences was accomplished using a gas chromatograph equipped with a
fused silica capillary column. The injections of each sample aliquots were made with an
autosampler. Chlorobiphenyl congeners (CBs) were identified and quantified on the basis of a
synthetic mixture of 19 individual congeners (CB 18, 26, 31, 44, 49, 52, 101, 105, 118, 128,
138, 149, 151, 153, 170, 180, 183, 187, 194).
Concentrations of contaminants in the sediments were compared with the following
sediment quality guidelines: a) Effects Range Low (ERL), that is indicative of contaminant
concentration below which adverse effects are rarely observed and b) Effects Range Median
(ERM), that points out the concentration above which biological effects frequently occurs
(Long, MacDonald, Smith, & Calder, 1995).
7 of 32
Monday , March 15, 2004
Elsevier

Revie
w C
opy
8
2.3. Amphipods
The amphipods used in the chronic sediment bioassays were juveniles belonging to the
2-4 mm length class (retained between 1000 and 475µm sieves), obtained from a laboratory
culturing system maintained as described in Costa (1997). Twenty-four hours before the
beginning of the experiments, a stock of juveniles was isolated from the main culture and kept
at the assay temperature (20 ºC) with unlimited food (macroalgae Ulva sp.).
2.4. Chronic sediment tests
Two independent chronic toxicity tests were performed in this study, which will be
hereafter referred to as chronic bioassay 1 and chronic bioassay 2. Sediments P and T were
assayed in chronic test 1, and sediments S1, S2 and D were assayed in chronic test 2.
Previous studies on the acute toxicity of sediments P and T (Costa, Correia, & Costa,
1998; Neuparth, 1999) did not reveal acute toxicity. Therefore, only sediments D, S1 and S2
were subjected to screening tests of acute toxicity as described in Costa et al. (1998).
Sediments showing acute toxicity were diluted with control sediment as much as required until
acute toxicity was absent. Sediment D was not acutely toxic and thus did not need dilution.
Sediments S1 and S2 were assayed in the chronic test at concentrations of 25 % and 50%
(v/v), respectively.
The assays were conducted at 20°C with 0.45 µm-filtered seawater at 33±1 ‰ salinity,
under a 12-h photoperiod. In both chronic tests five replicates per treatment were employed.
The sediments were placed in the respective aquaria (10-L) the day before the start of the
assay. The sediment layer had about 1 cm. Seawater was added gently, to minimize sediment
resuspention, and aeration was provided with plastic tips placed at least 1 cm above the
sediment surface. Before addition of the amphipods, the sediment-overlying water system was
allowed to equilibrate overnight.
8 of 32
Monday , March 15, 2004
Elsevier
Revie
w C
opy
9
The assays started the following day with the allocation of exactly 70 juveniles to each
test chamber. The water was renewed every 10 days (80% of the volume). The organisms
were fed with macroalgae Ulva sp. on a ad libitum basis, assuring that food was never in
shortage. With the exception of the food supply, that was fresh or frozen Ulva sp. in chronic
test 1 and 2 respectively, the procedure was the same in both tests. Test chambers were
inspected daily for aeration and feeding requirements and to remove dead animals.
At the end of the 28-d exposure period, the contents of each chamber were gently sieved
through 1000 and 250 µm mesh sieves to collect surviving adults and their offspring,
respectively. Four to five pools of 4 to 6 males from each test sediment (pool wet wt. ~ 0.05 g)
were frozen and stored at –80 °C for later quantification of whole body metal
bioaccumulation, MT and LP. Fifteen adults (males and non-gravid females) of each tested
sediment were sampled for immediate DNA extraction and subsequent analysis of SB.
2.5. Biological responses
2.5.1. Quantification of whole-body heavy metals and MT levels. Pools of whole animals (pool
wet wt. about 0.05 g) were homogenized at 4 ºC in 4 ml of 0.02 M Tris-HCl buffer (pH 8.6)
and sub-samples taken for determination of heavy metals and MT. Whole-body metal analyses
were carried out on dried, HNO3-digested sub-samples using flame atomic absorption
spectrophotometry. Analysis of dogfish muscle (DORM-1) and liver reference (DOLT-1)
material (National Research Council of Canada, Canada) was carried out, using the same
treatment, in order to validate the metal analyses. The values measured for Cu, Zn and Cd,
were within the certified range and the concentrations were expressed as µg.g-1 dry wt. of
whole body homogenate. MT determination was performed by differential pulse polarography
9 of 32
Monday , March 15, 2004
Elsevier
Revie
w C
opy
10
(DPP), essentially as described in Bebianno and Langston (1989). An aliquot of the sub-
sample homogenate (2 ml) was centrifuged at 30 000 x g for 1 hour at 4 ºC. The cytosol was
heat-treated at 80 ºC for 10 minutes to precipitate the high molecular weight proteins, and
subsequently centrifuged at 30 000 x g for 1 hour at 4 ºC. Aliquots (150 - 250 µl) of the heat-
treated cytosol were taken for quantification of heat-stable MT using DPP with a static
mercury drop electrode. A Metrohm 693 VA Processor and the 694 VA Stand was used for
that purpose. The Brdicka supporting electrolyte containing 1 M NH4Cl, 1M NH4 OH and 2
mM [Co(NH3)6]Cl3 was prepared weekly and stored at 4 ºC (Palecek & Pechan, 1971). In the
absence of a purified amphipod MT, quantification was by reference to standard additions of
rabbit liver MT-1 (Sigma, Portugal). The values obtained were expressed as mg rabbit-MT
equivalents g-1 dry wt. of whole body homogenate.
2.5.2. Lipid peroxidation. Malondialdehyde (MDA) was determined by the thiobarbituric acid
method of Ohkawa et al. (1979) with minor modifications. Pools of whole animal (0.05 - 0.08
g wet wt) were homogenized at 4 ºC in 1:4 wet wt./buffer volume ratio in 50 mM
NaH2PO2/Na2HPO4 pH 7.4 containing 15 % glycerol (w/v), and centrifuged at 9000 x g for 15
minutes at 4 ºC. Sub-samples (62.5 µl) of tissue homogenate were treated with 25 µl of 8.1 %
dodecyl sulphate sodium, 187 µl of 20 % tricloroacetic acid (pH 3.5) and 187 µl of
thiobarbituric acid. The mixture was made up to 0.5 ml with distilled water and then heated for
60 minutes in boiling water. After cooling, 125 µl of distilled water and 625 µl of a mixture of
n-butanol and pyridine (15:1, v/v) were added. The mixture was shaken vigorously before
centrifugation at 4000xg for 10 minutes. The organic layer was then recovered and its
absorbance measured at 532 nm. MDA concentrations were derived from a standard curve and
the values expressed in terms of MDA ηmol equivalents per g wet wt. tissue.
10 of 32
Monday , March 15, 2004
Elsevier
Revie
w C
opy
11
2.5.3. DNA Strand breakage analysis. DNA was isolated individually from whole amphipods,
immediately after the 28-day exposure. An outline of the DNA extraction procedure and DNA
strand breakage analysis is presented below, while detailed descriptions are provided in Costa
et al. (2002). Briefly, the DNA isolation involved extractions with PCI
(phenol:chloroform:isoamyl alcohol, 25:24:1, v/v/v) and subsequently chloroform, before and
after digestions with ribonuclease A and proteinase K. Strand breakage analysis comprised
electrophoresis of the DNA extracts under alkaline (pH 12) and neutral (pH 8) conditions, thus
allowing for determination of total (single and double) and double-stranded breaks in the
DNA, respectively. Migration of the DNA within the gel matrix is size dependent, and
detection is easily accomplished after staining with ethidium bromide.
Photographs of ethidium-bromide stained gels were analysed with the software QWin Lite
V2.3 (Leica Microsystems) in order to obtain densitometric profiles of the migration of each
DNA sample. Finally the average molecular length (Ln) was computed from these data. The
average molecular length is inversely proportional to the number of DNA strand breaks
according to the formula:
Number of strand breaks per 105 nucleotides = 1/Ln x 100 [1]
In order to normalize results among gels, it was required to determine the relative number
of total (RNTSB) and double strand breaks (RNDSB). This was accomplished by calculating
the difference in the number of strand breaks between every treatment sample and the
respective control sediment mean within each gel:
samples from total-strand break gel: RNTSB = 1/Ln (sij) - 1/Ln (Cmj) [2]
samples from double-strand break gel: RNDSB = 1/Ln (sij) - 1/Ln (Cmj), [3]
where sij is the sample i from gel j and Cm is the respective control mean from gel j
11 of 32
Monday , March 15, 2004
Elsevier

Revie
w C
opy
12
Accordingly the relative number of single strand breaks (RNSSB) was determined as follows:
RNSSB per 105 nucleotides = RNTSBi – (2 x RNDSBi), [4]
where i is the sample number.
2.6. Statistical analyses
A one–way analysis of variance (ANOVA) was carried out for each studied variable
(tissue level of heavy metals, MT, LP and SB variables - Ln TSB, Ln DSB, RNTSB, RNDSB
and RNSSB) to determine if differences in responses between exposed and control amphipods
could be attributed to exposure to contaminated sediments. Significant differences were
established at P<0.1. The Fisher’s Least Significant Difference test (LSD) was used for
multiple comparisons between pairs of means.
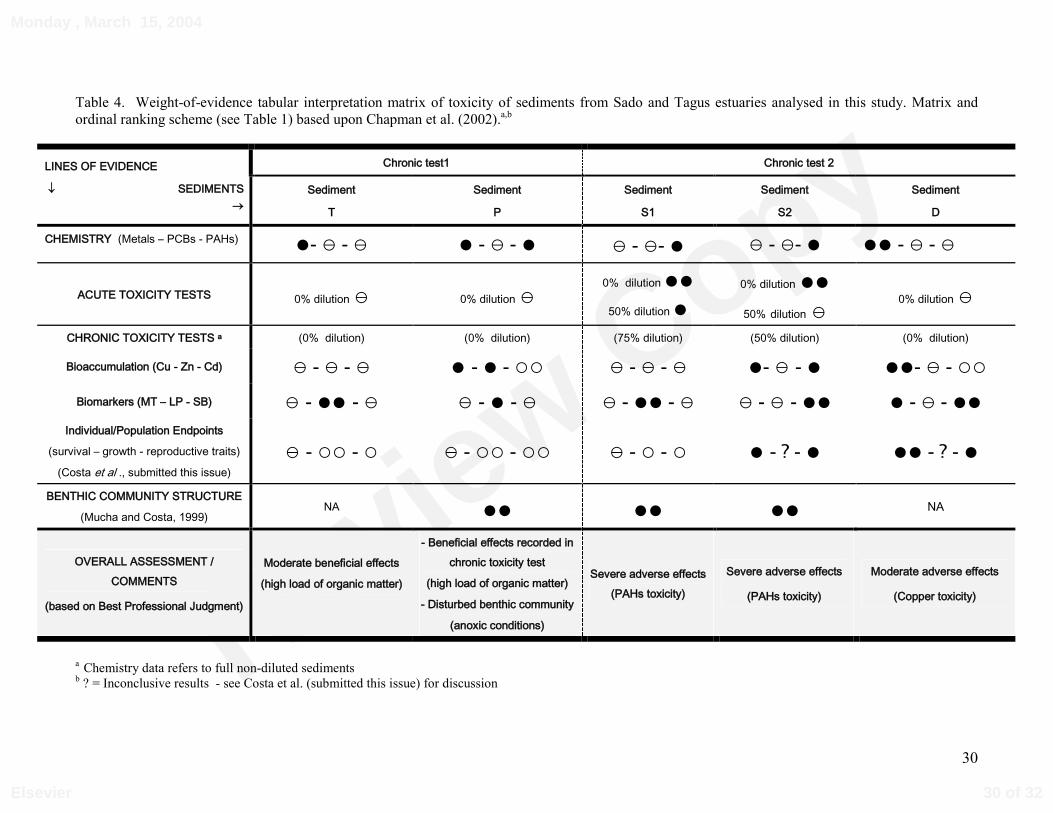
2.7. Weight-of-evidence (WOE) approach
Based in Chapman et al. (2002) procedure, a WOE framework was applied to our data in
order to assemble and interpret the information derived from the multiple lines of evidence
(LOE) produced in this investigation. This approach entailed the setting up of an ordinal
ranking system to categorize our LOE, followed by construction of the WOE interpretation
matrix.
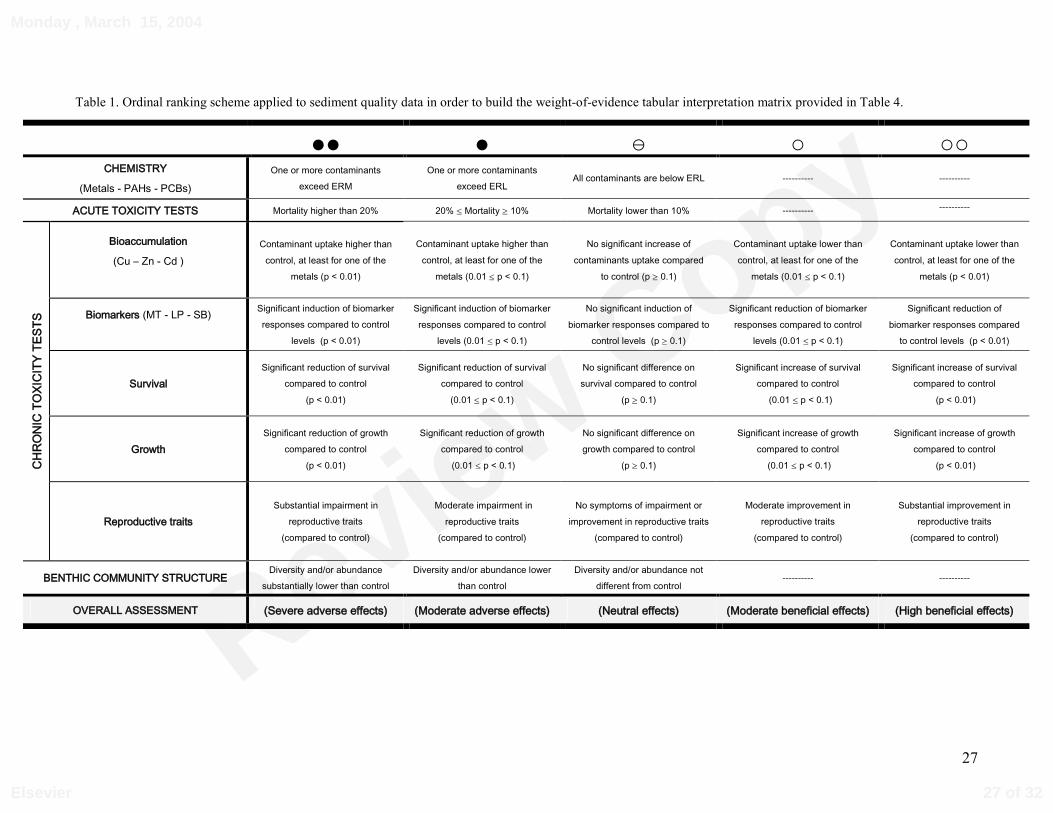
Table 1 summarizes the ordinal ranking system adopted. The various LOE considered
comprise concentrations of sediment’s contaminants, acute toxicity data, chronic toxicity, and
information on benthic community structure obtained from other study (Mucha & Costa,
1999). The LOE for chronic toxicity comprised bioaccumulation of metallic contaminants and
biomarker responses (MT, LP and SB) here reported, and organism/population responses
reported in Costa et al (submitted this issue). Three categories of responses compared to
12 of 32
Monday , March 15, 2004
Elsevier
Revie
w C
opy
13
control treatment were considered: negative, neutral and positive. Within negative and positive
categories two levels of intensity were considered: moderate and high.
The various LOE differ in the type and relevance of information provided for
ecotoxicological assessment of the tested sediments. Therefore, the global evaluation of the
quality of each tested sediment required a best professional judgment (BPJ) approach
(Chapman et al., 2002). This approach enabled a qualitative analysis of the WOE matrix,
attending to the particular information (and its relevance) that can be obtained from each LOE.
3. Results
3.1. Sediment geochemistry
Results of geochemical analyses of sediments are presented on Table 2. All contaminants
were below ERM, except copper in sediment D and phenanthrene in sediment S1. As a
general trend, heavy metal concentrations were higher in sediments D, P and T. Copper
concentration exceeded ERM or ERL in sediment D and P respectively, and zinc levels
exceeded ERL either in D, P or T sediments. PAHs concentrations were as a rule high in
sediments S1, S2 and P. Most of individual PAHs, high or low molecular weight PAHs, and
total PAHs were higher than ERL in these three sediments. PCBs concentrations were low in
all tested sediments and in none exceeded ERL.
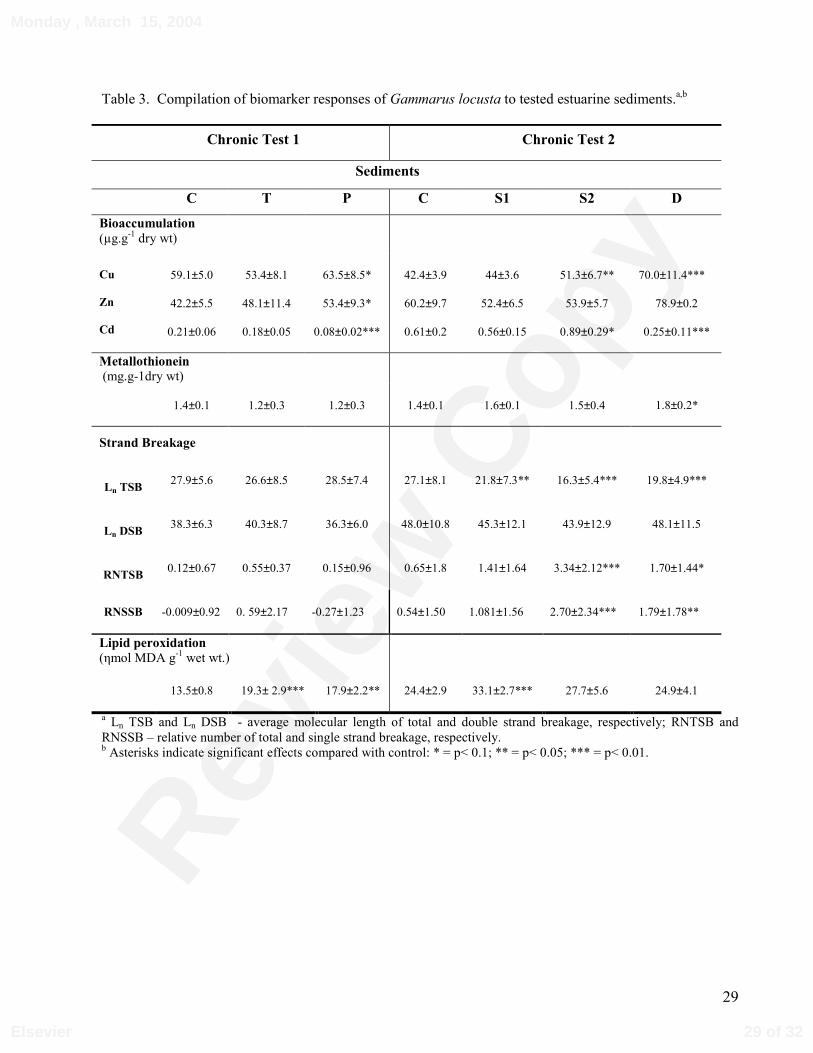
3.2. Bioaccumulation
Only heavy metals were measured in amphipod tissues. The results for whole-body
heavy metal accumulation are displayed in Table 2. The accumulation of Cu was significantly
higher in amphipods exposed to sediments P, S2 and D, with 7, 21 and 66 % higher levels,
13 of 32
Monday , March 15, 2004
Elsevier
Revie
w C
opy
14
respectively, compared with the values of control organisms (p< 0.1, p< 0.05 and p< 0.01
respectively).
Zn detected in organisms exposed to sediment P was also higher in about 26% compared
to control (p< 0.1). No significant bioaccumulation of Cd was observed in amphipods in any
of the contaminated sediments, except sediment S2. On the contrary, for sediments P and D
significantly lower body-burdens of Cd were detected (p< 0.01).
3.3. MT induction and LP
In chronic test 1 no induction of metallothionein (MT) was observed in animals exposed
to contaminated sediments (sediments P and T) compared to control levels (1.3 mg MT g-1 dry
wt). In contrast, lipid peroxidation (LP) in sediments P and T was about 30% and 40% higher
than control (13.5 ηmol MDA g-1 wet wt.; p< 0.05 and p< 0.01 respectively). In chronic test 2,
significantly higher MT induction was detected only in amphipods exposed to sediment D
compared to control levels of 1.4 mg MT g-1 dry wt (p< 0.1). Effects on LP were observed
only in animals from sediment S1, where values were 36 % higher than control (24.4 ηmol
MDA g-1 wet wt., p< 0.01) (Table 3).
3.4. DNA integrity
The differences in the relative number of total and single strand breaks (RNTSB and
RNSSB) of amphipods exposed to contaminated and control sediments are shown in Table 3.
In general, for all the contaminated sediments tested, no effects were observed on double
strand breakage parameters (Ln DSB and RNDSB).
In chronic test 1, no effects on DNA integrity were detected in exposed amphipods
(sediment P and T) compared to control organisms. The RNTSB and RNSSB of amphipods
from sediments P and T did not differ from control values (p> 0.1). In chronic test 2, the
14 of 32
Monday , March 15, 2004
Elsevier
Revie
w C
opy
15
results showed significant differences between amphipods exposed to each of the
contaminated sediments (S1, S2 and D) compared to control, when the Ln of TSB was
examined (p< 0.05, p< 0.01 and p< 0.01 respectively). Loss of DNA integrity was also
observed in the relative number of strand breaks (total and single) determined in organisms
exposed to sediments S2 and D (RNTSB - p< 0.01 and p< 0.1, respectively and RNSSB - p<
0.01 and p< 0.05, respectively). In sediments S2 and D, amphipods had on average twice as
many single strand breaks per 105 nucleotides than control. In amphipods from sediment S1,
RNTSB and RNSSB values were also higher than control, but they were not significantly
different (p> 0.1).
3.5 Weight-of-evidence (WOE) approach
Table 4 provides a global WOE interpretation of the results here reported (sediment
chemistry, metal bioaccumulation, biomarker responses)], together with organism/population
endpoints (Costa et al., submitted this issue), and also benthic community information from
other study (Mucha & Costa, 1999). Overall, sediments S1, S2 and D, were considered to
present a sizeable negative impact and ecological risk. Sediments’ S1 and S2 impact is thought
to be related in part with PAHs toxicity, while copper contamination appears to have a role in
sediment’s D toxicity. The two remaining sediments – T and P – did not show negative impact
and appear to have a beneficial effect in the test species. However, sediment P have a
detrimental ecological impact in situ, as indicated by benthic communities’ information, that
could not be detected through toxicity testing. The reasons for these global sediment quality
assessments are specified in the Discussion under a BPJ perspective.
15 of 32
Monday , March 15, 2004
Elsevier
Revie
w C
opy
16
4. Discussion
4.1 Biomarker responses
Considering the biomarker responses on the whole, sediments evaluated in chronic test 1
(sediments P and T) did not exhibit contaminant-induced stress in the amphipod G. locusta.
By comparison with control organisms, no adverse effects were detected on MT induction and
DNA integrity. Whereas in sediment T only Zn concentrations raise some concern, in
sediment P several contaminants (Cu, Zn and PAHs) exceeded the ERL, and therefore
biomarker responses (over chronic exposures) might be anticipated. The fact that
bioaccumulation of Cu and Zn was only little higher than control levels (approximately one
fold higher than control), and apparently insufficient to induce MT, indicates low
bioavailability of metallic contaminants in sediments P. The lower levels observed for Cd
body-burdens, compared to control in this sediment (and also in sediment D), most likely
resulted from interactions with the essential metals Cu and/or Zn that were bioaccumulated by
G. locusta. These interactions can take place at different stages of absorption, distribution in
the organism, and excretion of the above-mentioned metals (Brzoska & Moniuszko-Jakoniuk,
2001). Some studies showed that increased Zn supply may reduce Cd absorption and
accumulation and prevent or reduce the adverse action of Cd (Brzoska & Moniuszko-
Jakoniuk, 2001).
The high content of organic matter of sediment P (8.7% TVS) possibly caused low
bioavailability of both metals and PAHs to G. locusta, reducing or eliminating the potential
negative impacts that would be anticipated from contaminant concentrations alone. It has been
extensively shown that either metallic or organic contaminants may become unavailable to
biota in sediments with high organic content, due to the strong sorption affinity of
contaminants to sediment’s organic carbon matrix (Gunnarsson et al., 1999; Lawrence &
16 of 32
Monday , March 15, 2004
Elsevier
Revie
w C
opy
17
Mason, 2001). Previous results from laboratory studies with G. locusta where the sediment-Cu
LC50s increased considerably and directly with sediment’s organic carbon content (Correia &
Costa, 2000), also support this premise. Low contaminant bioavailability as a result of binding
to organic carbon matrix may also explain the absence of adverse effects recorded at
organism/population level in sediment P. Actually amphipods exposed to this sediment
exhibited high individual performance, in particular a significant improvement of individual
growth and pregnancy ratio compared to control animals. Similar stimulating effects on
growth were also observed in sediment T, although not as significant as in sediment P (Costa
et al, submitted this issue).
As opposed to these results, the higher levels of lipid peroxidation detected in animals
exposed to sediments P and T, would indicate occurrence of toxicant-induced stress. Although
these sediments differ in contamination levels, they have in common the high level of organic
content (8.7% and 11.5% TVS, respectively), a feature that was the most likely cause for the
growth stimulation observed in amphipods exposed to both sediments. As there is no other
evidence showing contaminant-induced insult from all remaining parameters, composite data
suggests that LP resulted from other causes than oxidative stress derived from exposure to
oxyradical-generating compounds (e.g. Cu or Zn and/or PAHs). Effectively, these LP results
are congruent with known evidence that endogenous variables (e.g. nutritional status, age, sex,
growth and reproduction) may themselves influence the peroxidation status of organisms
(Viarengo, Canesi, Pertica, & Livingstone, 1991), including G. locusta (Correia, Costa, Luis,
& Livingstone, 2003), therefore contributing to confound contaminant-induced effects. Earlier
studies with G. locusta revealed that increases in LP could be attributed to the improvement of
the physiological condition of animals and not directly to damage derived from exposure to
copper (Correia, 2002).
17 of 32
Monday , March 15, 2004
Elsevier
Revie
w C
opy
18
Results from chronic test 2 globally showed that sediments S2 and D generated chronic
toxicity to the amphipod G. locusta. According to DNA damage data, sediments S2 and D can
produce DNA strand breakage, mainly single strand breaks. The loss of DNA integrity was
observed by the significantly higher Ln TSB, RNTSB and RNSSB in animals exposed to both
sediments, but it was much more pronounced in sediment S2. The detection of these adverse
effects in amphipods from sediments S2 and D provide evidence of exposure and
bioavailability of genotoxicants in both sediments. Although the complex chemical nature of
sediments may make unclear which were the compound(s) responsible for the DNA damage
observed, the approach here followed may help identifying probable candidates. Compound
analyses of the various parameters provide significant weight-of-evidence that copper
contributed to the detrimental effects observed in amphipods exposed to this sediment D: 1)
high concentration of Cu, namely exceeding ERM, 2) significant Cu bioaccumulation and 3)
MT induction. Although copper is an essential metal, it may become toxic if intracellular
concentrations exceed the organisms’ requirements and its detoxification capability (Viarengo,
1989; Schenk, Davis, & Griffin, 1999; Livingstone, 2001). The available scientific evidence
referred to in the literature, indicates the potential of copper and other heavy metals as
genotoxicants (Bolognesi, Landini, Roggieri, Fabbri, & Viarengo, 1999; Jha, Cheung,
Foulkes, Hill, & Depledge, 2000). Moreover in previous studies with G. locusta, Cu has been
shown to induce MT (Correia et al., 2002) and DNA single strand breaks (Costa et al., 2002).
Effects of MT induction were only observed in amphipods exposed to sediment D. A
positive correlation was also detected between MT concentration and whole-body levels of Cu
(r = 0.5035, p < 0.05), indicating that induction of MT was closely associated with Cu in
sediment D. The simultaneous presence of SB and MT in animals exposed to sediment D, and
the absence of MT induction in amphipods from sediment S2 suggests that the dynamics of
toxicity differed in the latter. Although not as high as in sediment D, there was still some Cu
18 of 32
Monday , March 15, 2004
Elsevier
Revie
w C
opy
19
bioaccumulation in sediment S2, and also levels of Cd little higher compared to control. In this
respect it is noteworthy that precisely in amphipods from sediment S2, which apparently
lacked MT “protection”, DNA damage was especially severe. Although other possible
interpretations for these observations cannot be discounted, according the available data the
most plausible is that effects on DNA integrity were caused mainly by other genotoxicants,
which are not detoxified by MT. The high levels of PAHs (over ERL) in sediment S2 are
particular relevant in a sandy sediment where the bioavailable fraction of organic
contaminants is potentially higher compared to muddy sediments.
Chronic toxicity of sediments S2 and D was also recorded at the organism/population
levels. As described in Costa et al (submitted this issue), an extensive impaired condition was
observed in amphipods exposed to these sediments that was expressed by lower survival, an
unbalanced sex ratio, low proportion of gravid females, and the lowest number of offspring,
by comparison with control amphipods. Hence, the biochemical endpoints are on the whole in
agreement with changes seen at higher-levels of biological organization (specially evident on
SB), providing more conclusive evidence on the prevalence of contaminant-induced stress in
these sediments.
Concerning sediment S1, no MT induction was detected and the loss of DNA integrity
was not as high and clear than in amphipods exposed to S2 and D (significant effects were
only observed in Ln TSB). Similar to what was observed in the first chronic toxicity test,
effects on LP were also detected in amphipods exposed to this sediment. For the reasons
previously mentioned this response is again interpreted as related with the higher average
length observed in S1 amphipods. Despite the high level of contamination and acute toxicity
of this sediment, the 75% dilution with control sediment was effective in almost eliminating
chronic toxicity. However, this dilution may be just near the toxicity threshold, as residual
traces of toxicity and some evidence of stimulating effects on growth suggest occurrence of
19 of 32
Monday , March 15, 2004
Elsevier
Revie
w C
opy
20
hormesis. Hormesis is a biological response to sub-inhibitory doses of stressor characterized
by stimulatory effects on biological indicators of insulted organisms, particularly growth,
compared to non-stressed control organisms (Stebbing, 1982, 1997). The event of hormesis
has been document in vertebrate and invertebrates in response to a variety of stressors
(Calabrese, Baldwin, & Holland, 1999). As showed in a previous study, where evidence was
found of copper-induced hormesis in G. locusta, stimulatory effects of low doses of toxicant
can be coupled with induction of LP (Correia, 2002) and MT (Correia et al., 2001). The
toxicity of sediment S1 was patent even at 50% dilution. By further diluting this sediment with
control sediment, contaminant concentrations were reduced possibly to a hormetic level, with
stimulatory effects on growth and LP, but not on MT, plausibly because hormesis inducer was
not a metallic contaminant.
4.2 Weight-of-Evidence (WOE) approach
In summary, by way of a WOE interpretation of the multiple biological effects examined,
the following conclusions can be drawn from this investigation:
1) Sediments enriched in organic matter may have a significant positive impact in G.
locusta’s growth in chronic bioassays (e.g. sediments T and P). These potential effects
should be considered in advance when designing either acute or chronic bioassays with
benthic organisms, where multiple-level assessments may play an useful role.
2) On the whole, sediments T and P did not reveal contaminant-induced stress to the
amphipod G. locusta. Despite sediment P showed some chemical contamination, the
high organic content of this sediment may have had some influence in reducing the
bioavailability of toxicants and consequently eliminating symptoms of toxicity. On the
other hand, the same factor probably promoted growth and fecundity of G. locusta. All
previous (Costa et al., 1998; Neuparth, 1999) and current tests with sediment P failed
20 of 32
Monday , March 15, 2004
Elsevier
Revie
w C
opy
21
to show toxicity. However, these findings do not match with benthic macrofauna
studies that recorded a disturbed community in the sediment collection site (Mucha &
Costa, 1999). The development of extreme anoxic conditions under high load of
organic matter, has been proposed as explanation for this impoverished benthic
community (Mucha and Costa, 1999).
3) As opposed to sediment P, results from the second chronic test show that a high
content of organic matter in the sediment is not necessarily a shield from contaminant
insult. That is the case for sediment D, which despite being the sediment with highest
organic content tested, was also one of chronically toxic sediments. Although other
possibilities cannot be discounted, there is some WOE that the origin of the sediment
D toxicity is associated with copper, namely considering the sediment’s copper above
ERM, bioaccumulation of copper and induction of MT.
4) The origin of the sediments S1 and S2 toxicity is apparently related with the nearby
industrial effluent at the sampling site, as it is evidenced by reduction of sediment
toxicity as a function of the distance from the effluent – S1 more toxic than S2. The
high levels of PAHs detected in these sediments probably played a role in the serious
detrimental effects recorded. The current findings of severe toxicity match with data
showing a highly disturbed benthic community at these sediments’ collection site
(Mucha & Costa, 1999).
5) A presumed hormetic response occurred after exposure of the amphipods to serial
dilutions of sediment S1. Only recently hormesis started to receive more widespread
recognition (Calabrese & Baldwin, 1999) but its relevance for ecological risk
assessments should be given proper appreciation promptly [Calabrese, 1999 #310;
(Chapman, 2002). The application of multiple-level assessments and WOE approaches
in chronic bioassays is likely to improve the ability to detect and understand better this
21 of 32
Monday , March 15, 2004
Elsevier
Revie
w C
opy
22
relevant phenomenon. Particularly considering that hormesis has been documented for
a multitude of stressors, toxicants being one among many others.
6) Sediments’ dilutions contribute to establish more clearly dose-responses and enable
ranking of sediment toxicity, which in this study was S1>S2>D. Sediment S1 was the
most toxic since a 75% dilution was required to eliminate acute toxicity and reduce
chronic toxicity to the putative hormetic response. Sediment S2 was the second most
toxic sediment since it still exhibited chronic toxicity after a 50% dilution, and
sediment D was the least toxic of the three sediments given that it only showed chronic
toxicity, but not acute toxicity when tested in full.
This study illustrated how integration of biochemical markers in chronic sediment tests
within a WOE framework, can help backing-up interpretation of organism and population-
level responses. By providing evidence of exposure (or lack of it) to contaminants in
sediments under examination, the biomarkers here applied assisted in the identification of the
grounds for organism-level responses. Namely they contributed to distinguish responses
induced by sediment contaminants from those responses derived from other factors, such as
for example the amount of organic matter in the sediment.
Further research is encouraged in what concerns with the use of a multi-level assessment
of chronic sediment toxicity, as for example the inclusion of the biomarkers tested here, and
eventually other potential biochemical endpoints, in long-term tests where responses are
determined on a time-course basis. This will enable a better understanding of pathways of
contaminant metabolism, detoxication and toxic action, allowing to follow more closely the
whole toxicological process up to the organism/population levels.
22 of 32
Monday , March 15, 2004
Elsevier
Revie
w C
opy
23
5. Acknowledgements
We are grateful to Eng. Carlos Vale, Dr Ana Maria Ferreira, Joana Raimundo
(INIAP/IPIMAR), and Eng. Paula Viana (Instituto do Ambiente) for analyses of sediments’
contaminants. We are thankful to Dr Peter M. Chapman (EVS Environment Consultants) for
comments on an early draft of this manuscript. This investigation was conducted under the
scope of the grant POCTI/BSE/41967/2001, and fellowships BD/21613/99, BD/11022/97,
BD/11575/97 and BPD/11588/02, approved by FCT and funded by the European Union -
FEDER.
6. References
Barka, S., Pavillon, J. F., & Amiard, J. C. (2001). Influence of different essential and non-essential metals on
MTLP levels in the copepod Tigriopus brevicornis. Comparative Biochemistry and Physiology, 128C, 479-
493.
Bebianno, M. J., & Langston, W. J. (1989). Quantification of metallothioneins in marine invertebrates using
different pulse polarography. Portugaliae Electrochimica Acta, 7, 59-64.
Bolognesi, C., Landini, E., Roggieri, P., Fabbri, R., & Viarengo, A. (1999). Genotoxicity biomarkers in the
assessment of heavy metal effects in mussels: experimental studies. Environmental and Molecular
Mutagenesis, 33, 287-292.
Brzoska, M. M., & Moniuszko-Jakoniuk, J. (2001). Interactions between cadmium and zinc in the organism.
Food and Chemical Toxicology, 39, 967-980.
Calabrese, E. J., & Baldwin, L. A. (1999). The marginalization of hormesis. Toxicologic Pathology, 27, 187-194.
Calabrese, E. J., Baldwin, L. A., & Holland, C. D. (1999). Hormesis: a highly generalizable and reproducible
phenomenon with important implications for risk assessment. Risk Analysis, 19, 261-281.
Chapman, P. M. (2002). Ecological risk assessment (ERA) and hormesis. The Science of the Total Environment,
288, 131-140.
23 of 32
Monday , March 15, 2004
Elsevier
Revie
w C
opy
24
Chapman, P. M., McDonald, B. G., & Lawrence, G. S. (2002). Weight-of-evidence issues and frameworks for
sediment quality (and other) assessments. Human and Ecological Risk Assessment, 8, 1489-1515.
Correia, A. D. (2002). Integrated ecotoxicological research with Gammarus locusta (L.): Biochemical and
cellular responses and links to organism-level endpoints. Ph.D. thesis, Universidade Nova de Lisboa,
Lisboa, Portugal.
Correia, A. D., Costa, F. O., Neuparth, T., Diniz, M. E., & Costa, M. H. (2001). Sub-lethal effects of copper
spiked sediments on the marine amphipod Gammarus locusta: evidence of hormesis? Ecotoxicology and
Environmental Restoration, 4, 32-38.
Correia, A. D., & Costa, M. H. (2000). Effects of sediment geochemical properties on the toxicity of copper-
spiked sediments to the marine amphipod Gammarus locusta. The Science of the Total Environment, 247,
99-106.
Correia, A. D., Costa, M. H., Luis, O. J., & Livingstone, D. R. (2003). Age-related changes in antioxidant
enzymes activities, fatty acid composition and lipid peroxidation in whole body Gammarus locusta
(Crustacea: Amphipoda). Journal of Experimental Marine Biology and Ecology, 289, 83-101.
Correia, A. D., Lima, G., Costa, M. H., & Livingstone, D. R. (2002). Studies on biomarkers of copper exposure
and toxicity in the marine amphipod Gammarus locusta (Crustacea) I: Induction of metallothionein and lipid
peroxidation. Biomarkers, 7, 422-437.
Costa, F. O. (1997). Gammarus locusta (L.) (Crustacea) em testes ecotoxicológicos: ecologia, cultura e
sensibilidade a variaveis não-contaminantes. M.Sc. thesis, Universidade Nova de Lisboa, Lisboa, Portugal.
Costa, F. O., Correia, A. D., & Costa, M. H. (1998). Acute marine sediment toxicity: A potential new test with
the amphipod Gammarus locusta. Ecotoxicology and Environmental Safety, 40, 81-87.
Costa, F. O., & Costa, M. H. (2000). Review of the ecology of Gammarus locusta (L.). Polish Archives of
Hydrobiology, 48, 541-559.
Costa, F. O., Neuparth, T., Costa, M. H., Theodorakis, C. W., & Shugart, L. R. (2002). Detection of DNA strand
breakage in a marine amphipod by agarose gel electrophoresis: exposure to X-rays and copper. Biomarkers,
7, 451-463.
Gunnarsson, J. S., Granberg, M. E., Nilsson, H. C., Rosenberg, R., & Hellman, B. (1999). Influence of sediment-
organic matter quality on growth and polychlorobiphenyl bioavailability in echinodermata (Amphiura
filiformis). Environmental Toxicology and Chemistry, 18, 1534-1543.
24 of 32
Monday , March 15, 2004
Elsevier
Revie
w C
opy
25
Hyne, R. V., & Maher, W. A. (2003). Invertebrate Biomarkers: links to toxicosis that predict population decline.
Ecotoxicology and Environmental Safety, 54, 366-374.
Jha, A. N., Cheung, V. V., Foulkes, M. E., Hill, S. J., & Depledge, M. H. (2000). Detection of genotoxins in the
marine environment: adoption and evaluation of an integrated approach using the embryo-larval stages of
the marine mussel, Mytilus edulis. Mutation Research, 464, 213-228.
Langston, W. J., & Bebianno, M. J. (1998). Metal Metabolism in Aquatic Environments. London: Chapman and
Hall.
Lawrence, A. L., & Mason, R. P. (2001). Factors controlling the bioaccumulation of mercury and methylmercury
by the estuarine amphipod Leptocheirus plumulosus. Environmental Pollution, 11, 217-231.
Livingstone, D. R. (2001). Contaminant-stimulated reactive oxygen species production and oxidative damage in
aquatic organisms. Marine Pollution Bulletin, 42, 656-666.
Long, E. R., MacDonald, D. D., Smith, S. L., & Calder, F. D. (1995). Incidence of adverse biological effects
within ranges of chemical concentrations in marine and estuarine sediments. Environmental Management,
19, 81-97.
Moksnes, P. O., Lindahl, U., & Haux, C. (1995). Metallothionein as a bioindicator of heavy metal exposure in the
tropical shrimp, Penaeus vannamei: A study of dose-dependent induction. Marine Environmental Research,
39, 143-146.
Mucha, A. P. (1997). Estudo das comunidades macrozoobênticas em biótopos litorais de energia distinta. Sua
relação com gradientes de carbono e nutrientes. Tese de Mestrado thesis, Universidade Nova de Lisboa,
Lisboa.
Mucha, A. P., & Costa, M. H. (1999). Macrozoobenthic community structure in two Portuguese estuaries:
Relationship with organic enrichment and nutrient gradients. Acta Oecologica, 20, 363-373.
Neuparth, T. (1999). Gammarus locusta e Corophium volutator em estudos de ecotoxicologia sedimentar:
biologia e sensibilidade a ambientes sedimentares perturbados. M.Sc. thesis, Universidade Nova de Lisboa,
Lisboa, Portugal.
Ohkawa, H., Ohishi, N., & Yagi, K. (1979). Assay for lipid peroxides in animal tissues by thiobarbituric acid
reaction. Analytical Biochemistry, 95, 351-358.
Palecek, E., & Pechan, Z. (1971). Estimation of nanogram quantities of proteins by pulse polarographic
techniques. Analytical Biochemistry, 42, 59-71.
25 of 32
Monday , March 15, 2004
Elsevier
Revie
w C
opy
26
Rantala, R. T. T., & Loring, D. H. (1977). A rapid determination of 10 elements in marine suspended particulate
matter by atomic absorption. Atomic Absorption Newsletter, 16, 51-52.
Schenk, D., Davis, K. B., & Griffin, B. R. (1999). Relationship between expression of hepatic metallothionein
and sublethal stress in channel catfish following acute exposure to copper sulphate. Aquaculture, 177, 367-
379.
Shugart, L. R. (1999). Structural damage to DNA in response to toxicant exposure. In V. Forbes, Genetics and
Ecotoxicology (pp. 151-167). Washington D.C.: Taylor & Francis.
Shugart, L. R. (2000). DNA damage as a biomarker of exposure. Ecotoxicology, 9, 329-340.
Stebbing, A. R. D. (1982). Hormesis - the stimulation of growth by low levels of inhibitors. The Science of the
Total Environment, 22, 213-234.
Stebbing, A. R. D. (1997). A theory for growth hormesis. Belle Newsletter, 6, 1-11.
USEPA-USACE (2001). Method for assessing the chronic toxicity of marine and estuarine sediment-associated
contaminants with the amphipod Leptocheirus plumulosus. United States Environmental Protection Agency,
EPA/600/R-01/020, Washington, D.C.
Viarengo, A. (1989). Heavy metals in marine invertebrates: mechanisms of regulation and toxicity at the cellular
level. CRC Critical Reviews in Aquatic Sciences, 1, 295-317.
Viarengo, A., Canesi, L., Pertica, M., & Livingstone, D. R. (1991). Seasonal variations in the antioxidant defence
systems and lipid peroxidation of the digestive gland of mussels. Comparative Biochemistry and Physiology,
100C, 187-190.
Wenning, R. J., & Ingersoll, C. G. (2002). Summary of SETAC Pellston Workshop on use of Sediment Quality
Guidelines and related tools for the assessment of contaminated sediments; 17-22 August 2002, Fairmont,
Montana, USA. Society of Environmental Toxicology and Chemistry (SETAC), Pensacola, FL, USA.
26 of 32
Monday , March 15, 2004
Elsevier
Review Copy
27
Table 1. Ordinal ranking scheme applied to sediment quality data in order to build the weight-of-evidence tabular interpretation matrix provided in Table 4.
�� � � ○ ○○ዊ�ዊ�ዊ�ዊ�ዊ�ዊ�ዊ�ዊ�ዊ�
ዊ�ዊ�ዊ�ዊ�ዊ�ዊ�ዊ�ዊ�ዊ�ዊ�ዊ�ዊ�ዊ�ዊ�ዊ�ዊ�ዊ�ዊ�ዊ�ዊ�ዊ�ዊ�
ዊ�ዊ�ዊ�ዊ�ዊ�ዊ�ዊ�ዊ�ዊ�ዊ�ዊ�ዊ�ዊ�ዊ�ዊ�ዊ�ዊ�ዊ�ዊ�ዊ�ዊ�ዊ�ዊ�ዊ�ዊ�
ዊ�ዊ�ዊ�ዊ�ዊ�ዊ�ዊ�ዊ�ዊ�ዊ�
ዊ�ዊ�ዊ�ዊ�ዊ�ዊ�ዊ�ዊ�ዊ�ዊ�ዊ�ዊ�ዊ�ዊ�ዊ�ዊ�ዊ�ዊ�ዊ�ዊ�ዊ�ዊ�ዊ�ዊ�ዊ�
ዊ�ዊ�ዊ�ዊ�ዊ�ዊ�ዊ�ዊ�ዊ�ዊ�ዊ�ዊ�ዊ�ዊ�ዊ�ዊ�ዊ�ዊ�ዊ�ዊ�ዊ�ዊ�ዊ�ዊ�ዊ�ዊ�ዊ�ዊ�ዊ�ዊ�ዊ�ዊ�ዊ�ዊ�ዊ�ዊ�ዊ�ዊ�ዊ�ዊ�ዊ� ---------- ----------
ዊ�ዊ�ዊ�ዊ�ዊ�ዊ�ዊ�ዊ�ዊ�ዊ�ዊ�ዊ�ዊ�ዊ�ዊ�ዊ�ዊ�ዊ�ዊ�ዊ� ዊ�ዊ�ዊ�ዊ�ዊ�ዊ�ዊ�ዊ�ዊ�ዊ�ዊ�ዊ�ዊ�ዊ�ዊ�ዊ�ዊ�ዊ�ዊ�ዊ�ዊ�ዊ�ዊ�ዊ�ዊ� ዊ�ዊ�ዊ�ዊ�ዊ�ዊ�ዊ�ዊ�ዊ�ዊ�ዊ�ዊ�ዊ�ዊ�ዊ�ዊ�ዊ�ዊ�ዊ�ዊ�ዊ� ዊ�ዊ�ዊ�ዊ�ዊ�ዊ�ዊ�ዊ�ዊ�ዊ�ዊ�ዊ�ዊ�ዊ�ዊ�ዊ�ዊ�ዊ�ዊ�ዊ�ዊ�ዊ�ዊ�ዊ� ---------- ----------
ዊ�ዊ�ዊ�ዊ�ዊ�ዊ�ዊ�ዊ�ዊ�ዊ�ዊ�ዊ�ዊ�ዊ�ዊ�
ዊ�ዊ�ዊ�ዊ�ዊ�ዊ�ዊ�ዊ�ዊ�ዊ�ዊ�ዊ�ዊ�ዊ�ዊ�ዊ�ዊ�ዊ�ዊ�ዊ�ዊ�ዊ�ዊ�ዊ�ዊ�ዊ�ዊ�ዊ�ዊ�ዊ�ዊ�ዊ�ዊ�ዊ�ዊ�ዊ�ዊ�ዊ�ዊ�ዊ�ዊ�ዊ�ዊ�ዊ�ዊ�ዊ�
ዊ�ዊ�ዊ�ዊ�ዊ�ዊ�ዊ�ዊ�ዊ�ዊ�ዊ�ዊ�ዊ�ዊ�ዊ�ዊ�ዊ�ዊ�ዊ�ዊ�ዊ�ዊ�ዊ�ዊ�ዊ�ዊ�ዊ�ዊ�ዊ�ዊ�ዊ�ዊ�ዊ�
ዊ�ዊ�ዊ�ዊ�ዊ�ዊ�ዊ�ዊ�ዊ�ዊ�ዊ�ዊ�ዊ�ዊ�ዊ�ዊ�ዊ�
ዊ�ዊ�ዊ�ዊ�ዊ�ዊ�ዊ�ዊ�ዊ�ዊ�ዊ�ዊ�ዊ�ዊ�ዊ�ዊ�ዊ�ዊ�ዊ�ዊ�ዊ�ዊ�ዊ�ዊ�ዊ�ዊ�ዊ�ዊ�ዊ�ዊ�ዊ�
ዊ�ዊ�ዊ�ዊ�ዊ�ዊ�ዊ�ዊ�ዊ�ዊ�ዊ�ዊ�ዊ�ዊ�ዊ�ዊ�ዊ�ዊ�ዊ�ዊ�ዊ�ዊ�ዊ�ዊ�ዊ�ዊ�ዊ�ዊ�ዊ�ዊ�ዊ�ዊ�ዊ�
ዊ�ዊ�ዊ�ዊ�ዊ�ዊ�ዊ�ዊ�ዊ�ዊ�ዊ�ዊ�ዊ�ዊ�ዊ�ዊ�ዊ�ዊ�ዊ�ዊ�ዊ�ዊ�ዊ�
ዊ�ዊ�ዊ�ዊ�ዊ�ዊ�ዊ�ዊ�ዊ�ዊ�ዊ�ዊ�ዊ�ዊ�ዊ�ዊ�ዊ�ዊ�ዊ�ዊ�ዊ�ዊ�ዊ�ዊ�ዊ�ዊ�ዊ�
ዊ�ዊ�ዊ�ዊ�ዊ�ዊ�ዊ�ዊ�ዊ�ዊ�ዊ�ዊ�ዊ�ዊ�ዊ�ዊ�ዊ�ዊ�ዊ�ዊ�ዊ�ዊ�ዊ�ዊ�ዊ�ዊ�ዊ�ዊ�ዊ�ዊ�ዊ�
ዊ�ዊ�ዊ�ዊ�ዊ�ዊ�ዊ�ዊ�ዊ�ዊ�ዊ�ዊ�ዊ�ዊ�ዊ�ዊ�ዊ�ዊ�ዊ�ዊ�
ዊ�ዊ�ዊ�ዊ�ዊ�ዊ�ዊ�ዊ�ዊ�ዊ�ዊ�ዊ�ዊ�ዊ�ዊ�ዊ�ዊ�ዊ�ዊ�ዊ�ዊ�ዊ�ዊ�ዊ�ዊ�ዊ�ዊ�ዊ�ዊ�ዊ�
ዊ�ዊ�ዊ�ዊ�ዊ�ዊ�ዊ�ዊ�ዊ�ዊ�ዊ�ዊ�ዊ�ዊ�ዊ�ዊ�ዊ�ዊ�ዊ�ዊ�ዊ�ዊ�ዊ�ዊ�ዊ�ዊ�ዊ�ዊ�ዊ�ዊ�ዊ�ዊ�ዊ�
ዊ�ዊ�ዊ�ዊ�ዊ�ዊ�ዊ�ዊ�ዊ�ዊ�ዊ�ዊ�ዊ�ዊ�ዊ�ዊ�ዊ�ዊ�ዊ�ዊ�ዊ�ዊ�ዊ�
ዊ�ዊ�ዊ�ዊ�ዊ�ዊ�ዊ�ዊ�ዊ�ዊ�ዊ�ዊ�ዊ�ዊ�ዊ�ዊ�ዊ�ዊ�ዊ�ዊ�ዊ�ዊ�ዊ�ዊ�ዊ�ዊ�ዊ�ዊ�ዊ�ዊ�
ዊ�ዊ�ዊ�ዊ�ዊ�ዊ�ዊ�ዊ�ዊ�ዊ�ዊ�ዊ�ዊ�ዊ�ዊ�ዊ�ዊ�ዊ�ዊ�ዊ�ዊ�ዊ�ዊ�ዊ�ዊ�ዊ�ዊ�ዊ�ዊ�ዊ�ዊ�ዊ�ዊ�
ዊ�ዊ�ዊ�ዊ�ዊ�ዊ�ዊ�ዊ�ዊ�ዊ�ዊ�ዊ�ዊ�ዊ�ዊ�ዊ�ዊ�
ዊ�ዊ�ዊ�ዊ�ዊ�ዊ�ዊ�ዊ�ዊ�ዊ�ዊ�ዊ�ዊ�ዊ�ዊ�ዊ�ዊ�ዊ�ዊ�ዊ�ዊ�ዊ�ዊ�ዊ�ዊ� ዊ�ዊ�ዊ�ዊ�ዊ�ዊ�ዊ�ዊ�ዊ�ዊ�ዊ�ዊ�ዊ�ዊ�ዊ�ዊ�ዊ�ዊ�ዊ�ዊ�ዊ�ዊ�ዊ�ዊ�ዊ�ዊ�ዊ�ዊ�ዊ�ዊ�ዊ�ዊ�ዊ�ዊ�ዊ�
ዊ�ዊ�ዊ�ዊ�ዊ�ዊ�ዊ�ዊ�ዊ�ዊ�ዊ�ዊ�ዊ�ዊ�ዊ�ዊ�ዊ�ዊ�ዊ�ዊ�ዊ�ዊ�ዊ�ዊ�ዊ�ዊ�ዊ�ዊ�ዊ�ዊ�
ዊ�ዊ�ዊ�ዊ�ዊ�ዊ�ዊ�ዊ�ዊ�ዊ�ዊ�ዊ�ዊ�ዊ�ዊ�ዊ�ዊ�ዊ�
ዊ�ዊ�ዊ�ዊ�ዊ�ዊ�ዊ�ዊ�ዊ�ዊ�ዊ�ዊ�ዊ�ዊ�ዊ�ዊ�ዊ�ዊ�ዊ�ዊ�ዊ�ዊ�ዊ�ዊ�ዊ�ዊ�ዊ�ዊ�ዊ�ዊ�ዊ�ዊ�ዊ�ዊ�ዊ�
ዊ�ዊ�ዊ�ዊ�ዊ�ዊ�ዊ�ዊ�ዊ�ዊ�ዊ�ዊ�ዊ�ዊ�ዊ�ዊ�ዊ�ዊ�ዊ�ዊ�ዊ�ዊ�ዊ�ዊ�ዊ�ዊ�ዊ�ዊ�ዊ�ዊ�
ዊ�ዊ�ዊ�ዊ�ዊ�ዊ�ዊ�ዊ�ዊ�ዊ�ዊ�ዊ�ዊ�ዊ�ዊ�ዊ�ዊ�ዊ�ዊ�ዊ�ዊ�ዊ�ዊ�
ዊ�ዊ�ዊ�ዊ�ዊ�ዊ�ዊ�ዊ�ዊ�ዊ�ዊ�ዊ�ዊ�ዊ�ዊ�ዊ�ዊ�ዊ�ዊ�ዊ�ዊ�ዊ�ዊ�ዊ�ዊ�ዊ�ዊ�ዊ�
ዊ�ዊ�ዊ�ዊ�ዊ�ዊ�ዊ�ዊ�ዊ�ዊ�ዊ�ዊ�ዊ�ዊ�ዊ�ዊ�ዊ�ዊ�ዊ�ዊ�ዊ�ዊ�ዊ�ዊ�ዊ�ዊ�ዊ�ዊ�ዊ�ዊ�ዊ�ዊ�
ዊ�ዊ�ዊ�ዊ�ዊ�ዊ�ዊ�ዊ�ዊ�ዊ�ዊ�ዊ�ዊ�ዊ�ዊ�ዊ�ዊ�ዊ�ዊ�ዊ�ዊ�ዊ�ዊ�ዊ�ዊ�
ዊ�ዊ�ዊ�ዊ�ዊ�ዊ�ዊ�ዊ�ዊ�ዊ�ዊ�ዊ�ዊ�ዊ�ዊ�ዊ�ዊ�ዊ�ዊ�ዊ�ዊ�ዊ�ዊ�ዊ�ዊ�ዊ�ዊ�ዊ�ዊ�ዊ�ዊ�ዊ�ዊ�ዊ�ዊ�
ዊ�ዊ�ዊ�ዊ�ዊ�ዊ�ዊ�ዊ�ዊ�ዊ�ዊ�ዊ�ዊ�ዊ�ዊ�ዊ�ዊ�ዊ�ዊ�ዊ�ዊ�ዊ�ዊ�ዊ�ዊ�ዊ�ዊ�ዊ�ዊ�ዊ�
ዊ�ዊ�ዊ�ዊ�ዊ�ዊ�ዊ�ዊ�ዊ�ዊ�ዊ�ዊ�ዊ�ዊ�ዊ�ዊ�ዊ�ዊ�ዊ�ዊ�ዊ�ዊ�ዊ�
ዊ�ዊ�ዊ�ዊ�ዊ�ዊ�ዊ�ዊ�ዊ�ዊ�ዊ�ዊ�ዊ�ዊ�ዊ�ዊ�ዊ�ዊ�ዊ�ዊ�ዊ�ዊ�ዊ�ዊ�ዊ�
ዊ�ዊ�ዊ�ዊ�ዊ�ዊ�ዊ�ዊ�ዊ�ዊ�ዊ�ዊ�ዊ�ዊ�ዊ�ዊ�ዊ�ዊ�ዊ�ዊ�ዊ�ዊ�ዊ�ዊ�ዊ�ዊ�ዊ�ዊ�ዊ�
ዊ�ዊ�ዊ�ዊ�ዊ�ዊ�ዊ�ዊ�ዊ�ዊ�ዊ�ዊ�ዊ�ዊ�ዊ�ዊ�ዊ�ዊ�ዊ�ዊ�ዊ�ዊ�ዊ�ዊ�ዊ�ዊ�ዊ�ዊ�ዊ�
ዊ�ዊ�ዊ�ዊ�ዊ�ዊ�ዊ�ዊ�ዊ�ዊ�ዊ�ዊ�ዊ�ዊ�ዊ�ዊ�ዊ�ዊ�ዊ�ዊ�ዊ�ዊ�ዊ�ዊ�ዊ�ዊ�ዊ�ዊ�ዊ�ዊ�ዊ�ዊ�ዊ�ዊ�ዊ�ዊ�ዊ�ዊ�ዊ�ዊ�ዊ�ዊ�
ዊ�ዊ�ዊ�ዊ�ዊ�ዊ�ዊ�ዊ�ዊ�ዊ�ዊ�ዊ�ዊ�ዊ�ዊ�ዊ�ዊ�ዊ�ዊ�
ዊ�ዊ�ዊ�ዊ�ዊ�ዊ�ዊ�ዊ�ዊ�ዊ�
ዊ�ዊ�ዊ�ዊ�ዊ�ዊ�ዊ�ዊ�ዊ�ዊ�ዊ�ዊ�ዊ�ዊ�ዊ�ዊ�ዊ�ዊ�ዊ�ዊ�ዊ�ዊ�ዊ�ዊ�ዊ�ዊ�ዊ�ዊ�ዊ�ዊ�ዊ�ዊ�ዊ�ዊ�
ዊ�ዊ�ዊ�ዊ�ዊ�ዊ�ዊ�ዊ�ዊ�ዊ�ዊ�ዊ�ዊ�ዊ�ዊ�ዊ�ዊ�ዊ�ዊ�ዊ�ዊ�ዊ�ዊ�ዊ�ዊ�ዊ�ዊ�ዊ�ዊ�ዊ�ዊ�ዊ�ዊ�ዊ�
ዊ�ዊ�ዊ�ዊ�ዊ�ዊ�ዊ�ዊ�ዊ�ዊ�ዊ�ዊ�ዊ�ዊ�ዊ�ዊ�
ዊ�ዊ�ዊ�ዊ�ዊ�ዊ�ዊ�ዊ�ዊ�ዊ�ዊ�ዊ�ዊ�ዊ�ዊ�ዊ�ዊ�ዊ�ዊ�ዊ�ዊ�ዊ�ዊ�ዊ�ዊ�ዊ�ዊ�ዊ�ዊ�
ዊ�ዊ�ዊ�ዊ�ዊ�ዊ�ዊ�ዊ�ዊ�ዊ�ዊ�ዊ�ዊ�ዊ�ዊ�ዊ�ዊ�ዊ�ዊ�ዊ�ዊ�ዊ�ዊ�ዊ�ዊ�ዊ�ዊ�ዊ�
ዊ�ዊ�ዊ�ዊ�ዊ�ዊ�ዊ�ዊ�ዊ�
ዊ�ዊ�ዊ�ዊ�ዊ�ዊ�ዊ�ዊ�ዊ�ዊ�ዊ�ዊ�ዊ�ዊ�ዊ�ዊ�ዊ�ዊ�ዊ�ዊ�ዊ�ዊ�ዊ�ዊ�ዊ�ዊ�ዊ�ዊ�ዊ�ዊ�ዊ�ዊ�ዊ�
ዊ�ዊ�ዊ�ዊ�ዊ�ዊ�ዊ�ዊ�ዊ�ዊ�ዊ�ዊ�ዊ�ዊ�ዊ�ዊ�ዊ�ዊ�ዊ�ዊ�
ዊ�ዊ�ዊ�ዊ�ዊ�ዊ�ዊ�ዊ�ዊ�ዊ�ዊ�ዊ�ዊ�ዊ�ዊ�ዊ�ዊ�ዊ�
ዊ�ዊ�ዊ�ዊ�ዊ�ዊ�ዊ�ዊ�ዊ�ዊ�ዊ�ዊ�ዊ�ዊ�ዊ�ዊ�ዊ�ዊ�ዊ�ዊ�ዊ�ዊ�ዊ�ዊ�ዊ�ዊ�ዊ�ዊ�ዊ�ዊ�ዊ�ዊ�ዊ�
ዊ�ዊ�ዊ�ዊ�ዊ�ዊ�ዊ�ዊ�ዊ�ዊ�ዊ�ዊ�ዊ�ዊ�ዊ�ዊ�ዊ�ዊ�ዊ�ዊ�ዊ�ዊ�ዊ�ዊ�ዊ�ዊ�ዊ�
ዊ�ዊ�ዊ�ዊ�ዊ�ዊ�ዊ�ዊ�ዊ�ዊ�ዊ�
ዊ�ዊ�ዊ�ዊ�ዊ�ዊ�ዊ�ዊ�ዊ�ዊ�ዊ�ዊ�ዊ�ዊ�ዊ�ዊ�ዊ�ዊ�ዊ�ዊ�ዊ�ዊ�ዊ�ዊ�ዊ�ዊ�ዊ�ዊ�ዊ�ዊ�ዊ�ዊ�ዊ�ዊ�ዊ�ዊ�ዊ�ዊ�
ዊ�ዊ�ዊ�ዊ�ዊ�ዊ�ዊ�ዊ�ዊ�ዊ�ዊ�ዊ�ዊ�ዊ�ዊ�ዊ�ዊ�ዊ�ዊ�ዊ�ዊ�
ዊ�ዊ�ዊ�ዊ�ዊ�ዊ�ዊ�ዊ�ዊ�ዊ�
ዊ�ዊ�ዊ�ዊ�ዊ�ዊ�ዊ�ዊ�ዊ�ዊ�ዊ�ዊ�ዊ�ዊ�ዊ�ዊ�ዊ�ዊ�ዊ�ዊ�ዊ�ዊ�ዊ�ዊ�ዊ�ዊ�ዊ�ዊ�ዊ�ዊ�ዊ�ዊ�
ዊ�ዊ�ዊ�ዊ�ዊ�ዊ�ዊ�ዊ�ዊ�ዊ�ዊ�ዊ�ዊ�ዊ�ዊ�ዊ�ዊ�ዊ�ዊ�ዊ�ዊ�ዊ�ዊ�ዊ�ዊ�
ዊ�ዊ�ዊ�ዊ�ዊ�ዊ�ዊ�ዊ�ዊ�ዊ�ዊ�ዊ�ዊ�ዊ�ዊ�ዊ�ዊ�
ዊ�ዊ�ዊ�ዊ�ዊ�ዊ�ዊ�ዊ�ዊ�ዊ�ዊ�ዊ�ዊ�ዊ�ዊ�ዊ�ዊ�ዊ�ዊ�ዊ�ዊ�ዊ�ዊ�ዊ�ዊ�ዊ�ዊ�ዊ�ዊ�
ዊ�ዊ�ዊ�ዊ�ዊ�ዊ�ዊ�ዊ�ዊ�ዊ�ዊ�ዊ�ዊ�ዊ�ዊ�ዊ�ዊ�ዊ�ዊ�ዊ�ዊ�ዊ�ዊ�ዊ�ዊ�ዊ�ዊ�ዊ�ዊ�ዊ�ዊ�ዊ�ዊ�ዊ�ዊ�ዊ�
ዊ�ዊ�ዊ�ዊ�ዊ�ዊ�ዊ�ዊ�ዊ�
ዊ�ዊ�ዊ�ዊ�ዊ�ዊ�ዊ�ዊ�ዊ�ዊ�ዊ�ዊ�ዊ�ዊ�ዊ�ዊ�ዊ�ዊ�ዊ�ዊ�ዊ�ዊ�ዊ�ዊ�ዊ�ዊ�ዊ�ዊ�ዊ�ዊ�ዊ�
ዊ�ዊ�ዊ�ዊ�ዊ�ዊ�ዊ�ዊ�ዊ�ዊ�ዊ�ዊ�ዊ�ዊ�ዊ�ዊ�ዊ�ዊ�ዊ�ዊ�
ዊ�ዊ�ዊ�ዊ�ዊ�ዊ�ዊ�ዊ�ዊ�ዊ�ዊ�ዊ�ዊ�ዊ�ዊ�ዊ�ዊ�
ዊ�ዊ�ዊ�ዊ�ዊ�ዊ�ዊ�ዊ�ዊ�ዊ�ዊ�ዊ�ዊ�ዊ�ዊ�ዊ�ዊ�ዊ�ዊ�ዊ�ዊ�ዊ�ዊ�ዊ�ዊ�ዊ�ዊ�ዊ�ዊ�ዊ�ዊ�
ዊ�ዊ�ዊ�ዊ�ዊ�ዊ�ዊ�ዊ�ዊ�ዊ�ዊ�ዊ�ዊ�ዊ�ዊ�ዊ�ዊ�ዊ�ዊ�ዊ�ዊ�ዊ�ዊ�ዊ�ዊ�
ዊ�ዊ�ዊ�ዊ�ዊ�ዊ�ዊ�ዊ�ዊ�ዊ�ዊ�ዊ�ዊ�ዊ�ዊ�ዊ�ዊ�ዊ�ዊ�ዊ�ዊ�ዊ�ዊ�ዊ�ዊ�ዊ�ዊ�ዊ�ዊ�ዊ�ዊ�
ዊ�ዊ�ዊ�
ዊ�ዊ�ዊ�ዊ�ዊ�ዊ�ዊ�ዊ�ዊ�ዊ�ዊ�ዊ�ዊ�ዊ�ዊ�ዊ�ዊ�ዊ�ዊ�ዊ�ዊ�ዊ�ዊ�ዊ�ዊ�ዊ�ዊ�ዊ�ዊ�ዊ�ዊ�ዊ�ዊ�ዊ�ዊ�ዊ�ዊ�ዊ�ዊ�ዊ�ዊ�ዊ�ዊ�ዊ�ዊ�
ዊ�ዊ�ዊ�ዊ�ዊ�ዊ�ዊ�ዊ�ዊ�ዊ�ዊ�ዊ�ዊ�ዊ�ዊ�ዊ�ዊ�ዊ�ዊ�ዊ�ዊ�ዊ�ዊ�ዊ�ዊ�ዊ�ዊ�ዊ�ዊ�
ዊ�ዊ�ዊ�ዊ�ዊ�ዊ�ዊ�ዊ�ዊ�ዊ�ዊ�ዊ�ዊ�ዊ�ዊ�ዊ�ዊ�ዊ�ዊ�ዊ�ዊ�
ዊ�ዊ�ዊ�ዊ�ዊ�ዊ�ዊ�ዊ�ዊ�ዊ�ዊ�ዊ�ዊ�ዊ�ዊ�ዊ�ዊ�ዊ�ዊ�ዊ�ዊ�ዊ�ዊ�ዊ�
ዊ�ዊ�ዊ�ዊ�ዊ�ዊ�ዊ�ዊ�ዊ�ዊ�ዊ�ዊ�ዊ�ዊ�ዊ�ዊ�ዊ�ዊ�ዊ�ዊ�ዊ�ዊ�ዊ�ዊ�ዊ�ዊ�ዊ�ዊ�ዊ�ዊ�ዊ�ዊ�ዊ�ዊ�ዊ�ዊ�ዊ�ዊ�ዊ�ዊ�ዊ�ዊ�ዊ�ዊ�ዊ�ዊ�ዊ�ዊ�ዊ�ዊ�ዊ�ዊ�ዊ�ዊ�ዊ�ዊ�
ዊ�ዊ�ዊ�ዊ�ዊ�ዊ�ዊ�ዊ�ዊ�ዊ�ዊ�ዊ�ዊ�ዊ�ዊ�ዊ�ዊ�ዊ�ዊ�ዊ�ዊ�
ዊ�ዊ�ዊ�ዊ�ዊ�ዊ�ዊ�ዊ�ዊ�ዊ�ዊ�ዊ�ዊ�ዊ�ዊ�ዊ�ዊ�ዊ�ዊ�ዊ�ዊ�ዊ�ዊ�ዊ�ዊ�ዊ�ዊ�ዊ�ዊ�
ዊ�ዊ�ዊ�ዊ�ዊ�ዊ�ዊ�ዊ�ዊ�ዊ�ዊ�ዊ�ዊ�ዊ�ዊ�ዊ�ዊ�ዊ�ዊ�ዊ�ዊ�ዊ�ዊ�ዊ�ዊ�ዊ�ዊ�ዊ�ዊ�ዊ�ዊ�ዊ�ዊ�ዊ�ዊ�
ዊ�ዊ�ዊ�ዊ�ዊ�ዊ�ዊ�ዊ�ዊ�ዊ�ዊ�ዊ�ዊ�ዊ�ዊ�ዊ�ዊ�ዊ�ዊ�ዊ�ዊ�
ዊ�ዊ�ዊ�ዊ�ዊ�ዊ�ዊ�ዊ�ዊ�ዊ�ዊ�ዊ�ዊ�ዊ�ዊ�ዊ�ዊ�ዊ�ዊ�ዊ�ዊ�ዊ�ዊ�ዊ�
ዊ�ዊ�ዊ�ዊ�ዊ�ዊ�ዊ�ዊ�ዊ�ዊ�ዊ�ዊ�ዊ�ዊ�ዊ�ዊ�ዊ�ዊ�ዊ�ዊ�
ዊ�ዊ�ዊ�ዊ�ዊ�ዊ�ዊ�ዊ�ዊ�ዊ�ዊ�ዊ�ዊ�ዊ�ዊ�ዊ�ዊ�ዊ�ዊ�ዊ�ዊ�
ዊ�ዊ�ዊ�ዊ�ዊ�ዊ�ዊ�ዊ�ዊ�ዊ�ዊ�ዊ�ዊ�ዊ�ዊ�ዊ�ዊ�ዊ�ዊ�ዊ�ዊ�ዊ�ዊ�ዊ�ዊ�ዊ�ዊ�
ዊ�ዊ�ዊ�ዊ�ዊ�ዊ�ዊ�ዊ�ዊ�ዊ�ዊ�ዊ�ዊ�ዊ�ዊ�ዊ�ዊ�ዊ�ዊ�ዊ�ዊ�ዊ�ዊ�ዊ�ዊ�ዊ�ዊ�ዊ�ዊ�ዊ�
ዊ�ዊ�ዊ�ዊ�ዊ�ዊ�ዊ�ዊ�ዊ�ዊ�ዊ�ዊ�ዊ�ዊ�ዊ�ዊ�ዊ�ዊ�ዊ�ዊ�ዊ�ዊ�
ዊ�ዊ�ዊ�ዊ�ዊ�ዊ�ዊ�ዊ�ዊ�ዊ�ዊ�ዊ�ዊ�ዊ�ዊ�ዊ�ዊ�ዊ�ዊ�ዊ�ዊ�ዊ�ዊ�ዊ�ዊ�ዊ�ዊ�ዊ�ዊ�ዊ�ዊ�ዊ�ዊ�ዊ�ዊ�ዊ�ዊ�ዊ�ዊ�ዊ�ዊ�ዊ�ዊ�ዊ�ዊ�ዊ�ዊ�ዊ�ዊ�ዊ�ዊ�ዊ�ዊ�ዊ�
ዊ�ዊ�ዊ�ዊ�ዊ�ዊ�ዊ�ዊ�ዊ�ዊ�ዊ�ዊ�ዊ�ዊ�ዊ�ዊ�ዊ�ዊ�ዊ�ዊ�ዊ�ዊ�ዊ�ዊ�ዊ�ዊ�ዊ�ዊ�ዊ�ዊ�ዊ�ዊ�
ዊ�ዊ�ዊ�ዊ�ዊ�ዊ�ዊ�ዊ�ዊ�ዊ�ዊ�ዊ�ዊ�ዊ�ዊ�ዊ�ዊ�ዊ�ዊ�ዊ�ዊ�ዊ�ዊ�ዊ�ዊ�ዊ�ዊ�ዊ�ዊ�ዊ�ዊ�ዊ�ዊ�
ዊ�ዊ�ዊ�ዊ�ዊ�ዊ�ዊ�ዊ�ዊ�ዊ�ዊ�ዊ�
ዊ�ዊ�ዊ�ዊ�ዊ�ዊ�ዊ�ዊ�ዊ�ዊ�ዊ�ዊ�ዊ�ዊ�ዊ�ዊ�ዊ�ዊ�ዊ�ዊ�ዊ�ዊ�ዊ�ዊ�ዊ�ዊ�ዊ�ዊ�ዊ�ዊ�ዊ�
ዊ�ዊ�ዊ�ዊ�ዊ�ዊ�ዊ�ዊ�ዊ�ዊ�ዊ�ዊ�ዊ�ዊ�ዊ�ዊ�ዊ�ዊ�ዊ�ዊ�ዊ�ዊ�---------- ----------
ዊ�ዊ�ዊ�ዊ�ዊ�ዊ�ዊ�ዊ�ዊ�ዊ�ዊ�ዊ�ዊ�ዊ�ዊ�ዊ�ዊ�ዊ� ዊ�ዊ�ዊ�ዊ�ዊ�ዊ�ዊ�ዊ�ዊ�ዊ�ዊ�ዊ�ዊ�ዊ�ዊ�ዊ�ዊ�ዊ�ዊ�ዊ�ዊ�ዊ�ዊ�ዊ� ዊ�ዊ�ዊ�ዊ�ዊ�ዊ�ዊ�ዊ�ዊ�ዊ�ዊ�ዊ�ዊ�ዊ�ዊ�ዊ�ዊ�ዊ�ዊ�ዊ�ዊ�ዊ�ዊ�ዊ�ዊ�ዊ� ዊ�ዊ�ዊ�ዊ�ዊ�ዊ�ዊ�ዊ�ዊ�ዊ�ዊ�ዊ�ዊ�ዊ�ዊ�ዊ�ዊ� ዊ�ዊ�ዊ�ዊ�ዊ�ዊ�ዊ�ዊ�ዊ�ዊ�ዊ�ዊ�ዊ�ዊ�ዊ�ዊ�ዊ�ዊ�ዊ�ዊ�ዊ�ዊ�ዊ�ዊ�ዊ�ዊ�ዊ�ዊ�ዊ� ዊ�ዊ�ዊ�ዊ�ዊ�ዊ�ዊ�ዊ�ዊ�ዊ�ዊ�ዊ�ዊ�ዊ�ዊ�ዊ�ዊ�ዊ�ዊ�ዊ�ዊ�ዊ�ዊ�ዊ�ዊ�
27 of 32
Monday , March 15, 2004
Elsevier
Review Copy
28
Table 2. Sediments’ collection sites, sediment features, and chemical contaminants of each sediment tested in chronic toxicity tests.a, b, c
Chronic Test 1 Chronic Test 2Control SedimentSediment T Sediment P Sediment S1 Sediment S2 Sediment D
Sediments’ collection sitesclean area of the
South margin of Sadoestuary
north margin ofTagus estuary near
the city of VilaFranca de Xira
north margin ofSado estuary
close to a pulpmill effluent
north margin of Sado estuary, near theeffluent of a pesticide and fertilizer plant(S1 collected 25 meters from the effluent,and S2 30 meters upstream from S1)
north margin of Sadoestuary, in a dockyardnearby an urban effluentof the city of Setúbal.
Sediment Type sand mud mud sand sand mudTVS (%) 0.7 11.5 8.7 0.4 0.4 12.7
Metals (µg.g-1 dry wt)Cd BDL 0.31 0.32 0.13 0.12 0.6Cu 0.21 33 85* 14 11 361**
Zn 20 190* 221* 27 62 217*
PAHs and PCBs(ηg.g-1 dry wt)
naphthalene 17 19 41 4 65 5acenaphthylene 3 3 13 BDL 21 5
acenaphtene BDL BDL BDL BDL BDL BDLfluorene BDL BDL 55* 104* 18 13
phenanthrene 74 84 303* 1658** 346* 145anthracene BDL BDL BDL BDL BDL BDL
∑Low mol wt PAHs 94 106 412 1848* 368 168fluoranthene 90 103 785* 1681* 1411* 355
pyrene 122 139 686* 2186* 1088* 359benzo(a)anthracene BDL BDL 490* 1194* 704* 154
chrysene 47 54 401* 1345* 518* 188benzo(b)fluoranthrene b 81 93 970 1390 1596 335benzo(g,h,i)perylene b BDL BDL 492 BDL BDL BDLbenzo(k)fluoranthene b BDL BDL BDL BDL BDL BDL
indeno(1,2,3-cd)pyrene b BDL BDL 525 644 657 BDLdibenzo(a,h)anthracene BDL BDL BDL BDL BDL BDL
benzo(a)pyrene BDL BDL 551* 794* 905* 183∑High mol wt PAHs 340 389 4900* 9779* 6879* 1574
∑Total PAHs 434 495 5312* 11627* 7247* 1742Total PCBs 0.83 0.83 2.51 0.68 0.89 1.78
a BDL = Bellow detection limitb ERL and ERM guidelines not availablec Values above ERL = *; Values above ERM = **
28 of 32
Monday , March 15, 2004
Elsevier
Revie
w C
opy
29
Table 3. Compilation of biomarker responses of Gammarus locusta to tested estuarine sediments.a,b
Chronic Test 1 Chronic Test 2
Sediments
C T P C S1 S2 D
Bioaccumulation (µg.g-1 dry wt)
Cu Zn Cd
59.1±5.0
42.2±5.5
0.21±0.06
53.4±8.1
48.1±11.4
0.18±0.05
63.5±8.5*
53.4±9.3*
0.08±0.02***
42.4±3.9
60.2±9.7
0.61±0.2
44±3.6
52.4±6.5
0.56±0.15
51.3±6.7**
53.9±5.7
0.89±0.29*
70.0±11.4***
78.9±0.2
0.25±0.11***
Metallothionein (mg.g-1dry wt)
1.4±0.1
1.2±0.3
1.2±0.3
1.4±0.1
1.6±0.1
1.5±0.4
1.8±0.2*
Strand Breakage
Ln TSB
27.9±5.6
26.6±8.5
28.5±7.4
27.1±8.1
21.8±7.3**
16.3±5.4***
19.8±4.9***
Ln DSB
38.3±6.3
40.3±8.7
36.3±6.0
48.0±10.8 45.3±12.1 43.9±12.9 48.1±11.5
RNTSB 0.12±0.67
0.55±0.37
0.15±0.96
0.65±1.8
1.41±1.64
3.34±2.12***
1.70±1.44*
RNSSB -0.009±0.92 0. 59±2.17 -0.27±1.23 0.54±1.50 1.081±1.56 2.70±2.34*** 1.79±1.78**
Lipid peroxidation (ηmol MDA g-1 wet wt.)
13.5±0.8
19.3± 2.9*** 17.9±2.2**
24.4±2.9
33.1±2.7*** 27.7±5.6
24.9±4.1
a Ln TSB and Ln DSB - average molecular length of total and double strand breakage, respectively; RNTSB and RNSSB – relative number of total and single strand breakage, respectively. b Asterisks indicate significant effects compared with control: * = p< 0.1; ** = p< 0.05; *** = p< 0.01.
29 of 32
Monday , March 15, 2004
Elsevier
Review Copy
30
Table 4. Weight-of-evidence tabular interpretation matrix of toxicity of sediments from Sado and Tagus estuaries analysed in this study. Matrix andordinal ranking scheme (see Table 1) based upon Chapman et al. (2002).a,b
a Chemistry data refers to full non-diluted sedimentsb ? = Inconclusive results - see Costa et al. (submitted this issue) for discussion
ዊ�ዊ�ዊ�ዊ�ዊ�ዊ�ዊ�ዊ�ዊ�ዊ�ዊ�ዊ�ዊ� ዊ�ዊ�ዊ�ዊ�ዊ�ዊ�ዊ�ዊ�ዊ�ዊ�ዊ�ዊ�ዊ�ዊ�ዊ�ዊ�ዊ�ዊ�ዊ�ዊ�ዊ�ዊ�ዊ�ዊ�ዊ�ዊ�ዊ�ዊ�ዊ�ዊ�ዊ�ዊ�
↓ዊ�ዊ�ዊ�ዊ�ዊ�ዊ�ዊ�ዊ�ዊ�ዊ�ዊ�ዊ�ዊ�ዊ�ዊ�ዊ�ዊ�ዊ�ዊ�ዊ�ዊ�ዊ�ዊ�ዊ�ዊ�ዊ�ዊ�ዊ�ዊ�ዊ�ዊ�ዊ�ዊ�ዊ�ዊ�ዊ�ዊ�ዊ�ዊ�ዊ�ዊ�ዊ�ዊ�ዊ�ዊ�ዊ�ዊ�ዊ�ዊ�→
ዊ�ዊ�ዊ�ዊ�ዊ�ዊ�ዊ�ዊ�
ዊ�
ዊ�ዊ�ዊ�ዊ�ዊ�ዊ�ዊ�ዊ�
ዊ�
ዊ�ዊ�ዊ�ዊ�ዊ�ዊ�ዊ�ዊ�ዊ�
ዊ�ዊ�
ዊ�ዊ�ዊ�ዊ�ዊ�ዊ�ዊ�ዊ�
ዊ�ዊ�
ዊ�ዊ�ዊ�ዊ�ዊ�ዊ�ዊ�ዊ�
ዊ�
ዊ�ዊ�ዊ�ዊ�ዊ�ዊ�ዊ�ዊ�ዊ�ዊ�ዊ�ዊ�ዊ�ዊ�ዊ�ዊ�ዊ�ዊ�ዊ�ዊ�ዊ�ዊ�ዊ�ዊ�ዊ�ዊ�ዊ�ዊ�ዊ�ዊ�ዊ�ዊ�ዊ� �ዊ� � ዊ� � � ዊ� � ዊ� � � ዊ� �ዊ� � � ዊ� �ዊ� � �� ዊ� � ዊ� �
ዊ�ዊ�ዊ�ዊ�ዊ�ዊ�ዊ�ዊ�ዊ�ዊ�ዊ�ዊ�ዊ�ዊ�ዊ�ዊ�ዊ�ዊ�ዊ�ዊ� ዊ�ዊ�ዊ�ዊ�ዊ�ዊ�ዊ�ዊ�ዊ�ዊ�ዊ�� ዊ�ዊ�ዊ�ዊ�ዊ�ዊ�ዊ�ዊ�ዊ�ዊ�ዊ��ዊ�ዊ�ዊ�ዊ�ዊ�ዊ�ዊ�ዊ�ዊ�ዊ�ዊ�ዊ���ዊ�ዊ�ዊ�ዊ�ዊ�ዊ�ዊ�ዊ�ዊ�ዊ�ዊ�ዊ�ዊ��
ዊ�ዊ�ዊ�ዊ�ዊ�ዊ�ዊ�ዊ�ዊ�ዊ�ዊ���ዊ�ዊ�ዊ� ዊ�ዊ�ዊ�ዊ�ዊ�ዊ�ዊ�ዊ� �
ዊ�ዊ�ዊ�ዊ�ዊ�ዊ�ዊ�ዊ�ዊ�ዊ�ዊ��
ዊ�ዊ�ዊ�ዊ�ዊ�ዊ�ዊ�ዊ�ዊ�ዊ�ዊ�ዊ�ዊ�ዊ�ዊ�ዊ�ዊ�ዊ�ዊ�ዊ�ዊ�ዊ�ዊ�ዊ� ዊ�ዊ�ዊ�ዊ�ዊ�ዊ�ዊ�ዊ�ዊ�ዊ�ዊ�ዊ�ዊ�ዊ� ዊ�ዊ�ዊ�ዊ�ዊ�ዊ�ዊ�ዊ�ዊ�ዊ�ዊ�ዊ�ዊ�ዊ� ዊ�ዊ�ዊ�ዊ�ዊ�ዊ�ዊ�ዊ�ዊ�ዊ�ዊ�ዊ�ዊ�ዊ� ዊ�ዊ�ዊ�ዊ�ዊ�ዊ�ዊ�ዊ�ዊ�ዊ�ዊ�ዊ�ዊ�ዊ� ዊ�ዊ�ዊ�ዊ�ዊ�ዊ�ዊ�ዊ�ዊ�ዊ�ዊ�ዊ�ዊ�ዊ�
ዊ�ዊ�ዊ�ዊ�ዊ�ዊ�ዊ�ዊ�ዊ�ዊ�ዊ�ዊ�ዊ�ዊ�ዊ�ዊ�ዊ�ዊ�ዊ�ዊ�ዊ�ዊ�ዊ�ዊ�ዊ�ዊ�ዊ�ዊ�ዊ�ዊ� � ዊ� � ዊ� � � ዊ� � ዊ� ○○ � ዊ� � ዊ� � �ዊ� � ዊ� � ��ዊ� � ዊ� ○○ዊ�ዊ�ዊ�ዊ�ዊ�ዊ�ዊ�ዊ�ዊ�ዊ�ዊ�ዊ�ዊ�ዊ�ዊ�ዊ�ዊ�ዊ�ዊ�ዊ�ዊ�ዊ�ዊ�ዊ�ዊ� � ዊ� �� ዊ� � � ዊ� � ዊ� � � ዊ� �� ዊ� � � ዊ� � ዊ� �� � ዊ� � ዊ� ��
ዊ�ዊ�ዊ�ዊ�ዊ�ዊ�ዊ�ዊ�ዊ�ዊ�ዊ�ዊ�ዊ�ዊ�ዊ�ዊ�ዊ�ዊ�ዊ�ዊ�ዊ�ዊ�ዊ�ዊ�ዊ�ዊ�ዊ�ዊ�ዊ�ዊ�ዊ�
ዊ�ዊ�ዊ�ዊ�ዊ�ዊ�ዊ�ዊ�ዊ�ዊ�ዊ�ዊ�ዊ�ዊ�ዊ�ዊ�ዊ�ዊ�ዊ�ዊ�ዊ�ዊ�ዊ�ዊ�ዊ�ዊ�ዊ�ዊ�ዊ�ዊ�ዊ�ዊ�ዊ�ዊ�ዊ�ዊ�ዊ�ዊ�ዊ�ዊ�ዊ�
ዊ�ዊ�ዊ�ዊ�ዊ�ዊ�ዊ�ዊ�ዊ�ዊ�ዊ�ዊ�ዊ�ዊ�ዊ�ዊ�ዊ�ዊ�ዊ�ዊ�ዊ�ዊ�ዊ�ዊ�ዊ�ዊ�ዊ�ዊ�ዊ�ዊ�ዊ�ዊ�ዊ�ዊ�ዊ�ዊ�ዊ�� ዊ� ○○ ዊ� ○ � ዊ� ○○ ዊ� ○○ � ዊ� ○ ዊ� ○ � ዊ� ? ዊ� � �� ዊ� ? ዊ� �
ዊ�ዊ�ዊ�ዊ�ዊ�ዊ�ዊ�ዊ�ዊ�ዊ�ዊ�ዊ�ዊ�ዊ�ዊ�ዊ�ዊ�ዊ�ዊ�ዊ�ዊ�ዊ�ዊ�ዊ�ዊ�ዊ�ዊ�
ዊ�ዊ�ዊ�ዊ�ዊ�ዊ�ዊ�ዊ�ዊ�ዊ�ዊ�ዊ�ዊ�ዊ�ዊ�ዊ�ዊ�ዊ�ዊ�ዊ�ዊ�ዊ�ዊ�ዊ�ዊ� �� �� �� ዊ�ዊ�
ዊ�ዊ�ዊ�ዊ�ዊ�ዊ�ዊ�ዊ�ዊ�ዊ�ዊ�ዊ�ዊ�ዊ�ዊ�ዊ�ዊ�ዊ�ዊ�ዊ�ዊ�
ዊ�ዊ�ዊ�ዊ�ዊ�ዊ�ዊ�ዊ�
ዊ�ዊ�ዊ�ዊ�ዊ�ዊ�ዊ�ዊ�ዊ�ዊ�ዊ�ዊ�ዊ�ዊ�ዊ�ዊ�ዊ�ዊ�ዊ�ዊ�ዊ�ዊ�ዊ�ዊ�ዊ�ዊ�ዊ�ዊ�ዊ�ዊ�ዊ�ዊ�ዊ�ዊ�ዊ�ዊ�ዊ�
ዊ�ዊ�ዊ�ዊ�ዊ�ዊ�ዊ�ዊ�ዊ�ዊ�ዊ�ዊ�ዊ�ዊ�ዊ�ዊ�ዊ�ዊ�ዊ�ዊ�ዊ�ዊ�ዊ�ዊ�ዊ�ዊ�ዊ�
ዊ�ዊ�ዊ�ዊ�ዊ�ዊ�ዊ�ዊ�ዊ�ዊ�ዊ�ዊ�ዊ�ዊ�ዊ�ዊ�ዊ�ዊ�ዊ�ዊ�ዊ�ዊ�ዊ�ዊ�ዊ�ዊ�ዊ�ዊ�ዊ�
ዊ�ዊ�ዊ�ዊ�ዊ�ዊ�ዊ�ዊ�ዊ�ዊ�ዊ�ዊ�ዊ�ዊ�ዊ�ዊ�ዊ�ዊ�ዊ�ዊ�ዊ�ዊ�ዊ�ዊ�ዊ�ዊ�ዊ�ዊ�ዊ�ዊ�ዊ�ዊ�ዊ�
ዊ�ዊ�ዊ�ዊ�ዊ�ዊ�ዊ�ዊ�ዊ�ዊ�ዊ�ዊ�ዊ�ዊ�ዊ�ዊ�ዊ�ዊ�ዊ�ዊ�ዊ�
ዊ�ዊ�ዊ�ዊ�ዊ�ዊ�ዊ�ዊ�ዊ�ዊ�ዊ�ዊ�ዊ�ዊ�ዊ�ዊ�ዊ�ዊ�ዊ�ዊ�ዊ�ዊ�ዊ�ዊ�ዊ�ዊ�ዊ�ዊ�ዊ�
ዊ�ዊ�ዊ�ዊ�ዊ�ዊ�ዊ�ዊ�ዊ�ዊ�ዊ�ዊ�ዊ�ዊ�ዊ�ዊ�ዊ�ዊ�ዊ�ዊ�ዊ�ዊ�ዊ�ዊ�ዊ�ዊ�ዊ�ዊ�ዊ�
ዊ�ዊ�ዊ�ዊ�ዊ�ዊ�ዊ�ዊ�ዊ�ዊ�ዊ�ዊ�ዊ�ዊ�ዊ�ዊ�ዊ�ዊ�ዊ�
ዊ�ዊ�ዊ�ዊ�ዊ�ዊ�ዊ�ዊ�ዊ�ዊ�ዊ�ዊ�ዊ�ዊ�ዊ�ዊ�ዊ�ዊ�ዊ�ዊ�ዊ�ዊ�
ዊ�ዊ�ዊ�ዊ�ዊ�ዊ�ዊ�ዊ�ዊ�ዊ�ዊ�ዊ�ዊ�ዊ�ዊ�
ዊ�ዊ�ዊ�ዊ�ዊ�ዊ�ዊ�ዊ�ዊ�ዊ�ዊ�ዊ�ዊ�ዊ�ዊ�ዊ�ዊ�ዊ�ዊ�ዊ�ዊ�ዊ�
ዊ�ዊ�ዊ�ዊ�ዊ�ዊ�ዊ�ዊ�ዊ�ዊ�ዊ�ዊ�ዊ�ዊ�ዊ�
ዊ�ዊ�ዊ�ዊ�ዊ�ዊ�ዊ�ዊ�ዊ�ዊ�ዊ�ዊ�ዊ�ዊ�ዊ�ዊ�ዊ�ዊ�ዊ�ዊ�ዊ�ዊ�ዊ�ዊ�
ዊ�ዊ�ዊ�ዊ�ዊ�ዊ�ዊ�ዊ�ዊ�ዊ�ዊ�ዊ�ዊ�ዊ�ዊ�ዊ�ዊ�
30 of 32
Monday , March 15, 2004
Elsevier
Revie
w C
opy
31
Figures Captions
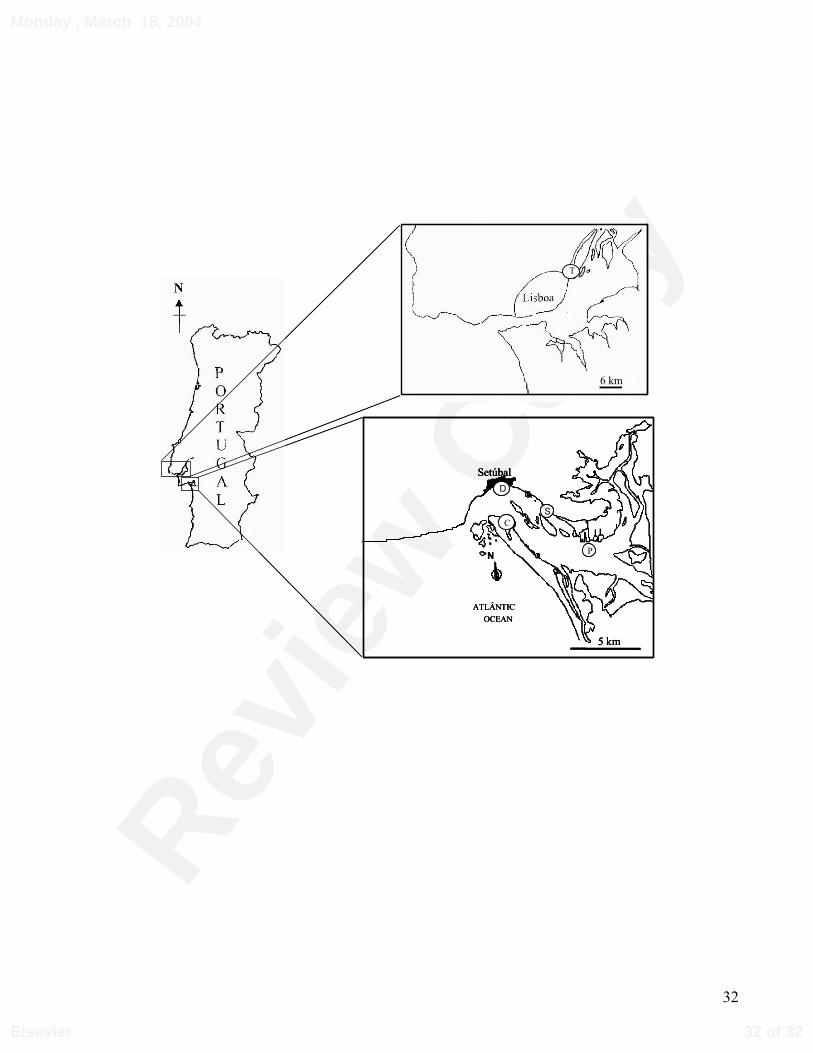
Figure 1. Sediments’ sampling sites in Tagus (above) and Sado (below) estuaries. The sediments
from Sado estuary were labelled as C, D, P and S (location for sediments S1 and S2) and the
sediment from Tagus estuary as T.
31 of 32
Monday , March 15, 2004
Elsevier
Revie
w C
opy
32
Setúbal
N
5 km
C
OCEAN ATLÂNTIC
Sado Estuary
S
D
6 km
P
T
6 km
Setúbal
N
5 km
C
OCEAN ATLÂNTIC
Sado Estuary
S
DSetúbal
N
5 km
C
OCEAN ATLÂNTIC
Sado Estuary
S
D
6 km
P
T
6 km
32 of 32
Monday , March 15, 2004
Elsevier