Embed Size (px)
Citation preview

ToxiciTy in california WaTers: san francisco Bay region
Brian Anderson
Bryn Phillips
Dan Markiewicz
Marie Stillway
August 2012
www.waterboards.ca.gov/swamp

August 2012
Toxicity in California Waters: San Francisco Bay Region
Page i
www.waterboards.ca.gov/swamp
AcknowleDgeMenTS
The authors thank Karen Taberski of the San Francisco Bay Regional Board. We are grateful for the services
provided by the field crews, laboratory and data management staff who participated in this project. Funding
was provided by the Surface Water Ambient Monitoring Program.

August 2012
Toxicity in California Waters: San Francisco Bay Region
Page ii
www.waterboards.ca.gov/swamp
TABLE OF CONTENTS TOC
Acknowledgements . . . . . . . . . . . . . . . . . . . . . . . . . . . . . . . . . . . . . . . . i
Table of Contents . . . . . . . . . . . . . . . . . . . . . . . . . . . . . . . . . . . . . . . . . ii
Tables and Figures . . . . . . . . . . . . . . . . . . . . . . . . . . . . . . . . . . . . . . . . iii
Executive Summary. . . . . . . . . . . . . . . . . . . . . . . . . . . . . . . . . . . . . . . . .1
Section 1: Introduction . . . . . . . . . . . . . . . . . . . . . . . . . . . . . . . . . . . . . . .3
Section 2: Scope and Methodology . . . . . . . . . . . . . . . . . . . . . . . . . . . . . . .5
Section 3: Regional Toxicity . . . . . . . . . . . . . . . . . . . . . . . . . . . . . . . . . . . .7Relative Toxicity Using Different Test Protocols . . . . . . . . . . . . . . . . . . . . . . . . . . . . . . . . . . . . . . .8
Section 4: Relationships between Land Use and Toxicity. . . . . . . . . . . . . . . . . . 11
Section 5: Geographical Patterns in Toxicity . . . . . . . . . . . . . . . . . . . . . . . . . 13Freshwater and Freshwater Sediment Toxicity . . . . . . . . . . . . . . . . . . . . . . . . . . . . . . . . . . . . . . . 13
Marin, Sonoma and San Francisco Counties . . . . . . . . . . . . . . . . . . . . . . . . . . . . . . . . . . . . . 13
Napa, Solano and Northern Contra Costa Counties . . . . . . . . . . . . . . . . . . . . . . . . . . . . . . . . 13
San Mateo, Santa Clara, Alameda and Western Contra Costa Counties . . . . . . . . . . . . . . . . . . 14
Marine Sediment Toxicity . . . . . . . . . . . . . . . . . . . . . . . . . . . . . . . . . . . . . . . . . . . . . . . . . . . . . . 14
Suisun Bay, Sacramento River and San Joaquin River . . . . . . . . . . . . . . . . . . . . . . . . . . . . . . 14
San Pablo Bay . . . . . . . . . . . . . . . . . . . . . . . . . . . . . . . . . . . . . . . . . . . . . . . . . . . . . . . . . . . 14
San Francisco Bay . . . . . . . . . . . . . . . . . . . . . . . . . . . . . . . . . . . . . . . . . . . . . . . . . . . . . . . . 14
Section 6: Causes of Toxicity . . . . . . . . . . . . . . . . . . . . . . . . . . . . . . . . . . 16Freshwater . . . . . . . . . . . . . . . . . . . . . . . . . . . . . . . . . . . . . . . . . . . . . . . . . . . . . . . . . . . . . . . . 16
Freshwater Sediment . . . . . . . . . . . . . . . . . . . . . . . . . . . . . . . . . . . . . . . . . . . . . . . . . . . . . . . . . 17
Marine Sediment . . . . . . . . . . . . . . . . . . . . . . . . . . . . . . . . . . . . . . . . . . . . . . . . . . . . . . . . . . . . 18
Section 7: Ecological Impacts Associated with Toxic Waters . . . . . . . . . . . . . . . 19Freshwater Habitats . . . . . . . . . . . . . . . . . . . . . . . . . . . . . . . . . . . . . . . . . . . . . . . . . . . . . . . . . . 19
Marine Habitats . . . . . . . . . . . . . . . . . . . . . . . . . . . . . . . . . . . . . . . . . . . . . . . . . . . . . . . . . . . . . 20
Section 8: Monitoring Recommendations . . . . . . . . . . . . . . . . . . . . . . . . . . . 21
References . . . . . . . . . . . . . . . . . . . . . . . . . . . . . . . . . . . . . . . . . . . . . 36

August 2012
Toxicity in California Waters: San Francisco Bay Region
Page iii
www.waterboards.ca.gov/swamp
TABLE OF CONTENTS TOC
List of Tables
Table 1. Source programs, water and sediment toxicity test counts and test dates for
San Francisco Bay regional toxicity data included in this report. . . . . . . . . . . . . . . . . . . . . . . . . . . .4
Table 2. Data conditions used to determine toxicity categories for any given sample
collection site. . . . . . . . . . . . . . . . . . . . . . . . . . . . . . . . . . . . . . . . . . . . . . . . . . . . . . . . . . . . . . . .6
Table 3. Species-specific maximum levels of toxicity observed at sites tested with E. estuarius,
H. azteca and M. galloprovincialis sediment toxicity tests, and C. dubia, P. promelas and
P. subcapitata water column toxicity tests. . . . . . . . . . . . . . . . . . . . . . . . . . . . . . . . . . . . . . . . . . .8
List of Figures
Figure 1. Magnitude of toxicity in water and sediment samples in the San Francisco Bay
Region of California. . . . . . . . . . . . . . . . . . . . . . . . . . . . . . . . . . . . . . . . . . . . . . . . . . . . . . . . . . .7
Figure 2. Magnitude of toxicity to individual freshwater species in water samples from the
San Francisco Bay Region of California. . . . . . . . . . . . . . . . . . . . . . . . . . . . . . . . . . . . . . . . . . . . .9
Figure 3. Magnitude of toxicity to individual marine species in sediment samples from the
San Francisco Bay Region of California. . . . . . . . . . . . . . . . . . . . . . . . . . . . . . . . . . . . . . . . . . . . 10
Figure 4. Water column toxicity (a) and sediment toxicity (b) at sites over a range of urban
land use intensity. Lower values represent lower levels of survival, and indicate higher toxicity.
Water toxicity data represent the most sensitive test species at each site. Black circles represent
nontoxic sites, while white circles represent sites found to be toxic on at least one occasion. . . . . . 11
Figure 5. Magnitude of freshwater toxicity at sites in the San Francisco Bay Region of California
based on the most sensitive species (test endpoint) in water samples collected at each site. . . . . . . 12
Figure 6. Magnitude of sediment toxicity at sites in the San Francisco Bay Region of California
based on the most sensitive species (test endpoint) in water samples collected at each site. . . . . . . 23

August 2012
Toxicity in California Waters: San Francisco Bay Region
Page iv
www.waterboards.ca.gov/swamp
TABLE OF CONTENTS TOC
Figure 7. Magnitude of freshwater toxicity at sites in Marin, Sonoma and San Francisco Counties
in the San Francisco Bay Region of California, based on the most sensitive species (test endpoint)
in water samples collected at each site. . . . . . . . . . . . . . . . . . . . . . . . . . . . . . . . . . . . . . . . . . . . . 24
Figure 8. Magnitude of sediment toxicity at sites in Marin, Sonoma32 and San Francisco Counties
in the San Francisco Bay Region of California, based on the most sensitive species (test endpoint)
in water samples collected at each site. . . . . . . . . . . . . . . . . . . . . . . . . . . . . . . . . . . . . . . . . . . . . 25
Figure 9. Magnitude of freshwater toxicity at sites in Napa, Solano, and northern Contra Costa
Counties in the San Francisco Bay Region of California, based on the most sensitive species
(test endpoint) in water samples collected at each site. . . . . . . . . . . . . . . . . . . . . . . . . . . . . . . . . 26
Figure 10. Magnitude of sediment toxicity at sites in Napa, Solano, and northern Contra Costa
Counties in the San Francisco Bay Region of California, based on the most sensitive species
(test endpoint) in water samples collected at each site. . . . . . . . . . . . . . . . . . . . . . . . . . . . . . . . . 27
Figure 11. Magnitude of freshwater toxicity at sites in the northern East Bay area of the
San Francisco Bay Region of California based on the most sensitive species (test endpoint)
in water samples collected at each site. . . . . . . . . . . . . . . . . . . . . . . . . . . . . . . . . . . . . . . . . . . . . 28
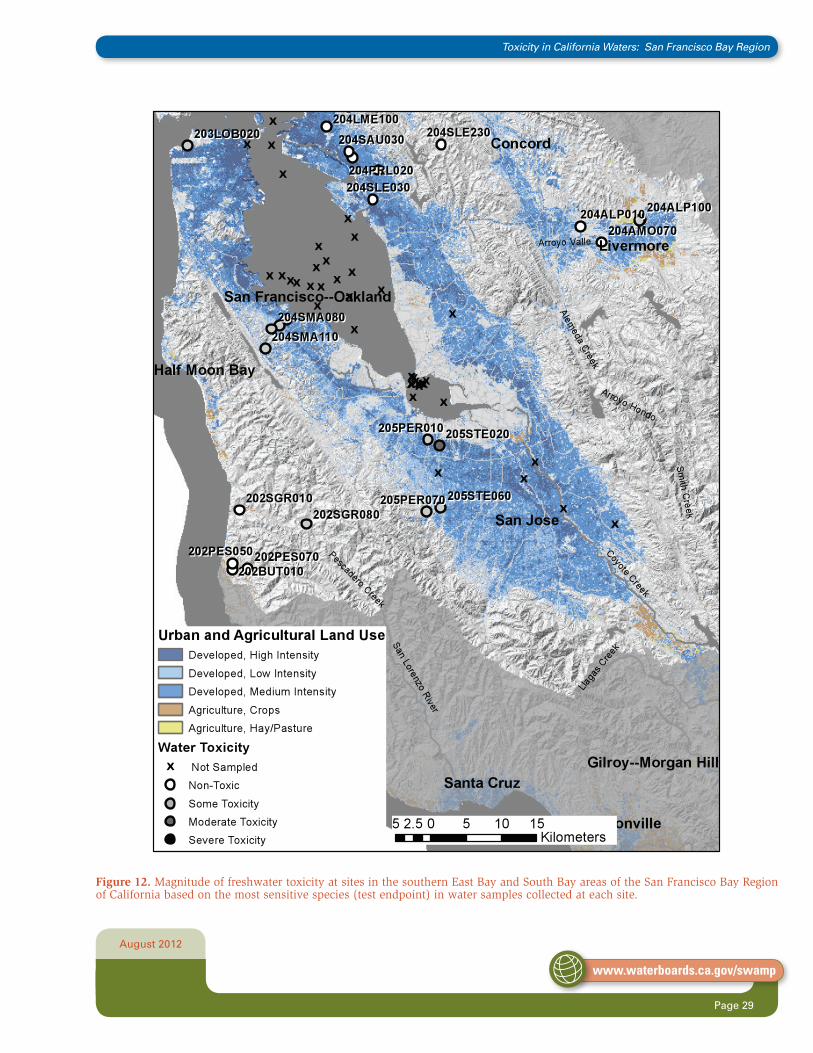
Figure 12. Magnitude of freshwater toxicity at sites in the southern East Bay and South Bay
areas of the San Francisco Bay Region of California based on the most sensitive species
(test endpoint) in water samples collected at each site. . . . . . . . . . . . . . . . . . . . . . . . . . . . . . . . . 29
Figure 13. Magnitude of sediment toxicity at sites in the southern East Bay and South Bay
areas of the San Francisco Bay Region of California based on the most sensitive species
(test endpoint) in water samples collected at each site. . . . . . . . . . . . . . . . . . . . . . . . . . . . . . . . . 30
Figure 14. Magnitude of sediment toxicity at sites in Suisun Bay in the San Francisco Bay
Region of California based on the most sensitive species (test endpoint) in water samples
collected at each site. . . . . . . . . . . . . . . . . . . . . . . . . . . . . . . . . . . . . . . . . . . . . . . . . . . . . . . . . . 31
Figure 15. Magnitude of sediment toxicity at sites in San Pablo Bay in the San Francisco Bay
Region of California based on the most sensitive species (test endpoint) in water samples
collected at each site. . . . . . . . . . . . . . . . . . . . . . . . . . . . . . . . . . . . . . . . . . . . . . . . . . . . . . . . . . 32

August 2012
Toxicity in California Waters: San Francisco Bay Region
Page v
www.waterboards.ca.gov/swamp
TABLE OF CONTENTS TOC
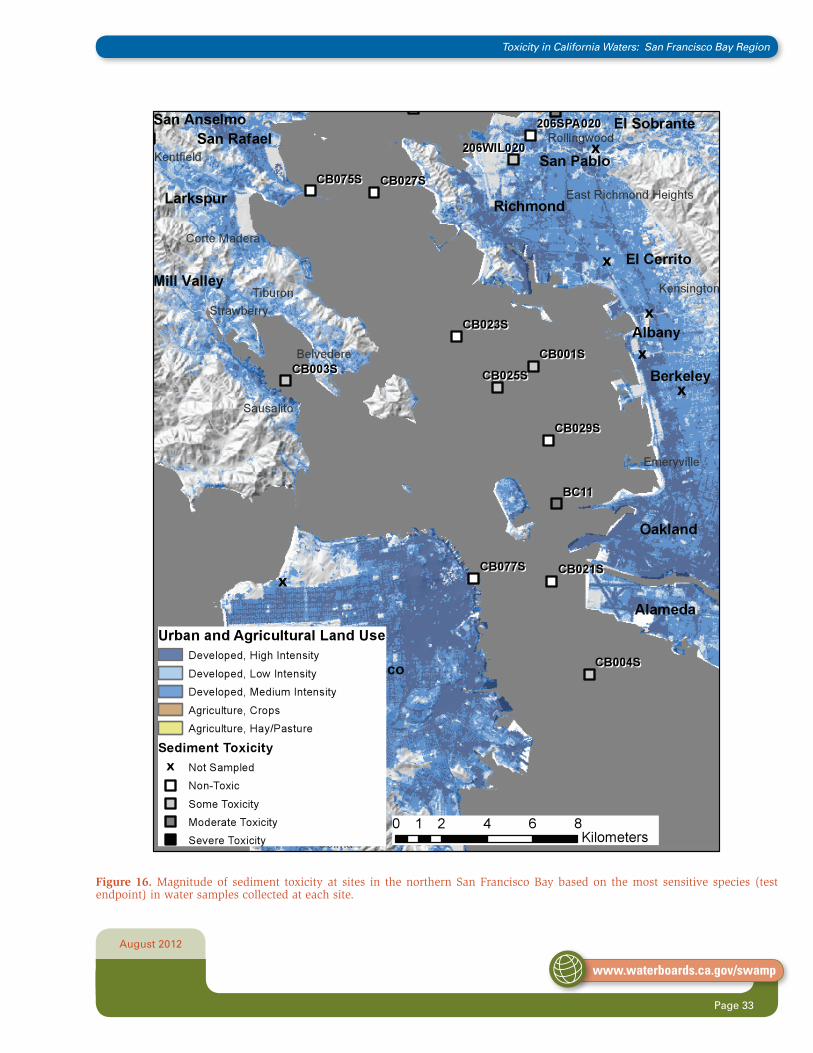
Figure 16. Magnitude of sediment toxicity at sites in the northern San Francisco Bay based
on the most sensitive species (test endpoint) in water samples collected at each site. . . . . . . . . . . 33
Figure 17. Magnitude of sediment toxicity at sites in the central San Francisco Bay based
on the most sensitive species (test endpoint) in water samples collected at each site. . . . . . . . . . . 34
Figure 18. Magnitude of sediment toxicity at sites in the southern San Francisco Bay based
on the most sensitive species (test endpoint) in water samples collected at each site. . . . . . . . . . . 35

August 2012
Toxicity in California Waters: San Francisco Bay Region
Page 1
www.waterboards.ca.gov/swamp
Toxicity testing has been used to assess effluent and surface water quality in California since the mid-1980s. When combined with chemical analyses and other water quality measures, results of toxicity tests provide information regarding the capacity of water bodies to support aquatic life beneficial uses. This report summarizes the findings of monitoring conducted by the Surface Water Ambient Monitoring Program (SWAMP) and associated programs between 2001 and 2010.
execUTiVe sUMMary e
As in Anderson et al. (2011), the majority of data presented in this report were obtained from monitoring
studies designed to increase understanding of potential biological impacts from human activities. As
such, site locations were generally targeted in lower watershed areas, such as tributary confluences
or upstream and downstream of potential pollutant sources. Only a minority of sites was chosen
probabilistically (i.e., at random). Therefore, these data only characterize the sites monitored and cannot
be used to make assumptions about unmonitored areas.
Freshwater, freshwater sediment and marine sediment toxicity was common in the San Francisco Bay
Region between 2001 and 2010. Freshwater and freshwater sediment toxicity were equally common,
but freshwater sediment toxicity tests demonstrated a higher magnitude of toxicity Thirty-seven percent
(37%) of sampling sites showed some freshwater toxicity, with 6% of sites showing moderate freshwater
toxicity. Forty-percent (40%) of sites showed some freshwater sediment toxicity, with 27% of sites
showing some toxicity to moderate toxicity, and 13% showing severe toxicity. Observations of
freshwater water and sediment toxicity in the San Francisco Bay Region were somewhat lower than
those observed statewide.
Marine sediment toxicity was both more common and of greater magnitude than toxicity measured at
freshwater sites: 74% of marine sites showed sediment toxicity, with 51% of sites showing some toxicity
to moderate toxicity, and 22% of sites showing severe toxicity. The frequency and intensity of toxicity
detections varied markedly between test species.
None of the freshwater sites examined in the San Francisco Bay Region between 2001 and 2010 showed
high water toxicity. Toxicity to C. dubia was observed rarely (2% of sites), while toxicity to P. promelas
and P. subcapitata was more common (19% and 25%, respectively). All toxicity to fish (P. promelas)
was of low magnitude.
Sediment toxicity was common at freshwater sites in the San Francisco Bay Region during 2001 - 2010.
Forty percent of the sites demonstrated some degree of sediment toxicity, and 17% were moderately

August 2012
Toxicity in California Waters: San Francisco Bay Region
Page 2
www.waterboards.ca.gov/swamp
toxic. A relatively high percent of sites tested for sediment toxicity were highly toxic to the amphipod
Hyalella azteca.
Marine sediment toxicity was found to be more common and of a higher magnitude than toxicity at
freshwater sites, particularly as measured by tests using the bivalve M. galloprovincialis. Sixty-four percent
(64%) of sites showed some toxicity to M. galloprovincialis, compared to 40% of sites toxic to E. estuarius,
and 25% of sites showed moderate to high toxicity to M. galloprovincialis, while only 4% of sites showed
this degree of toxicity to E. estuarius.
All water and sediment samples collected at sites with the lower intensities of urban land use were non-
toxic, while a number of the sites with moderately to very intense urban land use showed some toxicity in at
least one sample, and the maximum intensity of water and sediment toxicity increased with increasing urban
land use. The probability of observing water or sediment toxicity increased along with the intensity of urban
land use (Logistic regression models; Water toxicity: P = 0.0053; Sediment toxicity: P = 0.0267).
As discussed in Anderson et al. (2011), the principal approach to determine whether observations of
toxicity in laboratory toxicity tests are indicative of ecological impacts in receiving waters has been to
conduct field bioassessments of macroinvertebrate communities. These studies have included “triad”
assessments of chemistry, toxicity and macroinvertebrate communities, the core components of SWAMP.
One recommendation for future SWAMP monitoring is to conduct further investigations on the linkages
between surface water toxicity and receiving system impacts on biological communities.

August 2012
Toxicity in California Waters: San Francisco Bay Region
Page 3
www.waterboards.ca.gov/swamp
The California State Water Resources Control Board recently summarized a decade of surface water toxicity monitoring from the Surface Water Ambient Monitoring Program (SWAMP) (Anderson et al., 2011; http://www.waterboards.ca.gov/water_issues/programs/swamp/reports.shtml). This report reviewed statewide trends in water and sediment toxicity collected as part of routine SWAMP monitoring activities in the nine California water quality control board regions, as well as data from associated programs reported to the California Environmental Data Exchange Network (CEDEN) database. The report also provided information on likely causes and ecological impacts associated with toxicity, and management initiatives that are addressing key contaminants of concern. The current report summarizes a subset of the statewide database that is relevant to the San Francisco Bay Region (Region 2).
SECTIONINTRODUCTION 1
The San Francisco Bay Region comprises 4,603 square miles and approximately one quarter of this
area is dominated by the San Francisco Bay Estuary. The Estuary conveys waters from the Sacramento
and San Joaquin Rivers and is the largest estuary on the west coast of the United States. The San
Francisco Bay system provides the only drainage outlet for waters of the Central Valley, and the
thousands of square miles of rivers draining through the Central Valley (Region 5) are funneled through
the Sacramento-San Joaquin River delta as it enters the northern San Francisco Estuary. The San
Francisco Bay Region is the fourth largest metropolitan area in the country and includes all or major
portions of Alameda, Contra Costa, Marin, Napa, San Francisco, San Mateo, Santa Clara, Solano, and
Sonoma counties. These counties contain numerous creeks and rivers that drain into the Regions seven
management basins: the Marin Coastal, San Mateo Coastal, and Central Basins (Central San Francisco
Estuary); the Santa Clara and South Bay Basins (Southern San Francisco Estuary), and the Suisun and
San Pablo Basins (Northern San Francisco Estuary). In addition to monitoring conducted in the San
Francisco Estuary as part of the San Francisco Estuary Institute’s Regional Monitoring Program, SWAMP
monitoring has been conducted in a number of the creeks and rivers in the seven planning basins.
SWAMP’s Stream Pollution Trends monitoring program (SPoT) has also been conducting sediment
contamination and toxicity surveys in eleven creeks in Region 2 since 2008. Source programs, test count
and sample date ranges are outlined in Table 1.

August 2012
Toxicity in California Waters: San Francisco Bay Region
Page 4
www.waterboards.ca.gov/swamp
Table 1Source programs, water and sediment toxicity test counts and test dates for
San Francisco Bay regional toxicity data included in this report.
Toxicity Test Type Program Test Count Sample Date Range
Water Column SWAMP 337 9/18/01 – 2/16/06
Sediment
Regional Monitoring Program for Water Quality 220 7/27/04 – 8/29/07
Statewide Urban Pyrethroid Monitoring 16 12/28/06 – 1/3/07
Stream Pollution Trends (SPoT) 10 6/17/08 – 8/13/08
Other SWAMP 13 9/18/01 – 6/19/02

August 2012
Toxicity in California Waters: San Francisco Bay Region
Page 5
www.waterboards.ca.gov/swamp
This study examined all toxicity data included in the SWAMP and CEDEN databases from toxicity tests whose controls showed acceptable performance according to the Measurement Quality Objectives of the 2008 SWAMP Quality Assurance Project Plan (QAPrP). The attached maps (Figures 5-18) show locations of sites sampled for toxicity by SWAMP and partner programs and the intensity of toxicity observed in the sediment samples collected at those sites. Sites are color-coded using the categorization process described in Anderson et al. (2011), which combines the results of all toxicity tests performed on samples collected at a site to quantify the magnitude and frequency of toxicity observed there.
SECTIONSCOpE aND METhODOlOgy2
Toxicity test results reported in the San Francisco Bay Region included freshwater exposures
of the cladoceran Ceriodaphnia dubia, the fathead minnow Pimephales promelas and the alga
Pseudokirchneriella subcapitata (formerly known as Selenastrum capricornutum). Freshwater sediment
samples were tested using the amphipod Hyalella azteca. Marine sediment samples were tested using
the amphipod Eohaustorius estuarius and the bivalve Mytilus galloprovincialis. Only survival endpoints
and algal growth are considered in the measures of toxicity reported here; sublethal endpoints are not
included, except in the case of bivalve development using M. galloprovincialis. The endpoint for this test
considers all but normally developed embryos to be dead. All sites identified as toxic therefore showed a
significant decrease in test animal survival or algal growth in one or more samples. A variety of species
were used to test ecotoxicological effects across a range of trophic levels and to examine organisms
vulnerable to a range of contaminants.
Several steps were followed to determine the toxicity of individual samples and to categorize the toxicity
of individual sites.
1. Standardize the statistical analyses: When data were submitted to the SWAMP/CEDEN databases, reporting laboratories evaluated the potential toxicity of samples using a variety of statistical protocols. In order to standardize the analysis of the entire data set, all control – sample comparisons were re-analyzed using the proposed EPA Test of Significant Toxicity (Anderson et al., 2011; Denton et al., 2011; US EPA, 2010). Individual samples were categorized as not toxic, toxic or highly toxic (see 2 below).
2. Calculate the High Toxicity Threshold: The High Toxicity Threshold is determined for each species’ endpoint from the entire dataset summarized in the Statewide Report (Anderson et al., 2011). This threshold is the average of two numbers, both expressed as a percentage of the control performance. The first number is the data point for the 99th percentile of Percent Minimum

August 2012
Toxicity in California Waters: San Francisco Bay Region
Page 6
www.waterboards.ca.gov/swamp
Table 2Data conditions used to determine toxicity categories for any given sample collection site.
Category Conditions for Categorization
Non-toxic No sample is ever toxic to any test species
Some Toxicity At least one sample is toxic to one or more species, and all of the species’ responses fall above their species-specific High Toxicity Threshold
Moderate Toxicity At least one sample is toxic to one or more species, and at least one of the species’ responses falls below their species-specific High Toxicity Threshold
High Toxicity At least one sample is toxic to one or more species, and the mean response of the most sensitive species falls below its respective High Toxicity Threshold
Significant Difference (PMSD), representing the lower end of test sensitivity across the distribution of PMSDs in the Statewide Report. The second value is the data point for the 75th percentile of Organism Performance Distribution of all toxic samples, representing an organism’s response on the more toxic end of the distribution. This average serves as a reasonable threshold for highly toxic samples.
3. Determine the Toxicity Category for each site: The magnitude and frequency of toxicity at each sample collection site was categorized (Table 2) according to Anderson et al. (2011) and Bay et al. (2007) as “non-toxic”, “some toxicity”, “moderately toxic”, or “highly toxic”. Throughout this document the terms some, moderate and highly will be italicized when in reference to these categories.
Separate categories were created for sediment and for water toxicity, as well as for toxicity to
individual species.

August 2012
Toxicity in California Waters: San Francisco Bay Region
Page 7
www.waterboards.ca.gov/swamp
Non-Toxic Some Toxicity Moderate Toxicity High Toxicity
Freshwater, freshwater sediment and marine sediment toxicity was common in the San Francisco Bay Region between 2001 and 2010 (Figure 1). Freshwater and freshwater sediment toxicity were equally common, but freshwater sediment toxicity tests demonstrated a higher magnitude of toxicity Thirty-seven percent (37%) of sampling sites showed some freshwater toxicity, with 6% of sites showing moderate freshwater toxicity. Forty-percent (40%) of sites showed some freshwater sediment toxicity, with 27% of sites showing some toxicity to moderate toxicity, and 13% showing severe toxicity. Observations of freshwater water and sediment toxicity in the San Francisco Bay Region were somewhat lower than those observed statewide (Anderson et al., 2011).
SECTIONREgIONal TOxICITy3
Figure 1. Magnitude of toxicity in water and sediment samples in the San Francisco Bay Region of California.
FRESHWATERToxiCiTy
FRESHWATER SEDiMENT ToxiCiTy
HARBoR/BAy SEDiMENT ToxiCiTy
N = 48 Sites N = 30 Sites N = 72 Sites

August 2012
Toxicity in California Waters: San Francisco Bay Region
Page 8
www.waterboards.ca.gov/swamp
Table 3Species-specific maximum levels of toxicity observed at sites tested with E. estuarius, H. azteca and M. galloprovincialis sediment tests and C. dubia, P. promelas and P. subcapitata water column tests.
Species Test TypeNumber of
Sites
Maximum Toxicity Level observed
Non-ToxicSome
ToxicityModerately
ToxicHighly Toxic
E. estuarius
Sediment
72 43 26 2 1
H. azteca 30 18 3 5 4
M. galloprovincialis 69 25 27 2 15
C. dubiaWater
Column
47 46 0 1 0
P. subcapitata 48 36 10 2 0
P. promelas 48 39 9 0 0
Marine sediment toxicity was both more common and of greater magnitude than toxicity measured at
freshwater sites: 74% of marine sites showed sediment toxicity, with 51% of sites showing some toxicity to
moderate toxicity, and 22% of sites showing severe toxicity.
Relative Toxicity Using Different Test Protocols
The frequency and intensity of toxicity detections varied markedly between test species. Freshwater toxicity
and marine sediment toxicity are summarized by individual species in Figures 2 and 3, respectively.
None of the freshwater sites examined in the San Francisco Bay Region between 2001 and 2010 showed
high water toxicity. Toxicity to C. dubia was observed rarely (2% of sites), while toxicity to P. promelas
and P. subcapitata was more common (19% and 25%, respectively). All toxicity to fish (P. promelas) was
of low magnitude. Reduced observations of water toxicity to C. dubia in urban creeks throughout the San
Francisco Bay Region was likely due to implementation of policies related to the diazinon and pesticide total
maximum daily loads (TMDLs) in SF Bay area tributaries (for current status see: www.waterboards.ca.gov/
sanfranciscobay/board_info/agendas/2011/March/8_SSR.pdf).
Reductions in water column toxicity in freshwater tributaries between 2001 and 2010 coincided with
observed reductions in water column toxicity in the Estuary. Anderson et al. (Anderson et al., 2003c)
summarized results of water and stormwater toxicity testing conducted in the Estuary as part of the Regional
Monitoring Program. Declines in water toxicity testing were partly attributed to declines in the use of the
organophosphate (OP) pesticides diazinon and chlorpyrifos. The decline in use of OP pesticides coincided

August 2012
Toxicity in California Waters: San Francisco Bay Region
Page 9
www.waterboards.ca.gov/swamp
with an increase in the use of pyrethroid pesticides. Pyrethroids are much more toxic to amphipod toxicity
test species than they are to fish, algae, and cladocerans such as C. dubia. Recent studies have found
increased water column toxicity due to pyrethroids when the amphipod H. azteca is used as a test species
(see Anderson et al., 2011). In San Francisco Bay regional monitoring, Werner et al. (Werner et al., 2010)
found toxic concentrations of pyrethroids at northern San Francisco Estuary sites tested with H. azteca in
2006 and 2007. Because of concerns about pyrethroid-caused water toxicity, H. azteca is now being used
as a test species in San Francisco Bay Region stormwater monitoring (C. Sommers, Regional Monitoring
Coalition, personal communication).
Sediment toxicity was common at freshwater sites in the San Francisco Bay Region during 2001 - 2010.
Forty percent of the sites demonstrated some degree of sediment toxicity, and 17% were moderately toxic.
A relatively high percent of sites tested for sediment toxicity were highly toxic to the amphipod Hyalella
azteca (Figure 1).
Marine sediment toxicity was found to be more common and of a higher magnitude than toxicity at
freshwater sites, particularly as measured by tests using the bivalve M. galloprovincialis. Sixty-four percent
(64%) of sites showed some toxicity to M. galloprovincialis, compared to 40% of sites toxic to E. estuarius,
and 25% of sites showed moderate to high toxicity to M. galloprovincialis, while only 4% of sites showed
this degree of toxicity to E. estuarius.
Non-Toxic Some Toxicity Moderate Toxicity High Toxicity
Figure 2. Magnitude of toxicity to individual freshwater species in water samples from the San Francisco Bay Region of California.
FRESHWATER ToxiCiTy By SPECiESC. dubia P. promelas S. Capricornutum
N = 47 Sites N = 48 Sites N = 48 Sites

August 2012
Toxicity in California Waters: San Francisco Bay Region
Page 10
www.waterboards.ca.gov/swamp
Figure 3. Magnitude of toxicity to individual marine species in sediment samples from the San Francisco Bay Region of California.
E. estuarius M. galloprovincialis
N = 72 Sites N = 69 Sites
Non-Toxic Some Toxicity Moderate Toxicity High Toxicity
MARiNE ToxiCiTy By SPECiES
August 2012
Toxicity in California Waters: San Francisco Bay Region
Page 11
www.waterboards.ca.gov/swamp
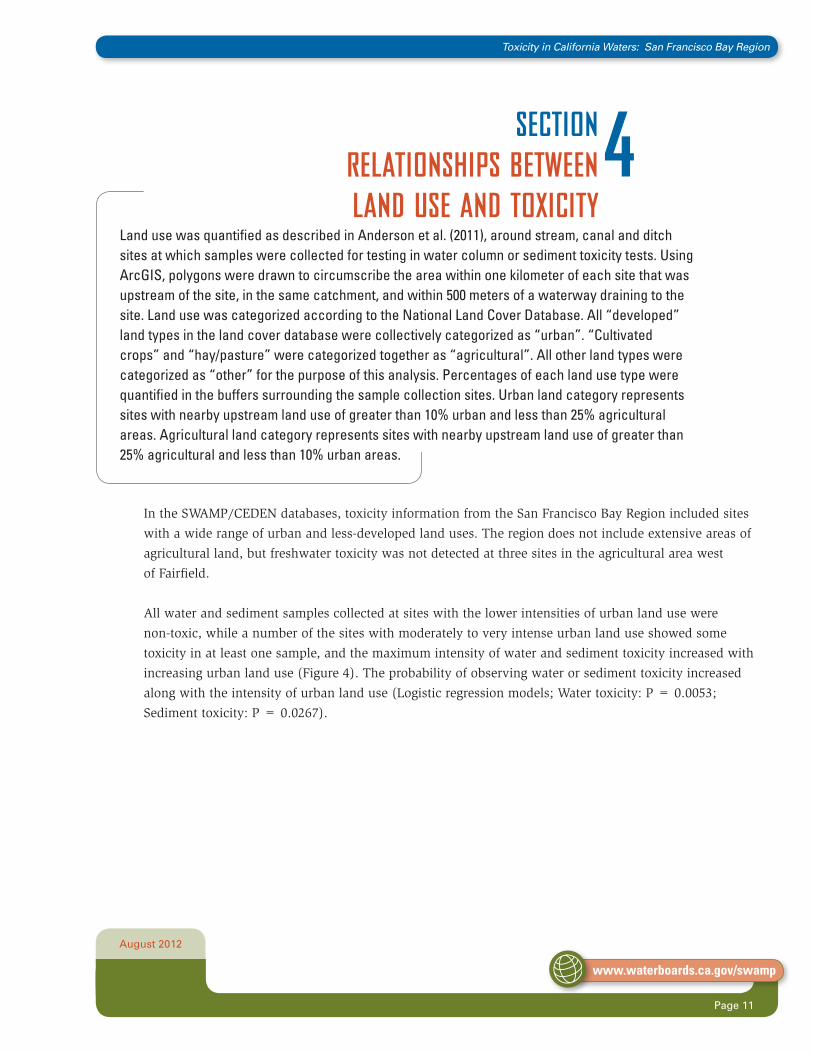
Land use was quantified as described in Anderson et al. (2011), around stream, canal and ditch sites at which samples were collected for testing in water column or sediment toxicity tests. Using ArcGIS, polygons were drawn to circumscribe the area within one kilometer of each site that was upstream of the site, in the same catchment, and within 500 meters of a waterway draining to the site. Land use was categorized according to the National Land Cover Database. All “developed” land types in the land cover database were collectively categorized as “urban”. “Cultivated crops” and “hay/pasture” were categorized together as “agricultural”. All other land types were categorized as “other” for the purpose of this analysis. Percentages of each land use type were quantified in the buffers surrounding the sample collection sites. Urban land category represents sites with nearby upstream land use of greater than 10% urban and less than 25% agricultural areas. Agricultural land category represents sites with nearby upstream land use of greater than 25% agricultural and less than 10% urban areas.
SECTION RElaTIONShIpS bETwEEN laND USE aND TOxICITy
4
In the SWAMP/CEDEN databases, toxicity information from the San Francisco Bay Region included sites
with a wide range of urban and less-developed land uses. The region does not include extensive areas of
agricultural land, but freshwater toxicity was not detected at three sites in the agricultural area west
of Fairfield.
All water and sediment samples collected at sites with the lower intensities of urban land use were
non-toxic, while a number of the sites with moderately to very intense urban land use showed some
toxicity in at least one sample, and the maximum intensity of water and sediment toxicity increased with
increasing urban land use (Figure 4). The probability of observing water or sediment toxicity increased
along with the intensity of urban land use (Logistic regression models; Water toxicity: P = 0.0053;
Sediment toxicity: P = 0.0267).

August 2012
Toxicity in California Waters: San Francisco Bay Region
Page 12
www.waterboards.ca.gov/swamp
Figure 5. Water column toxicity (a) and sediment toxicity (b) at sites over a range of urban land use intensity. Lower values represent lower levels of survival, and indicate higher toxicity. Water toxicity data represent the most sensitive test species at each site. Black circles represent nontoxic sites, while white circles represent sites found to be toxic on at least one occasion.
WATER ToxiCiTy: ALL SPECiES CoMBiNED
SEDiMENT ToxiCiTy: H. aztECa 10-DAy SURvivAL

August 2012
Toxicity in California Waters: San Francisco Bay Region
Page 13
www.waterboards.ca.gov/swamp
Moderate to high freshwater sediment toxicity was spatially variable in urban areas throughout the San Francisco Bay Region, including San Mateo, San Jose, the East Bay, Vallejo and Fairfield. Sediment toxicity in urban centers was clearly more common than in the less urbanized areas of western Marin and San Mateo Counties (Figures 6 - 13, sediment toxicity maps). Greater H. azteca sediment toxicity in urban areas has been reported previously (Weston et al., 2005; Holmes et al., 2008).
SECTIONgEOgRaphICal paTTERNS IN TOxICITy5
FRESHWATER AND FRESHWATER SEDiMENT ToxiCiTy
Marin, Sonoma and San Francisco Counties (Figures 7 and 8)
Samples collected at sites in Marin and Sonoma counties showed little freshwater and freshwater
sediment toxicity. However, the majority of the sites sampled in the area were located away from urban
centers and agricultural areas. The urban corridor of eastern Marin County through Petaluma to Sonoma
was not extensively sampled, with the exception of one site in the city of Petaluma where moderate algal
toxicity was observed (206PET310) and Corte Madera Creek at Sir Francis Drake Boulevard (203SUP040),
where some sediment toxicity was found. In San Francisco, some algal toxicity was found in Lobos Creek
(203LOB020).
Napa, Solano and Northern Contra Costa Counties (Figures 9 and 10)
In the northeastern portion of the San Francisco Bay Region, water toxicity was assessed in an
agricultural area west of Fairfield, where sites were found to be non-toxic, and in urban areas south
of Suisun Bay, where toxicity ranged from some to moderate. The most intense water column toxicity
was found in a floodway south of Broad Slough (207KIR020), where C. dubia showed 100% mortality
in January, 2003 and some algal toxicity was seen later in that year. Freshwater sediment toxicity was
assessed in most urban and agricultural areas, and was found to be moderate to high in the Vallejo
and Southwest Fairfield urban areas at Blue Rock Springs (206SUP004), in American Canyon Creek
(206SUP047), and in a tributary to Suisun Slough (207SUP102).
The agricultural and urban areas in the Napa Valley were not sampled for water or sediment toxicity.

August 2012
Toxicity in California Waters: San Francisco Bay Region
Page 14
www.waterboards.ca.gov/swamp
San Mateo, Santa Clara, Alameda and Western Contra Costa Counties (Figures 11-13)
Water samples from most sites in the streams of eastern San Francisco Bay Region were nontoxic, with
occasional sites showing some toxicity. Sites showing toxicity included Codornices Creek (203COD020), a
tributary of Lake Temescal (203TEM090), and Altamont Creek (204ALP100). Sediments were found to be
moderately toxic in Rheem Creek (206SUP007) and San Leandro Creek (204SLE030).
In streams of the southern and southwestern San Francisco Bay, some water toxicity was pervasive, and
moderate to high water toxicity was found at sites in Stevens Creek (205SUP101), Coyote Creek (205SUP022)
and Quimby Creek in San Jose (205SUP103) and in San Mateo Creek (204SMA020).
Water and Sediment samples from sites near the communities of San Gregorio and Pescadero in southern
San Mateo County were largely nontoxic.
Water toxicity between 2004 and 2005 was much reduced compared to toxicity levels in the 1990s. Among
sites found to be toxic to C. dubia in 2005 were Castro Valley Creek (acutely toxic) and San Francisquito and
Rheem Creeks (reduced C. dubia reproduction). Diazinon and malathion were found at Castro Valley and
Rheem Creeks (Ruby, 2005). Of these waterways, Rheem Creek (206SUP007) is the only one sampled in the
current data set. It was not sampled for water toxicity, but moderate H. azteca toxicity was observed in the
sediment. Santa Clara County creeks were tested for toxicity and pesticides in the winter of 2004 - 2005. Out
of 12 sites examined, three were toxic to P. subcapitata, one site was acutely toxic to C. dubia, and one site
was acutely toxic to P. promelas (Ruby, 2005).
MARiNE SEDiMENT ToxiCiTy
Suisun Bay, Sacramento River and San Joaquin River (Figure 14)
Sediments in the Sacramento River, the San Joaquin River, and the great majority of sites in Suisun Bay were
found to be highly toxic.
San Pablo Bay (Figure 15)
Some toxicity was detected at most sites throughout San Pablo Bay, but this toxicity did not reach a moderate
or high level of intensity.
San Francisco Bay (Figures 16-18)
Toxicity was detected at the majority of sites in San Francisco Bay, and more intense toxicity was detected in
locations throughout the bay including sites BC11, BA41, SB02S, and BA10, as well as a broad area of high
toxicity detected at sites LSB025S, LSB033S, LSB073S, and LSB001S south of the San Mateo Bridge.

August 2012
Toxicity in California Waters: San Francisco Bay Region
Page 15
www.waterboards.ca.gov/swamp
It should be noted that while moderate toxicity to amphipods has been common in routine monitoring
conducted as part of the Regional Monitoring Program, recent studies have shown that the magnitude of
toxicity at many of the hotspots identified through Bay Protection and Toxic Cleanup Program (BPTCP) and
other monitoring in the late 1990s has apparently abated. Phillips et al. (Phillips et al., 2009) conducted
monitoring at 13 previously toxic stations in San Francisco Bay in 2007 in an attempt to identify candidate
sites for TIE studies. Of these, only four, Mission Creek, Islais Creek, Dunbarton Bridge and Airport, were
significantly toxic, and the mean amphipod survival at these stations was 64.5%. Sites that had previously
demonstrated very high toxicity have been shown to be largely non-toxic in recent monitoring, including
Castro Cove and San Leandro Bay. The cause(s) of persistent moderate toxicity to amphipods in RMP Status
and Trends samples is the subject of on-going concern in the Estuary.

August 2012
Toxicity in California Waters: San Francisco Bay Region
Page 16
www.waterboards.ca.gov/swamp
FRESHWATER
In the 1990’s, freshwater toxicity was common in the urban creeks and storm drains of the San Francisco Bay area, while sampling in more recent years has shown a greatly reduced incidence of toxicity, particularly in the case of toxicity to C. dubia. It is generally acknowledged that this decline in toxicity has been the direct result of changes in pesticide application including reduction in the urban use of organophosphate insecticides such as diazinon and chlorpyrifos (Johnson, 2005). The milder water toxicity that remains in the San Francisco Bay Region in recent years has been more difficult to link to pesticide detections (Ruby, 2005), which may be partially the result of the limited extent of chemical analysis for pyrethroid pesticides, and the toxicity of pyrethroids at concentrations approaching the detection limits of chemical analysis. In a review of sources of pesticides in the San Francisco Estuary, Kuivila and Hladik (Kuivila and Hladik, 2008) identified urban waterways as being sources of pesticides during most months of the year.
SECTIONCaUSES Of TOxICITy6
Correlation analyses and toxicity identification evaluations (TIEs) were used to determine causes of
water and sediment toxicity statewide (Anderson et al., 2011). The results of these analyses showed that
the majority of toxicity was caused by pesticides. TIE studies and pesticide detections in toxic water
samples from California also have demonstrated that water toxicity to C. dubia is caused primarily by
a combination of organophosphate and pyrethroid pesticides (de Vlaming et al., 2000; Bacey et al.,
2005; Holmes et al., 2005; AquaScience, 2007; AEAL, 2008). Recent water column TIEs with H. azteca
have identified pyrethroids as the most major toxicants of concern in urban runoff, and have found that
toxicity of agricultural runoff was caused by mixtures of organophosphates and pyrethroids (Weston
and Lydy, 2010a, b). Aerial vector control spraying of pyrethrins in the Sacramento area was not found
to cause water column toxicity (Weston et al., 2006). Toxicity to fish was not high between 2001 and
2010, and few water samples reached a level fish toxicity sufficient to initiate a TIE process. Moderate
to high algal toxicity occurred at select sites, but algal TIEs are not yet well-developed or widely used,
and causes of algal toxicity remain unclear. Algal toxicity in the San Francisco Bay Region was often
accompanied by detections of diazinon, and it is possible that herbicidal compounds co-occurring with
insecticides in runoff were responsible for part or all of the algal toxicity observed.
Pesticide data collected by SWAMP from 2001 - 2005 show that diazinon continued to be commonly
detected in urban creeks in low concentrations (below 0.06 ug/L), and toxicity data show that C. dubia
toxicity in urban creeks has become rare. However, the one instance of high C. dubia toxicity found in
the current data set was associated with high concentrations of chlorpyrifos (0.111 ug/L) and diazinon

August 2012
Toxicity in California Waters: San Francisco Bay Region
Page 17
www.waterboards.ca.gov/swamp
(0.741 ug/L), as well as a suite of poly-aromatic hydrocarbons (PAHs) with a total concentration of
0.5844 ug/L.
FRESHWATER SEDiMENT
Sediment TIEs using H. azteca have been conducted in most regions of California where toxicity has been
observed. The majority of sediment TIEs and chemical analyses of toxic sediments have identified pyrethroid
pesticides as the cause of toxicity. Other studies have shown sediment toxicity is due to the OP pesticide
chlorpyrifos, or to mixtures of chlorpyrifos and pyrethroids. The majority of these studies have been
conducted in the Central Valley and on the Central Coast.
A statewide study to assess sediment toxicity in urban creeks found that sediments in the San Francisco Bay
area caused significant amphipod mortality (H. azteca) in all stations tested (Blue Rock Springs, Coyote Creek,
Rheem Creek, Stevens Creek). Mortality at all sites increased when H. azteca were exposed to the sediments
at 15 °C instead of 23 °C (including Corte Madera Creek), indicating that pyrethroid insecticides were likely
the primary cause of toxicity. Moreover, pyrethroid pesticides were detected in every sediment sample
(Holmes et al., 2008). The pyrethroid most commonly detected at toxic concentrations was bifenthrin.
Amweg et al. (Amweg et al., 2006) found significant H. azteca mortality when they tested sediment samples
from East Bay streams collected in 2004. The most intense toxicity was found in Pine Creek and Kirker
Creek, with sediments from Pine Creek causing total mortality on every occasion tested, and sediments
from Kirker Creek causing between 40 and 100% mortality. Significant H. azteca mortality was also found
in Lauterwasser Creek, Glen Echo Creek and Lion Creek. Chemical analysis of sediment pyrethroids showed
that toxicity in Kirker Creek could be explained solely by the presence of pyrethroids, but the relationship
between pyrethroids and toxicity was less apparent at other sites, indicating that other compounds may be
acting as major agents of toxicity, and that pyrethroid bioavailability can vary considerably. In addition,
Lowe et al. (Lowe et al., 2007) conducted a TIE of sediment from San Mateo Creek and found pyrethroids
were the likely cause of sediment toxicity to H. azteca.
The SPoT monitoring program has been conducting contamination and toxicity surveys in several
watersheds throughout the San Francisco Bay Region since 2008. In 2010, SPoT began conducting dual
toxicity testing at two temperatures with a subset of sites, to help diagnose toxicity due to pyrethroids.
Results showed minimal toxicity in sediment from San Leandro Creek, Laurel Creek, and the Guadalupe
River when tests were conducted at 23 °C, and high toxicity when tests were conducted at 15 °C. Testing
with two temperatures was expanded to nine of eleven San Francisco Bay Region SPoT stations in 2011, and
the results of these tests will be presented in future SPoT reports.

August 2012
Toxicity in California Waters: San Francisco Bay Region
Page 18
www.waterboards.ca.gov/swamp
MARiNE SEDiMENT
Moderate to high sediment toxicity has been observed in San Francisco Estuary sediments since testing
began in the mid-1980s. Correlation analyses found that amphipod mortality was highly correlated with
organic chemicals, metals, and mixtures of chemicals (Thompson et al., 1999; Hunt et al., 2001). Anderson
et al. (Anderson et al., 2007) summarized the results of correlation studies conducted with amphipods and
again found that mixtures of organic chemicals were most strongly correlated with amphipod mortality. One
of the primary chemicals most significantly correlated with amphipod mortality in these and other statewide
datasets is the organochlorine pesticide chlordane (see discussion below). These and other authors have also
reported significant negative correlations between increasing clay concentrations in San Francisco Estuary
sediment and amphipod survival.
TIEs conducted with bivalve embryo development have shown that inhibition of bivalve embryo
development by San Francisco Estuary sediments is due to divalent cationic metals, and Phillips et al.
(Phillips et al., 2003) showed that copper in Grizzly Bay sediment was the likely cause of toxicity to bivalve
embryos in the northern Estuary. Many previous studies have demonstrated that invertebrate embryos are
particularly sensitive to divalent metals.
TIEs with amphipods have been less conclusive. Phillips et al. (Phillips et al., 2009) found that toxicity of
Mission Creek sediment to the amphipod Eohaustorius estuarius was due to ammonia, hydrogen sulfide,
and mixtures of organic chemicals, including the organophosphate pesticide chlorpyrifos. These authors also
reviewed existing TIE data and results of sediment and water spiking experiments and concluded metals
were likely not responsible for sediment toxicity to this species. Phillips et al. (Phillips et al., 2011) conducted
additional sediment spiking experiments and determined that the organochlorine pesticide chlordane is likely
not responsible for sediment toxicity to Eohaustorius estuarius. This demonstrated the utility of combining
TIE data, correlation analyses, and evaluation of sediment chemistry relative to experimentally-derived
toxicity thresholds.
As discussed above, non-contaminant factors may also be causing amphipod mortality in some San
Francisco Estuary sediments. While numerous studies have documented correlations between amphipod
mortality and increased proportions of fine-grained sediment, the conclusions are often confounded by the
co-variance of contaminant concentrations with grain size. An evaluation of data from 308 uncontaminated
San Francisco Estuary sediment samples collected between 1994 and 2008 for the RMP showed a statistically
significant relationship between increasing clay content and amphipod mortality. In a laboratory experiment
that manipulated the amount of fines in reference sediment, E. estuarius survival decreased significantly
when the percentage of fines exceeded 90% (MPSL unpublished data). It is possible that grain size,
particularly clay content, may be playing a role in the moderate amphipod mortality observed at many RMP
sites. The possible influence of grain size on E. estuarius survival should be investigated in future studies.
August 2012
Toxicity in California Waters: San Francisco Bay Region
Page 19
www.waterboards.ca.gov/swamp
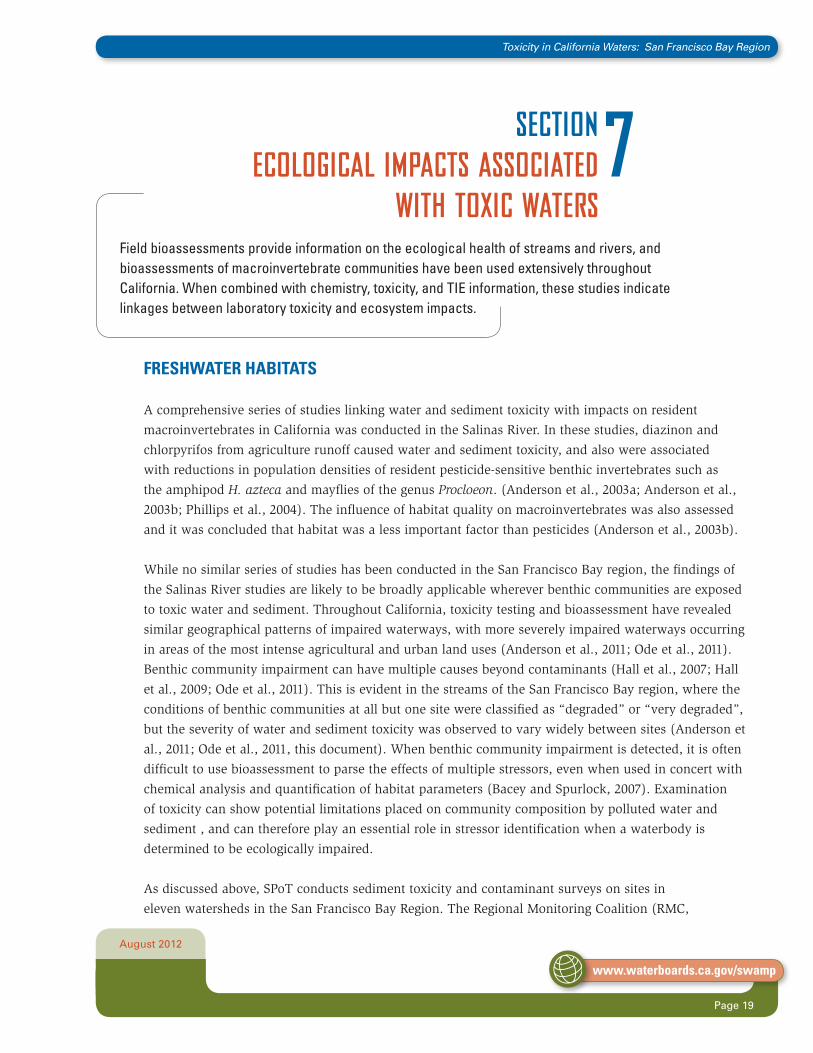
Field bioassessments provide information on the ecological health of streams and rivers, and bioassessments of macroinvertebrate communities have been used extensively throughout California. When combined with chemistry, toxicity, and TIE information, these studies indicate linkages between laboratory toxicity and ecosystem impacts.
SECTIONECOlOgICal IMpaCTS aSSOCIaTED
wITh TOxIC waTERS7
FRESHWATER HABiTATS
A comprehensive series of studies linking water and sediment toxicity with impacts on resident
macroinvertebrates in California was conducted in the Salinas River. In these studies, diazinon and
chlorpyrifos from agriculture runoff caused water and sediment toxicity, and also were associated
with reductions in population densities of resident pesticide-sensitive benthic invertebrates such as
the amphipod H. azteca and mayflies of the genus Procloeon. (Anderson et al., 2003a; Anderson et al.,
2003b; Phillips et al., 2004). The influence of habitat quality on macroinvertebrates was also assessed
and it was concluded that habitat was a less important factor than pesticides (Anderson et al., 2003b).
While no similar series of studies has been conducted in the San Francisco Bay region, the findings of
the Salinas River studies are likely to be broadly applicable wherever benthic communities are exposed
to toxic water and sediment. Throughout California, toxicity testing and bioassessment have revealed
similar geographical patterns of impaired waterways, with more severely impaired waterways occurring
in areas of the most intense agricultural and urban land uses (Anderson et al., 2011; Ode et al., 2011).
Benthic community impairment can have multiple causes beyond contaminants (Hall et al., 2007; Hall
et al., 2009; Ode et al., 2011). This is evident in the streams of the San Francisco Bay region, where the
conditions of benthic communities at all but one site were classified as “degraded” or “very degraded”,
but the severity of water and sediment toxicity was observed to vary widely between sites (Anderson et
al., 2011; Ode et al., 2011, this document). When benthic community impairment is detected, it is often
difficult to use bioassessment to parse the effects of multiple stressors, even when used in concert with
chemical analysis and quantification of habitat parameters (Bacey and Spurlock, 2007). Examination
of toxicity can show potential limitations placed on community composition by polluted water and
sediment , and can therefore play an essential role in stressor identification when a waterbody is
determined to be ecologically impaired.
As discussed above, SPoT conducts sediment toxicity and contaminant surveys on sites in
eleven watersheds in the San Francisco Bay Region. The Regional Monitoring Coalition (RMC,
August 2012
Toxicity in California Waters: San Francisco Bay Region
Page 20
www.waterboards.ca.gov/swamp
formerly BASMAA) conducts stormwater monitoring at nine of these sites, and this includes benthic
macroinvertebrate community surveys. As monitoring proceeds, the combined SPoT and RMC datasets will
allow an evaluation of the relationships between benthic macroinvertebrate index (BMI) metrics, sediment
toxicity, and contamination, similar to the studies described above for the Salinas and Central Valleys. This
should provide valuable information on the potential for contaminant and non-contaminants stressors to
impact invertebrate communities in San Francisco Bay regional streams.
MARiNE HABiTATS
As in freshwater habitats, the primary studies linking laboratory toxicity with ecological impacts have been
“triad” studies incorporating laboratory toxicity tests, chemical analyses, and benthic community bioassessments.
The best examples of triad studies in the San Francisco Estuary were those conducted by the Bay Protection and
Toxic Cleanup Program (BPTCP; (Hunt et al., 2001)). Hunt et al. (2001) conducted studies at three gradient sites
located at the margins of the Estuary: Mission Creek, Peyton Slough, and Zeneca Marsh. All of these studies
showed that as sediment contamination and toxicity increased along a contamination gradient, impacts on the
benthic communities increased along these gradients. Data from Mission Creek provide the best example. Sites
located near a combined sewage and stormwater overflow outfall demonstrated high toxicity to amphipods and
bivalve development, high concentrations of chemicals in mixtures, and depauperate benthic communities.
The benthic community nearest the outfall was characterized by few crustacean (sensitive species), and higher
proportions of tolerant polychaete worm taxa. Samples taken at the mid-gradient station were less contaminated
and toxic, and the benthic community at this station had greater numbers of sensitive indicator species. Samples
taken from the end of the gradient farthest from the outfall showed no toxicity, low contaminant concentrations,
and benthic communities representative of reference conditions (Hunt et al., 2001). Toxic hotspots in Mission Bay
and San Leandro Bay are the subject of more recent triad studies conducted by the RMP in summer 2011. The
results of these studies are pending. In addition to BPTCP studies, an ecological risk assessment conducted by EPA
in the Lauritzen Channel Superfund site found similar triad relationships: stations with the highest sediment DDT
contamination also had the highest amphipod mortality and the greatest impacts on benthic macroinvertebrates
(Swartz et al., 1994).
In collaboration among NOAA, EPA (EMAP) and the RMP, triad studies were conducted throughout the
Estuary from 2000 to 2001. Results of this study provided less conclusive results linking contamination to
toxicity (Anderson et al., 2007). Amphipod mortality was not correlated with contamination, but was highly
correlated with sediment TOC and grain-size, two constituents that co-vary with contaminants. As opposed
to studies at toxic hotspots, these studies were likely complicated by the moderate contamination and toxicity
signals representative of mid-channel samples. In addition, linking benthic community impacts in the Estuary
with contamination and toxicity is complicated by differences in opinions by benthic ecologists. While there is
reasonably good agreement on macroinvertebrate communities associated with degraded habitats in the more
marine influenced (polyhaline) areas of the Estuary (Weisberg et al., 2008), there is little agreement on what
constitutes a degraded community in the less saline (mesohaline) and tidal freshwater habitats of the Estuary
(Thompson et al., in press).

August 2012
Toxicity in California Waters: San Francisco Bay Region
Page 21
www.waterboards.ca.gov/swamp
An examination of toxicity monitoring sites with data recorded in the SWAMP/CEDEN databases shows that the majority of water toxicity is due to pesticides, mainly pyrethroids in concert with other compounds. Freshwater sediment toxicity has been correlated wtih organic chemicals, metals and mixtures of chemicals. The organochlorine pesticide chlordane has been linked to marine sediment toxicity. Based on these results, we offer the following recommendations:
SECTIONMONITORINg RECOMMENDaTIONS8
• Increasingevidenceofpyrethroidtoxicityinwatersuggeststheneedformorewatertestingwiththe amphipod Hyalella azteca. This should be encouraged for RMC stormwater and other ambient NPDES monitoring in Region 2, as well as water column toxicity monitoring in the northern Estuary/Delta boundary areas.
• Considertheimportanceofemergingcontaminantsofconcerninfuturewaterandsedimentmonitoring (e.g., algal toxins, additional pesticides such as fipronil).
• DatafromSWAMPregionalandSPoTtestingprogramsshouldbeusefulindetectingchangesin toxicity patterns over larger spatial and temporal scales, there is a need for consistency in monitoring to capture emerging trends.
• ContinuecoordinationofSWAMPwithothermonitoringprograms(e.g.,RMCstormwaterand other NPDES monitoring, RMP). Linkage between SPoT measures with bioassessments conducted as part of the RMC would help strengthen the in situ ecological context of toxicity and chemical monitoring data.
• Encouragetheinvestigationofnon-contaminantstressorsonindicatorspeciesusedinRMPmonitoring (e.g., investigate effects of grain size on the amphipod E. estuarius).

August 2012
Toxicity in California Waters: San Francisco Bay Region
Page 22
www.waterboards.ca.gov/swamp
Figure 5. Magnitude of freshwater toxicity at sites in the San Francisco Bay Region of California based on the most sensitive species (test endpoint) in water samples collected at each site.

August 2012
Toxicity in California Waters: San Francisco Bay Region
Page 23
www.waterboards.ca.gov/swamp
Figure 6. Magnitude of sediment toxicity at sites in the San Francisco Bay Region of California based on the most sensitive species (test endpoint) in water samples collected at each site.

August 2012
Toxicity in California Waters: San Francisco Bay Region
Page 24
www.waterboards.ca.gov/swamp
Figure 7. Magnitude of freshwater toxicity at sites in Marin, Sonoma and San Francisco Counties in the San Francisco Bay Region of California, based on the most sensitive species (test endpoint) in water samples collected at each site.

August 2012
Toxicity in California Waters: San Francisco Bay Region
Page 25
www.waterboards.ca.gov/swamp
Figure 8. Magnitude of sediment toxicity at sites in Marin, Sonoma and San Francisco Counties in the San Francisco Bay Region of California, based on the most sensitive species (test endpoint) in water samples collected at each site.

August 2012
Toxicity in California Waters: San Francisco Bay Region
Page 26
www.waterboards.ca.gov/swamp
Figure 9. Magnitude of freshwater toxicity at sites in Napa, Solano, and northern Contra Costa Counties in the San Francisco Bay Region of California, based on the most sensitive species (test endpoint) in water samples collected at each site.

August 2012
Toxicity in California Waters: San Francisco Bay Region
Page 27
www.waterboards.ca.gov/swamp
Figure 10. Magnitude of sediment toxicity at sites in Napa, Solano, and northern Contra Costa Counties in the San Francisco Bay Region of California, based on the most sensitive species (test endpoint) in water samples collected at each site.

August 2012
Toxicity in California Waters: San Francisco Bay Region
Page 28
www.waterboards.ca.gov/swamp
Figure 11. Magnitude of freshwater toxicity at sites in the northern East Bay area of the San Francisco Bay Region of California based on the most sensitive species (test endpoint) in water samples collected at each site.
August 2012
Toxicity in California Waters: San Francisco Bay Region
Page 29
www.waterboards.ca.gov/swamp
Figure 12. Magnitude of freshwater toxicity at sites in the southern East Bay and South Bay areas of the San Francisco Bay Region of California based on the most sensitive species (test endpoint) in water samples collected at each site.

August 2012
Toxicity in California Waters: San Francisco Bay Region
Page 30
www.waterboards.ca.gov/swamp
Figure 13. Magnitude of sediment toxicity at sites in the southern East Bay and South Bay areas of the San Francisco Bay Region of California based on the most sensitive species (test endpoint) in water samples collected at each site.

August 2012
Toxicity in California Waters: San Francisco Bay Region
Page 31
www.waterboards.ca.gov/swamp
Figure 14. Magnitude of sediment toxicity at sites in Suisun Bay in the San Francisco Bay Region of California based on the most sensitive species (test endpoint) in water samples collected at each site.

August 2012
Toxicity in California Waters: San Francisco Bay Region
Page 32
www.waterboards.ca.gov/swamp
Figure 15. Magnitude of sediment toxicity at sites in San Pablo Bay in the San Francisco Bay Region of California based on the most sensitive species (test endpoint) in water samples collected at each site.
August 2012
Toxicity in California Waters: San Francisco Bay Region
Page 33
www.waterboards.ca.gov/swamp
Figure 16. Magnitude of sediment toxicity at sites in the northern San Francisco Bay based on the most sensitive species (test endpoint) in water samples collected at each site.

August 2012
Toxicity in California Waters: San Francisco Bay Region
Page 34
www.waterboards.ca.gov/swamp
Figure 17. Magnitude of sediment toxicity at sites in the central San Francisco Bay based on the most sensitive species (test endpoint) in water samples collected at each site.

August 2012
Toxicity in California Waters: San Francisco Bay Region
Page 35
www.waterboards.ca.gov/swamp
Figure 18. Magnitude of sediment toxicity at sites in the southern San Francisco Bay based on the most sensitive species (test endpoint) in water samples collected at each site.

August 2012
Toxicity in California Waters: San Francisco Bay Region
Page 36
www.waterboards.ca.gov/swamp
REfERENCESRAEAL, 2008. Aquatic Ecosystems Analysis Laboratory. Conditional waiver for irrigated agriculture monitoring
program Phase II sampling results, quarterly report - activities from July 1, 2005 - September 30, 2005. Central
Valley Regional Water Quality Control Board. Rancho Cordova, CA.
Amweg, E.L., Weston, D.P., You, J., Lydy, M.J., 2006. Pyrethroid Insecticides and Sediment Toxicity in Urban
Creeks from California and Tennessee. Environ. Sci. Technol. 40, 1700-1706.
Anderson, B.S., Hunt, J.W., Markewicz, D., Larsen, K., 2011. Toxicity in California Waters, Surface Water
Ambient Monitoring Program. California Water Resources Control Board. Sacramento, CA.
Anderson, B.S., Hunt, J.W., Phillips, B.M., Nicely, P.A., de Vlaming, V., Connor, V., Richard, N., Tjeerdema,
R.S., 2003a. Integrated assessment of the impacts of agricultural drainwater in the Salinas River (California,
USA). Environmental Pollution 124, 523-532.
Anderson, B.S., Hunt, J.W., Phillips, B.M., Nicely, P.A., Gilbert, K.D., De Vlaming, V., Connor, V., Richard,
N., Tjeerdema, R.S., 2003b. Ecotoxicologic impacts of agricultural drain water in the Salinas River, California,
USA. Environmental Toxicology and Chemistry 22, 2375-2384.
Anderson, B.S., Hunt, J.W., Phillips, B.M., Thompson, B., Lowe, S., Taberski, K., Carr, R.S., 2007. Patterns and
trends in sediment toxicity in the San Francisco estuary. Environ Res 205.
Anderson, B.S., Ogle, R.S., Lowe, S., 2003c. Ten years of testing for the effects of estuary contamination. In:
Pulse of the Estuary - Monitoring and Managing Contamination in the San Francisco Estuary. Summary
Report. San Francisco Estuary Institute, pp. 27-31.
AquaScience, 2007. Acute toxicity of Sacramento area urban creeks to Ceriodaphnia dubia. Central Valley
Regional Water Quality Control Board. Rancho Cordova, CA.
Bacey, J., Spurlock, F., 2007. Biological assessment of urban and agricultural streams in the California central
valley. Environmental Monitoring and Assessment 130, 483-493.
Bacey, J., Spurlock, F., Starner, K., Feng, H., Hsu, J., White, J., Tran, D.M., 2005. Residues and toxicity of
esfenvalerate and permethrin in water and sediment, in tributaries of the Sacramento and San Joaquin
Rivers, California, USA. Bull Environ Contam Toxicol 74, 864-871.

August 2012
Toxicity in California Waters: San Francisco Bay Region
Page 37
www.waterboards.ca.gov/swamp
de Vlaming, V., Connor, V., DiGiorgio, C., Bailey, H.C., Deanovic, L.A., Hinton, D.E., 2000. Application of
whole effluent toxicity test procedures to ambient water quality assessment. Environ Toxicol Chem 19, 42-62.
Hall, L.W., Killen, W.D., Alden, R.W., 2007. Relationship of farm level pesticide use and physical habitat
on benthic community status in a california agricultural stream. Human and Ecological Risk Assessment 13,
843-869.
Hall, L.W., Killen, W.D., Anderson, R.D., Alden, R.W., 2009. The Influence of Physical Habitat, Pyrethroids,
and Metals on Benthic Community Condition in an Urban and Residential Stream in California. Human and
Ecological Risk Assessment 15, 526-553.
Holmes, R.W., Anderson, B.S., Phillips, B.M., Hunt, J.W., Crane, D., Mekebri, A., Blondina, G., Nguyen,
L., Connor, V., 2008. Statewide Investigation of the Role of Pyrethroid Pesticides in Sediment Toxicity in
California’s Urban Waterways. Environ Sci Technol 42, 7003-7009.
Holmes, R.W., De Vlaming, V., Markewicz, D., Goding, K., 2005. Benthic macroinvertebrate colonization of
artificial substrates in agriculture-dominated waterways of the lower Sacramento River watershed. Central
Valley Regional Water Quality Control Board, Rancho Cordova, CA.
Hunt, J.W., Anderson, B.S., Phillips, B.M., Tjeerdema, R.S., Taberski, K.M., Wilson, C.J., Puckett, H.M.,
Stephenson, M., Fairey, R., Oakden, J., 2001. A large-scale categorization of sites in San Francisco Bay, USA,
based on the sediment quality triad, toxicity identification evaluations, and gradient studies. Environmental
Toxicology and Chemistry 20, 1252-1265.
Johnson, B., 2005. Diazinon and pesticide-related toxicity in bay area urban creeks. Prepared for: California
Regional Water Quality Control Board, San Francisco Bay Region.
Kuivila, K.K., Hladik, M., 2008. Understanding the occurrence and transport of current-use pesticides in the
San Francisco Estuary watershed. San Francisco Estuary and Watershed Science 6, 1-19. John Muir Institute of
the Environment, UC Davis, Davis, CA.
Lowe, S., Anderson, B.S., Phillips, B.M., 2007. Final Project Report: Investigations of Sources and Effects
of Pyrethroid Pesticides in Watersheds of the San Francisco Bay Estuary. Proposition 13 PRISM Grant #
041355520. SFEI Contribution #523. San Francisco Estuary Institute, Oakland, CA, Oakland, CA.
Ode, P.R., Kincaid, T.M., Fleming, T., Rehn, A.C., 2011. Ecological Condition Assessments of California’s
Perennial Wadeable Streams: Highlights from the Surface Water Ambient Monitoring Program’s Perennial
Streams Assessment (PSA) (2000-2007).

August 2012
Toxicity in California Waters: San Francisco Bay Region
Page 38
www.waterboards.ca.gov/swamp
Phillips, B.M., Anderson, B.S., Hunt, J.W., Nicely, P.A., Kosaka, R.A., Tjeerdema, R.S., de Vlaming, V.,
Richard, N., 2004. In situ water and sediment toxicity in an agricultural watershed. Environmental Toxicology
and Chemistry 23, 435-442.
Phillips, B.M., Anderson, B.S., Hunt, J.W., Thompson, B., Lowe, S., Hoenicke, R., Tjeerdema, R., 2003. Causes
of sediment toxicity to Mytilus galloprovincialis in San Francisco Bay, California. Archives of Environmental
Contamination and Toxicology 45, 492-497.
Phillips, B.M., Anderson, B.S., Lowe, S., 2011. RMP Sediment Study 2009-2010, Determining Causes of
Sediment Toxicity in the San Francisco Estuary. Regional Monitoring Program for Water Quality in the San
Francisco Estuary. Contribution No. 626. San Francisco Estuary Institute. Oakland, CA.
Phillips, B.M., Anderson, B.S., Lowe, S., Hunt, J.W., 2009. RMP Sediment TIE Study 2007-2008: Using Toxicity
Identification Evaluation (TIE) Methods to Investigate Causes of Sediment Toxicity to Amphipods. Regional
Monitoring Program for Water Quality in the San Francisco Estuary Contribution No. 561. San Francisco
Estuary Institute, Oakland, CA.
Ruby, A., 2005. Technical Memorandum: Analysis of Bay Area Urban Creeks 2004-2005. Clean Estuary Project,
Oakland. CA.
Swartz, R.C., Cole, F.A., Lamberson, J.O., Ferraro, S.P., Schults, D.W., DeBen, W.A., Lee, H., Ozretich, R.J.,
1994. Sediment toxicity, contamination and amphipod abundance at a DDT- and dieldrin-contaminated site
in San Francisco Bay. Environ Toxicol Chem 13, 949-962.
Thompson, B., Anderson, B.S., Hunt, J.W., Taberski, K., Phillips, B.M., 1999. Relationships between sediment
toxicity and contamination in San Francisco Bay. Mar Environ Res 48.
Weisberg, S.B., Thompson, B.E., Ranasinghe, J.A., Montagne, D.E., Cadien, D.B., 2008. The level of agreement
among experts applying best professional judgment to assess the condition of benthic infaunal communities.
Ecological Indicators 8, 389-394.
Werner, I., Deanovic, L.A., Markewicz, D., Khamphanh, M., Reece, C.K., Stillway, M., Reece, C., 2010.
Monitoring acute and chronic water column toxicity in the northern Sacramento-San Joaquin Estuary,
California, USA, using the euryhaline amphipod, Hyalella azteca: 2006 to 2007. Environmental Toxicology
and Chemistry 29, 2190-2199.
Weston, D.P., Amweg, E.L., Mekebri, A., Ogle, R.S., Lydy, M.J., 2006. Aquatic effects of aerial spraying for
mosquito control over an urban area. Environmental Science & Technology 40, 5817-5822.

August 2012
Toxicity in California Waters: San Francisco Bay Region
Page 39
www.waterboards.ca.gov/swamp
Weston, D.P., Holmes, R.W., You, J., Lydy, M.J., 2005. Aquatic toxicity due to residential use of pyrethroid
insecticides. Environmental Science & Technology 39, 9778-9784.
Weston, D.P., Lydy, M.J., 2010a. Focused toxicity identification evaluations to rapidly identify the cause of
toxicity in environmental samples. Chemosphere 78, 368-374.
Weston, D.P., Lydy, M.J., 2010b. Urban and Agricultural Sources of Pyrethroid Insecticides to the Sacramento-
San Joaquin Delta of California. Environmental Science & Technology 44, 1833-1840.

For more information, please contact:
Marie StillwayAquatic Health Program
University of California, DavisDepartment of Anatomy, Physiology and Cell Biology
one Shields Ave Davis, California
www.waterboards.ca.gov/swamp