Embed Size (px)
Citation preview

Town of Hingham
Climate Change Vulnerability, Risk
Assessment and Adaptation Study
April 16, 2015

2
• Overview of Project
• Methodology Used for Study
• Review of Flood Modeling Results:
• Risk of Flooding Maps (2030 and 2070)
• Sea Level Rise Only (2030 and 2070)
• Depth of Flooding Maps (Present, 2030 and 2070)
• Municipally-Owned Infrastructure Subject to Flooding
• Methodology for Assessing Vulnerability of Critical
Municipally-Owned Infrastructure Subject to Flooding
• Preliminary Vulnerability Ranking
Today’s Presentation

3
Town Steering Committee
• Monica Conyngham
• Mary Savage Dunham
• Roger Fernandes
• Scott McIsaac
• Jim Murphy
• Abby Piersall (Project Manager)
• Walter Sullivan
• Randy Sylvester
• Richard Cook
• Ken Corson
• Brian Knies

4
• Hingham awarded a CZM “Coastal
Community Resilience Grant”
• Grant amount = $44,461
• One of nine awards totaling $1.0 million
• 25% Town in-kind match
• Town retained Kleinfelder of Cambridge,
MA as the project consultant
Grant Award
5
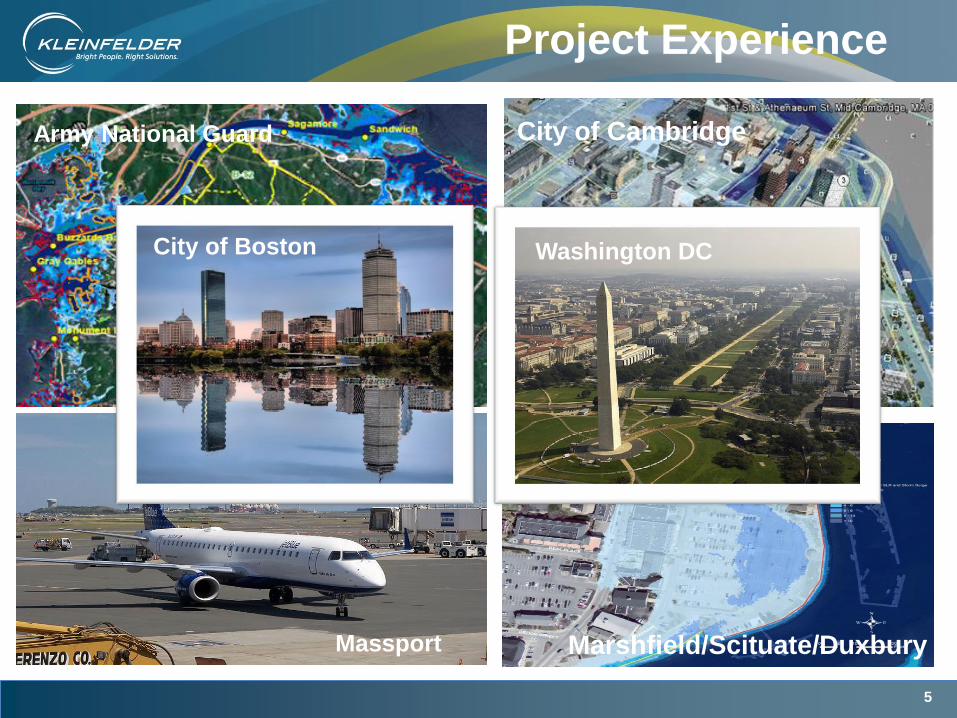
Project Experience
Army National Guard City of Cambridge
Massport Marshfield/Scituate/Duxbury
City of Boston Washington DC

6
• Develop appropriate sea level rise and storm
surge scenarios
• Understand vulnerability of municipal
infrastructure and natural resources to sea
level rise and storm surge
• Develop potential short-, mid- and long-term
adaptation strategies: • Protect
• Accommodate
• Retreat
Project Objectives

7
• Produce high quality maps and graphics
• Undertake a public outreach and education
program
Project Objectives
• This project is not related to FEMA flood
mapping or flood insurance rates!

8
Priority-
planning
areas
Project Approach
Phase I
Sea Level Rise/Storm
Surge Projections
Scenario Development
Phase II
Mapping Inundation
Modeling Results
Vulnerability/Risk
Assessment
Phase III
Develop Adaptation
Strategies
Public Outreach
Probability of occurrence
Co
nse
qu
en
ce
of im
pa
ct

9
Phase I: Establish Study Parameters
Choice of sea level rise and storm
surge model
Types of storm and storm climatology
Selection of sea level rise scenarios
Planning horizons
Display of output results

10
A Detailed Water Surface Model

11
ADCIRC Model Grid

12
Storm Climatology
Includes both tropical and
extra-tropical storm sets
• A Large Statistically robust set of storms.
Advantages of The Proposed Model

13
Global Mean Sea Level Rise Projections

14
What Causes Sea Level Rise?
Global Sea Level Change
• Thermal expansion of
oceans
• Freshwater addition from
melting of glaciers
Local Sea Level Change
• Land subsidence
• Changes in ocean currents
Glacier Bay National Park, Alaska

15
Global Mean Sea Level Rise Projections
NOAA Technical Report Global Sea Level Rise Scenarios for the United
States National Climate Assessment, December 2012
Highest Curve Used in this Study

16
• 2015 - Present
• 2030 – 15 years out – Near term
• 2070 – 55 years out – Long term
Planning Horizons

17
Phase II: Mapping and Vulnerability
Assessment
Inundation Mapping for Different Scenarios
Sea level rise and storm surge simulations
Risk-based maps and exceedance curves
Maps for sea level rise alone
Vulnerability Assessment on
Municipal Infrastructure
Natural Resources

18
2030 – Risk of Flooding Map

19
2070 – Risk of Flooding Map

20
Sea Level Rise - 2030

21
Sea Level Rise - 2070
!( Municipally owned
!( Non-Municipal
Exposed Critical Assets

22
2030 SLR only 2070 SLR only
Depth of Flooding above Ground: SLR Only
Sea Level Rise Comparison:
Inner Hingham Harbor

23
2030 SLR only 2070 SLR only
Depth of Flooding above Ground: SLR Only
Sea Level Rise Comparison:
Foster Elementary and Broad Cove PS

24
Present: 1% Annual Probability
(≈100 yr Recurrence)
Depth of Flooding above Ground

25
Present: 0.2% Annual Probability
(≈500 yr Recurrence)
Depth of Flooding above Ground
!( Municipally owned
!( Non-Municipal
Exposed Critical Assets
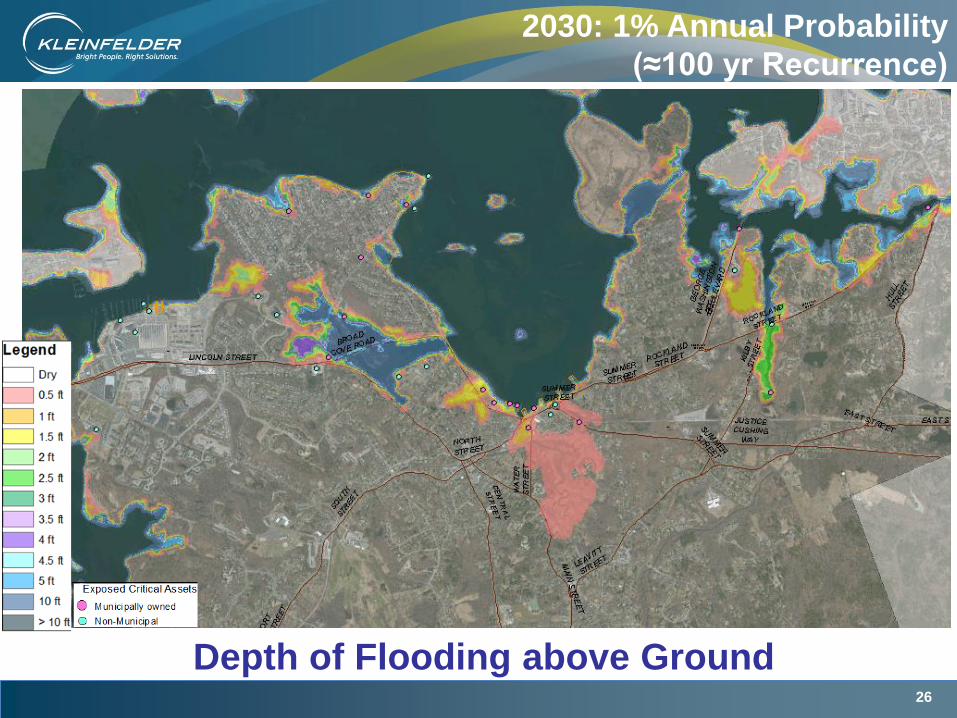
26
2030: 1% Annual Probability
(≈100 yr Recurrence)
Depth of Flooding above Ground

27
Depth of Flooding above Ground
2030: 0.2% Annual Probability
(≈500 yr Recurrence)

28
2070: 1% Annual Probability
(≈100 yr Recurrence)
Depth of Flooding above Ground

29
2070: 0.2% Annual Probability
(≈500 yr Recurrence)
Depth of Flooding above Ground

30
Present Inundation: Hingham-Hull Connectors
At 1% annual probability (≈100 yr
recurrence) At 0.2 % annual probability (≈ 500 yr
recurrence)
Depth of Flooding above Ground

31
2030 Inundation: Hingham-Hull Connectors
At 1% annual probability (≈100 yr
recurrence) At 0.2 % annual probability (≈ 500 yr
recurrence)
Depth of Flooding above Ground

32
2070 Inundation: Hingham-Hull Connectors
At 1% annual probability (≈100 yr
recurrence) At 0.2 % annual probability (≈ 500 yr
recurrence)
Depth of Flooding above Ground

33
Present Inundation: Inner Hingham Harbor
At 1% annual probability (≈100 yr
recurrence) At 0.2 % annual probability (≈ 500 yr
recurrence)
Depth of Flooding above Ground

34
2030 Inundation: Inner Hingham Harbor
At 1% annual probability (≈100 yr
recurrence) At 0.2 % annual probability (≈ 500 yr
recurrence)
Depth of Flooding above Ground

35
2070 Inundation: Inner Hingham Harbor
At 1% annual probability (≈100 yr
recurrence) At 0.2 % annual probability (≈ 500 yr
recurrence)
Depth of Flooding above Ground

36
At 1% annual probability (≈100 yr
recurrence) At 0.2 % annual probability (≈ 500 yr
recurrence)
Depth of Flooding above Ground
2030 Inundation: Foster Elementary and Broad Cove PS

37
At 1% annual probability (≈100 yr
recurrence) At 0.2 % annual probability (≈ 500 yr
recurrence)
Depth of Flooding above Ground
2070 Inundation: Foster Elementary and Broad Cove PS

38
Infrastructure Vulnerable to Flooding - Facilities
Facility/Building Name Critical Elevation
(NAVD88) First Vulnerable Time
Horizon
Bel Air Pump Station 7.30 Present
Howe St Pump Station 8.30 Present
West Corner Pump Station 8.50 Present
Hingham Bathing Beach (Parking Lot) 9.06* Present
Heliport at Bathing Beach 8.12* Present
William L Foster Elementary School 6.10 2030
Mill St. Pump Station 8.69* 2030
Broad Cove Sewer Pump Station 8.10 2030
Whitney Wharf 10.36* 2070
Downer Ave Sewer Pump 11.90 2070
Beal Street Pump Station 12.20 2070
Walton Cove Pump Station 11.40 2070
(*) Critical elevation provided by Town of Hingham

39
Infrastructure Vulnerable to Flooding - Roadways
Roadway Name
Rockland St/Kilby St at Foundary Pond Dam
Summer St/Rte 3A Rotary
Otis St at Hingham Bathing Beach
44 North St at MBTA Greenbush
Broad Cove Road
32 Eldridge Court toward Mill St PS
Rockland St/Hull St at West Corner PS
Rockland St at Meadow Road
Lincoln St
George Washington Blvd Bridge (approach)
Beach Road and Beach Lane Intersection
Parker Drive and Howe St Intersection at Howe St PS
Main St at Winter St
Fresh River Ave
Downer Ave and Condito Rd
62 Downer Ave toward Foster Elem
Otis St

40
Infrastructure Vulnerable to Flooding – Coastal
Stabilization Structures

41
Infrastructure Vulnerable to Flooding – Coastal
Stabilization Structures
Structure Type CZM Coastal Stabilization Structure Name
Bulkhead/ Seawall 034-051-000-003-100
Bulkhead/ Seawall 034-051-000-001-200
Revetment 034-030-000-011-100
Bulkhead/ Seawall 034-051-000-005B-100
Bulkhead/ Seawall 034-030-000-011-200
Bulkhead/ Seawall 034-050-000-050-200
Bulkhead/ Seawall 034-051-000-005B-200
Revetment 034-050-000-050-100
Bulkhead/ Seawall 034-051-000-001-300
Bulkhead/ Seawall 034-051-000-001-100
Bulkhead/ Seawall 034-051-000-059-100
Bulkhead/ Seawall 034-051-000-001-400
Bulkhead/ Seawall 034-051-000-005-100
Bulkhead/ Seawall 034-051-000-004-100
Bulkhead/ Seawall 034-045-000-002-200
Revetment 034-045-000-002-300
Revetment 034-045-000-002-100
Revetment 034-046-000-001-100
Revetment 034-039-000-009-100
Bulkhead/ Seawall 034-017-000-113-100
Bulkhead/ Seawall 034-027-000-059-100
Bulkhead/ Seawall 034-016-000-183-100
Revetment 034-016-000-183-200
Revetment 034-050-000-051-100
Bulkhead/ Seawall 034-036-000-106-300
Bulkhead/ Seawall 034-017-000-099-100
Revetment 034-036-000-106-200
Revetment 034-011-000-005-100
Revetment 034-034-000-000-100
Revetment 034-035-000-001-100
Bulkhead/ Seawall 034-036-000-106-100
Groin/ Jetty 034-045-000-002-400
Groin/ Jetty 034-017-000-100-100
Revetment 034-039-000-008-100
Martin’s Well
Bridge Street
Stodder’s Neck
Hingham Shipyard
Hingham Yacht Club
Broad Cove Entrance
Iron Horse Park

42
Risk Based Vulnerability Assessment

43
Risk (R) = Probability of Flooding (P) x
Consequence of Flooding (C)
Risk Based Vulnerability Assessment
R = P X C
For each infrastructure asset, assess:

44
IN Move to Step 2
OUT
Exclude from
further analysis
1 Determine Critical Assets
% Probability of Inundation (2030)

45
Door threshold/ 1st Floor Outdoor equipment
Indoor equipment
Opening to basement
Threshold for
significant damage?
Selecting Critical Elevation
Elevation above which asset would fail to function

46
Mill Street Pump Station
Critical Elevation Threshold:
Rim Elevation at Well = 8.69 ft. NAVD88
(Source: Town data)
Intersection of Rockland & Kilby Street
Critical Elevation Threshold:
Road Elevation = 8.10 ft. NAVD88
(Source: LiDAR, assumptions)
2 Determine Critical Elevations

47
3 Obtain Probability of Exceedence Data
Mill Street Pump Station Critical Elevation Threshold = 8.69 ft. NAVD88
Present 2030 2070
% Probability
Flood
elevation
Depth above
critical elev.
Flood
elevation
Depth above
critical elev.
Flood
elevation
Depth above
critical elev.
0.1 dry 0 11.8 3.11 14.1 5.41
0.2 dry 0 11.5 2.81 14 5.31
0.5 dry 0 11 2.31 13.5 4.81
1 dry 0 10.3 1.61 12.8 4.11
2 dry 0 10 1.31 12.5 3.81
5 dry 0 9.3 0.61 12.1 3.41
10 dry 0 dry 0 11.5 2.81
20 dry 0 dry 0 11.1 2.41
25 dry 0 dry 0 10.9 2.21
30 dry 0 dry 0 10.8 2.11
50 dry 0 dry 0 9.3 0.61
100 dry 0 dry 0 dry 0

48
4 Determine Consequence of Failure Score
Rating Area of
Service Loss
Duration of
Service Loss
Cost of
Damage
Impact on
Public Safety
& Emergency
Services
Impact on
Important
Economic
Activities
Impact on
Public Health
&
Environment
5 Whole
town/city > 30 days > $10m Very high Very high Very high
4 Multiple
neighborhoods 14 - 30 days $1m - $10m High High High
3 Neighborhood 7 - 14 days $100k - $1m Moderate Moderate Moderate
2 Locality 1 - 7 days $10k - $100k Low Low Low
1 Property < 1 day < $10k None None None
Area of
Service Loss
Duration of
Service Loss
Cost of
Damage
Impacts to
Public Safety
Services
Impacts to
Economic
Activities
Impacts to
Public Health/
Environment
Consequence
score
Rating 2 4 2 1 5 5 63
Mill St. Pump
Station

49
5
Calculate Risk Scores and Rankings
tn = Time horizon, n
P = Probability
C = Consequence
R = Risk
t1 = Present
t2 = 2030
t3 = 2070
W = Weight
Rtn = Ptn X Ctn
Rt1(Wt1) + Rt2 (Wt2) + Rt3 (Wt3) = Rt1,t2,t3
50%
30%
20% Present
2030
2070
Weighting

50
5 Calculate Risk Scores and Rankings
Example - Mill Street Pump Station
Probability of
Exceedance
Consequence
ScoreRisk Score Weight
Composite
Risk Score
Present 0 63 0 0.5
2030 5 63 317 0.3
2070 50 63 3167 0.2
728

51
Top 15 Assets Vulnerable to Flooding
Ranked by Composite Risk Score (Preliminary)
Type Name/NumberConsequence
Score
Present
Probability
(%)
Present Risk
Score
2030
Probability
(%)
2030 Risk
Score
2070
Probability
(%)
2070 Risk
Score
Composite
Risk Score
Bulkhead/ Seawall 034-051-000-003-100 60 25 1500 50 3000 100 6000 2850
Facility Bel Air Pump Station 50 20 1000 50 2500 100 5000 2250
Bulkhead/ Seawall 034-051-000-001-200 60 5 300 30 1800 100 6000 1890
Facility William L Foster Elementary School 63 0 0 10 633 100 6333 1457
Facility Howe St Pump Station 47 2 93 25 1167 100 4667 1330
Roadway Rockland St/Kilby St at Foundary Pond Dam 30 10 300 50 1500 100 3000 1200
Revetment 034-030-000-011-100 23 30 700 50 1167 100 2333 1167
Facility Broad Cove Sewer Pump Station 53 0 0 2 107 100 5333 1099
Facility West Corner Pump Station 50 1 25 5 250 100 5000 1088
Bulkhead/ Seawall 034-051-000-005B-100 33 5 167 30 1000 100 3333 1050
Facility Hingham Bathing Beach (Parking Lot) 43 1 22 5 217 100 4333 943
Bulkhead/ Seawall 034-030-000-011-200 33 2 67 20 667 100 3333 900
Bulkhead/ Seawall 034-050-000-050-200 40 1 20 5 200 100 4000 870
Facility Mill St. Pump Station 63 0 0 5 317 50 3167 728
Facility Heliport at Bathing Beach 27 1 27 10 267 100 2667 627
Martin’s Well
Iron Horse Park

52
Top 15 Assets Vulnerable to Flooding
Ranked by Present Day Risk Score
Type Name/NumberConsequence
Score
Present
Probability
(%)
Present Risk
Score
Bulkhead/ Seawall 034-051-000-003-100 60 25 1500
Facility Bel Air Pump Station 50 20 1000
Revetment 034-030-000-011-100 23 30 700
Bulkhead/ Seawall 034-051-000-001-200 60 5 300
Roadway Rockland St/Kilby St at Foundary Pond Dam 30 10 300
Bulkhead/ Seawall 034-051-000-005B-100 33 5 167
Facility Howe St Pump Station 47 2 93
Bulkhead/ Seawall 034-030-000-011-200 33 2 67
Facility Heliport at Bathing Beach 27 1 27
Facility West Corner Pump Station 50 1 25
Facility Hingham Bathing Beach (Parking Lot) 43 1 22
Bulkhead/ Seawall 034-050-000-050-200 40 1 20
Revetment 034-050-000-050-100 23 1 12
Facility William L Foster Elementary School 63 0 0
Facility Broad Cove Sewer Pump Station 53 0 0
Martin’s Well
Iron Horse Park

53
Top 15 Assets Vulnerable to Flooding
Ranked by 2030 Risk Score
Type Name/NumberConsequence
Score
2030
Probability
(%)
2030 Risk
Score
Bulkhead/ Seawall 034-051-000-003-100 60 50 3000
Facility Bel Air Pump Station 50 50 2500
Bulkhead/ Seawall 034-051-000-001-200 60 30 1800
Roadway Rockland St/Kilby St at Foundary Pond Dam 30 50 1500
Revetment 034-030-000-011-100 23 50 1167
Facility Howe St Pump Station 47 25 1167
Bulkhead/ Seawall 034-051-000-005B-100 33 30 1000
Bulkhead/ Seawall 034-030-000-011-200 33 20 667
Facility William L Foster Elementary School 63 10 633
Facility Mill St. Pump Station 63 5 317
Facility Heliport at Bathing Beach 27 10 267
Facility West Corner Pump Station 50 5 250
Facility Hingham Bathing Beach (Parking Lot) 43 5 217
Bulkhead/ Seawall 034-050-000-050-200 40 5 200
Revetment 034-050-000-050-100 23 5 117
Martin’s Well
Iron Horse Park
54
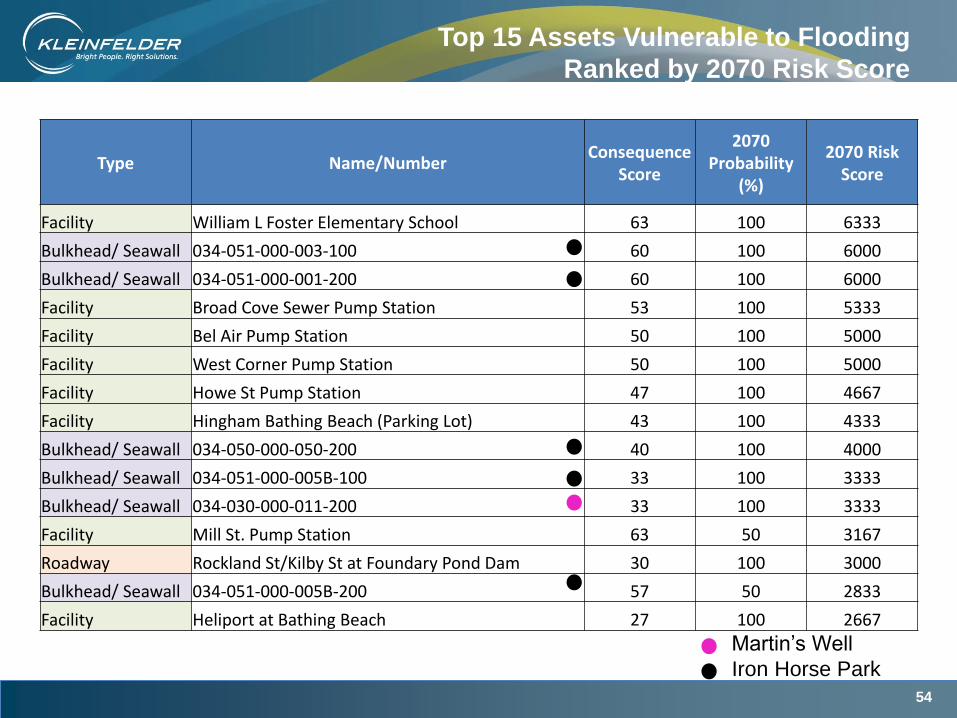
Top 15 Assets Vulnerable to Flooding
Ranked by 2070 Risk Score
Type Name/Number Consequence
Score
2070 Probability
(%)
2070 Risk Score
Facility William L Foster Elementary School 63 100 6333
Bulkhead/ Seawall 034-051-000-003-100 60 100 6000
Bulkhead/ Seawall 034-051-000-001-200 60 100 6000
Facility Broad Cove Sewer Pump Station 53 100 5333
Facility Bel Air Pump Station 50 100 5000
Facility West Corner Pump Station 50 100 5000
Facility Howe St Pump Station 47 100 4667
Facility Hingham Bathing Beach (Parking Lot) 43 100 4333
Bulkhead/ Seawall 034-050-000-050-200 40 100 4000
Bulkhead/ Seawall 034-051-000-005B-100 33 100 3333
Bulkhead/ Seawall 034-030-000-011-200 33 100 3333
Facility Mill St. Pump Station 63 50 3167
Roadway Rockland St/Kilby St at Foundary Pond Dam 30 100 3000
Bulkhead/ Seawall 034-051-000-005B-200 57 50 2833
Facility Heliport at Bathing Beach 27 100 2667
Martin’s Well
Iron Horse Park

55
Thank You - Questions?