Embed Size (px)
Citation preview

TOWN OF FIRESTONE RAW WATER IRRIGATION SYSTEM
MASTER PLAN
MARCH 2010
COLORADO CIVIL GROUP, INC.
Raw Water Irrigation System Master Plan March 2010
i
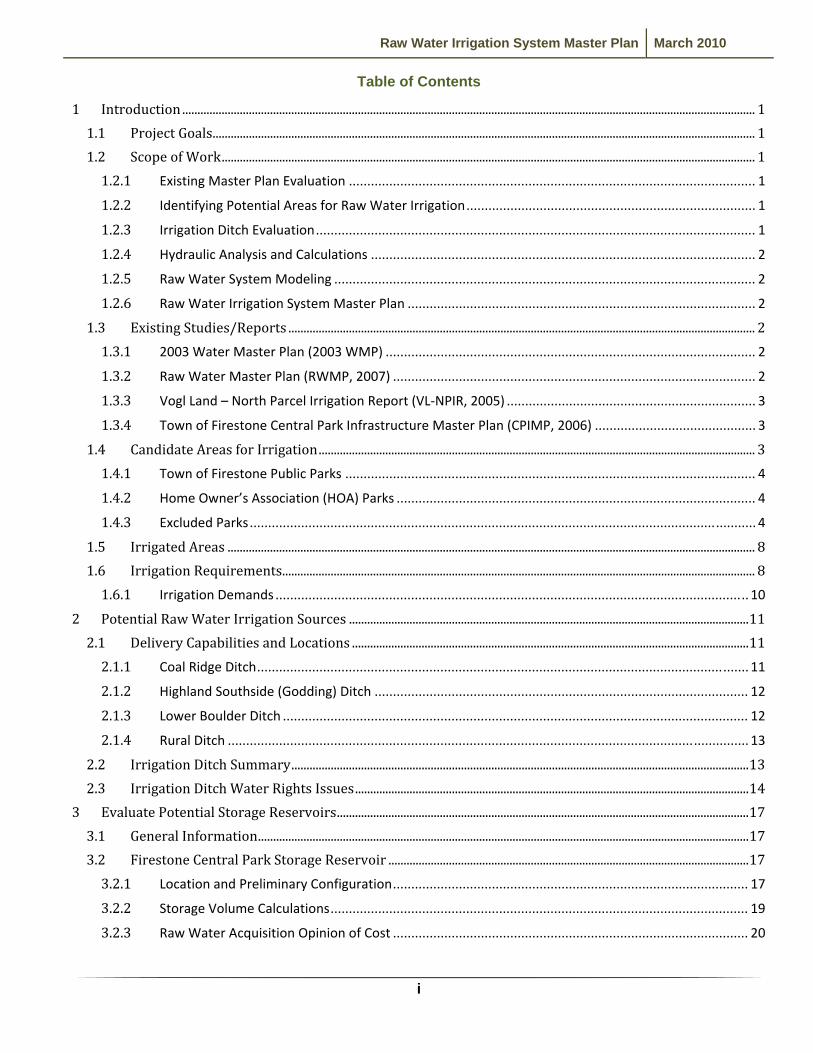
Table of Contents
1 Introduction ............................................................................................................................................................................................. 1 1.1 Project Goals ................................................................................................................................................................................... 1 1.2 Scope of Work ................................................................................................................................................................................ 1 1.2.1 Existing Master Plan Evaluation ............................................................................................................... 1
1.2.2 Identifying Potential Areas for Raw Water Irrigation ............................................................................... 1
1.2.3 Irrigation Ditch Evaluation ........................................................................................................................ 1
1.2.4 Hydraulic Analysis and Calculations ......................................................................................................... 2
1.2.5 Raw Water System Modeling ................................................................................................................... 2
1.2.6 Raw Water Irrigation System Master Plan ............................................................................................... 2
1.3 Existing Studies/Reports .......................................................................................................................................................... 2 1.3.1 2003 Water Master Plan (2003 WMP) ..................................................................................................... 2
1.3.2 Raw Water Master Plan (RWMP, 2007) ................................................................................................... 2
1.3.3 Vogl Land – North Parcel Irrigation Report (VL‐NPIR, 2005) .................................................................... 3
1.3.4 Town of Firestone Central Park Infrastructure Master Plan (CPIMP, 2006) ............................................ 3
1.4 Candidate Areas for Irrigation ................................................................................................................................................ 3 1.4.1 Town of Firestone Public Parks ................................................................................................................ 4
1.4.2 Home Owner’s Association (HOA) Parks .................................................................................................. 4
1.4.3 Excluded Parks .......................................................................................................................................... 4
1.5 Irrigated Areas .............................................................................................................................................................................. 8 1.6 Irrigation Requirements............................................................................................................................................................ 8 1.6.1 Irrigation Demands ................................................................................................................................. 10
2 Potential Raw Water Irrigation Sources .................................................................................................................................... 11 2.1 Delivery Capabilities and Locations ................................................................................................................................... 11 2.1.1 Coal Ridge Ditch ...................................................................................................................................... 11
2.1.2 Highland Southside (Godding) Ditch ...................................................................................................... 12
2.1.3 Lower Boulder Ditch ............................................................................................................................... 12
2.1.4 Rural Ditch .............................................................................................................................................. 13
2.2 Irrigation Ditch Summary ....................................................................................................................................................... 13 2.3 Irrigation Ditch Water Rights Issues .................................................................................................................................. 14
3 Evaluate Potential Storage Reservoirs ........................................................................................................................................ 17 3.1 General Information .................................................................................................................................................................. 17 3.2 Firestone Central Park Storage Reservoir ....................................................................................................................... 17 3.2.1 Location and Preliminary Configuration ................................................................................................. 17
3.2.2 Storage Volume Calculations .................................................................................................................. 19
3.2.3 Raw Water Acquisition Opinion of Cost ................................................................................................. 20
Raw Water Irrigation System Master Plan March 2010
ii
3.3 Vogl North Subdivision Storage Reservoir ...................................................................................................................... 21 3.4 Gravel Pit Storage Reservoirs ............................................................................................................................................... 21
4 Raw Water System Transfer Designs .......................................................................................................................................... 23 4.1 Transfer Pump Station Evaluation (Vogl) ........................................................................................................................ 23 4.2 Transfer Pump Station Evaluation (Public Works Facility) ..................................................................................... 24 4.3 Transfer System Design Criteria .......................................................................................................................................... 25 4.4 Transfer System Opinions of Cost ....................................................................................................................................... 28
5 Raw Water Distribution System Design ..................................................................................................................................... 30 5.1 Distribution System Alignment Evaluation ..................................................................................................................... 30 5.2 Pump and Distribution System Modeling ........................................................................................................................ 30 5.2.1 Average Year Scenario ............................................................................................................................ 34
5.2.2 Drought Year Scenario ............................................................................................................................ 34
5.3 Pump Station Configuration and Sizing ............................................................................................................................ 34 5.4 Intake Structure Evaluation ................................................................................................................................................... 35 5.5 Distribution System Design Criteria ................................................................................................................................... 35 5.6 Distribution System Opinions of Cost ................................................................................................................................ 36 5.7 Alternative Irrigation Supply ................................................................................................................................................ 39
6 Overall Project Opinion of Cost ...................................................................................................................................................... 40 6.1 Annual Operation & Maintenance Expenses ................................................................................................................... 40
7 References .............................................................................................................................................................................................. 41
Appendix A: Park Information ................................................................................................................................................................... A Appendix B: Precipitation and ETO Data ................................................................................................................................................ B Appendix C: Irrigation Demands ............................................................................................................................................................... C Appendix D: Irrigation Ditch Diversion Records ................................................................................................................................ D Appendix E: Storage Calculations ............................................................................................................................................................. E Appendix F: Transfer Pump System Calculations .............................................................................................................................. F Appendix G: Distribution System Pump Calculations ...................................................................................................................... G
Raw Water Irrigation System Master Plan March 2010
1
1 Introduction 1.1 Project Goals
The Town of Firestone has requested that Colorado Civil Group, Inc. prepare a Raw Water Irrigation System Master Plan (RWISMP or Master Plan) on behalf of the Town. The primary goal of this Master Plan is to provide a preliminary layout and design of a raw water system that would irrigate a number of public parks, both existing and future. The system will be sized to accommodate several Home Owner Association (HOA) parks and open spaces. This report also provides an explanation and summary of the various irrigation water supply options as well as water right issues that the Town will need to consider prior to implementing recommendations within this Master Plan.
1.2 Scope of Work The scope of work directed by the Town of Firestone included evaluating existing master plans, identifying potential areas that would benefit from raw water service, reviewing irrigation ditch delivery capabilities, hydraulic analysis and calculations, raw water irrigation system modeling, and creation of the Master Plan document. A brief summary of each significant task is provided below and more detailed discussion is provided in later sections of this Master Plan. 1.2.1 Existing Master Plan Evaluation
To assist with preparation of this Master Plan, several previously prepared reports were evaluated and referenced. These include the 2003 Water Master Plan, Raw Water Master Plan (August 2007), the Vogl Land – North Parcel Irrigation Report, and the Town of Firestone Central Park Infrastructure Master Plan (Draft). Specific information from these reports is referenced throughout this Master Plan.
1.2.2 Identifying Potential Areas for Raw Water Irrigation Existing and future park locations were evaluated to determine which sites would benefit most from this raw water irrigation system. Priority was placed on Town of Firestone public parks; however several HOA parks and open spaces were identified as potential candidates to be included. Specific public parks, HOA parks, and open spaces identified for inclusion are discussed further in this Master Plan. Parks and open spaces not evaluated in this Master Plan are listed with reasons for their exclusion.
1.2.3 Irrigation Ditch Evaluation Existing irrigation ditches within the Firestone area were evaluated to determine their ability to support the proposed raw water irrigation system currently and in the future. Various water right issues associated with acquisition and using irrigation ditch water is also explained and summarized in Section 2.3 of this Master Plan.
Raw Water Irrigation System Master Plan March 2010
2
1.2.4 Hydraulic Analysis and Calculations Hydraulic analysis and calculations were prepared to aid in the layout and design of the raw water irrigation system. This includes the following:
• Supply hydrographs for the four irrigation ditches • Demand hydrographs for the selected public parks, HOA parks, and open spaces • Demand calculations identifying the application and delivery rates of raw water to
the irrigated areas • Storage calculations for sizing the raw water irrigation reservoirs
1.2.5 Raw Water System Modeling
The proposed raw water irrigation system was modeled to determine distribution pipe layout, sizing, and the pump requirements. Detailed modeling assumptions, methods and results are presented in later sections of this Master Plan.
1.2.6 Raw Water Irrigation System Master Plan This RWISMP has been prepared to provide the Town of Firestone with a comprehensive report to implement the development of a raw water irrigation system. The plan provides a design and layout of the raw water system as well as a summary of the calculations and assumptions. The plan also provides an analysis of the possible raw water sources and the water rights issues that will be encountered in pursuing acquisition of the raw water supply for the system. A cost analysis and estimate is also provided for the infrastructure improvements.
1.3 Existing Studies/Reports Several existing reports have been prepared that relate to this Master Plan. These reports have been studied and in some cases referenced prior to the preparation of this document. Those reports have been listed and summarized in the following sections. 1.3.1 2003 Water Master Plan (2003 WMP)
A water master plan was prepared for the Town in 2003 by TST, Inc. Consulting Engineers. This report assisted in the design and expansion of the potable water system and identified anticipated infrastructure needs for future development. The report also provided some analysis for a future raw water irrigation system. Water right issues were addressed for irrigation ditches and agricultural wells. A preliminary demand projection and conceptual layout were also provided.
1.3.2 Raw Water Master Plan (RWMP, 2007) A raw water master plan was prepared for the Town in 2007 by Clear Water Solutions, Inc. This report was prepared to assist the Town in implementing a policy for raw water
Raw Water Irrigation System Master Plan March 2010
3
development and acquisition. This document contains very detailed information on the irrigation ditches, water rights, and yields provided by each. This information is referenced throughout this Master Plan.
1.3.3 Vogl Land – North Parcel Irrigation Report (VLNPIR, 2005) An irrigation report was prepared for the Vogl Land - North Parcel by Prominence Development Corporation in 2005. The report presented the design of the proposed raw water system for the Vogl development including demand calculations, delivery system, pump, and storage reservoir designs. The water rights associated with the property were also discussed along with the dedication of irrigation ditch shares to the Town of Firestone. The technical information on the Coal Ridge Ditch within this report was prepared by Leaf Engineering, Inc. on behalf of the Ditch Company.
1.3.4 Town of Firestone Central Park Infrastructure Master Plan (CPIMP, 2006) A Central Park Infrastructure Master Plan was prepared by TST, Inc. in 2006. The Master Plan is available as a Draft and was never finalized. Section 8 of the CPIMP, 2006 focused on the implementation of a raw water irrigation system at Central Park. The report discussed the landscaping concept, provided assumptions for the total irrigated area, discussed irrigation storage pond alternatives, and provided conceptual interim and ultimate pond designs. Several assumptions in the report have been used in preparation of this Master Plan. These assumptions are summarized in later sections of this report.
1.4 Candidate Areas for Irrigation
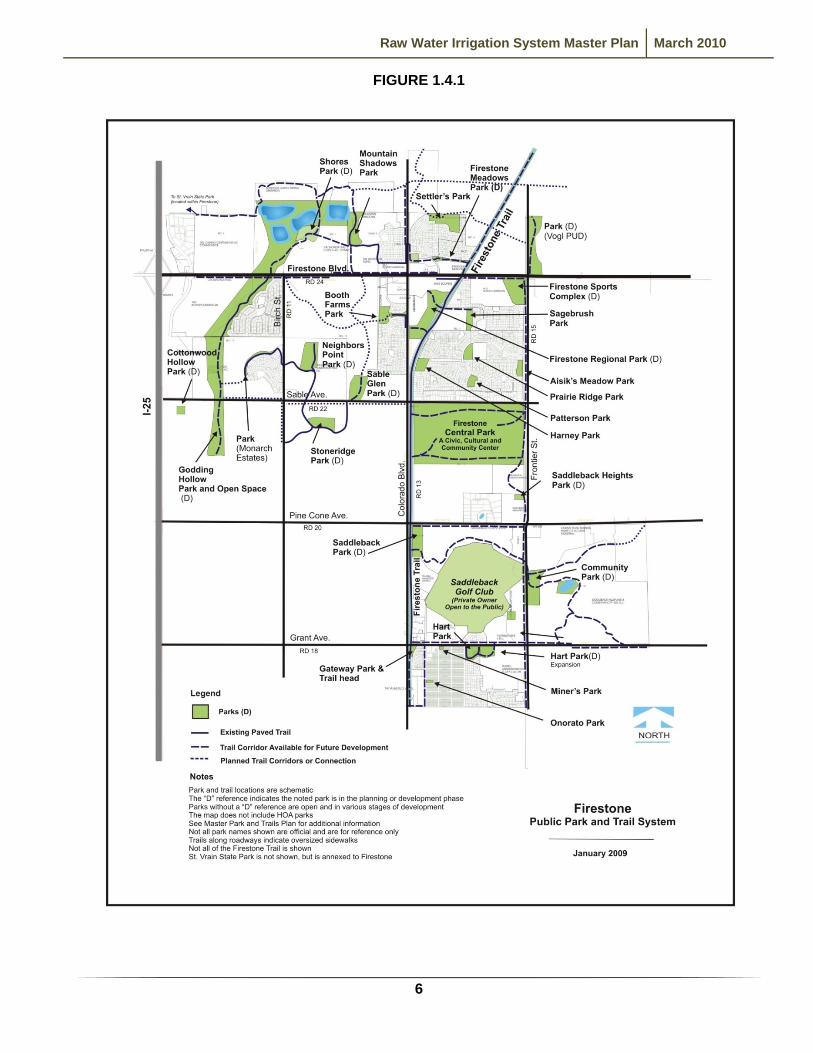
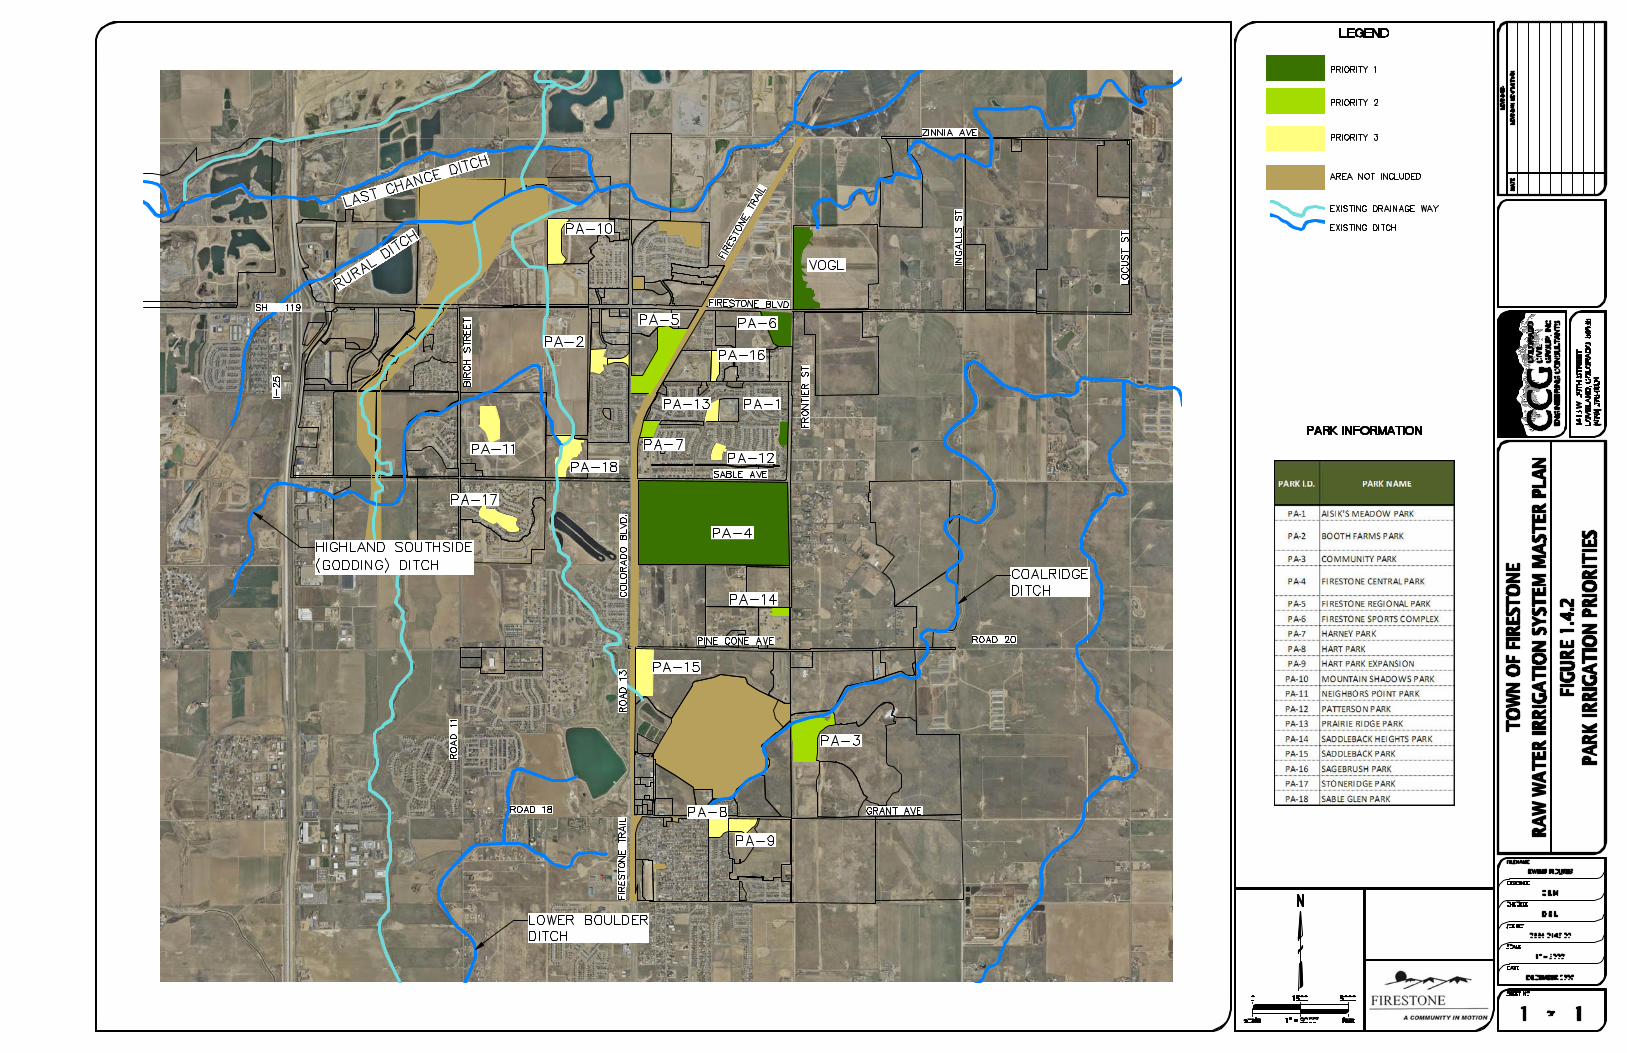
The Town of Firestone Master Plan 2008 identified all of the candidate areas that could be served by the raw water irrigation system. Figure 18: Parks, Trails and Open Space: Phase 1 from this document is shown as Figure 1.4.1 on page 6. Existing and future parks, trails, and open spaces within the Town of Firestone were evaluated to determine which areas should be irrigated with the Town’s proposed raw water system. After the areas were determined to be included, a priority assignment from 1 to 3 was give to each of the parks/open spaces that will assist with phasing of the necessary infrastructure construction. Priority 1 parks were chosen due to their proximity to the initial infrastructure necessary to connect the raw water source with the storage and pumping facilities (Central Park). Figure 1.4.2 lists all of the included parks, with their Park I.D. and shows the priority rankings. The determination of which parks will be irrigated with the raw water system is a recommendation and can be revised in the future depending on the goals of the Town’s Parks and Trails Committee, Planning Commission, and/or the Town Board.
Raw Water Irrigation System Master Plan March 2010
4
1.4.1 Town of Firestone Public Parks The parks that are to be irrigated with the raw water system were chosen based on several factors including: reduction in use of potable water used for irrigation and proximity to proposed distribution system. The proximity to the proposed distribution system is an important factor because it helps to minimize infrastructure and maintenance costs for the Town. For this reason, parks located west of Colorado Boulevard were not determined to be a high priority. Raw water distribution mains were laid out with the goal of minimizing infrastructure costs, while being located in Town right-of-way or other corridors that allow access and simple construction. It may be beneficial to meter the raw water at each location. This will ensure that the usage follows the recommendations within this Master Plan.
1.4.2 Home Owner’s Association (HOA) Parks HOA parks included in this Master Plan were chosen based on their proximity to proposed raw water infrastructure that would be serving Town parks. The choice to connect to the Town’s system would be made by each individual HOA and not dictated by the Town. A raw water rate would need to be determined by the Town so that each HOA could be billed for their metered usage.
1.4.3 Excluded Parks
It is not economically feasible to irrigate all existing and future parks and open spaces in the Town with a raw water irrigation system. The reasons are primarily the distance from the proposed infrastructure and the park(s) size. In some instances, it would not be beneficial to extend infrastructure to serve just one park. Some of the parks within Firestone are relatively small in size and do not have a significant irrigation demand. The costs to extend raw water infrastructure to these areas cannot be justified. Parks not included in this study are listed below with the primary reason(s) for their exclusion.
1. Cottonwood Hollow Park • Primarily a non-irrigated natural area • Distance from proposed raw water system infrastructure • Relatively small size
2. Firestone Meadows Park • Distance from proposed raw water system infrastructure • Relatively small size
3. Firestone Trail • Primarily a non-irrigated natural area • Small percentage of natural areas and open space will require irrigation.
These areas can be evaluated on a case by case basis. If the raw water irrigation infrastructure is installed in the vicinity of these areas, then it may be beneficial to connect them to this system. These irrigated areas
Raw Water Irrigation System Master Plan March 2010
5
are relatively small and can be considered, negligible compared to the system.
4. Gateway Park & Trailhead • Relatively small size
5. Godding Hollow Park & Open Space • Primarily a non-irrigated natural area • Small percentage of natural areas and open space will require irrigation
6. Miner’s Park • Relatively small size
7. Monarch Estates Park • Distance from proposed raw water system infrastructure
8. Onorato Park • Relatively small size
9. Saddleback Golf Club • Served by a private raw water irrigation system
10. Settler’s Park • Distance from proposed raw water system infrastructure
11. Shores Park • Distance from proposed raw water system infrastructure
12. Vogl • To be served by a future private raw water irrigation system
The Vogl North Park is shown as a Priority 1 park in Figure 1.4.2 but has not been accounted for in this Master Plan. The Vogl project will be developed with a raw water irrigation system that will be owned and operated by the Town of Firestone. A preliminary design has previously been prepared for this system, excluding this area from the calculations within this Master Plan.
Raw Water Irrigation System Master Plan March 2010
6
FIGURE 1.4.1

Raw Water Irrigation System Master Plan March 2010
8
1.5 Irrigated Areas
After the candidate parks were identified, the irrigated area for each location was determined. Table A1 (Appendix A) lists the gross acreage for each park based on the Town’s records. Because each park contains a combination of parking lots, playgrounds, sidewalks, non-irrigated areas, athletic courts, etc., only a percentage of each park will be irrigated. Aerial photos were used along with field inspections to determine the irrigated percentage for multiple parks, which are as follows: • Aisik’s Meadow Park (22.3% irrigated area) • Harney Park (64.8% irrigated area) • Hart Park (70.4% irrigated area) • Settler’s Park (86.8% irrigated area)
The results from these calculations are shown on Figure A1 (Appendix A) and yield a weighted irrigated area average of 67.0%. For the purposes of this master plan, the percentage was increased to 75.0% for all park and open space areas except for Firestone Central Park. The CPIMP, 2006 listed the irrigated area for Firestone Central Park as 90.0 acres, which is equivalent to 34.4% of the total area. The total irrigated area for the Priority 1-3 parks is 241.5 acres per Table A1 (Appendix A).
1.6 Irrigation Requirements The irrigation demand is a function of the local climate and the type of landscaping to be irrigated. These parameters determine the evapotranspiration (ETO) rate, which is defined as the process of transferring moisture from the earth to the atmosphere by evaporation of water and transpiration from plants. The ETO rate is the historical grass reference evapotranspiration for the growing season of April 1 through October 31 and is used to determine the amount of water a typical landscape would require during this period. The ETO requirement is satisfied in two ways, irrigation and precipitation. ETO and precipitation data is collected and recorded by the Northern Colorado Water Conservancy District (NCWCD) at twenty four (24) weather station locations within the District. The ETO data is logged daily during the months of March through October and the precipitation data is logged daily on an annual basis. This data can be found at the NCWCD website (www.ncwcd.org).
For this Master Plan, the Longmont South weather station was selected because of its proximity to the Town of Firestone. This weather station is identified as an alfalfa hay site at Swalde Farm and is located on Lookout Road just east of the intersection with Highway 287. This weather station is approximately 10.25 miles (cross country) from the intersection of Firestone Boulevard and Colorado Boulevard. Data from this weather station as taken from the NCWCD website and used to create the following Tables in Appendix B:
• Table B1 Precipitation Summary, Longmont South • Table B2 ETO Summary, Longmont South • Tables B3 (2007) – B13 (1998) NCWCD Weather Station Data, Longmont South
Raw Water Irrigation System Master Plan March 2010
9
The monthly precipitation data is summarized in Table B1 and the monthly ETO data is summarized in Table B2 for the years 1998 through 2007. The daily precipitation and ETO data is listed in Tables B3 through B12 for the years 2007 through 1998, respectively. Due to the amount of information, Tables B3 – B12 can be found on the CD in Appendix B.
This data has been used to establish the average ETO and precipitation rates from 1998 to 2007. During these 10 years the average precipitation was 11.64 inches and the average ETO was 39.43 inches. The results from this 10 year period were used to establish the Average Year Scenario. In 2002, the State of Colorado experienced one of the worst drought years on record. During this year the precipitation was 8.18 inches and the average ETO was 41.84 inches. The data from the year 2002 was used to establish the Drought Year Scenario.
A third and final scenario was also evaluated as requested by the Public Works Department. This scenario assumes that 2 inches of raw water will be applied per week during the entire irrigation season. This constant application is independent of precipitation rates or ETO requirements. This scenario is referred to as the Public Works Scenario throughout this Master Plan.
The NCWCD has an established procedure for calculating the irrigation demand as a function of several variables including the ETO, lawn type, precipitation, and irrigation application efficiency. A detailed explanation of these calculations can be found in Appendix C. The irrigation demand has been calculated for the following lawn types as defined by the NCWCD:
1. High-Performance Lawn (HPL) – Ideal for heavy use such as sports fields, high-use parks, or requires a aesthetic appearance because of surrounding uses. The High Performance Lawn has a crop coefficient of Kc = 0.90.
2. Traditional Lawn (TL) – Found in most residential neighborhoods, parks, businesses, shopping centers, etc. where foot traffic and uses are not excessive. The Traditional Lawn has a crop coefficient of Kc = 0.81.
3. Low Maintenance Lawn (LML) – Seldom used for activities but is used to cover the ground to control erosion, weed infestation, or serve as a firebreak. Traffic medians, greenbelts, detention ponds, or even home lawns can fall into this category. Typically these lawns require less mowing, fertilizer and water. The Low Maintenance Lawn has a crop coefficient of Kc = 0.72.
Although some areas within the Town of Firestone parks and open space areas may fall into the high-performance and low maintenance lawn categories, the traditional lawn category has been used to calculate an average irrigation demand for all areas. Even areas such as the Firestone Sports Complex will have a combination of all three lawn types. The irrigation requirements for the high-performance lawn, traditional lawn, and low maintenance lawn can be found in Tables C1, C2, and C3, respectively for the average year scenario. The annual irrigation requirement for a traditional lawn is 2.48 acre-feet per acre (Table C2). The monthly irrigation requirements from Tables C1 – C3 are plotted on Figure C1 (Appendix C).
Raw Water Irrigation System Master Plan March 2010
10
The irrigation requirements for the high-performance lawn, traditional lawn, and low maintenance lawn can be found in Tables C4, C5, and C6, respectively for the drought year scenario. The monthly irrigation requirement from these tables is plotted on Figure C2 in Appendix C. The annual irrigation requirement for a traditional lawn is 2.96 acre-feet per acre (Table C5), which is a 19.4% increase over the average year scenario. The irrigation requirements for the public works scenario can be found in Table C7 and on Figure C3 in Appendix C.
As previously mentioned the public works scenario assumes that 2 inches of raw water will be applied per week during the entire irrigation season. The only variable under this scenario is the number of days per month during the irrigation season. The annual irrigation requirement for this scenario is 5.10 acre-feet per acre (Table C7), which is a 105.7% increase over the average year scenario.
1.6.1 Irrigation Demands
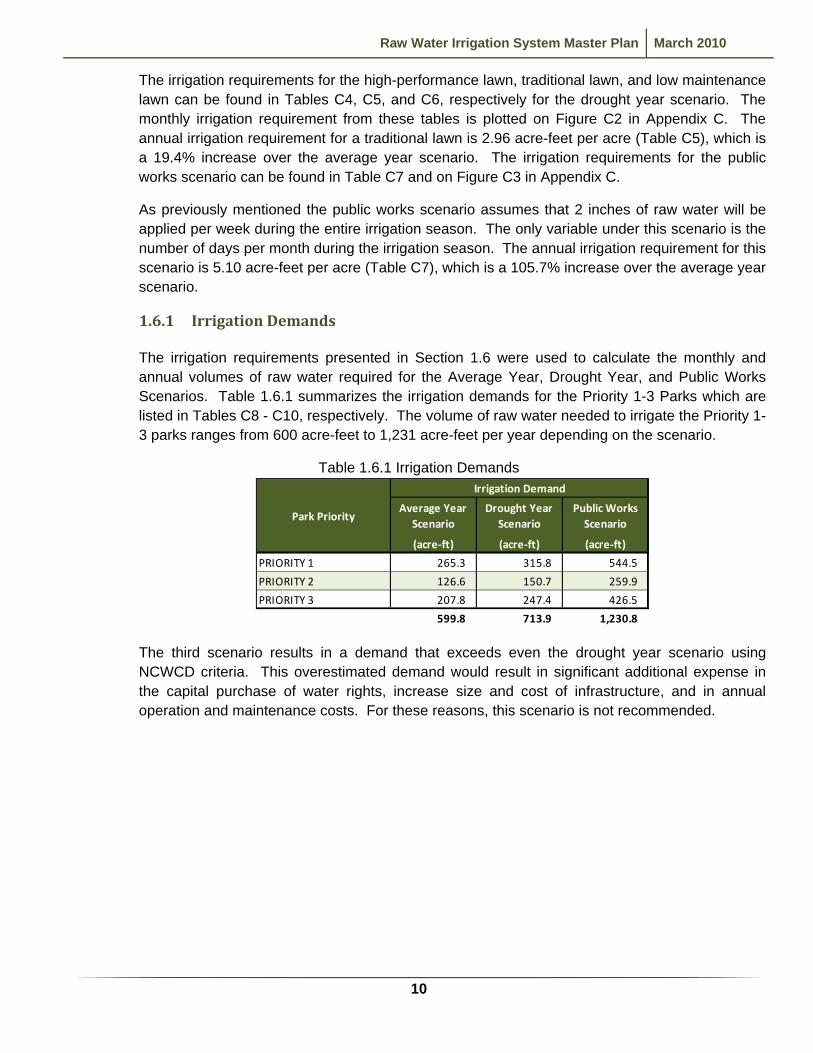
The irrigation requirements presented in Section 1.6 were used to calculate the monthly and annual volumes of raw water required for the Average Year, Drought Year, and Public Works Scenarios. Table 1.6.1 summarizes the irrigation demands for the Priority 1-3 Parks which are listed in Tables C8 - C10, respectively. The volume of raw water needed to irrigate the Priority 1-3 parks ranges from 600 acre-feet to 1,231 acre-feet per year depending on the scenario.
Table 1.6.1 Irrigation Demands
(acre‐ft) (acre‐ft) (acre‐ft)
PRIORITY 1 265.3 315.8 544.5
PRIORITY 2 126.6 150.7 259.9
PRIORITY 3 207.8 247.4 426.5
599.8 713.9 1,230.8
Park PriorityAverage Year
ScenarioDrought Year
ScenarioPublic Works Scenario
Irrigation Demand
The third scenario results in a demand that exceeds even the drought year scenario using NCWCD criteria. This overestimated demand would result in significant additional expense in the capital purchase of water rights, increase size and cost of infrastructure, and in annual operation and maintenance costs. For these reasons, this scenario is not recommended.
Raw Water Irrigation System Master Plan March 2010
11
2 Potential Raw Water Irrigation Sources 2.1 Delivery Capabilities and Locations
The delivery capabilities of the existing irrigation ditches near or within the Town of Firestone were researched in detail and reported to the Town (RWMP, 2007). Sections 2.1.1 – 2.1.4 summarize the delivery capabilities and locations of four of the available irrigation ditches, which are listed below: • Coal Ridge Ditch • Highland Southside (Godding) Ditch • Lower Boulder Ditch • Rural Ditch These four irrigation ditches are the most feasible sources of raw water for the Town’s irrigation system (RWMP, 2007). Hydrographs were created for these four irrigation ditches to show the average monthly diversions (total and per share) based on data from previous reports. The data for the irrigation ditch diversions for the Highland Southside (Godding), Lower Boulder and Rural ditches represent the years 1950 to 2005 and were provided in the RWMP, 2007. Diversion records for the Coal Ridge Ditch represent a fifty year average and were provided in the VL-NPIR, 2005.
2.1.1 Coal Ridge Ditch The Coal Ridge Ditch delivery is measured in Section 25, Township 2 North, Range 68 West of the 6th Principal Meridian (P.M.), Weld County. This ditch shares water rights with the Lower Boulder Ditch Company. The Coal Ridge Ditch Company owns 48 preferred shares of Lower Boulder Ditch water, which are divided into 2,100 shares of the Coal Ridge Ditch Company (RWMP, 2007). The Coal Ridge Ditch has a 50-year average annual diversion of 1.25 acre-feet per share which is used for the average-year scenario. This ditch had an annual diversion of 1.05 acre-feet (16% reduction) per share in 2002 which is used for the drought-year scenario. This data was taken from the monthly flow rates provided in Table 2 (VL-NPIR, 2005) and is summarized in Table D1 (Appendix D). Hydrographs illustrating the monthly diversions in acre-feet for both scenarios are shown on Figure D1 (Appendix D). This ditch has the smallest diversion per share of the four referenced in this Master Plan.
A discrepancy exists between two of the existing studies/reports referenced in this Master Plan. The RWMP, 2007 states that the Coal Ridge Ditch has an average annual diversion of 0.50 acre-ft and the VL-NPIR, 2005 states that the value is approximately 1.25 acre-feet. The average annual diversion rate of 1.25 acre-feet was used in this Master Plan, while the price of $6,000 per acre-foot (RWMP, 2007) was used to set a price per share of $7,500. Even if the diversion rate per share is found to be different, the price per acre-foot should remain constant. The Coal Ridge Ditch is the ideal raw
Raw Water Irrigation System Master Plan March 2010
12
water supply option for the Town of Firestone (RWMP, 2007). The advantages to this option are location (providing the ability to gravity feed most parts of town) and price (it is the least expensive per acre-foot in the area). Furthermore, this water right can be acquired through annexation because there are existing lands within the Town limits that were historically irrigated with this ditch right. Because of these benefits, the Town of Firestone should actively pursue the acquisition of Coal Ridge Ditch irrigation shares. This Master Plan further evaluates the Coal Ridge Ditch as the primary source to support the raw water irrigation system, at least in the foreseeable future.
2.1.2 Highland Southside (Godding) Ditch The Highland Southside (Godding) Ditch has its head gate on Idaho Creek, located in Section 21, Township 2 North, Range 68 West of the 6th P.M., Weld County. The Highland Southside (Godding) Ditch Company has 183 shares, which deliver an average annual diversion of 27.2 acre-feet per share for the years 1950-2005 which is used for the average-year scenario. The Highland Southside (Godding) Ditch had an annual diversion of 8.3 acre-feet (69.5% reduction) per share in 2002 which is used for the drought-year scenario. This information was provided in the RWMP, 2007 (Appendix A) and is summarized in Table D2 (Appendix D). Hydrographs illustrating the monthly diversions in acre-feet for both scenarios are shown on Figure D2 (Appendix D).
The approximate cost per share is $177,000 which equivalent to $6,500 per acre foot. The cost per share was estimated as it could not be confirmed through the ditch company or water brokers (RWMP, 2007). The Highland Southside (Godding) Ditch should be considered on a case-by-case basis due to the need for storage to irrigate in its off-peak delivery months (RWMP, 2007). The report states that if shares become available to the Town through annexation, the Town should accept the Highland Southside (Godding) Ditch water. This ditch right was significantly impacted during the drought year scenario. For these reasons, this ditch right has not been further evaluated as the source to support the raw water irrigation system in this Master Plan.
2.1.3 Lower Boulder Ditch
The Lower Boulder Ditch head gate is on Boulder Creek, located in Section 16, Township 1 North, Range 69 West of the 6th P.M., Boulder County. The ditch company has preferred (200 shares) and common (200 shares) shares, with the preferred shares being very senior and the common shares being very junior. In dry years, the junior shares yield very little, if any irrigation water. The Lower Boulder Ditch has an average annual diversion of 23.1 acre-feet per preferred share and 7.7 acre-feet per common share for the years 1950-2005 which are used for the average-year scenario. The Lower Boulder Ditch had an annual diversion of 17.9 acre-feet (22.5% reduction) per preferred share and 6.0 acre-feet (22.0% reduction) per common share in 2002 which are used for the drought-year scenario. This information was provided in the RWMP, 2007 and is summarized in Table D3 (Appendix D). Hydrographs illustrating the monthly
Raw Water Irrigation System Master Plan March 2010
13
diversions in acre-feet for both scenarios/share types are shown on Figure D3 (Appendix D). The approximate cost per preferred share is $190,000 and $30,000 per common share, which is equivalent to $8,300 and $3,900 per acre-foot, respectively. The Lower Boulder Ditch Company owns shares of Colorado Big Thompson (CBT) water which is uses to supplement deliveries of its common shares. Although the RWMP, 2007 identifies Lower Boulder Ditch preferred shares as a good raw water supply option, due to its seniority, location and cost per acre-foot, this ditch right has not been further evaluated as the source to support the raw water irrigation system in this Master Plan. This is due mainly to the cost of the shares per acre-foot and the difficulty in transferring this raw water to the proposed storage reservoir(s).
2.1.4 Rural Ditch
The Rural Ditch also has its head gate on Boulder Creek, located in Section 20, Township 2 North, Range 68 West of the 6th P.M., Weld County. The Rural Ditch Company has 50 shares, which deliver an average of 113.8 ac-ft per share for the years 1950-2005 which is used for the average-year scenario. The Rural Ditch had an annual diversion 100.8 acre-feet (11.4% reduction) per share in 2002 which is used for the drought-year scenario. The Rural Ditch has the largest diversion per share of the four irrigation ditches. This information was provided in the RWMP, 2007 and is summarized in Table D4 (Appendix D). Hydrographs illustrating the monthly diversions in acre-feet for both scenarios are shown on Figure D4 (Appendix D).
The approximate cost per share ranges from $800,000 to $1,000,000 according to the Rural Ditch rider, which is equivalent to $7,030 to $8,790 per acre foot. The RWMP, 2007 identifies the Rural Ditch as a raw water supply option to be considered on a case-by-case basis due to limited availability and the need for storage to irrigate in its off-peak delivery months. The report states that if shares become available to the Town through annexation, the Town should accept the Rural Ditch water to help diversify the Town’s raw water portfolio. For these reasons, this ditch right has not been further evaluated as the source to support the raw water irrigation system in this Master Plan.
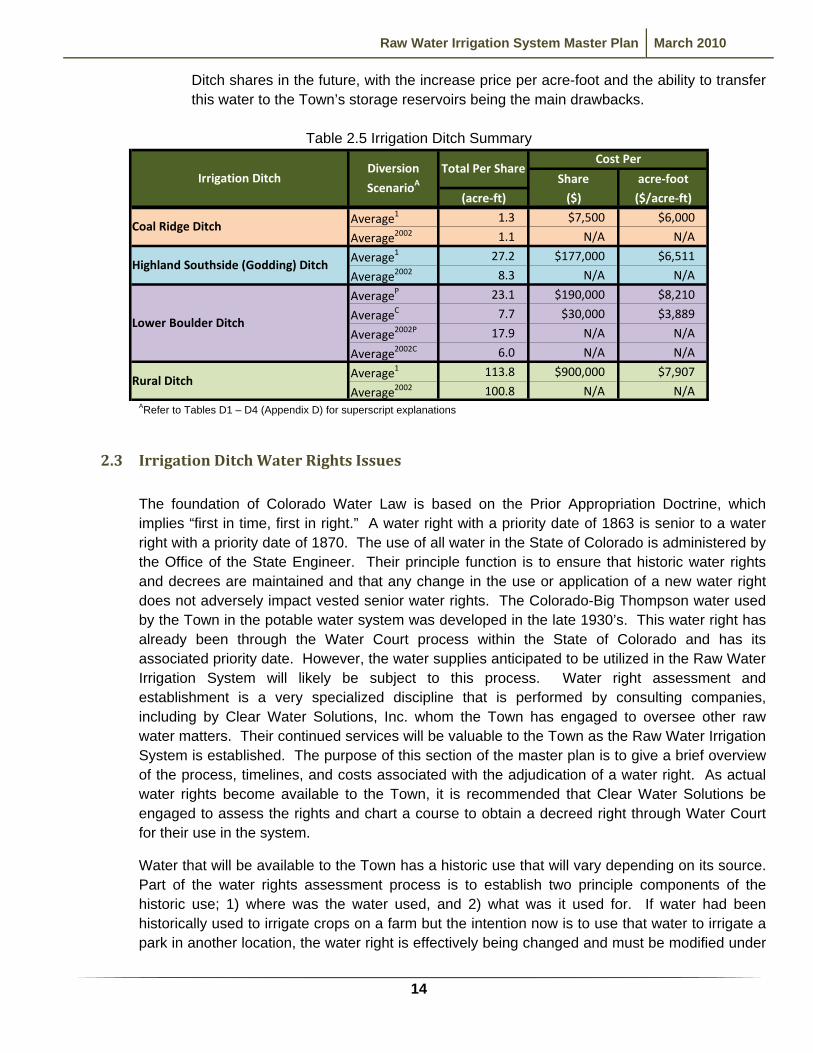
2.2 Irrigation Ditch Summary
The monthly and annual diversions for the average-year and drought-year scenarios are summarized in Table D5 (Appendix D) for all four irrigation ditches mentioned previously. The annual diversions and costs per share (and acre-foot) are summarized in Table 2.5, on the following page. Because the Coal Ridge Ditch and Lower Boulder Ditch were identified as the best options for a raw water supply: a comparison was prepared to show the percent distribution of the annual delivery per month. This comparison is shown in Table D6, and illustrates that both ditches have a similar delivery distribution. Because these are similar, the Coal Ridge Ditch is used for further evaluations in this Master Plan. Coal Ridge Ditch shares could be substituted with Lower Boulder
Raw Water Irrigation System Master Plan March 2010
14
Ditch shares in the future, with the increase price per acre-foot and the ability to transfer this water to the Town’s storage reservoirs being the main drawbacks.
Table 2.5 Irrigation Ditch Summary
Share acre‐foot
(acre‐ft) ($) ($/acre‐ft)
Average1 1.3 $7,500 $6,000
Average2002 1.1 N/A N/A
Average1 27.2 $177,000 $6,511
Average2002 8.3 N/A N/A
AverageP 23.1 $190,000 $8,210
AverageC 7.7 $30,000 $3,889
Average2002P 17.9 N/A N/A
Average2002C 6.0 N/A N/A
Average1 113.8 $900,000 $7,907
Average2002 100.8 N/A N/ARural Ditch
Irrigation Ditch
Cost PerDiversion
ScenarioATotal Per Share
Coal Ridge Ditch
Highland Southside (Godding) Ditch
Lower Boulder Ditch
ARefer to Tables D1 – D4 (Appendix D) for superscript explanations
2.3 Irrigation Ditch Water Rights Issues
The foundation of Colorado Water Law is based on the Prior Appropriation Doctrine, which implies “first in time, first in right.” A water right with a priority date of 1863 is senior to a water right with a priority date of 1870. The use of all water in the State of Colorado is administered by the Office of the State Engineer. Their principle function is to ensure that historic water rights and decrees are maintained and that any change in the use or application of a new water right does not adversely impact vested senior water rights. The Colorado-Big Thompson water used by the Town in the potable water system was developed in the late 1930’s. This water right has already been through the Water Court process within the State of Colorado and has its associated priority date. However, the water supplies anticipated to be utilized in the Raw Water Irrigation System will likely be subject to this process. Water right assessment and establishment is a very specialized discipline that is performed by consulting companies, including by Clear Water Solutions, Inc. whom the Town has engaged to oversee other raw water matters. Their continued services will be valuable to the Town as the Raw Water Irrigation System is established. The purpose of this section of the master plan is to give a brief overview of the process, timelines, and costs associated with the adjudication of a water right. As actual water rights become available to the Town, it is recommended that Clear Water Solutions be engaged to assess the rights and chart a course to obtain a decreed right through Water Court for their use in the system.
Water that will be available to the Town has a historic use that will vary depending on its source. Part of the water rights assessment process is to establish two principle components of the historic use; 1) where was the water used, and 2) what was it used for. If water had been historically used to irrigate crops on a farm but the intention now is to use that water to irrigate a park in another location, the water right is effectively being changed and must be modified under
Raw Water Irrigation System Master Plan March 2010
15
the laws of Colorado. For virtually all of the available raw water supplies that the Town would be able to utilize, the historic use was irrigation of cultivated crops and is described as a “direct flow” right. This simply means that the water is taken directly from river, diverted through the ditch system and applied to the irrigated crop. Colorado Water Law allows for only 72 hours of storage before the water must be diverted for its decreed irrigation use. The reason for this is to eliminate an expansion of use, which in this case, is the loss of water introduced due to evaporation and the changing of return flow patterns. If the water is stored for more than 72 hours, then you are effectively causing an expansion of use and the water right must be modified under the laws of Colorado. Additionally, what the water was historically used to irrigate versus what is intended to irrigate can initiate a change of the use.
The Raw Water Irrigation System proposed by this master plan will certainly involve a change of use or location of use of the local water rights and will require a formal application through Water Court. This is accomplished in two steps that involve the State Engineer’s Office and Colorado Water Court. To change a water right, an application to Water Court is required. This is a legal process that adjudicates a right and gives the water right owner legal authority to use the water for the purpose stated in the Water Court application. Once decreed, the water right owner is required to only use the right under the specific terms and condition of the decree. The purpose of the terms and conditions is to ensure that other water rights are not adversely affected.
For example; The Town’s system will utilize extended storage in ponds for two purposes. The primary purpose is to allow the Town to take water whenever the ditch system can deliver it and then store it until it is needed for irrigation. In addition, the storage ponds will likely be utilized for recreational/aesthetic opportunities. Storage of the water beyond 72 hours will result in evaporative losses that diminish the water that would have normally made it back into the river system. That loss is not acceptable to downstream water rights so that loss must be augmented, or replaced. To accomplish augmentation the evaporative loss must be determined and an equal amount of water sent back into the river system. If the Town owns 100 acre-feet of raw water but 15 acre-feet is lost to evaporation every year, the Town will actually only yield 70 acre-feet of usable water. Under that scenario 15 acre-feet is lost to evaporation and another 15 acre-feet must be used to replenish the river system. In addition, changes in timing of return flows will need to be considered.
The Water Court process can take many years to complete and receive a Court-decreed water right. During that period the Town can proceed with an interim, temporary plan on an annual basis. This is called a Substitute Water Supply Plan. It is structured similar to a Plan for Augmentation through Water Court and is reviewed by the State Engineer. Once approved, this plan will allow the Town to proceed with use of the system. The Substitute Water Supply Plan can be approved for up to 5 years. The intent of the 5-year window is to allow applicants to operate under the State Engineer while the Water Court process plays out. The idea is that by the end of the 5 years, a decree will be entered by the Court. If the Court has not entered a decree by that point, continued approval on a year-to-year basis can be granted so long as adequate due diligence can be shown. Inadequate diligence is cause for the Town’s case to be thrown out and the irrigation system to be shut down. Clear Water Solutions can help to ensure this does not happen.
Raw Water Irrigation System Master Plan March 2010
16
The Water Court process timing and costs are very difficult to accurately predict as third party objectors are involved. For the purposes of this master plan it recommended that 7 years and $150,000.00 be anticipated for the Water Court process. The principle costs associated with this process are the consultant and legal fees incurred in defending the Town’s case with any objectors in the river system. Typically there are water rights owners that will demand a closer examination of the Town’s engineering and the impact of the Town’s proposed plan on their water rights. These defenses involve both evaluation and negotiation and can be very time consuming. The Substitute Water Supply Plan also has a number of variables involved but is a somewhat more predictable process. For purposes of this master plan it is recommended that 7 months and $30,000 be anticipated for the Substitute Water Supply Plan process. The principle costs associated with this process are the consultant fees incurred to assess the water right and prepare the plan. This can take up to 4 months and is then submitted to the Office of the State Engineer for their review. The State’s review and approval process can take up to 3 months.
It should be noted that this process (or some component of it) will apply every time the Town secures and wishes to change the use or location of use of a water right. For that purpose it is further recommended that the Town strategically plan acquisition of raw water rights so that several rights can be processed simultaneously with a Water Court application to limit Water Court Amendments. Each time the Town amends its court case, it opens the door to additional objectors. Limiting this will help control the substantial cost of obtaining decreed rights for use in the Raw Water Irrigation System.
Raw Water Irrigation System Master Plan March 2010
17
3 Evaluate Potential Storage Reservoirs 3.1 General Information
The irrigation system will consist of diverting the raw water from the irrigation ditch (inflow), transferring it to a temporary storage reservoir, and distributing (outflow) it to the various parks and open spaces for irrigation. A storage reservoir will be necessary to balance the irrigation inflow and outflow, since the flow rates change over time and vary from each other. The storage reservoir will ensure that there is enough raw water to distribute to the parks and open spaces to satisfy the irrigation requirement. This is further explained in the following subsections. Also, as previously discussed, there are a number of potential inflow sources that could be used individually or (more likely) in combination to meet the irrigation demand. For purposes of simplifying this evaluation, Coal Ridge Ditch supply parameters were used to determine inflow.
3.2 Firestone Central Park Storage Reservoir
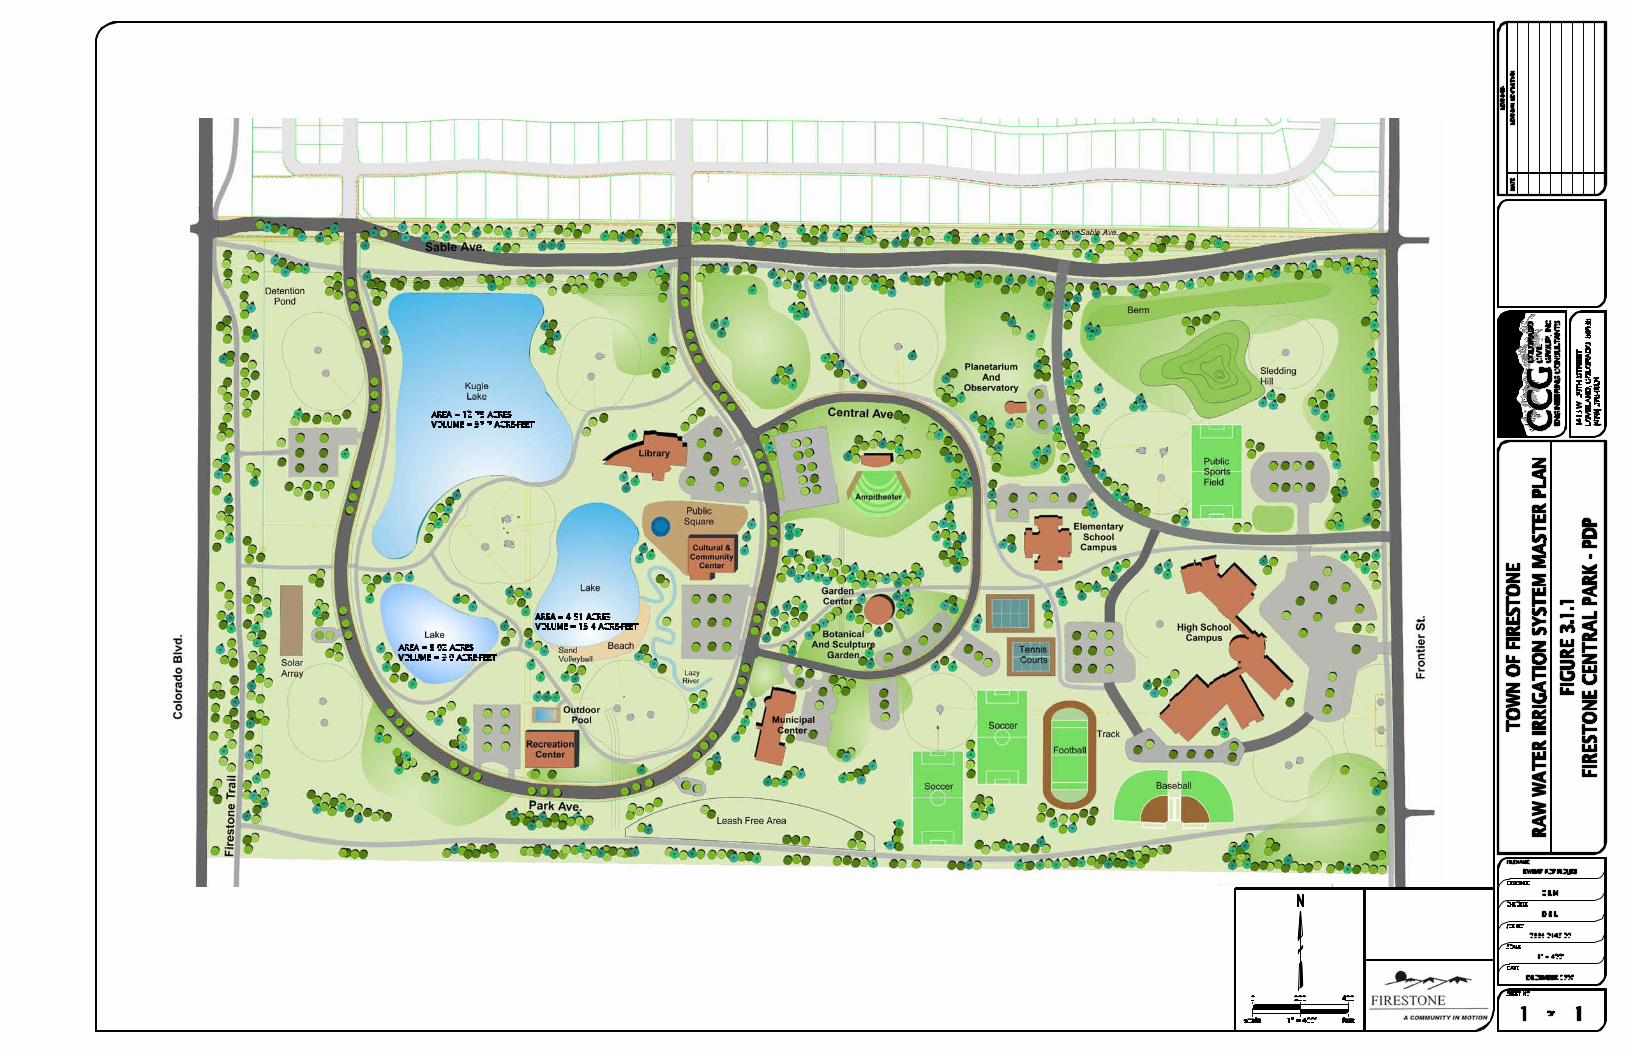
Firestone Central Park was chosen as a preferred location for a main storage reservoir and distribution point for the Town’s raw water system. The park is centrally located within the Town of Firestone and the conceptual plan for the park includes a series of amenity ponds. The CPIMP, 2006 provided preliminary pond locations, sizes, and depths which have been used as a basis for the evaluation in this Master Plan. 3.2.1 Location and Preliminary Configuration
Figure 3.1.1 shows the configuration of three proposed reservoirs at Firestone Central Park, within Park Avenue. This configuration was included in the updated Preliminary Development Plan (PDP) for this site. Although the layout differs from the initial plan (CPIMP, 2006), the concept is similar. These reservoirs would be hydraulically connected with a series of streams and a pump that would re-circulate the water. Each reservoir shall be to be approximately eight feet deep, with the top three feet being available for raw water irrigation storage. Figure E1 (Appendix E) illustrates a typical cross-section. The layout presented in this Master Plan assumes that the existing gas and oil facilities located at Central Park will still be in place when the ponds are constructed.
Raw Water Irrigation System Master Plan March 2010
19
3.2.2 Storage Volume Calculations
Using the design constraints shown on Figures 3.1.1 and E1, an initial available raw water storage volume was determined, based on a total surface area of 20.26 acres . This area was used as a starting point in evaluating the functionality of the Firestone Central Park irrigation reservoirs. The volume in the irrigation reservoir(s) will fluctuate to balance the varying inflow from the raw water source(s), the varying irrigation demand that will be pumped into the distribution system, and the losses due to evaporation. The Central Park irrigation reservoir(s) will be lined with clay or a synthetic material so infiltration losses were assumed to be negligible. A spreadsheet model was created to balance these conditions and calculate the irrigation reservoir water level information. To simplify calculations for evaporation, volume, and water level, the spreadsheet model assumed one circular pond rather than several irregularly shaped ponds. The irrigation reservoir stage-storage parameters are listed in Table E1 (Appendix E). The number of Coal Ridge Ditch shares was adjusted in the spreadsheet to meet the reservoir water level requirements and provide irrigation for the parks and open spaces. The number of shares was adjusted to maintain a water depth at minimum of 5 feet deep. If the irrigation ditch shares filled the reservoir in excess of 8 feet, then this was considered excess inflow (volume shortage). This volume shortage is considered a loss since the irrigation reservoirs cannot physically store this water at Firestone Central Park. The combination of multiple raw water irrigation sources, unlimited irrigation storage reservoir configurations, and the phasing of infrastructure improvements create an infinite number of possible solutions for the raw water irrigation system. The following scenarios were evaluated to determine the volume of irrigation inflow required to support the irrigation system: • Priority 1 Parks, Average Year Scenario • Priority 1 Parks, Drought Year Scenario • Priority1-3 Parks, Average Year Scenario • Priority 1-3 Parks, Drought Year Scenario The Priority 1 Parks, Average Year Scenario will require 302 Coal Ridge Ditch shares to meet the irrigation demands and keep the Central Park irrigation reservoirs within the 5 to 8 feet operating range. The results from this scenario can be found in Table E2 and Figure E2 (Appendix E). The results of these calculations indicate that approximately 38.2 acre-feet (approximately 10.1%) of raw water cannot be utilized by the Central Park irrigation reservoirs or the distribution system. The Priority 1 Parks, Drought Year Scenario will require 409 Coal Ridge Ditch shares to meet the irrigation demands and keep the Central Park irrigation reservoir within the 5 to 8 feet operating range. The results from this scenario can be found in Table E3 and Figure E3 (Appendix E). The results of these calculations indicate that approximately 38.7 acre-feet (approximately 9.0%) of raw water cannot be utilized by the Central Park irrigation reservoirs or the distribution system. The Priority 1-3 Parks, Average Year Scenario will require 879 Coal Ridge Ditch shares to meet the irrigation demands and keep the Central Park irrigation reservoir within the 5 to 8 feet
Raw Water Irrigation System Master Plan March 2010
20
operating range. The results from this scenario can be found in Table E4 and Figure E4 (Appendix E). The results of these calculations indicate that approximately 425.0 acre-feet (approximately 38.7%) of raw water cannot be utilized by the Central Park irrigation reservoirs or the distribution system. This amount of excess raw water illustrates the need for additional irrigation reservoirs as the distribution system is expanded to serve the Priority 2-3 Parks. The Priority 1-3 Parks, Drought Year Scenario will require 1,086 Coal Ridge Ditch shares to meet the irrigation demands and keep the Central Park irrigation reservoir within the 5 to 8 feet operating range. The results from this scenario can be found in Table E5 and Figure E5 (Appendix E). The results of these calculations indicate that approximately 351.4 acre-feet (approximately 30.8%) of raw water cannot be utilized by the Central Park irrigation reservoirs or the distribution system. As mentioned above, this amount of excess raw water illustrates the need for additional irrigation reservoirs as the distribution system is expanded to serve the Priority 2-3 Parks Each of the four scenarios listed above include approximately 69.2 acre-feet of evaporative losses from the Central Park irrigation reservoir. The evaporative losses were based on the annual gross evaporation of 41.0 inches provided by Clear Water Solutions, Inc. The monthly and annual evaporative loss supporting data can be found in Table E6 and Figure E6 (Appendix E). In each of the scenarios, there is an excess inflow of raw water to the Central Park storage reservoirs. This is due to the inflow hydrographs for the irrigation ditches. During months with lower irrigation demands and higher raw water delivery rates, the pond fills to capacity and cannot store any additional water. For purposes of this Master Plan, the excess inflow is raw water in addition to what can be stored and is essentially unusable. There may be opportunities to store this excess inflow in other irrigation reservoirs discussed in the following sections. Moving this inflow to multiple storage reservoirs will allow all raw water rights owned by the Town of Firestone to be put to a beneficial use. Additional storage opportunities are discussed in Sections 3.3 and 3.4 of this Master Plan. This excess water could be used in drought years to supplement any shortages in raw water supply or for augmentation that would be required by the Town based on the State’s Water Court process. 3.2.3 Raw Water Acquisition Opinion of Cost In order to determine the costs associated with the raw water acquisition, the Priority 1 Parks, Drought Year Scenario will be recommended as the first planning step for the Town of Firestone. This scenario requires 409 shares (Table E3) of the Coal Ridge Ditch to meet irrigation demands and evaporative losses. The State of Colorado will require another 66 shares (69.2 acre-feet @ 1.05 acre-feet per share) of the Coal Ridge Ditch to augment the evaporative losses, which is explained in Section 2.3. The Coal Ridge Ditch shares are valued at $7,500 per share, which is equivalent to a raw water acquisition cost of $3,562,500 for 475 shares. The additional Coal Ridge Ditch shares to be dedicated to the Town of Firestone (VL-NPIR, 2005) were not deducted from this figure since they have minimal impact during the drought year. In addition to the cost for the Coal Ridge Ditch shares, legal fees and expenses will be incurred to allow this raw water
Raw Water Irrigation System Master Plan March 2010
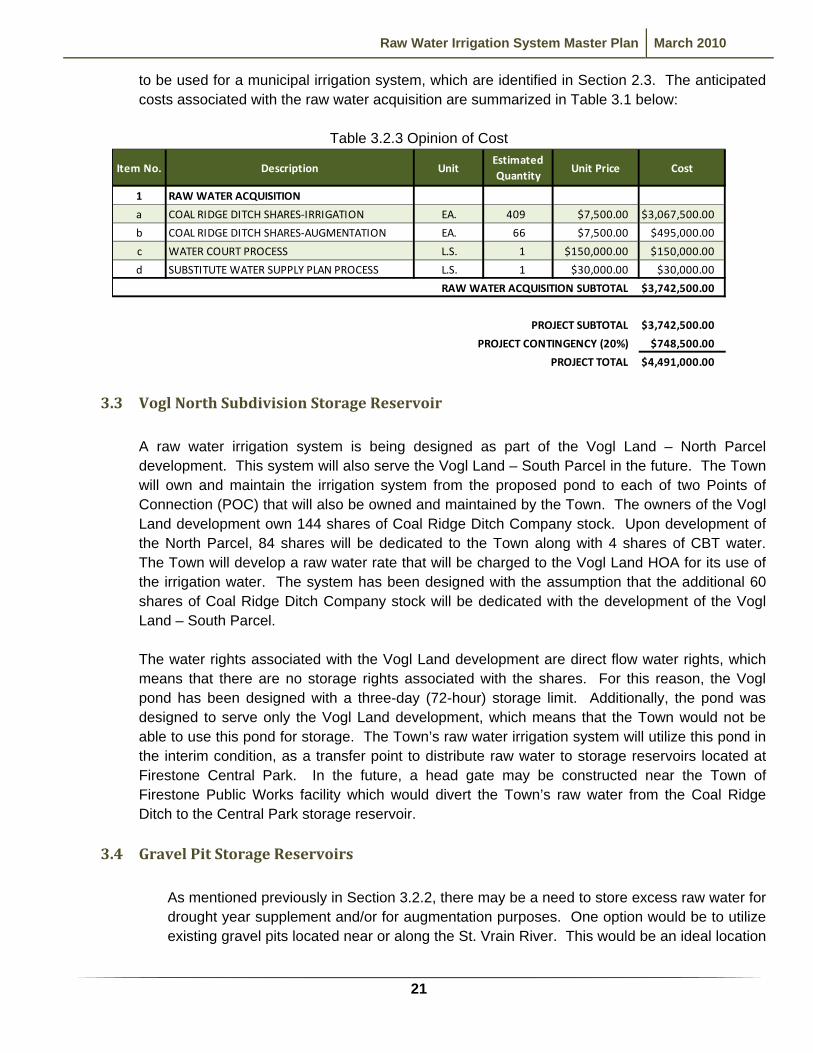
21
to be used for a municipal irrigation system, which are identified in Section 2.3. The anticipated costs associated with the raw water acquisition are summarized in Table 3.1 below:
Table 3.2.3 Opinion of Cost
1 RAW WATER ACQUISITION
a COAL RIDGE DITCH SHARES‐IRRIGATION EA. 409 $7,500.00 $3,067,500.00
b COAL RIDGE DITCH SHARES‐AUGMENTATION EA. 66 $7,500.00 $495,000.00
c WATER COURT PROCESS L.S. 1 $150,000.00 $150,000.00
d SUBSTITUTE WATER SUPPLY PLAN PROCESS L.S. 1 $30,000.00 $30,000.00
RAW WATER ACQUISITION SUBTOTAL $3,742,500.00
PROJECT SUBTOTAL $3,742,500.00
PROJECT CONTINGENCY (20%) $748,500.00
PROJECT TOTAL $4,491,000.00
CostItem No. Description UnitEstimated Quantity
Unit Price
3.3 Vogl North Subdivision Storage Reservoir
A raw water irrigation system is being designed as part of the Vogl Land – North Parcel development. This system will also serve the Vogl Land – South Parcel in the future. The Town will own and maintain the irrigation system from the proposed pond to each of two Points of Connection (POC) that will also be owned and maintained by the Town. The owners of the Vogl Land development own 144 shares of Coal Ridge Ditch Company stock. Upon development of the North Parcel, 84 shares will be dedicated to the Town along with 4 shares of CBT water. The Town will develop a raw water rate that will be charged to the Vogl Land HOA for its use of the irrigation water. The system has been designed with the assumption that the additional 60 shares of Coal Ridge Ditch Company stock will be dedicated with the development of the Vogl Land – South Parcel. The water rights associated with the Vogl Land development are direct flow water rights, which means that there are no storage rights associated with the shares. For this reason, the Vogl pond has been designed with a three-day (72-hour) storage limit. Additionally, the pond was designed to serve only the Vogl Land development, which means that the Town would not be able to use this pond for storage. The Town’s raw water irrigation system will utilize this pond in the interim condition, as a transfer point to distribute raw water to storage reservoirs located at Firestone Central Park. In the future, a head gate may be constructed near the Town of Firestone Public Works facility which would divert the Town’s raw water from the Coal Ridge Ditch to the Central Park storage reservoir.
3.4 Gravel Pit Storage Reservoirs
As mentioned previously in Section 3.2.2, there may be a need to store excess raw water for drought year supplement and/or for augmentation purposes. One option would be to utilize existing gravel pits located near or along the St. Vrain River. This would be an ideal location
Raw Water Irrigation System Master Plan March 2010
22
due to the proximity to the river where the water would be released for augmentation and because the excess water could likely be piped to the gravel pits without being pumped. An additional irrigation line and pump station would be required to transfer water from this area back to Firestone Central Park. Since the Town does not own the gravel pits, an agreement would have to be negotiated with the owner(s) to allow the Town to store water in the gravel pit reservoirs.
Raw Water Irrigation System Master Plan March 2010
23
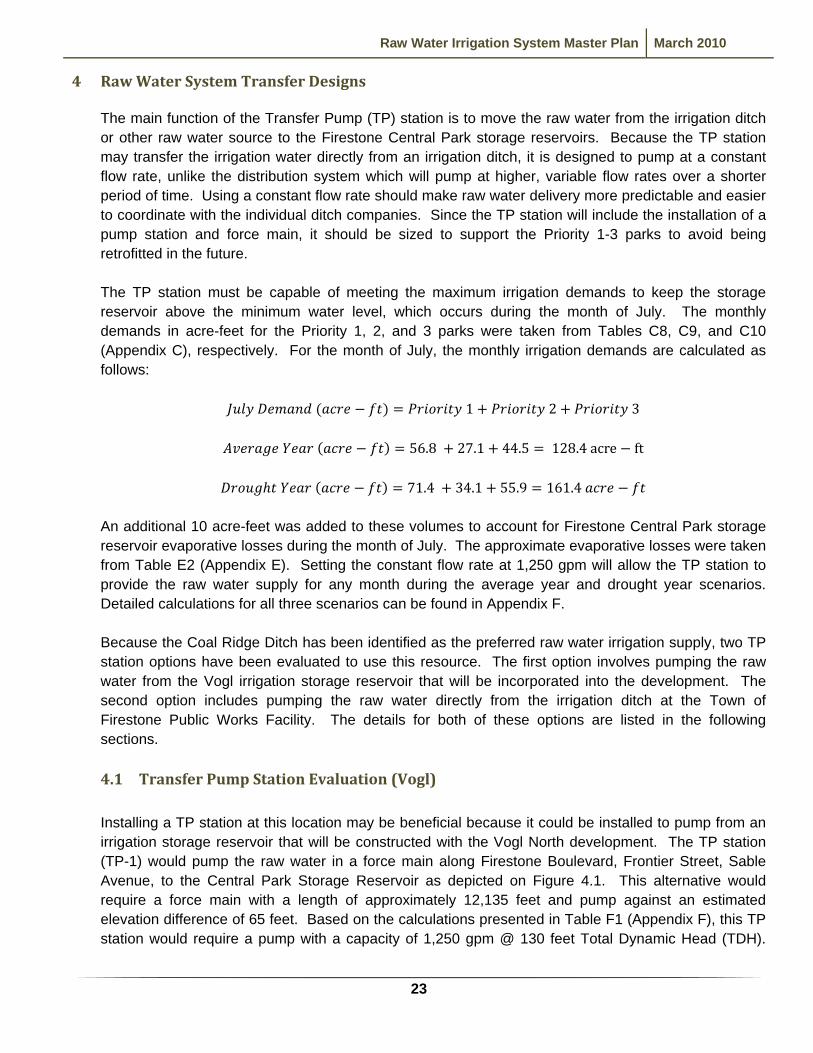
4 Raw Water System Transfer Designs The main function of the Transfer Pump (TP) station is to move the raw water from the irrigation ditch or other raw water source to the Firestone Central Park storage reservoirs. Because the TP station may transfer the irrigation water directly from an irrigation ditch, it is designed to pump at a constant flow rate, unlike the distribution system which will pump at higher, variable flow rates over a shorter period of time. Using a constant flow rate should make raw water delivery more predictable and easier to coordinate with the individual ditch companies. Since the TP station will include the installation of a pump station and force main, it should be sized to support the Priority 1-3 parks to avoid being retrofitted in the future. The TP station must be capable of meeting the maximum irrigation demands to keep the storage reservoir above the minimum water level, which occurs during the month of July. The monthly demands in acre-feet for the Priority 1, 2, and 3 parks were taken from Tables C8, C9, and C10 (Appendix C), respectively. For the month of July, the monthly irrigation demands are calculated as follows:
1 2 3
56.8 27.1 44.5 128.4 acre ft
71.4 34.1 55.9 161.4
An additional 10 acre-feet was added to these volumes to account for Firestone Central Park storage reservoir evaporative losses during the month of July. The approximate evaporative losses were taken from Table E2 (Appendix E). Setting the constant flow rate at 1,250 gpm will allow the TP station to provide the raw water supply for any month during the average year and drought year scenarios. Detailed calculations for all three scenarios can be found in Appendix F. Because the Coal Ridge Ditch has been identified as the preferred raw water irrigation supply, two TP station options have been evaluated to use this resource. The first option involves pumping the raw water from the Vogl irrigation storage reservoir that will be incorporated into the development. The second option includes pumping the raw water directly from the irrigation ditch at the Town of Firestone Public Works Facility. The details for both of these options are listed in the following sections. 4.1 Transfer Pump Station Evaluation (Vogl)
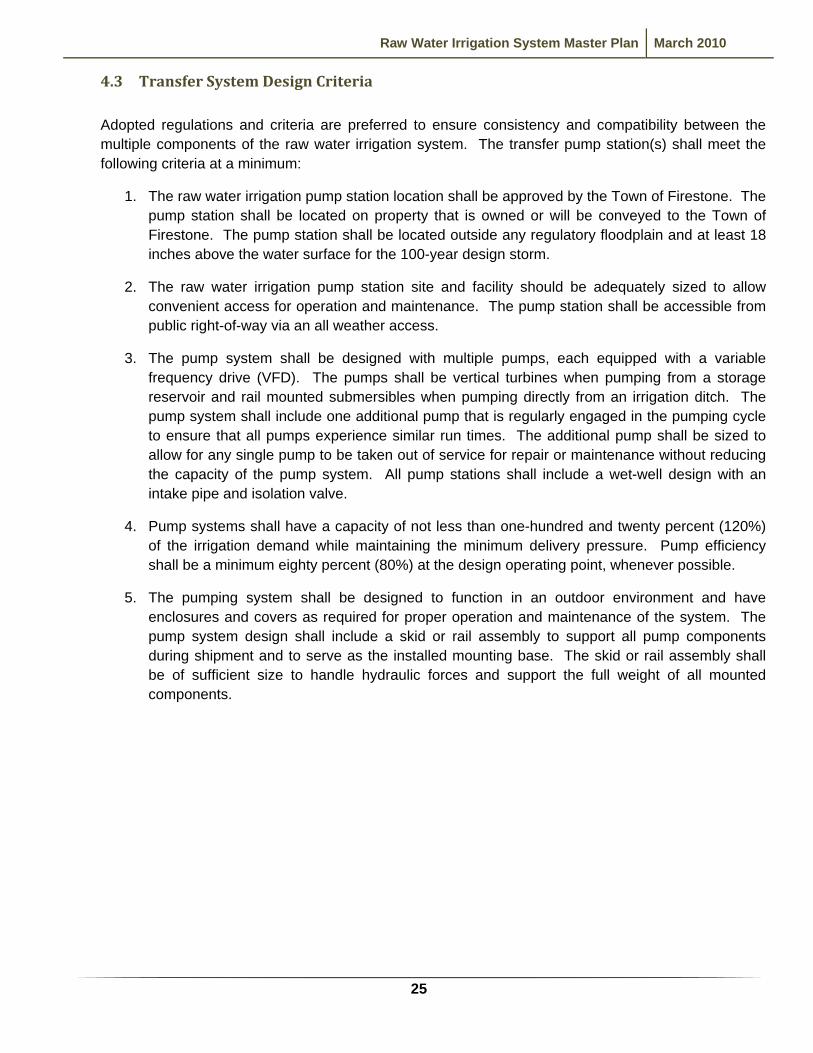
Installing a TP station at this location may be beneficial because it could be installed to pump from an irrigation storage reservoir that will be constructed with the Vogl North development. The TP station (TP-1) would pump the raw water in a force main along Firestone Boulevard, Frontier Street, Sable Avenue, to the Central Park Storage Reservoir as depicted on Figure 4.1. This alternative would require a force main with a length of approximately 12,135 feet and pump against an estimated elevation difference of 65 feet. Based on the calculations presented in Table F1 (Appendix F), this TP station would require a pump with a capacity of 1,250 gpm @ 130 feet Total Dynamic Head (TDH).
Raw Water Irrigation System Master Plan March 2010
24
These parameters can be met by an ITT Flygt submersible pump with an 88 horsepower (hp) motor. This is based on the pump data provided Lee Mathews Equipment, Inc. in Appendix F. At this operating point, this specific pump has an efficiency of 63.4%. The advantages and disadvantages for this option are as follows:
Advantages • Pumping from a storage reservoir will allow suspended solids to settle out prior to the transfer. • Vertical turbine pumps may be an option which can operate more efficiently. • The force main is shorter in length.
Disadvantages • The transfer pump has greater TDH requirement resulting in larger, more expensive pumps that
consume more power. • This alternative is dependent on the Vogl development
4.2 Transfer Pump Station Evaluation (Public Works Facility)
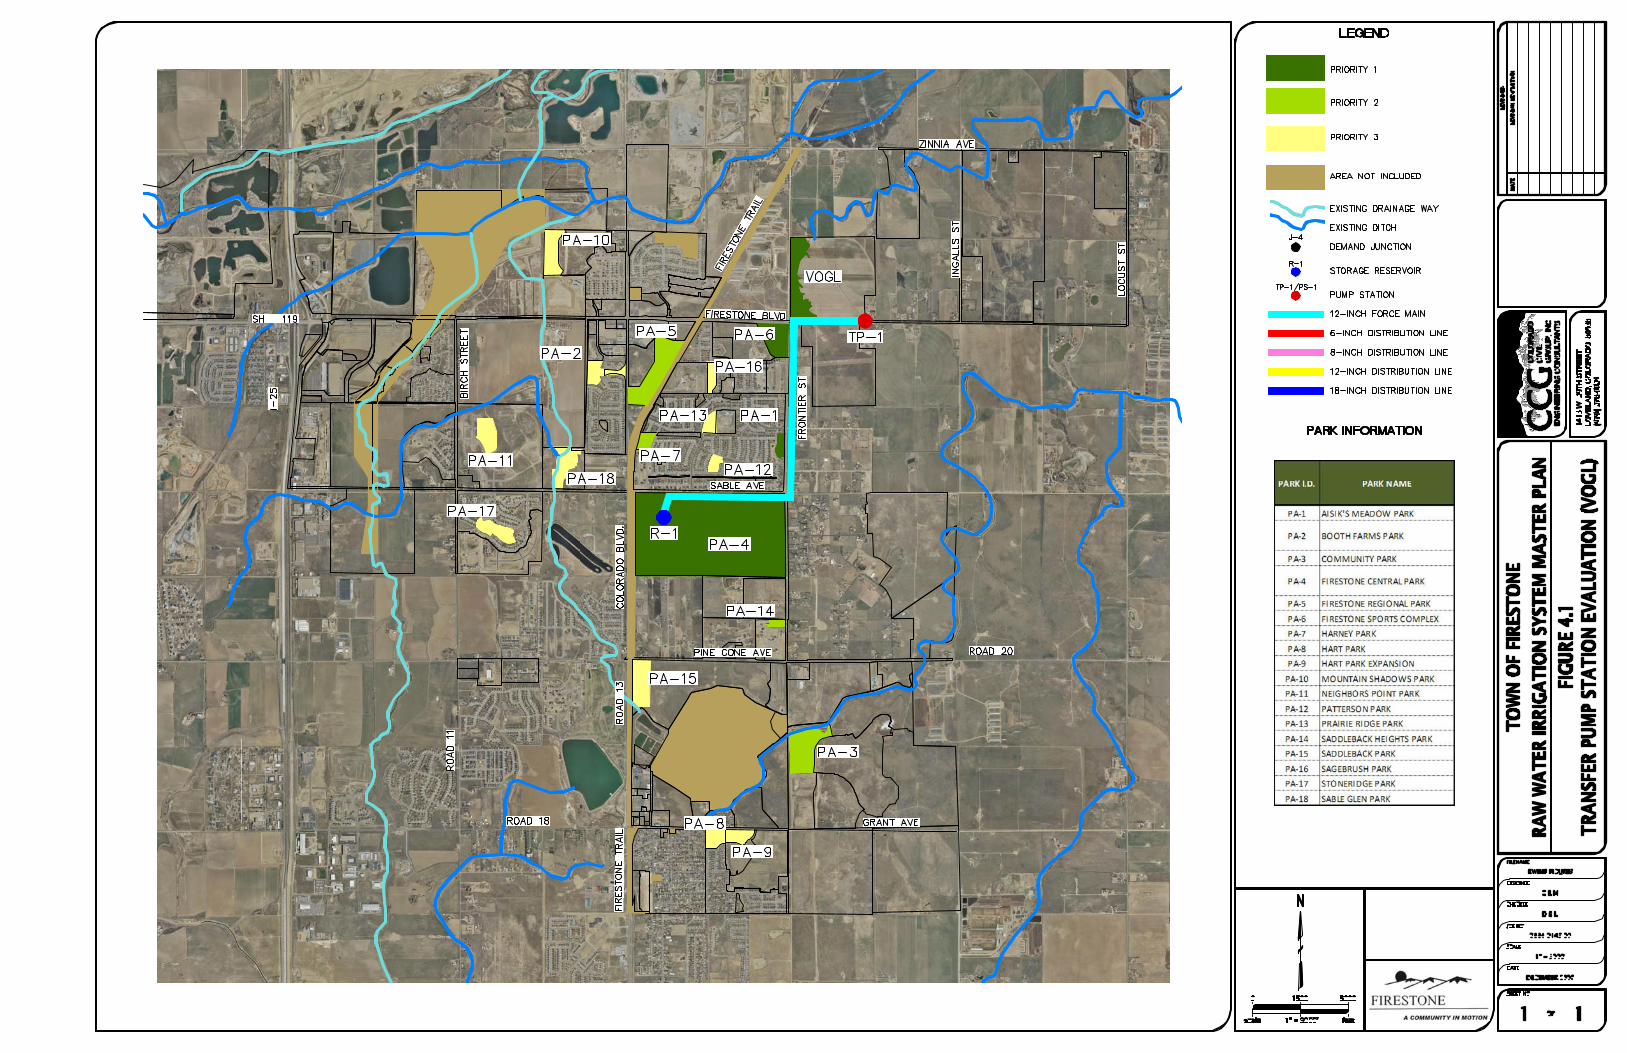
The Coal Ridge Ditch runs along the south property line of the Town of Firestone Public Works Facility, located at 7500 Weld County Road 20. Installing a TP station at this location would be beneficial because it could be installed on property already owned by the Town. The TP station (TP-2) would pump the raw water in a force main along the west property line of the Public Works Facility, Pine Cone Avenue (W.C.R. 20), Frontier Street, and Sable Avenue to the Central Park storage reservoir as depicted on Figure 4.2. This alternative would require a force main with a length of approximately 12,925 feet and pump against an estimated elevation difference of 12 feet. Based on the calculations presented in Table F2 (Appendix F), this TP station would require a pump with a capacity of 1,250 gpm @ 80 feet TDH. These parameters can be met by an ITT Flygt submersible pump with a 47 hp motor. This is based on the pump data provided Lee Mathews Equipment, Inc. in Appendix F. At this operating point, this specific pump has an efficiency of 47.5%. The advantages and disadvantages for this option are as follows:
Advantages • Property is owned by the Town of Firestone. • The elevation difference is reduced resulting in smaller pump motor(s) and less power
consumption.
Disadvantages • The force main has greater length • Since the pump will be transferring raw water directly out of the irrigation ditch, there will be more
suspended solids which will be transferred to the Firestone Central Park storage reservoir(s), which will require additional maintenance.
Raw Water Irrigation System Master Plan March 2010
25
4.3 Transfer System Design Criteria
Adopted regulations and criteria are preferred to ensure consistency and compatibility between the multiple components of the raw water irrigation system. The transfer pump station(s) shall meet the following criteria at a minimum:
1. The raw water irrigation pump station location shall be approved by the Town of Firestone. The pump station shall be located on property that is owned or will be conveyed to the Town of Firestone. The pump station shall be located outside any regulatory floodplain and at least 18 inches above the water surface for the 100-year design storm.
2. The raw water irrigation pump station site and facility should be adequately sized to allow convenient access for operation and maintenance. The pump station shall be accessible from public right-of-way via an all weather access.
3. The pump system shall be designed with multiple pumps, each equipped with a variable frequency drive (VFD). The pumps shall be vertical turbines when pumping from a storage reservoir and rail mounted submersibles when pumping directly from an irrigation ditch. The pump system shall include one additional pump that is regularly engaged in the pumping cycle to ensure that all pumps experience similar run times. The additional pump shall be sized to allow for any single pump to be taken out of service for repair or maintenance without reducing the capacity of the pump system. All pump stations shall include a wet-well design with an intake pipe and isolation valve.
4. Pump systems shall have a capacity of not less than one-hundred and twenty percent (120%) of the irrigation demand while maintaining the minimum delivery pressure. Pump efficiency shall be a minimum eighty percent (80%) at the design operating point, whenever possible.
5. The pumping system shall be designed to function in an outdoor environment and have enclosures and covers as required for proper operation and maintenance of the system. The pump system design shall include a skid or rail assembly to support all pump components during shipment and to serve as the installed mounting base. The skid or rail assembly shall be of sufficient size to handle hydraulic forces and support the full weight of all mounted components.
Raw Water Irrigation System Master Plan March 2010
28
8. Additional pump system design components shall include, but not be limited to, motors, valves, gauges, mounting and support structures, power and electrical equipment, control systems, operator interface devices, alarms, supervisory control and data acquisition (SCADA) systems, monitoring devices, building requirements, installation and operation instructions, and recommended maintenance procedures.
9. The Construction Drawings for the irrigation pumping system shall show a typical layout, elevation and plan views, and critical dimensions for the pump system, building, wet well, etc. The pump system manufacturer and project engineer are responsible for the layout and design of the pump system supplied and any special coordination issues that affect the critical dimensions, layout or orientation of the pump system.
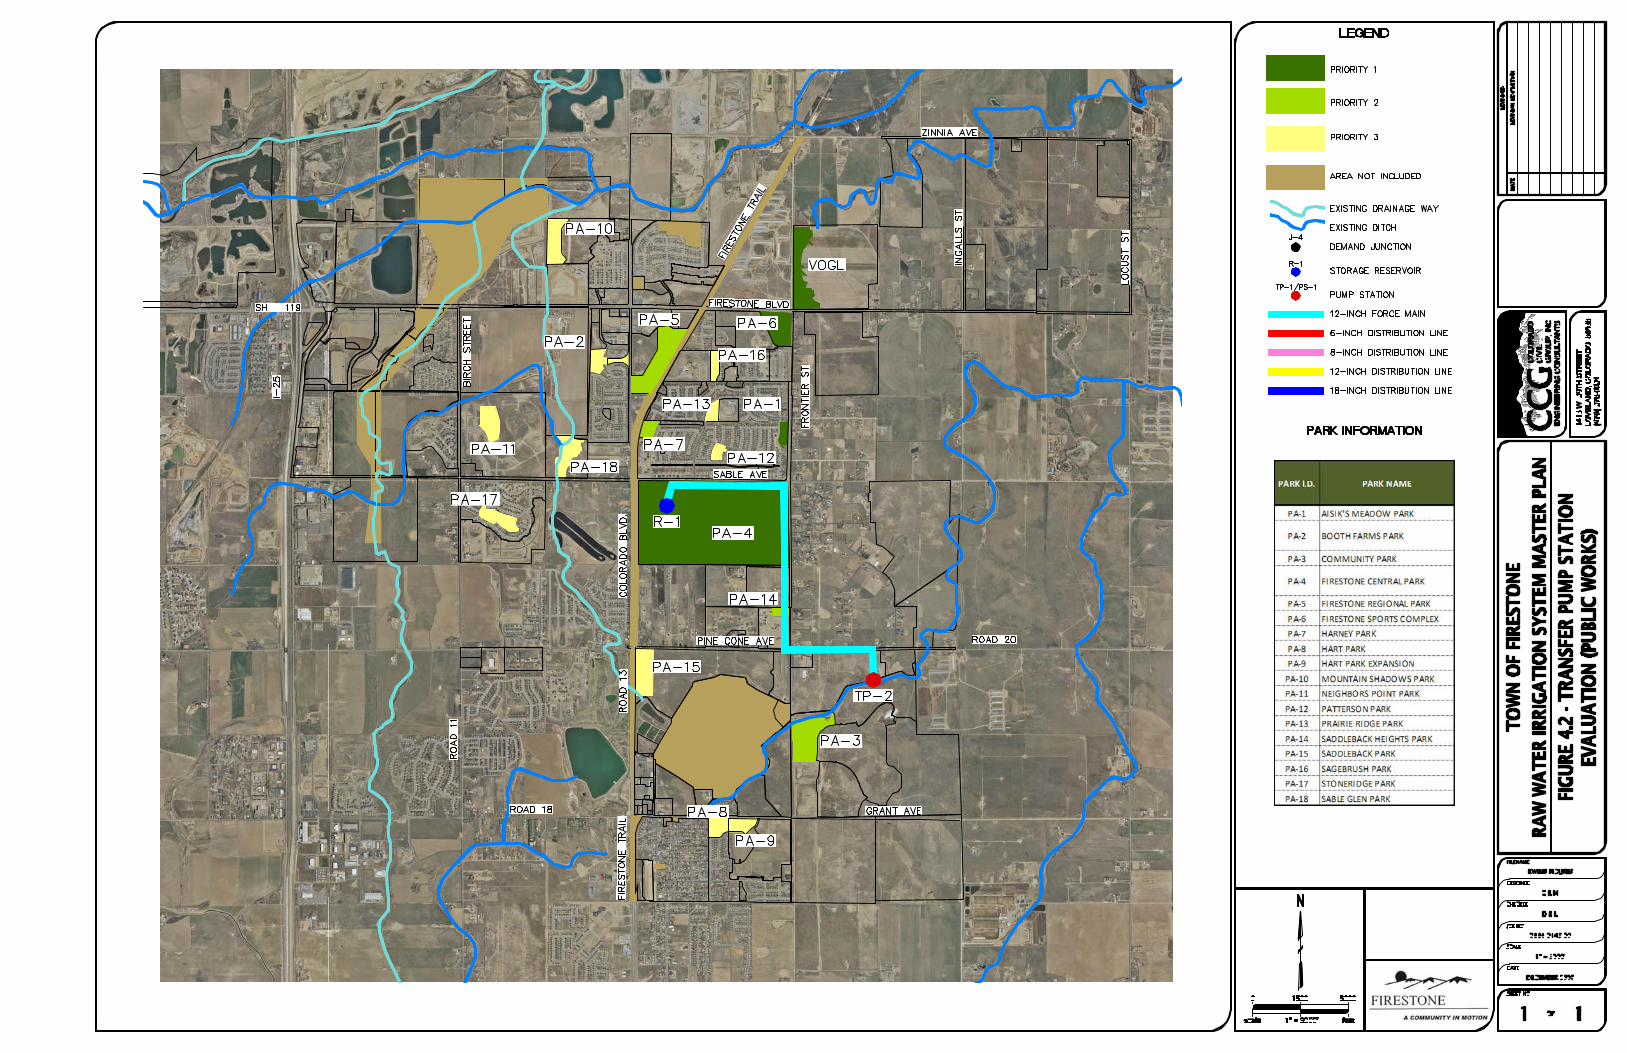
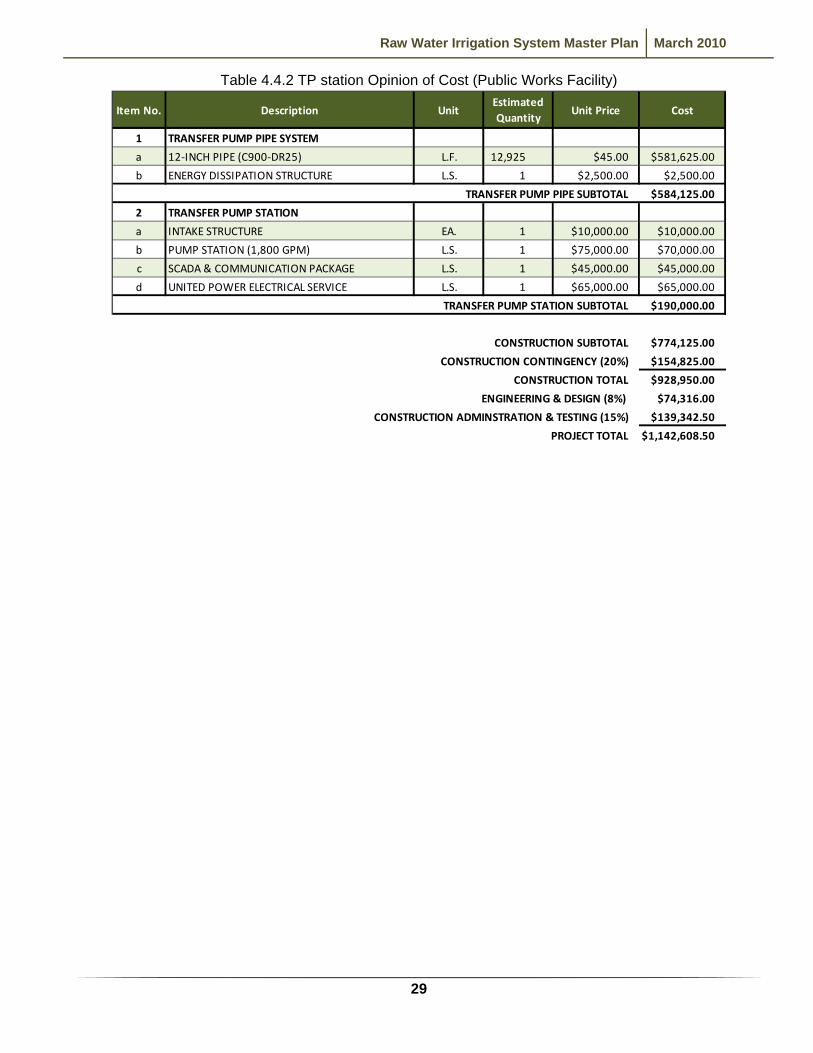
4.4 Transfer System Opinions of Cost
An Opinion of Cost was prepared for both TP Station options. Table 4.4.1 has an estimated cost of $1,130,730 for the Vogl TP station and Table 4.4.2 lists an estimated cost of $1,142,610 for the Public Works Facility alternative.
Table 4.4.1 TP station Opinion of Cost (Vogl)
1 TRANSFER PUMP PIPE SYSTEM
a 12‐INCH PIPE (C900‐DR25) L.F. 12,135 $45.00 $546,075.00
b ENERGY DISSIPATION STRUCTURE L.S. 1 $2,500.00 $2,500.00
TRANSFER PUMP PIPE SUBTOTAL $548,575.00
2 TRANSFER PUMP STATION
a INTAKE STRUCTURE EA. 1 $7,500.00 $7,500.00
b PUMP STATION (1,800 GPM) L.S. 1 $100,000.00 $100,000.00
c SCADA & COMMUNICATION PACKAGE L.S. 1 $45,000.00 $45,000.00
d UNITED POWER ELECTRICAL SERVICE L.S. 1 $65,000.00 $65,000.00
TRANSFER PUMP STATION SUBTOTAL $217,500.00
CONSTRUCTION SUBTOTAL $766,075.00
CONSTRUCTION CONTINGENCY (20%) $153,215.00
CONSTRUCTION TOTAL $919,290.00
ENGINEERING & DESIGN (8%) $73,543.20
CONSTRUCTION ADMINSTRATION & TESTING (15%) $137,893.50
PROJECT TOTAL $1,130,726.70
CostItem No. Description UnitEstimated Quantity
Unit Price
The Vogl TP station is slightly less expensive due to the force main length and the simpler intake structure. The Public Works Facility TP station has a less expensive pump station, however not enough to offset the additional cost of the force main. Because these opinions of costs are very similar, either option would be a viable alternative. The selection of either alternative may be dictated by the preference of the Coal Ridge Ditch Company and/or the status of the Vogl development.
Raw Water Irrigation System Master Plan March 2010
29
Table 4.4.2 TP station Opinion of Cost (Public Works Facility)
1 TRANSFER PUMP PIPE SYSTEM
a 12‐INCH PIPE (C900‐DR25) L.F. 12,925 $45.00 $581,625.00
b ENERGY DISSIPATION STRUCTURE L.S. 1 $2,500.00 $2,500.00
TRANSFER PUMP PIPE SUBTOTAL $584,125.00
2 TRANSFER PUMP STATION
a INTAKE STRUCTURE EA. 1 $10,000.00 $10,000.00
b PUMP STATION (1,800 GPM) L.S. 1 $75,000.00 $70,000.00
c SCADA & COMMUNICATION PACKAGE L.S. 1 $45,000.00 $45,000.00
d UNITED POWER ELECTRICAL SERVICE L.S. 1 $65,000.00 $65,000.00
TRANSFER PUMP STATION SUBTOTAL $190,000.00
CONSTRUCTION SUBTOTAL $774,125.00
CONSTRUCTION CONTINGENCY (20%) $154,825.00
CONSTRUCTION TOTAL $928,950.00
ENGINEERING & DESIGN (8%) $74,316.00
CONSTRUCTION ADMINSTRATION & TESTING (15%) $139,342.50
PROJECT TOTAL $1,142,608.50
CostItem No. Description UnitEstimated Quantity
Unit Price
Raw Water Irrigation System Master Plan March 2010
30
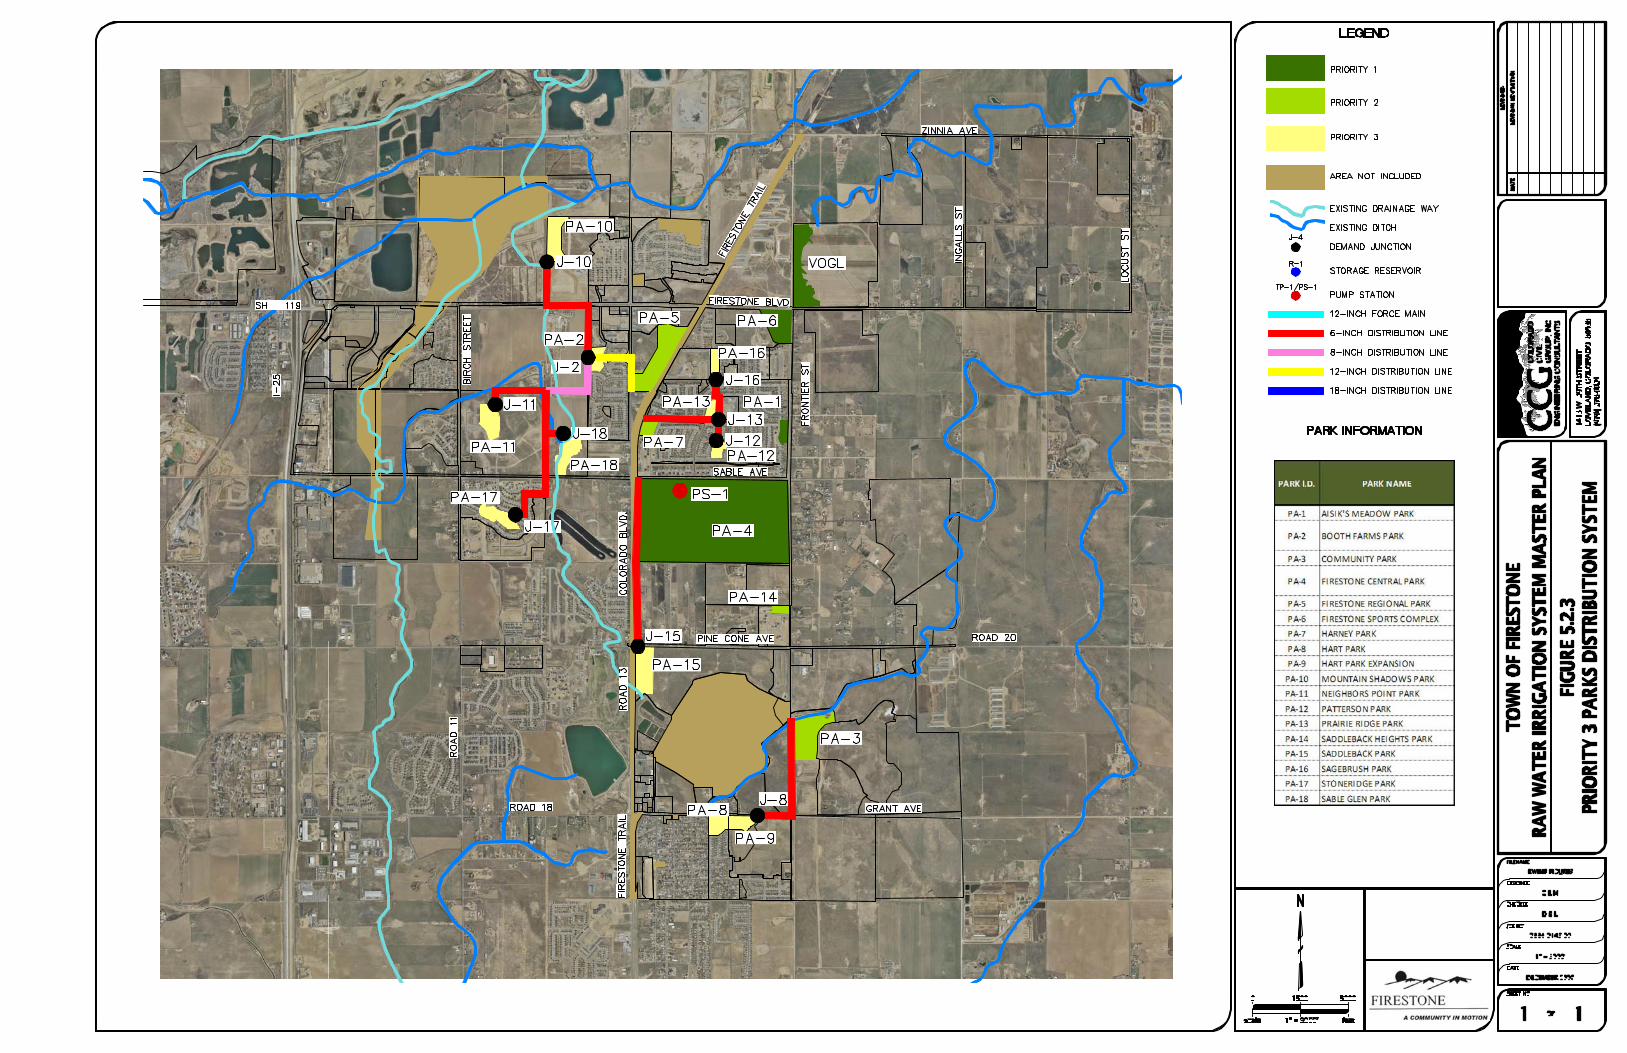
5 Raw Water Distribution System Design It is intended that all Priority 1-3 park areas will eventually be irrigated by a distribution system that will originate at and be supplied by the Central Park irrigation reservoir. As discussed in Section 1.4, the areas were prioritized based on their current status and location relative to Central Park. Because the distribution system infrastructure will be designed and constructed from the center out to the extents of the system, it has been designed to provide service to all Priority 1-3 park areas. The infrastructure improvements associated with the Priority 2 system will support the Priority 3 system and the infrastructure improvements associated with the Priority 1 system will support the Priority 2 and 3 systems. 5.1 Distribution System Alignment Evaluation
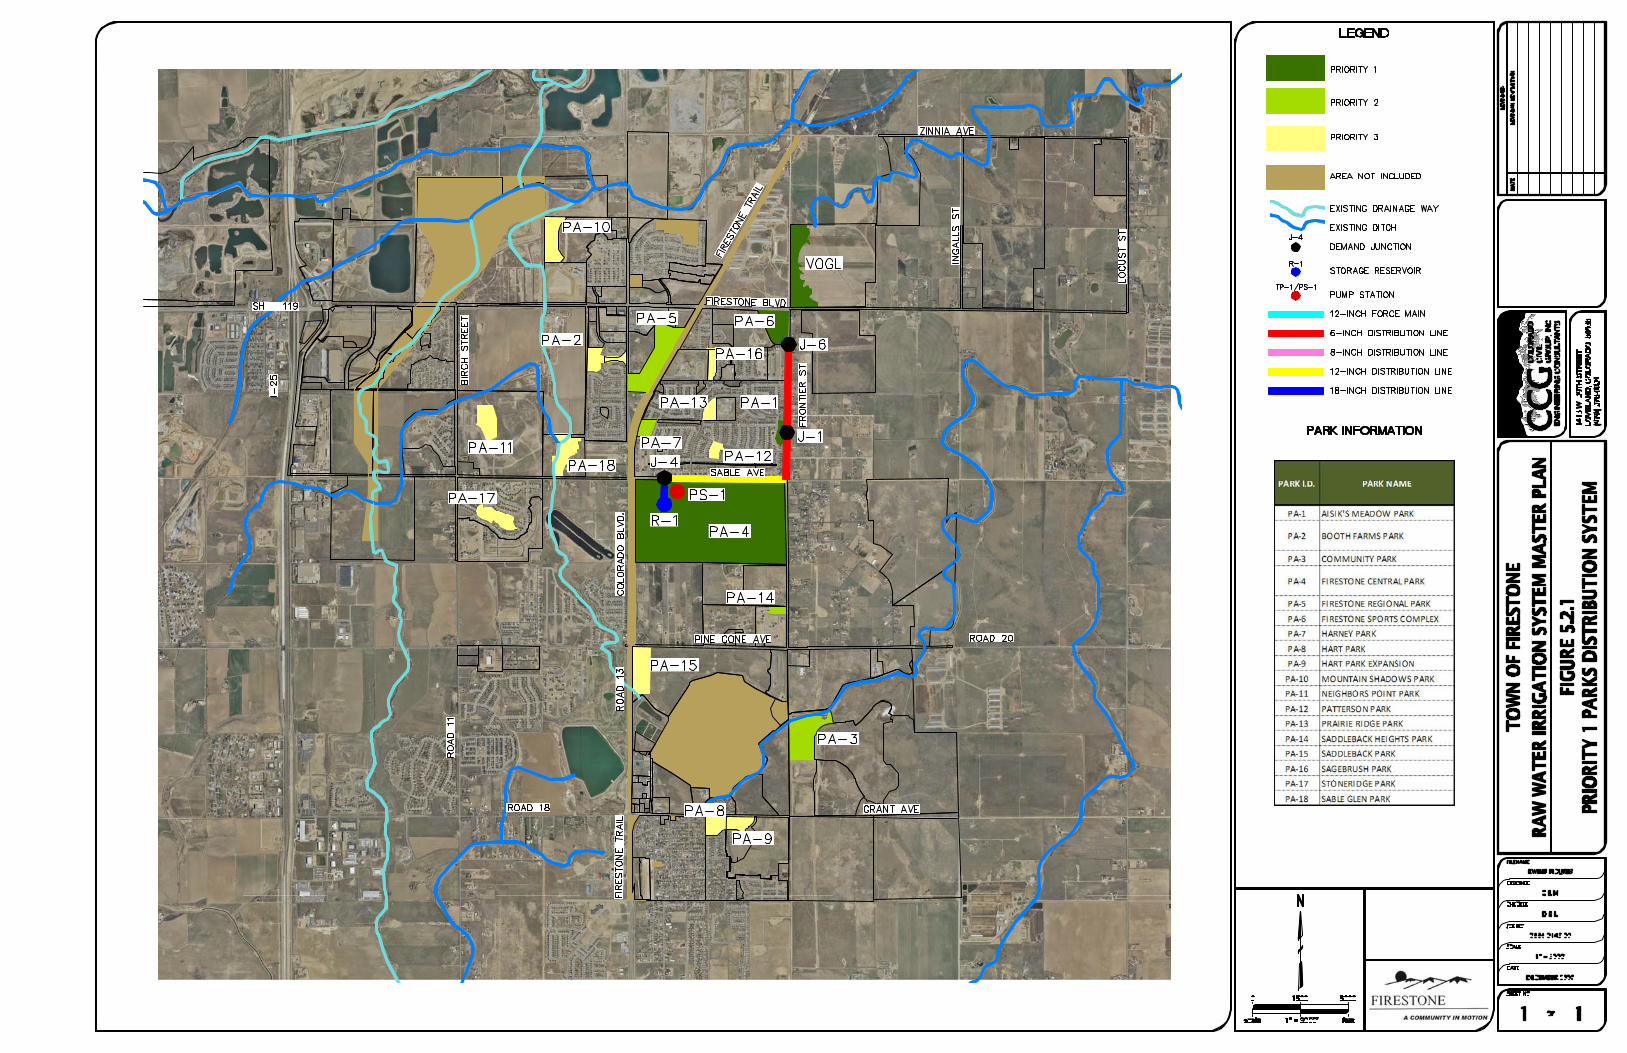
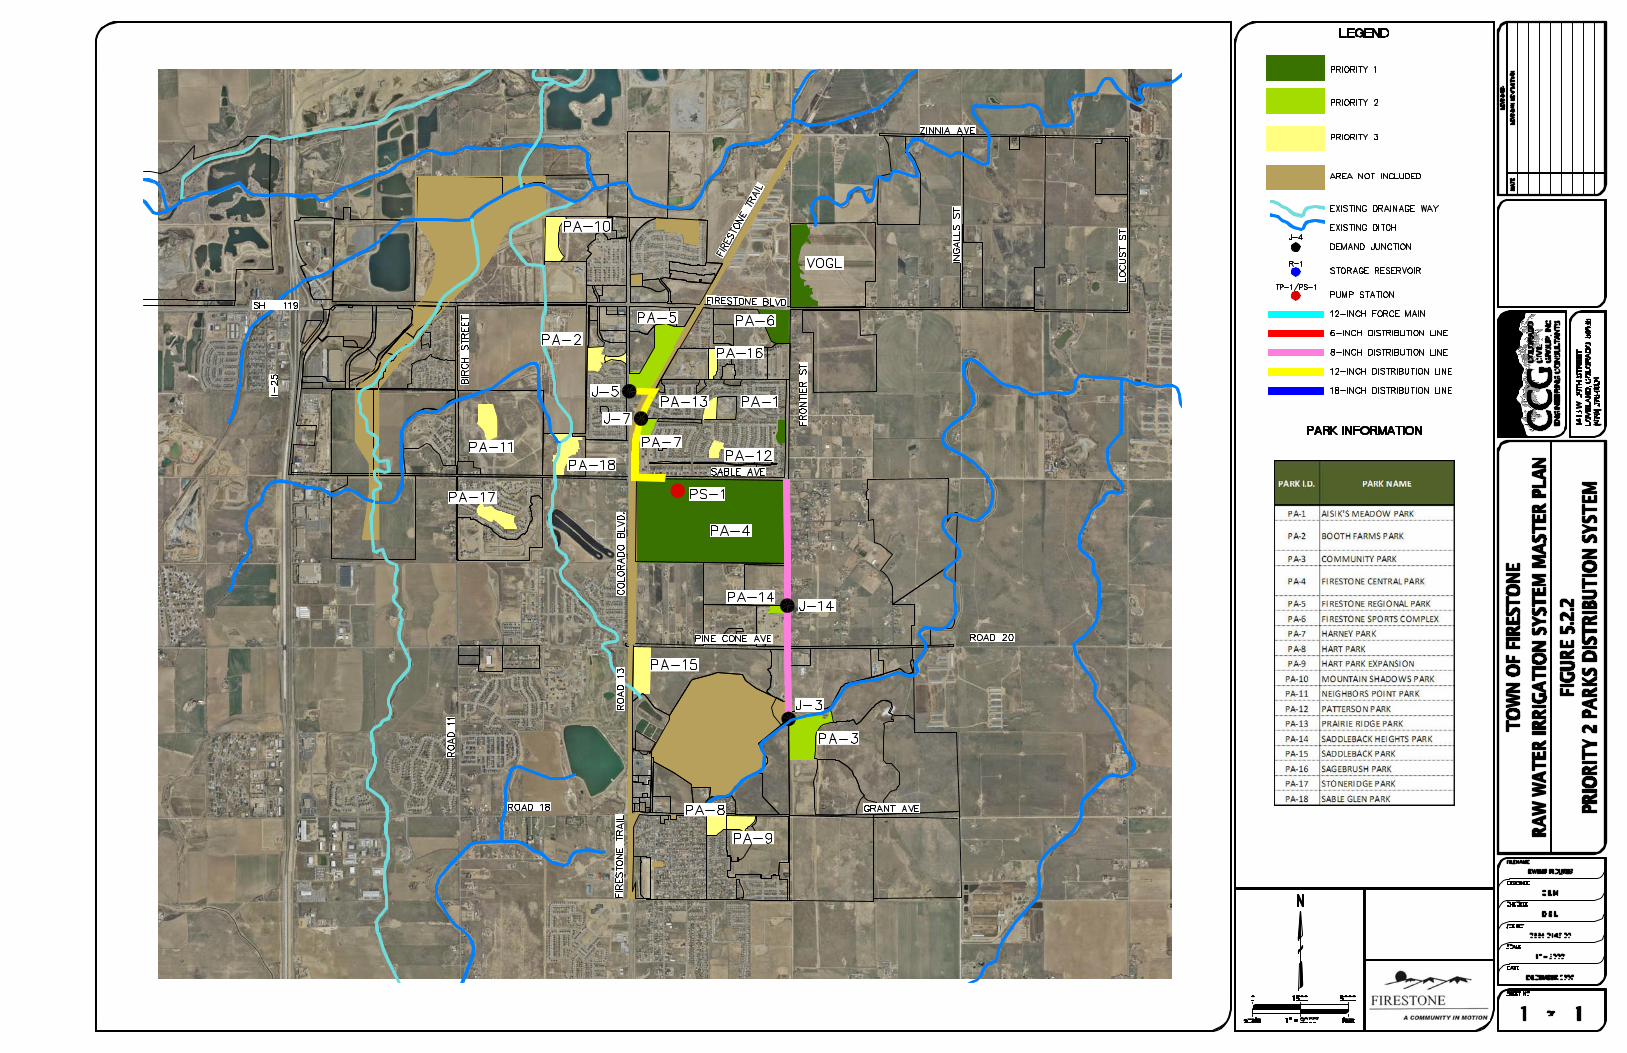
The distribution system was generally aligned along and through existing and future public streets, public parks, open space areas, and other similar corridors. The distribution system was laid out with the intent of providing service to all Priority 1-3 Parks while minimizing the amount of infrastructure required. The Priority 1, 2, and 3 distribution system infrastructure requirements are shown in Figures 5.1.1, 5.1.2, and 5.1.3, respectively.
5.2 Pump and Distribution System Modeling
The distribution pump (DP) station and pipe network has been sized to meet the irrigation application rates which are dependent on the irrigation demands presented in Section 1.5, Section 1.6, and Appendix C. The DP station is identified as PS-1 on Figures 5.1.1 - 5.1.3. The application rate is different from the irrigation demand with respect that the water has to be applied to the turf in a limited amount of time. Typically, the parks and open spaces are irrigated at night so that the watering will not interfere with the use of the park. The pipe sizes and pump total dynamic head (TDH) were set so that the minimum dynamic system pressure is 70 psi and the maximum pipe velocity in the distribution system is less than 5 feet per second. All of the distribution pipes were modeled as P.V.C. with a Hazen-Williams C value of 130. The DP station and pipe network were modeled for all three scenarios using the WaterCAD V8 software package. The results from this modeling effort can be found in Appendix G.
The pump station and distribution system has been evaluated for the Priority 1-3 parks for both scenarios previously discussed in this Master Plan which includes the following:
1. Average Year Scenario 2. Drought Year Scenario
The amount of time allowed for irrigation has been adjusted so that the application rates are similar for both scenarios. The modeling results for each scenario are listed in Sections 5.2.1 – 5.2.2.
Raw Water Irrigation System Master Plan March 2010
34
5.2.1 Average Year Scenario
The Average Year Scenario assumed an application schedule of irrigating six days per week, eight hours per day. During the month of July, this is equivalent to an application rate of 13.6 gal/(min-acre). The supporting calculations for this application rate can be found in Appendix G. Using this application rate for all Priority 1-3 parks yields a DP station required capacity of 3,285 gpm as indicated in Table G1(Appendix G). Figure G1 and Table G2 (Appendix G); identify how these demands are distributed to serve all of the Priority 1-3 parks. Figure G1 shows additional nodes/junctions that were incorporated in the WaterCAD model but did not have irrigation demands applied to them. The WaterCAD modeling results for the Average Year Scenario are listed in Tables G3 and G4 (Appendix G). The lowest dynamic system pressure is 81.9 psi at Junction J-8 (Hart Park & Hart Park Expansion) and the highest dynamic system pressure is 149.6 psi at Junction J-10 (Mountain Shadows Park). The highest pipe velocity is 4.14 feet per second in pipes P-36 and P-37 which is the 18-inch distribution line between the DP station and Sable Avenue. These results meet the system criteria listed in Section 5.5. 5.2.2 Drought Year Scenario
The Drought Year Scenario assumed an application schedule of irrigating seven days per week, eight hours per day. During the month of July, this is equivalent to an application rate of 14.6 gal/(min-acre), which is the highest of the three scenarios. The supporting calculations for this application rate can be found in Appendix G. Using this application rate for all Priority 1-3 parks yields a DP station required capacity of 3,527 gpm as indicated in Table G1(Appendix G). Figure G1 and Table G2(Appendix G) identify how these demands are distributed to serve all of the Priority 1-3 parks. Figure G1 shows additional nodes/junctions that were incorporated in the WaterCAD model but did not have irrigation demands applied to them. The WaterCAD modeling results for the Drought Year Scenario are listed in Tables G5 and G6 (Appendix G). The lowest dynamic system pressure is 70.7 psi at Junction J-8 (Hart Park & Hart Park Expansion) and the highest dynamic system pressure is 146.1 psi at Junction J-10 (Mountain Shadows Park). The highest pipe velocity is 4.45 feet per second in pipes P-36 and P-37 which is the 18-inch distribution line between the DP station and Sable Avenue. These results meet the system criteria listed in Section 5.5.
5.3 Pump Station Configuration and Sizing
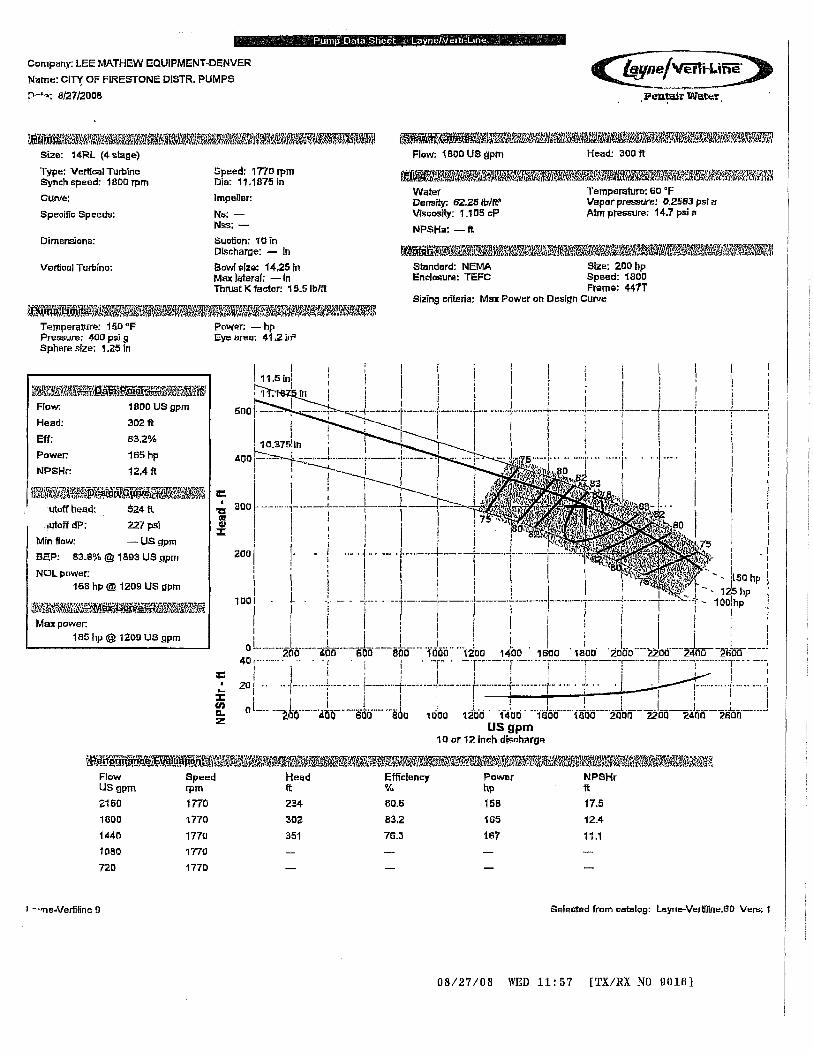
Evaluating both scenarios will ensure that the pump station and distribution system can accommodate either scenario while operating efficiently. For irrigation months other than July, either the days and/or hours per day can be reduced since the volume of irrigation water to be applied will be lower. As previously mentioned, the pump station will be designed to accommodate the drought-year scenario for the priority 1-3 parks. The pump station will generally be sized to pump at 3,600 gpm at 300 feet TDH, which is equivalent to a discharge pressure of 124.6 psi. The pump station has been initially configured with two pumps in parallel, each providing 1,800 gpm and 300 feet TDH. These parameters can be met by two Aurora Pump/Layne Vertiline vertical turbine pumps, each with a 200 hp motor. This is based on the
Raw Water Irrigation System Master Plan March 2010
35
pump data provided Lee Mathews Equipment, Inc. in Appendix G. At the specified operating point, this pump has an efficiency of 83.2%.
5.4 Intake Structure Evaluation
The intake structure will designed and installed approximately one to two feet above the bottom of the Central Park storage reservoir. This configuration will keep debris on the surface and the bottom of the reservoir from being pulled into the pump station wet well. This will also allow the top three feet of reservoir storage to be utilized for irrigation without exposing the intake structure during normal drawdown. The additional depth of the intake structure will allow the distribution system to use additional volume in the reservoir when necessary (i.e. emergency situation, etc.). The intake structure will consist of a self cleaning screen and an intake pipe (approximately 18-inches in diameter) that connects to the pump station wet well. The intake structure will be designed with a slight slope towards the storage reservoir. If the reservoir is ever drained, the pump station intake structure and wet well will also drain. The intake pipe will also be installed with an isolation valve so the wet well can be pumped out when the pump station is winterized or needs to be serviced.
5.5 Distribution System Design Criteria
Adopted regulations and criteria are preferred to ensure consistency and compatibility between the multiple components of the raw water irrigation system. The distribution system shall meet the following criteria at a minimum:
1. Raw water irrigation lines shall be at least 4 inches in diameter. The minimum depth of cover shall be 4 feet and the maximum shall be 6 feet, whenever possible.
2. The raw water irrigation system shall be designed with a minimum dynamic pressure of 70 psi and a maximum dynamic pressure of 150 psi. Pressures greater than 150 psi shall be reduced with a pressure reducing valve (PRV). The maximum velocity within raw water irrigation lines shall be 5 feet per second.
3. The raw water irrigation lines shall be AWWA C900 or C905 polyvinyl chloride (PVC) pressure pipe, pressure class 165, purple color. PVC pipe markings shall include the designation “CAUTION NON-POTABLE WATER” or “CAUTION RECLAIMED WATER” in addition to the standard factory labeling required by AWWA. PVC may be substituted with high density polyethylene (HDPE) pipe pending approval from the Town of Firestone.
4. Underground marking tape shall be installed above raw water irrigation lines when purple color pipe or appurtenances are not used for construction.
5. Accessible appurtenances (i.e. hatches, manhole covers, meter pit lids, valve boxes, etc.), shall be stamped “IRRIGATION.”
Raw Water Irrigation System Master Plan March 2010
36
6. Accessible appurtenances not available from the manufacturer in the purple color (i.e. hatches, manhole covers, meter pit lids, valve boxes, etc.), shall be primed and painted with 2 coats of an approved purple rust inhibitive paint.
The DP station shall meet or exceed the criteria listed in Section 4.3 and shall meet this additional requirement:
1. The pump system shall include a pressure maintenance (jockey) pump for sustaining the design pressure in the distribution system at all times. The requirement will be determined during the pump station design and may be satisfied by one of the primary pumps with a VFD.
5.6 Distribution System Opinions of Cost
Opinion of Costs were prepared for the Priority 1, 2, and 3 distribution systems and are listed in Tables 5.6.1, 5.6.2 and Table 5.6.3, respectively. Table 5.6.1 has an estimated cost of $3,119,350 for the Priority 1 distribution system, which is significantly higher because of the mandatory improvements that are needed initially. These improvements include the DP station, construction of the Central Park irrigation reservoir, and larger distribution pipe lines.
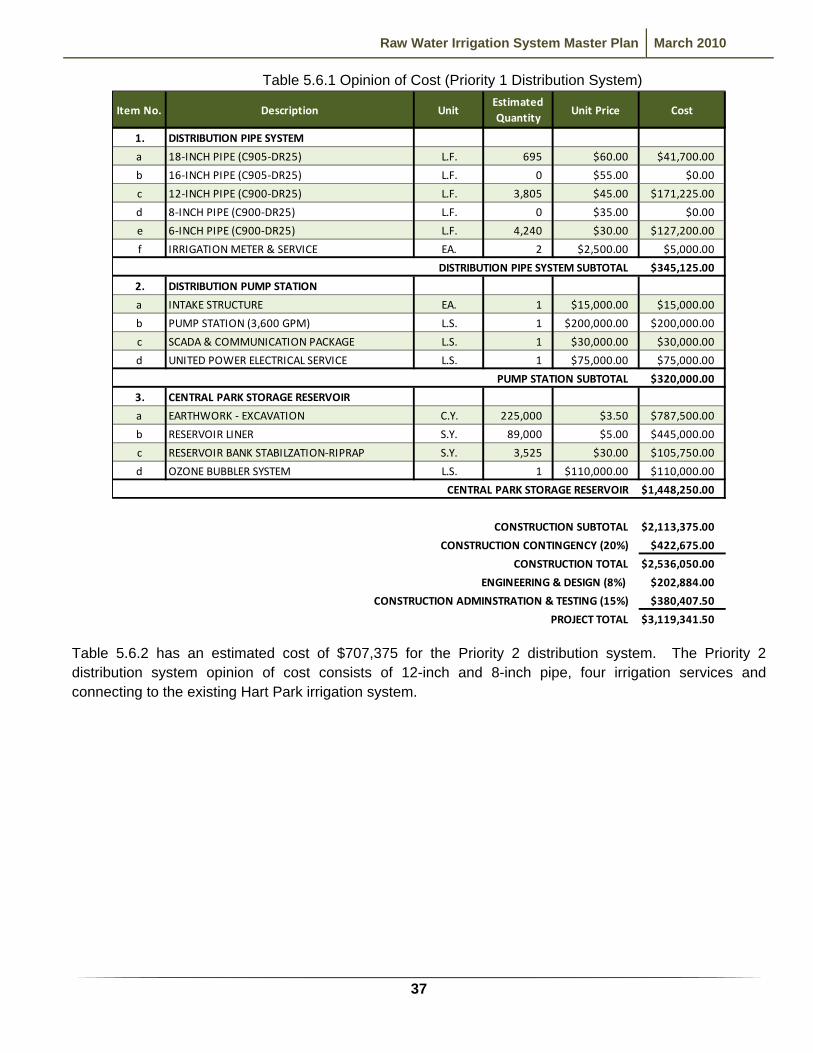
Raw Water Irrigation System Master Plan March 2010
37
Table 5.6.1 Opinion of Cost (Priority 1 Distribution System)
1. DISTRIBUTION PIPE SYSTEM
a 18‐INCH PIPE (C905‐DR25) L.F. 695 $60.00 $41,700.00
b 16‐INCH PIPE (C905‐DR25) L.F. 0 $55.00 $0.00
c 12‐INCH PIPE (C900‐DR25) L.F. 3,805 $45.00 $171,225.00
d 8‐INCH PIPE (C900‐DR25) L.F. 0 $35.00 $0.00
e 6‐INCH PIPE (C900‐DR25) L.F. 4,240 $30.00 $127,200.00
f IRRIGATION METER & SERVICE EA. 2 $2,500.00 $5,000.00
DISTRIBUTION PIPE SYSTEM SUBTOTAL $345,125.00
2. DISTRIBUTION PUMP STATION
a INTAKE STRUCTURE EA. 1 $15,000.00 $15,000.00
b PUMP STATION (3,600 GPM) L.S. 1 $200,000.00 $200,000.00
c SCADA & COMMUNICATION PACKAGE L.S. 1 $30,000.00 $30,000.00
d UNITED POWER ELECTRICAL SERVICE L.S. 1 $75,000.00 $75,000.00
PUMP STATION SUBTOTAL $320,000.00
3. CENTRAL PARK STORAGE RESERVOIR
a EARTHWORK ‐ EXCAVATION C.Y. 225,000 $3.50 $787,500.00
b RESERVOIR LINER S.Y. 89,000 $5.00 $445,000.00
c RESERVOIR BANK STABILZATION‐RIPRAP S.Y. 3,525 $30.00 $105,750.00
d OZONE BUBBLER SYSTEM L.S. 1 $110,000.00 $110,000.00
CENTRAL PARK STORAGE RESERVOIR $1,448,250.00
CONSTRUCTION SUBTOTAL $2,113,375.00
CONSTRUCTION CONTINGENCY (20%) $422,675.00
CONSTRUCTION TOTAL $2,536,050.00
ENGINEERING & DESIGN (8%) $202,884.00
CONSTRUCTION ADMINSTRATION & TESTING (15%) $380,407.50
PROJECT TOTAL $3,119,341.50
Unit Price CostItem No.Estimated Quantity
UnitDescription
Table 5.6.2 has an estimated cost of $707,375 for the Priority 2 distribution system. The Priority 2 distribution system opinion of cost consists of 12-inch and 8-inch pipe, four irrigation services and connecting to the existing Hart Park irrigation system.
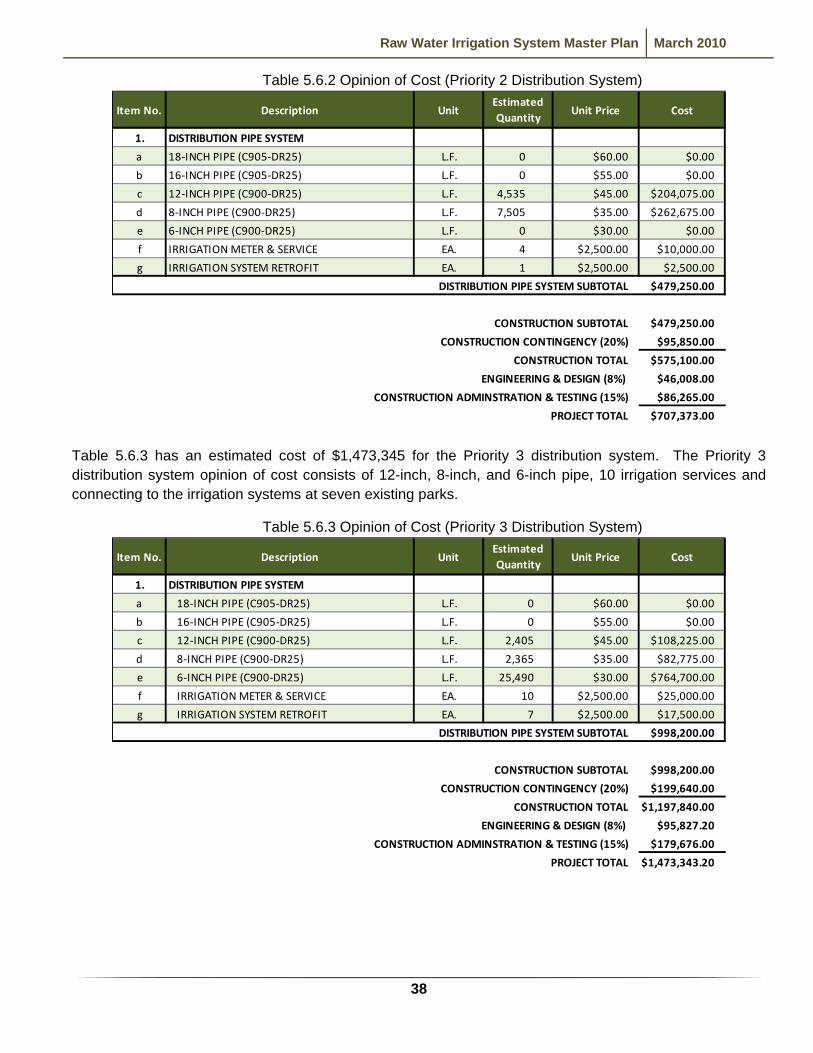
Raw Water Irrigation System Master Plan March 2010
38
Table 5.6.2 Opinion of Cost (Priority 2 Distribution System)
1. DISTRIBUTION PIPE SYSTEM
a 18‐INCH PIPE (C905‐DR25) L.F. 0 $60.00 $0.00
b 16‐INCH PIPE (C905‐DR25) L.F. 0 $55.00 $0.00
c 12‐INCH PIPE (C900‐DR25) L.F. 4,535 $45.00 $204,075.00
d 8‐INCH PIPE (C900‐DR25) L.F. 7,505 $35.00 $262,675.00
e 6‐INCH PIPE (C900‐DR25) L.F. 0 $30.00 $0.00
f IRRIGATION METER & SERVICE EA. 4 $2,500.00 $10,000.00
g IRRIGATION SYSTEM RETROFIT EA. 1 $2,500.00 $2,500.00
DISTRIBUTION PIPE SYSTEM SUBTOTAL $479,250.00
CONSTRUCTION SUBTOTAL $479,250.00
CONSTRUCTION CONTINGENCY (20%) $95,850.00
CONSTRUCTION TOTAL $575,100.00
ENGINEERING & DESIGN (8%) $46,008.00
CONSTRUCTION ADMINSTRATION & TESTING (15%) $86,265.00
PROJECT TOTAL $707,373.00
CostItem No. Description UnitEstimated Quantity
Unit Price
Table 5.6.3 has an estimated cost of $1,473,345 for the Priority 3 distribution system. The Priority 3 distribution system opinion of cost consists of 12-inch, 8-inch, and 6-inch pipe, 10 irrigation services and connecting to the irrigation systems at seven existing parks.
Table 5.6.3 Opinion of Cost (Priority 3 Distribution System)
1. DISTRIBUTION PIPE SYSTEM
a 18‐INCH PIPE (C905‐DR25) L.F. 0 $60.00 $0.00
b 16‐INCH PIPE (C905‐DR25) L.F. 0 $55.00 $0.00
c 12‐INCH PIPE (C900‐DR25) L.F. 2,405 $45.00 $108,225.00
d 8‐INCH PIPE (C900‐DR25) L.F. 2,365 $35.00 $82,775.00
e 6‐INCH PIPE (C900‐DR25) L.F. 25,490 $30.00 $764,700.00
f IRRIGATION METER & SERVICE EA. 10 $2,500.00 $25,000.00
g IRRIGATION SYSTEM RETROFIT EA. 7 $2,500.00 $17,500.00
DISTRIBUTION PIPE SYSTEM SUBTOTAL $998,200.00
CONSTRUCTION SUBTOTAL $998,200.00
CONSTRUCTION CONTINGENCY (20%) $199,640.00
CONSTRUCTION TOTAL $1,197,840.00
ENGINEERING & DESIGN (8%) $95,827.20
CONSTRUCTION ADMINSTRATION & TESTING (15%) $179,676.00
PROJECT TOTAL $1,473,343.20
CostItem No. Description UnitEstimated Quantity
Unit Price
Raw Water Irrigation System Master Plan March 2010
39
5.7 Alternative Irrigation Supply
In the event of a drought condition similar to or exceeding that of 2002, the Town would still have the ability to irrigate using potable water. Potable water could also be used as an interim supply if the TP station is taken out of service for an extended period of time. Fire hydrants located at Central Park could be used to fill the storage reservoirs as needed to supply water to the system. A fire hydrant was installed with the Phase 1A infrastructure for Central Park and is located on the east side of Park Avenue, across from the Carbon Valley library site (Lot 1). There will be additional fire hydrants located along Park Avenue that will be installed with future phases of the park development that could also be used to fill the reservoirs.
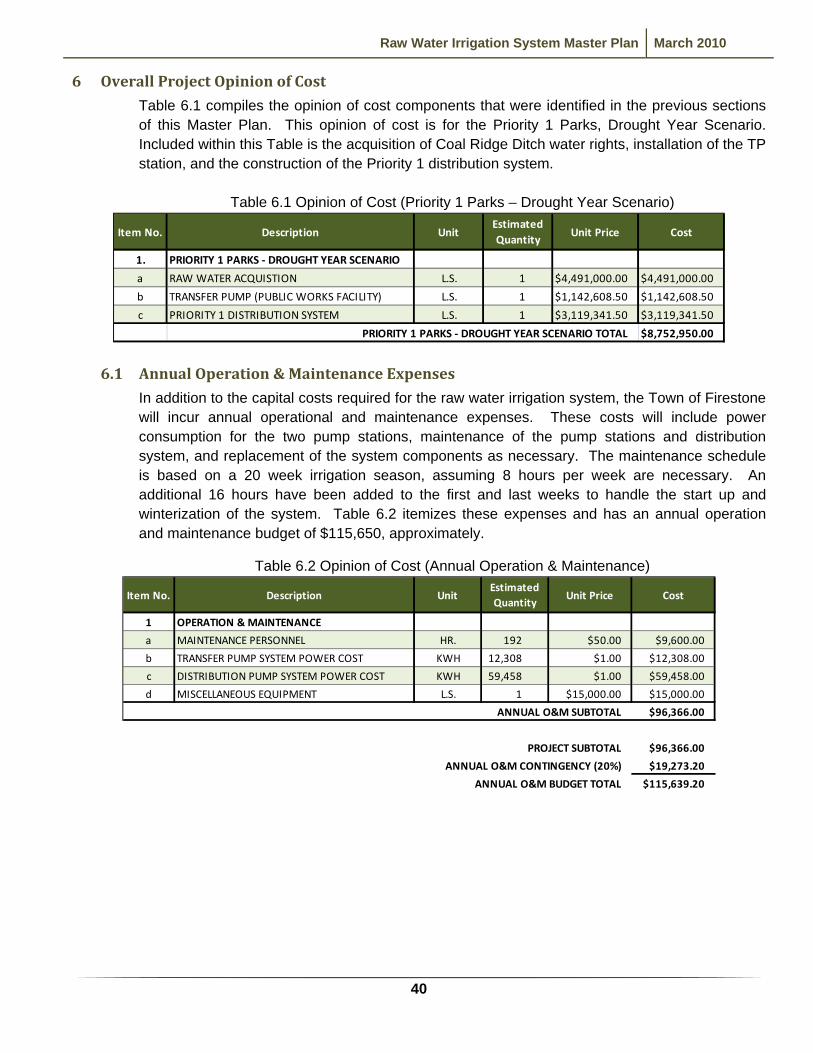
Raw Water Irrigation System Master Plan March 2010
40
6 Overall Project Opinion of Cost
Table 6.1 compiles the opinion of cost components that were identified in the previous sections of this Master Plan. This opinion of cost is for the Priority 1 Parks, Drought Year Scenario. Included within this Table is the acquisition of Coal Ridge Ditch water rights, installation of the TP station, and the construction of the Priority 1 distribution system.
Table 6.1 Opinion of Cost (Priority 1 Parks – Drought Year Scenario)
1. PRIORITY 1 PARKS ‐ DROUGHT YEAR SCENARIO
a RAW WATER ACQUISTION L.S. 1 $4,491,000.00 $4,491,000.00
b TRANSFER PUMP (PUBLIC WORKS FACILITY) L.S. 1 $1,142,608.50 $1,142,608.50
c PRIORITY 1 DISTRIBUTION SYSTEM L.S. 1 $3,119,341.50 $3,119,341.50
PRIORITY 1 PARKS ‐ DROUGHT YEAR SCENARIO TOTAL $8,752,950.00
CostItem No. Description UnitEstimated Quantity
Unit Price
6.1 Annual Operation & Maintenance Expenses
In addition to the capital costs required for the raw water irrigation system, the Town of Firestone will incur annual operational and maintenance expenses. These costs will include power consumption for the two pump stations, maintenance of the pump stations and distribution system, and replacement of the system components as necessary. The maintenance schedule is based on a 20 week irrigation season, assuming 8 hours per week are necessary. An additional 16 hours have been added to the first and last weeks to handle the start up and winterization of the system. Table 6.2 itemizes these expenses and has an annual operation and maintenance budget of $115,650, approximately.
Table 6.2 Opinion of Cost (Annual Operation & Maintenance)
1 OPERATION & MAINTENANCE
a MAINTENANCE PERSONNEL HR. 192 $50.00 $9,600.00
b TRANSFER PUMP SYSTEM POWER COST KWH 12,308 $1.00 $12,308.00
c DISTRIBUTION PUMP SYSTEM POWER COST KWH 59,458 $1.00 $59,458.00
d MISCELLANEOUS EQUIPMENT L.S. 1 $15,000.00 $15,000.00
ANNUAL O&M SUBTOTAL $96,366.00
PROJECT SUBTOTAL $96,366.00
ANNUAL O&M CONTINGENCY (20%) $19,273.20
ANNUAL O&M BUDGET TOTAL $115,639.20
CostItem No. Description UnitEstimated Quantity
Unit Price
Raw Water Irrigation System Master Plan March 2010
41
7 References
2003 Water Master Plan TST Inc., Consulting Engineers June 2003 Northern Colorado Water Conservancy District, www.ncwcd.org Town of Firestone Central Park Infrastructure Master Plan (Draft) TST Inc., Consulting Engineers 2006 Town of Firestone Master Plan, 2008 Town of Firestone Raw Water Master Plan (August 2007)
Clear Water Solutions, Inc. August 2007
Vogl Land – North Parcel Irrigation Report Prominence Development Corp. November 7, 2005
Raw Water Irrigation System Master Plan March 2010
A
Appendix A: Park Information
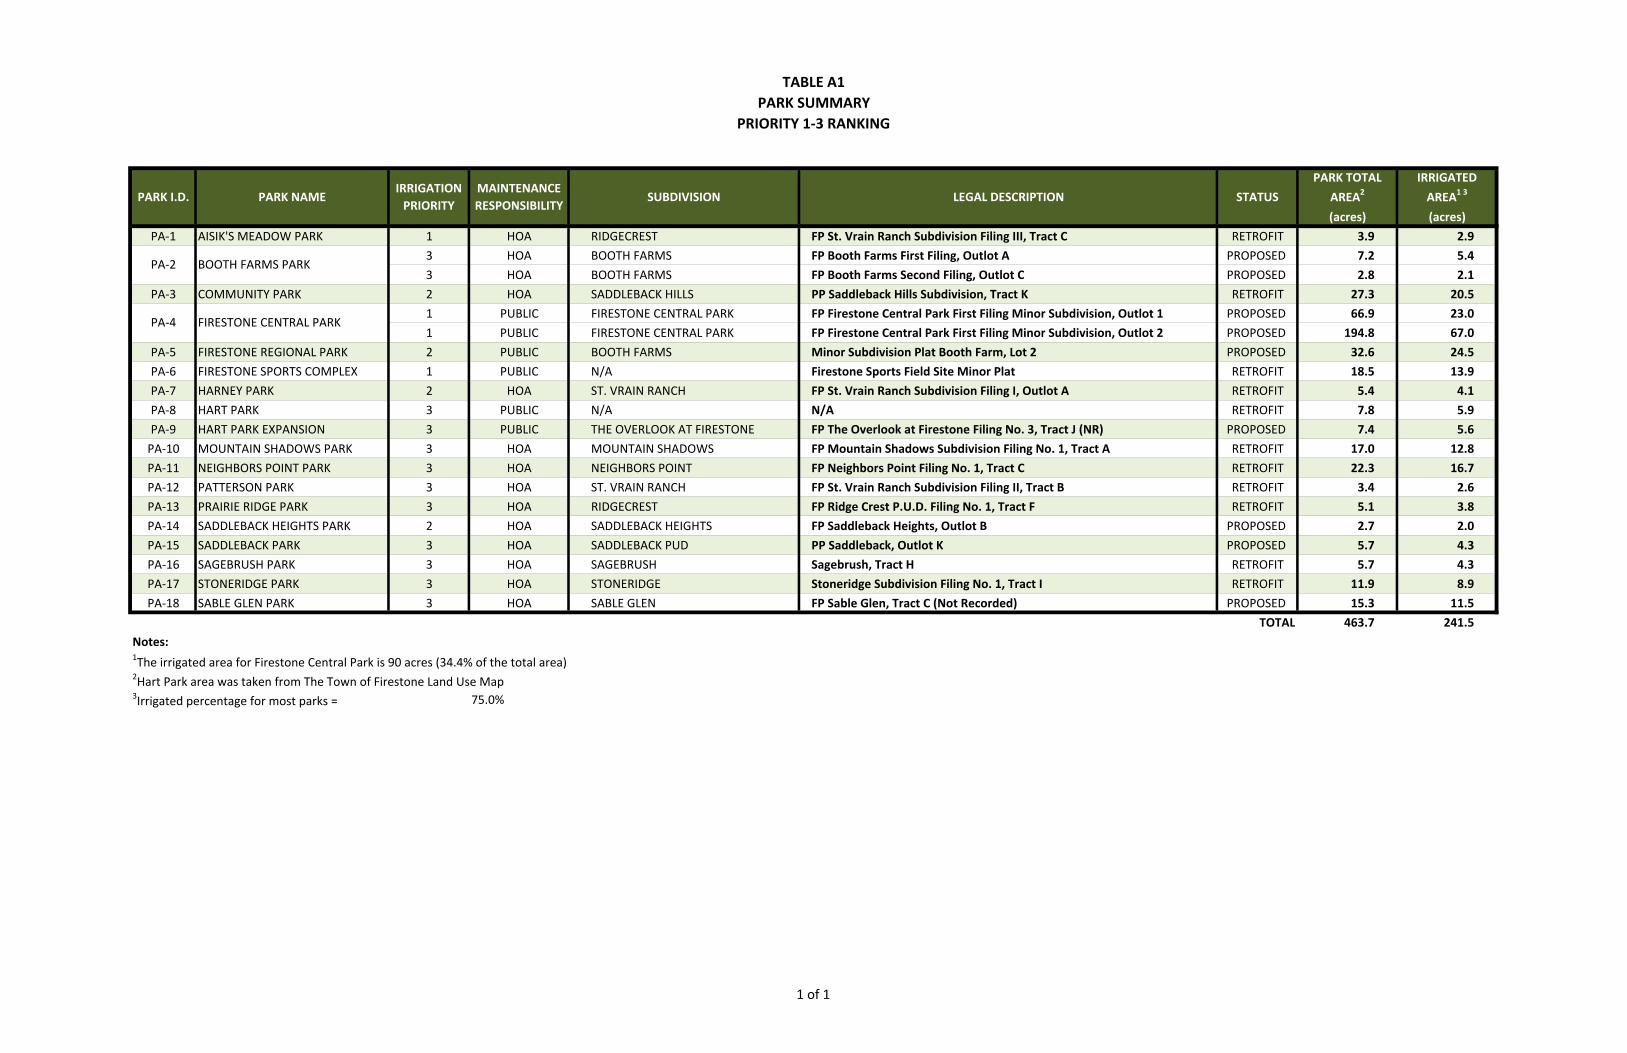
TABLE A1PARK SUMMARY
PRIORITY 1‐3 RANKING
(acres) (acres)
PA‐1 AISIK'S MEADOW PARK 1 HOA RIDGECREST FP St. Vrain Ranch Subdivision Filing III, Tract C RETROFIT 3.9 2.9
3 HOA BOOTH FARMS FP Booth Farms First Filing, Outlot A PROPOSED 7.2 5.4
3 HOA BOOTH FARMS FP Booth Farms Second Filing, Outlot C PROPOSED 2.8 2.1
PA‐3 COMMUNITY PARK 2 HOA SADDLEBACK HILLS PP Saddleback Hills Subdivision, Tract K RETROFIT 27.3 20.5
1 PUBLIC FIRESTONE CENTRAL PARK FP Firestone Central Park First Filing Minor Subdivision, Outlot 1 PROPOSED 66.9 23.0
1 PUBLIC FIRESTONE CENTRAL PARK FP Firestone Central Park First Filing Minor Subdivision, Outlot 2 PROPOSED 194.8 67.0
PA‐5 FIRESTONE REGIONAL PARK 2 PUBLIC BOOTH FARMS Minor Subdivision Plat Booth Farm, Lot 2 PROPOSED 32.6 24.5
PA‐6 FIRESTONE SPORTS COMPLEX 1 PUBLIC N/A Firestone Sports Field Site Minor Plat RETROFIT 18.5 13.9
PA‐7 HARNEY PARK 2 HOA ST. VRAIN RANCH FP St. Vrain Ranch Subdivision Filing I, Outlot A RETROFIT 5.4 4.1
PA‐8 HART PARK 3 PUBLIC N/A N/A RETROFIT 7.8 5.9
PA‐9 HART PARK EXPANSION 3 PUBLIC THE OVERLOOK AT FIRESTONE FP The Overlook at Firestone Filing No. 3, Tract J (NR) PROPOSED 7.4 5.6
PA‐10 MOUNTAIN SHADOWS PARK 3 HOA MOUNTAIN SHADOWS FP Mountain Shadows Subdivision Filing No. 1, Tract A RETROFIT 17.0 12.8
PA‐11 NEIGHBORS POINT PARK 3 HOA NEIGHBORS POINT FP Neighbors Point Filing No. 1, Tract C RETROFIT 22.3 16.7
PA‐12 PATTERSON PARK 3 HOA ST. VRAIN RANCH FP St. Vrain Ranch Subdivision Filing II, Tract B RETROFIT 3.4 2.6
PA‐13 PRAIRIE RIDGE PARK 3 HOA RIDGECREST FP Ridge Crest P.U.D. Filing No. 1, Tract F RETROFIT 5.1 3.8
PA‐14 SADDLEBACK HEIGHTS PARK 2 HOA SADDLEBACK HEIGHTS FP Saddleback Heights, Outlot B PROPOSED 2.7 2.0
PA‐15 SADDLEBACK PARK 3 HOA SADDLEBACK PUD PP Saddleback, Outlot K PROPOSED 5.7 4.3
PA‐16 SAGEBRUSH PARK 3 HOA SAGEBRUSH Sagebrush, Tract H RETROFIT 5.7 4.3
PA‐17 STONERIDGE PARK 3 HOA STONERIDGE Stoneridge Subdivision Filing No. 1, Tract I RETROFIT 11.9 8.9
PA‐18 SABLE GLEN PARK 3 HOA SABLE GLEN FP Sable Glen, Tract C (Not Recorded) PROPOSED 15.3 11.5
TOTAL 463.7 241.5
Notes:1The irrigated area for Firestone Central Park is 90 acres (34.4% of the total area)2Hart Park area was taken from The Town of Firestone Land Use Map3Irrigated percentage for most parks = 75.0%
IRRIGATED
AREA1 3STATUS
PARK TOTAL
AREA2PARK NAMEMAINTENANCE RESPONSIBILITY
IRRIGATION PRIORITY
SUBDIVISION LEGAL DESCRIPTIONPARK I.D.
PA‐2 BOOTH FARMS PARK
PA‐4 FIRESTONE CENTRAL PARK
1 of 1
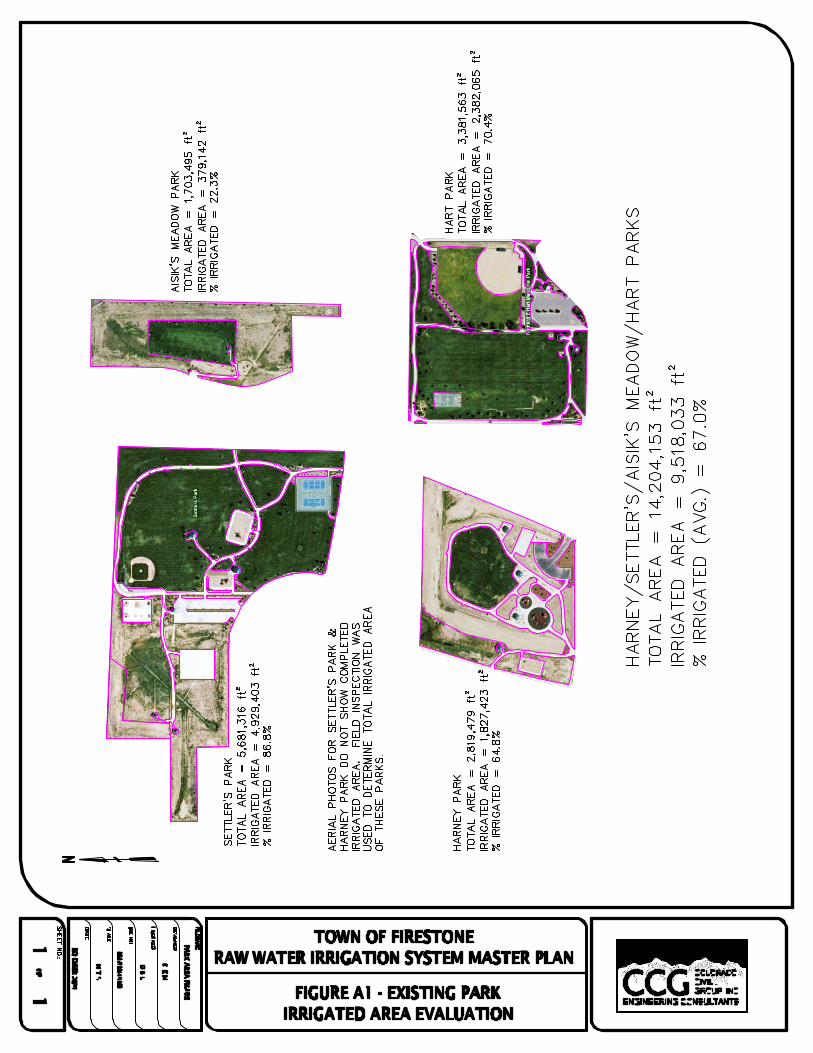
Raw Water Irrigation System Master Plan March 2010
B
Appendix B: Precipitation and ETO Data
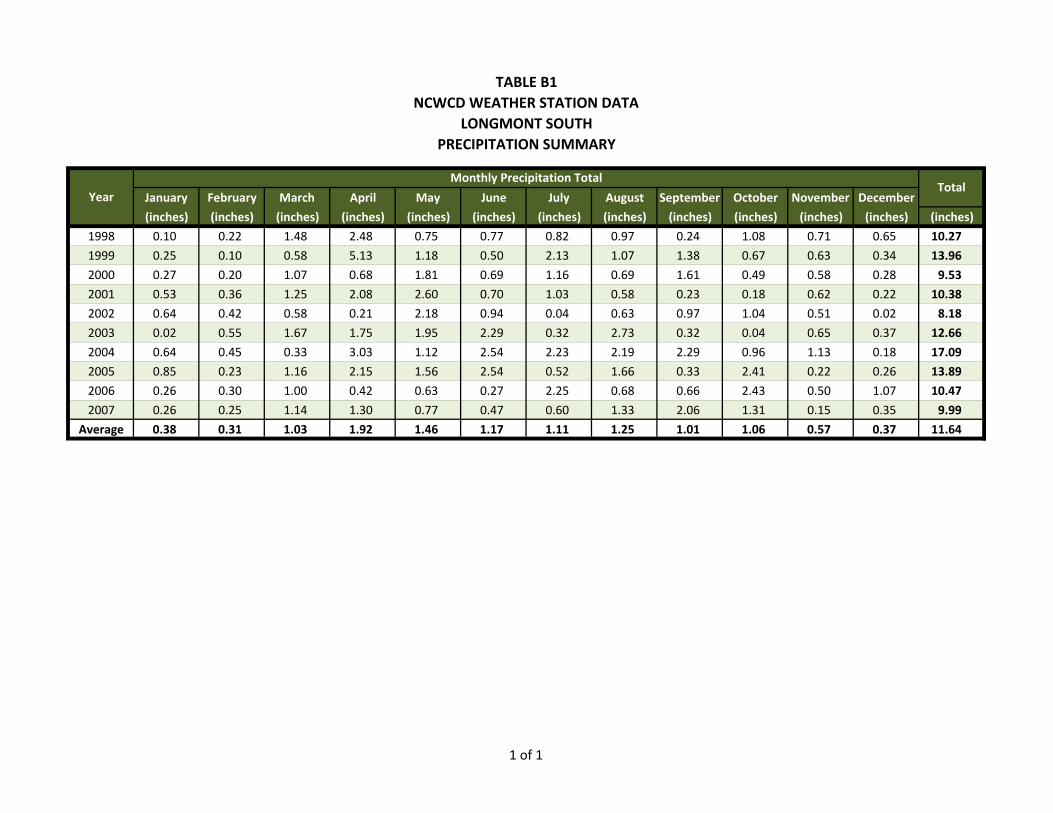
TABLE B1NCWCD WEATHER STATION DATA
LONGMONT SOUTH PRECIPITATION SUMMARY
January February March April May June July August September October November December
(inches) (inches) (inches) (inches) (inches) (inches) (inches) (inches) (inches) (inches) (inches) (inches) (inches)
1998 0.10 0.22 1.48 2.48 0.75 0.77 0.82 0.97 0.24 1.08 0.71 0.65 10.27
1999 0.25 0.10 0.58 5.13 1.18 0.50 2.13 1.07 1.38 0.67 0.63 0.34 13.96
2000 0.27 0.20 1.07 0.68 1.81 0.69 1.16 0.69 1.61 0.49 0.58 0.28 9.53
2001 0.53 0.36 1.25 2.08 2.60 0.70 1.03 0.58 0.23 0.18 0.62 0.22 10.38
2002 0.64 0.42 0.58 0.21 2.18 0.94 0.04 0.63 0.97 1.04 0.51 0.02 8.18
2003 0.02 0.55 1.67 1.75 1.95 2.29 0.32 2.73 0.32 0.04 0.65 0.37 12.66
2004 0.64 0.45 0.33 3.03 1.12 2.54 2.23 2.19 2.29 0.96 1.13 0.18 17.09
2005 0.85 0.23 1.16 2.15 1.56 2.54 0.52 1.66 0.33 2.41 0.22 0.26 13.89
2006 0.26 0.30 1.00 0.42 0.63 0.27 2.25 0.68 0.66 2.43 0.50 1.07 10.47
2007 0.26 0.25 1.14 1.30 0.77 0.47 0.60 1.33 2.06 1.31 0.15 0.35 9.99
Average 0.38 0.31 1.03 1.92 1.46 1.17 1.11 1.25 1.01 1.06 0.57 0.37 11.64
Year
Monthly Precipitation TotalTotal
1 of 1
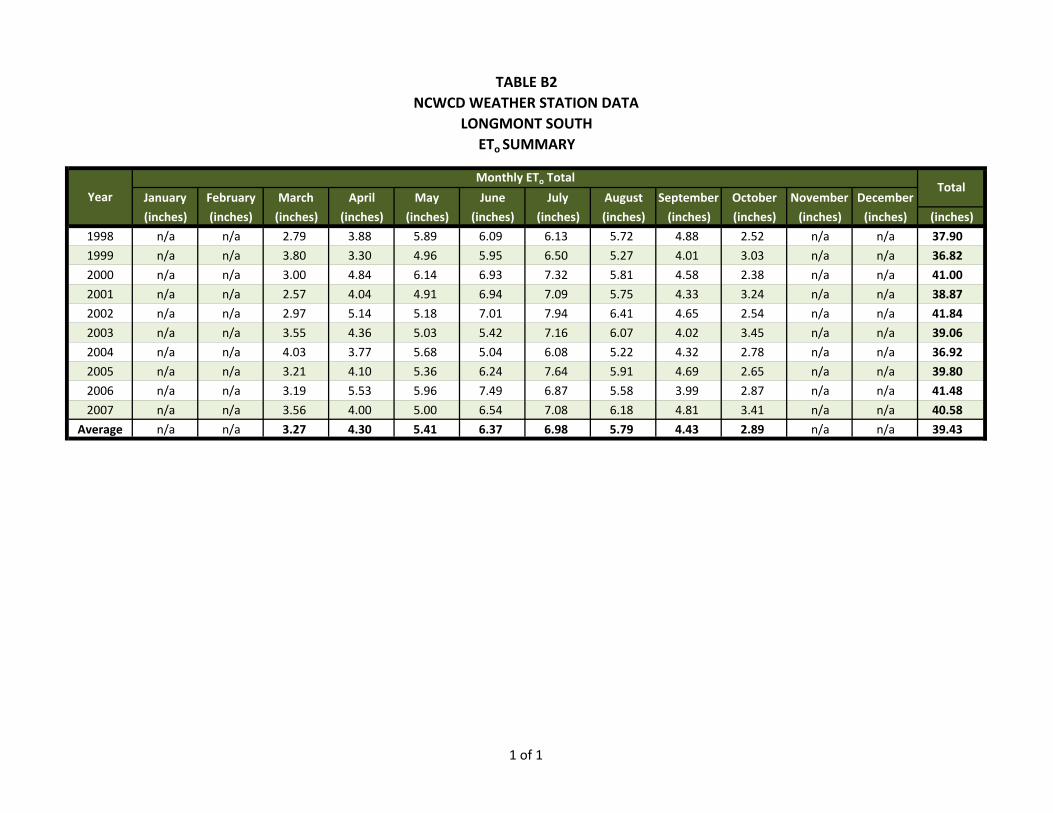
TABLE B2NCWCD WEATHER STATION DATA
LONGMONT SOUTH ETo SUMMARY
January February March April May June July August September October November December
(inches) (inches) (inches) (inches) (inches) (inches) (inches) (inches) (inches) (inches) (inches) (inches) (inches)
1998 n/a n/a 2.79 3.88 5.89 6.09 6.13 5.72 4.88 2.52 n/a n/a 37.90
1999 n/a n/a 3.80 3.30 4.96 5.95 6.50 5.27 4.01 3.03 n/a n/a 36.82
2000 n/a n/a 3.00 4.84 6.14 6.93 7.32 5.81 4.58 2.38 n/a n/a 41.00
2001 n/a n/a 2.57 4.04 4.91 6.94 7.09 5.75 4.33 3.24 n/a n/a 38.87
2002 n/a n/a 2.97 5.14 5.18 7.01 7.94 6.41 4.65 2.54 n/a n/a 41.84
2003 n/a n/a 3.55 4.36 5.03 5.42 7.16 6.07 4.02 3.45 n/a n/a 39.06
2004 n/a n/a 4.03 3.77 5.68 5.04 6.08 5.22 4.32 2.78 n/a n/a 36.92
2005 n/a n/a 3.21 4.10 5.36 6.24 7.64 5.91 4.69 2.65 n/a n/a 39.80
2006 n/a n/a 3.19 5.53 5.96 7.49 6.87 5.58 3.99 2.87 n/a n/a 41.48
2007 n/a n/a 3.56 4.00 5.00 6.54 7.08 6.18 4.81 3.41 n/a n/a 40.58
Average n/a n/a 3.27 4.30 5.41 6.37 6.98 5.79 4.43 2.89 n/a n/a 39.43
Year
Monthly ETo Total Total
1 of 1
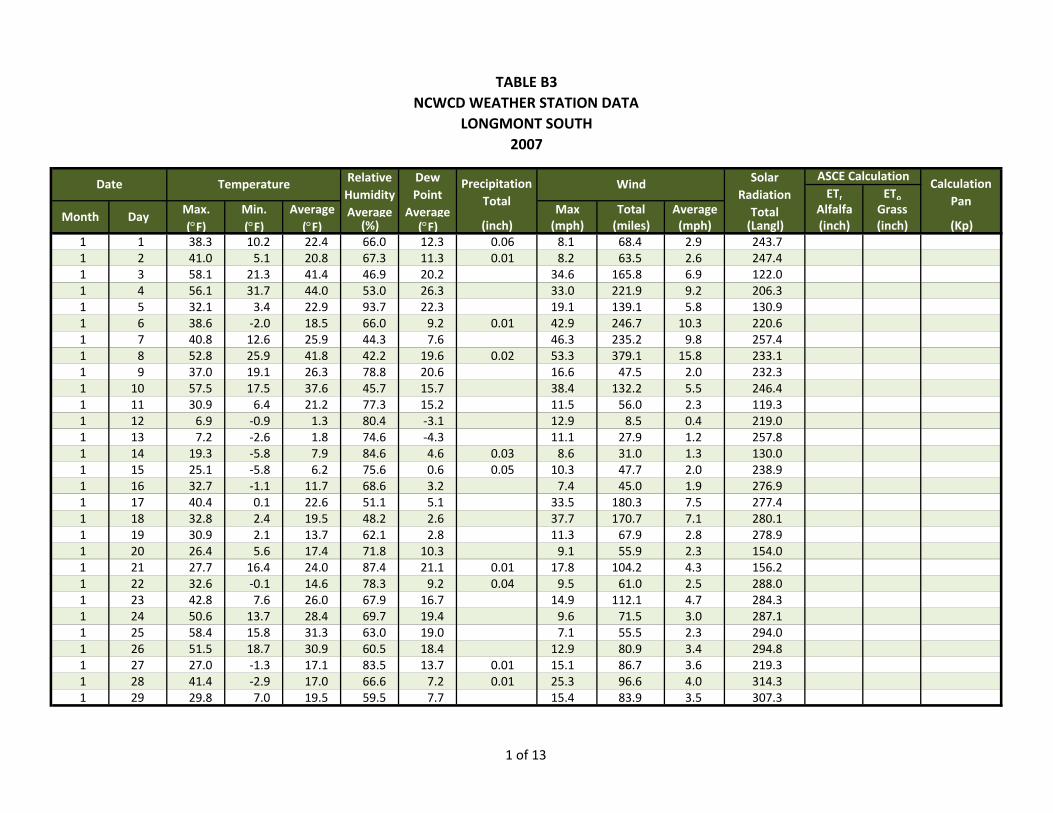
TABLE B3NCWCD WEATHER STATION DATA
LONGMONT SOUTH 2007
ETr EToMax. Min. Average Max Total Average Alfalfa Grass(°F) (°F) (°F) (%) (°F) (inch) (mph) (miles) (mph) (Langl) (inch) (inch) (Kp)
1 1 38.3 10.2 22.4 66.0 12.3 0.06 8.1 68.4 2.9 243.71 2 41.0 5.1 20.8 67.3 11.3 0.01 8.2 63.5 2.6 247.41 3 58.1 21.3 41.4 46.9 20.2 34.6 165.8 6.9 122.01 4 56.1 31.7 44.0 53.0 26.3 33.0 221.9 9.2 206.31 5 32.1 3.4 22.9 93.7 22.3 19.1 139.1 5.8 130.91 6 38.6 ‐2.0 18.5 66.0 9.2 0.01 42.9 246.7 10.3 220.61 7 40.8 12.6 25.9 44.3 7.6 46.3 235.2 9.8 257.41 8 52.8 25.9 41.8 42.2 19.6 0.02 53.3 379.1 15.8 233.11 9 37.0 19.1 26.3 78.8 20.6 16.6 47.5 2.0 232.31 10 57.5 17.5 37.6 45.7 15.7 38.4 132.2 5.5 246.41 11 30.9 6.4 21.2 77.3 15.2 11.5 56.0 2.3 119.31 12 6.9 ‐0.9 1.3 80.4 ‐3.1 12.9 8.5 0.4 219.01 13 7.2 ‐2.6 1.8 74.6 ‐4.3 11.1 27.9 1.2 257.81 14 19.3 ‐5.8 7.9 84.6 4.6 0.03 8.6 31.0 1.3 130.01 15 25.1 ‐5.8 6.2 75.6 0.6 0.05 10.3 47.7 2.0 238.91 16 32.7 ‐1.1 11.7 68.6 3.2 7.4 45.0 1.9 276.91 17 40.4 0.1 22.6 51.1 5.1 33.5 180.3 7.5 277.41 18 32.8 2.4 19.5 48.2 2.6 37.7 170.7 7.1 280.11 19 30.9 2.1 13.7 62.1 2.8 11.3 67.9 2.8 278.91 20 26.4 5.6 17.4 71.8 10.3 9.1 55.9 2.3 154.01 21 27.7 16.4 24.0 87.4 21.1 0.01 17.8 104.2 4.3 156.21 22 32.6 ‐0.1 14.6 78.3 9.2 0.04 9.5 61.0 2.5 288.01 23 42.8 7.6 26.0 67.9 16.7 14.9 112.1 4.7 284.31 24 50.6 13.7 28.4 69.7 19.4 9.6 71.5 3.0 287.11 25 58.4 15.8 31.3 63.0 19.0 7.1 55.5 2.3 294.01 26 51.5 18.7 30.9 60.5 18.4 12.9 80.9 3.4 294.81 27 27.0 ‐1.3 17.1 83.5 13.7 0.01 15.1 86.7 3.6 219.31 28 41.4 ‐2.9 17.0 66.6 7.2 0.01 25.3 96.6 4.0 314.31 29 29.8 7.0 19.5 59.5 7.7 15.4 83.9 3.5 307.3
Month Day
Temperature Wind Calculation Pan
Relative Humidity Average
Dew Point
Average
Precipitation Total
ASCE CalculationSolar Radiation Total
Date
1 of 13
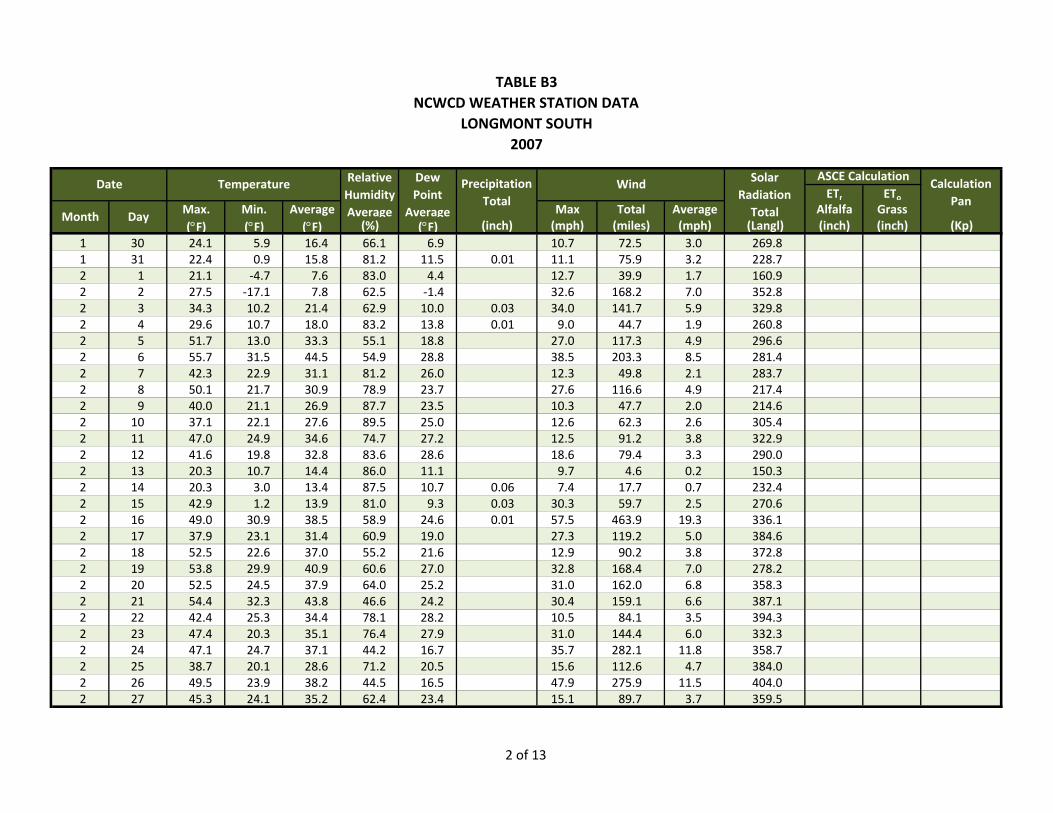
TABLE B3NCWCD WEATHER STATION DATA
LONGMONT SOUTH 2007
ETr EToMax. Min. Average Max Total Average Alfalfa Grass(°F) (°F) (°F) (%) (°F) (inch) (mph) (miles) (mph) (Langl) (inch) (inch) (Kp)
Month Day
Temperature Wind Calculation Pan
Relative Humidity Average
Dew Point
Average
Precipitation Total
ASCE CalculationSolar Radiation Total
Date
1 30 24.1 5.9 16.4 66.1 6.9 10.7 72.5 3.0 269.81 31 22.4 0.9 15.8 81.2 11.5 0.01 11.1 75.9 3.2 228.72 1 21.1 ‐4.7 7.6 83.0 4.4 12.7 39.9 1.7 160.92 2 27.5 ‐17.1 7.8 62.5 ‐1.4 32.6 168.2 7.0 352.82 3 34.3 10.2 21.4 62.9 10.0 0.03 34.0 141.7 5.9 329.82 4 29.6 10.7 18.0 83.2 13.8 0.01 9.0 44.7 1.9 260.82 5 51.7 13.0 33.3 55.1 18.8 27.0 117.3 4.9 296.62 6 55.7 31.5 44.5 54.9 28.8 38.5 203.3 8.5 281.42 7 42.3 22.9 31.1 81.2 26.0 12.3 49.8 2.1 283.72 8 50.1 21.7 30.9 78.9 23.7 27.6 116.6 4.9 217.42 9 40.0 21.1 26.9 87.7 23.5 10.3 47.7 2.0 214.62 10 37.1 22.1 27.6 89.5 25.0 12.6 62.3 2.6 305.42 11 47.0 24.9 34.6 74.7 27.2 12.5 91.2 3.8 322.92 12 41.6 19.8 32.8 83.6 28.6 18.6 79.4 3.3 290.02 13 20.3 10.7 14.4 86.0 11.1 9.7 4.6 0.2 150.32 14 20.3 3.0 13.4 87.5 10.7 0.06 7.4 17.7 0.7 232.42 15 42.9 1.2 13.9 81.0 9.3 0.03 30.3 59.7 2.5 270.62 16 49.0 30.9 38.5 58.9 24.6 0.01 57.5 463.9 19.3 336.12 17 37.9 23.1 31.4 60.9 19.0 27.3 119.2 5.0 384.62 18 52.5 22.6 37.0 55.2 21.6 12.9 90.2 3.8 372.82 19 53.8 29.9 40.9 60.6 27.0 32.8 168.4 7.0 278.22 20 52.5 24.5 37.9 64.0 25.2 31.0 162.0 6.8 358.32 21 54.4 32.3 43.8 46.6 24.2 30.4 159.1 6.6 387.12 22 42.4 25.3 34.4 78.1 28.2 10.5 84.1 3.5 394.32 23 47.4 20.3 35.1 76.4 27.9 31.0 144.4 6.0 332.32 24 47.1 24.7 37.1 44.2 16.7 35.7 282.1 11.8 358.72 25 38.7 20.1 28.6 71.2 20.5 15.6 112.6 4.7 384.02 26 49.5 23.9 38.2 44.5 16.5 47.9 275.9 11.5 404.02 27 45.3 24.1 35.2 62.4 23.4 15.1 89.7 3.7 359.5
2 of 13
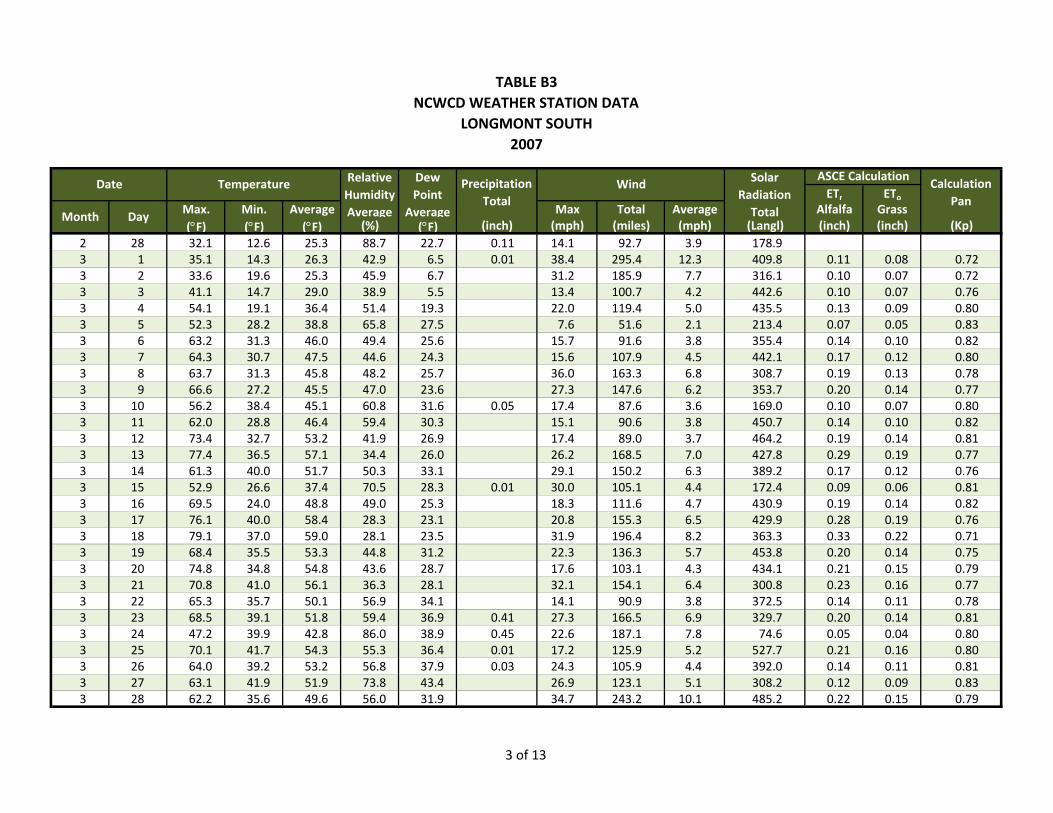
TABLE B3NCWCD WEATHER STATION DATA
LONGMONT SOUTH 2007
ETr EToMax. Min. Average Max Total Average Alfalfa Grass(°F) (°F) (°F) (%) (°F) (inch) (mph) (miles) (mph) (Langl) (inch) (inch) (Kp)
Month Day
Temperature Wind Calculation Pan
Relative Humidity Average
Dew Point
Average
Precipitation Total
ASCE CalculationSolar Radiation Total
Date
2 28 32.1 12.6 25.3 88.7 22.7 0.11 14.1 92.7 3.9 178.93 1 35.1 14.3 26.3 42.9 6.5 0.01 38.4 295.4 12.3 409.8 0.11 0.08 0.723 2 33.6 19.6 25.3 45.9 6.7 31.2 185.9 7.7 316.1 0.10 0.07 0.723 3 41.1 14.7 29.0 38.9 5.5 13.4 100.7 4.2 442.6 0.10 0.07 0.763 4 54.1 19.1 36.4 51.4 19.3 22.0 119.4 5.0 435.5 0.13 0.09 0.803 5 52.3 28.2 38.8 65.8 27.5 7.6 51.6 2.1 213.4 0.07 0.05 0.833 6 63.2 31.3 46.0 49.4 25.6 15.7 91.6 3.8 355.4 0.14 0.10 0.823 7 64.3 30.7 47.5 44.6 24.3 15.6 107.9 4.5 442.1 0.17 0.12 0.803 8 63.7 31.3 45.8 48.2 25.7 36.0 163.3 6.8 308.7 0.19 0.13 0.783 9 66.6 27.2 45.5 47.0 23.6 27.3 147.6 6.2 353.7 0.20 0.14 0.773 10 56.2 38.4 45.1 60.8 31.6 0.05 17.4 87.6 3.6 169.0 0.10 0.07 0.803 11 62.0 28.8 46.4 59.4 30.3 15.1 90.6 3.8 450.7 0.14 0.10 0.823 12 73.4 32.7 53.2 41.9 26.9 17.4 89.0 3.7 464.2 0.19 0.14 0.813 13 77.4 36.5 57.1 34.4 26.0 26.2 168.5 7.0 427.8 0.29 0.19 0.773 14 61.3 40.0 51.7 50.3 33.1 29.1 150.2 6.3 389.2 0.17 0.12 0.763 15 52.9 26.6 37.4 70.5 28.3 0.01 30.0 105.1 4.4 172.4 0.09 0.06 0.813 16 69.5 24.0 48.8 49.0 25.3 18.3 111.6 4.7 430.9 0.19 0.14 0.823 17 76.1 40.0 58.4 28.3 23.1 20.8 155.3 6.5 429.9 0.28 0.19 0.763 18 79.1 37.0 59.0 28.1 23.5 31.9 196.4 8.2 363.3 0.33 0.22 0.713 19 68.4 35.5 53.3 44.8 31.2 22.3 136.3 5.7 453.8 0.20 0.14 0.753 20 74.8 34.8 54.8 43.6 28.7 17.6 103.1 4.3 434.1 0.21 0.15 0.793 21 70.8 41.0 56.1 36.3 28.1 32.1 154.1 6.4 300.8 0.23 0.16 0.773 22 65.3 35.7 50.1 56.9 34.1 14.1 90.9 3.8 372.5 0.14 0.11 0.783 23 68.5 39.1 51.8 59.4 36.9 0.41 27.3 166.5 6.9 329.7 0.20 0.14 0.813 24 47.2 39.9 42.8 86.0 38.9 0.45 22.6 187.1 7.8 74.6 0.05 0.04 0.803 25 70.1 41.7 54.3 55.3 36.4 0.01 17.2 125.9 5.2 527.7 0.21 0.16 0.803 26 64.0 39.2 53.2 56.8 37.9 0.03 24.3 105.9 4.4 392.0 0.14 0.11 0.813 27 63.1 41.9 51.9 73.8 43.4 26.9 123.1 5.1 308.2 0.12 0.09 0.833 28 62.2 35.6 49.6 56.0 31.9 34.7 243.2 10.1 485.2 0.22 0.15 0.79
3 of 13
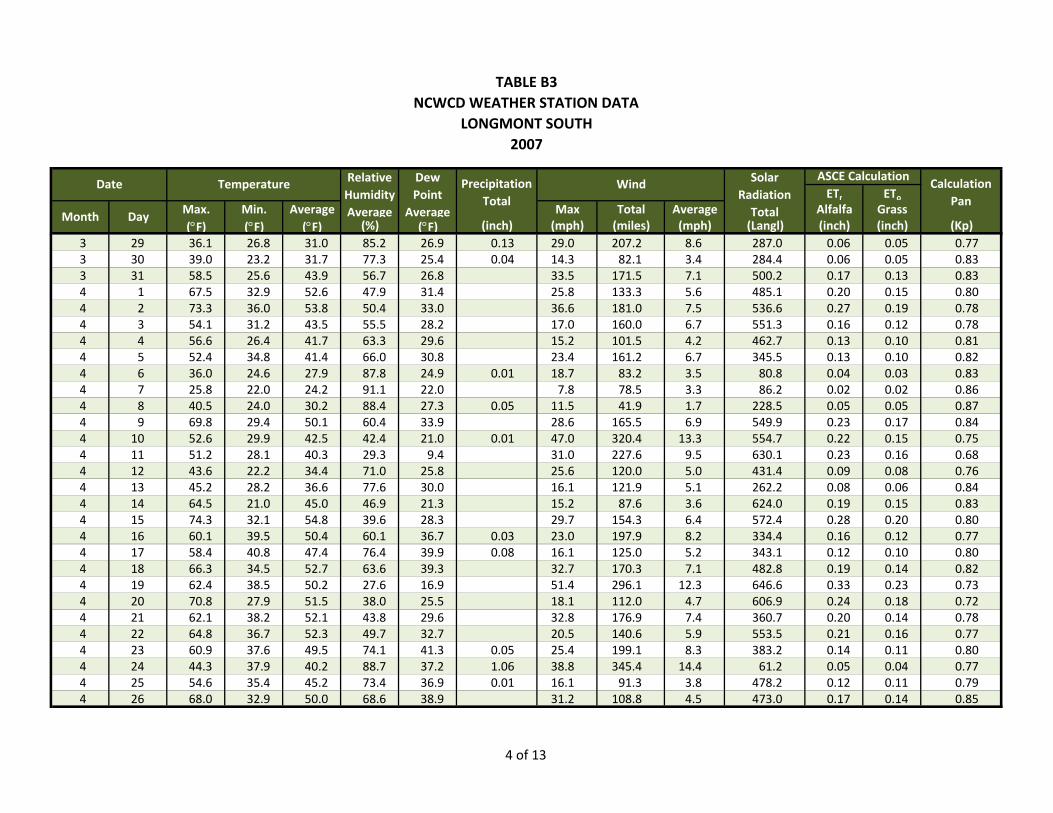
TABLE B3NCWCD WEATHER STATION DATA
LONGMONT SOUTH 2007
ETr EToMax. Min. Average Max Total Average Alfalfa Grass(°F) (°F) (°F) (%) (°F) (inch) (mph) (miles) (mph) (Langl) (inch) (inch) (Kp)
Month Day
Temperature Wind Calculation Pan
Relative Humidity Average
Dew Point
Average
Precipitation Total
ASCE CalculationSolar Radiation Total
Date
3 29 36.1 26.8 31.0 85.2 26.9 0.13 29.0 207.2 8.6 287.0 0.06 0.05 0.773 30 39.0 23.2 31.7 77.3 25.4 0.04 14.3 82.1 3.4 284.4 0.06 0.05 0.833 31 58.5 25.6 43.9 56.7 26.8 33.5 171.5 7.1 500.2 0.17 0.13 0.834 1 67.5 32.9 52.6 47.9 31.4 25.8 133.3 5.6 485.1 0.20 0.15 0.804 2 73.3 36.0 53.8 50.4 33.0 36.6 181.0 7.5 536.6 0.27 0.19 0.784 3 54.1 31.2 43.5 55.5 28.2 17.0 160.0 6.7 551.3 0.16 0.12 0.784 4 56.6 26.4 41.7 63.3 29.6 15.2 101.5 4.2 462.7 0.13 0.10 0.814 5 52.4 34.8 41.4 66.0 30.8 23.4 161.2 6.7 345.5 0.13 0.10 0.824 6 36.0 24.6 27.9 87.8 24.9 0.01 18.7 83.2 3.5 80.8 0.04 0.03 0.834 7 25.8 22.0 24.2 91.1 22.0 7.8 78.5 3.3 86.2 0.02 0.02 0.864 8 40.5 24.0 30.2 88.4 27.3 0.05 11.5 41.9 1.7 228.5 0.05 0.05 0.874 9 69.8 29.4 50.1 60.4 33.9 28.6 165.5 6.9 549.9 0.23 0.17 0.844 10 52.6 29.9 42.5 42.4 21.0 0.01 47.0 320.4 13.3 554.7 0.22 0.15 0.754 11 51.2 28.1 40.3 29.3 9.4 31.0 227.6 9.5 630.1 0.23 0.16 0.684 12 43.6 22.2 34.4 71.0 25.8 25.6 120.0 5.0 431.4 0.09 0.08 0.764 13 45.2 28.2 36.6 77.6 30.0 16.1 121.9 5.1 262.2 0.08 0.06 0.844 14 64.5 21.0 45.0 46.9 21.3 15.2 87.6 3.6 624.0 0.19 0.15 0.834 15 74.3 32.1 54.8 39.6 28.3 29.7 154.3 6.4 572.4 0.28 0.20 0.804 16 60.1 39.5 50.4 60.1 36.7 0.03 23.0 197.9 8.2 334.4 0.16 0.12 0.774 17 58.4 40.8 47.4 76.4 39.9 0.08 16.1 125.0 5.2 343.1 0.12 0.10 0.804 18 66.3 34.5 52.7 63.6 39.3 32.7 170.3 7.1 482.8 0.19 0.14 0.824 19 62.4 38.5 50.2 27.6 16.9 51.4 296.1 12.3 646.6 0.33 0.23 0.734 20 70.8 27.9 51.5 38.0 25.5 18.1 112.0 4.7 606.9 0.24 0.18 0.724 21 62.1 38.2 52.1 43.8 29.6 32.8 176.9 7.4 360.7 0.20 0.14 0.784 22 64.8 36.7 52.3 49.7 32.7 20.5 140.6 5.9 553.5 0.21 0.16 0.774 23 60.9 37.6 49.5 74.1 41.3 0.05 25.4 199.1 8.3 383.2 0.14 0.11 0.804 24 44.3 37.9 40.2 88.7 37.2 1.06 38.8 345.4 14.4 61.2 0.05 0.04 0.774 25 54.6 35.4 45.2 73.4 36.9 0.01 16.1 91.3 3.8 478.2 0.12 0.11 0.794 26 68.0 32.9 50.0 68.6 38.9 31.2 108.8 4.5 473.0 0.17 0.14 0.85
4 of 13
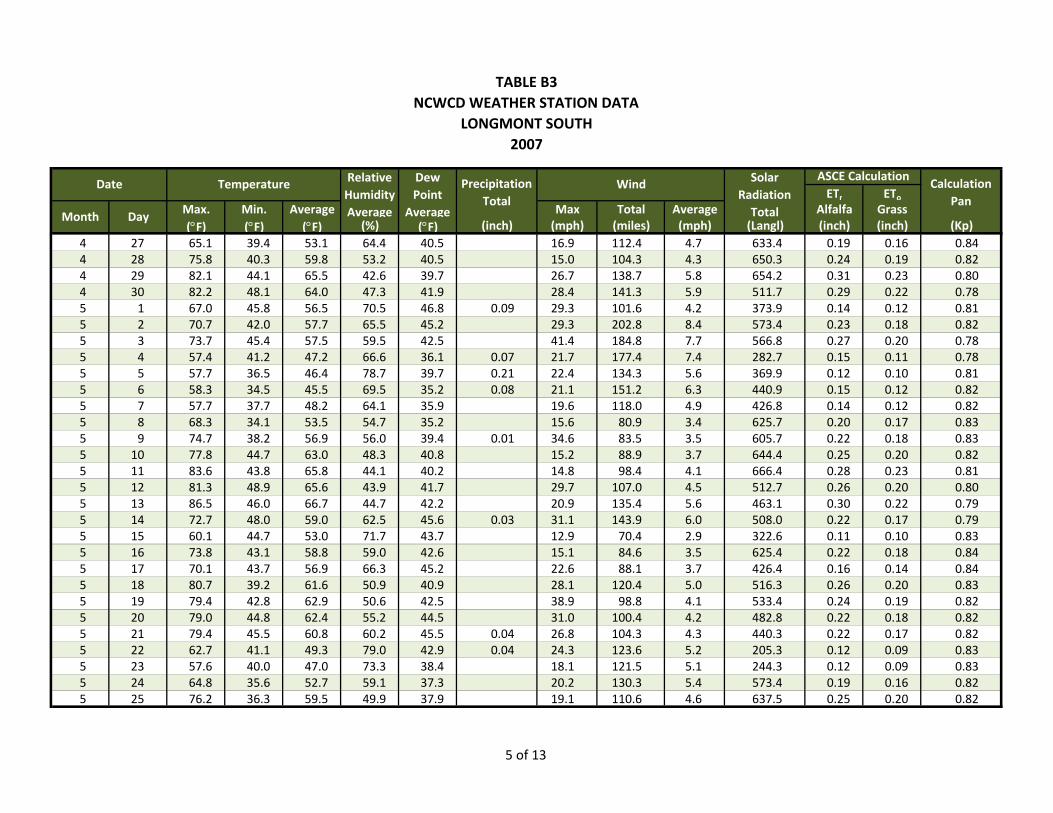
TABLE B3NCWCD WEATHER STATION DATA
LONGMONT SOUTH 2007
ETr EToMax. Min. Average Max Total Average Alfalfa Grass(°F) (°F) (°F) (%) (°F) (inch) (mph) (miles) (mph) (Langl) (inch) (inch) (Kp)
Month Day
Temperature Wind Calculation Pan
Relative Humidity Average
Dew Point
Average
Precipitation Total
ASCE CalculationSolar Radiation Total
Date
4 27 65.1 39.4 53.1 64.4 40.5 16.9 112.4 4.7 633.4 0.19 0.16 0.844 28 75.8 40.3 59.8 53.2 40.5 15.0 104.3 4.3 650.3 0.24 0.19 0.824 29 82.1 44.1 65.5 42.6 39.7 26.7 138.7 5.8 654.2 0.31 0.23 0.804 30 82.2 48.1 64.0 47.3 41.9 28.4 141.3 5.9 511.7 0.29 0.22 0.785 1 67.0 45.8 56.5 70.5 46.8 0.09 29.3 101.6 4.2 373.9 0.14 0.12 0.815 2 70.7 42.0 57.7 65.5 45.2 29.3 202.8 8.4 573.4 0.23 0.18 0.825 3 73.7 45.4 57.5 59.5 42.5 41.4 184.8 7.7 566.8 0.27 0.20 0.785 4 57.4 41.2 47.2 66.6 36.1 0.07 21.7 177.4 7.4 282.7 0.15 0.11 0.785 5 57.7 36.5 46.4 78.7 39.7 0.21 22.4 134.3 5.6 369.9 0.12 0.10 0.815 6 58.3 34.5 45.5 69.5 35.2 0.08 21.1 151.2 6.3 440.9 0.15 0.12 0.825 7 57.7 37.7 48.2 64.1 35.9 19.6 118.0 4.9 426.8 0.14 0.12 0.825 8 68.3 34.1 53.5 54.7 35.2 15.6 80.9 3.4 625.7 0.20 0.17 0.835 9 74.7 38.2 56.9 56.0 39.4 0.01 34.6 83.5 3.5 605.7 0.22 0.18 0.835 10 77.8 44.7 63.0 48.3 40.8 15.2 88.9 3.7 644.4 0.25 0.20 0.825 11 83.6 43.8 65.8 44.1 40.2 14.8 98.4 4.1 666.4 0.28 0.23 0.815 12 81.3 48.9 65.6 43.9 41.7 29.7 107.0 4.5 512.7 0.26 0.20 0.805 13 86.5 46.0 66.7 44.7 42.2 20.9 135.4 5.6 463.1 0.30 0.22 0.795 14 72.7 48.0 59.0 62.5 45.6 0.03 31.1 143.9 6.0 508.0 0.22 0.17 0.795 15 60.1 44.7 53.0 71.7 43.7 12.9 70.4 2.9 322.6 0.11 0.10 0.835 16 73.8 43.1 58.8 59.0 42.6 15.1 84.6 3.5 625.4 0.22 0.18 0.845 17 70.1 43.7 56.9 66.3 45.2 22.6 88.1 3.7 426.4 0.16 0.14 0.845 18 80.7 39.2 61.6 50.9 40.9 28.1 120.4 5.0 516.3 0.26 0.20 0.835 19 79.4 42.8 62.9 50.6 42.5 38.9 98.8 4.1 533.4 0.24 0.19 0.825 20 79.0 44.8 62.4 55.2 44.5 31.0 100.4 4.2 482.8 0.22 0.18 0.825 21 79.4 45.5 60.8 60.2 45.5 0.04 26.8 104.3 4.3 440.3 0.22 0.17 0.825 22 62.7 41.1 49.3 79.0 42.9 0.04 24.3 123.6 5.2 205.3 0.12 0.09 0.835 23 57.6 40.0 47.0 73.3 38.4 18.1 121.5 5.1 244.3 0.12 0.09 0.835 24 64.8 35.6 52.7 59.1 37.3 20.2 130.3 5.4 573.4 0.19 0.16 0.825 25 76.2 36.3 59.5 49.9 37.9 19.1 110.6 4.6 637.5 0.25 0.20 0.82
5 of 13
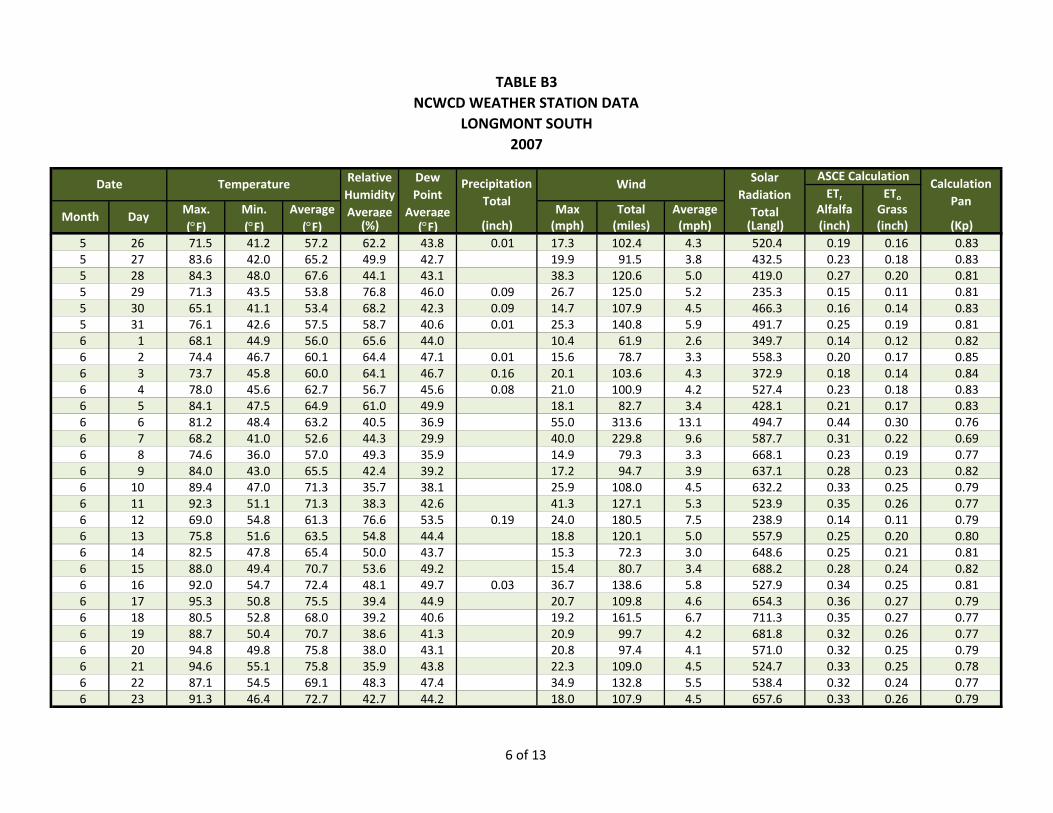
TABLE B3NCWCD WEATHER STATION DATA
LONGMONT SOUTH 2007
ETr EToMax. Min. Average Max Total Average Alfalfa Grass(°F) (°F) (°F) (%) (°F) (inch) (mph) (miles) (mph) (Langl) (inch) (inch) (Kp)
Month Day
Temperature Wind Calculation Pan
Relative Humidity Average
Dew Point
Average
Precipitation Total
ASCE CalculationSolar Radiation Total
Date
5 26 71.5 41.2 57.2 62.2 43.8 0.01 17.3 102.4 4.3 520.4 0.19 0.16 0.835 27 83.6 42.0 65.2 49.9 42.7 19.9 91.5 3.8 432.5 0.23 0.18 0.835 28 84.3 48.0 67.6 44.1 43.1 38.3 120.6 5.0 419.0 0.27 0.20 0.815 29 71.3 43.5 53.8 76.8 46.0 0.09 26.7 125.0 5.2 235.3 0.15 0.11 0.815 30 65.1 41.1 53.4 68.2 42.3 0.09 14.7 107.9 4.5 466.3 0.16 0.14 0.835 31 76.1 42.6 57.5 58.7 40.6 0.01 25.3 140.8 5.9 491.7 0.25 0.19 0.816 1 68.1 44.9 56.0 65.6 44.0 10.4 61.9 2.6 349.7 0.14 0.12 0.826 2 74.4 46.7 60.1 64.4 47.1 0.01 15.6 78.7 3.3 558.3 0.20 0.17 0.856 3 73.7 45.8 60.0 64.1 46.7 0.16 20.1 103.6 4.3 372.9 0.18 0.14 0.846 4 78.0 45.6 62.7 56.7 45.6 0.08 21.0 100.9 4.2 527.4 0.23 0.18 0.836 5 84.1 47.5 64.9 61.0 49.9 18.1 82.7 3.4 428.1 0.21 0.17 0.836 6 81.2 48.4 63.2 40.5 36.9 55.0 313.6 13.1 494.7 0.44 0.30 0.766 7 68.2 41.0 52.6 44.3 29.9 40.0 229.8 9.6 587.7 0.31 0.22 0.696 8 74.6 36.0 57.0 49.3 35.9 14.9 79.3 3.3 668.1 0.23 0.19 0.776 9 84.0 43.0 65.5 42.4 39.2 17.2 94.7 3.9 637.1 0.28 0.23 0.826 10 89.4 47.0 71.3 35.7 38.1 25.9 108.0 4.5 632.2 0.33 0.25 0.796 11 92.3 51.1 71.3 38.3 42.6 41.3 127.1 5.3 523.9 0.35 0.26 0.776 12 69.0 54.8 61.3 76.6 53.5 0.19 24.0 180.5 7.5 238.9 0.14 0.11 0.796 13 75.8 51.6 63.5 54.8 44.4 18.8 120.1 5.0 557.9 0.25 0.20 0.806 14 82.5 47.8 65.4 50.0 43.7 15.3 72.3 3.0 648.6 0.25 0.21 0.816 15 88.0 49.4 70.7 53.6 49.2 15.4 80.7 3.4 688.2 0.28 0.24 0.826 16 92.0 54.7 72.4 48.1 49.7 0.03 36.7 138.6 5.8 527.9 0.34 0.25 0.816 17 95.3 50.8 75.5 39.4 44.9 20.7 109.8 4.6 654.3 0.36 0.27 0.796 18 80.5 52.8 68.0 39.2 40.6 19.2 161.5 6.7 711.3 0.35 0.27 0.776 19 88.7 50.4 70.7 38.6 41.3 20.9 99.7 4.2 681.8 0.32 0.26 0.776 20 94.8 49.8 75.8 38.0 43.1 20.8 97.4 4.1 571.0 0.32 0.25 0.796 21 94.6 55.1 75.8 35.9 43.8 22.3 109.0 4.5 524.7 0.33 0.25 0.786 22 87.1 54.5 69.1 48.3 47.4 34.9 132.8 5.5 538.4 0.32 0.24 0.776 23 91.3 46.4 72.7 42.7 44.2 18.0 107.9 4.5 657.6 0.33 0.26 0.79
6 of 13
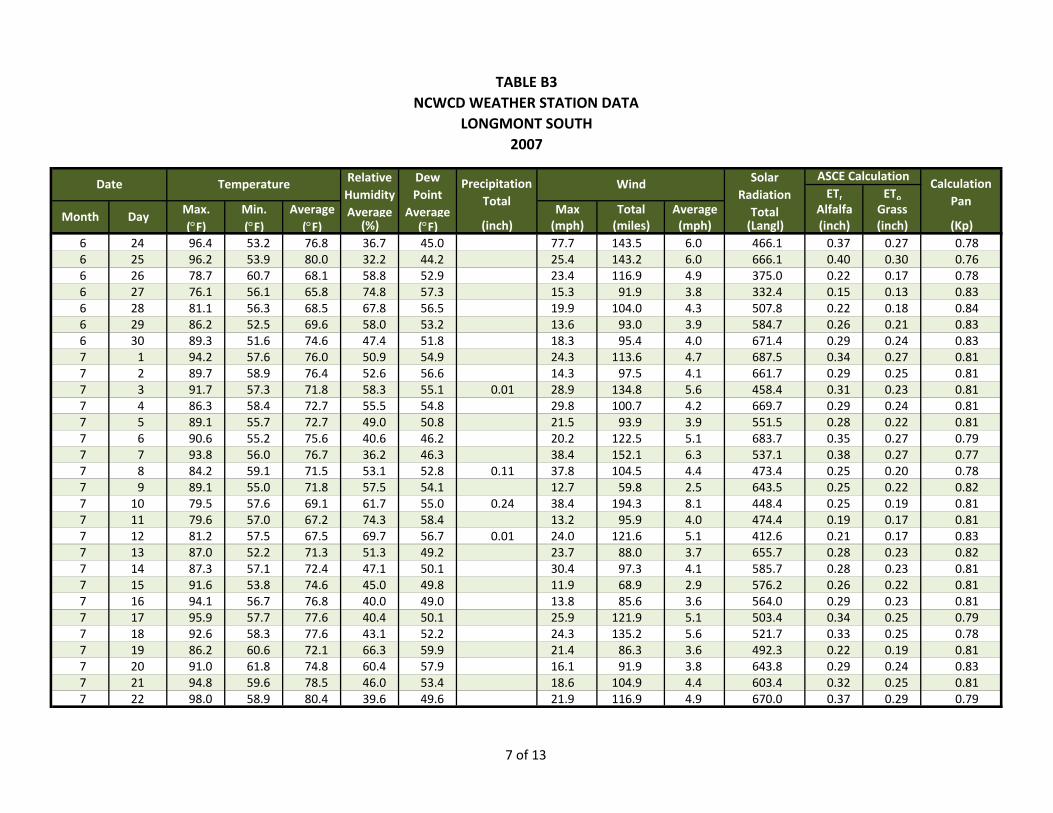
TABLE B3NCWCD WEATHER STATION DATA
LONGMONT SOUTH 2007
ETr EToMax. Min. Average Max Total Average Alfalfa Grass(°F) (°F) (°F) (%) (°F) (inch) (mph) (miles) (mph) (Langl) (inch) (inch) (Kp)
Month Day
Temperature Wind Calculation Pan
Relative Humidity Average
Dew Point
Average
Precipitation Total
ASCE CalculationSolar Radiation Total
Date
6 24 96.4 53.2 76.8 36.7 45.0 77.7 143.5 6.0 466.1 0.37 0.27 0.786 25 96.2 53.9 80.0 32.2 44.2 25.4 143.2 6.0 666.1 0.40 0.30 0.766 26 78.7 60.7 68.1 58.8 52.9 23.4 116.9 4.9 375.0 0.22 0.17 0.786 27 76.1 56.1 65.8 74.8 57.3 15.3 91.9 3.8 332.4 0.15 0.13 0.836 28 81.1 56.3 68.5 67.8 56.5 19.9 104.0 4.3 507.8 0.22 0.18 0.846 29 86.2 52.5 69.6 58.0 53.2 13.6 93.0 3.9 584.7 0.26 0.21 0.836 30 89.3 51.6 74.6 47.4 51.8 18.3 95.4 4.0 671.4 0.29 0.24 0.837 1 94.2 57.6 76.0 50.9 54.9 24.3 113.6 4.7 687.5 0.34 0.27 0.817 2 89.7 58.9 76.4 52.6 56.6 14.3 97.5 4.1 661.7 0.29 0.25 0.817 3 91.7 57.3 71.8 58.3 55.1 0.01 28.9 134.8 5.6 458.4 0.31 0.23 0.817 4 86.3 58.4 72.7 55.5 54.8 29.8 100.7 4.2 669.7 0.29 0.24 0.817 5 89.1 55.7 72.7 49.0 50.8 21.5 93.9 3.9 551.5 0.28 0.22 0.817 6 90.6 55.2 75.6 40.6 46.2 20.2 122.5 5.1 683.7 0.35 0.27 0.797 7 93.8 56.0 76.7 36.2 46.3 38.4 152.1 6.3 537.1 0.38 0.27 0.777 8 84.2 59.1 71.5 53.1 52.8 0.11 37.8 104.5 4.4 473.4 0.25 0.20 0.787 9 89.1 55.0 71.8 57.5 54.1 12.7 59.8 2.5 643.5 0.25 0.22 0.827 10 79.5 57.6 69.1 61.7 55.0 0.24 38.4 194.3 8.1 448.4 0.25 0.19 0.817 11 79.6 57.0 67.2 74.3 58.4 13.2 95.9 4.0 474.4 0.19 0.17 0.817 12 81.2 57.5 67.5 69.7 56.7 0.01 24.0 121.6 5.1 412.6 0.21 0.17 0.837 13 87.0 52.2 71.3 51.3 49.2 23.7 88.0 3.7 655.7 0.28 0.23 0.827 14 87.3 57.1 72.4 47.1 50.1 30.4 97.3 4.1 585.7 0.28 0.23 0.817 15 91.6 53.8 74.6 45.0 49.8 11.9 68.9 2.9 576.2 0.26 0.22 0.817 16 94.1 56.7 76.8 40.0 49.0 13.8 85.6 3.6 564.0 0.29 0.23 0.817 17 95.9 57.7 77.6 40.4 50.1 25.9 121.9 5.1 503.4 0.34 0.25 0.797 18 92.6 58.3 77.6 43.1 52.2 24.3 135.2 5.6 521.7 0.33 0.25 0.787 19 86.2 60.6 72.1 66.3 59.9 21.4 86.3 3.6 492.3 0.22 0.19 0.817 20 91.0 61.8 74.8 60.4 57.9 16.1 91.9 3.8 643.8 0.29 0.24 0.837 21 94.8 59.6 78.5 46.0 53.4 18.6 104.9 4.4 603.4 0.32 0.25 0.817 22 98.0 58.9 80.4 39.6 49.6 21.9 116.9 4.9 670.0 0.37 0.29 0.79
7 of 13
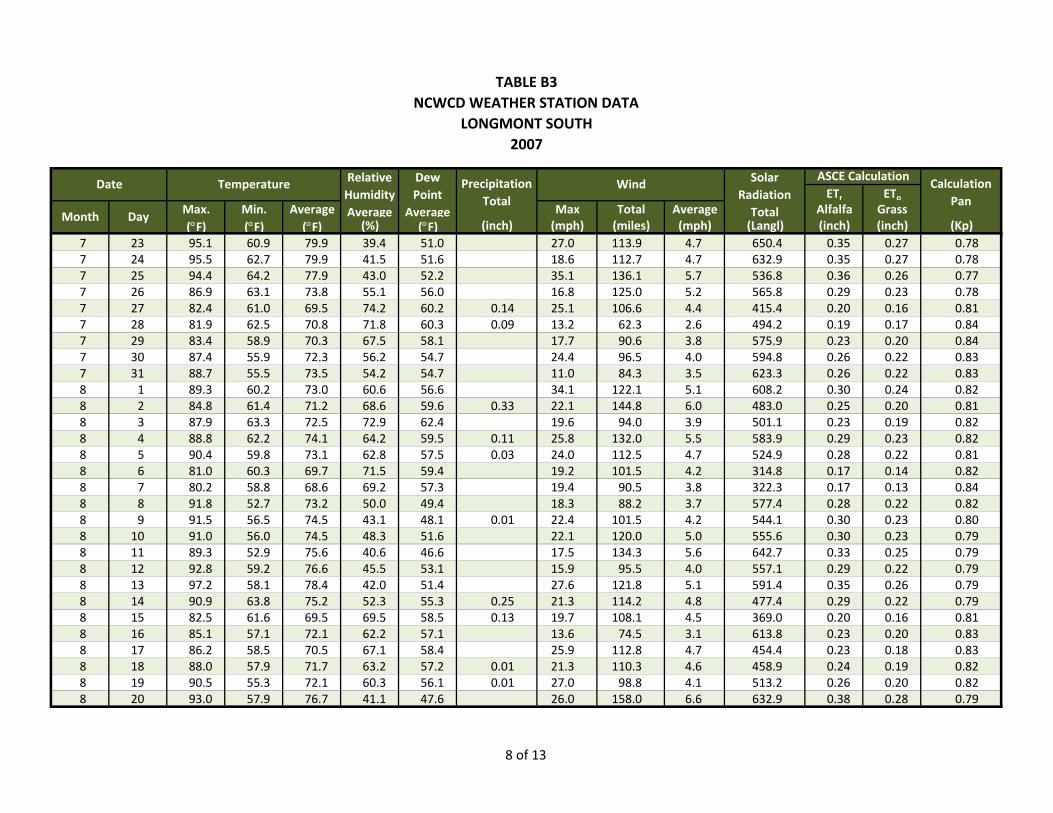
TABLE B3NCWCD WEATHER STATION DATA
LONGMONT SOUTH 2007
ETr EToMax. Min. Average Max Total Average Alfalfa Grass(°F) (°F) (°F) (%) (°F) (inch) (mph) (miles) (mph) (Langl) (inch) (inch) (Kp)
Month Day
Temperature Wind Calculation Pan
Relative Humidity Average
Dew Point
Average
Precipitation Total
ASCE CalculationSolar Radiation Total
Date
7 23 95.1 60.9 79.9 39.4 51.0 27.0 113.9 4.7 650.4 0.35 0.27 0.787 24 95.5 62.7 79.9 41.5 51.6 18.6 112.7 4.7 632.9 0.35 0.27 0.787 25 94.4 64.2 77.9 43.0 52.2 35.1 136.1 5.7 536.8 0.36 0.26 0.777 26 86.9 63.1 73.8 55.1 56.0 16.8 125.0 5.2 565.8 0.29 0.23 0.787 27 82.4 61.0 69.5 74.2 60.2 0.14 25.1 106.6 4.4 415.4 0.20 0.16 0.817 28 81.9 62.5 70.8 71.8 60.3 0.09 13.2 62.3 2.6 494.2 0.19 0.17 0.847 29 83.4 58.9 70.3 67.5 58.1 17.7 90.6 3.8 575.9 0.23 0.20 0.847 30 87.4 55.9 72.3 56.2 54.7 24.4 96.5 4.0 594.8 0.26 0.22 0.837 31 88.7 55.5 73.5 54.2 54.7 11.0 84.3 3.5 623.3 0.26 0.22 0.838 1 89.3 60.2 73.0 60.6 56.6 34.1 122.1 5.1 608.2 0.30 0.24 0.828 2 84.8 61.4 71.2 68.6 59.6 0.33 22.1 144.8 6.0 483.0 0.25 0.20 0.818 3 87.9 63.3 72.5 72.9 62.4 19.6 94.0 3.9 501.1 0.23 0.19 0.828 4 88.8 62.2 74.1 64.2 59.5 0.11 25.8 132.0 5.5 583.9 0.29 0.23 0.828 5 90.4 59.8 73.1 62.8 57.5 0.03 24.0 112.5 4.7 524.9 0.28 0.22 0.818 6 81.0 60.3 69.7 71.5 59.4 19.2 101.5 4.2 314.8 0.17 0.14 0.828 7 80.2 58.8 68.6 69.2 57.3 19.4 90.5 3.8 322.3 0.17 0.13 0.848 8 91.8 52.7 73.2 50.0 49.4 18.3 88.2 3.7 577.4 0.28 0.22 0.828 9 91.5 56.5 74.5 43.1 48.1 0.01 22.4 101.5 4.2 544.1 0.30 0.23 0.808 10 91.0 56.0 74.5 48.3 51.6 22.1 120.0 5.0 555.6 0.30 0.23 0.798 11 89.3 52.9 75.6 40.6 46.6 17.5 134.3 5.6 642.7 0.33 0.25 0.798 12 92.8 59.2 76.6 45.5 53.1 15.9 95.5 4.0 557.1 0.29 0.22 0.798 13 97.2 58.1 78.4 42.0 51.4 27.6 121.8 5.1 591.4 0.35 0.26 0.798 14 90.9 63.8 75.2 52.3 55.3 0.25 21.3 114.2 4.8 477.4 0.29 0.22 0.798 15 82.5 61.6 69.5 69.5 58.5 0.13 19.7 108.1 4.5 369.0 0.20 0.16 0.818 16 85.1 57.1 72.1 62.2 57.1 13.6 74.5 3.1 613.8 0.23 0.20 0.838 17 86.2 58.5 70.5 67.1 58.4 25.9 112.8 4.7 454.4 0.23 0.18 0.838 18 88.0 57.9 71.7 63.2 57.2 0.01 21.3 110.3 4.6 458.9 0.24 0.19 0.828 19 90.5 55.3 72.1 60.3 56.1 0.01 27.0 98.8 4.1 513.2 0.26 0.20 0.828 20 93.0 57.9 76.7 41.1 47.6 26.0 158.0 6.6 632.9 0.38 0.28 0.79
8 of 13
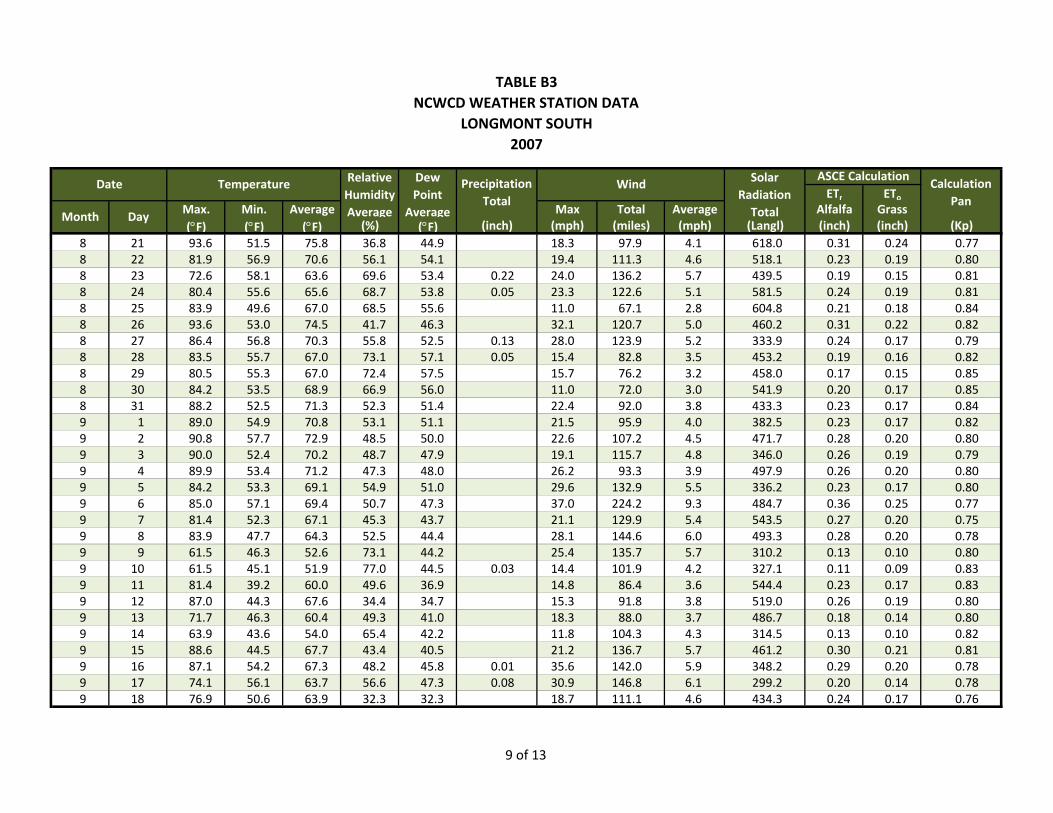
TABLE B3NCWCD WEATHER STATION DATA
LONGMONT SOUTH 2007
ETr EToMax. Min. Average Max Total Average Alfalfa Grass(°F) (°F) (°F) (%) (°F) (inch) (mph) (miles) (mph) (Langl) (inch) (inch) (Kp)
Month Day
Temperature Wind Calculation Pan
Relative Humidity Average
Dew Point
Average
Precipitation Total
ASCE CalculationSolar Radiation Total
Date
8 21 93.6 51.5 75.8 36.8 44.9 18.3 97.9 4.1 618.0 0.31 0.24 0.778 22 81.9 56.9 70.6 56.1 54.1 19.4 111.3 4.6 518.1 0.23 0.19 0.808 23 72.6 58.1 63.6 69.6 53.4 0.22 24.0 136.2 5.7 439.5 0.19 0.15 0.818 24 80.4 55.6 65.6 68.7 53.8 0.05 23.3 122.6 5.1 581.5 0.24 0.19 0.818 25 83.9 49.6 67.0 68.5 55.6 11.0 67.1 2.8 604.8 0.21 0.18 0.848 26 93.6 53.0 74.5 41.7 46.3 32.1 120.7 5.0 460.2 0.31 0.22 0.828 27 86.4 56.8 70.3 55.8 52.5 0.13 28.0 123.9 5.2 333.9 0.24 0.17 0.798 28 83.5 55.7 67.0 73.1 57.1 0.05 15.4 82.8 3.5 453.2 0.19 0.16 0.828 29 80.5 55.3 67.0 72.4 57.5 15.7 76.2 3.2 458.0 0.17 0.15 0.858 30 84.2 53.5 68.9 66.9 56.0 11.0 72.0 3.0 541.9 0.20 0.17 0.858 31 88.2 52.5 71.3 52.3 51.4 22.4 92.0 3.8 433.3 0.23 0.17 0.849 1 89.0 54.9 70.8 53.1 51.1 21.5 95.9 4.0 382.5 0.23 0.17 0.829 2 90.8 57.7 72.9 48.5 50.0 22.6 107.2 4.5 471.7 0.28 0.20 0.809 3 90.0 52.4 70.2 48.7 47.9 19.1 115.7 4.8 346.0 0.26 0.19 0.799 4 89.9 53.4 71.2 47.3 48.0 26.2 93.3 3.9 497.9 0.26 0.20 0.809 5 84.2 53.3 69.1 54.9 51.0 29.6 132.9 5.5 336.2 0.23 0.17 0.809 6 85.0 57.1 69.4 50.7 47.3 37.0 224.2 9.3 484.7 0.36 0.25 0.779 7 81.4 52.3 67.1 45.3 43.7 21.1 129.9 5.4 543.5 0.27 0.20 0.759 8 83.9 47.7 64.3 52.5 44.4 28.1 144.6 6.0 493.3 0.28 0.20 0.789 9 61.5 46.3 52.6 73.1 44.2 25.4 135.7 5.7 310.2 0.13 0.10 0.809 10 61.5 45.1 51.9 77.0 44.5 0.03 14.4 101.9 4.2 327.1 0.11 0.09 0.839 11 81.4 39.2 60.0 49.6 36.9 14.8 86.4 3.6 544.4 0.23 0.17 0.839 12 87.0 44.3 67.6 34.4 34.7 15.3 91.8 3.8 519.0 0.26 0.19 0.809 13 71.7 46.3 60.4 49.3 41.0 18.3 88.0 3.7 486.7 0.18 0.14 0.809 14 63.9 43.6 54.0 65.4 42.2 11.8 104.3 4.3 314.5 0.13 0.10 0.829 15 88.6 44.5 67.7 43.4 40.5 21.2 136.7 5.7 461.2 0.30 0.21 0.819 16 87.1 54.2 67.3 48.2 45.8 0.01 35.6 142.0 5.9 348.2 0.29 0.20 0.789 17 74.1 56.1 63.7 56.6 47.3 0.08 30.9 146.8 6.1 299.2 0.20 0.14 0.789 18 76.9 50.6 63.9 32.3 32.3 18.7 111.1 4.6 434.3 0.24 0.17 0.76
9 of 13
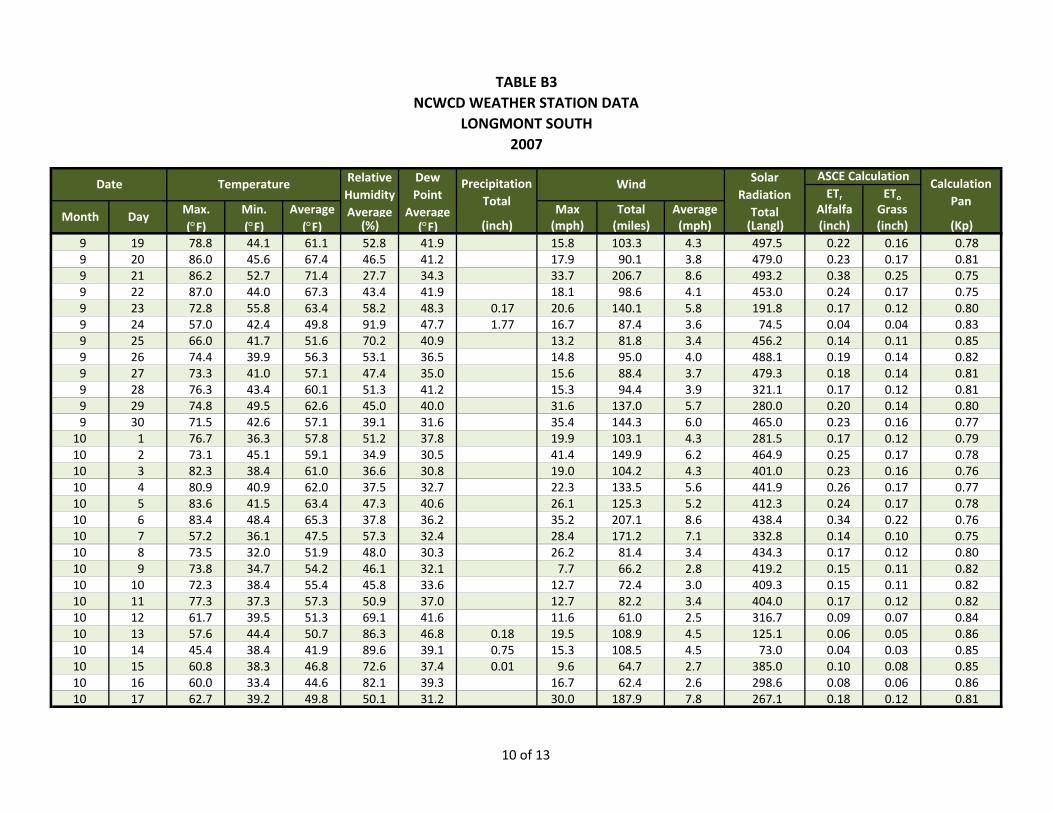
TABLE B3NCWCD WEATHER STATION DATA
LONGMONT SOUTH 2007
ETr EToMax. Min. Average Max Total Average Alfalfa Grass(°F) (°F) (°F) (%) (°F) (inch) (mph) (miles) (mph) (Langl) (inch) (inch) (Kp)
Month Day
Temperature Wind Calculation Pan
Relative Humidity Average
Dew Point
Average
Precipitation Total
ASCE CalculationSolar Radiation Total
Date
9 19 78.8 44.1 61.1 52.8 41.9 15.8 103.3 4.3 497.5 0.22 0.16 0.789 20 86.0 45.6 67.4 46.5 41.2 17.9 90.1 3.8 479.0 0.23 0.17 0.819 21 86.2 52.7 71.4 27.7 34.3 33.7 206.7 8.6 493.2 0.38 0.25 0.759 22 87.0 44.0 67.3 43.4 41.9 18.1 98.6 4.1 453.0 0.24 0.17 0.759 23 72.8 55.8 63.4 58.2 48.3 0.17 20.6 140.1 5.8 191.8 0.17 0.12 0.809 24 57.0 42.4 49.8 91.9 47.7 1.77 16.7 87.4 3.6 74.5 0.04 0.04 0.839 25 66.0 41.7 51.6 70.2 40.9 13.2 81.8 3.4 456.2 0.14 0.11 0.859 26 74.4 39.9 56.3 53.1 36.5 14.8 95.0 4.0 488.1 0.19 0.14 0.829 27 73.3 41.0 57.1 47.4 35.0 15.6 88.4 3.7 479.3 0.18 0.14 0.819 28 76.3 43.4 60.1 51.3 41.2 15.3 94.4 3.9 321.1 0.17 0.12 0.819 29 74.8 49.5 62.6 45.0 40.0 31.6 137.0 5.7 280.0 0.20 0.14 0.809 30 71.5 42.6 57.1 39.1 31.6 35.4 144.3 6.0 465.0 0.23 0.16 0.7710 1 76.7 36.3 57.8 51.2 37.8 19.9 103.1 4.3 281.5 0.17 0.12 0.7910 2 73.1 45.1 59.1 34.9 30.5 41.4 149.9 6.2 464.9 0.25 0.17 0.7810 3 82.3 38.4 61.0 36.6 30.8 19.0 104.2 4.3 401.0 0.23 0.16 0.7610 4 80.9 40.9 62.0 37.5 32.7 22.3 133.5 5.6 441.9 0.26 0.17 0.7710 5 83.6 41.5 63.4 47.3 40.6 26.1 125.3 5.2 412.3 0.24 0.17 0.7810 6 83.4 48.4 65.3 37.8 36.2 35.2 207.1 8.6 438.4 0.34 0.22 0.7610 7 57.2 36.1 47.5 57.3 32.4 28.4 171.2 7.1 332.8 0.14 0.10 0.7510 8 73.5 32.0 51.9 48.0 30.3 26.2 81.4 3.4 434.3 0.17 0.12 0.8010 9 73.8 34.7 54.2 46.1 32.1 7.7 66.2 2.8 419.2 0.15 0.11 0.8210 10 72.3 38.4 55.4 45.8 33.6 12.7 72.4 3.0 409.3 0.15 0.11 0.8210 11 77.3 37.3 57.3 50.9 37.0 12.7 82.2 3.4 404.0 0.17 0.12 0.8210 12 61.7 39.5 51.3 69.1 41.6 11.6 61.0 2.5 316.7 0.09 0.07 0.8410 13 57.6 44.4 50.7 86.3 46.8 0.18 19.5 108.9 4.5 125.1 0.06 0.05 0.8610 14 45.4 38.4 41.9 89.6 39.1 0.75 15.3 108.5 4.5 73.0 0.04 0.03 0.8510 15 60.8 38.3 46.8 72.6 37.4 0.01 9.6 64.7 2.7 385.0 0.10 0.08 0.8510 16 60.0 33.4 44.6 82.1 39.3 16.7 62.4 2.6 298.6 0.08 0.06 0.8610 17 62.7 39.2 49.8 50.1 31.2 30.0 187.9 7.8 267.1 0.18 0.12 0.81
10 of 13
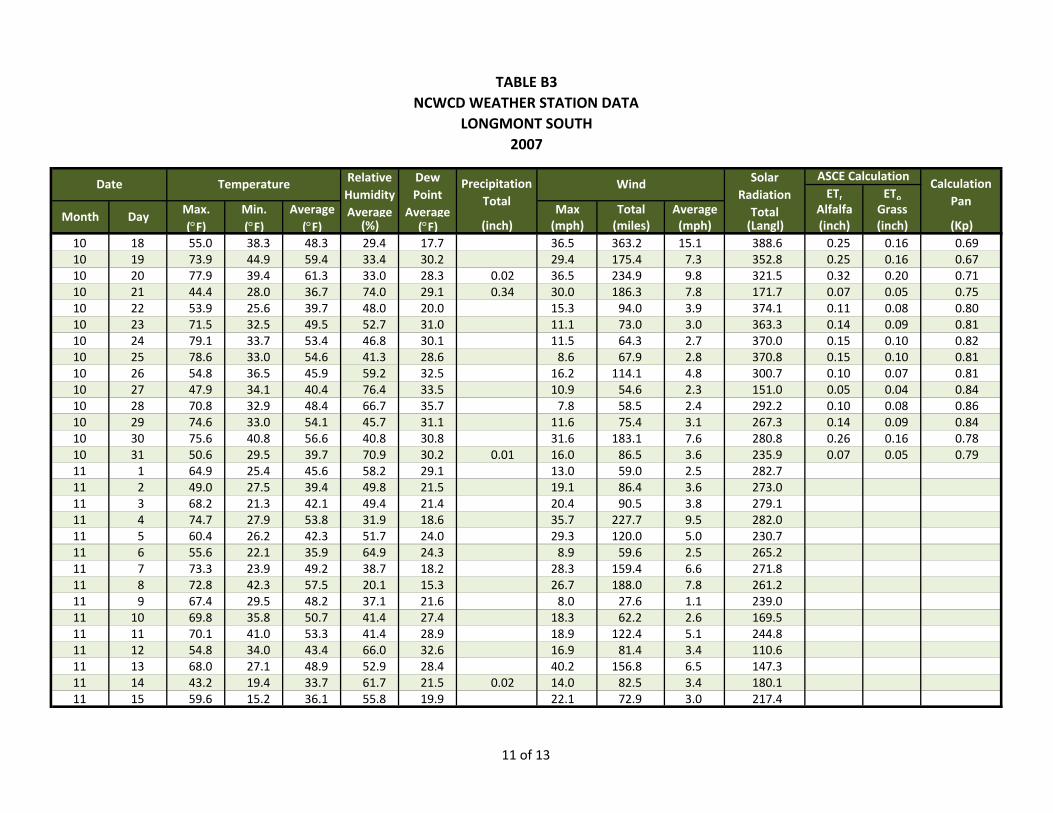
TABLE B3NCWCD WEATHER STATION DATA
LONGMONT SOUTH 2007
ETr EToMax. Min. Average Max Total Average Alfalfa Grass(°F) (°F) (°F) (%) (°F) (inch) (mph) (miles) (mph) (Langl) (inch) (inch) (Kp)
Month Day
Temperature Wind Calculation Pan
Relative Humidity Average
Dew Point
Average
Precipitation Total
ASCE CalculationSolar Radiation Total
Date
10 18 55.0 38.3 48.3 29.4 17.7 36.5 363.2 15.1 388.6 0.25 0.16 0.6910 19 73.9 44.9 59.4 33.4 30.2 29.4 175.4 7.3 352.8 0.25 0.16 0.6710 20 77.9 39.4 61.3 33.0 28.3 0.02 36.5 234.9 9.8 321.5 0.32 0.20 0.7110 21 44.4 28.0 36.7 74.0 29.1 0.34 30.0 186.3 7.8 171.7 0.07 0.05 0.7510 22 53.9 25.6 39.7 48.0 20.0 15.3 94.0 3.9 374.1 0.11 0.08 0.8010 23 71.5 32.5 49.5 52.7 31.0 11.1 73.0 3.0 363.3 0.14 0.09 0.8110 24 79.1 33.7 53.4 46.8 30.1 11.5 64.3 2.7 370.0 0.15 0.10 0.8210 25 78.6 33.0 54.6 41.3 28.6 8.6 67.9 2.8 370.8 0.15 0.10 0.8110 26 54.8 36.5 45.9 59.2 32.5 16.2 114.1 4.8 300.7 0.10 0.07 0.8110 27 47.9 34.1 40.4 76.4 33.5 10.9 54.6 2.3 151.0 0.05 0.04 0.8410 28 70.8 32.9 48.4 66.7 35.7 7.8 58.5 2.4 292.2 0.10 0.08 0.8610 29 74.6 33.0 54.1 45.7 31.1 11.6 75.4 3.1 267.3 0.14 0.09 0.8410 30 75.6 40.8 56.6 40.8 30.8 31.6 183.1 7.6 280.8 0.26 0.16 0.7810 31 50.6 29.5 39.7 70.9 30.2 0.01 16.0 86.5 3.6 235.9 0.07 0.05 0.7911 1 64.9 25.4 45.6 58.2 29.1 13.0 59.0 2.5 282.711 2 49.0 27.5 39.4 49.8 21.5 19.1 86.4 3.6 273.011 3 68.2 21.3 42.1 49.4 21.4 20.4 90.5 3.8 279.111 4 74.7 27.9 53.8 31.9 18.6 35.7 227.7 9.5 282.011 5 60.4 26.2 42.3 51.7 24.0 29.3 120.0 5.0 230.711 6 55.6 22.1 35.9 64.9 24.3 8.9 59.6 2.5 265.211 7 73.3 23.9 49.2 38.7 18.2 28.3 159.4 6.6 271.811 8 72.8 42.3 57.5 20.1 15.3 26.7 188.0 7.8 261.211 9 67.4 29.5 48.2 37.1 21.6 8.0 27.6 1.1 239.011 10 69.8 35.8 50.7 41.4 27.4 18.3 62.2 2.6 169.511 11 70.1 41.0 53.3 41.4 28.9 18.9 122.4 5.1 244.811 12 54.8 34.0 43.4 66.0 32.6 16.9 81.4 3.4 110.611 13 68.0 27.1 48.9 52.9 28.4 40.2 156.8 6.5 147.311 14 43.2 19.4 33.7 61.7 21.5 0.02 14.0 82.5 3.4 180.111 15 59.6 15.2 36.1 55.8 19.9 22.1 72.9 3.0 217.4
11 of 13

TABLE B3NCWCD WEATHER STATION DATA
LONGMONT SOUTH 2007
ETr EToMax. Min. Average Max Total Average Alfalfa Grass(°F) (°F) (°F) (%) (°F) (inch) (mph) (miles) (mph) (Langl) (inch) (inch) (Kp)
Month Day
Temperature Wind Calculation Pan
Relative Humidity Average
Dew Point
Average
Precipitation Total
ASCE CalculationSolar Radiation Total
Date
11 16 69.5 36.8 57.1 25.4 21.3 25.2 148.8 6.2 127.911 17 63.4 36.5 47.1 47.0 27.6 16.9 97.9 4.1 76.411 18 68.4 42.6 59.1 25.4 23.0 33.8 194.5 8.1 151.011 19 78.1 38.7 59.9 21.3 18.2 36.2 206.0 8.6 232.911 20 61.6 28.3 37.1 57.5 21.7 25.8 132.1 5.5 98.011 21 28.7 10.8 22.1 92.0 20.4 0.01 10.7 61.6 2.6 119.711 22 30.4 10.8 20.8 87.5 17.7 0.08 9.1 32.4 1.4 208.511 23 28.9 17.2 22.8 76.4 16.3 14.9 91.6 3.8 119.211 24 44.5 9.6 27.0 59.9 13.2 0.03 14.3 82.8 3.5 241.211 25 51.5 18.2 32.9 61.3 20.1 12.9 71.5 3.0 195.011 26 42.7 19.5 29.8 68.6 20.4 13.3 75.1 3.1 215.411 27 59.3 17.6 37.5 51.5 17.7 29.9 134.0 5.6 231.611 28 40.8 19.9 31.3 49.7 13.8 0.01 29.9 142.3 5.9 210.811 29 55.3 14.1 31.2 48.3 12.0 39.7 116.5 4.9 219.911 30 30.3 12.6 20.2 70.7 12.1 14.5 68.5 2.9 192.612 1 37.3 18.7 26.0 76.9 19.6 18.0 84.3 3.5 155.312 2 45.0 17.2 29.6 52.7 11.0 26.7 109.0 4.5 174.312 3 61.1 21.1 44.0 35.7 15.6 40.4 209.5 8.7 119.112 4 71.6 54.0 62.0 18.2 17.7 39.2 362.8 15.1 208.112 5 55.2 34.6 45.2 44.4 24.2 30.1 72.9 3.0 193.012 6 54.5 30.1 41.8 56.9 26.5 0.01 24.5 105.3 4.4 194.312 7 39.2 27.1 31.0 96.0 30.0 0.16 18.4 176.8 7.4 20.912 8 27.7 1.7 19.1 92.7 17.9 16.6 148.1 6.2 58.512 9 22.9 0.3 9.6 88.3 7.6 7.5 35.7 1.5 101.812 10 29.8 3.0 20.7 86.6 17.8 0.01 13.2 106.5 4.4 219.112 11 24.9 17.1 20.7 90.5 18.4 0.01 14.3 88.8 3.7 163.612 12 30.4 ‐1.8 14.3 85.5 11.5 0.10 11.0 37.0 1.5 212.412 13 28.2 3.0 17.4 78.3 11.9 11.9 70.1 2.9 178.712 14 22.9 ‐1.1 15.3 84.8 12.2 12.7 75.2 3.1 131.6
12 of 13
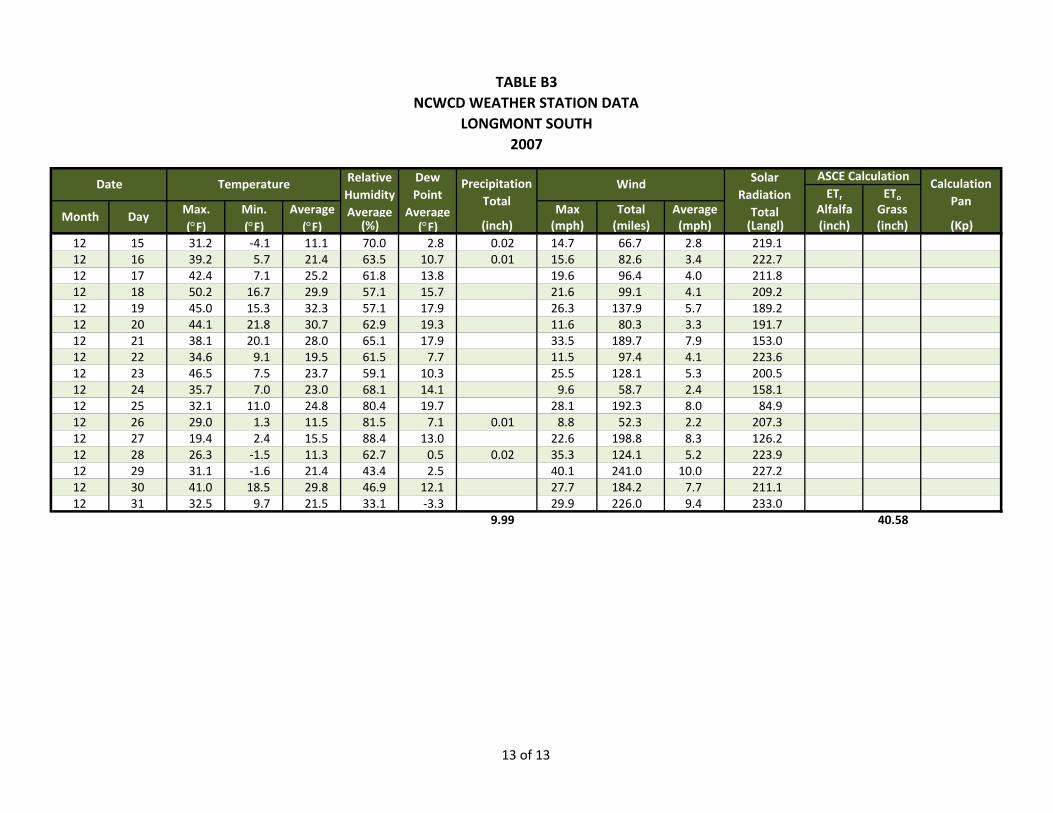
TABLE B3NCWCD WEATHER STATION DATA
LONGMONT SOUTH 2007
ETr EToMax. Min. Average Max Total Average Alfalfa Grass(°F) (°F) (°F) (%) (°F) (inch) (mph) (miles) (mph) (Langl) (inch) (inch) (Kp)
Month Day
Temperature Wind Calculation Pan
Relative Humidity Average
Dew Point
Average
Precipitation Total
ASCE CalculationSolar Radiation Total
Date
12 15 31.2 ‐4.1 11.1 70.0 2.8 0.02 14.7 66.7 2.8 219.112 16 39.2 5.7 21.4 63.5 10.7 0.01 15.6 82.6 3.4 222.712 17 42.4 7.1 25.2 61.8 13.8 19.6 96.4 4.0 211.812 18 50.2 16.7 29.9 57.1 15.7 21.6 99.1 4.1 209.212 19 45.0 15.3 32.3 57.1 17.9 26.3 137.9 5.7 189.212 20 44.1 21.8 30.7 62.9 19.3 11.6 80.3 3.3 191.712 21 38.1 20.1 28.0 65.1 17.9 33.5 189.7 7.9 153.012 22 34.6 9.1 19.5 61.5 7.7 11.5 97.4 4.1 223.612 23 46.5 7.5 23.7 59.1 10.3 25.5 128.1 5.3 200.512 24 35.7 7.0 23.0 68.1 14.1 9.6 58.7 2.4 158.112 25 32.1 11.0 24.8 80.4 19.7 28.1 192.3 8.0 84.912 26 29.0 1.3 11.5 81.5 7.1 0.01 8.8 52.3 2.2 207.312 27 19.4 2.4 15.5 88.4 13.0 22.6 198.8 8.3 126.212 28 26.3 ‐1.5 11.3 62.7 0.5 0.02 35.3 124.1 5.2 223.912 29 31.1 ‐1.6 21.4 43.4 2.5 40.1 241.0 10.0 227.212 30 41.0 18.5 29.8 46.9 12.1 27.7 184.2 7.7 211.112 31 32.5 9.7 21.5 33.1 ‐3.3 29.9 226.0 9.4 233.0
9.99 40.58
13 of 13
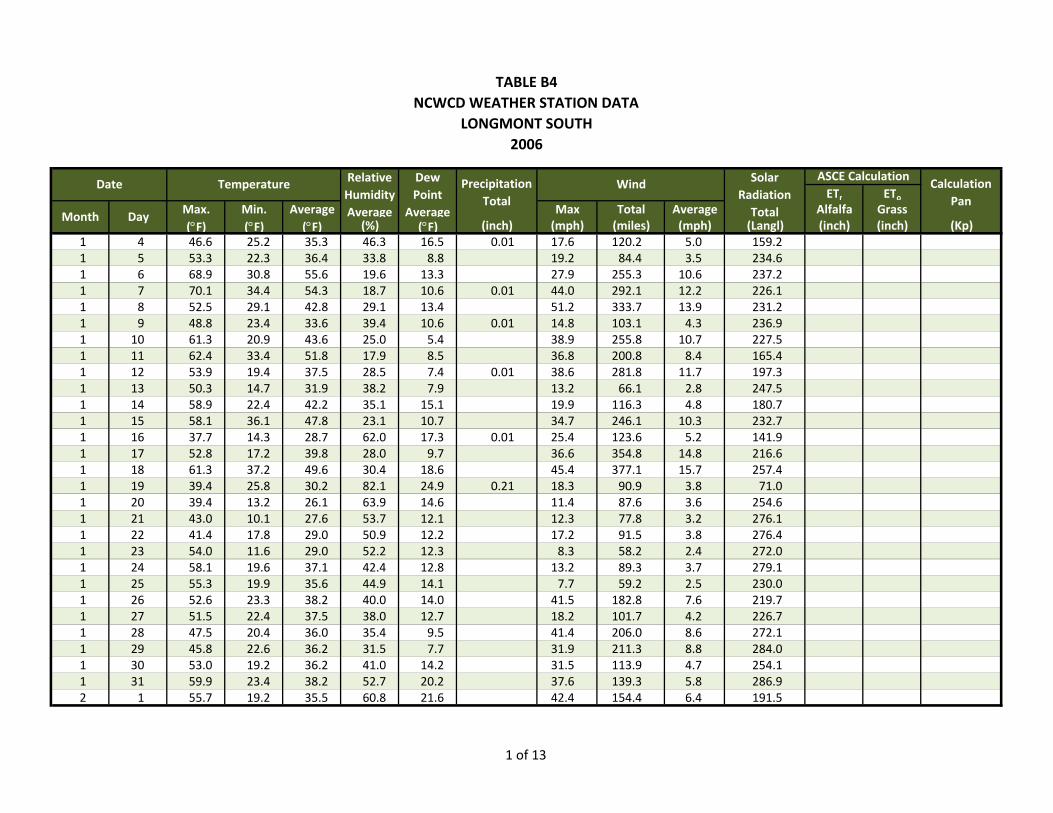
TABLE B4NCWCD WEATHER STATION DATA
LONGMONT SOUTH 2006
ETr EToMax. Min. Average Max Total Average Alfalfa Grass(°F) (°F) (°F) (%) (°F) (inch) (mph) (miles) (mph) (Langl) (inch) (inch) (Kp)
1 4 46.6 25.2 35.3 46.3 16.5 0.01 17.6 120.2 5.0 159.21 5 53.3 22.3 36.4 33.8 8.8 19.2 84.4 3.5 234.61 6 68.9 30.8 55.6 19.6 13.3 27.9 255.3 10.6 237.21 7 70.1 34.4 54.3 18.7 10.6 0.01 44.0 292.1 12.2 226.11 8 52.5 29.1 42.8 29.1 13.4 51.2 333.7 13.9 231.21 9 48.8 23.4 33.6 39.4 10.6 0.01 14.8 103.1 4.3 236.91 10 61.3 20.9 43.6 25.0 5.4 38.9 255.8 10.7 227.51 11 62.4 33.4 51.8 17.9 8.5 36.8 200.8 8.4 165.41 12 53.9 19.4 37.5 28.5 7.4 0.01 38.6 281.8 11.7 197.31 13 50.3 14.7 31.9 38.2 7.9 13.2 66.1 2.8 247.51 14 58.9 22.4 42.2 35.1 15.1 19.9 116.3 4.8 180.71 15 58.1 36.1 47.8 23.1 10.7 34.7 246.1 10.3 232.71 16 37.7 14.3 28.7 62.0 17.3 0.01 25.4 123.6 5.2 141.91 17 52.8 17.2 39.8 28.0 9.7 36.6 354.8 14.8 216.61 18 61.3 37.2 49.6 30.4 18.6 45.4 377.1 15.7 257.41 19 39.4 25.8 30.2 82.1 24.9 0.21 18.3 90.9 3.8 71.01 20 39.4 13.2 26.1 63.9 14.6 11.4 87.6 3.6 254.61 21 43.0 10.1 27.6 53.7 12.1 12.3 77.8 3.2 276.11 22 41.4 17.8 29.0 50.9 12.2 17.2 91.5 3.8 276.41 23 54.0 11.6 29.0 52.2 12.3 8.3 58.2 2.4 272.01 24 58.1 19.6 37.1 42.4 12.8 13.2 89.3 3.7 279.11 25 55.3 19.9 35.6 44.9 14.1 7.7 59.2 2.5 230.01 26 52.6 23.3 38.2 40.0 14.0 41.5 182.8 7.6 219.71 27 51.5 22.4 37.5 38.0 12.7 18.2 101.7 4.2 226.71 28 47.5 20.4 36.0 35.4 9.5 41.4 206.0 8.6 272.11 29 45.8 22.6 36.2 31.5 7.7 31.9 211.3 8.8 284.01 30 53.0 19.2 36.2 41.0 14.2 31.5 113.9 4.7 254.11 31 59.9 23.4 38.2 52.7 20.2 37.6 139.3 5.8 286.92 1 55.7 19.2 35.5 60.8 21.6 42.4 154.4 6.4 191.5
Solar Radiation Total
ASCE CalculationCalculation
PanMonth Day
Date Temperature Relative Humidity Average
Dew Point
Average
Precipitation Total
Wind
1 of 13
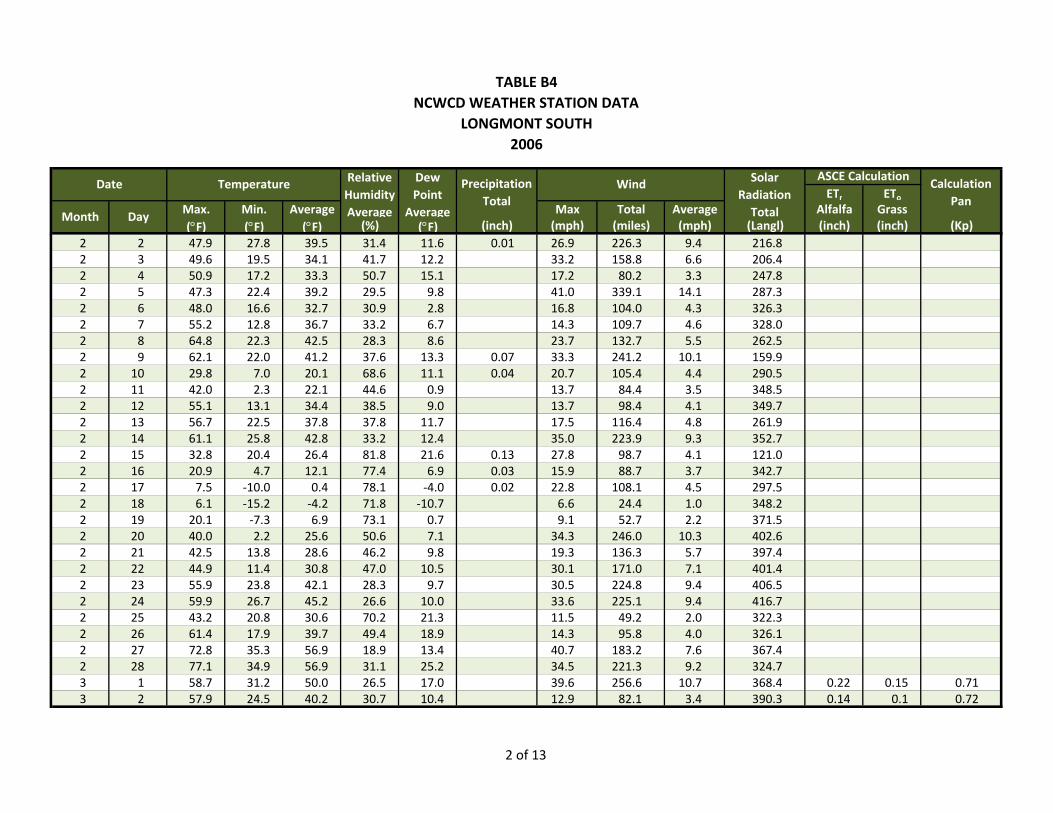
TABLE B4NCWCD WEATHER STATION DATA
LONGMONT SOUTH 2006
ETr EToMax. Min. Average Max Total Average Alfalfa Grass(°F) (°F) (°F) (%) (°F) (inch) (mph) (miles) (mph) (Langl) (inch) (inch) (Kp)
Solar Radiation Total
ASCE CalculationCalculation
PanMonth Day
Date Temperature Relative Humidity Average
Dew Point
Average
Precipitation Total
Wind
2 2 47.9 27.8 39.5 31.4 11.6 0.01 26.9 226.3 9.4 216.82 3 49.6 19.5 34.1 41.7 12.2 33.2 158.8 6.6 206.42 4 50.9 17.2 33.3 50.7 15.1 17.2 80.2 3.3 247.82 5 47.3 22.4 39.2 29.5 9.8 41.0 339.1 14.1 287.32 6 48.0 16.6 32.7 30.9 2.8 16.8 104.0 4.3 326.32 7 55.2 12.8 36.7 33.2 6.7 14.3 109.7 4.6 328.02 8 64.8 22.3 42.5 28.3 8.6 23.7 132.7 5.5 262.52 9 62.1 22.0 41.2 37.6 13.3 0.07 33.3 241.2 10.1 159.92 10 29.8 7.0 20.1 68.6 11.1 0.04 20.7 105.4 4.4 290.52 11 42.0 2.3 22.1 44.6 0.9 13.7 84.4 3.5 348.52 12 55.1 13.1 34.4 38.5 9.0 13.7 98.4 4.1 349.72 13 56.7 22.5 37.8 37.8 11.7 17.5 116.4 4.8 261.92 14 61.1 25.8 42.8 33.2 12.4 35.0 223.9 9.3 352.72 15 32.8 20.4 26.4 81.8 21.6 0.13 27.8 98.7 4.1 121.02 16 20.9 4.7 12.1 77.4 6.9 0.03 15.9 88.7 3.7 342.72 17 7.5 ‐10.0 0.4 78.1 ‐4.0 0.02 22.8 108.1 4.5 297.52 18 6.1 ‐15.2 ‐4.2 71.8 ‐10.7 6.6 24.4 1.0 348.22 19 20.1 ‐7.3 6.9 73.1 0.7 9.1 52.7 2.2 371.52 20 40.0 2.2 25.6 50.6 7.1 34.3 246.0 10.3 402.62 21 42.5 13.8 28.6 46.2 9.8 19.3 136.3 5.7 397.42 22 44.9 11.4 30.8 47.0 10.5 30.1 171.0 7.1 401.42 23 55.9 23.8 42.1 28.3 9.7 30.5 224.8 9.4 406.52 24 59.9 26.7 45.2 26.6 10.0 33.6 225.1 9.4 416.72 25 43.2 20.8 30.6 70.2 21.3 11.5 49.2 2.0 322.32 26 61.4 17.9 39.7 49.4 18.9 14.3 95.8 4.0 326.12 27 72.8 35.3 56.9 18.9 13.4 40.7 183.2 7.6 367.42 28 77.1 34.9 56.9 31.1 25.2 34.5 221.3 9.2 324.73 1 58.7 31.2 50.0 26.5 17.0 39.6 256.6 10.7 368.4 0.22 0.15 0.713 2 57.9 24.5 40.2 30.7 10.4 12.9 82.1 3.4 390.3 0.14 0.1 0.72
2 of 13
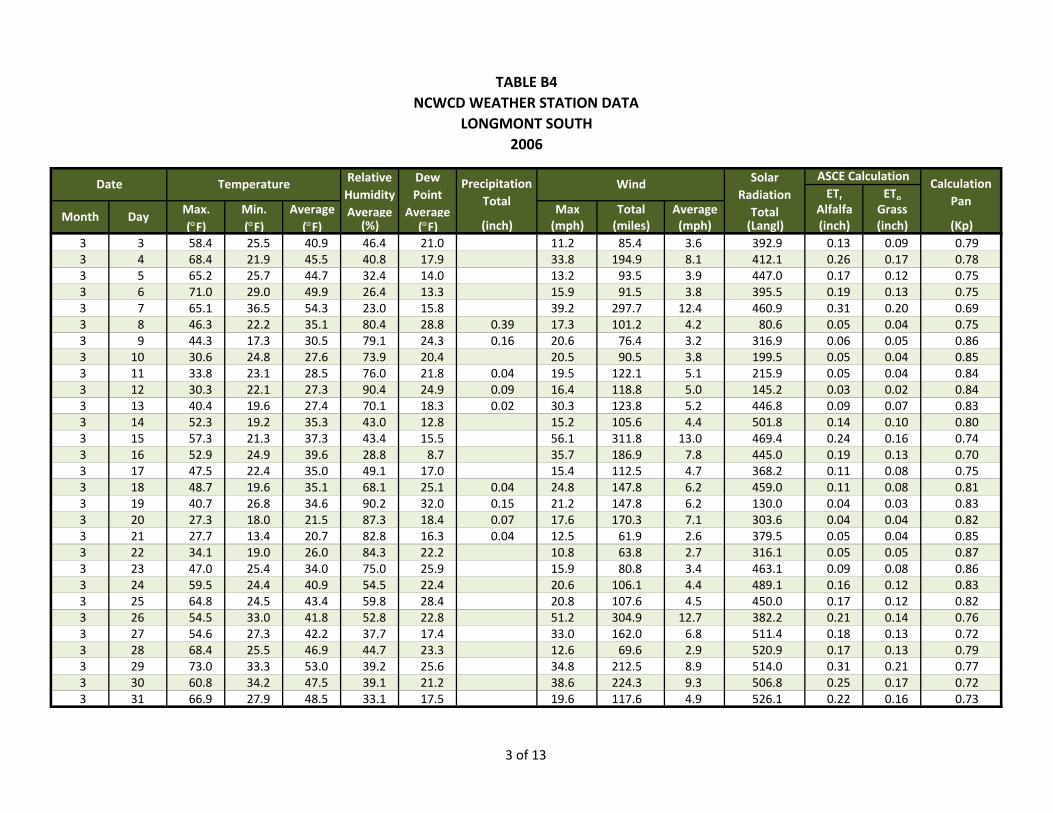
TABLE B4NCWCD WEATHER STATION DATA
LONGMONT SOUTH 2006
ETr EToMax. Min. Average Max Total Average Alfalfa Grass(°F) (°F) (°F) (%) (°F) (inch) (mph) (miles) (mph) (Langl) (inch) (inch) (Kp)
Solar Radiation Total
ASCE CalculationCalculation
PanMonth Day
Date Temperature Relative Humidity Average
Dew Point
Average
Precipitation Total
Wind
3 3 58.4 25.5 40.9 46.4 21.0 11.2 85.4 3.6 392.9 0.13 0.09 0.793 4 68.4 21.9 45.5 40.8 17.9 33.8 194.9 8.1 412.1 0.26 0.17 0.783 5 65.2 25.7 44.7 32.4 14.0 13.2 93.5 3.9 447.0 0.17 0.12 0.753 6 71.0 29.0 49.9 26.4 13.3 15.9 91.5 3.8 395.5 0.19 0.13 0.753 7 65.1 36.5 54.3 23.0 15.8 39.2 297.7 12.4 460.9 0.31 0.20 0.693 8 46.3 22.2 35.1 80.4 28.8 0.39 17.3 101.2 4.2 80.6 0.05 0.04 0.753 9 44.3 17.3 30.5 79.1 24.3 0.16 20.6 76.4 3.2 316.9 0.06 0.05 0.863 10 30.6 24.8 27.6 73.9 20.4 20.5 90.5 3.8 199.5 0.05 0.04 0.853 11 33.8 23.1 28.5 76.0 21.8 0.04 19.5 122.1 5.1 215.9 0.05 0.04 0.843 12 30.3 22.1 27.3 90.4 24.9 0.09 16.4 118.8 5.0 145.2 0.03 0.02 0.843 13 40.4 19.6 27.4 70.1 18.3 0.02 30.3 123.8 5.2 446.8 0.09 0.07 0.833 14 52.3 19.2 35.3 43.0 12.8 15.2 105.6 4.4 501.8 0.14 0.10 0.803 15 57.3 21.3 37.3 43.4 15.5 56.1 311.8 13.0 469.4 0.24 0.16 0.743 16 52.9 24.9 39.6 28.8 8.7 35.7 186.9 7.8 445.0 0.19 0.13 0.703 17 47.5 22.4 35.0 49.1 17.0 15.4 112.5 4.7 368.2 0.11 0.08 0.753 18 48.7 19.6 35.1 68.1 25.1 0.04 24.8 147.8 6.2 459.0 0.11 0.08 0.813 19 40.7 26.8 34.6 90.2 32.0 0.15 21.2 147.8 6.2 130.0 0.04 0.03 0.833 20 27.3 18.0 21.5 87.3 18.4 0.07 17.6 170.3 7.1 303.6 0.04 0.04 0.823 21 27.7 13.4 20.7 82.8 16.3 0.04 12.5 61.9 2.6 379.5 0.05 0.04 0.853 22 34.1 19.0 26.0 84.3 22.2 10.8 63.8 2.7 316.1 0.05 0.05 0.873 23 47.0 25.4 34.0 75.0 25.9 15.9 80.8 3.4 463.1 0.09 0.08 0.863 24 59.5 24.4 40.9 54.5 22.4 20.6 106.1 4.4 489.1 0.16 0.12 0.833 25 64.8 24.5 43.4 59.8 28.4 20.8 107.6 4.5 450.0 0.17 0.12 0.823 26 54.5 33.0 41.8 52.8 22.8 51.2 304.9 12.7 382.2 0.21 0.14 0.763 27 54.6 27.3 42.2 37.7 17.4 33.0 162.0 6.8 511.4 0.18 0.13 0.723 28 68.4 25.5 46.9 44.7 23.3 12.6 69.6 2.9 520.9 0.17 0.13 0.793 29 73.0 33.3 53.0 39.2 25.6 34.8 212.5 8.9 514.0 0.31 0.21 0.773 30 60.8 34.2 47.5 39.1 21.2 38.6 224.3 9.3 506.8 0.25 0.17 0.723 31 66.9 27.9 48.5 33.1 17.5 19.6 117.6 4.9 526.1 0.22 0.16 0.73
3 of 13
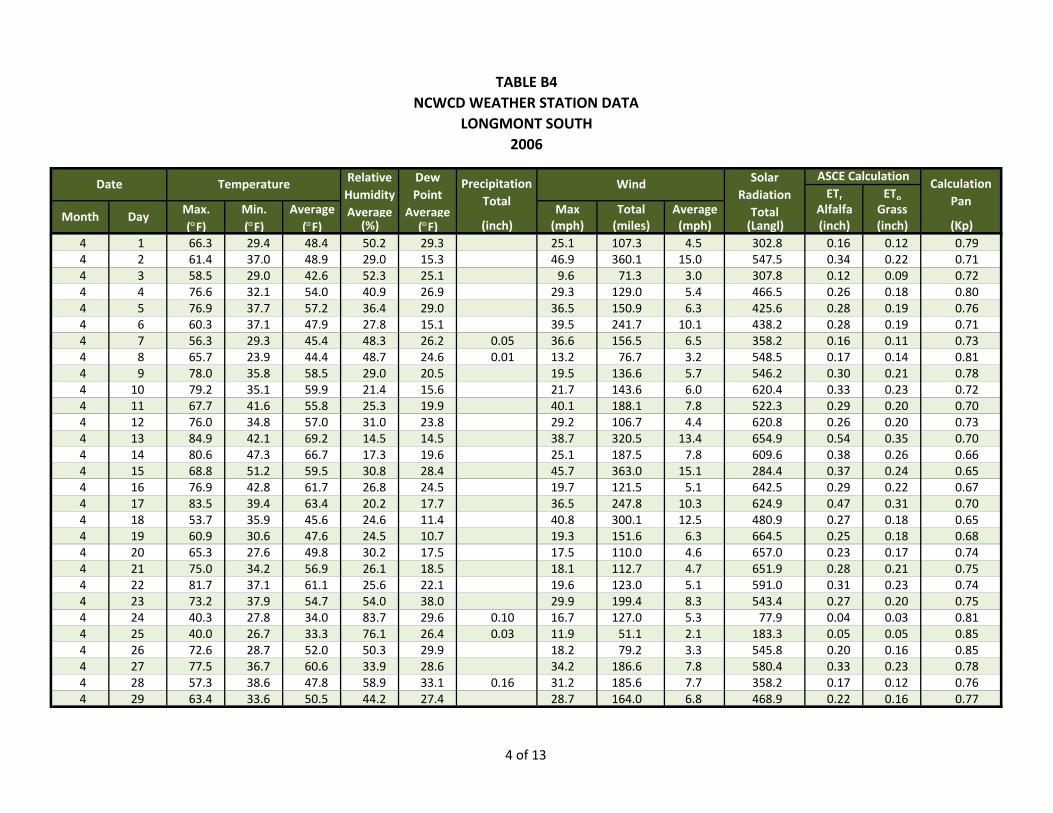
TABLE B4NCWCD WEATHER STATION DATA
LONGMONT SOUTH 2006
ETr EToMax. Min. Average Max Total Average Alfalfa Grass(°F) (°F) (°F) (%) (°F) (inch) (mph) (miles) (mph) (Langl) (inch) (inch) (Kp)
Solar Radiation Total
ASCE CalculationCalculation
PanMonth Day
Date Temperature Relative Humidity Average
Dew Point
Average
Precipitation Total
Wind
4 1 66.3 29.4 48.4 50.2 29.3 25.1 107.3 4.5 302.8 0.16 0.12 0.794 2 61.4 37.0 48.9 29.0 15.3 46.9 360.1 15.0 547.5 0.34 0.22 0.714 3 58.5 29.0 42.6 52.3 25.1 9.6 71.3 3.0 307.8 0.12 0.09 0.724 4 76.6 32.1 54.0 40.9 26.9 29.3 129.0 5.4 466.5 0.26 0.18 0.804 5 76.9 37.7 57.2 36.4 29.0 36.5 150.9 6.3 425.6 0.28 0.19 0.764 6 60.3 37.1 47.9 27.8 15.1 39.5 241.7 10.1 438.2 0.28 0.19 0.714 7 56.3 29.3 45.4 48.3 26.2 0.05 36.6 156.5 6.5 358.2 0.16 0.11 0.734 8 65.7 23.9 44.4 48.7 24.6 0.01 13.2 76.7 3.2 548.5 0.17 0.14 0.814 9 78.0 35.8 58.5 29.0 20.5 19.5 136.6 5.7 546.2 0.30 0.21 0.784 10 79.2 35.1 59.9 21.4 15.6 21.7 143.6 6.0 620.4 0.33 0.23 0.724 11 67.7 41.6 55.8 25.3 19.9 40.1 188.1 7.8 522.3 0.29 0.20 0.704 12 76.0 34.8 57.0 31.0 23.8 29.2 106.7 4.4 620.8 0.26 0.20 0.734 13 84.9 42.1 69.2 14.5 14.5 38.7 320.5 13.4 654.9 0.54 0.35 0.704 14 80.6 47.3 66.7 17.3 19.6 25.1 187.5 7.8 609.6 0.38 0.26 0.664 15 68.8 51.2 59.5 30.8 28.4 45.7 363.0 15.1 284.4 0.37 0.24 0.654 16 76.9 42.8 61.7 26.8 24.5 19.7 121.5 5.1 642.5 0.29 0.22 0.674 17 83.5 39.4 63.4 20.2 17.7 36.5 247.8 10.3 624.9 0.47 0.31 0.704 18 53.7 35.9 45.6 24.6 11.4 40.8 300.1 12.5 480.9 0.27 0.18 0.654 19 60.9 30.6 47.6 24.5 10.7 19.3 151.6 6.3 664.5 0.25 0.18 0.684 20 65.3 27.6 49.8 30.2 17.5 17.5 110.0 4.6 657.0 0.23 0.17 0.744 21 75.0 34.2 56.9 26.1 18.5 18.1 112.7 4.7 651.9 0.28 0.21 0.754 22 81.7 37.1 61.1 25.6 22.1 19.6 123.0 5.1 591.0 0.31 0.23 0.744 23 73.2 37.9 54.7 54.0 38.0 29.9 199.4 8.3 543.4 0.27 0.20 0.754 24 40.3 27.8 34.0 83.7 29.6 0.10 16.7 127.0 5.3 77.9 0.04 0.03 0.814 25 40.0 26.7 33.3 76.1 26.4 0.03 11.9 51.1 2.1 183.3 0.05 0.05 0.854 26 72.6 28.7 52.0 50.3 29.9 18.2 79.2 3.3 545.8 0.20 0.16 0.854 27 77.5 36.7 60.6 33.9 28.6 34.2 186.6 7.8 580.4 0.33 0.23 0.784 28 57.3 38.6 47.8 58.9 33.1 0.16 31.2 185.6 7.7 358.2 0.17 0.12 0.764 29 63.4 33.6 50.5 44.2 27.4 28.7 164.0 6.8 468.9 0.22 0.16 0.77
4 of 13
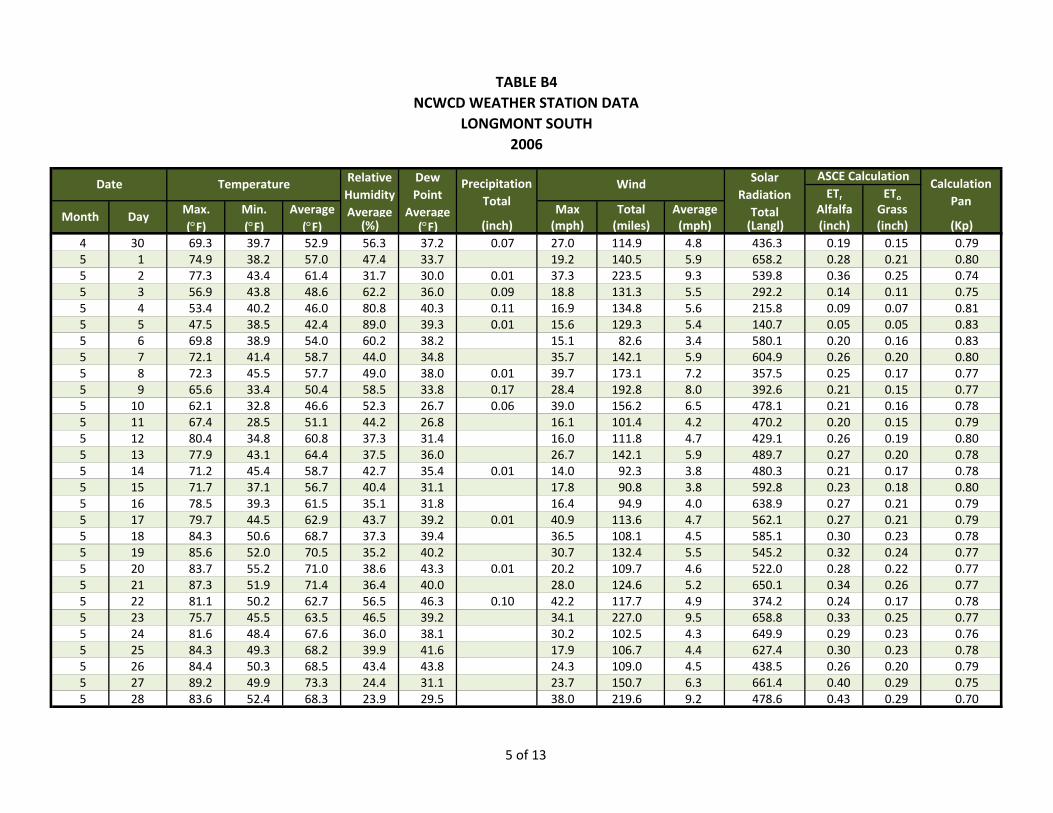
TABLE B4NCWCD WEATHER STATION DATA
LONGMONT SOUTH 2006
ETr EToMax. Min. Average Max Total Average Alfalfa Grass(°F) (°F) (°F) (%) (°F) (inch) (mph) (miles) (mph) (Langl) (inch) (inch) (Kp)
Solar Radiation Total
ASCE CalculationCalculation
PanMonth Day
Date Temperature Relative Humidity Average
Dew Point
Average
Precipitation Total
Wind
4 30 69.3 39.7 52.9 56.3 37.2 0.07 27.0 114.9 4.8 436.3 0.19 0.15 0.795 1 74.9 38.2 57.0 47.4 33.7 19.2 140.5 5.9 658.2 0.28 0.21 0.805 2 77.3 43.4 61.4 31.7 30.0 0.01 37.3 223.5 9.3 539.8 0.36 0.25 0.745 3 56.9 43.8 48.6 62.2 36.0 0.09 18.8 131.3 5.5 292.2 0.14 0.11 0.755 4 53.4 40.2 46.0 80.8 40.3 0.11 16.9 134.8 5.6 215.8 0.09 0.07 0.815 5 47.5 38.5 42.4 89.0 39.3 0.01 15.6 129.3 5.4 140.7 0.05 0.05 0.835 6 69.8 38.9 54.0 60.2 38.2 15.1 82.6 3.4 580.1 0.20 0.16 0.835 7 72.1 41.4 58.7 44.0 34.8 35.7 142.1 5.9 604.9 0.26 0.20 0.805 8 72.3 45.5 57.7 49.0 38.0 0.01 39.7 173.1 7.2 357.5 0.25 0.17 0.775 9 65.6 33.4 50.4 58.5 33.8 0.17 28.4 192.8 8.0 392.6 0.21 0.15 0.775 10 62.1 32.8 46.6 52.3 26.7 0.06 39.0 156.2 6.5 478.1 0.21 0.16 0.785 11 67.4 28.5 51.1 44.2 26.8 16.1 101.4 4.2 470.2 0.20 0.15 0.795 12 80.4 34.8 60.8 37.3 31.4 16.0 111.8 4.7 429.1 0.26 0.19 0.805 13 77.9 43.1 64.4 37.5 36.0 26.7 142.1 5.9 489.7 0.27 0.20 0.785 14 71.2 45.4 58.7 42.7 35.4 0.01 14.0 92.3 3.8 480.3 0.21 0.17 0.785 15 71.7 37.1 56.7 40.4 31.1 17.8 90.8 3.8 592.8 0.23 0.18 0.805 16 78.5 39.3 61.5 35.1 31.8 16.4 94.9 4.0 638.9 0.27 0.21 0.795 17 79.7 44.5 62.9 43.7 39.2 0.01 40.9 113.6 4.7 562.1 0.27 0.21 0.795 18 84.3 50.6 68.7 37.3 39.4 36.5 108.1 4.5 585.1 0.30 0.23 0.785 19 85.6 52.0 70.5 35.2 40.2 30.7 132.4 5.5 545.2 0.32 0.24 0.775 20 83.7 55.2 71.0 38.6 43.3 0.01 20.2 109.7 4.6 522.0 0.28 0.22 0.775 21 87.3 51.9 71.4 36.4 40.0 28.0 124.6 5.2 650.1 0.34 0.26 0.775 22 81.1 50.2 62.7 56.5 46.3 0.10 42.2 117.7 4.9 374.2 0.24 0.17 0.785 23 75.7 45.5 63.5 46.5 39.2 34.1 227.0 9.5 658.8 0.33 0.25 0.775 24 81.6 48.4 67.6 36.0 38.1 30.2 102.5 4.3 649.9 0.29 0.23 0.765 25 84.3 49.3 68.2 39.9 41.6 17.9 106.7 4.4 627.4 0.30 0.23 0.785 26 84.4 50.3 68.5 43.4 43.8 24.3 109.0 4.5 438.5 0.26 0.20 0.795 27 89.2 49.9 73.3 24.4 31.1 23.7 150.7 6.3 661.4 0.40 0.29 0.755 28 83.6 52.4 68.3 23.9 29.5 38.0 219.6 9.2 478.6 0.43 0.29 0.70
5 of 13
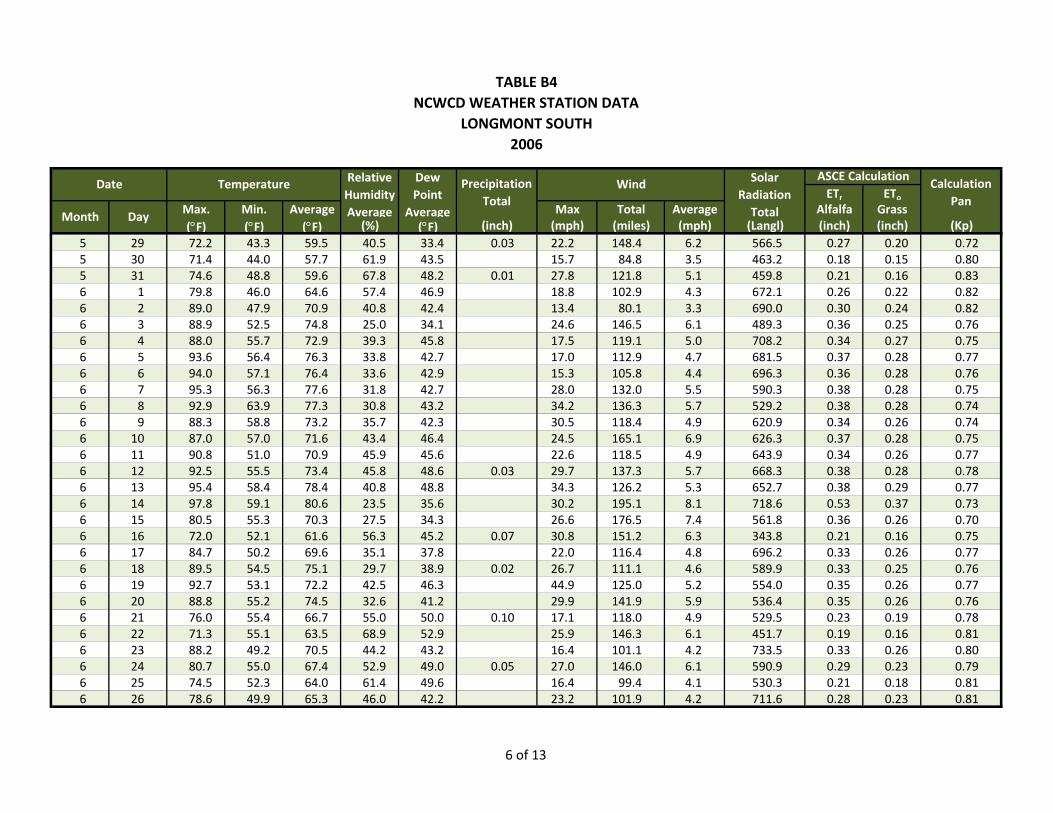
TABLE B4NCWCD WEATHER STATION DATA
LONGMONT SOUTH 2006
ETr EToMax. Min. Average Max Total Average Alfalfa Grass(°F) (°F) (°F) (%) (°F) (inch) (mph) (miles) (mph) (Langl) (inch) (inch) (Kp)
Solar Radiation Total
ASCE CalculationCalculation
PanMonth Day
Date Temperature Relative Humidity Average
Dew Point
Average
Precipitation Total
Wind
5 29 72.2 43.3 59.5 40.5 33.4 0.03 22.2 148.4 6.2 566.5 0.27 0.20 0.725 30 71.4 44.0 57.7 61.9 43.5 15.7 84.8 3.5 463.2 0.18 0.15 0.805 31 74.6 48.8 59.6 67.8 48.2 0.01 27.8 121.8 5.1 459.8 0.21 0.16 0.836 1 79.8 46.0 64.6 57.4 46.9 18.8 102.9 4.3 672.1 0.26 0.22 0.826 2 89.0 47.9 70.9 40.8 42.4 13.4 80.1 3.3 690.0 0.30 0.24 0.826 3 88.9 52.5 74.8 25.0 34.1 24.6 146.5 6.1 489.3 0.36 0.25 0.766 4 88.0 55.7 72.9 39.3 45.8 17.5 119.1 5.0 708.2 0.34 0.27 0.756 5 93.6 56.4 76.3 33.8 42.7 17.0 112.9 4.7 681.5 0.37 0.28 0.776 6 94.0 57.1 76.4 33.6 42.9 15.3 105.8 4.4 696.3 0.36 0.28 0.766 7 95.3 56.3 77.6 31.8 42.7 28.0 132.0 5.5 590.3 0.38 0.28 0.756 8 92.9 63.9 77.3 30.8 43.2 34.2 136.3 5.7 529.2 0.38 0.28 0.746 9 88.3 58.8 73.2 35.7 42.3 30.5 118.4 4.9 620.9 0.34 0.26 0.746 10 87.0 57.0 71.6 43.4 46.4 24.5 165.1 6.9 626.3 0.37 0.28 0.756 11 90.8 51.0 70.9 45.9 45.6 22.6 118.5 4.9 643.9 0.34 0.26 0.776 12 92.5 55.5 73.4 45.8 48.6 0.03 29.7 137.3 5.7 668.3 0.38 0.28 0.786 13 95.4 58.4 78.4 40.8 48.8 34.3 126.2 5.3 652.7 0.38 0.29 0.776 14 97.8 59.1 80.6 23.5 35.6 30.2 195.1 8.1 718.6 0.53 0.37 0.736 15 80.5 55.3 70.3 27.5 34.3 26.6 176.5 7.4 561.8 0.36 0.26 0.706 16 72.0 52.1 61.6 56.3 45.2 0.07 30.8 151.2 6.3 343.8 0.21 0.16 0.756 17 84.7 50.2 69.6 35.1 37.8 22.0 116.4 4.8 696.2 0.33 0.26 0.776 18 89.5 54.5 75.1 29.7 38.9 0.02 26.7 111.1 4.6 589.9 0.33 0.25 0.766 19 92.7 53.1 72.2 42.5 46.3 44.9 125.0 5.2 554.0 0.35 0.26 0.776 20 88.8 55.2 74.5 32.6 41.2 29.9 141.9 5.9 536.4 0.35 0.26 0.766 21 76.0 55.4 66.7 55.0 50.0 0.10 17.1 118.0 4.9 529.5 0.23 0.19 0.786 22 71.3 55.1 63.5 68.9 52.9 25.9 146.3 6.1 451.7 0.19 0.16 0.816 23 88.2 49.2 70.5 44.2 43.2 16.4 101.1 4.2 733.5 0.33 0.26 0.806 24 80.7 55.0 67.4 52.9 49.0 0.05 27.0 146.0 6.1 590.9 0.29 0.23 0.796 25 74.5 52.3 64.0 61.4 49.6 16.4 99.4 4.1 530.3 0.21 0.18 0.816 26 78.6 49.9 65.3 46.0 42.2 23.2 101.9 4.2 711.6 0.28 0.23 0.81
6 of 13
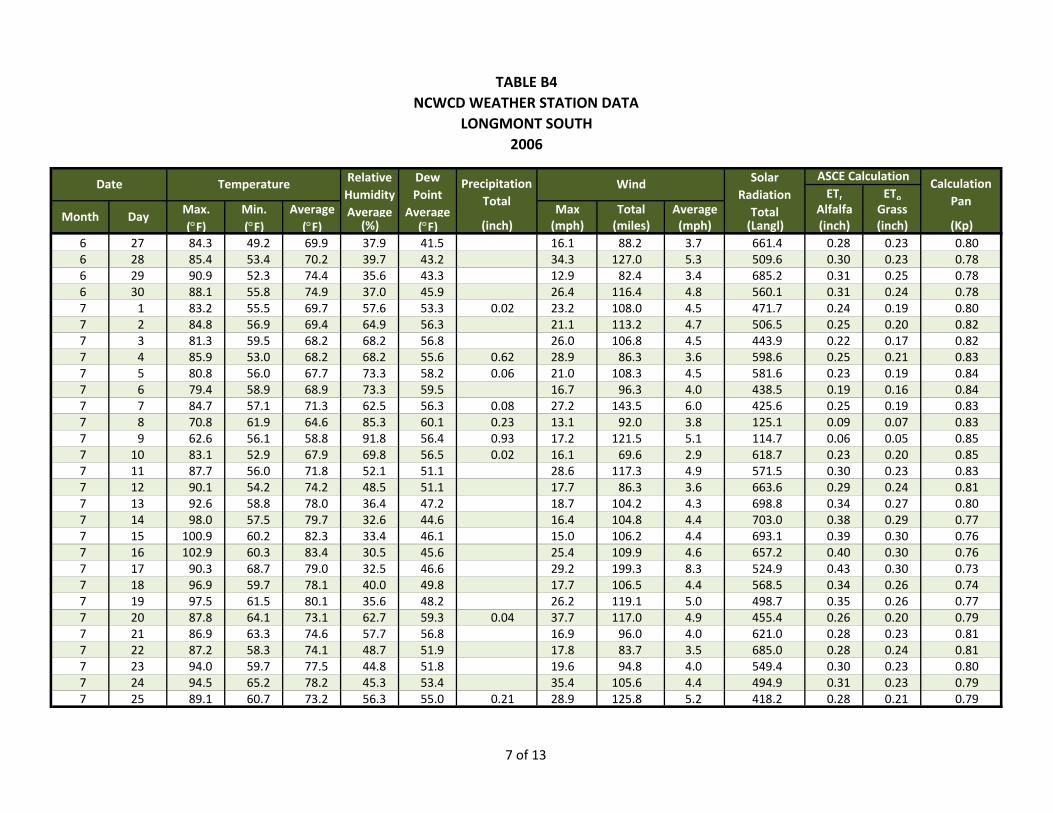
TABLE B4NCWCD WEATHER STATION DATA
LONGMONT SOUTH 2006
ETr EToMax. Min. Average Max Total Average Alfalfa Grass(°F) (°F) (°F) (%) (°F) (inch) (mph) (miles) (mph) (Langl) (inch) (inch) (Kp)
Solar Radiation Total
ASCE CalculationCalculation
PanMonth Day
Date Temperature Relative Humidity Average
Dew Point
Average
Precipitation Total
Wind
6 27 84.3 49.2 69.9 37.9 41.5 16.1 88.2 3.7 661.4 0.28 0.23 0.806 28 85.4 53.4 70.2 39.7 43.2 34.3 127.0 5.3 509.6 0.30 0.23 0.786 29 90.9 52.3 74.4 35.6 43.3 12.9 82.4 3.4 685.2 0.31 0.25 0.786 30 88.1 55.8 74.9 37.0 45.9 26.4 116.4 4.8 560.1 0.31 0.24 0.787 1 83.2 55.5 69.7 57.6 53.3 0.02 23.2 108.0 4.5 471.7 0.24 0.19 0.807 2 84.8 56.9 69.4 64.9 56.3 21.1 113.2 4.7 506.5 0.25 0.20 0.827 3 81.3 59.5 68.2 68.2 56.8 26.0 106.8 4.5 443.9 0.22 0.17 0.827 4 85.9 53.0 68.2 68.2 55.6 0.62 28.9 86.3 3.6 598.6 0.25 0.21 0.837 5 80.8 56.0 67.7 73.3 58.2 0.06 21.0 108.3 4.5 581.6 0.23 0.19 0.847 6 79.4 58.9 68.9 73.3 59.5 16.7 96.3 4.0 438.5 0.19 0.16 0.847 7 84.7 57.1 71.3 62.5 56.3 0.08 27.2 143.5 6.0 425.6 0.25 0.19 0.837 8 70.8 61.9 64.6 85.3 60.1 0.23 13.1 92.0 3.8 125.1 0.09 0.07 0.837 9 62.6 56.1 58.8 91.8 56.4 0.93 17.2 121.5 5.1 114.7 0.06 0.05 0.857 10 83.1 52.9 67.9 69.8 56.5 0.02 16.1 69.6 2.9 618.7 0.23 0.20 0.857 11 87.7 56.0 71.8 52.1 51.1 28.6 117.3 4.9 571.5 0.30 0.23 0.837 12 90.1 54.2 74.2 48.5 51.1 17.7 86.3 3.6 663.6 0.29 0.24 0.817 13 92.6 58.8 78.0 36.4 47.2 18.7 104.2 4.3 698.8 0.34 0.27 0.807 14 98.0 57.5 79.7 32.6 44.6 16.4 104.8 4.4 703.0 0.38 0.29 0.777 15 100.9 60.2 82.3 33.4 46.1 15.0 106.2 4.4 693.1 0.39 0.30 0.767 16 102.9 60.3 83.4 30.5 45.6 25.4 109.9 4.6 657.2 0.40 0.30 0.767 17 90.3 68.7 79.0 32.5 46.6 29.2 199.3 8.3 524.9 0.43 0.30 0.737 18 96.9 59.7 78.1 40.0 49.8 17.7 106.5 4.4 568.5 0.34 0.26 0.747 19 97.5 61.5 80.1 35.6 48.2 26.2 119.1 5.0 498.7 0.35 0.26 0.777 20 87.8 64.1 73.1 62.7 59.3 0.04 37.7 117.0 4.9 455.4 0.26 0.20 0.797 21 86.9 63.3 74.6 57.7 56.8 16.9 96.0 4.0 621.0 0.28 0.23 0.817 22 87.2 58.3 74.1 48.7 51.9 17.8 83.7 3.5 685.0 0.28 0.24 0.817 23 94.0 59.7 77.5 44.8 51.8 19.6 94.8 4.0 549.4 0.30 0.23 0.807 24 94.5 65.2 78.2 45.3 53.4 35.4 105.6 4.4 494.9 0.31 0.23 0.797 25 89.1 60.7 73.2 56.3 55.0 0.21 28.9 125.8 5.2 418.2 0.28 0.21 0.79
7 of 13
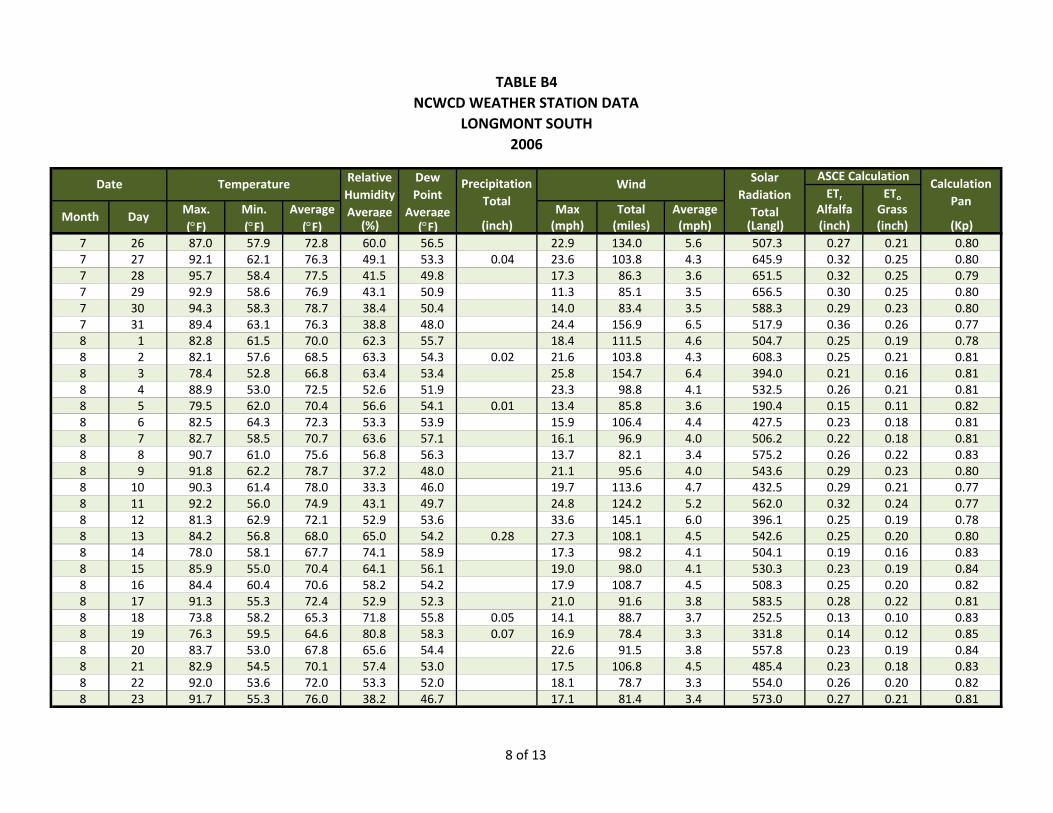
TABLE B4NCWCD WEATHER STATION DATA
LONGMONT SOUTH 2006
ETr EToMax. Min. Average Max Total Average Alfalfa Grass(°F) (°F) (°F) (%) (°F) (inch) (mph) (miles) (mph) (Langl) (inch) (inch) (Kp)
Solar Radiation Total
ASCE CalculationCalculation
PanMonth Day
Date Temperature Relative Humidity Average
Dew Point
Average
Precipitation Total
Wind
7 26 87.0 57.9 72.8 60.0 56.5 22.9 134.0 5.6 507.3 0.27 0.21 0.807 27 92.1 62.1 76.3 49.1 53.3 0.04 23.6 103.8 4.3 645.9 0.32 0.25 0.807 28 95.7 58.4 77.5 41.5 49.8 17.3 86.3 3.6 651.5 0.32 0.25 0.797 29 92.9 58.6 76.9 43.1 50.9 11.3 85.1 3.5 656.5 0.30 0.25 0.807 30 94.3 58.3 78.7 38.4 50.4 14.0 83.4 3.5 588.3 0.29 0.23 0.807 31 89.4 63.1 76.3 38.8 48.0 24.4 156.9 6.5 517.9 0.36 0.26 0.778 1 82.8 61.5 70.0 62.3 55.7 18.4 111.5 4.6 504.7 0.25 0.19 0.788 2 82.1 57.6 68.5 63.3 54.3 0.02 21.6 103.8 4.3 608.3 0.25 0.21 0.818 3 78.4 52.8 66.8 63.4 53.4 25.8 154.7 6.4 394.0 0.21 0.16 0.818 4 88.9 53.0 72.5 52.6 51.9 23.3 98.8 4.1 532.5 0.26 0.21 0.818 5 79.5 62.0 70.4 56.6 54.1 0.01 13.4 85.8 3.6 190.4 0.15 0.11 0.828 6 82.5 64.3 72.3 53.3 53.9 15.9 106.4 4.4 427.5 0.23 0.18 0.818 7 82.7 58.5 70.7 63.6 57.1 16.1 96.9 4.0 506.2 0.22 0.18 0.818 8 90.7 61.0 75.6 56.8 56.3 13.7 82.1 3.4 575.2 0.26 0.22 0.838 9 91.8 62.2 78.7 37.2 48.0 21.1 95.6 4.0 543.6 0.29 0.23 0.808 10 90.3 61.4 78.0 33.3 46.0 19.7 113.6 4.7 432.5 0.29 0.21 0.778 11 92.2 56.0 74.9 43.1 49.7 24.8 124.2 5.2 562.0 0.32 0.24 0.778 12 81.3 62.9 72.1 52.9 53.6 33.6 145.1 6.0 396.1 0.25 0.19 0.788 13 84.2 56.8 68.0 65.0 54.2 0.28 27.3 108.1 4.5 542.6 0.25 0.20 0.808 14 78.0 58.1 67.7 74.1 58.9 17.3 98.2 4.1 504.1 0.19 0.16 0.838 15 85.9 55.0 70.4 64.1 56.1 19.0 98.0 4.1 530.3 0.23 0.19 0.848 16 84.4 60.4 70.6 58.2 54.2 17.9 108.7 4.5 508.3 0.25 0.20 0.828 17 91.3 55.3 72.4 52.9 52.3 21.0 91.6 3.8 583.5 0.28 0.22 0.818 18 73.8 58.2 65.3 71.8 55.8 0.05 14.1 88.7 3.7 252.5 0.13 0.10 0.838 19 76.3 59.5 64.6 80.8 58.3 0.07 16.9 78.4 3.3 331.8 0.14 0.12 0.858 20 83.7 53.0 67.8 65.6 54.4 22.6 91.5 3.8 557.8 0.23 0.19 0.848 21 82.9 54.5 70.1 57.4 53.0 17.5 106.8 4.5 485.4 0.23 0.18 0.838 22 92.0 53.6 72.0 53.3 52.0 18.1 78.7 3.3 554.0 0.26 0.20 0.828 23 91.7 55.3 76.0 38.2 46.7 17.1 81.4 3.4 573.0 0.27 0.21 0.81
8 of 13
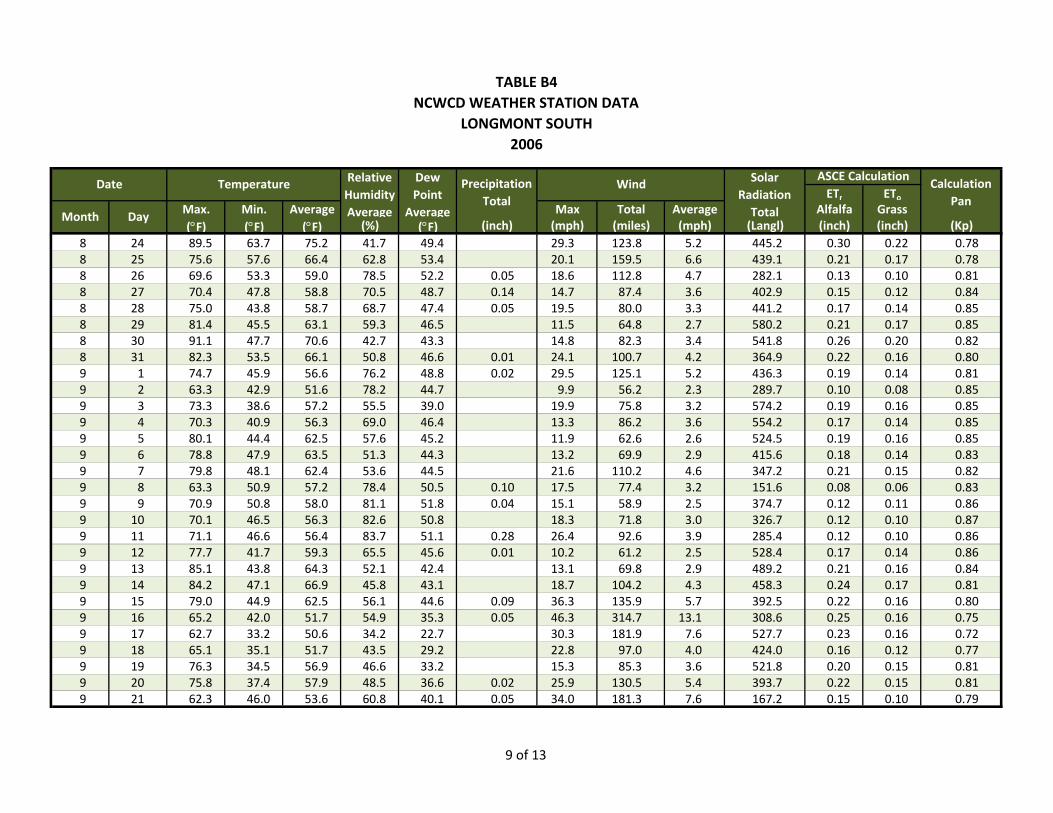
TABLE B4NCWCD WEATHER STATION DATA
LONGMONT SOUTH 2006
ETr EToMax. Min. Average Max Total Average Alfalfa Grass(°F) (°F) (°F) (%) (°F) (inch) (mph) (miles) (mph) (Langl) (inch) (inch) (Kp)
Solar Radiation Total
ASCE CalculationCalculation
PanMonth Day
Date Temperature Relative Humidity Average
Dew Point
Average
Precipitation Total
Wind
8 24 89.5 63.7 75.2 41.7 49.4 29.3 123.8 5.2 445.2 0.30 0.22 0.788 25 75.6 57.6 66.4 62.8 53.4 20.1 159.5 6.6 439.1 0.21 0.17 0.788 26 69.6 53.3 59.0 78.5 52.2 0.05 18.6 112.8 4.7 282.1 0.13 0.10 0.818 27 70.4 47.8 58.8 70.5 48.7 0.14 14.7 87.4 3.6 402.9 0.15 0.12 0.848 28 75.0 43.8 58.7 68.7 47.4 0.05 19.5 80.0 3.3 441.2 0.17 0.14 0.858 29 81.4 45.5 63.1 59.3 46.5 11.5 64.8 2.7 580.2 0.21 0.17 0.858 30 91.1 47.7 70.6 42.7 43.3 14.8 82.3 3.4 541.8 0.26 0.20 0.828 31 82.3 53.5 66.1 50.8 46.6 0.01 24.1 100.7 4.2 364.9 0.22 0.16 0.809 1 74.7 45.9 56.6 76.2 48.8 0.02 29.5 125.1 5.2 436.3 0.19 0.14 0.819 2 63.3 42.9 51.6 78.2 44.7 9.9 56.2 2.3 289.7 0.10 0.08 0.859 3 73.3 38.6 57.2 55.5 39.0 19.9 75.8 3.2 574.2 0.19 0.16 0.859 4 70.3 40.9 56.3 69.0 46.4 13.3 86.2 3.6 554.2 0.17 0.14 0.859 5 80.1 44.4 62.5 57.6 45.2 11.9 62.6 2.6 524.5 0.19 0.16 0.859 6 78.8 47.9 63.5 51.3 44.3 13.2 69.9 2.9 415.6 0.18 0.14 0.839 7 79.8 48.1 62.4 53.6 44.5 21.6 110.2 4.6 347.2 0.21 0.15 0.829 8 63.3 50.9 57.2 78.4 50.5 0.10 17.5 77.4 3.2 151.6 0.08 0.06 0.839 9 70.9 50.8 58.0 81.1 51.8 0.04 15.1 58.9 2.5 374.7 0.12 0.11 0.869 10 70.1 46.5 56.3 82.6 50.8 18.3 71.8 3.0 326.7 0.12 0.10 0.879 11 71.1 46.6 56.4 83.7 51.1 0.28 26.4 92.6 3.9 285.4 0.12 0.10 0.869 12 77.7 41.7 59.3 65.5 45.6 0.01 10.2 61.2 2.5 528.4 0.17 0.14 0.869 13 85.1 43.8 64.3 52.1 42.4 13.1 69.8 2.9 489.2 0.21 0.16 0.849 14 84.2 47.1 66.9 45.8 43.1 18.7 104.2 4.3 458.3 0.24 0.17 0.819 15 79.0 44.9 62.5 56.1 44.6 0.09 36.3 135.9 5.7 392.5 0.22 0.16 0.809 16 65.2 42.0 51.7 54.9 35.3 0.05 46.3 314.7 13.1 308.6 0.25 0.16 0.759 17 62.7 33.2 50.6 34.2 22.7 30.3 181.9 7.6 527.7 0.23 0.16 0.729 18 65.1 35.1 51.7 43.5 29.2 22.8 97.0 4.0 424.0 0.16 0.12 0.779 19 76.3 34.5 56.9 46.6 33.2 15.3 85.3 3.6 521.8 0.20 0.15 0.819 20 75.8 37.4 57.9 48.5 36.6 0.02 25.9 130.5 5.4 393.7 0.22 0.15 0.819 21 62.3 46.0 53.6 60.8 40.1 0.05 34.0 181.3 7.6 167.2 0.15 0.10 0.79
9 of 13
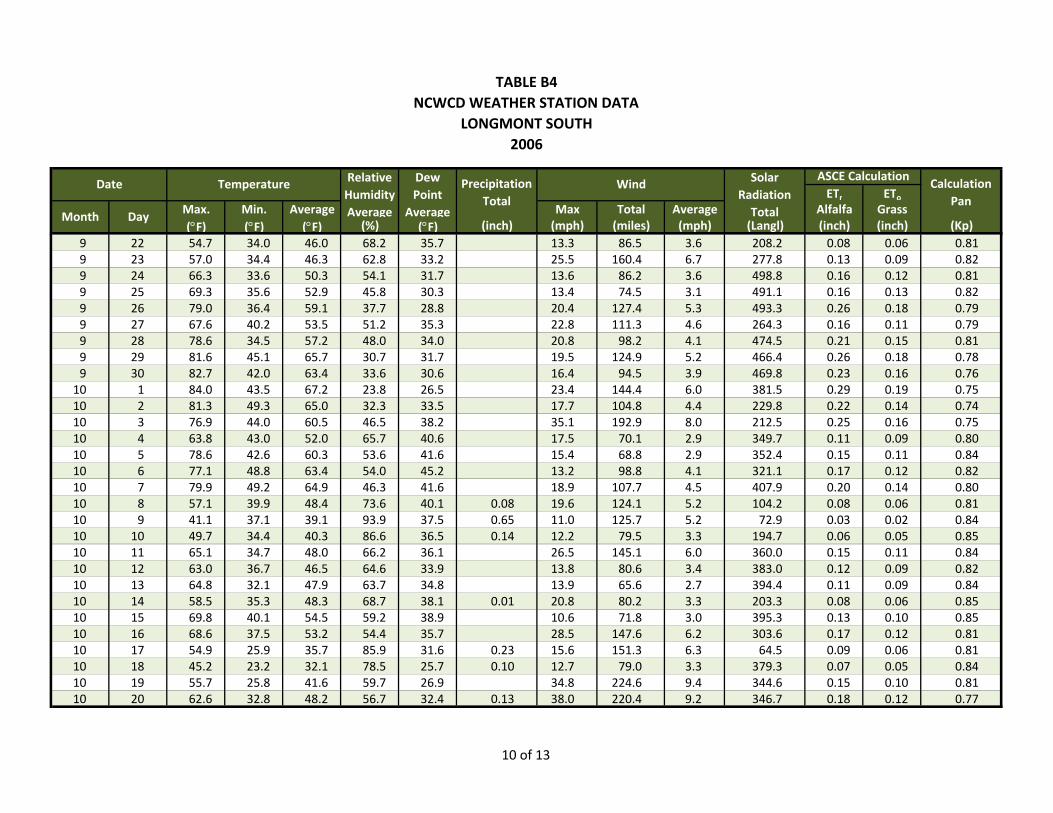
TABLE B4NCWCD WEATHER STATION DATA
LONGMONT SOUTH 2006
ETr EToMax. Min. Average Max Total Average Alfalfa Grass(°F) (°F) (°F) (%) (°F) (inch) (mph) (miles) (mph) (Langl) (inch) (inch) (Kp)
Solar Radiation Total
ASCE CalculationCalculation
PanMonth Day
Date Temperature Relative Humidity Average
Dew Point
Average
Precipitation Total
Wind
9 22 54.7 34.0 46.0 68.2 35.7 13.3 86.5 3.6 208.2 0.08 0.06 0.819 23 57.0 34.4 46.3 62.8 33.2 25.5 160.4 6.7 277.8 0.13 0.09 0.829 24 66.3 33.6 50.3 54.1 31.7 13.6 86.2 3.6 498.8 0.16 0.12 0.819 25 69.3 35.6 52.9 45.8 30.3 13.4 74.5 3.1 491.1 0.16 0.13 0.829 26 79.0 36.4 59.1 37.7 28.8 20.4 127.4 5.3 493.3 0.26 0.18 0.799 27 67.6 40.2 53.5 51.2 35.3 22.8 111.3 4.6 264.3 0.16 0.11 0.799 28 78.6 34.5 57.2 48.0 34.0 20.8 98.2 4.1 474.5 0.21 0.15 0.819 29 81.6 45.1 65.7 30.7 31.7 19.5 124.9 5.2 466.4 0.26 0.18 0.789 30 82.7 42.0 63.4 33.6 30.6 16.4 94.5 3.9 469.8 0.23 0.16 0.7610 1 84.0 43.5 67.2 23.8 26.5 23.4 144.4 6.0 381.5 0.29 0.19 0.7510 2 81.3 49.3 65.0 32.3 33.5 17.7 104.8 4.4 229.8 0.22 0.14 0.7410 3 76.9 44.0 60.5 46.5 38.2 35.1 192.9 8.0 212.5 0.25 0.16 0.7510 4 63.8 43.0 52.0 65.7 40.6 17.5 70.1 2.9 349.7 0.11 0.09 0.8010 5 78.6 42.6 60.3 53.6 41.6 15.4 68.8 2.9 352.4 0.15 0.11 0.8410 6 77.1 48.8 63.4 54.0 45.2 13.2 98.8 4.1 321.1 0.17 0.12 0.8210 7 79.9 49.2 64.9 46.3 41.6 18.9 107.7 4.5 407.9 0.20 0.14 0.8010 8 57.1 39.9 48.4 73.6 40.1 0.08 19.6 124.1 5.2 104.2 0.08 0.06 0.8110 9 41.1 37.1 39.1 93.9 37.5 0.65 11.0 125.7 5.2 72.9 0.03 0.02 0.8410 10 49.7 34.4 40.3 86.6 36.5 0.14 12.2 79.5 3.3 194.7 0.06 0.05 0.8510 11 65.1 34.7 48.0 66.2 36.1 26.5 145.1 6.0 360.0 0.15 0.11 0.8410 12 63.0 36.7 46.5 64.6 33.9 13.8 80.6 3.4 383.0 0.12 0.09 0.8210 13 64.8 32.1 47.9 63.7 34.8 13.9 65.6 2.7 394.4 0.11 0.09 0.8410 14 58.5 35.3 48.3 68.7 38.1 0.01 20.8 80.2 3.3 203.3 0.08 0.06 0.8510 15 69.8 40.1 54.5 59.2 38.9 10.6 71.8 3.0 395.3 0.13 0.10 0.8510 16 68.6 37.5 53.2 54.4 35.7 28.5 147.6 6.2 303.6 0.17 0.12 0.8110 17 54.9 25.9 35.7 85.9 31.6 0.23 15.6 151.3 6.3 64.5 0.09 0.06 0.8110 18 45.2 23.2 32.1 78.5 25.7 0.10 12.7 79.0 3.3 379.3 0.07 0.05 0.8410 19 55.7 25.8 41.6 59.7 26.9 34.8 224.6 9.4 344.6 0.15 0.10 0.8110 20 62.6 32.8 48.2 56.7 32.4 0.13 38.0 220.4 9.2 346.7 0.18 0.12 0.77
10 of 13
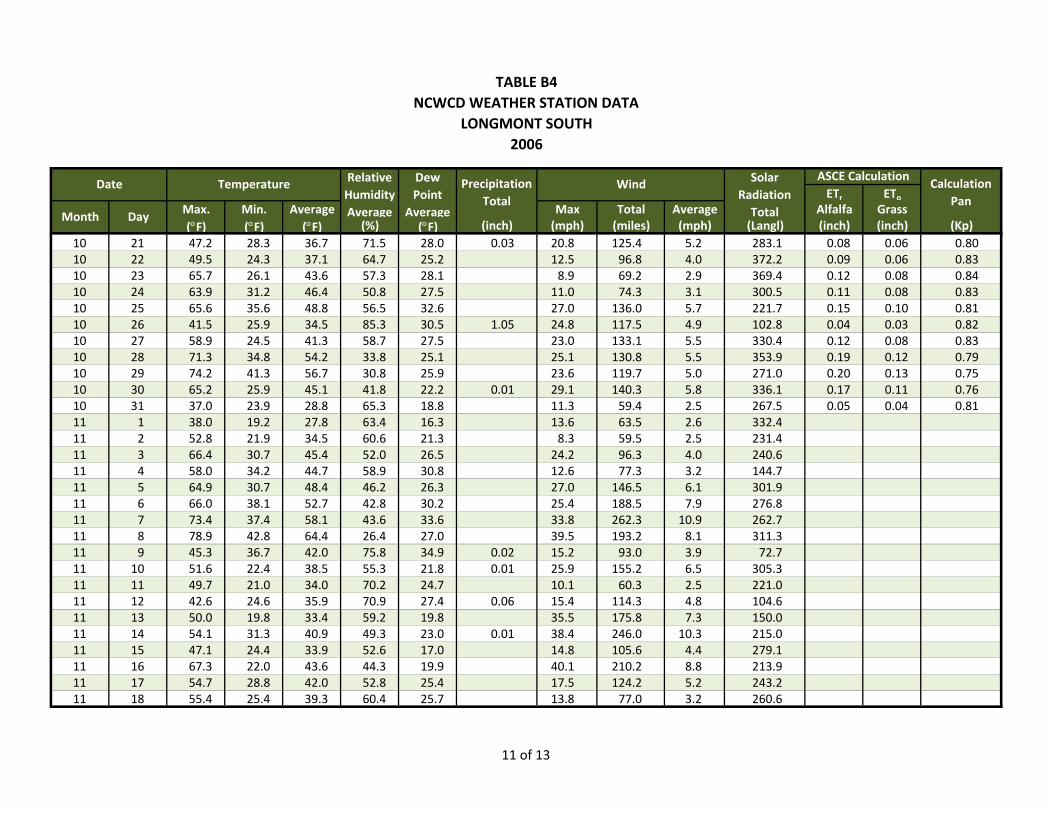
TABLE B4NCWCD WEATHER STATION DATA
LONGMONT SOUTH 2006
ETr EToMax. Min. Average Max Total Average Alfalfa Grass(°F) (°F) (°F) (%) (°F) (inch) (mph) (miles) (mph) (Langl) (inch) (inch) (Kp)
Solar Radiation Total
ASCE CalculationCalculation
PanMonth Day
Date Temperature Relative Humidity Average
Dew Point
Average
Precipitation Total
Wind
10 21 47.2 28.3 36.7 71.5 28.0 0.03 20.8 125.4 5.2 283.1 0.08 0.06 0.8010 22 49.5 24.3 37.1 64.7 25.2 12.5 96.8 4.0 372.2 0.09 0.06 0.8310 23 65.7 26.1 43.6 57.3 28.1 8.9 69.2 2.9 369.4 0.12 0.08 0.8410 24 63.9 31.2 46.4 50.8 27.5 11.0 74.3 3.1 300.5 0.11 0.08 0.8310 25 65.6 35.6 48.8 56.5 32.6 27.0 136.0 5.7 221.7 0.15 0.10 0.8110 26 41.5 25.9 34.5 85.3 30.5 1.05 24.8 117.5 4.9 102.8 0.04 0.03 0.8210 27 58.9 24.5 41.3 58.7 27.5 23.0 133.1 5.5 330.4 0.12 0.08 0.8310 28 71.3 34.8 54.2 33.8 25.1 25.1 130.8 5.5 353.9 0.19 0.12 0.7910 29 74.2 41.3 56.7 30.8 25.9 23.6 119.7 5.0 271.0 0.20 0.13 0.7510 30 65.2 25.9 45.1 41.8 22.2 0.01 29.1 140.3 5.8 336.1 0.17 0.11 0.7610 31 37.0 23.9 28.8 65.3 18.8 11.3 59.4 2.5 267.5 0.05 0.04 0.8111 1 38.0 19.2 27.8 63.4 16.3 13.6 63.5 2.6 332.411 2 52.8 21.9 34.5 60.6 21.3 8.3 59.5 2.5 231.411 3 66.4 30.7 45.4 52.0 26.5 24.2 96.3 4.0 240.611 4 58.0 34.2 44.7 58.9 30.8 12.6 77.3 3.2 144.711 5 64.9 30.7 48.4 46.2 26.3 27.0 146.5 6.1 301.911 6 66.0 38.1 52.7 42.8 30.2 25.4 188.5 7.9 276.811 7 73.4 37.4 58.1 43.6 33.6 33.8 262.3 10.9 262.711 8 78.9 42.8 64.4 26.4 27.0 39.5 193.2 8.1 311.311 9 45.3 36.7 42.0 75.8 34.9 0.02 15.2 93.0 3.9 72.711 10 51.6 22.4 38.5 55.3 21.8 0.01 25.9 155.2 6.5 305.311 11 49.7 21.0 34.0 70.2 24.7 10.1 60.3 2.5 221.011 12 42.6 24.6 35.9 70.9 27.4 0.06 15.4 114.3 4.8 104.611 13 50.0 19.8 33.4 59.2 19.8 35.5 175.8 7.3 150.011 14 54.1 31.3 40.9 49.3 23.0 0.01 38.4 246.0 10.3 215.011 15 47.1 24.4 33.9 52.6 17.0 14.8 105.6 4.4 279.111 16 67.3 22.0 43.6 44.3 19.9 40.1 210.2 8.8 213.911 17 54.7 28.8 42.0 52.8 25.4 17.5 124.2 5.2 243.211 18 55.4 25.4 39.3 60.4 25.7 13.8 77.0 3.2 260.6
11 of 13
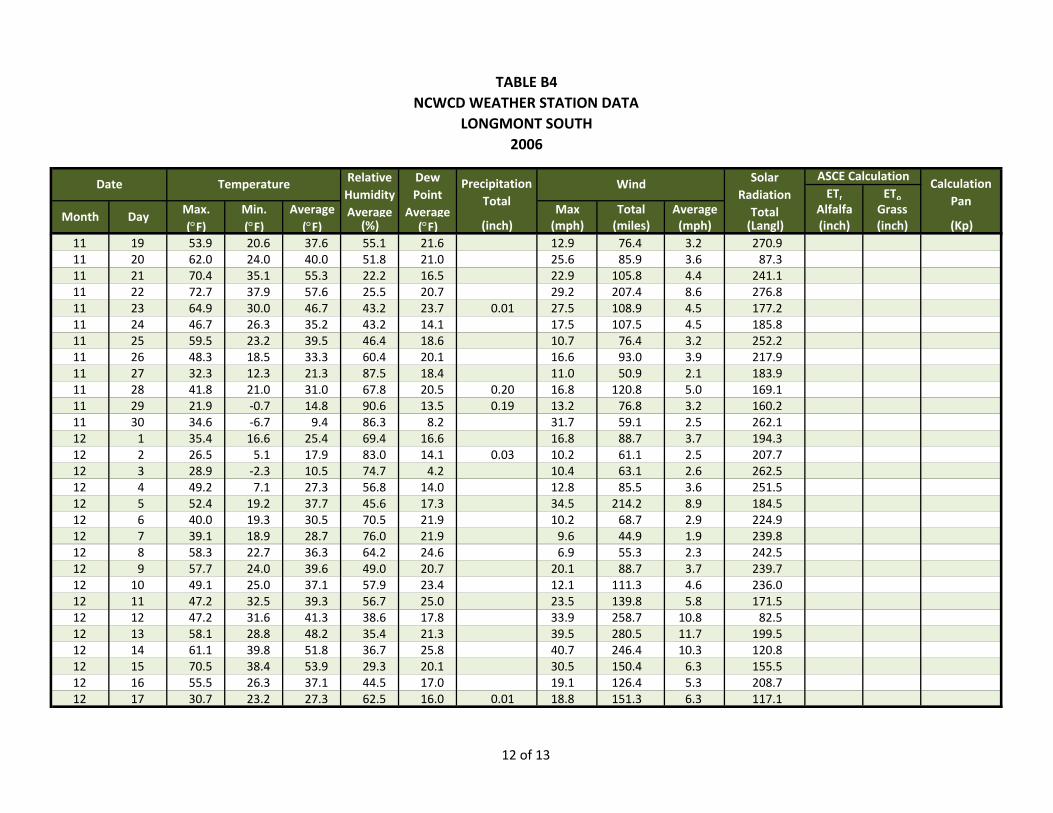
TABLE B4NCWCD WEATHER STATION DATA
LONGMONT SOUTH 2006
ETr EToMax. Min. Average Max Total Average Alfalfa Grass(°F) (°F) (°F) (%) (°F) (inch) (mph) (miles) (mph) (Langl) (inch) (inch) (Kp)
Solar Radiation Total
ASCE CalculationCalculation
PanMonth Day
Date Temperature Relative Humidity Average
Dew Point
Average
Precipitation Total
Wind
11 19 53.9 20.6 37.6 55.1 21.6 12.9 76.4 3.2 270.911 20 62.0 24.0 40.0 51.8 21.0 25.6 85.9 3.6 87.311 21 70.4 35.1 55.3 22.2 16.5 22.9 105.8 4.4 241.111 22 72.7 37.9 57.6 25.5 20.7 29.2 207.4 8.6 276.811 23 64.9 30.0 46.7 43.2 23.7 0.01 27.5 108.9 4.5 177.211 24 46.7 26.3 35.2 43.2 14.1 17.5 107.5 4.5 185.811 25 59.5 23.2 39.5 46.4 18.6 10.7 76.4 3.2 252.211 26 48.3 18.5 33.3 60.4 20.1 16.6 93.0 3.9 217.911 27 32.3 12.3 21.3 87.5 18.4 11.0 50.9 2.1 183.911 28 41.8 21.0 31.0 67.8 20.5 0.20 16.8 120.8 5.0 169.111 29 21.9 ‐0.7 14.8 90.6 13.5 0.19 13.2 76.8 3.2 160.211 30 34.6 ‐6.7 9.4 86.3 8.2 31.7 59.1 2.5 262.112 1 35.4 16.6 25.4 69.4 16.6 16.8 88.7 3.7 194.312 2 26.5 5.1 17.9 83.0 14.1 0.03 10.2 61.1 2.5 207.712 3 28.9 ‐2.3 10.5 74.7 4.2 10.4 63.1 2.6 262.512 4 49.2 7.1 27.3 56.8 14.0 12.8 85.5 3.6 251.512 5 52.4 19.2 37.7 45.6 17.3 34.5 214.2 8.9 184.512 6 40.0 19.3 30.5 70.5 21.9 10.2 68.7 2.9 224.912 7 39.1 18.9 28.7 76.0 21.9 9.6 44.9 1.9 239.812 8 58.3 22.7 36.3 64.2 24.6 6.9 55.3 2.3 242.512 9 57.7 24.0 39.6 49.0 20.7 20.1 88.7 3.7 239.712 10 49.1 25.0 37.1 57.9 23.4 12.1 111.3 4.6 236.012 11 47.2 32.5 39.3 56.7 25.0 23.5 139.8 5.8 171.512 12 47.2 31.6 41.3 38.6 17.8 33.9 258.7 10.8 82.512 13 58.1 28.8 48.2 35.4 21.3 39.5 280.5 11.7 199.512 14 61.1 39.8 51.8 36.7 25.8 40.7 246.4 10.3 120.812 15 70.5 38.4 53.9 29.3 20.1 30.5 150.4 6.3 155.512 16 55.5 26.3 37.1 44.5 17.0 19.1 126.4 5.3 208.712 17 30.7 23.2 27.3 62.5 16.0 0.01 18.8 151.3 6.3 117.1
12 of 13
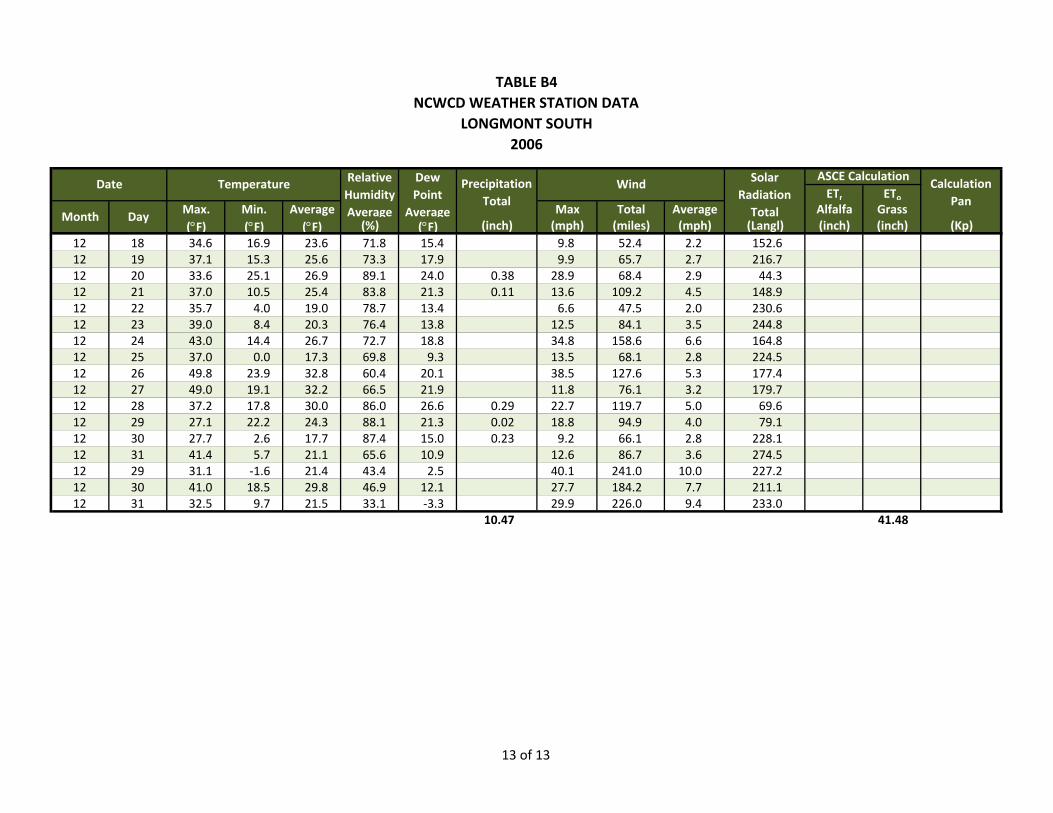
TABLE B4NCWCD WEATHER STATION DATA
LONGMONT SOUTH 2006
ETr EToMax. Min. Average Max Total Average Alfalfa Grass(°F) (°F) (°F) (%) (°F) (inch) (mph) (miles) (mph) (Langl) (inch) (inch) (Kp)
Solar Radiation Total
ASCE CalculationCalculation
PanMonth Day
Date Temperature Relative Humidity Average
Dew Point
Average
Precipitation Total
Wind
12 18 34.6 16.9 23.6 71.8 15.4 9.8 52.4 2.2 152.612 19 37.1 15.3 25.6 73.3 17.9 9.9 65.7 2.7 216.712 20 33.6 25.1 26.9 89.1 24.0 0.38 28.9 68.4 2.9 44.312 21 37.0 10.5 25.4 83.8 21.3 0.11 13.6 109.2 4.5 148.912 22 35.7 4.0 19.0 78.7 13.4 6.6 47.5 2.0 230.612 23 39.0 8.4 20.3 76.4 13.8 12.5 84.1 3.5 244.812 24 43.0 14.4 26.7 72.7 18.8 34.8 158.6 6.6 164.812 25 37.0 0.0 17.3 69.8 9.3 13.5 68.1 2.8 224.512 26 49.8 23.9 32.8 60.4 20.1 38.5 127.6 5.3 177.412 27 49.0 19.1 32.2 66.5 21.9 11.8 76.1 3.2 179.712 28 37.2 17.8 30.0 86.0 26.6 0.29 22.7 119.7 5.0 69.612 29 27.1 22.2 24.3 88.1 21.3 0.02 18.8 94.9 4.0 79.112 30 27.7 2.6 17.7 87.4 15.0 0.23 9.2 66.1 2.8 228.112 31 41.4 5.7 21.1 65.6 10.9 12.6 86.7 3.6 274.512 29 31.1 ‐1.6 21.4 43.4 2.5 40.1 241.0 10.0 227.212 30 41.0 18.5 29.8 46.9 12.1 27.7 184.2 7.7 211.112 31 32.5 9.7 21.5 33.1 ‐3.3 29.9 226.0 9.4 233.0
10.47 41.48
13 of 13
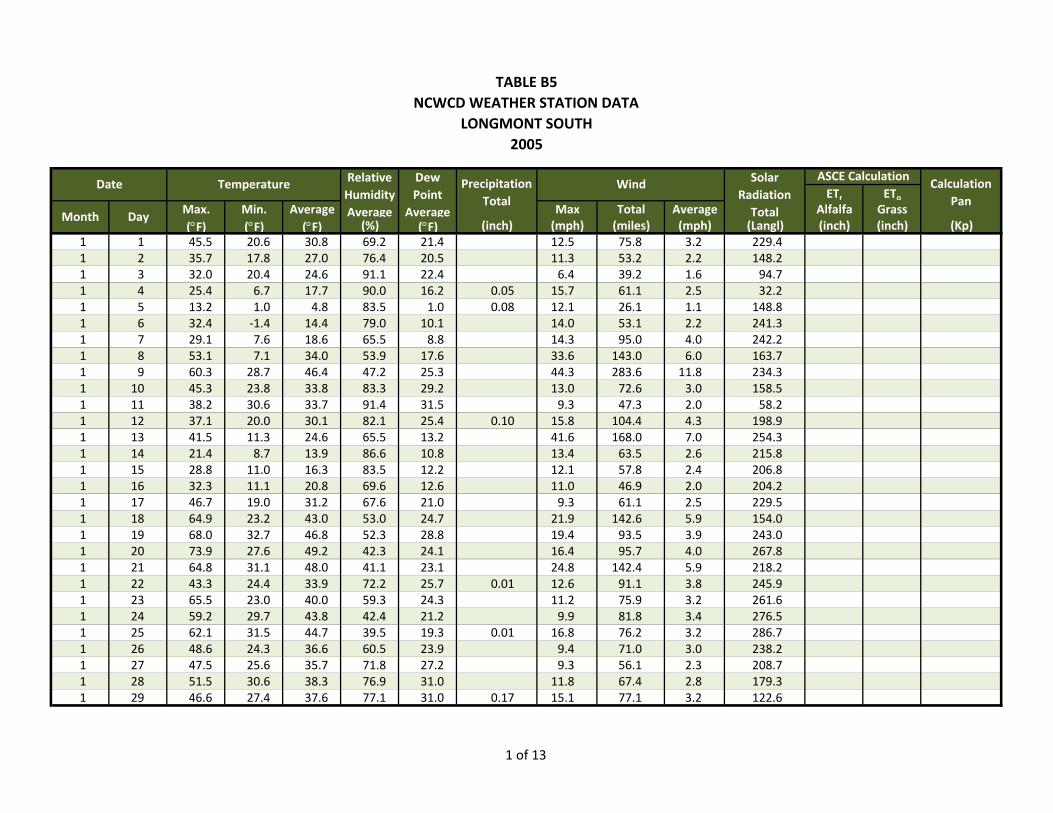
TABLE B5NCWCD WEATHER STATION DATA
LONGMONT SOUTH 2005
ETr EToMax. Min. Average Max Total Average Alfalfa Grass(°F) (°F) (°F) (%) (°F) (inch) (mph) (miles) (mph) (Langl) (inch) (inch) (Kp)
1 1 45.5 20.6 30.8 69.2 21.4 12.5 75.8 3.2 229.41 2 35.7 17.8 27.0 76.4 20.5 11.3 53.2 2.2 148.21 3 32.0 20.4 24.6 91.1 22.4 6.4 39.2 1.6 94.71 4 25.4 6.7 17.7 90.0 16.2 0.05 15.7 61.1 2.5 32.21 5 13.2 1.0 4.8 83.5 1.0 0.08 12.1 26.1 1.1 148.81 6 32.4 ‐1.4 14.4 79.0 10.1 14.0 53.1 2.2 241.31 7 29.1 7.6 18.6 65.5 8.8 14.3 95.0 4.0 242.21 8 53.1 7.1 34.0 53.9 17.6 33.6 143.0 6.0 163.71 9 60.3 28.7 46.4 47.2 25.3 44.3 283.6 11.8 234.31 10 45.3 23.8 33.8 83.3 29.2 13.0 72.6 3.0 158.51 11 38.2 30.6 33.7 91.4 31.5 9.3 47.3 2.0 58.21 12 37.1 20.0 30.1 82.1 25.4 0.10 15.8 104.4 4.3 198.91 13 41.5 11.3 24.6 65.5 13.2 41.6 168.0 7.0 254.31 14 21.4 8.7 13.9 86.6 10.8 13.4 63.5 2.6 215.81 15 28.8 11.0 16.3 83.5 12.2 12.1 57.8 2.4 206.81 16 32.3 11.1 20.8 69.6 12.6 11.0 46.9 2.0 204.21 17 46.7 19.0 31.2 67.6 21.0 9.3 61.1 2.5 229.51 18 64.9 23.2 43.0 53.0 24.7 21.9 142.6 5.9 154.01 19 68.0 32.7 46.8 52.3 28.8 19.4 93.5 3.9 243.01 20 73.9 27.6 49.2 42.3 24.1 16.4 95.7 4.0 267.81 21 64.8 31.1 48.0 41.1 23.1 24.8 142.4 5.9 218.21 22 43.3 24.4 33.9 72.2 25.7 0.01 12.6 91.1 3.8 245.91 23 65.5 23.0 40.0 59.3 24.3 11.2 75.9 3.2 261.61 24 59.2 29.7 43.8 42.4 21.2 9.9 81.8 3.4 276.51 25 62.1 31.5 44.7 39.5 19.3 0.01 16.8 76.2 3.2 286.71 26 48.6 24.3 36.6 60.5 23.9 9.4 71.0 3.0 238.21 27 47.5 25.6 35.7 71.8 27.2 9.3 56.1 2.3 208.71 28 51.5 30.6 38.3 76.9 31.0 11.8 67.4 2.8 179.31 29 46.6 27.4 37.6 77.1 31.0 0.17 15.1 77.1 3.2 122.6
Solar Radiation Total
ASCE CalculationCalculation
PanMonth Day
Date Temperature Relative Humidity Average
Dew Point
Average
Precipitation Total
Wind
1 of 13
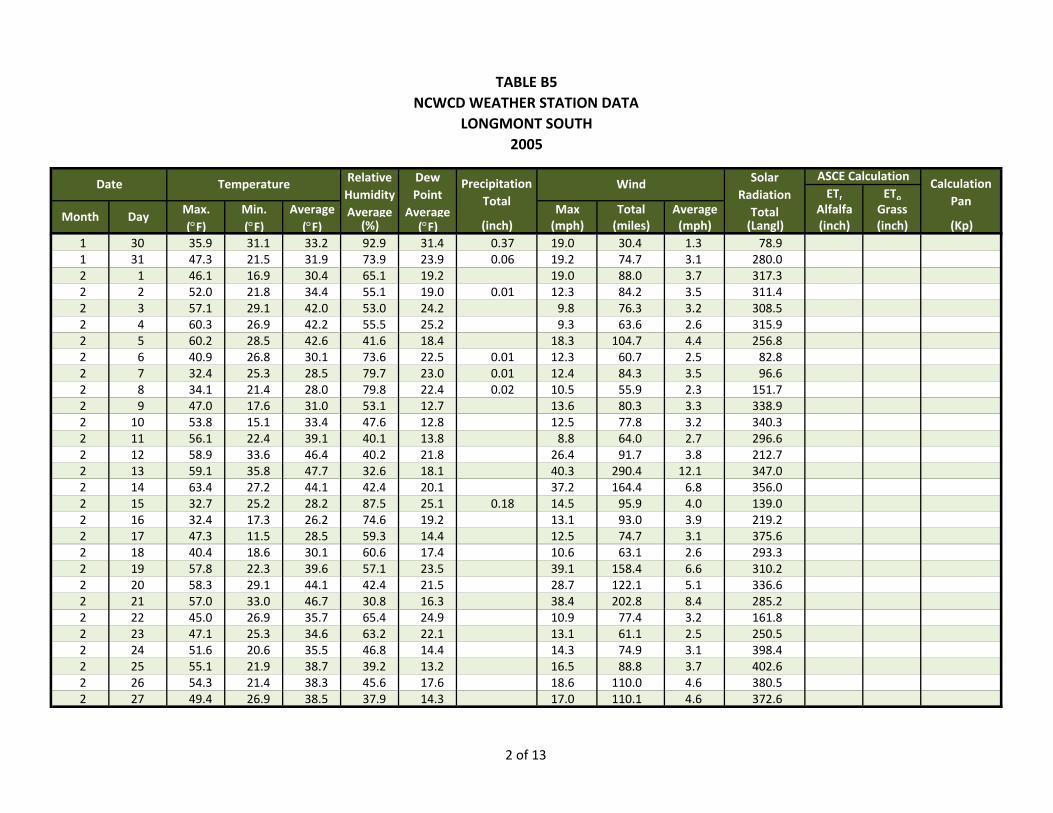
TABLE B5NCWCD WEATHER STATION DATA
LONGMONT SOUTH 2005
ETr EToMax. Min. Average Max Total Average Alfalfa Grass(°F) (°F) (°F) (%) (°F) (inch) (mph) (miles) (mph) (Langl) (inch) (inch) (Kp)
Solar Radiation Total
ASCE CalculationCalculation
PanMonth Day
Date Temperature Relative Humidity Average
Dew Point
Average
Precipitation Total
Wind
1 30 35.9 31.1 33.2 92.9 31.4 0.37 19.0 30.4 1.3 78.91 31 47.3 21.5 31.9 73.9 23.9 0.06 19.2 74.7 3.1 280.02 1 46.1 16.9 30.4 65.1 19.2 19.0 88.0 3.7 317.32 2 52.0 21.8 34.4 55.1 19.0 0.01 12.3 84.2 3.5 311.42 3 57.1 29.1 42.0 53.0 24.2 9.8 76.3 3.2 308.52 4 60.3 26.9 42.2 55.5 25.2 9.3 63.6 2.6 315.92 5 60.2 28.5 42.6 41.6 18.4 18.3 104.7 4.4 256.82 6 40.9 26.8 30.1 73.6 22.5 0.01 12.3 60.7 2.5 82.82 7 32.4 25.3 28.5 79.7 23.0 0.01 12.4 84.3 3.5 96.62 8 34.1 21.4 28.0 79.8 22.4 0.02 10.5 55.9 2.3 151.72 9 47.0 17.6 31.0 53.1 12.7 13.6 80.3 3.3 338.92 10 53.8 15.1 33.4 47.6 12.8 12.5 77.8 3.2 340.32 11 56.1 22.4 39.1 40.1 13.8 8.8 64.0 2.7 296.62 12 58.9 33.6 46.4 40.2 21.8 26.4 91.7 3.8 212.72 13 59.1 35.8 47.7 32.6 18.1 40.3 290.4 12.1 347.02 14 63.4 27.2 44.1 42.4 20.1 37.2 164.4 6.8 356.02 15 32.7 25.2 28.2 87.5 25.1 0.18 14.5 95.9 4.0 139.02 16 32.4 17.3 26.2 74.6 19.2 13.1 93.0 3.9 219.22 17 47.3 11.5 28.5 59.3 14.4 12.5 74.7 3.1 375.62 18 40.4 18.6 30.1 60.6 17.4 10.6 63.1 2.6 293.32 19 57.8 22.3 39.6 57.1 23.5 39.1 158.4 6.6 310.22 20 58.3 29.1 44.1 42.4 21.5 28.7 122.1 5.1 336.62 21 57.0 33.0 46.7 30.8 16.3 38.4 202.8 8.4 285.22 22 45.0 26.9 35.7 65.4 24.9 10.9 77.4 3.2 161.82 23 47.1 25.3 34.6 63.2 22.1 13.1 61.1 2.5 250.52 24 51.6 20.6 35.5 46.8 14.4 14.3 74.9 3.1 398.42 25 55.1 21.9 38.7 39.2 13.2 16.5 88.8 3.7 402.62 26 54.3 21.4 38.3 45.6 17.6 18.6 110.0 4.6 380.52 27 49.4 26.9 38.5 37.9 14.3 17.0 110.1 4.6 372.6
2 of 13
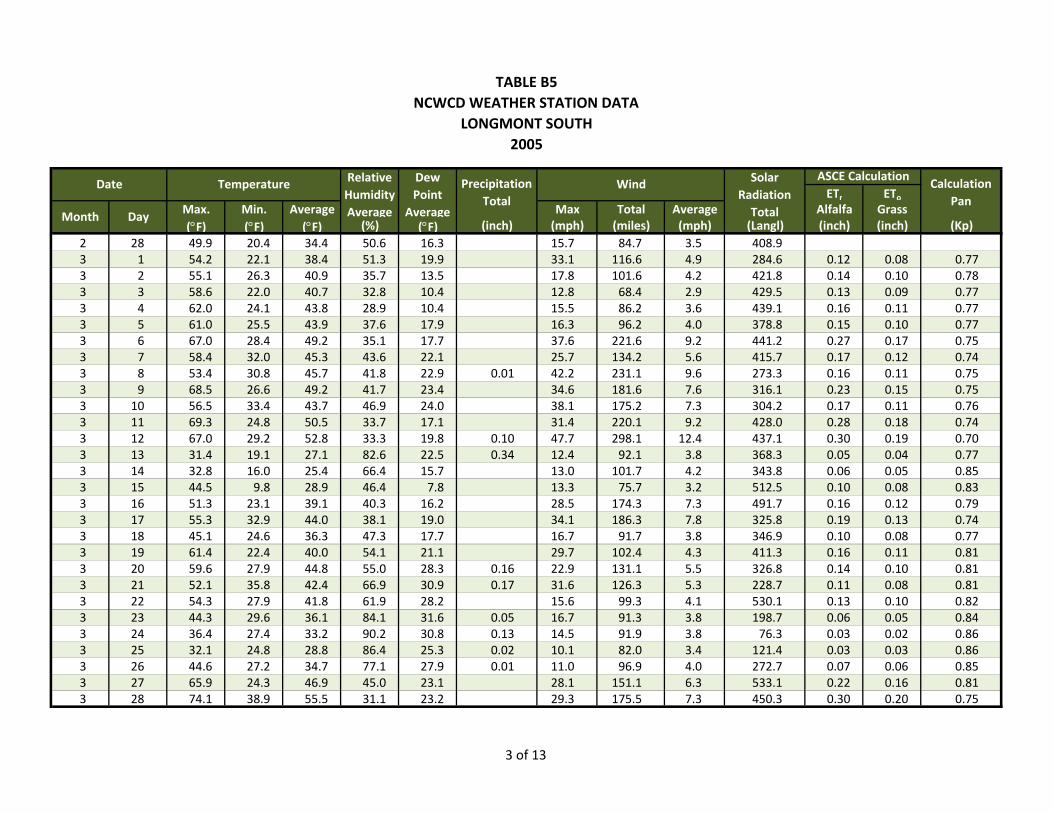
TABLE B5NCWCD WEATHER STATION DATA
LONGMONT SOUTH 2005
ETr EToMax. Min. Average Max Total Average Alfalfa Grass(°F) (°F) (°F) (%) (°F) (inch) (mph) (miles) (mph) (Langl) (inch) (inch) (Kp)
Solar Radiation Total
ASCE CalculationCalculation
PanMonth Day
Date Temperature Relative Humidity Average
Dew Point
Average
Precipitation Total
Wind
2 28 49.9 20.4 34.4 50.6 16.3 15.7 84.7 3.5 408.93 1 54.2 22.1 38.4 51.3 19.9 33.1 116.6 4.9 284.6 0.12 0.08 0.773 2 55.1 26.3 40.9 35.7 13.5 17.8 101.6 4.2 421.8 0.14 0.10 0.783 3 58.6 22.0 40.7 32.8 10.4 12.8 68.4 2.9 429.5 0.13 0.09 0.773 4 62.0 24.1 43.8 28.9 10.4 15.5 86.2 3.6 439.1 0.16 0.11 0.773 5 61.0 25.5 43.9 37.6 17.9 16.3 96.2 4.0 378.8 0.15 0.10 0.773 6 67.0 28.4 49.2 35.1 17.7 37.6 221.6 9.2 441.2 0.27 0.17 0.753 7 58.4 32.0 45.3 43.6 22.1 25.7 134.2 5.6 415.7 0.17 0.12 0.743 8 53.4 30.8 45.7 41.8 22.9 0.01 42.2 231.1 9.6 273.3 0.16 0.11 0.753 9 68.5 26.6 49.2 41.7 23.4 34.6 181.6 7.6 316.1 0.23 0.15 0.753 10 56.5 33.4 43.7 46.9 24.0 38.1 175.2 7.3 304.2 0.17 0.11 0.763 11 69.3 24.8 50.5 33.7 17.1 31.4 220.1 9.2 428.0 0.28 0.18 0.743 12 67.0 29.2 52.8 33.3 19.8 0.10 47.7 298.1 12.4 437.1 0.30 0.19 0.703 13 31.4 19.1 27.1 82.6 22.5 0.34 12.4 92.1 3.8 368.3 0.05 0.04 0.773 14 32.8 16.0 25.4 66.4 15.7 13.0 101.7 4.2 343.8 0.06 0.05 0.853 15 44.5 9.8 28.9 46.4 7.8 13.3 75.7 3.2 512.5 0.10 0.08 0.833 16 51.3 23.1 39.1 40.3 16.2 28.5 174.3 7.3 491.7 0.16 0.12 0.793 17 55.3 32.9 44.0 38.1 19.0 34.1 186.3 7.8 325.8 0.19 0.13 0.743 18 45.1 24.6 36.3 47.3 17.7 16.7 91.7 3.8 346.9 0.10 0.08 0.773 19 61.4 22.4 40.0 54.1 21.1 29.7 102.4 4.3 411.3 0.16 0.11 0.813 20 59.6 27.9 44.8 55.0 28.3 0.16 22.9 131.1 5.5 326.8 0.14 0.10 0.813 21 52.1 35.8 42.4 66.9 30.9 0.17 31.6 126.3 5.3 228.7 0.11 0.08 0.813 22 54.3 27.9 41.8 61.9 28.2 15.6 99.3 4.1 530.1 0.13 0.10 0.823 23 44.3 29.6 36.1 84.1 31.6 0.05 16.7 91.3 3.8 198.7 0.06 0.05 0.843 24 36.4 27.4 33.2 90.2 30.8 0.13 14.5 91.9 3.8 76.3 0.03 0.02 0.863 25 32.1 24.8 28.8 86.4 25.3 0.02 10.1 82.0 3.4 121.4 0.03 0.03 0.863 26 44.6 27.2 34.7 77.1 27.9 0.01 11.0 96.9 4.0 272.7 0.07 0.06 0.853 27 65.9 24.3 46.9 45.0 23.1 28.1 151.1 6.3 533.1 0.22 0.16 0.813 28 74.1 38.9 55.5 31.1 23.2 29.3 175.5 7.3 450.3 0.30 0.20 0.75
3 of 13
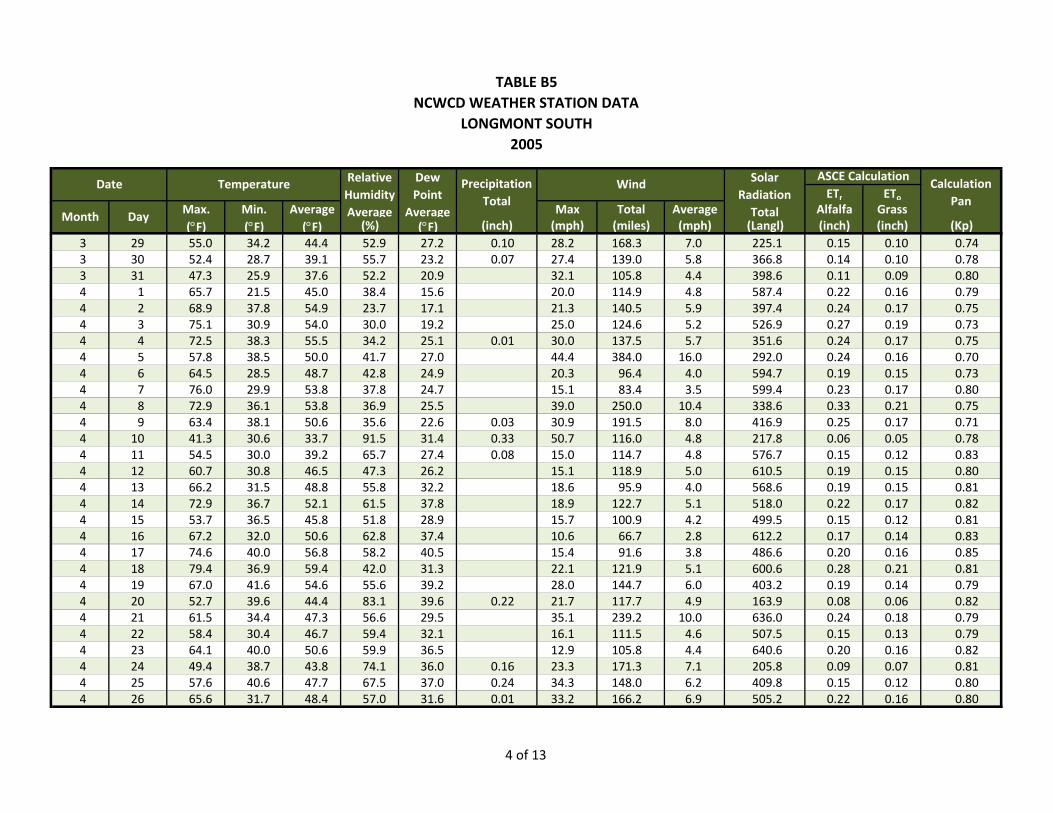
TABLE B5NCWCD WEATHER STATION DATA
LONGMONT SOUTH 2005
ETr EToMax. Min. Average Max Total Average Alfalfa Grass(°F) (°F) (°F) (%) (°F) (inch) (mph) (miles) (mph) (Langl) (inch) (inch) (Kp)
Solar Radiation Total
ASCE CalculationCalculation
PanMonth Day
Date Temperature Relative Humidity Average
Dew Point
Average
Precipitation Total
Wind
3 29 55.0 34.2 44.4 52.9 27.2 0.10 28.2 168.3 7.0 225.1 0.15 0.10 0.743 30 52.4 28.7 39.1 55.7 23.2 0.07 27.4 139.0 5.8 366.8 0.14 0.10 0.783 31 47.3 25.9 37.6 52.2 20.9 32.1 105.8 4.4 398.6 0.11 0.09 0.804 1 65.7 21.5 45.0 38.4 15.6 20.0 114.9 4.8 587.4 0.22 0.16 0.794 2 68.9 37.8 54.9 23.7 17.1 21.3 140.5 5.9 397.4 0.24 0.17 0.754 3 75.1 30.9 54.0 30.0 19.2 25.0 124.6 5.2 526.9 0.27 0.19 0.734 4 72.5 38.3 55.5 34.2 25.1 0.01 30.0 137.5 5.7 351.6 0.24 0.17 0.754 5 57.8 38.5 50.0 41.7 27.0 44.4 384.0 16.0 292.0 0.24 0.16 0.704 6 64.5 28.5 48.7 42.8 24.9 20.3 96.4 4.0 594.7 0.19 0.15 0.734 7 76.0 29.9 53.8 37.8 24.7 15.1 83.4 3.5 599.4 0.23 0.17 0.804 8 72.9 36.1 53.8 36.9 25.5 39.0 250.0 10.4 338.6 0.33 0.21 0.754 9 63.4 38.1 50.6 35.6 22.6 0.03 30.9 191.5 8.0 416.9 0.25 0.17 0.714 10 41.3 30.6 33.7 91.5 31.4 0.33 50.7 116.0 4.8 217.8 0.06 0.05 0.784 11 54.5 30.0 39.2 65.7 27.4 0.08 15.0 114.7 4.8 576.7 0.15 0.12 0.834 12 60.7 30.8 46.5 47.3 26.2 15.1 118.9 5.0 610.5 0.19 0.15 0.804 13 66.2 31.5 48.8 55.8 32.2 18.6 95.9 4.0 568.6 0.19 0.15 0.814 14 72.9 36.7 52.1 61.5 37.8 18.9 122.7 5.1 518.0 0.22 0.17 0.824 15 53.7 36.5 45.8 51.8 28.9 15.7 100.9 4.2 499.5 0.15 0.12 0.814 16 67.2 32.0 50.6 62.8 37.4 10.6 66.7 2.8 612.2 0.17 0.14 0.834 17 74.6 40.0 56.8 58.2 40.5 15.4 91.6 3.8 486.6 0.20 0.16 0.854 18 79.4 36.9 59.4 42.0 31.3 22.1 121.9 5.1 600.6 0.28 0.21 0.814 19 67.0 41.6 54.6 55.6 39.2 28.0 144.7 6.0 403.2 0.19 0.14 0.794 20 52.7 39.6 44.4 83.1 39.6 0.22 21.7 117.7 4.9 163.9 0.08 0.06 0.824 21 61.5 34.4 47.3 56.6 29.5 35.1 239.2 10.0 636.0 0.24 0.18 0.794 22 58.4 30.4 46.7 59.4 32.1 16.1 111.5 4.6 507.5 0.15 0.13 0.794 23 64.1 40.0 50.6 59.9 36.5 12.9 105.8 4.4 640.6 0.20 0.16 0.824 24 49.4 38.7 43.8 74.1 36.0 0.16 23.3 171.3 7.1 205.8 0.09 0.07 0.814 25 57.6 40.6 47.7 67.5 37.0 0.24 34.3 148.0 6.2 409.8 0.15 0.12 0.804 26 65.6 31.7 48.4 57.0 31.6 0.01 33.2 166.2 6.9 505.2 0.22 0.16 0.80
4 of 13
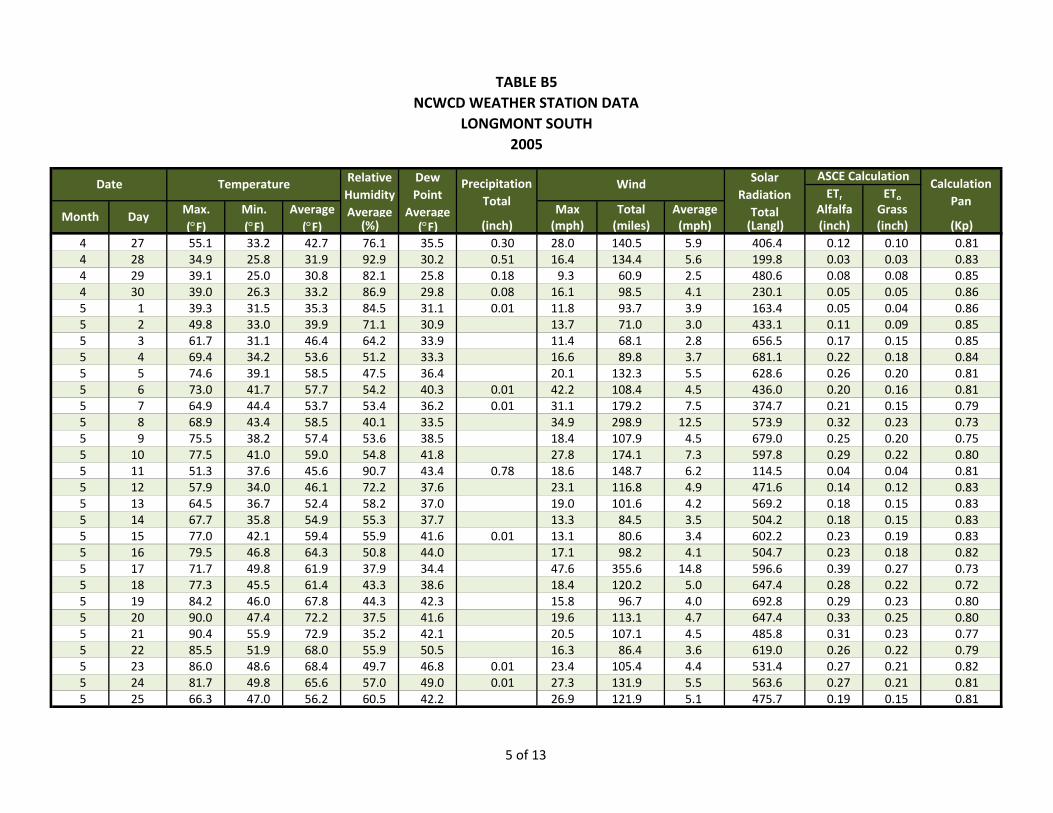
TABLE B5NCWCD WEATHER STATION DATA
LONGMONT SOUTH 2005
ETr EToMax. Min. Average Max Total Average Alfalfa Grass(°F) (°F) (°F) (%) (°F) (inch) (mph) (miles) (mph) (Langl) (inch) (inch) (Kp)
Solar Radiation Total
ASCE CalculationCalculation
PanMonth Day
Date Temperature Relative Humidity Average
Dew Point
Average
Precipitation Total
Wind
4 27 55.1 33.2 42.7 76.1 35.5 0.30 28.0 140.5 5.9 406.4 0.12 0.10 0.814 28 34.9 25.8 31.9 92.9 30.2 0.51 16.4 134.4 5.6 199.8 0.03 0.03 0.834 29 39.1 25.0 30.8 82.1 25.8 0.18 9.3 60.9 2.5 480.6 0.08 0.08 0.854 30 39.0 26.3 33.2 86.9 29.8 0.08 16.1 98.5 4.1 230.1 0.05 0.05 0.865 1 39.3 31.5 35.3 84.5 31.1 0.01 11.8 93.7 3.9 163.4 0.05 0.04 0.865 2 49.8 33.0 39.9 71.1 30.9 13.7 71.0 3.0 433.1 0.11 0.09 0.855 3 61.7 31.1 46.4 64.2 33.9 11.4 68.1 2.8 656.5 0.17 0.15 0.855 4 69.4 34.2 53.6 51.2 33.3 16.6 89.8 3.7 681.1 0.22 0.18 0.845 5 74.6 39.1 58.5 47.5 36.4 20.1 132.3 5.5 628.6 0.26 0.20 0.815 6 73.0 41.7 57.7 54.2 40.3 0.01 42.2 108.4 4.5 436.0 0.20 0.16 0.815 7 64.9 44.4 53.7 53.4 36.2 0.01 31.1 179.2 7.5 374.7 0.21 0.15 0.795 8 68.9 43.4 58.5 40.1 33.5 34.9 298.9 12.5 573.9 0.32 0.23 0.735 9 75.5 38.2 57.4 53.6 38.5 18.4 107.9 4.5 679.0 0.25 0.20 0.755 10 77.5 41.0 59.0 54.8 41.8 27.8 174.1 7.3 597.8 0.29 0.22 0.805 11 51.3 37.6 45.6 90.7 43.4 0.78 18.6 148.7 6.2 114.5 0.04 0.04 0.815 12 57.9 34.0 46.1 72.2 37.6 23.1 116.8 4.9 471.6 0.14 0.12 0.835 13 64.5 36.7 52.4 58.2 37.0 19.0 101.6 4.2 569.2 0.18 0.15 0.835 14 67.7 35.8 54.9 55.3 37.7 13.3 84.5 3.5 504.2 0.18 0.15 0.835 15 77.0 42.1 59.4 55.9 41.6 0.01 13.1 80.6 3.4 602.2 0.23 0.19 0.835 16 79.5 46.8 64.3 50.8 44.0 17.1 98.2 4.1 504.7 0.23 0.18 0.825 17 71.7 49.8 61.9 37.9 34.4 47.6 355.6 14.8 596.6 0.39 0.27 0.735 18 77.3 45.5 61.4 43.3 38.6 18.4 120.2 5.0 647.4 0.28 0.22 0.725 19 84.2 46.0 67.8 44.3 42.3 15.8 96.7 4.0 692.8 0.29 0.23 0.805 20 90.0 47.4 72.2 37.5 41.6 19.6 113.1 4.7 647.4 0.33 0.25 0.805 21 90.4 55.9 72.9 35.2 42.1 20.5 107.1 4.5 485.8 0.31 0.23 0.775 22 85.5 51.9 68.0 55.9 50.5 16.3 86.4 3.6 619.0 0.26 0.22 0.795 23 86.0 48.6 68.4 49.7 46.8 0.01 23.4 105.4 4.4 531.4 0.27 0.21 0.825 24 81.7 49.8 65.6 57.0 49.0 0.01 27.3 131.9 5.5 563.6 0.27 0.21 0.815 25 66.3 47.0 56.2 60.5 42.2 26.9 121.9 5.1 475.7 0.19 0.15 0.81
5 of 13
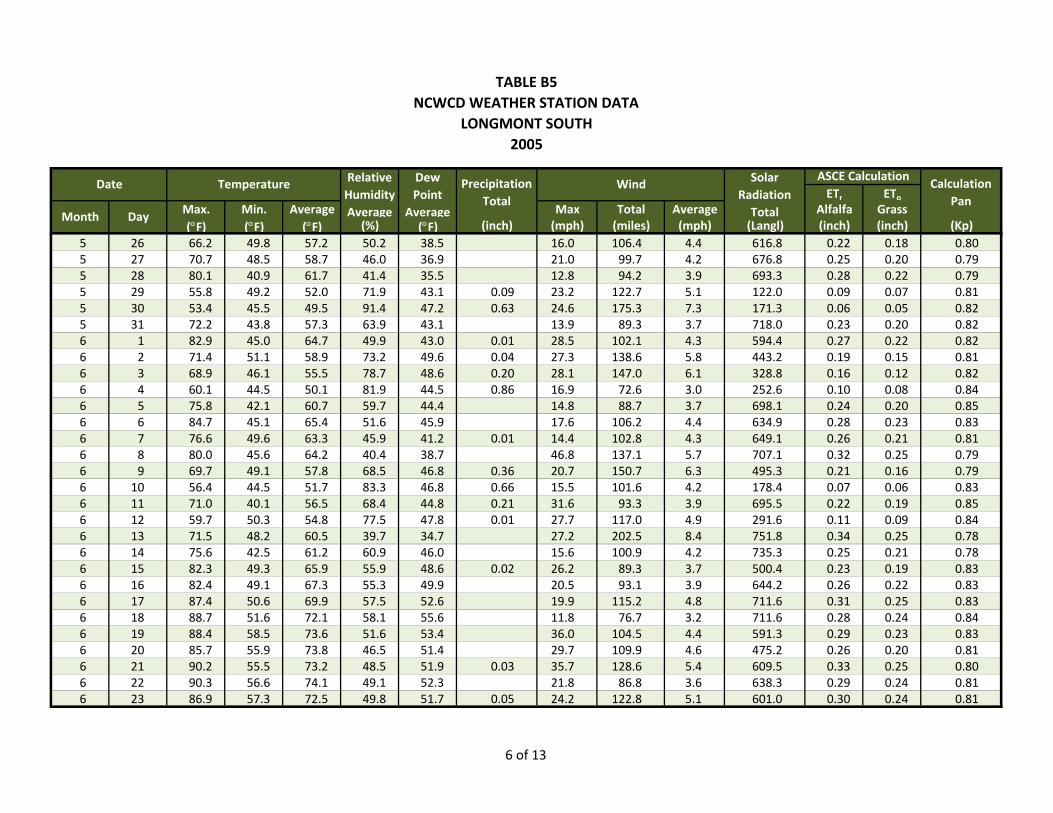
TABLE B5NCWCD WEATHER STATION DATA
LONGMONT SOUTH 2005
ETr EToMax. Min. Average Max Total Average Alfalfa Grass(°F) (°F) (°F) (%) (°F) (inch) (mph) (miles) (mph) (Langl) (inch) (inch) (Kp)
Solar Radiation Total
ASCE CalculationCalculation
PanMonth Day
Date Temperature Relative Humidity Average
Dew Point
Average
Precipitation Total
Wind
5 26 66.2 49.8 57.2 50.2 38.5 16.0 106.4 4.4 616.8 0.22 0.18 0.805 27 70.7 48.5 58.7 46.0 36.9 21.0 99.7 4.2 676.8 0.25 0.20 0.795 28 80.1 40.9 61.7 41.4 35.5 12.8 94.2 3.9 693.3 0.28 0.22 0.795 29 55.8 49.2 52.0 71.9 43.1 0.09 23.2 122.7 5.1 122.0 0.09 0.07 0.815 30 53.4 45.5 49.5 91.4 47.2 0.63 24.6 175.3 7.3 171.3 0.06 0.05 0.825 31 72.2 43.8 57.3 63.9 43.1 13.9 89.3 3.7 718.0 0.23 0.20 0.826 1 82.9 45.0 64.7 49.9 43.0 0.01 28.5 102.1 4.3 594.4 0.27 0.22 0.826 2 71.4 51.1 58.9 73.2 49.6 0.04 27.3 138.6 5.8 443.2 0.19 0.15 0.816 3 68.9 46.1 55.5 78.7 48.6 0.20 28.1 147.0 6.1 328.8 0.16 0.12 0.826 4 60.1 44.5 50.1 81.9 44.5 0.86 16.9 72.6 3.0 252.6 0.10 0.08 0.846 5 75.8 42.1 60.7 59.7 44.4 14.8 88.7 3.7 698.1 0.24 0.20 0.856 6 84.7 45.1 65.4 51.6 45.9 17.6 106.2 4.4 634.9 0.28 0.23 0.836 7 76.6 49.6 63.3 45.9 41.2 0.01 14.4 102.8 4.3 649.1 0.26 0.21 0.816 8 80.0 45.6 64.2 40.4 38.7 46.8 137.1 5.7 707.1 0.32 0.25 0.796 9 69.7 49.1 57.8 68.5 46.8 0.36 20.7 150.7 6.3 495.3 0.21 0.16 0.796 10 56.4 44.5 51.7 83.3 46.8 0.66 15.5 101.6 4.2 178.4 0.07 0.06 0.836 11 71.0 40.1 56.5 68.4 44.8 0.21 31.6 93.3 3.9 695.5 0.22 0.19 0.856 12 59.7 50.3 54.8 77.5 47.8 0.01 27.7 117.0 4.9 291.6 0.11 0.09 0.846 13 71.5 48.2 60.5 39.7 34.7 27.2 202.5 8.4 751.8 0.34 0.25 0.786 14 75.6 42.5 61.2 60.9 46.0 15.6 100.9 4.2 735.3 0.25 0.21 0.786 15 82.3 49.3 65.9 55.9 48.6 0.02 26.2 89.3 3.7 500.4 0.23 0.19 0.836 16 82.4 49.1 67.3 55.3 49.9 20.5 93.1 3.9 644.2 0.26 0.22 0.836 17 87.4 50.6 69.9 57.5 52.6 19.9 115.2 4.8 711.6 0.31 0.25 0.836 18 88.7 51.6 72.1 58.1 55.6 11.8 76.7 3.2 711.6 0.28 0.24 0.846 19 88.4 58.5 73.6 51.6 53.4 36.0 104.5 4.4 591.3 0.29 0.23 0.836 20 85.7 55.9 73.8 46.5 51.4 29.7 109.9 4.6 475.2 0.26 0.20 0.816 21 90.2 55.5 73.2 48.5 51.9 0.03 35.7 128.6 5.4 609.5 0.33 0.25 0.806 22 90.3 56.6 74.1 49.1 52.3 21.8 86.8 3.6 638.3 0.29 0.24 0.816 23 86.9 57.3 72.5 49.8 51.7 0.05 24.2 122.8 5.1 601.0 0.30 0.24 0.81
6 of 13
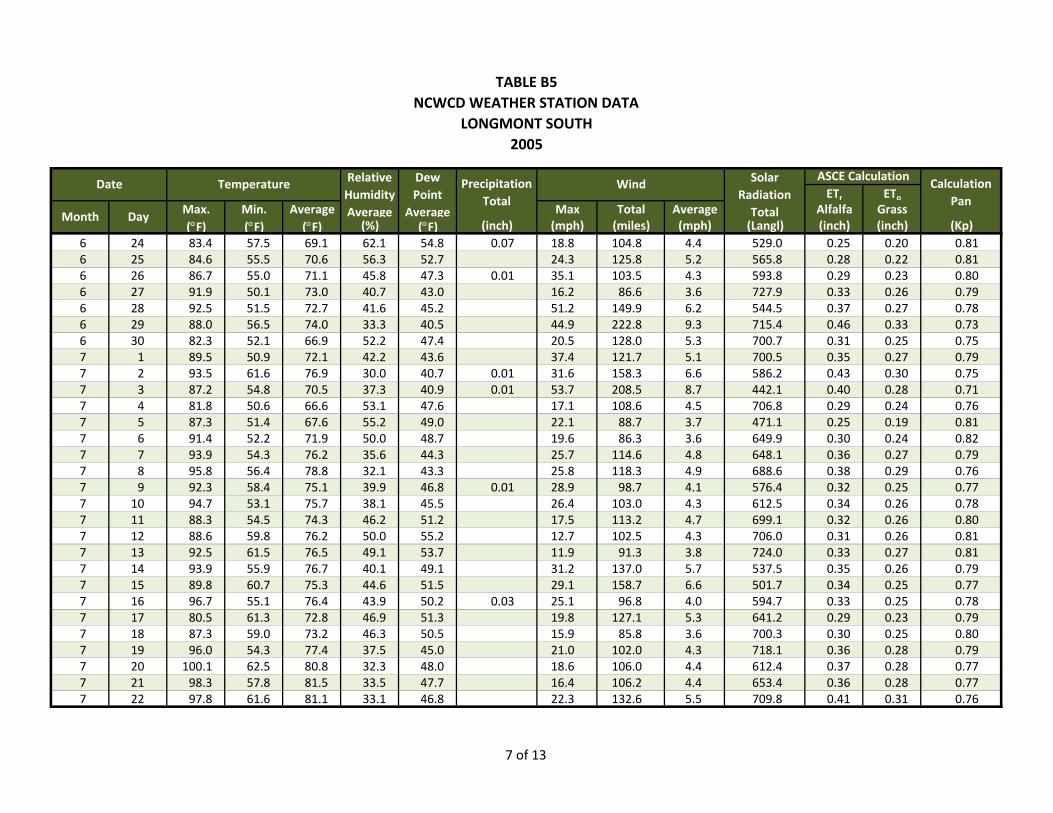
TABLE B5NCWCD WEATHER STATION DATA
LONGMONT SOUTH 2005
ETr EToMax. Min. Average Max Total Average Alfalfa Grass(°F) (°F) (°F) (%) (°F) (inch) (mph) (miles) (mph) (Langl) (inch) (inch) (Kp)
Solar Radiation Total
ASCE CalculationCalculation
PanMonth Day
Date Temperature Relative Humidity Average
Dew Point
Average
Precipitation Total
Wind
6 24 83.4 57.5 69.1 62.1 54.8 0.07 18.8 104.8 4.4 529.0 0.25 0.20 0.816 25 84.6 55.5 70.6 56.3 52.7 24.3 125.8 5.2 565.8 0.28 0.22 0.816 26 86.7 55.0 71.1 45.8 47.3 0.01 35.1 103.5 4.3 593.8 0.29 0.23 0.806 27 91.9 50.1 73.0 40.7 43.0 16.2 86.6 3.6 727.9 0.33 0.26 0.796 28 92.5 51.5 72.7 41.6 45.2 51.2 149.9 6.2 544.5 0.37 0.27 0.786 29 88.0 56.5 74.0 33.3 40.5 44.9 222.8 9.3 715.4 0.46 0.33 0.736 30 82.3 52.1 66.9 52.2 47.4 20.5 128.0 5.3 700.7 0.31 0.25 0.757 1 89.5 50.9 72.1 42.2 43.6 37.4 121.7 5.1 700.5 0.35 0.27 0.797 2 93.5 61.6 76.9 30.0 40.7 0.01 31.6 158.3 6.6 586.2 0.43 0.30 0.757 3 87.2 54.8 70.5 37.3 40.9 0.01 53.7 208.5 8.7 442.1 0.40 0.28 0.717 4 81.8 50.6 66.6 53.1 47.6 17.1 108.6 4.5 706.8 0.29 0.24 0.767 5 87.3 51.4 67.6 55.2 49.0 22.1 88.7 3.7 471.1 0.25 0.19 0.817 6 91.4 52.2 71.9 50.0 48.7 19.6 86.3 3.6 649.9 0.30 0.24 0.827 7 93.9 54.3 76.2 35.6 44.3 25.7 114.6 4.8 648.1 0.36 0.27 0.797 8 95.8 56.4 78.8 32.1 43.3 25.8 118.3 4.9 688.6 0.38 0.29 0.767 9 92.3 58.4 75.1 39.9 46.8 0.01 28.9 98.7 4.1 576.4 0.32 0.25 0.777 10 94.7 53.1 75.7 38.1 45.5 26.4 103.0 4.3 612.5 0.34 0.26 0.787 11 88.3 54.5 74.3 46.2 51.2 17.5 113.2 4.7 699.1 0.32 0.26 0.807 12 88.6 59.8 76.2 50.0 55.2 12.7 102.5 4.3 706.0 0.31 0.26 0.817 13 92.5 61.5 76.5 49.1 53.7 11.9 91.3 3.8 724.0 0.33 0.27 0.817 14 93.9 55.9 76.7 40.1 49.1 31.2 137.0 5.7 537.5 0.35 0.26 0.797 15 89.8 60.7 75.3 44.6 51.5 29.1 158.7 6.6 501.7 0.34 0.25 0.777 16 96.7 55.1 76.4 43.9 50.2 0.03 25.1 96.8 4.0 594.7 0.33 0.25 0.787 17 80.5 61.3 72.8 46.9 51.3 19.8 127.1 5.3 641.2 0.29 0.23 0.797 18 87.3 59.0 73.2 46.3 50.5 15.9 85.8 3.6 700.3 0.30 0.25 0.807 19 96.0 54.3 77.4 37.5 45.0 21.0 102.0 4.3 718.1 0.36 0.28 0.797 20 100.1 62.5 80.8 32.3 48.0 18.6 106.0 4.4 612.4 0.37 0.28 0.777 21 98.3 57.8 81.5 33.5 47.7 16.4 106.2 4.4 653.4 0.36 0.28 0.777 22 97.8 61.6 81.1 33.1 46.8 22.3 132.6 5.5 709.8 0.41 0.31 0.76
7 of 13
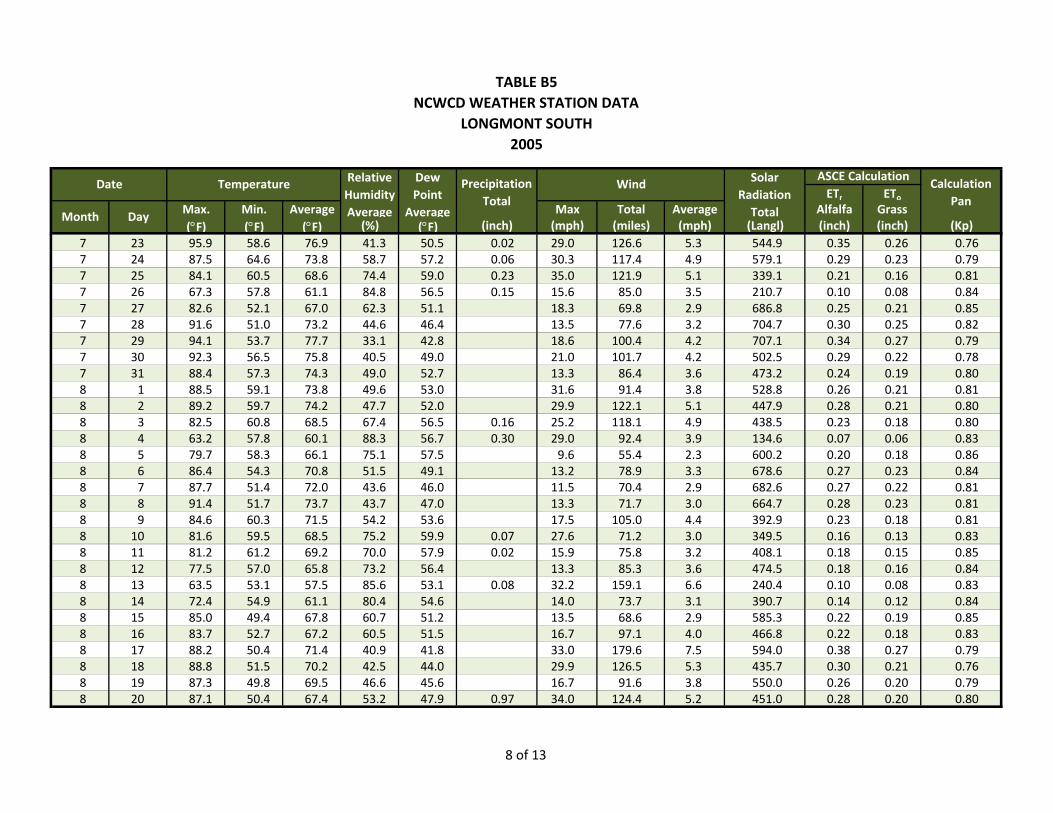
TABLE B5NCWCD WEATHER STATION DATA
LONGMONT SOUTH 2005
ETr EToMax. Min. Average Max Total Average Alfalfa Grass(°F) (°F) (°F) (%) (°F) (inch) (mph) (miles) (mph) (Langl) (inch) (inch) (Kp)
Solar Radiation Total
ASCE CalculationCalculation
PanMonth Day
Date Temperature Relative Humidity Average
Dew Point
Average
Precipitation Total
Wind
7 23 95.9 58.6 76.9 41.3 50.5 0.02 29.0 126.6 5.3 544.9 0.35 0.26 0.767 24 87.5 64.6 73.8 58.7 57.2 0.06 30.3 117.4 4.9 579.1 0.29 0.23 0.797 25 84.1 60.5 68.6 74.4 59.0 0.23 35.0 121.9 5.1 339.1 0.21 0.16 0.817 26 67.3 57.8 61.1 84.8 56.5 0.15 15.6 85.0 3.5 210.7 0.10 0.08 0.847 27 82.6 52.1 67.0 62.3 51.1 18.3 69.8 2.9 686.8 0.25 0.21 0.857 28 91.6 51.0 73.2 44.6 46.4 13.5 77.6 3.2 704.7 0.30 0.25 0.827 29 94.1 53.7 77.7 33.1 42.8 18.6 100.4 4.2 707.1 0.34 0.27 0.797 30 92.3 56.5 75.8 40.5 49.0 21.0 101.7 4.2 502.5 0.29 0.22 0.787 31 88.4 57.3 74.3 49.0 52.7 13.3 86.4 3.6 473.2 0.24 0.19 0.808 1 88.5 59.1 73.8 49.6 53.0 31.6 91.4 3.8 528.8 0.26 0.21 0.818 2 89.2 59.7 74.2 47.7 52.0 29.9 122.1 5.1 447.9 0.28 0.21 0.808 3 82.5 60.8 68.5 67.4 56.5 0.16 25.2 118.1 4.9 438.5 0.23 0.18 0.808 4 63.2 57.8 60.1 88.3 56.7 0.30 29.0 92.4 3.9 134.6 0.07 0.06 0.838 5 79.7 58.3 66.1 75.1 57.5 9.6 55.4 2.3 600.2 0.20 0.18 0.868 6 86.4 54.3 70.8 51.5 49.1 13.2 78.9 3.3 678.6 0.27 0.23 0.848 7 87.7 51.4 72.0 43.6 46.0 11.5 70.4 2.9 682.6 0.27 0.22 0.818 8 91.4 51.7 73.7 43.7 47.0 13.3 71.7 3.0 664.7 0.28 0.23 0.818 9 84.6 60.3 71.5 54.2 53.6 17.5 105.0 4.4 392.9 0.23 0.18 0.818 10 81.6 59.5 68.5 75.2 59.9 0.07 27.6 71.2 3.0 349.5 0.16 0.13 0.838 11 81.2 61.2 69.2 70.0 57.9 0.02 15.9 75.8 3.2 408.1 0.18 0.15 0.858 12 77.5 57.0 65.8 73.2 56.4 13.3 85.3 3.6 474.5 0.18 0.16 0.848 13 63.5 53.1 57.5 85.6 53.1 0.08 32.2 159.1 6.6 240.4 0.10 0.08 0.838 14 72.4 54.9 61.1 80.4 54.6 14.0 73.7 3.1 390.7 0.14 0.12 0.848 15 85.0 49.4 67.8 60.7 51.2 13.5 68.6 2.9 585.3 0.22 0.19 0.858 16 83.7 52.7 67.2 60.5 51.5 16.7 97.1 4.0 466.8 0.22 0.18 0.838 17 88.2 50.4 71.4 40.9 41.8 33.0 179.6 7.5 594.0 0.38 0.27 0.798 18 88.8 51.5 70.2 42.5 44.0 29.9 126.5 5.3 435.7 0.30 0.21 0.768 19 87.3 49.8 69.5 46.6 45.6 16.7 91.6 3.8 550.0 0.26 0.20 0.798 20 87.1 50.4 67.4 53.2 47.9 0.97 34.0 124.4 5.2 451.0 0.28 0.20 0.80
8 of 13

TABLE B5NCWCD WEATHER STATION DATA
LONGMONT SOUTH 2005
ETr EToMax. Min. Average Max Total Average Alfalfa Grass(°F) (°F) (°F) (%) (°F) (inch) (mph) (miles) (mph) (Langl) (inch) (inch) (Kp)
Solar Radiation Total
ASCE CalculationCalculation
PanMonth Day
Date Temperature Relative Humidity Average
Dew Point
Average
Precipitation Total
Wind
8 21 84.3 57.8 68.7 57.1 51.1 0.04 26.4 122.1 5.1 558.5 0.28 0.21 0.808 22 80.4 53.1 66.9 61.9 52.7 0.01 22.6 86.3 3.6 516.7 0.21 0.17 0.818 23 85.2 53.6 65.1 67.2 52.8 0.01 26.8 102.0 4.3 516.1 0.24 0.19 0.838 24 89.2 49.6 71.0 49.3 46.6 13.9 79.9 3.3 605.3 0.26 0.21 0.828 25 87.2 54.8 71.3 41.7 45.4 33.8 155.7 6.5 449.9 0.32 0.22 0.798 26 89.7 51.9 71.0 45.5 45.6 29.7 138.9 5.8 533.3 0.32 0.24 0.778 27 85.4 52.4 68.2 50.2 46.8 24.5 116.1 4.8 426.3 0.26 0.19 0.798 28 87.4 47.0 69.0 42.8 41.1 14.3 78.5 3.3 575.8 0.25 0.20 0.808 29 91.0 50.5 71.8 34.6 38.1 15.1 80.5 3.4 581.6 0.28 0.21 0.798 30 94.1 49.7 75.5 27.7 35.9 24.2 158.7 6.6 580.8 0.40 0.28 0.758 31 74.4 47.5 60.9 42.0 36.2 23.0 135.4 5.6 582.7 0.26 0.20 0.759 1 80.6 42.2 63.6 42.3 38.5 12.3 84.6 3.5 585.0 0.23 0.18 0.799 2 87.9 46.3 69.4 44.3 43.0 15.6 86.5 3.6 587.1 0.26 0.20 0.819 3 90.1 52.2 72.0 37.2 41.9 13.6 99.1 4.1 550.2 0.28 0.21 0.799 4 85.8 57.2 72.7 37.0 43.9 18.1 117.1 4.9 526.5 0.28 0.21 0.779 5 87.3 52.9 70.8 45.7 46.5 0.01 15.8 78.6 3.3 443.0 0.22 0.17 0.799 6 76.2 53.6 65.4 56.5 49.4 0.01 16.4 95.0 4.0 388.6 0.18 0.14 0.819 7 88.6 52.8 69.5 57.5 51.2 14.9 65.9 2.7 545.6 0.22 0.18 0.839 8 86.4 54.1 70.9 54.5 51.9 20.9 101.9 4.2 349.7 0.21 0.16 0.829 9 86.1 59.4 72.1 48.8 50.7 0.02 32.1 111.7 4.7 390.0 0.24 0.18 0.809 10 86.8 56.0 71.8 40.6 44.5 27.1 139.8 5.8 531.0 0.31 0.22 0.789 11 86.7 51.5 70.7 34.3 38.7 20.3 125.2 5.2 517.3 0.29 0.21 0.769 12 83.3 54.3 68.7 31.7 35.3 26.2 120.4 5.0 538.2 0.29 0.21 0.759 13 65.9 48.6 55.8 50.0 36.6 0.04 20.2 177.8 7.4 320.9 0.21 0.15 0.759 14 67.0 43.1 53.9 68.4 43.4 26.2 119.6 5.0 323.1 0.14 0.11 0.799 15 76.6 39.4 59.8 43.1 34.0 20.7 93.6 3.9 532.1 0.22 0.16 0.819 16 80.6 40.0 60.6 41.6 34.6 17.1 87.2 3.6 429.3 0.21 0.16 0.809 17 83.2 40.0 65.2 29.6 29.7 18.5 94.7 3.9 531.6 0.25 0.18 0.799 18 76.7 43.1 61.1 44.7 39.1 12.0 87.2 3.6 463.4 0.19 0.15 0.79
9 of 13
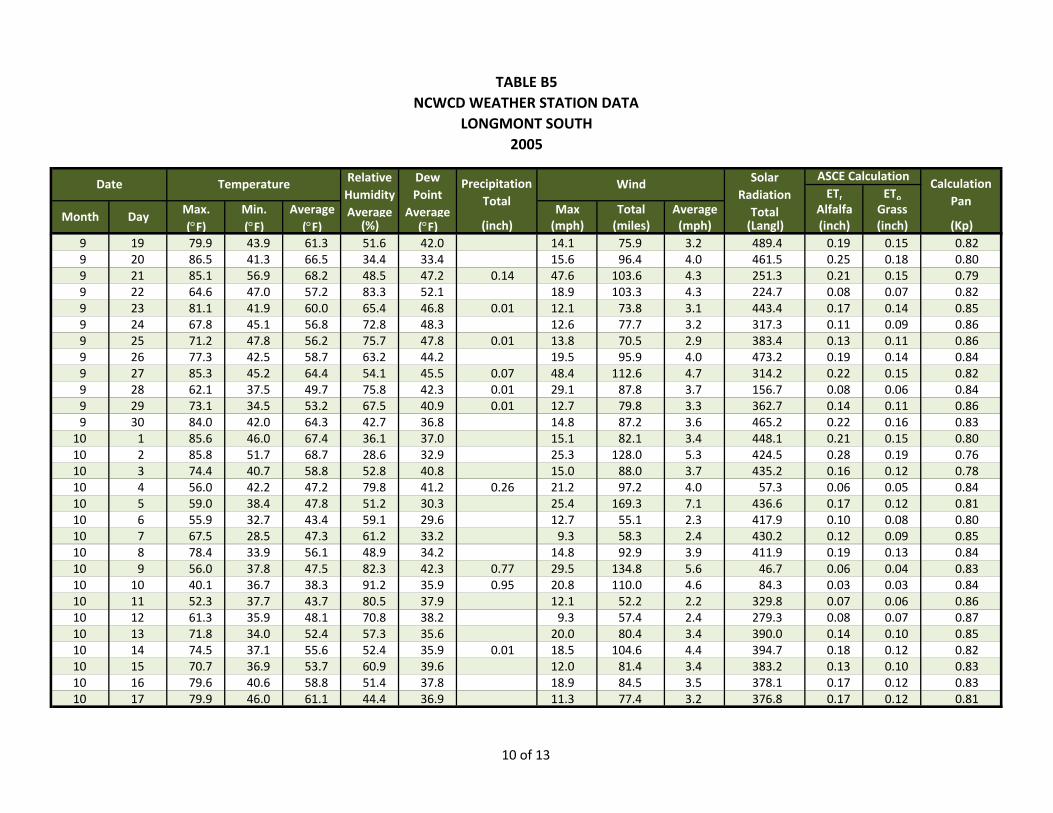
TABLE B5NCWCD WEATHER STATION DATA
LONGMONT SOUTH 2005
ETr EToMax. Min. Average Max Total Average Alfalfa Grass(°F) (°F) (°F) (%) (°F) (inch) (mph) (miles) (mph) (Langl) (inch) (inch) (Kp)
Solar Radiation Total
ASCE CalculationCalculation
PanMonth Day
Date Temperature Relative Humidity Average
Dew Point
Average
Precipitation Total
Wind
9 19 79.9 43.9 61.3 51.6 42.0 14.1 75.9 3.2 489.4 0.19 0.15 0.829 20 86.5 41.3 66.5 34.4 33.4 15.6 96.4 4.0 461.5 0.25 0.18 0.809 21 85.1 56.9 68.2 48.5 47.2 0.14 47.6 103.6 4.3 251.3 0.21 0.15 0.799 22 64.6 47.0 57.2 83.3 52.1 18.9 103.3 4.3 224.7 0.08 0.07 0.829 23 81.1 41.9 60.0 65.4 46.8 0.01 12.1 73.8 3.1 443.4 0.17 0.14 0.859 24 67.8 45.1 56.8 72.8 48.3 12.6 77.7 3.2 317.3 0.11 0.09 0.869 25 71.2 47.8 56.2 75.7 47.8 0.01 13.8 70.5 2.9 383.4 0.13 0.11 0.869 26 77.3 42.5 58.7 63.2 44.2 19.5 95.9 4.0 473.2 0.19 0.14 0.849 27 85.3 45.2 64.4 54.1 45.5 0.07 48.4 112.6 4.7 314.2 0.22 0.15 0.829 28 62.1 37.5 49.7 75.8 42.3 0.01 29.1 87.8 3.7 156.7 0.08 0.06 0.849 29 73.1 34.5 53.2 67.5 40.9 0.01 12.7 79.8 3.3 362.7 0.14 0.11 0.869 30 84.0 42.0 64.3 42.7 36.8 14.8 87.2 3.6 465.2 0.22 0.16 0.8310 1 85.6 46.0 67.4 36.1 37.0 15.1 82.1 3.4 448.1 0.21 0.15 0.8010 2 85.8 51.7 68.7 28.6 32.9 25.3 128.0 5.3 424.5 0.28 0.19 0.7610 3 74.4 40.7 58.8 52.8 40.8 15.0 88.0 3.7 435.2 0.16 0.12 0.7810 4 56.0 42.2 47.2 79.8 41.2 0.26 21.2 97.2 4.0 57.3 0.06 0.05 0.8410 5 59.0 38.4 47.8 51.2 30.3 25.4 169.3 7.1 436.6 0.17 0.12 0.8110 6 55.9 32.7 43.4 59.1 29.6 12.7 55.1 2.3 417.9 0.10 0.08 0.8010 7 67.5 28.5 47.3 61.2 33.2 9.3 58.3 2.4 430.2 0.12 0.09 0.8510 8 78.4 33.9 56.1 48.9 34.2 14.8 92.9 3.9 411.9 0.19 0.13 0.8410 9 56.0 37.8 47.5 82.3 42.3 0.77 29.5 134.8 5.6 46.7 0.06 0.04 0.8310 10 40.1 36.7 38.3 91.2 35.9 0.95 20.8 110.0 4.6 84.3 0.03 0.03 0.8410 11 52.3 37.7 43.7 80.5 37.9 12.1 52.2 2.2 329.8 0.07 0.06 0.8610 12 61.3 35.9 48.1 70.8 38.2 9.3 57.4 2.4 279.3 0.08 0.07 0.8710 13 71.8 34.0 52.4 57.3 35.6 20.0 80.4 3.4 390.0 0.14 0.10 0.8510 14 74.5 37.1 55.6 52.4 35.9 0.01 18.5 104.6 4.4 394.7 0.18 0.12 0.8210 15 70.7 36.9 53.7 60.9 39.6 12.0 81.4 3.4 383.2 0.13 0.10 0.8310 16 79.6 40.6 58.8 51.4 37.8 18.9 84.5 3.5 378.1 0.17 0.12 0.8310 17 79.9 46.0 61.1 44.4 36.9 11.3 77.4 3.2 376.8 0.17 0.12 0.81
10 of 13
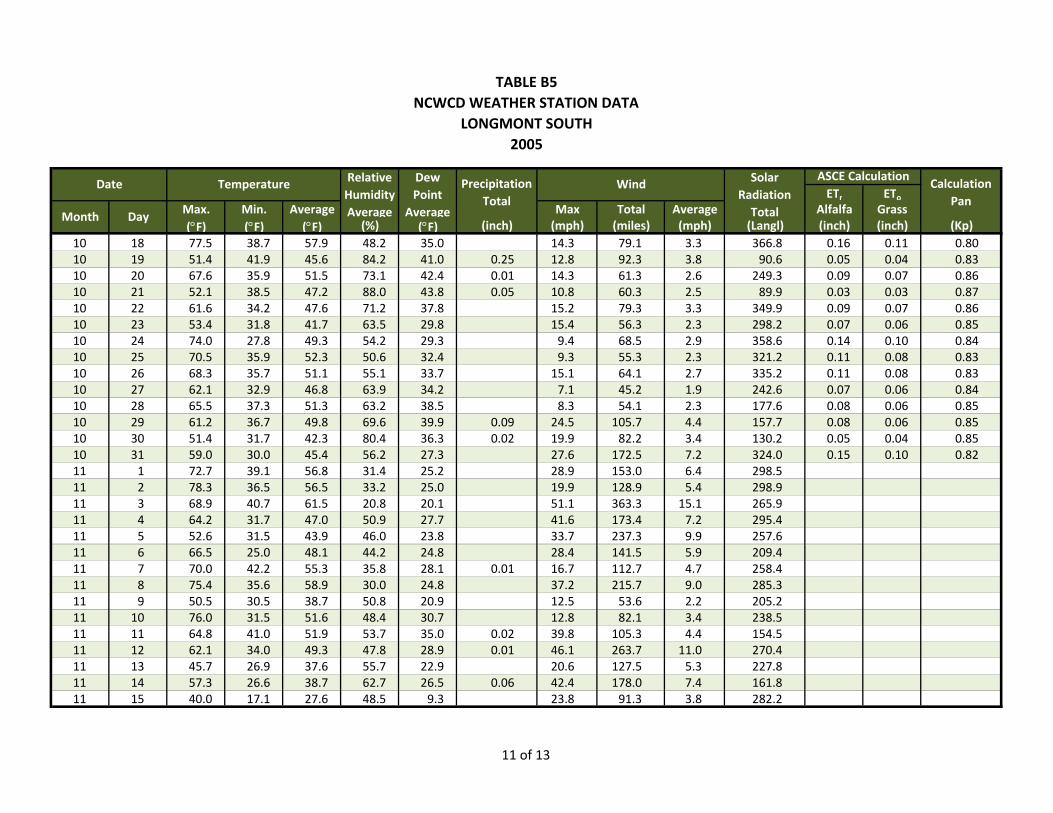
TABLE B5NCWCD WEATHER STATION DATA
LONGMONT SOUTH 2005
ETr EToMax. Min. Average Max Total Average Alfalfa Grass(°F) (°F) (°F) (%) (°F) (inch) (mph) (miles) (mph) (Langl) (inch) (inch) (Kp)
Solar Radiation Total
ASCE CalculationCalculation
PanMonth Day
Date Temperature Relative Humidity Average
Dew Point
Average
Precipitation Total
Wind
10 18 77.5 38.7 57.9 48.2 35.0 14.3 79.1 3.3 366.8 0.16 0.11 0.8010 19 51.4 41.9 45.6 84.2 41.0 0.25 12.8 92.3 3.8 90.6 0.05 0.04 0.8310 20 67.6 35.9 51.5 73.1 42.4 0.01 14.3 61.3 2.6 249.3 0.09 0.07 0.8610 21 52.1 38.5 47.2 88.0 43.8 0.05 10.8 60.3 2.5 89.9 0.03 0.03 0.8710 22 61.6 34.2 47.6 71.2 37.8 15.2 79.3 3.3 349.9 0.09 0.07 0.8610 23 53.4 31.8 41.7 63.5 29.8 15.4 56.3 2.3 298.2 0.07 0.06 0.8510 24 74.0 27.8 49.3 54.2 29.3 9.4 68.5 2.9 358.6 0.14 0.10 0.8410 25 70.5 35.9 52.3 50.6 32.4 9.3 55.3 2.3 321.2 0.11 0.08 0.8310 26 68.3 35.7 51.1 55.1 33.7 15.1 64.1 2.7 335.2 0.11 0.08 0.8310 27 62.1 32.9 46.8 63.9 34.2 7.1 45.2 1.9 242.6 0.07 0.06 0.8410 28 65.5 37.3 51.3 63.2 38.5 8.3 54.1 2.3 177.6 0.08 0.06 0.8510 29 61.2 36.7 49.8 69.6 39.9 0.09 24.5 105.7 4.4 157.7 0.08 0.06 0.8510 30 51.4 31.7 42.3 80.4 36.3 0.02 19.9 82.2 3.4 130.2 0.05 0.04 0.8510 31 59.0 30.0 45.4 56.2 27.3 27.6 172.5 7.2 324.0 0.15 0.10 0.8211 1 72.7 39.1 56.8 31.4 25.2 28.9 153.0 6.4 298.511 2 78.3 36.5 56.5 33.2 25.0 19.9 128.9 5.4 298.911 3 68.9 40.7 61.5 20.8 20.1 51.1 363.3 15.1 265.911 4 64.2 31.7 47.0 50.9 27.7 41.6 173.4 7.2 295.411 5 52.6 31.5 43.9 46.0 23.8 33.7 237.3 9.9 257.611 6 66.5 25.0 48.1 44.2 24.8 28.4 141.5 5.9 209.411 7 70.0 42.2 55.3 35.8 28.1 0.01 16.7 112.7 4.7 258.411 8 75.4 35.6 58.9 30.0 24.8 37.2 215.7 9.0 285.311 9 50.5 30.5 38.7 50.8 20.9 12.5 53.6 2.2 205.211 10 76.0 31.5 51.6 48.4 30.7 12.8 82.1 3.4 238.511 11 64.8 41.0 51.9 53.7 35.0 0.02 39.8 105.3 4.4 154.511 12 62.1 34.0 49.3 47.8 28.9 0.01 46.1 263.7 11.0 270.411 13 45.7 26.9 37.6 55.7 22.9 20.6 127.5 5.3 227.811 14 57.3 26.6 38.7 62.7 26.5 0.06 42.4 178.0 7.4 161.811 15 40.0 17.1 27.6 48.5 9.3 23.8 91.3 3.8 282.2
11 of 13
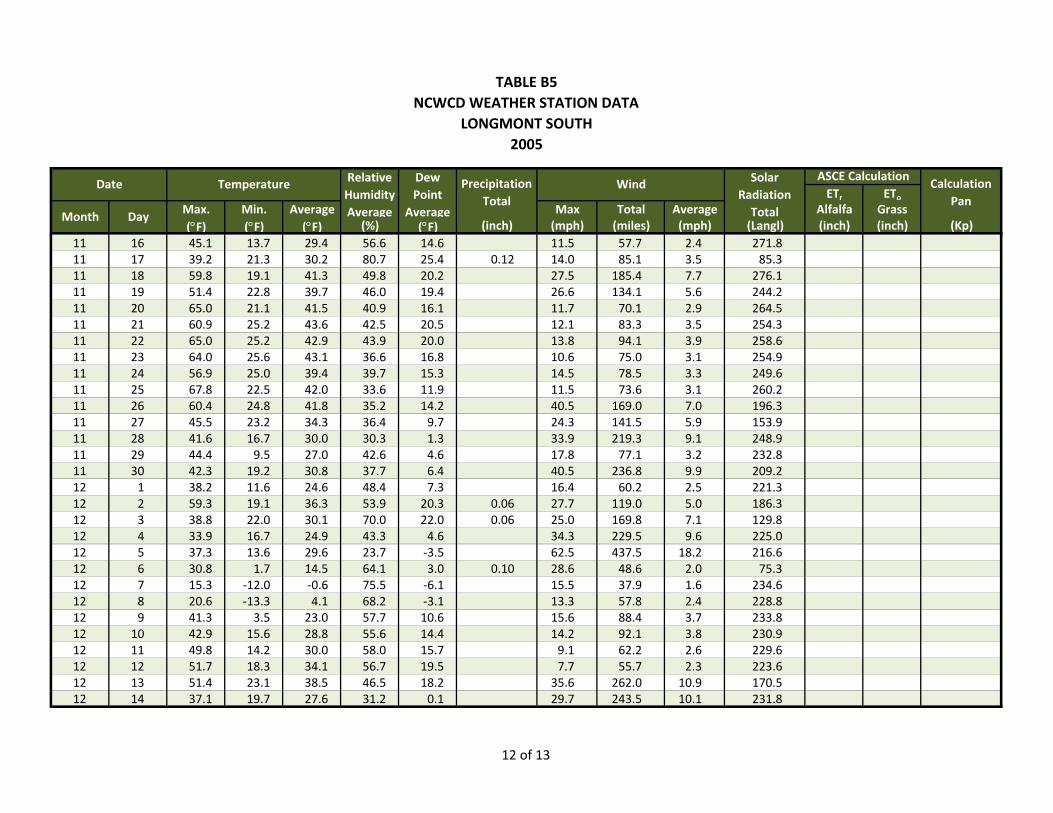
TABLE B5NCWCD WEATHER STATION DATA
LONGMONT SOUTH 2005
ETr EToMax. Min. Average Max Total Average Alfalfa Grass(°F) (°F) (°F) (%) (°F) (inch) (mph) (miles) (mph) (Langl) (inch) (inch) (Kp)
Solar Radiation Total
ASCE CalculationCalculation
PanMonth Day
Date Temperature Relative Humidity Average
Dew Point
Average
Precipitation Total
Wind
11 16 45.1 13.7 29.4 56.6 14.6 11.5 57.7 2.4 271.811 17 39.2 21.3 30.2 80.7 25.4 0.12 14.0 85.1 3.5 85.311 18 59.8 19.1 41.3 49.8 20.2 27.5 185.4 7.7 276.111 19 51.4 22.8 39.7 46.0 19.4 26.6 134.1 5.6 244.211 20 65.0 21.1 41.5 40.9 16.1 11.7 70.1 2.9 264.511 21 60.9 25.2 43.6 42.5 20.5 12.1 83.3 3.5 254.311 22 65.0 25.2 42.9 43.9 20.0 13.8 94.1 3.9 258.611 23 64.0 25.6 43.1 36.6 16.8 10.6 75.0 3.1 254.911 24 56.9 25.0 39.4 39.7 15.3 14.5 78.5 3.3 249.611 25 67.8 22.5 42.0 33.6 11.9 11.5 73.6 3.1 260.211 26 60.4 24.8 41.8 35.2 14.2 40.5 169.0 7.0 196.311 27 45.5 23.2 34.3 36.4 9.7 24.3 141.5 5.9 153.911 28 41.6 16.7 30.0 30.3 1.3 33.9 219.3 9.1 248.911 29 44.4 9.5 27.0 42.6 4.6 17.8 77.1 3.2 232.811 30 42.3 19.2 30.8 37.7 6.4 40.5 236.8 9.9 209.212 1 38.2 11.6 24.6 48.4 7.3 16.4 60.2 2.5 221.312 2 59.3 19.1 36.3 53.9 20.3 0.06 27.7 119.0 5.0 186.312 3 38.8 22.0 30.1 70.0 22.0 0.06 25.0 169.8 7.1 129.812 4 33.9 16.7 24.9 43.3 4.6 34.3 229.5 9.6 225.012 5 37.3 13.6 29.6 23.7 ‐3.5 62.5 437.5 18.2 216.612 6 30.8 1.7 14.5 64.1 3.0 0.10 28.6 48.6 2.0 75.312 7 15.3 ‐12.0 ‐0.6 75.5 ‐6.1 15.5 37.9 1.6 234.612 8 20.6 ‐13.3 4.1 68.2 ‐3.1 13.3 57.8 2.4 228.812 9 41.3 3.5 23.0 57.7 10.6 15.6 88.4 3.7 233.812 10 42.9 15.6 28.8 55.6 14.4 14.2 92.1 3.8 230.912 11 49.8 14.2 30.0 58.0 15.7 9.1 62.2 2.6 229.612 12 51.7 18.3 34.1 56.7 19.5 7.7 55.7 2.3 223.612 13 51.4 23.1 38.5 46.5 18.2 35.6 262.0 10.9 170.512 14 37.1 19.7 27.6 31.2 0.1 29.7 243.5 10.1 231.8
12 of 13
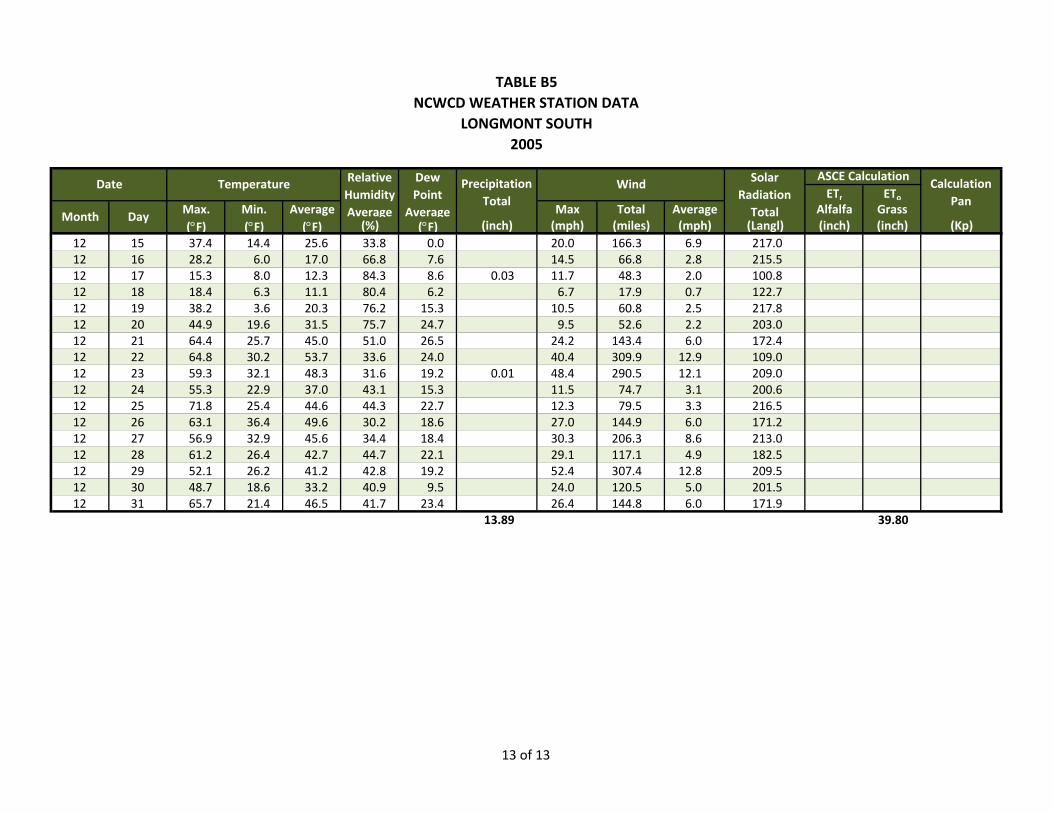
TABLE B5NCWCD WEATHER STATION DATA
LONGMONT SOUTH 2005
ETr EToMax. Min. Average Max Total Average Alfalfa Grass(°F) (°F) (°F) (%) (°F) (inch) (mph) (miles) (mph) (Langl) (inch) (inch) (Kp)
Solar Radiation Total
ASCE CalculationCalculation
PanMonth Day
Date Temperature Relative Humidity Average
Dew Point
Average
Precipitation Total
Wind
12 15 37.4 14.4 25.6 33.8 0.0 20.0 166.3 6.9 217.012 16 28.2 6.0 17.0 66.8 7.6 14.5 66.8 2.8 215.512 17 15.3 8.0 12.3 84.3 8.6 0.03 11.7 48.3 2.0 100.812 18 18.4 6.3 11.1 80.4 6.2 6.7 17.9 0.7 122.712 19 38.2 3.6 20.3 76.2 15.3 10.5 60.8 2.5 217.812 20 44.9 19.6 31.5 75.7 24.7 9.5 52.6 2.2 203.012 21 64.4 25.7 45.0 51.0 26.5 24.2 143.4 6.0 172.412 22 64.8 30.2 53.7 33.6 24.0 40.4 309.9 12.9 109.012 23 59.3 32.1 48.3 31.6 19.2 0.01 48.4 290.5 12.1 209.012 24 55.3 22.9 37.0 43.1 15.3 11.5 74.7 3.1 200.612 25 71.8 25.4 44.6 44.3 22.7 12.3 79.5 3.3 216.512 26 63.1 36.4 49.6 30.2 18.6 27.0 144.9 6.0 171.212 27 56.9 32.9 45.6 34.4 18.4 30.3 206.3 8.6 213.012 28 61.2 26.4 42.7 44.7 22.1 29.1 117.1 4.9 182.512 29 52.1 26.2 41.2 42.8 19.2 52.4 307.4 12.8 209.512 30 48.7 18.6 33.2 40.9 9.5 24.0 120.5 5.0 201.512 31 65.7 21.4 46.5 41.7 23.4 26.4 144.8 6.0 171.9
13.89 39.80
13 of 13
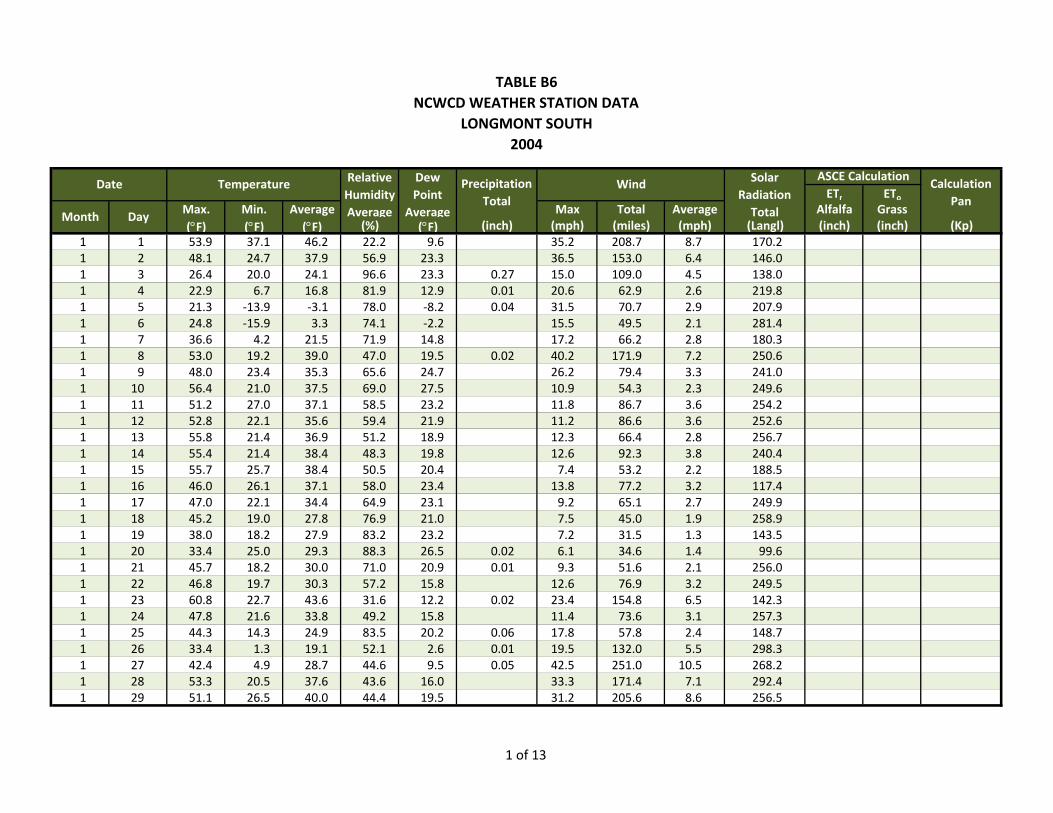
TABLE B6NCWCD WEATHER STATION DATA
LONGMONT SOUTH 2004
ETr EToMax. Min. Average Max Total Average Alfalfa Grass(°F) (°F) (°F) (%) (°F) (inch) (mph) (miles) (mph) (Langl) (inch) (inch) (Kp)
1 1 53.9 37.1 46.2 22.2 9.6 35.2 208.7 8.7 170.21 2 48.1 24.7 37.9 56.9 23.3 36.5 153.0 6.4 146.01 3 26.4 20.0 24.1 96.6 23.3 0.27 15.0 109.0 4.5 138.01 4 22.9 6.7 16.8 81.9 12.9 0.01 20.6 62.9 2.6 219.81 5 21.3 ‐13.9 ‐3.1 78.0 ‐8.2 0.04 31.5 70.7 2.9 207.91 6 24.8 ‐15.9 3.3 74.1 ‐2.2 15.5 49.5 2.1 281.41 7 36.6 4.2 21.5 71.9 14.8 17.2 66.2 2.8 180.31 8 53.0 19.2 39.0 47.0 19.5 0.02 40.2 171.9 7.2 250.61 9 48.0 23.4 35.3 65.6 24.7 26.2 79.4 3.3 241.01 10 56.4 21.0 37.5 69.0 27.5 10.9 54.3 2.3 249.61 11 51.2 27.0 37.1 58.5 23.2 11.8 86.7 3.6 254.21 12 52.8 22.1 35.6 59.4 21.9 11.2 86.6 3.6 252.61 13 55.8 21.4 36.9 51.2 18.9 12.3 66.4 2.8 256.71 14 55.4 21.4 38.4 48.3 19.8 12.6 92.3 3.8 240.41 15 55.7 25.7 38.4 50.5 20.4 7.4 53.2 2.2 188.51 16 46.0 26.1 37.1 58.0 23.4 13.8 77.2 3.2 117.41 17 47.0 22.1 34.4 64.9 23.1 9.2 65.1 2.7 249.91 18 45.2 19.0 27.8 76.9 21.0 7.5 45.0 1.9 258.91 19 38.0 18.2 27.9 83.2 23.2 7.2 31.5 1.3 143.51 20 33.4 25.0 29.3 88.3 26.5 0.02 6.1 34.6 1.4 99.61 21 45.7 18.2 30.0 71.0 20.9 0.01 9.3 51.6 2.1 256.01 22 46.8 19.7 30.3 57.2 15.8 12.6 76.9 3.2 249.51 23 60.8 22.7 43.6 31.6 12.2 0.02 23.4 154.8 6.5 142.31 24 47.8 21.6 33.8 49.2 15.8 11.4 73.6 3.1 257.31 25 44.3 14.3 24.9 83.5 20.2 0.06 17.8 57.8 2.4 148.71 26 33.4 1.3 19.1 52.1 2.6 0.01 19.5 132.0 5.5 298.31 27 42.4 4.9 28.7 44.6 9.5 0.05 42.5 251.0 10.5 268.21 28 53.3 20.5 37.6 43.6 16.0 33.3 171.4 7.1 292.41 29 51.1 26.5 40.0 44.4 19.5 31.2 205.6 8.6 256.5
Solar Radiation Total
ASCE CalculationCalculation
PanMonth Day
Date Temperature Relative Humidity Average
Dew Point
Average
Precipitation Total
Wind
1 of 13
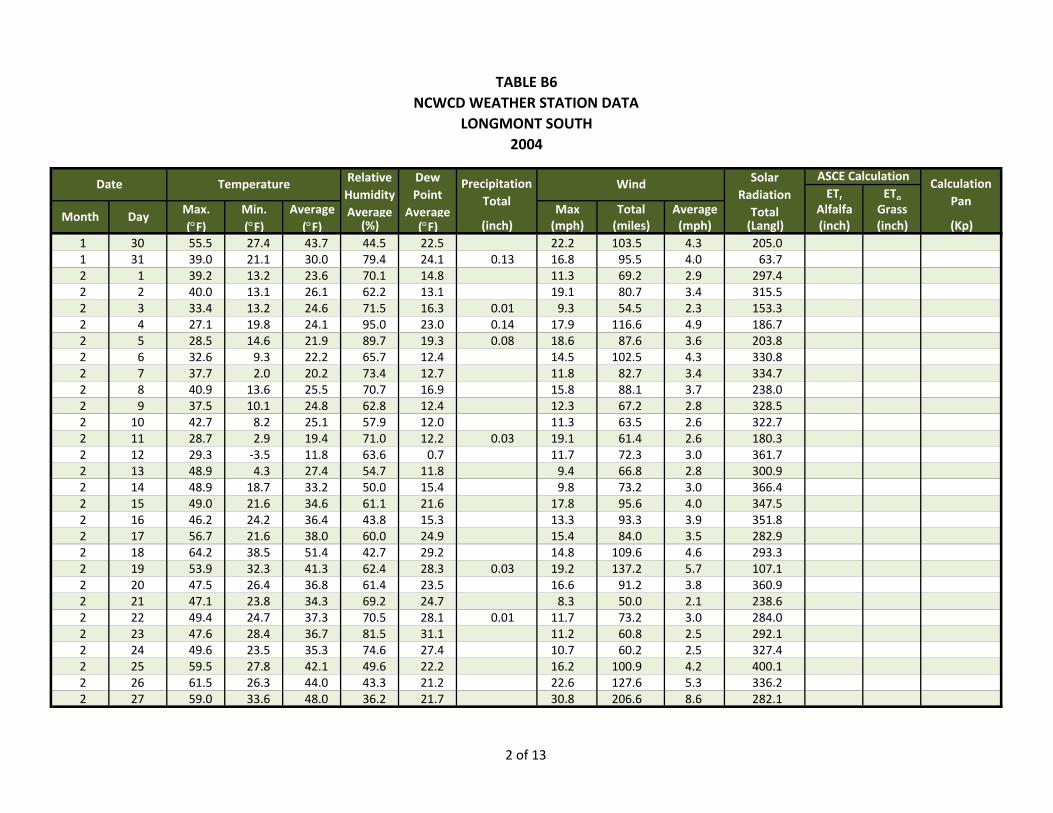
TABLE B6NCWCD WEATHER STATION DATA
LONGMONT SOUTH 2004
ETr EToMax. Min. Average Max Total Average Alfalfa Grass(°F) (°F) (°F) (%) (°F) (inch) (mph) (miles) (mph) (Langl) (inch) (inch) (Kp)
Solar Radiation Total
ASCE CalculationCalculation
PanMonth Day
Date Temperature Relative Humidity Average
Dew Point
Average
Precipitation Total
Wind
1 30 55.5 27.4 43.7 44.5 22.5 22.2 103.5 4.3 205.01 31 39.0 21.1 30.0 79.4 24.1 0.13 16.8 95.5 4.0 63.72 1 39.2 13.2 23.6 70.1 14.8 11.3 69.2 2.9 297.42 2 40.0 13.1 26.1 62.2 13.1 19.1 80.7 3.4 315.52 3 33.4 13.2 24.6 71.5 16.3 0.01 9.3 54.5 2.3 153.32 4 27.1 19.8 24.1 95.0 23.0 0.14 17.9 116.6 4.9 186.72 5 28.5 14.6 21.9 89.7 19.3 0.08 18.6 87.6 3.6 203.82 6 32.6 9.3 22.2 65.7 12.4 14.5 102.5 4.3 330.82 7 37.7 2.0 20.2 73.4 12.7 11.8 82.7 3.4 334.72 8 40.9 13.6 25.5 70.7 16.9 15.8 88.1 3.7 238.02 9 37.5 10.1 24.8 62.8 12.4 12.3 67.2 2.8 328.52 10 42.7 8.2 25.1 57.9 12.0 11.3 63.5 2.6 322.72 11 28.7 2.9 19.4 71.0 12.2 0.03 19.1 61.4 2.6 180.32 12 29.3 ‐3.5 11.8 63.6 0.7 11.7 72.3 3.0 361.72 13 48.9 4.3 27.4 54.7 11.8 9.4 66.8 2.8 300.92 14 48.9 18.7 33.2 50.0 15.4 9.8 73.2 3.0 366.42 15 49.0 21.6 34.6 61.1 21.6 17.8 95.6 4.0 347.52 16 46.2 24.2 36.4 43.8 15.3 13.3 93.3 3.9 351.82 17 56.7 21.6 38.0 60.0 24.9 15.4 84.0 3.5 282.92 18 64.2 38.5 51.4 42.7 29.2 14.8 109.6 4.6 293.32 19 53.9 32.3 41.3 62.4 28.3 0.03 19.2 137.2 5.7 107.12 20 47.5 26.4 36.8 61.4 23.5 16.6 91.2 3.8 360.92 21 47.1 23.8 34.3 69.2 24.7 8.3 50.0 2.1 238.62 22 49.4 24.7 37.3 70.5 28.1 0.01 11.7 73.2 3.0 284.02 23 47.6 28.4 36.7 81.5 31.1 11.2 60.8 2.5 292.12 24 49.6 23.5 35.3 74.6 27.4 10.7 60.2 2.5 327.42 25 59.5 27.8 42.1 49.6 22.2 16.2 100.9 4.2 400.12 26 61.5 26.3 44.0 43.3 21.2 22.6 127.6 5.3 336.22 27 59.0 33.6 48.0 36.2 21.7 30.8 206.6 8.6 282.1
2 of 13
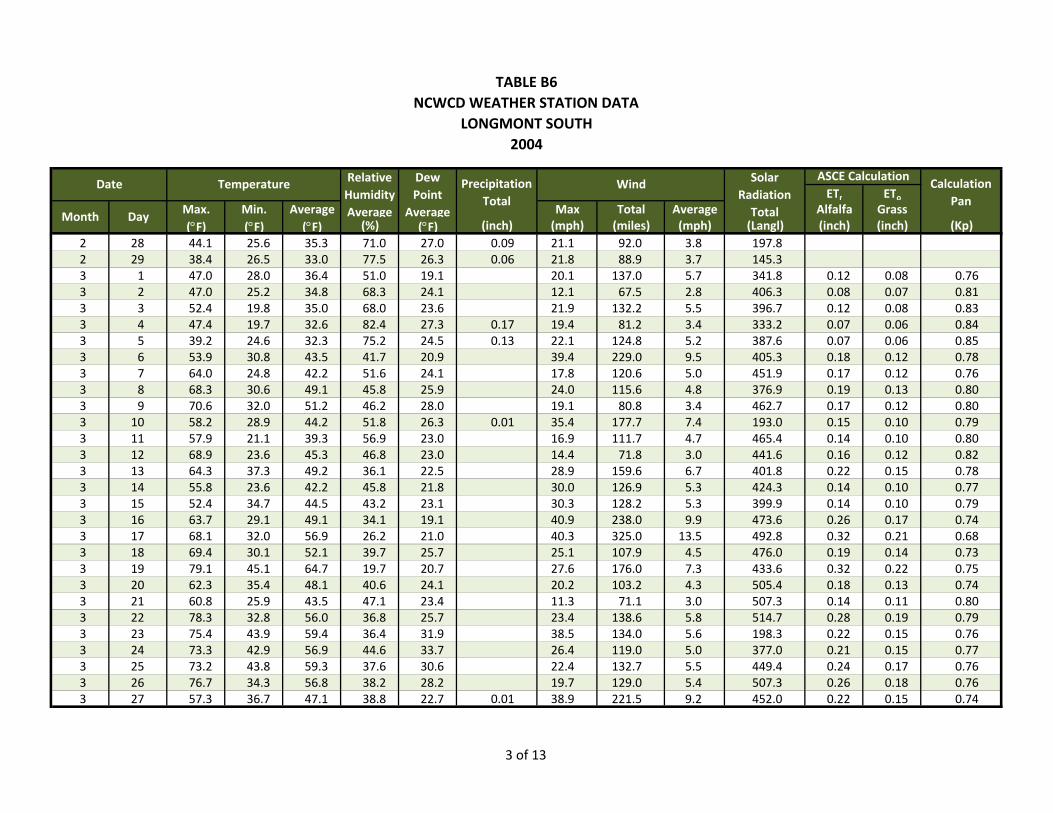
TABLE B6NCWCD WEATHER STATION DATA
LONGMONT SOUTH 2004
ETr EToMax. Min. Average Max Total Average Alfalfa Grass(°F) (°F) (°F) (%) (°F) (inch) (mph) (miles) (mph) (Langl) (inch) (inch) (Kp)
Solar Radiation Total
ASCE CalculationCalculation
PanMonth Day
Date Temperature Relative Humidity Average
Dew Point
Average
Precipitation Total
Wind
2 28 44.1 25.6 35.3 71.0 27.0 0.09 21.1 92.0 3.8 197.82 29 38.4 26.5 33.0 77.5 26.3 0.06 21.8 88.9 3.7 145.33 1 47.0 28.0 36.4 51.0 19.1 20.1 137.0 5.7 341.8 0.12 0.08 0.763 2 47.0 25.2 34.8 68.3 24.1 12.1 67.5 2.8 406.3 0.08 0.07 0.813 3 52.4 19.8 35.0 68.0 23.6 21.9 132.2 5.5 396.7 0.12 0.08 0.833 4 47.4 19.7 32.6 82.4 27.3 0.17 19.4 81.2 3.4 333.2 0.07 0.06 0.843 5 39.2 24.6 32.3 75.2 24.5 0.13 22.1 124.8 5.2 387.6 0.07 0.06 0.853 6 53.9 30.8 43.5 41.7 20.9 39.4 229.0 9.5 405.3 0.18 0.12 0.783 7 64.0 24.8 42.2 51.6 24.1 17.8 120.6 5.0 451.9 0.17 0.12 0.763 8 68.3 30.6 49.1 45.8 25.9 24.0 115.6 4.8 376.9 0.19 0.13 0.803 9 70.6 32.0 51.2 46.2 28.0 19.1 80.8 3.4 462.7 0.17 0.12 0.803 10 58.2 28.9 44.2 51.8 26.3 0.01 35.4 177.7 7.4 193.0 0.15 0.10 0.793 11 57.9 21.1 39.3 56.9 23.0 16.9 111.7 4.7 465.4 0.14 0.10 0.803 12 68.9 23.6 45.3 46.8 23.0 14.4 71.8 3.0 441.6 0.16 0.12 0.823 13 64.3 37.3 49.2 36.1 22.5 28.9 159.6 6.7 401.8 0.22 0.15 0.783 14 55.8 23.6 42.2 45.8 21.8 30.0 126.9 5.3 424.3 0.14 0.10 0.773 15 52.4 34.7 44.5 43.2 23.1 30.3 128.2 5.3 399.9 0.14 0.10 0.793 16 63.7 29.1 49.1 34.1 19.1 40.9 238.0 9.9 473.6 0.26 0.17 0.743 17 68.1 32.0 56.9 26.2 21.0 40.3 325.0 13.5 492.8 0.32 0.21 0.683 18 69.4 30.1 52.1 39.7 25.7 25.1 107.9 4.5 476.0 0.19 0.14 0.733 19 79.1 45.1 64.7 19.7 20.7 27.6 176.0 7.3 433.6 0.32 0.22 0.753 20 62.3 35.4 48.1 40.6 24.1 20.2 103.2 4.3 505.4 0.18 0.13 0.743 21 60.8 25.9 43.5 47.1 23.4 11.3 71.1 3.0 507.3 0.14 0.11 0.803 22 78.3 32.8 56.0 36.8 25.7 23.4 138.6 5.8 514.7 0.28 0.19 0.793 23 75.4 43.9 59.4 36.4 31.9 38.5 134.0 5.6 198.3 0.22 0.15 0.763 24 73.3 42.9 56.9 44.6 33.7 26.4 119.0 5.0 377.0 0.21 0.15 0.773 25 73.2 43.8 59.3 37.6 30.6 22.4 132.7 5.5 449.4 0.24 0.17 0.763 26 76.7 34.3 56.8 38.2 28.2 19.7 129.0 5.4 507.3 0.26 0.18 0.763 27 57.3 36.7 47.1 38.8 22.7 0.01 38.9 221.5 9.2 452.0 0.22 0.15 0.74
3 of 13
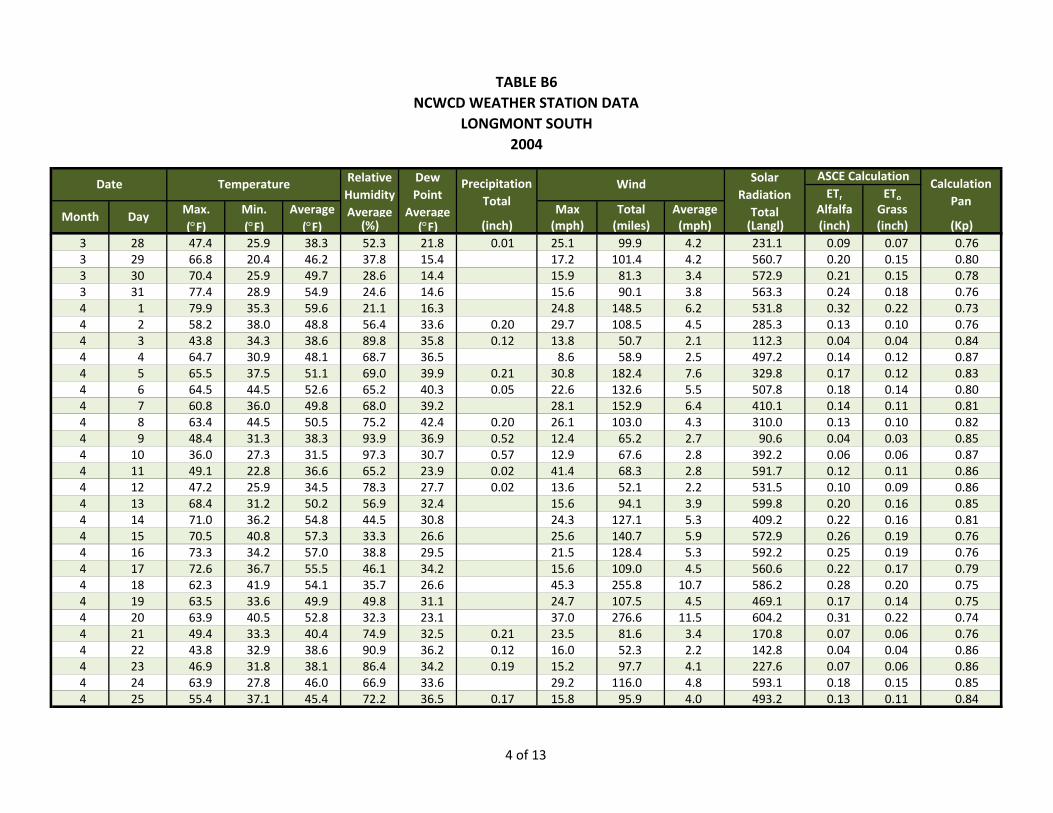
TABLE B6NCWCD WEATHER STATION DATA
LONGMONT SOUTH 2004
ETr EToMax. Min. Average Max Total Average Alfalfa Grass(°F) (°F) (°F) (%) (°F) (inch) (mph) (miles) (mph) (Langl) (inch) (inch) (Kp)
Solar Radiation Total
ASCE CalculationCalculation
PanMonth Day
Date Temperature Relative Humidity Average
Dew Point
Average
Precipitation Total
Wind
3 28 47.4 25.9 38.3 52.3 21.8 0.01 25.1 99.9 4.2 231.1 0.09 0.07 0.763 29 66.8 20.4 46.2 37.8 15.4 17.2 101.4 4.2 560.7 0.20 0.15 0.803 30 70.4 25.9 49.7 28.6 14.4 15.9 81.3 3.4 572.9 0.21 0.15 0.783 31 77.4 28.9 54.9 24.6 14.6 15.6 90.1 3.8 563.3 0.24 0.18 0.764 1 79.9 35.3 59.6 21.1 16.3 24.8 148.5 6.2 531.8 0.32 0.22 0.734 2 58.2 38.0 48.8 56.4 33.6 0.20 29.7 108.5 4.5 285.3 0.13 0.10 0.764 3 43.8 34.3 38.6 89.8 35.8 0.12 13.8 50.7 2.1 112.3 0.04 0.04 0.844 4 64.7 30.9 48.1 68.7 36.5 8.6 58.9 2.5 497.2 0.14 0.12 0.874 5 65.5 37.5 51.1 69.0 39.9 0.21 30.8 182.4 7.6 329.8 0.17 0.12 0.834 6 64.5 44.5 52.6 65.2 40.3 0.05 22.6 132.6 5.5 507.8 0.18 0.14 0.804 7 60.8 36.0 49.8 68.0 39.2 28.1 152.9 6.4 410.1 0.14 0.11 0.814 8 63.4 44.5 50.5 75.2 42.4 0.20 26.1 103.0 4.3 310.0 0.13 0.10 0.824 9 48.4 31.3 38.3 93.9 36.9 0.52 12.4 65.2 2.7 90.6 0.04 0.03 0.854 10 36.0 27.3 31.5 97.3 30.7 0.57 12.9 67.6 2.8 392.2 0.06 0.06 0.874 11 49.1 22.8 36.6 65.2 23.9 0.02 41.4 68.3 2.8 591.7 0.12 0.11 0.864 12 47.2 25.9 34.5 78.3 27.7 0.02 13.6 52.1 2.2 531.5 0.10 0.09 0.864 13 68.4 31.2 50.2 56.9 32.4 15.6 94.1 3.9 599.8 0.20 0.16 0.854 14 71.0 36.2 54.8 44.5 30.8 24.3 127.1 5.3 409.2 0.22 0.16 0.814 15 70.5 40.8 57.3 33.3 26.6 25.6 140.7 5.9 572.9 0.26 0.19 0.764 16 73.3 34.2 57.0 38.8 29.5 21.5 128.4 5.3 592.2 0.25 0.19 0.764 17 72.6 36.7 55.5 46.1 34.2 15.6 109.0 4.5 560.6 0.22 0.17 0.794 18 62.3 41.9 54.1 35.7 26.6 45.3 255.8 10.7 586.2 0.28 0.20 0.754 19 63.5 33.6 49.9 49.8 31.1 24.7 107.5 4.5 469.1 0.17 0.14 0.754 20 63.9 40.5 52.8 32.3 23.1 37.0 276.6 11.5 604.2 0.31 0.22 0.744 21 49.4 33.3 40.4 74.9 32.5 0.21 23.5 81.6 3.4 170.8 0.07 0.06 0.764 22 43.8 32.9 38.6 90.9 36.2 0.12 16.0 52.3 2.2 142.8 0.04 0.04 0.864 23 46.9 31.8 38.1 86.4 34.2 0.19 15.2 97.7 4.1 227.6 0.07 0.06 0.864 24 63.9 27.8 46.0 66.9 33.6 29.2 116.0 4.8 593.1 0.18 0.15 0.854 25 55.4 37.1 45.4 72.2 36.5 0.17 15.8 95.9 4.0 493.2 0.13 0.11 0.84
4 of 13

TABLE B6NCWCD WEATHER STATION DATA
LONGMONT SOUTH 2004
ETr EToMax. Min. Average Max Total Average Alfalfa Grass(°F) (°F) (°F) (%) (°F) (inch) (mph) (miles) (mph) (Langl) (inch) (inch) (Kp)
Solar Radiation Total
ASCE CalculationCalculation
PanMonth Day
Date Temperature Relative Humidity Average
Dew Point
Average
Precipitation Total
Wind
4 26 66.8 34.5 52.6 59.3 37.0 15.2 95.9 4.0 626.3 0.19 0.16 0.844 27 77.7 36.4 59.7 41.9 31.8 31.7 179.3 7.5 637.3 0.32 0.24 0.804 28 76.5 43.3 60.9 32.8 29.7 37.1 154.2 6.4 449.4 0.29 0.21 0.754 29 45.0 31.7 35.9 86.9 32.3 0.05 17.8 109.1 4.5 115.1 0.06 0.04 0.794 30 35.3 31.0 32.7 98.0 32.1 0.38 18.0 65.0 2.7 109.8 0.03 0.03 0.865 1 60.8 29.5 45.5 63.1 32.3 12.7 71.7 3.0 631.2 0.16 0.14 0.865 2 70.2 32.8 54.1 51.6 34.5 16.9 94.6 3.9 630.2 0.21 0.17 0.845 3 79.7 42.0 63.6 41.1 36.5 20.4 119.0 5.0 592.0 0.28 0.21 0.815 4 78.7 48.6 62.4 48.0 41.5 21.8 140.2 5.8 600.4 0.29 0.22 0.785 5 85.9 46.8 68.6 34.8 36.9 20.4 141.0 5.9 662.8 0.35 0.26 0.775 6 86.1 48.6 69.5 28.5 32.4 16.1 92.2 3.8 596.5 0.29 0.22 0.755 7 83.0 44.7 65.8 46.5 40.8 16.2 100.7 4.2 656.0 0.28 0.22 0.785 8 82.1 45.1 65.9 32.9 33.2 16.9 99.4 4.1 617.0 0.28 0.22 0.795 9 82.1 44.3 65.8 32.6 33.6 16.3 104.1 4.3 510.5 0.27 0.20 0.775 10 79.8 42.8 63.2 49.8 44.1 32.1 163.7 6.8 606.5 0.29 0.22 0.785 11 84.5 51.7 66.3 37.0 37.0 41.2 187.1 7.8 539.9 0.39 0.27 0.765 12 54.5 33.6 43.2 72.9 34.2 0.68 22.0 108.3 4.5 173.8 0.09 0.07 0.785 13 42.3 33.2 37.9 90.0 35.2 0.15 11.5 99.2 4.1 164.4 0.05 0.04 0.845 14 62.9 37.9 49.0 70.9 39.1 16.9 57.8 2.4 569.6 0.16 0.14 0.865 15 68.2 38.9 54.9 62.5 41.3 27.4 113.3 4.7 526.8 0.19 0.16 0.855 16 77.3 40.8 60.7 53.6 40.4 30.6 162.6 6.8 628.7 0.29 0.22 0.815 17 68.6 46.7 59.3 66.6 47.7 19.9 137.6 5.7 451.6 0.18 0.14 0.815 18 71.7 53.0 61.1 78.1 53.7 15.7 109.2 4.5 480.9 0.17 0.15 0.835 19 80.6 45.3 63.5 62.1 47.7 22.6 107.4 4.5 587.8 0.25 0.20 0.835 20 72.5 52.2 62.3 62.8 49.3 16.5 124.0 5.2 517.8 0.21 0.17 0.825 21 79.1 50.1 64.8 57.2 46.6 26.0 117.6 4.9 586.6 0.26 0.21 0.815 22 68.0 49.2 58.2 57.0 42.7 0.03 28.0 126.4 5.3 372.2 0.19 0.14 0.805 23 77.2 38.6 60.5 50.3 38.3 17.8 102.9 4.3 618.7 0.25 0.20 0.815 24 67.8 42.7 55.5 60.8 41.7 0.17 18.1 119.8 5.0 512.9 0.19 0.16 0.82
5 of 13
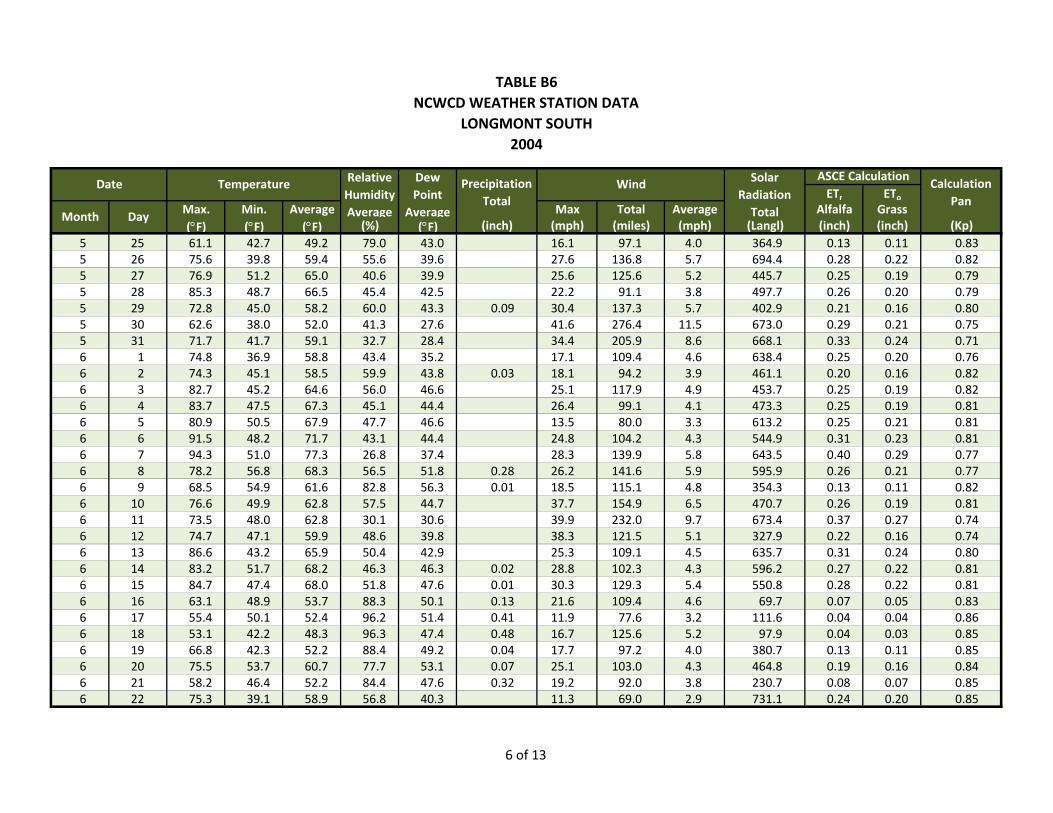
TABLE B6NCWCD WEATHER STATION DATA
LONGMONT SOUTH 2004
ETr EToMax. Min. Average Max Total Average Alfalfa Grass(°F) (°F) (°F) (%) (°F) (inch) (mph) (miles) (mph) (Langl) (inch) (inch) (Kp)
Solar Radiation Total
ASCE CalculationCalculation
PanMonth Day
Date Temperature Relative Humidity Average
Dew Point
Average
Precipitation Total
Wind
5 25 61.1 42.7 49.2 79.0 43.0 16.1 97.1 4.0 364.9 0.13 0.11 0.835 26 75.6 39.8 59.4 55.6 39.6 27.6 136.8 5.7 694.4 0.28 0.22 0.825 27 76.9 51.2 65.0 40.6 39.9 25.6 125.6 5.2 445.7 0.25 0.19 0.795 28 85.3 48.7 66.5 45.4 42.5 22.2 91.1 3.8 497.7 0.26 0.20 0.795 29 72.8 45.0 58.2 60.0 43.3 0.09 30.4 137.3 5.7 402.9 0.21 0.16 0.805 30 62.6 38.0 52.0 41.3 27.6 41.6 276.4 11.5 673.0 0.29 0.21 0.755 31 71.7 41.7 59.1 32.7 28.4 34.4 205.9 8.6 668.1 0.33 0.24 0.716 1 74.8 36.9 58.8 43.4 35.2 17.1 109.4 4.6 638.4 0.25 0.20 0.766 2 74.3 45.1 58.5 59.9 43.8 0.03 18.1 94.2 3.9 461.1 0.20 0.16 0.826 3 82.7 45.2 64.6 56.0 46.6 25.1 117.9 4.9 453.7 0.25 0.19 0.826 4 83.7 47.5 67.3 45.1 44.4 26.4 99.1 4.1 473.3 0.25 0.19 0.816 5 80.9 50.5 67.9 47.7 46.6 13.5 80.0 3.3 613.2 0.25 0.21 0.816 6 91.5 48.2 71.7 43.1 44.4 24.8 104.2 4.3 544.9 0.31 0.23 0.816 7 94.3 51.0 77.3 26.8 37.4 28.3 139.9 5.8 643.5 0.40 0.29 0.776 8 78.2 56.8 68.3 56.5 51.8 0.28 26.2 141.6 5.9 595.9 0.26 0.21 0.776 9 68.5 54.9 61.6 82.8 56.3 0.01 18.5 115.1 4.8 354.3 0.13 0.11 0.826 10 76.6 49.9 62.8 57.5 44.7 37.7 154.9 6.5 470.7 0.26 0.19 0.816 11 73.5 48.0 62.8 30.1 30.6 39.9 232.0 9.7 673.4 0.37 0.27 0.746 12 74.7 47.1 59.9 48.6 39.8 38.3 121.5 5.1 327.9 0.22 0.16 0.746 13 86.6 43.2 65.9 50.4 42.9 25.3 109.1 4.5 635.7 0.31 0.24 0.806 14 83.2 51.7 68.2 46.3 46.3 0.02 28.8 102.3 4.3 596.2 0.27 0.22 0.816 15 84.7 47.4 68.0 51.8 47.6 0.01 30.3 129.3 5.4 550.8 0.28 0.22 0.816 16 63.1 48.9 53.7 88.3 50.1 0.13 21.6 109.4 4.6 69.7 0.07 0.05 0.836 17 55.4 50.1 52.4 96.2 51.4 0.41 11.9 77.6 3.2 111.6 0.04 0.04 0.866 18 53.1 42.2 48.3 96.3 47.4 0.48 16.7 125.6 5.2 97.9 0.04 0.03 0.856 19 66.8 42.3 52.2 88.4 49.2 0.04 17.7 97.2 4.0 380.7 0.13 0.11 0.856 20 75.5 53.7 60.7 77.7 53.1 0.07 25.1 103.0 4.3 464.8 0.19 0.16 0.846 21 58.2 46.4 52.2 84.4 47.6 0.32 19.2 92.0 3.8 230.7 0.08 0.07 0.856 22 75.3 39.1 58.9 56.8 40.3 11.3 69.0 2.9 731.1 0.24 0.20 0.85
6 of 13
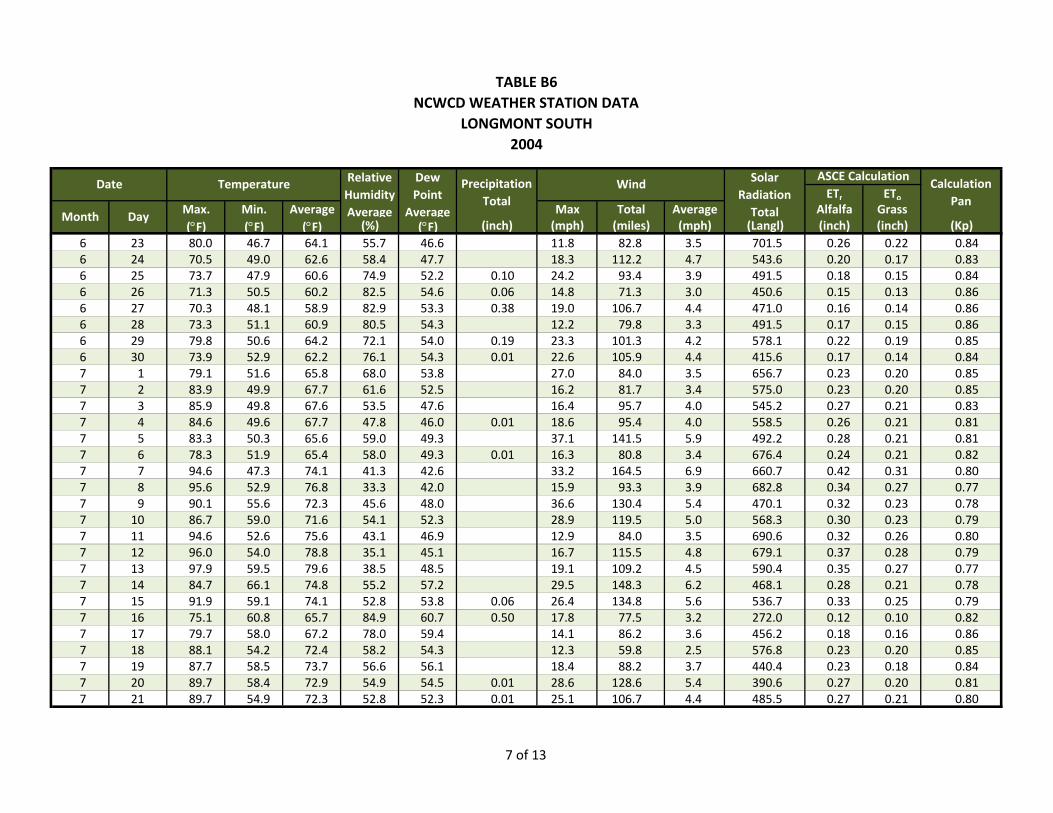
TABLE B6NCWCD WEATHER STATION DATA
LONGMONT SOUTH 2004
ETr EToMax. Min. Average Max Total Average Alfalfa Grass(°F) (°F) (°F) (%) (°F) (inch) (mph) (miles) (mph) (Langl) (inch) (inch) (Kp)
Solar Radiation Total
ASCE CalculationCalculation
PanMonth Day
Date Temperature Relative Humidity Average
Dew Point
Average
Precipitation Total
Wind
6 23 80.0 46.7 64.1 55.7 46.6 11.8 82.8 3.5 701.5 0.26 0.22 0.846 24 70.5 49.0 62.6 58.4 47.7 18.3 112.2 4.7 543.6 0.20 0.17 0.836 25 73.7 47.9 60.6 74.9 52.2 0.10 24.2 93.4 3.9 491.5 0.18 0.15 0.846 26 71.3 50.5 60.2 82.5 54.6 0.06 14.8 71.3 3.0 450.6 0.15 0.13 0.866 27 70.3 48.1 58.9 82.9 53.3 0.38 19.0 106.7 4.4 471.0 0.16 0.14 0.866 28 73.3 51.1 60.9 80.5 54.3 12.2 79.8 3.3 491.5 0.17 0.15 0.866 29 79.8 50.6 64.2 72.1 54.0 0.19 23.3 101.3 4.2 578.1 0.22 0.19 0.856 30 73.9 52.9 62.2 76.1 54.3 0.01 22.6 105.9 4.4 415.6 0.17 0.14 0.847 1 79.1 51.6 65.8 68.0 53.8 27.0 84.0 3.5 656.7 0.23 0.20 0.857 2 83.9 49.9 67.7 61.6 52.5 16.2 81.7 3.4 575.0 0.23 0.20 0.857 3 85.9 49.8 67.6 53.5 47.6 16.4 95.7 4.0 545.2 0.27 0.21 0.837 4 84.6 49.6 67.7 47.8 46.0 0.01 18.6 95.4 4.0 558.5 0.26 0.21 0.817 5 83.3 50.3 65.6 59.0 49.3 37.1 141.5 5.9 492.2 0.28 0.21 0.817 6 78.3 51.9 65.4 58.0 49.3 0.01 16.3 80.8 3.4 676.4 0.24 0.21 0.827 7 94.6 47.3 74.1 41.3 42.6 33.2 164.5 6.9 660.7 0.42 0.31 0.807 8 95.6 52.9 76.8 33.3 42.0 15.9 93.3 3.9 682.8 0.34 0.27 0.777 9 90.1 55.6 72.3 45.6 48.0 36.6 130.4 5.4 470.1 0.32 0.23 0.787 10 86.7 59.0 71.6 54.1 52.3 28.9 119.5 5.0 568.3 0.30 0.23 0.797 11 94.6 52.6 75.6 43.1 46.9 12.9 84.0 3.5 690.6 0.32 0.26 0.807 12 96.0 54.0 78.8 35.1 45.1 16.7 115.5 4.8 679.1 0.37 0.28 0.797 13 97.9 59.5 79.6 38.5 48.5 19.1 109.2 4.5 590.4 0.35 0.27 0.777 14 84.7 66.1 74.8 55.2 57.2 29.5 148.3 6.2 468.1 0.28 0.21 0.787 15 91.9 59.1 74.1 52.8 53.8 0.06 26.4 134.8 5.6 536.7 0.33 0.25 0.797 16 75.1 60.8 65.7 84.9 60.7 0.50 17.8 77.5 3.2 272.0 0.12 0.10 0.827 17 79.7 58.0 67.2 78.0 59.4 14.1 86.2 3.6 456.2 0.18 0.16 0.867 18 88.1 54.2 72.4 58.2 54.3 12.3 59.8 2.5 576.8 0.23 0.20 0.857 19 87.7 58.5 73.7 56.6 56.1 18.4 88.2 3.7 440.4 0.23 0.18 0.847 20 89.7 58.4 72.9 54.9 54.5 0.01 28.6 128.6 5.4 390.6 0.27 0.20 0.817 21 89.7 54.9 72.3 52.8 52.3 0.01 25.1 106.7 4.4 485.5 0.27 0.21 0.80
7 of 13
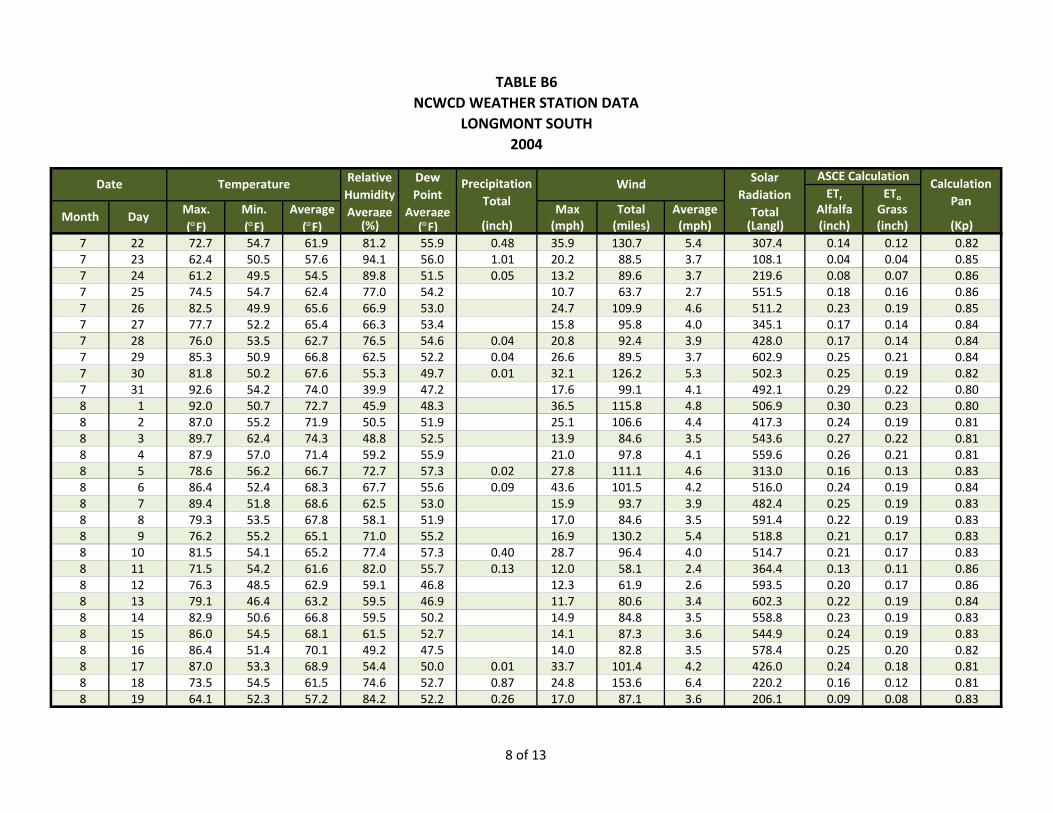
TABLE B6NCWCD WEATHER STATION DATA
LONGMONT SOUTH 2004
ETr EToMax. Min. Average Max Total Average Alfalfa Grass(°F) (°F) (°F) (%) (°F) (inch) (mph) (miles) (mph) (Langl) (inch) (inch) (Kp)
Solar Radiation Total
ASCE CalculationCalculation
PanMonth Day
Date Temperature Relative Humidity Average
Dew Point
Average
Precipitation Total
Wind
7 22 72.7 54.7 61.9 81.2 55.9 0.48 35.9 130.7 5.4 307.4 0.14 0.12 0.827 23 62.4 50.5 57.6 94.1 56.0 1.01 20.2 88.5 3.7 108.1 0.04 0.04 0.857 24 61.2 49.5 54.5 89.8 51.5 0.05 13.2 89.6 3.7 219.6 0.08 0.07 0.867 25 74.5 54.7 62.4 77.0 54.2 10.7 63.7 2.7 551.5 0.18 0.16 0.867 26 82.5 49.9 65.6 66.9 53.0 24.7 109.9 4.6 511.2 0.23 0.19 0.857 27 77.7 52.2 65.4 66.3 53.4 15.8 95.8 4.0 345.1 0.17 0.14 0.847 28 76.0 53.5 62.7 76.5 54.6 0.04 20.8 92.4 3.9 428.0 0.17 0.14 0.847 29 85.3 50.9 66.8 62.5 52.2 0.04 26.6 89.5 3.7 602.9 0.25 0.21 0.847 30 81.8 50.2 67.6 55.3 49.7 0.01 32.1 126.2 5.3 502.3 0.25 0.19 0.827 31 92.6 54.2 74.0 39.9 47.2 17.6 99.1 4.1 492.1 0.29 0.22 0.808 1 92.0 50.7 72.7 45.9 48.3 36.5 115.8 4.8 506.9 0.30 0.23 0.808 2 87.0 55.2 71.9 50.5 51.9 25.1 106.6 4.4 417.3 0.24 0.19 0.818 3 89.7 62.4 74.3 48.8 52.5 13.9 84.6 3.5 543.6 0.27 0.22 0.818 4 87.9 57.0 71.4 59.2 55.9 21.0 97.8 4.1 559.6 0.26 0.21 0.818 5 78.6 56.2 66.7 72.7 57.3 0.02 27.8 111.1 4.6 313.0 0.16 0.13 0.838 6 86.4 52.4 68.3 67.7 55.6 0.09 43.6 101.5 4.2 516.0 0.24 0.19 0.848 7 89.4 51.8 68.6 62.5 53.0 15.9 93.7 3.9 482.4 0.25 0.19 0.838 8 79.3 53.5 67.8 58.1 51.9 17.0 84.6 3.5 591.4 0.22 0.19 0.838 9 76.2 55.2 65.1 71.0 55.2 16.9 130.2 5.4 518.8 0.21 0.17 0.838 10 81.5 54.1 65.2 77.4 57.3 0.40 28.7 96.4 4.0 514.7 0.21 0.17 0.838 11 71.5 54.2 61.6 82.0 55.7 0.13 12.0 58.1 2.4 364.4 0.13 0.11 0.868 12 76.3 48.5 62.9 59.1 46.8 12.3 61.9 2.6 593.5 0.20 0.17 0.868 13 79.1 46.4 63.2 59.5 46.9 11.7 80.6 3.4 602.3 0.22 0.19 0.848 14 82.9 50.6 66.8 59.5 50.2 14.9 84.8 3.5 558.8 0.23 0.19 0.838 15 86.0 54.5 68.1 61.5 52.7 14.1 87.3 3.6 544.9 0.24 0.19 0.838 16 86.4 51.4 70.1 49.2 47.5 14.0 82.8 3.5 578.4 0.25 0.20 0.828 17 87.0 53.3 68.9 54.4 50.0 0.01 33.7 101.4 4.2 426.0 0.24 0.18 0.818 18 73.5 54.5 61.5 74.6 52.7 0.87 24.8 153.6 6.4 220.2 0.16 0.12 0.818 19 64.1 52.3 57.2 84.2 52.2 0.26 17.0 87.1 3.6 206.1 0.09 0.08 0.83
8 of 13
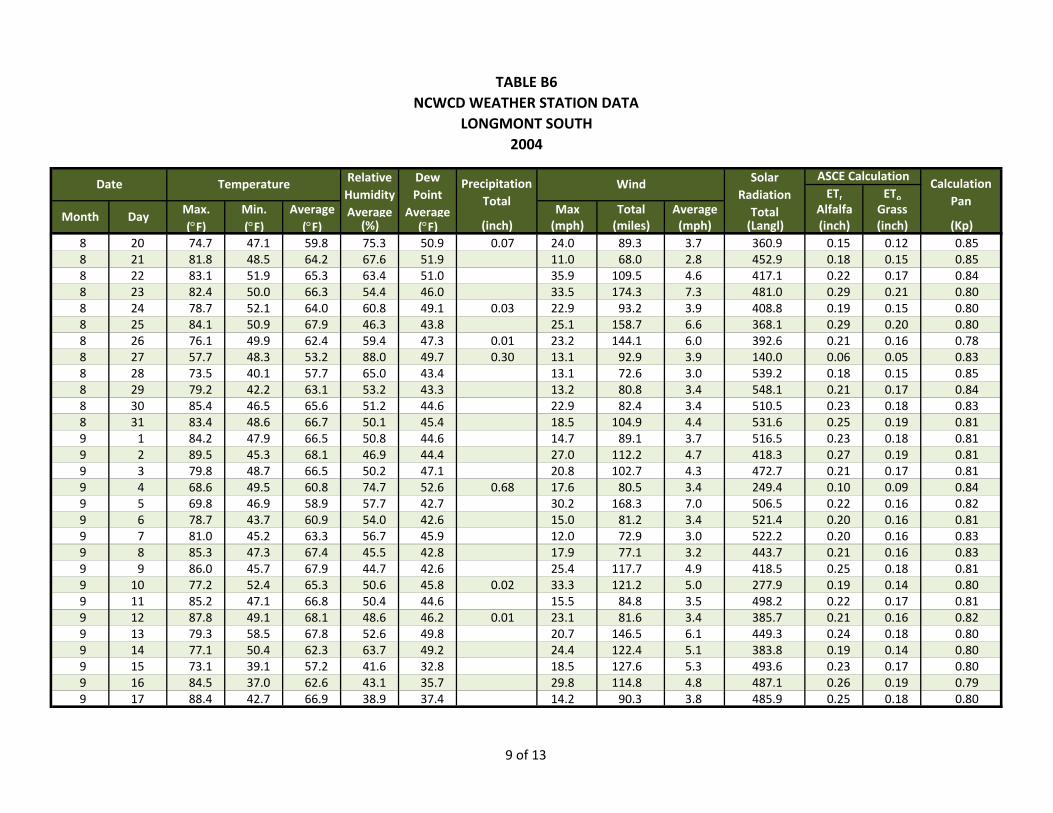
TABLE B6NCWCD WEATHER STATION DATA
LONGMONT SOUTH 2004
ETr EToMax. Min. Average Max Total Average Alfalfa Grass(°F) (°F) (°F) (%) (°F) (inch) (mph) (miles) (mph) (Langl) (inch) (inch) (Kp)
Solar Radiation Total
ASCE CalculationCalculation
PanMonth Day
Date Temperature Relative Humidity Average
Dew Point
Average
Precipitation Total
Wind
8 20 74.7 47.1 59.8 75.3 50.9 0.07 24.0 89.3 3.7 360.9 0.15 0.12 0.858 21 81.8 48.5 64.2 67.6 51.9 11.0 68.0 2.8 452.9 0.18 0.15 0.858 22 83.1 51.9 65.3 63.4 51.0 35.9 109.5 4.6 417.1 0.22 0.17 0.848 23 82.4 50.0 66.3 54.4 46.0 33.5 174.3 7.3 481.0 0.29 0.21 0.808 24 78.7 52.1 64.0 60.8 49.1 0.03 22.9 93.2 3.9 408.8 0.19 0.15 0.808 25 84.1 50.9 67.9 46.3 43.8 25.1 158.7 6.6 368.1 0.29 0.20 0.808 26 76.1 49.9 62.4 59.4 47.3 0.01 23.2 144.1 6.0 392.6 0.21 0.16 0.788 27 57.7 48.3 53.2 88.0 49.7 0.30 13.1 92.9 3.9 140.0 0.06 0.05 0.838 28 73.5 40.1 57.7 65.0 43.4 13.1 72.6 3.0 539.2 0.18 0.15 0.858 29 79.2 42.2 63.1 53.2 43.3 13.2 80.8 3.4 548.1 0.21 0.17 0.848 30 85.4 46.5 65.6 51.2 44.6 22.9 82.4 3.4 510.5 0.23 0.18 0.838 31 83.4 48.6 66.7 50.1 45.4 18.5 104.9 4.4 531.6 0.25 0.19 0.819 1 84.2 47.9 66.5 50.8 44.6 14.7 89.1 3.7 516.5 0.23 0.18 0.819 2 89.5 45.3 68.1 46.9 44.4 27.0 112.2 4.7 418.3 0.27 0.19 0.819 3 79.8 48.7 66.5 50.2 47.1 20.8 102.7 4.3 472.7 0.21 0.17 0.819 4 68.6 49.5 60.8 74.7 52.6 0.68 17.6 80.5 3.4 249.4 0.10 0.09 0.849 5 69.8 46.9 58.9 57.7 42.7 30.2 168.3 7.0 506.5 0.22 0.16 0.829 6 78.7 43.7 60.9 54.0 42.6 15.0 81.2 3.4 521.4 0.20 0.16 0.819 7 81.0 45.2 63.3 56.7 45.9 12.0 72.9 3.0 522.2 0.20 0.16 0.839 8 85.3 47.3 67.4 45.5 42.8 17.9 77.1 3.2 443.7 0.21 0.16 0.839 9 86.0 45.7 67.9 44.7 42.6 25.4 117.7 4.9 418.5 0.25 0.18 0.819 10 77.2 52.4 65.3 50.6 45.8 0.02 33.3 121.2 5.0 277.9 0.19 0.14 0.809 11 85.2 47.1 66.8 50.4 44.6 15.5 84.8 3.5 498.2 0.22 0.17 0.819 12 87.8 49.1 68.1 48.6 46.2 0.01 23.1 81.6 3.4 385.7 0.21 0.16 0.829 13 79.3 58.5 67.8 52.6 49.8 20.7 146.5 6.1 449.3 0.24 0.18 0.809 14 77.1 50.4 62.3 63.7 49.2 24.4 122.4 5.1 383.8 0.19 0.14 0.809 15 73.1 39.1 57.2 41.6 32.8 18.5 127.6 5.3 493.6 0.23 0.17 0.809 16 84.5 37.0 62.6 43.1 35.7 29.8 114.8 4.8 487.1 0.26 0.19 0.799 17 88.4 42.7 66.9 38.9 37.4 14.2 90.3 3.8 485.9 0.25 0.18 0.80
9 of 13
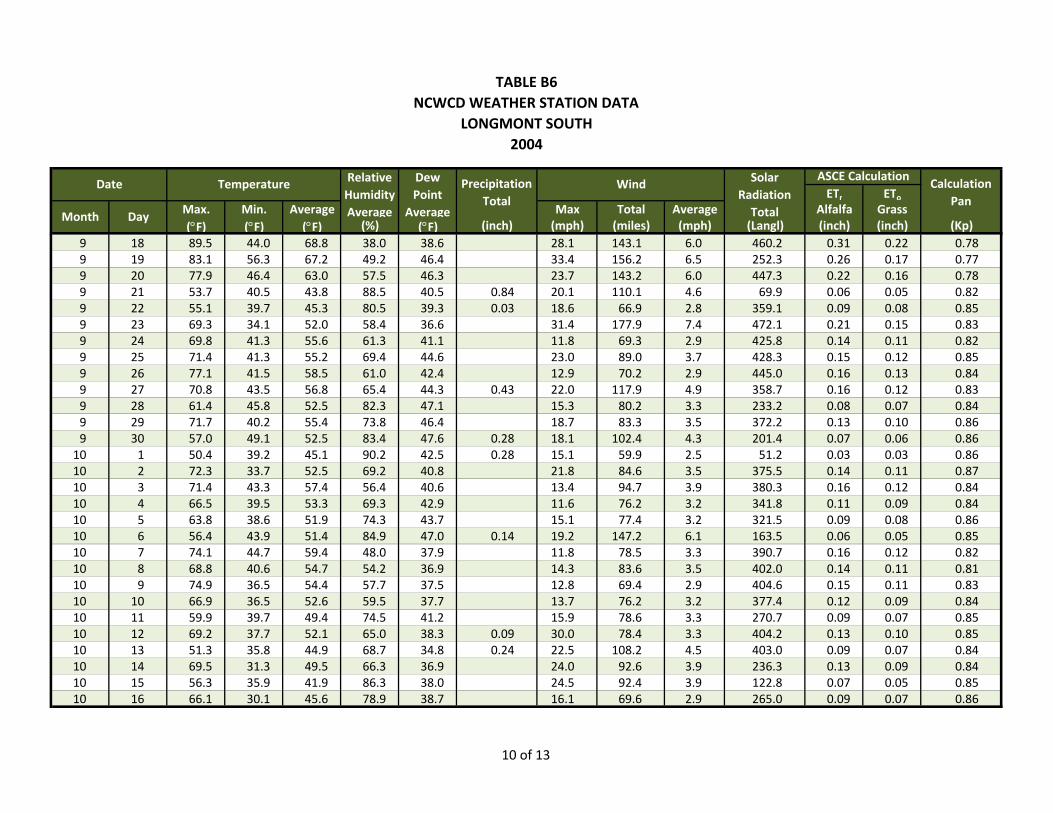
TABLE B6NCWCD WEATHER STATION DATA
LONGMONT SOUTH 2004
ETr EToMax. Min. Average Max Total Average Alfalfa Grass(°F) (°F) (°F) (%) (°F) (inch) (mph) (miles) (mph) (Langl) (inch) (inch) (Kp)
Solar Radiation Total
ASCE CalculationCalculation
PanMonth Day
Date Temperature Relative Humidity Average
Dew Point
Average
Precipitation Total
Wind
9 18 89.5 44.0 68.8 38.0 38.6 28.1 143.1 6.0 460.2 0.31 0.22 0.789 19 83.1 56.3 67.2 49.2 46.4 33.4 156.2 6.5 252.3 0.26 0.17 0.779 20 77.9 46.4 63.0 57.5 46.3 23.7 143.2 6.0 447.3 0.22 0.16 0.789 21 53.7 40.5 43.8 88.5 40.5 0.84 20.1 110.1 4.6 69.9 0.06 0.05 0.829 22 55.1 39.7 45.3 80.5 39.3 0.03 18.6 66.9 2.8 359.1 0.09 0.08 0.859 23 69.3 34.1 52.0 58.4 36.6 31.4 177.9 7.4 472.1 0.21 0.15 0.839 24 69.8 41.3 55.6 61.3 41.1 11.8 69.3 2.9 425.8 0.14 0.11 0.829 25 71.4 41.3 55.2 69.4 44.6 23.0 89.0 3.7 428.3 0.15 0.12 0.859 26 77.1 41.5 58.5 61.0 42.4 12.9 70.2 2.9 445.0 0.16 0.13 0.849 27 70.8 43.5 56.8 65.4 44.3 0.43 22.0 117.9 4.9 358.7 0.16 0.12 0.839 28 61.4 45.8 52.5 82.3 47.1 15.3 80.2 3.3 233.2 0.08 0.07 0.849 29 71.7 40.2 55.4 73.8 46.4 18.7 83.3 3.5 372.2 0.13 0.10 0.869 30 57.0 49.1 52.5 83.4 47.6 0.28 18.1 102.4 4.3 201.4 0.07 0.06 0.8610 1 50.4 39.2 45.1 90.2 42.5 0.28 15.1 59.9 2.5 51.2 0.03 0.03 0.8610 2 72.3 33.7 52.5 69.2 40.8 21.8 84.6 3.5 375.5 0.14 0.11 0.8710 3 71.4 43.3 57.4 56.4 40.6 13.4 94.7 3.9 380.3 0.16 0.12 0.8410 4 66.5 39.5 53.3 69.3 42.9 11.6 76.2 3.2 341.8 0.11 0.09 0.8410 5 63.8 38.6 51.9 74.3 43.7 15.1 77.4 3.2 321.5 0.09 0.08 0.8610 6 56.4 43.9 51.4 84.9 47.0 0.14 19.2 147.2 6.1 163.5 0.06 0.05 0.8510 7 74.1 44.7 59.4 48.0 37.9 11.8 78.5 3.3 390.7 0.16 0.12 0.8210 8 68.8 40.6 54.7 54.2 36.9 14.3 83.6 3.5 402.0 0.14 0.11 0.8110 9 74.9 36.5 54.4 57.7 37.5 12.8 69.4 2.9 404.6 0.15 0.11 0.8310 10 66.9 36.5 52.6 59.5 37.7 13.7 76.2 3.2 377.4 0.12 0.09 0.8410 11 59.9 39.7 49.4 74.5 41.2 15.9 78.6 3.3 270.7 0.09 0.07 0.8510 12 69.2 37.7 52.1 65.0 38.3 0.09 30.0 78.4 3.3 404.2 0.13 0.10 0.8510 13 51.3 35.8 44.9 68.7 34.8 0.24 22.5 108.2 4.5 403.0 0.09 0.07 0.8410 14 69.5 31.3 49.5 66.3 36.9 24.0 92.6 3.9 236.3 0.13 0.09 0.8410 15 56.3 35.9 41.9 86.3 38.0 24.5 92.4 3.9 122.8 0.07 0.05 0.8510 16 66.1 30.1 45.6 78.9 38.7 16.1 69.6 2.9 265.0 0.09 0.07 0.86
10 of 13
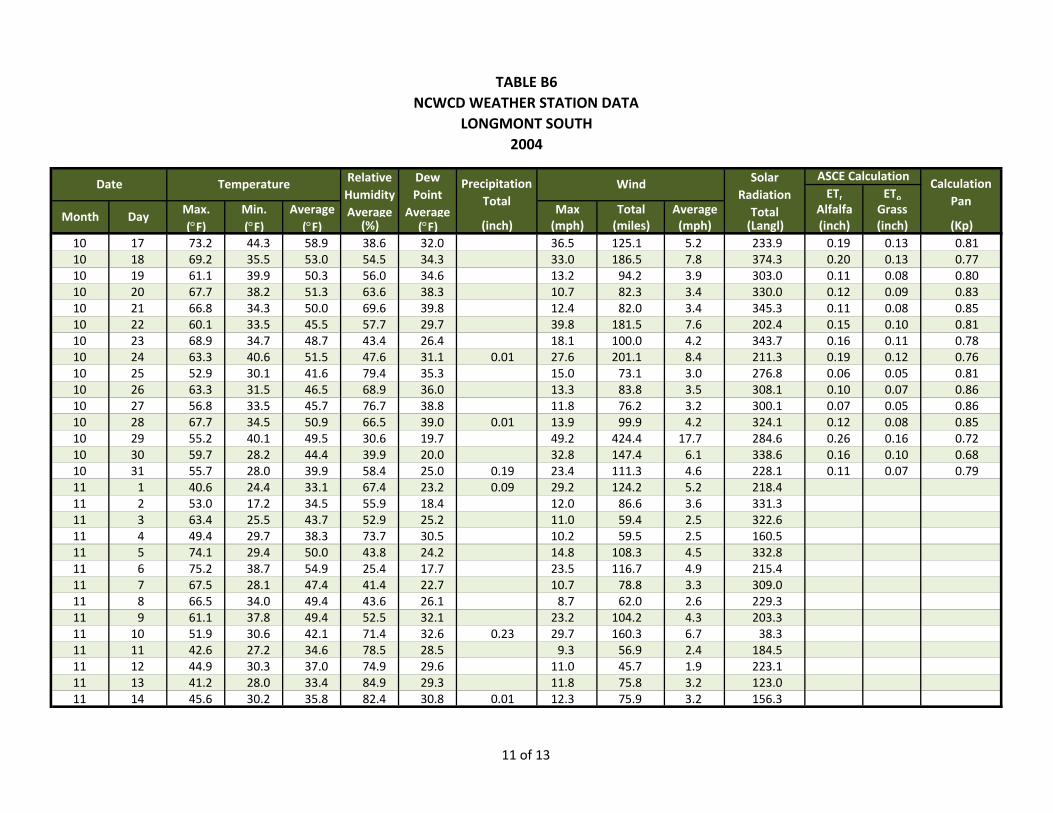
TABLE B6NCWCD WEATHER STATION DATA
LONGMONT SOUTH 2004
ETr EToMax. Min. Average Max Total Average Alfalfa Grass(°F) (°F) (°F) (%) (°F) (inch) (mph) (miles) (mph) (Langl) (inch) (inch) (Kp)
Solar Radiation Total
ASCE CalculationCalculation
PanMonth Day
Date Temperature Relative Humidity Average
Dew Point
Average
Precipitation Total
Wind
10 17 73.2 44.3 58.9 38.6 32.0 36.5 125.1 5.2 233.9 0.19 0.13 0.8110 18 69.2 35.5 53.0 54.5 34.3 33.0 186.5 7.8 374.3 0.20 0.13 0.7710 19 61.1 39.9 50.3 56.0 34.6 13.2 94.2 3.9 303.0 0.11 0.08 0.8010 20 67.7 38.2 51.3 63.6 38.3 10.7 82.3 3.4 330.0 0.12 0.09 0.8310 21 66.8 34.3 50.0 69.6 39.8 12.4 82.0 3.4 345.3 0.11 0.08 0.8510 22 60.1 33.5 45.5 57.7 29.7 39.8 181.5 7.6 202.4 0.15 0.10 0.8110 23 68.9 34.7 48.7 43.4 26.4 18.1 100.0 4.2 343.7 0.16 0.11 0.7810 24 63.3 40.6 51.5 47.6 31.1 0.01 27.6 201.1 8.4 211.3 0.19 0.12 0.7610 25 52.9 30.1 41.6 79.4 35.3 15.0 73.1 3.0 276.8 0.06 0.05 0.8110 26 63.3 31.5 46.5 68.9 36.0 13.3 83.8 3.5 308.1 0.10 0.07 0.8610 27 56.8 33.5 45.7 76.7 38.8 11.8 76.2 3.2 300.1 0.07 0.05 0.8610 28 67.7 34.5 50.9 66.5 39.0 0.01 13.9 99.9 4.2 324.1 0.12 0.08 0.8510 29 55.2 40.1 49.5 30.6 19.7 49.2 424.4 17.7 284.6 0.26 0.16 0.7210 30 59.7 28.2 44.4 39.9 20.0 32.8 147.4 6.1 338.6 0.16 0.10 0.6810 31 55.7 28.0 39.9 58.4 25.0 0.19 23.4 111.3 4.6 228.1 0.11 0.07 0.7911 1 40.6 24.4 33.1 67.4 23.2 0.09 29.2 124.2 5.2 218.411 2 53.0 17.2 34.5 55.9 18.4 12.0 86.6 3.6 331.311 3 63.4 25.5 43.7 52.9 25.2 11.0 59.4 2.5 322.611 4 49.4 29.7 38.3 73.7 30.5 10.2 59.5 2.5 160.511 5 74.1 29.4 50.0 43.8 24.2 14.8 108.3 4.5 332.811 6 75.2 38.7 54.9 25.4 17.7 23.5 116.7 4.9 215.411 7 67.5 28.1 47.4 41.4 22.7 10.7 78.8 3.3 309.011 8 66.5 34.0 49.4 43.6 26.1 8.7 62.0 2.6 229.311 9 61.1 37.8 49.4 52.5 32.1 23.2 104.2 4.3 203.311 10 51.9 30.6 42.1 71.4 32.6 0.23 29.7 160.3 6.7 38.311 11 42.6 27.2 34.6 78.5 28.5 9.3 56.9 2.4 184.511 12 44.9 30.3 37.0 74.9 29.6 11.0 45.7 1.9 223.111 13 41.2 28.0 33.4 84.9 29.3 11.8 75.8 3.2 123.011 14 45.6 30.2 35.8 82.4 30.8 0.01 12.3 75.9 3.2 156.3
11 of 13
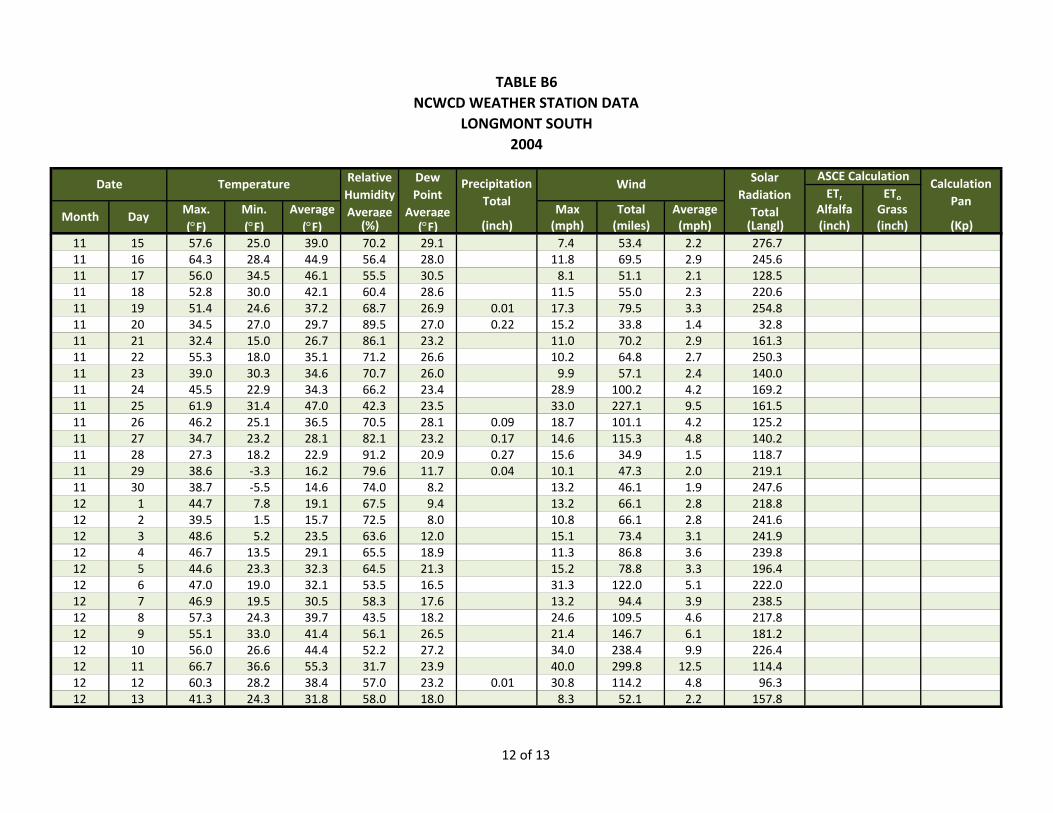
TABLE B6NCWCD WEATHER STATION DATA
LONGMONT SOUTH 2004
ETr EToMax. Min. Average Max Total Average Alfalfa Grass(°F) (°F) (°F) (%) (°F) (inch) (mph) (miles) (mph) (Langl) (inch) (inch) (Kp)
Solar Radiation Total
ASCE CalculationCalculation
PanMonth Day
Date Temperature Relative Humidity Average
Dew Point
Average
Precipitation Total
Wind
11 15 57.6 25.0 39.0 70.2 29.1 7.4 53.4 2.2 276.711 16 64.3 28.4 44.9 56.4 28.0 11.8 69.5 2.9 245.611 17 56.0 34.5 46.1 55.5 30.5 8.1 51.1 2.1 128.511 18 52.8 30.0 42.1 60.4 28.6 11.5 55.0 2.3 220.611 19 51.4 24.6 37.2 68.7 26.9 0.01 17.3 79.5 3.3 254.811 20 34.5 27.0 29.7 89.5 27.0 0.22 15.2 33.8 1.4 32.811 21 32.4 15.0 26.7 86.1 23.2 11.0 70.2 2.9 161.311 22 55.3 18.0 35.1 71.2 26.6 10.2 64.8 2.7 250.311 23 39.0 30.3 34.6 70.7 26.0 9.9 57.1 2.4 140.011 24 45.5 22.9 34.3 66.2 23.4 28.9 100.2 4.2 169.211 25 61.9 31.4 47.0 42.3 23.5 33.0 227.1 9.5 161.511 26 46.2 25.1 36.5 70.5 28.1 0.09 18.7 101.1 4.2 125.211 27 34.7 23.2 28.1 82.1 23.2 0.17 14.6 115.3 4.8 140.211 28 27.3 18.2 22.9 91.2 20.9 0.27 15.6 34.9 1.5 118.711 29 38.6 ‐3.3 16.2 79.6 11.7 0.04 10.1 47.3 2.0 219.111 30 38.7 ‐5.5 14.6 74.0 8.2 13.2 46.1 1.9 247.612 1 44.7 7.8 19.1 67.5 9.4 13.2 66.1 2.8 218.812 2 39.5 1.5 15.7 72.5 8.0 10.8 66.1 2.8 241.612 3 48.6 5.2 23.5 63.6 12.0 15.1 73.4 3.1 241.912 4 46.7 13.5 29.1 65.5 18.9 11.3 86.8 3.6 239.812 5 44.6 23.3 32.3 64.5 21.3 15.2 78.8 3.3 196.412 6 47.0 19.0 32.1 53.5 16.5 31.3 122.0 5.1 222.012 7 46.9 19.5 30.5 58.3 17.6 13.2 94.4 3.9 238.512 8 57.3 24.3 39.7 43.5 18.2 24.6 109.5 4.6 217.812 9 55.1 33.0 41.4 56.1 26.5 21.4 146.7 6.1 181.212 10 56.0 26.6 44.4 52.2 27.2 34.0 238.4 9.9 226.412 11 66.7 36.6 55.3 31.7 23.9 40.0 299.8 12.5 114.412 12 60.3 28.2 38.4 57.0 23.2 0.01 30.8 114.2 4.8 96.312 13 41.3 24.3 31.8 58.0 18.0 8.3 52.1 2.2 157.8
12 of 13
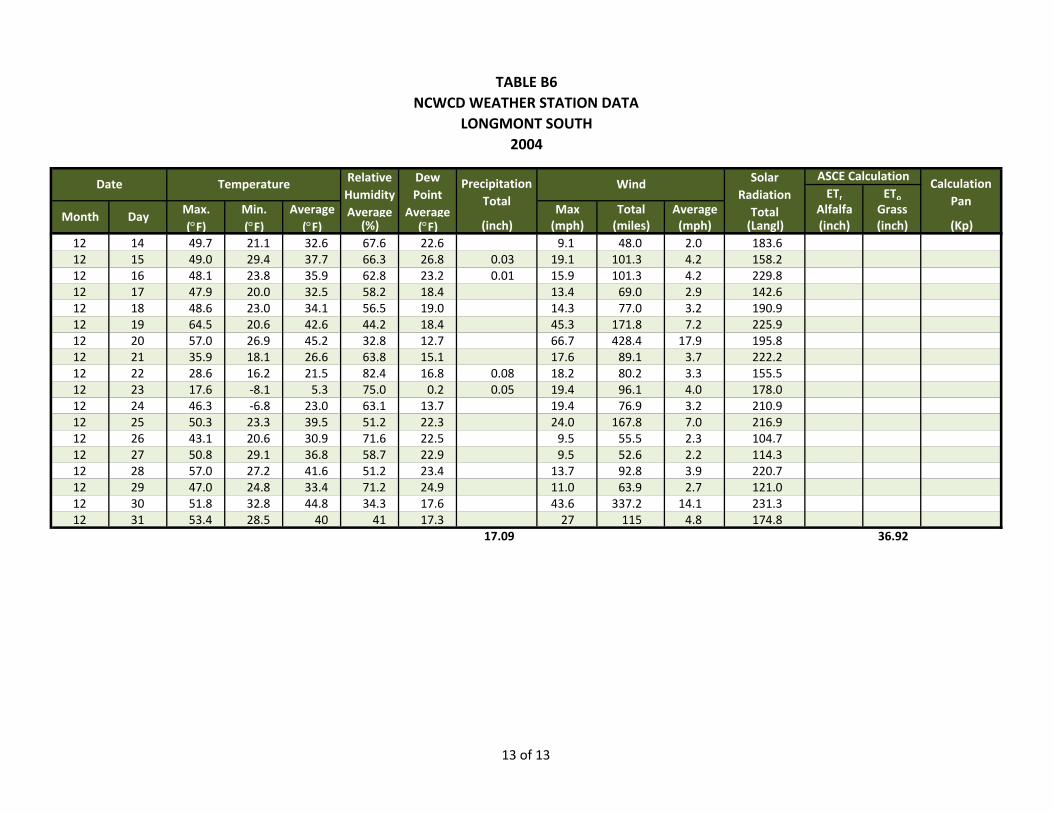
TABLE B6NCWCD WEATHER STATION DATA
LONGMONT SOUTH 2004
ETr EToMax. Min. Average Max Total Average Alfalfa Grass(°F) (°F) (°F) (%) (°F) (inch) (mph) (miles) (mph) (Langl) (inch) (inch) (Kp)
Solar Radiation Total
ASCE CalculationCalculation
PanMonth Day
Date Temperature Relative Humidity Average
Dew Point
Average
Precipitation Total
Wind
12 14 49.7 21.1 32.6 67.6 22.6 9.1 48.0 2.0 183.612 15 49.0 29.4 37.7 66.3 26.8 0.03 19.1 101.3 4.2 158.212 16 48.1 23.8 35.9 62.8 23.2 0.01 15.9 101.3 4.2 229.812 17 47.9 20.0 32.5 58.2 18.4 13.4 69.0 2.9 142.612 18 48.6 23.0 34.1 56.5 19.0 14.3 77.0 3.2 190.912 19 64.5 20.6 42.6 44.2 18.4 45.3 171.8 7.2 225.912 20 57.0 26.9 45.2 32.8 12.7 66.7 428.4 17.9 195.812 21 35.9 18.1 26.6 63.8 15.1 17.6 89.1 3.7 222.212 22 28.6 16.2 21.5 82.4 16.8 0.08 18.2 80.2 3.3 155.512 23 17.6 ‐8.1 5.3 75.0 0.2 0.05 19.4 96.1 4.0 178.012 24 46.3 ‐6.8 23.0 63.1 13.7 19.4 76.9 3.2 210.912 25 50.3 23.3 39.5 51.2 22.3 24.0 167.8 7.0 216.912 26 43.1 20.6 30.9 71.6 22.5 9.5 55.5 2.3 104.712 27 50.8 29.1 36.8 58.7 22.9 9.5 52.6 2.2 114.312 28 57.0 27.2 41.6 51.2 23.4 13.7 92.8 3.9 220.712 29 47.0 24.8 33.4 71.2 24.9 11.0 63.9 2.7 121.012 30 51.8 32.8 44.8 34.3 17.6 43.6 337.2 14.1 231.312 31 53.4 28.5 40 41 17.3 27 115 4.8 174.8
17.09 36.92
13 of 13
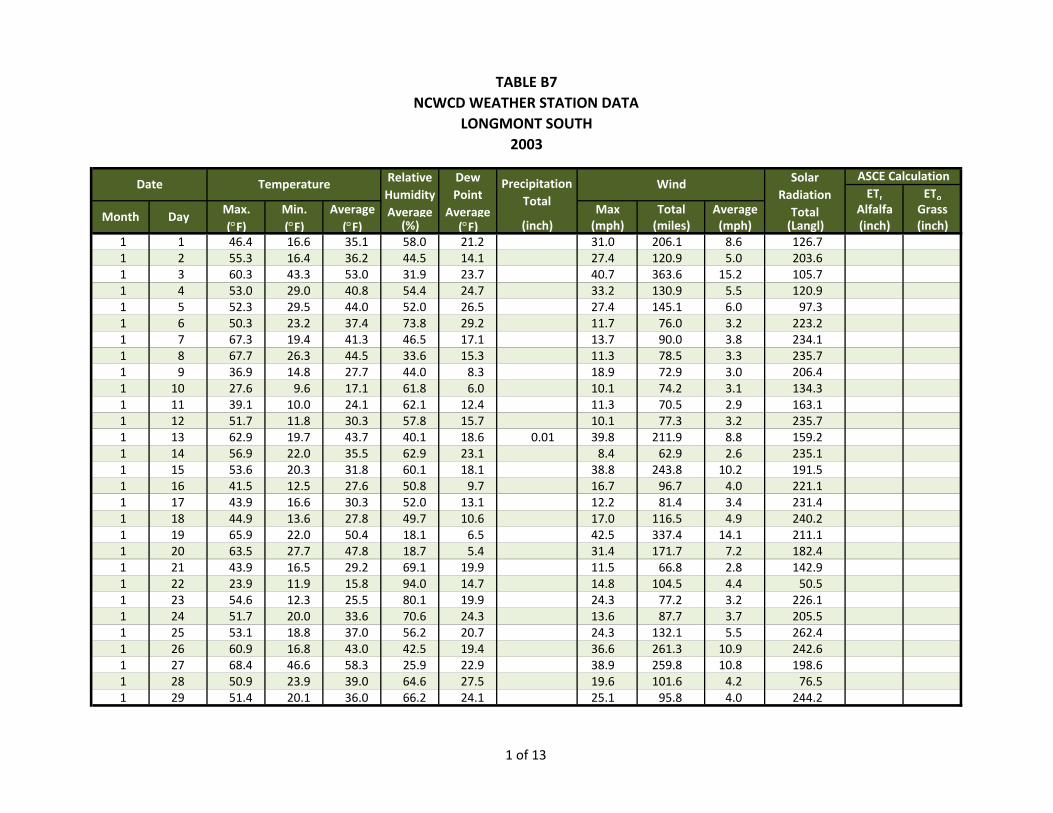
TABLE B7NCWCD WEATHER STATION DATA
LONGMONT SOUTH 2003
ETr EToMax. Min. Average Max Total Average Alfalfa Grass(°F) (°F) (°F) (%) (°F) (inch) (mph) (miles) (mph) (Langl) (inch) (inch)
1 1 46.4 16.6 35.1 58.0 21.2 31.0 206.1 8.6 126.71 2 55.3 16.4 36.2 44.5 14.1 27.4 120.9 5.0 203.61 3 60.3 43.3 53.0 31.9 23.7 40.7 363.6 15.2 105.71 4 53.0 29.0 40.8 54.4 24.7 33.2 130.9 5.5 120.91 5 52.3 29.5 44.0 52.0 26.5 27.4 145.1 6.0 97.31 6 50.3 23.2 37.4 73.8 29.2 11.7 76.0 3.2 223.21 7 67.3 19.4 41.3 46.5 17.1 13.7 90.0 3.8 234.11 8 67.7 26.3 44.5 33.6 15.3 11.3 78.5 3.3 235.71 9 36.9 14.8 27.7 44.0 8.3 18.9 72.9 3.0 206.41 10 27.6 9.6 17.1 61.8 6.0 10.1 74.2 3.1 134.31 11 39.1 10.0 24.1 62.1 12.4 11.3 70.5 2.9 163.11 12 51.7 11.8 30.3 57.8 15.7 10.1 77.3 3.2 235.71 13 62.9 19.7 43.7 40.1 18.6 0.01 39.8 211.9 8.8 159.21 14 56.9 22.0 35.5 62.9 23.1 8.4 62.9 2.6 235.11 15 53.6 20.3 31.8 60.1 18.1 38.8 243.8 10.2 191.51 16 41.5 12.5 27.6 50.8 9.7 16.7 96.7 4.0 221.11 17 43.9 16.6 30.3 52.0 13.1 12.2 81.4 3.4 231.41 18 44.9 13.6 27.8 49.7 10.6 17.0 116.5 4.9 240.21 19 65.9 22.0 50.4 18.1 6.5 42.5 337.4 14.1 211.11 20 63.5 27.7 47.8 18.7 5.4 31.4 171.7 7.2 182.41 21 43.9 16.5 29.2 69.1 19.9 11.5 66.8 2.8 142.91 22 23.9 11.9 15.8 94.0 14.7 14.8 104.5 4.4 50.51 23 54.6 12.3 25.5 80.1 19.9 24.3 77.2 3.2 226.11 24 51.7 20.0 33.6 70.6 24.3 13.6 87.7 3.7 205.51 25 53.1 18.8 37.0 56.2 20.7 24.3 132.1 5.5 262.41 26 60.9 16.8 43.0 42.5 19.4 36.6 261.3 10.9 242.61 27 68.4 46.6 58.3 25.9 22.9 38.9 259.8 10.8 198.61 28 50.9 23.9 39.0 64.6 27.5 19.6 101.6 4.2 76.51 29 51.4 20.1 36.0 66.2 24.1 25.1 95.8 4.0 244.2
Solar Radiation Total
ASCE Calculation
Month Day
Date Temperature Relative Humidity Average
Dew Point
Average
Precipitation Total
Wind
1 of 13
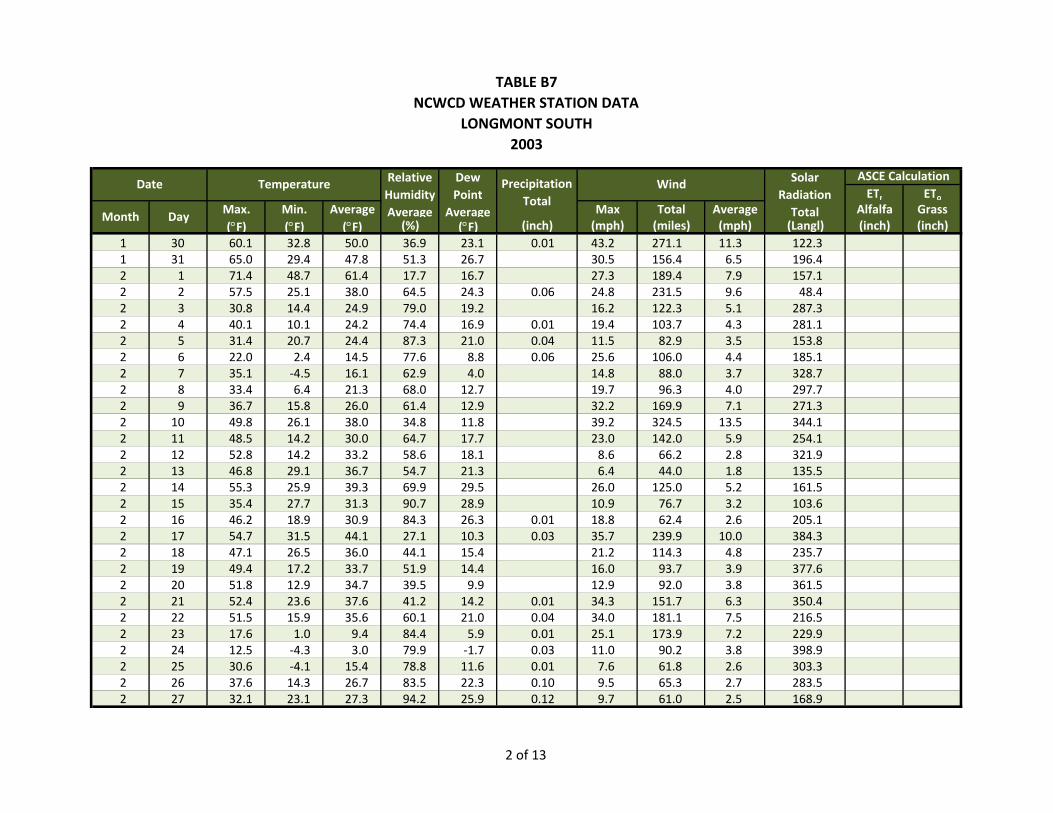
TABLE B7NCWCD WEATHER STATION DATA
LONGMONT SOUTH 2003
ETr EToMax. Min. Average Max Total Average Alfalfa Grass(°F) (°F) (°F) (%) (°F) (inch) (mph) (miles) (mph) (Langl) (inch) (inch)
Solar Radiation Total
ASCE Calculation
Month Day
Date Temperature Relative Humidity Average
Dew Point
Average
Precipitation Total
Wind
1 30 60.1 32.8 50.0 36.9 23.1 0.01 43.2 271.1 11.3 122.31 31 65.0 29.4 47.8 51.3 26.7 30.5 156.4 6.5 196.42 1 71.4 48.7 61.4 17.7 16.7 27.3 189.4 7.9 157.12 2 57.5 25.1 38.0 64.5 24.3 0.06 24.8 231.5 9.6 48.42 3 30.8 14.4 24.9 79.0 19.2 16.2 122.3 5.1 287.32 4 40.1 10.1 24.2 74.4 16.9 0.01 19.4 103.7 4.3 281.12 5 31.4 20.7 24.4 87.3 21.0 0.04 11.5 82.9 3.5 153.82 6 22.0 2.4 14.5 77.6 8.8 0.06 25.6 106.0 4.4 185.12 7 35.1 ‐4.5 16.1 62.9 4.0 14.8 88.0 3.7 328.72 8 33.4 6.4 21.3 68.0 12.7 19.7 96.3 4.0 297.72 9 36.7 15.8 26.0 61.4 12.9 32.2 169.9 7.1 271.32 10 49.8 26.1 38.0 34.8 11.8 39.2 324.5 13.5 344.12 11 48.5 14.2 30.0 64.7 17.7 23.0 142.0 5.9 254.12 12 52.8 14.2 33.2 58.6 18.1 8.6 66.2 2.8 321.92 13 46.8 29.1 36.7 54.7 21.3 6.4 44.0 1.8 135.52 14 55.3 25.9 39.3 69.9 29.5 26.0 125.0 5.2 161.52 15 35.4 27.7 31.3 90.7 28.9 10.9 76.7 3.2 103.62 16 46.2 18.9 30.9 84.3 26.3 0.01 18.8 62.4 2.6 205.12 17 54.7 31.5 44.1 27.1 10.3 0.03 35.7 239.9 10.0 384.32 18 47.1 26.5 36.0 44.1 15.4 21.2 114.3 4.8 235.72 19 49.4 17.2 33.7 51.9 14.4 16.0 93.7 3.9 377.62 20 51.8 12.9 34.7 39.5 9.9 12.9 92.0 3.8 361.52 21 52.4 23.6 37.6 41.2 14.2 0.01 34.3 151.7 6.3 350.42 22 51.5 15.9 35.6 60.1 21.0 0.04 34.0 181.1 7.5 216.52 23 17.6 1.0 9.4 84.4 5.9 0.01 25.1 173.9 7.2 229.92 24 12.5 ‐4.3 3.0 79.9 ‐1.7 0.03 11.0 90.2 3.8 398.92 25 30.6 ‐4.1 15.4 78.8 11.6 0.01 7.6 61.8 2.6 303.32 26 37.6 14.3 26.7 83.5 22.3 0.10 9.5 65.3 2.7 283.52 27 32.1 23.1 27.3 94.2 25.9 0.12 9.7 61.0 2.5 168.9
2 of 13
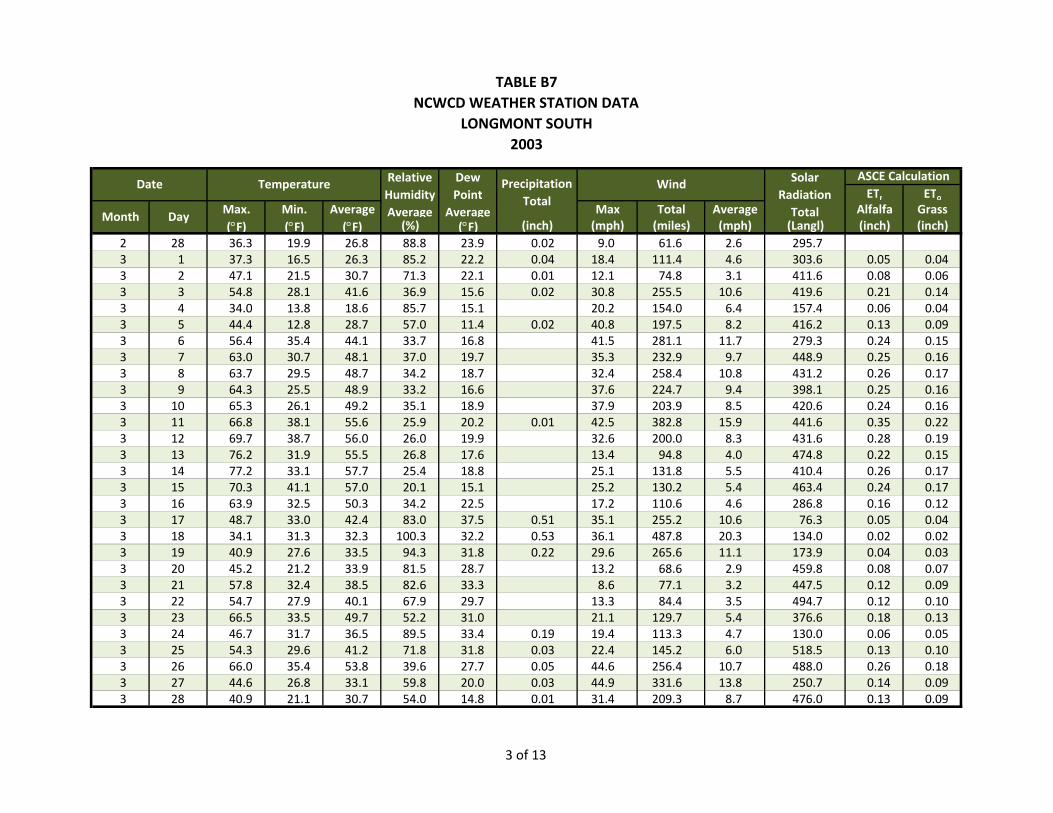
TABLE B7NCWCD WEATHER STATION DATA
LONGMONT SOUTH 2003
ETr EToMax. Min. Average Max Total Average Alfalfa Grass(°F) (°F) (°F) (%) (°F) (inch) (mph) (miles) (mph) (Langl) (inch) (inch)
Solar Radiation Total
ASCE Calculation
Month Day
Date Temperature Relative Humidity Average
Dew Point
Average
Precipitation Total
Wind
2 28 36.3 19.9 26.8 88.8 23.9 0.02 9.0 61.6 2.6 295.73 1 37.3 16.5 26.3 85.2 22.2 0.04 18.4 111.4 4.6 303.6 0.05 0.043 2 47.1 21.5 30.7 71.3 22.1 0.01 12.1 74.8 3.1 411.6 0.08 0.063 3 54.8 28.1 41.6 36.9 15.6 0.02 30.8 255.5 10.6 419.6 0.21 0.143 4 34.0 13.8 18.6 85.7 15.1 20.2 154.0 6.4 157.4 0.06 0.043 5 44.4 12.8 28.7 57.0 11.4 0.02 40.8 197.5 8.2 416.2 0.13 0.093 6 56.4 35.4 44.1 33.7 16.8 41.5 281.1 11.7 279.3 0.24 0.153 7 63.0 30.7 48.1 37.0 19.7 35.3 232.9 9.7 448.9 0.25 0.163 8 63.7 29.5 48.7 34.2 18.7 32.4 258.4 10.8 431.2 0.26 0.173 9 64.3 25.5 48.9 33.2 16.6 37.6 224.7 9.4 398.1 0.25 0.163 10 65.3 26.1 49.2 35.1 18.9 37.9 203.9 8.5 420.6 0.24 0.163 11 66.8 38.1 55.6 25.9 20.2 0.01 42.5 382.8 15.9 441.6 0.35 0.223 12 69.7 38.7 56.0 26.0 19.9 32.6 200.0 8.3 431.6 0.28 0.193 13 76.2 31.9 55.5 26.8 17.6 13.4 94.8 4.0 474.8 0.22 0.153 14 77.2 33.1 57.7 25.4 18.8 25.1 131.8 5.5 410.4 0.26 0.173 15 70.3 41.1 57.0 20.1 15.1 25.2 130.2 5.4 463.4 0.24 0.173 16 63.9 32.5 50.3 34.2 22.5 17.2 110.6 4.6 286.8 0.16 0.123 17 48.7 33.0 42.4 83.0 37.5 0.51 35.1 255.2 10.6 76.3 0.05 0.043 18 34.1 31.3 32.3 100.3 32.2 0.53 36.1 487.8 20.3 134.0 0.02 0.023 19 40.9 27.6 33.5 94.3 31.8 0.22 29.6 265.6 11.1 173.9 0.04 0.033 20 45.2 21.2 33.9 81.5 28.7 13.2 68.6 2.9 459.8 0.08 0.073 21 57.8 32.4 38.5 82.6 33.3 8.6 77.1 3.2 447.5 0.12 0.093 22 54.7 27.9 40.1 67.9 29.7 13.3 84.4 3.5 494.7 0.12 0.103 23 66.5 33.5 49.7 52.2 31.0 21.1 129.7 5.4 376.6 0.18 0.133 24 46.7 31.7 36.5 89.5 33.4 0.19 19.4 113.3 4.7 130.0 0.06 0.053 25 54.3 29.6 41.2 71.8 31.8 0.03 22.4 145.2 6.0 518.5 0.13 0.103 26 66.0 35.4 53.8 39.6 27.7 0.05 44.6 256.4 10.7 488.0 0.26 0.183 27 44.6 26.8 33.1 59.8 20.0 0.03 44.9 331.6 13.8 250.7 0.14 0.093 28 40.9 21.1 30.7 54.0 14.8 0.01 31.4 209.3 8.7 476.0 0.13 0.09
3 of 13
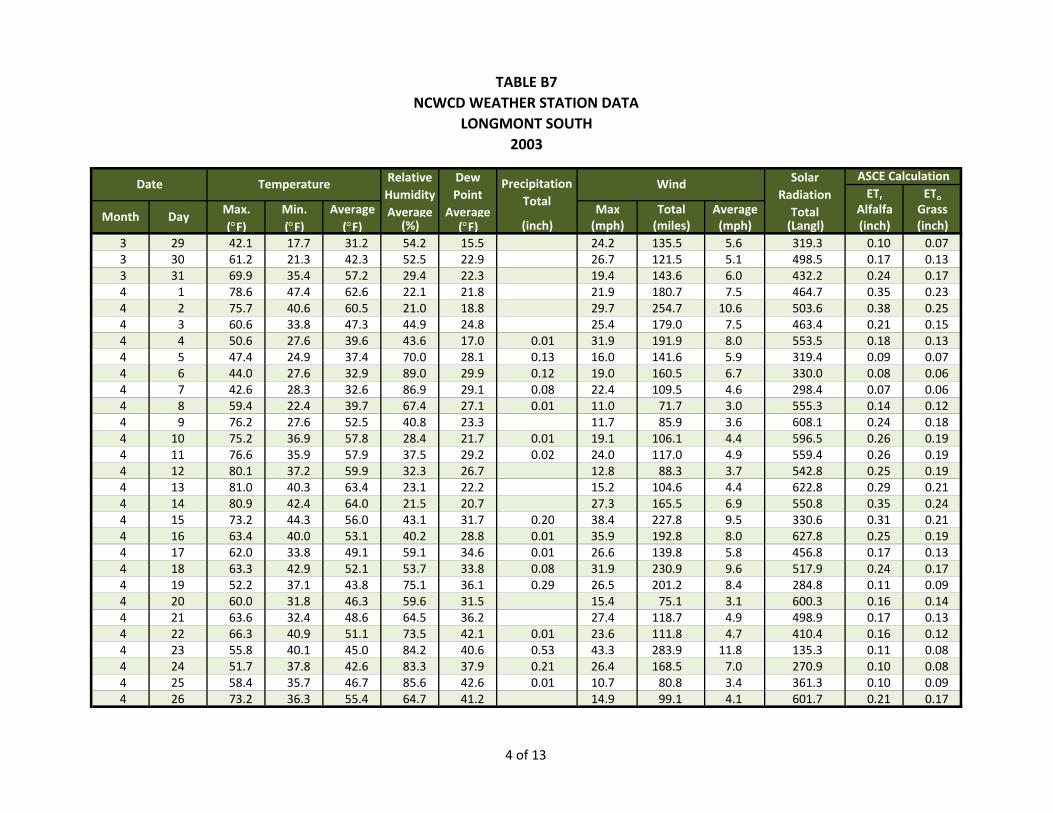
TABLE B7NCWCD WEATHER STATION DATA
LONGMONT SOUTH 2003
ETr EToMax. Min. Average Max Total Average Alfalfa Grass(°F) (°F) (°F) (%) (°F) (inch) (mph) (miles) (mph) (Langl) (inch) (inch)
Solar Radiation Total
ASCE Calculation
Month Day
Date Temperature Relative Humidity Average
Dew Point
Average
Precipitation Total
Wind
3 29 42.1 17.7 31.2 54.2 15.5 24.2 135.5 5.6 319.3 0.10 0.073 30 61.2 21.3 42.3 52.5 22.9 26.7 121.5 5.1 498.5 0.17 0.133 31 69.9 35.4 57.2 29.4 22.3 19.4 143.6 6.0 432.2 0.24 0.174 1 78.6 47.4 62.6 22.1 21.8 21.9 180.7 7.5 464.7 0.35 0.234 2 75.7 40.6 60.5 21.0 18.8 29.7 254.7 10.6 503.6 0.38 0.254 3 60.6 33.8 47.3 44.9 24.8 25.4 179.0 7.5 463.4 0.21 0.154 4 50.6 27.6 39.6 43.6 17.0 0.01 31.9 191.9 8.0 553.5 0.18 0.134 5 47.4 24.9 37.4 70.0 28.1 0.13 16.0 141.6 5.9 319.4 0.09 0.074 6 44.0 27.6 32.9 89.0 29.9 0.12 19.0 160.5 6.7 330.0 0.08 0.064 7 42.6 28.3 32.6 86.9 29.1 0.08 22.4 109.5 4.6 298.4 0.07 0.064 8 59.4 22.4 39.7 67.4 27.1 0.01 11.0 71.7 3.0 555.3 0.14 0.124 9 76.2 27.6 52.5 40.8 23.3 11.7 85.9 3.6 608.1 0.24 0.184 10 75.2 36.9 57.8 28.4 21.7 0.01 19.1 106.1 4.4 596.5 0.26 0.194 11 76.6 35.9 57.9 37.5 29.2 0.02 24.0 117.0 4.9 559.4 0.26 0.194 12 80.1 37.2 59.9 32.3 26.7 12.8 88.3 3.7 542.8 0.25 0.194 13 81.0 40.3 63.4 23.1 22.2 15.2 104.6 4.4 622.8 0.29 0.214 14 80.9 42.4 64.0 21.5 20.7 27.3 165.5 6.9 550.8 0.35 0.244 15 73.2 44.3 56.0 43.1 31.7 0.20 38.4 227.8 9.5 330.6 0.31 0.214 16 63.4 40.0 53.1 40.2 28.8 0.01 35.9 192.8 8.0 627.8 0.25 0.194 17 62.0 33.8 49.1 59.1 34.6 0.01 26.6 139.8 5.8 456.8 0.17 0.134 18 63.3 42.9 52.1 53.7 33.8 0.08 31.9 230.9 9.6 517.9 0.24 0.174 19 52.2 37.1 43.8 75.1 36.1 0.29 26.5 201.2 8.4 284.8 0.11 0.094 20 60.0 31.8 46.3 59.6 31.5 15.4 75.1 3.1 600.3 0.16 0.144 21 63.6 32.4 48.6 64.5 36.2 27.4 118.7 4.9 498.9 0.17 0.134 22 66.3 40.9 51.1 73.5 42.1 0.01 23.6 111.8 4.7 410.4 0.16 0.124 23 55.8 40.1 45.0 84.2 40.6 0.53 43.3 283.9 11.8 135.3 0.11 0.084 24 51.7 37.8 42.6 83.3 37.9 0.21 26.4 168.5 7.0 270.9 0.10 0.084 25 58.4 35.7 46.7 85.6 42.6 0.01 10.7 80.8 3.4 361.3 0.10 0.094 26 73.2 36.3 55.4 64.7 41.2 14.9 99.1 4.1 601.7 0.21 0.17
4 of 13
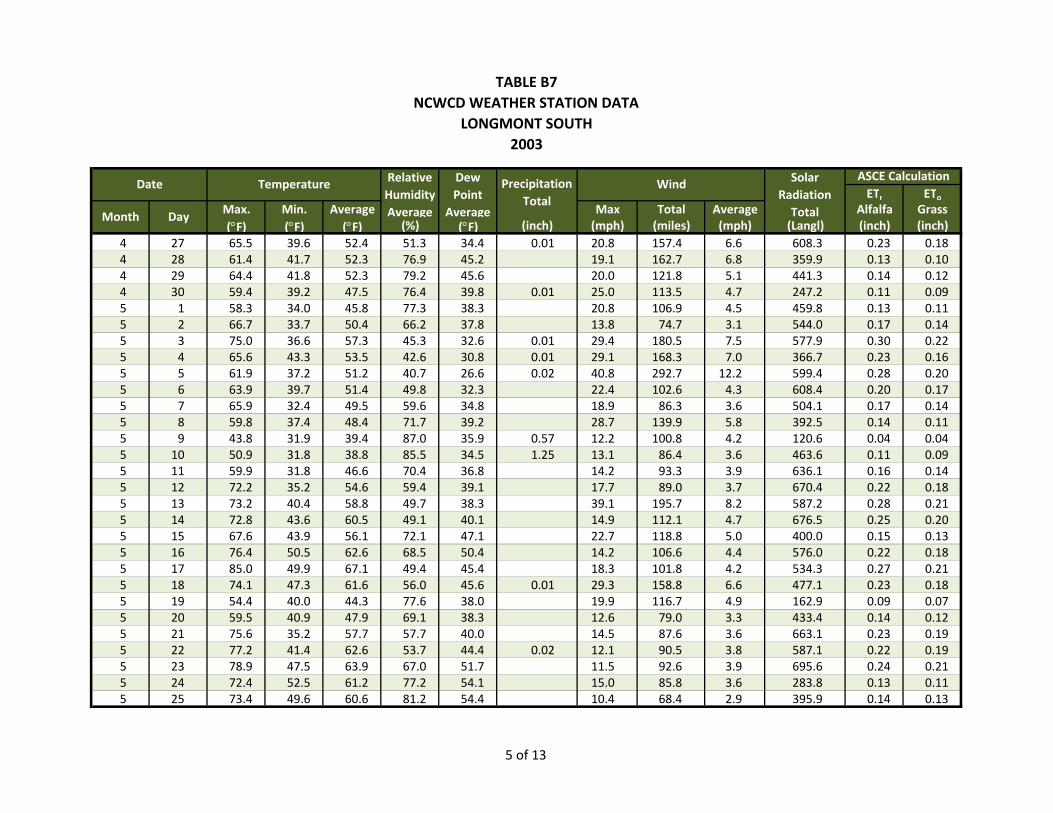
TABLE B7NCWCD WEATHER STATION DATA
LONGMONT SOUTH 2003
ETr EToMax. Min. Average Max Total Average Alfalfa Grass(°F) (°F) (°F) (%) (°F) (inch) (mph) (miles) (mph) (Langl) (inch) (inch)
Solar Radiation Total
ASCE Calculation
Month Day
Date Temperature Relative Humidity Average
Dew Point
Average
Precipitation Total
Wind
4 27 65.5 39.6 52.4 51.3 34.4 0.01 20.8 157.4 6.6 608.3 0.23 0.184 28 61.4 41.7 52.3 76.9 45.2 19.1 162.7 6.8 359.9 0.13 0.104 29 64.4 41.8 52.3 79.2 45.6 20.0 121.8 5.1 441.3 0.14 0.124 30 59.4 39.2 47.5 76.4 39.8 0.01 25.0 113.5 4.7 247.2 0.11 0.095 1 58.3 34.0 45.8 77.3 38.3 20.8 106.9 4.5 459.8 0.13 0.115 2 66.7 33.7 50.4 66.2 37.8 13.8 74.7 3.1 544.0 0.17 0.145 3 75.0 36.6 57.3 45.3 32.6 0.01 29.4 180.5 7.5 577.9 0.30 0.225 4 65.6 43.3 53.5 42.6 30.8 0.01 29.1 168.3 7.0 366.7 0.23 0.165 5 61.9 37.2 51.2 40.7 26.6 0.02 40.8 292.7 12.2 599.4 0.28 0.205 6 63.9 39.7 51.4 49.8 32.3 22.4 102.6 4.3 608.4 0.20 0.175 7 65.9 32.4 49.5 59.6 34.8 18.9 86.3 3.6 504.1 0.17 0.145 8 59.8 37.4 48.4 71.7 39.2 28.7 139.9 5.8 392.5 0.14 0.115 9 43.8 31.9 39.4 87.0 35.9 0.57 12.2 100.8 4.2 120.6 0.04 0.045 10 50.9 31.8 38.8 85.5 34.5 1.25 13.1 86.4 3.6 463.6 0.11 0.095 11 59.9 31.8 46.6 70.4 36.8 14.2 93.3 3.9 636.1 0.16 0.145 12 72.2 35.2 54.6 59.4 39.1 17.7 89.0 3.7 670.4 0.22 0.185 13 73.2 40.4 58.8 49.7 38.3 39.1 195.7 8.2 587.2 0.28 0.215 14 72.8 43.6 60.5 49.1 40.1 14.9 112.1 4.7 676.5 0.25 0.205 15 67.6 43.9 56.1 72.1 47.1 22.7 118.8 5.0 400.0 0.15 0.135 16 76.4 50.5 62.6 68.5 50.4 14.2 106.6 4.4 576.0 0.22 0.185 17 85.0 49.9 67.1 49.4 45.4 18.3 101.8 4.2 534.3 0.27 0.215 18 74.1 47.3 61.6 56.0 45.6 0.01 29.3 158.8 6.6 477.1 0.23 0.185 19 54.4 40.0 44.3 77.6 38.0 19.9 116.7 4.9 162.9 0.09 0.075 20 59.5 40.9 47.9 69.1 38.3 12.6 79.0 3.3 433.4 0.14 0.125 21 75.6 35.2 57.7 57.7 40.0 14.5 87.6 3.6 663.1 0.23 0.195 22 77.2 41.4 62.6 53.7 44.4 0.02 12.1 90.5 3.8 587.1 0.22 0.195 23 78.9 47.5 63.9 67.0 51.7 11.5 92.6 3.9 695.6 0.24 0.215 24 72.4 52.5 61.2 77.2 54.1 15.0 85.8 3.6 283.8 0.13 0.115 25 73.4 49.6 60.6 81.2 54.4 10.4 68.4 2.9 395.9 0.14 0.13
5 of 13
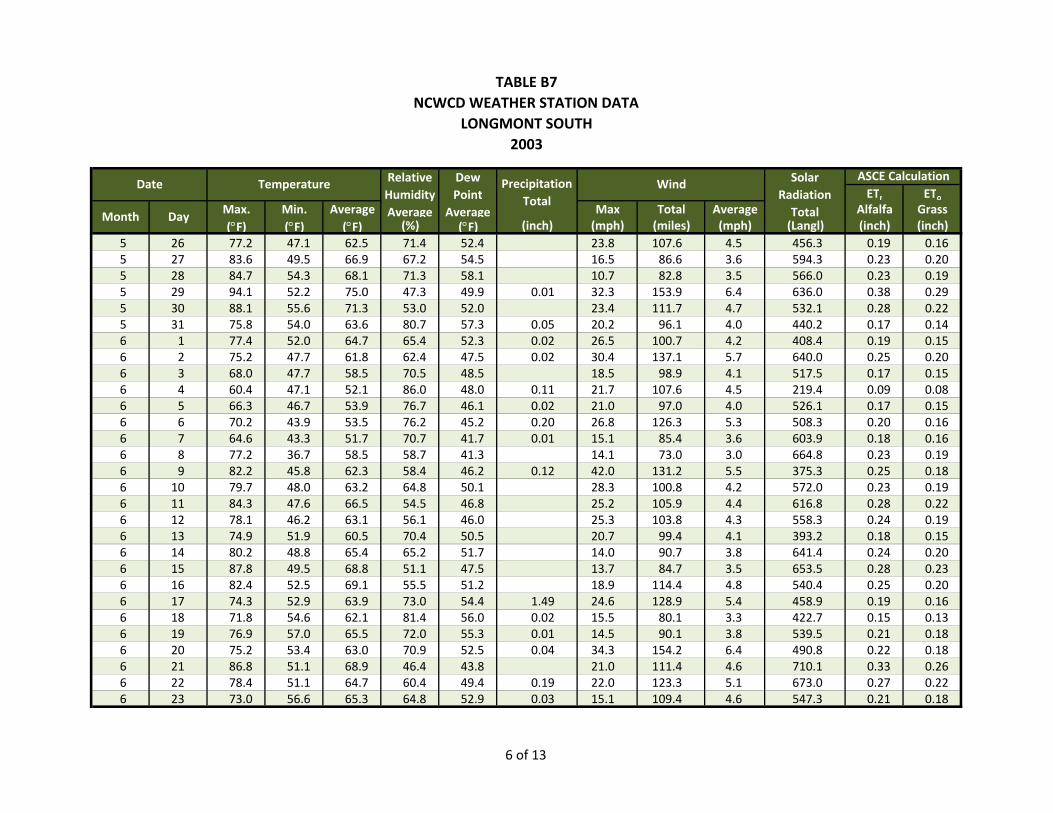
TABLE B7NCWCD WEATHER STATION DATA
LONGMONT SOUTH 2003
ETr EToMax. Min. Average Max Total Average Alfalfa Grass(°F) (°F) (°F) (%) (°F) (inch) (mph) (miles) (mph) (Langl) (inch) (inch)
Solar Radiation Total
ASCE Calculation
Month Day
Date Temperature Relative Humidity Average
Dew Point
Average
Precipitation Total
Wind
5 26 77.2 47.1 62.5 71.4 52.4 23.8 107.6 4.5 456.3 0.19 0.165 27 83.6 49.5 66.9 67.2 54.5 16.5 86.6 3.6 594.3 0.23 0.205 28 84.7 54.3 68.1 71.3 58.1 10.7 82.8 3.5 566.0 0.23 0.195 29 94.1 52.2 75.0 47.3 49.9 0.01 32.3 153.9 6.4 636.0 0.38 0.295 30 88.1 55.6 71.3 53.0 52.0 23.4 111.7 4.7 532.1 0.28 0.225 31 75.8 54.0 63.6 80.7 57.3 0.05 20.2 96.1 4.0 440.2 0.17 0.146 1 77.4 52.0 64.7 65.4 52.3 0.02 26.5 100.7 4.2 408.4 0.19 0.156 2 75.2 47.7 61.8 62.4 47.5 0.02 30.4 137.1 5.7 640.0 0.25 0.206 3 68.0 47.7 58.5 70.5 48.5 18.5 98.9 4.1 517.5 0.17 0.156 4 60.4 47.1 52.1 86.0 48.0 0.11 21.7 107.6 4.5 219.4 0.09 0.086 5 66.3 46.7 53.9 76.7 46.1 0.02 21.0 97.0 4.0 526.1 0.17 0.156 6 70.2 43.9 53.5 76.2 45.2 0.20 26.8 126.3 5.3 508.3 0.20 0.166 7 64.6 43.3 51.7 70.7 41.7 0.01 15.1 85.4 3.6 603.9 0.18 0.166 8 77.2 36.7 58.5 58.7 41.3 14.1 73.0 3.0 664.8 0.23 0.196 9 82.2 45.8 62.3 58.4 46.2 0.12 42.0 131.2 5.5 375.3 0.25 0.186 10 79.7 48.0 63.2 64.8 50.1 28.3 100.8 4.2 572.0 0.23 0.196 11 84.3 47.6 66.5 54.5 46.8 25.2 105.9 4.4 616.8 0.28 0.226 12 78.1 46.2 63.1 56.1 46.0 25.3 103.8 4.3 558.3 0.24 0.196 13 74.9 51.9 60.5 70.4 50.5 20.7 99.4 4.1 393.2 0.18 0.156 14 80.2 48.8 65.4 65.2 51.7 14.0 90.7 3.8 641.4 0.24 0.206 15 87.8 49.5 68.8 51.1 47.5 13.7 84.7 3.5 653.5 0.28 0.236 16 82.4 52.5 69.1 55.5 51.2 18.9 114.4 4.8 540.4 0.25 0.206 17 74.3 52.9 63.9 73.0 54.4 1.49 24.6 128.9 5.4 458.9 0.19 0.166 18 71.8 54.6 62.1 81.4 56.0 0.02 15.5 80.1 3.3 422.7 0.15 0.136 19 76.9 57.0 65.5 72.0 55.3 0.01 14.5 90.1 3.8 539.5 0.21 0.186 20 75.2 53.4 63.0 70.9 52.5 0.04 34.3 154.2 6.4 490.8 0.22 0.186 21 86.8 51.1 68.9 46.4 43.8 21.0 111.4 4.6 710.1 0.33 0.266 22 78.4 51.1 64.7 60.4 49.4 0.19 22.0 123.3 5.1 673.0 0.27 0.226 23 73.0 56.6 65.3 64.8 52.9 0.03 15.1 109.4 4.6 547.3 0.21 0.18
6 of 13
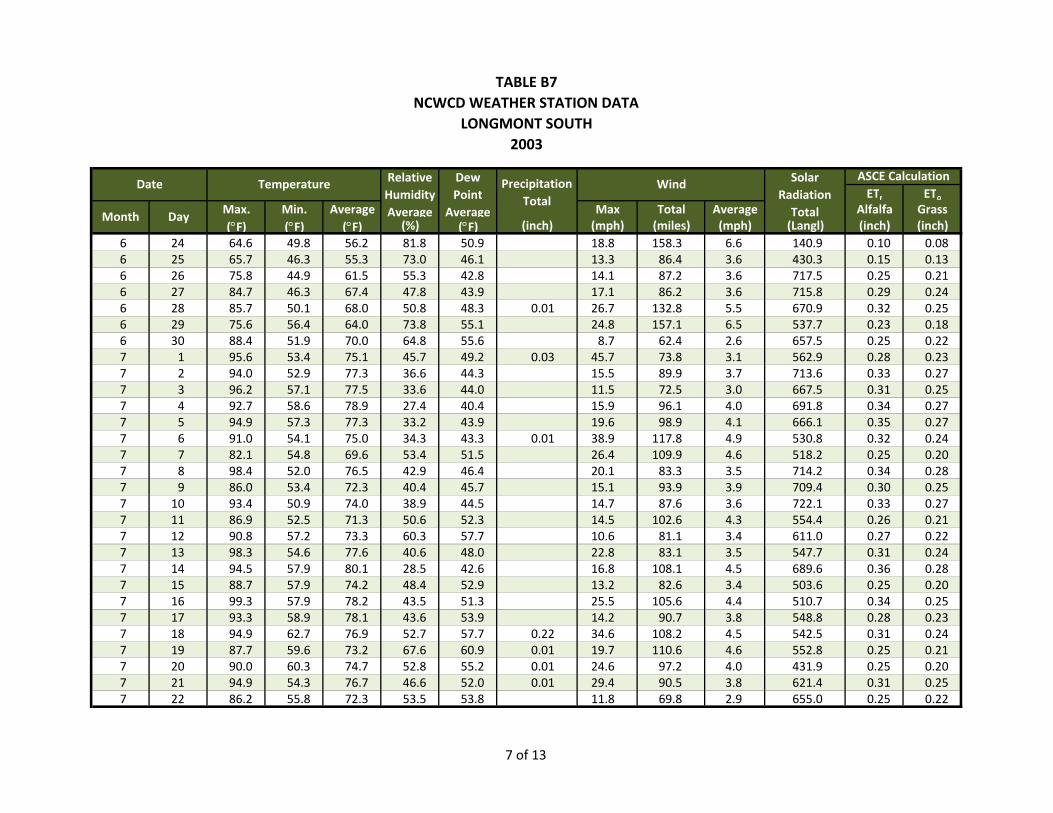
TABLE B7NCWCD WEATHER STATION DATA
LONGMONT SOUTH 2003
ETr EToMax. Min. Average Max Total Average Alfalfa Grass(°F) (°F) (°F) (%) (°F) (inch) (mph) (miles) (mph) (Langl) (inch) (inch)
Solar Radiation Total
ASCE Calculation
Month Day
Date Temperature Relative Humidity Average
Dew Point
Average
Precipitation Total
Wind
6 24 64.6 49.8 56.2 81.8 50.9 18.8 158.3 6.6 140.9 0.10 0.086 25 65.7 46.3 55.3 73.0 46.1 13.3 86.4 3.6 430.3 0.15 0.136 26 75.8 44.9 61.5 55.3 42.8 14.1 87.2 3.6 717.5 0.25 0.216 27 84.7 46.3 67.4 47.8 43.9 17.1 86.2 3.6 715.8 0.29 0.246 28 85.7 50.1 68.0 50.8 48.3 0.01 26.7 132.8 5.5 670.9 0.32 0.256 29 75.6 56.4 64.0 73.8 55.1 24.8 157.1 6.5 537.7 0.23 0.186 30 88.4 51.9 70.0 64.8 55.6 8.7 62.4 2.6 657.5 0.25 0.227 1 95.6 53.4 75.1 45.7 49.2 0.03 45.7 73.8 3.1 562.9 0.28 0.237 2 94.0 52.9 77.3 36.6 44.3 15.5 89.9 3.7 713.6 0.33 0.277 3 96.2 57.1 77.5 33.6 44.0 11.5 72.5 3.0 667.5 0.31 0.257 4 92.7 58.6 78.9 27.4 40.4 15.9 96.1 4.0 691.8 0.34 0.277 5 94.9 57.3 77.3 33.2 43.9 19.6 98.9 4.1 666.1 0.35 0.277 6 91.0 54.1 75.0 34.3 43.3 0.01 38.9 117.8 4.9 530.8 0.32 0.247 7 82.1 54.8 69.6 53.4 51.5 26.4 109.9 4.6 518.2 0.25 0.207 8 98.4 52.0 76.5 42.9 46.4 20.1 83.3 3.5 714.2 0.34 0.287 9 86.0 53.4 72.3 40.4 45.7 15.1 93.9 3.9 709.4 0.30 0.257 10 93.4 50.9 74.0 38.9 44.5 14.7 87.6 3.6 722.1 0.33 0.277 11 86.9 52.5 71.3 50.6 52.3 14.5 102.6 4.3 554.4 0.26 0.217 12 90.8 57.2 73.3 60.3 57.7 10.6 81.1 3.4 611.0 0.27 0.227 13 98.3 54.6 77.6 40.6 48.0 22.8 83.1 3.5 547.7 0.31 0.247 14 94.5 57.9 80.1 28.5 42.6 16.8 108.1 4.5 689.6 0.36 0.287 15 88.7 57.9 74.2 48.4 52.9 13.2 82.6 3.4 503.6 0.25 0.207 16 99.3 57.9 78.2 43.5 51.3 25.5 105.6 4.4 510.7 0.34 0.257 17 93.3 58.9 78.1 43.6 53.9 14.2 90.7 3.8 548.8 0.28 0.237 18 94.9 62.7 76.9 52.7 57.7 0.22 34.6 108.2 4.5 542.5 0.31 0.247 19 87.7 59.6 73.2 67.6 60.9 0.01 19.7 110.6 4.6 552.8 0.25 0.217 20 90.0 60.3 74.7 52.8 55.2 0.01 24.6 97.2 4.0 431.9 0.25 0.207 21 94.9 54.3 76.7 46.6 52.0 0.01 29.4 90.5 3.8 621.4 0.31 0.257 22 86.2 55.8 72.3 53.5 53.8 11.8 69.8 2.9 655.0 0.25 0.22
7 of 13
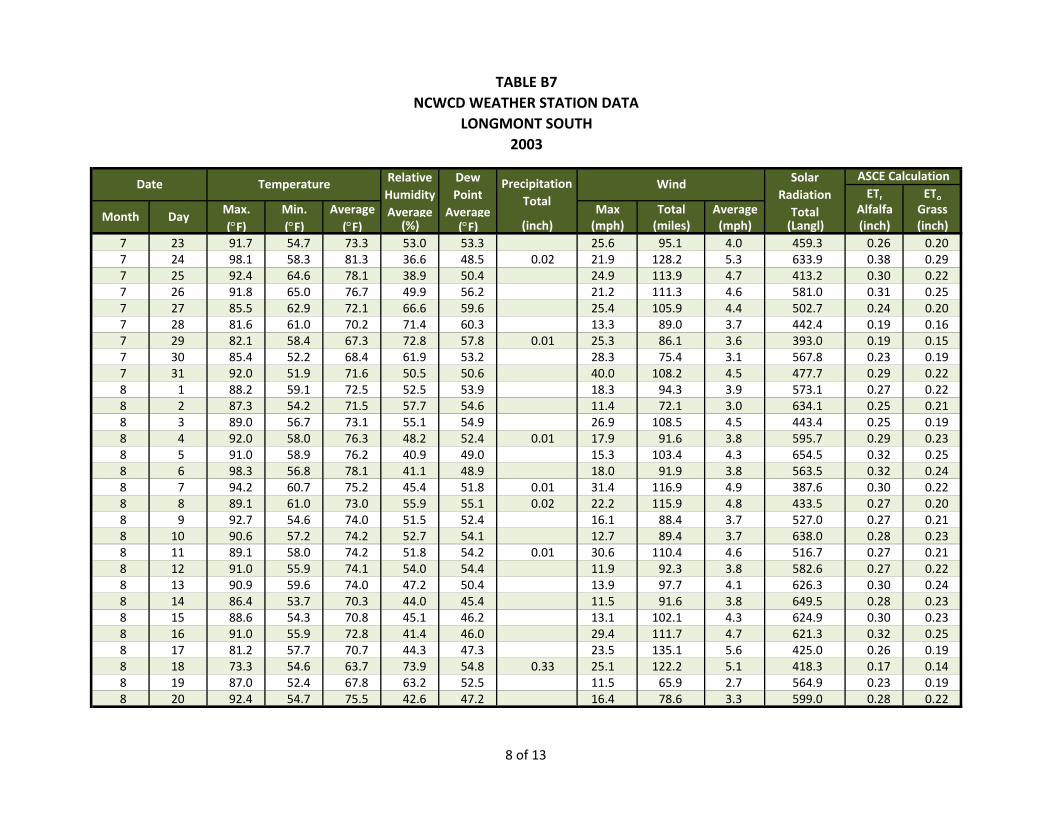
TABLE B7NCWCD WEATHER STATION DATA
LONGMONT SOUTH 2003
ETr EToMax. Min. Average Max Total Average Alfalfa Grass(°F) (°F) (°F) (%) (°F) (inch) (mph) (miles) (mph) (Langl) (inch) (inch)
Solar Radiation Total
ASCE Calculation
Month Day
Date Temperature Relative Humidity Average
Dew Point
Average
Precipitation Total
Wind
7 23 91.7 54.7 73.3 53.0 53.3 25.6 95.1 4.0 459.3 0.26 0.207 24 98.1 58.3 81.3 36.6 48.5 0.02 21.9 128.2 5.3 633.9 0.38 0.297 25 92.4 64.6 78.1 38.9 50.4 24.9 113.9 4.7 413.2 0.30 0.227 26 91.8 65.0 76.7 49.9 56.2 21.2 111.3 4.6 581.0 0.31 0.257 27 85.5 62.9 72.1 66.6 59.6 25.4 105.9 4.4 502.7 0.24 0.207 28 81.6 61.0 70.2 71.4 60.3 13.3 89.0 3.7 442.4 0.19 0.167 29 82.1 58.4 67.3 72.8 57.8 0.01 25.3 86.1 3.6 393.0 0.19 0.157 30 85.4 52.2 68.4 61.9 53.2 28.3 75.4 3.1 567.8 0.23 0.197 31 92.0 51.9 71.6 50.5 50.6 40.0 108.2 4.5 477.7 0.29 0.228 1 88.2 59.1 72.5 52.5 53.9 18.3 94.3 3.9 573.1 0.27 0.228 2 87.3 54.2 71.5 57.7 54.6 11.4 72.1 3.0 634.1 0.25 0.218 3 89.0 56.7 73.1 55.1 54.9 26.9 108.5 4.5 443.4 0.25 0.198 4 92.0 58.0 76.3 48.2 52.4 0.01 17.9 91.6 3.8 595.7 0.29 0.238 5 91.0 58.9 76.2 40.9 49.0 15.3 103.4 4.3 654.5 0.32 0.258 6 98.3 56.8 78.1 41.1 48.9 18.0 91.9 3.8 563.5 0.32 0.248 7 94.2 60.7 75.2 45.4 51.8 0.01 31.4 116.9 4.9 387.6 0.30 0.228 8 89.1 61.0 73.0 55.9 55.1 0.02 22.2 115.9 4.8 433.5 0.27 0.208 9 92.7 54.6 74.0 51.5 52.4 16.1 88.4 3.7 527.0 0.27 0.218 10 90.6 57.2 74.2 52.7 54.1 12.7 89.4 3.7 638.0 0.28 0.238 11 89.1 58.0 74.2 51.8 54.2 0.01 30.6 110.4 4.6 516.7 0.27 0.218 12 91.0 55.9 74.1 54.0 54.4 11.9 92.3 3.8 582.6 0.27 0.228 13 90.9 59.6 74.0 47.2 50.4 13.9 97.7 4.1 626.3 0.30 0.248 14 86.4 53.7 70.3 44.0 45.4 11.5 91.6 3.8 649.5 0.28 0.238 15 88.6 54.3 70.8 45.1 46.2 13.1 102.1 4.3 624.9 0.30 0.238 16 91.0 55.9 72.8 41.4 46.0 29.4 111.7 4.7 621.3 0.32 0.258 17 81.2 57.7 70.7 44.3 47.3 23.5 135.1 5.6 425.0 0.26 0.198 18 73.3 54.6 63.7 73.9 54.8 0.33 25.1 122.2 5.1 418.3 0.17 0.148 19 87.0 52.4 67.8 63.2 52.5 11.5 65.9 2.7 564.9 0.23 0.198 20 92.4 54.7 75.5 42.6 47.2 16.4 78.6 3.3 599.0 0.28 0.22
8 of 13
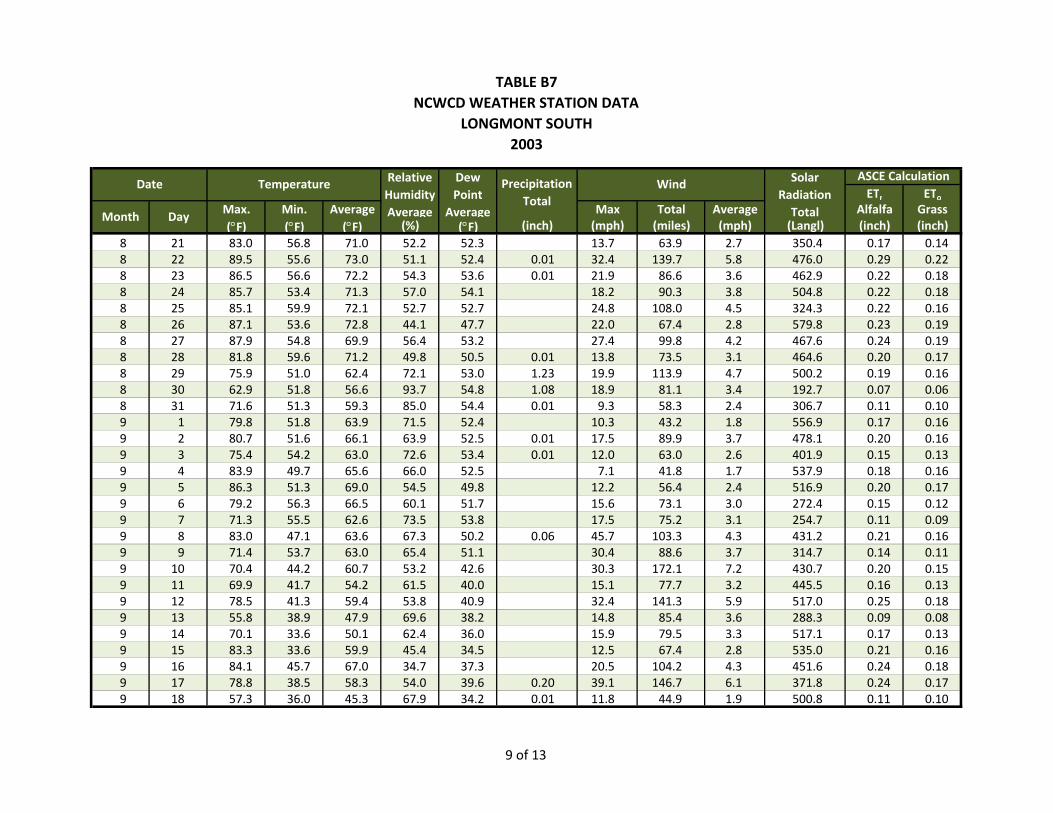
TABLE B7NCWCD WEATHER STATION DATA
LONGMONT SOUTH 2003
ETr EToMax. Min. Average Max Total Average Alfalfa Grass(°F) (°F) (°F) (%) (°F) (inch) (mph) (miles) (mph) (Langl) (inch) (inch)
Solar Radiation Total
ASCE Calculation
Month Day
Date Temperature Relative Humidity Average
Dew Point
Average
Precipitation Total
Wind
8 21 83.0 56.8 71.0 52.2 52.3 13.7 63.9 2.7 350.4 0.17 0.148 22 89.5 55.6 73.0 51.1 52.4 0.01 32.4 139.7 5.8 476.0 0.29 0.228 23 86.5 56.6 72.2 54.3 53.6 0.01 21.9 86.6 3.6 462.9 0.22 0.188 24 85.7 53.4 71.3 57.0 54.1 18.2 90.3 3.8 504.8 0.22 0.188 25 85.1 59.9 72.1 52.7 52.7 24.8 108.0 4.5 324.3 0.22 0.168 26 87.1 53.6 72.8 44.1 47.7 22.0 67.4 2.8 579.8 0.23 0.198 27 87.9 54.8 69.9 56.4 53.2 27.4 99.8 4.2 467.6 0.24 0.198 28 81.8 59.6 71.2 49.8 50.5 0.01 13.8 73.5 3.1 464.6 0.20 0.178 29 75.9 51.0 62.4 72.1 53.0 1.23 19.9 113.9 4.7 500.2 0.19 0.168 30 62.9 51.8 56.6 93.7 54.8 1.08 18.9 81.1 3.4 192.7 0.07 0.068 31 71.6 51.3 59.3 85.0 54.4 0.01 9.3 58.3 2.4 306.7 0.11 0.109 1 79.8 51.8 63.9 71.5 52.4 10.3 43.2 1.8 556.9 0.17 0.169 2 80.7 51.6 66.1 63.9 52.5 0.01 17.5 89.9 3.7 478.1 0.20 0.169 3 75.4 54.2 63.0 72.6 53.4 0.01 12.0 63.0 2.6 401.9 0.15 0.139 4 83.9 49.7 65.6 66.0 52.5 7.1 41.8 1.7 537.9 0.18 0.169 5 86.3 51.3 69.0 54.5 49.8 12.2 56.4 2.4 516.9 0.20 0.179 6 79.2 56.3 66.5 60.1 51.7 15.6 73.1 3.0 272.4 0.15 0.129 7 71.3 55.5 62.6 73.5 53.8 17.5 75.2 3.1 254.7 0.11 0.099 8 83.0 47.1 63.6 67.3 50.2 0.06 45.7 103.3 4.3 431.2 0.21 0.169 9 71.4 53.7 63.0 65.4 51.1 30.4 88.6 3.7 314.7 0.14 0.119 10 70.4 44.2 60.7 53.2 42.6 30.3 172.1 7.2 430.7 0.20 0.159 11 69.9 41.7 54.2 61.5 40.0 15.1 77.7 3.2 445.5 0.16 0.139 12 78.5 41.3 59.4 53.8 40.9 32.4 141.3 5.9 517.0 0.25 0.189 13 55.8 38.9 47.9 69.6 38.2 14.8 85.4 3.6 288.3 0.09 0.089 14 70.1 33.6 50.1 62.4 36.0 15.9 79.5 3.3 517.1 0.17 0.139 15 83.3 33.6 59.9 45.4 34.5 12.5 67.4 2.8 535.0 0.21 0.169 16 84.1 45.7 67.0 34.7 37.3 20.5 104.2 4.3 451.6 0.24 0.189 17 78.8 38.5 58.3 54.0 39.6 0.20 39.1 146.7 6.1 371.8 0.24 0.179 18 57.3 36.0 45.3 67.9 34.2 0.01 11.8 44.9 1.9 500.8 0.11 0.10
9 of 13

TABLE B7NCWCD WEATHER STATION DATA
LONGMONT SOUTH 2003
ETr EToMax. Min. Average Max Total Average Alfalfa Grass(°F) (°F) (°F) (%) (°F) (inch) (mph) (miles) (mph) (Langl) (inch) (inch)
Solar Radiation Total
ASCE Calculation
Month Day
Date Temperature Relative Humidity Average
Dew Point
Average
Precipitation Total
Wind
9 19 70.5 33.4 52.2 55.7 34.5 12.0 57.3 2.4 496.2 0.15 0.129 20 74.3 38.3 56.7 53.9 37.7 0.01 21.7 63.2 2.6 340.1 0.14 0.119 21 73.8 37.8 56.1 53.8 37.9 0.01 24.5 75.7 3.2 496.8 0.17 0.149 22 77.7 37.7 55.9 56.5 39.3 12.3 64.6 2.7 491.1 0.17 0.149 23 83.5 39.6 62.8 40.3 34.1 0.01 26.6 117.5 4.9 500.7 0.26 0.199 24 66.3 41.1 55.8 47.2 36.0 12.4 59.4 2.5 476.1 0.14 0.119 25 87.1 34.2 60.4 45.5 33.4 15.6 70.3 2.9 481.3 0.22 0.169 26 77.1 45.3 61.9 38.1 34.6 17.2 54.6 2.3 465.9 0.16 0.139 27 71.3 38.6 54.7 54.2 36.5 11.0 66.9 2.8 450.5 0.15 0.129 28 69.2 35.0 53.0 50.9 33.3 14.0 56.8 2.4 454.6 0.14 0.119 29 64.8 36.5 51.7 55.2 35.1 22.6 70.1 2.9 439.5 0.13 0.109 30 49.8 35.1 43.8 73.9 36.0 12.9 81.4 3.4 223.1 0.07 0.0510 1 65.0 31.2 47.1 74.7 38.6 8.8 36.1 1.5 330.6 0.09 0.0710 2 69.4 39.5 54.8 65.1 42.6 16.2 66.2 2.8 297.5 0.11 0.0910 3 66.3 46.1 56.3 54.3 38.4 9.3 45.8 1.9 307.3 0.10 0.0810 4 72.3 39.9 54.5 51.0 35.5 12.1 53.6 2.2 415.2 0.13 0.1010 5 77.2 36.6 58.1 47.6 34.9 15.2 85.3 3.6 409.6 0.18 0.1310 6 78.1 40.0 59.5 40.2 32.1 10.0 60.7 2.5 419.4 0.16 0.1210 7 79.2 39.5 59.4 40.4 32.4 10.7 65.6 2.7 356.5 0.16 0.1210 8 79.6 46.8 63.0 38.4 35.5 19.7 71.4 3.0 369.6 0.17 0.1210 9 85.8 40.9 63.0 41.7 35.8 10.9 65.1 2.7 400.3 0.18 0.1310 10 81.7 45.6 62.8 41.4 36.5 32.7 107.0 4.5 345.9 0.22 0.1510 11 60.4 35.9 48.6 43.3 25.8 0.01 16.6 92.3 3.8 416.5 0.14 0.1010 12 82.8 28.8 55.5 36.1 23.0 20.3 102.6 4.3 423.1 0.24 0.1610 13 64.1 31.0 50.2 34.1 21.5 0.01 40.9 175.9 7.3 383.1 0.20 0.1410 14 66.4 28.3 46.0 40.4 20.0 18.4 88.8 3.7 414.0 0.16 0.1110 15 71.6 30.1 50.5 33.1 19.3 15.5 75.5 3.1 329.0 0.16 0.1110 16 73.3 32.5 50.1 42.4 26.2 17.5 77.1 3.2 385.4 0.16 0.1110 17 83.8 32.8 59.4 40.3 29.9 14.8 87.0 3.6 383.9 0.20 0.14
10 of 13
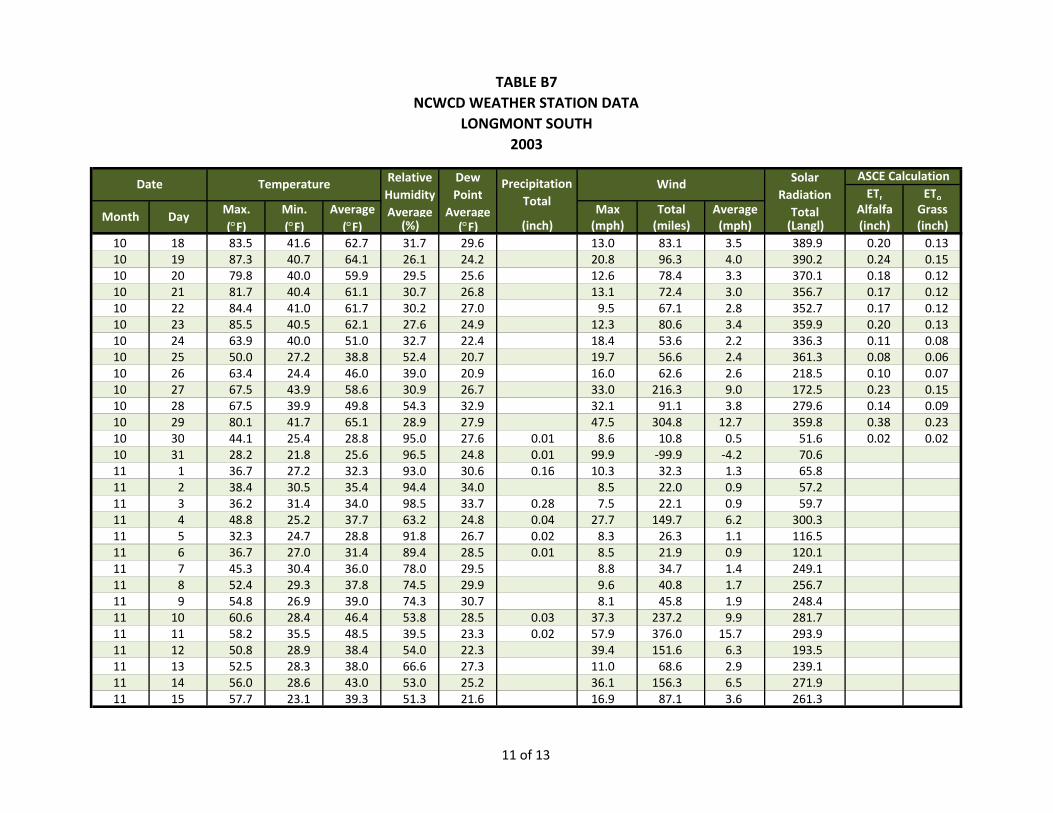
TABLE B7NCWCD WEATHER STATION DATA
LONGMONT SOUTH 2003
ETr EToMax. Min. Average Max Total Average Alfalfa Grass(°F) (°F) (°F) (%) (°F) (inch) (mph) (miles) (mph) (Langl) (inch) (inch)
Solar Radiation Total
ASCE Calculation
Month Day
Date Temperature Relative Humidity Average
Dew Point
Average
Precipitation Total
Wind
10 18 83.5 41.6 62.7 31.7 29.6 13.0 83.1 3.5 389.9 0.20 0.1310 19 87.3 40.7 64.1 26.1 24.2 20.8 96.3 4.0 390.2 0.24 0.1510 20 79.8 40.0 59.9 29.5 25.6 12.6 78.4 3.3 370.1 0.18 0.1210 21 81.7 40.4 61.1 30.7 26.8 13.1 72.4 3.0 356.7 0.17 0.1210 22 84.4 41.0 61.7 30.2 27.0 9.5 67.1 2.8 352.7 0.17 0.1210 23 85.5 40.5 62.1 27.6 24.9 12.3 80.6 3.4 359.9 0.20 0.1310 24 63.9 40.0 51.0 32.7 22.4 18.4 53.6 2.2 336.3 0.11 0.0810 25 50.0 27.2 38.8 52.4 20.7 19.7 56.6 2.4 361.3 0.08 0.0610 26 63.4 24.4 46.0 39.0 20.9 16.0 62.6 2.6 218.5 0.10 0.0710 27 67.5 43.9 58.6 30.9 26.7 33.0 216.3 9.0 172.5 0.23 0.1510 28 67.5 39.9 49.8 54.3 32.9 32.1 91.1 3.8 279.6 0.14 0.0910 29 80.1 41.7 65.1 28.9 27.9 47.5 304.8 12.7 359.8 0.38 0.2310 30 44.1 25.4 28.8 95.0 27.6 0.01 8.6 10.8 0.5 51.6 0.02 0.0210 31 28.2 21.8 25.6 96.5 24.8 0.01 99.9 ‐99.9 ‐4.2 70.611 1 36.7 27.2 32.3 93.0 30.6 0.16 10.3 32.3 1.3 65.811 2 38.4 30.5 35.4 94.4 34.0 8.5 22.0 0.9 57.211 3 36.2 31.4 34.0 98.5 33.7 0.28 7.5 22.1 0.9 59.711 4 48.8 25.2 37.7 63.2 24.8 0.04 27.7 149.7 6.2 300.311 5 32.3 24.7 28.8 91.8 26.7 0.02 8.3 26.3 1.1 116.511 6 36.7 27.0 31.4 89.4 28.5 0.01 8.5 21.9 0.9 120.111 7 45.3 30.4 36.0 78.0 29.5 8.8 34.7 1.4 249.111 8 52.4 29.3 37.8 74.5 29.9 9.6 40.8 1.7 256.711 9 54.8 26.9 39.0 74.3 30.7 8.1 45.8 1.9 248.411 10 60.6 28.4 46.4 53.8 28.5 0.03 37.3 237.2 9.9 281.711 11 58.2 35.5 48.5 39.5 23.3 0.02 57.9 376.0 15.7 293.911 12 50.8 28.9 38.4 54.0 22.3 39.4 151.6 6.3 193.511 13 52.5 28.3 38.0 66.6 27.3 11.0 68.6 2.9 239.111 14 56.0 28.6 43.0 53.0 25.2 36.1 156.3 6.5 271.911 15 57.7 23.1 39.3 51.3 21.6 16.9 87.1 3.6 261.3
11 of 13
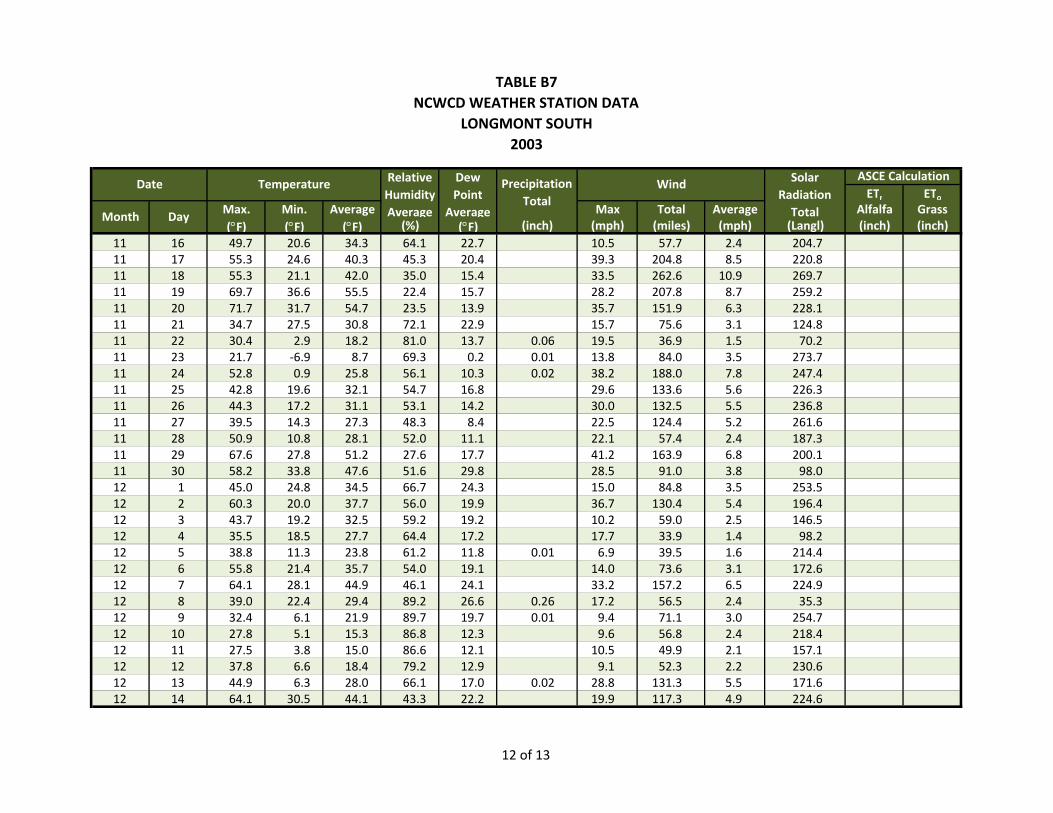
TABLE B7NCWCD WEATHER STATION DATA
LONGMONT SOUTH 2003
ETr EToMax. Min. Average Max Total Average Alfalfa Grass(°F) (°F) (°F) (%) (°F) (inch) (mph) (miles) (mph) (Langl) (inch) (inch)
Solar Radiation Total
ASCE Calculation
Month Day
Date Temperature Relative Humidity Average
Dew Point
Average
Precipitation Total
Wind
11 16 49.7 20.6 34.3 64.1 22.7 10.5 57.7 2.4 204.711 17 55.3 24.6 40.3 45.3 20.4 39.3 204.8 8.5 220.811 18 55.3 21.1 42.0 35.0 15.4 33.5 262.6 10.9 269.711 19 69.7 36.6 55.5 22.4 15.7 28.2 207.8 8.7 259.211 20 71.7 31.7 54.7 23.5 13.9 35.7 151.9 6.3 228.111 21 34.7 27.5 30.8 72.1 22.9 15.7 75.6 3.1 124.811 22 30.4 2.9 18.2 81.0 13.7 0.06 19.5 36.9 1.5 70.211 23 21.7 ‐6.9 8.7 69.3 0.2 0.01 13.8 84.0 3.5 273.711 24 52.8 0.9 25.8 56.1 10.3 0.02 38.2 188.0 7.8 247.411 25 42.8 19.6 32.1 54.7 16.8 29.6 133.6 5.6 226.311 26 44.3 17.2 31.1 53.1 14.2 30.0 132.5 5.5 236.811 27 39.5 14.3 27.3 48.3 8.4 22.5 124.4 5.2 261.611 28 50.9 10.8 28.1 52.0 11.1 22.1 57.4 2.4 187.311 29 67.6 27.8 51.2 27.6 17.7 41.2 163.9 6.8 200.111 30 58.2 33.8 47.6 51.6 29.8 28.5 91.0 3.8 98.012 1 45.0 24.8 34.5 66.7 24.3 15.0 84.8 3.5 253.512 2 60.3 20.0 37.7 56.0 19.9 36.7 130.4 5.4 196.412 3 43.7 19.2 32.5 59.2 19.2 10.2 59.0 2.5 146.512 4 35.5 18.5 27.7 64.4 17.2 17.7 33.9 1.4 98.212 5 38.8 11.3 23.8 61.2 11.8 0.01 6.9 39.5 1.6 214.412 6 55.8 21.4 35.7 54.0 19.1 14.0 73.6 3.1 172.612 7 64.1 28.1 44.9 46.1 24.1 33.2 157.2 6.5 224.912 8 39.0 22.4 29.4 89.2 26.6 0.26 17.2 56.5 2.4 35.312 9 32.4 6.1 21.9 89.7 19.7 0.01 9.4 71.1 3.0 254.712 10 27.8 5.1 15.3 86.8 12.3 9.6 56.8 2.4 218.412 11 27.5 3.8 15.0 86.6 12.1 10.5 49.9 2.1 157.112 12 37.8 6.6 18.4 79.2 12.9 9.1 52.3 2.2 230.612 13 44.9 6.3 28.0 66.1 17.0 0.02 28.8 131.3 5.5 171.612 14 64.1 30.5 44.1 43.3 22.2 19.9 117.3 4.9 224.6
12 of 13
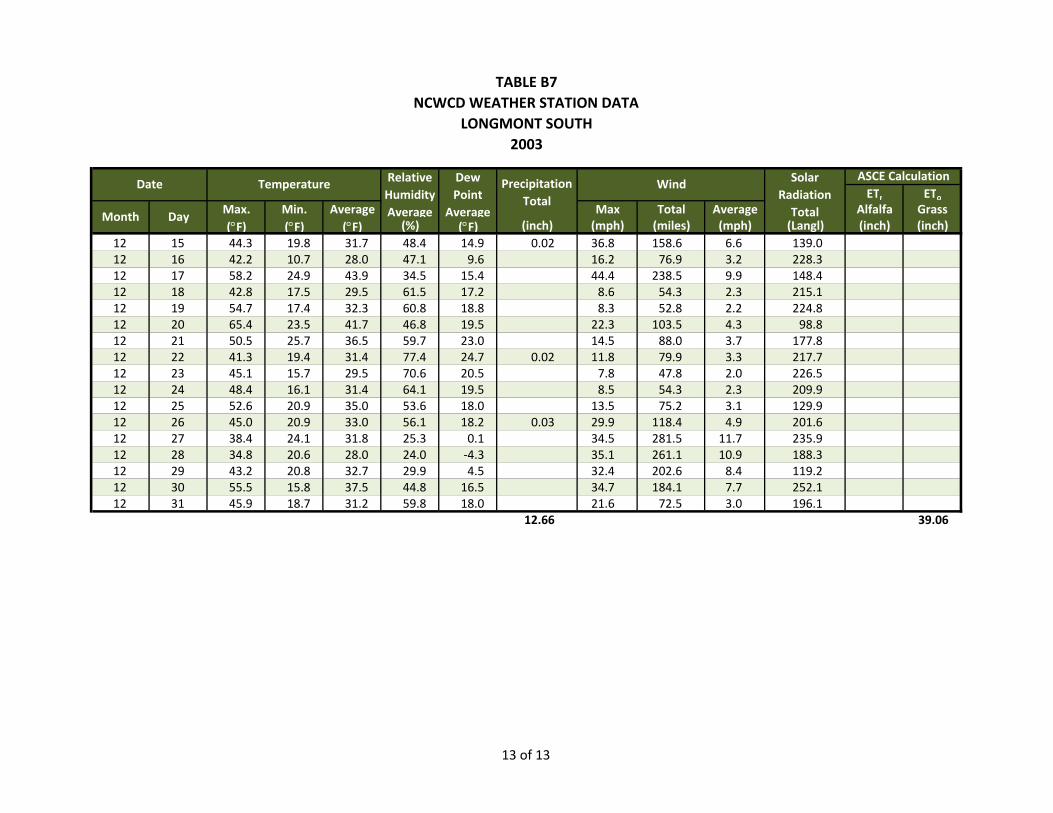
TABLE B7NCWCD WEATHER STATION DATA
LONGMONT SOUTH 2003
ETr EToMax. Min. Average Max Total Average Alfalfa Grass(°F) (°F) (°F) (%) (°F) (inch) (mph) (miles) (mph) (Langl) (inch) (inch)
Solar Radiation Total
ASCE Calculation
Month Day
Date Temperature Relative Humidity Average
Dew Point
Average
Precipitation Total
Wind
12 15 44.3 19.8 31.7 48.4 14.9 0.02 36.8 158.6 6.6 139.012 16 42.2 10.7 28.0 47.1 9.6 16.2 76.9 3.2 228.312 17 58.2 24.9 43.9 34.5 15.4 44.4 238.5 9.9 148.412 18 42.8 17.5 29.5 61.5 17.2 8.6 54.3 2.3 215.112 19 54.7 17.4 32.3 60.8 18.8 8.3 52.8 2.2 224.812 20 65.4 23.5 41.7 46.8 19.5 22.3 103.5 4.3 98.812 21 50.5 25.7 36.5 59.7 23.0 14.5 88.0 3.7 177.812 22 41.3 19.4 31.4 77.4 24.7 0.02 11.8 79.9 3.3 217.712 23 45.1 15.7 29.5 70.6 20.5 7.8 47.8 2.0 226.512 24 48.4 16.1 31.4 64.1 19.5 8.5 54.3 2.3 209.912 25 52.6 20.9 35.0 53.6 18.0 13.5 75.2 3.1 129.912 26 45.0 20.9 33.0 56.1 18.2 0.03 29.9 118.4 4.9 201.612 27 38.4 24.1 31.8 25.3 0.1 34.5 281.5 11.7 235.912 28 34.8 20.6 28.0 24.0 ‐4.3 35.1 261.1 10.9 188.312 29 43.2 20.8 32.7 29.9 4.5 32.4 202.6 8.4 119.212 30 55.5 15.8 37.5 44.8 16.5 34.7 184.1 7.7 252.112 31 45.9 18.7 31.2 59.8 18.0 21.6 72.5 3.0 196.1
12.66 39.06
13 of 13
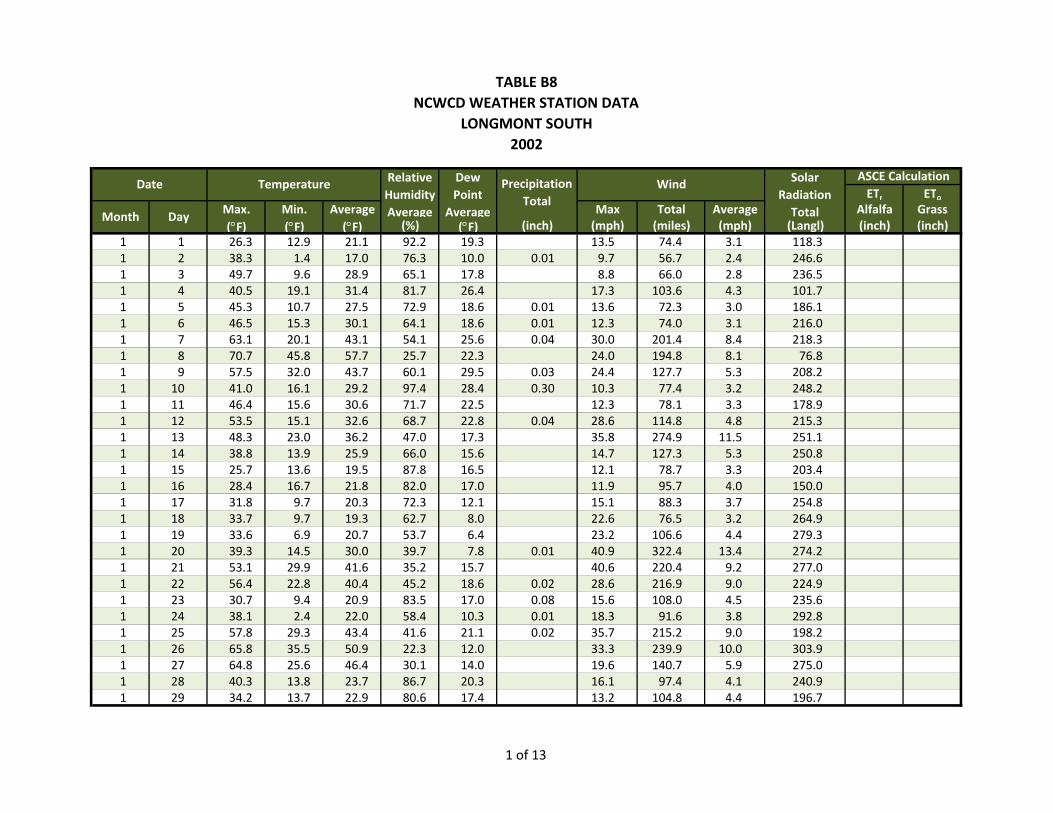
TABLE B8NCWCD WEATHER STATION DATA
LONGMONT SOUTH 2002
ETr EToMax. Min. Average Max Total Average Alfalfa Grass(°F) (°F) (°F) (%) (°F) (inch) (mph) (miles) (mph) (Langl) (inch) (inch)
1 1 26.3 12.9 21.1 92.2 19.3 13.5 74.4 3.1 118.31 2 38.3 1.4 17.0 76.3 10.0 0.01 9.7 56.7 2.4 246.61 3 49.7 9.6 28.9 65.1 17.8 8.8 66.0 2.8 236.51 4 40.5 19.1 31.4 81.7 26.4 17.3 103.6 4.3 101.71 5 45.3 10.7 27.5 72.9 18.6 0.01 13.6 72.3 3.0 186.11 6 46.5 15.3 30.1 64.1 18.6 0.01 12.3 74.0 3.1 216.01 7 63.1 20.1 43.1 54.1 25.6 0.04 30.0 201.4 8.4 218.31 8 70.7 45.8 57.7 25.7 22.3 24.0 194.8 8.1 76.81 9 57.5 32.0 43.7 60.1 29.5 0.03 24.4 127.7 5.3 208.21 10 41.0 16.1 29.2 97.4 28.4 0.30 10.3 77.4 3.2 248.21 11 46.4 15.6 30.6 71.7 22.5 12.3 78.1 3.3 178.91 12 53.5 15.1 32.6 68.7 22.8 0.04 28.6 114.8 4.8 215.31 13 48.3 23.0 36.2 47.0 17.3 35.8 274.9 11.5 251.11 14 38.8 13.9 25.9 66.0 15.6 14.7 127.3 5.3 250.81 15 25.7 13.6 19.5 87.8 16.5 12.1 78.7 3.3 203.41 16 28.4 16.7 21.8 82.0 17.0 11.9 95.7 4.0 150.01 17 31.8 9.7 20.3 72.3 12.1 15.1 88.3 3.7 254.81 18 33.7 9.7 19.3 62.7 8.0 22.6 76.5 3.2 264.91 19 33.6 6.9 20.7 53.7 6.4 23.2 106.6 4.4 279.31 20 39.3 14.5 30.0 39.7 7.8 0.01 40.9 322.4 13.4 274.21 21 53.1 29.9 41.6 35.2 15.7 40.6 220.4 9.2 277.01 22 56.4 22.8 40.4 45.2 18.6 0.02 28.6 216.9 9.0 224.91 23 30.7 9.4 20.9 83.5 17.0 0.08 15.6 108.0 4.5 235.61 24 38.1 2.4 22.0 58.4 10.3 0.01 18.3 91.6 3.8 292.81 25 57.8 29.3 43.4 41.6 21.1 0.02 35.7 215.2 9.0 198.21 26 65.8 35.5 50.9 22.3 12.0 33.3 239.9 10.0 303.91 27 64.8 25.6 46.4 30.1 14.0 19.6 140.7 5.9 275.01 28 40.3 13.8 23.7 86.7 20.3 16.1 97.4 4.1 240.91 29 34.2 13.7 22.9 80.6 17.4 13.2 104.8 4.4 196.7
Solar Radiation Total
ASCE Calculation
Month Day
Date Temperature Relative Humidity Average
Dew Point
Average
Precipitation Total
Wind
1 of 13

TABLE B8NCWCD WEATHER STATION DATA
LONGMONT SOUTH 2002
ETr EToMax. Min. Average Max Total Average Alfalfa Grass(°F) (°F) (°F) (%) (°F) (inch) (mph) (miles) (mph) (Langl) (inch) (inch)
Solar Radiation Total
ASCE Calculation
Month Day
Date Temperature Relative Humidity Average
Dew Point
Average
Precipitation Total
Wind
1 30 25.7 9.2 18.6 93.0 17.0 0.05 12.7 98.7 4.1 266.41 31 32.0 2.4 17.9 63.1 6.3 0.01 11.5 77.8 3.2 321.22 1 37.6 9.1 22.9 64.1 12.2 0.01 9.0 65.3 2.7 315.82 2 45.5 15.3 29.4 58.0 14.4 16.1 100.4 4.2 259.42 3 49.7 13.8 30.6 59.2 16.4 12.8 94.8 4.0 323.82 4 48.9 14.2 30.4 53.6 13.8 0.02 21.0 110.4 4.6 316.62 5 40.5 15.2 27.8 48.0 9.2 11.3 77.4 3.2 332.52 6 53.1 13.8 32.8 45.1 11.0 19.8 95.8 4.0 338.52 7 60.9 14.4 39.3 33.3 7.2 0.01 26.0 143.2 6.0 227.92 8 56.8 26.0 39.3 32.0 10.7 0.02 49.4 332.0 13.8 272.62 9 36.9 15.9 32.2 34.0 6.9 48.5 423.2 17.6 82.52 10 51.1 10.4 29.8 32.9 ‐0.1 17.2 91.3 3.8 358.22 11 64.5 20.7 44.1 27.7 7.2 0.01 40.7 233.6 9.7 211.72 12 33.4 18.2 25.8 62.2 14.4 15.1 84.7 3.5 220.32 13 57.2 10.0 32.2 44.7 6.1 13.2 72.0 3.0 355.52 14 51.3 15.6 36.0 56.7 17.3 0.01 45.1 256.9 10.7 160.02 15 57.4 8.1 30.3 65.2 17.5 0.02 10.2 71.2 3.0 357.22 16 54.5 15.5 34.9 44.6 13.1 11.3 93.4 3.9 377.22 17 65.9 25.7 45.0 36.5 16.1 0.01 20.5 130.1 5.4 350.12 18 55.6 29.3 42.6 50.0 24.5 0.01 23.5 103.8 4.3 275.82 19 53.6 24.1 39.2 49.9 20.4 0.01 31.6 169.2 7.0 377.42 20 54.4 28.1 42.1 40.5 18.4 33.3 241.7 10.1 338.62 21 48.8 22.8 36.1 39.5 11.6 24.4 118.1 4.9 401.52 22 67.5 23.2 51.1 24.9 12.7 38.2 344.2 14.3 327.22 23 75.2 39.9 59.8 18.0 15.3 36.4 229.8 9.6 371.72 24 54.7 24.0 35.4 70.3 25.7 25.9 149.0 6.2 271.92 25 24.5 4.6 10.0 88.5 7.9 0.10 23.7 172.1 7.2 340.42 26 24.4 ‐8.1 10.5 72.2 2.7 0.02 11.8 83.0 3.5 413.62 27 34.6 4.9 21.4 67.1 12.0 0.01 16.2 107.0 4.5 401.8
2 of 13
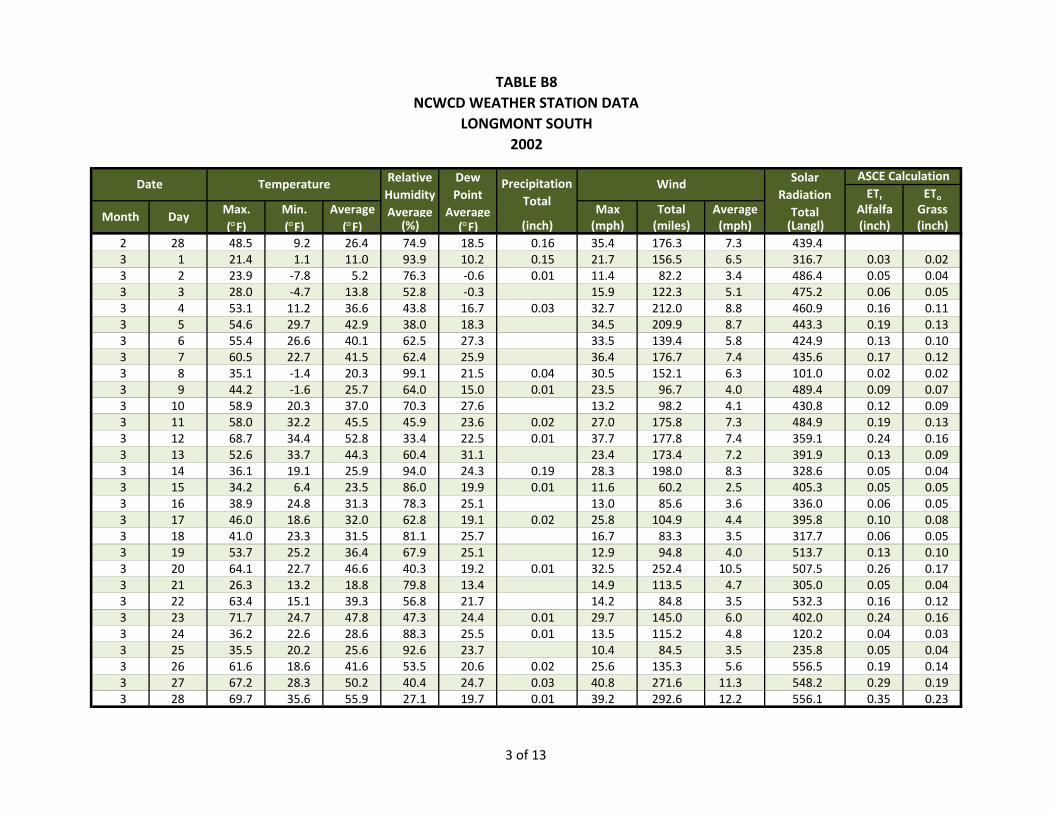
TABLE B8NCWCD WEATHER STATION DATA
LONGMONT SOUTH 2002
ETr EToMax. Min. Average Max Total Average Alfalfa Grass(°F) (°F) (°F) (%) (°F) (inch) (mph) (miles) (mph) (Langl) (inch) (inch)
Solar Radiation Total
ASCE Calculation
Month Day
Date Temperature Relative Humidity Average
Dew Point
Average
Precipitation Total
Wind
2 28 48.5 9.2 26.4 74.9 18.5 0.16 35.4 176.3 7.3 439.43 1 21.4 1.1 11.0 93.9 10.2 0.15 21.7 156.5 6.5 316.7 0.03 0.023 2 23.9 ‐7.8 5.2 76.3 ‐0.6 0.01 11.4 82.2 3.4 486.4 0.05 0.043 3 28.0 ‐4.7 13.8 52.8 ‐0.3 15.9 122.3 5.1 475.2 0.06 0.053 4 53.1 11.2 36.6 43.8 16.7 0.03 32.7 212.0 8.8 460.9 0.16 0.113 5 54.6 29.7 42.9 38.0 18.3 34.5 209.9 8.7 443.3 0.19 0.133 6 55.4 26.6 40.1 62.5 27.3 33.5 139.4 5.8 424.9 0.13 0.103 7 60.5 22.7 41.5 62.4 25.9 36.4 176.7 7.4 435.6 0.17 0.123 8 35.1 ‐1.4 20.3 99.1 21.5 0.04 30.5 152.1 6.3 101.0 0.02 0.023 9 44.2 ‐1.6 25.7 64.0 15.0 0.01 23.5 96.7 4.0 489.4 0.09 0.073 10 58.9 20.3 37.0 70.3 27.6 13.2 98.2 4.1 430.8 0.12 0.093 11 58.0 32.2 45.5 45.9 23.6 0.02 27.0 175.8 7.3 484.9 0.19 0.133 12 68.7 34.4 52.8 33.4 22.5 0.01 37.7 177.8 7.4 359.1 0.24 0.163 13 52.6 33.7 44.3 60.4 31.1 23.4 173.4 7.2 391.9 0.13 0.093 14 36.1 19.1 25.9 94.0 24.3 0.19 28.3 198.0 8.3 328.6 0.05 0.043 15 34.2 6.4 23.5 86.0 19.9 0.01 11.6 60.2 2.5 405.3 0.05 0.053 16 38.9 24.8 31.3 78.3 25.1 13.0 85.6 3.6 336.0 0.06 0.053 17 46.0 18.6 32.0 62.8 19.1 0.02 25.8 104.9 4.4 395.8 0.10 0.083 18 41.0 23.3 31.5 81.1 25.7 16.7 83.3 3.5 317.7 0.06 0.053 19 53.7 25.2 36.4 67.9 25.1 12.9 94.8 4.0 513.7 0.13 0.103 20 64.1 22.7 46.6 40.3 19.2 0.01 32.5 252.4 10.5 507.5 0.26 0.173 21 26.3 13.2 18.8 79.8 13.4 14.9 113.5 4.7 305.0 0.05 0.043 22 63.4 15.1 39.3 56.8 21.7 14.2 84.8 3.5 532.3 0.16 0.123 23 71.7 24.7 47.8 47.3 24.4 0.01 29.7 145.0 6.0 402.0 0.24 0.163 24 36.2 22.6 28.6 88.3 25.5 0.01 13.5 115.2 4.8 120.2 0.04 0.033 25 35.5 20.2 25.6 92.6 23.7 10.4 84.5 3.5 235.8 0.05 0.043 26 61.6 18.6 41.6 53.5 20.6 0.02 25.6 135.3 5.6 556.5 0.19 0.143 27 67.2 28.3 50.2 40.4 24.7 0.03 40.8 271.6 11.3 548.2 0.29 0.193 28 69.7 35.6 55.9 27.1 19.7 0.01 39.2 292.6 12.2 556.1 0.35 0.23
3 of 13
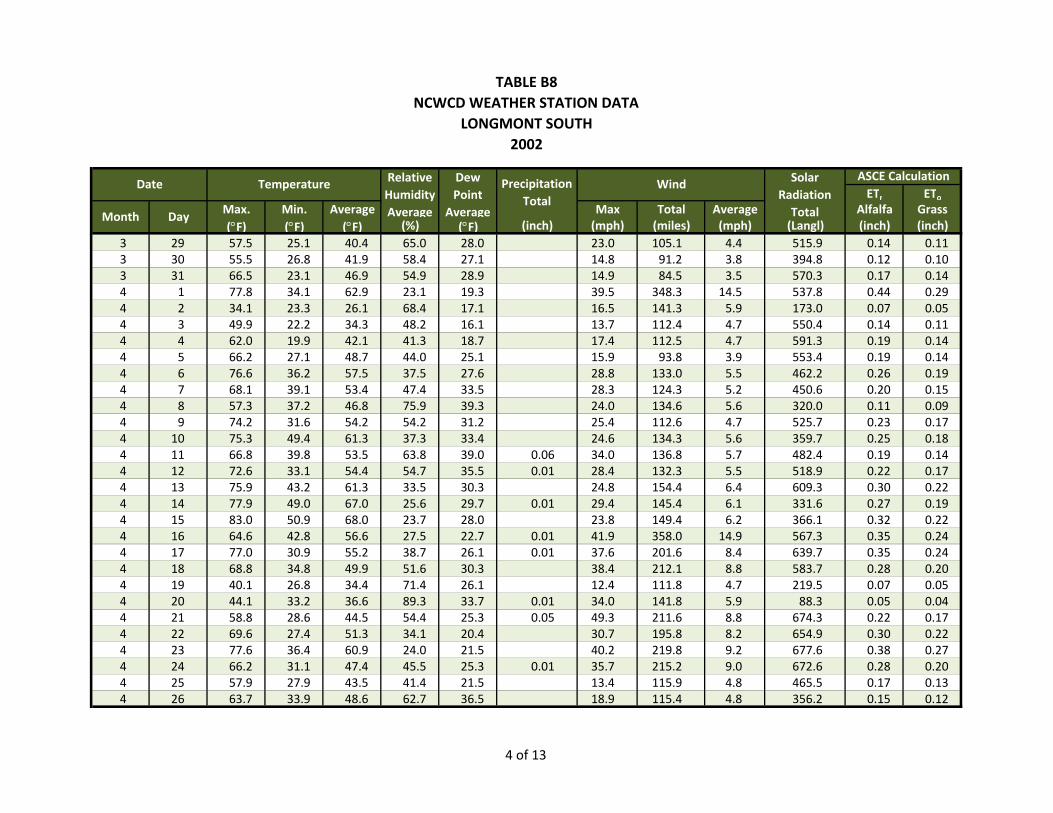
TABLE B8NCWCD WEATHER STATION DATA
LONGMONT SOUTH 2002
ETr EToMax. Min. Average Max Total Average Alfalfa Grass(°F) (°F) (°F) (%) (°F) (inch) (mph) (miles) (mph) (Langl) (inch) (inch)
Solar Radiation Total
ASCE Calculation
Month Day
Date Temperature Relative Humidity Average
Dew Point
Average
Precipitation Total
Wind
3 29 57.5 25.1 40.4 65.0 28.0 23.0 105.1 4.4 515.9 0.14 0.113 30 55.5 26.8 41.9 58.4 27.1 14.8 91.2 3.8 394.8 0.12 0.103 31 66.5 23.1 46.9 54.9 28.9 14.9 84.5 3.5 570.3 0.17 0.144 1 77.8 34.1 62.9 23.1 19.3 39.5 348.3 14.5 537.8 0.44 0.294 2 34.1 23.3 26.1 68.4 17.1 16.5 141.3 5.9 173.0 0.07 0.054 3 49.9 22.2 34.3 48.2 16.1 13.7 112.4 4.7 550.4 0.14 0.114 4 62.0 19.9 42.1 41.3 18.7 17.4 112.5 4.7 591.3 0.19 0.144 5 66.2 27.1 48.7 44.0 25.1 15.9 93.8 3.9 553.4 0.19 0.144 6 76.6 36.2 57.5 37.5 27.6 28.8 133.0 5.5 462.2 0.26 0.194 7 68.1 39.1 53.4 47.4 33.5 28.3 124.3 5.2 450.6 0.20 0.154 8 57.3 37.2 46.8 75.9 39.3 24.0 134.6 5.6 320.0 0.11 0.094 9 74.2 31.6 54.2 54.2 31.2 25.4 112.6 4.7 525.7 0.23 0.174 10 75.3 49.4 61.3 37.3 33.4 24.6 134.3 5.6 359.7 0.25 0.184 11 66.8 39.8 53.5 63.8 39.0 0.06 34.0 136.8 5.7 482.4 0.19 0.144 12 72.6 33.1 54.4 54.7 35.5 0.01 28.4 132.3 5.5 518.9 0.22 0.174 13 75.9 43.2 61.3 33.5 30.3 24.8 154.4 6.4 609.3 0.30 0.224 14 77.9 49.0 67.0 25.6 29.7 0.01 29.4 145.4 6.1 331.6 0.27 0.194 15 83.0 50.9 68.0 23.7 28.0 23.8 149.4 6.2 366.1 0.32 0.224 16 64.6 42.8 56.6 27.5 22.7 0.01 41.9 358.0 14.9 567.3 0.35 0.244 17 77.0 30.9 55.2 38.7 26.1 0.01 37.6 201.6 8.4 639.7 0.35 0.244 18 68.8 34.8 49.9 51.6 30.3 38.4 212.1 8.8 583.7 0.28 0.204 19 40.1 26.8 34.4 71.4 26.1 12.4 111.8 4.7 219.5 0.07 0.054 20 44.1 33.2 36.6 89.3 33.7 0.01 34.0 141.8 5.9 88.3 0.05 0.044 21 58.8 28.6 44.5 54.4 25.3 0.05 49.3 211.6 8.8 674.3 0.22 0.174 22 69.6 27.4 51.3 34.1 20.4 30.7 195.8 8.2 654.9 0.30 0.224 23 77.6 36.4 60.9 24.0 21.5 40.2 219.8 9.2 677.6 0.38 0.274 24 66.2 31.1 47.4 45.5 25.3 0.01 35.7 215.2 9.0 672.6 0.28 0.204 25 57.9 27.9 43.5 41.4 21.5 13.4 115.9 4.8 465.5 0.17 0.134 26 63.7 33.9 48.6 62.7 36.5 18.9 115.4 4.8 356.2 0.15 0.12
4 of 13

TABLE B8NCWCD WEATHER STATION DATA
LONGMONT SOUTH 2002
ETr EToMax. Min. Average Max Total Average Alfalfa Grass(°F) (°F) (°F) (%) (°F) (inch) (mph) (miles) (mph) (Langl) (inch) (inch)
Solar Radiation Total
ASCE Calculation
Month Day
Date Temperature Relative Humidity Average
Dew Point
Average
Precipitation Total
Wind
4 27 68.0 41.5 51.3 70.3 39.6 0.04 38.3 186.2 7.8 454.4 0.22 0.164 28 73.1 29.5 53.4 54.1 31.6 43.0 255.8 10.7 689.9 0.33 0.234 29 77.7 36.1 59.5 40.0 33.0 20.5 140.8 5.9 663.8 0.30 0.224 30 75.3 37.2 57.4 51.8 39.0 21.6 131.2 5.5 680.6 0.26 0.205 1 52.9 32.7 43.2 89.7 40.9 0.01 22.4 174.4 7.3 108.6 0.05 0.045 2 59.8 32.9 43.1 81.3 36.8 0.04 15.1 85.8 3.6 472.9 0.13 0.115 3 72.0 34.4 56.1 41.1 29.4 0.03 29.0 226.0 9.4 690.3 0.32 0.235 4 69.5 36.2 53.3 57.5 37.6 23.6 101.5 4.2 550.7 0.20 0.165 5 79.1 37.5 61.5 38.4 31.5 24.7 133.8 5.6 649.0 0.30 0.235 6 82.7 40.8 64.4 29.7 28.9 28.6 127.2 5.3 615.8 0.32 0.245 7 66.6 41.0 53.6 70.9 44.0 22.6 106.7 4.4 527.5 0.17 0.145 8 67.1 36.9 51.9 59.6 36.8 0.01 27.3 212.8 8.9 591.9 0.24 0.185 9 63.1 27.4 45.4 41.8 22.3 14.6 90.4 3.8 688.1 0.21 0.175 10 59.9 35.0 50.2 48.1 30.8 14.7 104.9 4.4 359.7 0.15 0.125 11 57.3 41.6 48.5 87.5 44.7 0.32 22.6 141.6 5.9 171.9 0.08 0.065 12 56.2 39.5 45.6 81.7 39.5 0.16 16.4 124.6 5.2 367.9 0.12 0.105 13 71.7 34.7 54.3 56.0 36.1 15.2 78.3 3.3 728.8 0.23 0.195 14 75.1 39.8 56.5 57.7 40.2 0.03 38.3 108.9 4.5 326.3 0.19 0.145 15 76.4 44.2 60.0 54.4 42.6 32.2 136.7 5.7 463.7 0.24 0.185 16 52.9 43.6 46.9 93.7 45.1 0.15 18.3 116.2 4.8 93.6 0.05 0.045 17 59.6 45.1 51.7 86.8 47.2 0.02 10.4 62.6 2.6 316.5 0.10 0.095 18 70.7 40.1 56.6 79.0 49.5 15.3 100.7 4.2 638.3 0.19 0.175 19 68.6 44.6 56.7 75.9 48.8 0.01 15.6 133.1 5.5 677.6 0.20 0.175 20 62.8 46.6 52.5 88.0 49.1 0.01 11.8 96.6 4.0 311.9 0.11 0.095 21 85.7 44.1 61.1 60.3 42.5 0.06 38.6 221.6 9.2 533.3 0.40 0.275 22 67.5 42.0 56.9 24.3 20.1 0.01 37.6 329.5 13.7 757.7 0.40 0.285 23 62.9 38.6 49.5 60.1 35.2 0.62 23.7 167.5 7.0 505.5 0.20 0.165 24 52.4 32.4 40.3 95.0 38.9 0.65 13.0 69.4 2.9 333.3 0.08 0.085 25 72.3 38.3 54.7 70.6 43.6 0.01 12.6 76.5 3.2 558.3 0.19 0.16
5 of 13

TABLE B8NCWCD WEATHER STATION DATA
LONGMONT SOUTH 2002
ETr EToMax. Min. Average Max Total Average Alfalfa Grass(°F) (°F) (°F) (%) (°F) (inch) (mph) (miles) (mph) (Langl) (inch) (inch)
Solar Radiation Total
ASCE Calculation
Month Day
Date Temperature Relative Humidity Average
Dew Point
Average
Precipitation Total
Wind
5 26 77.4 43.2 62.3 49.5 41.3 0.01 19.4 106.0 4.4 606.1 0.25 0.205 27 79.5 45.4 62.7 55.0 45.0 0.03 26.2 131.4 5.5 642.1 0.28 0.225 28 82.3 48.3 67.2 47.8 44.8 26.6 108.1 4.5 715.4 0.29 0.245 29 84.4 51.5 69.5 47.1 46.8 15.2 80.2 3.3 581.1 0.25 0.215 30 90.1 50.7 74.3 44.8 49.4 28.6 96.6 4.0 729.0 0.31 0.265 31 90.5 56.0 74.2 46.4 51.0 27.4 104.7 4.4 633.9 0.31 0.256 1 83.3 53.3 69.0 57.8 52.9 33.4 95.6 4.0 418.2 0.21 0.176 2 90.6 50.7 72.8 42.1 44.9 18.6 130.9 5.5 689.7 0.36 0.286 3 73.3 50.6 62.3 72.2 52.5 0.34 26.2 159.3 6.6 528.9 0.21 0.176 4 64.8 48.2 55.1 87.4 50.9 0.17 12.0 69.7 2.9 252.4 0.09 0.086 5 76.2 43.4 61.5 68.5 48.6 0.02 13.7 84.2 3.5 572.4 0.20 0.186 6 86.9 49.6 69.2 51.4 48.6 0.03 26.2 109.2 4.5 600.1 0.29 0.236 7 91.9 50.9 72.5 49.4 50.1 32.0 139.0 5.8 545.5 0.33 0.256 8 84.5 49.3 67.9 66.1 56.1 14.2 99.0 4.1 539.8 0.23 0.196 9 95.2 53.0 75.0 41.0 48.1 15.7 130.5 5.4 570.4 0.36 0.276 10 79.8 52.7 65.1 43.1 40.7 19.6 160.1 6.7 498.2 0.31 0.236 11 79.1 45.4 63.9 55.3 45.8 15.6 85.4 3.6 702.4 0.25 0.226 12 81.3 49.6 66.3 46.1 43.3 16.9 95.6 4.0 722.3 0.29 0.246 13 73.9 47.6 62.6 54.4 45.7 14.4 91.8 3.8 640.6 0.23 0.196 14 80.6 48.7 65.4 52.8 47.0 15.9 88.7 3.7 637.2 0.25 0.216 15 80.3 51.1 65.2 60.2 49.5 23.2 105.7 4.4 394.6 0.21 0.176 16 83.7 49.0 66.7 63.9 52.1 0.01 23.4 106.7 4.4 647.0 0.27 0.226 17 94.9 50.6 74.8 38.4 42.4 23.8 105.2 4.4 645.7 0.35 0.276 18 97.1 58.3 78.8 23.5 36.2 14.3 93.9 3.9 696.5 0.37 0.286 19 88.4 57.0 72.6 44.8 48.4 0.27 25.7 163.3 6.8 577.5 0.36 0.276 20 82.1 56.2 69.0 74.0 59.5 0.03 27.2 106.5 4.4 510.4 0.21 0.186 21 89.6 59.5 74.3 51.7 54.6 0.03 32.7 156.1 6.5 508.9 0.32 0.246 22 92.5 57.4 72.8 61.3 56.8 0.01 24.1 93.4 3.9 532.0 0.28 0.226 23 93.2 57.2 76.9 36.7 45.6 0.01 22.3 121.1 5.0 745.0 0.38 0.30
6 of 13
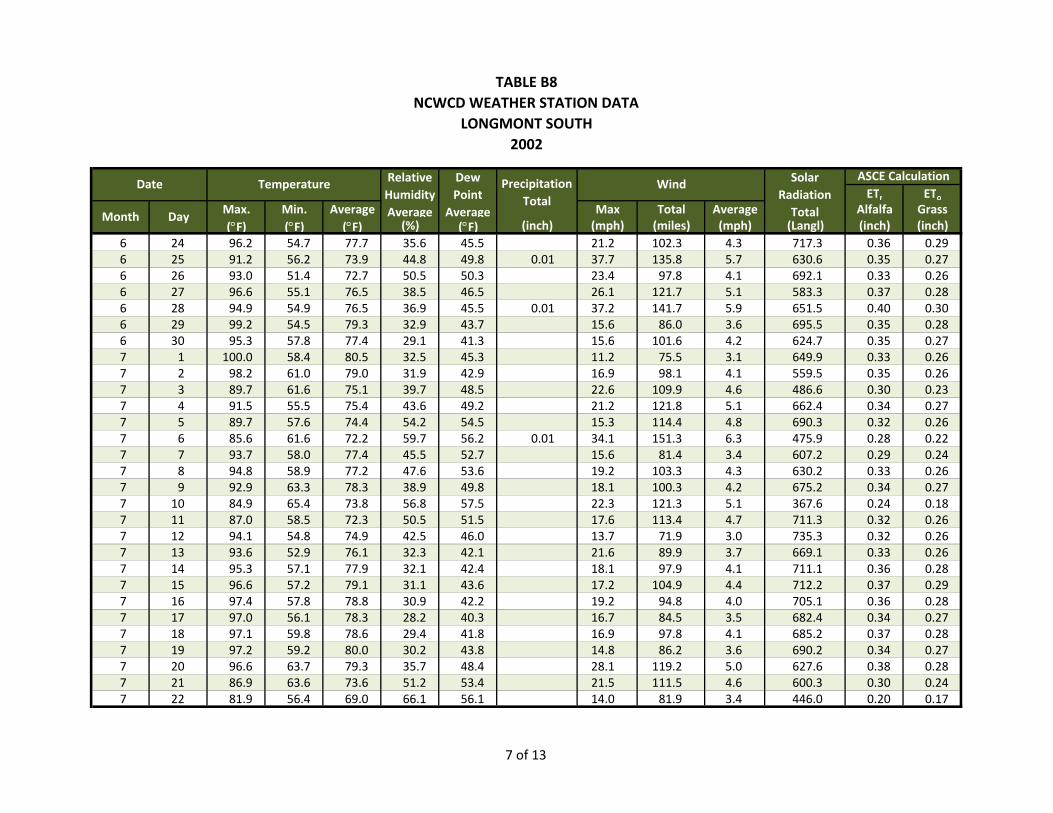
TABLE B8NCWCD WEATHER STATION DATA
LONGMONT SOUTH 2002
ETr EToMax. Min. Average Max Total Average Alfalfa Grass(°F) (°F) (°F) (%) (°F) (inch) (mph) (miles) (mph) (Langl) (inch) (inch)
Solar Radiation Total
ASCE Calculation
Month Day
Date Temperature Relative Humidity Average
Dew Point
Average
Precipitation Total
Wind
6 24 96.2 54.7 77.7 35.6 45.5 21.2 102.3 4.3 717.3 0.36 0.296 25 91.2 56.2 73.9 44.8 49.8 0.01 37.7 135.8 5.7 630.6 0.35 0.276 26 93.0 51.4 72.7 50.5 50.3 23.4 97.8 4.1 692.1 0.33 0.266 27 96.6 55.1 76.5 38.5 46.5 26.1 121.7 5.1 583.3 0.37 0.286 28 94.9 54.9 76.5 36.9 45.5 0.01 37.2 141.7 5.9 651.5 0.40 0.306 29 99.2 54.5 79.3 32.9 43.7 15.6 86.0 3.6 695.5 0.35 0.286 30 95.3 57.8 77.4 29.1 41.3 15.6 101.6 4.2 624.7 0.35 0.277 1 100.0 58.4 80.5 32.5 45.3 11.2 75.5 3.1 649.9 0.33 0.267 2 98.2 61.0 79.0 31.9 42.9 16.9 98.1 4.1 559.5 0.35 0.267 3 89.7 61.6 75.1 39.7 48.5 22.6 109.9 4.6 486.6 0.30 0.237 4 91.5 55.5 75.4 43.6 49.2 21.2 121.8 5.1 662.4 0.34 0.277 5 89.7 57.6 74.4 54.2 54.5 15.3 114.4 4.8 690.3 0.32 0.267 6 85.6 61.6 72.2 59.7 56.2 0.01 34.1 151.3 6.3 475.9 0.28 0.227 7 93.7 58.0 77.4 45.5 52.7 15.6 81.4 3.4 607.2 0.29 0.247 8 94.8 58.9 77.2 47.6 53.6 19.2 103.3 4.3 630.2 0.33 0.267 9 92.9 63.3 78.3 38.9 49.8 18.1 100.3 4.2 675.2 0.34 0.277 10 84.9 65.4 73.8 56.8 57.5 22.3 121.3 5.1 367.6 0.24 0.187 11 87.0 58.5 72.3 50.5 51.5 17.6 113.4 4.7 711.3 0.32 0.267 12 94.1 54.8 74.9 42.5 46.0 13.7 71.9 3.0 735.3 0.32 0.267 13 93.6 52.9 76.1 32.3 42.1 21.6 89.9 3.7 669.1 0.33 0.267 14 95.3 57.1 77.9 32.1 42.4 18.1 97.9 4.1 711.1 0.36 0.287 15 96.6 57.2 79.1 31.1 43.6 17.2 104.9 4.4 712.2 0.37 0.297 16 97.4 57.8 78.8 30.9 42.2 19.2 94.8 4.0 705.1 0.36 0.287 17 97.0 56.1 78.3 28.2 40.3 16.7 84.5 3.5 682.4 0.34 0.277 18 97.1 59.8 78.6 29.4 41.8 16.9 97.8 4.1 685.2 0.37 0.287 19 97.2 59.2 80.0 30.2 43.8 14.8 86.2 3.6 690.2 0.34 0.277 20 96.6 63.7 79.3 35.7 48.4 28.1 119.2 5.0 627.6 0.38 0.287 21 86.9 63.6 73.6 51.2 53.4 21.5 111.5 4.6 600.3 0.30 0.247 22 81.9 56.4 69.0 66.1 56.1 14.0 81.9 3.4 446.0 0.20 0.17
7 of 13
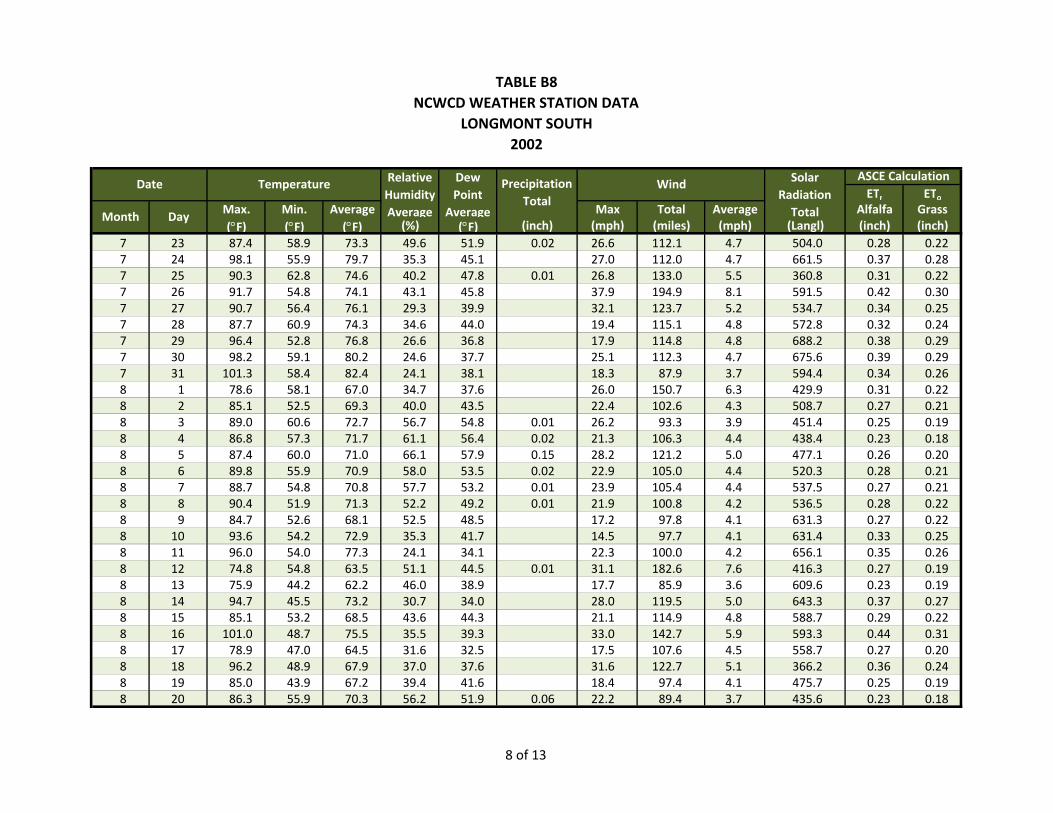
TABLE B8NCWCD WEATHER STATION DATA
LONGMONT SOUTH 2002
ETr EToMax. Min. Average Max Total Average Alfalfa Grass(°F) (°F) (°F) (%) (°F) (inch) (mph) (miles) (mph) (Langl) (inch) (inch)
Solar Radiation Total
ASCE Calculation
Month Day
Date Temperature Relative Humidity Average
Dew Point
Average
Precipitation Total
Wind
7 23 87.4 58.9 73.3 49.6 51.9 0.02 26.6 112.1 4.7 504.0 0.28 0.227 24 98.1 55.9 79.7 35.3 45.1 27.0 112.0 4.7 661.5 0.37 0.287 25 90.3 62.8 74.6 40.2 47.8 0.01 26.8 133.0 5.5 360.8 0.31 0.227 26 91.7 54.8 74.1 43.1 45.8 37.9 194.9 8.1 591.5 0.42 0.307 27 90.7 56.4 76.1 29.3 39.9 32.1 123.7 5.2 534.7 0.34 0.257 28 87.7 60.9 74.3 34.6 44.0 19.4 115.1 4.8 572.8 0.32 0.247 29 96.4 52.8 76.8 26.6 36.8 17.9 114.8 4.8 688.2 0.38 0.297 30 98.2 59.1 80.2 24.6 37.7 25.1 112.3 4.7 675.6 0.39 0.297 31 101.3 58.4 82.4 24.1 38.1 18.3 87.9 3.7 594.4 0.34 0.268 1 78.6 58.1 67.0 34.7 37.6 26.0 150.7 6.3 429.9 0.31 0.228 2 85.1 52.5 69.3 40.0 43.5 22.4 102.6 4.3 508.7 0.27 0.218 3 89.0 60.6 72.7 56.7 54.8 0.01 26.2 93.3 3.9 451.4 0.25 0.198 4 86.8 57.3 71.7 61.1 56.4 0.02 21.3 106.3 4.4 438.4 0.23 0.188 5 87.4 60.0 71.0 66.1 57.9 0.15 28.2 121.2 5.0 477.1 0.26 0.208 6 89.8 55.9 70.9 58.0 53.5 0.02 22.9 105.0 4.4 520.3 0.28 0.218 7 88.7 54.8 70.8 57.7 53.2 0.01 23.9 105.4 4.4 537.5 0.27 0.218 8 90.4 51.9 71.3 52.2 49.2 0.01 21.9 100.8 4.2 536.5 0.28 0.228 9 84.7 52.6 68.1 52.5 48.5 17.2 97.8 4.1 631.3 0.27 0.228 10 93.6 54.2 72.9 35.3 41.7 14.5 97.7 4.1 631.4 0.33 0.258 11 96.0 54.0 77.3 24.1 34.1 22.3 100.0 4.2 656.1 0.35 0.268 12 74.8 54.8 63.5 51.1 44.5 0.01 31.1 182.6 7.6 416.3 0.27 0.198 13 75.9 44.2 62.2 46.0 38.9 17.7 85.9 3.6 609.6 0.23 0.198 14 94.7 45.5 73.2 30.7 34.0 28.0 119.5 5.0 643.3 0.37 0.278 15 85.1 53.2 68.5 43.6 44.3 21.1 114.9 4.8 588.7 0.29 0.228 16 101.0 48.7 75.5 35.5 39.3 33.0 142.7 5.9 593.3 0.44 0.318 17 78.9 47.0 64.5 31.6 32.5 17.5 107.6 4.5 558.7 0.27 0.208 18 96.2 48.9 67.9 37.0 37.6 31.6 122.7 5.1 366.2 0.36 0.248 19 85.0 43.9 67.2 39.4 41.6 18.4 97.4 4.1 475.7 0.25 0.198 20 86.3 55.9 70.3 56.2 51.9 0.06 22.2 89.4 3.7 435.6 0.23 0.18
8 of 13
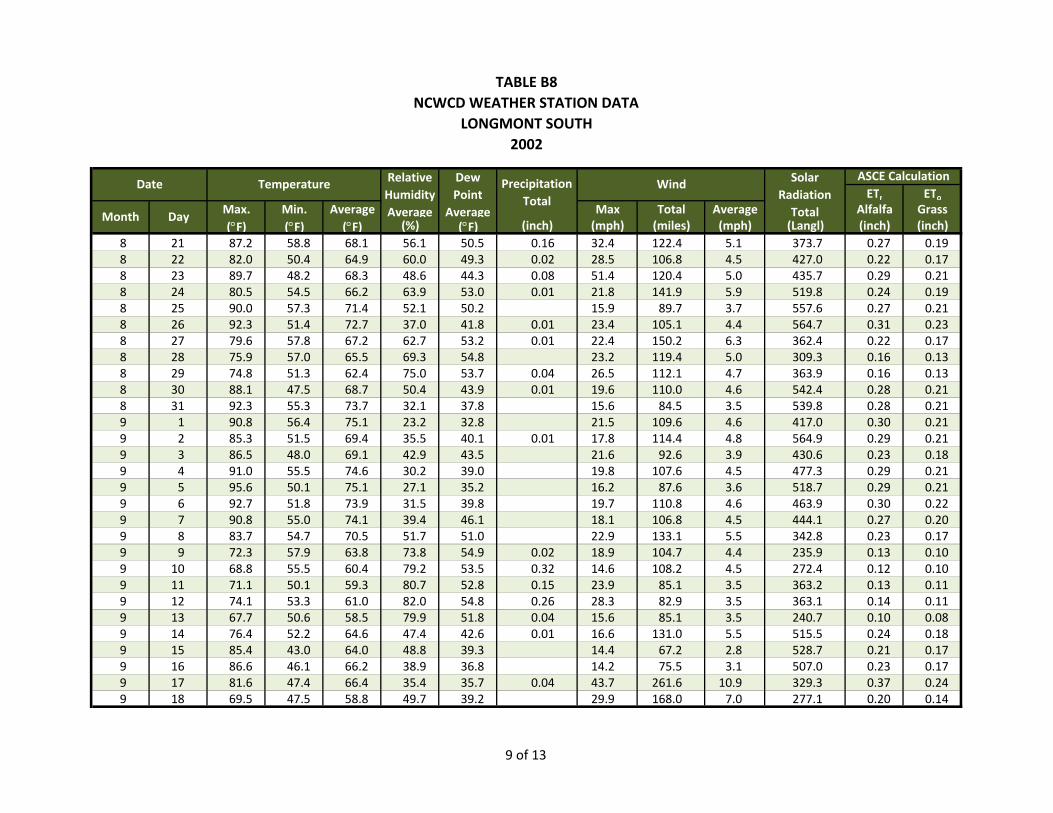
TABLE B8NCWCD WEATHER STATION DATA
LONGMONT SOUTH 2002
ETr EToMax. Min. Average Max Total Average Alfalfa Grass(°F) (°F) (°F) (%) (°F) (inch) (mph) (miles) (mph) (Langl) (inch) (inch)
Solar Radiation Total
ASCE Calculation
Month Day
Date Temperature Relative Humidity Average
Dew Point
Average
Precipitation Total
Wind
8 21 87.2 58.8 68.1 56.1 50.5 0.16 32.4 122.4 5.1 373.7 0.27 0.198 22 82.0 50.4 64.9 60.0 49.3 0.02 28.5 106.8 4.5 427.0 0.22 0.178 23 89.7 48.2 68.3 48.6 44.3 0.08 51.4 120.4 5.0 435.7 0.29 0.218 24 80.5 54.5 66.2 63.9 53.0 0.01 21.8 141.9 5.9 519.8 0.24 0.198 25 90.0 57.3 71.4 52.1 50.2 15.9 89.7 3.7 557.6 0.27 0.218 26 92.3 51.4 72.7 37.0 41.8 0.01 23.4 105.1 4.4 564.7 0.31 0.238 27 79.6 57.8 67.2 62.7 53.2 0.01 22.4 150.2 6.3 362.4 0.22 0.178 28 75.9 57.0 65.5 69.3 54.8 23.2 119.4 5.0 309.3 0.16 0.138 29 74.8 51.3 62.4 75.0 53.7 0.04 26.5 112.1 4.7 363.9 0.16 0.138 30 88.1 47.5 68.7 50.4 43.9 0.01 19.6 110.0 4.6 542.4 0.28 0.218 31 92.3 55.3 73.7 32.1 37.8 15.6 84.5 3.5 539.8 0.28 0.219 1 90.8 56.4 75.1 23.2 32.8 21.5 109.6 4.6 417.0 0.30 0.219 2 85.3 51.5 69.4 35.5 40.1 0.01 17.8 114.4 4.8 564.9 0.29 0.219 3 86.5 48.0 69.1 42.9 43.5 21.6 92.6 3.9 430.6 0.23 0.189 4 91.0 55.5 74.6 30.2 39.0 19.8 107.6 4.5 477.3 0.29 0.219 5 95.6 50.1 75.1 27.1 35.2 16.2 87.6 3.6 518.7 0.29 0.219 6 92.7 51.8 73.9 31.5 39.8 19.7 110.8 4.6 463.9 0.30 0.229 7 90.8 55.0 74.1 39.4 46.1 18.1 106.8 4.5 444.1 0.27 0.209 8 83.7 54.7 70.5 51.7 51.0 22.9 133.1 5.5 342.8 0.23 0.179 9 72.3 57.9 63.8 73.8 54.9 0.02 18.9 104.7 4.4 235.9 0.13 0.109 10 68.8 55.5 60.4 79.2 53.5 0.32 14.6 108.2 4.5 272.4 0.12 0.109 11 71.1 50.1 59.3 80.7 52.8 0.15 23.9 85.1 3.5 363.2 0.13 0.119 12 74.1 53.3 61.0 82.0 54.8 0.26 28.3 82.9 3.5 363.1 0.14 0.119 13 67.7 50.6 58.5 79.9 51.8 0.04 15.6 85.1 3.5 240.7 0.10 0.089 14 76.4 52.2 64.6 47.4 42.6 0.01 16.6 131.0 5.5 515.5 0.24 0.189 15 85.4 43.0 64.0 48.8 39.3 14.4 67.2 2.8 528.7 0.21 0.179 16 86.6 46.1 66.2 38.9 36.8 14.2 75.5 3.1 507.0 0.23 0.179 17 81.6 47.4 66.4 35.4 35.7 0.04 43.7 261.6 10.9 329.3 0.37 0.249 18 69.5 47.5 58.8 49.7 39.2 29.9 168.0 7.0 277.1 0.20 0.14
9 of 13
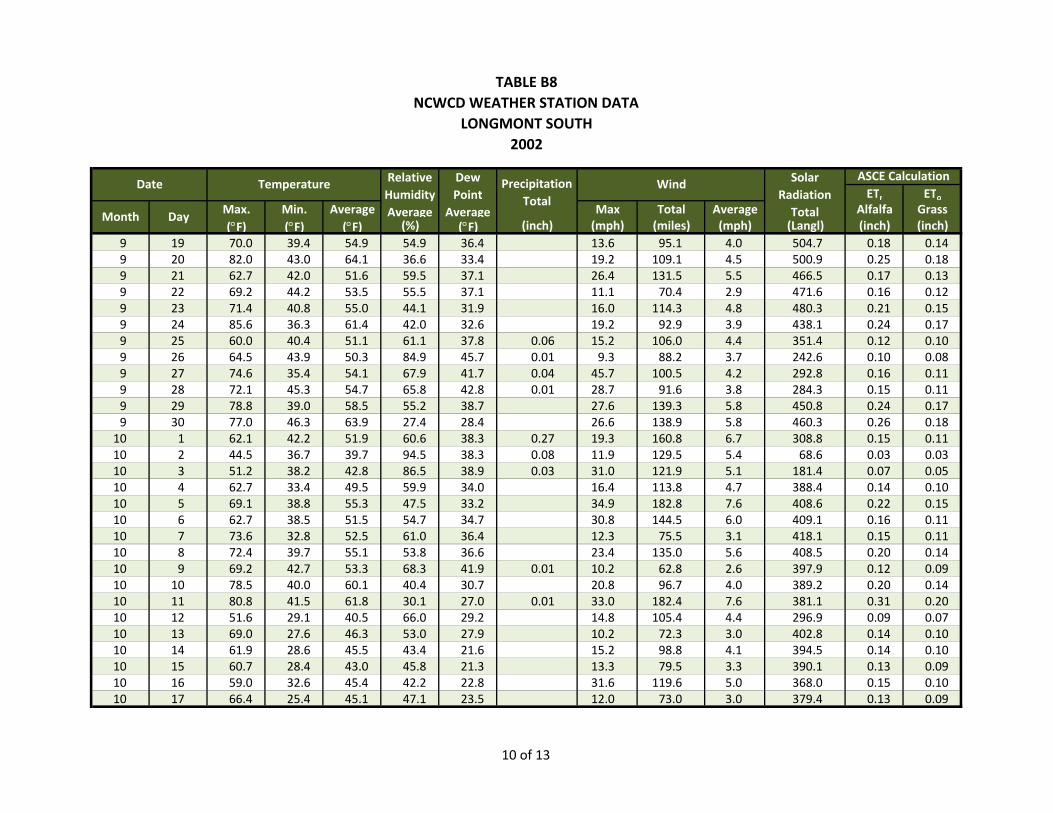
TABLE B8NCWCD WEATHER STATION DATA
LONGMONT SOUTH 2002
ETr EToMax. Min. Average Max Total Average Alfalfa Grass(°F) (°F) (°F) (%) (°F) (inch) (mph) (miles) (mph) (Langl) (inch) (inch)
Solar Radiation Total
ASCE Calculation
Month Day
Date Temperature Relative Humidity Average
Dew Point
Average
Precipitation Total
Wind
9 19 70.0 39.4 54.9 54.9 36.4 13.6 95.1 4.0 504.7 0.18 0.149 20 82.0 43.0 64.1 36.6 33.4 19.2 109.1 4.5 500.9 0.25 0.189 21 62.7 42.0 51.6 59.5 37.1 26.4 131.5 5.5 466.5 0.17 0.139 22 69.2 44.2 53.5 55.5 37.1 11.1 70.4 2.9 471.6 0.16 0.129 23 71.4 40.8 55.0 44.1 31.9 16.0 114.3 4.8 480.3 0.21 0.159 24 85.6 36.3 61.4 42.0 32.6 19.2 92.9 3.9 438.1 0.24 0.179 25 60.0 40.4 51.1 61.1 37.8 0.06 15.2 106.0 4.4 351.4 0.12 0.109 26 64.5 43.9 50.3 84.9 45.7 0.01 9.3 88.2 3.7 242.6 0.10 0.089 27 74.6 35.4 54.1 67.9 41.7 0.04 45.7 100.5 4.2 292.8 0.16 0.119 28 72.1 45.3 54.7 65.8 42.8 0.01 28.7 91.6 3.8 284.3 0.15 0.119 29 78.8 39.0 58.5 55.2 38.7 27.6 139.3 5.8 450.8 0.24 0.179 30 77.0 46.3 63.9 27.4 28.4 26.6 138.9 5.8 460.3 0.26 0.1810 1 62.1 42.2 51.9 60.6 38.3 0.27 19.3 160.8 6.7 308.8 0.15 0.1110 2 44.5 36.7 39.7 94.5 38.3 0.08 11.9 129.5 5.4 68.6 0.03 0.0310 3 51.2 38.2 42.8 86.5 38.9 0.03 31.0 121.9 5.1 181.4 0.07 0.0510 4 62.7 33.4 49.5 59.9 34.0 16.4 113.8 4.7 388.4 0.14 0.1010 5 69.1 38.8 55.3 47.5 33.2 34.9 182.8 7.6 408.6 0.22 0.1510 6 62.7 38.5 51.5 54.7 34.7 30.8 144.5 6.0 409.1 0.16 0.1110 7 73.6 32.8 52.5 61.0 36.4 12.3 75.5 3.1 418.1 0.15 0.1110 8 72.4 39.7 55.1 53.8 36.6 23.4 135.0 5.6 408.5 0.20 0.1410 9 69.2 42.7 53.3 68.3 41.9 0.01 10.2 62.8 2.6 397.9 0.12 0.0910 10 78.5 40.0 60.1 40.4 30.7 20.8 96.7 4.0 389.2 0.20 0.1410 11 80.8 41.5 61.8 30.1 27.0 0.01 33.0 182.4 7.6 381.1 0.31 0.2010 12 51.6 29.1 40.5 66.0 29.2 14.8 105.4 4.4 296.9 0.09 0.0710 13 69.0 27.6 46.3 53.0 27.9 10.2 72.3 3.0 402.8 0.14 0.1010 14 61.9 28.6 45.5 43.4 21.6 15.2 98.8 4.1 394.5 0.14 0.1010 15 60.7 28.4 43.0 45.8 21.3 13.3 79.5 3.3 390.1 0.13 0.0910 16 59.0 32.6 45.4 42.2 22.8 31.6 119.6 5.0 368.0 0.15 0.1010 17 66.4 25.4 45.1 47.1 23.5 12.0 73.0 3.0 379.4 0.13 0.09
10 of 13
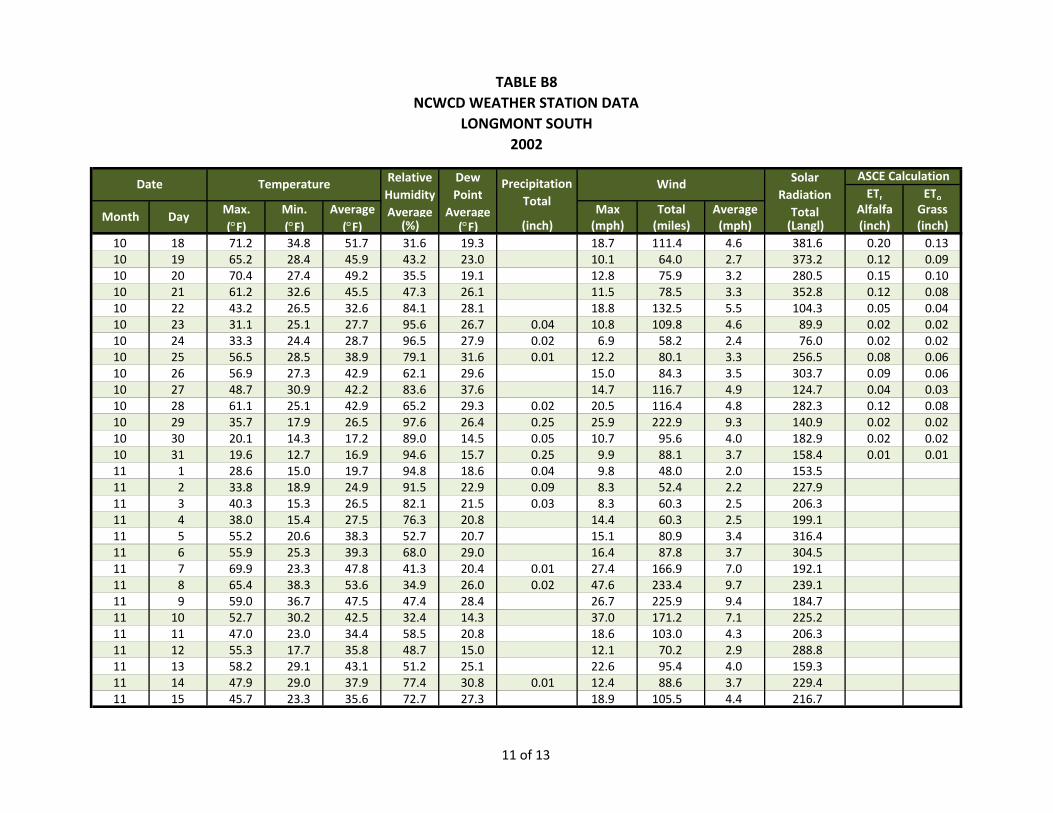
TABLE B8NCWCD WEATHER STATION DATA
LONGMONT SOUTH 2002
ETr EToMax. Min. Average Max Total Average Alfalfa Grass(°F) (°F) (°F) (%) (°F) (inch) (mph) (miles) (mph) (Langl) (inch) (inch)
Solar Radiation Total
ASCE Calculation
Month Day
Date Temperature Relative Humidity Average
Dew Point
Average
Precipitation Total
Wind
10 18 71.2 34.8 51.7 31.6 19.3 18.7 111.4 4.6 381.6 0.20 0.1310 19 65.2 28.4 45.9 43.2 23.0 10.1 64.0 2.7 373.2 0.12 0.0910 20 70.4 27.4 49.2 35.5 19.1 12.8 75.9 3.2 280.5 0.15 0.1010 21 61.2 32.6 45.5 47.3 26.1 11.5 78.5 3.3 352.8 0.12 0.0810 22 43.2 26.5 32.6 84.1 28.1 18.8 132.5 5.5 104.3 0.05 0.0410 23 31.1 25.1 27.7 95.6 26.7 0.04 10.8 109.8 4.6 89.9 0.02 0.0210 24 33.3 24.4 28.7 96.5 27.9 0.02 6.9 58.2 2.4 76.0 0.02 0.0210 25 56.5 28.5 38.9 79.1 31.6 0.01 12.2 80.1 3.3 256.5 0.08 0.0610 26 56.9 27.3 42.9 62.1 29.6 15.0 84.3 3.5 303.7 0.09 0.0610 27 48.7 30.9 42.2 83.6 37.6 14.7 116.7 4.9 124.7 0.04 0.0310 28 61.1 25.1 42.9 65.2 29.3 0.02 20.5 116.4 4.8 282.3 0.12 0.0810 29 35.7 17.9 26.5 97.6 26.4 0.25 25.9 222.9 9.3 140.9 0.02 0.0210 30 20.1 14.3 17.2 89.0 14.5 0.05 10.7 95.6 4.0 182.9 0.02 0.0210 31 19.6 12.7 16.9 94.6 15.7 0.25 9.9 88.1 3.7 158.4 0.01 0.0111 1 28.6 15.0 19.7 94.8 18.6 0.04 9.8 48.0 2.0 153.511 2 33.8 18.9 24.9 91.5 22.9 0.09 8.3 52.4 2.2 227.911 3 40.3 15.3 26.5 82.1 21.5 0.03 8.3 60.3 2.5 206.311 4 38.0 15.4 27.5 76.3 20.8 14.4 60.3 2.5 199.111 5 55.2 20.6 38.3 52.7 20.7 15.1 80.9 3.4 316.411 6 55.9 25.3 39.3 68.0 29.0 16.4 87.8 3.7 304.511 7 69.9 23.3 47.8 41.3 20.4 0.01 27.4 166.9 7.0 192.111 8 65.4 38.3 53.6 34.9 26.0 0.02 47.6 233.4 9.7 239.111 9 59.0 36.7 47.5 47.4 28.4 26.7 225.9 9.4 184.711 10 52.7 30.2 42.5 32.4 14.3 37.0 171.2 7.1 225.211 11 47.0 23.0 34.4 58.5 20.8 18.6 103.0 4.3 206.311 12 55.3 17.7 35.8 48.7 15.0 12.1 70.2 2.9 288.811 13 58.2 29.1 43.1 51.2 25.1 22.6 95.4 4.0 159.311 14 47.9 29.0 37.9 77.4 30.8 0.01 12.4 88.6 3.7 229.411 15 45.7 23.3 35.6 72.7 27.3 18.9 105.5 4.4 216.7
11 of 13
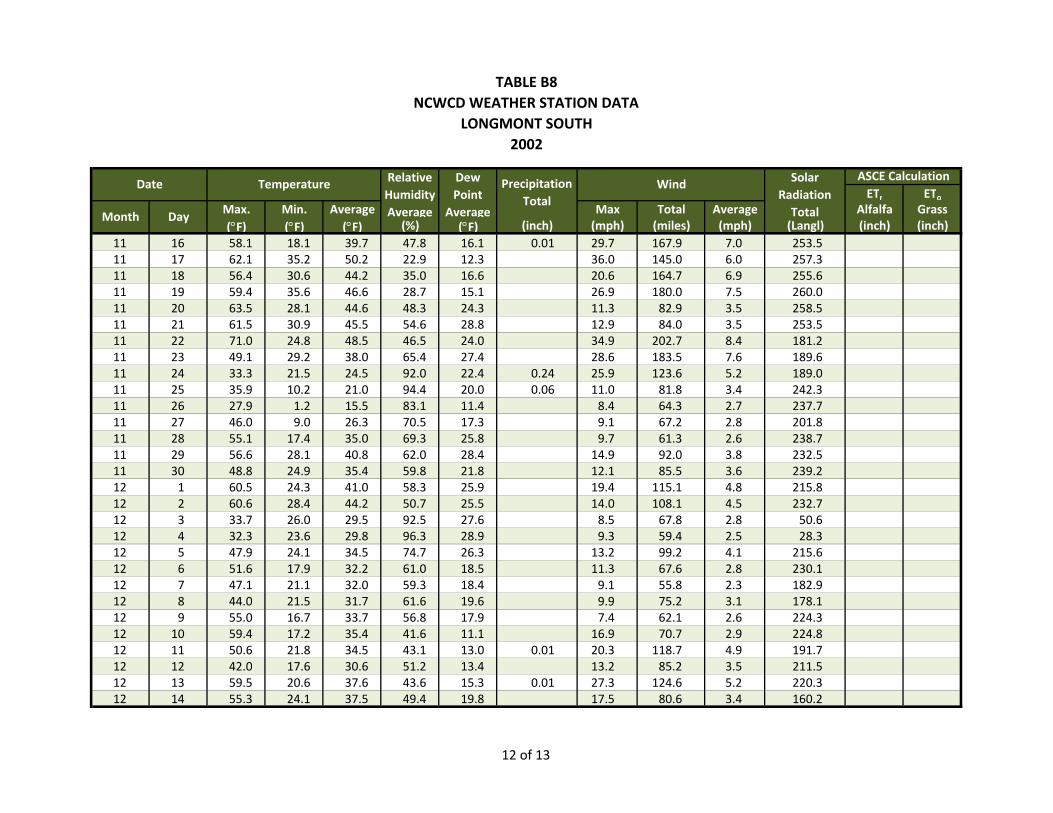
TABLE B8NCWCD WEATHER STATION DATA
LONGMONT SOUTH 2002
ETr EToMax. Min. Average Max Total Average Alfalfa Grass(°F) (°F) (°F) (%) (°F) (inch) (mph) (miles) (mph) (Langl) (inch) (inch)
Solar Radiation Total
ASCE Calculation
Month Day
Date Temperature Relative Humidity Average
Dew Point
Average
Precipitation Total
Wind
11 16 58.1 18.1 39.7 47.8 16.1 0.01 29.7 167.9 7.0 253.511 17 62.1 35.2 50.2 22.9 12.3 36.0 145.0 6.0 257.311 18 56.4 30.6 44.2 35.0 16.6 20.6 164.7 6.9 255.611 19 59.4 35.6 46.6 28.7 15.1 26.9 180.0 7.5 260.011 20 63.5 28.1 44.6 48.3 24.3 11.3 82.9 3.5 258.511 21 61.5 30.9 45.5 54.6 28.8 12.9 84.0 3.5 253.511 22 71.0 24.8 48.5 46.5 24.0 34.9 202.7 8.4 181.211 23 49.1 29.2 38.0 65.4 27.4 28.6 183.5 7.6 189.611 24 33.3 21.5 24.5 92.0 22.4 0.24 25.9 123.6 5.2 189.011 25 35.9 10.2 21.0 94.4 20.0 0.06 11.0 81.8 3.4 242.311 26 27.9 1.2 15.5 83.1 11.4 8.4 64.3 2.7 237.711 27 46.0 9.0 26.3 70.5 17.3 9.1 67.2 2.8 201.811 28 55.1 17.4 35.0 69.3 25.8 9.7 61.3 2.6 238.711 29 56.6 28.1 40.8 62.0 28.4 14.9 92.0 3.8 232.511 30 48.8 24.9 35.4 59.8 21.8 12.1 85.5 3.6 239.212 1 60.5 24.3 41.0 58.3 25.9 19.4 115.1 4.8 215.812 2 60.6 28.4 44.2 50.7 25.5 14.0 108.1 4.5 232.712 3 33.7 26.0 29.5 92.5 27.6 8.5 67.8 2.8 50.612 4 32.3 23.6 29.8 96.3 28.9 9.3 59.4 2.5 28.312 5 47.9 24.1 34.5 74.7 26.3 13.2 99.2 4.1 215.612 6 51.6 17.9 32.2 61.0 18.5 11.3 67.6 2.8 230.112 7 47.1 21.1 32.0 59.3 18.4 9.1 55.8 2.3 182.912 8 44.0 21.5 31.7 61.6 19.6 9.9 75.2 3.1 178.112 9 55.0 16.7 33.7 56.8 17.9 7.4 62.1 2.6 224.312 10 59.4 17.2 35.4 41.6 11.1 16.9 70.7 2.9 224.812 11 50.6 21.8 34.5 43.1 13.0 0.01 20.3 118.7 4.9 191.712 12 42.0 17.6 30.6 51.2 13.4 13.2 85.2 3.5 211.512 13 59.5 20.6 37.6 43.6 15.3 0.01 27.3 124.6 5.2 220.312 14 55.3 24.1 37.5 49.4 19.8 17.5 80.6 3.4 160.2
12 of 13
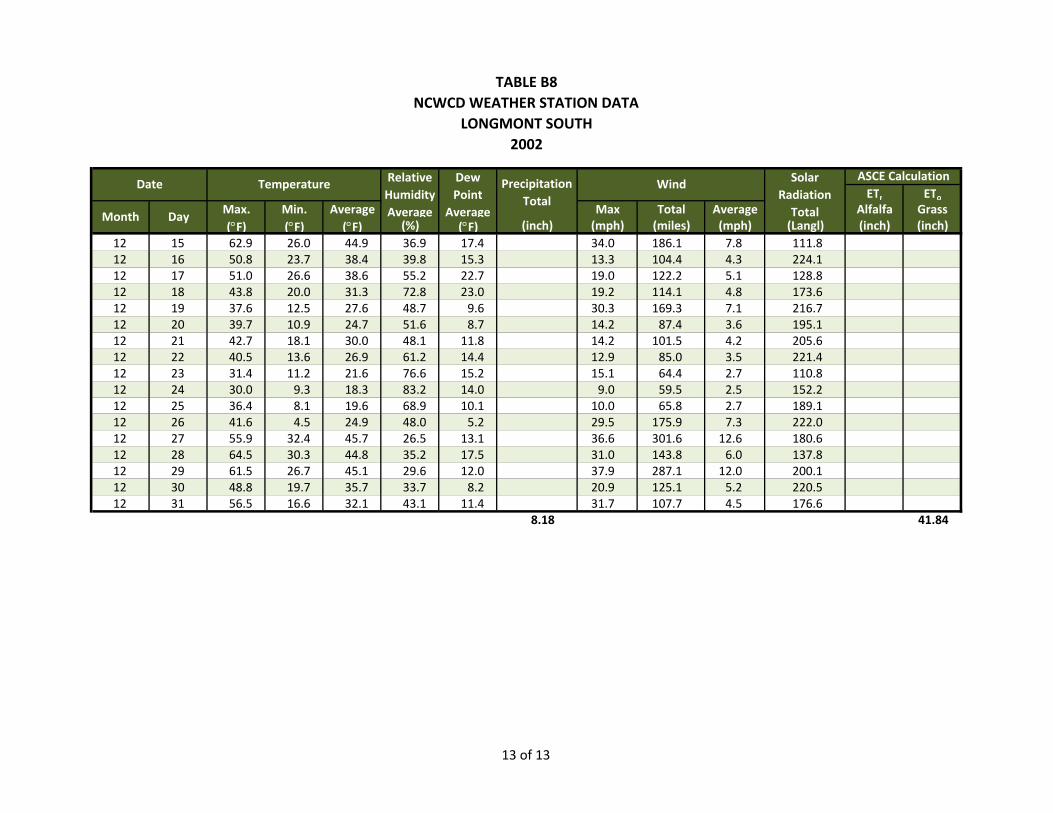
TABLE B8NCWCD WEATHER STATION DATA
LONGMONT SOUTH 2002
ETr EToMax. Min. Average Max Total Average Alfalfa Grass(°F) (°F) (°F) (%) (°F) (inch) (mph) (miles) (mph) (Langl) (inch) (inch)
Solar Radiation Total
ASCE Calculation
Month Day
Date Temperature Relative Humidity Average
Dew Point
Average
Precipitation Total
Wind
12 15 62.9 26.0 44.9 36.9 17.4 34.0 186.1 7.8 111.812 16 50.8 23.7 38.4 39.8 15.3 13.3 104.4 4.3 224.112 17 51.0 26.6 38.6 55.2 22.7 19.0 122.2 5.1 128.812 18 43.8 20.0 31.3 72.8 23.0 19.2 114.1 4.8 173.612 19 37.6 12.5 27.6 48.7 9.6 30.3 169.3 7.1 216.712 20 39.7 10.9 24.7 51.6 8.7 14.2 87.4 3.6 195.112 21 42.7 18.1 30.0 48.1 11.8 14.2 101.5 4.2 205.612 22 40.5 13.6 26.9 61.2 14.4 12.9 85.0 3.5 221.412 23 31.4 11.2 21.6 76.6 15.2 15.1 64.4 2.7 110.812 24 30.0 9.3 18.3 83.2 14.0 9.0 59.5 2.5 152.212 25 36.4 8.1 19.6 68.9 10.1 10.0 65.8 2.7 189.112 26 41.6 4.5 24.9 48.0 5.2 29.5 175.9 7.3 222.012 27 55.9 32.4 45.7 26.5 13.1 36.6 301.6 12.6 180.612 28 64.5 30.3 44.8 35.2 17.5 31.0 143.8 6.0 137.812 29 61.5 26.7 45.1 29.6 12.0 37.9 287.1 12.0 200.112 30 48.8 19.7 35.7 33.7 8.2 20.9 125.1 5.2 220.512 31 56.5 16.6 32.1 43.1 11.4 31.7 107.7 4.5 176.6
8.18 41.84
13 of 13
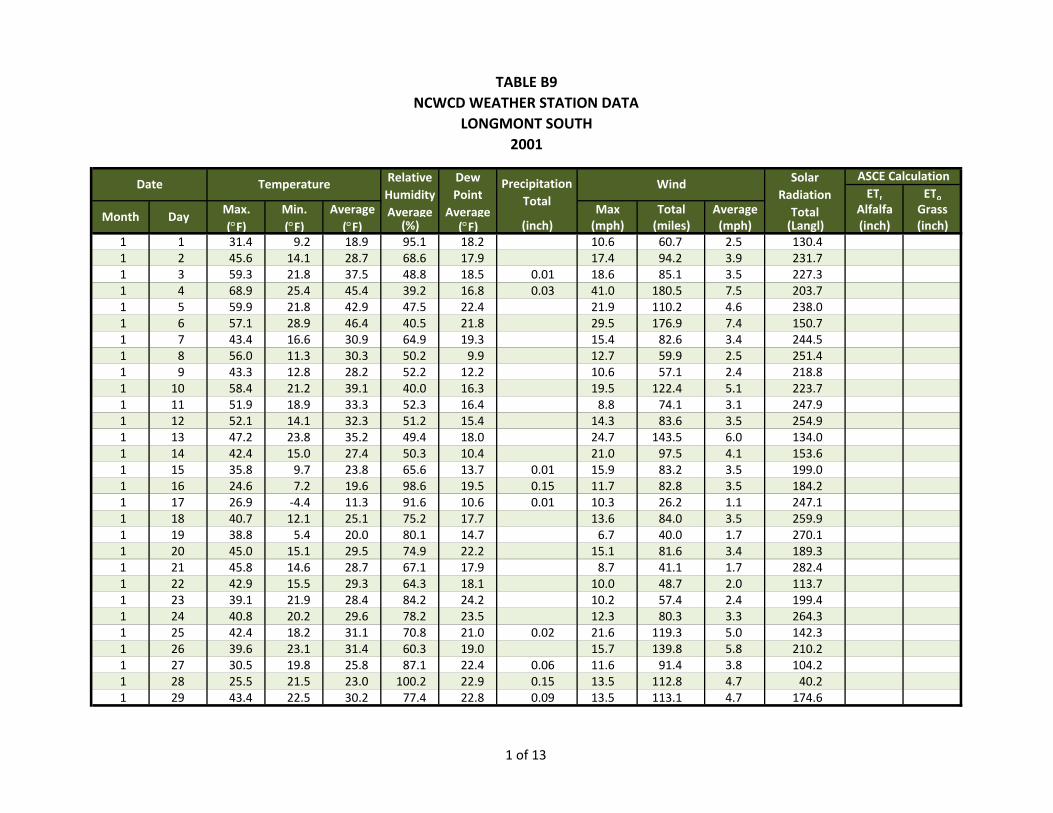
TABLE B9NCWCD WEATHER STATION DATA
LONGMONT SOUTH 2001
ETr EToMax. Min. Average Max Total Average Alfalfa Grass(°F) (°F) (°F) (%) (°F) (inch) (mph) (miles) (mph) (Langl) (inch) (inch)
1 1 31.4 9.2 18.9 95.1 18.2 10.6 60.7 2.5 130.41 2 45.6 14.1 28.7 68.6 17.9 17.4 94.2 3.9 231.71 3 59.3 21.8 37.5 48.8 18.5 0.01 18.6 85.1 3.5 227.31 4 68.9 25.4 45.4 39.2 16.8 0.03 41.0 180.5 7.5 203.71 5 59.9 21.8 42.9 47.5 22.4 21.9 110.2 4.6 238.01 6 57.1 28.9 46.4 40.5 21.8 29.5 176.9 7.4 150.71 7 43.4 16.6 30.9 64.9 19.3 15.4 82.6 3.4 244.51 8 56.0 11.3 30.3 50.2 9.9 12.7 59.9 2.5 251.41 9 43.3 12.8 28.2 52.2 12.2 10.6 57.1 2.4 218.81 10 58.4 21.2 39.1 40.0 16.3 19.5 122.4 5.1 223.71 11 51.9 18.9 33.3 52.3 16.4 8.8 74.1 3.1 247.91 12 52.1 14.1 32.3 51.2 15.4 14.3 83.6 3.5 254.91 13 47.2 23.8 35.2 49.4 18.0 24.7 143.5 6.0 134.01 14 42.4 15.0 27.4 50.3 10.4 21.0 97.5 4.1 153.61 15 35.8 9.7 23.8 65.6 13.7 0.01 15.9 83.2 3.5 199.01 16 24.6 7.2 19.6 98.6 19.5 0.15 11.7 82.8 3.5 184.21 17 26.9 ‐4.4 11.3 91.6 10.6 0.01 10.3 26.2 1.1 247.11 18 40.7 12.1 25.1 75.2 17.7 13.6 84.0 3.5 259.91 19 38.8 5.4 20.0 80.1 14.7 6.7 40.0 1.7 270.11 20 45.0 15.1 29.5 74.9 22.2 15.1 81.6 3.4 189.31 21 45.8 14.6 28.7 67.1 17.9 8.7 41.1 1.7 282.41 22 42.9 15.5 29.3 64.3 18.1 10.0 48.7 2.0 113.71 23 39.1 21.9 28.4 84.2 24.2 10.2 57.4 2.4 199.41 24 40.8 20.2 29.6 78.2 23.5 12.3 80.3 3.3 264.31 25 42.4 18.2 31.1 70.8 21.0 0.02 21.6 119.3 5.0 142.31 26 39.6 23.1 31.4 60.3 19.0 15.7 139.8 5.8 210.21 27 30.5 19.8 25.8 87.1 22.4 0.06 11.6 91.4 3.8 104.21 28 25.5 21.5 23.0 100.2 22.9 0.15 13.5 112.8 4.7 40.21 29 43.4 22.5 30.2 77.4 22.8 0.09 13.5 113.1 4.7 174.6
Solar Radiation Total
ASCE Calculation
Month Day
Date Temperature Relative Humidity Average
Dew Point
Average
Precipitation Total
Wind
1 of 13
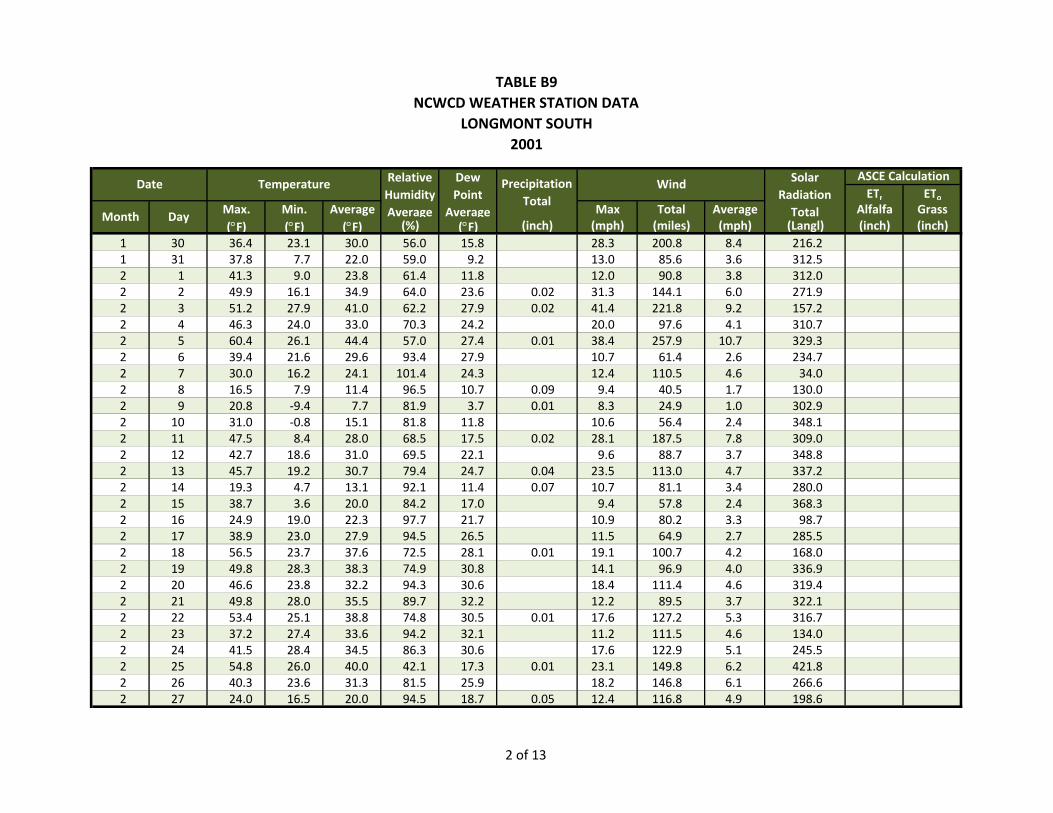
TABLE B9NCWCD WEATHER STATION DATA
LONGMONT SOUTH 2001
ETr EToMax. Min. Average Max Total Average Alfalfa Grass(°F) (°F) (°F) (%) (°F) (inch) (mph) (miles) (mph) (Langl) (inch) (inch)
Solar Radiation Total
ASCE Calculation
Month Day
Date Temperature Relative Humidity Average
Dew Point
Average
Precipitation Total
Wind
1 30 36.4 23.1 30.0 56.0 15.8 28.3 200.8 8.4 216.21 31 37.8 7.7 22.0 59.0 9.2 13.0 85.6 3.6 312.52 1 41.3 9.0 23.8 61.4 11.8 12.0 90.8 3.8 312.02 2 49.9 16.1 34.9 64.0 23.6 0.02 31.3 144.1 6.0 271.92 3 51.2 27.9 41.0 62.2 27.9 0.02 41.4 221.8 9.2 157.22 4 46.3 24.0 33.0 70.3 24.2 20.0 97.6 4.1 310.72 5 60.4 26.1 44.4 57.0 27.4 0.01 38.4 257.9 10.7 329.32 6 39.4 21.6 29.6 93.4 27.9 10.7 61.4 2.6 234.72 7 30.0 16.2 24.1 101.4 24.3 12.4 110.5 4.6 34.02 8 16.5 7.9 11.4 96.5 10.7 0.09 9.4 40.5 1.7 130.02 9 20.8 ‐9.4 7.7 81.9 3.7 0.01 8.3 24.9 1.0 302.92 10 31.0 ‐0.8 15.1 81.8 11.8 10.6 56.4 2.4 348.12 11 47.5 8.4 28.0 68.5 17.5 0.02 28.1 187.5 7.8 309.02 12 42.7 18.6 31.0 69.5 22.1 9.6 88.7 3.7 348.82 13 45.7 19.2 30.7 79.4 24.7 0.04 23.5 113.0 4.7 337.22 14 19.3 4.7 13.1 92.1 11.4 0.07 10.7 81.1 3.4 280.02 15 38.7 3.6 20.0 84.2 17.0 9.4 57.8 2.4 368.32 16 24.9 19.0 22.3 97.7 21.7 10.9 80.2 3.3 98.72 17 38.9 23.0 27.9 94.5 26.5 11.5 64.9 2.7 285.52 18 56.5 23.7 37.6 72.5 28.1 0.01 19.1 100.7 4.2 168.02 19 49.8 28.3 38.3 74.9 30.8 14.1 96.9 4.0 336.92 20 46.6 23.8 32.2 94.3 30.6 18.4 111.4 4.6 319.42 21 49.8 28.0 35.5 89.7 32.2 12.2 89.5 3.7 322.12 22 53.4 25.1 38.8 74.8 30.5 0.01 17.6 127.2 5.3 316.72 23 37.2 27.4 33.6 94.2 32.1 11.2 111.5 4.6 134.02 24 41.5 28.4 34.5 86.3 30.6 17.6 122.9 5.1 245.52 25 54.8 26.0 40.0 42.1 17.3 0.01 23.1 149.8 6.2 421.82 26 40.3 23.6 31.3 81.5 25.9 18.2 146.8 6.1 266.62 27 24.0 16.5 20.0 94.5 18.7 0.05 12.4 116.8 4.9 198.6
2 of 13
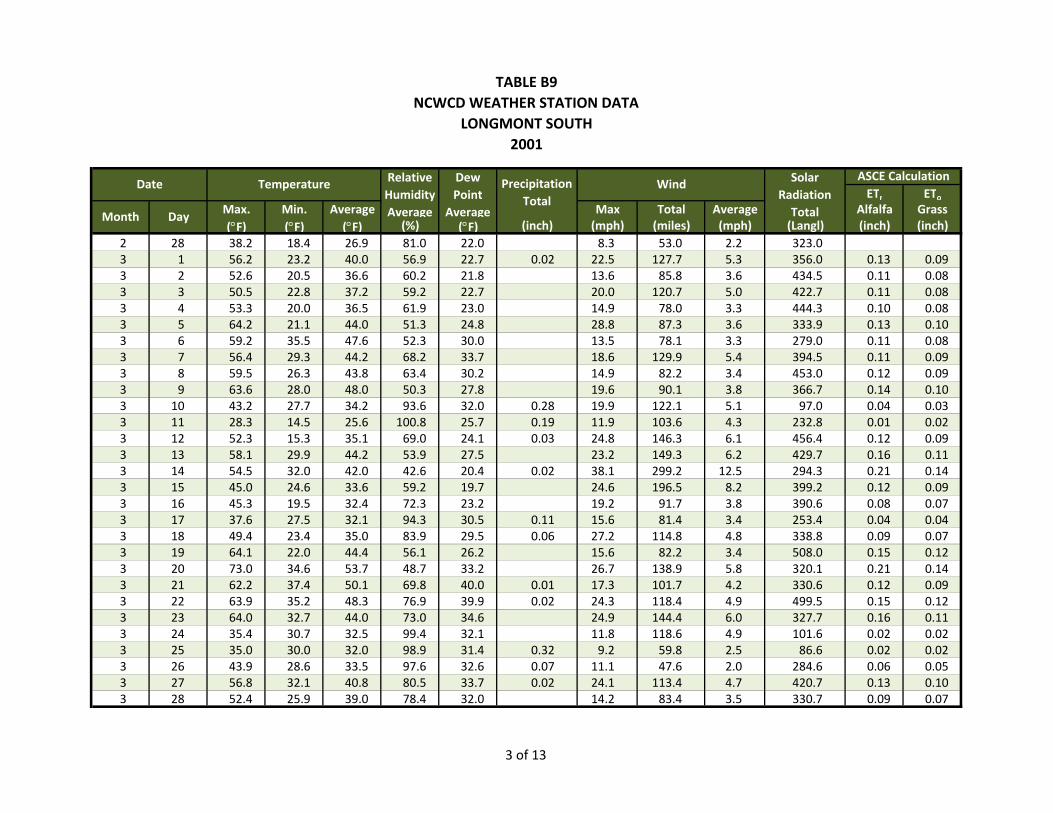
TABLE B9NCWCD WEATHER STATION DATA
LONGMONT SOUTH 2001
ETr EToMax. Min. Average Max Total Average Alfalfa Grass(°F) (°F) (°F) (%) (°F) (inch) (mph) (miles) (mph) (Langl) (inch) (inch)
Solar Radiation Total
ASCE Calculation
Month Day
Date Temperature Relative Humidity Average
Dew Point
Average
Precipitation Total
Wind
2 28 38.2 18.4 26.9 81.0 22.0 8.3 53.0 2.2 323.03 1 56.2 23.2 40.0 56.9 22.7 0.02 22.5 127.7 5.3 356.0 0.13 0.093 2 52.6 20.5 36.6 60.2 21.8 13.6 85.8 3.6 434.5 0.11 0.083 3 50.5 22.8 37.2 59.2 22.7 20.0 120.7 5.0 422.7 0.11 0.083 4 53.3 20.0 36.5 61.9 23.0 14.9 78.0 3.3 444.3 0.10 0.083 5 64.2 21.1 44.0 51.3 24.8 28.8 87.3 3.6 333.9 0.13 0.103 6 59.2 35.5 47.6 52.3 30.0 13.5 78.1 3.3 279.0 0.11 0.083 7 56.4 29.3 44.2 68.2 33.7 18.6 129.9 5.4 394.5 0.11 0.093 8 59.5 26.3 43.8 63.4 30.2 14.9 82.2 3.4 453.0 0.12 0.093 9 63.6 28.0 48.0 50.3 27.8 19.6 90.1 3.8 366.7 0.14 0.103 10 43.2 27.7 34.2 93.6 32.0 0.28 19.9 122.1 5.1 97.0 0.04 0.033 11 28.3 14.5 25.6 100.8 25.7 0.19 11.9 103.6 4.3 232.8 0.01 0.023 12 52.3 15.3 35.1 69.0 24.1 0.03 24.8 146.3 6.1 456.4 0.12 0.093 13 58.1 29.9 44.2 53.9 27.5 23.2 149.3 6.2 429.7 0.16 0.113 14 54.5 32.0 42.0 42.6 20.4 0.02 38.1 299.2 12.5 294.3 0.21 0.143 15 45.0 24.6 33.6 59.2 19.7 24.6 196.5 8.2 399.2 0.12 0.093 16 45.3 19.5 32.4 72.3 23.2 19.2 91.7 3.8 390.6 0.08 0.073 17 37.6 27.5 32.1 94.3 30.5 0.11 15.6 81.4 3.4 253.4 0.04 0.043 18 49.4 23.4 35.0 83.9 29.5 0.06 27.2 114.8 4.8 338.8 0.09 0.073 19 64.1 22.0 44.4 56.1 26.2 15.6 82.2 3.4 508.0 0.15 0.123 20 73.0 34.6 53.7 48.7 33.2 26.7 138.9 5.8 320.1 0.21 0.143 21 62.2 37.4 50.1 69.8 40.0 0.01 17.3 101.7 4.2 330.6 0.12 0.093 22 63.9 35.2 48.3 76.9 39.9 0.02 24.3 118.4 4.9 499.5 0.15 0.123 23 64.0 32.7 44.0 73.0 34.6 24.9 144.4 6.0 327.7 0.16 0.113 24 35.4 30.7 32.5 99.4 32.1 11.8 118.6 4.9 101.6 0.02 0.023 25 35.0 30.0 32.0 98.9 31.4 0.32 9.2 59.8 2.5 86.6 0.02 0.023 26 43.9 28.6 33.5 97.6 32.6 0.07 11.1 47.6 2.0 284.6 0.06 0.053 27 56.8 32.1 40.8 80.5 33.7 0.02 24.1 113.4 4.7 420.7 0.13 0.103 28 52.4 25.9 39.0 78.4 32.0 14.2 83.4 3.5 330.7 0.09 0.07
3 of 13
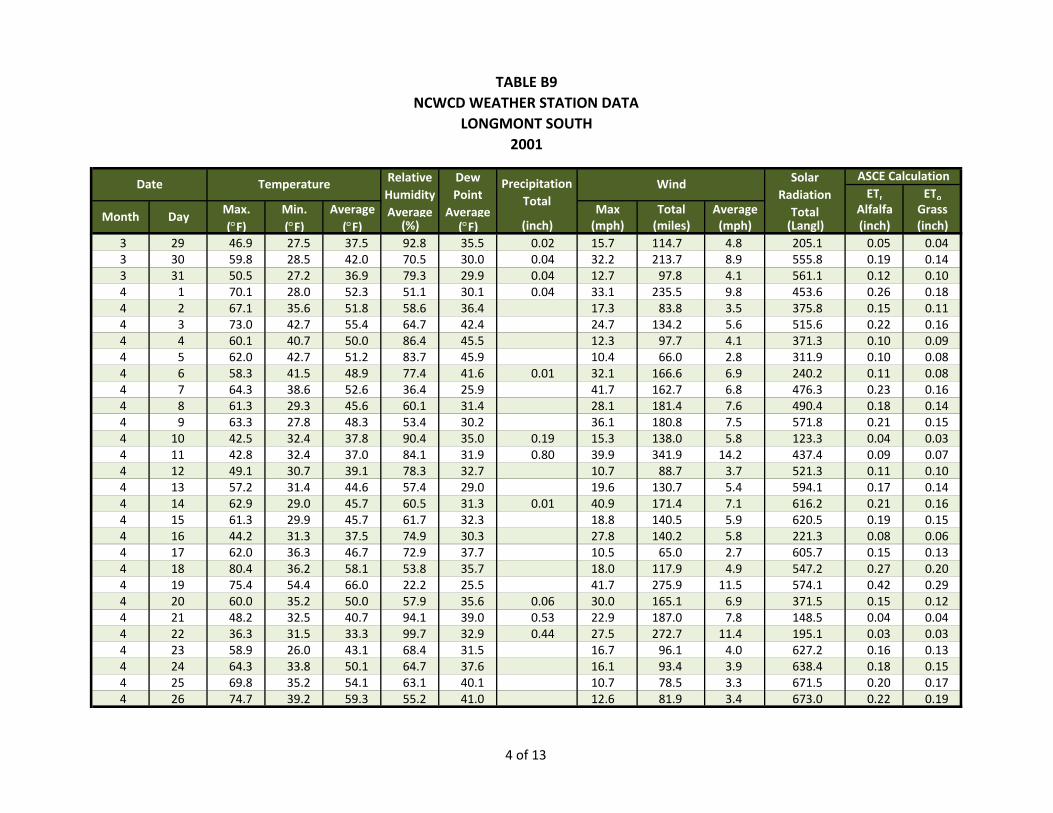
TABLE B9NCWCD WEATHER STATION DATA
LONGMONT SOUTH 2001
ETr EToMax. Min. Average Max Total Average Alfalfa Grass(°F) (°F) (°F) (%) (°F) (inch) (mph) (miles) (mph) (Langl) (inch) (inch)
Solar Radiation Total
ASCE Calculation
Month Day
Date Temperature Relative Humidity Average
Dew Point
Average
Precipitation Total
Wind
3 29 46.9 27.5 37.5 92.8 35.5 0.02 15.7 114.7 4.8 205.1 0.05 0.043 30 59.8 28.5 42.0 70.5 30.0 0.04 32.2 213.7 8.9 555.8 0.19 0.143 31 50.5 27.2 36.9 79.3 29.9 0.04 12.7 97.8 4.1 561.1 0.12 0.104 1 70.1 28.0 52.3 51.1 30.1 0.04 33.1 235.5 9.8 453.6 0.26 0.184 2 67.1 35.6 51.8 58.6 36.4 17.3 83.8 3.5 375.8 0.15 0.114 3 73.0 42.7 55.4 64.7 42.4 24.7 134.2 5.6 515.6 0.22 0.164 4 60.1 40.7 50.0 86.4 45.5 12.3 97.7 4.1 371.3 0.10 0.094 5 62.0 42.7 51.2 83.7 45.9 10.4 66.0 2.8 311.9 0.10 0.084 6 58.3 41.5 48.9 77.4 41.6 0.01 32.1 166.6 6.9 240.2 0.11 0.084 7 64.3 38.6 52.6 36.4 25.9 41.7 162.7 6.8 476.3 0.23 0.164 8 61.3 29.3 45.6 60.1 31.4 28.1 181.4 7.6 490.4 0.18 0.144 9 63.3 27.8 48.3 53.4 30.2 36.1 180.8 7.5 571.8 0.21 0.154 10 42.5 32.4 37.8 90.4 35.0 0.19 15.3 138.0 5.8 123.3 0.04 0.034 11 42.8 32.4 37.0 84.1 31.9 0.80 39.9 341.9 14.2 437.4 0.09 0.074 12 49.1 30.7 39.1 78.3 32.7 10.7 88.7 3.7 521.3 0.11 0.104 13 57.2 31.4 44.6 57.4 29.0 19.6 130.7 5.4 594.1 0.17 0.144 14 62.9 29.0 45.7 60.5 31.3 0.01 40.9 171.4 7.1 616.2 0.21 0.164 15 61.3 29.9 45.7 61.7 32.3 18.8 140.5 5.9 620.5 0.19 0.154 16 44.2 31.3 37.5 74.9 30.3 27.8 140.2 5.8 221.3 0.08 0.064 17 62.0 36.3 46.7 72.9 37.7 10.5 65.0 2.7 605.7 0.15 0.134 18 80.4 36.2 58.1 53.8 35.7 18.0 117.9 4.9 547.2 0.27 0.204 19 75.4 54.4 66.0 22.2 25.5 41.7 275.9 11.5 574.1 0.42 0.294 20 60.0 35.2 50.0 57.9 35.6 0.06 30.0 165.1 6.9 371.5 0.15 0.124 21 48.2 32.5 40.7 94.1 39.0 0.53 22.9 187.0 7.8 148.5 0.04 0.044 22 36.3 31.5 33.3 99.7 32.9 0.44 27.5 272.7 11.4 195.1 0.03 0.034 23 58.9 26.0 43.1 68.4 31.5 16.7 96.1 4.0 627.2 0.16 0.134 24 64.3 33.8 50.1 64.7 37.6 16.1 93.4 3.9 638.4 0.18 0.154 25 69.8 35.2 54.1 63.1 40.1 10.7 78.5 3.3 671.5 0.20 0.174 26 74.7 39.2 59.3 55.2 41.0 12.6 81.9 3.4 673.0 0.22 0.19
4 of 13

TABLE B9NCWCD WEATHER STATION DATA
LONGMONT SOUTH 2001
ETr EToMax. Min. Average Max Total Average Alfalfa Grass(°F) (°F) (°F) (%) (°F) (inch) (mph) (miles) (mph) (Langl) (inch) (inch)
Solar Radiation Total
ASCE Calculation
Month Day
Date Temperature Relative Humidity Average
Dew Point
Average
Precipitation Total
Wind
4 27 78.7 41.2 60.6 57.5 43.8 16.5 93.7 3.9 659.6 0.24 0.204 28 74.0 40.9 59.9 60.7 45.3 21.0 116.4 4.8 483.7 0.20 0.164 29 77.7 42.7 63.3 46.9 40.9 27.8 116.8 4.9 561.6 0.25 0.194 30 74.2 42.5 61.0 47.7 39.6 21.9 112.6 4.7 553.5 0.23 0.185 1 84.5 52.2 68.4 35.6 38.1 0.01 28.4 196.4 8.2 619.0 0.39 0.285 2 58.4 32.5 35.7 99.0 35.0 0.46 25.7 152.8 6.4 102.4 0.12 0.085 3 38.2 32.3 34.9 101.8 34.9 0.48 11.0 127.2 5.3 203.9 0.04 0.045 4 41.4 35.2 38.2 101.1 38.1 0.72 12.7 147.4 6.1 93.7 0.02 0.025 5 49.8 38.8 44.0 97.3 43.3 0.58 25.0 160.0 6.7 125.8 0.04 0.045 6 60.3 37.9 50.7 74.3 42.8 0.02 23.1 157.1 6.5 558.5 0.15 0.135 7 62.8 39.8 51.1 71.0 41.7 18.7 109.0 4.5 707.0 0.19 0.165 8 73.4 38.4 58.6 59.1 42.3 21.7 113.9 4.7 716.0 0.24 0.205 9 78.8 40.1 59.4 56.0 42.4 0.02 36.2 110.2 4.6 452.6 0.23 0.175 10 81.2 47.5 62.2 53.8 44.0 25.6 141.7 5.9 412.2 0.27 0.195 11 70.1 49.1 57.0 78.2 49.8 22.7 115.9 4.8 535.4 0.19 0.165 12 81.3 43.3 63.6 59.9 47.0 10.0 62.9 2.6 723.0 0.24 0.215 13 84.3 45.4 66.9 51.9 47.1 14.0 71.7 3.0 690.2 0.26 0.225 14 81.5 49.4 65.6 58.3 50.1 23.3 103.7 4.3 564.4 0.24 0.205 15 84.6 49.6 69.6 44.8 45.9 25.7 161.8 6.7 630.6 0.33 0.255 16 80.8 59.0 67.9 51.6 49.4 20.3 105.4 4.4 499.0 0.25 0.205 17 62.9 46.2 55.1 83.5 49.9 0.10 19.0 109.5 4.6 224.4 0.09 0.085 18 75.2 45.0 59.7 73.8 49.2 0.01 17.9 75.8 3.2 616.0 0.20 0.185 19 66.2 50.8 58.7 80.2 52.5 14.2 92.6 3.9 366.3 0.13 0.115 20 75.0 32.8 50.1 81.6 43.5 0.11 41.7 195.9 8.2 533.5 0.25 0.185 21 58.0 29.6 44.8 59.8 29.6 18.9 91.8 3.8 619.6 0.17 0.145 22 75.5 36.1 57.4 50.9 37.7 18.1 109.2 4.5 586.2 0.24 0.195 23 79.5 39.0 61.5 53.2 41.5 0.01 38.4 133.7 5.6 635.8 0.28 0.225 24 75.8 37.4 58.9 50.1 38.2 24.3 131.8 5.5 600.2 0.26 0.205 25 71.3 34.4 55.3 68.3 44.1 12.9 70.6 2.9 615.1 0.19 0.16
5 of 13

TABLE B9NCWCD WEATHER STATION DATA
LONGMONT SOUTH 2001
ETr EToMax. Min. Average Max Total Average Alfalfa Grass(°F) (°F) (°F) (%) (°F) (inch) (mph) (miles) (mph) (Langl) (inch) (inch)
Solar Radiation Total
ASCE Calculation
Month Day
Date Temperature Relative Humidity Average
Dew Point
Average
Precipitation Total
Wind
5 26 76.4 42.3 60.7 70.5 50.1 12.3 72.8 3.0 490.2 0.18 0.155 27 75.6 53.4 62.3 76.7 54.2 19.7 118.6 4.9 559.2 0.21 0.185 28 69.7 46.1 58.7 88.2 54.9 0.02 18.0 95.4 4.0 300.6 0.11 0.095 29 77.3 51.9 62.1 76.1 53.4 0.03 28.6 97.0 4.0 558.4 0.21 0.185 30 66.4 48.3 57.7 84.2 52.8 0.02 17.1 114.1 4.8 352.3 0.12 0.115 31 77.1 41.5 60.8 73.6 50.8 0.01 16.8 85.7 3.6 668.9 0.22 0.196 1 80.9 47.6 65.9 60.0 49.5 13.9 85.0 3.5 711.0 0.26 0.226 2 88.7 45.1 66.9 60.0 50.7 16.7 84.3 3.5 629.1 0.27 0.226 3 67.1 54.3 58.9 91.0 56.1 0.05 20.7 138.8 5.8 206.8 0.10 0.086 4 61.1 48.0 54.1 100.1 53.7 0.27 16.8 138.7 5.8 219.9 0.06 0.066 5 75.1 41.7 59.2 76.9 50.5 0.01 14.8 73.9 3.1 673.0 0.21 0.196 6 82.0 45.0 64.5 68.6 52.4 13.2 92.8 3.9 721.0 0.26 0.226 7 82.2 53.0 66.8 75.1 57.9 0.01 22.1 98.6 4.1 610.9 0.23 0.206 8 86.9 51.9 70.6 60.9 53.8 14.5 100.3 4.2 695.7 0.29 0.246 9 91.9 53.4 70.7 54.2 51.2 25.6 108.9 4.5 469.9 0.29 0.226 10 95.8 52.3 76.7 36.9 43.6 0.01 27.2 128.5 5.4 734.0 0.40 0.316 11 94.8 51.9 76.6 36.2 43.3 25.4 142.6 5.9 692.5 0.40 0.306 12 85.1 54.0 70.2 62.9 55.3 15.7 82.4 3.4 465.5 0.21 0.186 13 64.1 43.8 53.1 68.2 41.1 0.31 25.4 146.3 6.1 271.1 0.16 0.126 14 68.4 39.7 55.5 51.5 35.1 0.04 32.8 260.1 10.8 693.0 0.30 0.226 15 85.1 45.7 68.1 31.0 33.4 29.8 200.5 8.4 745.0 0.43 0.316 16 83.6 47.6 65.9 56.0 48.7 12.8 94.3 3.9 733.0 0.28 0.246 17 95.4 50.9 75.1 38.8 40.9 23.1 105.6 4.4 778.0 0.38 0.306 18 94.2 57.8 76.1 27.5 37.5 33.3 183.6 7.7 678.6 0.48 0.346 19 72.0 56.1 62.3 58.8 47.5 20.8 148.3 6.2 521.7 0.24 0.196 20 78.2 49.2 62.8 73.3 53.4 24.7 129.3 5.4 642.9 0.24 0.206 21 81.4 54.7 67.1 69.8 55.3 18.0 85.6 3.6 670.8 0.25 0.226 22 89.9 50.3 70.4 52.0 49.1 40.5 139.3 5.8 613.0 0.34 0.266 23 96.0 50.9 74.8 40.5 44.7 24.9 116.9 4.9 685.4 0.38 0.29
6 of 13
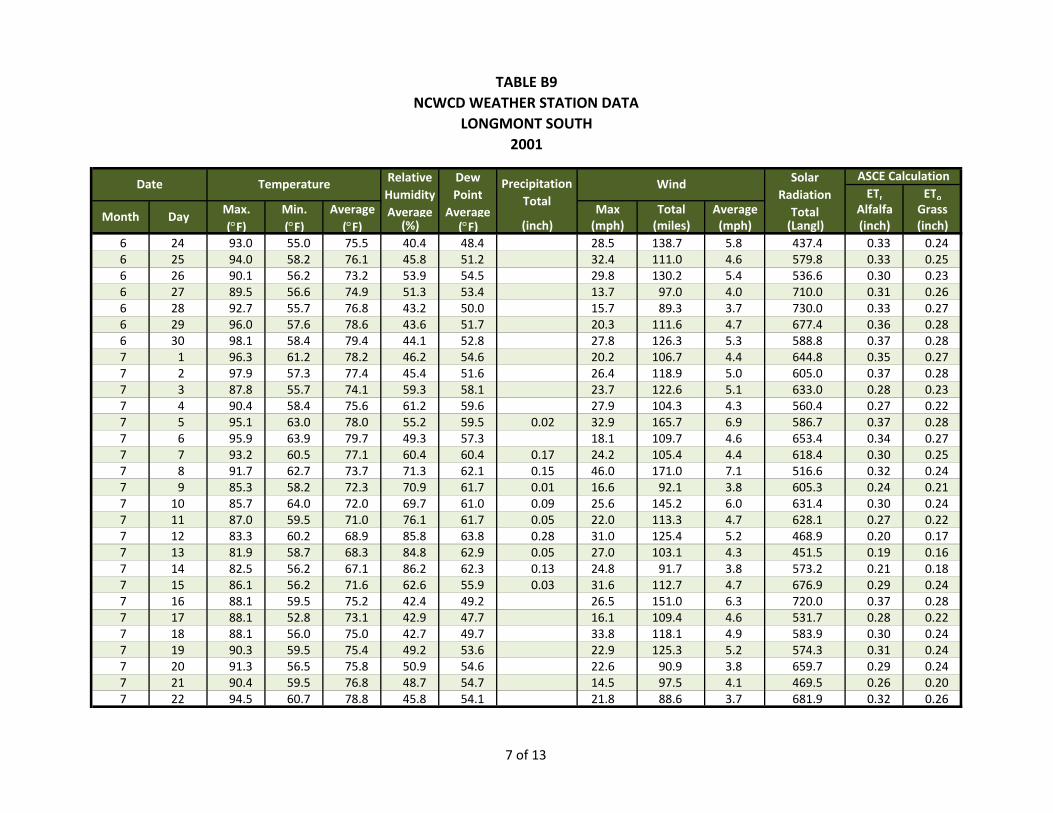
TABLE B9NCWCD WEATHER STATION DATA
LONGMONT SOUTH 2001
ETr EToMax. Min. Average Max Total Average Alfalfa Grass(°F) (°F) (°F) (%) (°F) (inch) (mph) (miles) (mph) (Langl) (inch) (inch)
Solar Radiation Total
ASCE Calculation
Month Day
Date Temperature Relative Humidity Average
Dew Point
Average
Precipitation Total
Wind
6 24 93.0 55.0 75.5 40.4 48.4 28.5 138.7 5.8 437.4 0.33 0.246 25 94.0 58.2 76.1 45.8 51.2 32.4 111.0 4.6 579.8 0.33 0.256 26 90.1 56.2 73.2 53.9 54.5 29.8 130.2 5.4 536.6 0.30 0.236 27 89.5 56.6 74.9 51.3 53.4 13.7 97.0 4.0 710.0 0.31 0.266 28 92.7 55.7 76.8 43.2 50.0 15.7 89.3 3.7 730.0 0.33 0.276 29 96.0 57.6 78.6 43.6 51.7 20.3 111.6 4.7 677.4 0.36 0.286 30 98.1 58.4 79.4 44.1 52.8 27.8 126.3 5.3 588.8 0.37 0.287 1 96.3 61.2 78.2 46.2 54.6 20.2 106.7 4.4 644.8 0.35 0.277 2 97.9 57.3 77.4 45.4 51.6 26.4 118.9 5.0 605.0 0.37 0.287 3 87.8 55.7 74.1 59.3 58.1 23.7 122.6 5.1 633.0 0.28 0.237 4 90.4 58.4 75.6 61.2 59.6 27.9 104.3 4.3 560.4 0.27 0.227 5 95.1 63.0 78.0 55.2 59.5 0.02 32.9 165.7 6.9 586.7 0.37 0.287 6 95.9 63.9 79.7 49.3 57.3 18.1 109.7 4.6 653.4 0.34 0.277 7 93.2 60.5 77.1 60.4 60.4 0.17 24.2 105.4 4.4 618.4 0.30 0.257 8 91.7 62.7 73.7 71.3 62.1 0.15 46.0 171.0 7.1 516.6 0.32 0.247 9 85.3 58.2 72.3 70.9 61.7 0.01 16.6 92.1 3.8 605.3 0.24 0.217 10 85.7 64.0 72.0 69.7 61.0 0.09 25.6 145.2 6.0 631.4 0.30 0.247 11 87.0 59.5 71.0 76.1 61.7 0.05 22.0 113.3 4.7 628.1 0.27 0.227 12 83.3 60.2 68.9 85.8 63.8 0.28 31.0 125.4 5.2 468.9 0.20 0.177 13 81.9 58.7 68.3 84.8 62.9 0.05 27.0 103.1 4.3 451.5 0.19 0.167 14 82.5 56.2 67.1 86.2 62.3 0.13 24.8 91.7 3.8 573.2 0.21 0.187 15 86.1 56.2 71.6 62.6 55.9 0.03 31.6 112.7 4.7 676.9 0.29 0.247 16 88.1 59.5 75.2 42.4 49.2 26.5 151.0 6.3 720.0 0.37 0.287 17 88.1 52.8 73.1 42.9 47.7 16.1 109.4 4.6 531.7 0.28 0.227 18 88.1 56.0 75.0 42.7 49.7 33.8 118.1 4.9 583.9 0.30 0.247 19 90.3 59.5 75.4 49.2 53.6 22.9 125.3 5.2 574.3 0.31 0.247 20 91.3 56.5 75.8 50.9 54.6 22.6 90.9 3.8 659.7 0.29 0.247 21 90.4 59.5 76.8 48.7 54.7 14.5 97.5 4.1 469.5 0.26 0.207 22 94.5 60.7 78.8 45.8 54.1 21.8 88.6 3.7 681.9 0.32 0.26
7 of 13

TABLE B9NCWCD WEATHER STATION DATA
LONGMONT SOUTH 2001
ETr EToMax. Min. Average Max Total Average Alfalfa Grass(°F) (°F) (°F) (%) (°F) (inch) (mph) (miles) (mph) (Langl) (inch) (inch)
Solar Radiation Total
ASCE Calculation
Month Day
Date Temperature Relative Humidity Average
Dew Point
Average
Precipitation Total
Wind
7 23 79.5 60.1 69.6 75.6 61.9 16.9 112.1 4.7 408.2 0.17 0.157 24 84.7 57.4 69.2 79.2 61.5 0.01 20.0 98.1 4.1 526.3 0.22 0.187 25 87.9 55.3 71.5 65.3 57.5 0.03 27.8 110.3 4.6 630.4 0.28 0.237 26 79.2 56.3 67.5 77.3 59.6 22.5 108.9 4.5 416.2 0.18 0.157 27 85.6 55.5 71.4 62.5 55.9 12.8 74.6 3.1 603.4 0.24 0.207 28 95.6 53.9 75.9 47.0 49.2 16.7 91.5 3.8 695.7 0.33 0.267 29 100.2 54.6 81.0 35.0 45.8 15.3 94.3 3.9 658.2 0.35 0.277 30 99.1 57.5 80.9 33.4 46.6 23.8 114.5 4.8 634.1 0.37 0.287 31 92.3 64.3 77.8 47.6 54.8 0.01 26.9 116.0 4.8 486.5 0.30 0.238 1 86.8 60.4 71.9 67.1 58.2 0.01 21.3 124.3 5.2 478.4 0.26 0.208 2 88.3 60.9 72.5 70.9 61.0 22.3 125.0 5.2 538.6 0.27 0.218 3 92.5 57.6 76.3 57.0 57.2 19.5 84.4 3.5 672.9 0.29 0.248 4 93.4 61.3 78.5 52.5 58.4 12.6 81.9 3.4 512.2 0.25 0.218 5 94.5 62.7 79.8 48.3 56.5 0.01 24.0 96.5 4.0 532.0 0.29 0.238 6 92.7 63.1 73.9 67.4 60.9 0.20 29.0 113.7 4.7 445.7 0.27 0.218 7 91.7 59.1 75.2 68.1 61.8 0.02 23.0 101.9 4.2 626.6 0.28 0.238 8 89.6 59.1 74.6 58.1 57.5 0.01 22.7 132.8 5.5 596.8 0.30 0.248 9 68.4 57.5 63.6 85.1 58.8 0.30 20.7 127.3 5.3 253.5 0.10 0.098 10 77.8 56.5 64.3 85.2 59.4 0.01 18.0 107.1 4.5 499.8 0.18 0.168 11 84.0 52.8 67.8 74.3 57.8 20.8 87.7 3.7 536.0 0.21 0.188 12 84.5 53.6 69.1 71.2 58.4 12.1 78.7 3.3 524.5 0.21 0.188 13 81.4 56.8 68.3 79.5 61.2 20.0 90.8 3.8 439.9 0.18 0.158 14 77.9 61.0 67.8 80.2 61.2 32.8 112.2 4.7 372.9 0.16 0.148 15 78.5 58.5 67.2 70.5 56.5 0.01 35.2 117.6 4.9 411.3 0.19 0.168 16 76.3 52.1 64.2 73.6 54.8 32.2 105.3 4.4 430.4 0.17 0.148 17 83.6 48.4 66.6 65.4 52.2 11.6 72.6 3.0 612.1 0.22 0.198 18 89.5 48.3 71.0 52.1 49.3 15.1 74.4 3.1 608.3 0.25 0.218 19 94.3 53.8 72.4 49.8 50.8 0.01 29.3 100.9 4.2 432.8 0.28 0.218 20 82.2 63.0 72.3 49.4 52.2 30.1 147.5 6.1 348.9 0.25 0.18
8 of 13
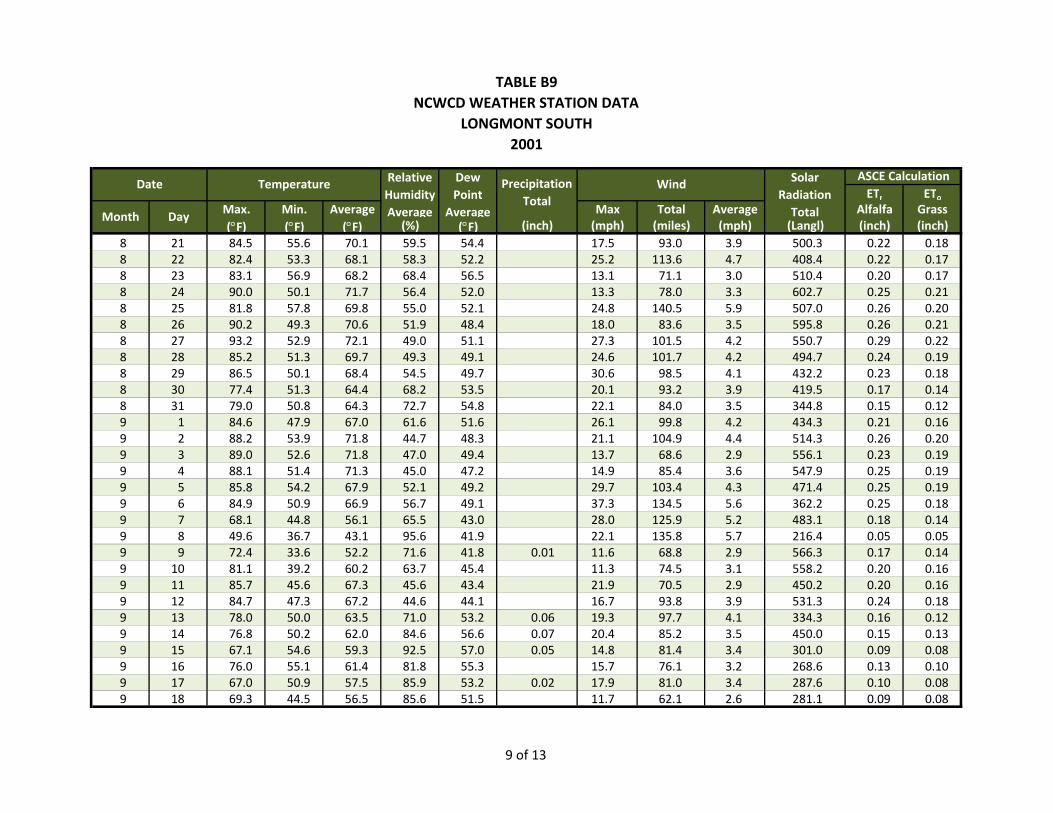
TABLE B9NCWCD WEATHER STATION DATA
LONGMONT SOUTH 2001
ETr EToMax. Min. Average Max Total Average Alfalfa Grass(°F) (°F) (°F) (%) (°F) (inch) (mph) (miles) (mph) (Langl) (inch) (inch)
Solar Radiation Total
ASCE Calculation
Month Day
Date Temperature Relative Humidity Average
Dew Point
Average
Precipitation Total
Wind
8 21 84.5 55.6 70.1 59.5 54.4 17.5 93.0 3.9 500.3 0.22 0.188 22 82.4 53.3 68.1 58.3 52.2 25.2 113.6 4.7 408.4 0.22 0.178 23 83.1 56.9 68.2 68.4 56.5 13.1 71.1 3.0 510.4 0.20 0.178 24 90.0 50.1 71.7 56.4 52.0 13.3 78.0 3.3 602.7 0.25 0.218 25 81.8 57.8 69.8 55.0 52.1 24.8 140.5 5.9 507.0 0.26 0.208 26 90.2 49.3 70.6 51.9 48.4 18.0 83.6 3.5 595.8 0.26 0.218 27 93.2 52.9 72.1 49.0 51.1 27.3 101.5 4.2 550.7 0.29 0.228 28 85.2 51.3 69.7 49.3 49.1 24.6 101.7 4.2 494.7 0.24 0.198 29 86.5 50.1 68.4 54.5 49.7 30.6 98.5 4.1 432.2 0.23 0.188 30 77.4 51.3 64.4 68.2 53.5 20.1 93.2 3.9 419.5 0.17 0.148 31 79.0 50.8 64.3 72.7 54.8 22.1 84.0 3.5 344.8 0.15 0.129 1 84.6 47.9 67.0 61.6 51.6 26.1 99.8 4.2 434.3 0.21 0.169 2 88.2 53.9 71.8 44.7 48.3 21.1 104.9 4.4 514.3 0.26 0.209 3 89.0 52.6 71.8 47.0 49.4 13.7 68.6 2.9 556.1 0.23 0.199 4 88.1 51.4 71.3 45.0 47.2 14.9 85.4 3.6 547.9 0.25 0.199 5 85.8 54.2 67.9 52.1 49.2 29.7 103.4 4.3 471.4 0.25 0.199 6 84.9 50.9 66.9 56.7 49.1 37.3 134.5 5.6 362.2 0.25 0.189 7 68.1 44.8 56.1 65.5 43.0 28.0 125.9 5.2 483.1 0.18 0.149 8 49.6 36.7 43.1 95.6 41.9 22.1 135.8 5.7 216.4 0.05 0.059 9 72.4 33.6 52.2 71.6 41.8 0.01 11.6 68.8 2.9 566.3 0.17 0.149 10 81.1 39.2 60.2 63.7 45.4 11.3 74.5 3.1 558.2 0.20 0.169 11 85.7 45.6 67.3 45.6 43.4 21.9 70.5 2.9 450.2 0.20 0.169 12 84.7 47.3 67.2 44.6 44.1 16.7 93.8 3.9 531.3 0.24 0.189 13 78.0 50.0 63.5 71.0 53.2 0.06 19.3 97.7 4.1 334.3 0.16 0.129 14 76.8 50.2 62.0 84.6 56.6 0.07 20.4 85.2 3.5 450.0 0.15 0.139 15 67.1 54.6 59.3 92.5 57.0 0.05 14.8 81.4 3.4 301.0 0.09 0.089 16 76.0 55.1 61.4 81.8 55.3 15.7 76.1 3.2 268.6 0.13 0.109 17 67.0 50.9 57.5 85.9 53.2 0.02 17.9 81.0 3.4 287.6 0.10 0.089 18 69.3 44.5 56.5 85.6 51.5 11.7 62.1 2.6 281.1 0.09 0.08
9 of 13

TABLE B9NCWCD WEATHER STATION DATA
LONGMONT SOUTH 2001
ETr EToMax. Min. Average Max Total Average Alfalfa Grass(°F) (°F) (°F) (%) (°F) (inch) (mph) (miles) (mph) (Langl) (inch) (inch)
Solar Radiation Total
ASCE Calculation
Month Day
Date Temperature Relative Humidity Average
Dew Point
Average
Precipitation Total
Wind
9 19 82.9 43.0 63.8 55.5 44.4 0.01 24.9 131.6 5.5 511.1 0.25 0.189 20 80.1 47.7 64.4 53.1 45.2 12.6 89.2 3.7 504.3 0.20 0.169 21 88.3 44.5 65.6 55.1 44.8 29.1 92.7 3.9 475.6 0.24 0.189 22 83.3 50.1 66.0 43.6 40.7 19.6 107.0 4.5 484.5 0.25 0.189 23 72.9 43.3 57.5 60.7 42.9 11.4 73.2 3.0 492.5 0.16 0.139 24 81.7 40.5 59.9 64.7 45.3 10.4 63.7 2.7 488.6 0.18 0.149 25 85.0 43.5 63.7 53.1 43.0 11.3 66.2 2.8 482.1 0.19 0.159 26 89.7 45.9 68.4 44.1 41.3 0.01 32.9 92.2 3.8 421.2 0.24 0.179 27 88.5 49.7 70.5 35.8 39.3 14.6 74.9 3.1 475.2 0.22 0.169 28 80.3 47.9 64.3 56.1 47.8 10.6 78.3 3.3 341.6 0.16 0.129 29 80.5 51.1 64.0 59.8 48.8 19.5 98.3 4.1 260.2 0.17 0.129 30 74.7 46.6 60.4 68.1 49.2 11.0 71.1 3.0 405.1 0.14 0.1110 1 81.2 46.3 63.3 58.4 46.2 11.1 69.6 2.9 440.3 0.17 0.1310 2 82.6 55.4 68.7 34.1 37.7 18.2 114.8 4.8 374.7 0.24 0.1710 3 80.3 41.7 60.4 49.3 39.2 18.7 108.6 4.5 434.7 0.22 0.1510 4 54.8 34.4 46.5 79.4 40.3 0.07 28.6 153.7 6.4 193.2 0.07 0.0510 5 42.9 31.0 36.4 94.0 34.6 0.01 22.3 94.2 3.9 114.1 0.03 0.0310 6 69.6 27.0 47.4 70.6 36.2 0.01 10.2 65.8 2.7 410.0 0.13 0.1010 7 74.8 39.2 56.3 62.9 42.4 0.01 22.9 111.3 4.6 212.1 0.15 0.1110 8 77.6 46.9 62.8 47.0 40.5 18.9 96.4 4.0 405.3 0.18 0.1310 9 63.6 41.7 51.6 69.9 41.6 0.04 34.8 140.6 5.9 290.2 0.13 0.0910 10 57.6 32.3 44.1 65.4 32.0 20.9 106.3 4.4 387.2 0.12 0.0910 11 66.3 25.7 45.7 57.3 28.8 42.7 206.3 8.6 188.0 0.20 0.1310 12 52.7 36.9 46.1 40.8 23.5 29.5 194.3 8.1 377.3 0.16 0.1110 13 61.3 34.8 52.2 45.8 31.8 25.3 225.7 9.4 306.0 0.17 0.1210 14 67.1 28.6 47.2 66.5 35.2 19.3 113.3 4.7 403.1 0.14 0.1010 15 50.9 31.0 39.5 77.1 32.7 0.01 45.0 130.8 5.5 329.4 0.09 0.0710 16 72.9 25.8 45.7 63.9 31.7 10.3 62.9 2.6 369.1 0.14 0.1010 17 77.3 33.5 56.1 47.1 32.0 23.2 111.9 4.7 234.3 0.19 0.13
10 of 13
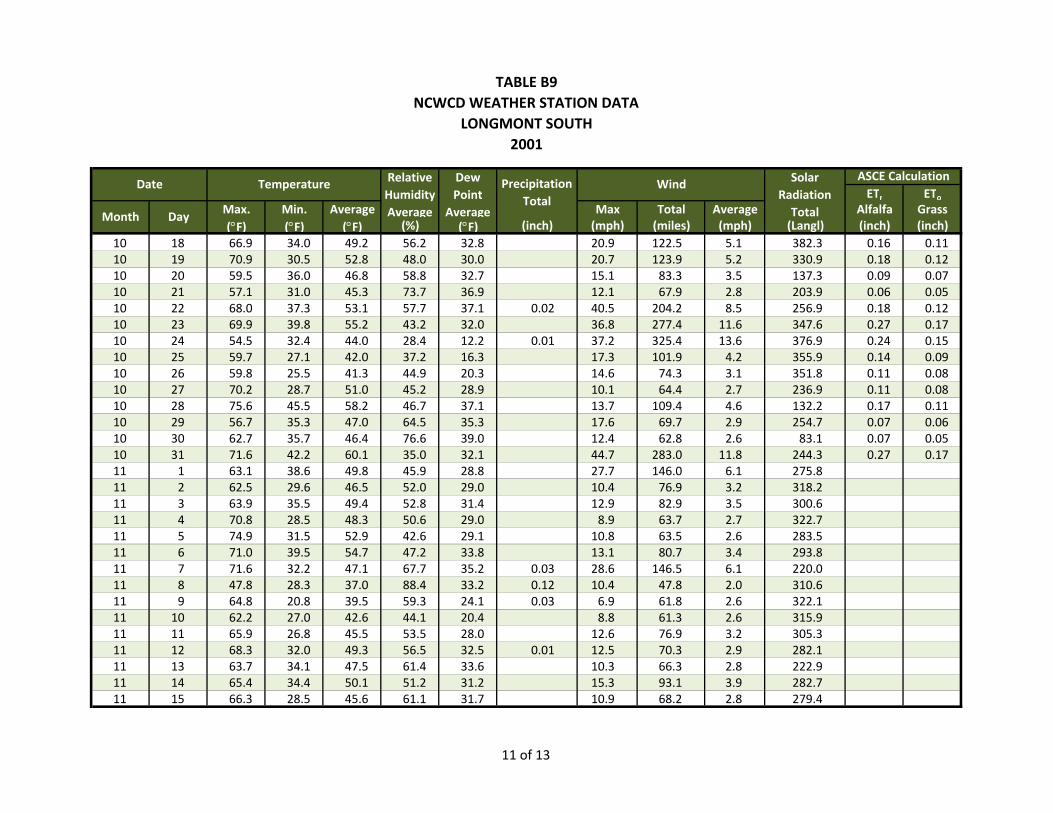
TABLE B9NCWCD WEATHER STATION DATA
LONGMONT SOUTH 2001
ETr EToMax. Min. Average Max Total Average Alfalfa Grass(°F) (°F) (°F) (%) (°F) (inch) (mph) (miles) (mph) (Langl) (inch) (inch)
Solar Radiation Total
ASCE Calculation
Month Day
Date Temperature Relative Humidity Average
Dew Point
Average
Precipitation Total
Wind
10 18 66.9 34.0 49.2 56.2 32.8 20.9 122.5 5.1 382.3 0.16 0.1110 19 70.9 30.5 52.8 48.0 30.0 20.7 123.9 5.2 330.9 0.18 0.1210 20 59.5 36.0 46.8 58.8 32.7 15.1 83.3 3.5 137.3 0.09 0.0710 21 57.1 31.0 45.3 73.7 36.9 12.1 67.9 2.8 203.9 0.06 0.0510 22 68.0 37.3 53.1 57.7 37.1 0.02 40.5 204.2 8.5 256.9 0.18 0.1210 23 69.9 39.8 55.2 43.2 32.0 36.8 277.4 11.6 347.6 0.27 0.1710 24 54.5 32.4 44.0 28.4 12.2 0.01 37.2 325.4 13.6 376.9 0.24 0.1510 25 59.7 27.1 42.0 37.2 16.3 17.3 101.9 4.2 355.9 0.14 0.0910 26 59.8 25.5 41.3 44.9 20.3 14.6 74.3 3.1 351.8 0.11 0.0810 27 70.2 28.7 51.0 45.2 28.9 10.1 64.4 2.7 236.9 0.11 0.0810 28 75.6 45.5 58.2 46.7 37.1 13.7 109.4 4.6 132.2 0.17 0.1110 29 56.7 35.3 47.0 64.5 35.3 17.6 69.7 2.9 254.7 0.07 0.0610 30 62.7 35.7 46.4 76.6 39.0 12.4 62.8 2.6 83.1 0.07 0.0510 31 71.6 42.2 60.1 35.0 32.1 44.7 283.0 11.8 244.3 0.27 0.1711 1 63.1 38.6 49.8 45.9 28.8 27.7 146.0 6.1 275.811 2 62.5 29.6 46.5 52.0 29.0 10.4 76.9 3.2 318.211 3 63.9 35.5 49.4 52.8 31.4 12.9 82.9 3.5 300.611 4 70.8 28.5 48.3 50.6 29.0 8.9 63.7 2.7 322.711 5 74.9 31.5 52.9 42.6 29.1 10.8 63.5 2.6 283.511 6 71.0 39.5 54.7 47.2 33.8 13.1 80.7 3.4 293.811 7 71.6 32.2 47.1 67.7 35.2 0.03 28.6 146.5 6.1 220.011 8 47.8 28.3 37.0 88.4 33.2 0.12 10.4 47.8 2.0 310.611 9 64.8 20.8 39.5 59.3 24.1 0.03 6.9 61.8 2.6 322.111 10 62.2 27.0 42.6 44.1 20.4 8.8 61.3 2.6 315.911 11 65.9 26.8 45.5 53.5 28.0 12.6 76.9 3.2 305.311 12 68.3 32.0 49.3 56.5 32.5 0.01 12.5 70.3 2.9 282.111 13 63.7 34.1 47.5 61.4 33.6 10.3 66.3 2.8 222.911 14 65.4 34.4 50.1 51.2 31.2 15.3 93.1 3.9 282.711 15 66.3 28.5 45.6 61.1 31.7 10.9 68.2 2.8 279.4
11 of 13
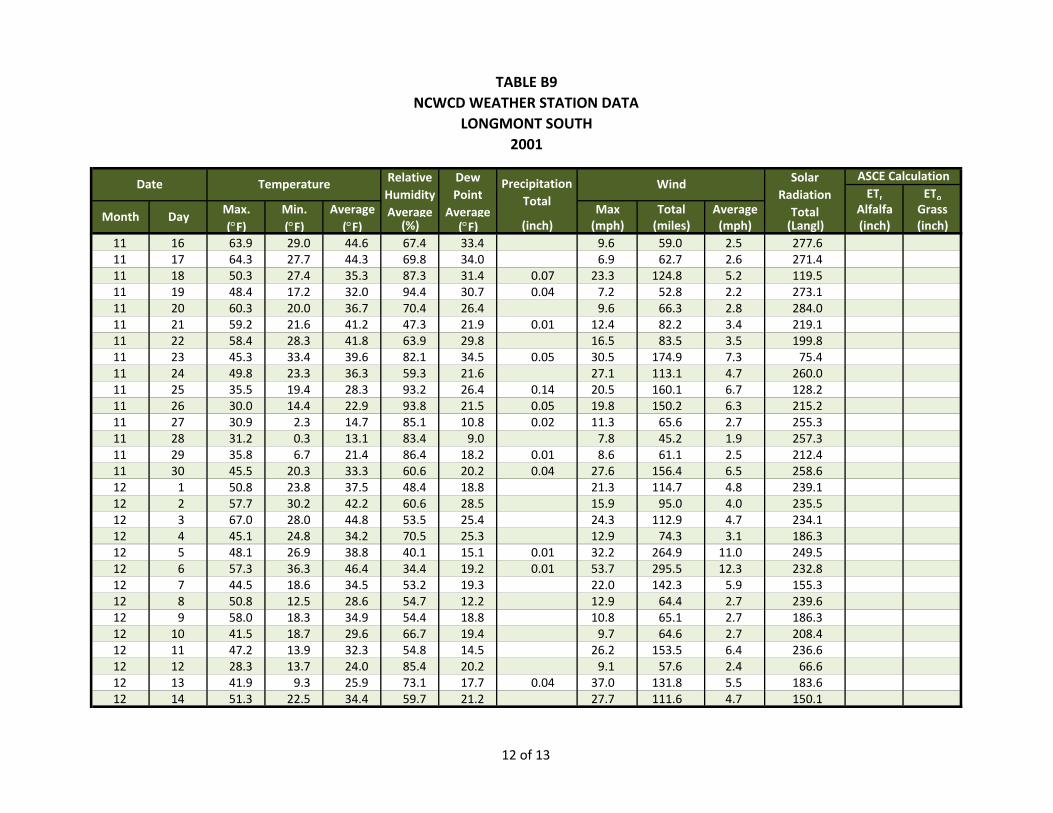
TABLE B9NCWCD WEATHER STATION DATA
LONGMONT SOUTH 2001
ETr EToMax. Min. Average Max Total Average Alfalfa Grass(°F) (°F) (°F) (%) (°F) (inch) (mph) (miles) (mph) (Langl) (inch) (inch)
Solar Radiation Total
ASCE Calculation
Month Day
Date Temperature Relative Humidity Average
Dew Point
Average
Precipitation Total
Wind
11 16 63.9 29.0 44.6 67.4 33.4 9.6 59.0 2.5 277.611 17 64.3 27.7 44.3 69.8 34.0 6.9 62.7 2.6 271.411 18 50.3 27.4 35.3 87.3 31.4 0.07 23.3 124.8 5.2 119.511 19 48.4 17.2 32.0 94.4 30.7 0.04 7.2 52.8 2.2 273.111 20 60.3 20.0 36.7 70.4 26.4 9.6 66.3 2.8 284.011 21 59.2 21.6 41.2 47.3 21.9 0.01 12.4 82.2 3.4 219.111 22 58.4 28.3 41.8 63.9 29.8 16.5 83.5 3.5 199.811 23 45.3 33.4 39.6 82.1 34.5 0.05 30.5 174.9 7.3 75.411 24 49.8 23.3 36.3 59.3 21.6 27.1 113.1 4.7 260.011 25 35.5 19.4 28.3 93.2 26.4 0.14 20.5 160.1 6.7 128.211 26 30.0 14.4 22.9 93.8 21.5 0.05 19.8 150.2 6.3 215.211 27 30.9 2.3 14.7 85.1 10.8 0.02 11.3 65.6 2.7 255.311 28 31.2 0.3 13.1 83.4 9.0 7.8 45.2 1.9 257.311 29 35.8 6.7 21.4 86.4 18.2 0.01 8.6 61.1 2.5 212.411 30 45.5 20.3 33.3 60.6 20.2 0.04 27.6 156.4 6.5 258.612 1 50.8 23.8 37.5 48.4 18.8 21.3 114.7 4.8 239.112 2 57.7 30.2 42.2 60.6 28.5 15.9 95.0 4.0 235.512 3 67.0 28.0 44.8 53.5 25.4 24.3 112.9 4.7 234.112 4 45.1 24.8 34.2 70.5 25.3 12.9 74.3 3.1 186.312 5 48.1 26.9 38.8 40.1 15.1 0.01 32.2 264.9 11.0 249.512 6 57.3 36.3 46.4 34.4 19.2 0.01 53.7 295.5 12.3 232.812 7 44.5 18.6 34.5 53.2 19.3 22.0 142.3 5.9 155.312 8 50.8 12.5 28.6 54.7 12.2 12.9 64.4 2.7 239.612 9 58.0 18.3 34.9 54.4 18.8 10.8 65.1 2.7 186.312 10 41.5 18.7 29.6 66.7 19.4 9.7 64.6 2.7 208.412 11 47.2 13.9 32.3 54.8 14.5 26.2 153.5 6.4 236.612 12 28.3 13.7 24.0 85.4 20.2 9.1 57.6 2.4 66.612 13 41.9 9.3 25.9 73.1 17.7 0.04 37.0 131.8 5.5 183.612 14 51.3 22.5 34.4 59.7 21.2 27.7 111.6 4.7 150.1
12 of 13

TABLE B9NCWCD WEATHER STATION DATA
LONGMONT SOUTH 2001
ETr EToMax. Min. Average Max Total Average Alfalfa Grass(°F) (°F) (°F) (%) (°F) (inch) (mph) (miles) (mph) (Langl) (inch) (inch)
Solar Radiation Total
ASCE Calculation
Month Day
Date Temperature Relative Humidity Average
Dew Point
Average
Precipitation Total
Wind
12 15 44.9 17.9 30.6 74.3 22.1 0.05 16.9 92.5 3.9 149.712 16 31.4 9.9 22.0 99.0 22.1 0.05 9.1 69.3 2.9 239.212 17 63.6 15.3 39.2 57.5 21.7 0.02 16.1 83.3 3.5 230.412 18 42.5 18.3 32.0 72.0 23.6 19.5 110.9 4.6 211.512 19 54.5 14.6 32.7 67.4 20.8 0.02 27.3 98.4 4.1 213.612 20 41.8 20.8 30.9 70.3 22.2 13.5 74.2 3.1 193.412 21 48.8 16.1 32.3 68.2 21.9 0.02 27.8 129.6 5.4 197.712 22 42.2 18.3 30.0 65.7 18.6 25.4 129.8 5.4 209.112 23 45.3 11.4 26.5 69.6 16.2 12.1 63.7 2.7 233.612 24 40.5 13.0 25.8 64.4 14.2 8.6 67.4 2.8 229.712 25 44.0 13.4 28.0 54.3 12.0 12.4 93.2 3.9 194.712 26 51.2 18.0 32.9 51.5 15.4 13.9 75.7 3.2 230.812 27 46.6 18.4 31.8 52.4 15.0 22.2 95.6 4.0 212.312 28 52.9 23.4 38.1 50.4 19.2 41.7 282.4 11.8 203.112 29 31.4 18.0 23.9 75.5 17.3 12.9 80.6 3.4 133.812 30 25.1 19.3 22.3 81.1 17.4 8.8 69.2 2.9 79.512 31 35.9 10.2 23.5 78.8 17.6 14.5 73.0 3.0 226.3
10.38 38.87
13 of 13
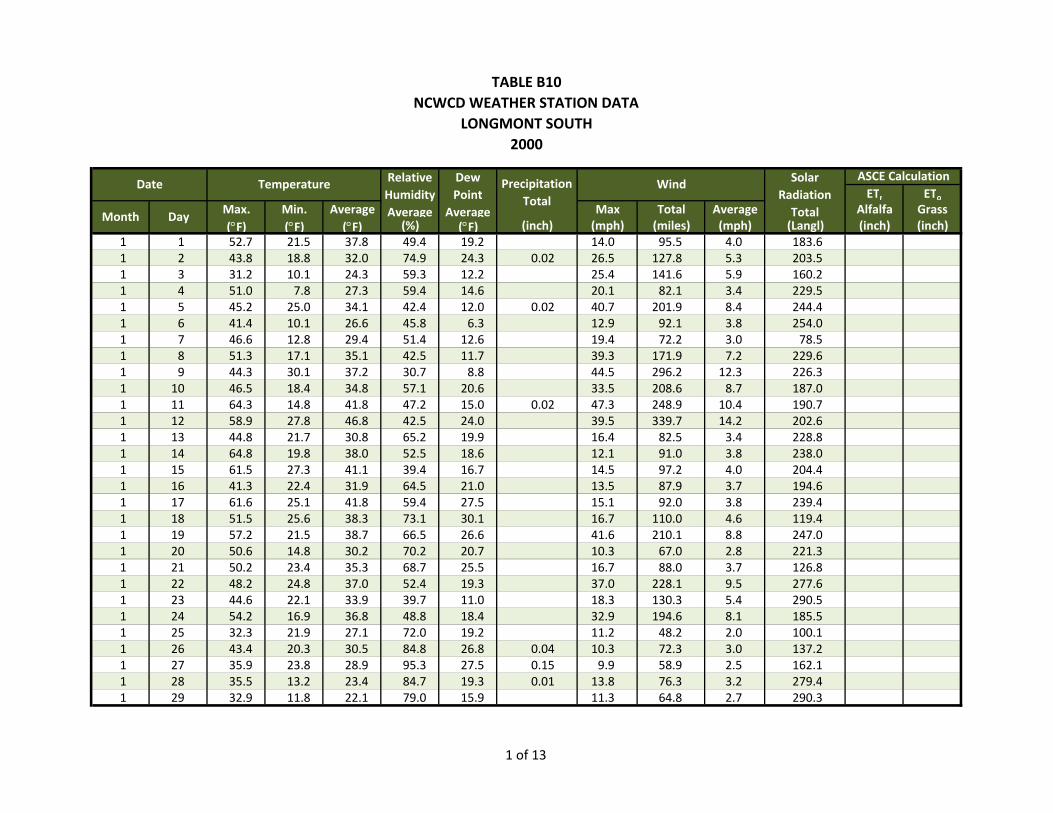
TABLE B10NCWCD WEATHER STATION DATA
LONGMONT SOUTH 2000
ETr EToMax. Min. Average Max Total Average Alfalfa Grass(°F) (°F) (°F) (%) (°F) (inch) (mph) (miles) (mph) (Langl) (inch) (inch)
1 1 52.7 21.5 37.8 49.4 19.2 14.0 95.5 4.0 183.61 2 43.8 18.8 32.0 74.9 24.3 0.02 26.5 127.8 5.3 203.51 3 31.2 10.1 24.3 59.3 12.2 25.4 141.6 5.9 160.21 4 51.0 7.8 27.3 59.4 14.6 20.1 82.1 3.4 229.51 5 45.2 25.0 34.1 42.4 12.0 0.02 40.7 201.9 8.4 244.41 6 41.4 10.1 26.6 45.8 6.3 12.9 92.1 3.8 254.01 7 46.6 12.8 29.4 51.4 12.6 19.4 72.2 3.0 78.51 8 51.3 17.1 35.1 42.5 11.7 39.3 171.9 7.2 229.61 9 44.3 30.1 37.2 30.7 8.8 44.5 296.2 12.3 226.31 10 46.5 18.4 34.8 57.1 20.6 33.5 208.6 8.7 187.01 11 64.3 14.8 41.8 47.2 15.0 0.02 47.3 248.9 10.4 190.71 12 58.9 27.8 46.8 42.5 24.0 39.5 339.7 14.2 202.61 13 44.8 21.7 30.8 65.2 19.9 16.4 82.5 3.4 228.81 14 64.8 19.8 38.0 52.5 18.6 12.1 91.0 3.8 238.01 15 61.5 27.3 41.1 39.4 16.7 14.5 97.2 4.0 204.41 16 41.3 22.4 31.9 64.5 21.0 13.5 87.9 3.7 194.61 17 61.6 25.1 41.8 59.4 27.5 15.1 92.0 3.8 239.41 18 51.5 25.6 38.3 73.1 30.1 16.7 110.0 4.6 119.41 19 57.2 21.5 38.7 66.5 26.6 41.6 210.1 8.8 247.01 20 50.6 14.8 30.2 70.2 20.7 10.3 67.0 2.8 221.31 21 50.2 23.4 35.3 68.7 25.5 16.7 88.0 3.7 126.81 22 48.2 24.8 37.0 52.4 19.3 37.0 228.1 9.5 277.61 23 44.6 22.1 33.9 39.7 11.0 18.3 130.3 5.4 290.51 24 54.2 16.9 36.8 48.8 18.4 32.9 194.6 8.1 185.51 25 32.3 21.9 27.1 72.0 19.2 11.2 48.2 2.0 100.11 26 43.4 20.3 30.5 84.8 26.8 0.04 10.3 72.3 3.0 137.21 27 35.9 23.8 28.9 95.3 27.5 0.15 9.9 58.9 2.5 162.11 28 35.5 13.2 23.4 84.7 19.3 0.01 13.8 76.3 3.2 279.41 29 32.9 11.8 22.1 79.0 15.9 11.3 64.8 2.7 290.3
Solar Radiation Total
ASCE Calculation
Month Day
Date Temperature Relative Humidity Average
Dew Point
Average
Precipitation Total
Wind
1 of 13
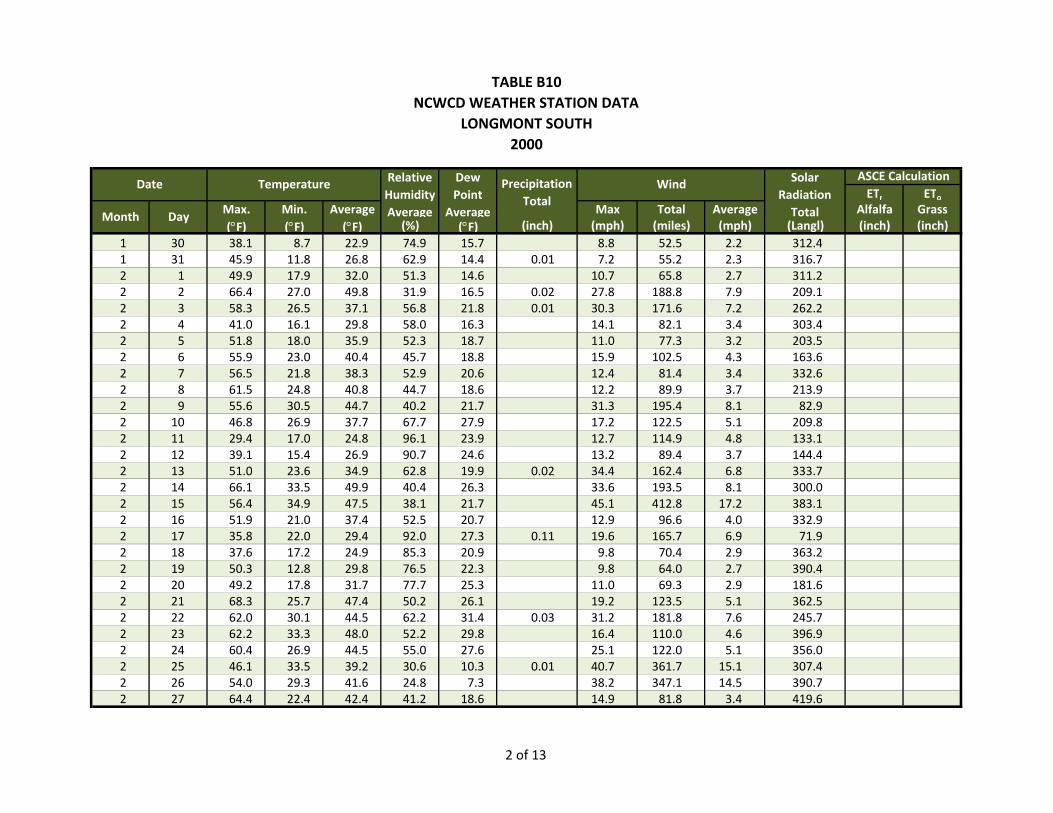
TABLE B10NCWCD WEATHER STATION DATA
LONGMONT SOUTH 2000
ETr EToMax. Min. Average Max Total Average Alfalfa Grass(°F) (°F) (°F) (%) (°F) (inch) (mph) (miles) (mph) (Langl) (inch) (inch)
Solar Radiation Total
ASCE Calculation
Month Day
Date Temperature Relative Humidity Average
Dew Point
Average
Precipitation Total
Wind
1 30 38.1 8.7 22.9 74.9 15.7 8.8 52.5 2.2 312.41 31 45.9 11.8 26.8 62.9 14.4 0.01 7.2 55.2 2.3 316.72 1 49.9 17.9 32.0 51.3 14.6 10.7 65.8 2.7 311.22 2 66.4 27.0 49.8 31.9 16.5 0.02 27.8 188.8 7.9 209.12 3 58.3 26.5 37.1 56.8 21.8 0.01 30.3 171.6 7.2 262.22 4 41.0 16.1 29.8 58.0 16.3 14.1 82.1 3.4 303.42 5 51.8 18.0 35.9 52.3 18.7 11.0 77.3 3.2 203.52 6 55.9 23.0 40.4 45.7 18.8 15.9 102.5 4.3 163.62 7 56.5 21.8 38.3 52.9 20.6 12.4 81.4 3.4 332.62 8 61.5 24.8 40.8 44.7 18.6 12.2 89.9 3.7 213.92 9 55.6 30.5 44.7 40.2 21.7 31.3 195.4 8.1 82.92 10 46.8 26.9 37.7 67.7 27.9 17.2 122.5 5.1 209.82 11 29.4 17.0 24.8 96.1 23.9 12.7 114.9 4.8 133.12 12 39.1 15.4 26.9 90.7 24.6 13.2 89.4 3.7 144.42 13 51.0 23.6 34.9 62.8 19.9 0.02 34.4 162.4 6.8 333.72 14 66.1 33.5 49.9 40.4 26.3 33.6 193.5 8.1 300.02 15 56.4 34.9 47.5 38.1 21.7 45.1 412.8 17.2 383.12 16 51.9 21.0 37.4 52.5 20.7 12.9 96.6 4.0 332.92 17 35.8 22.0 29.4 92.0 27.3 0.11 19.6 165.7 6.9 71.92 18 37.6 17.2 24.9 85.3 20.9 9.8 70.4 2.9 363.22 19 50.3 12.8 29.8 76.5 22.3 9.8 64.0 2.7 390.42 20 49.2 17.8 31.7 77.7 25.3 11.0 69.3 2.9 181.62 21 68.3 25.7 47.4 50.2 26.1 19.2 123.5 5.1 362.52 22 62.0 30.1 44.5 62.2 31.4 0.03 31.2 181.8 7.6 245.72 23 62.2 33.3 48.0 52.2 29.8 16.4 110.0 4.6 396.92 24 60.4 26.9 44.5 55.0 27.6 25.1 122.0 5.1 356.02 25 46.1 33.5 39.2 30.6 10.3 0.01 40.7 361.7 15.1 307.42 26 54.0 29.3 41.6 24.8 7.3 38.2 347.1 14.5 390.72 27 64.4 22.4 42.4 41.2 18.6 14.9 81.8 3.4 419.6
2 of 13
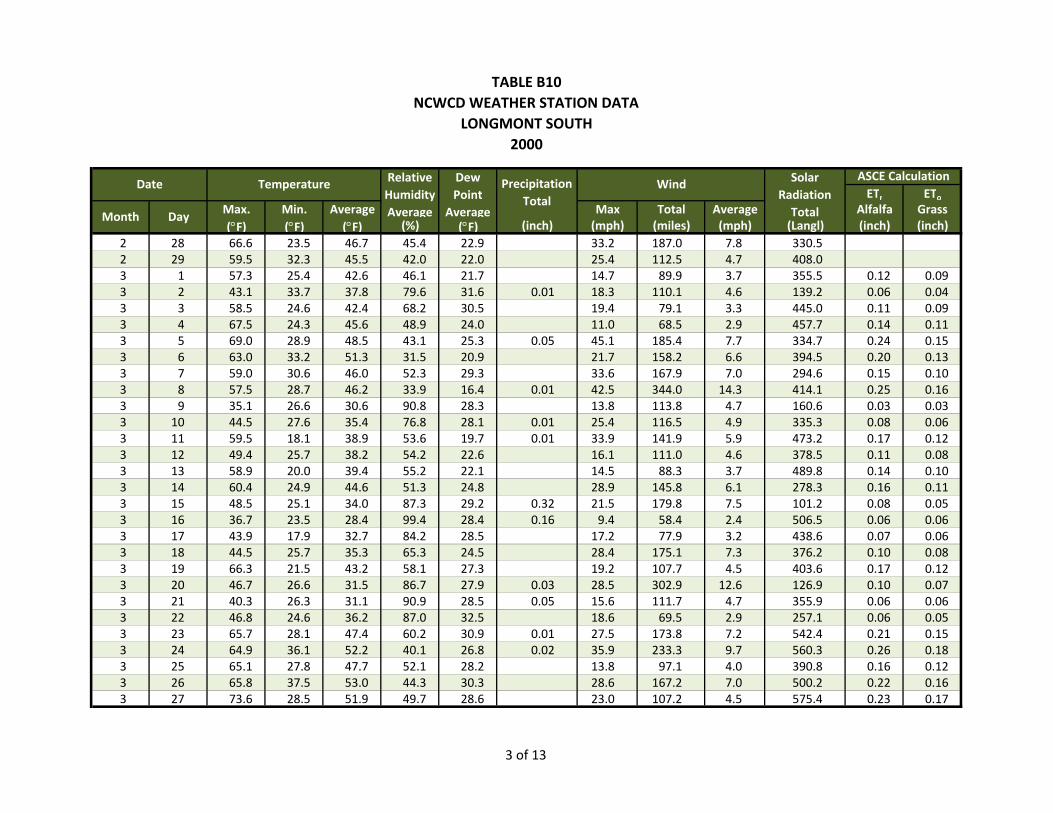
TABLE B10NCWCD WEATHER STATION DATA
LONGMONT SOUTH 2000
ETr EToMax. Min. Average Max Total Average Alfalfa Grass(°F) (°F) (°F) (%) (°F) (inch) (mph) (miles) (mph) (Langl) (inch) (inch)
Solar Radiation Total
ASCE Calculation
Month Day
Date Temperature Relative Humidity Average
Dew Point
Average
Precipitation Total
Wind
2 28 66.6 23.5 46.7 45.4 22.9 33.2 187.0 7.8 330.52 29 59.5 32.3 45.5 42.0 22.0 25.4 112.5 4.7 408.03 1 57.3 25.4 42.6 46.1 21.7 14.7 89.9 3.7 355.5 0.12 0.093 2 43.1 33.7 37.8 79.6 31.6 0.01 18.3 110.1 4.6 139.2 0.06 0.043 3 58.5 24.6 42.4 68.2 30.5 19.4 79.1 3.3 445.0 0.11 0.093 4 67.5 24.3 45.6 48.9 24.0 11.0 68.5 2.9 457.7 0.14 0.113 5 69.0 28.9 48.5 43.1 25.3 0.05 45.1 185.4 7.7 334.7 0.24 0.153 6 63.0 33.2 51.3 31.5 20.9 21.7 158.2 6.6 394.5 0.20 0.133 7 59.0 30.6 46.0 52.3 29.3 33.6 167.9 7.0 294.6 0.15 0.103 8 57.5 28.7 46.2 33.9 16.4 0.01 42.5 344.0 14.3 414.1 0.25 0.163 9 35.1 26.6 30.6 90.8 28.3 13.8 113.8 4.7 160.6 0.03 0.033 10 44.5 27.6 35.4 76.8 28.1 0.01 25.4 116.5 4.9 335.3 0.08 0.063 11 59.5 18.1 38.9 53.6 19.7 0.01 33.9 141.9 5.9 473.2 0.17 0.123 12 49.4 25.7 38.2 54.2 22.6 16.1 111.0 4.6 378.5 0.11 0.083 13 58.9 20.0 39.4 55.2 22.1 14.5 88.3 3.7 489.8 0.14 0.103 14 60.4 24.9 44.6 51.3 24.8 28.9 145.8 6.1 278.3 0.16 0.113 15 48.5 25.1 34.0 87.3 29.2 0.32 21.5 179.8 7.5 101.2 0.08 0.053 16 36.7 23.5 28.4 99.4 28.4 0.16 9.4 58.4 2.4 506.5 0.06 0.063 17 43.9 17.9 32.7 84.2 28.5 17.2 77.9 3.2 438.6 0.07 0.063 18 44.5 25.7 35.3 65.3 24.5 28.4 175.1 7.3 376.2 0.10 0.083 19 66.3 21.5 43.2 58.1 27.3 19.2 107.7 4.5 403.6 0.17 0.123 20 46.7 26.6 31.5 86.7 27.9 0.03 28.5 302.9 12.6 126.9 0.10 0.073 21 40.3 26.3 31.1 90.9 28.5 0.05 15.6 111.7 4.7 355.9 0.06 0.063 22 46.8 24.6 36.2 87.0 32.5 18.6 69.5 2.9 257.1 0.06 0.053 23 65.7 28.1 47.4 60.2 30.9 0.01 27.5 173.8 7.2 542.4 0.21 0.153 24 64.9 36.1 52.2 40.1 26.8 0.02 35.9 233.3 9.7 560.3 0.26 0.183 25 65.1 27.8 47.7 52.1 28.2 13.8 97.1 4.0 390.8 0.16 0.123 26 65.8 37.5 53.0 44.3 30.3 28.6 167.2 7.0 500.2 0.22 0.163 27 73.6 28.5 51.9 49.7 28.6 23.0 107.2 4.5 575.4 0.23 0.17
3 of 13

TABLE B10NCWCD WEATHER STATION DATA
LONGMONT SOUTH 2000
ETr EToMax. Min. Average Max Total Average Alfalfa Grass(°F) (°F) (°F) (%) (°F) (inch) (mph) (miles) (mph) (Langl) (inch) (inch)
Solar Radiation Total
ASCE Calculation
Month Day
Date Temperature Relative Humidity Average
Dew Point
Average
Precipitation Total
Wind
3 28 57.9 32.8 46.6 55.7 30.8 23.4 127.7 5.3 385.6 0.14 0.113 29 59.8 34.7 46.9 62.5 32.5 0.01 20.8 111.7 4.7 517.9 0.16 0.123 30 39.3 31.7 34.3 96.3 33.1 0.13 23.6 186.8 7.8 95.8 0.03 0.033 31 35.8 29.8 31.6 100.8 31.4 0.25 15.2 107.3 4.5 272.4 0.04 0.044 1 49.2 25.6 37.2 65.1 25.1 0.01 14.0 102.3 4.3 577.8 0.13 0.104 2 49.8 25.9 34.9 86.4 30.6 0.21 27.9 113.4 4.7 195.7 0.08 0.064 3 43.7 14.2 31.7 74.2 23.6 14.5 75.4 3.1 588.0 0.09 0.094 4 75.4 26.0 54.4 46.5 26.7 0.04 30.5 193.8 8.1 605.4 0.31 0.224 5 74.9 51.8 66.6 22.4 26.5 0.01 38.7 306.0 12.8 508.1 0.41 0.274 6 73.7 32.2 55.8 39.4 26.7 0.01 45.5 295.2 12.3 544.4 0.36 0.244 7 60.3 32.9 44.1 45.2 22.7 31.3 232.6 9.7 583.0 0.25 0.184 8 69.5 23.0 45.6 44.6 22.5 15.1 69.9 2.9 609.1 0.19 0.154 9 76.3 33.4 55.7 39.8 28.3 20.5 131.3 5.5 565.4 0.27 0.204 10 63.1 37.0 52.4 45.8 30.5 28.9 182.6 7.6 429.4 0.21 0.154 11 65.4 35.1 49.9 56.7 34.3 15.7 119.4 5.0 606.1 0.20 0.164 12 73.7 32.1 54.3 48.9 30.9 30.5 114.1 4.8 501.6 0.23 0.174 13 76.5 50.7 63.7 26.8 27.9 21.1 118.3 4.9 462.6 0.27 0.194 14 75.5 37.5 56.4 42.0 31.3 32.7 181.1 7.5 439.4 0.29 0.204 15 37.6 27.7 31.2 94.3 29.7 0.13 11.9 127.7 5.3 116.6 0.04 0.034 16 65.2 27.7 44.1 74.6 35.4 0.01 14.7 88.8 3.7 587.4 0.17 0.144 17 76.1 33.5 55.6 54.8 35.6 18.1 106.7 4.4 631.9 0.24 0.194 18 79.6 37.9 57.4 38.1 29.2 0.04 54.9 296.2 12.3 546.6 0.43 0.294 19 53.2 38.1 47.7 44.7 27.0 43.2 236.4 9.8 151.1 0.16 0.114 20 68.5 28.9 50.8 53.3 32.5 14.8 116.9 4.9 651.4 0.22 0.174 21 75.9 33.8 56.0 46.5 33.1 19.4 99.2 4.1 537.1 0.23 0.184 22 69.8 40.2 54.4 58.2 39.1 0.07 32.0 203.0 8.5 286.2 0.21 0.154 23 65.5 43.9 53.8 77.3 46.2 0.01 22.3 138.0 5.8 379.5 0.14 0.124 24 64.9 38.3 50.5 63.1 36.6 0.03 46.4 211.3 8.8 550.3 0.22 0.174 25 68.5 35.6 52.0 44.0 29.2 17.4 119.0 5.0 644.3 0.24 0.18
4 of 13
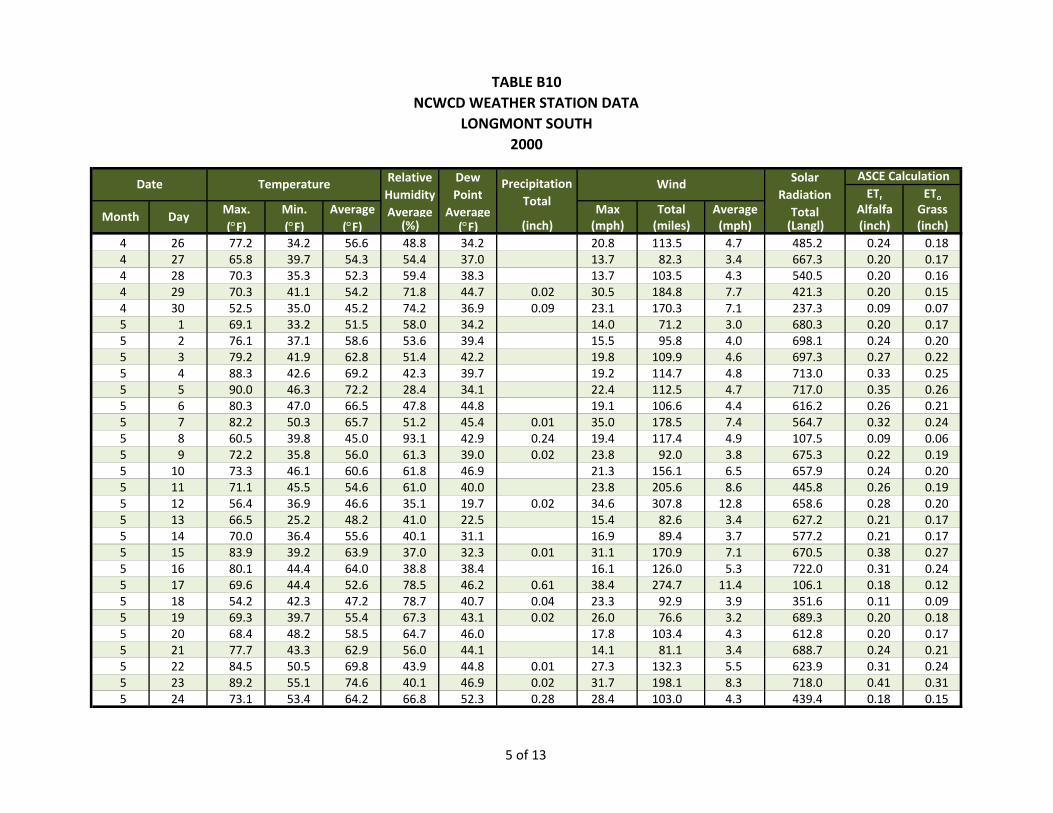
TABLE B10NCWCD WEATHER STATION DATA
LONGMONT SOUTH 2000
ETr EToMax. Min. Average Max Total Average Alfalfa Grass(°F) (°F) (°F) (%) (°F) (inch) (mph) (miles) (mph) (Langl) (inch) (inch)
Solar Radiation Total
ASCE Calculation
Month Day
Date Temperature Relative Humidity Average
Dew Point
Average
Precipitation Total
Wind
4 26 77.2 34.2 56.6 48.8 34.2 20.8 113.5 4.7 485.2 0.24 0.184 27 65.8 39.7 54.3 54.4 37.0 13.7 82.3 3.4 667.3 0.20 0.174 28 70.3 35.3 52.3 59.4 38.3 13.7 103.5 4.3 540.5 0.20 0.164 29 70.3 41.1 54.2 71.8 44.7 0.02 30.5 184.8 7.7 421.3 0.20 0.154 30 52.5 35.0 45.2 74.2 36.9 0.09 23.1 170.3 7.1 237.3 0.09 0.075 1 69.1 33.2 51.5 58.0 34.2 14.0 71.2 3.0 680.3 0.20 0.175 2 76.1 37.1 58.6 53.6 39.4 15.5 95.8 4.0 698.1 0.24 0.205 3 79.2 41.9 62.8 51.4 42.2 19.8 109.9 4.6 697.3 0.27 0.225 4 88.3 42.6 69.2 42.3 39.7 19.2 114.7 4.8 713.0 0.33 0.255 5 90.0 46.3 72.2 28.4 34.1 22.4 112.5 4.7 717.0 0.35 0.265 6 80.3 47.0 66.5 47.8 44.8 19.1 106.6 4.4 616.2 0.26 0.215 7 82.2 50.3 65.7 51.2 45.4 0.01 35.0 178.5 7.4 564.7 0.32 0.245 8 60.5 39.8 45.0 93.1 42.9 0.24 19.4 117.4 4.9 107.5 0.09 0.065 9 72.2 35.8 56.0 61.3 39.0 0.02 23.8 92.0 3.8 675.3 0.22 0.195 10 73.3 46.1 60.6 61.8 46.9 21.3 156.1 6.5 657.9 0.24 0.205 11 71.1 45.5 54.6 61.0 40.0 23.8 205.6 8.6 445.8 0.26 0.195 12 56.4 36.9 46.6 35.1 19.7 0.02 34.6 307.8 12.8 658.6 0.28 0.205 13 66.5 25.2 48.2 41.0 22.5 15.4 82.6 3.4 627.2 0.21 0.175 14 70.0 36.4 55.6 40.1 31.1 16.9 89.4 3.7 577.2 0.21 0.175 15 83.9 39.2 63.9 37.0 32.3 0.01 31.1 170.9 7.1 670.5 0.38 0.275 16 80.1 44.4 64.0 38.8 38.4 16.1 126.0 5.3 722.0 0.31 0.245 17 69.6 44.4 52.6 78.5 46.2 0.61 38.4 274.7 11.4 106.1 0.18 0.125 18 54.2 42.3 47.2 78.7 40.7 0.04 23.3 92.9 3.9 351.6 0.11 0.095 19 69.3 39.7 55.4 67.3 43.1 0.02 26.0 76.6 3.2 689.3 0.20 0.185 20 68.4 48.2 58.5 64.7 46.0 17.8 103.4 4.3 612.8 0.20 0.175 21 77.7 43.3 62.9 56.0 44.1 14.1 81.1 3.4 688.7 0.24 0.215 22 84.5 50.5 69.8 43.9 44.8 0.01 27.3 132.3 5.5 623.9 0.31 0.245 23 89.2 55.1 74.6 40.1 46.9 0.02 31.7 198.1 8.3 718.0 0.41 0.315 24 73.1 53.4 64.2 66.8 52.3 0.28 28.4 103.0 4.3 439.4 0.18 0.15
5 of 13

TABLE B10NCWCD WEATHER STATION DATA
LONGMONT SOUTH 2000
ETr EToMax. Min. Average Max Total Average Alfalfa Grass(°F) (°F) (°F) (%) (°F) (inch) (mph) (miles) (mph) (Langl) (inch) (inch)
Solar Radiation Total
ASCE Calculation
Month Day
Date Temperature Relative Humidity Average
Dew Point
Average
Precipitation Total
Wind
5 25 76.6 50.3 59.6 86.4 55.3 0.52 25.9 97.3 4.1 562.7 0.20 0.175 26 73.8 48.9 60.8 71.1 50.6 0.01 34.5 153.4 6.4 474.4 0.21 0.165 27 80.0 44.2 64.1 57.9 46.0 17.1 88.8 3.7 766.0 0.27 0.235 28 90.9 49.5 72.2 47.8 49.3 22.8 114.4 4.8 608.2 0.31 0.245 29 94.0 58.3 76.7 39.1 48.3 25.1 125.7 5.2 692.9 0.38 0.295 30 73.6 53.8 63.4 75.3 55.2 13.5 107.8 4.5 527.4 0.19 0.165 31 76.8 53.9 63.8 84.0 58.5 14.3 94.9 4.0 618.8 0.20 0.186 1 70.4 45.6 59.8 50.9 41.3 16.1 94.7 3.9 735.0 0.24 0.216 2 78.2 44.5 62.7 58.4 47.2 16.3 93.5 3.9 701.0 0.25 0.216 3 91.3 49.1 72.7 42.5 43.4 16.2 93.2 3.9 696.2 0.32 0.266 4 75.3 56.8 66.2 58.7 50.8 0.02 21.0 124.8 5.2 509.7 0.23 0.186 5 74.5 46.3 61.6 68.9 50.8 13.3 102.7 4.3 653.2 0.22 0.196 6 94.9 49.0 72.3 48.4 47.5 25.9 97.9 4.1 675.3 0.34 0.276 7 97.0 54.4 78.8 26.8 38.2 16.9 99.8 4.2 767.0 0.38 0.306 8 95.4 56.3 76.1 33.0 43.3 23.7 126.0 5.3 547.7 0.37 0.276 9 88.3 57.9 74.8 33.5 42.7 32.0 181.7 7.6 565.4 0.39 0.286 10 83.8 51.4 68.9 38.5 41.3 22.6 162.3 6.8 689.9 0.36 0.276 11 86.7 50.5 70.4 43.2 44.3 17.6 102.5 4.3 582.0 0.29 0.236 12 91.5 47.7 72.9 38.5 39.8 20.2 104.7 4.4 659.6 0.34 0.266 13 82.8 55.9 69.2 35.8 39.1 39.2 276.9 11.5 721.0 0.47 0.336 14 82.2 43.3 66.2 47.8 42.4 17.0 109.8 4.6 726.0 0.30 0.246 15 89.1 53.8 69.2 41.0 41.6 37.6 312.0 13.0 557.9 0.53 0.366 16 54.4 47.0 50.8 71.8 42.0 15.2 105.9 4.4 141.3 0.09 0.076 17 64.3 42.4 52.2 77.8 44.6 0.20 17.2 97.9 4.1 535.0 0.16 0.146 18 87.8 41.2 63.9 61.9 47.0 0.03 28.6 107.9 4.5 657.3 0.30 0.246 19 83.0 56.2 69.0 47.6 47.1 0.07 49.0 248.7 10.4 525.8 0.38 0.276 20 82.3 52.7 66.7 43.9 40.4 0.02 32.2 182.0 7.6 773.0 0.39 0.296 21 84.3 42.9 64.4 52.3 43.0 14.2 82.8 3.5 776.0 0.29 0.246 22 92.8 50.8 73.4 39.1 43.3 14.7 87.8 3.7 721.0 0.33 0.27
6 of 13
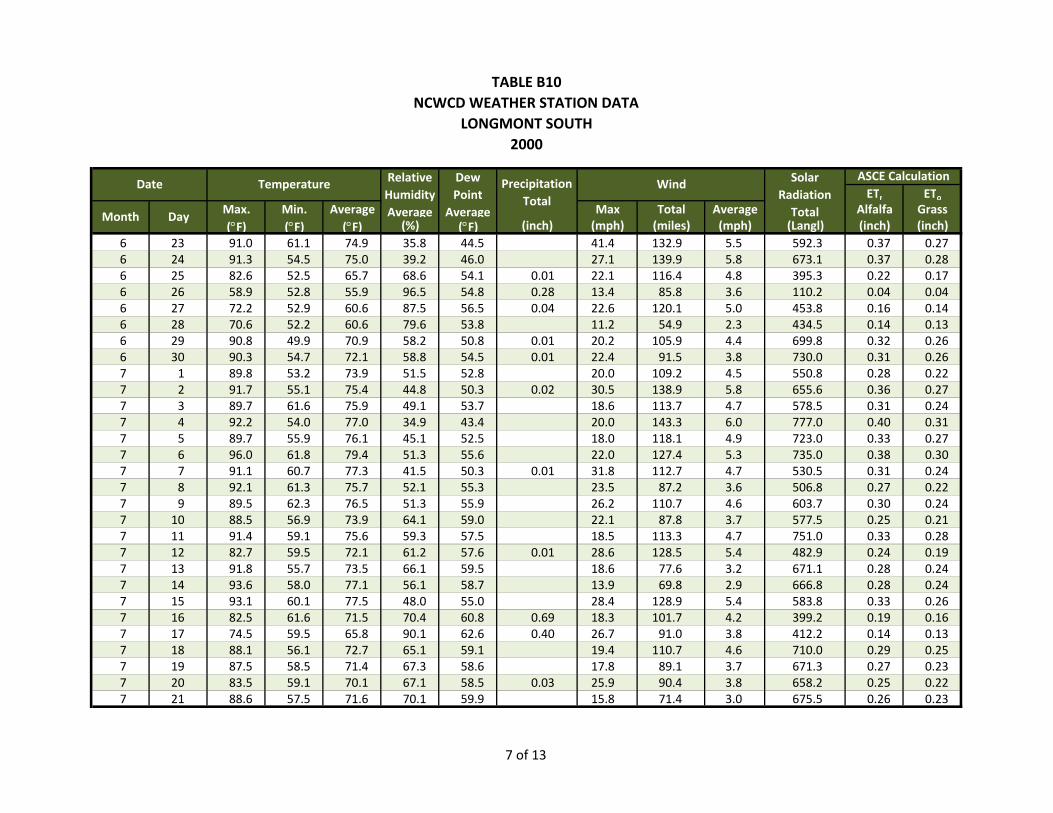
TABLE B10NCWCD WEATHER STATION DATA
LONGMONT SOUTH 2000
ETr EToMax. Min. Average Max Total Average Alfalfa Grass(°F) (°F) (°F) (%) (°F) (inch) (mph) (miles) (mph) (Langl) (inch) (inch)
Solar Radiation Total
ASCE Calculation
Month Day
Date Temperature Relative Humidity Average
Dew Point
Average
Precipitation Total
Wind
6 23 91.0 61.1 74.9 35.8 44.5 41.4 132.9 5.5 592.3 0.37 0.276 24 91.3 54.5 75.0 39.2 46.0 27.1 139.9 5.8 673.1 0.37 0.286 25 82.6 52.5 65.7 68.6 54.1 0.01 22.1 116.4 4.8 395.3 0.22 0.176 26 58.9 52.8 55.9 96.5 54.8 0.28 13.4 85.8 3.6 110.2 0.04 0.046 27 72.2 52.9 60.6 87.5 56.5 0.04 22.6 120.1 5.0 453.8 0.16 0.146 28 70.6 52.2 60.6 79.6 53.8 11.2 54.9 2.3 434.5 0.14 0.136 29 90.8 49.9 70.9 58.2 50.8 0.01 20.2 105.9 4.4 699.8 0.32 0.266 30 90.3 54.7 72.1 58.8 54.5 0.01 22.4 91.5 3.8 730.0 0.31 0.267 1 89.8 53.2 73.9 51.5 52.8 20.0 109.2 4.5 550.8 0.28 0.227 2 91.7 55.1 75.4 44.8 50.3 0.02 30.5 138.9 5.8 655.6 0.36 0.277 3 89.7 61.6 75.9 49.1 53.7 18.6 113.7 4.7 578.5 0.31 0.247 4 92.2 54.0 77.0 34.9 43.4 20.0 143.3 6.0 777.0 0.40 0.317 5 89.7 55.9 76.1 45.1 52.5 18.0 118.1 4.9 723.0 0.33 0.277 6 96.0 61.8 79.4 51.3 55.6 22.0 127.4 5.3 735.0 0.38 0.307 7 91.1 60.7 77.3 41.5 50.3 0.01 31.8 112.7 4.7 530.5 0.31 0.247 8 92.1 61.3 75.7 52.1 55.3 23.5 87.2 3.6 506.8 0.27 0.227 9 89.5 62.3 76.5 51.3 55.9 26.2 110.7 4.6 603.7 0.30 0.247 10 88.5 56.9 73.9 64.1 59.0 22.1 87.8 3.7 577.5 0.25 0.217 11 91.4 59.1 75.6 59.3 57.5 18.5 113.3 4.7 751.0 0.33 0.287 12 82.7 59.5 72.1 61.2 57.6 0.01 28.6 128.5 5.4 482.9 0.24 0.197 13 91.8 55.7 73.5 66.1 59.5 18.6 77.6 3.2 671.1 0.28 0.247 14 93.6 58.0 77.1 56.1 58.7 13.9 69.8 2.9 666.8 0.28 0.247 15 93.1 60.1 77.5 48.0 55.0 28.4 128.9 5.4 583.8 0.33 0.267 16 82.5 61.6 71.5 70.4 60.8 0.69 18.3 101.7 4.2 399.2 0.19 0.167 17 74.5 59.5 65.8 90.1 62.6 0.40 26.7 91.0 3.8 412.2 0.14 0.137 18 88.1 56.1 72.7 65.1 59.1 19.4 110.7 4.6 710.0 0.29 0.257 19 87.5 58.5 71.4 67.3 58.6 17.8 89.1 3.7 671.3 0.27 0.237 20 83.5 59.1 70.1 67.1 58.5 0.03 25.9 90.4 3.8 658.2 0.25 0.227 21 88.6 57.5 71.6 70.1 59.9 15.8 71.4 3.0 675.5 0.26 0.23
7 of 13

TABLE B10NCWCD WEATHER STATION DATA
LONGMONT SOUTH 2000
ETr EToMax. Min. Average Max Total Average Alfalfa Grass(°F) (°F) (°F) (%) (°F) (inch) (mph) (miles) (mph) (Langl) (inch) (inch)
Solar Radiation Total
ASCE Calculation
Month Day
Date Temperature Relative Humidity Average
Dew Point
Average
Precipitation Total
Wind
7 22 85.0 57.1 71.0 67.4 58.6 21.7 75.0 3.1 597.7 0.23 0.207 23 97.9 55.6 76.1 51.4 52.2 15.3 76.9 3.2 681.8 0.32 0.267 24 99.1 60.5 78.8 36.5 47.6 27.4 163.2 6.8 500.9 0.43 0.307 25 93.5 55.3 76.6 43.3 50.2 12.6 87.2 3.6 658.9 0.31 0.257 26 95.4 61.0 77.0 43.3 51.0 28.7 115.1 4.8 535.5 0.34 0.257 27 91.2 57.0 75.1 48.9 52.9 23.2 112.8 4.7 505.5 0.29 0.227 28 87.2 59.2 73.8 59.5 57.5 13.4 88.3 3.7 623.5 0.26 0.227 29 89.1 56.1 73.8 55.0 54.1 14.2 75.1 3.1 654.1 0.27 0.237 30 87.2 56.7 73.3 51.5 52.5 12.8 67.3 2.8 657.6 0.26 0.227 31 88.4 54.9 74.4 47.3 50.9 14.5 66.5 2.8 664.7 0.26 0.228 1 95.3 55.1 76.3 44.0 50.2 0.02 42.9 96.6 4.0 607.0 0.32 0.258 2 90.1 63.0 77.7 44.7 53.1 30.7 134.4 5.6 408.5 0.29 0.218 3 89.5 61.3 74.5 61.1 59.4 16.7 76.6 3.2 424.3 0.21 0.178 4 92.2 58.9 73.8 61.5 58.6 20.6 105.0 4.4 572.5 0.29 0.238 5 91.0 58.8 75.2 53.2 54.8 39.3 146.9 6.1 499.4 0.31 0.238 6 88.1 53.8 72.6 51.8 51.5 20.7 100.7 4.2 679.5 0.29 0.248 7 93.2 50.5 73.6 48.6 49.2 16.8 101.4 4.2 566.3 0.30 0.238 8 93.1 58.2 77.7 34.4 45.5 14.5 96.6 4.0 673.5 0.32 0.258 9 93.1 57.2 77.3 41.4 51.4 21.0 120.4 5.0 655.3 0.33 0.268 10 87.0 55.3 71.7 65.9 58.8 13.4 78.9 3.3 623.1 0.24 0.218 11 93.5 60.2 76.6 54.7 56.9 24.1 96.7 4.0 619.5 0.30 0.248 12 75.2 62.9 70.5 61.4 56.4 11.3 74.5 3.1 182.9 0.12 0.108 13 89.4 55.2 73.4 57.4 55.7 16.8 84.6 3.5 584.6 0.25 0.218 14 94.7 54.9 76.8 46.7 52.3 12.9 72.7 3.0 482.6 0.25 0.208 15 88.3 60.9 75.1 54.9 57.7 0.02 24.5 112.5 4.7 558.9 0.27 0.218 16 88.1 61.8 70.7 75.6 61.7 0.12 22.9 108.3 4.5 355.1 0.21 0.168 17 74.6 60.6 64.3 85.7 59.6 0.12 17.9 86.7 3.6 247.4 0.12 0.108 18 73.4 55.3 64.3 90.3 61.2 0.04 13.7 92.7 3.9 387.5 0.12 0.118 19 87.2 55.4 73.2 60.1 56.0 0.02 31.0 100.0 4.2 634.8 0.26 0.22
8 of 13
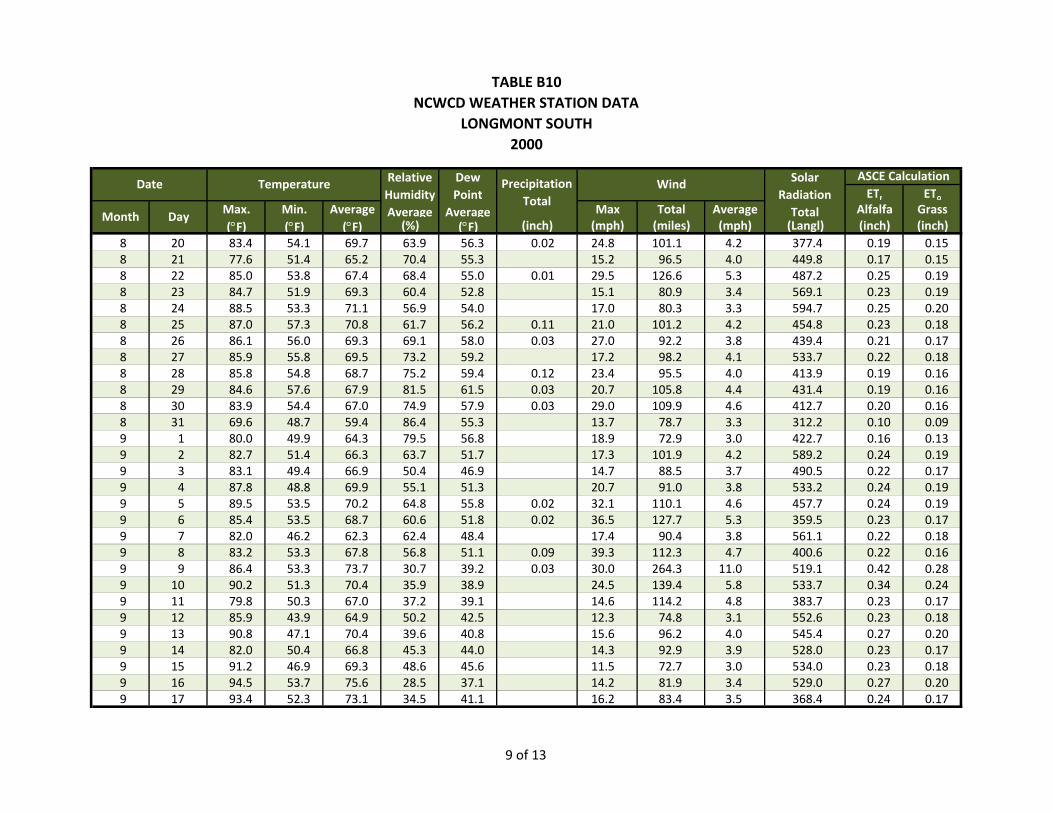
TABLE B10NCWCD WEATHER STATION DATA
LONGMONT SOUTH 2000
ETr EToMax. Min. Average Max Total Average Alfalfa Grass(°F) (°F) (°F) (%) (°F) (inch) (mph) (miles) (mph) (Langl) (inch) (inch)
Solar Radiation Total
ASCE Calculation
Month Day
Date Temperature Relative Humidity Average
Dew Point
Average
Precipitation Total
Wind
8 20 83.4 54.1 69.7 63.9 56.3 0.02 24.8 101.1 4.2 377.4 0.19 0.158 21 77.6 51.4 65.2 70.4 55.3 15.2 96.5 4.0 449.8 0.17 0.158 22 85.0 53.8 67.4 68.4 55.0 0.01 29.5 126.6 5.3 487.2 0.25 0.198 23 84.7 51.9 69.3 60.4 52.8 15.1 80.9 3.4 569.1 0.23 0.198 24 88.5 53.3 71.1 56.9 54.0 17.0 80.3 3.3 594.7 0.25 0.208 25 87.0 57.3 70.8 61.7 56.2 0.11 21.0 101.2 4.2 454.8 0.23 0.188 26 86.1 56.0 69.3 69.1 58.0 0.03 27.0 92.2 3.8 439.4 0.21 0.178 27 85.9 55.8 69.5 73.2 59.2 17.2 98.2 4.1 533.7 0.22 0.188 28 85.8 54.8 68.7 75.2 59.4 0.12 23.4 95.5 4.0 413.9 0.19 0.168 29 84.6 57.6 67.9 81.5 61.5 0.03 20.7 105.8 4.4 431.4 0.19 0.168 30 83.9 54.4 67.0 74.9 57.9 0.03 29.0 109.9 4.6 412.7 0.20 0.168 31 69.6 48.7 59.4 86.4 55.3 13.7 78.7 3.3 312.2 0.10 0.099 1 80.0 49.9 64.3 79.5 56.8 18.9 72.9 3.0 422.7 0.16 0.139 2 82.7 51.4 66.3 63.7 51.7 17.3 101.9 4.2 589.2 0.24 0.199 3 83.1 49.4 66.9 50.4 46.9 14.7 88.5 3.7 490.5 0.22 0.179 4 87.8 48.8 69.9 55.1 51.3 20.7 91.0 3.8 533.2 0.24 0.199 5 89.5 53.5 70.2 64.8 55.8 0.02 32.1 110.1 4.6 457.7 0.24 0.199 6 85.4 53.5 68.7 60.6 51.8 0.02 36.5 127.7 5.3 359.5 0.23 0.179 7 82.0 46.2 62.3 62.4 48.4 17.4 90.4 3.8 561.1 0.22 0.189 8 83.2 53.3 67.8 56.8 51.1 0.09 39.3 112.3 4.7 400.6 0.22 0.169 9 86.4 53.3 73.7 30.7 39.2 0.03 30.0 264.3 11.0 519.1 0.42 0.289 10 90.2 51.3 70.4 35.9 38.9 24.5 139.4 5.8 533.7 0.34 0.249 11 79.8 50.3 67.0 37.2 39.1 14.6 114.2 4.8 383.7 0.23 0.179 12 85.9 43.9 64.9 50.2 42.5 12.3 74.8 3.1 552.6 0.23 0.189 13 90.8 47.1 70.4 39.6 40.8 15.6 96.2 4.0 545.4 0.27 0.209 14 82.0 50.4 66.8 45.3 44.0 14.3 92.9 3.9 528.0 0.23 0.179 15 91.2 46.9 69.3 48.6 45.6 11.5 72.7 3.0 534.0 0.23 0.189 16 94.5 53.7 75.6 28.5 37.1 14.2 81.9 3.4 529.0 0.27 0.209 17 93.4 52.3 73.1 34.5 41.1 16.2 83.4 3.5 368.4 0.24 0.17
9 of 13

TABLE B10NCWCD WEATHER STATION DATA
LONGMONT SOUTH 2000
ETr EToMax. Min. Average Max Total Average Alfalfa Grass(°F) (°F) (°F) (%) (°F) (inch) (mph) (miles) (mph) (Langl) (inch) (inch)
Solar Radiation Total
ASCE Calculation
Month Day
Date Temperature Relative Humidity Average
Dew Point
Average
Precipitation Total
Wind
9 18 82.3 59.7 70.0 41.3 44.8 17.4 91.5 3.8 386.4 0.21 0.169 19 76.6 47.2 64.9 52.5 46.1 0.19 22.6 155.2 6.5 433.2 0.21 0.169 20 55.7 43.2 49.1 80.7 43.0 0.37 20.5 117.3 4.9 248.9 0.08 0.079 21 74.4 39.1 53.9 80.5 47.2 0.06 30.3 126.5 5.3 341.1 0.16 0.129 22 49.6 33.0 40.7 99.9 40.7 0.06 14.3 152.3 6.3 90.7 0.03 0.039 23 39.0 32.4 34.7 101.6 34.7 0.42 13.6 93.9 3.9 112.8 0.03 0.039 24 45.8 30.6 35.9 91.2 33.0 0.33 9.4 58.2 2.4 361.3 0.07 0.069 25 65.8 29.5 46.0 71.1 34.9 12.1 62.6 2.6 510.7 0.13 0.119 26 72.0 34.0 52.3 65.9 39.0 15.1 76.3 3.2 500.2 0.16 0.129 27 74.2 38.6 57.1 57.5 39.4 13.4 87.6 3.6 493.1 0.17 0.139 28 81.8 39.0 58.7 60.3 42.5 9.8 57.4 2.4 460.8 0.17 0.139 29 80.1 47.0 63.9 58.6 47.7 0.02 37.8 140.8 5.9 321.9 0.20 0.149 30 80.0 53.8 66.4 49.3 45.5 27.5 117.0 4.9 393.0 0.21 0.1510 1 83.9 56.3 70.7 34.1 39.8 29.8 156.8 6.5 381.5 0.29 0.1910 2 74.5 41.5 57.7 72.1 48.1 18.9 80.2 3.3 418.1 0.14 0.1110 3 75.8 45.5 57.8 69.0 47.1 24.5 117.4 4.9 365.9 0.17 0.1310 4 59.7 44.7 52.0 90.3 49.1 18.9 94.4 3.9 244.6 0.07 0.0610 5 53.0 33.0 41.0 99.4 41.1 0.08 26.6 174.4 7.3 93.2 0.05 0.0410 6 36.5 31.0 33.5 99.6 33.2 0.04 11.2 111.2 4.6 98.6 0.02 0.0210 7 42.8 34.9 38.7 91.8 36.3 8.4 59.7 2.5 107.0 0.03 0.0310 8 54.0 28.4 41.1 81.8 35.5 0.01 9.9 59.4 2.5 385.7 0.08 0.0710 9 63.8 26.8 43.5 80.5 37.1 10.0 47.7 2.0 419.1 0.09 0.0810 10 70.5 32.3 50.0 71.5 39.9 14.7 78.7 3.3 409.3 0.13 0.1010 11 72.2 32.8 54.4 66.0 41.9 0.02 25.6 92.1 3.8 419.5 0.14 0.1110 12 67.3 41.5 55.4 63.1 42.3 12.8 103.0 4.3 405.9 0.13 0.1010 13 63.6 40.0 52.8 54.5 34.9 0.01 28.5 143.0 6.0 398.9 0.16 0.1110 14 59.8 34.8 47.0 63.9 34.4 18.9 92.9 3.9 320.3 0.11 0.0810 15 61.6 29.4 44.5 71.8 34.7 11.7 79.1 3.3 399.9 0.10 0.0810 16 66.1 32.0 48.6 60.4 33.8 15.0 80.0 3.3 396.0 0.12 0.09
10 of 13
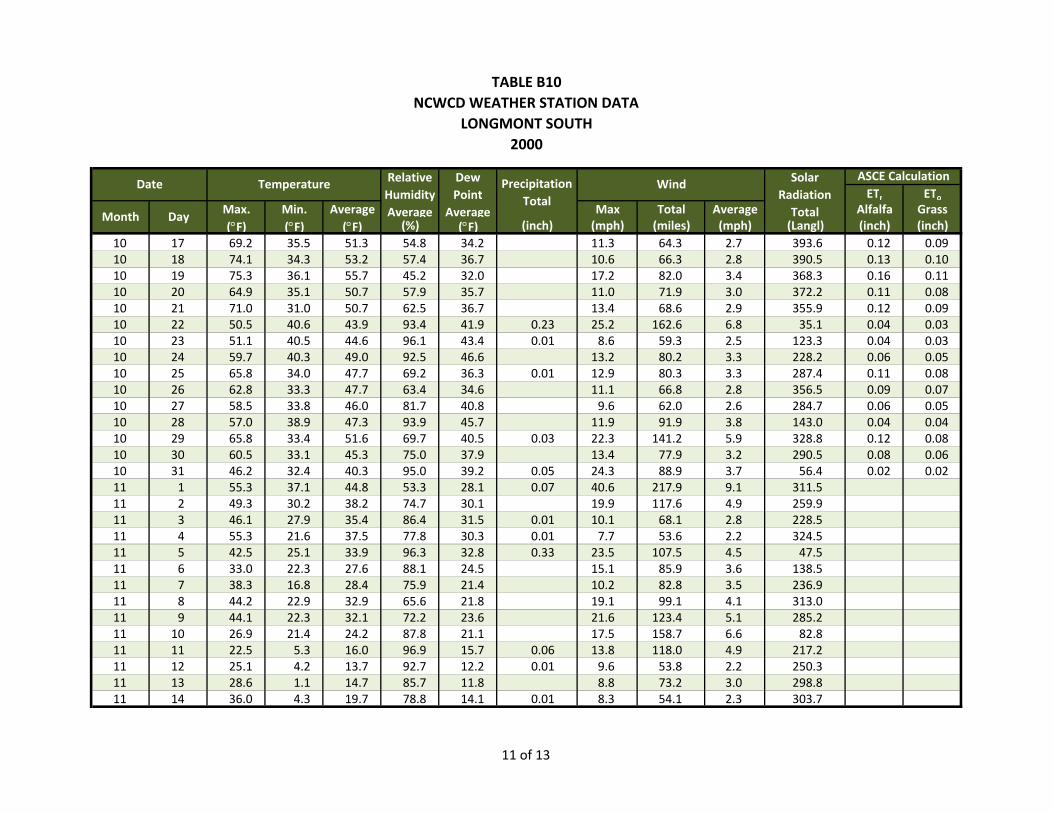
TABLE B10NCWCD WEATHER STATION DATA
LONGMONT SOUTH 2000
ETr EToMax. Min. Average Max Total Average Alfalfa Grass(°F) (°F) (°F) (%) (°F) (inch) (mph) (miles) (mph) (Langl) (inch) (inch)
Solar Radiation Total
ASCE Calculation
Month Day
Date Temperature Relative Humidity Average
Dew Point
Average
Precipitation Total
Wind
10 17 69.2 35.5 51.3 54.8 34.2 11.3 64.3 2.7 393.6 0.12 0.0910 18 74.1 34.3 53.2 57.4 36.7 10.6 66.3 2.8 390.5 0.13 0.1010 19 75.3 36.1 55.7 45.2 32.0 17.2 82.0 3.4 368.3 0.16 0.1110 20 64.9 35.1 50.7 57.9 35.7 11.0 71.9 3.0 372.2 0.11 0.0810 21 71.0 31.0 50.7 62.5 36.7 13.4 68.6 2.9 355.9 0.12 0.0910 22 50.5 40.6 43.9 93.4 41.9 0.23 25.2 162.6 6.8 35.1 0.04 0.0310 23 51.1 40.5 44.6 96.1 43.4 0.01 8.6 59.3 2.5 123.3 0.04 0.0310 24 59.7 40.3 49.0 92.5 46.6 13.2 80.2 3.3 228.2 0.06 0.0510 25 65.8 34.0 47.7 69.2 36.3 0.01 12.9 80.3 3.3 287.4 0.11 0.0810 26 62.8 33.3 47.7 63.4 34.6 11.1 66.8 2.8 356.5 0.09 0.0710 27 58.5 33.8 46.0 81.7 40.8 9.6 62.0 2.6 284.7 0.06 0.0510 28 57.0 38.9 47.3 93.9 45.7 11.9 91.9 3.8 143.0 0.04 0.0410 29 65.8 33.4 51.6 69.7 40.5 0.03 22.3 141.2 5.9 328.8 0.12 0.0810 30 60.5 33.1 45.3 75.0 37.9 13.4 77.9 3.2 290.5 0.08 0.0610 31 46.2 32.4 40.3 95.0 39.2 0.05 24.3 88.9 3.7 56.4 0.02 0.0211 1 55.3 37.1 44.8 53.3 28.1 0.07 40.6 217.9 9.1 311.511 2 49.3 30.2 38.2 74.7 30.1 19.9 117.6 4.9 259.911 3 46.1 27.9 35.4 86.4 31.5 0.01 10.1 68.1 2.8 228.511 4 55.3 21.6 37.5 77.8 30.3 0.01 7.7 53.6 2.2 324.511 5 42.5 25.1 33.9 96.3 32.8 0.33 23.5 107.5 4.5 47.511 6 33.0 22.3 27.6 88.1 24.5 15.1 85.9 3.6 138.511 7 38.3 16.8 28.4 75.9 21.4 10.2 82.8 3.5 236.911 8 44.2 22.9 32.9 65.6 21.8 19.1 99.1 4.1 313.011 9 44.1 22.3 32.1 72.2 23.6 21.6 123.4 5.1 285.211 10 26.9 21.4 24.2 87.8 21.1 17.5 158.7 6.6 82.811 11 22.5 5.3 16.0 96.9 15.7 0.06 13.8 118.0 4.9 217.211 12 25.1 4.2 13.7 92.7 12.2 0.01 9.6 53.8 2.2 250.311 13 28.6 1.1 14.7 85.7 11.8 8.8 73.2 3.0 298.811 14 36.0 4.3 19.7 78.8 14.1 0.01 8.3 54.1 2.3 303.7
11 of 13
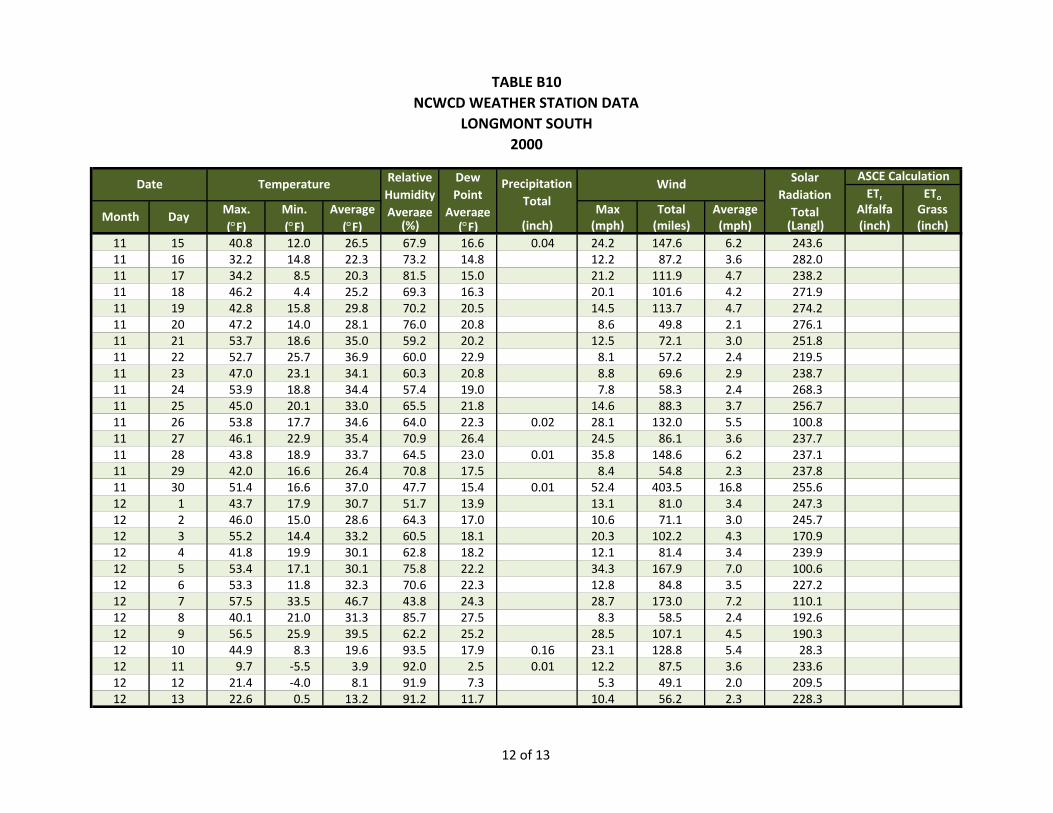
TABLE B10NCWCD WEATHER STATION DATA
LONGMONT SOUTH 2000
ETr EToMax. Min. Average Max Total Average Alfalfa Grass(°F) (°F) (°F) (%) (°F) (inch) (mph) (miles) (mph) (Langl) (inch) (inch)
Solar Radiation Total
ASCE Calculation
Month Day
Date Temperature Relative Humidity Average
Dew Point
Average
Precipitation Total
Wind
11 15 40.8 12.0 26.5 67.9 16.6 0.04 24.2 147.6 6.2 243.611 16 32.2 14.8 22.3 73.2 14.8 12.2 87.2 3.6 282.011 17 34.2 8.5 20.3 81.5 15.0 21.2 111.9 4.7 238.211 18 46.2 4.4 25.2 69.3 16.3 20.1 101.6 4.2 271.911 19 42.8 15.8 29.8 70.2 20.5 14.5 113.7 4.7 274.211 20 47.2 14.0 28.1 76.0 20.8 8.6 49.8 2.1 276.111 21 53.7 18.6 35.0 59.2 20.2 12.5 72.1 3.0 251.811 22 52.7 25.7 36.9 60.0 22.9 8.1 57.2 2.4 219.511 23 47.0 23.1 34.1 60.3 20.8 8.8 69.6 2.9 238.711 24 53.9 18.8 34.4 57.4 19.0 7.8 58.3 2.4 268.311 25 45.0 20.1 33.0 65.5 21.8 14.6 88.3 3.7 256.711 26 53.8 17.7 34.6 64.0 22.3 0.02 28.1 132.0 5.5 100.811 27 46.1 22.9 35.4 70.9 26.4 24.5 86.1 3.6 237.711 28 43.8 18.9 33.7 64.5 23.0 0.01 35.8 148.6 6.2 237.111 29 42.0 16.6 26.4 70.8 17.5 8.4 54.8 2.3 237.811 30 51.4 16.6 37.0 47.7 15.4 0.01 52.4 403.5 16.8 255.612 1 43.7 17.9 30.7 51.7 13.9 13.1 81.0 3.4 247.312 2 46.0 15.0 28.6 64.3 17.0 10.6 71.1 3.0 245.712 3 55.2 14.4 33.2 60.5 18.1 20.3 102.2 4.3 170.912 4 41.8 19.9 30.1 62.8 18.2 12.1 81.4 3.4 239.912 5 53.4 17.1 30.1 75.8 22.2 34.3 167.9 7.0 100.612 6 53.3 11.8 32.3 70.6 22.3 12.8 84.8 3.5 227.212 7 57.5 33.5 46.7 43.8 24.3 28.7 173.0 7.2 110.112 8 40.1 21.0 31.3 85.7 27.5 8.3 58.5 2.4 192.612 9 56.5 25.9 39.5 62.2 25.2 28.5 107.1 4.5 190.312 10 44.9 8.3 19.6 93.5 17.9 0.16 23.1 128.8 5.4 28.312 11 9.7 ‐5.5 3.9 92.0 2.5 0.01 12.2 87.5 3.6 233.612 12 21.4 ‐4.0 8.1 91.9 7.3 5.3 49.1 2.0 209.512 13 22.6 0.5 13.2 91.2 11.7 10.4 56.2 2.3 228.3
12 of 13
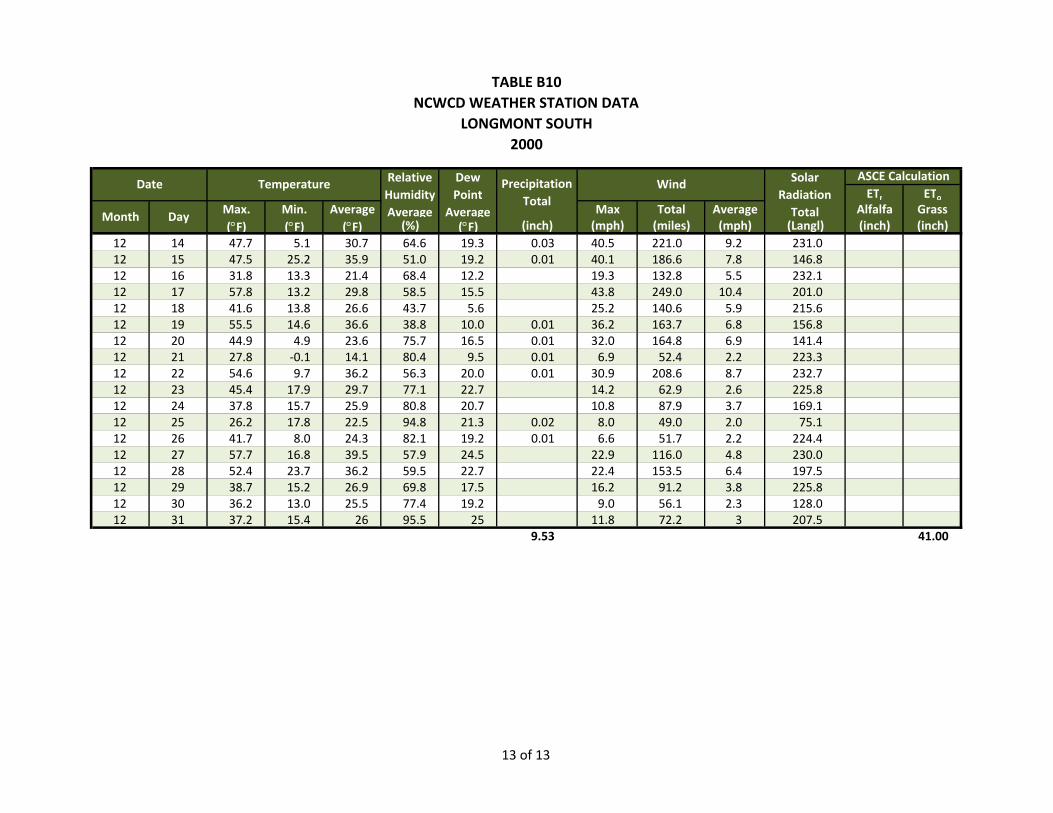
TABLE B10NCWCD WEATHER STATION DATA
LONGMONT SOUTH 2000
ETr EToMax. Min. Average Max Total Average Alfalfa Grass(°F) (°F) (°F) (%) (°F) (inch) (mph) (miles) (mph) (Langl) (inch) (inch)
Solar Radiation Total
ASCE Calculation
Month Day
Date Temperature Relative Humidity Average
Dew Point
Average
Precipitation Total
Wind
12 14 47.7 5.1 30.7 64.6 19.3 0.03 40.5 221.0 9.2 231.012 15 47.5 25.2 35.9 51.0 19.2 0.01 40.1 186.6 7.8 146.812 16 31.8 13.3 21.4 68.4 12.2 19.3 132.8 5.5 232.112 17 57.8 13.2 29.8 58.5 15.5 43.8 249.0 10.4 201.012 18 41.6 13.8 26.6 43.7 5.6 25.2 140.6 5.9 215.612 19 55.5 14.6 36.6 38.8 10.0 0.01 36.2 163.7 6.8 156.812 20 44.9 4.9 23.6 75.7 16.5 0.01 32.0 164.8 6.9 141.412 21 27.8 ‐0.1 14.1 80.4 9.5 0.01 6.9 52.4 2.2 223.312 22 54.6 9.7 36.2 56.3 20.0 0.01 30.9 208.6 8.7 232.712 23 45.4 17.9 29.7 77.1 22.7 14.2 62.9 2.6 225.812 24 37.8 15.7 25.9 80.8 20.7 10.8 87.9 3.7 169.112 25 26.2 17.8 22.5 94.8 21.3 0.02 8.0 49.0 2.0 75.112 26 41.7 8.0 24.3 82.1 19.2 0.01 6.6 51.7 2.2 224.412 27 57.7 16.8 39.5 57.9 24.5 22.9 116.0 4.8 230.012 28 52.4 23.7 36.2 59.5 22.7 22.4 153.5 6.4 197.512 29 38.7 15.2 26.9 69.8 17.5 16.2 91.2 3.8 225.812 30 36.2 13.0 25.5 77.4 19.2 9.0 56.1 2.3 128.012 31 37.2 15.4 26 95.5 25 11.8 72.2 3 207.5
9.53 41.00
13 of 13
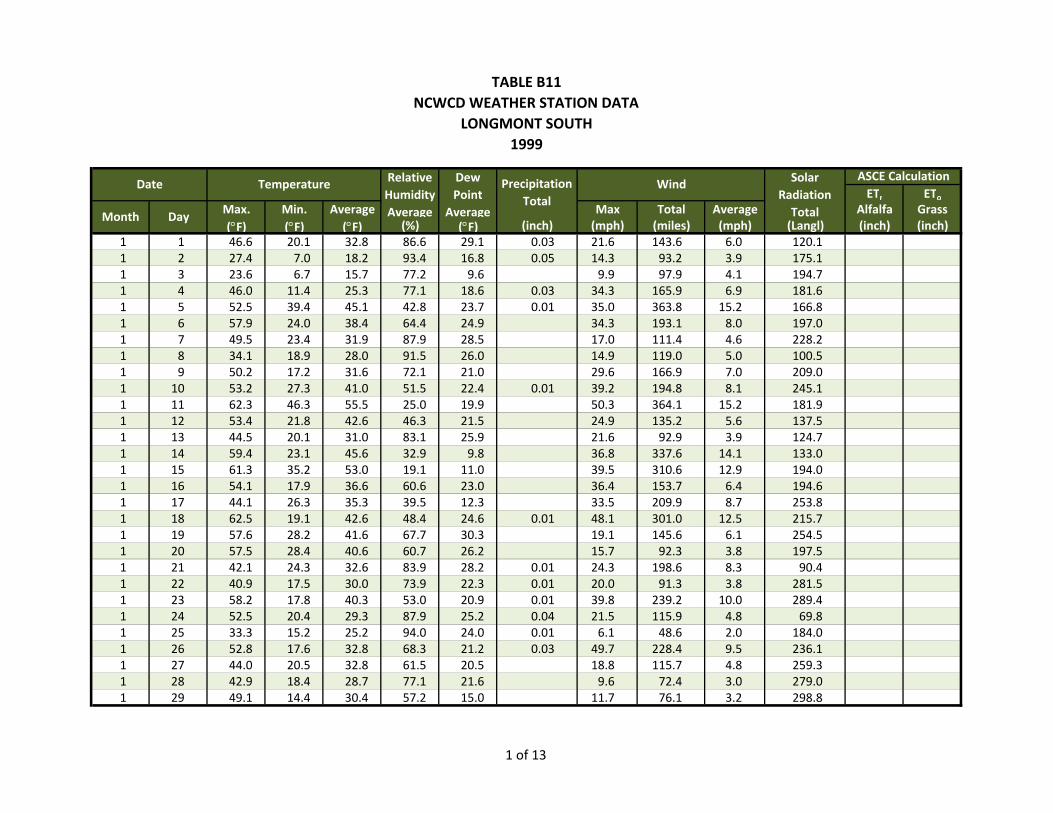
TABLE B11NCWCD WEATHER STATION DATA
LONGMONT SOUTH 1999
ETr EToMax. Min. Average Max Total Average Alfalfa Grass(°F) (°F) (°F) (%) (°F) (inch) (mph) (miles) (mph) (Langl) (inch) (inch)
1 1 46.6 20.1 32.8 86.6 29.1 0.03 21.6 143.6 6.0 120.11 2 27.4 7.0 18.2 93.4 16.8 0.05 14.3 93.2 3.9 175.11 3 23.6 6.7 15.7 77.2 9.6 9.9 97.9 4.1 194.71 4 46.0 11.4 25.3 77.1 18.6 0.03 34.3 165.9 6.9 181.61 5 52.5 39.4 45.1 42.8 23.7 0.01 35.0 363.8 15.2 166.81 6 57.9 24.0 38.4 64.4 24.9 34.3 193.1 8.0 197.01 7 49.5 23.4 31.9 87.9 28.5 17.0 111.4 4.6 228.21 8 34.1 18.9 28.0 91.5 26.0 14.9 119.0 5.0 100.51 9 50.2 17.2 31.6 72.1 21.0 29.6 166.9 7.0 209.01 10 53.2 27.3 41.0 51.5 22.4 0.01 39.2 194.8 8.1 245.11 11 62.3 46.3 55.5 25.0 19.9 50.3 364.1 15.2 181.91 12 53.4 21.8 42.6 46.3 21.5 24.9 135.2 5.6 137.51 13 44.5 20.1 31.0 83.1 25.9 21.6 92.9 3.9 124.71 14 59.4 23.1 45.6 32.9 9.8 36.8 337.6 14.1 133.01 15 61.3 35.2 53.0 19.1 11.0 39.5 310.6 12.9 194.01 16 54.1 17.9 36.6 60.6 23.0 36.4 153.7 6.4 194.61 17 44.1 26.3 35.3 39.5 12.3 33.5 209.9 8.7 253.81 18 62.5 19.1 42.6 48.4 24.6 0.01 48.1 301.0 12.5 215.71 19 57.6 28.2 41.6 67.7 30.3 19.1 145.6 6.1 254.51 20 57.5 28.4 40.6 60.7 26.2 15.7 92.3 3.8 197.51 21 42.1 24.3 32.6 83.9 28.2 0.01 24.3 198.6 8.3 90.41 22 40.9 17.5 30.0 73.9 22.3 0.01 20.0 91.3 3.8 281.51 23 58.2 17.8 40.3 53.0 20.9 0.01 39.8 239.2 10.0 289.41 24 52.5 20.4 29.3 87.9 25.2 0.04 21.5 115.9 4.8 69.81 25 33.3 15.2 25.2 94.0 24.0 0.01 6.1 48.6 2.0 184.01 26 52.8 17.6 32.8 68.3 21.2 0.03 49.7 228.4 9.5 236.11 27 44.0 20.5 32.8 61.5 20.5 18.8 115.7 4.8 259.31 28 42.9 18.4 28.7 77.1 21.6 9.6 72.4 3.0 279.01 29 49.1 14.4 30.4 57.2 15.0 11.7 76.1 3.2 298.8
Solar Radiation Total
ASCE Calculation
Month Day
Date Temperature Relative Humidity Average
Dew Point
Average
Precipitation Total
Wind
1 of 13
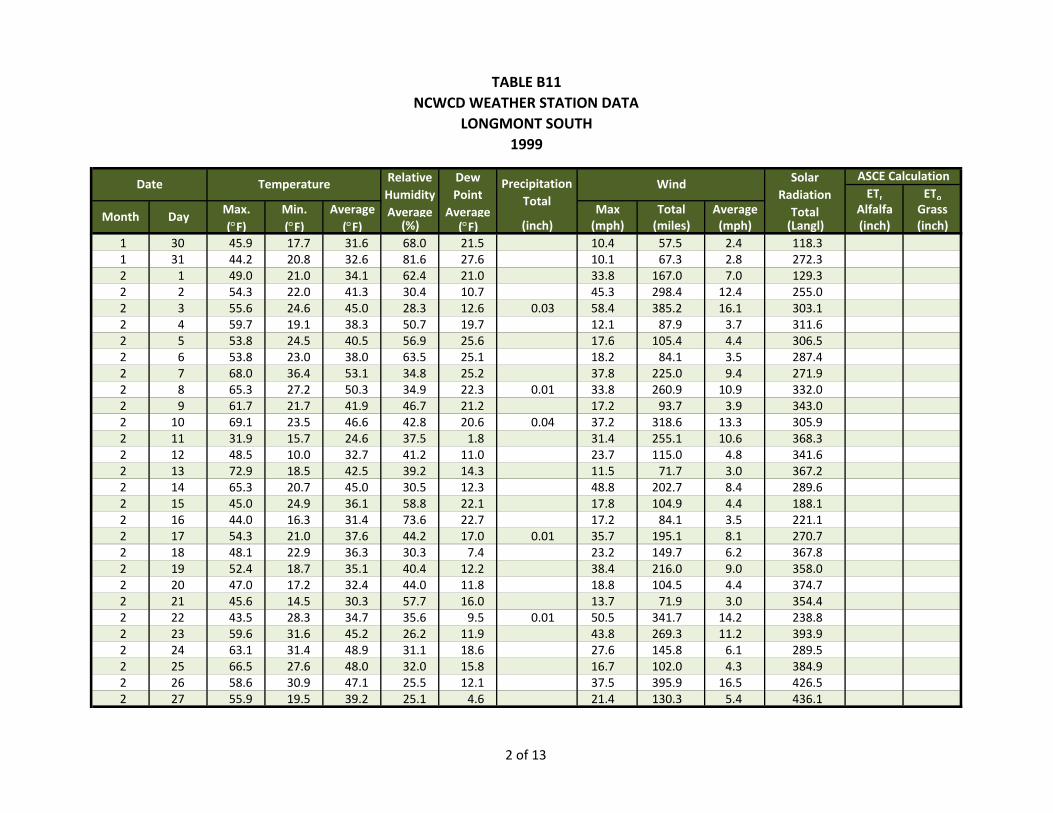
TABLE B11NCWCD WEATHER STATION DATA
LONGMONT SOUTH 1999
ETr EToMax. Min. Average Max Total Average Alfalfa Grass(°F) (°F) (°F) (%) (°F) (inch) (mph) (miles) (mph) (Langl) (inch) (inch)
Solar Radiation Total
ASCE Calculation
Month Day
Date Temperature Relative Humidity Average
Dew Point
Average
Precipitation Total
Wind
1 30 45.9 17.7 31.6 68.0 21.5 10.4 57.5 2.4 118.31 31 44.2 20.8 32.6 81.6 27.6 10.1 67.3 2.8 272.32 1 49.0 21.0 34.1 62.4 21.0 33.8 167.0 7.0 129.32 2 54.3 22.0 41.3 30.4 10.7 45.3 298.4 12.4 255.02 3 55.6 24.6 45.0 28.3 12.6 0.03 58.4 385.2 16.1 303.12 4 59.7 19.1 38.3 50.7 19.7 12.1 87.9 3.7 311.62 5 53.8 24.5 40.5 56.9 25.6 17.6 105.4 4.4 306.52 6 53.8 23.0 38.0 63.5 25.1 18.2 84.1 3.5 287.42 7 68.0 36.4 53.1 34.8 25.2 37.8 225.0 9.4 271.92 8 65.3 27.2 50.3 34.9 22.3 0.01 33.8 260.9 10.9 332.02 9 61.7 21.7 41.9 46.7 21.2 17.2 93.7 3.9 343.02 10 69.1 23.5 46.6 42.8 20.6 0.04 37.2 318.6 13.3 305.92 11 31.9 15.7 24.6 37.5 1.8 31.4 255.1 10.6 368.32 12 48.5 10.0 32.7 41.2 11.0 23.7 115.0 4.8 341.62 13 72.9 18.5 42.5 39.2 14.3 11.5 71.7 3.0 367.22 14 65.3 20.7 45.0 30.5 12.3 48.8 202.7 8.4 289.62 15 45.0 24.9 36.1 58.8 22.1 17.8 104.9 4.4 188.12 16 44.0 16.3 31.4 73.6 22.7 17.2 84.1 3.5 221.12 17 54.3 21.0 37.6 44.2 17.0 0.01 35.7 195.1 8.1 270.72 18 48.1 22.9 36.3 30.3 7.4 23.2 149.7 6.2 367.82 19 52.4 18.7 35.1 40.4 12.2 38.4 216.0 9.0 358.02 20 47.0 17.2 32.4 44.0 11.8 18.8 104.5 4.4 374.72 21 45.6 14.5 30.3 57.7 16.0 13.7 71.9 3.0 354.42 22 43.5 28.3 34.7 35.6 9.5 0.01 50.5 341.7 14.2 238.82 23 59.6 31.6 45.2 26.2 11.9 43.8 269.3 11.2 393.92 24 63.1 31.4 48.9 31.1 18.6 27.6 145.8 6.1 289.52 25 66.5 27.6 48.0 32.0 15.8 16.7 102.0 4.3 384.92 26 58.6 30.9 47.1 25.5 12.1 37.5 395.9 16.5 426.52 27 55.9 19.5 39.2 25.1 4.6 21.4 130.3 5.4 436.1
2 of 13
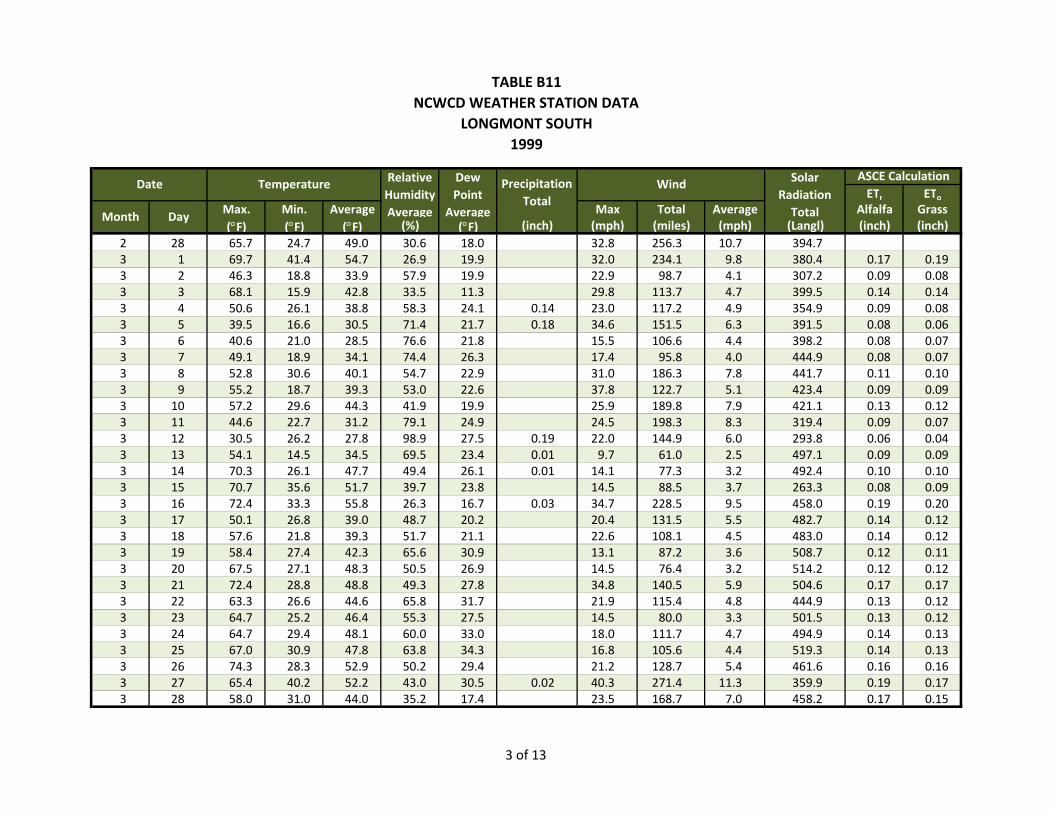
TABLE B11NCWCD WEATHER STATION DATA
LONGMONT SOUTH 1999
ETr EToMax. Min. Average Max Total Average Alfalfa Grass(°F) (°F) (°F) (%) (°F) (inch) (mph) (miles) (mph) (Langl) (inch) (inch)
Solar Radiation Total
ASCE Calculation
Month Day
Date Temperature Relative Humidity Average
Dew Point
Average
Precipitation Total
Wind
2 28 65.7 24.7 49.0 30.6 18.0 32.8 256.3 10.7 394.73 1 69.7 41.4 54.7 26.9 19.9 32.0 234.1 9.8 380.4 0.17 0.193 2 46.3 18.8 33.9 57.9 19.9 22.9 98.7 4.1 307.2 0.09 0.083 3 68.1 15.9 42.8 33.5 11.3 29.8 113.7 4.7 399.5 0.14 0.143 4 50.6 26.1 38.8 58.3 24.1 0.14 23.0 117.2 4.9 354.9 0.09 0.083 5 39.5 16.6 30.5 71.4 21.7 0.18 34.6 151.5 6.3 391.5 0.08 0.063 6 40.6 21.0 28.5 76.6 21.8 15.5 106.6 4.4 398.2 0.08 0.073 7 49.1 18.9 34.1 74.4 26.3 17.4 95.8 4.0 444.9 0.08 0.073 8 52.8 30.6 40.1 54.7 22.9 31.0 186.3 7.8 441.7 0.11 0.103 9 55.2 18.7 39.3 53.0 22.6 37.8 122.7 5.1 423.4 0.09 0.093 10 57.2 29.6 44.3 41.9 19.9 25.9 189.8 7.9 421.1 0.13 0.123 11 44.6 22.7 31.2 79.1 24.9 24.5 198.3 8.3 319.4 0.09 0.073 12 30.5 26.2 27.8 98.9 27.5 0.19 22.0 144.9 6.0 293.8 0.06 0.043 13 54.1 14.5 34.5 69.5 23.4 0.01 9.7 61.0 2.5 497.1 0.09 0.093 14 70.3 26.1 47.7 49.4 26.1 0.01 14.1 77.3 3.2 492.4 0.10 0.103 15 70.7 35.6 51.7 39.7 23.8 14.5 88.5 3.7 263.3 0.08 0.093 16 72.4 33.3 55.8 26.3 16.7 0.03 34.7 228.5 9.5 458.0 0.19 0.203 17 50.1 26.8 39.0 48.7 20.2 20.4 131.5 5.5 482.7 0.14 0.123 18 57.6 21.8 39.3 51.7 21.1 22.6 108.1 4.5 483.0 0.14 0.123 19 58.4 27.4 42.3 65.6 30.9 13.1 87.2 3.6 508.7 0.12 0.113 20 67.5 27.1 48.3 50.5 26.9 14.5 76.4 3.2 514.2 0.12 0.123 21 72.4 28.8 48.8 49.3 27.8 34.8 140.5 5.9 504.6 0.17 0.173 22 63.3 26.6 44.6 65.8 31.7 21.9 115.4 4.8 444.9 0.13 0.123 23 64.7 25.2 46.4 55.3 27.5 14.5 80.0 3.3 501.5 0.13 0.123 24 64.7 29.4 48.1 60.0 33.0 18.0 111.7 4.7 494.9 0.14 0.133 25 67.0 30.9 47.8 63.8 34.3 16.8 105.6 4.4 519.3 0.14 0.133 26 74.3 28.3 52.9 50.2 29.4 21.2 128.7 5.4 461.6 0.16 0.163 27 65.4 40.2 52.2 43.0 30.5 0.02 40.3 271.4 11.3 359.9 0.19 0.173 28 58.0 31.0 44.0 35.2 17.4 23.5 168.7 7.0 458.2 0.17 0.15
3 of 13
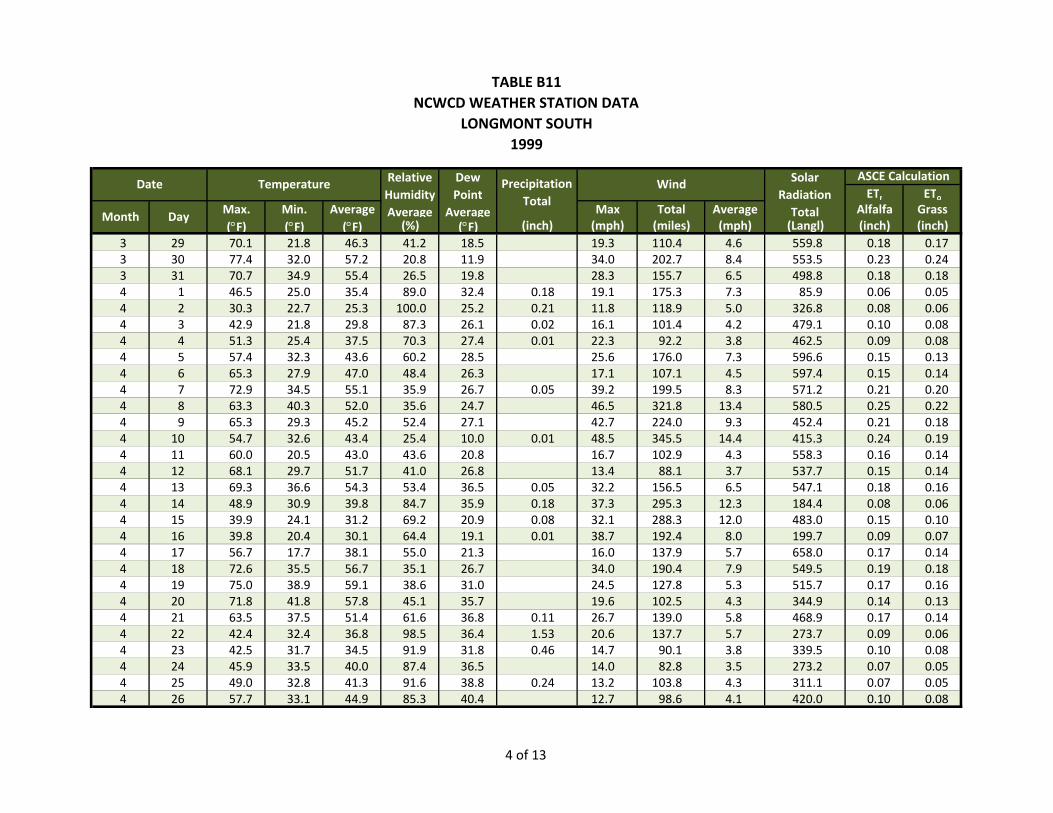
TABLE B11NCWCD WEATHER STATION DATA
LONGMONT SOUTH 1999
ETr EToMax. Min. Average Max Total Average Alfalfa Grass(°F) (°F) (°F) (%) (°F) (inch) (mph) (miles) (mph) (Langl) (inch) (inch)
Solar Radiation Total
ASCE Calculation
Month Day
Date Temperature Relative Humidity Average
Dew Point
Average
Precipitation Total
Wind
3 29 70.1 21.8 46.3 41.2 18.5 19.3 110.4 4.6 559.8 0.18 0.173 30 77.4 32.0 57.2 20.8 11.9 34.0 202.7 8.4 553.5 0.23 0.243 31 70.7 34.9 55.4 26.5 19.8 28.3 155.7 6.5 498.8 0.18 0.184 1 46.5 25.0 35.4 89.0 32.4 0.18 19.1 175.3 7.3 85.9 0.06 0.054 2 30.3 22.7 25.3 100.0 25.2 0.21 11.8 118.9 5.0 326.8 0.08 0.064 3 42.9 21.8 29.8 87.3 26.1 0.02 16.1 101.4 4.2 479.1 0.10 0.084 4 51.3 25.4 37.5 70.3 27.4 0.01 22.3 92.2 3.8 462.5 0.09 0.084 5 57.4 32.3 43.6 60.2 28.5 25.6 176.0 7.3 596.6 0.15 0.134 6 65.3 27.9 47.0 48.4 26.3 17.1 107.1 4.5 597.4 0.15 0.144 7 72.9 34.5 55.1 35.9 26.7 0.05 39.2 199.5 8.3 571.2 0.21 0.204 8 63.3 40.3 52.0 35.6 24.7 46.5 321.8 13.4 580.5 0.25 0.224 9 65.3 29.3 45.2 52.4 27.1 42.7 224.0 9.3 452.4 0.21 0.184 10 54.7 32.6 43.4 25.4 10.0 0.01 48.5 345.5 14.4 415.3 0.24 0.194 11 60.0 20.5 43.0 43.6 20.8 16.7 102.9 4.3 558.3 0.16 0.144 12 68.1 29.7 51.7 41.0 26.8 13.4 88.1 3.7 537.7 0.15 0.144 13 69.3 36.6 54.3 53.4 36.5 0.05 32.2 156.5 6.5 547.1 0.18 0.164 14 48.9 30.9 39.8 84.7 35.9 0.18 37.3 295.3 12.3 184.4 0.08 0.064 15 39.9 24.1 31.2 69.2 20.9 0.08 32.1 288.3 12.0 483.0 0.15 0.104 16 39.8 20.4 30.1 64.4 19.1 0.01 38.7 192.4 8.0 199.7 0.09 0.074 17 56.7 17.7 38.1 55.0 21.3 16.0 137.9 5.7 658.0 0.17 0.144 18 72.6 35.5 56.7 35.1 26.7 34.0 190.4 7.9 549.5 0.19 0.184 19 75.0 38.9 59.1 38.6 31.0 24.5 127.8 5.3 515.7 0.17 0.164 20 71.8 41.8 57.8 45.1 35.7 19.6 102.5 4.3 344.9 0.14 0.134 21 63.5 37.5 51.4 61.6 36.8 0.11 26.7 139.0 5.8 468.9 0.17 0.144 22 42.4 32.4 36.8 98.5 36.4 1.53 20.6 137.7 5.7 273.7 0.09 0.064 23 42.5 31.7 34.5 91.9 31.8 0.46 14.7 90.1 3.8 339.5 0.10 0.084 24 45.9 33.5 40.0 87.4 36.5 14.0 82.8 3.5 273.2 0.07 0.054 25 49.0 32.8 41.3 91.6 38.8 0.24 13.2 103.8 4.3 311.1 0.07 0.054 26 57.7 33.1 44.9 85.3 40.4 12.7 98.6 4.1 420.0 0.10 0.08
4 of 13
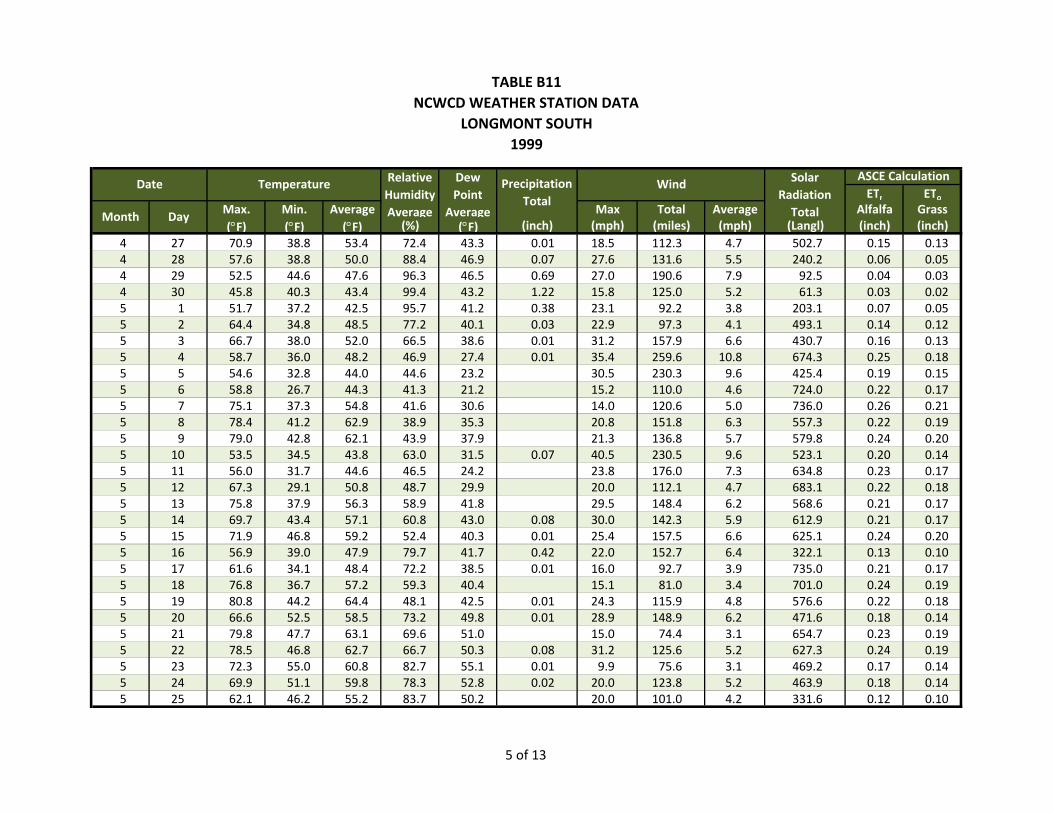
TABLE B11NCWCD WEATHER STATION DATA
LONGMONT SOUTH 1999
ETr EToMax. Min. Average Max Total Average Alfalfa Grass(°F) (°F) (°F) (%) (°F) (inch) (mph) (miles) (mph) (Langl) (inch) (inch)
Solar Radiation Total
ASCE Calculation
Month Day
Date Temperature Relative Humidity Average
Dew Point
Average
Precipitation Total
Wind
4 27 70.9 38.8 53.4 72.4 43.3 0.01 18.5 112.3 4.7 502.7 0.15 0.134 28 57.6 38.8 50.0 88.4 46.9 0.07 27.6 131.6 5.5 240.2 0.06 0.054 29 52.5 44.6 47.6 96.3 46.5 0.69 27.0 190.6 7.9 92.5 0.04 0.034 30 45.8 40.3 43.4 99.4 43.2 1.22 15.8 125.0 5.2 61.3 0.03 0.025 1 51.7 37.2 42.5 95.7 41.2 0.38 23.1 92.2 3.8 203.1 0.07 0.055 2 64.4 34.8 48.5 77.2 40.1 0.03 22.9 97.3 4.1 493.1 0.14 0.125 3 66.7 38.0 52.0 66.5 38.6 0.01 31.2 157.9 6.6 430.7 0.16 0.135 4 58.7 36.0 48.2 46.9 27.4 0.01 35.4 259.6 10.8 674.3 0.25 0.185 5 54.6 32.8 44.0 44.6 23.2 30.5 230.3 9.6 425.4 0.19 0.155 6 58.8 26.7 44.3 41.3 21.2 15.2 110.0 4.6 724.0 0.22 0.175 7 75.1 37.3 54.8 41.6 30.6 14.0 120.6 5.0 736.0 0.26 0.215 8 78.4 41.2 62.9 38.9 35.3 20.8 151.8 6.3 557.3 0.22 0.195 9 79.0 42.8 62.1 43.9 37.9 21.3 136.8 5.7 579.8 0.24 0.205 10 53.5 34.5 43.8 63.0 31.5 0.07 40.5 230.5 9.6 523.1 0.20 0.145 11 56.0 31.7 44.6 46.5 24.2 23.8 176.0 7.3 634.8 0.23 0.175 12 67.3 29.1 50.8 48.7 29.9 20.0 112.1 4.7 683.1 0.22 0.185 13 75.8 37.9 56.3 58.9 41.8 29.5 148.4 6.2 568.6 0.21 0.175 14 69.7 43.4 57.1 60.8 43.0 0.08 30.0 142.3 5.9 612.9 0.21 0.175 15 71.9 46.8 59.2 52.4 40.3 0.01 25.4 157.5 6.6 625.1 0.24 0.205 16 56.9 39.0 47.9 79.7 41.7 0.42 22.0 152.7 6.4 322.1 0.13 0.105 17 61.6 34.1 48.4 72.2 38.5 0.01 16.0 92.7 3.9 735.0 0.21 0.175 18 76.8 36.7 57.2 59.3 40.4 15.1 81.0 3.4 701.0 0.24 0.195 19 80.8 44.2 64.4 48.1 42.5 0.01 24.3 115.9 4.8 576.6 0.22 0.185 20 66.6 52.5 58.5 73.2 49.8 0.01 28.9 148.9 6.2 471.6 0.18 0.145 21 79.8 47.7 63.1 69.6 51.0 15.0 74.4 3.1 654.7 0.23 0.195 22 78.5 46.8 62.7 66.7 50.3 0.08 31.2 125.6 5.2 627.3 0.24 0.195 23 72.3 55.0 60.8 82.7 55.1 0.01 9.9 75.6 3.1 469.2 0.17 0.145 24 69.9 51.1 59.8 78.3 52.8 0.02 20.0 123.8 5.2 463.9 0.18 0.145 25 62.1 46.2 55.2 83.7 50.2 20.0 101.0 4.2 331.6 0.12 0.10
5 of 13

TABLE B11NCWCD WEATHER STATION DATA
LONGMONT SOUTH 1999
ETr EToMax. Min. Average Max Total Average Alfalfa Grass(°F) (°F) (°F) (%) (°F) (inch) (mph) (miles) (mph) (Langl) (inch) (inch)
Solar Radiation Total
ASCE Calculation
Month Day
Date Temperature Relative Humidity Average
Dew Point
Average
Precipitation Total
Wind
5 26 74.0 40.1 58.9 69.4 47.8 14.3 82.1 3.4 683.0 0.23 0.185 27 67.0 52.2 57.5 79.4 51.1 17.9 105.8 4.4 357.8 0.14 0.115 28 77.8 41.9 60.8 69.4 48.6 14.8 71.9 3.0 720.0 0.24 0.195 29 80.2 46.4 61.6 67.5 49.5 0.03 35.7 114.6 4.8 549.9 0.23 0.185 30 79.6 49.7 64.7 63.4 50.3 21.3 110.4 4.6 613.0 0.24 0.195 31 66.9 49.0 56.6 75.7 48.9 39.8 174.0 7.3 415.2 0.19 0.146 1 75.8 43.1 61.1 51.2 42.2 25.0 108.9 4.5 679.0 0.26 0.206 2 80.6 46.0 64.2 57.8 47.8 31.8 126.2 5.3 610.7 0.26 0.206 3 80.6 43.4 63.8 52.2 44.5 13.1 99.2 4.1 690.9 0.27 0.216 4 83.2 44.3 65.4 45.1 42.1 18.9 102.1 4.3 667.1 0.29 0.226 5 68.5 47.1 55.3 67.6 44.5 28.6 146.0 6.1 404.6 0.21 0.166 6 73.5 43.6 60.8 47.1 39.6 0.01 35.8 152.0 6.3 594.6 0.26 0.206 7 88.3 44.1 67.8 42.2 39.7 21.7 130.3 5.4 727.0 0.34 0.266 8 90.2 48.7 72.8 27.7 33.6 18.2 120.4 5.0 744.0 0.34 0.266 9 74.4 51.4 63.1 58.5 47.4 0.03 18.0 114.8 4.8 601.1 0.25 0.196 10 69.9 52.6 59.2 84.7 54.2 0.06 17.1 102.2 4.3 419.4 0.18 0.146 11 73.8 42.7 58.4 74.8 49.9 0.06 20.5 120.4 5.0 646.2 0.24 0.186 12 71.6 47.9 58.9 77.6 51.2 0.02 30.3 103.0 4.3 509.5 0.19 0.156 13 69.1 47.5 57.0 78.5 49.8 19.9 102.9 4.3 466.3 0.18 0.136 14 74.1 49.7 61.9 76.4 53.9 22.0 116.5 4.9 520.4 0.19 0.156 15 62.9 49.7 55.6 92.7 53.5 0.24 12.2 87.3 3.6 241.4 0.09 0.076 16 58.4 51.3 54.6 89.7 51.6 0.02 11.7 87.6 3.6 177.4 0.07 0.066 17 75.8 49.1 60.4 81.1 53.9 0.03 22.9 125.8 5.2 546.0 0.21 0.156 18 82.8 48.1 66.9 63.6 51.4 15.3 85.4 3.6 714.0 0.26 0.196 19 87.0 53.2 70.5 56.0 51.8 18.1 94.7 3.9 588.6 0.26 0.196 20 89.8 52.7 71.1 54.8 51.8 17.5 97.9 4.1 636.1 0.29 0.226 21 86.4 52.6 68.8 56.5 51.3 0.01 23.7 108.9 4.5 486.4 0.27 0.206 22 87.7 51.0 71.0 49.8 47.9 0.02 44.2 139.2 5.8 530.0 0.30 0.226 23 88.8 54.4 72.0 55.8 52.9 13.8 85.5 3.6 713.0 0.31 0.23
6 of 13
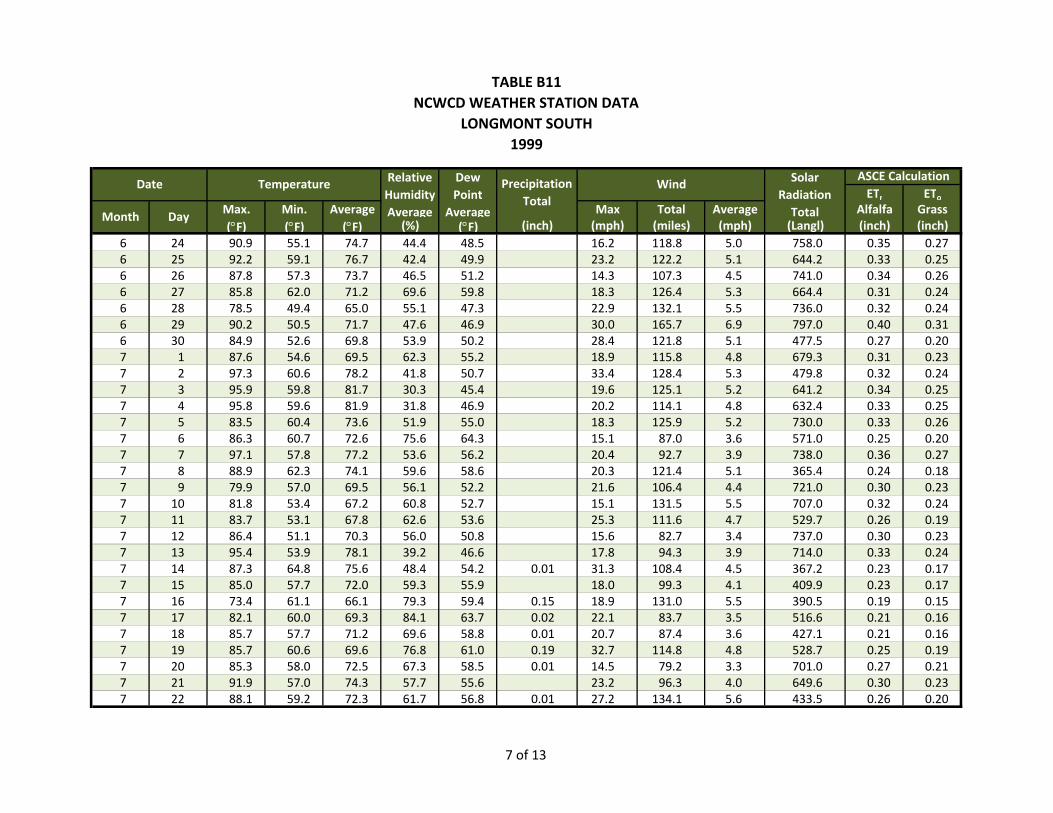
TABLE B11NCWCD WEATHER STATION DATA
LONGMONT SOUTH 1999
ETr EToMax. Min. Average Max Total Average Alfalfa Grass(°F) (°F) (°F) (%) (°F) (inch) (mph) (miles) (mph) (Langl) (inch) (inch)
Solar Radiation Total
ASCE Calculation
Month Day
Date Temperature Relative Humidity Average
Dew Point
Average
Precipitation Total
Wind
6 24 90.9 55.1 74.7 44.4 48.5 16.2 118.8 5.0 758.0 0.35 0.276 25 92.2 59.1 76.7 42.4 49.9 23.2 122.2 5.1 644.2 0.33 0.256 26 87.8 57.3 73.7 46.5 51.2 14.3 107.3 4.5 741.0 0.34 0.266 27 85.8 62.0 71.2 69.6 59.8 18.3 126.4 5.3 664.4 0.31 0.246 28 78.5 49.4 65.0 55.1 47.3 22.9 132.1 5.5 736.0 0.32 0.246 29 90.2 50.5 71.7 47.6 46.9 30.0 165.7 6.9 797.0 0.40 0.316 30 84.9 52.6 69.8 53.9 50.2 28.4 121.8 5.1 477.5 0.27 0.207 1 87.6 54.6 69.5 62.3 55.2 18.9 115.8 4.8 679.3 0.31 0.237 2 97.3 60.6 78.2 41.8 50.7 33.4 128.4 5.3 479.8 0.32 0.247 3 95.9 59.8 81.7 30.3 45.4 19.6 125.1 5.2 641.2 0.34 0.257 4 95.8 59.6 81.9 31.8 46.9 20.2 114.1 4.8 632.4 0.33 0.257 5 83.5 60.4 73.6 51.9 55.0 18.3 125.9 5.2 730.0 0.33 0.267 6 86.3 60.7 72.6 75.6 64.3 15.1 87.0 3.6 571.0 0.25 0.207 7 97.1 57.8 77.2 53.6 56.2 20.4 92.7 3.9 738.0 0.36 0.277 8 88.9 62.3 74.1 59.6 58.6 20.3 121.4 5.1 365.4 0.24 0.187 9 79.9 57.0 69.5 56.1 52.2 21.6 106.4 4.4 721.0 0.30 0.237 10 81.8 53.4 67.2 60.8 52.7 15.1 131.5 5.5 707.0 0.32 0.247 11 83.7 53.1 67.8 62.6 53.6 25.3 111.6 4.7 529.7 0.26 0.197 12 86.4 51.1 70.3 56.0 50.8 15.6 82.7 3.4 737.0 0.30 0.237 13 95.4 53.9 78.1 39.2 46.6 17.8 94.3 3.9 714.0 0.33 0.247 14 87.3 64.8 75.6 48.4 54.2 0.01 31.3 108.4 4.5 367.2 0.23 0.177 15 85.0 57.7 72.0 59.3 55.9 18.0 99.3 4.1 409.9 0.23 0.177 16 73.4 61.1 66.1 79.3 59.4 0.15 18.9 131.0 5.5 390.5 0.19 0.157 17 82.1 60.0 69.3 84.1 63.7 0.02 22.1 83.7 3.5 516.6 0.21 0.167 18 85.7 57.7 71.2 69.6 58.8 0.01 20.7 87.4 3.6 427.1 0.21 0.167 19 85.7 60.6 69.6 76.8 61.0 0.19 32.7 114.8 4.8 528.7 0.25 0.197 20 85.3 58.0 72.5 67.3 58.5 0.01 14.5 79.2 3.3 701.0 0.27 0.217 21 91.9 57.0 74.3 57.7 55.6 23.2 96.3 4.0 649.6 0.30 0.237 22 88.1 59.2 72.3 61.7 56.8 0.01 27.2 134.1 5.6 433.5 0.26 0.20
7 of 13
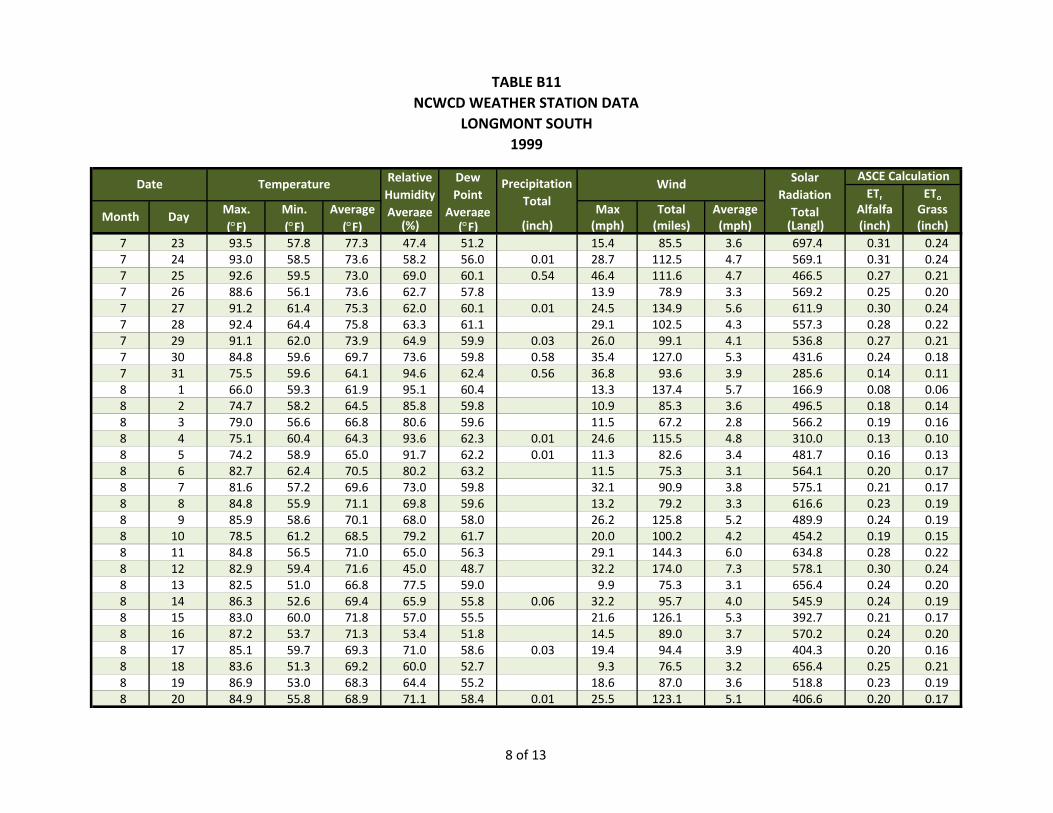
TABLE B11NCWCD WEATHER STATION DATA
LONGMONT SOUTH 1999
ETr EToMax. Min. Average Max Total Average Alfalfa Grass(°F) (°F) (°F) (%) (°F) (inch) (mph) (miles) (mph) (Langl) (inch) (inch)
Solar Radiation Total
ASCE Calculation
Month Day
Date Temperature Relative Humidity Average
Dew Point
Average
Precipitation Total
Wind
7 23 93.5 57.8 77.3 47.4 51.2 15.4 85.5 3.6 697.4 0.31 0.247 24 93.0 58.5 73.6 58.2 56.0 0.01 28.7 112.5 4.7 569.1 0.31 0.247 25 92.6 59.5 73.0 69.0 60.1 0.54 46.4 111.6 4.7 466.5 0.27 0.217 26 88.6 56.1 73.6 62.7 57.8 13.9 78.9 3.3 569.2 0.25 0.207 27 91.2 61.4 75.3 62.0 60.1 0.01 24.5 134.9 5.6 611.9 0.30 0.247 28 92.4 64.4 75.8 63.3 61.1 29.1 102.5 4.3 557.3 0.28 0.227 29 91.1 62.0 73.9 64.9 59.9 0.03 26.0 99.1 4.1 536.8 0.27 0.217 30 84.8 59.6 69.7 73.6 59.8 0.58 35.4 127.0 5.3 431.6 0.24 0.187 31 75.5 59.6 64.1 94.6 62.4 0.56 36.8 93.6 3.9 285.6 0.14 0.118 1 66.0 59.3 61.9 95.1 60.4 13.3 137.4 5.7 166.9 0.08 0.068 2 74.7 58.2 64.5 85.8 59.8 10.9 85.3 3.6 496.5 0.18 0.148 3 79.0 56.6 66.8 80.6 59.6 11.5 67.2 2.8 566.2 0.19 0.168 4 75.1 60.4 64.3 93.6 62.3 0.01 24.6 115.5 4.8 310.0 0.13 0.108 5 74.2 58.9 65.0 91.7 62.2 0.01 11.3 82.6 3.4 481.7 0.16 0.138 6 82.7 62.4 70.5 80.2 63.2 11.5 75.3 3.1 564.1 0.20 0.178 7 81.6 57.2 69.6 73.0 59.8 32.1 90.9 3.8 575.1 0.21 0.178 8 84.8 55.9 71.1 69.8 59.6 13.2 79.2 3.3 616.6 0.23 0.198 9 85.9 58.6 70.1 68.0 58.0 26.2 125.8 5.2 489.9 0.24 0.198 10 78.5 61.2 68.5 79.2 61.7 20.0 100.2 4.2 454.2 0.19 0.158 11 84.8 56.5 71.0 65.0 56.3 29.1 144.3 6.0 634.8 0.28 0.228 12 82.9 59.4 71.6 45.0 48.7 32.2 174.0 7.3 578.1 0.30 0.248 13 82.5 51.0 66.8 77.5 59.0 9.9 75.3 3.1 656.4 0.24 0.208 14 86.3 52.6 69.4 65.9 55.8 0.06 32.2 95.7 4.0 545.9 0.24 0.198 15 83.0 60.0 71.8 57.0 55.5 21.6 126.1 5.3 392.7 0.21 0.178 16 87.2 53.7 71.3 53.4 51.8 14.5 89.0 3.7 570.2 0.24 0.208 17 85.1 59.7 69.3 71.0 58.6 0.03 19.4 94.4 3.9 404.3 0.20 0.168 18 83.6 51.3 69.2 60.0 52.7 9.3 76.5 3.2 656.4 0.25 0.218 19 86.9 53.0 68.3 64.4 55.2 18.6 87.0 3.6 518.8 0.23 0.198 20 84.9 55.8 68.9 71.1 58.4 0.01 25.5 123.1 5.1 406.6 0.20 0.17
8 of 13
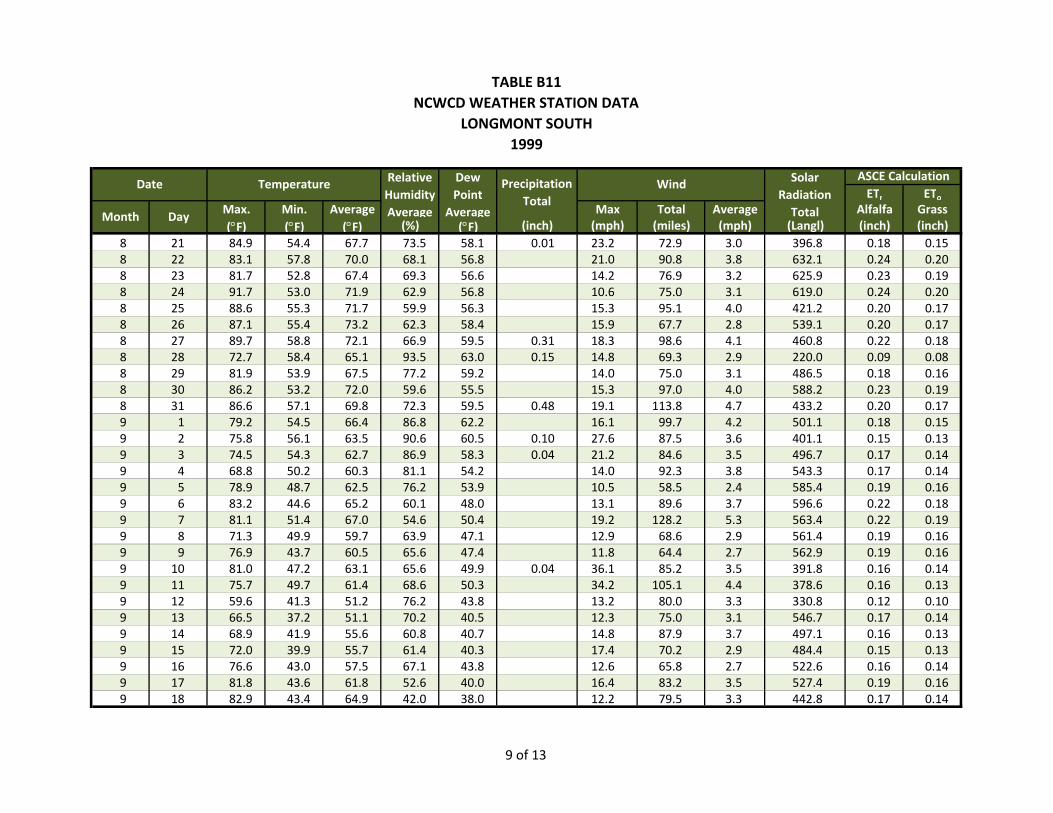
TABLE B11NCWCD WEATHER STATION DATA
LONGMONT SOUTH 1999
ETr EToMax. Min. Average Max Total Average Alfalfa Grass(°F) (°F) (°F) (%) (°F) (inch) (mph) (miles) (mph) (Langl) (inch) (inch)
Solar Radiation Total
ASCE Calculation
Month Day
Date Temperature Relative Humidity Average
Dew Point
Average
Precipitation Total
Wind
8 21 84.9 54.4 67.7 73.5 58.1 0.01 23.2 72.9 3.0 396.8 0.18 0.158 22 83.1 57.8 70.0 68.1 56.8 21.0 90.8 3.8 632.1 0.24 0.208 23 81.7 52.8 67.4 69.3 56.6 14.2 76.9 3.2 625.9 0.23 0.198 24 91.7 53.0 71.9 62.9 56.8 10.6 75.0 3.1 619.0 0.24 0.208 25 88.6 55.3 71.7 59.9 56.3 15.3 95.1 4.0 421.2 0.20 0.178 26 87.1 55.4 73.2 62.3 58.4 15.9 67.7 2.8 539.1 0.20 0.178 27 89.7 58.8 72.1 66.9 59.5 0.31 18.3 98.6 4.1 460.8 0.22 0.188 28 72.7 58.4 65.1 93.5 63.0 0.15 14.8 69.3 2.9 220.0 0.09 0.088 29 81.9 53.9 67.5 77.2 59.2 14.0 75.0 3.1 486.5 0.18 0.168 30 86.2 53.2 72.0 59.6 55.5 15.3 97.0 4.0 588.2 0.23 0.198 31 86.6 57.1 69.8 72.3 59.5 0.48 19.1 113.8 4.7 433.2 0.20 0.179 1 79.2 54.5 66.4 86.8 62.2 16.1 99.7 4.2 501.1 0.18 0.159 2 75.8 56.1 63.5 90.6 60.5 0.10 27.6 87.5 3.6 401.1 0.15 0.139 3 74.5 54.3 62.7 86.9 58.3 0.04 21.2 84.6 3.5 496.7 0.17 0.149 4 68.8 50.2 60.3 81.1 54.2 14.0 92.3 3.8 543.3 0.17 0.149 5 78.9 48.7 62.5 76.2 53.9 10.5 58.5 2.4 585.4 0.19 0.169 6 83.2 44.6 65.2 60.1 48.0 13.1 89.6 3.7 596.6 0.22 0.189 7 81.1 51.4 67.0 54.6 50.4 19.2 128.2 5.3 563.4 0.22 0.199 8 71.3 49.9 59.7 63.9 47.1 12.9 68.6 2.9 561.4 0.19 0.169 9 76.9 43.7 60.5 65.6 47.4 11.8 64.4 2.7 562.9 0.19 0.169 10 81.0 47.2 63.1 65.6 49.9 0.04 36.1 85.2 3.5 391.8 0.16 0.149 11 75.7 49.7 61.4 68.6 50.3 34.2 105.1 4.4 378.6 0.16 0.139 12 59.6 41.3 51.2 76.2 43.8 13.2 80.0 3.3 330.8 0.12 0.109 13 66.5 37.2 51.1 70.2 40.5 12.3 75.0 3.1 546.7 0.17 0.149 14 68.9 41.9 55.6 60.8 40.7 14.8 87.9 3.7 497.1 0.16 0.139 15 72.0 39.9 55.7 61.4 40.3 17.4 70.2 2.9 484.4 0.15 0.139 16 76.6 43.0 57.5 67.1 43.8 12.6 65.8 2.7 522.6 0.16 0.149 17 81.8 43.6 61.8 52.6 40.0 16.4 83.2 3.5 527.4 0.19 0.169 18 82.9 43.4 64.9 42.0 38.0 12.2 79.5 3.3 442.8 0.17 0.14
9 of 13
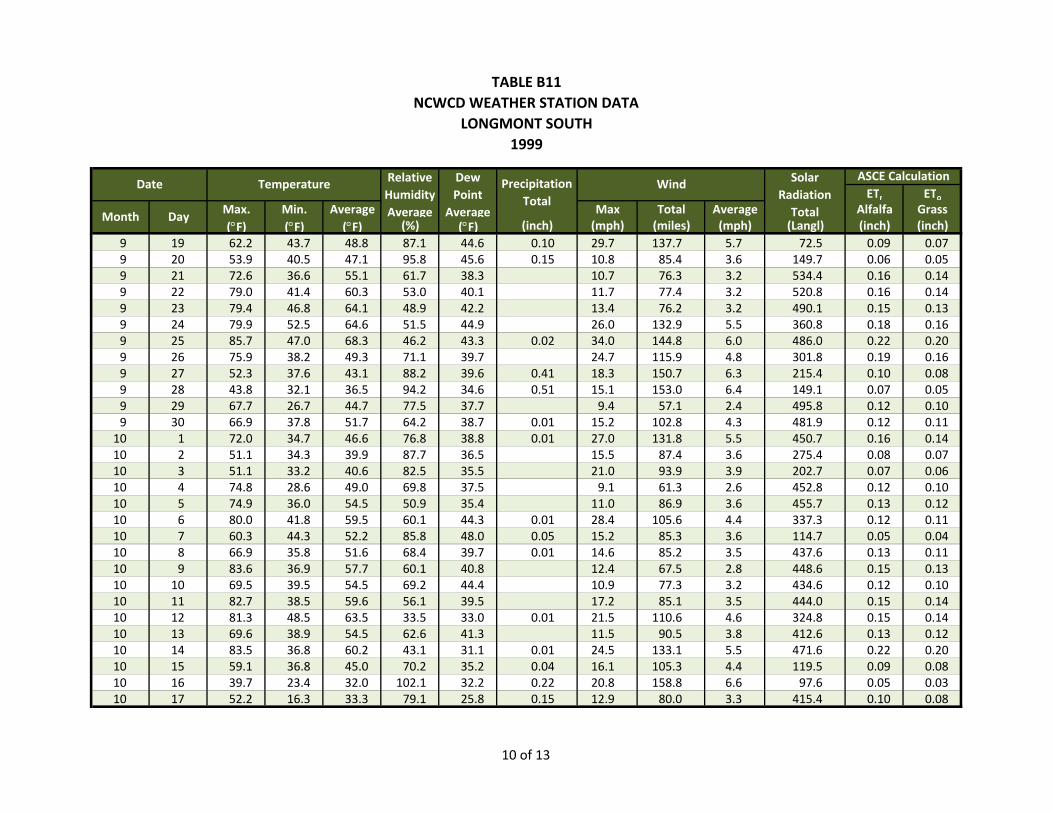
TABLE B11NCWCD WEATHER STATION DATA
LONGMONT SOUTH 1999
ETr EToMax. Min. Average Max Total Average Alfalfa Grass(°F) (°F) (°F) (%) (°F) (inch) (mph) (miles) (mph) (Langl) (inch) (inch)
Solar Radiation Total
ASCE Calculation
Month Day
Date Temperature Relative Humidity Average
Dew Point
Average
Precipitation Total
Wind
9 19 62.2 43.7 48.8 87.1 44.6 0.10 29.7 137.7 5.7 72.5 0.09 0.079 20 53.9 40.5 47.1 95.8 45.6 0.15 10.8 85.4 3.6 149.7 0.06 0.059 21 72.6 36.6 55.1 61.7 38.3 10.7 76.3 3.2 534.4 0.16 0.149 22 79.0 41.4 60.3 53.0 40.1 11.7 77.4 3.2 520.8 0.16 0.149 23 79.4 46.8 64.1 48.9 42.2 13.4 76.2 3.2 490.1 0.15 0.139 24 79.9 52.5 64.6 51.5 44.9 26.0 132.9 5.5 360.8 0.18 0.169 25 85.7 47.0 68.3 46.2 43.3 0.02 34.0 144.8 6.0 486.0 0.22 0.209 26 75.9 38.2 49.3 71.1 39.7 24.7 115.9 4.8 301.8 0.19 0.169 27 52.3 37.6 43.1 88.2 39.6 0.41 18.3 150.7 6.3 215.4 0.10 0.089 28 43.8 32.1 36.5 94.2 34.6 0.51 15.1 153.0 6.4 149.1 0.07 0.059 29 67.7 26.7 44.7 77.5 37.7 9.4 57.1 2.4 495.8 0.12 0.109 30 66.9 37.8 51.7 64.2 38.7 0.01 15.2 102.8 4.3 481.9 0.12 0.1110 1 72.0 34.7 46.6 76.8 38.8 0.01 27.0 131.8 5.5 450.7 0.16 0.1410 2 51.1 34.3 39.9 87.7 36.5 15.5 87.4 3.6 275.4 0.08 0.0710 3 51.1 33.2 40.6 82.5 35.5 21.0 93.9 3.9 202.7 0.07 0.0610 4 74.8 28.6 49.0 69.8 37.5 9.1 61.3 2.6 452.8 0.12 0.1010 5 74.9 36.0 54.5 50.9 35.4 11.0 86.9 3.6 455.7 0.13 0.1210 6 80.0 41.8 59.5 60.1 44.3 0.01 28.4 105.6 4.4 337.3 0.12 0.1110 7 60.3 44.3 52.2 85.8 48.0 0.05 15.2 85.3 3.6 114.7 0.05 0.0410 8 66.9 35.8 51.6 68.4 39.7 0.01 14.6 85.2 3.5 437.6 0.13 0.1110 9 83.6 36.9 57.7 60.1 40.8 12.4 67.5 2.8 448.6 0.15 0.1310 10 69.5 39.5 54.5 69.2 44.4 10.9 77.3 3.2 434.6 0.12 0.1010 11 82.7 38.5 59.6 56.1 39.5 17.2 85.1 3.5 444.0 0.15 0.1410 12 81.3 48.5 63.5 33.5 33.0 0.01 21.5 110.6 4.6 324.8 0.15 0.1410 13 69.6 38.9 54.5 62.6 41.3 11.5 90.5 3.8 412.6 0.13 0.1210 14 83.5 36.8 60.2 43.1 31.1 0.01 24.5 133.1 5.5 471.6 0.22 0.2010 15 59.1 36.8 45.0 70.2 35.2 0.04 16.1 105.3 4.4 119.5 0.09 0.0810 16 39.7 23.4 32.0 102.1 32.2 0.22 20.8 158.8 6.6 97.6 0.05 0.0310 17 52.2 16.3 33.3 79.1 25.8 0.15 12.9 80.0 3.3 415.4 0.10 0.08
10 of 13
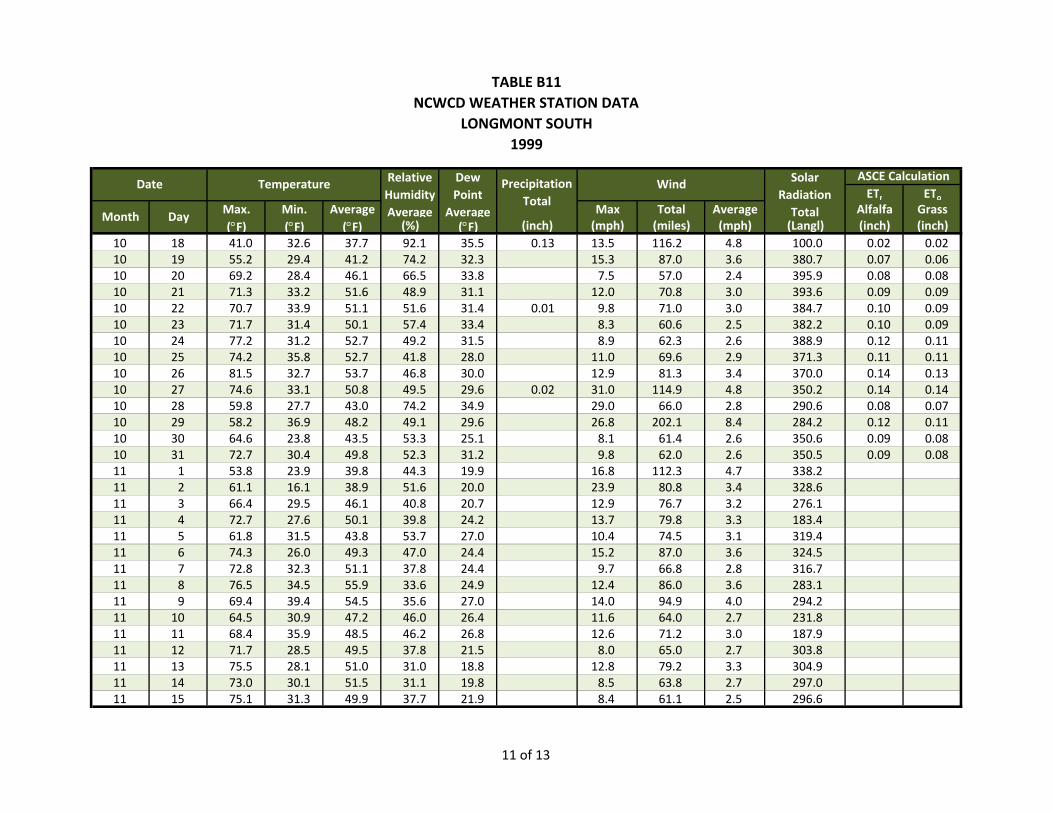
TABLE B11NCWCD WEATHER STATION DATA
LONGMONT SOUTH 1999
ETr EToMax. Min. Average Max Total Average Alfalfa Grass(°F) (°F) (°F) (%) (°F) (inch) (mph) (miles) (mph) (Langl) (inch) (inch)
Solar Radiation Total
ASCE Calculation
Month Day
Date Temperature Relative Humidity Average
Dew Point
Average
Precipitation Total
Wind
10 18 41.0 32.6 37.7 92.1 35.5 0.13 13.5 116.2 4.8 100.0 0.02 0.0210 19 55.2 29.4 41.2 74.2 32.3 15.3 87.0 3.6 380.7 0.07 0.0610 20 69.2 28.4 46.1 66.5 33.8 7.5 57.0 2.4 395.9 0.08 0.0810 21 71.3 33.2 51.6 48.9 31.1 12.0 70.8 3.0 393.6 0.09 0.0910 22 70.7 33.9 51.1 51.6 31.4 0.01 9.8 71.0 3.0 384.7 0.10 0.0910 23 71.7 31.4 50.1 57.4 33.4 8.3 60.6 2.5 382.2 0.10 0.0910 24 77.2 31.2 52.7 49.2 31.5 8.9 62.3 2.6 388.9 0.12 0.1110 25 74.2 35.8 52.7 41.8 28.0 11.0 69.6 2.9 371.3 0.11 0.1110 26 81.5 32.7 53.7 46.8 30.0 12.9 81.3 3.4 370.0 0.14 0.1310 27 74.6 33.1 50.8 49.5 29.6 0.02 31.0 114.9 4.8 350.2 0.14 0.1410 28 59.8 27.7 43.0 74.2 34.9 29.0 66.0 2.8 290.6 0.08 0.0710 29 58.2 36.9 48.2 49.1 29.6 26.8 202.1 8.4 284.2 0.12 0.1110 30 64.6 23.8 43.5 53.3 25.1 8.1 61.4 2.6 350.6 0.09 0.0810 31 72.7 30.4 49.8 52.3 31.2 9.8 62.0 2.6 350.5 0.09 0.0811 1 53.8 23.9 39.8 44.3 19.9 16.8 112.3 4.7 338.211 2 61.1 16.1 38.9 51.6 20.0 23.9 80.8 3.4 328.611 3 66.4 29.5 46.1 40.8 20.7 12.9 76.7 3.2 276.111 4 72.7 27.6 50.1 39.8 24.2 13.7 79.8 3.3 183.411 5 61.8 31.5 43.8 53.7 27.0 10.4 74.5 3.1 319.411 6 74.3 26.0 49.3 47.0 24.4 15.2 87.0 3.6 324.511 7 72.8 32.3 51.1 37.8 24.4 9.7 66.8 2.8 316.711 8 76.5 34.5 55.9 33.6 24.9 12.4 86.0 3.6 283.111 9 69.4 39.4 54.5 35.6 27.0 14.0 94.9 4.0 294.211 10 64.5 30.9 47.2 46.0 26.4 11.6 64.0 2.7 231.811 11 68.4 35.9 48.5 46.2 26.8 12.6 71.2 3.0 187.911 12 71.7 28.5 49.5 37.8 21.5 8.0 65.0 2.7 303.811 13 75.5 28.1 51.0 31.0 18.8 12.8 79.2 3.3 304.911 14 73.0 30.1 51.5 31.1 19.8 8.5 63.8 2.7 297.011 15 75.1 31.3 49.9 37.7 21.9 8.4 61.1 2.5 296.6
11 of 13
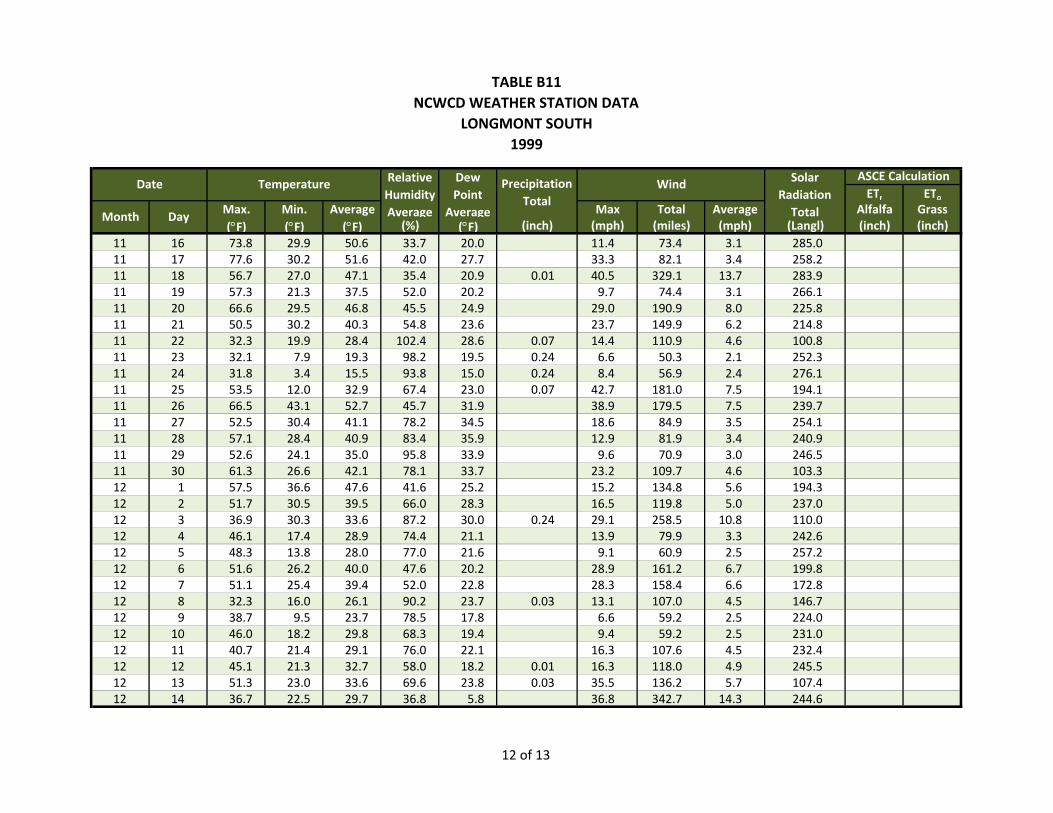
TABLE B11NCWCD WEATHER STATION DATA
LONGMONT SOUTH 1999
ETr EToMax. Min. Average Max Total Average Alfalfa Grass(°F) (°F) (°F) (%) (°F) (inch) (mph) (miles) (mph) (Langl) (inch) (inch)
Solar Radiation Total
ASCE Calculation
Month Day
Date Temperature Relative Humidity Average
Dew Point
Average
Precipitation Total
Wind
11 16 73.8 29.9 50.6 33.7 20.0 11.4 73.4 3.1 285.011 17 77.6 30.2 51.6 42.0 27.7 33.3 82.1 3.4 258.211 18 56.7 27.0 47.1 35.4 20.9 0.01 40.5 329.1 13.7 283.911 19 57.3 21.3 37.5 52.0 20.2 9.7 74.4 3.1 266.111 20 66.6 29.5 46.8 45.5 24.9 29.0 190.9 8.0 225.811 21 50.5 30.2 40.3 54.8 23.6 23.7 149.9 6.2 214.811 22 32.3 19.9 28.4 102.4 28.6 0.07 14.4 110.9 4.6 100.811 23 32.1 7.9 19.3 98.2 19.5 0.24 6.6 50.3 2.1 252.311 24 31.8 3.4 15.5 93.8 15.0 0.24 8.4 56.9 2.4 276.111 25 53.5 12.0 32.9 67.4 23.0 0.07 42.7 181.0 7.5 194.111 26 66.5 43.1 52.7 45.7 31.9 38.9 179.5 7.5 239.711 27 52.5 30.4 41.1 78.2 34.5 18.6 84.9 3.5 254.111 28 57.1 28.4 40.9 83.4 35.9 12.9 81.9 3.4 240.911 29 52.6 24.1 35.0 95.8 33.9 9.6 70.9 3.0 246.511 30 61.3 26.6 42.1 78.1 33.7 23.2 109.7 4.6 103.312 1 57.5 36.6 47.6 41.6 25.2 15.2 134.8 5.6 194.312 2 51.7 30.5 39.5 66.0 28.3 16.5 119.8 5.0 237.012 3 36.9 30.3 33.6 87.2 30.0 0.24 29.1 258.5 10.8 110.012 4 46.1 17.4 28.9 74.4 21.1 13.9 79.9 3.3 242.612 5 48.3 13.8 28.0 77.0 21.6 9.1 60.9 2.5 257.212 6 51.6 26.2 40.0 47.6 20.2 28.9 161.2 6.7 199.812 7 51.1 25.4 39.4 52.0 22.8 28.3 158.4 6.6 172.812 8 32.3 16.0 26.1 90.2 23.7 0.03 13.1 107.0 4.5 146.712 9 38.7 9.5 23.7 78.5 17.8 6.6 59.2 2.5 224.012 10 46.0 18.2 29.8 68.3 19.4 9.4 59.2 2.5 231.012 11 40.7 21.4 29.1 76.0 22.1 16.3 107.6 4.5 232.412 12 45.1 21.3 32.7 58.0 18.2 0.01 16.3 118.0 4.9 245.512 13 51.3 23.0 33.6 69.6 23.8 0.03 35.5 136.2 5.7 107.412 14 36.7 22.5 29.7 36.8 5.8 36.8 342.7 14.3 244.6
12 of 13
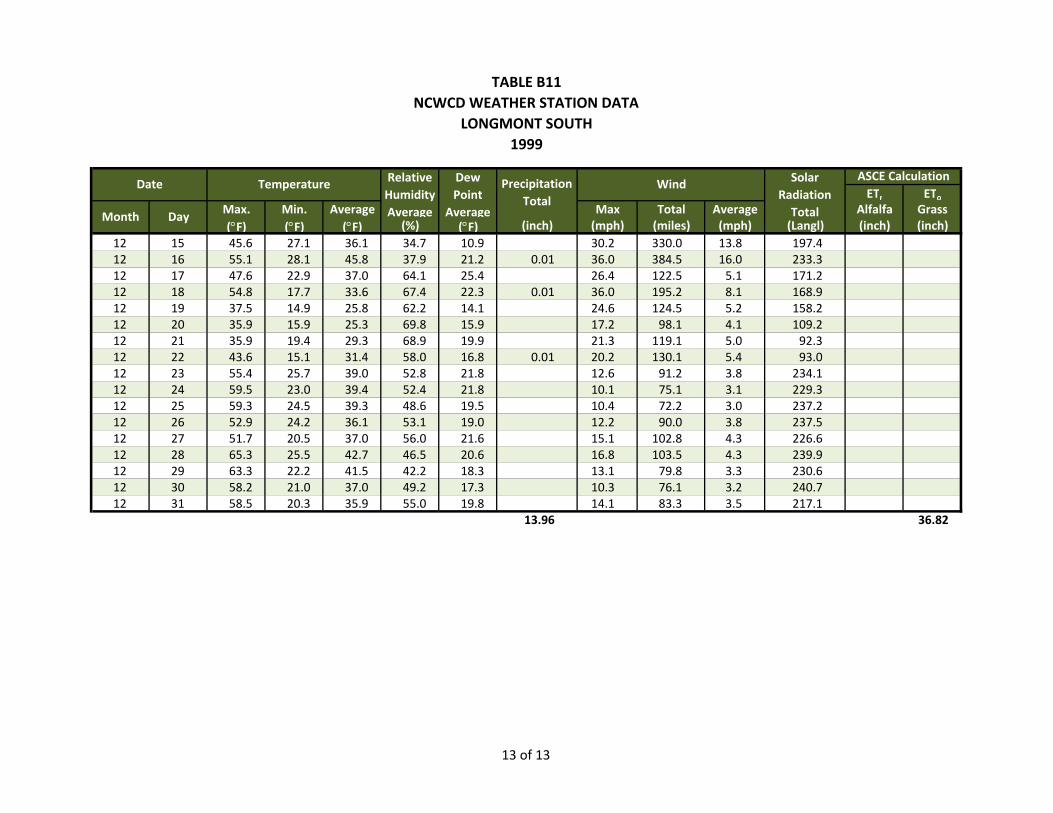
TABLE B11NCWCD WEATHER STATION DATA
LONGMONT SOUTH 1999
ETr EToMax. Min. Average Max Total Average Alfalfa Grass(°F) (°F) (°F) (%) (°F) (inch) (mph) (miles) (mph) (Langl) (inch) (inch)
Solar Radiation Total
ASCE Calculation
Month Day
Date Temperature Relative Humidity Average
Dew Point
Average
Precipitation Total
Wind
12 15 45.6 27.1 36.1 34.7 10.9 30.2 330.0 13.8 197.412 16 55.1 28.1 45.8 37.9 21.2 0.01 36.0 384.5 16.0 233.312 17 47.6 22.9 37.0 64.1 25.4 26.4 122.5 5.1 171.212 18 54.8 17.7 33.6 67.4 22.3 0.01 36.0 195.2 8.1 168.912 19 37.5 14.9 25.8 62.2 14.1 24.6 124.5 5.2 158.212 20 35.9 15.9 25.3 69.8 15.9 17.2 98.1 4.1 109.212 21 35.9 19.4 29.3 68.9 19.9 21.3 119.1 5.0 92.312 22 43.6 15.1 31.4 58.0 16.8 0.01 20.2 130.1 5.4 93.012 23 55.4 25.7 39.0 52.8 21.8 12.6 91.2 3.8 234.112 24 59.5 23.0 39.4 52.4 21.8 10.1 75.1 3.1 229.312 25 59.3 24.5 39.3 48.6 19.5 10.4 72.2 3.0 237.212 26 52.9 24.2 36.1 53.1 19.0 12.2 90.0 3.8 237.512 27 51.7 20.5 37.0 56.0 21.6 15.1 102.8 4.3 226.612 28 65.3 25.5 42.7 46.5 20.6 16.8 103.5 4.3 239.912 29 63.3 22.2 41.5 42.2 18.3 13.1 79.8 3.3 230.612 30 58.2 21.0 37.0 49.2 17.3 10.3 76.1 3.2 240.712 31 58.5 20.3 35.9 55.0 19.8 14.1 83.3 3.5 217.1
13.96 36.82
13 of 13
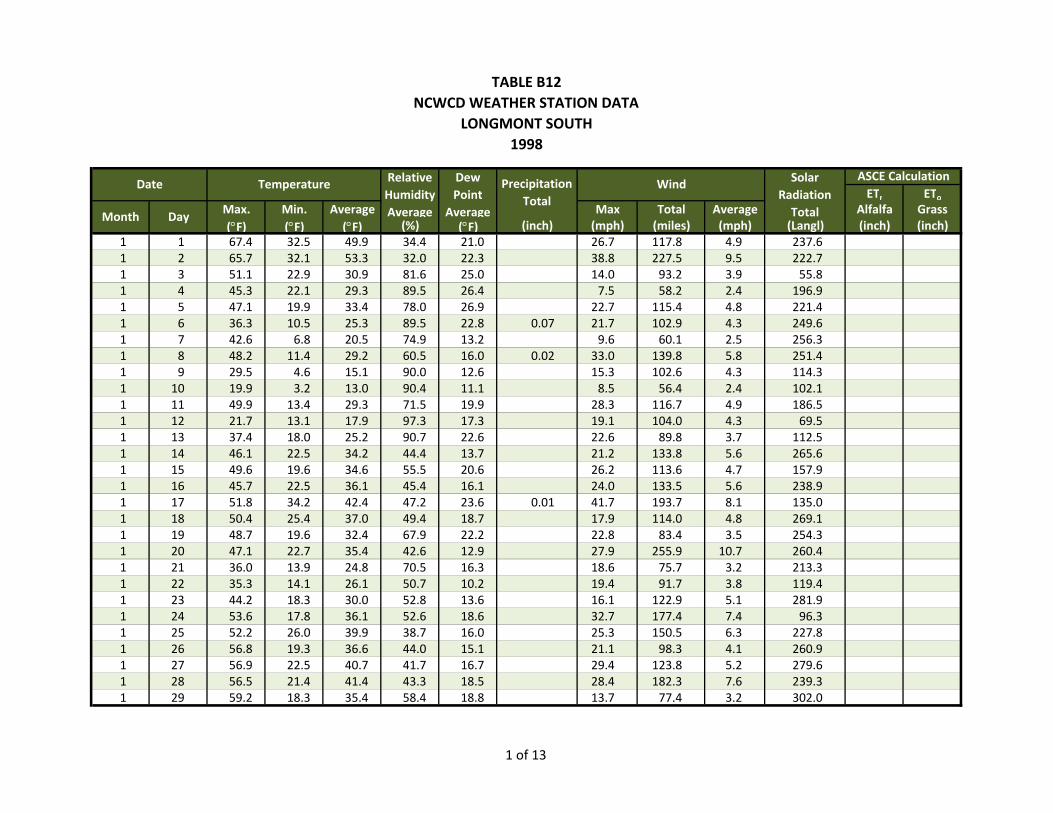
TABLE B12NCWCD WEATHER STATION DATA
LONGMONT SOUTH 1998
ETr EToMax. Min. Average Max Total Average Alfalfa Grass(°F) (°F) (°F) (%) (°F) (inch) (mph) (miles) (mph) (Langl) (inch) (inch)
1 1 67.4 32.5 49.9 34.4 21.0 26.7 117.8 4.9 237.61 2 65.7 32.1 53.3 32.0 22.3 38.8 227.5 9.5 222.71 3 51.1 22.9 30.9 81.6 25.0 14.0 93.2 3.9 55.81 4 45.3 22.1 29.3 89.5 26.4 7.5 58.2 2.4 196.91 5 47.1 19.9 33.4 78.0 26.9 22.7 115.4 4.8 221.41 6 36.3 10.5 25.3 89.5 22.8 0.07 21.7 102.9 4.3 249.61 7 42.6 6.8 20.5 74.9 13.2 9.6 60.1 2.5 256.31 8 48.2 11.4 29.2 60.5 16.0 0.02 33.0 139.8 5.8 251.41 9 29.5 4.6 15.1 90.0 12.6 15.3 102.6 4.3 114.31 10 19.9 3.2 13.0 90.4 11.1 8.5 56.4 2.4 102.11 11 49.9 13.4 29.3 71.5 19.9 28.3 116.7 4.9 186.51 12 21.7 13.1 17.9 97.3 17.3 19.1 104.0 4.3 69.51 13 37.4 18.0 25.2 90.7 22.6 22.6 89.8 3.7 112.51 14 46.1 22.5 34.2 44.4 13.7 21.2 133.8 5.6 265.61 15 49.6 19.6 34.6 55.5 20.6 26.2 113.6 4.7 157.91 16 45.7 22.5 36.1 45.4 16.1 24.0 133.5 5.6 238.91 17 51.8 34.2 42.4 47.2 23.6 0.01 41.7 193.7 8.1 135.01 18 50.4 25.4 37.0 49.4 18.7 17.9 114.0 4.8 269.11 19 48.7 19.6 32.4 67.9 22.2 22.8 83.4 3.5 254.31 20 47.1 22.7 35.4 42.6 12.9 27.9 255.9 10.7 260.41 21 36.0 13.9 24.8 70.5 16.3 18.6 75.7 3.2 213.31 22 35.3 14.1 26.1 50.7 10.2 19.4 91.7 3.8 119.41 23 44.2 18.3 30.0 52.8 13.6 16.1 122.9 5.1 281.91 24 53.6 17.8 36.1 52.6 18.6 32.7 177.4 7.4 96.31 25 52.2 26.0 39.9 38.7 16.0 25.3 150.5 6.3 227.81 26 56.8 19.3 36.6 44.0 15.1 21.1 98.3 4.1 260.91 27 56.9 22.5 40.7 41.7 16.7 29.4 123.8 5.2 279.61 28 56.5 21.4 41.4 43.3 18.5 28.4 182.3 7.6 239.31 29 59.2 18.3 35.4 58.4 18.8 13.7 77.4 3.2 302.0
Solar Radiation Total
ASCE Calculation
Month Day
Date Temperature Relative Humidity Average
Dew Point
Average
Precipitation Total
Wind
1 of 13
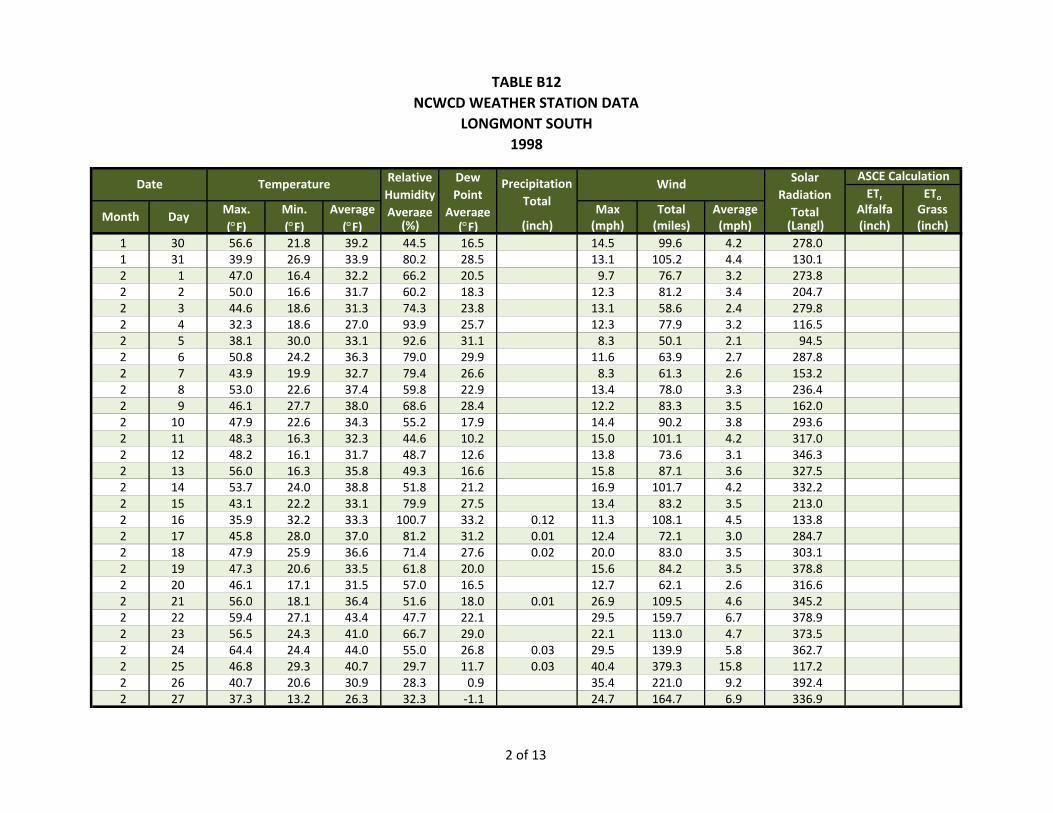
TABLE B12NCWCD WEATHER STATION DATA
LONGMONT SOUTH 1998
ETr EToMax. Min. Average Max Total Average Alfalfa Grass(°F) (°F) (°F) (%) (°F) (inch) (mph) (miles) (mph) (Langl) (inch) (inch)
Solar Radiation Total
ASCE Calculation
Month Day
Date Temperature Relative Humidity Average
Dew Point
Average
Precipitation Total
Wind
1 30 56.6 21.8 39.2 44.5 16.5 14.5 99.6 4.2 278.01 31 39.9 26.9 33.9 80.2 28.5 13.1 105.2 4.4 130.12 1 47.0 16.4 32.2 66.2 20.5 9.7 76.7 3.2 273.82 2 50.0 16.6 31.7 60.2 18.3 12.3 81.2 3.4 204.72 3 44.6 18.6 31.3 74.3 23.8 13.1 58.6 2.4 279.82 4 32.3 18.6 27.0 93.9 25.7 12.3 77.9 3.2 116.52 5 38.1 30.0 33.1 92.6 31.1 8.3 50.1 2.1 94.52 6 50.8 24.2 36.3 79.0 29.9 11.6 63.9 2.7 287.82 7 43.9 19.9 32.7 79.4 26.6 8.3 61.3 2.6 153.22 8 53.0 22.6 37.4 59.8 22.9 13.4 78.0 3.3 236.42 9 46.1 27.7 38.0 68.6 28.4 12.2 83.3 3.5 162.02 10 47.9 22.6 34.3 55.2 17.9 14.4 90.2 3.8 293.62 11 48.3 16.3 32.3 44.6 10.2 15.0 101.1 4.2 317.02 12 48.2 16.1 31.7 48.7 12.6 13.8 73.6 3.1 346.32 13 56.0 16.3 35.8 49.3 16.6 15.8 87.1 3.6 327.52 14 53.7 24.0 38.8 51.8 21.2 16.9 101.7 4.2 332.22 15 43.1 22.2 33.1 79.9 27.5 13.4 83.2 3.5 213.02 16 35.9 32.2 33.3 100.7 33.2 0.12 11.3 108.1 4.5 133.82 17 45.8 28.0 37.0 81.2 31.2 0.01 12.4 72.1 3.0 284.72 18 47.9 25.9 36.6 71.4 27.6 0.02 20.0 83.0 3.5 303.12 19 47.3 20.6 33.5 61.8 20.0 15.6 84.2 3.5 378.82 20 46.1 17.1 31.5 57.0 16.5 12.7 62.1 2.6 316.62 21 56.0 18.1 36.4 51.6 18.0 0.01 26.9 109.5 4.6 345.22 22 59.4 27.1 43.4 47.7 22.1 29.5 159.7 6.7 378.92 23 56.5 24.3 41.0 66.7 29.0 22.1 113.0 4.7 373.52 24 64.4 24.4 44.0 55.0 26.8 0.03 29.5 139.9 5.8 362.72 25 46.8 29.3 40.7 29.7 11.7 0.03 40.4 379.3 15.8 117.22 26 40.7 20.6 30.9 28.3 0.9 35.4 221.0 9.2 392.42 27 37.3 13.2 26.3 32.3 ‐1.1 24.7 164.7 6.9 336.9
2 of 13
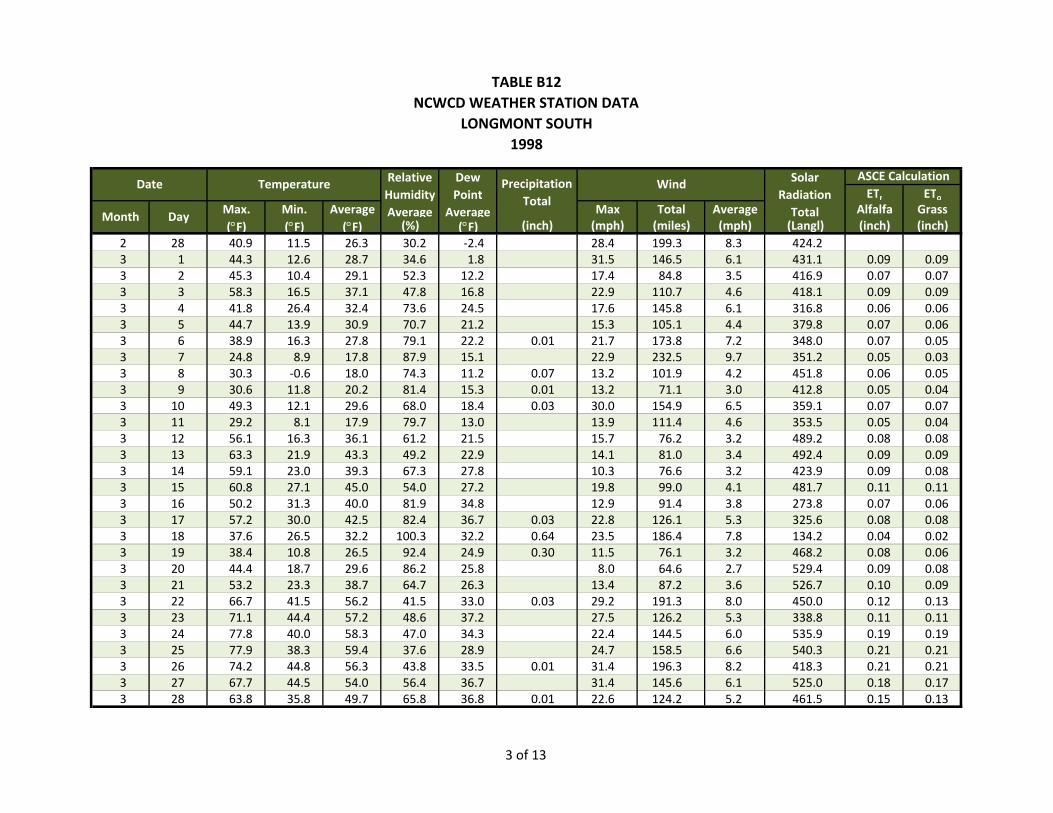
TABLE B12NCWCD WEATHER STATION DATA
LONGMONT SOUTH 1998
ETr EToMax. Min. Average Max Total Average Alfalfa Grass(°F) (°F) (°F) (%) (°F) (inch) (mph) (miles) (mph) (Langl) (inch) (inch)
Solar Radiation Total
ASCE Calculation
Month Day
Date Temperature Relative Humidity Average
Dew Point
Average
Precipitation Total
Wind
2 28 40.9 11.5 26.3 30.2 ‐2.4 28.4 199.3 8.3 424.23 1 44.3 12.6 28.7 34.6 1.8 31.5 146.5 6.1 431.1 0.09 0.093 2 45.3 10.4 29.1 52.3 12.2 17.4 84.8 3.5 416.9 0.07 0.073 3 58.3 16.5 37.1 47.8 16.8 22.9 110.7 4.6 418.1 0.09 0.093 4 41.8 26.4 32.4 73.6 24.5 17.6 145.8 6.1 316.8 0.06 0.063 5 44.7 13.9 30.9 70.7 21.2 15.3 105.1 4.4 379.8 0.07 0.063 6 38.9 16.3 27.8 79.1 22.2 0.01 21.7 173.8 7.2 348.0 0.07 0.053 7 24.8 8.9 17.8 87.9 15.1 22.9 232.5 9.7 351.2 0.05 0.033 8 30.3 ‐0.6 18.0 74.3 11.2 0.07 13.2 101.9 4.2 451.8 0.06 0.053 9 30.6 11.8 20.2 81.4 15.3 0.01 13.2 71.1 3.0 412.8 0.05 0.043 10 49.3 12.1 29.6 68.0 18.4 0.03 30.0 154.9 6.5 359.1 0.07 0.073 11 29.2 8.1 17.9 79.7 13.0 13.9 111.4 4.6 353.5 0.05 0.043 12 56.1 16.3 36.1 61.2 21.5 15.7 76.2 3.2 489.2 0.08 0.083 13 63.3 21.9 43.3 49.2 22.9 14.1 81.0 3.4 492.4 0.09 0.093 14 59.1 23.0 39.3 67.3 27.8 10.3 76.6 3.2 423.9 0.09 0.083 15 60.8 27.1 45.0 54.0 27.2 19.8 99.0 4.1 481.7 0.11 0.113 16 50.2 31.3 40.0 81.9 34.8 12.9 91.4 3.8 273.8 0.07 0.063 17 57.2 30.0 42.5 82.4 36.7 0.03 22.8 126.1 5.3 325.6 0.08 0.083 18 37.6 26.5 32.2 100.3 32.2 0.64 23.5 186.4 7.8 134.2 0.04 0.023 19 38.4 10.8 26.5 92.4 24.9 0.30 11.5 76.1 3.2 468.2 0.08 0.063 20 44.4 18.7 29.6 86.2 25.8 8.0 64.6 2.7 529.4 0.09 0.083 21 53.2 23.3 38.7 64.7 26.3 13.4 87.2 3.6 526.7 0.10 0.093 22 66.7 41.5 56.2 41.5 33.0 0.03 29.2 191.3 8.0 450.0 0.12 0.133 23 71.1 44.4 57.2 48.6 37.2 27.5 126.2 5.3 338.8 0.11 0.113 24 77.8 40.0 58.3 47.0 34.3 22.4 144.5 6.0 535.9 0.19 0.193 25 77.9 38.3 59.4 37.6 28.9 24.7 158.5 6.6 540.3 0.21 0.213 26 74.2 44.8 56.3 43.8 33.5 0.01 31.4 196.3 8.2 418.3 0.21 0.213 27 67.7 44.5 54.0 56.4 36.7 31.4 145.6 6.1 525.0 0.18 0.173 28 63.8 35.8 49.7 65.8 36.8 0.01 22.6 124.2 5.2 461.5 0.15 0.13
3 of 13
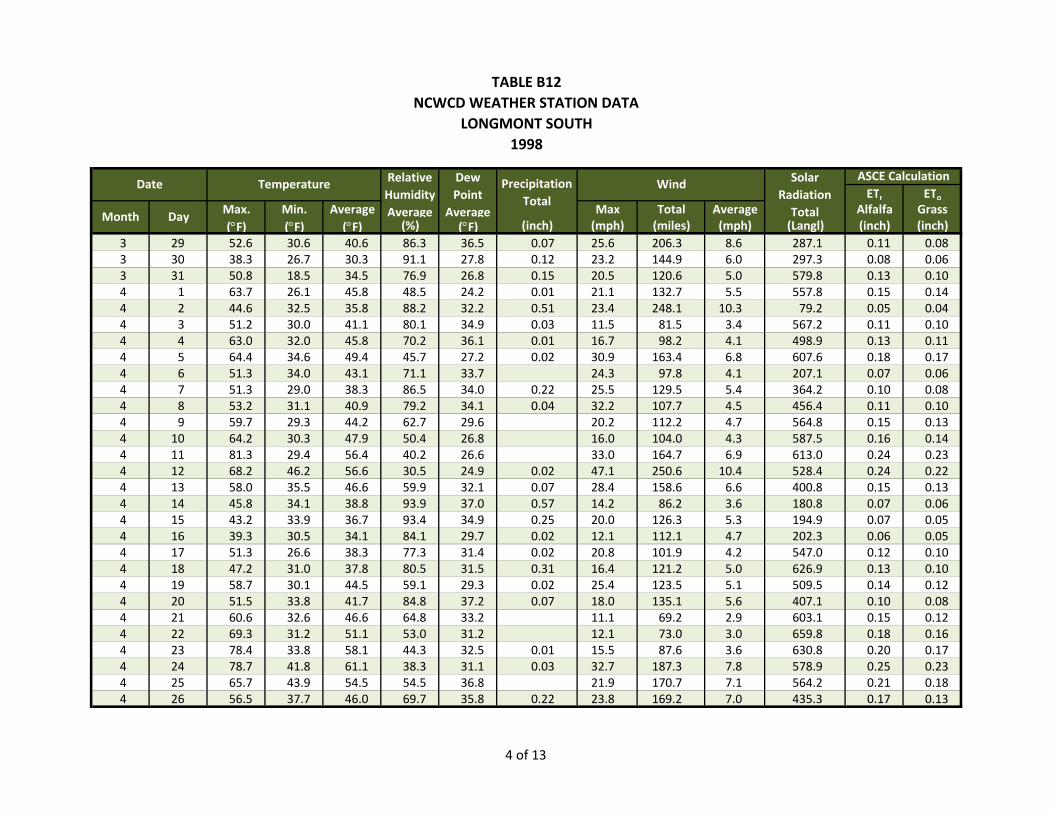
TABLE B12NCWCD WEATHER STATION DATA
LONGMONT SOUTH 1998
ETr EToMax. Min. Average Max Total Average Alfalfa Grass(°F) (°F) (°F) (%) (°F) (inch) (mph) (miles) (mph) (Langl) (inch) (inch)
Solar Radiation Total
ASCE Calculation
Month Day
Date Temperature Relative Humidity Average
Dew Point
Average
Precipitation Total
Wind
3 29 52.6 30.6 40.6 86.3 36.5 0.07 25.6 206.3 8.6 287.1 0.11 0.083 30 38.3 26.7 30.3 91.1 27.8 0.12 23.2 144.9 6.0 297.3 0.08 0.063 31 50.8 18.5 34.5 76.9 26.8 0.15 20.5 120.6 5.0 579.8 0.13 0.104 1 63.7 26.1 45.8 48.5 24.2 0.01 21.1 132.7 5.5 557.8 0.15 0.144 2 44.6 32.5 35.8 88.2 32.2 0.51 23.4 248.1 10.3 79.2 0.05 0.044 3 51.2 30.0 41.1 80.1 34.9 0.03 11.5 81.5 3.4 567.2 0.11 0.104 4 63.0 32.0 45.8 70.2 36.1 0.01 16.7 98.2 4.1 498.9 0.13 0.114 5 64.4 34.6 49.4 45.7 27.2 0.02 30.9 163.4 6.8 607.6 0.18 0.174 6 51.3 34.0 43.1 71.1 33.7 24.3 97.8 4.1 207.1 0.07 0.064 7 51.3 29.0 38.3 86.5 34.0 0.22 25.5 129.5 5.4 364.2 0.10 0.084 8 53.2 31.1 40.9 79.2 34.1 0.04 32.2 107.7 4.5 456.4 0.11 0.104 9 59.7 29.3 44.2 62.7 29.6 20.2 112.2 4.7 564.8 0.15 0.134 10 64.2 30.3 47.9 50.4 26.8 16.0 104.0 4.3 587.5 0.16 0.144 11 81.3 29.4 56.4 40.2 26.6 33.0 164.7 6.9 613.0 0.24 0.234 12 68.2 46.2 56.6 30.5 24.9 0.02 47.1 250.6 10.4 528.4 0.24 0.224 13 58.0 35.5 46.6 59.9 32.1 0.07 28.4 158.6 6.6 400.8 0.15 0.134 14 45.8 34.1 38.8 93.9 37.0 0.57 14.2 86.2 3.6 180.8 0.07 0.064 15 43.2 33.9 36.7 93.4 34.9 0.25 20.0 126.3 5.3 194.9 0.07 0.054 16 39.3 30.5 34.1 84.1 29.7 0.02 12.1 112.1 4.7 202.3 0.06 0.054 17 51.3 26.6 38.3 77.3 31.4 0.02 20.8 101.9 4.2 547.0 0.12 0.104 18 47.2 31.0 37.8 80.5 31.5 0.31 16.4 121.2 5.0 626.9 0.13 0.104 19 58.7 30.1 44.5 59.1 29.3 0.02 25.4 123.5 5.1 509.5 0.14 0.124 20 51.5 33.8 41.7 84.8 37.2 0.07 18.0 135.1 5.6 407.1 0.10 0.084 21 60.6 32.6 46.6 64.8 33.2 11.1 69.2 2.9 603.1 0.15 0.124 22 69.3 31.2 51.1 53.0 31.2 12.1 73.0 3.0 659.8 0.18 0.164 23 78.4 33.8 58.1 44.3 32.5 0.01 15.5 87.6 3.6 630.8 0.20 0.174 24 78.7 41.8 61.1 38.3 31.1 0.03 32.7 187.3 7.8 578.9 0.25 0.234 25 65.7 43.9 54.5 54.5 36.8 21.9 170.7 7.1 564.2 0.21 0.184 26 56.5 37.7 46.0 69.7 35.8 0.22 23.8 169.2 7.0 435.3 0.17 0.13
4 of 13

TABLE B12NCWCD WEATHER STATION DATA
LONGMONT SOUTH 1998
ETr EToMax. Min. Average Max Total Average Alfalfa Grass(°F) (°F) (°F) (%) (°F) (inch) (mph) (miles) (mph) (Langl) (inch) (inch)
Solar Radiation Total
ASCE Calculation
Month Day
Date Temperature Relative Humidity Average
Dew Point
Average
Precipitation Total
Wind
4 27 60.1 32.2 46.9 63.4 33.4 0.01 21.3 140.6 5.9 634.2 0.20 0.164 28 61.8 37.3 49.0 58.9 33.0 21.2 99.4 4.1 667.2 0.19 0.164 29 68.9 28.8 51.4 45.4 28.1 15.1 73.9 3.1 681.2 0.20 0.174 30 73.5 36.7 57.1 43.1 31.7 0.02 45.6 182.2 7.6 494.6 0.21 0.195 1 69.8 40.3 55.0 51.0 36.3 30.9 114.2 4.8 482.6 0.18 0.155 2 67.6 37.8 53.4 60.6 38.7 17.2 78.9 3.3 621.1 0.19 0.165 3 79.2 37.9 57.9 51.5 38.0 25.1 127.4 5.3 634.3 0.25 0.215 4 76.7 39.5 59.7 51.4 38.5 0.01 28.9 189.6 7.9 597.4 0.25 0.225 5 68.6 44.4 55.2 72.6 45.4 0.15 24.3 130.9 5.5 568.5 0.20 0.165 6 64.6 40.0 50.8 78.7 44.0 0.13 27.5 163.3 6.8 331.7 0.15 0.125 7 68.2 46.0 53.3 71.2 43.5 0.04 23.2 163.7 6.8 601.1 0.22 0.185 8 58.5 41.5 48.4 86.5 44.3 0.16 30.5 168.2 7.0 338.6 0.12 0.095 9 63.6 33.9 49.5 79.8 42.8 0.01 16.3 98.8 4.1 561.7 0.16 0.135 10 76.8 39.7 58.6 66.0 45.1 0.01 18.7 116.8 4.9 647.9 0.22 0.185 11 70.8 46.8 57.8 67.5 45.6 0.03 26.4 136.9 5.7 571.0 0.20 0.165 12 69.3 38.6 54.7 71.0 44.1 0.01 19.6 99.3 4.1 585.2 0.19 0.155 13 86.7 41.0 63.7 47.2 37.5 0.06 32.8 139.1 5.8 690.0 0.31 0.265 14 72.2 42.8 57.2 56.2 40.9 0.01 32.2 171.4 7.1 497.0 0.22 0.185 15 71.6 43.8 58.5 38.3 30.3 34.3 259.7 10.8 737.0 0.34 0.275 16 78.3 38.0 60.1 43.2 35.4 16.4 127.4 5.3 700.0 0.28 0.235 17 85.4 42.1 66.3 30.7 29.2 25.6 143.2 6.0 722.0 0.32 0.265 18 83.6 45.8 68.6 31.0 34.5 0.01 27.5 110.0 4.6 480.1 0.24 0.195 19 84.5 42.0 65.9 40.7 38.3 30.1 98.4 4.1 631.0 0.27 0.225 20 80.7 46.2 64.6 58.9 48.6 26.5 110.8 4.6 478.9 0.23 0.185 21 82.2 50.7 66.5 57.0 48.7 27.7 138.4 5.8 570.8 0.26 0.215 22 64.6 48.4 55.9 85.7 51.5 0.10 19.7 130.3 5.4 334.1 0.14 0.115 23 72.8 42.6 57.2 61.0 41.2 0.01 22.6 130.9 5.5 616.4 0.25 0.205 24 71.7 42.8 56.2 65.5 44.1 20.1 104.1 4.3 510.3 0.20 0.165 25 73.2 40.2 58.6 64.4 44.8 18.9 107.7 4.5 623.9 0.22 0.17
5 of 13
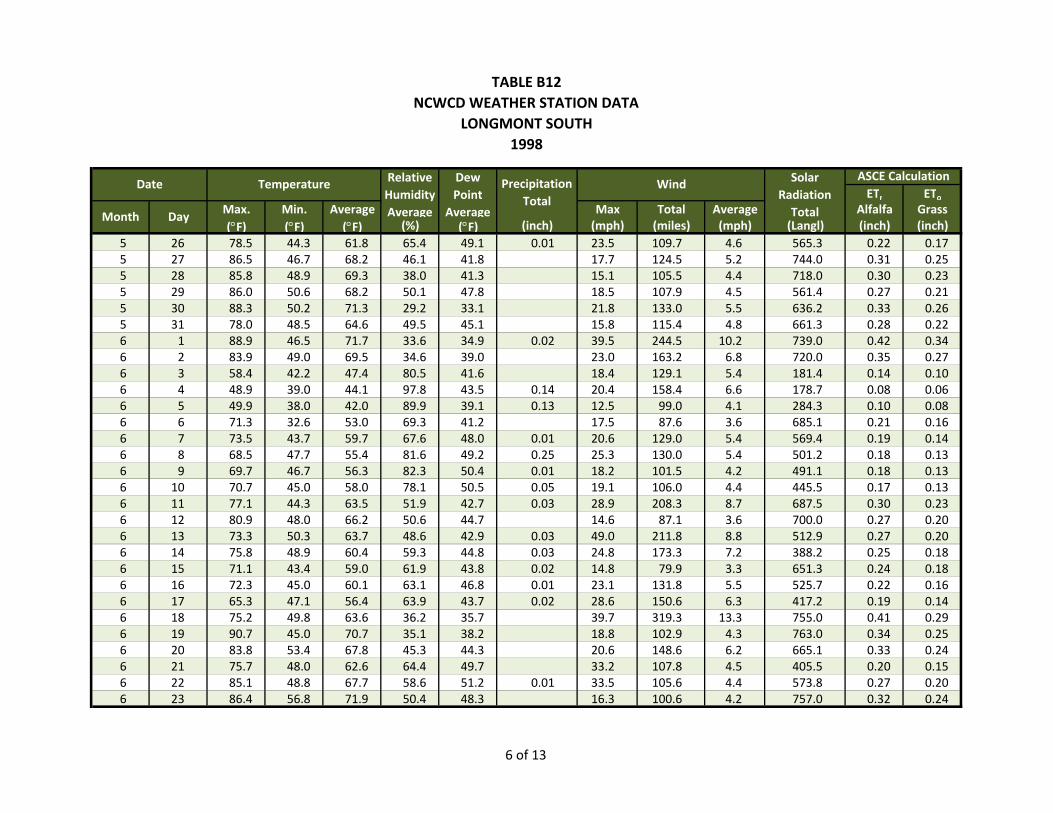
TABLE B12NCWCD WEATHER STATION DATA
LONGMONT SOUTH 1998
ETr EToMax. Min. Average Max Total Average Alfalfa Grass(°F) (°F) (°F) (%) (°F) (inch) (mph) (miles) (mph) (Langl) (inch) (inch)
Solar Radiation Total
ASCE Calculation
Month Day
Date Temperature Relative Humidity Average
Dew Point
Average
Precipitation Total
Wind
5 26 78.5 44.3 61.8 65.4 49.1 0.01 23.5 109.7 4.6 565.3 0.22 0.175 27 86.5 46.7 68.2 46.1 41.8 17.7 124.5 5.2 744.0 0.31 0.255 28 85.8 48.9 69.3 38.0 41.3 15.1 105.5 4.4 718.0 0.30 0.235 29 86.0 50.6 68.2 50.1 47.8 18.5 107.9 4.5 561.4 0.27 0.215 30 88.3 50.2 71.3 29.2 33.1 21.8 133.0 5.5 636.2 0.33 0.265 31 78.0 48.5 64.6 49.5 45.1 15.8 115.4 4.8 661.3 0.28 0.226 1 88.9 46.5 71.7 33.6 34.9 0.02 39.5 244.5 10.2 739.0 0.42 0.346 2 83.9 49.0 69.5 34.6 39.0 23.0 163.2 6.8 720.0 0.35 0.276 3 58.4 42.2 47.4 80.5 41.6 18.4 129.1 5.4 181.4 0.14 0.106 4 48.9 39.0 44.1 97.8 43.5 0.14 20.4 158.4 6.6 178.7 0.08 0.066 5 49.9 38.0 42.0 89.9 39.1 0.13 12.5 99.0 4.1 284.3 0.10 0.086 6 71.3 32.6 53.0 69.3 41.2 17.5 87.6 3.6 685.1 0.21 0.166 7 73.5 43.7 59.7 67.6 48.0 0.01 20.6 129.0 5.4 569.4 0.19 0.146 8 68.5 47.7 55.4 81.6 49.2 0.25 25.3 130.0 5.4 501.2 0.18 0.136 9 69.7 46.7 56.3 82.3 50.4 0.01 18.2 101.5 4.2 491.1 0.18 0.136 10 70.7 45.0 58.0 78.1 50.5 0.05 19.1 106.0 4.4 445.5 0.17 0.136 11 77.1 44.3 63.5 51.9 42.7 0.03 28.9 208.3 8.7 687.5 0.30 0.236 12 80.9 48.0 66.2 50.6 44.7 14.6 87.1 3.6 700.0 0.27 0.206 13 73.3 50.3 63.7 48.6 42.9 0.03 49.0 211.8 8.8 512.9 0.27 0.206 14 75.8 48.9 60.4 59.3 44.8 0.03 24.8 173.3 7.2 388.2 0.25 0.186 15 71.1 43.4 59.0 61.9 43.8 0.02 14.8 79.9 3.3 651.3 0.24 0.186 16 72.3 45.0 60.1 63.1 46.8 0.01 23.1 131.8 5.5 525.7 0.22 0.166 17 65.3 47.1 56.4 63.9 43.7 0.02 28.6 150.6 6.3 417.2 0.19 0.146 18 75.2 49.8 63.6 36.2 35.7 39.7 319.3 13.3 755.0 0.41 0.296 19 90.7 45.0 70.7 35.1 38.2 18.8 102.9 4.3 763.0 0.34 0.256 20 83.8 53.4 67.8 45.3 44.3 20.6 148.6 6.2 665.1 0.33 0.246 21 75.7 48.0 62.6 64.4 49.7 33.2 107.8 4.5 405.5 0.20 0.156 22 85.1 48.8 67.7 58.6 51.2 0.01 33.5 105.6 4.4 573.8 0.27 0.206 23 86.4 56.8 71.9 50.4 48.3 16.3 100.6 4.2 757.0 0.32 0.24
6 of 13

TABLE B12NCWCD WEATHER STATION DATA
LONGMONT SOUTH 1998
ETr EToMax. Min. Average Max Total Average Alfalfa Grass(°F) (°F) (°F) (%) (°F) (inch) (mph) (miles) (mph) (Langl) (inch) (inch)
Solar Radiation Total
ASCE Calculation
Month Day
Date Temperature Relative Humidity Average
Dew Point
Average
Precipitation Total
Wind
6 24 88.8 51.6 71.8 29.0 31.9 32.2 210.2 8.8 758.0 0.44 0.336 25 93.7 47.4 72.4 31.3 37.9 13.1 86.5 3.6 755.0 0.36 0.266 26 94.2 49.9 76.5 26.3 35.8 0.01 29.5 188.9 7.9 765.1 0.44 0.346 27 90.0 50.7 73.7 38.1 45.0 18.3 106.7 4.4 744.0 0.35 0.266 28 91.3 50.6 73.3 43.1 48.7 12.1 83.9 3.5 749.0 0.34 0.256 29 90.5 58.0 75.5 44.4 50.3 14.4 89.7 3.7 745.0 0.34 0.256 30 85.6 58.9 71.1 60.8 56.4 11.3 83.1 3.5 569.7 0.27 0.207 1 85.0 58.9 71.5 68.4 59.9 17.6 152.4 6.3 708.0 0.31 0.247 2 88.9 59.1 73.5 65.1 59.6 21.8 101.4 4.2 701.0 0.30 0.237 3 82.0 59.5 70.3 62.2 56.1 19.8 113.8 4.7 499.8 0.25 0.197 4 80.0 52.6 68.6 68.7 57.5 18.9 96.9 4.0 457.3 0.21 0.167 5 93.1 52.4 75.2 57.4 55.2 13.9 82.4 3.4 699.4 0.31 0.237 6 76.6 61.7 69.5 68.1 58.4 0.01 18.6 98.1 4.1 211.7 0.14 0.107 7 86.6 53.7 70.4 64.1 56.3 25.3 93.3 3.9 506.3 0.25 0.197 8 80.7 58.5 69.5 75.8 61.1 14.0 96.7 4.0 461.2 0.20 0.167 9 81.2 59.1 68.9 79.3 61.8 22.2 101.6 4.2 493.0 0.21 0.167 10 83.5 56.4 70.2 73.4 60.3 19.8 85.8 3.6 600.4 0.24 0.197 11 91.2 55.3 74.5 53.1 53.6 0.01 30.0 103.9 4.3 643.9 0.30 0.237 12 97.5 58.1 79.2 38.3 49.1 17.4 100.0 4.2 696.7 0.34 0.257 13 96.3 56.6 79.7 36.5 47.3 19.2 102.6 4.3 731.0 0.35 0.277 14 94.5 57.7 77.7 38.3 48.6 27.8 110.0 4.6 589.8 0.33 0.257 15 89.8 55.4 73.2 50.1 52.6 23.8 129.4 5.4 596.5 0.33 0.257 16 87.4 52.9 71.6 60.4 55.4 14.4 98.1 4.1 723.0 0.32 0.257 17 93.9 55.9 77.7 41.9 49.6 15.6 93.2 3.9 733.0 0.33 0.267 18 100.8 56.8 81.2 37.0 48.5 13.4 87.3 3.6 734.0 0.35 0.267 19 99.5 62.6 82.7 32.9 47.9 17.3 116.9 4.9 663.1 0.36 0.277 20 99.4 63.5 82.9 31.3 45.8 10.9 87.8 3.7 728.0 0.36 0.277 21 88.7 61.5 73.8 52.1 55.0 29.4 129.5 5.4 432.4 0.29 0.227 22 77.9 59.8 67.1 84.7 62.1 0.16 20.0 119.0 5.0 361.1 0.19 0.15
7 of 13
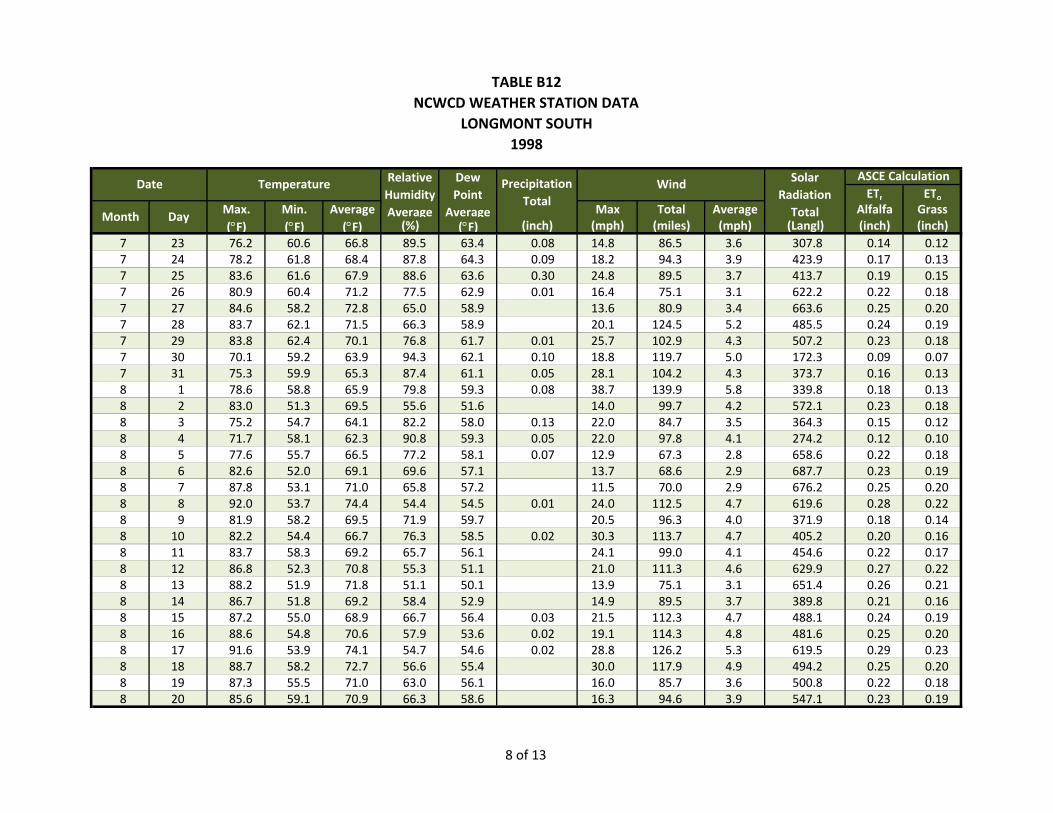
TABLE B12NCWCD WEATHER STATION DATA
LONGMONT SOUTH 1998
ETr EToMax. Min. Average Max Total Average Alfalfa Grass(°F) (°F) (°F) (%) (°F) (inch) (mph) (miles) (mph) (Langl) (inch) (inch)
Solar Radiation Total
ASCE Calculation
Month Day
Date Temperature Relative Humidity Average
Dew Point
Average
Precipitation Total
Wind
7 23 76.2 60.6 66.8 89.5 63.4 0.08 14.8 86.5 3.6 307.8 0.14 0.127 24 78.2 61.8 68.4 87.8 64.3 0.09 18.2 94.3 3.9 423.9 0.17 0.137 25 83.6 61.6 67.9 88.6 63.6 0.30 24.8 89.5 3.7 413.7 0.19 0.157 26 80.9 60.4 71.2 77.5 62.9 0.01 16.4 75.1 3.1 622.2 0.22 0.187 27 84.6 58.2 72.8 65.0 58.9 13.6 80.9 3.4 663.6 0.25 0.207 28 83.7 62.1 71.5 66.3 58.9 20.1 124.5 5.2 485.5 0.24 0.197 29 83.8 62.4 70.1 76.8 61.7 0.01 25.7 102.9 4.3 507.2 0.23 0.187 30 70.1 59.2 63.9 94.3 62.1 0.10 18.8 119.7 5.0 172.3 0.09 0.077 31 75.3 59.9 65.3 87.4 61.1 0.05 28.1 104.2 4.3 373.7 0.16 0.138 1 78.6 58.8 65.9 79.8 59.3 0.08 38.7 139.9 5.8 339.8 0.18 0.138 2 83.0 51.3 69.5 55.6 51.6 14.0 99.7 4.2 572.1 0.23 0.188 3 75.2 54.7 64.1 82.2 58.0 0.13 22.0 84.7 3.5 364.3 0.15 0.128 4 71.7 58.1 62.3 90.8 59.3 0.05 22.0 97.8 4.1 274.2 0.12 0.108 5 77.6 55.7 66.5 77.2 58.1 0.07 12.9 67.3 2.8 658.6 0.22 0.188 6 82.6 52.0 69.1 69.6 57.1 13.7 68.6 2.9 687.7 0.23 0.198 7 87.8 53.1 71.0 65.8 57.2 11.5 70.0 2.9 676.2 0.25 0.208 8 92.0 53.7 74.4 54.4 54.5 0.01 24.0 112.5 4.7 619.6 0.28 0.228 9 81.9 58.2 69.5 71.9 59.7 20.5 96.3 4.0 371.9 0.18 0.148 10 82.2 54.4 66.7 76.3 58.5 0.02 30.3 113.7 4.7 405.2 0.20 0.168 11 83.7 58.3 69.2 65.7 56.1 24.1 99.0 4.1 454.6 0.22 0.178 12 86.8 52.3 70.8 55.3 51.1 21.0 111.3 4.6 629.9 0.27 0.228 13 88.2 51.9 71.8 51.1 50.1 13.9 75.1 3.1 651.4 0.26 0.218 14 86.7 51.8 69.2 58.4 52.9 14.9 89.5 3.7 389.8 0.21 0.168 15 87.2 55.0 68.9 66.7 56.4 0.03 21.5 112.3 4.7 488.1 0.24 0.198 16 88.6 54.8 70.6 57.9 53.6 0.02 19.1 114.3 4.8 481.6 0.25 0.208 17 91.6 53.9 74.1 54.7 54.6 0.02 28.8 126.2 5.3 619.5 0.29 0.238 18 88.7 58.2 72.7 56.6 55.4 30.0 117.9 4.9 494.2 0.25 0.208 19 87.3 55.5 71.0 63.0 56.1 16.0 85.7 3.6 500.8 0.22 0.188 20 85.6 59.1 70.9 66.3 58.6 16.3 94.6 3.9 547.1 0.23 0.19
8 of 13

TABLE B12NCWCD WEATHER STATION DATA
LONGMONT SOUTH 1998
ETr EToMax. Min. Average Max Total Average Alfalfa Grass(°F) (°F) (°F) (%) (°F) (inch) (mph) (miles) (mph) (Langl) (inch) (inch)
Solar Radiation Total
ASCE Calculation
Month Day
Date Temperature Relative Humidity Average
Dew Point
Average
Precipitation Total
Wind
8 21 84.9 56.8 70.1 69.4 58.7 15.1 85.5 3.6 488.6 0.21 0.178 22 91.8 52.5 72.8 60.0 55.3 0.03 38.4 82.8 3.5 574.6 0.25 0.208 23 92.6 55.6 76.3 48.4 52.6 16.7 101.7 4.2 630.1 0.27 0.238 24 91.0 59.8 73.4 55.5 54.4 25.1 125.1 5.2 531.0 0.28 0.238 25 80.7 54.6 67.4 71.9 57.2 11.9 78.8 3.3 256.0 0.14 0.128 26 88.7 55.0 72.4 62.6 57.0 13.4 78.0 3.3 604.1 0.24 0.208 27 86.2 57.5 72.6 50.6 52.1 18.2 112.3 4.7 512.1 0.24 0.208 28 85.7 48.4 69.0 44.5 43.3 12.7 71.2 3.0 637.7 0.25 0.218 29 90.5 47.9 70.9 45.1 46.0 14.1 76.7 3.2 616.1 0.26 0.218 30 94.1 57.2 75.3 42.3 47.9 0.01 22.5 85.4 3.6 607.5 0.26 0.228 31 81.3 56.4 68.1 62.4 54.4 0.50 26.5 115.4 4.8 379.8 0.19 0.169 1 78.8 56.2 66.7 69.3 55.0 0.01 13.5 105.4 4.4 508.7 0.21 0.189 2 85.7 50.3 69.3 57.5 51.3 0.01 12.3 74.6 3.1 608.4 0.23 0.209 3 92.7 58.2 75.4 38.8 46.5 10.7 69.3 2.9 609.6 0.24 0.209 4 95.2 52.3 73.8 47.4 48.8 15.3 75.8 3.2 584.7 0.25 0.219 5 93.0 52.8 73.7 47.2 50.4 13.2 62.9 2.6 600.8 0.24 0.209 6 92.1 52.6 74.1 45.3 48.5 13.6 86.4 3.6 593.5 0.26 0.229 7 83.0 56.2 69.2 73.2 59.6 13.4 75.8 3.2 563.6 0.21 0.189 8 87.7 54.7 70.3 70.5 58.7 0.03 29.7 78.2 3.3 555.5 0.22 0.199 9 90.8 55.2 71.8 56.8 53.3 15.4 88.5 3.7 480.8 0.22 0.199 10 91.0 52.8 72.7 48.5 49.6 18.9 102.8 4.3 527.3 0.24 0.209 11 89.0 55.5 72.7 48.9 50.9 16.5 101.5 4.2 544.6 0.24 0.209 12 80.6 56.2 65.4 72.3 55.9 0.08 28.2 105.7 4.4 276.8 0.16 0.149 13 76.8 48.8 61.3 78.4 53.7 0.01 20.2 85.9 3.6 333.1 0.15 0.139 14 76.3 47.1 62.3 72.7 51.8 13.1 74.3 3.1 486.8 0.17 0.159 15 79.8 48.6 64.6 67.4 51.7 18.6 64.5 2.7 543.2 0.18 0.159 16 83.3 47.1 65.2 60.9 49.7 10.9 62.1 2.6 520.1 0.18 0.159 17 86.5 49.4 68.5 48.7 45.9 10.1 70.2 2.9 536.7 0.19 0.179 18 89.5 50.1 70.3 45.1 44.8 14.4 64.1 2.7 492.0 0.18 0.16
9 of 13

TABLE B12NCWCD WEATHER STATION DATA
LONGMONT SOUTH 1998
ETr EToMax. Min. Average Max Total Average Alfalfa Grass(°F) (°F) (°F) (%) (°F) (inch) (mph) (miles) (mph) (Langl) (inch) (inch)
Solar Radiation Total
ASCE Calculation
Month Day
Date Temperature Relative Humidity Average
Dew Point
Average
Precipitation Total
Wind
9 19 83.1 54.7 69.9 37.7 41.6 0.02 28.7 154.7 6.4 500.7 0.25 0.219 20 77.9 45.7 61.5 68.0 50.0 0.02 21.9 147.7 6.2 434.3 0.20 0.179 21 55.2 46.0 48.6 98.4 48.1 0.02 18.3 140.0 5.8 68.2 0.07 0.059 22 65.3 45.6 52.9 88.0 49.0 0.01 9.7 61.2 2.5 344.8 0.11 0.109 23 71.1 46.2 58.9 80.8 52.2 13.8 68.4 2.9 310.8 0.09 0.089 24 81.4 44.7 63.0 68.0 50.0 0.01 12.0 71.2 3.0 504.1 0.15 0.139 25 85.0 44.3 65.8 50.8 45.0 0.01 23.8 118.6 4.9 506.5 0.20 0.189 26 80.2 50.3 66.8 34.0 36.5 0.01 22.7 149.8 6.2 513.8 0.23 0.209 27 77.8 44.8 60.6 54.5 43.0 9.9 80.7 3.4 512.3 0.19 0.169 28 86.5 39.9 64.7 46.8 40.9 11.2 78.4 3.3 476.9 0.18 0.169 29 77.3 52.0 64.0 54.8 46.9 18.8 81.6 3.4 188.3 0.11 0.109 30 67.0 48.4 57.8 67.5 46.6 21.9 128.0 5.3 400.8 0.15 0.1210 1 55.4 44.2 50.5 88.1 47.0 0.04 13.9 100.7 4.2 114.7 0.06 0.0510 2 64.5 44.1 49.5 95.7 48.2 0.06 14.2 88.1 3.7 214.7 0.09 0.0710 3 52.1 44.6 47.1 97.4 46.1 0.04 17.9 107.6 4.5 112.5 0.04 0.0310 4 60.1 42.0 48.2 79.2 41.2 0.21 34.9 153.9 6.4 371.3 0.12 0.1010 5 55.5 37.8 45.3 60.3 30.8 24.2 133.1 5.5 270.8 0.11 0.0910 6 64.1 30.6 49.2 49.3 29.1 13.5 111.8 4.7 472.1 0.14 0.1210 7 71.8 34.1 52.3 55.6 34.3 11.4 63.8 2.7 471.0 0.13 0.1110 8 78.1 38.8 57.8 54.6 38.4 9.7 64.6 2.7 419.9 0.12 0.1010 9 76.6 40.5 59.3 42.6 33.5 14.3 109.0 4.5 454.6 0.16 0.1510 10 71.8 36.7 56.2 45.6 34.0 17.8 87.3 3.6 408.2 0.13 0.1210 11 66.7 42.5 53.9 36.5 26.7 22.6 170.2 7.1 454.4 0.20 0.1710 12 66.5 31.3 47.1 58.0 31.6 10.8 64.2 2.7 326.6 0.11 0.1010 13 76.4 32.5 52.7 52.8 33.4 12.2 71.4 3.0 336.3 0.12 0.1110 14 74.7 40.4 58.8 51.2 39.5 17.9 113.8 4.7 392.3 0.13 0.1210 15 68.2 39.4 53.7 68.8 43.0 10.5 65.0 2.7 389.6 0.10 0.0910 16 55.0 40.6 47.6 93.5 46.1 0.05 31.6 124.6 5.2 89.4 0.04 0.0310 17 52.1 32.0 42.2 75.8 34.5 20.2 111.1 4.6 186.8 0.08 0.06
10 of 13
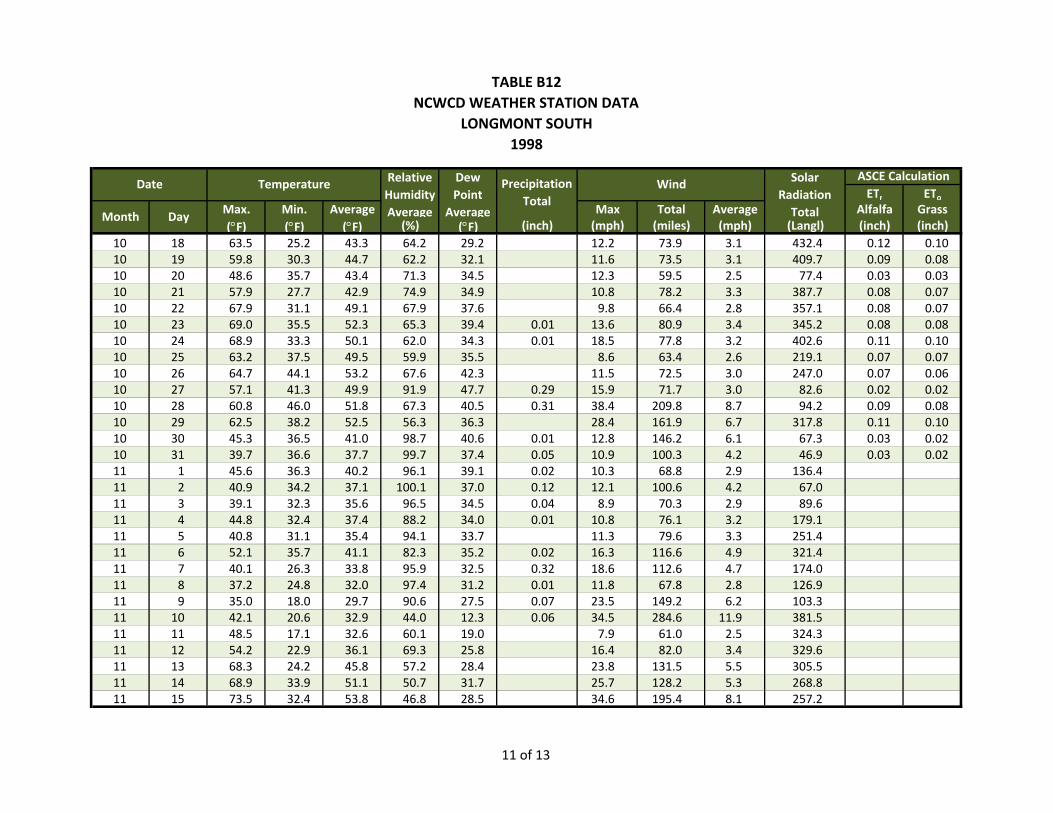
TABLE B12NCWCD WEATHER STATION DATA
LONGMONT SOUTH 1998
ETr EToMax. Min. Average Max Total Average Alfalfa Grass(°F) (°F) (°F) (%) (°F) (inch) (mph) (miles) (mph) (Langl) (inch) (inch)
Solar Radiation Total
ASCE Calculation
Month Day
Date Temperature Relative Humidity Average
Dew Point
Average
Precipitation Total
Wind
10 18 63.5 25.2 43.3 64.2 29.2 12.2 73.9 3.1 432.4 0.12 0.1010 19 59.8 30.3 44.7 62.2 32.1 11.6 73.5 3.1 409.7 0.09 0.0810 20 48.6 35.7 43.4 71.3 34.5 12.3 59.5 2.5 77.4 0.03 0.0310 21 57.9 27.7 42.9 74.9 34.9 10.8 78.2 3.3 387.7 0.08 0.0710 22 67.9 31.1 49.1 67.9 37.6 9.8 66.4 2.8 357.1 0.08 0.0710 23 69.0 35.5 52.3 65.3 39.4 0.01 13.6 80.9 3.4 345.2 0.08 0.0810 24 68.9 33.3 50.1 62.0 34.3 0.01 18.5 77.8 3.2 402.6 0.11 0.1010 25 63.2 37.5 49.5 59.9 35.5 8.6 63.4 2.6 219.1 0.07 0.0710 26 64.7 44.1 53.2 67.6 42.3 11.5 72.5 3.0 247.0 0.07 0.0610 27 57.1 41.3 49.9 91.9 47.7 0.29 15.9 71.7 3.0 82.6 0.02 0.0210 28 60.8 46.0 51.8 67.3 40.5 0.31 38.4 209.8 8.7 94.2 0.09 0.0810 29 62.5 38.2 52.5 56.3 36.3 28.4 161.9 6.7 317.8 0.11 0.1010 30 45.3 36.5 41.0 98.7 40.6 0.01 12.8 146.2 6.1 67.3 0.03 0.0210 31 39.7 36.6 37.7 99.7 37.4 0.05 10.9 100.3 4.2 46.9 0.03 0.0211 1 45.6 36.3 40.2 96.1 39.1 0.02 10.3 68.8 2.9 136.411 2 40.9 34.2 37.1 100.1 37.0 0.12 12.1 100.6 4.2 67.011 3 39.1 32.3 35.6 96.5 34.5 0.04 8.9 70.3 2.9 89.611 4 44.8 32.4 37.4 88.2 34.0 0.01 10.8 76.1 3.2 179.111 5 40.8 31.1 35.4 94.1 33.7 11.3 79.6 3.3 251.411 6 52.1 35.7 41.1 82.3 35.2 0.02 16.3 116.6 4.9 321.411 7 40.1 26.3 33.8 95.9 32.5 0.32 18.6 112.6 4.7 174.011 8 37.2 24.8 32.0 97.4 31.2 0.01 11.8 67.8 2.8 126.911 9 35.0 18.0 29.7 90.6 27.5 0.07 23.5 149.2 6.2 103.311 10 42.1 20.6 32.9 44.0 12.3 0.06 34.5 284.6 11.9 381.511 11 48.5 17.1 32.6 60.1 19.0 7.9 61.0 2.5 324.311 12 54.2 22.9 36.1 69.3 25.8 16.4 82.0 3.4 329.611 13 68.3 24.2 45.8 57.2 28.4 23.8 131.5 5.5 305.511 14 68.9 33.9 51.1 50.7 31.7 25.7 128.2 5.3 268.811 15 73.5 32.4 53.8 46.8 28.5 34.6 195.4 8.1 257.2
11 of 13

TABLE B12NCWCD WEATHER STATION DATA
LONGMONT SOUTH 1998
ETr EToMax. Min. Average Max Total Average Alfalfa Grass(°F) (°F) (°F) (%) (°F) (inch) (mph) (miles) (mph) (Langl) (inch) (inch)
Solar Radiation Total
ASCE Calculation
Month Day
Date Temperature Relative Humidity Average
Dew Point
Average
Precipitation Total
Wind
11 16 60.4 31.5 45.3 55.9 29.8 14.1 95.4 4.0 239.411 17 55.4 31.1 41.7 64.2 29.9 29.6 91.4 3.8 178.911 18 56.4 31.0 45.8 40.6 21.2 0.02 44.3 318.9 13.3 271.311 19 48.6 30.0 36.3 71.1 27.0 20.5 98.1 4.1 234.211 20 55.6 19.3 34.4 56.8 18.4 10.2 76.3 3.2 270.611 21 66.6 23.8 53.6 28.9 21.8 0.01 33.4 182.3 7.6 198.011 22 73.6 49.2 62.3 23.0 23.5 0.01 38.3 243.0 10.1 268.211 23 58.7 30.9 45.4 42.8 22.6 15.3 86.5 3.6 255.311 24 70.1 25.8 52.3 32.4 17.7 40.0 260.0 10.8 265.711 25 61.2 32.9 48.4 39.2 23.0 27.1 139.9 5.8 113.911 26 69.2 28.2 46.6 56.6 30.1 10.7 71.6 3.0 257.711 27 71.3 30.4 48.8 52.7 30.5 9.2 77.6 3.2 246.311 28 59.1 33.6 45.0 52.2 27.7 12.9 72.5 3.0 144.011 29 65.2 35.2 51.9 43.3 29.4 26.7 165.6 6.9 154.111 30 66.5 30.4 49.5 41.9 25.4 25.3 120.7 5.0 259.612 1 67.7 29.4 46.2 49.3 26.3 10.2 72.7 3.0 246.612 2 70.8 29.7 47.5 47.0 25.2 20.8 107.6 4.5 249.112 3 66.3 27.8 45.5 45.5 23.4 13.7 72.2 3.0 242.312 4 61.1 24.4 42.8 52.5 25.2 16.9 97.3 4.1 212.612 5 41.1 21.0 30.9 68.8 20.9 20.2 95.8 4.0 198.712 6 35.9 18.9 26.5 84.8 22.3 11.6 70.1 2.9 190.112 7 39.0 13.7 25.3 58.7 11.6 12.5 90.1 3.8 216.212 8 38.0 9.1 24.7 61.0 12.3 8.5 58.0 2.4 121.112 9 31.0 19.0 26.4 89.4 23.7 0.20 21.4 161.4 6.7 79.312 10 27.4 2.3 14.0 94.1 13.6 0.02 5.1 48.4 2.0 226.912 11 40.9 3.9 22.1 80.4 17.0 9.5 61.1 2.5 237.412 12 39.9 14.0 26.1 77.3 20.1 12.0 72.8 3.0 151.212 13 50.1 13.8 29.6 68.6 19.9 8.3 54.0 2.3 240.612 14 59.6 20.4 36.6 58.5 22.5 10.3 66.7 2.8 242.2
12 of 13
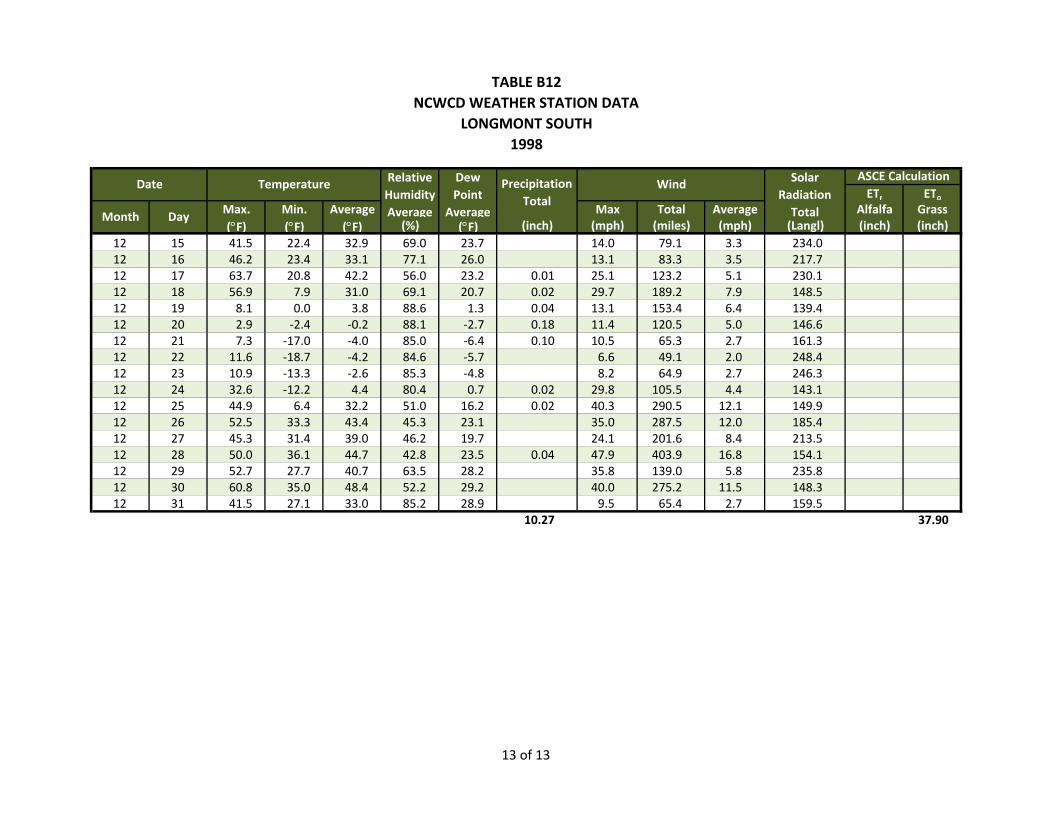
TABLE B12NCWCD WEATHER STATION DATA
LONGMONT SOUTH 1998
ETr EToMax. Min. Average Max Total Average Alfalfa Grass(°F) (°F) (°F) (%) (°F) (inch) (mph) (miles) (mph) (Langl) (inch) (inch)
Solar Radiation Total
ASCE Calculation
Month Day
Date Temperature Relative Humidity Average
Dew Point
Average
Precipitation Total
Wind
12 15 41.5 22.4 32.9 69.0 23.7 14.0 79.1 3.3 234.012 16 46.2 23.4 33.1 77.1 26.0 13.1 83.3 3.5 217.712 17 63.7 20.8 42.2 56.0 23.2 0.01 25.1 123.2 5.1 230.112 18 56.9 7.9 31.0 69.1 20.7 0.02 29.7 189.2 7.9 148.512 19 8.1 0.0 3.8 88.6 1.3 0.04 13.1 153.4 6.4 139.412 20 2.9 ‐2.4 ‐0.2 88.1 ‐2.7 0.18 11.4 120.5 5.0 146.612 21 7.3 ‐17.0 ‐4.0 85.0 ‐6.4 0.10 10.5 65.3 2.7 161.312 22 11.6 ‐18.7 ‐4.2 84.6 ‐5.7 6.6 49.1 2.0 248.412 23 10.9 ‐13.3 ‐2.6 85.3 ‐4.8 8.2 64.9 2.7 246.312 24 32.6 ‐12.2 4.4 80.4 0.7 0.02 29.8 105.5 4.4 143.112 25 44.9 6.4 32.2 51.0 16.2 0.02 40.3 290.5 12.1 149.912 26 52.5 33.3 43.4 45.3 23.1 35.0 287.5 12.0 185.412 27 45.3 31.4 39.0 46.2 19.7 24.1 201.6 8.4 213.512 28 50.0 36.1 44.7 42.8 23.5 0.04 47.9 403.9 16.8 154.112 29 52.7 27.7 40.7 63.5 28.2 35.8 139.0 5.8 235.812 30 60.8 35.0 48.4 52.2 29.2 40.0 275.2 11.5 148.312 31 41.5 27.1 33.0 85.2 28.9 9.5 65.4 2.7 159.5
10.27 37.90
13 of 13

Raw Water Irrigation System Master Plan March 2010
C
Appendix C: Irrigation Demands
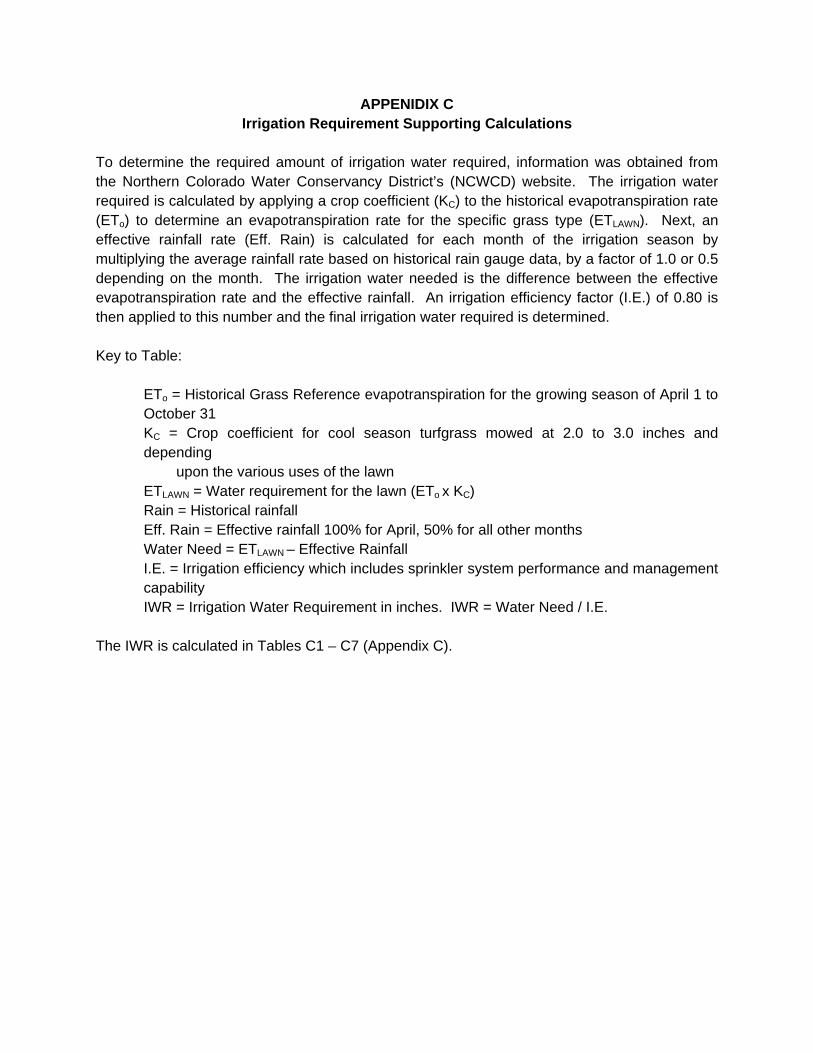
APPENIDIX C Irrigation Requirement Supporting Calculations
To determine the required amount of irrigation water required, information was obtained from the Northern Colorado Water Conservancy District’s (NCWCD) website. The irrigation water required is calculated by applying a crop coefficient (KC) to the historical evapotranspiration rate (ETo) to determine an evapotranspiration rate for the specific grass type (ETLAWN). Next, an effective rainfall rate (Eff. Rain) is calculated for each month of the irrigation season by multiplying the average rainfall rate based on historical rain gauge data, by a factor of 1.0 or 0.5 depending on the month. The irrigation water needed is the difference between the effective evapotranspiration rate and the effective rainfall. An irrigation efficiency factor (I.E.) of 0.80 is then applied to this number and the final irrigation water required is determined. Key to Table: ETo = Historical Grass Reference evapotranspiration for the growing season of April 1 to October 31
KC = Crop coefficient for cool season turfgrass mowed at 2.0 to 3.0 inches and depending
upon the various uses of the lawn ETLAWN = Water requirement for the lawn (ETo x KC) Rain = Historical rainfall Eff. Rain = Effective rainfall 100% for April, 50% for all other months Water Need = ETLAWN – Effective Rainfall I.E. = Irrigation efficiency which includes sprinkler system performance and management capability IWR = Irrigation Water Requirement in inches. IWR = Water Need / I.E. The IWR is calculated in Tables C1 – C7 (Appendix C).
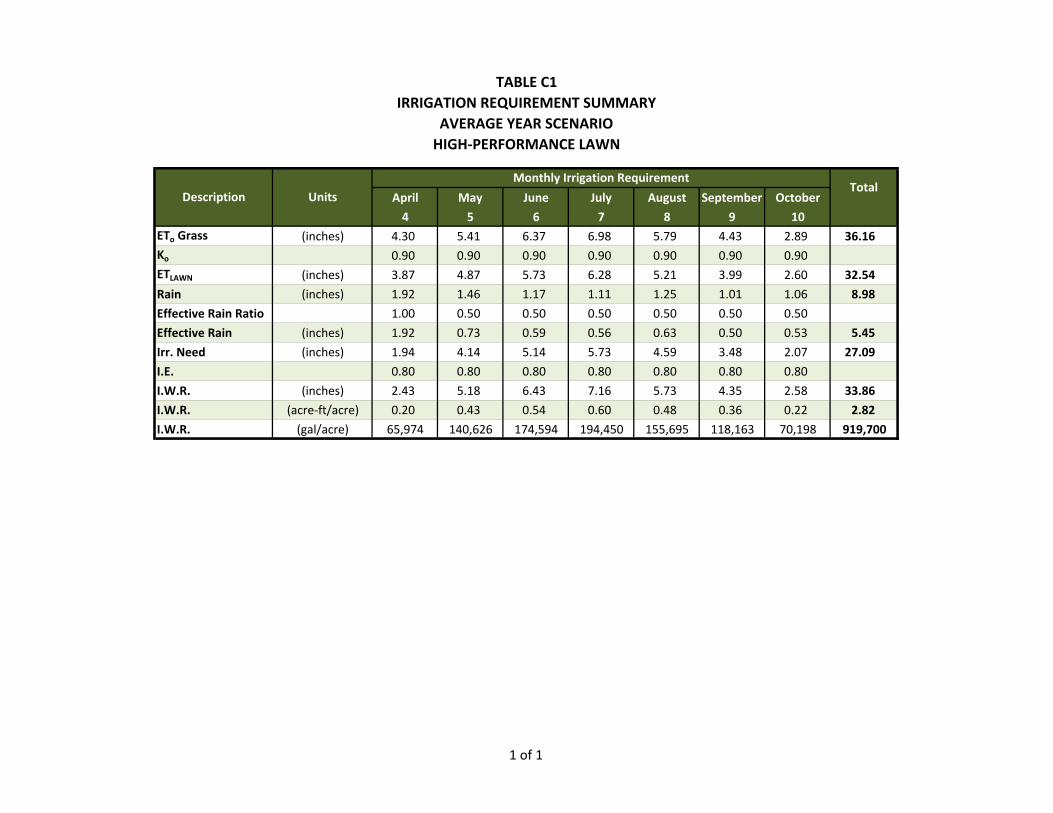
TABLE C1IRRIGATION REQUIREMENT SUMMARY
AVERAGE YEAR SCENARIOHIGH‐PERFORMANCE LAWN
April May June July August September October
4 5 6 7 8 9 10ETo Grass (inches) 4.30 5.41 6.37 6.98 5.79 4.43 2.89 36.16Ko 0.90 0.90 0.90 0.90 0.90 0.90 0.90ETLAWN (inches) 3.87 4.87 5.73 6.28 5.21 3.99 2.60 32.54
Rain (inches) 1.92 1.46 1.17 1.11 1.25 1.01 1.06 8.98
Effective Rain Ratio 1.00 0.50 0.50 0.50 0.50 0.50 0.50
Effective Rain (inches) 1.92 0.73 0.59 0.56 0.63 0.50 0.53 5.45
Irr. Need (inches) 1.94 4.14 5.14 5.73 4.59 3.48 2.07 27.09
I.E. 0.80 0.80 0.80 0.80 0.80 0.80 0.80
I.W.R. (inches) 2.43 5.18 6.43 7.16 5.73 4.35 2.58 33.86
I.W.R. (acre‐ft/acre) 0.20 0.43 0.54 0.60 0.48 0.36 0.22 2.82
I.W.R. (gal/acre) 65,974 140,626 174,594 194,450 155,695 118,163 70,198 919,700
Monthly Irrigation RequirementTotal
Description Units
1 of 1

TABLE C2IRRIGATION REQUIREMENT SUMMARY
AVERAGE YEAR SCENARIOTRADITIONAL LAWN
April May June July August September October
4 5 6 7 8 9 10ETo Grass (inches) 4.30 5.41 6.37 6.98 5.79 4.43 2.89 36.16Ko 0.81 0.81 0.81 0.81 0.81 0.81 0.81ETLAWN (inches) 3.48 4.38 5.16 5.65 4.69 3.59 2.34 29.29
Rain (inches) 1.92 1.46 1.17 1.11 1.25 1.01 1.06 8.98
Effective Rain Ratio 1.00 0.50 0.50 0.50 0.50 0.50 0.50
Effective Rain (inches) 1.92 0.73 0.59 0.56 0.63 0.50 0.53 5.45
Irr. Need (inches) 1.56 3.66 4.57 5.10 4.07 3.08 1.81 23.84
I.E. 0.80 0.80 0.80 0.80 0.80 0.80 0.80
I.W.R. (inches) 1.95 4.57 5.71 6.37 5.08 3.85 2.26 29.80
I.W.R. (acre‐ft/acre) 0.16 0.38 0.48 0.53 0.42 0.32 0.19 2.48
I.W.R. (gal/acre) 52,849 124,094 155,147 173,121 137,999 104,634 61,377 809,220
DescriptionMonthly Irrigation Requirement
TotalUnits
1 of 1
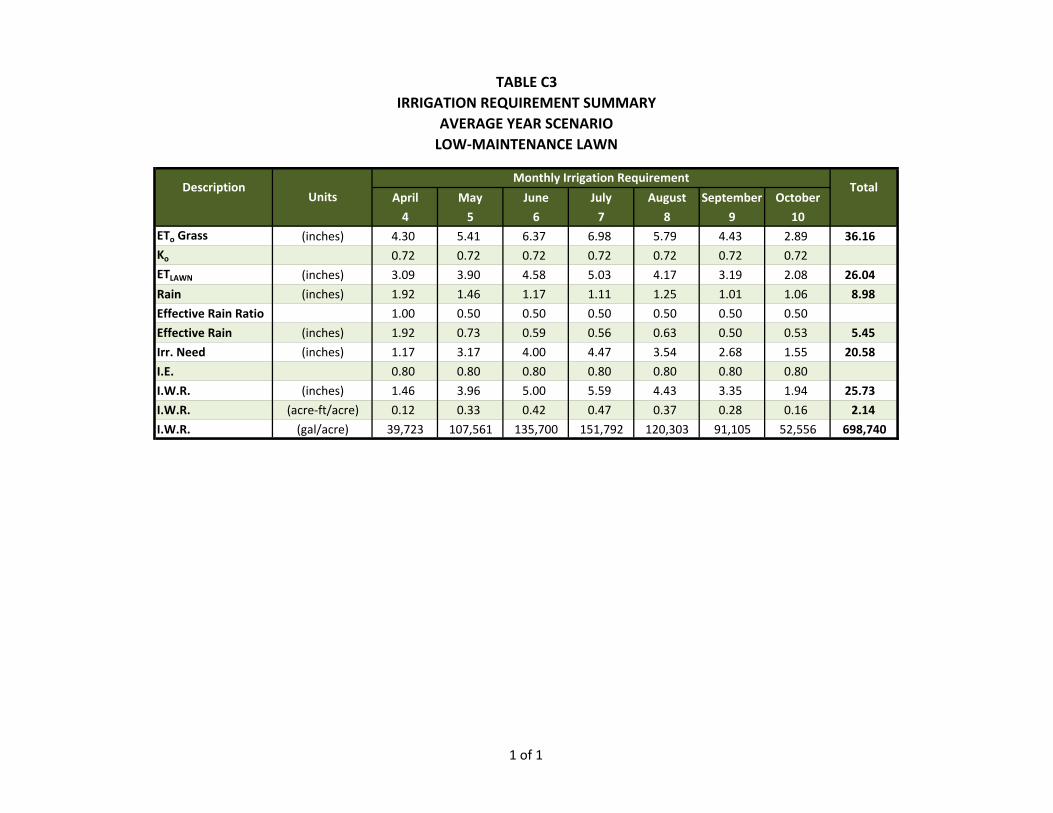
TABLE C3IRRIGATION REQUIREMENT SUMMARY
AVERAGE YEAR SCENARIOLOW‐MAINTENANCE LAWN
April May June July August September October
4 5 6 7 8 9 10ETo Grass (inches) 4.30 5.41 6.37 6.98 5.79 4.43 2.89 36.16Ko 0.72 0.72 0.72 0.72 0.72 0.72 0.72ETLAWN (inches) 3.09 3.90 4.58 5.03 4.17 3.19 2.08 26.04
Rain (inches) 1.92 1.46 1.17 1.11 1.25 1.01 1.06 8.98
Effective Rain Ratio 1.00 0.50 0.50 0.50 0.50 0.50 0.50
Effective Rain (inches) 1.92 0.73 0.59 0.56 0.63 0.50 0.53 5.45
Irr. Need (inches) 1.17 3.17 4.00 4.47 3.54 2.68 1.55 20.58
I.E. 0.80 0.80 0.80 0.80 0.80 0.80 0.80
I.W.R. (inches) 1.46 3.96 5.00 5.59 4.43 3.35 1.94 25.73
I.W.R. (acre‐ft/acre) 0.12 0.33 0.42 0.47 0.37 0.28 0.16 2.14
I.W.R. (gal/acre) 39,723 107,561 135,700 151,792 120,303 91,105 52,556 698,740
DescriptionMonthly Irrigation Requirement
TotalUnits
1 of 1
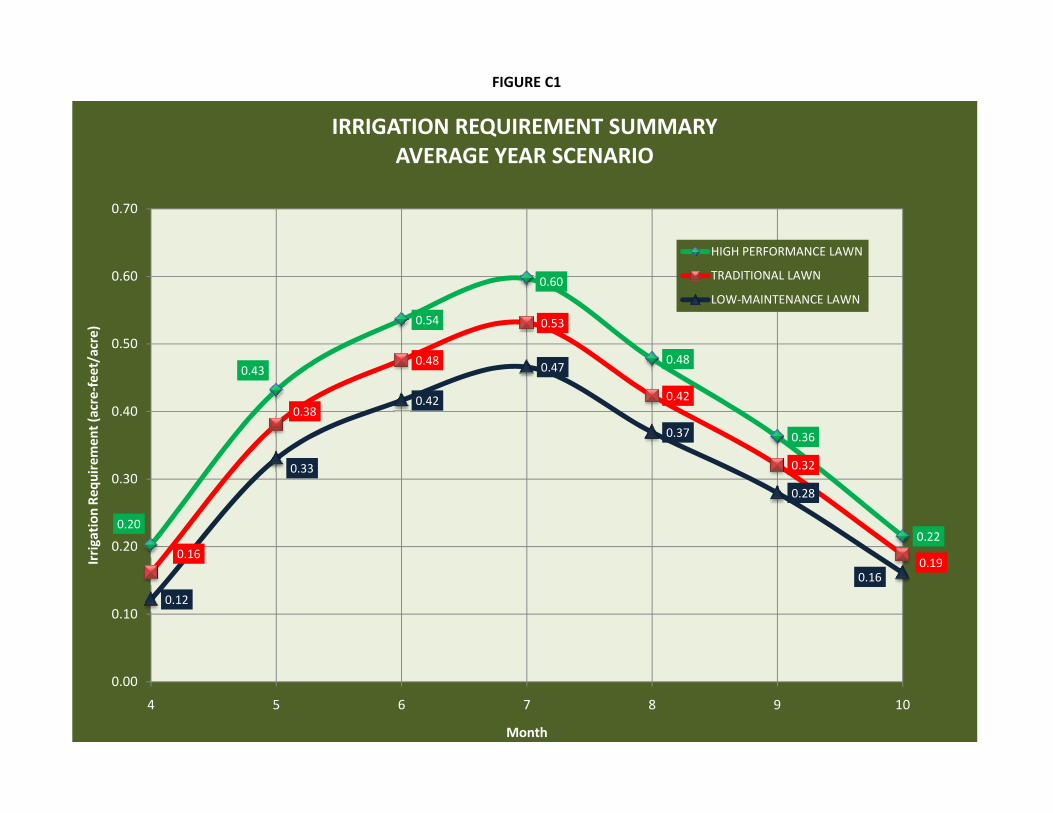
FIGURE C1
0.43
0.54
0.60
0.48
0.36
0.38
0.48
0.53
0.42
0.320.33
0.42
0.47
0.37
0 30
0.40
0.50
0.60
0.70
uiremen
t (acre‐feet/acre)
IRRIGATION REQUIREMENT SUMMARYAVERAGE YEAR SCENARIO
HIGH PERFORMANCE LAWN
TRADITIONAL LAWN
LOW‐MAINTENANCE LAWN
0.200.22
0.160.19
0.12
0.28
0.16
0.00
0.10
0.20
0.30
4 5 6 7 8 9 10
Irrigation
Req
u
Month

TABLE C4IRRIGATION REQUIREMENT SUMMARY
DROUGHT YEAR SCENARIOHIGH‐PERFORMANCE LAWN
April May June July August September October
4 5 6 7 8 9 10ETo Grass (2002) (inches) 5.14 5.18 7.01 7.94 6.41 4.65 2.54 38.87Ko 0.90 0.90 0.90 0.90 0.90 0.90 0.90ETLAWN (inches) 4.63 4.66 6.31 7.15 5.77 4.19 2.29 34.98
Rain (2002) (inches) 0.21 2.18 0.94 0.04 0.63 0.97 1.04 6.01
Effective Rain Ratio 1.00 0.50 0.50 0.50 0.50 0.50 0.50
Effective Rain (inches) 0.21 1.09 0.47 0.02 0.32 0.49 0.52 3.11
Irr. Need (inches) 4.42 3.57 5.84 7.13 5.45 3.70 1.77 31.87
I.E. 0.80 0.80 0.80 0.80 0.80 0.80 0.80
I.W.R. (inches) 5.52 4.47 7.30 8.91 6.82 4.63 2.21 39.84
I.W.R. (acre‐ft/acre) 0.46 0.37 0.61 0.74 0.57 0.39 0.18 3.32
I.W.R. (gal/acre) 149,914 121,262 198,222 241,913 185,152 125,607 59,952 1,082,022
DescriptionMonthly Irrigation Requirement
TotalUnits
1 of 1

TABLE C5IRRIGATION REQUIREMENT SUMMARY
DROUGHT YEAR SCENARIOTRADITIONAL LAWN
April May June July August September October
4 5 6 7 8 9 10ETo Grass (2002) (inches) 5.14 5.18 7.01 7.94 6.41 4.65 2.54 38.87Ko 0.81 0.81 0.81 0.81 0.81 0.81 0.81ETLAWN (inches) 4.16 4.20 5.68 6.43 5.19 3.77 2.06 31.48
Rain (2002) (inches) 0.21 2.18 0.94 0.04 0.63 0.97 1.04 6.01
Effective Rain Ratio 1.00 0.50 0.50 0.50 0.50 0.50 0.50
Effective Rain (inches) 0.21 1.09 0.47 0.02 0.32 0.49 0.52 3.11
Irr. Need (inches) 3.95 3.11 5.21 6.41 4.88 3.28 1.54 28.37
I.E. 0.80 0.80 0.80 0.80 0.80 0.80 0.80
I.W.R. (inches) 4.94 3.88 6.51 8.01 6.10 4.10 1.92 35.47
I.W.R. (acre‐ft/acre) 0.41 0.32 0.54 0.67 0.51 0.34 0.16 2.96
I.W.R. (gal/acre) 134,210 105,435 176,804 217,654 165,567 111,400 52,192 963,262
DescriptionMonthly Irrigation Requirement
TotalUnits
1 of 1
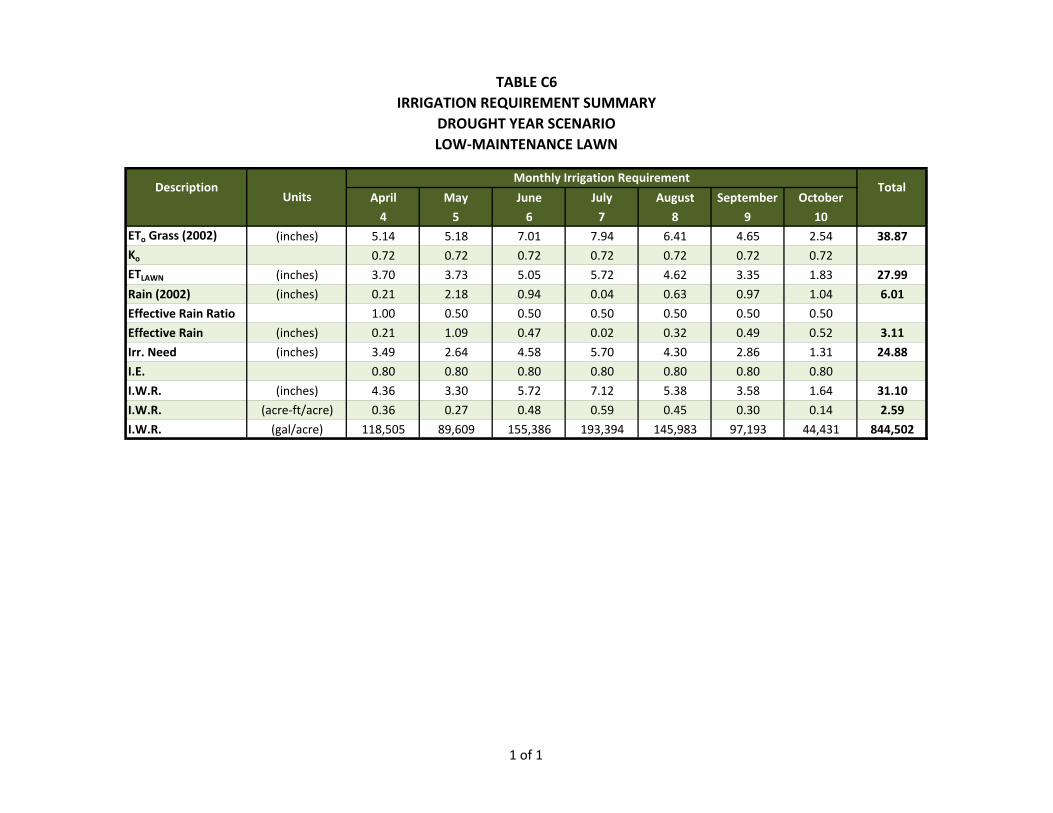
TABLE C6IRRIGATION REQUIREMENT SUMMARY
DROUGHT YEAR SCENARIOLOW‐MAINTENANCE LAWN
April May June July August September October
4 5 6 7 8 9 10ETo Grass (2002) (inches) 5.14 5.18 7.01 7.94 6.41 4.65 2.54 38.87Ko 0.72 0.72 0.72 0.72 0.72 0.72 0.72ETLAWN (inches) 3.70 3.73 5.05 5.72 4.62 3.35 1.83 27.99
Rain (2002) (inches) 0.21 2.18 0.94 0.04 0.63 0.97 1.04 6.01
Effective Rain Ratio 1.00 0.50 0.50 0.50 0.50 0.50 0.50
Effective Rain (inches) 0.21 1.09 0.47 0.02 0.32 0.49 0.52 3.11
Irr. Need (inches) 3.49 2.64 4.58 5.70 4.30 2.86 1.31 24.88
I.E. 0.80 0.80 0.80 0.80 0.80 0.80 0.80
I.W.R. (inches) 4.36 3.30 5.72 7.12 5.38 3.58 1.64 31.10
I.W.R. (acre‐ft/acre) 0.36 0.27 0.48 0.59 0.45 0.30 0.14 2.59
I.W.R. (gal/acre) 118,505 89,609 155,386 193,394 145,983 97,193 44,431 844,502
DescriptionMonthly Irrigation Requirement
TotalUnits
1 of 1
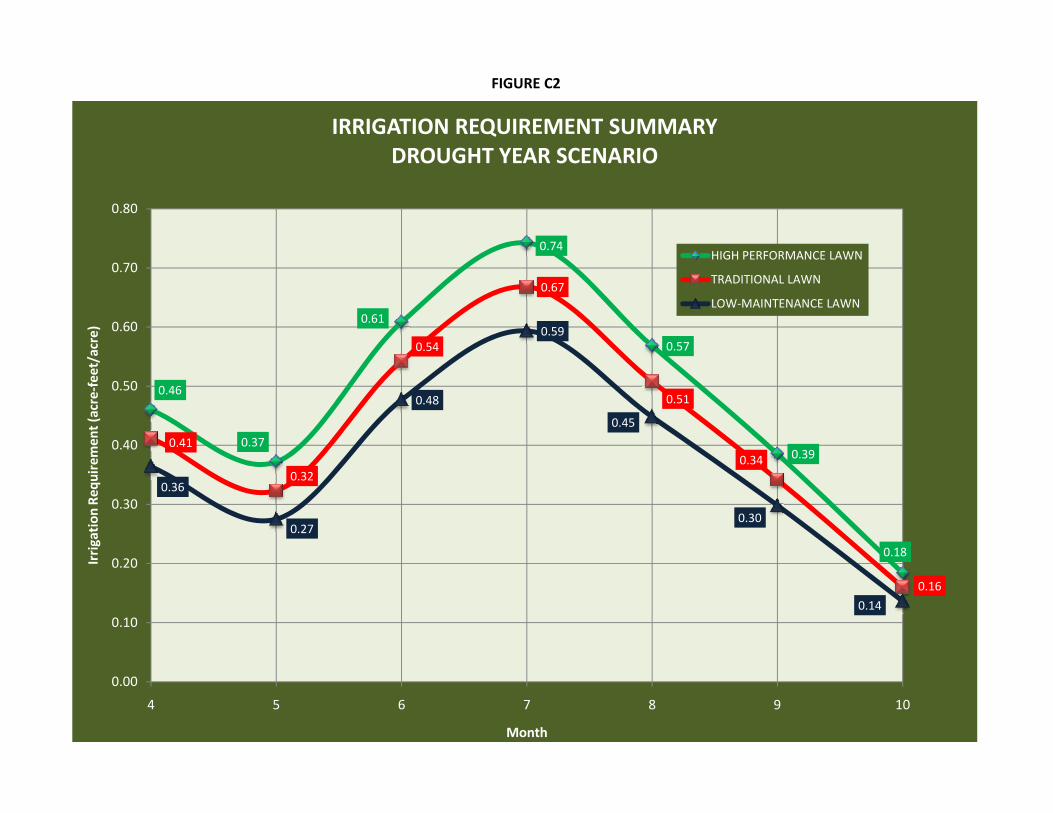
FIGURE C2
0.46
0.37
0.61
0.74
0.57
0.390.41
0 32
0.54
0.67
0.51
0.34
0.48
0.59
0.45
0.40
0.50
0.60
0.70
0.80
uiremen
t (acre‐feet/acre)
IRRIGATION REQUIREMENT SUMMARYDROUGHT YEAR SCENARIO
HIGH PERFORMANCE LAWN
TRADITIONAL LAWN
LOW‐MAINTENANCE LAWN
0.18
0.32
0.16
0.36
0.270.30
0.14
0.00
0.10
0.20
0.30
4 5 6 7 8 9 10
Irrigation
Req
u
Month
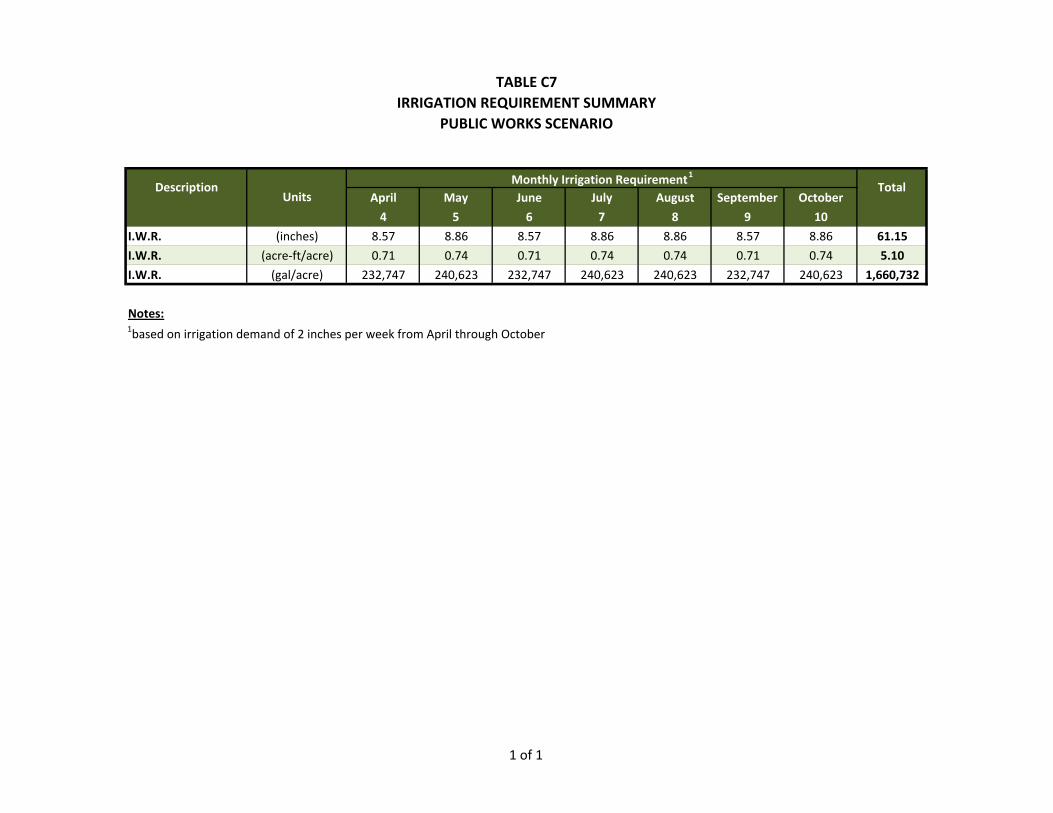
TABLE C7IRRIGATION REQUIREMENT SUMMARY
PUBLIC WORKS SCENARIO
April May June July August September October
4 5 6 7 8 9 10
I.W.R. (inches) 8.57 8.86 8.57 8.86 8.86 8.57 8.86 61.15
I.W.R. (acre‐ft/acre) 0.71 0.74 0.71 0.74 0.74 0.71 0.74 5.10
I.W.R. (gal/acre) 232,747 240,623 232,747 240,623 240,623 232,747 240,623 1,660,732
Notes:1based on irrigation demand of 2 inches per week from April through October
DescriptionMonthly Irrigation Requirement1
TotalUnits
1 of 1

FIGURE C3
0.71
0.740.71 0.74
0.74
0.71 0.74
0.50
0.60
0.70
0.80
0.90
1.00
uiremen
t (acre‐feet/acre)
IRRIGATION REQUIREMENT SUMMARYPUBLIC WORKS SCENARIO
ALL LAWN TYPES
0.00
0.10
0.20
0.30
0.40
4 5 6 7 8 9 10
Irrigation
Req
u
Month

TABLE C8IRRIGATION DEMANDPRIORITY 1 PARKS
April May June July August September October
4 5 6 7 8 9 10
(acres) (acre‐ft) (acre‐ft) (acre‐ft) (acre‐ft) (acre‐ft) (acre‐ft) (acre‐ft) (acre‐ft)
PA‐1 AISIK'S MEADOW PARK 1 2.9 0.5 1.1 1.4 1.6 1.2 0.9 0.6 7.3
1 23.0 3.7 8.8 11.0 12.2 9.7 7.4 4.3 57.1
1 67.0 10.9 25.5 31.9 35.6 28.4 21.5 12.6 166.4
PA‐6 FIRESTONE SPORTS COMPLEX 1 13.9 2.3 5.3 6.6 7.4 5.9 4.5 2.6 34.5
TOTAL 17.3 40.7 50.9 56.8 45.2 34.3 20.1 265.3
Notes:1based on a traditional lawn
PA‐4 FIRESTONE CENTRAL PARK
TotalPark I.D. Park Description PriorityIrrigated Area
Average Year Scenario1
1 of 3
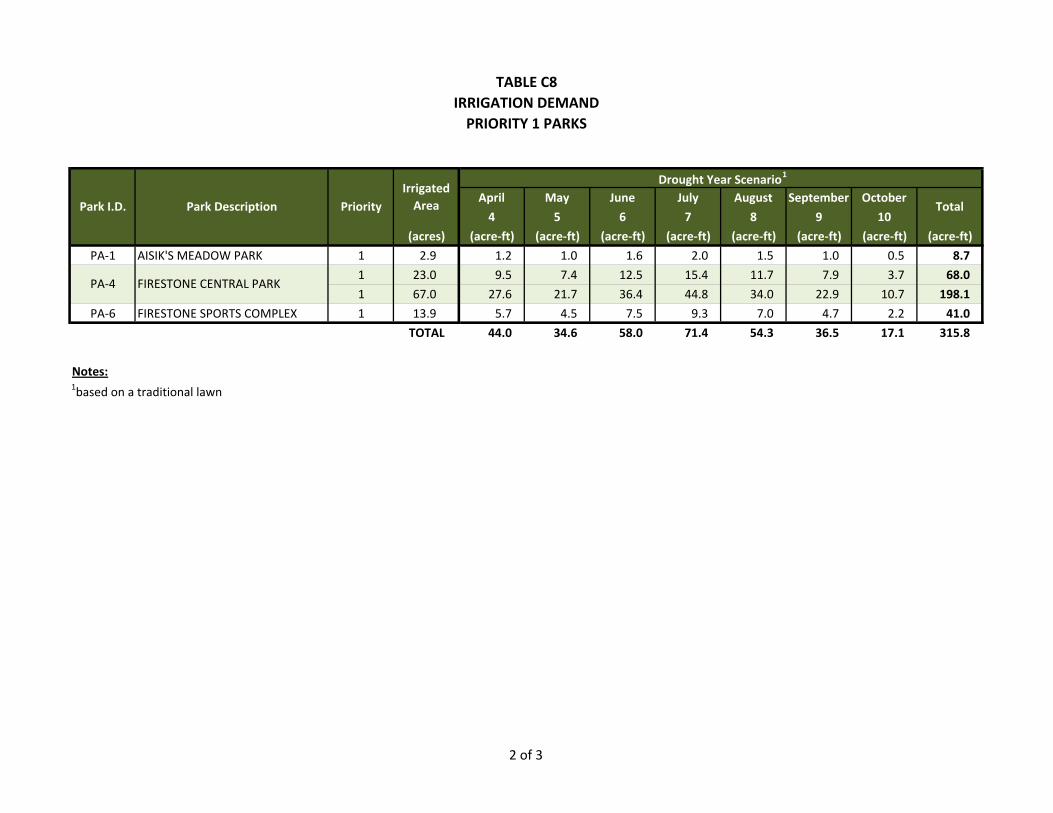
TABLE C8IRRIGATION DEMANDPRIORITY 1 PARKS
(acres)
PA‐1 AISIK'S MEADOW PARK 1 2.9
1 23.0
1 67.0
PA‐6 FIRESTONE SPORTS COMPLEX 1 13.9
TOTAL
Notes:1based on a traditional lawn
PA‐4 FIRESTONE CENTRAL PARK
Park I.D. Park Description PriorityIrrigated Area
April May June July August September October
4 5 6 7 8 9 10
(acre‐ft) (acre‐ft) (acre‐ft) (acre‐ft) (acre‐ft) (acre‐ft) (acre‐ft) (acre‐ft)
1.2 1.0 1.6 2.0 1.5 1.0 0.5 8.7
9.5 7.4 12.5 15.4 11.7 7.9 3.7 68.0
27.6 21.7 36.4 44.8 34.0 22.9 10.7 198.1
5.7 4.5 7.5 9.3 7.0 4.7 2.2 41.0
44.0 34.6 58.0 71.4 54.3 36.5 17.1 315.8
Drought Year Scenario1
Total
2 of 3
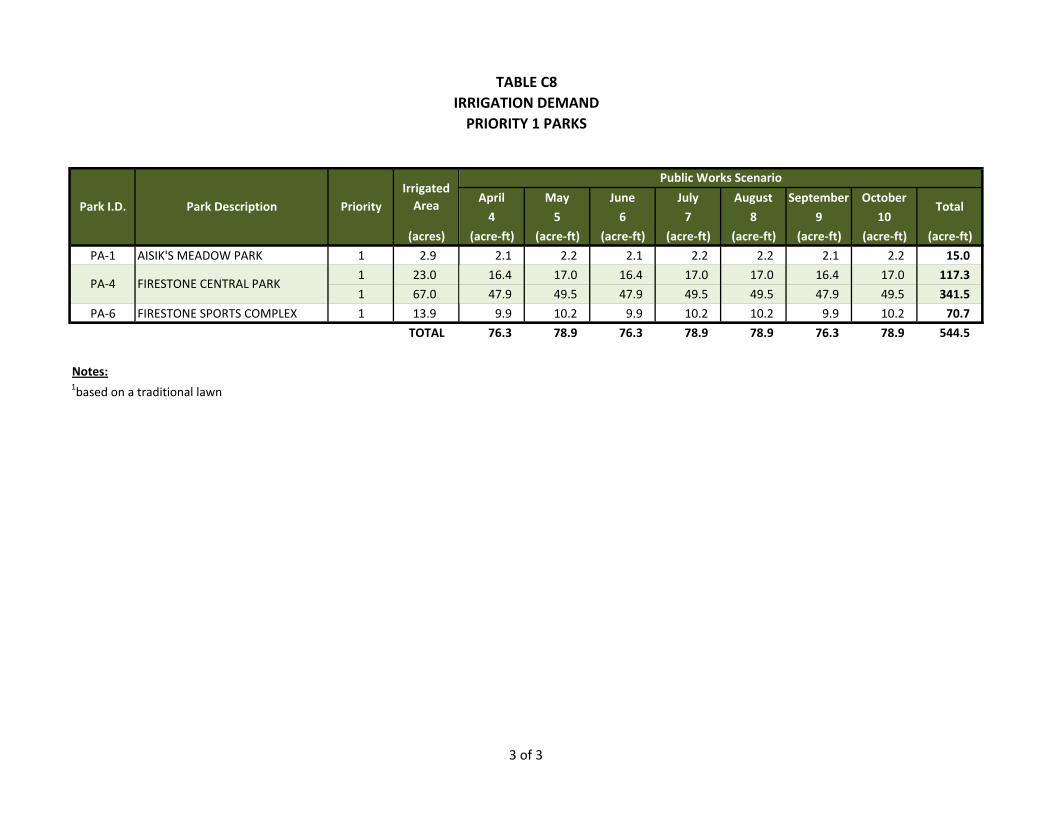
TABLE C8IRRIGATION DEMANDPRIORITY 1 PARKS
(acres)
PA‐1 AISIK'S MEADOW PARK 1 2.9
1 23.0
1 67.0
PA‐6 FIRESTONE SPORTS COMPLEX 1 13.9
TOTAL
Notes:1based on a traditional lawn
PA‐4 FIRESTONE CENTRAL PARK
Park I.D. Park Description PriorityIrrigated Area
April May June July August September October
4 5 6 7 8 9 10
(acre‐ft) (acre‐ft) (acre‐ft) (acre‐ft) (acre‐ft) (acre‐ft) (acre‐ft) (acre‐ft)
2.1 2.2 2.1 2.2 2.2 2.1 2.2 15.0
16.4 17.0 16.4 17.0 17.0 16.4 17.0 117.3
47.9 49.5 47.9 49.5 49.5 47.9 49.5 341.5
9.9 10.2 9.9 10.2 10.2 9.9 10.2 70.7
76.3 78.9 76.3 78.9 78.9 76.3 78.9 544.5
Public Works Scenario
Total
3 of 3

TABLE C9IRRIGATION DEMANDPRIORITY 2 PARKS
April May June July August September October
4 5 6 7 8 9 10
(acres) (acre‐ft) (acre‐ft) (acre‐ft) (acre‐ft) (acre‐ft) (acre‐ft) (acre‐ft) (acre‐ft)
PA‐3 COMMUNITY PARK 2 20.5 3.3 7.8 9.7 10.9 8.7 6.6 3.9 50.8
PA‐5 FIRSESTONE REGIONAL PARK 2 24.5 4.0 9.3 11.6 13.0 10.4 7.8 4.6 60.7
PA‐7 HARNEY PARK 2 4.1 0.7 1.5 1.9 2.2 1.7 1.3 0.8 10.1
PA‐14 SADDLEBACK HEIGHTS PARK 2 2.0 0.3 0.8 1.0 1.1 0.9 0.7 0.4 5.0
TOTAL 8.3 19.4 24.3 27.1 21.6 16.4 9.6 126.6
Notes:1based on a traditional lawn
TotalPark I.D. Park Description PriorityIrrigated Area
Average Year Scenario1
1 of 3
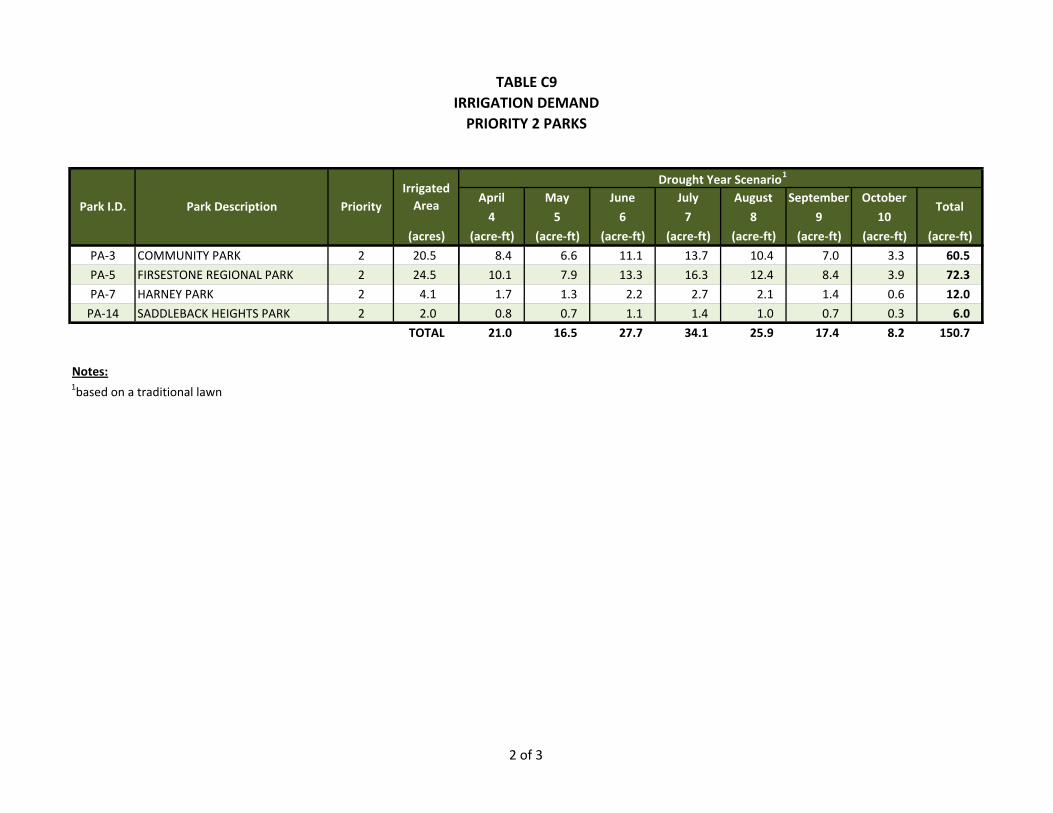
TABLE C9IRRIGATION DEMANDPRIORITY 2 PARKS
(acres)
PA‐3 COMMUNITY PARK 2 20.5
PA‐5 FIRSESTONE REGIONAL PARK 2 24.5
PA‐7 HARNEY PARK 2 4.1
PA‐14 SADDLEBACK HEIGHTS PARK 2 2.0
TOTAL
Notes:1based on a traditional lawn
Park I.D. Park Description PriorityIrrigated Area
April May June July August September October
4 5 6 7 8 9 10
(acre‐ft) (acre‐ft) (acre‐ft) (acre‐ft) (acre‐ft) (acre‐ft) (acre‐ft) (acre‐ft)
8.4 6.6 11.1 13.7 10.4 7.0 3.3 60.5
10.1 7.9 13.3 16.3 12.4 8.4 3.9 72.3
1.7 1.3 2.2 2.7 2.1 1.4 0.6 12.0
0.8 0.7 1.1 1.4 1.0 0.7 0.3 6.0
21.0 16.5 27.7 34.1 25.9 17.4 8.2 150.7
Total
Drought Year Scenario1
2 of 3

TABLE C9IRRIGATION DEMANDPRIORITY 2 PARKS
(acres)
PA‐3 COMMUNITY PARK 2 20.5
PA‐5 FIRSESTONE REGIONAL PARK 2 24.5
PA‐7 HARNEY PARK 2 4.1
PA‐14 SADDLEBACK HEIGHTS PARK 2 2.0
TOTAL
Notes:1based on a traditional lawn
Park I.D. Park Description PriorityIrrigated Area
April May June July August September October
4 5 6 7 8 9 10
(acre‐ft) (acre‐ft) (acre‐ft) (acre‐ft) (acre‐ft) (acre‐ft) (acre‐ft) (acre‐ft)
14.6 15.1 14.6 15.1 15.1 14.6 15.1 104.3
17.5 18.1 17.5 18.1 18.1 17.5 18.1 124.6
2.9 3.0 2.9 3.0 3.0 2.9 3.0 20.6
1.4 1.5 1.4 1.5 1.5 1.4 1.5 10.3
36.4 37.7 36.4 37.7 37.7 36.4 37.7 259.9
Public Works Scenario
Total
3 of 3

TABLE C10IRRIGATION DEMANDPRIORITY 3 PARKS
April May June July August September October
4 5 6 7 8 9 10
(acres) (acre‐ft) (acre‐ft) (acre‐ft) (acre‐ft) (acre‐ft) (acre‐ft) (acre‐ft) (acre‐ft)
3 5.4 0.9 2.1 2.6 2.9 2.3 1.7 1.0 13.4
3 2.1 0.3 0.8 1.0 1.1 0.9 0.7 0.4 5.2
PA‐8 HART PARK 3 5.9 0.9 2.2 2.8 3.1 2.5 1.9 1.1 14.5
PA‐9 HART PARK EXPANSION 3 5.6 0.9 2.1 2.6 2.9 2.4 1.8 1.0 13.8
PA‐10 MOUNTAIN SHADOWS PARK 3 12.8 2.1 4.9 6.1 6.8 5.4 4.1 2.4 31.7
PA‐11 NEIGHBORS POINT PARK 3 16.7 2.7 6.4 8.0 8.9 7.1 5.4 3.1 41.5
PA‐12 PATTERSON PARK 3 2.6 0.4 1.0 1.2 1.4 1.1 0.8 0.5 6.3
PA‐13 PRAIRIE RIDGE PARK 3 3.8 0.6 1.5 1.8 2.0 1.6 1.2 0.7 9.5
PA‐15 SADDLEBACK PARK 3 4.3 0.7 1.6 2.0 2.3 1.8 1.4 0.8 10.6
PA‐16 SAGEBRUSH PARK 3 4.3 0.7 1.6 2.0 2.3 1.8 1.4 0.8 10.6
PA‐17 STONERIDGE PARK 3 8.9 1.4 3.4 4.2 4.7 3.8 2.9 1.7 22.2
PA‐18 SABLE GLEN PARK 3 11.5 1.9 4.4 5.5 6.1 4.9 3.7 2.2 28.5
TOTAL 13.6 31.9 39.8 44.5 35.4 26.9 15.8 207.8
Notes:1based on a traditional lawn
Total
PA‐2 BOOTH FARMS PARK
Park I.D. Park Description PriorityIrrigated Area
Average Year Scenario1
1 of 3
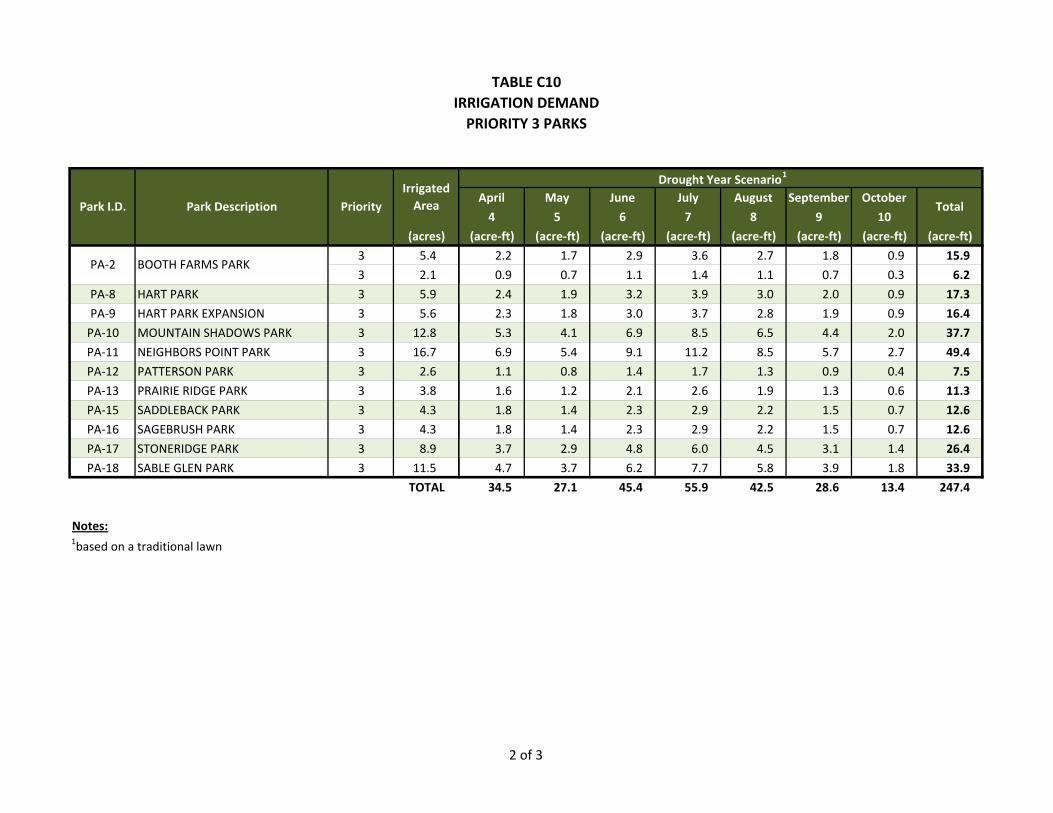
TABLE C10IRRIGATION DEMANDPRIORITY 3 PARKS
(acres)
3 5.4
3 2.1
PA‐8 HART PARK 3 5.9
PA‐9 HART PARK EXPANSION 3 5.6
PA‐10 MOUNTAIN SHADOWS PARK 3 12.8
PA‐11 NEIGHBORS POINT PARK 3 16.7
PA‐12 PATTERSON PARK 3 2.6
PA‐13 PRAIRIE RIDGE PARK 3 3.8
PA‐15 SADDLEBACK PARK 3 4.3
PA‐16 SAGEBRUSH PARK 3 4.3
PA‐17 STONERIDGE PARK 3 8.9
PA‐18 SABLE GLEN PARK 3 11.5
TOTAL
Notes:1based on a traditional lawn
PA‐2 BOOTH FARMS PARK
Park I.D. Park Description PriorityIrrigated Area
April May June July August September October
4 5 6 7 8 9 10
(acre‐ft) (acre‐ft) (acre‐ft) (acre‐ft) (acre‐ft) (acre‐ft) (acre‐ft) (acre‐ft)
2.2 1.7 2.9 3.6 2.7 1.8 0.9 15.9
0.9 0.7 1.1 1.4 1.1 0.7 0.3 6.2
2.4 1.9 3.2 3.9 3.0 2.0 0.9 17.3
2.3 1.8 3.0 3.7 2.8 1.9 0.9 16.4
5.3 4.1 6.9 8.5 6.5 4.4 2.0 37.7
6.9 5.4 9.1 11.2 8.5 5.7 2.7 49.4
1.1 0.8 1.4 1.7 1.3 0.9 0.4 7.5
1.6 1.2 2.1 2.6 1.9 1.3 0.6 11.3
1.8 1.4 2.3 2.9 2.2 1.5 0.7 12.6
1.8 1.4 2.3 2.9 2.2 1.5 0.7 12.6
3.7 2.9 4.8 6.0 4.5 3.1 1.4 26.4
4.7 3.7 6.2 7.7 5.8 3.9 1.8 33.9
34.5 27.1 45.4 55.9 42.5 28.6 13.4 247.4
Total
Drought Year Scenario1
2 of 3
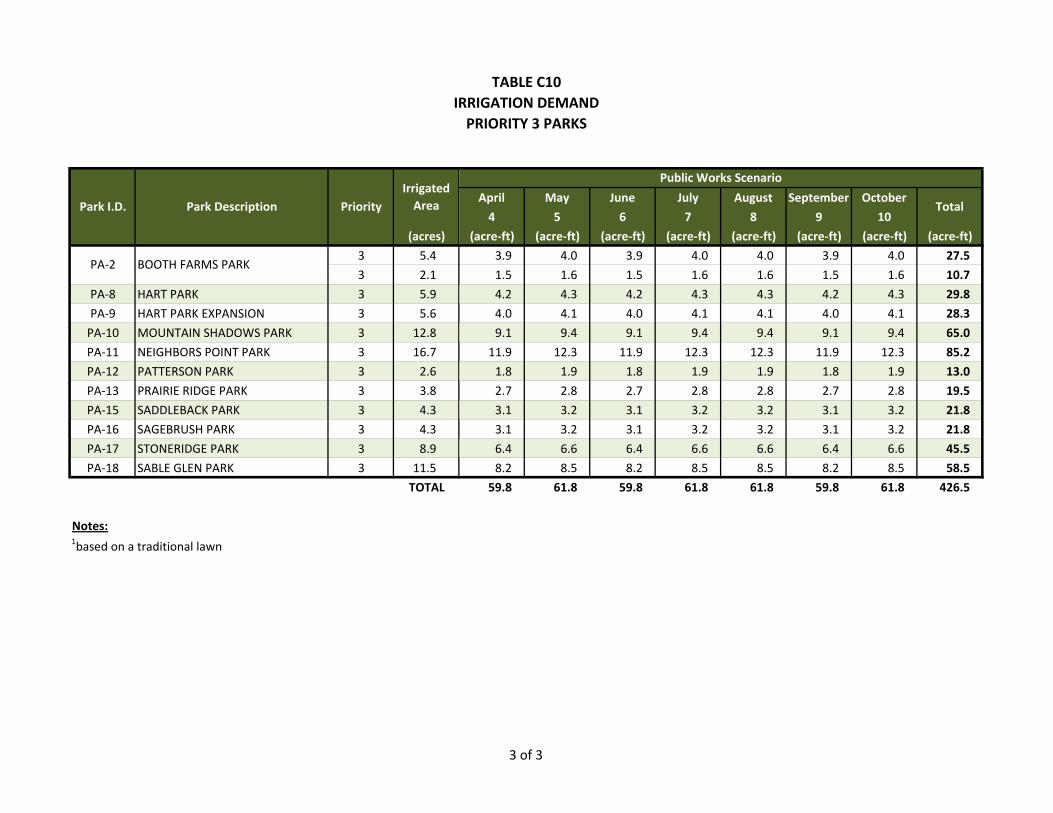
TABLE C10IRRIGATION DEMANDPRIORITY 3 PARKS
(acres)
3 5.4
3 2.1
PA‐8 HART PARK 3 5.9
PA‐9 HART PARK EXPANSION 3 5.6
PA‐10 MOUNTAIN SHADOWS PARK 3 12.8
PA‐11 NEIGHBORS POINT PARK 3 16.7
PA‐12 PATTERSON PARK 3 2.6
PA‐13 PRAIRIE RIDGE PARK 3 3.8
PA‐15 SADDLEBACK PARK 3 4.3
PA‐16 SAGEBRUSH PARK 3 4.3
PA‐17 STONERIDGE PARK 3 8.9
PA‐18 SABLE GLEN PARK 3 11.5
TOTAL
Notes:1based on a traditional lawn
PA‐2 BOOTH FARMS PARK
Park I.D. Park Description PriorityIrrigated Area
April May June July August September October
4 5 6 7 8 9 10
(acre‐ft) (acre‐ft) (acre‐ft) (acre‐ft) (acre‐ft) (acre‐ft) (acre‐ft) (acre‐ft)
3.9 4.0 3.9 4.0 4.0 3.9 4.0 27.5
1.5 1.6 1.5 1.6 1.6 1.5 1.6 10.7
4.2 4.3 4.2 4.3 4.3 4.2 4.3 29.8
4.0 4.1 4.0 4.1 4.1 4.0 4.1 28.3
9.1 9.4 9.1 9.4 9.4 9.1 9.4 65.0
11.9 12.3 11.9 12.3 12.3 11.9 12.3 85.2
1.8 1.9 1.8 1.9 1.9 1.8 1.9 13.0
2.7 2.8 2.7 2.8 2.8 2.7 2.8 19.5
3.1 3.2 3.1 3.2 3.2 3.1 3.2 21.8
3.1 3.2 3.1 3.2 3.2 3.1 3.2 21.8
6.4 6.6 6.4 6.6 6.6 6.4 6.6 45.5
8.2 8.5 8.2 8.5 8.5 8.2 8.5 58.5
59.8 61.8 59.8 61.8 61.8 59.8 61.8 426.5
Public Works Scenario
Total
3 of 3

Raw Water Irrigation System Master Plan March 2010
D
Appendix D: Irrigation Ditch Diversion Records
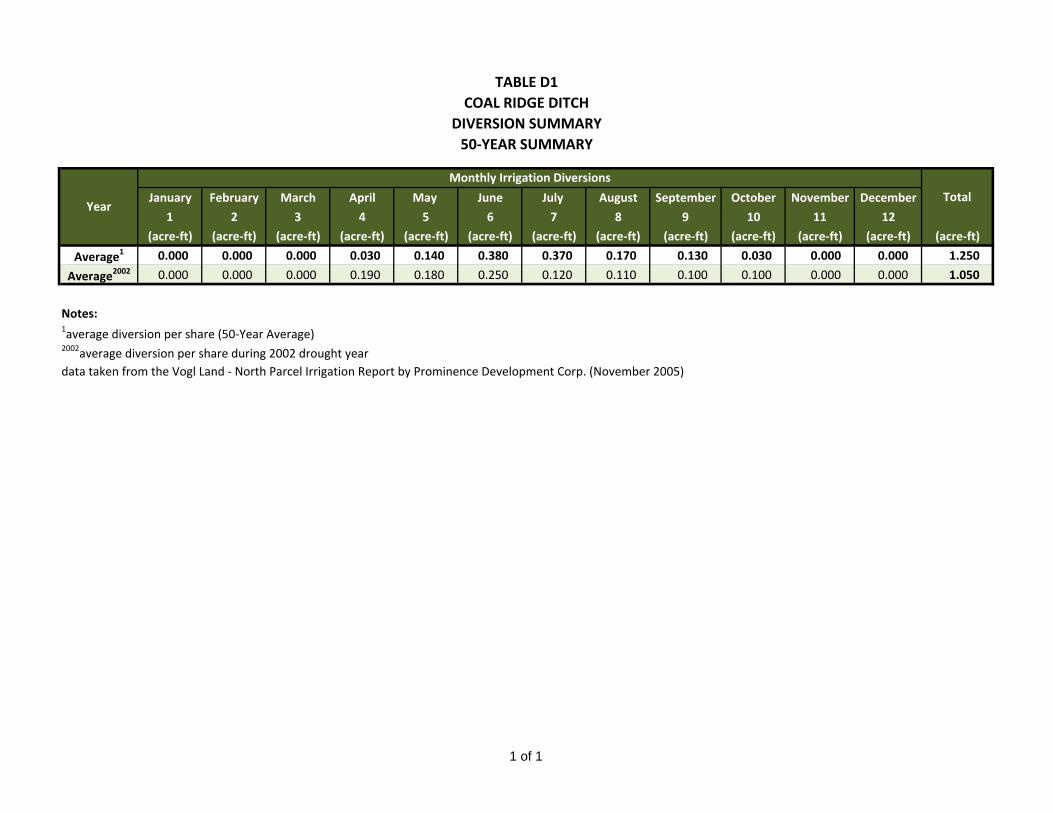
TABLE D1COAL RIDGE DITCH
DIVERSION SUMMARY50‐YEAR SUMMARY
January February March April May June July August September October November December
1 2 3 4 5 6 7 8 9 10 11 12
(acre‐ft) (acre‐ft) (acre‐ft) (acre‐ft) (acre‐ft) (acre‐ft) (acre‐ft) (acre‐ft) (acre‐ft) (acre‐ft) (acre‐ft) (acre‐ft) (acre‐ft)
Average1 0.000 0.000 0.000 0.030 0.140 0.380 0.370 0.170 0.130 0.030 0.000 0.000 1.250
Average2002 0.000 0.000 0.000 0.190 0.180 0.250 0.120 0.110 0.100 0.100 0.000 0.000 1.050
Notes:1average diversion per share (50‐Year Average)2002average diversion per share during 2002 drought yeardata taken from the Vogl Land ‐ North Parcel Irrigation Report by Prominence Development Corp. (November 2005)
Year
Monthly Irrigation Diversions
Total
1 of 1
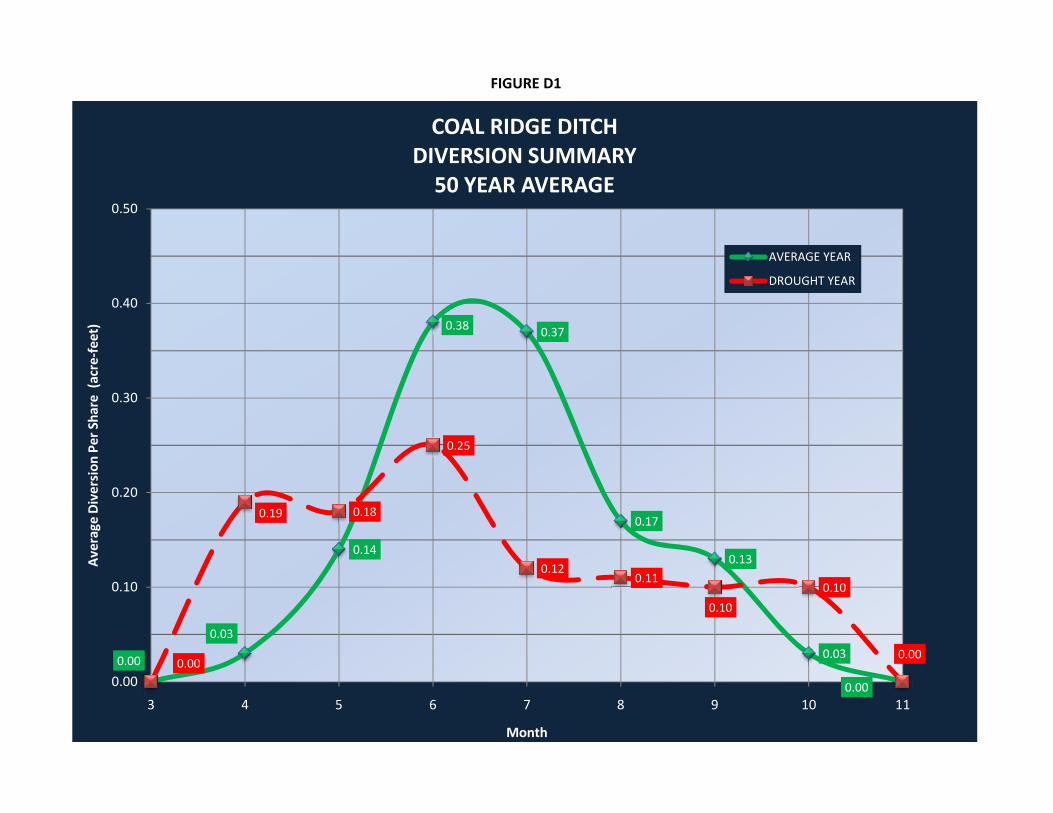
FIGURE D1
0.38 0.37
0.25
0.30
0.40
0.50
sion
Per Sha
re (acre‐feet)
COAL RIDGE DITCHDIVERSION SUMMARY50 YEAR AVERAGE
AVERAGE YEAR
DROUGHT YEAR
0.00
0.03
0.14
0.17
0.13
0.03
0.00
0.00
0.19 0.18
0.120.11
0.10
0.10
0.00
0.00
0.10
0.20
3 4 5 6 7 8 9 10 11
Average
Divers
Month
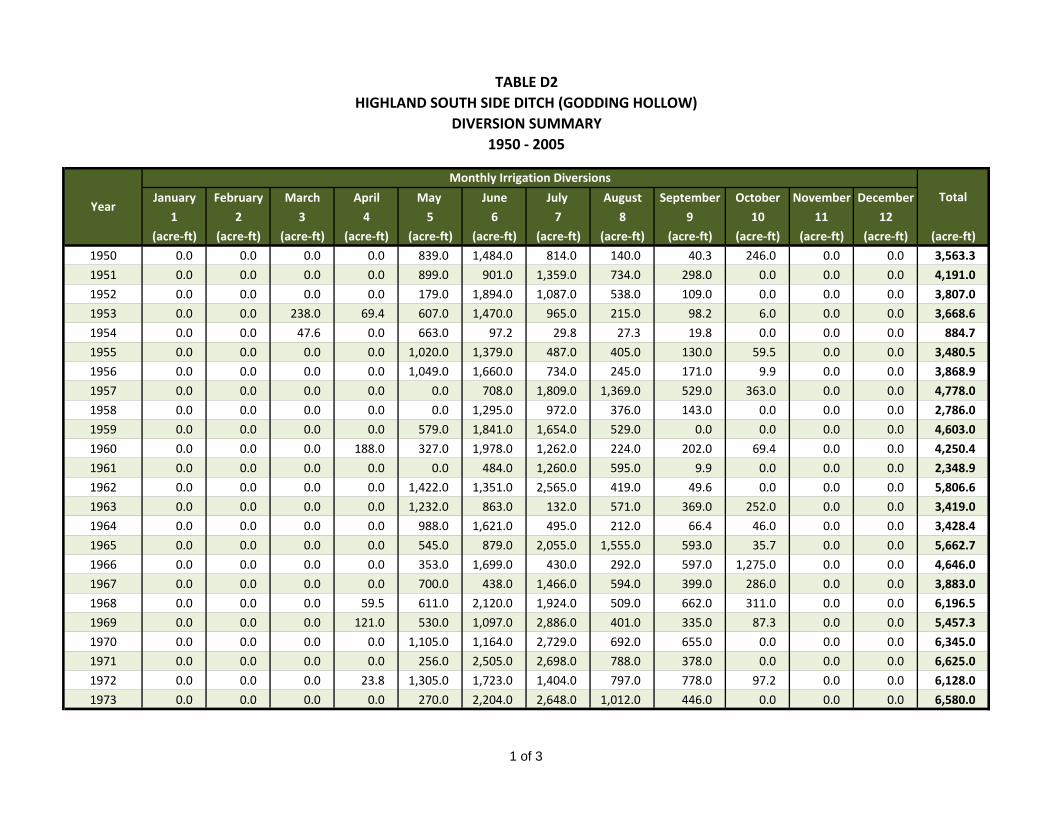
TABLE D2HIGHLAND SOUTH SIDE DITCH (GODDING HOLLOW)
DIVERSION SUMMARY1950 ‐ 2005
January February March April May June July August September October November December
1 2 3 4 5 6 7 8 9 10 11 12
(acre‐ft) (acre‐ft) (acre‐ft) (acre‐ft) (acre‐ft) (acre‐ft) (acre‐ft) (acre‐ft) (acre‐ft) (acre‐ft) (acre‐ft) (acre‐ft) (acre‐ft)
1950 0.0 0.0 0.0 0.0 839.0 1,484.0 814.0 140.0 40.3 246.0 0.0 0.0 3,563.3
1951 0.0 0.0 0.0 0.0 899.0 901.0 1,359.0 734.0 298.0 0.0 0.0 0.0 4,191.0
1952 0.0 0.0 0.0 0.0 179.0 1,894.0 1,087.0 538.0 109.0 0.0 0.0 0.0 3,807.0
1953 0.0 0.0 238.0 69.4 607.0 1,470.0 965.0 215.0 98.2 6.0 0.0 0.0 3,668.6
1954 0.0 0.0 47.6 0.0 663.0 97.2 29.8 27.3 19.8 0.0 0.0 0.0 884.7
1955 0.0 0.0 0.0 0.0 1,020.0 1,379.0 487.0 405.0 130.0 59.5 0.0 0.0 3,480.5
1956 0.0 0.0 0.0 0.0 1,049.0 1,660.0 734.0 245.0 171.0 9.9 0.0 0.0 3,868.9
1957 0.0 0.0 0.0 0.0 0.0 708.0 1,809.0 1,369.0 529.0 363.0 0.0 0.0 4,778.0
1958 0.0 0.0 0.0 0.0 0.0 1,295.0 972.0 376.0 143.0 0.0 0.0 0.0 2,786.0
1959 0.0 0.0 0.0 0.0 579.0 1,841.0 1,654.0 529.0 0.0 0.0 0.0 0.0 4,603.0
1960 0.0 0.0 0.0 188.0 327.0 1,978.0 1,262.0 224.0 202.0 69.4 0.0 0.0 4,250.4
1961 0.0 0.0 0.0 0.0 0.0 484.0 1,260.0 595.0 9.9 0.0 0.0 0.0 2,348.9
1962 0.0 0.0 0.0 0.0 1,422.0 1,351.0 2,565.0 419.0 49.6 0.0 0.0 0.0 5,806.6
1963 0.0 0.0 0.0 0.0 1,232.0 863.0 132.0 571.0 369.0 252.0 0.0 0.0 3,419.0
1964 0.0 0.0 0.0 0.0 988.0 1,621.0 495.0 212.0 66.4 46.0 0.0 0.0 3,428.4
1965 0.0 0.0 0.0 0.0 545.0 879.0 2,055.0 1,555.0 593.0 35.7 0.0 0.0 5,662.7
1966 0.0 0.0 0.0 0.0 353.0 1,699.0 430.0 292.0 597.0 1,275.0 0.0 0.0 4,646.0
1967 0.0 0.0 0.0 0.0 700.0 438.0 1,466.0 594.0 399.0 286.0 0.0 0.0 3,883.0
1968 0.0 0.0 0.0 59.5 611.0 2,120.0 1,924.0 509.0 662.0 311.0 0.0 0.0 6,196.5
1969 0.0 0.0 0.0 121.0 530.0 1,097.0 2,886.0 401.0 335.0 87.3 0.0 0.0 5,457.3
1970 0.0 0.0 0.0 0.0 1,105.0 1,164.0 2,729.0 692.0 655.0 0.0 0.0 0.0 6,345.0
1971 0.0 0.0 0.0 0.0 256.0 2,505.0 2,698.0 788.0 378.0 0.0 0.0 0.0 6,625.0
1972 0.0 0.0 0.0 23.8 1,305.0 1,723.0 1,404.0 797.0 778.0 97.2 0.0 0.0 6,128.0
1973 0.0 0.0 0.0 0.0 270.0 2,204.0 2,648.0 1,012.0 446.0 0.0 0.0 0.0 6,580.0
Year
Monthly Irrigation Diversions
Total
1 of 3
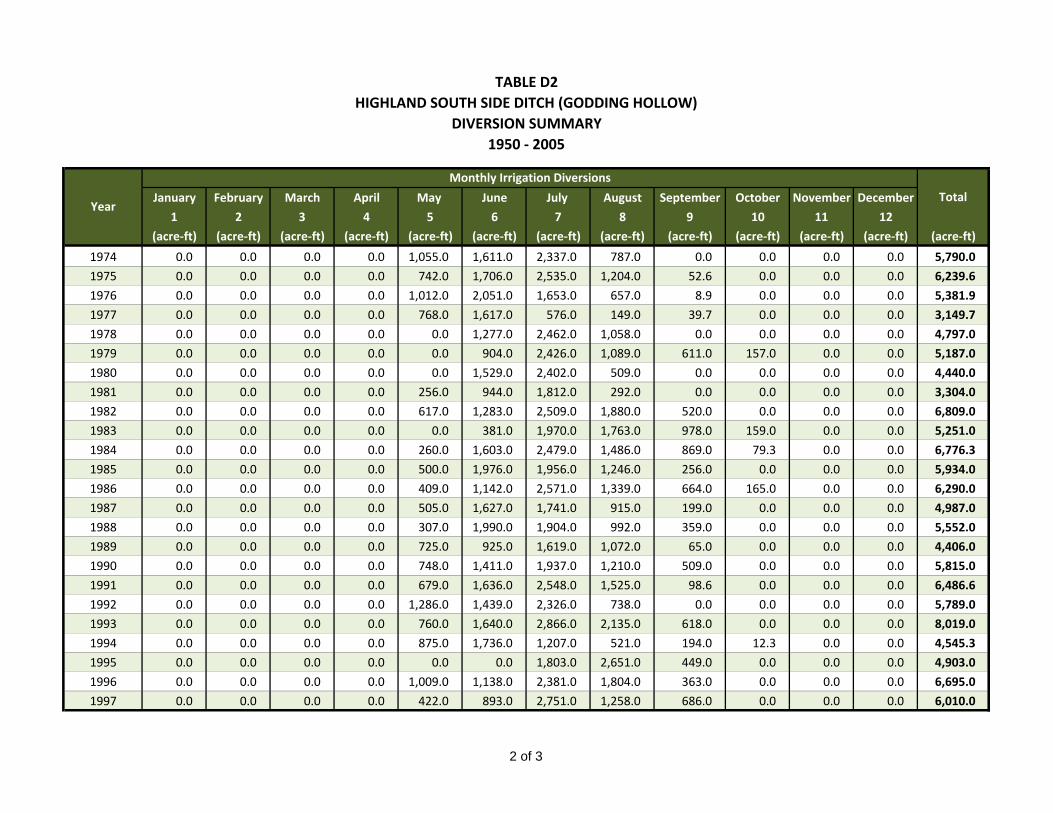
TABLE D2HIGHLAND SOUTH SIDE DITCH (GODDING HOLLOW)
DIVERSION SUMMARY1950 ‐ 2005
January February March April May June July August September October November December
1 2 3 4 5 6 7 8 9 10 11 12
(acre‐ft) (acre‐ft) (acre‐ft) (acre‐ft) (acre‐ft) (acre‐ft) (acre‐ft) (acre‐ft) (acre‐ft) (acre‐ft) (acre‐ft) (acre‐ft) (acre‐ft)
Year
Monthly Irrigation Diversions
Total
1974 0.0 0.0 0.0 0.0 1,055.0 1,611.0 2,337.0 787.0 0.0 0.0 0.0 0.0 5,790.0
1975 0.0 0.0 0.0 0.0 742.0 1,706.0 2,535.0 1,204.0 52.6 0.0 0.0 0.0 6,239.6
1976 0.0 0.0 0.0 0.0 1,012.0 2,051.0 1,653.0 657.0 8.9 0.0 0.0 0.0 5,381.9
1977 0.0 0.0 0.0 0.0 768.0 1,617.0 576.0 149.0 39.7 0.0 0.0 0.0 3,149.7
1978 0.0 0.0 0.0 0.0 0.0 1,277.0 2,462.0 1,058.0 0.0 0.0 0.0 0.0 4,797.0
1979 0.0 0.0 0.0 0.0 0.0 904.0 2,426.0 1,089.0 611.0 157.0 0.0 0.0 5,187.0
1980 0.0 0.0 0.0 0.0 0.0 1,529.0 2,402.0 509.0 0.0 0.0 0.0 0.0 4,440.0
1981 0.0 0.0 0.0 0.0 256.0 944.0 1,812.0 292.0 0.0 0.0 0.0 0.0 3,304.0
1982 0.0 0.0 0.0 0.0 617.0 1,283.0 2,509.0 1,880.0 520.0 0.0 0.0 0.0 6,809.0
1983 0.0 0.0 0.0 0.0 0.0 381.0 1,970.0 1,763.0 978.0 159.0 0.0 0.0 5,251.0
1984 0.0 0.0 0.0 0.0 260.0 1,603.0 2,479.0 1,486.0 869.0 79.3 0.0 0.0 6,776.3
1985 0.0 0.0 0.0 0.0 500.0 1,976.0 1,956.0 1,246.0 256.0 0.0 0.0 0.0 5,934.0
1986 0.0 0.0 0.0 0.0 409.0 1,142.0 2,571.0 1,339.0 664.0 165.0 0.0 0.0 6,290.0
1987 0.0 0.0 0.0 0.0 505.0 1,627.0 1,741.0 915.0 199.0 0.0 0.0 0.0 4,987.0
1988 0.0 0.0 0.0 0.0 307.0 1,990.0 1,904.0 992.0 359.0 0.0 0.0 0.0 5,552.0
1989 0.0 0.0 0.0 0.0 725.0 925.0 1,619.0 1,072.0 65.0 0.0 0.0 0.0 4,406.0
1990 0.0 0.0 0.0 0.0 748.0 1,411.0 1,937.0 1,210.0 509.0 0.0 0.0 0.0 5,815.0
1991 0.0 0.0 0.0 0.0 679.0 1,636.0 2,548.0 1,525.0 98.6 0.0 0.0 0.0 6,486.6
1992 0.0 0.0 0.0 0.0 1,286.0 1,439.0 2,326.0 738.0 0.0 0.0 0.0 0.0 5,789.0
1993 0.0 0.0 0.0 0.0 760.0 1,640.0 2,866.0 2,135.0 618.0 0.0 0.0 0.0 8,019.0
1994 0.0 0.0 0.0 0.0 875.0 1,736.0 1,207.0 521.0 194.0 12.3 0.0 0.0 4,545.3
1995 0.0 0.0 0.0 0.0 0.0 0.0 1,803.0 2,651.0 449.0 0.0 0.0 0.0 4,903.0
1996 0.0 0.0 0.0 0.0 1,009.0 1,138.0 2,381.0 1,804.0 363.0 0.0 0.0 0.0 6,695.0
1997 0.0 0.0 0.0 0.0 422.0 893.0 2,751.0 1,258.0 686.0 0.0 0.0 0.0 6,010.0
2 of 3
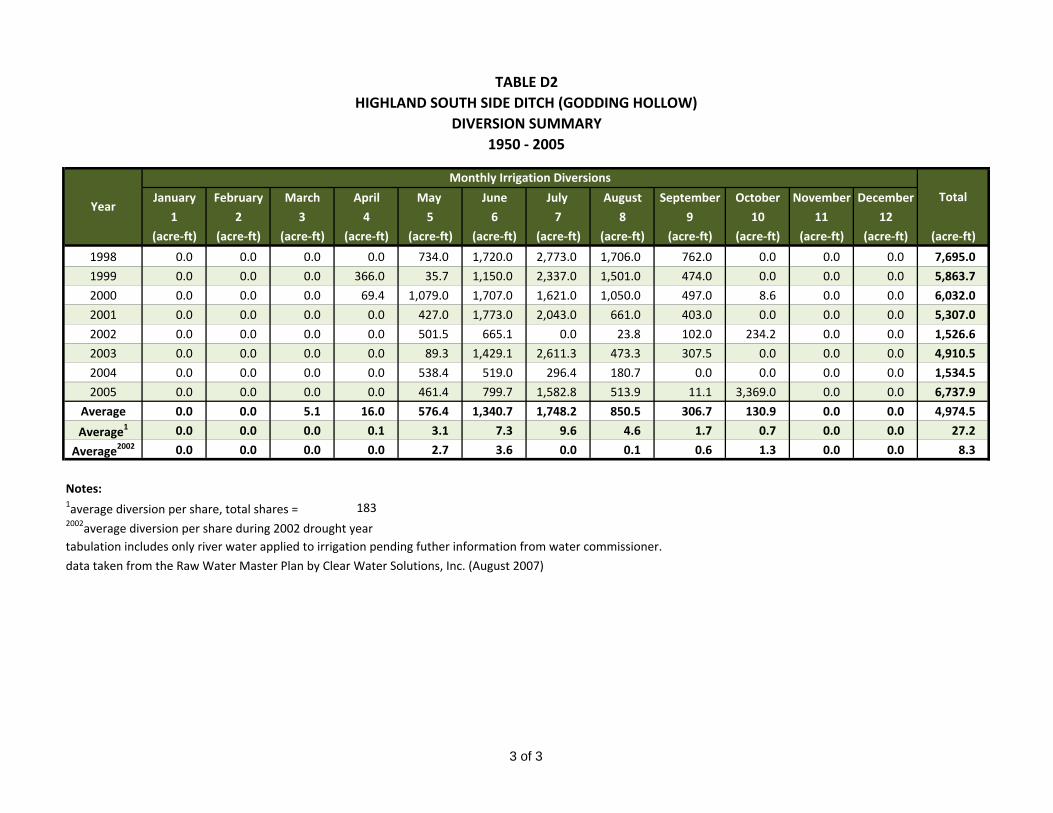
TABLE D2HIGHLAND SOUTH SIDE DITCH (GODDING HOLLOW)
DIVERSION SUMMARY1950 ‐ 2005
January February March April May June July August September October November December
1 2 3 4 5 6 7 8 9 10 11 12
(acre‐ft) (acre‐ft) (acre‐ft) (acre‐ft) (acre‐ft) (acre‐ft) (acre‐ft) (acre‐ft) (acre‐ft) (acre‐ft) (acre‐ft) (acre‐ft) (acre‐ft)
Year
Monthly Irrigation Diversions
Total
1998 0.0 0.0 0.0 0.0 734.0 1,720.0 2,773.0 1,706.0 762.0 0.0 0.0 0.0 7,695.0
1999 0.0 0.0 0.0 366.0 35.7 1,150.0 2,337.0 1,501.0 474.0 0.0 0.0 0.0 5,863.7
2000 0.0 0.0 0.0 69.4 1,079.0 1,707.0 1,621.0 1,050.0 497.0 8.6 0.0 0.0 6,032.0
2001 0.0 0.0 0.0 0.0 427.0 1,773.0 2,043.0 661.0 403.0 0.0 0.0 0.0 5,307.0
2002 0.0 0.0 0.0 0.0 501.5 665.1 0.0 23.8 102.0 234.2 0.0 0.0 1,526.6
2003 0.0 0.0 0.0 0.0 89.3 1,429.1 2,611.3 473.3 307.5 0.0 0.0 0.0 4,910.5
2004 0.0 0.0 0.0 0.0 538.4 519.0 296.4 180.7 0.0 0.0 0.0 0.0 1,534.5
2005 0.0 0.0 0.0 0.0 461.4 799.7 1,582.8 513.9 11.1 3,369.0 0.0 0.0 6,737.9
Average 0.0 0.0 5.1 16.0 576.4 1,340.7 1,748.2 850.5 306.7 130.9 0.0 0.0 4,974.5
Average1 0.0 0.0 0.0 0.1 3.1 7.3 9.6 4.6 1.7 0.7 0.0 0.0 27.2
Average2002 0.0 0.0 0.0 0.0 2.7 3.6 0.0 0.1 0.6 1.3 0.0 0.0 8.3
Notes:1average diversion per share, total shares = 1832002average diversion per share during 2002 drought yeartabulation includes only river water applied to irrigation pending futher information from water commissioner.
data taken from the Raw Water Master Plan by Clear Water Solutions, Inc. (August 2007)
3 of 3
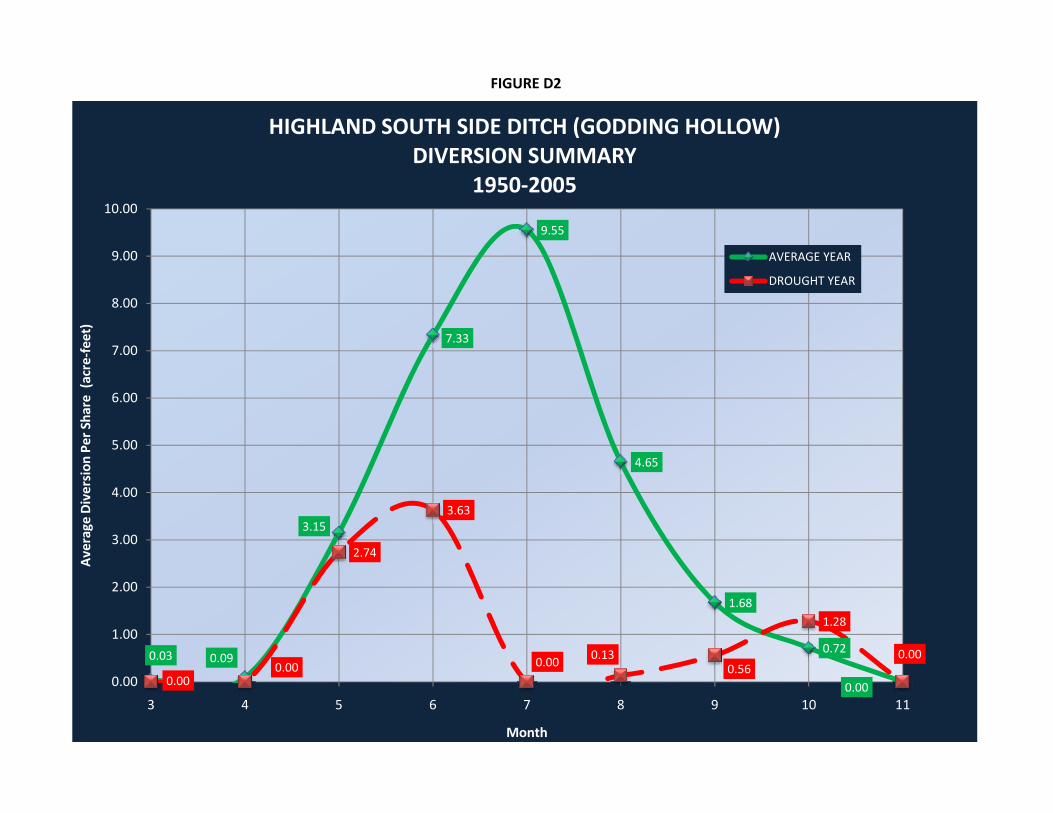
FIGURE D2
7.33
9.55
4.655.00
6.00
7.00
8.00
9.00
10.00
sion
Per Sha
re (acre‐feet)
HIGHLAND SOUTH SIDE DITCH (GODDING HOLLOW)DIVERSION SUMMARY
1950‐2005
AVERAGE YEAR
DROUGHT YEAR
0.03 0.09
3.15
1.68
0.72
0.000.000.00
2.74
3.63
0.00 0.130.56
1.28
0.00
0.00
1.00
2.00
3.00
4.00
3 4 5 6 7 8 9 10 11
Average
Divers
Month
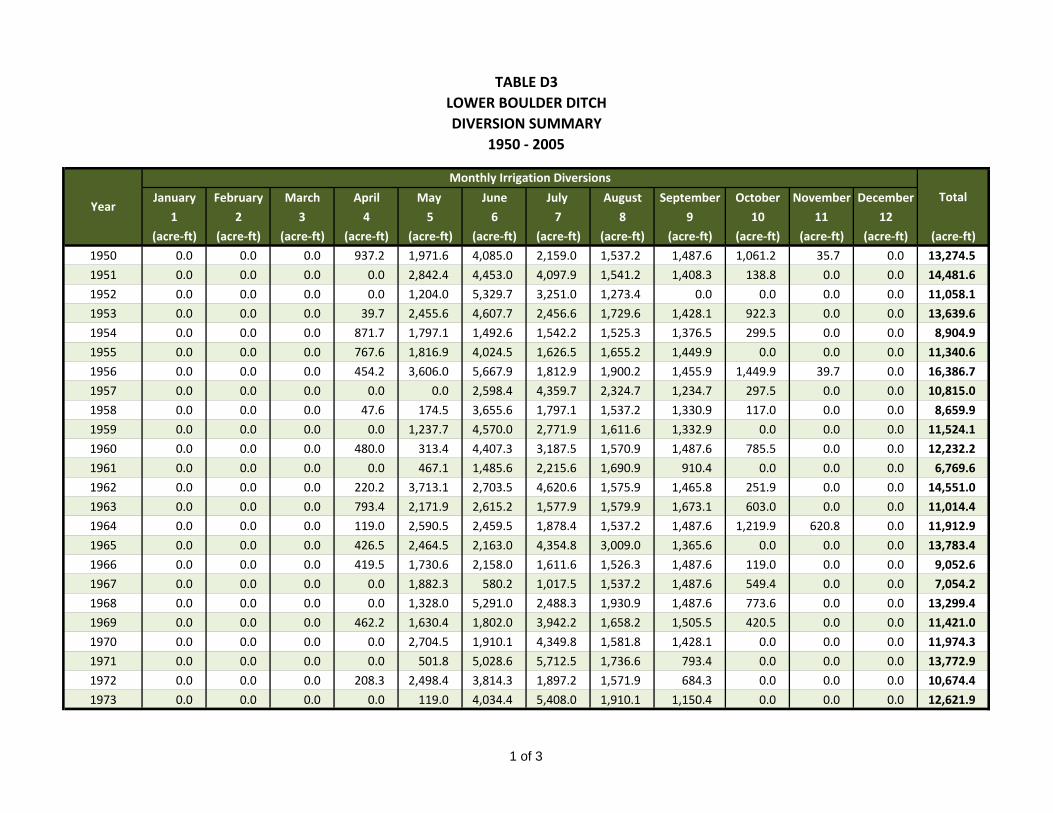
TABLE D3LOWER BOULDER DITCHDIVERSION SUMMARY
1950 ‐ 2005
January February March April May June July August September October November December
1 2 3 4 5 6 7 8 9 10 11 12
(acre‐ft) (acre‐ft) (acre‐ft) (acre‐ft) (acre‐ft) (acre‐ft) (acre‐ft) (acre‐ft) (acre‐ft) (acre‐ft) (acre‐ft) (acre‐ft) (acre‐ft)
1950 0.0 0.0 0.0 937.2 1,971.6 4,085.0 2,159.0 1,537.2 1,487.6 1,061.2 35.7 0.0 13,274.5
1951 0.0 0.0 0.0 0.0 2,842.4 4,453.0 4,097.9 1,541.2 1,408.3 138.8 0.0 0.0 14,481.6
1952 0.0 0.0 0.0 0.0 1,204.0 5,329.7 3,251.0 1,273.4 0.0 0.0 0.0 0.0 11,058.1
1953 0.0 0.0 0.0 39.7 2,455.6 4,607.7 2,456.6 1,729.6 1,428.1 922.3 0.0 0.0 13,639.6
1954 0.0 0.0 0.0 871.7 1,797.1 1,492.6 1,542.2 1,525.3 1,376.5 299.5 0.0 0.0 8,904.9
1955 0.0 0.0 0.0 767.6 1,816.9 4,024.5 1,626.5 1,655.2 1,449.9 0.0 0.0 0.0 11,340.6
1956 0.0 0.0 0.0 454.2 3,606.0 5,667.9 1,812.9 1,900.2 1,455.9 1,449.9 39.7 0.0 16,386.7
1957 0.0 0.0 0.0 0.0 0.0 2,598.4 4,359.7 2,324.7 1,234.7 297.5 0.0 0.0 10,815.0
1958 0.0 0.0 0.0 47.6 174.5 3,655.6 1,797.1 1,537.2 1,330.9 117.0 0.0 0.0 8,659.9
1959 0.0 0.0 0.0 0.0 1,237.7 4,570.0 2,771.9 1,611.6 1,332.9 0.0 0.0 0.0 11,524.1
1960 0.0 0.0 0.0 480.0 313.4 4,407.3 3,187.5 1,570.9 1,487.6 785.5 0.0 0.0 12,232.2
1961 0.0 0.0 0.0 0.0 467.1 1,485.6 2,215.6 1,690.9 910.4 0.0 0.0 0.0 6,769.6
1962 0.0 0.0 0.0 220.2 3,713.1 2,703.5 4,620.6 1,575.9 1,465.8 251.9 0.0 0.0 14,551.0
1963 0.0 0.0 0.0 793.4 2,171.9 2,615.2 1,577.9 1,579.9 1,673.1 603.0 0.0 0.0 11,014.4
1964 0.0 0.0 0.0 119.0 2,590.5 2,459.5 1,878.4 1,537.2 1,487.6 1,219.9 620.8 0.0 11,912.9
1965 0.0 0.0 0.0 426.5 2,464.5 2,163.0 4,354.8 3,009.0 1,365.6 0.0 0.0 0.0 13,783.4
1966 0.0 0.0 0.0 419.5 1,730.6 2,158.0 1,611.6 1,526.3 1,487.6 119.0 0.0 0.0 9,052.6
1967 0.0 0.0 0.0 0.0 1,882.3 580.2 1,017.5 1,537.2 1,487.6 549.4 0.0 0.0 7,054.2
1968 0.0 0.0 0.0 0.0 1,328.0 5,291.0 2,488.3 1,930.9 1,487.6 773.6 0.0 0.0 13,299.4
1969 0.0 0.0 0.0 462.2 1,630.4 1,802.0 3,942.2 1,658.2 1,505.5 420.5 0.0 0.0 11,421.0
1970 0.0 0.0 0.0 0.0 2,704.5 1,910.1 4,349.8 1,581.8 1,428.1 0.0 0.0 0.0 11,974.3
1971 0.0 0.0 0.0 0.0 501.8 5,028.6 5,712.5 1,736.6 793.4 0.0 0.0 0.0 13,772.9
1972 0.0 0.0 0.0 208.3 2,498.4 3,814.3 1,897.2 1,571.9 684.3 0.0 0.0 0.0 10,674.4
1973 0.0 0.0 0.0 0.0 119.0 4,034.4 5,408.0 1,910.1 1,150.4 0.0 0.0 0.0 12,621.9
Year
Monthly Irrigation Diversions
Total
1 of 3
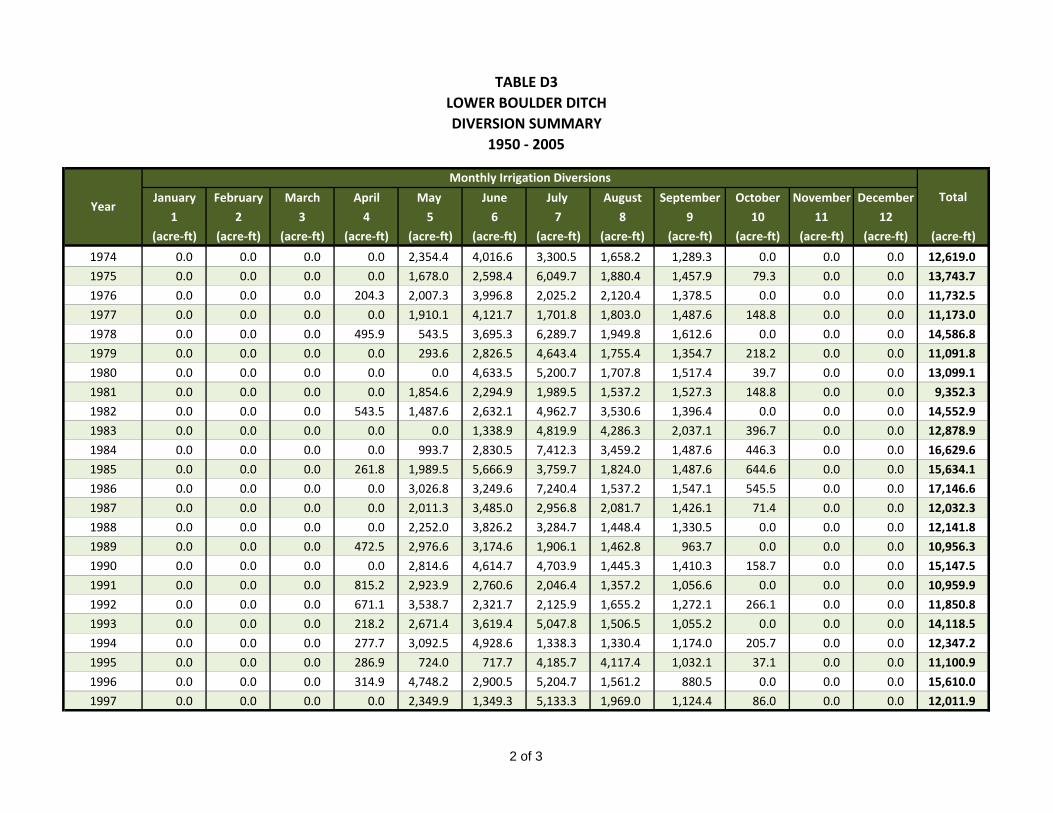
TABLE D3LOWER BOULDER DITCHDIVERSION SUMMARY
1950 ‐ 2005
January February March April May June July August September October November December
1 2 3 4 5 6 7 8 9 10 11 12
(acre‐ft) (acre‐ft) (acre‐ft) (acre‐ft) (acre‐ft) (acre‐ft) (acre‐ft) (acre‐ft) (acre‐ft) (acre‐ft) (acre‐ft) (acre‐ft) (acre‐ft)
Year
Monthly Irrigation Diversions
Total
1974 0.0 0.0 0.0 0.0 2,354.4 4,016.6 3,300.5 1,658.2 1,289.3 0.0 0.0 0.0 12,619.0
1975 0.0 0.0 0.0 0.0 1,678.0 2,598.4 6,049.7 1,880.4 1,457.9 79.3 0.0 0.0 13,743.7
1976 0.0 0.0 0.0 204.3 2,007.3 3,996.8 2,025.2 2,120.4 1,378.5 0.0 0.0 0.0 11,732.5
1977 0.0 0.0 0.0 0.0 1,910.1 4,121.7 1,701.8 1,803.0 1,487.6 148.8 0.0 0.0 11,173.0
1978 0.0 0.0 0.0 495.9 543.5 3,695.3 6,289.7 1,949.8 1,612.6 0.0 0.0 0.0 14,586.8
1979 0.0 0.0 0.0 0.0 293.6 2,826.5 4,643.4 1,755.4 1,354.7 218.2 0.0 0.0 11,091.8
1980 0.0 0.0 0.0 0.0 0.0 4,633.5 5,200.7 1,707.8 1,517.4 39.7 0.0 0.0 13,099.1
1981 0.0 0.0 0.0 0.0 1,854.6 2,294.9 1,989.5 1,537.2 1,527.3 148.8 0.0 0.0 9,352.3
1982 0.0 0.0 0.0 543.5 1,487.6 2,632.1 4,962.7 3,530.6 1,396.4 0.0 0.0 0.0 14,552.9
1983 0.0 0.0 0.0 0.0 0.0 1,338.9 4,819.9 4,286.3 2,037.1 396.7 0.0 0.0 12,878.9
1984 0.0 0.0 0.0 0.0 993.7 2,830.5 7,412.3 3,459.2 1,487.6 446.3 0.0 0.0 16,629.6
1985 0.0 0.0 0.0 261.8 1,989.5 5,666.9 3,759.7 1,824.0 1,487.6 644.6 0.0 0.0 15,634.1
1986 0.0 0.0 0.0 0.0 3,026.8 3,249.6 7,240.4 1,537.2 1,547.1 545.5 0.0 0.0 17,146.6
1987 0.0 0.0 0.0 0.0 2,011.3 3,485.0 2,956.8 2,081.7 1,426.1 71.4 0.0 0.0 12,032.3
1988 0.0 0.0 0.0 0.0 2,252.0 3,826.2 3,284.7 1,448.4 1,330.5 0.0 0.0 0.0 12,141.8
1989 0.0 0.0 0.0 472.5 2,976.6 3,174.6 1,906.1 1,462.8 963.7 0.0 0.0 0.0 10,956.3
1990 0.0 0.0 0.0 0.0 2,814.6 4,614.7 4,703.9 1,445.3 1,410.3 158.7 0.0 0.0 15,147.5
1991 0.0 0.0 0.0 815.2 2,923.9 2,760.6 2,046.4 1,357.2 1,056.6 0.0 0.0 0.0 10,959.9
1992 0.0 0.0 0.0 671.1 3,538.7 2,321.7 2,125.9 1,655.2 1,272.1 266.1 0.0 0.0 11,850.8
1993 0.0 0.0 0.0 218.2 2,671.4 3,619.4 5,047.8 1,506.5 1,055.2 0.0 0.0 0.0 14,118.5
1994 0.0 0.0 0.0 277.7 3,092.5 4,928.6 1,338.3 1,330.4 1,174.0 205.7 0.0 0.0 12,347.2
1995 0.0 0.0 0.0 286.9 724.0 717.7 4,185.7 4,117.4 1,032.1 37.1 0.0 0.0 11,100.9
1996 0.0 0.0 0.0 314.9 4,748.2 2,900.5 5,204.7 1,561.2 880.5 0.0 0.0 0.0 15,610.0
1997 0.0 0.0 0.0 0.0 2,349.9 1,349.3 5,133.3 1,969.0 1,124.4 86.0 0.0 0.0 12,011.9
2 of 3
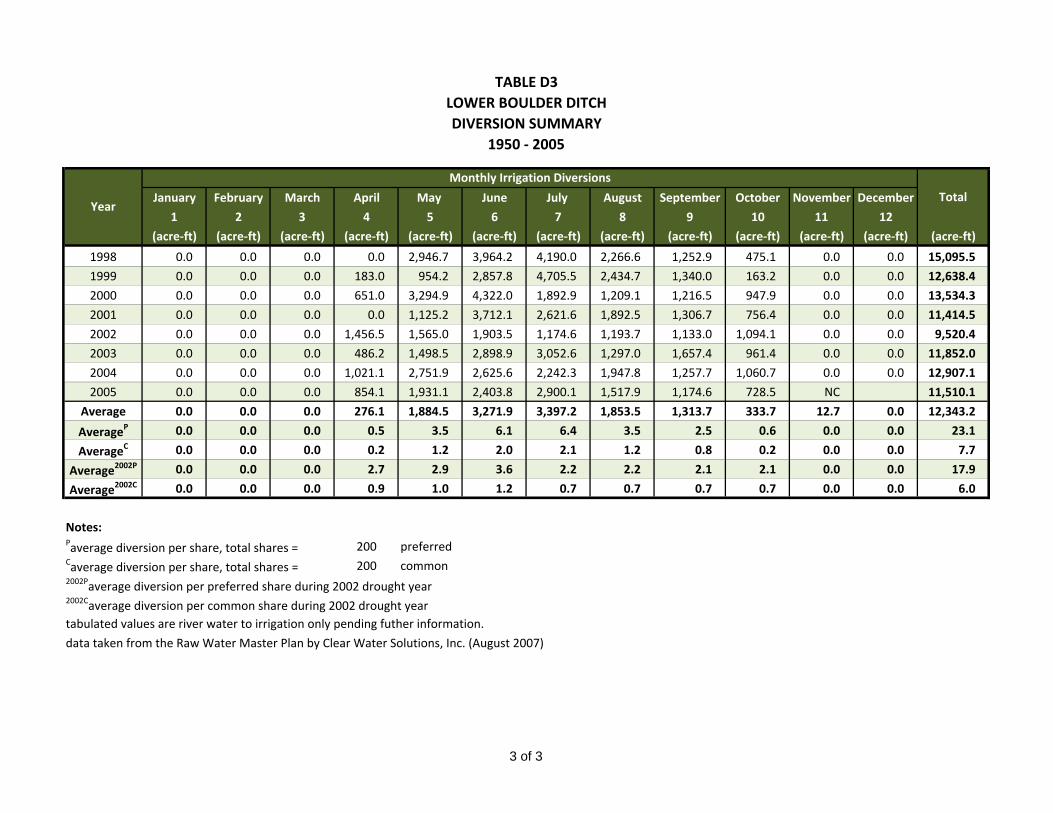
TABLE D3LOWER BOULDER DITCHDIVERSION SUMMARY
1950 ‐ 2005
January February March April May June July August September October November December
1 2 3 4 5 6 7 8 9 10 11 12
(acre‐ft) (acre‐ft) (acre‐ft) (acre‐ft) (acre‐ft) (acre‐ft) (acre‐ft) (acre‐ft) (acre‐ft) (acre‐ft) (acre‐ft) (acre‐ft) (acre‐ft)
Year
Monthly Irrigation Diversions
Total
1998 0.0 0.0 0.0 0.0 2,946.7 3,964.2 4,190.0 2,266.6 1,252.9 475.1 0.0 0.0 15,095.5
1999 0.0 0.0 0.0 183.0 954.2 2,857.8 4,705.5 2,434.7 1,340.0 163.2 0.0 0.0 12,638.4
2000 0.0 0.0 0.0 651.0 3,294.9 4,322.0 1,892.9 1,209.1 1,216.5 947.9 0.0 0.0 13,534.3
2001 0.0 0.0 0.0 0.0 1,125.2 3,712.1 2,621.6 1,892.5 1,306.7 756.4 0.0 0.0 11,414.5
2002 0.0 0.0 0.0 1,456.5 1,565.0 1,903.5 1,174.6 1,193.7 1,133.0 1,094.1 0.0 0.0 9,520.4
2003 0.0 0.0 0.0 486.2 1,498.5 2,898.9 3,052.6 1,297.0 1,657.4 961.4 0.0 0.0 11,852.0
2004 0.0 0.0 0.0 1,021.1 2,751.9 2,625.6 2,242.3 1,947.8 1,257.7 1,060.7 0.0 0.0 12,907.1
2005 0.0 0.0 0.0 854.1 1,931.1 2,403.8 2,900.1 1,517.9 1,174.6 728.5 NC 11,510.1
Average 0.0 0.0 0.0 276.1 1,884.5 3,271.9 3,397.2 1,853.5 1,313.7 333.7 12.7 0.0 12,343.2
AverageP 0.0 0.0 0.0 0.5 3.5 6.1 6.4 3.5 2.5 0.6 0.0 0.0 23.1
AverageC 0.0 0.0 0.0 0.2 1.2 2.0 2.1 1.2 0.8 0.2 0.0 0.0 7.7
Average2002P 0.0 0.0 0.0 2.7 2.9 3.6 2.2 2.2 2.1 2.1 0.0 0.0 17.9
Average2002C 0.0 0.0 0.0 0.9 1.0 1.2 0.7 0.7 0.7 0.7 0.0 0.0 6.0
Notes:Paverage diversion per share, total shares = 200 preferredCaverage diversion per share, total shares = 200 common2002Paverage diversion per preferred share during 2002 drought year2002Caverage diversion per common share during 2002 drought yeartabulated values are river water to irrigation only pending futher information.
data taken from the Raw Water Master Plan by Clear Water Solutions, Inc. (August 2007)
3 of 3
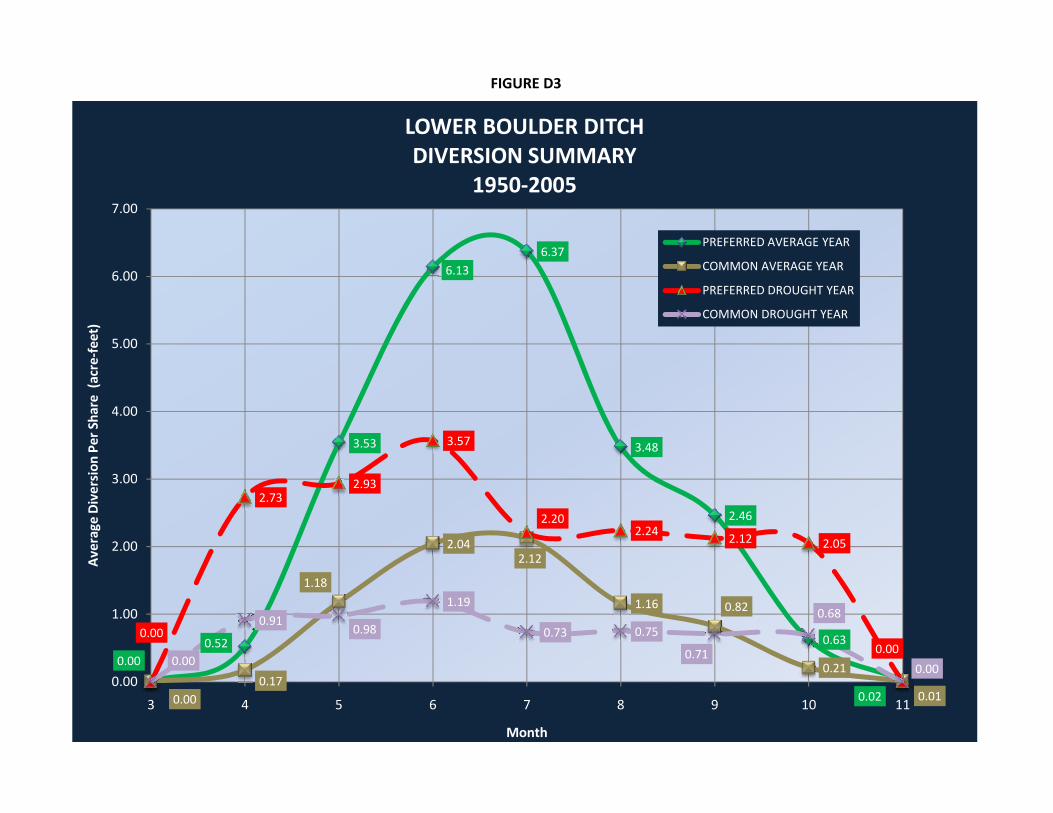
FIGURE D3
3.53
6.136.37
3.483.57
3 00
4.00
5.00
6.00
7.00
sion
Per Sha
re (acre‐feet)
LOWER BOULDER DITCHDIVERSION SUMMARY
1950‐2005
PREFERRED AVERAGE YEAR
COMMON AVERAGE YEAR
PREFERRED DROUGHT YEAR
COMMON DROUGHT YEAR
0.000.52
2.46
0.63
0.020.000.17
1.18
2.042.12
1.16 0.82
0.21
0.01
0.00
2.732.93
2.202.24
2.12 2.05
0.000.00
0.910.98
1.19
0.73 0.75
0.71
0.68
0.000.00
1.00
2.00
3.00
3 4 5 6 7 8 9 10 11
Average
Divers
Month
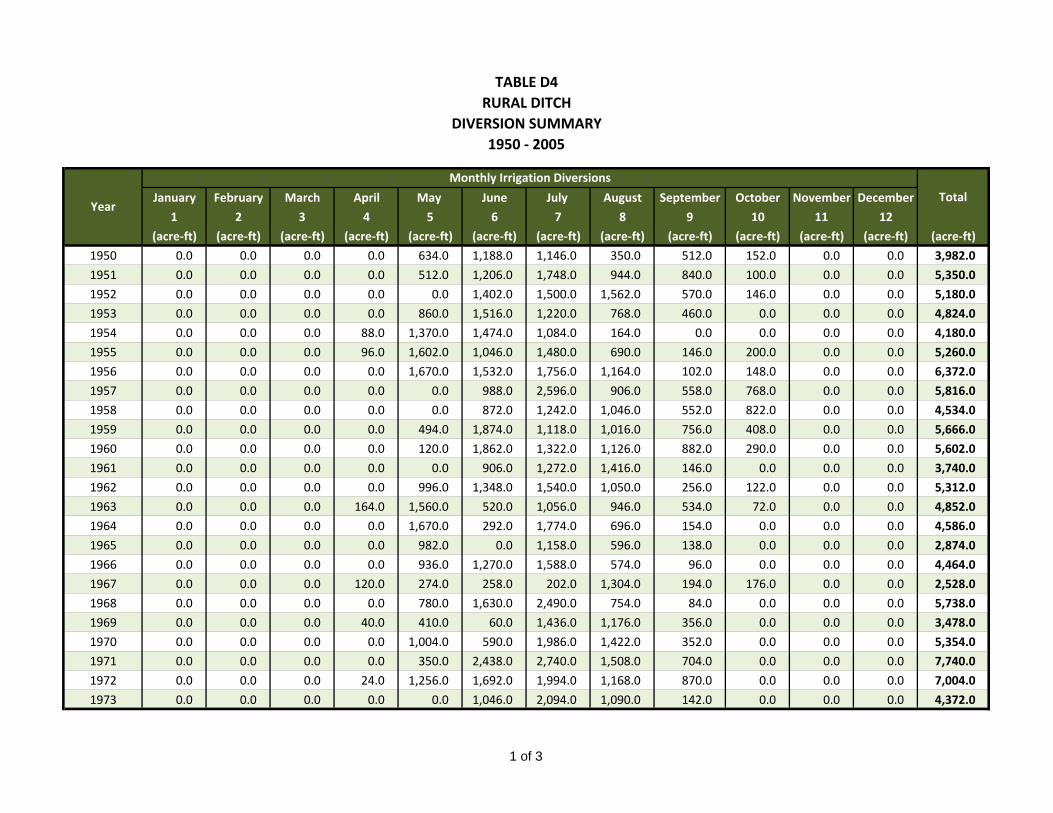
TABLE D4RURAL DITCH
DIVERSION SUMMARY1950 ‐ 2005
January February March April May June July August September October November December
1 2 3 4 5 6 7 8 9 10 11 12
(acre‐ft) (acre‐ft) (acre‐ft) (acre‐ft) (acre‐ft) (acre‐ft) (acre‐ft) (acre‐ft) (acre‐ft) (acre‐ft) (acre‐ft) (acre‐ft) (acre‐ft)
1950 0.0 0.0 0.0 0.0 634.0 1,188.0 1,146.0 350.0 512.0 152.0 0.0 0.0 3,982.0
1951 0.0 0.0 0.0 0.0 512.0 1,206.0 1,748.0 944.0 840.0 100.0 0.0 0.0 5,350.0
1952 0.0 0.0 0.0 0.0 0.0 1,402.0 1,500.0 1,562.0 570.0 146.0 0.0 0.0 5,180.0
1953 0.0 0.0 0.0 0.0 860.0 1,516.0 1,220.0 768.0 460.0 0.0 0.0 0.0 4,824.0
1954 0.0 0.0 0.0 88.0 1,370.0 1,474.0 1,084.0 164.0 0.0 0.0 0.0 0.0 4,180.0
1955 0.0 0.0 0.0 96.0 1,602.0 1,046.0 1,480.0 690.0 146.0 200.0 0.0 0.0 5,260.0
1956 0.0 0.0 0.0 0.0 1,670.0 1,532.0 1,756.0 1,164.0 102.0 148.0 0.0 0.0 6,372.0
1957 0.0 0.0 0.0 0.0 0.0 988.0 2,596.0 906.0 558.0 768.0 0.0 0.0 5,816.0
1958 0.0 0.0 0.0 0.0 0.0 872.0 1,242.0 1,046.0 552.0 822.0 0.0 0.0 4,534.0
1959 0.0 0.0 0.0 0.0 494.0 1,874.0 1,118.0 1,016.0 756.0 408.0 0.0 0.0 5,666.0
1960 0.0 0.0 0.0 0.0 120.0 1,862.0 1,322.0 1,126.0 882.0 290.0 0.0 0.0 5,602.0
1961 0.0 0.0 0.0 0.0 0.0 906.0 1,272.0 1,416.0 146.0 0.0 0.0 0.0 3,740.0
1962 0.0 0.0 0.0 0.0 996.0 1,348.0 1,540.0 1,050.0 256.0 122.0 0.0 0.0 5,312.0
1963 0.0 0.0 0.0 164.0 1,560.0 520.0 1,056.0 946.0 534.0 72.0 0.0 0.0 4,852.0
1964 0.0 0.0 0.0 0.0 1,670.0 292.0 1,774.0 696.0 154.0 0.0 0.0 0.0 4,586.0
1965 0.0 0.0 0.0 0.0 982.0 0.0 1,158.0 596.0 138.0 0.0 0.0 0.0 2,874.0
1966 0.0 0.0 0.0 0.0 936.0 1,270.0 1,588.0 574.0 96.0 0.0 0.0 0.0 4,464.0
1967 0.0 0.0 0.0 120.0 274.0 258.0 202.0 1,304.0 194.0 176.0 0.0 0.0 2,528.0
1968 0.0 0.0 0.0 0.0 780.0 1,630.0 2,490.0 754.0 84.0 0.0 0.0 0.0 5,738.0
1969 0.0 0.0 0.0 40.0 410.0 60.0 1,436.0 1,176.0 356.0 0.0 0.0 0.0 3,478.0
1970 0.0 0.0 0.0 0.0 1,004.0 590.0 1,986.0 1,422.0 352.0 0.0 0.0 0.0 5,354.0
1971 0.0 0.0 0.0 0.0 350.0 2,438.0 2,740.0 1,508.0 704.0 0.0 0.0 0.0 7,740.0
1972 0.0 0.0 0.0 24.0 1,256.0 1,692.0 1,994.0 1,168.0 870.0 0.0 0.0 0.0 7,004.0
1973 0.0 0.0 0.0 0.0 0.0 1,046.0 2,094.0 1,090.0 142.0 0.0 0.0 0.0 4,372.0
Year
Monthly Irrigation Diversions
Total
1 of 3
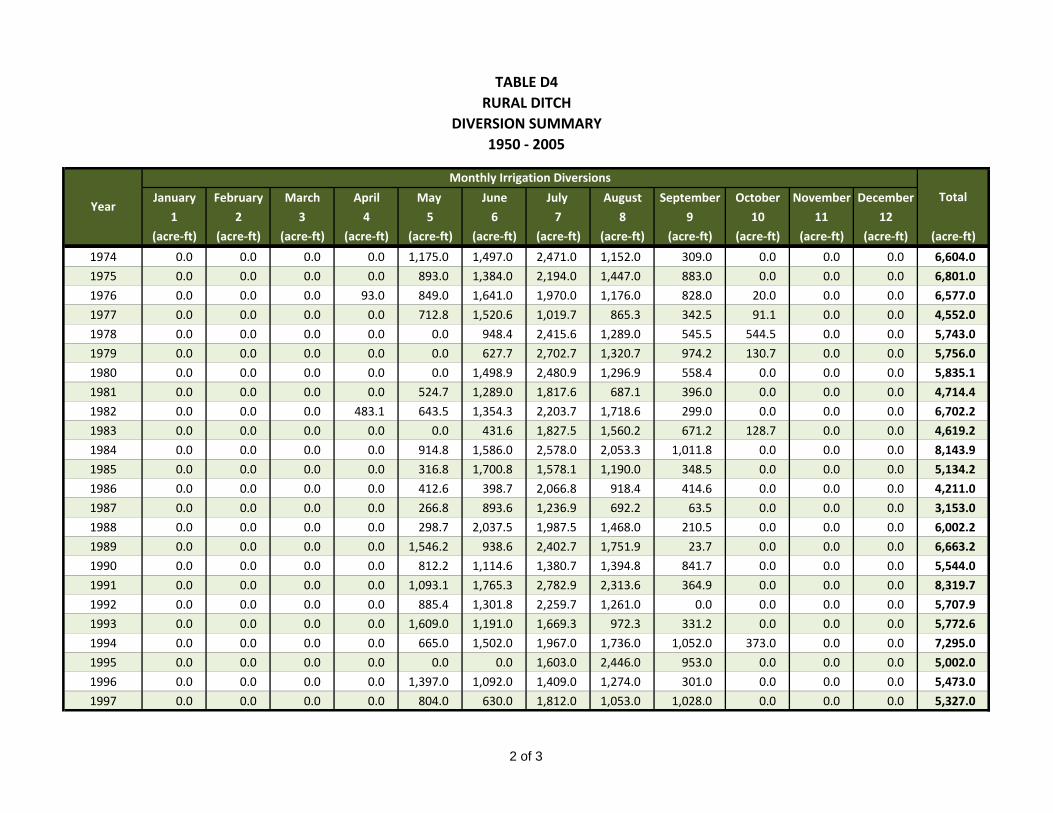
TABLE D4RURAL DITCH
DIVERSION SUMMARY1950 ‐ 2005
January February March April May June July August September October November December
1 2 3 4 5 6 7 8 9 10 11 12
(acre‐ft) (acre‐ft) (acre‐ft) (acre‐ft) (acre‐ft) (acre‐ft) (acre‐ft) (acre‐ft) (acre‐ft) (acre‐ft) (acre‐ft) (acre‐ft) (acre‐ft)
Year
Monthly Irrigation Diversions
Total
1974 0.0 0.0 0.0 0.0 1,175.0 1,497.0 2,471.0 1,152.0 309.0 0.0 0.0 0.0 6,604.0
1975 0.0 0.0 0.0 0.0 893.0 1,384.0 2,194.0 1,447.0 883.0 0.0 0.0 0.0 6,801.0
1976 0.0 0.0 0.0 93.0 849.0 1,641.0 1,970.0 1,176.0 828.0 20.0 0.0 0.0 6,577.0
1977 0.0 0.0 0.0 0.0 712.8 1,520.6 1,019.7 865.3 342.5 91.1 0.0 0.0 4,552.0
1978 0.0 0.0 0.0 0.0 0.0 948.4 2,415.6 1,289.0 545.5 544.5 0.0 0.0 5,743.0
1979 0.0 0.0 0.0 0.0 0.0 627.7 2,702.7 1,320.7 974.2 130.7 0.0 0.0 5,756.0
1980 0.0 0.0 0.0 0.0 0.0 1,498.9 2,480.9 1,296.9 558.4 0.0 0.0 0.0 5,835.1
1981 0.0 0.0 0.0 0.0 524.7 1,289.0 1,817.6 687.1 396.0 0.0 0.0 0.0 4,714.4
1982 0.0 0.0 0.0 483.1 643.5 1,354.3 2,203.7 1,718.6 299.0 0.0 0.0 0.0 6,702.2
1983 0.0 0.0 0.0 0.0 0.0 431.6 1,827.5 1,560.2 671.2 128.7 0.0 0.0 4,619.2
1984 0.0 0.0 0.0 0.0 914.8 1,586.0 2,578.0 2,053.3 1,011.8 0.0 0.0 0.0 8,143.9
1985 0.0 0.0 0.0 0.0 316.8 1,700.8 1,578.1 1,190.0 348.5 0.0 0.0 0.0 5,134.2
1986 0.0 0.0 0.0 0.0 412.6 398.7 2,066.8 918.4 414.6 0.0 0.0 0.0 4,211.0
1987 0.0 0.0 0.0 0.0 266.8 893.6 1,236.9 692.2 63.5 0.0 0.0 0.0 3,153.0
1988 0.0 0.0 0.0 0.0 298.7 2,037.5 1,987.5 1,468.0 210.5 0.0 0.0 0.0 6,002.2
1989 0.0 0.0 0.0 0.0 1,546.2 938.6 2,402.7 1,751.9 23.7 0.0 0.0 0.0 6,663.2
1990 0.0 0.0 0.0 0.0 812.2 1,114.6 1,380.7 1,394.8 841.7 0.0 0.0 0.0 5,544.0
1991 0.0 0.0 0.0 0.0 1,093.1 1,765.3 2,782.9 2,313.6 364.9 0.0 0.0 0.0 8,319.7
1992 0.0 0.0 0.0 0.0 885.4 1,301.8 2,259.7 1,261.0 0.0 0.0 0.0 0.0 5,707.9
1993 0.0 0.0 0.0 0.0 1,609.0 1,191.0 1,669.3 972.3 331.2 0.0 0.0 0.0 5,772.6
1994 0.0 0.0 0.0 0.0 665.0 1,502.0 1,967.0 1,736.0 1,052.0 373.0 0.0 0.0 7,295.0
1995 0.0 0.0 0.0 0.0 0.0 0.0 1,603.0 2,446.0 953.0 0.0 0.0 0.0 5,002.0
1996 0.0 0.0 0.0 0.0 1,397.0 1,092.0 1,409.0 1,274.0 301.0 0.0 0.0 0.0 5,473.0
1997 0.0 0.0 0.0 0.0 804.0 630.0 1,812.0 1,053.0 1,028.0 0.0 0.0 0.0 5,327.0
2 of 3
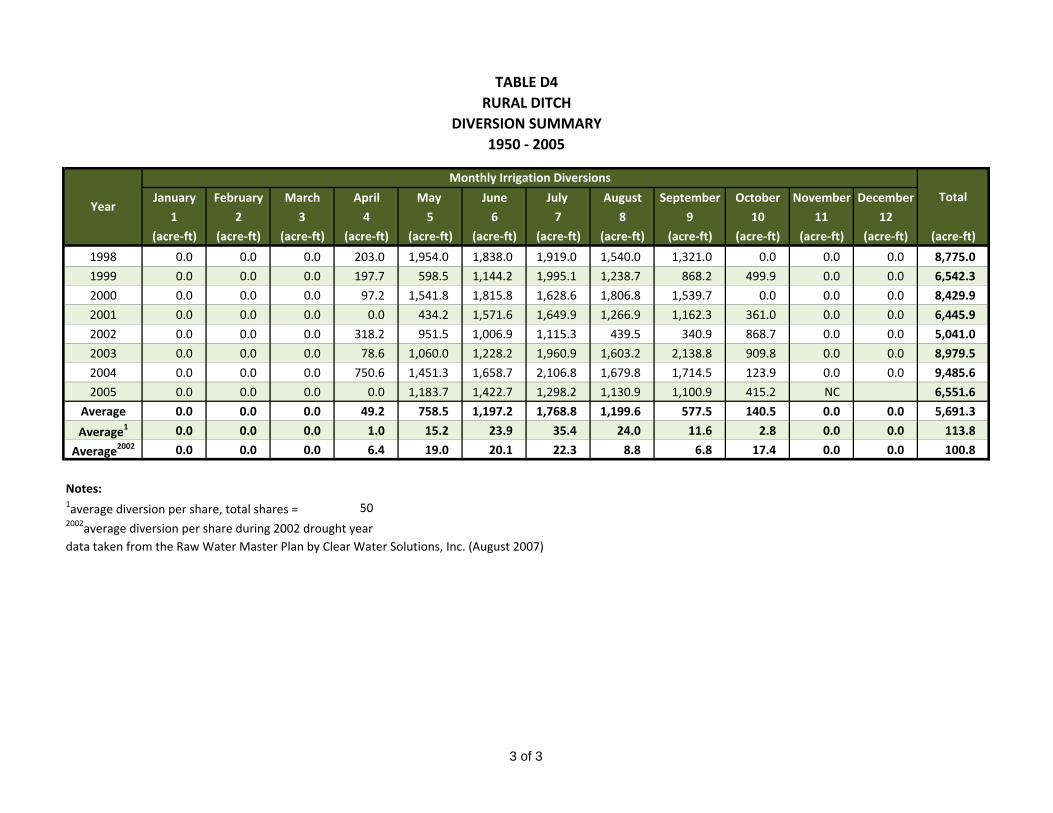
TABLE D4RURAL DITCH
DIVERSION SUMMARY1950 ‐ 2005
January February March April May June July August September October November December
1 2 3 4 5 6 7 8 9 10 11 12
(acre‐ft) (acre‐ft) (acre‐ft) (acre‐ft) (acre‐ft) (acre‐ft) (acre‐ft) (acre‐ft) (acre‐ft) (acre‐ft) (acre‐ft) (acre‐ft) (acre‐ft)
Year
Monthly Irrigation Diversions
Total
1998 0.0 0.0 0.0 203.0 1,954.0 1,838.0 1,919.0 1,540.0 1,321.0 0.0 0.0 0.0 8,775.0
1999 0.0 0.0 0.0 197.7 598.5 1,144.2 1,995.1 1,238.7 868.2 499.9 0.0 0.0 6,542.3
2000 0.0 0.0 0.0 97.2 1,541.8 1,815.8 1,628.6 1,806.8 1,539.7 0.0 0.0 0.0 8,429.9
2001 0.0 0.0 0.0 0.0 434.2 1,571.6 1,649.9 1,266.9 1,162.3 361.0 0.0 0.0 6,445.9
2002 0.0 0.0 0.0 318.2 951.5 1,006.9 1,115.3 439.5 340.9 868.7 0.0 0.0 5,041.0
2003 0.0 0.0 0.0 78.6 1,060.0 1,228.2 1,960.9 1,603.2 2,138.8 909.8 0.0 0.0 8,979.5
2004 0.0 0.0 0.0 750.6 1,451.3 1,658.7 2,106.8 1,679.8 1,714.5 123.9 0.0 0.0 9,485.6
2005 0.0 0.0 0.0 0.0 1,183.7 1,422.7 1,298.2 1,130.9 1,100.9 415.2 NC 6,551.6
Average 0.0 0.0 0.0 49.2 758.5 1,197.2 1,768.8 1,199.6 577.5 140.5 0.0 0.0 5,691.3
Average1 0.0 0.0 0.0 1.0 15.2 23.9 35.4 24.0 11.6 2.8 0.0 0.0 113.8
Average2002 0.0 0.0 0.0 6.4 19.0 20.1 22.3 8.8 6.8 17.4 0.0 0.0 100.8
Notes:1average diversion per share, total shares = 502002average diversion per share during 2002 drought yeardata taken from the Raw Water Master Plan by Clear Water Solutions, Inc. (August 2007)
3 of 3
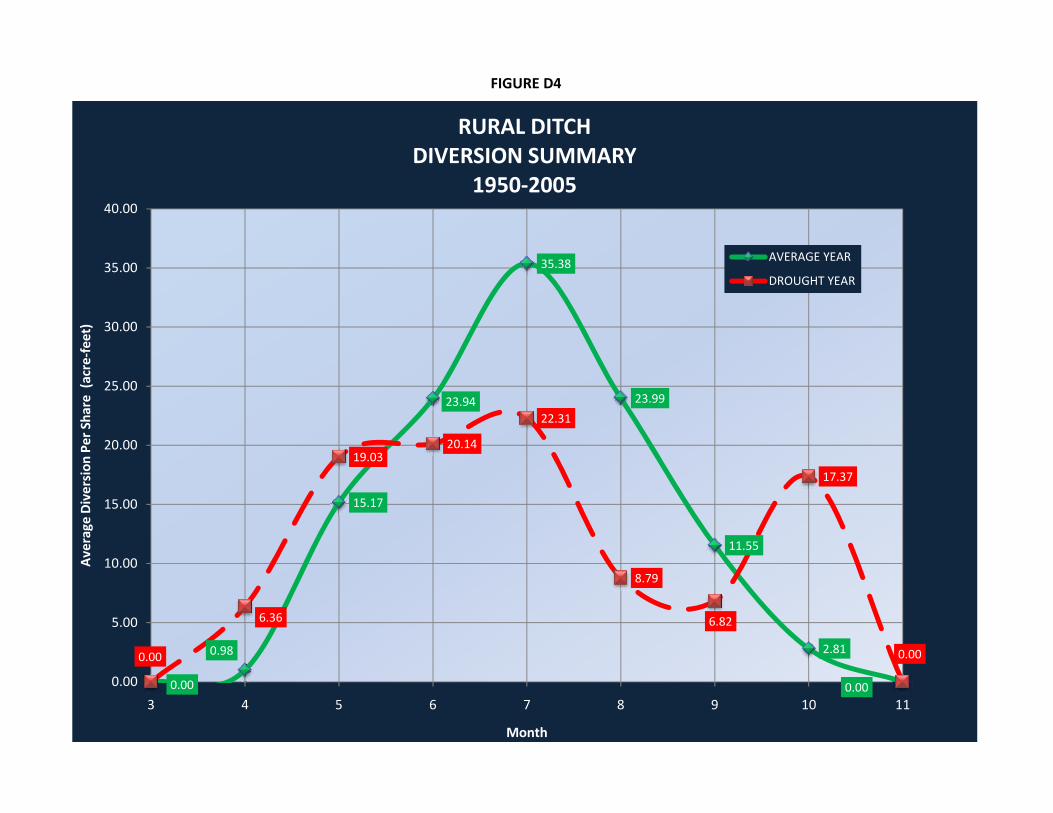
FIGURE D4
23.94
35.38
23.99
19.0320.14
22.31
17 37
20.00
25.00
30.00
35.00
40.00
sion
Per Sha
re (acre‐feet)
RURAL DITCHDIVERSION SUMMARY
1950‐2005
AVERAGE YEAR
DROUGHT YEAR
0.00
0.98
15.17
11.55
2.81
0.00
0.00
6.36
8.79
6.82
17.37
0.00
0.00
5.00
10.00
15.00
3 4 5 6 7 8 9 10 11
Average
Divers
Month
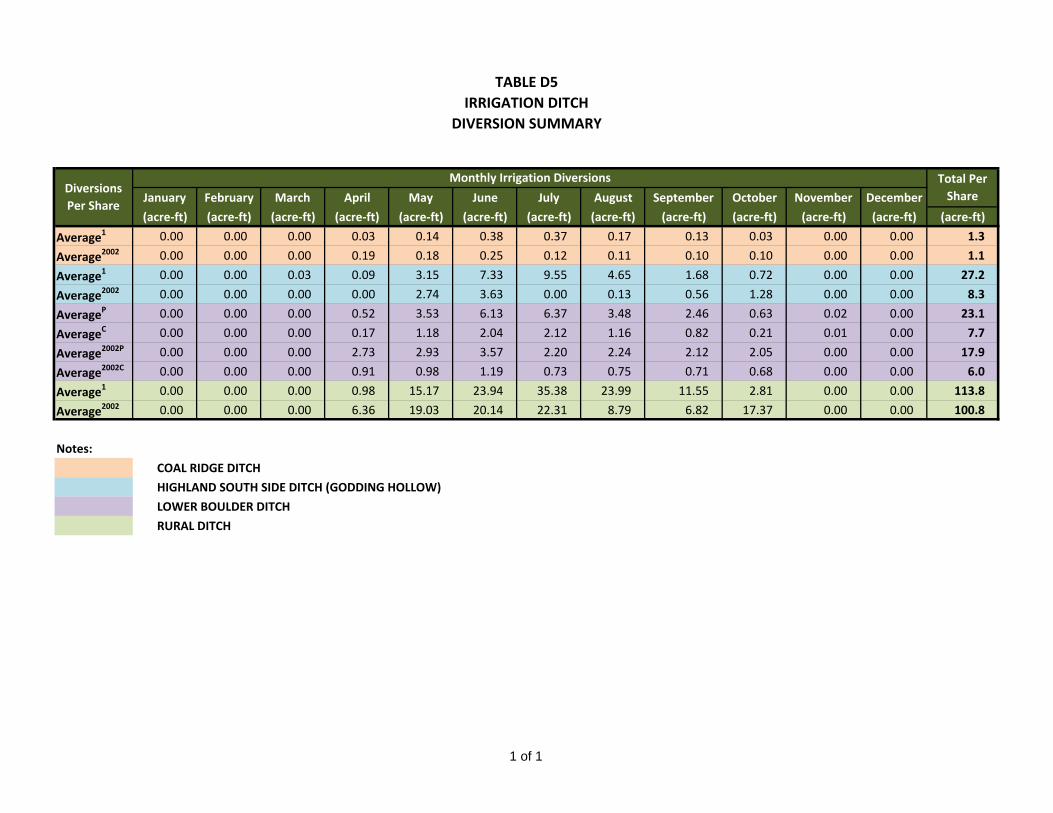
TABLE D5IRRIGATION DITCH
DIVERSION SUMMARY
January February March April May June July August September October November December
(acre‐ft) (acre‐ft) (acre‐ft) (acre‐ft) (acre‐ft) (acre‐ft) (acre‐ft) (acre‐ft) (acre‐ft) (acre‐ft) (acre‐ft) (acre‐ft) (acre‐ft)
Average1 0.00 0.00 0.00 0.03 0.14 0.38 0.37 0.17 0.13 0.03 0.00 0.00 1.3
Average2002 0.00 0.00 0.00 0.19 0.18 0.25 0.12 0.11 0.10 0.10 0.00 0.00 1.1
Average1 0.00 0.00 0.03 0.09 3.15 7.33 9.55 4.65 1.68 0.72 0.00 0.00 27.2
Average2002 0.00 0.00 0.00 0.00 2.74 3.63 0.00 0.13 0.56 1.28 0.00 0.00 8.3
AverageP 0.00 0.00 0.00 0.52 3.53 6.13 6.37 3.48 2.46 0.63 0.02 0.00 23.1
AverageC 0.00 0.00 0.00 0.17 1.18 2.04 2.12 1.16 0.82 0.21 0.01 0.00 7.7
Average2002P 0.00 0.00 0.00 2.73 2.93 3.57 2.20 2.24 2.12 2.05 0.00 0.00 17.9
Average2002C 0.00 0.00 0.00 0.91 0.98 1.19 0.73 0.75 0.71 0.68 0.00 0.00 6.0
Average1 0.00 0.00 0.00 0.98 15.17 23.94 35.38 23.99 11.55 2.81 0.00 0.00 113.8
Average2002 0.00 0.00 0.00 6.36 19.03 20.14 22.31 8.79 6.82 17.37 0.00 0.00 100.8
Notes:
COAL RIDGE DITCH
HIGHLAND SOUTH SIDE DITCH (GODDING HOLLOW)
LOWER BOULDER DITCH
RURAL DITCH
Diversions Per Share
Monthly Irrigation Diversions Total Per Share
1 of 1
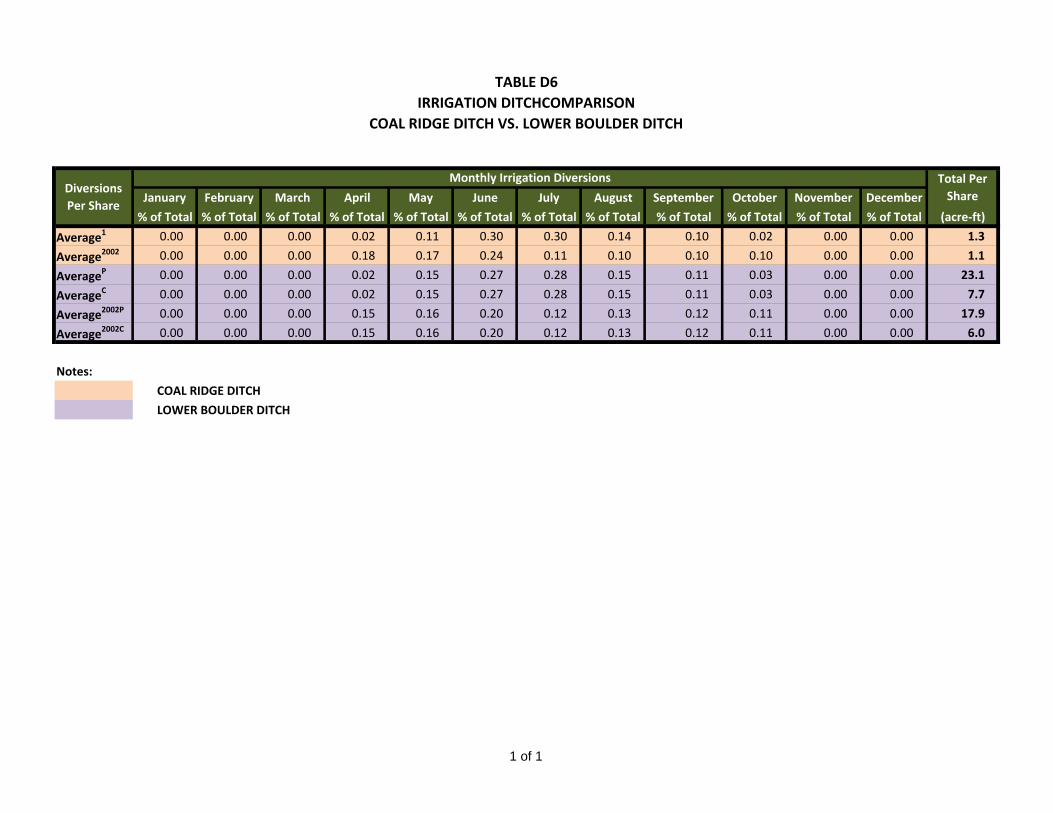
TABLE D6IRRIGATION DITCHCOMPARISON
COAL RIDGE DITCH VS. LOWER BOULDER DITCH
January February March April May June July August September October November December
% of Total % of Total % of Total % of Total % of Total % of Total % of Total % of Total % of Total % of Total % of Total % of Total (acre‐ft)
Average1 0.00 0.00 0.00 0.02 0.11 0.30 0.30 0.14 0.10 0.02 0.00 0.00 1.3
Average2002 0.00 0.00 0.00 0.18 0.17 0.24 0.11 0.10 0.10 0.10 0.00 0.00 1.1
AverageP 0.00 0.00 0.00 0.02 0.15 0.27 0.28 0.15 0.11 0.03 0.00 0.00 23.1
AverageC 0.00 0.00 0.00 0.02 0.15 0.27 0.28 0.15 0.11 0.03 0.00 0.00 7.7
Average2002P 0.00 0.00 0.00 0.15 0.16 0.20 0.12 0.13 0.12 0.11 0.00 0.00 17.9
Average2002C 0.00 0.00 0.00 0.15 0.16 0.20 0.12 0.13 0.12 0.11 0.00 0.00 6.0
Notes:
COAL RIDGE DITCH
LOWER BOULDER DITCH
Diversions Per Share
Monthly Irrigation Diversions Total Per Share
1 of 1
Raw Water Irrigation System Master Plan March 2010
E
Appendix E: Storage Calculations
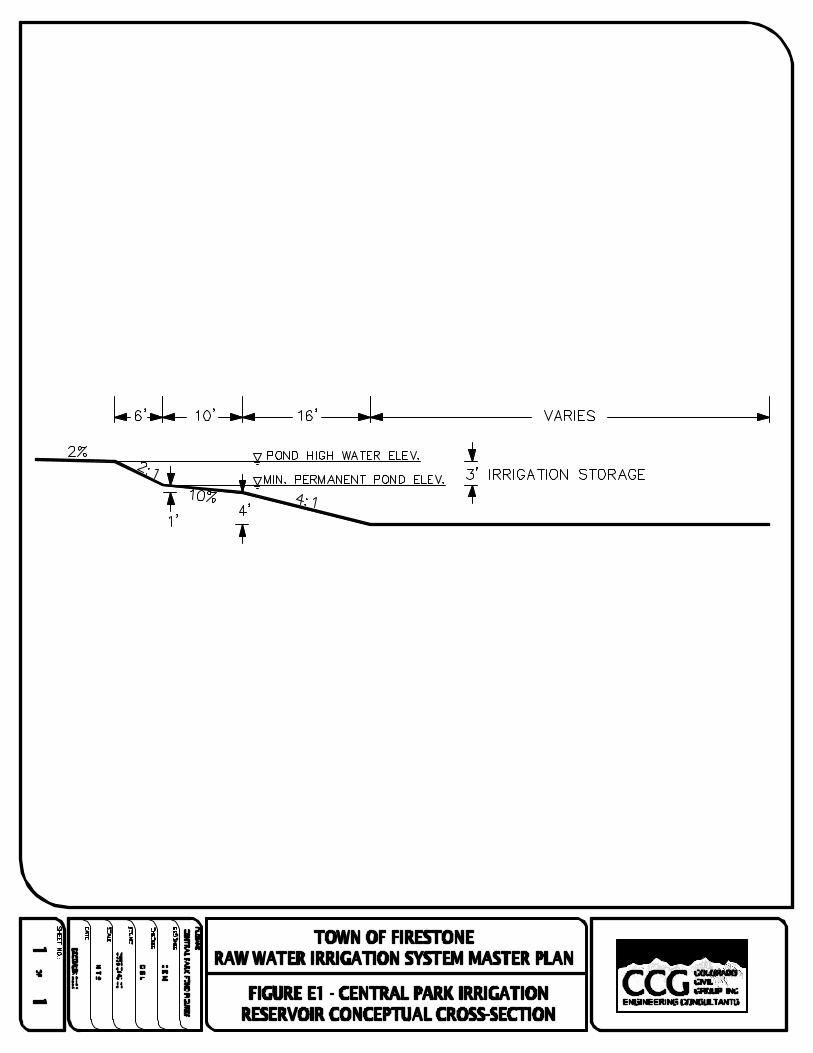

TABLE E1FIRESTONE CENTRAL PARKIRRIGATION RESERVOIR STAGE‐STORAGE DATA
Elevation1 Depth2 Radius Perimeter
(feet) (feet) (feet) (feet) (ft2) (acres) (ft3) (acre‐feet)3
Notes:1water surface elevations are approximate2water below 5.0 feet is not assumed for irrigation storage3total irrigation storage = 60.09 acre‐feet
4945
4944
4943
4942
Incremental Storage
8.0
7.0879,150 20.18
872,515 20.036.0
875,826
3,305
5.0865,905 19.88
20.26
20.11
Irrigation Pond Data
19.95
19.80
530.0
528.0
526.0
524.0
Surface Area
3,292 862,606
869,203
3,330 882,473
3,318
3,129 779,128
4.0
3.0
2.0
1.0
0.0
3,154
3,230
3,204
3,179
829,996
817,128
804,361
791,694
19.05
18.76
18.47
18.17
17.89
846,301 19.43
823,562
810,745
798,027
785,411
18.91
18.61
18.32
18.03
4941
4940
4939
4938
4937
514.0
510.0
506.0
502.0
498.0
Page 1 of 1
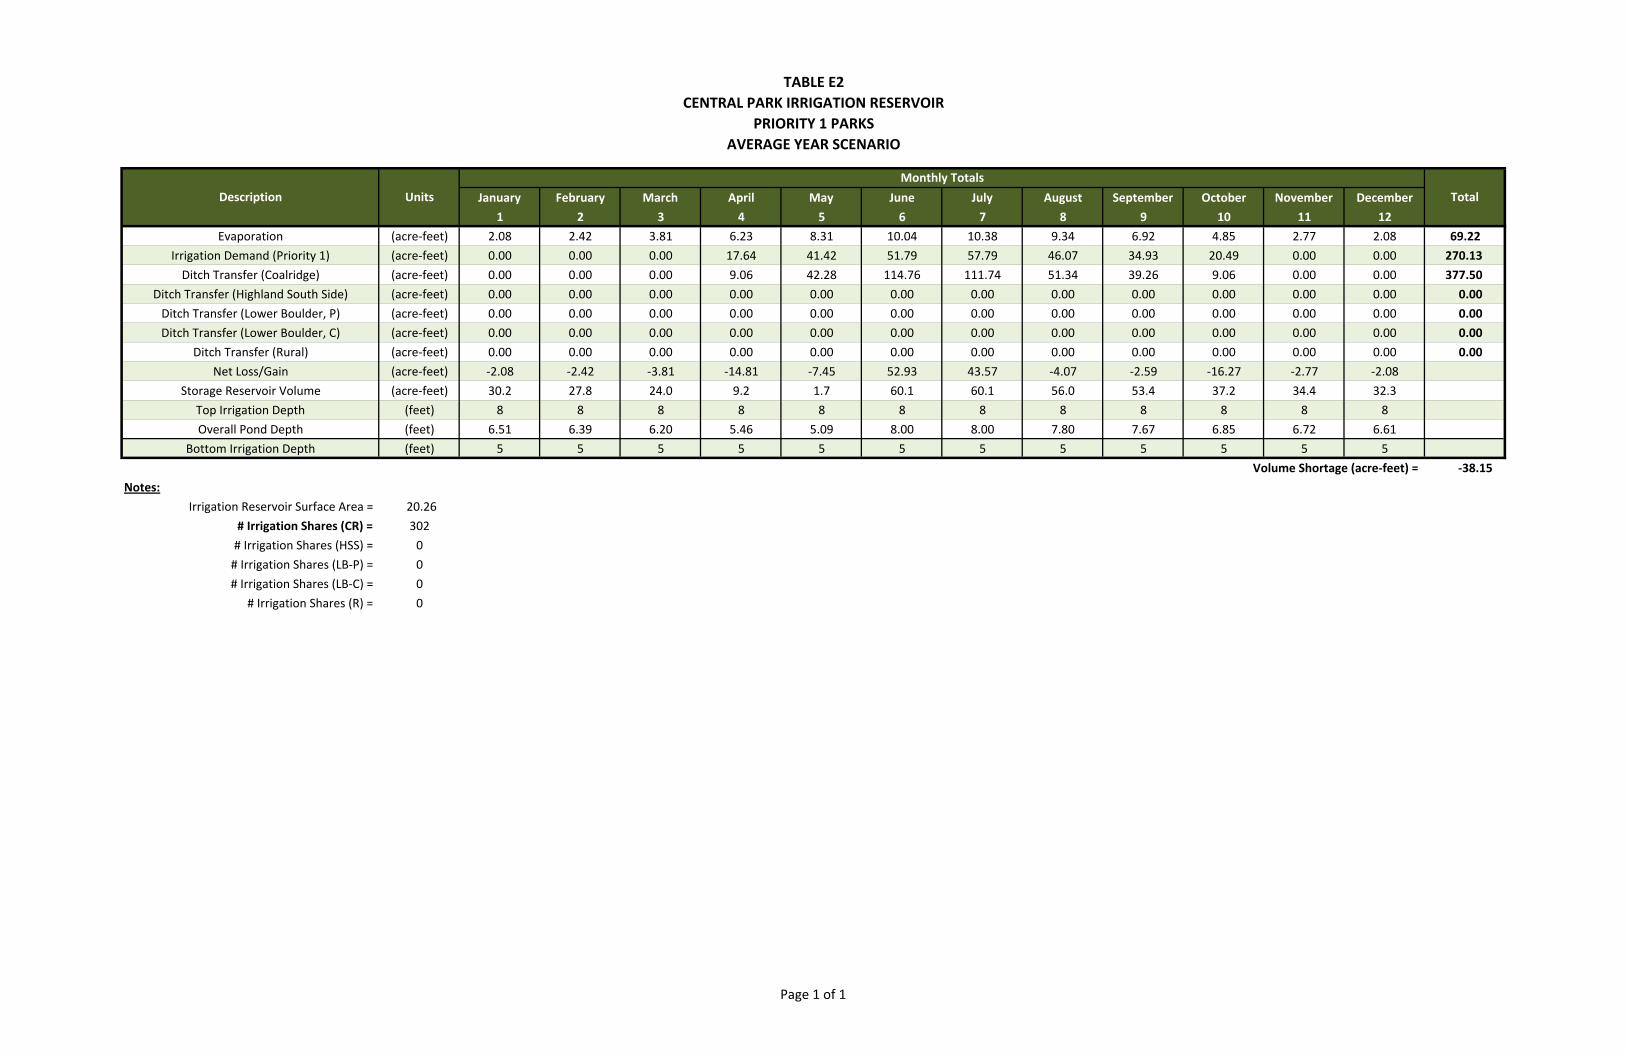
TABLE E2CENTRAL PARK IRRIGATION RESERVOIR
PRIORITY 1 PARKSAVERAGE YEAR SCENARIO
January February March April May June July August September October November December
1 2 3 4 5 6 7 8 9 10 11 12
Evaporation (acre‐feet) 2.08 2.42 3.81 6.23 8.31 10.04 10.38 9.34 6.92 4.85 2.77 2.08 69.22
Irrigation Demand (Priority 1) (acre‐feet) 0.00 0.00 0.00 17.64 41.42 51.79 57.79 46.07 34.93 20.49 0.00 0.00 270.13
Ditch Transfer (Coalridge) (acre‐feet) 0.00 0.00 0.00 9.06 42.28 114.76 111.74 51.34 39.26 9.06 0.00 0.00 377.50
Ditch Transfer (Highland South Side) (acre‐feet) 0.00 0.00 0.00 0.00 0.00 0.00 0.00 0.00 0.00 0.00 0.00 0.00 0.00
Ditch Transfer (Lower Boulder, P) (acre‐feet) 0.00 0.00 0.00 0.00 0.00 0.00 0.00 0.00 0.00 0.00 0.00 0.00 0.00
Ditch Transfer (Lower Boulder, C) (acre‐feet) 0.00 0.00 0.00 0.00 0.00 0.00 0.00 0.00 0.00 0.00 0.00 0.00 0.00
Ditch Transfer (Rural) (acre‐feet) 0.00 0.00 0.00 0.00 0.00 0.00 0.00 0.00 0.00 0.00 0.00 0.00 0.00
Net Loss/Gain (acre‐feet) ‐2.08 ‐2.42 ‐3.81 ‐14.81 ‐7.45 52.93 43.57 ‐4.07 ‐2.59 ‐16.27 ‐2.77 ‐2.08
Storage Reservoir Volume (acre‐feet) 30.2 27.8 24.0 9.2 1.7 60.1 60.1 56.0 53.4 37.2 34.4 32.3
Top Irrigation Depth (feet) 8 8 8 8 8 8 8 8 8 8 8 8
Overall Pond Depth (feet) 6.51 6.39 6.20 5.46 5.09 8.00 8.00 7.80 7.67 6.85 6.72 6.61
Bottom Irrigation Depth (feet) 5 5 5 5 5 5 5 5 5 5 5 5
Volume Shortage (acre‐feet) = ‐38.15
Notes:
Irrigation Reservoir Surface Area = 20.26
# Irrigation Shares (CR) = 302
# Irrigation Shares (HSS) = 0
# Irrigation Shares (LB‐P) = 0
# Irrigation Shares (LB‐C) = 0
# Irrigation Shares (R) = 0
Description
Monthly Totals
Units Total
Page 1 of 1
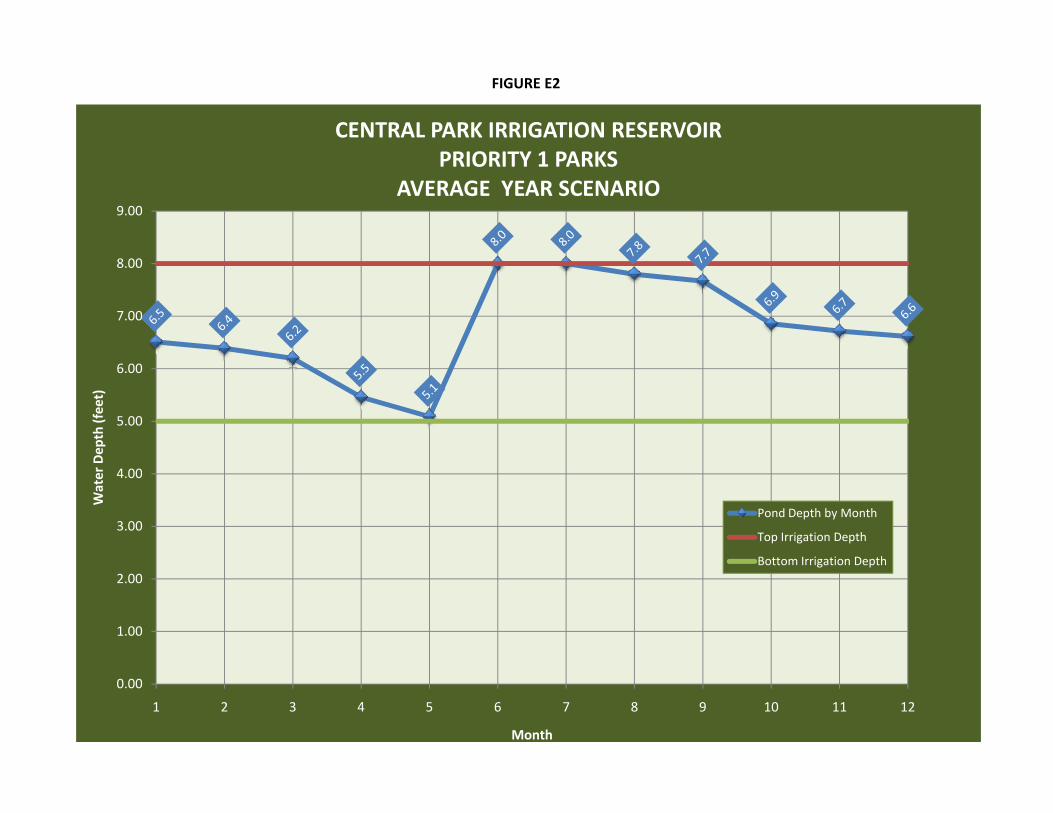
FIGURE E2
4 00
5.00
6.00
7.00
8.00
9.00
er Dep
th (feet)
CENTRAL PARK IRRIGATION RESERVOIRPRIORITY 1 PARKS
AVERAGE YEAR SCENARIO
0.00
1.00
2.00
3.00
4.00
1 2 3 4 5 6 7 8 9 10 11 12
Wate
Month
Pond Depth by Month
Top Irrigation Depth
Bottom Irrigation Depth
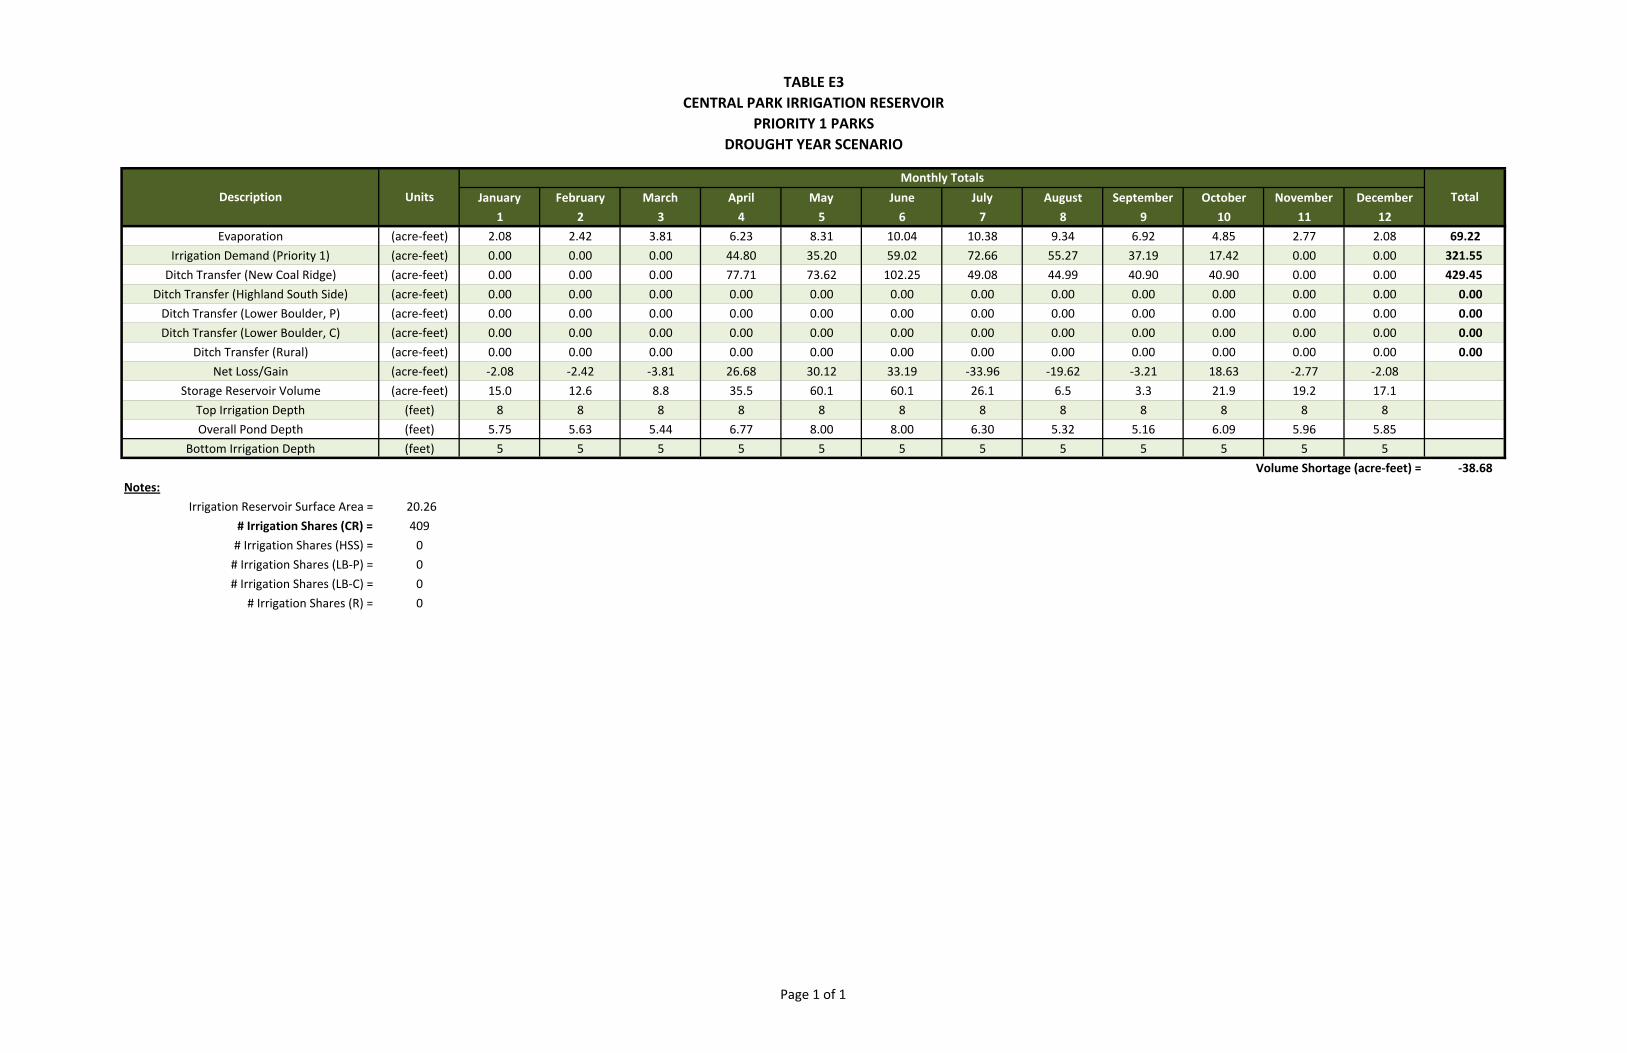
TABLE E3CENTRAL PARK IRRIGATION RESERVOIR
PRIORITY 1 PARKSDROUGHT YEAR SCENARIO
January February March April May June July August September October November December
1 2 3 4 5 6 7 8 9 10 11 12
Evaporation (acre‐feet) 2.08 2.42 3.81 6.23 8.31 10.04 10.38 9.34 6.92 4.85 2.77 2.08 69.22
Irrigation Demand (Priority 1) (acre‐feet) 0.00 0.00 0.00 44.80 35.20 59.02 72.66 55.27 37.19 17.42 0.00 0.00 321.55
Ditch Transfer (New Coal Ridge) (acre‐feet) 0.00 0.00 0.00 77.71 73.62 102.25 49.08 44.99 40.90 40.90 0.00 0.00 429.45
Ditch Transfer (Highland South Side) (acre‐feet) 0.00 0.00 0.00 0.00 0.00 0.00 0.00 0.00 0.00 0.00 0.00 0.00 0.00
Ditch Transfer (Lower Boulder, P) (acre‐feet) 0.00 0.00 0.00 0.00 0.00 0.00 0.00 0.00 0.00 0.00 0.00 0.00 0.00
Ditch Transfer (Lower Boulder, C) (acre‐feet) 0.00 0.00 0.00 0.00 0.00 0.00 0.00 0.00 0.00 0.00 0.00 0.00 0.00
Ditch Transfer (Rural) (acre‐feet) 0.00 0.00 0.00 0.00 0.00 0.00 0.00 0.00 0.00 0.00 0.00 0.00 0.00
Net Loss/Gain (acre‐feet) ‐2.08 ‐2.42 ‐3.81 26.68 30.12 33.19 ‐33.96 ‐19.62 ‐3.21 18.63 ‐2.77 ‐2.08
Storage Reservoir Volume (acre‐feet) 15.0 12.6 8.8 35.5 60.1 60.1 26.1 6.5 3.3 21.9 19.2 17.1
Top Irrigation Depth (feet) 8 8 8 8 8 8 8 8 8 8 8 8
Overall Pond Depth (feet) 5.75 5.63 5.44 6.77 8.00 8.00 6.30 5.32 5.16 6.09 5.96 5.85
Bottom Irrigation Depth (feet) 5 5 5 5 5 5 5 5 5 5 5 5
Volume Shortage (acre‐feet) = ‐38.68
Notes:
Irrigation Reservoir Surface Area = 20.26
# Irrigation Shares (CR) = 409
# Irrigation Shares (HSS) = 0
# Irrigation Shares (LB‐P) = 0
# Irrigation Shares (LB‐C) = 0
# Irrigation Shares (R) = 0
Description
Monthly Totals
Units Total
Page 1 of 1
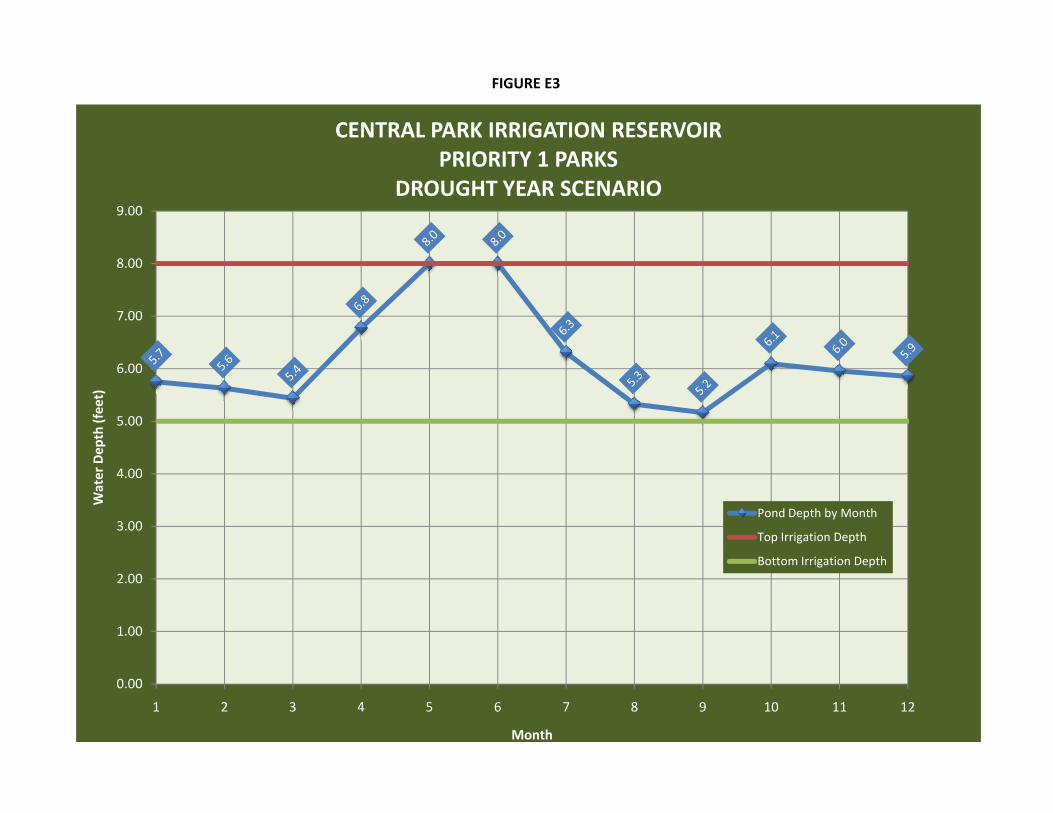
FIGURE E3
4 00
5.00
6.00
7.00
8.00
9.00
er Dep
th (feet)
CENTRAL PARK IRRIGATION RESERVOIRPRIORITY 1 PARKS
DROUGHT YEAR SCENARIO
0.00
1.00
2.00
3.00
4.00
1 2 3 4 5 6 7 8 9 10 11 12
Wate
Month
Pond Depth by Month
Top Irrigation Depth
Bottom Irrigation Depth
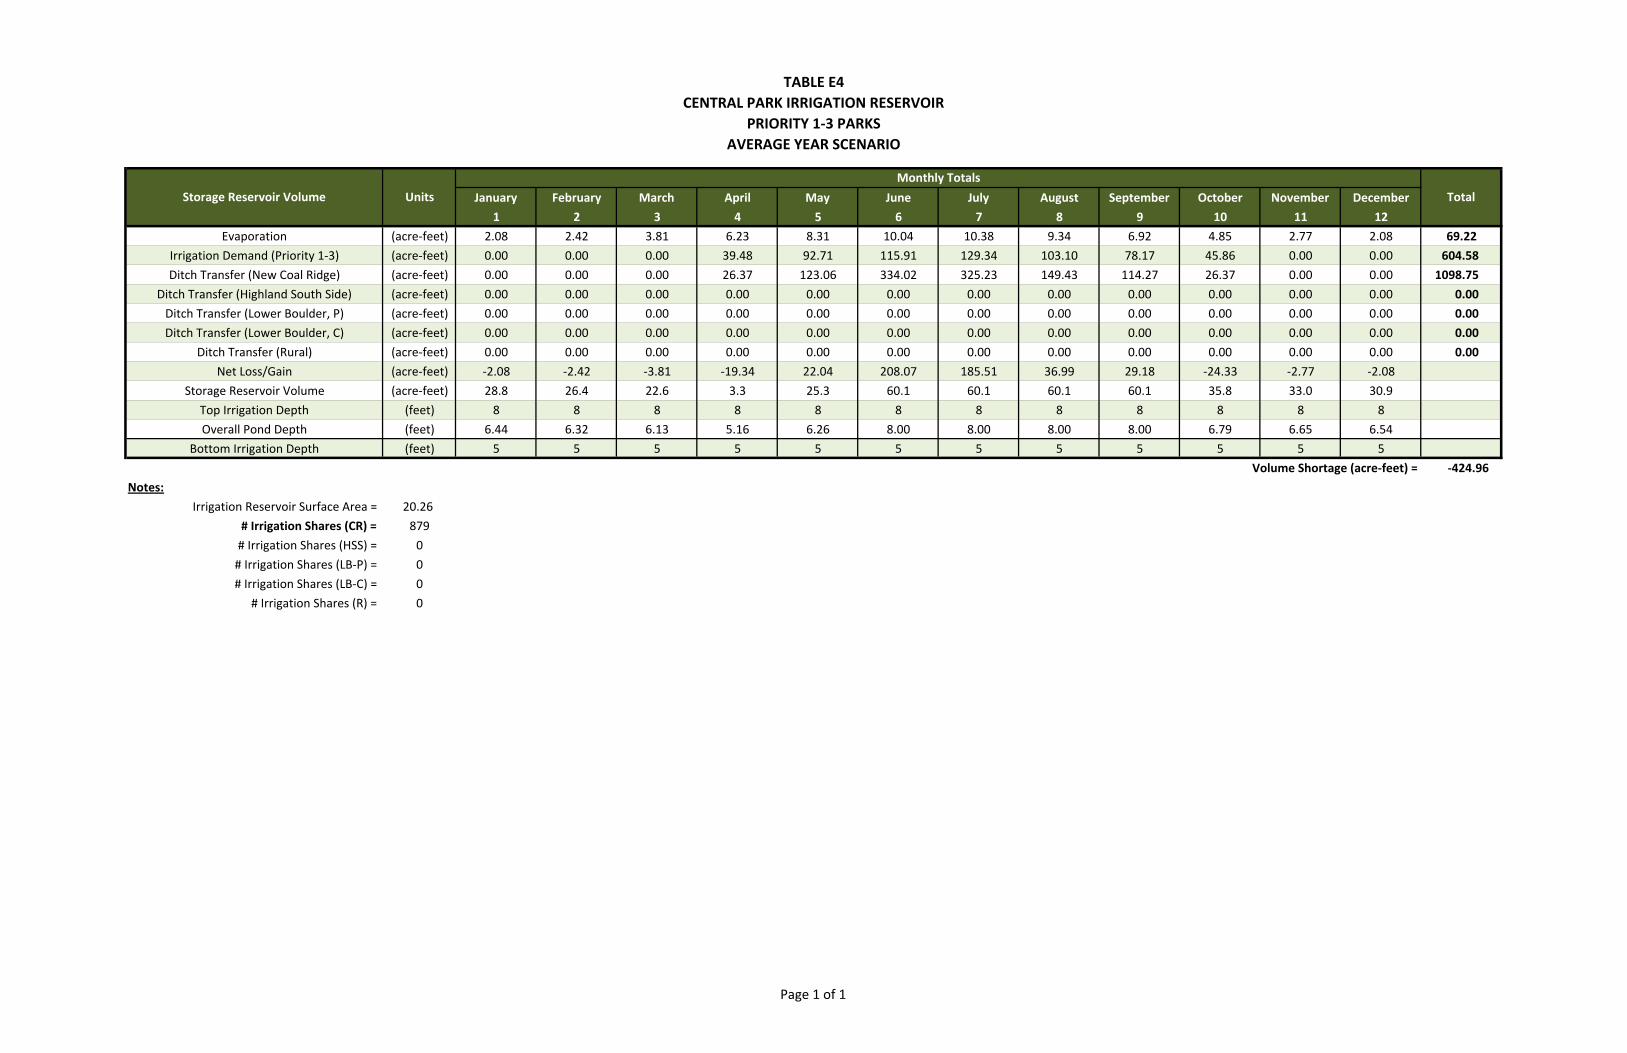
TABLE E4CENTRAL PARK IRRIGATION RESERVOIR
PRIORITY 1‐3 PARKSAVERAGE YEAR SCENARIO
January February March April May June July August September October November December
1 2 3 4 5 6 7 8 9 10 11 12
Evaporation (acre‐feet) 2.08 2.42 3.81 6.23 8.31 10.04 10.38 9.34 6.92 4.85 2.77 2.08 69.22
Irrigation Demand (Priority 1‐3) (acre‐feet) 0.00 0.00 0.00 39.48 92.71 115.91 129.34 103.10 78.17 45.86 0.00 0.00 604.58
Ditch Transfer (New Coal Ridge) (acre‐feet) 0.00 0.00 0.00 26.37 123.06 334.02 325.23 149.43 114.27 26.37 0.00 0.00 1098.75
Ditch Transfer (Highland South Side) (acre‐feet) 0.00 0.00 0.00 0.00 0.00 0.00 0.00 0.00 0.00 0.00 0.00 0.00 0.00
Ditch Transfer (Lower Boulder, P) (acre‐feet) 0.00 0.00 0.00 0.00 0.00 0.00 0.00 0.00 0.00 0.00 0.00 0.00 0.00
Ditch Transfer (Lower Boulder, C) (acre‐feet) 0.00 0.00 0.00 0.00 0.00 0.00 0.00 0.00 0.00 0.00 0.00 0.00 0.00
Ditch Transfer (Rural) (acre‐feet) 0.00 0.00 0.00 0.00 0.00 0.00 0.00 0.00 0.00 0.00 0.00 0.00 0.00
Net Loss/Gain (acre‐feet) ‐2.08 ‐2.42 ‐3.81 ‐19.34 22.04 208.07 185.51 36.99 29.18 ‐24.33 ‐2.77 ‐2.08
Storage Reservoir Volume (acre‐feet) 28.8 26.4 22.6 3.3 25.3 60.1 60.1 60.1 60.1 35.8 33.0 30.9
Top Irrigation Depth (feet) 8 8 8 8 8 8 8 8 8 8 8 8
Overall Pond Depth (feet) 6.44 6.32 6.13 5.16 6.26 8.00 8.00 8.00 8.00 6.79 6.65 6.54
Bottom Irrigation Depth (feet) 5 5 5 5 5 5 5 5 5 5 5 5
Volume Shortage (acre‐feet) = ‐424.96
Notes:
Irrigation Reservoir Surface Area = 20.26
# Irrigation Shares (CR) = 879
# Irrigation Shares (HSS) = 0
# Irrigation Shares (LB‐P) = 0
# Irrigation Shares (LB‐C) = 0
# Irrigation Shares (R) = 0
Storage Reservoir Volume
Monthly Totals
Units Total
Page 1 of 1
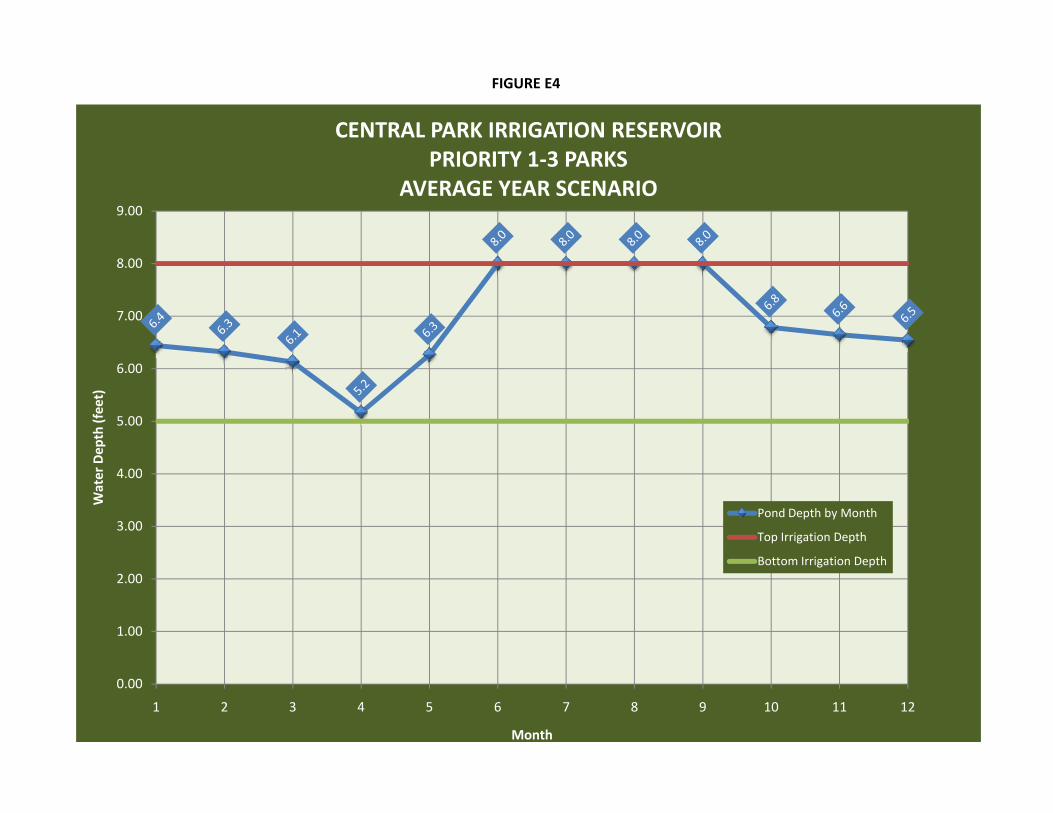
FIGURE E4
4 00
5.00
6.00
7.00
8.00
9.00
er Dep
th (feet)
CENTRAL PARK IRRIGATION RESERVOIRPRIORITY 1‐3 PARKS
AVERAGE YEAR SCENARIO
0.00
1.00
2.00
3.00
4.00
1 2 3 4 5 6 7 8 9 10 11 12
Wate
Month
Pond Depth by Month
Top Irrigation Depth
Bottom Irrigation Depth
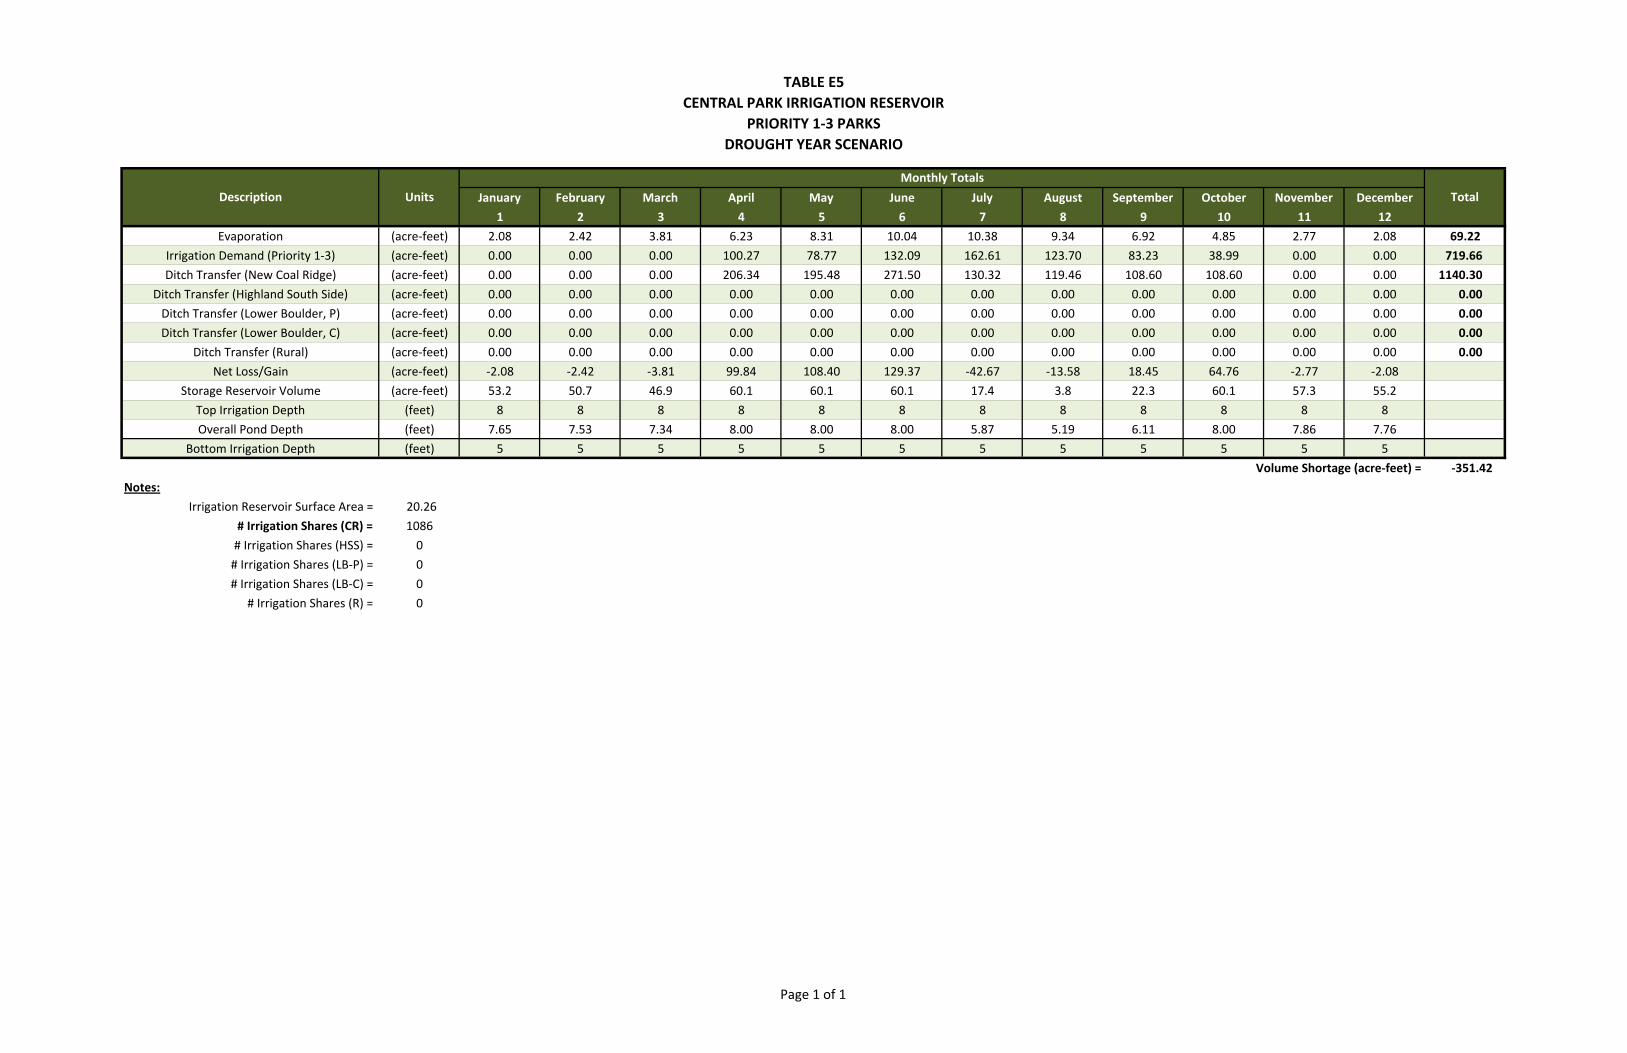
TABLE E5CENTRAL PARK IRRIGATION RESERVOIR
PRIORITY 1‐3 PARKSDROUGHT YEAR SCENARIO
January February March April May June July August September October November December
1 2 3 4 5 6 7 8 9 10 11 12
Evaporation (acre‐feet) 2.08 2.42 3.81 6.23 8.31 10.04 10.38 9.34 6.92 4.85 2.77 2.08 69.22
Irrigation Demand (Priority 1‐3) (acre‐feet) 0.00 0.00 0.00 100.27 78.77 132.09 162.61 123.70 83.23 38.99 0.00 0.00 719.66
Ditch Transfer (New Coal Ridge) (acre‐feet) 0.00 0.00 0.00 206.34 195.48 271.50 130.32 119.46 108.60 108.60 0.00 0.00 1140.30
Ditch Transfer (Highland South Side) (acre‐feet) 0.00 0.00 0.00 0.00 0.00 0.00 0.00 0.00 0.00 0.00 0.00 0.00 0.00
Ditch Transfer (Lower Boulder, P) (acre‐feet) 0.00 0.00 0.00 0.00 0.00 0.00 0.00 0.00 0.00 0.00 0.00 0.00 0.00
Ditch Transfer (Lower Boulder, C) (acre‐feet) 0.00 0.00 0.00 0.00 0.00 0.00 0.00 0.00 0.00 0.00 0.00 0.00 0.00
Ditch Transfer (Rural) (acre‐feet) 0.00 0.00 0.00 0.00 0.00 0.00 0.00 0.00 0.00 0.00 0.00 0.00 0.00
Net Loss/Gain (acre‐feet) ‐2.08 ‐2.42 ‐3.81 99.84 108.40 129.37 ‐42.67 ‐13.58 18.45 64.76 ‐2.77 ‐2.08
Storage Reservoir Volume (acre‐feet) 53.2 50.7 46.9 60.1 60.1 60.1 17.4 3.8 22.3 60.1 57.3 55.2
Top Irrigation Depth (feet) 8 8 8 8 8 8 8 8 8 8 8 8
Overall Pond Depth (feet) 7.65 7.53 7.34 8.00 8.00 8.00 5.87 5.19 6.11 8.00 7.86 7.76
Bottom Irrigation Depth (feet) 5 5 5 5 5 5 5 5 5 5 5 5
Volume Shortage (acre‐feet) = ‐351.42
Notes:
Irrigation Reservoir Surface Area = 20.26
# Irrigation Shares (CR) = 1086
# Irrigation Shares (HSS) = 0
# Irrigation Shares (LB‐P) = 0
# Irrigation Shares (LB‐C) = 0
# Irrigation Shares (R) = 0
Description
Monthly Totals
Units Total
Page 1 of 1
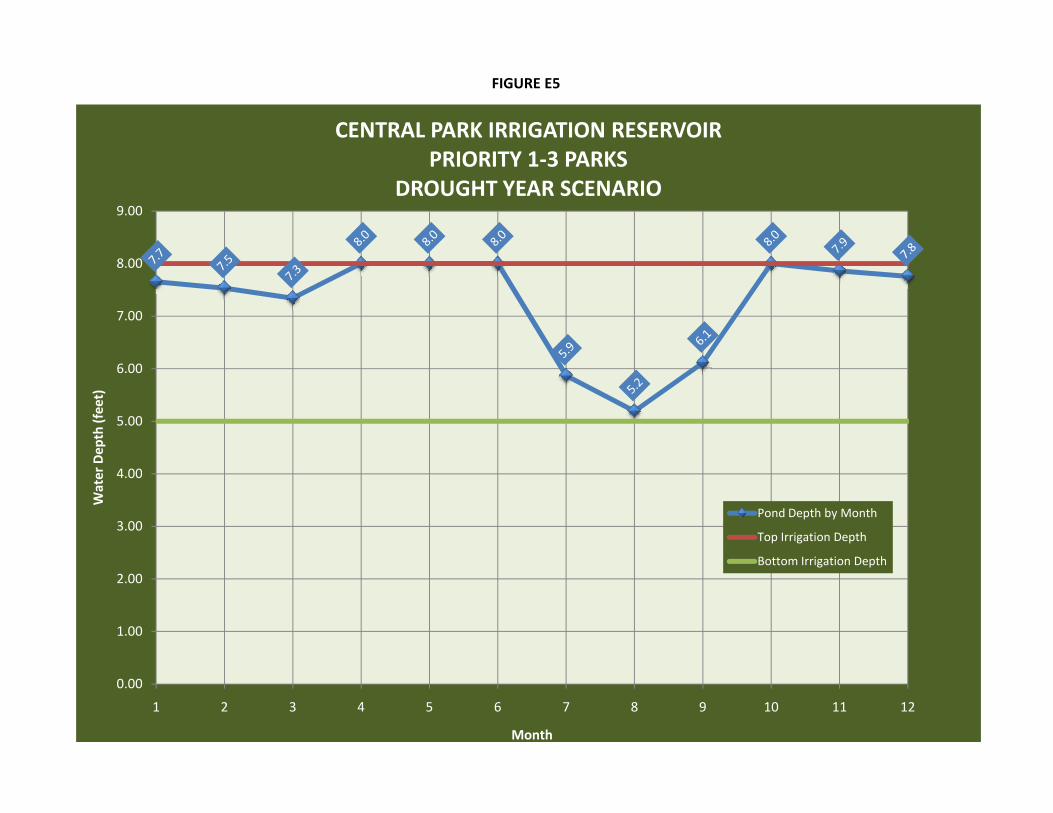
FIGURE E5
4 00
5.00
6.00
7.00
8.00
9.00
er Dep
th (feet)
CENTRAL PARK IRRIGATION RESERVOIRPRIORITY 1‐3 PARKS
DROUGHT YEAR SCENARIO
0.00
1.00
2.00
3.00
4.00
1 2 3 4 5 6 7 8 9 10 11 12
Wate
Month
Pond Depth by Month
Top Irrigation Depth
Bottom Irrigation Depth
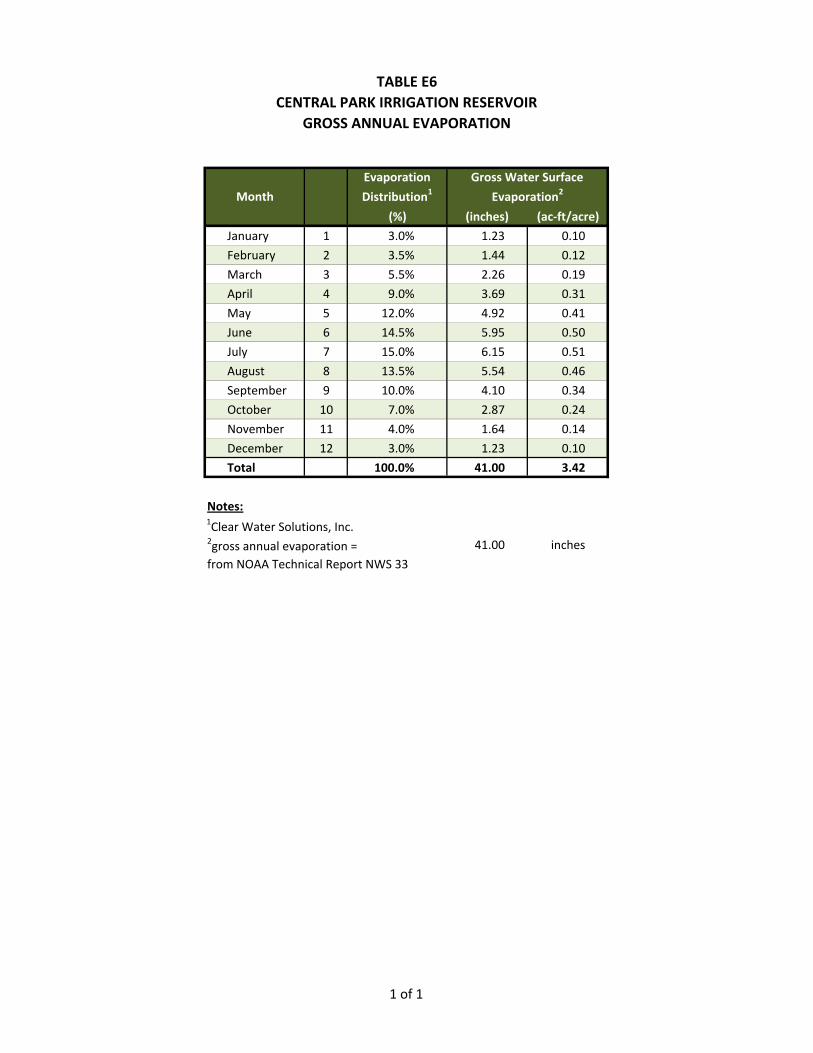
TABLE E6CENTRAL PARK IRRIGATION RESERVOIR
GROSS ANNUAL EVAPORATION
(%) (inches) (ac‐ft/acre)
January 1 3.0% 1.23 0.10
February 2 3.5% 1.44 0.12
March 3 5.5% 2.26 0.19
April 4 9.0% 3.69 0.31
May 5 12.0% 4.92 0.41
June 6 14.5% 5.95 0.50
July 7 15.0% 6.15 0.51
August 8 13.5% 5.54 0.46
September 9 10.0% 4.10 0.34
October 10 7.0% 2.87 0.24
November 11 4.0% 1.64 0.14
December 12 3.0% 1.23 0.10
Total 100.0% 41.00 3.42
Notes:1Clear Water Solutions, Inc.2gross annual evaporation = 41.00 inches
from NOAA Technical Report NWS 33
Month
Evaporation
Distribution1
Gross Water Surface
Evaporation2
1 of 1
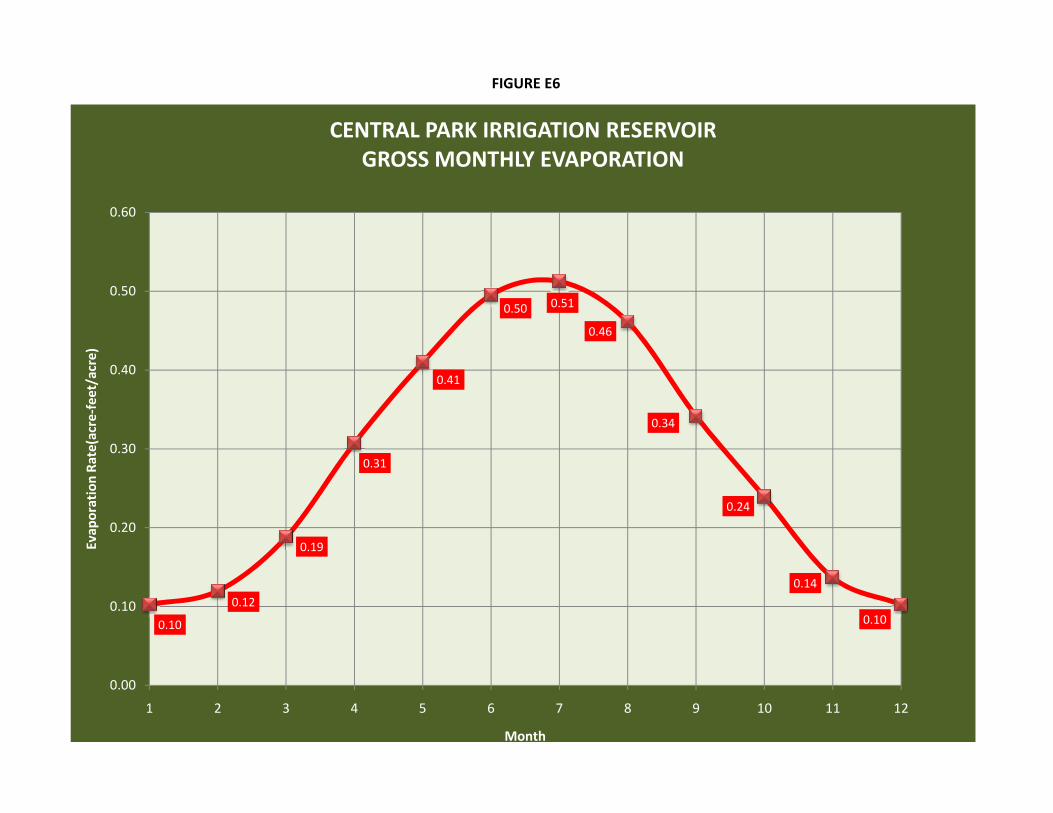
FIGURE E6
0.31
0.41
0.50 0.51
0.46
0.34
0.30
0.40
0.50
0.60
Rate(acre‐feet/acre)
CENTRAL PARK IRRIGATION RESERVOIRGROSS MONTHLY EVAPORATION
0.10
0.12
0.19
0.24
0.14
0.10
0.00
0.10
0.20
1 2 3 4 5 6 7 8 9 10 11 12
Evap
oration
Month
Raw Water Irrigation System Master Plan March 2010
F
Appendix F: Transfer Pump System Calculations
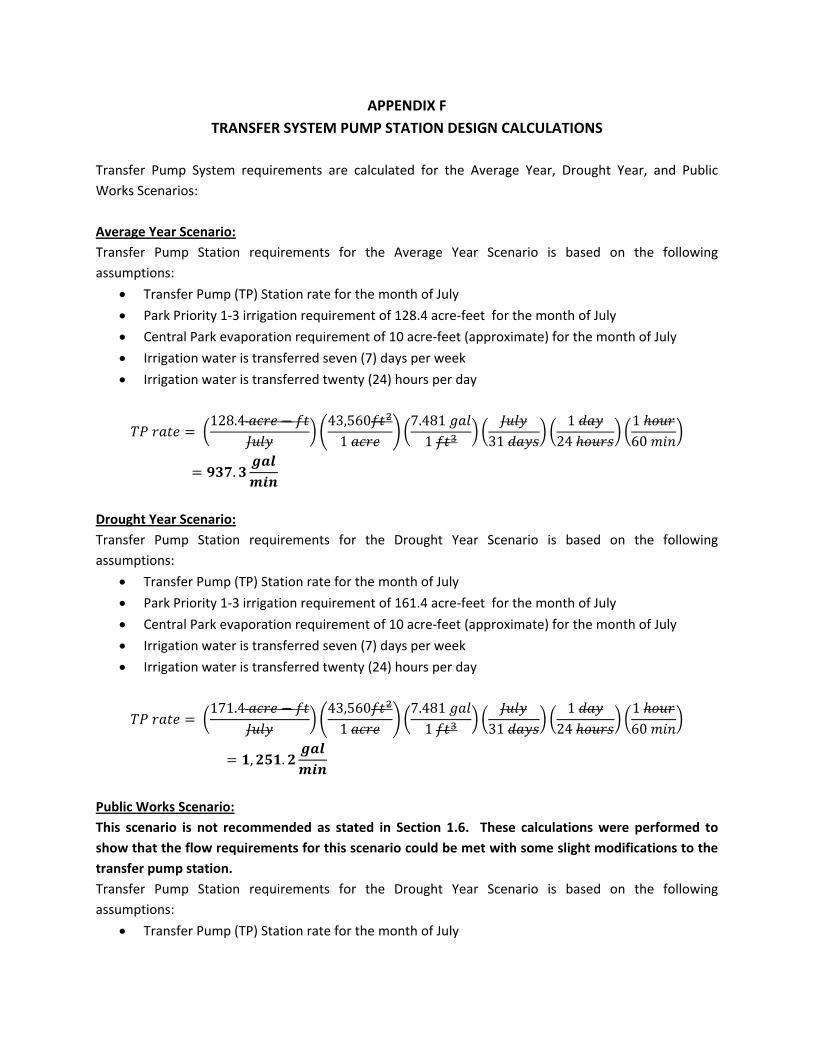
APPENDIX F TRANSFER SYSTEM PUMP STATION DESIGN CALCULATIONS
Transfer Pump System requirements are calculated for the Average Year, Drought Year, and Public Works Scenarios: Average Year Scenario: Transfer Pump Station requirements for the Average Year Scenario is based on the following assumptions:
• Transfer Pump (TP) Station rate for the month of July
• Park Priority 1‐3 irrigation requirement of 128.4 acre‐feet for the month of July
• Central Park evaporation requirement of 10 acre‐feet (approximate) for the month of July
• Irrigation water is transferred seven (7) days per week
• Irrigation water is transferred twenty (24) hours per day
128.4 43,560
1 7.481
1 31 1
24 1 60
.
Drought Year Scenario: Transfer Pump Station requirements for the Drought Year Scenario is based on the following assumptions:
• Transfer Pump (TP) Station rate for the month of July
• Park Priority 1‐3 irrigation requirement of 161.4 acre‐feet for the month of July
• Central Park evaporation requirement of 10 acre‐feet (approximate) for the month of July
• Irrigation water is transferred seven (7) days per week
• Irrigation water is transferred twenty (24) hours per day
171.4 43,560
1 7.481
1 31 1
24 1 60
, .
Public Works Scenario: This scenario is not recommended as stated in Section 1.6. These calculations were performed to show that the flow requirements for this scenario could be met with some slight modifications to the transfer pump station. Transfer Pump Station requirements for the Drought Year Scenario is based on the following assumptions:
• Transfer Pump (TP) Station rate for the month of July
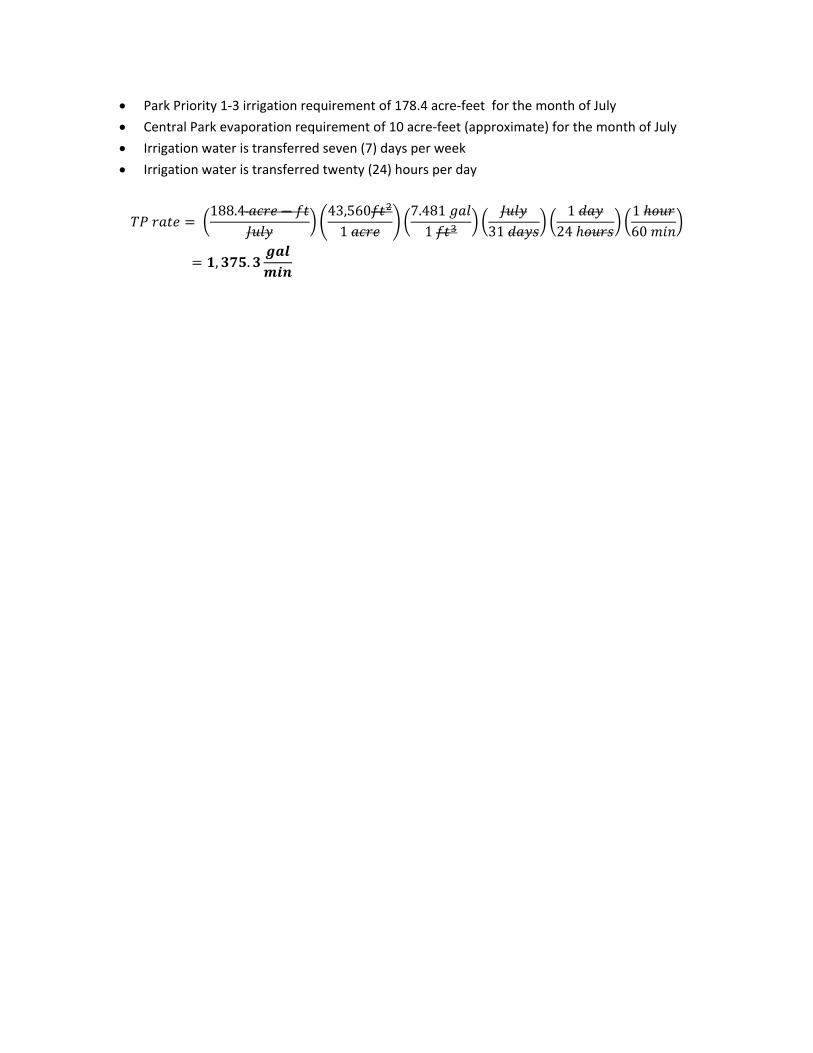
• Park Priority 1‐3 irrigation requirement of 178.4 acre‐feet for the month of July
• Central Park evaporation requirement of 10 acre‐feet (approximate) for the month of July
• Irrigation water is transferred seven (7) days per week
• Irrigation water is transferred twenty (24) hours per day
188.4 43,560
1 7.481
1 31 1
24 1 60
, .
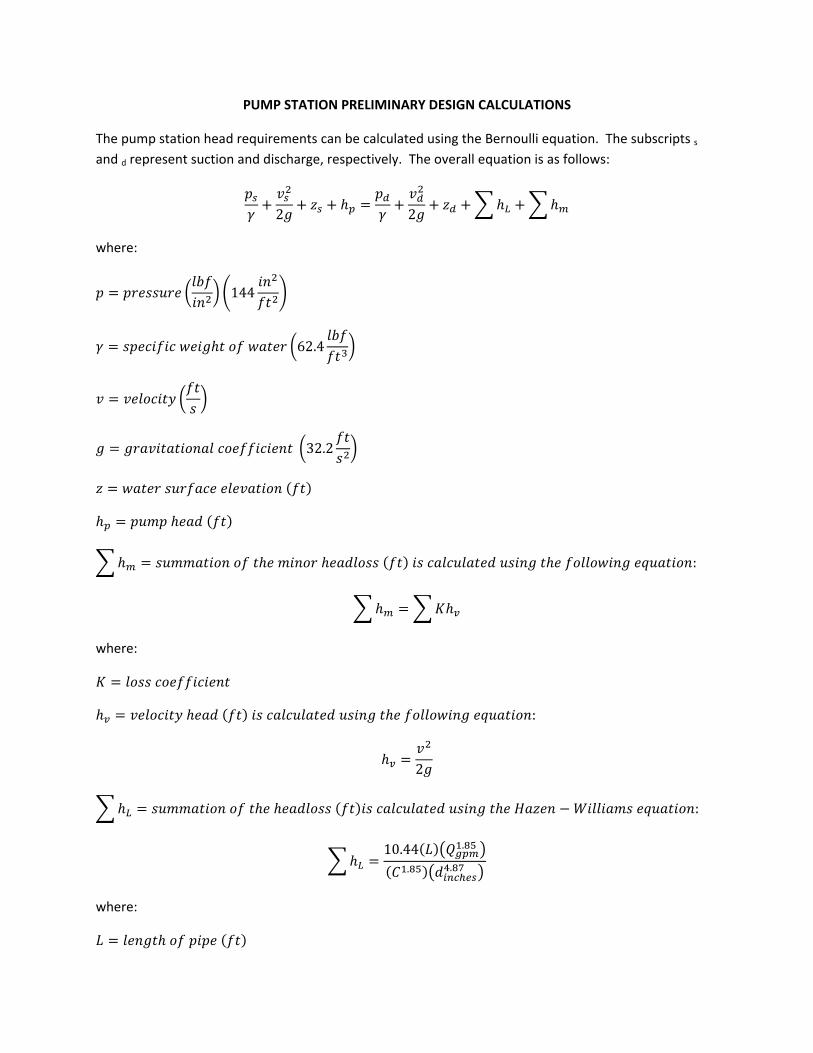
PUMP STATION PRELIMINARY DESIGN CALCULATIONS
The pump station head requirements can be calculated using the Bernoulli equation. The subscripts s and d represent suction and discharge, respectively. The overall equation is as follows:
2 2
where:
144
62.4
32.2
:
where:
:
2
:
10.44 .
. .
where:
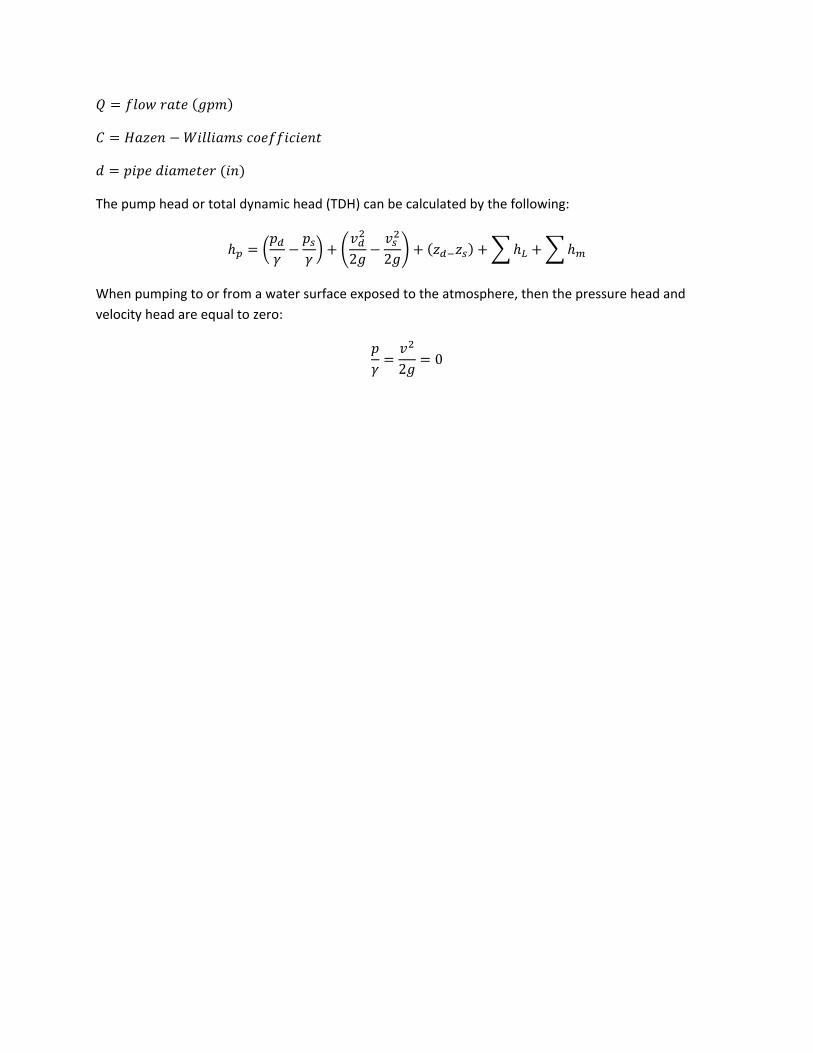
The pump head or total dynamic head (TDH) can be calculated by the following:
2 2
When pumping to or from a water surface exposed to the atmosphere, then the pressure head and velocity head are equal to zero:
20
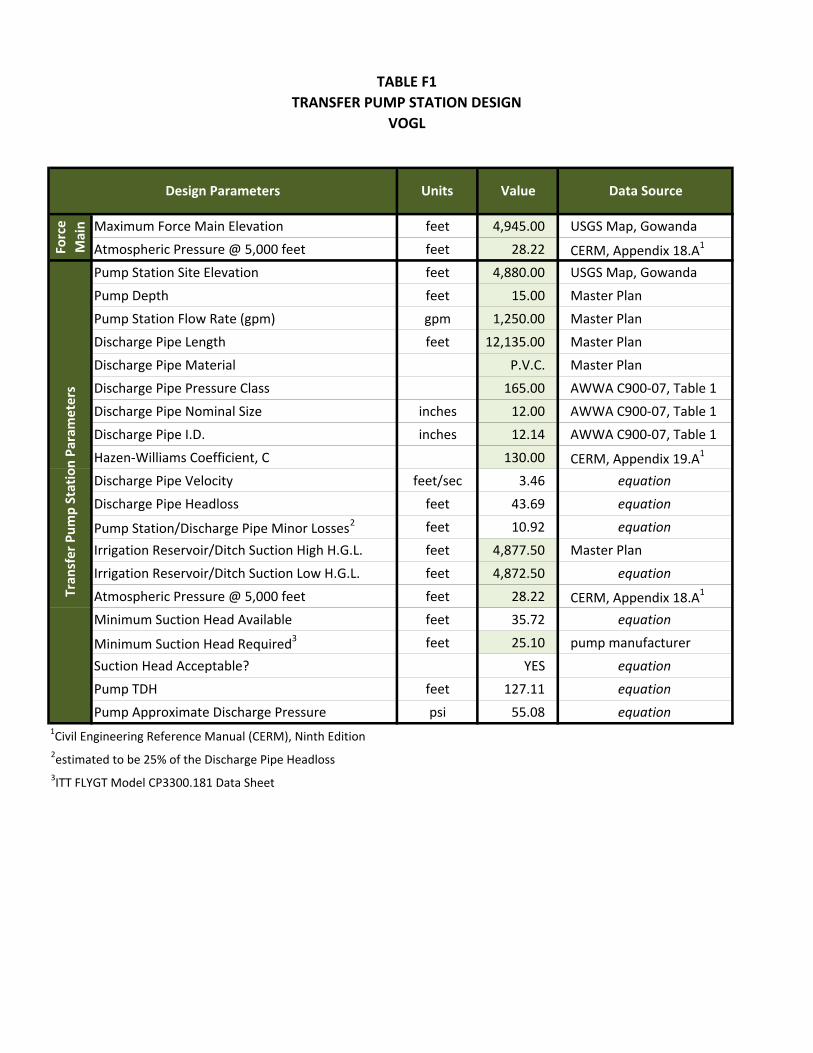
TABLE F1TRANSFER PUMP STATION DESIGN
VOGL
Maximum Force Main Elevation feet 4,945.00 USGS Map, Gowanda
Atmospheric Pressure @ 5,000 feet feet 28.22 CERM, Appendix 18.A1
Pump Station Site Elevation feet 4,880.00 USGS Map, Gowanda
Pump Depth feet 15.00 Master Plan
Pump Station Flow Rate (gpm) gpm 1,250.00 Master Plan
Discharge Pipe Length feet 12,135.00 Master Plan
Discharge Pipe Material P.V.C. Master Plan
Discharge Pipe Pressure Class 165.00 AWWA C900‐07, Table 1
Discharge Pipe Nominal Size inches 12.00 AWWA C900‐07, Table 1
Discharge Pipe I.D. inches 12.14 AWWA C900‐07, Table 1
Hazen‐Williams Coefficient, C 130.00 CERM, Appendix 19.A1
Discharge Pipe Velocity feet/sec 3.46 equation
Discharge Pipe Headloss feet 43.69 equation
Pump Station/Discharge Pipe Minor Losses2 feet 10.92 equation
Irrigation Reservoir/Ditch Suction High H.G.L. feet 4,877.50 Master Plan
Irrigation Reservoir/Ditch Suction Low H.G.L. feet 4,872.50 equation
Atmospheric Pressure @ 5,000 feet feet 28.22 CERM, Appendix 18.A1
Minimum Suction Head Available feet 35.72 equation
Minimum Suction Head Required3 feet 25.10 pump manufacturer
Suction Head Acceptable? YES equation
Pump TDH feet 127.11 equation
Pump Approximate Discharge Pressure psi 55.08 equation1Civil Engineering Reference Manual (CERM), Ninth Edition2estimated to be 25% of the Discharge Pipe Headloss3ITT FLYGT Model CP3300.181 Data Sheet
Tran
sfer Pum
p Station Pa
rameters
Design Parameters Units Value Data Source
Force
Main
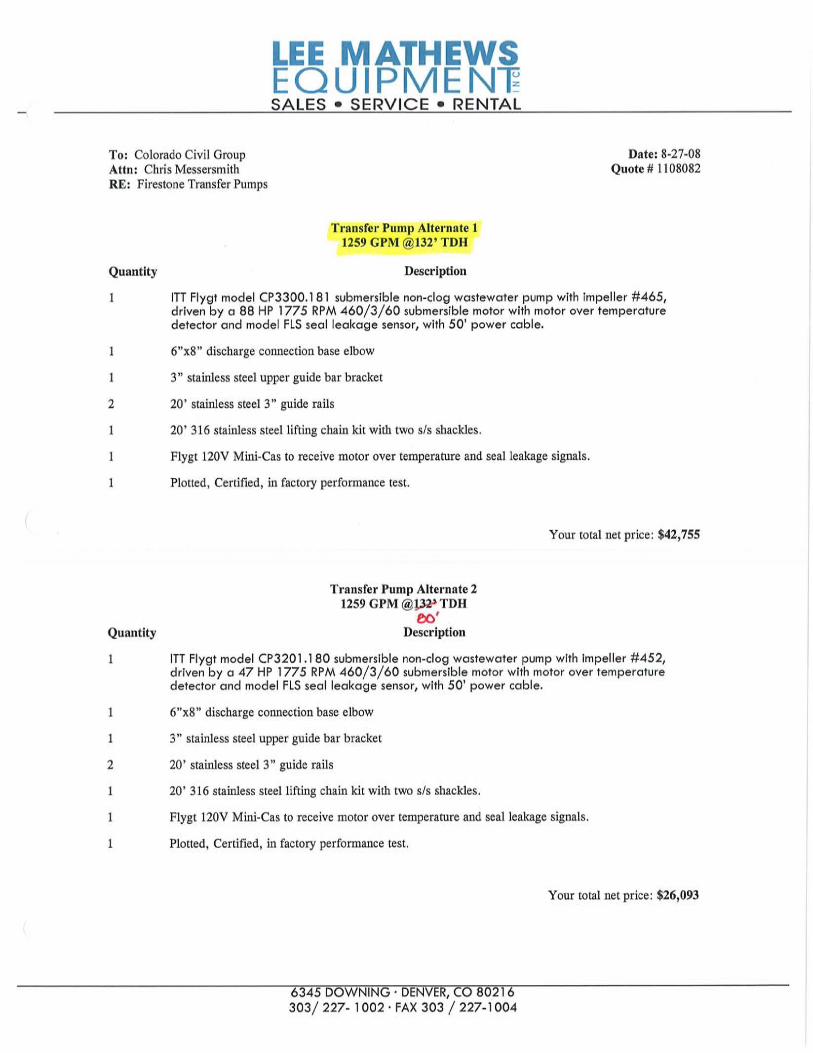
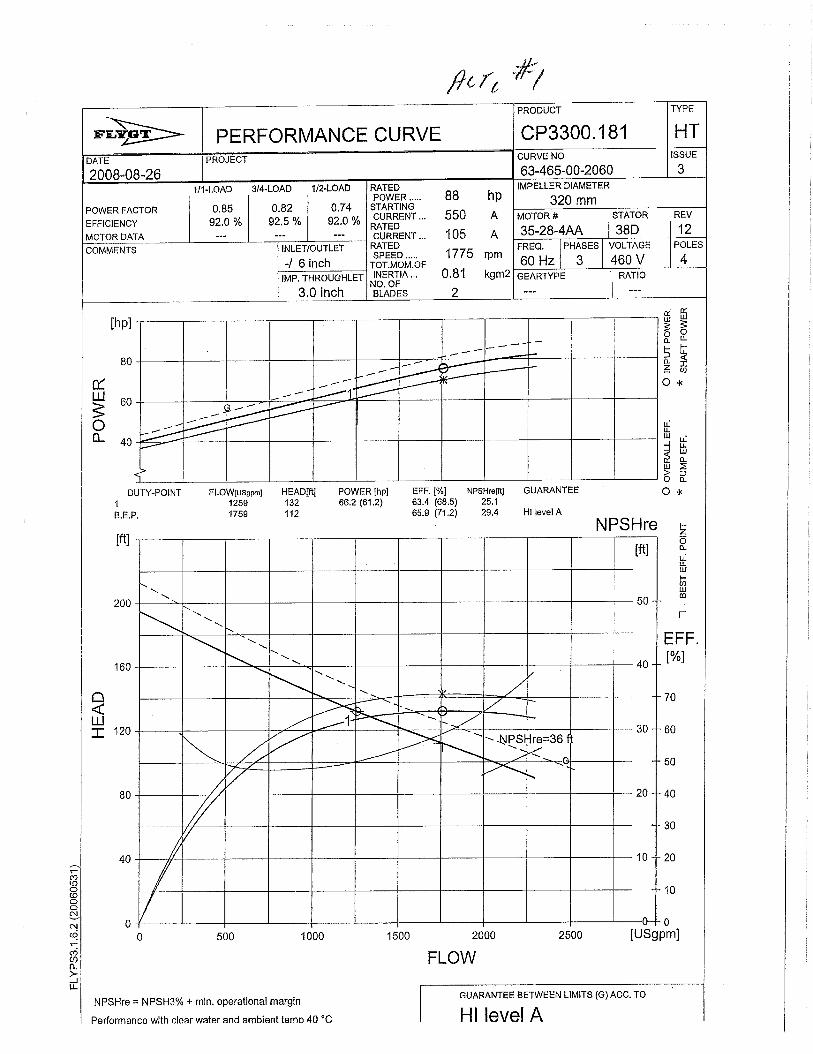
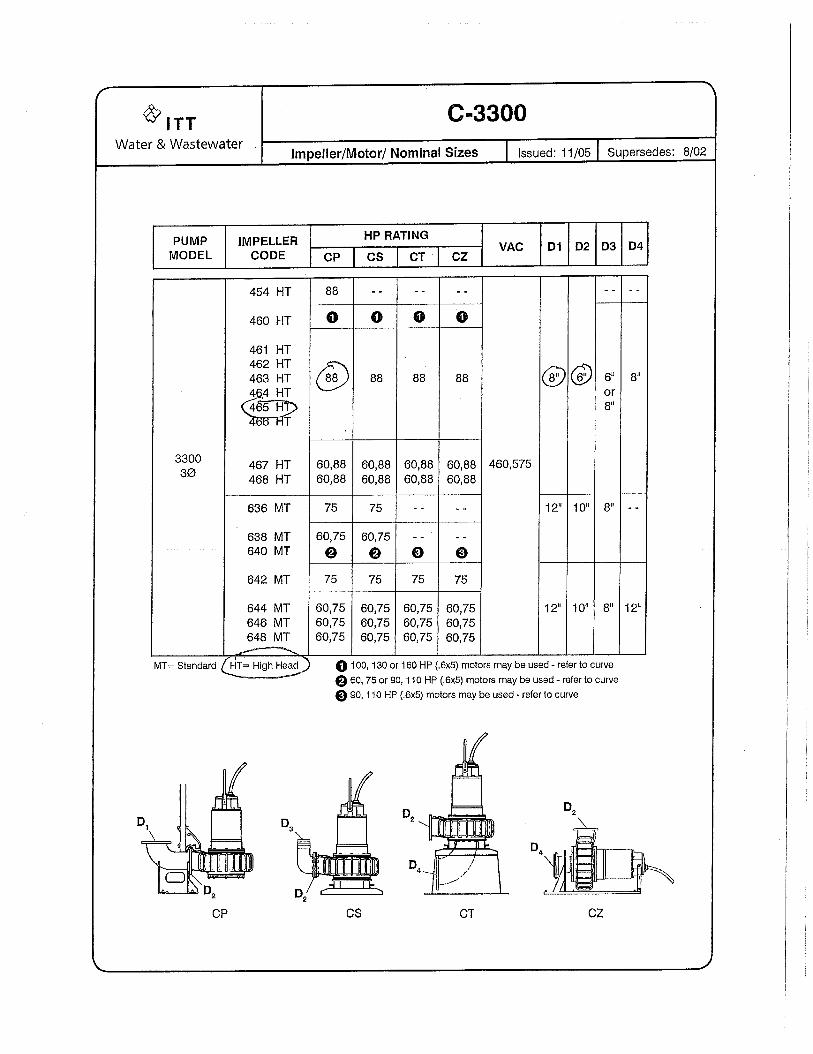
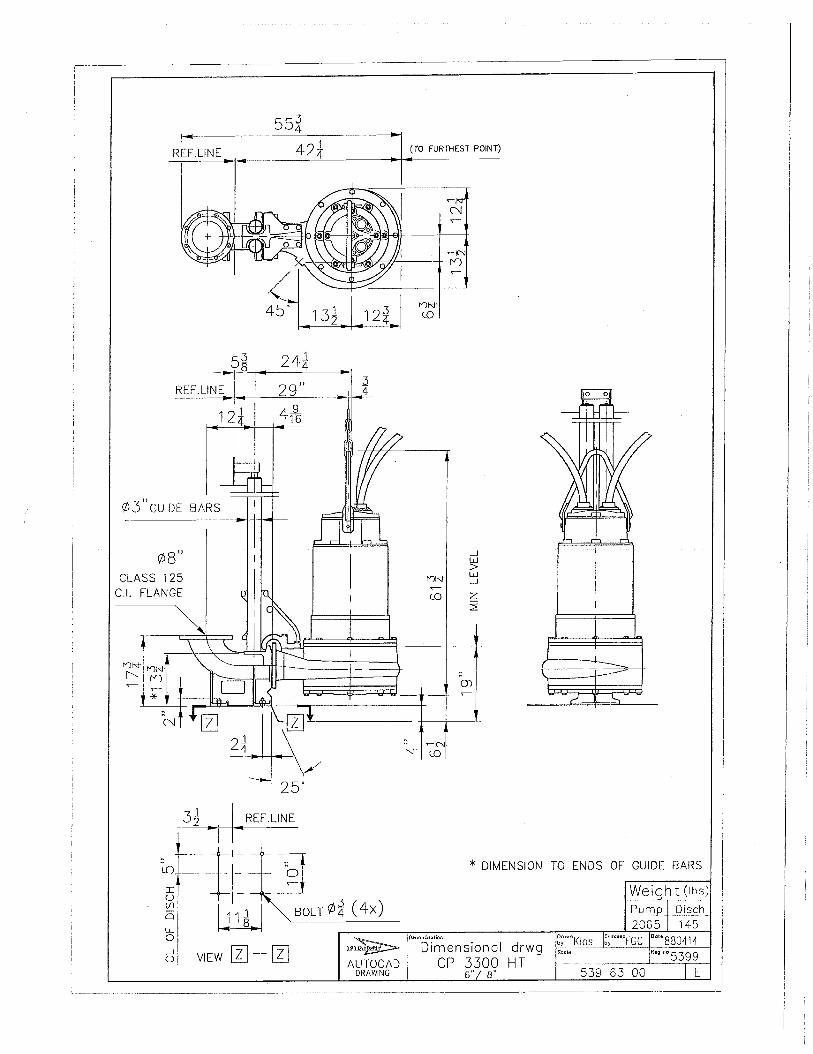
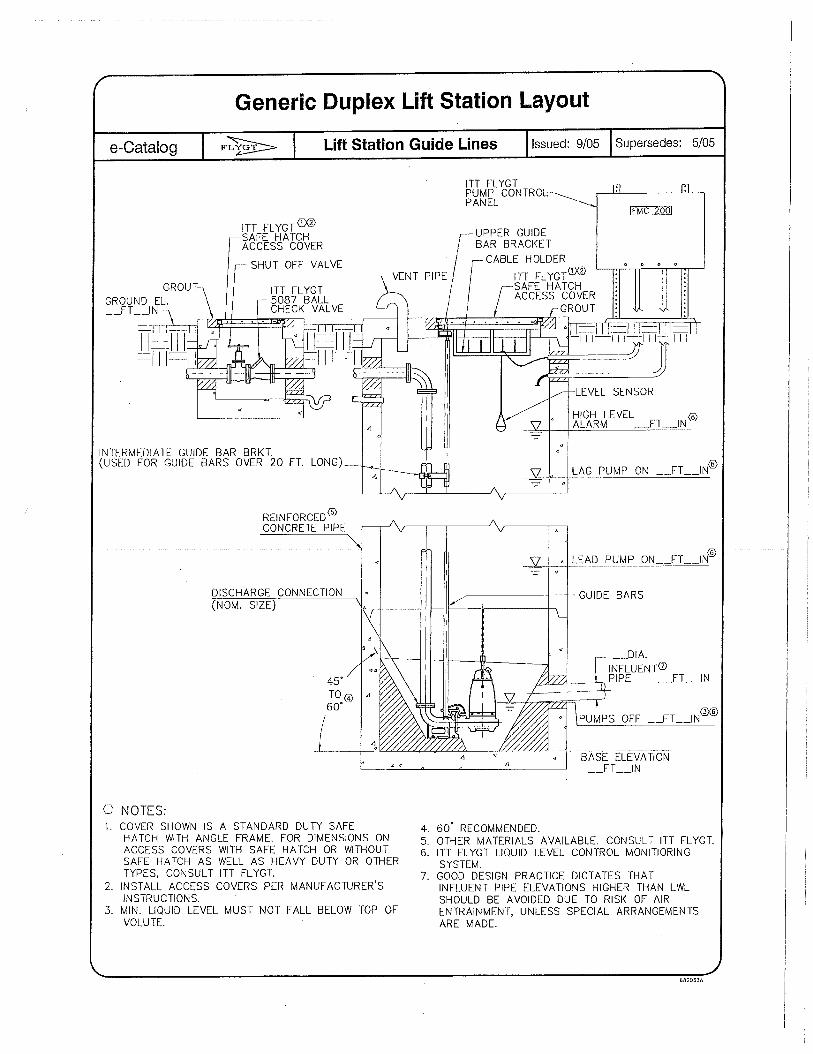
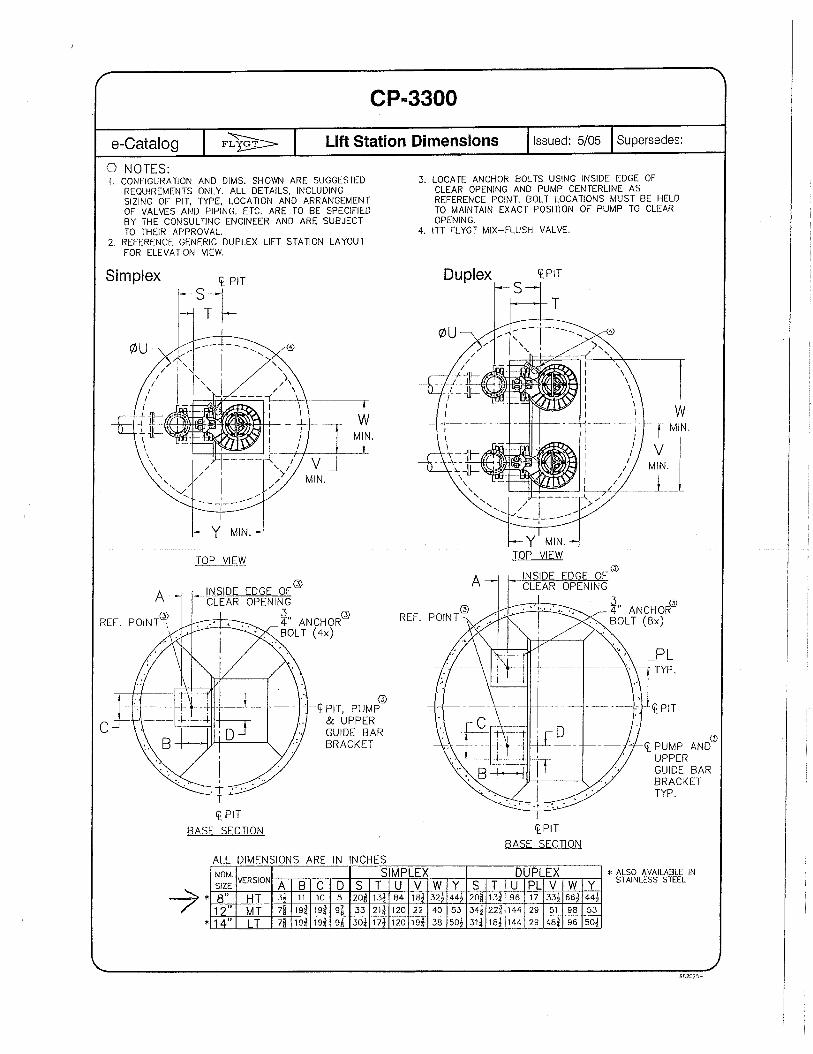

TABLE F2TRANSFER PUMP STATION DESIGN
PUBLIC WORKS FACILITY
Maximum Force Main Elevation feet 4,972.00 USGS Map, Gowanda
Atmospheric Pressure @ 5,000 feet feet 28.22 CERM, Appendix 18.A1
Pump Station Site Elevation feet 4,960.00 USGS Map, Gowanda
Pump Depth feet 15.00 Master Plan
Pump Station Flow Rate (gpm) gpm 1,250.00 Master Plan
Discharge Pipe Length feet 12,925.00 Master Plan
Discharge Pipe Material P.V.C. Master Plan
Discharge Pipe Pressure Class 165.00 AWWA C900‐07, Table 1
Discharge Pipe Nominal Size inches 12.00 AWWA C900‐07, Table 1
Discharge Pipe I.D. inches 12.14 AWWA C900‐07, Table 1
Hazen‐Williams Coefficient, C 130.00 CERM, Appendix 19.A1
Discharge Pipe Velocity feet/sec 3.46 equation
Discharge Pipe Headloss feet 46.53 equation
Pump Station/Discharge Pipe Minor Losses2 feet 11.63 equation
Irrigation Ditch/Suction High H.G.L. feet 4,957.50 Master Plan
Irrigation Ditch/Suction Low H.G.L. feet 4,952.50 equation
Atmospheric Pressure @ 5,000 feet feet 28.22 CERM, Appendix 18.A1
Minimum Suction Head Available feet 35.72 equation
Minimum Suction Head Required3 feet 20.00 pump manufacturer
Suction Head Acceptable? YES equation
Pump TDH feet 77.67 equation
Pump Approximate Discharge Pressure psi 33.65 equation1Civil Engineering Reference Manual (CERM), Ninth Edition2estimated to be 25% of the Discharge Pipe Headloss3ITT FLYGT Model CP3201.180 Data Sheet
Data SourceValue
Tran
sfer Pum
p Station Pa
rameters
Design Parameters Units
Force
Main
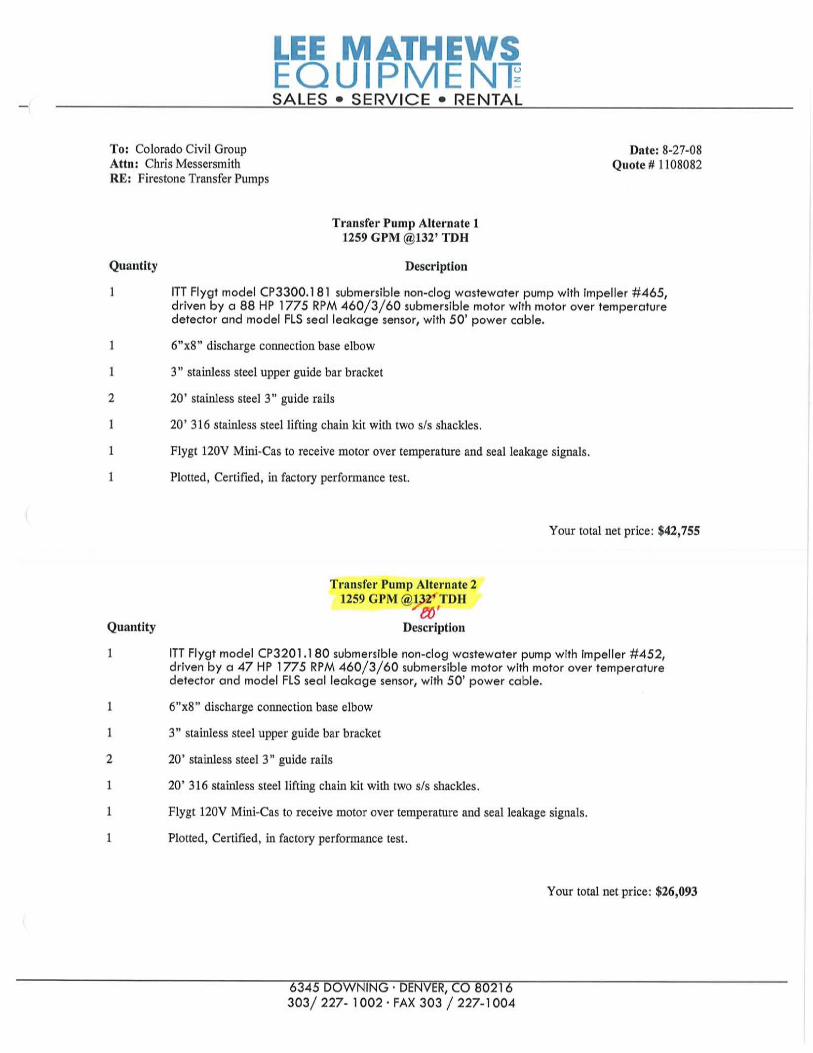
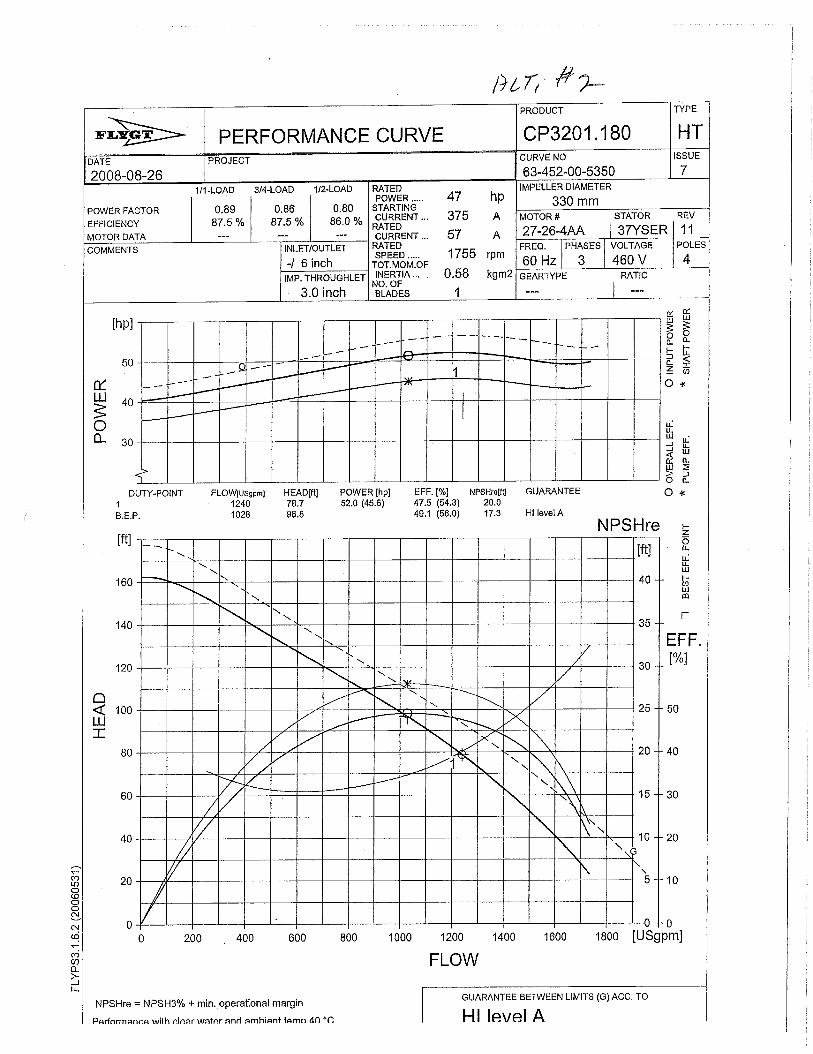
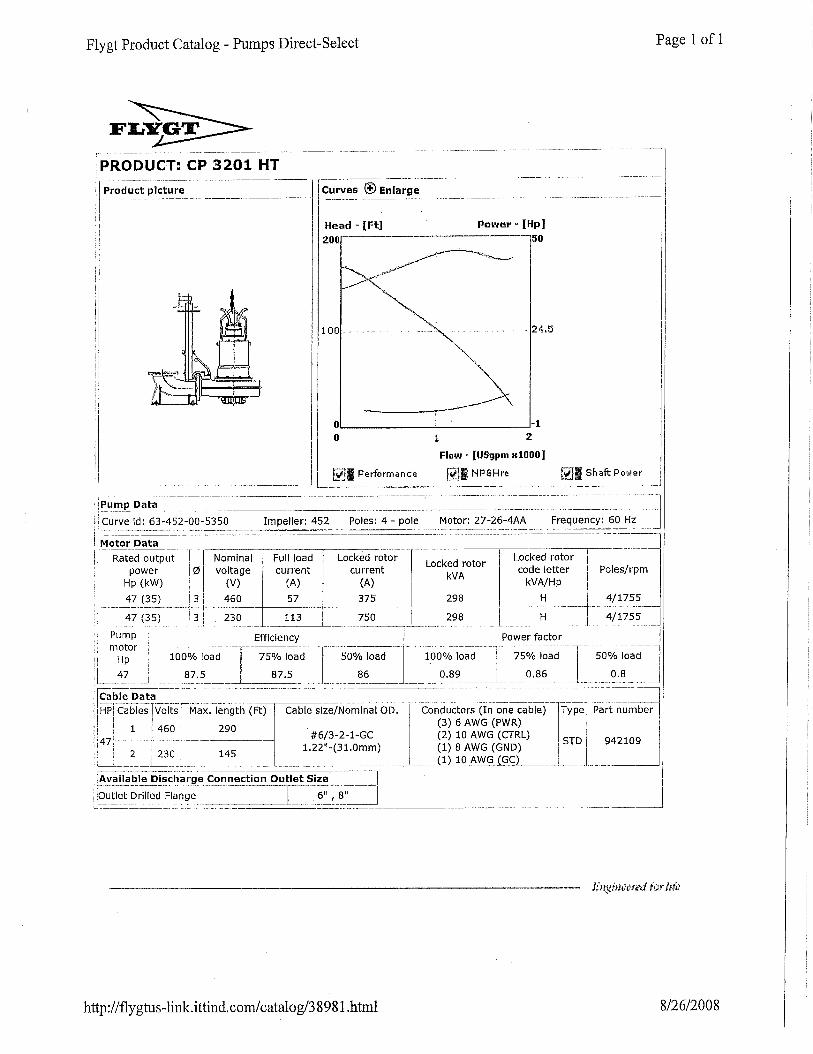
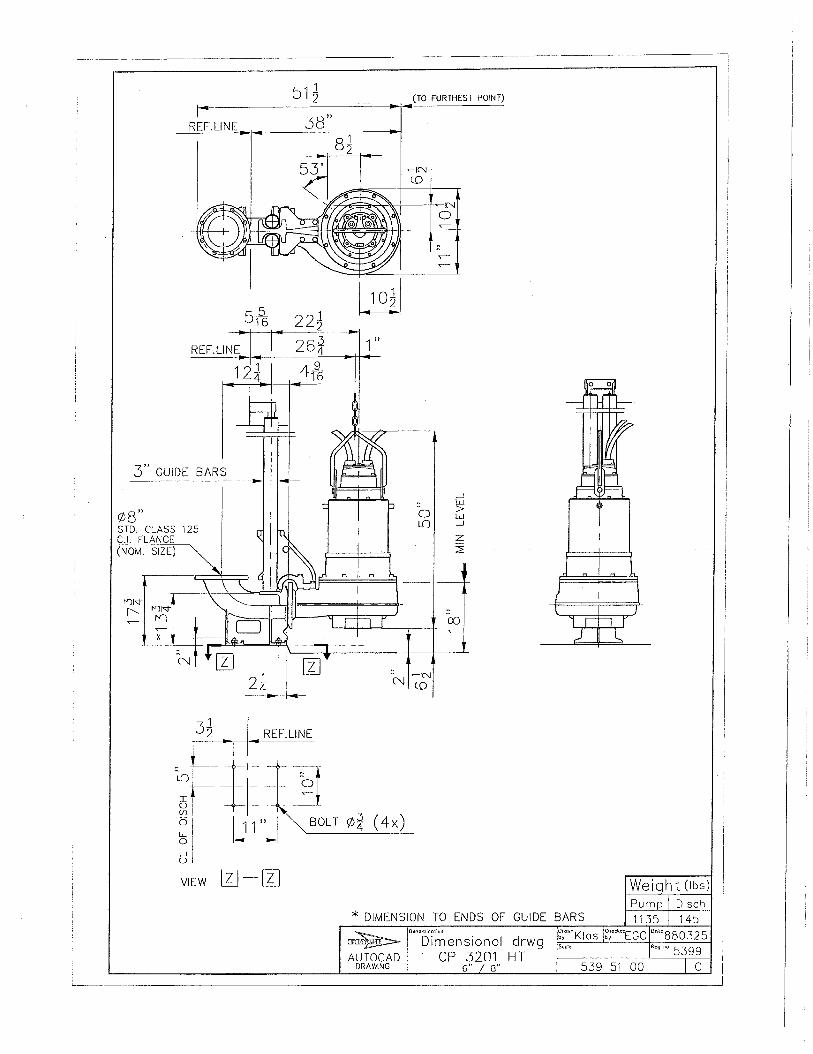
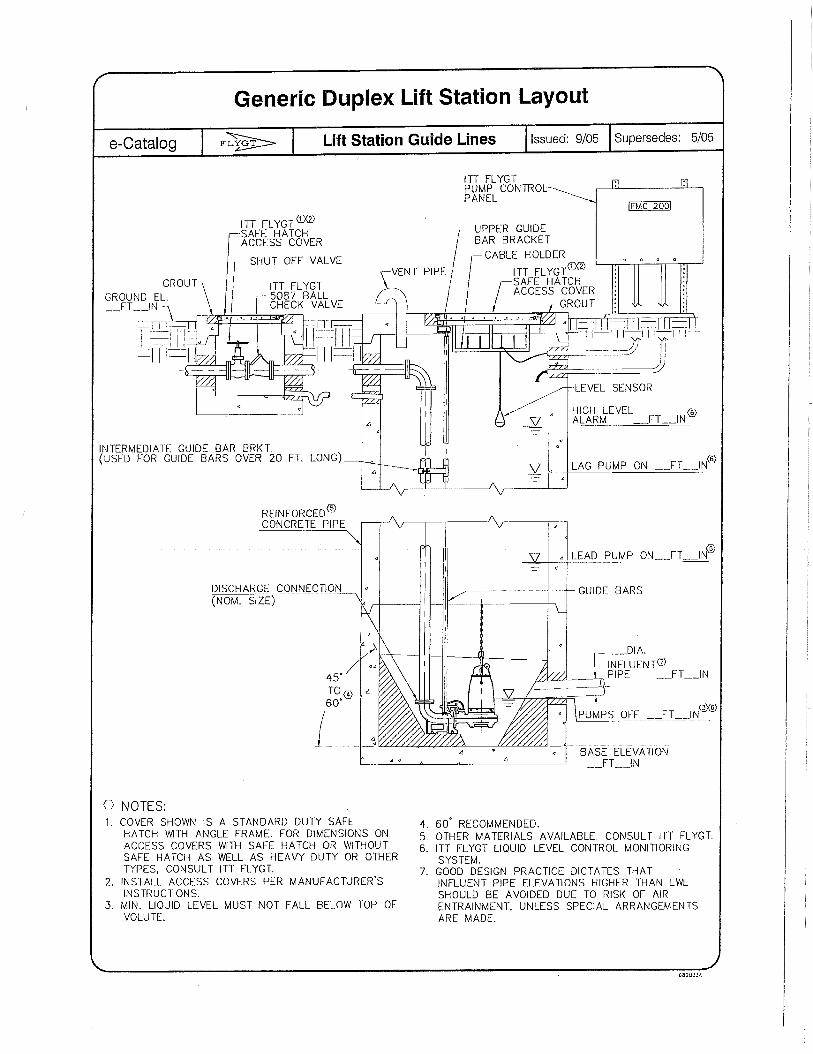
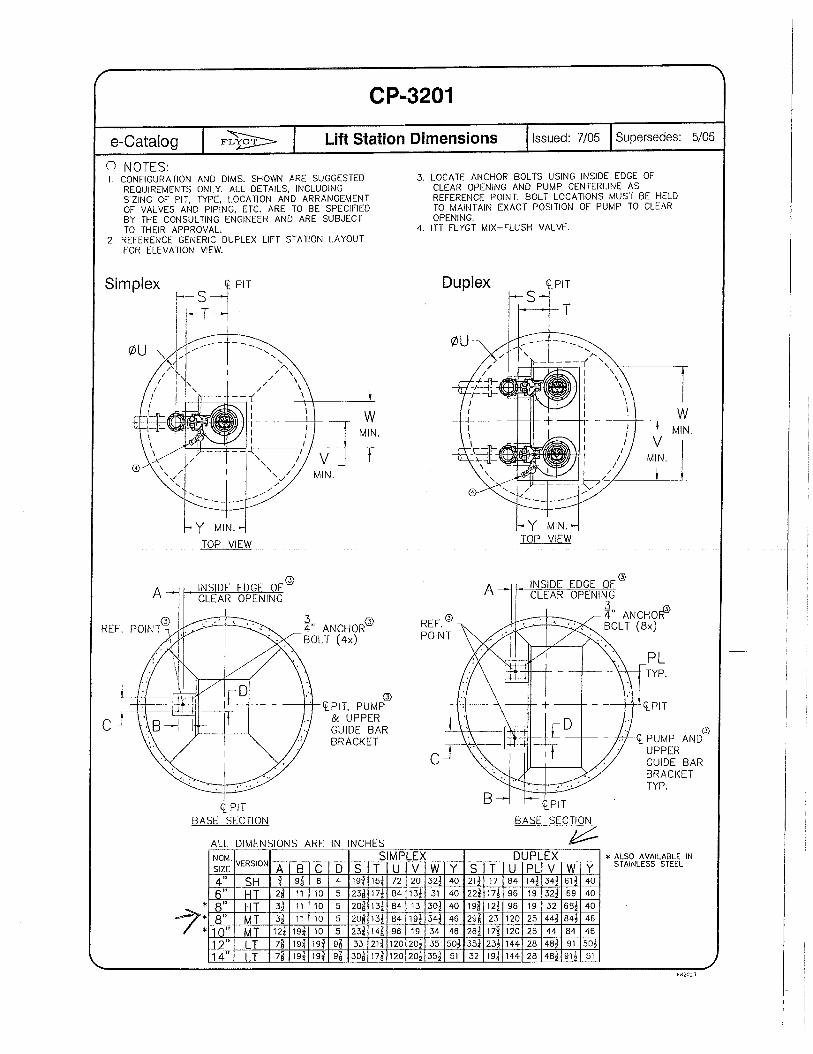
Raw Water Irrigation System Master Plan March 2010
G
Appendix G: Distribution System Pump Calculations
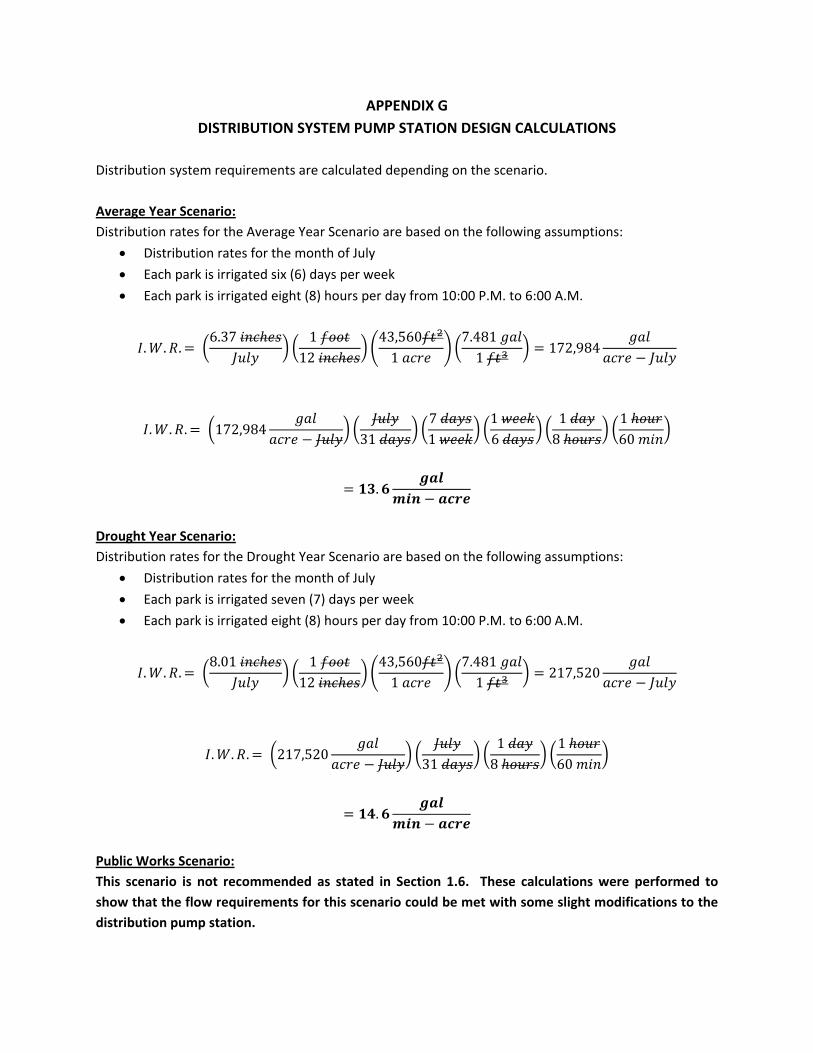
APPENDIX G DISTRIBUTION SYSTEM PUMP STATION DESIGN CALCULATIONS
Distribution system requirements are calculated depending on the scenario. Average Year Scenario: Distribution rates for the Average Year Scenario are based on the following assumptions:
• Distribution rates for the month of July
• Each park is irrigated six (6) days per week
• Each park is irrigated eight (8) hours per day from 10:00 P.M. to 6:00 A.M.
. . . 6.37 1
12 43,560
1 7.481
1 172,984
. . . 172,98431
7 1
1 6
1 8
1 60
.
Drought Year Scenario: Distribution rates for the Drought Year Scenario are based on the following assumptions:
• Distribution rates for the month of July
• Each park is irrigated seven (7) days per week
• Each park is irrigated eight (8) hours per day from 10:00 P.M. to 6:00 A.M.
. . . 8.01 1
12 43,560
1 7.481
1 217,520
. . . 217,52031
1 8
1 60
.
Public Works Scenario: This scenario is not recommended as stated in Section 1.6. These calculations were performed to show that the flow requirements for this scenario could be met with some slight modifications to the distribution pump station.
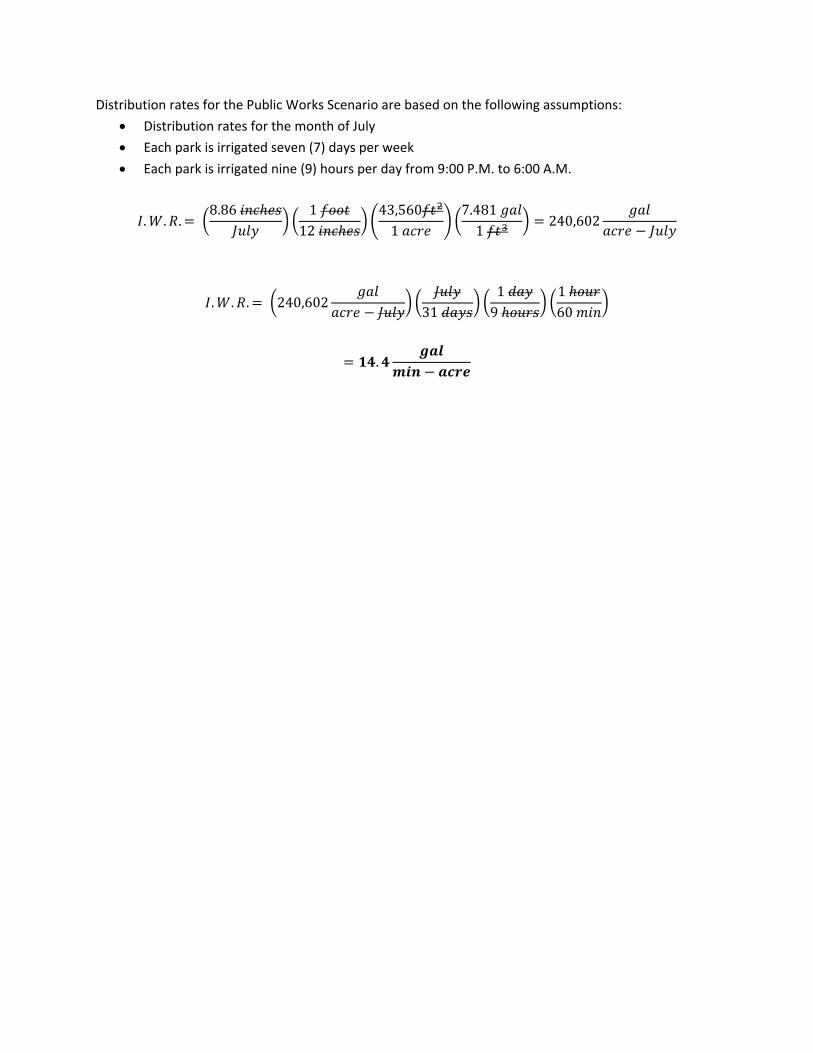
Distribution rates for the Public Works Scenario are based on the following assumptions:
• Distribution rates for the month of July
• Each park is irrigated seven (7) days per week
• Each park is irrigated nine (9) hours per day from 9:00 P.M. to 6:00 A.M.
. . . 8.86 1
12 43,560
1 7.481
1 240,602
. . . 240,60231
1 9
1 60
.
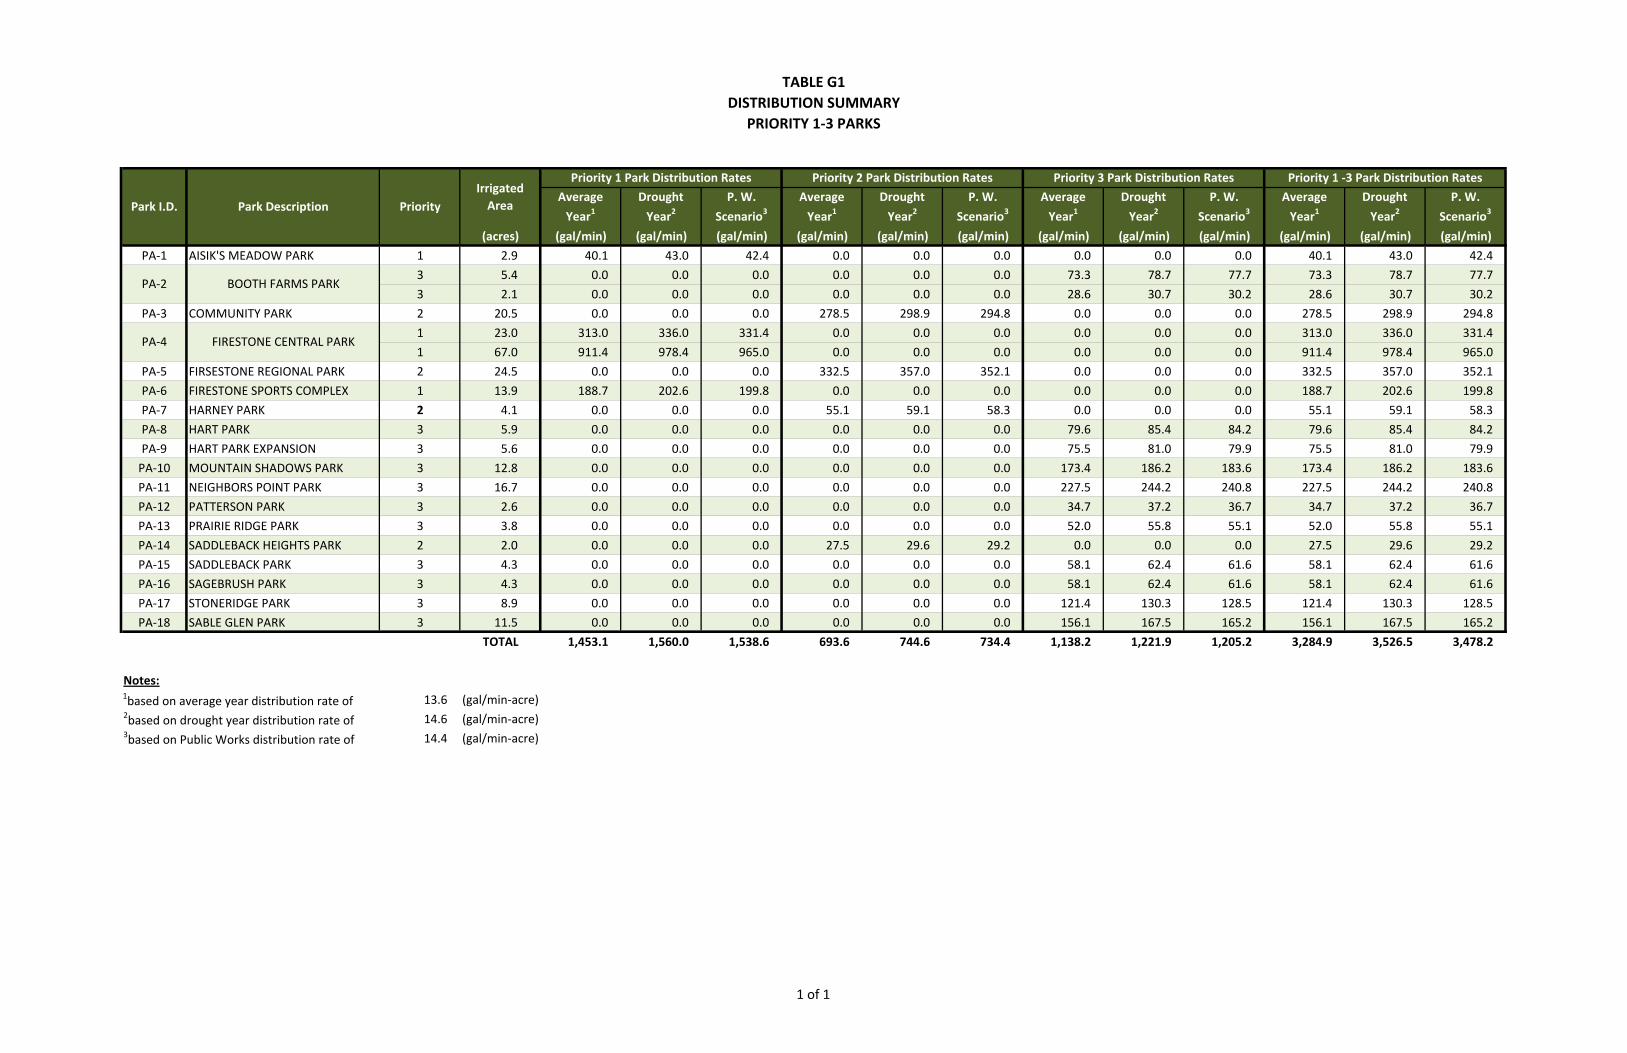
TABLE G1DISTRIBUTION SUMMARY
PRIORITY 1‐3 PARKS
(acres) (gal/min) (gal/min) (gal/min) (gal/min) (gal/min) (gal/min) (gal/min) (gal/min) (gal/min) (gal/min) (gal/min) (gal/min)
PA‐1 AISIK'S MEADOW PARK 1 2.9 40.1 43.0 42.4 0.0 0.0 0.0 0.0 0.0 0.0 40.1 43.0 42.4
3 5.4 0.0 0.0 0.0 0.0 0.0 0.0 73.3 78.7 77.7 73.3 78.7 77.7
3 2.1 0.0 0.0 0.0 0.0 0.0 0.0 28.6 30.7 30.2 28.6 30.7 30.2
PA‐3 COMMUNITY PARK 2 20.5 0.0 0.0 0.0 278.5 298.9 294.8 0.0 0.0 0.0 278.5 298.9 294.8
1 23.0 313.0 336.0 331.4 0.0 0.0 0.0 0.0 0.0 0.0 313.0 336.0 331.4
1 67.0 911.4 978.4 965.0 0.0 0.0 0.0 0.0 0.0 0.0 911.4 978.4 965.0
PA‐5 FIRSESTONE REGIONAL PARK 2 24.5 0.0 0.0 0.0 332.5 357.0 352.1 0.0 0.0 0.0 332.5 357.0 352.1
PA‐6 FIRESTONE SPORTS COMPLEX 1 13.9 188.7 202.6 199.8 0.0 0.0 0.0 0.0 0.0 0.0 188.7 202.6 199.8
PA‐7 HARNEY PARK 2 4.1 0.0 0.0 0.0 55.1 59.1 58.3 0.0 0.0 0.0 55.1 59.1 58.3
PA‐8 HART PARK 3 5.9 0.0 0.0 0.0 0.0 0.0 0.0 79.6 85.4 84.2 79.6 85.4 84.2
PA‐9 HART PARK EXPANSION 3 5.6 0.0 0.0 0.0 0.0 0.0 0.0 75.5 81.0 79.9 75.5 81.0 79.9
PA‐10 MOUNTAIN SHADOWS PARK 3 12.8 0.0 0.0 0.0 0.0 0.0 0.0 173.4 186.2 183.6 173.4 186.2 183.6
PA‐11 NEIGHBORS POINT PARK 3 16.7 0.0 0.0 0.0 0.0 0.0 0.0 227.5 244.2 240.8 227.5 244.2 240.8
PA‐12 PATTERSON PARK 3 2.6 0.0 0.0 0.0 0.0 0.0 0.0 34.7 37.2 36.7 34.7 37.2 36.7
PA‐13 PRAIRIE RIDGE PARK 3 3.8 0.0 0.0 0.0 0.0 0.0 0.0 52.0 55.8 55.1 52.0 55.8 55.1
PA‐14 SADDLEBACK HEIGHTS PARK 2 2.0 0.0 0.0 0.0 27.5 29.6 29.2 0.0 0.0 0.0 27.5 29.6 29.2
PA‐15 SADDLEBACK PARK 3 4.3 0.0 0.0 0.0 0.0 0.0 0.0 58.1 62.4 61.6 58.1 62.4 61.6
PA‐16 SAGEBRUSH PARK 3 4.3 0.0 0.0 0.0 0.0 0.0 0.0 58.1 62.4 61.6 58.1 62.4 61.6
PA‐17 STONERIDGE PARK 3 8.9 0.0 0.0 0.0 0.0 0.0 0.0 121.4 130.3 128.5 121.4 130.3 128.5
PA‐18 SABLE GLEN PARK 3 11.5 0.0 0.0 0.0 0.0 0.0 0.0 156.1 167.5 165.2 156.1 167.5 165.2
TOTAL 1,453.1 1,560.0 1,538.6 693.6 744.6 734.4 1,138.2 1,221.9 1,205.2 3,284.9 3,526.5 3,478.2
Notes:1based on average year distribution rate of 13.6 (gal/min‐acre)2based on drought year distribution rate of 14.6 (gal/min‐acre)3based on Public Works distribution rate of 14.4 (gal/min‐acre)
Average
Year1Drought
Year2P. W.
Scenario3
Priority 1 Park Distribution Rates Priority 2 Park Distribution Rates
Average
Year1
Priority 1 ‐3 Park Distribution Rates
Average
Year1Drought
Year2P. W.
Scenario3
P. W.
Scenario3
Priority 3 Park Distribution Rates
Average
Year1Drought
Year2P. W.
Scenario3
PA‐2 BOOTH FARMS PARK
PA‐4 FIRESTONE CENTRAL PARK
Drought
Year2Park I.D. Priority
Irrigated AreaPark Description
1 of 1
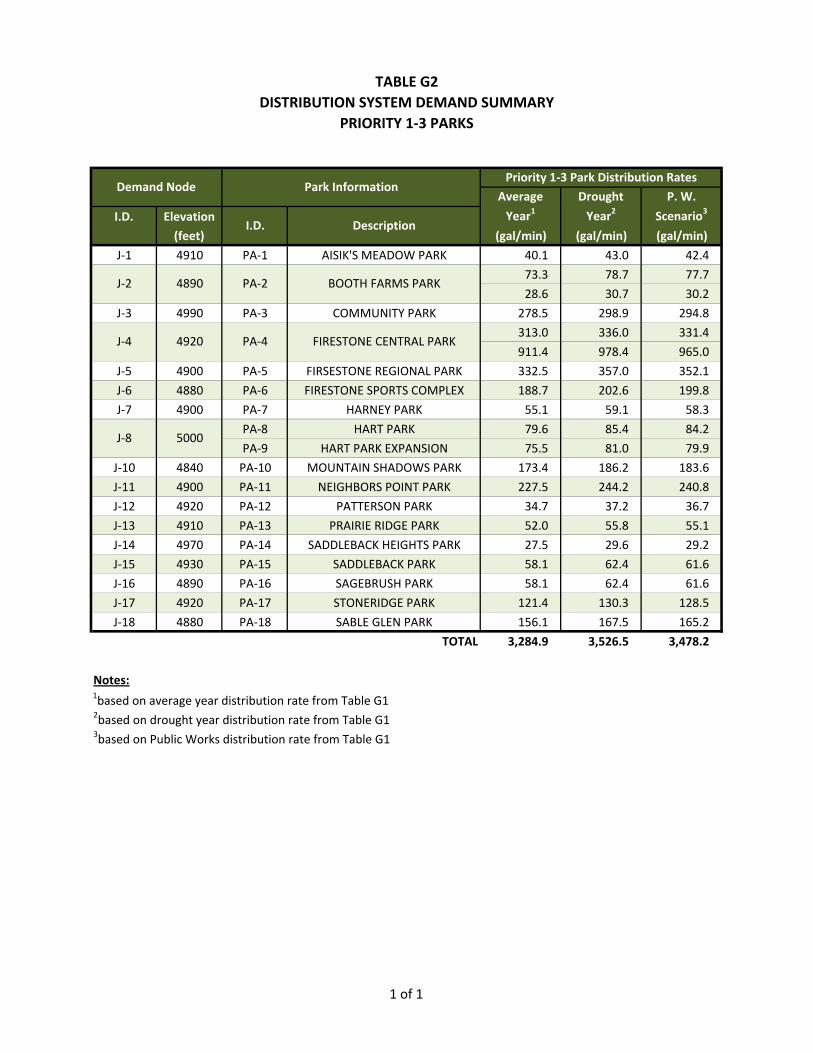
TABLE G2DISTRIBUTION SYSTEM DEMAND SUMMARY
PRIORITY 1‐3 PARKS
I.D. Elevation
(feet) (gal/min) (gal/min) (gal/min)
J‐1 4910 PA‐1 AISIK'S MEADOW PARK 40.1 43.0 42.4
73.3 78.7 77.7
28.6 30.7 30.2
J‐3 4990 PA‐3 COMMUNITY PARK 278.5 298.9 294.8
313.0 336.0 331.4
911.4 978.4 965.0
J‐5 4900 PA‐5 FIRSESTONE REGIONAL PARK 332.5 357.0 352.1
J‐6 4880 PA‐6 FIRESTONE SPORTS COMPLEX 188.7 202.6 199.8
J‐7 4900 PA‐7 HARNEY PARK 55.1 59.1 58.3
PA‐8 HART PARK 79.6 85.4 84.2
PA‐9 HART PARK EXPANSION 75.5 81.0 79.9
J‐10 4840 PA‐10 MOUNTAIN SHADOWS PARK 173.4 186.2 183.6
J‐11 4900 PA‐11 NEIGHBORS POINT PARK 227.5 244.2 240.8
J‐12 4920 PA‐12 PATTERSON PARK 34.7 37.2 36.7
J‐13 4910 PA‐13 PRAIRIE RIDGE PARK 52.0 55.8 55.1
J‐14 4970 PA‐14 SADDLEBACK HEIGHTS PARK 27.5 29.6 29.2
J‐15 4930 PA‐15 SADDLEBACK PARK 58.1 62.4 61.6
J‐16 4890 PA‐16 SAGEBRUSH PARK 58.1 62.4 61.6
J‐17 4920 PA‐17 STONERIDGE PARK 121.4 130.3 128.5
J‐18 4880 PA‐18 SABLE GLEN PARK 156.1 167.5 165.2
TOTAL 3,284.9 3,526.5 3,478.2
Notes:1based on average year distribution rate from Table G12based on drought year distribution rate from Table G13based on Public Works distribution rate from Table G1
J‐2
J‐8
Park Information
I.D. Description
Demand Node
4890
J‐4 4920
5000
BOOTH FARMS PARK
FIRESTONE CENTRAL PARK
PA‐2
PA‐4
Average
Year1Drought
Year2P. W.
Scenario3
Priority 1‐3 Park Distribution Rates
1 of 1
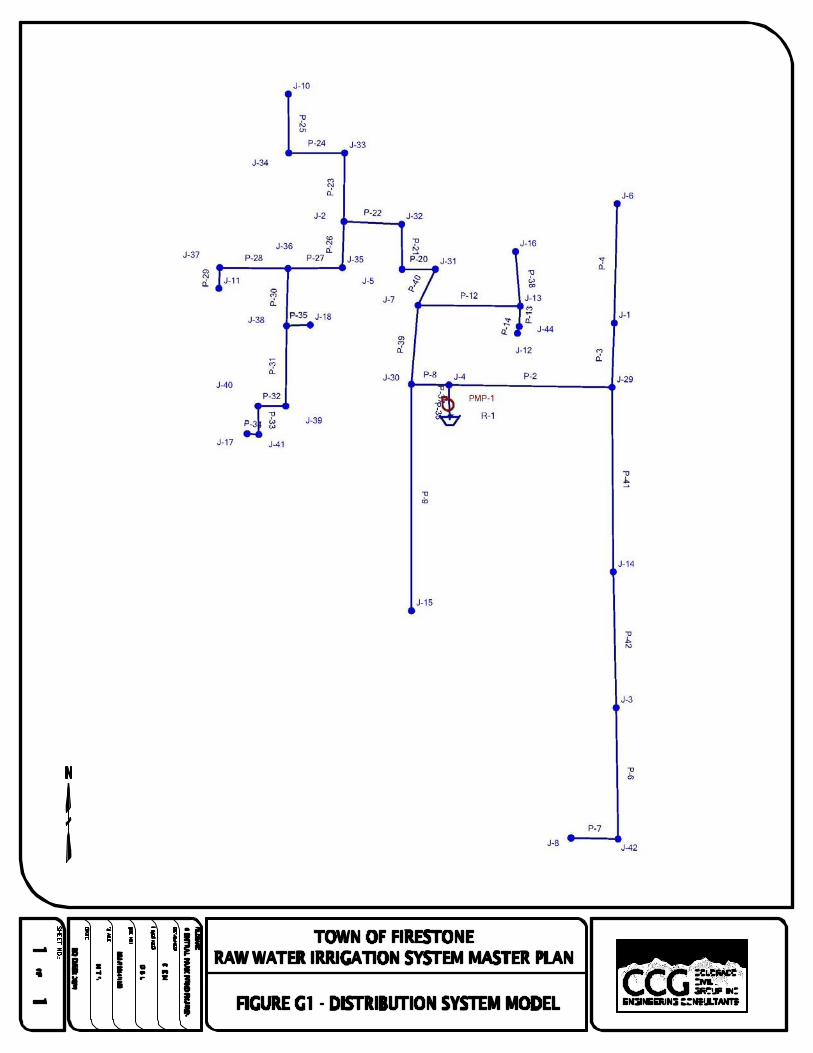
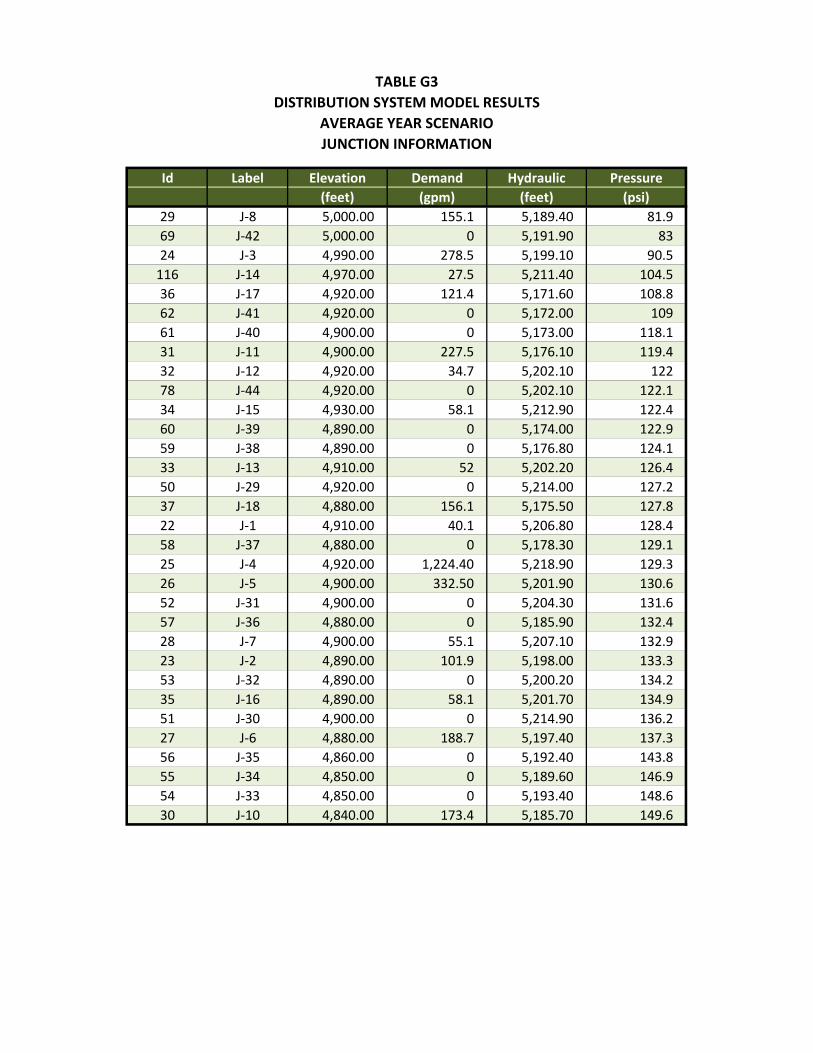
TABLE G3DISTRIBUTION SYSTEM MODEL RESULTS
AVERAGE YEAR SCENARIOJUNCTION INFORMATION
Id Label Elevation Demand Hydraulic Pressure(feet) (gpm) (feet) (psi)
29 J‐8 5,000.00 155.1 5,189.40 81.969 J‐42 5,000.00 0 5,191.90 8324 J‐3 4,990.00 278.5 5,199.10 90.5116 J‐14 4,970.00 27.5 5,211.40 104.536 J‐17 4,920.00 121.4 5,171.60 108.862 J‐41 4,920.00 0 5,172.00 10961 J‐40 4,900.00 0 5,173.00 118.131 J‐11 4,900.00 227.5 5,176.10 119.432 J‐12 4,920.00 34.7 5,202.10 12278 J‐44 4,920.00 0 5,202.10 122.134 J‐15 4,930.00 58.1 5,212.90 122.460 J‐39 4,890.00 0 5,174.00 122.959 J‐38 4,890.00 0 5,176.80 124.133 J‐13 4,910.00 52 5,202.20 126.450 J‐29 4,920.00 0 5,214.00 127.237 J‐18 4,880.00 156.1 5,175.50 127.822 J‐1 4,910.00 40.1 5,206.80 128.458 J‐37 4,880.00 0 5,178.30 129.125 J‐4 4,920.00 1,224.40 5,218.90 129.326 J‐5 4,900.00 332.50 5,201.90 130.652 J‐31 4,900.00 0 5,204.30 131.657 J‐36 4,880.00 0 5,185.90 132.428 J‐7 4,900.00 55.1 5,207.10 132.923 J‐2 4,890.00 101.9 5,198.00 133.353 J‐32 4,890.00 0 5,200.20 134.235 J‐16 4,890.00 58.1 5,201.70 134.951 J‐30 4,900.00 0 5,214.90 136.227 J‐6 4,880.00 188.7 5,197.40 137.356 J‐35 4,860.00 0 5,192.40 143.855 J‐34 4,850.00 0 5,189.60 146.954 J‐33 4,850.00 0 5,193.40 148.630 J‐10 4,840.00 173.4 5,185.70 149.6
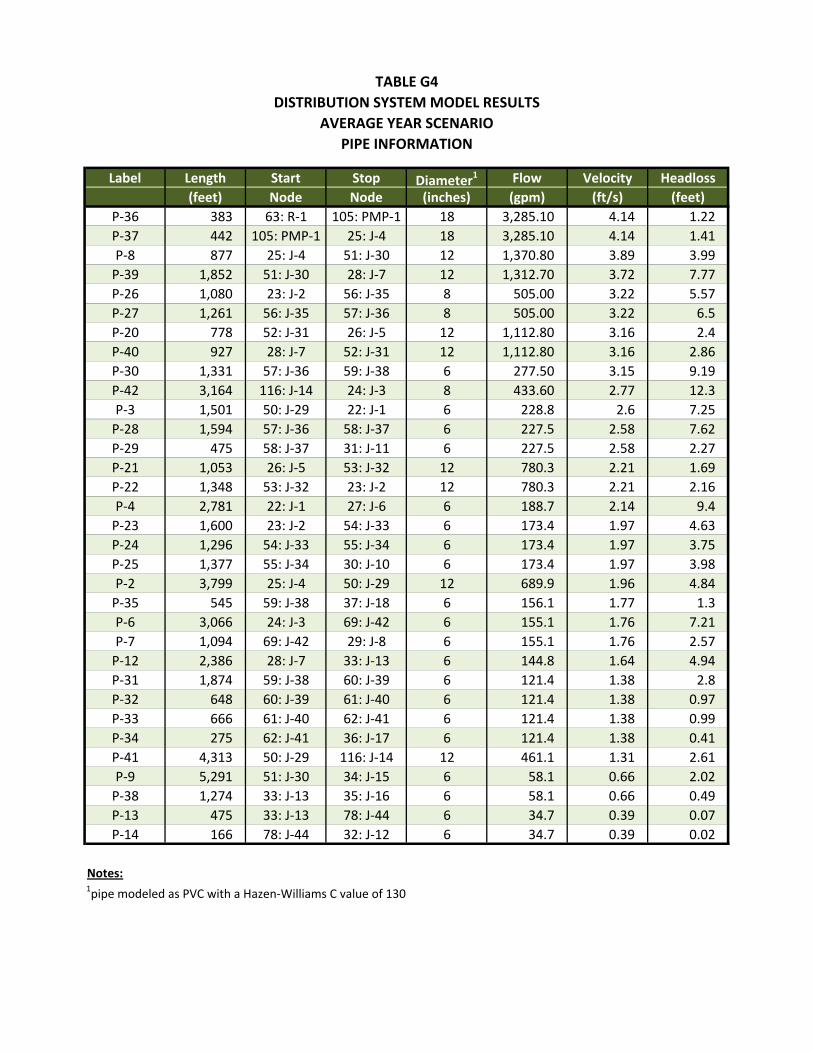
TABLE G4DISTRIBUTION SYSTEM MODEL RESULTS
AVERAGE YEAR SCENARIOPIPE INFORMATION
Label Length Start Stop Diameter1 Flow Velocity Headloss(feet) Node Node (inches) (gpm) (ft/s) (feet)
P‐36 383 63: R‐1 105: PMP‐1 18 3,285.10 4.14 1.22P‐37 442 105: PMP‐1 25: J‐4 18 3,285.10 4.14 1.41P‐8 877 25: J‐4 51: J‐30 12 1,370.80 3.89 3.99P‐39 1,852 51: J‐30 28: J‐7 12 1,312.70 3.72 7.77P‐26 1,080 23: J‐2 56: J‐35 8 505.00 3.22 5.57P‐27 1,261 56: J‐35 57: J‐36 8 505.00 3.22 6.5P‐20 778 52: J‐31 26: J‐5 12 1,112.80 3.16 2.4P‐40 927 28: J‐7 52: J‐31 12 1,112.80 3.16 2.86P‐30 1,331 57: J‐36 59: J‐38 6 277.50 3.15 9.19P‐42 3,164 116: J‐14 24: J‐3 8 433.60 2.77 12.3P‐3 1,501 50: J‐29 22: J‐1 6 228.8 2.6 7.25P‐28 1,594 57: J‐36 58: J‐37 6 227.5 2.58 7.62P‐29 475 58: J‐37 31: J‐11 6 227.5 2.58 2.27P‐21 1,053 26: J‐5 53: J‐32 12 780.3 2.21 1.69P‐22 1,348 53: J‐32 23: J‐2 12 780.3 2.21 2.16P‐4 2,781 22: J‐1 27: J‐6 6 188.7 2.14 9.4P‐23 1,600 23: J‐2 54: J‐33 6 173.4 1.97 4.63P‐24 1,296 54: J‐33 55: J‐34 6 173.4 1.97 3.75P‐25 1,377 55: J‐34 30: J‐10 6 173.4 1.97 3.98P‐2 3,799 25: J‐4 50: J‐29 12 689.9 1.96 4.84P‐35 545 59: J‐38 37: J‐18 6 156.1 1.77 1.3P‐6 3,066 24: J‐3 69: J‐42 6 155.1 1.76 7.21P‐7 1,094 69: J‐42 29: J‐8 6 155.1 1.76 2.57P‐12 2,386 28: J‐7 33: J‐13 6 144.8 1.64 4.94P‐31 1,874 59: J‐38 60: J‐39 6 121.4 1.38 2.8P‐32 648 60: J‐39 61: J‐40 6 121.4 1.38 0.97P‐33 666 61: J‐40 62: J‐41 6 121.4 1.38 0.99P‐34 275 62: J‐41 36: J‐17 6 121.4 1.38 0.41P‐41 4,313 50: J‐29 116: J‐14 12 461.1 1.31 2.61P‐9 5,291 51: J‐30 34: J‐15 6 58.1 0.66 2.02P‐38 1,274 33: J‐13 35: J‐16 6 58.1 0.66 0.49P‐13 475 33: J‐13 78: J‐44 6 34.7 0.39 0.07P‐14 166 78: J‐44 32: J‐12 6 34.7 0.39 0.02
Notes:1pipe modeled as PVC with a Hazen‐Williams C value of 130

TABLE G5DISTRIBUTION SYSTEM MODEL RESULTS
DROUGHT‐YEAR SCENARIOJUNCTION INFORMATION
Id Label Elevation Demand Hydraulic Pressure(feet) (gpm) (feet) (psi)
29 J‐8 5,000.00 166.4 5,163.40 70.769 J‐42 5,000.00 0 5,166.30 7224 J‐3 4,990.00 298.9 5,174.50 79.8116 J‐14 4,970.00 29.6 5,188.60 94.636 J‐17 4,920.00 130.3 5,161.60 104.562 J‐41 4,920.00 0 5,162.00 104.761 J‐40 4,900.00 0 5,163.20 113.931 J‐11 4,900.00 244.2 5,166.70 115.460 J‐39 4,890.00 0 5,164.30 118.732 J‐12 4,920.00 37.2 5,196.30 119.678 J‐44 4,920.00 0 5,196.40 119.659 J‐38 4,890.00 0 5,167.50 12034 J‐15 4,930.00 62.4 5,208.60 120.637 J‐18 4,880.00 167.5 5,166.00 123.733 J‐13 4,910.00 55.8 5,196.50 123.958 J‐37 4,880.00 0 5,169.30 125.150 J‐29 4,920.00 0 5,210.00 125.522 J‐1 4,910.00 43 5,201.70 126.225 J‐4 4,920.00 1,314.40 5,215.50 127.826 J‐5 4,900.00 357 5,196.10 128.157 J‐36 4,880.00 0.00 5,177.90 128.952 J‐31 4,900.00 0 5,198.80 129.323 J‐2 4,890.00 109.4 5,191.70 130.528 J‐7 4,900.00 59.1 5,202.10 130.753 J‐32 4,890.00 0 5,194.20 131.635 J‐16 4,890.00 62.4 5,195.90 132.351 J‐30 4,900.00 0 5,210.90 134.527 J‐6 4,880.00 202.6 5,191.00 134.556 J‐35 4,860.00 0 5,185.40 140.855 J‐34 4,850.00 0 5,182.10 143.754 J‐33 4,850.00 0 5,186.40 145.630 J‐10 4,840.00 186.2 5,177.60 146.1
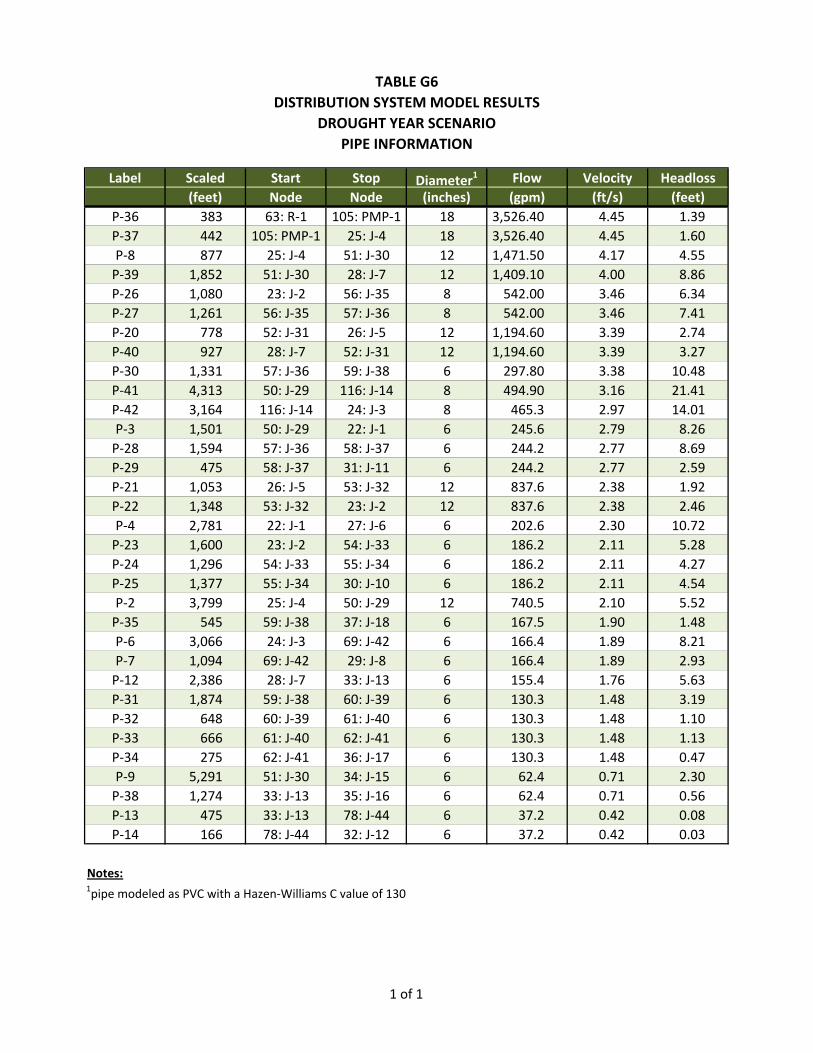
TABLE G6DISTRIBUTION SYSTEM MODEL RESULTS
DROUGHT YEAR SCENARIOPIPE INFORMATION
Label Scaled Start Stop Diameter1 Flow Velocity Headloss(feet) Node Node (inches) (gpm) (ft/s) (feet)
P‐36 383 63: R‐1 105: PMP‐1 18 3,526.40 4.45 1.39P‐37 442 105: PMP‐1 25: J‐4 18 3,526.40 4.45 1.60P‐8 877 25: J‐4 51: J‐30 12 1,471.50 4.17 4.55P‐39 1,852 51: J‐30 28: J‐7 12 1,409.10 4.00 8.86P‐26 1,080 23: J‐2 56: J‐35 8 542.00 3.46 6.34P‐27 1,261 56: J‐35 57: J‐36 8 542.00 3.46 7.41P‐20 778 52: J‐31 26: J‐5 12 1,194.60 3.39 2.74P‐40 927 28: J‐7 52: J‐31 12 1,194.60 3.39 3.27P‐30 1,331 57: J‐36 59: J‐38 6 297.80 3.38 10.48P‐41 4,313 50: J‐29 116: J‐14 8 494.90 3.16 21.41P‐42 3,164 116: J‐14 24: J‐3 8 465.3 2.97 14.01P‐3 1,501 50: J‐29 22: J‐1 6 245.6 2.79 8.26P‐28 1,594 57: J‐36 58: J‐37 6 244.2 2.77 8.69P‐29 475 58: J‐37 31: J‐11 6 244.2 2.77 2.59P‐21 1,053 26: J‐5 53: J‐32 12 837.6 2.38 1.92P‐22 1,348 53: J‐32 23: J‐2 12 837.6 2.38 2.46P‐4 2,781 22: J‐1 27: J‐6 6 202.6 2.30 10.72P‐23 1,600 23: J‐2 54: J‐33 6 186.2 2.11 5.28P‐24 1,296 54: J‐33 55: J‐34 6 186.2 2.11 4.27P‐25 1,377 55: J‐34 30: J‐10 6 186.2 2.11 4.54P‐2 3,799 25: J‐4 50: J‐29 12 740.5 2.10 5.52P‐35 545 59: J‐38 37: J‐18 6 167.5 1.90 1.48P‐6 3,066 24: J‐3 69: J‐42 6 166.4 1.89 8.21P‐7 1,094 69: J‐42 29: J‐8 6 166.4 1.89 2.93P‐12 2,386 28: J‐7 33: J‐13 6 155.4 1.76 5.63P‐31 1,874 59: J‐38 60: J‐39 6 130.3 1.48 3.19P‐32 648 60: J‐39 61: J‐40 6 130.3 1.48 1.10P‐33 666 61: J‐40 62: J‐41 6 130.3 1.48 1.13P‐34 275 62: J‐41 36: J‐17 6 130.3 1.48 0.47P‐9 5,291 51: J‐30 34: J‐15 6 62.4 0.71 2.30P‐38 1,274 33: J‐13 35: J‐16 6 62.4 0.71 0.56P‐13 475 33: J‐13 78: J‐44 6 37.2 0.42 0.08P‐14 166 78: J‐44 32: J‐12 6 37.2 0.42 0.03
Notes:1pipe modeled as PVC with a Hazen‐Williams C value of 130
1 of 1
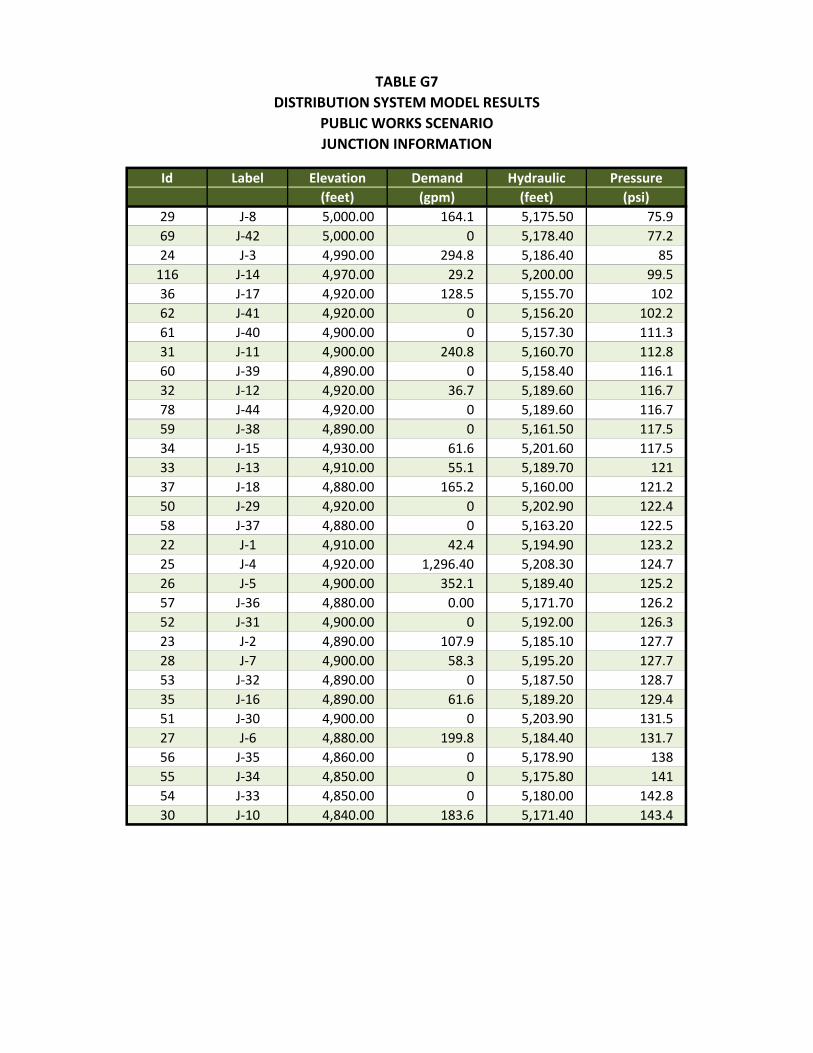
TABLE G7DISTRIBUTION SYSTEM MODEL RESULTS
PUBLIC WORKS SCENARIOJUNCTION INFORMATION
Id Label Elevation Demand Hydraulic Pressure(feet) (gpm) (feet) (psi)
29 J‐8 5,000.00 164.1 5,175.50 75.969 J‐42 5,000.00 0 5,178.40 77.224 J‐3 4,990.00 294.8 5,186.40 85116 J‐14 4,970.00 29.2 5,200.00 99.536 J‐17 4,920.00 128.5 5,155.70 10262 J‐41 4,920.00 0 5,156.20 102.261 J‐40 4,900.00 0 5,157.30 111.331 J‐11 4,900.00 240.8 5,160.70 112.860 J‐39 4,890.00 0 5,158.40 116.132 J‐12 4,920.00 36.7 5,189.60 116.778 J‐44 4,920.00 0 5,189.60 116.759 J‐38 4,890.00 0 5,161.50 117.534 J‐15 4,930.00 61.6 5,201.60 117.533 J‐13 4,910.00 55.1 5,189.70 12137 J‐18 4,880.00 165.2 5,160.00 121.250 J‐29 4,920.00 0 5,202.90 122.458 J‐37 4,880.00 0 5,163.20 122.522 J‐1 4,910.00 42.4 5,194.90 123.225 J‐4 4,920.00 1,296.40 5,208.30 124.726 J‐5 4,900.00 352.1 5,189.40 125.257 J‐36 4,880.00 0.00 5,171.70 126.252 J‐31 4,900.00 0 5,192.00 126.323 J‐2 4,890.00 107.9 5,185.10 127.728 J‐7 4,900.00 58.3 5,195.20 127.753 J‐32 4,890.00 0 5,187.50 128.735 J‐16 4,890.00 61.6 5,189.20 129.451 J‐30 4,900.00 0 5,203.90 131.527 J‐6 4,880.00 199.8 5,184.40 131.756 J‐35 4,860.00 0 5,178.90 13855 J‐34 4,850.00 0 5,175.80 14154 J‐33 4,850.00 0 5,180.00 142.830 J‐10 4,840.00 183.6 5,171.40 143.4
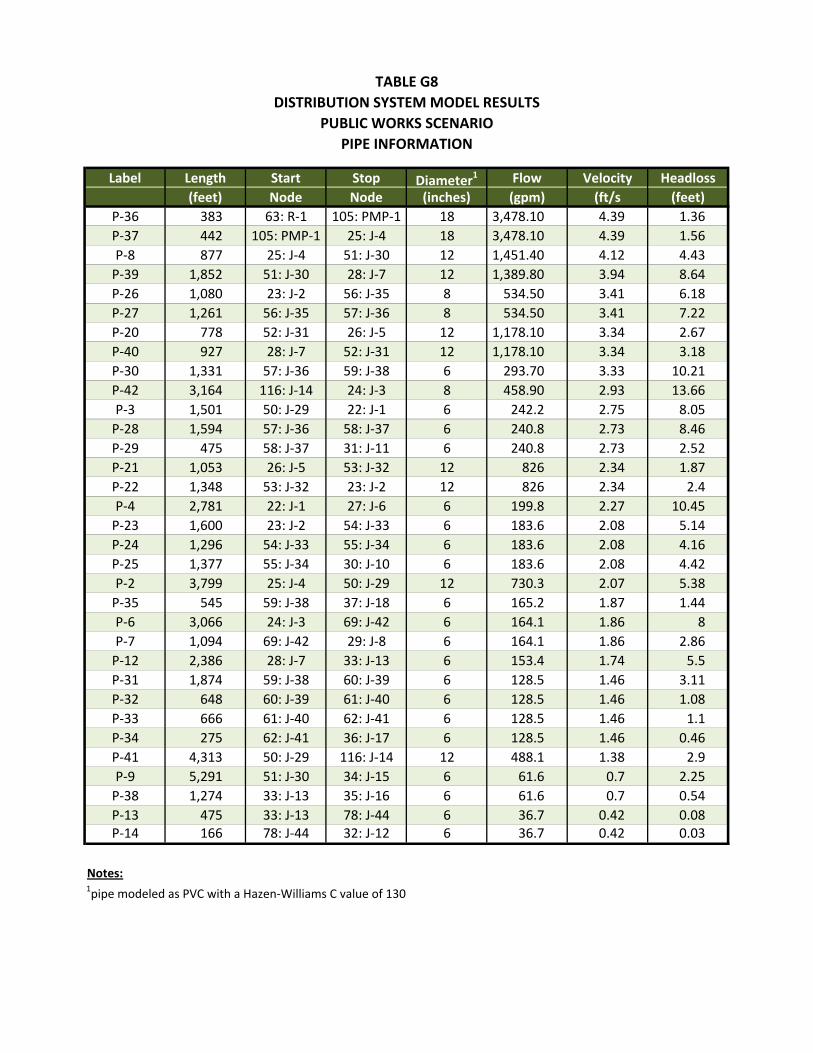
TABLE G8DISTRIBUTION SYSTEM MODEL RESULTS
PUBLIC WORKS SCENARIOPIPE INFORMATION
Label Length Start Stop Diameter1 Flow Velocity Headloss(feet) Node Node (inches) (gpm) (ft/s (feet)
P‐36 383 63: R‐1 105: PMP‐1 18 3,478.10 4.39 1.36P‐37 442 105: PMP‐1 25: J‐4 18 3,478.10 4.39 1.56P‐8 877 25: J‐4 51: J‐30 12 1,451.40 4.12 4.43P‐39 1,852 51: J‐30 28: J‐7 12 1,389.80 3.94 8.64P‐26 1,080 23: J‐2 56: J‐35 8 534.50 3.41 6.18P‐27 1,261 56: J‐35 57: J‐36 8 534.50 3.41 7.22P‐20 778 52: J‐31 26: J‐5 12 1,178.10 3.34 2.67P‐40 927 28: J‐7 52: J‐31 12 1,178.10 3.34 3.18P‐30 1,331 57: J‐36 59: J‐38 6 293.70 3.33 10.21P‐42 3,164 116: J‐14 24: J‐3 8 458.90 2.93 13.66P‐3 1,501 50: J‐29 22: J‐1 6 242.2 2.75 8.05P‐28 1,594 57: J‐36 58: J‐37 6 240.8 2.73 8.46P‐29 475 58: J‐37 31: J‐11 6 240.8 2.73 2.52P‐21 1,053 26: J‐5 53: J‐32 12 826 2.34 1.87P‐22 1,348 53: J‐32 23: J‐2 12 826 2.34 2.4P‐4 2,781 22: J‐1 27: J‐6 6 199.8 2.27 10.45P‐23 1,600 23: J‐2 54: J‐33 6 183.6 2.08 5.14P‐24 1,296 54: J‐33 55: J‐34 6 183.6 2.08 4.16P‐25 1,377 55: J‐34 30: J‐10 6 183.6 2.08 4.42P‐2 3,799 25: J‐4 50: J‐29 12 730.3 2.07 5.38P‐35 545 59: J‐38 37: J‐18 6 165.2 1.87 1.44P‐6 3,066 24: J‐3 69: J‐42 6 164.1 1.86 8P‐7 1,094 69: J‐42 29: J‐8 6 164.1 1.86 2.86P‐12 2,386 28: J‐7 33: J‐13 6 153.4 1.74 5.5P‐31 1,874 59: J‐38 60: J‐39 6 128.5 1.46 3.11P‐32 648 60: J‐39 61: J‐40 6 128.5 1.46 1.08P‐33 666 61: J‐40 62: J‐41 6 128.5 1.46 1.1P‐34 275 62: J‐41 36: J‐17 6 128.5 1.46 0.46P‐41 4,313 50: J‐29 116: J‐14 12 488.1 1.38 2.9P‐9 5,291 51: J‐30 34: J‐15 6 61.6 0.7 2.25P‐38 1,274 33: J‐13 35: J‐16 6 61.6 0.7 0.54P‐13 475 33: J‐13 78: J‐44 6 36.7 0.42 0.08P‐14 166 78: J‐44 32: J‐12 6 36.7 0.42 0.03
Notes:1pipe modeled as PVC with a Hazen‐Williams C value of 130