Embed Size (px)
Citation preview

General rights Copyright and moral rights for the publications made accessible in the public portal are retained by the authors and/or other copyright owners and it is a condition of accessing publications that users recognise and abide by the legal requirements associated with these rights.
Users may download and print one copy of any publication from the public portal for the purpose of private study or research.
You may not further distribute the material or use it for any profit-making activity or commercial gain
You may freely distribute the URL identifying the publication in the public portal If you believe that this document breaches copyright please contact us providing details, and we will remove access to the work immediately and investigate your claim.
Downloaded from orbit.dtu.dk on: Dec 08, 2021
Towards the origins of over-dispersion in beta source calibration
Hansen, Vicki; Murray, Andrew ; Thomsen, Kristina ; Jain, Mayank; Autzen, Martin; Buylaert, Jan-Pieter
Published in:Radiation Measurements
Link to article, DOI:10.1016/j.radmeas.2018.05.014
Publication date:2018
Document VersionPublisher's PDF, also known as Version of record
Link back to DTU Orbit
Citation (APA):Hansen, V., Murray, A., Thomsen, K., Jain, M., Autzen, M., & Buylaert, J-P. (2018). Towards the origins of over-dispersion in beta source calibration. Radiation Measurements, 120, 157-162.https://doi.org/10.1016/j.radmeas.2018.05.014
Contents lists available at ScienceDirect
Radiation Measurements
journal homepage: www.elsevier.com/locate/radmeas
Towards the origins of over-dispersion in beta source calibration
Vicki Hansena,∗, Andrew Murraya, Kristina Thomsenb, Mayank Jainb, Martin Autzenb,Jan-Pieter Buylaerta,b
aNordic Laboratory for Luminescence Dating, Department of Geoscience, Aarhus University, Risø Campus, Denmarkb Center for Nuclear Technologies, Technical University of Denmark, DTU Risø Campus, Denmark
A B S T R A C T
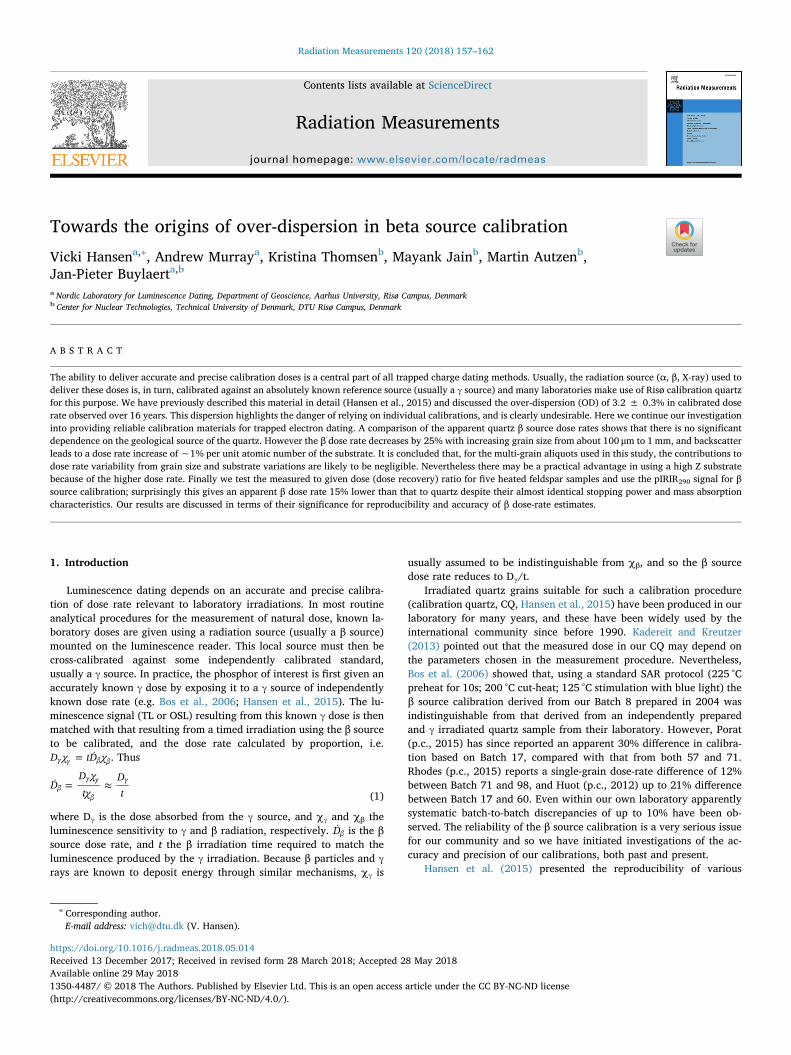
The ability to deliver accurate and precise calibration doses is a central part of all trapped charge dating methods. Usually, the radiation source (α, β, X-ray) used todeliver these doses is, in turn, calibrated against an absolutely known reference source (usually a γ source) and many laboratories make use of Risø calibration quartzfor this purpose. We have previously described this material in detail (Hansen et al., 2015) and discussed the over-dispersion (OD) of 3.2 ± 0.3% in calibrated doserate observed over 16 years. This dispersion highlights the danger of relying on individual calibrations, and is clearly undesirable. Here we continue our investigationinto providing reliable calibration materials for trapped electron dating. A comparison of the apparent quartz β source dose rates shows that there is no significantdependence on the geological source of the quartz. However the β dose rate decreases by 25% with increasing grain size from about 100 μm to 1mm, and backscatterleads to a dose rate increase of ∼1% per unit atomic number of the substrate. It is concluded that, for the multi-grain aliquots used in this study, the contributions todose rate variability from grain size and substrate variations are likely to be negligible. Nevertheless there may be a practical advantage in using a high Z substratebecause of the higher dose rate. Finally we test the measured to given dose (dose recovery) ratio for five heated feldspar samples and use the pIRIR290 signal for βsource calibration; surprisingly this gives an apparent β dose rate 15% lower than that to quartz despite their almost identical stopping power and mass absorptioncharacteristics. Our results are discussed in terms of their significance for reproducibility and accuracy of β dose-rate estimates.
1. Introduction
Luminescence dating depends on an accurate and precise calibra-tion of dose rate relevant to laboratory irradiations. In most routineanalytical procedures for the measurement of natural dose, known la-boratory doses are given using a radiation source (usually a β source)mounted on the luminescence reader. This local source must then becross-calibrated against some independently calibrated standard,usually a γ source. In practice, the phosphor of interest is first given anaccurately known γ dose by exposing it to a γ source of independentlyknown dose rate (e.g. Bos et al., 2006; Hansen et al., 2015). The lu-minescence signal (TL or OSL) resulting from this known γ dose is thenmatched with that resulting from a timed irradiation using the β sourceto be calibrated, and the dose rate calculated by proportion, i.e.
=D χ tD χ˙γ γ β β. Thus
= ≈DD χtχ
Dt
˙ βγ γ
β
γ
(1)
where Dγ is the dose absorbed from the γ source, and χγ and χβ theluminescence sensitivity to γ and β radiation, respectively. Dβ is the βsource dose rate, and t the β irradiation time required to match theluminescence produced by the γ irradiation. Because β particles and γrays are known to deposit energy through similar mechanisms, χγ is
usually assumed to be indistinguishable from χβ, and so the β sourcedose rate reduces to Dγ/t.
Irradiated quartz grains suitable for such a calibration procedure(calibration quartz, CQ, Hansen et al., 2015) have been produced in ourlaboratory for many years, and these have been widely used by theinternational community since before 1990. Kadereit and Kreutzer(2013) pointed out that the measured dose in our CQ may depend onthe parameters chosen in the measurement procedure. Nevertheless,Bos et al. (2006) showed that, using a standard SAR protocol (225 °Cpreheat for 10s; 200 °C cut-heat; 125 °C stimulation with blue light) theβ source calibration derived from our Batch 8 prepared in 2004 wasindistinguishable from that derived from an independently preparedand γ irradiated quartz sample from their laboratory. However, Porat(p.c., 2015) has since reported an apparent 30% difference in calibra-tion based on Batch 17, compared with that from both 57 and 71.Rhodes (p.c., 2015) reports a single-grain dose-rate difference of 12%between Batch 71 and 98, and Huot (p.c., 2012) up to 21% differencebetween Batch 17 and 60. Even within our own laboratory apparentlysystematic batch-to-batch discrepancies of up to 10% have been ob-served. The reliability of the β source calibration is a very serious issuefor our community and so we have initiated investigations of the ac-curacy and precision of our calibrations, both past and present.
Hansen et al. (2015) presented the reproducibility of various
https://doi.org/10.1016/j.radmeas.2018.05.014Received 13 December 2017; Received in revised form 28 March 2018; Accepted 28 May 2018
∗ Corresponding author.E-mail address: [email protected] (V. Hansen).
Radiation Measurements 120 (2018) 157–162
Available online 29 May 20181350-4487/ © 2018 The Authors. Published by Elsevier Ltd. This is an open access article under the CC BY-NC-ND license (http://creativecommons.org/licenses/BY-NC-ND/4.0/).
T
batches of CQ over> 13 years and we have since extended this data setby three more years (Fig. S1a) and five additional new batches of ca-libration quartz. The average standard deviation from an exponentialdecay (Fig. S1, solid line) is 3%, and the ratio of the fitted decay con-stant to that of 90Sr is 0.96 ± 0.05. The average dose rates have anover-dispersion of 2.8 ± 0.7% around the fitted line (Fig. S1b), and themaximum deviations of individual calibration measurements from thefitted line are as large as 10%.
Here we describe further investigations into laboratory parametersthat might affect the accuracy and precision of our CQ. We first com-pare the apparent β source dose rates based on quartz derived fromdifferent geological sources and then investigate the dose rate depen-dence on grain size and atomic number of the sample holder used tohold the phosphor grains. After testing the dose recovery ratio for fiveheated feldspar samples, the pIRIR290 signal is also used for β sourcecalibration and the resulting apparent dose rate compared with thatderived using quartz. This result is then compared with that predictedfrom Monte Carlo modelling. Finally our observations are discussed interms of significance for reproducibility and accuracy of laboratory βdose rates.
2. Instrumentation
All luminescence measurements were undertaken using a Risø TL/OSL DA-20 luminescence reader fitted with blue LEDs (470 nm,∼80mW/cm2) and a90Sr/90Y β source (Bøtter-Jensen et al., 2010). Formeasurement, a monolayer of quartz grains were mounted on 0.3 mmthick stainless steel discs using silicone oil. OSL signals were derivedfrom the first 0.64 s of stimulations minus the subsequent 0.64 s.Equivalent dose measurements employed a SAR protocol (Murray andWintle, 2000, 2003) with a 260 °C for 10 s/220 °C preheat/cutheat,stimulation at 125 °C and cleanout with stimulation at 280 °C for 40 s.XRF measurement made use of a Risø XRF attachment to the reader(Kook et al., 2012) specifically designed for characterising the compo-sition of quartz and feldspar extract (e.g. Porat et al., 2015). All XRFfeldspar grains were measured as loose grains on Mo cups.
3. Apparent dose rate dispersion using quartz of different origins
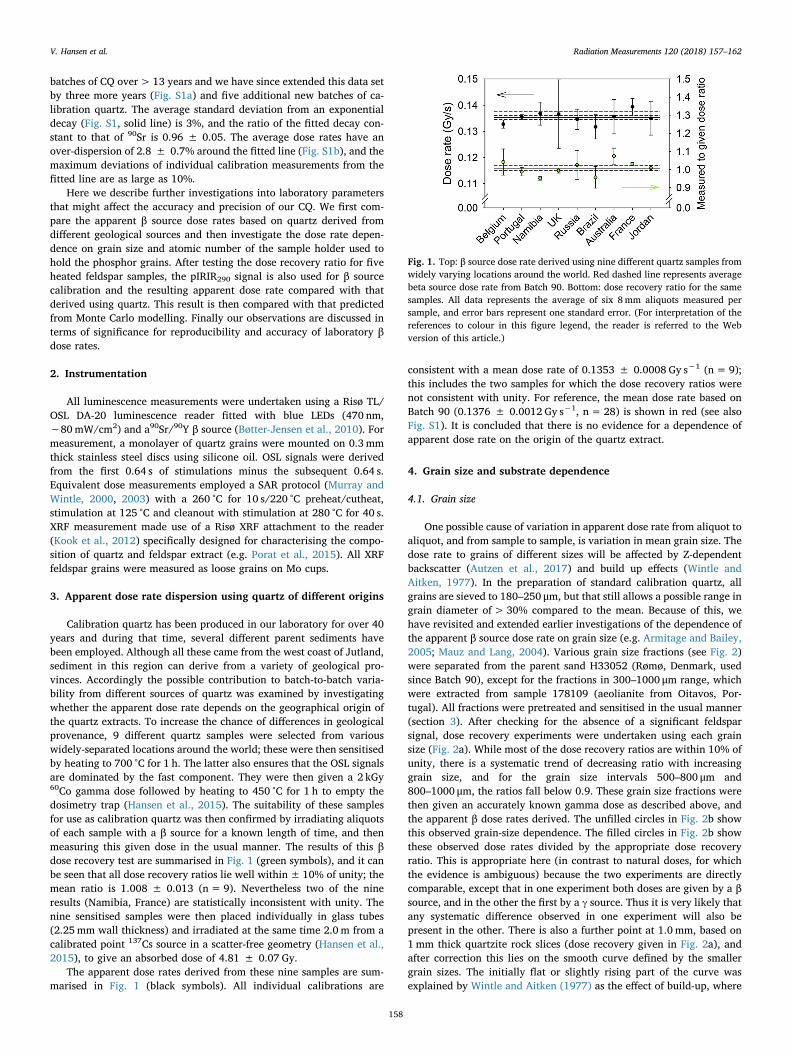
Calibration quartz has been produced in our laboratory for over 40years and during that time, several different parent sediments havebeen employed. Although all these came from the west coast of Jutland,sediment in this region can derive from a variety of geological pro-vinces. Accordingly the possible contribution to batch-to-batch varia-bility from different sources of quartz was examined by investigatingwhether the apparent dose rate depends on the geographical origin ofthe quartz extracts. To increase the chance of differences in geologicalprovenance, 9 different quartz samples were selected from variouswidely-separated locations around the world; these were then sensitisedby heating to 700 °C for 1 h. The latter also ensures that the OSL signalsare dominated by the fast component. They were then given a 2 kGy60Co gamma dose followed by heating to 450 °C for 1 h to empty thedosimetry trap (Hansen et al., 2015). The suitability of these samplesfor use as calibration quartz was then confirmed by irradiating aliquotsof each sample with a β source for a known length of time, and thenmeasuring this given dose in the usual manner. The results of this βdose recovery test are summarised in Fig. 1 (green symbols), and it canbe seen that all dose recovery ratios lie well within±10% of unity; themean ratio is 1.008 ± 0.013 (n= 9). Nevertheless two of the nineresults (Namibia, France) are statistically inconsistent with unity. Thenine sensitised samples were then placed individually in glass tubes(2.25 mm wall thickness) and irradiated at the same time 2.0 m from acalibrated point 137Cs source in a scatter-free geometry (Hansen et al.,2015), to give an absorbed dose of 4.81 ± 0.07 Gy.
The apparent dose rates derived from these nine samples are sum-marised in Fig. 1 (black symbols). All individual calibrations are
consistent with a mean dose rate of 0.1353 ± 0.0008 Gy s−1 (n=9);this includes the two samples for which the dose recovery ratios werenot consistent with unity. For reference, the mean dose rate based onBatch 90 (0.1376 ± 0.0012 Gy s−1, n= 28) is shown in red (see alsoFig. S1). It is concluded that there is no evidence for a dependence ofapparent dose rate on the origin of the quartz extract.
4. Grain size and substrate dependence
4.1. Grain size
One possible cause of variation in apparent dose rate from aliquot toaliquot, and from sample to sample, is variation in mean grain size. Thedose rate to grains of different sizes will be affected by Z-dependentbackscatter (Autzen et al., 2017) and build up effects (Wintle andAitken, 1977). In the preparation of standard calibration quartz, allgrains are sieved to 180–250 μm, but that still allows a possible range ingrain diameter of> 30% compared to the mean. Because of this, wehave revisited and extended earlier investigations of the dependence ofthe apparent β source dose rate on grain size (e.g. Armitage and Bailey,2005; Mauz and Lang, 2004). Various grain size fractions (see Fig. 2)were separated from the parent sand H33052 (Rømø, Denmark, usedsince Batch 90), except for the fractions in 300–1000 μm range, whichwere extracted from sample 178109 (aeolianite from Oitavos, Por-tugal). All fractions were pretreated and sensitised in the usual manner(section 3). After checking for the absence of a significant feldsparsignal, dose recovery experiments were undertaken using each grainsize (Fig. 2a). While most of the dose recovery ratios are within 10% ofunity, there is a systematic trend of decreasing ratio with increasinggrain size, and for the grain size intervals 500–800 μm and800–1000 μm, the ratios fall below 0.9. These grain size fractions werethen given an accurately known gamma dose as described above, andthe apparent β dose rates derived. The unfilled circles in Fig. 2b showthis observed grain-size dependence. The filled circles in Fig. 2b showthese observed dose rates divided by the appropriate dose recoveryratio. This is appropriate here (in contrast to natural doses, for whichthe evidence is ambiguous) because the two experiments are directlycomparable, except that in one experiment both doses are given by a βsource, and in the other the first by a γ source. Thus it is very likely thatany systematic difference observed in one experiment will also bepresent in the other. There is also a further point at 1.0 mm, based on1mm thick quartzite rock slices (dose recovery given in Fig. 2a), andafter correction this lies on the smooth curve defined by the smallergrain sizes. The initially flat or slightly rising part of the curve wasexplained by Wintle and Aitken (1977) as the effect of build-up, where
Fig. 1. Top: β source dose rate derived using nine different quartz samples fromwidely varying locations around the world. Red dashed line represents averagebeta source dose rate from Batch 90. Bottom: dose recovery ratio for the samesamples. All data represents the average of six 8mm aliquots measured persample, and error bars represent one standard error. (For interpretation of thereferences to colour in this figure legend, the reader is referred to the Webversion of this article.)
V. Hansen et al. Radiation Measurements 120 (2018) 157–162
158

the electron flux (and so the dose rate) increases as the beam passesfrom air to quartz. The subsequent decrease with grain size is to beexpected from the larger average contribution from low energy back-scatter to smaller grain sizes (Autzen et al., 2017) and the greater at-tenuation of the primary spectrum as the grain size increases. Similardata have been reported by Armitage and Bailey (2005) and Mauz andLang (2004). From this curve it can be predicted that the dose rate to180 μm grains should be ∼1.5% greater than that to 250 μm; this issmall compared to the observed range of 10% in apparent β dose ratereported above.
4.2. Substrate
The substrate on which grains are irradiated contributes to the totalbeta dose rate by scattering incident electrons back into the quartzgrains. When calibrating a β source, grains are usually presented eitherloose in a thin metal cup (usually 0.1mm stainless steel) or adhered to a
flat metal disc (0.3 mm stainless steel or aluminium) using silicone oil.The main advantage of the cup is the ability to hold a large sample (upto ∼20mg) but this is at the cost of significant dependence of the meandose rate on sample mass, because the backscatter from quartz is dif-ferent from that from stainless steel. Murray (1981) was the first toinvestigate this, and he showed that for an infinitely thick substrate (i.e.a substrate thickness very large compared to the range of the incidentparticles) the apparent β dose rate to CaF2 (mean Z=12.7) on alumi-nium (Z= 13) was ∼13% lower than on steel (Z∼26), and Greilichet al. (2008) and Autzen et al. (2017) have since modelled these data.Since the effective Z of quartz (Z∼10) is slightly less than that of alu-minium, the dose rate to a quartz grain sitting directly on steel will thusbe considerably more than that to a grain sitting on other quartz grains.In practice, we do not irradiate on infinitely-thick substrates, and so wehave investigated the variation in apparent β dose rates to be expectedfor a monolayer of quartz grains placed in 0.1 mm thick cups made froma variety of substrates (Fig. 3a). The variation in dose rate compared tothat for grains irradiated on steel is considerable, from ∼0.78 for alu-minium, up to ∼1.4 for platinum. These effects are considerably largerthan those described earlier, presumably because in thin substratesdensity effects become important; for a given thickness of metal, thereare 40% more atoms per unit area in a steel cup than in one made fromaluminium. In addition, the β dose rate to 180–250 μm grains in pla-tinum cups is ∼40% higher than in conventional stainless steel cups.This increase offers the possibility of a greater routine beta dose rate indating applications, but this can only be taking advantage of if the netspectrum to which the grains are exposed during irradiation is at leastas suitable as that experienced on steel and aluminium.
Autzen et al. (2017) undertook Monte Carlo modelling (usingGEANT4) of the incident β source spectrum and the backscatteredspectra from infinitely thick substrates of various Z. These show that themain effect of changing Z is to change the intensity of the backscatteredspectrum, but that there is a relatively small effect on the energy dis-tribution. In Fig. 3b, we present the primary β spectrum and back-scattered spectra using different substrates (all except Pt, Mo are fromAutzen et al., 2017). For comparison, we have also calculated the in-finite matrix β spectrum from 4 K, as representing a natural spectrum. Itappears that a standard total laboratory spectrum (primary + back-scattered) derived from irradiation on steel discs is likely to containmany more high-energy electrons than any infinite matrix beta spec-trum. It is thus likely that the total spectrum resulting from irradiationon a high Z substrate (e.g. Pt, Z = 78, Fig. 3a) will be closer to thenatural spectrum that those on lower Z substrates.
Fig. 2. a) Beta dose recovery as a function of grain size (4–11, 40–63, 63–90,90–180, 180–250, 300–500, 500–800, 800–1000 μm); red circle – 1mm thickrock slice drilled from quartzite (unknown origin). b) Dose rate dependence ongrain size, for grains mounted in stainless steel discs; red circle - 1mm rockslice. (For interpretation of the references to colour in this figure legend, thereader is referred to the Web version of this article.)
Fig. 3. a) β dose rate to quartz in cups as a function of atomic number normalised to that in conventional stainless-steel cups. (SS is derived using Fe) b) Modelled βsource incident spectrum, and backscattered spectra from various infinitely thick substrates. Later modelling will use finite cup thickness and geometry, but this isexpected to primarily reduce the intensities of the spectra.
V. Hansen et al. Radiation Measurements 120 (2018) 157–162
159
5. K-feldspar
To test whether the observed over-dispersion in the quartz cali-bration time-series (Fig. S1) is related only to the luminescence char-acteristics of quartz or to variability in measurement procedures/in-strumentation, we have begun to investigate the potential of usingfeldspar pIRIR signals for calibration.
From simple examination of mass absorption coefficients (NISTIR5632) and stopping powers (NISTIR 4999), we anticipate that the betadose rate to quartz and feldspar should be indistinguishable. To confirmthis, we have used GEANT4 to formally model both the ratio of gamma
dose rates in pure K feldspar and pure quartz (0.993 ± 0.002 (n=5),averaged over a 1mm thick slice) and the corresponding β dose rateratio (1.0032 ± 0.0008, for a 200 μm thick slice of dosimeter placedon 0.5 mm stainless steel substrate). These data confirm that the β doserate to feldspar should be within 1% of that to quartz.
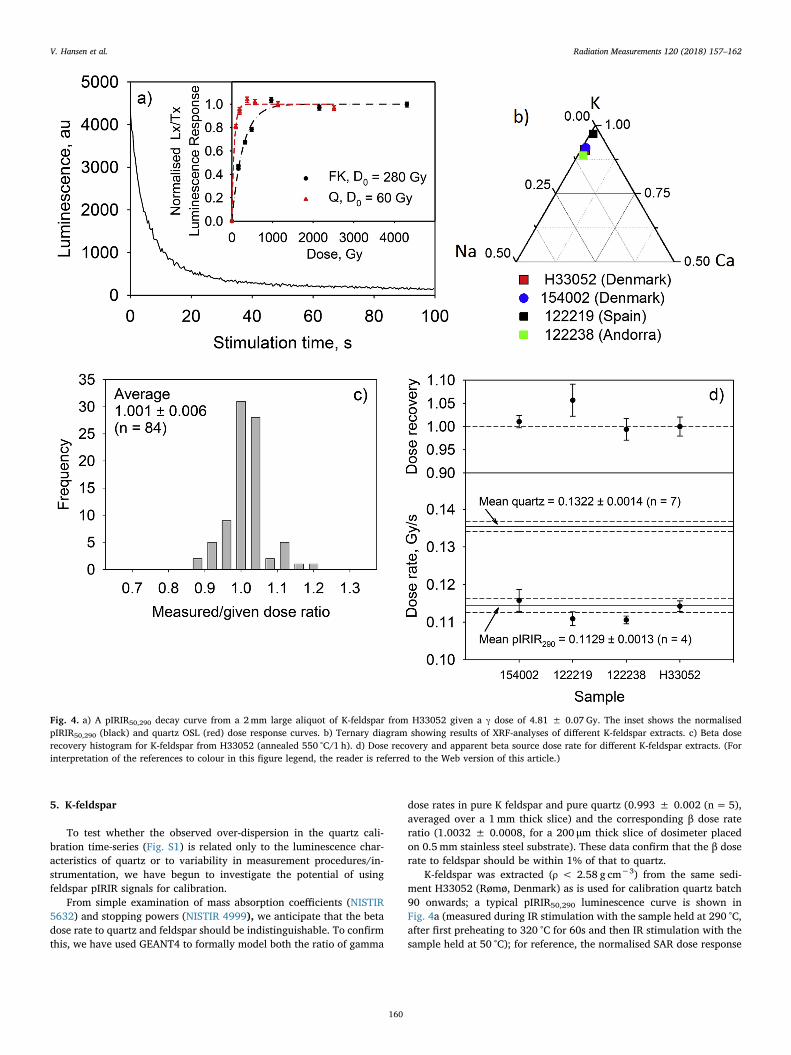
K-feldspar was extracted (ρ < 2.58 g cm−3) from the same sedi-ment H33052 (Rømø, Denmark) as is used for calibration quartz batch90 onwards; a typical pIRIR50,290 luminescence curve is shown inFig. 4a (measured during IR stimulation with the sample held at 290 °C,after first preheating to 320 °C for 60s and then IR stimulation with thesample held at 50 °C); for reference, the normalised SAR dose response
Fig. 4. a) A pIRIR50,290 decay curve from a 2mm large aliquot of K-feldspar from H33052 given a γ dose of 4.81 ± 0.07 Gy. The inset shows the normalisedpIRIR50,290 (black) and quartz OSL (red) dose response curves. b) Ternary diagram showing results of XRF-analyses of different K-feldspar extracts. c) Beta doserecovery histogram for K-feldspar from H33052 (annealed 550 °C/1 h). d) Dose recovery and apparent beta source dose rate for different K-feldspar extracts. (Forinterpretation of the references to colour in this figure legend, the reader is referred to the Web version of this article.)
V. Hansen et al. Radiation Measurements 120 (2018) 157–162
160
curve is shown in the inset, compared to that of the calibration quartzderived from the same sample.
Before this K-rich feldspar extract can be used for calibration it mustbe shown to be pure, and we must test whether a laboratory β dose canbe recovered using our chosen pIRIR50,290 protocol. Fig. 4b shows theresults of XRF analysis; the fraction of K-feldspar is> 90% for allsamples. Fig. 4c shows the results of the β dose recovery test on sampleH33052 after first heating to 550 °C for 1 h; the dose recovery ratio isindistinguishable from unity and the data have a relative standard de-viation of ∼5%.
A portion of this heated extract was then exposed to the 137Csgamma source as described above, and the β source calibrated in theusual manner, but using the pIRIR50,290 signal. Rather disturbingly, theaverage apparent β source dose rate to feldspar is significantly lower(∼15%) than that measured using standard calibration quartz (Fig. 4d,sample H33052).
As a further test of this unexpected discrepancy, three additionalpure K-rich feldspar extracts from different locations (Fig. 4b) wereprepared as above, and irradiated together in the 137Cs γ source. Notethat these three K-feldspar extracts also yield dose recovery ratiosconsistent with unity (Fig. 4d, top). The weighted mean of all fourmeasurements is 0.1119 ± 0.0007 Gy/s (6 aliquots per sample). Thedata are not over-dispersed, but this is not surprising since all 24 ali-quots were measured in a single sequence; the quartz over-dispersionarises mainly between sequences. Nevertheless, these dose rates areconsistent with an average ratio of 0.854 ± 0.013 to that to quartz(Fig. 4d, bottom). The implications of this difference are considerable,and this unexpected discrepancy clearly requires further investigation.However, we can confidently rule out instability of the pIRIR50,290
signal as a significant contribution, because this would tend to lead toan over-estimate of the β source dose rate, rather than an under-estimate.
6. Discussion and conclusions
It is clear that both the grain-size dependence and the backscattercontribution have the potential to contribute to multi-grain aliquot-to-aliquot over-dispersion during β irradiation. Both grain-size dependentattenuation effects on the backscattered and primary spectra, and thepossibility of one grain sitting on top of another (and so experiencing adifferent backscatter contribution from grains sitting directly on thesubstrate) could lead to unexpected variability. The slope of the grainsize dependency in Fig. 2b is ∼7×10⁻⁴ μm−1 (for grain sizes >100 μm); the grain-size range used here is 180–250 μm, suggesting anupper limit to the range in dose rates of ((250-180) x 7×10−4)= 5%,about half of that observed. In practice, no samples will be entirely180 μm or 250 μm, and so the real range in dose rates arising from grainsize variation will be much smaller than this. The variation in dose ratearising from substrate variation is readily eliminated by ensuring amonolayer of grains on the substrate. Thus, we anticipate that, inpractice for the multi-grain aliquots used in Fig. S1, the contributions todose rate variability from grain size and substrate variations are likelyto be negligible.
However, investigations into the effect of substrate variation do leadus to a conclusion of some practical importance. From modelling, wededuced that the net electron spectrum is likely to be closer to thatexperienced in nature for high Z substrates (although whether that isimportant is unknown). Thus it is concluded that there are unlikely tobe any significant undesirable effects of using high Z substrates such asplatinum (Pt) cups in routine irradiations, although it would be veryimportant to ensure grains were presented as a monolayer. In contrast,there is likely to be significant practical benefit in using Pt cups; theaverage dose rate would be 40% greater than on stainless steel, and
75% greater than on Al.The original motivation for investigating the β dose rate to feldspar
was to test whether the poor reproducibility in quartz calibration arisesbecause of instrument variability. At this stage in our investigations, wedo not draw any conclusions on this. However, an unexpected differ-ence of 15% in dose rate to quartz and feldspar has been observed. Thisis surprising because modelling suggests there should be no differencebetween feldspar and quartz calibrations. It is deduced that this dif-ference must arise from differences in quartz and feldspar luminescenceresponse to β and γ radiation (i.e. in χγ and χβ for quartz and feldspar inEquation (1)). Given the observed reproducibility from sample tosample (in both Q and KF, Fig. 1 and Fig. 4d) this difference is likely tobe due mainly to crystal structure.In addition, some grain-to-grainvariation in dose rate within quartz and feldspar cannot be ruled outbecause of variations in both attenuation and backscatter.
Nevertheless, if this observation proves reliable, and if it applies tothe natural β dose rate, then the effect on ages will be relatively small(< 5%) because the total beta dose rate component makes upabout> 70% of the total. But this remains to be tested experimentally.
In summary.
1. The average apparent quartz dose rate is independent of the sourceof the quartz.
2. The effect of likely grain size and substrate variations on β dose ratereproducibility is probably not significant.
3. It may be possible to increase effective β source dose rates by ∼40%using platinum instead of stainless steel cups.
4. The apparent β dose rate to feldspar is ∼15% less than that toquartz, independent of origin; whether this translates into a 15%error in age depends on whether the same effect occurs in nature.
Acknowledgements
We thank Sébastien Huot, Ed Rhodes and Naomi Porat for reportingtheir Batch dependence of source calibrations, and Warren Thompsonfor providing the quartzite rock slices. J.-P. Buylaert and M. Autzenreceive funding from the European Research Council (ERC) under theEU Horizon 2020 programme ERC-2014-StG 639904 – RELOS.
Appendix A. Supplementary data
Supplementary data related to this article can be found at https://doi.org/10.1016/j.radmeas.2018.05.014.
References
Armitage, S.J., Bailey, R.M., 2005. The measured dependence of laboratory beta doserates on sample grain size. Radiat. Meas. 39, 123–127.
Autzen, M., Guérin, G., Murray, A.S., Thomsen, K.J., Buylaert, J.-P., Jain, M., 2017. Theeffect of backscattering on the beta dose absorbed by individual quartz grains. Radiat.Meas. 106, 491–497.
Bos, A.J.J., Wallinga, J., Johns, C., Abellon, R.D., Brouwer, J.C., Schaart, D.R., Murray,A.S., 2006. Accurate calibration of a laboratory beta particle dose rate for datingpurposes. Radiat. Meas. 41, 1020–1025.
Bøtter-Jensen, L., Thomsen, K.J., Jain, M., 2010. Review of optically stimulated lumi-nescence (OSL) instrumental developments for retrospective dosimetry. Radiat. Meas.41, 253–257.
Greilich, S., Murray, A.S., Bøtter-Jensen, L., 2008. Simulation of electron transport duringbeta irradiation. Radiat. Meas. 43, 748–751.
Hansen, V., Murray, A.S., Buylaert, J.-P., Yeo, E.-Y., Thomsen, K.J., 2015. A new irra-diated quartz for beta source calibration. Radiat. Meas. 81, 123–127.
Kadereit, A., Kreutzer, S., 2013. Risø calibration quartz - a challenge for β-source cali-bration. An applied study with relevance for luminescence dating measurement.Journal of the International Measurement Confederation 46, 2238–2250.
Kook, M.H., Lapp, T., Murray, A.S., Thiel, C., 2012. A Risø XRF attachment for majorelement analysis of aliquots of quartz and feldspar separates, 2012. In: UKLuminescence and ESR Meeting, Aberystwyth, September 2012 (Abstract), pp. 37.
V. Hansen et al. Radiation Measurements 120 (2018) 157–162
161
Murray, A.S., 1981. Environmental Radioactivity Studies Relevant toThermoluminescence Dating. Oxford University, pp. 404 unpublished PhD thesis.
Murray, A.S., Wintle, A.G., 2000. Luminescence dating of quartz using an improvedsingle-aliquot regenerative-dose protocol. Radiat. Meas. 32, 57–73.
Murray, A.S., Wintle, A.G., 2003. The single aliquot regenerative dose protocol: potentialfor improvements in reliability. Radiat. Meas. 37, 377–381.
Mauz, B., Lang, A., 2004. Removal of the feldspar-derived luminescence component frompolymineral fine silt samples for optical dating applications: evaluation of chemical
treatment protocols and quality control procedures. Ancient TL 22, 1–8.NISTIR 4999: https://physics.nist.gov/PhysRefData/Star/Text/method.html.NISTIR 5632: https://www.nist.gov/pml/x-ray-mass-attenuation-coefficients.Porat, N., Faerstein, G., Medialdea, A., Murray, A.S., 2015. Re-examination of common
extraction and purification methods of quartz and feldspar for luminescence dating.Ancient TL 33, 1.
Wintle, A.G., Aitken, M.J., 1977. Absorbed dose from a beta source as shown by ther-moluminescence dosimetry. Int. J. Appl. Radiat. Isot. 28, 625–627.
V. Hansen et al. Radiation Measurements 120 (2018) 157–162
162