Embed Size (px)
Citation preview
World Health OrganizationSustainable Development andHealthy Environments
Towards an Assessment ofthe Socioeconomic
Impact of Arsenic Poisoningin Bangladesh
prepared in cooperation withthe Department of Health in Sustainable Development
Protection of the Human EnvironmentWater, Sanitation and Health
Geneva, 2000
WHO/SDE/WSH/00.4Distr.: General
English only
TABLE OF CONTENTS
Acknowledgements . . . . . . . . . . . . . . . . . . . . . . . . . . . . . . . . . . . . . . . . . . . . . . . . . . . . . . 1
1. Introduction . . . . . . . . . . . . . . . . . . . . . . . . . . . . . . . . . . . . . . . . . . . . . . . . . . . . . . . . . . 3
2. The importance of safe water supply to the household . . . . . . . . . . . . . . . . . . . . . 3
3. Health effects of arsenic in drinking water . . . . . . . . . . . . . . . . . . . . . . . . . . . . . . . 53.1 Non-cancer health effects . . . . . . . . . . . . . . . . . . . . . . . . . . . . . . . . . . . . . . . . . . . . 53.2 Cancer health effects . . . . . . . . . . . . . . . . . . . . . . . . . . . . . . . . . . . . . . . . . . . . . . . 63.3 Treatment of arsenicosis sufferers . . . . . . . . . . . . . . . . . . . . . . . . . . . . . . . . . . . . . 8
4. Mitigation of arsenic in drinking water . . . . . . . . . . . . . . . . . . . . . . . . . . . . . . . . . . 84.1 Groundwater . . . . . . . . . . . . . . . . . . . . . . . . . . . . . . . . . . . . . . . . . . . . . . . . . . . . . . 84.2 Surface water . . . . . . . . . . . . . . . . . . . . . . . . . . . . . . . . . . . . . . . . . . . . . . . . . . . . . 10
4.2.1 Surface water treatment . . . . . . . . . . . . . . . . . . . . . . . . . . . . . . . . . . . . . . . 104.2.2 Rainwater . . . . . . . . . . . . . . . . . . . . . . . . . . . . . . . . . . . . . . . . . . . . . . . . . . 11
4.3 Technology choice . . . . . . . . . . . . . . . . . . . . . . . . . . . . . . . . . . . . . . . . . . . . . . . . . 12
5. Arsenicosis and economic status: the poor suffer most . . . . . . . . . . . . . . . . . . . .125.1The relationship between household income and prevalence of arsenicosis 125.2 Explanations for the role of socioeconomic status in arsenic poisening . . . . . . .13
6. The socioeconomic impact of arsenic poisening: coping and steps towardsmodelling . . . . . . . . . . . . . . . . . . . . . . . . . . . . . . . . . . . . . . . . . . . . . . . . . . . . . . . . . . . . . 146.1 Coping with the impact of arsenic poisening: introductory elements . . . . . . . . . .156.2 The policy question: the arsenic poisoning and its socioeconomic impact . . . . .
. 16
7. A sub-model of the epidemiology of arsenicosis at village level . . . . . . . . . . . . . .167.1 Epidemiological model . . . . . . . . . . . . . . . . . . . . . . . . . . . . . . . . . . . . . . . . . . . . . . 177.2 Assignment of prevalence and incidence . . . . . . . . . . . . . . . . . . . . . . . . . . . . . . . .187.3 Natural history of arsenicosis . . . . . . . . . . . . . . . . . . . . . . . . . . . . . . . . . . . . . . . . .197.4 Model results . . . . . . . . . . . . . . . . . . . . . . . . . . . . . . . . . . . . . . . . . . . . . . . . . . . . . . 20
8. Sub-model of arsenicosis and its socioeconomic impact on village households218.1 Socioeconomic household survey at T0 . . . . . . . . . . . . . . . . . . . . . . . . . . . . . . . . . 218.2 Coping . . . . . . . . . . . . . . . . . . . . . . . . . . . . . . . . . . . . . . . . . . . . . . . . . . . . . . . . . . 228.3 Modeling the impact of mitigation methods . . . . . . . . . . . . . . . . . . . . . . . . . . . . . .24
9. Remaining challenges for modelling . . . . . . . . . . . . . . . . . . . . . . . . . . . . . . . . . . . . . 259.1 Including other health and social effects . . . . . . . . . . . . . . . . . . . . . . . . . . . . . . . . 25

9.2 Transition between stages of arsenicosis . . . . . . . . . . . . . . . . . . . . . . . . . . . . . . . . 269.3 Unit of time in the simulation model . . . . . . . . . . . . . . . . . . . . . . . . . . . . . . . . . . . 26
10.Conclusion . . . . . . . . . . . . . . . . . . . . . . . . . . . . . . . . . . . . . . . . . . . . . . . . . . . . . . . . . . . . 27
Bibliography . . . . . . . . . . . . . . . . . . . . . . . . . . . . . . . . . . . . . . . . . . . . . . . . . . . . . . . . . . . . 28
Figures and Tables . . . . . . . . . . . . . . . . . . . . . . . . . . . . . . . . . . . . . . . . . . . . . . . . . . . . . . 33
Appendix I . . . . . . . . . . . . . . . . . . . . . . . . . . . . . . . . . . . . . . . . . . . . . . . . . . . . . . . . . . . . . . 39
Acknowledgements
The authors wish to express their appreciation to all those whose efforts made the production of this
report possible. Special thanks are made to the following persons including:
• Dr Masakazu Tani, Department of Environmental Design, Kyushu Institute of Design (Japan),for providing the original data of his study in Bangladesh with the report (published by AsiaArsenic Network), and comments to finalize the documents,
• Professor Guy Alaerts, the World Bank, for his views on the health and economic aspects ofarsenic poisoning,
• Dr. D.N. Guha Mazumder, Institute of Post Graduate Medical Education and Research (India),for providing his report and information,
• Dr Quazi Quamruzzaman, Dhaka Community Hospital (Bangladesh), for his comments andsuggestions about further needs of study,
• Professor Sushil Ranjan Howlader, Institute of Health Economics, University of Dhaka(Bangladesh), for his comments,
• Dr Antero Aitio, PCS/PHE/SDE WHO, for information about health impact,
• Dr Jenny Pronczuk, PCS/PHE/SDE WHO, for information about diagnosis.
All remaining errors as well as the views expressed in this paper are the responsibility of the authors
only, however.
1
1. Introduction
Access to a safe water supply is one of the most important determinants of health andsocioeconomic development (Cvjetanovic 1986). This recognition of the importance of safe watersupplies has led to an emphasis on the provision of appropriate facilities in developing countries. Inthe 1970s, it was realised that Bangladesh’s population density and lack of access to adequatesanitation had led to severe microbiological contamination of surface water, resulting in high levelsof morbidity and mortality. Bangladesh’s government and population, supported by internationalagencies, have since then installed about 4 million tubewells1 to tap better quality groundwatersources. This tube well initiative is said to have contributed significantly to the halving of infantmortality over a 36-year, from 151/000 in 1960 to 83/000 in 1996. The under-five mortality rate alsodropped from 247/000 to 112/000 in that period (UNICEF 1998).
However, in 1993, drinking water samples from tubewells were found to contain high levelsof arsenic. The area containing the worst arsenic concentrations stretches across the central sectionof Bangladesh from Chapai Nawabganj in the west to Brahmanbaria in the east, although there areisolated areas affected in other regions, particularly the Greater Sylhet area in the north-east. Theexact number of persons at risk from arsenic poisoning is not known with accuracy. The BritishGeological survey (1998) estimates the total population affected as 18.5-22.7 million based on theassumption that the population affected is proportional to the number of wells contaminated.
The arsenic hazard will have an important impact on the health, social and economic status ofthe population. The primary purpose of this paper is to propose a methodology to analyse the healtheffects, how people cope with the socioeconomic consequences of the disease and to predict thebeneficial effects of various alternative mitigation methods. In the next section the importance ofa safe water supply will be discussed from the household perspective. Section 3 outlines the healthimpact of arsenic ingestion from drinking water, the suggested treatment protocol and the optionsfor mitigation programmes. Section 4 investigates current technologies that mitigate arsenic levelsto reduce in drinking water. We focus on the link between arsenicosis and economic status insection 5. In section 6, we address the issue of households’ coping strategies, and discuss stepstowards modeling this coping behavior. Section 7 then sets out a framework for analysis of thesocioeconomic impact of arsenicosis and presents results of an epidemiological model that attemptsto predict the health impact of arsenic poisoning over a 30-year time frame. Further challenges formodeling of arsenicosis and its impact on households are discussed in section 8. We conclude insection 9.
2. The importance of safe water supply to the household
Water intended for human consumption should be both safe and wholesome. This has beendefined as water that is free from pathogenic agents, free from harmful chemical substances, pleasantto taste, i.e. free from colour and odour, and usable for domestic purposes (Park 1997). Withoutample safe drinking water, communities cannot be healthy.
1 The figure of 11 million was stated by Dr Quazi Quamruzzaman, Dhaka Community Hospital, in his presentation atWHO in September 1999. The difference with the figure of 4 million above may be due to difference in the definitionof tubewells, however.
2
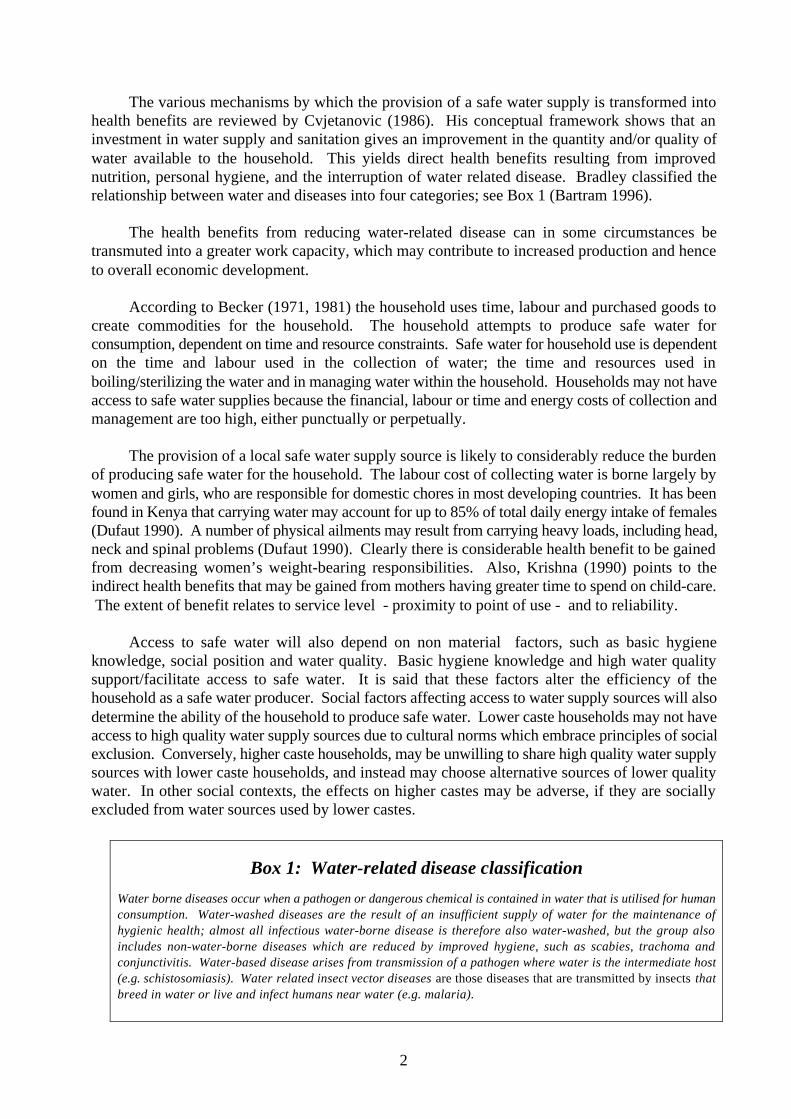
The various mechanisms by which the provision of a safe water supply is transformed intohealth benefits are reviewed by Cvjetanovic (1986). His conceptual framework shows that aninvestment in water supply and sanitation gives an improvement in the quantity and/or quality ofwater available to the household. This yields direct health benefits resulting from improvednutrition, personal hygiene, and the interruption of water related disease. Bradley classified therelationship between water and diseases into four categories; see Box 1 (Bartram 1996).
The health benefits from reducing water-related disease can in some circumstances betransmuted into a greater work capacity, which may contribute to increased production and henceto overall economic development.
According to Becker (1971, 1981) the household uses time, labour and purchased goods tocreate commodities for the household. The household attempts to produce safe water forconsumption, dependent on time and resource constraints. Safe water for household use is dependenton the time and labour used in the collection of water; the time and resources used inboiling/sterilizing the water and in managing water within the household. Households may not haveaccess to safe water supplies because the financial, labour or time and energy costs of collection andmanagement are too high, either punctually or perpetually.
The provision of a local safe water supply source is likely to considerably reduce the burdenof producing safe water for the household. The labour cost of collecting water is borne largely bywomen and girls, who are responsible for domestic chores in most developing countries. It has beenfound in Kenya that carrying water may account for up to 85% of total daily energy intake of females(Dufaut 1990). A number of physical ailments may result from carrying heavy loads, including head,neck and spinal problems (Dufaut 1990). Clearly there is considerable health benefit to be gainedfrom decreasing women’s weight-bearing responsibilities. Also, Krishna (1990) points to theindirect health benefits that may be gained from mothers having greater time to spend on child-care. The extent of benefit relates to service level - proximity to point of use - and to reliability.
Access to safe water will also depend on non material factors, such as basic hygieneknowledge, social position and water quality. Basic hygiene knowledge and high water qualitysupport/facilitate access to safe water. It is said that these factors alter the efficiency of thehousehold as a safe water producer. Social factors affecting access to water supply sources will alsodetermine the ability of the household to produce safe water. Lower caste households may not haveaccess to high quality water supply sources due to cultural norms which embrace principles of socialexclusion. Conversely, higher caste households, may be unwilling to share high quality water supplysources with lower caste households, and instead may choose alternative sources of lower qualitywater. In other social contexts, the effects on higher castes may be adverse, if they are sociallyexcluded from water sources used by lower castes.
Box 1: Water-related disease classification
Water borne diseases occur when a pathogen or dangerous chemical is contained in water that is utilised for humanconsumption. Water-washed diseases are the result of an insufficient supply of water for the maintenance ofhygienic health; almost all infectious water-borne disease is therefore also water-washed, but the group alsoincludes non-water-borne diseases which are reduced by improved hygiene, such as scabies, trachoma andconjunctivitis. Water-based disease arises from transmission of a pathogen where water is the intermediate host(e.g. schistosomiasis). Water related insect vector diseases are those diseases that are transmitted by insects thatbreed in water or live and infect humans near water (e.g. malaria).
3
3. Health effects of arsenic in drinking water
World Health Organization (WHO) recommendations on the acceptability and safety of levelsof arsenic in drinking water have dropped twenty-fold, from a concentration of 0.2 mg per litre in1958 to 0.01 mg per litre in its 1993 Drinking Water Guidelines. But according to BangladeshStandards for Testing Institution (BSTI, 1989) the maximum permissible limit for arsenic (As) is0.05 mg per litre.
There is no widely accepted complete definition of what constitutes arsenicosis. Inorganicarsenic is a classified carcinogen (IARC 1980) that also has a multitude of non-cancer effects. Thewidespread effects of arsenic are perhaps responsible in part for the lack of a widely accepted caredefinition for arsenicosis. Furthermore, some symptoms of arsenicosis (such as shortness of breath)may be observationally indistinguishable from the health effects of other illnesses. It is not possiblehere to undertake a comprehensive review of the health effects of arsenic contamination of drinkingwater. The International Programme on Chemical Safety (IPCS) Environmental Health Criteria(EHC) is making a comprehensive health effect assessment, which will be finalised in 2000. Rather,the purpose of this section is to highlight some of the main findings of the literature on health effects,especially with respect to predictive use of the available information. In addition, arsenic poisoningmay be acute or chronic. In the context of community drinking water supply, only chronic exposureis relevant. Acute poisoning is therefore not discussed further.
3.1 Non-cancer health effectsAccording to the National Research Council report (p89, 1999): “Arsenic exposure interfereswith the action of enzymes, essential actions, and transcriptional events in cells in the body,and a multitude of multisystemic non-cancer effects might ensue.” The most widely notednon-cancer effects of chronic arsenic consumption are skin lesions. The first symptoms toappear after initiation of exposure are hyperpigmentation (dark spots on the skin) andhypopigmentation (white spots on the skin). Some physicians collectively refer to thesesymptoms as melanosis. Hyperpigmentation commonly appear in a raindrop pattern on thetrunk or extremities, but also on mucous membranes such as the tongue (Yeh 1973). Over timearsenic exposure is associated with keratoses on the hands and feet. Keratosis is a conditionwhere the skin hardens and develops into raised wart-like nodules. These nodules becomemore pronounced over time, sometimes reaching 1cm in size (National Research Council1999). Tseng et al. (1977) noted that skin cancers often appear at the sites of existingkeratoses. The time from exposure to manifestation is debated in the literature (see NationalResearch Council 1999). It is likely that differing exposures to arsenic accounts for theheterogeneity in observations. The youngest age reported for patients with hyperpigmentationand keratosis is 2 years (Rosenberg 1974). For Bangladesh, Guha Mazumder et al. (1998)suggests a minimum time gap of five years between first exposure and initial cutaneousmanifestations. The distinctive appearance of these skin lesions has meant they have beenused as indicators of arsenic exposure, when it has not been possible to ascertain arsenicconcentrations in well water.
Arsenic has been associated with a multitude of other non-cancer health effects. Arsenic isassociated with peripheral vascular disease (blackfoot disease) in China (Province of Taiwan)(Tseng 1977). This condition results in gangrene in the extremities and usually occurs inconjunction with skin lesions. Other cardiovascular problems such as hypertension(Chen et al. 1995) and ischemic heart disease have been found to be associated with arsenic
4
(Tsuda et al. 1995). Research into organ damage has concentrated mainly on the liver.Guha Mazumder et al. (1988) found evidence of liver enlargement and non cirrhotic portalfibrosis among a small sample of severely affected arsenic patients in West Bengal. In a laterstudy, Guha Mazumder et al. (1997) also suggested pulmonary health effects. They foundrestrictive lung disease among 53% of a small sample of severely affected arsenic patients inWest Bengal.
In terms of haematological effects, anaemia is commonly cited (National Research Council1999). Another widely suggested health effect is diabetes mellitus. Rahman et al. (1998) founda significant dose response relationship between arsenic exposure and diabetes mellitus amongthose suffering from keratoses in Dhaka, Bangladesh.
3.2 Cancer health effects
Hutchinson (1887) identified arsenic as a carcinogen because of the high number of skincancers occurring on patients treated with arsenicals. The International Agency for Researchon Cancer (IARC 1980) classified inorganic arsenic compounds as skin and lung (viainhalation) carcinogens. In the period following this classification, concerns have grown overthe possibility of arsenic in drinking water causing a number of other cancers.
The strongest epidemiological evidence on skin cancer effects comes from studies of arseniccontamination of drinking water in China (Province of Taiwan). Villages in south-westernChina (Province of Taiwan) switched from surface water to arsenic contaminated well waterfor drinking in the 1920s. An early study by Tseng et al. (1968) found evidence of a doseresponse relationship between concentration of arsenic in drinking water and prevalence ofskin cancer. IPCS (1981) estimated skin cancer risk from life-time exposure to arsenic indrinking water at 5% for 0.2 mg of arsenic per litre, based on the findings of Tseng et al.(1977). Based on the increased incidence of skin cancer observed in the population in China(Province of Taiwan), the US Environmental Protection Agency (1988) has used a multistagemodel that is both linear and quadratic in dose to estimate the lifetime skin cancer riskassociated with the ingestion of arsenic in drinking-water. With this model and data on males,the concentrations of arsenic in drinking-water associated with estimated excess lifetime skincancer risks of 10-4, 10-5, and 10-6 are 0.0017, 0.00017, and 0.000017 mg/l respectively.Considering other data and the fact that the concentration of arsenic in drinking-water at anestimated skin cancer risk of 10-5 is below the practical quantification limit of 0.01 mg/l as wellas a view to reducing the concentration of arsenic in drinking-water, provisional guidelinevalue of 0.01 mg/l is recommended (WHO 1996). The guideline value is associated with anexcess life-time risk for skin cancer of 6x 10⁻⁴ (i.e. six persons in 10,000).
High levels of arsenic in drinking water are also associated with a number of internal cancers.However, it is difficult to quantitatively establish risk in many of the studies, due to problemsin measuring exposure to arsenic. Chen et al. (1985) calculated standardised mortality ratios(SMRs) for a number of cancers in 84 villages in south-western China (Province of Taiwan).Mortality from 1968-1986 was compared with age and sex adjusted expected mortality.Significantly increased mortality was observed among both males and females for bladder,kidney, lung, liver and colon cancers. However, the authors were not able to directly estimatearsenic concentrations in well water. Chen and Wang (1990) were able to use data on arsenicconcentrations in 83,656 wells in 314 precincts and townships, collected from 1974-1976 in
5
China (Province of Taiwan). The authors used a multiple regression approach to control forsocioeconomic confounding factors, and compared age adjusted mortality rates with averagearsenic concentrations in each township. They found a significant relationship with arsenicconcentration and mortality from cancers of the liver, nasal cavity, lung, bladder and kidneyfor both sexes. One problem with this study for the purpose of quantitative risk assessment,is that the authors do not report the methodology used for calculating the average arsenicconcentration for each township or precinct.
Hopenhayn-Rich et al. (1998) examined SMRs for bladder, kidney, lung, liver and stomachcancers for 1986-1991 for 26 counties in the Cordoba Province in Argentina. The authorsstratified counties into low, intermediate and high exposure groups based on arsenic levels intheir drinking water. The low and intermediate exposure counties were defined by the authors.Data for arsenic levels in the two high exposure counties were given. These levels ranged from0.04 mg/l to 0.43 mg/l. SMRs were calculated using age and sex specific national rates forArgentina. Significant exposure-response relationships were found for the cancer in thebladder, lung and kidney. It is unlikely that smoking is a confounding factor, as deaths fromchronic obstructive pulmonary disease (indicative of smoking) were not related to arsenicconcentrations.
The above-mentioned studies all utilised an ecological design and are thus susceptible to biasfrom confounding factors. However, the bladder and lung cancer results of these studies arealso confirmed by cohort studies which may be less susceptible to this form of bias. Thesestudies are also useful in providing data on the latency period of internal cancers. Cuzick et al.(1992) studied a cohort of patients treated with Fowler’s solution (potassium arsenite) inEngland from 1945-1969. In the follow up until 1991, a significant excess of bladder cancermortality occurred. In addition, a subset of patients had exhibited skin lesions when examinedin 1970. It was found that all patients who subsequently died of bladder cancer had alsosuffered skin lesions. Even after stratifying this subset according to dose group, the findingthat all cases had skin lesions was highly significant. The authors suggested this providedevidence that skin lesions are a useful biomarker for susceptibility to internal cancers. Theperiod between first exposure and death from bladder cancer varied from 10 years to over20 years.
Tsuda et al. (1995) followed up a cohort of 454 residents in Japan who had used industriallypolluted water for five years. The authors separated the cohort into low, medium and highexposure groups, based on arsenic concentration in local wells. The low group was exposedto less than 0.05 mg/l, the medium exposure group 0.05-0.99 mg/l and the high exposure groupgreater than 1 mg/l. A significant excess of cancers occurred only in the group exposed to anarsenic concentration greater than 1 mg/l. This finding may be because the small sample sizeis unable to detect significant excess deaths in the medium exposure group. There may alsobe underestimation of the effect due to the relatively short period of exposure. Significantexcess deaths from lung cancer (nine deaths) and urinary tract cancer (two from bladder cancerand one renal pelvis cancer) were observed in the high exposure group. In contrast to thefindings of Cuzick et al. (1992), the authors found excess cancer mortality among those bothwith and without skin lesions present: “The results demonstrate that negative skin signs areno assurance of low risk for cancer development.” (Tsuda et al. p207, 1995). The authors notethat the period from first exposure to death from lung cancer varied from 11 to 35 years, witha mean of 26.7 years.
6
To conclude, the results from studies of cancer indicate strong evidence that exposure toarsenic is related to skin, lung and bladder cancer, although more established assessment onhealth effect of arsenic is being prepared by IPCS/EHC. It is likely that arsenic causes anumber of other cancers, but thus far epidemiological evidence has not been consistent forother sites in the body.
3.3 Treatment of arsenicosis sufferers
Guha Mazumder (1996) outlines a treatment regime for those suffering from arsenicosis. Itis suggested that the first stage in treating those with arsenicosis should be the immediatecessation of consumption of arsenic contaminated water. Once this has been achieved theemphasis should be on the provision of a diet high in protein (preferably meat) and vitamins,to aid the methylation of inorganic arsenic in the body. The chelating agents DMPS(dimercaptopropane sulphonate) and DMSA (dimercaptosuccinic acid) are recommended astreatment drugs. DMPS is considered more efficacious than DMSA in aiding the eliminationof arsenic from the body, but DMSA is preferred for wide spread application because of itslower risk of side effects (Angle 1995). However, Guha Mazumder (1996) notes that thesedrugs are very expensive. Chelation therapy has been demonstrated to be effective in thetreatment of acute arsenic poisoning. Its value in treatment of chronic poisoning remainsundemonstrated. Palliative care may be the only affordable treatment in rural areas ofBangladesh, where expensive drugs and protein-rich diets are unlikely to be available to thevast majority. In the case of keratosis, application of ointment containing salicylic acid canhelp to soften the skin and ease the pain of the patient.
4. Mitigation of arsenic in drinking water
This section will analyse the technologies that can be used to provide safe drinking water inrural Bangladesh. The available options for safe water can be classified by source: groundwater,surface water and rainwater. Recent years have seen increasing acceptance of strategies forincremental improvement in environment and health in general and of demand-driven approachesin water supply and sanitation in particular. It is inappropriate therefore to pursue a single “master”technological solution but rather to inform communities and individuals of alternatives and theircharacteristics, to “offer” a selection of alternatives. The mitigation measures outlined below shouldnot be seen as a list from which the most preferable should be selected, but the basis for developmentof a portfolio of alternatives.
4.1 Groundwater
The simplest and most immediately achievable option is the sharing of tubewells that arecurrently low or free from arsenic. Arsenic-containing wells may still be used safely forlaundry-washing for example, and a simple colour coding (e.g. “traffic lights”) may have asignificant impact on community arsenic exposure if carefully and continuously backed up byawareness raising and educational activities. However, in the most highly contaminated areasno tubewells will contain safe levels of arsenic. Furthermore, colour-coding would have to bemonitored carefully over time, as tubewells with previously safe test results may be later foundto contain increased levels of arsenic. The principal costs of such an approach relate to the
7
ongoing testing and labelling of wells and of continuous awareness raising and education.These may be borne by the community or an outside agency. In practice the household burdenof water collection is likely to increase (i.e. a greater average distance will be travelled in orderto collect the same volume of water).
The other alternative for groundwater supply is the development of deep tubewells. TheBritish Geological Survey (1998) found only two out of 280 tubewells below 200 m inBangladesh to be contaminated with high levels of arsenic. The principal costs of such anapproach relate to the costs of developing deep tubewells. There include costs of training andequipping drilling teams as well as the direct costs of drilling per se including a proportion ofunsuccessful bores. These may be borne by the community or an outside agency. Ifcontaminated wells remain in use for other purposes such as laundry then ongoing awareness-raising and education will be essential. If new wells are appropriately sited then the householdburden of water collection may be constant or even decrease. Deep tubewells have been in usefor years in coastal areas because of high salinity in shallow aquifers. However, it is notpossible to exploit this technology in all areas because rock formations may make drillingunfeasible.
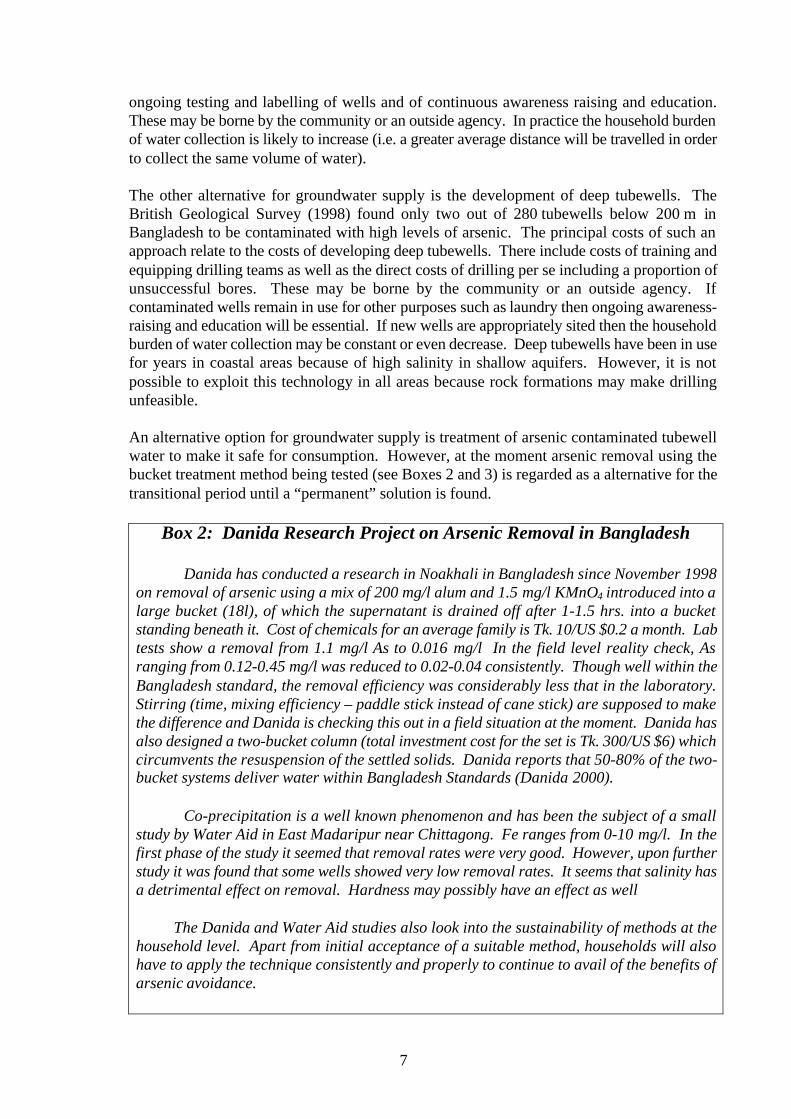
An alternative option for groundwater supply is treatment of arsenic contaminated tubewellwater to make it safe for consumption. However, at the moment arsenic removal using thebucket treatment method being tested (see Boxes 2 and 3) is regarded as a alternative for thetransitional period until a “permanent” solution is found.
Box 2: Danida Research Project on Arsenic Removal in Bangladesh
Danida has conducted a research in Noakhali in Bangladesh since November 1998on removal of arsenic using a mix of 200 mg/l alum and 1.5 mg/l KMnO4 introduced into alarge bucket (18l), of which the supernatant is drained off after 1-1.5 hrs. into a bucketstanding beneath it. Cost of chemicals for an average family is Tk. 10/US $0.2 a month. Labtests show a removal from 1.1 mg/l As to 0.016 mg/l In the field level reality check, Asranging from 0.12-0.45 mg/l was reduced to 0.02-0.04 consistently. Though well within theBangladesh standard, the removal efficiency was considerably less that in the laboratory.Stirring (time, mixing efficiency – paddle stick instead of cane stick) are supposed to makethe difference and Danida is checking this out in a field situation at the moment. Danida hasalso designed a two-bucket column (total investment cost for the set is Tk. 300/US $6) whichcircumvents the resuspension of the settled solids. Danida reports that 50-80% of the two-bucket systems deliver water within Bangladesh Standards (Danida 2000).
Co-precipitation is a well known phenomenon and has been the subject of a smallstudy by Water Aid in East Madaripur near Chittagong. Fe ranges from 0-10 mg/l. In thefirst phase of the study it seemed that removal rates were very good. However, upon furtherstudy it was found that some wells showed very low removal rates. It seems that salinity hasa detrimental effect on removal. Hardness may possibly have an effect as well
The Danida and Water Aid studies also look into the sustainability of methods at thehousehold level. Apart from initial acceptance of a suitable method, households will alsohave to apply the technique consistently and properly to continue to avail of the benefits ofarsenic avoidance.
8
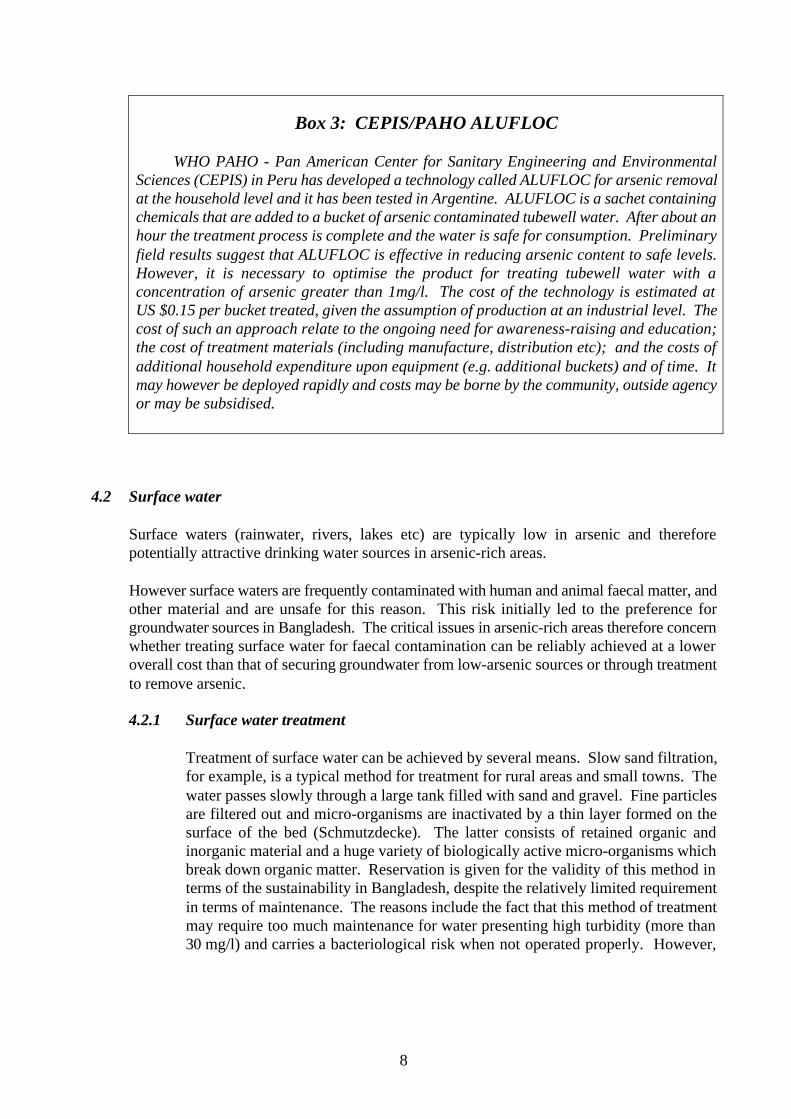
Box 3: CEPIS/PAHO ALUFLOC
WHO PAHO - Pan American Center for Sanitary Engineering and EnvironmentalSciences (CEPIS) in Peru has developed a technology called ALUFLOC for arsenic removalat the household level and it has been tested in Argentine. ALUFLOC is a sachet containingchemicals that are added to a bucket of arsenic contaminated tubewell water. After about anhour the treatment process is complete and the water is safe for consumption. Preliminaryfield results suggest that ALUFLOC is effective in reducing arsenic content to safe levels.However, it is necessary to optimise the product for treating tubewell water with aconcentration of arsenic greater than 1mg/l. The cost of the technology is estimated atUS $0.15 per bucket treated, given the assumption of production at an industrial level. Thecost of such an approach relate to the ongoing need for awareness-raising and education;the cost of treatment materials (including manufacture, distribution etc); and the costs ofadditional household expenditure upon equipment (e.g. additional buckets) and of time. Itmay however be deployed rapidly and costs may be borne by the community, outside agencyor may be subsidised.
4.2 Surface water
Surface waters (rainwater, rivers, lakes etc) are typically low in arsenic and thereforepotentially attractive drinking water sources in arsenic-rich areas.
However surface waters are frequently contaminated with human and animal faecal matter, andother material and are unsafe for this reason. This risk initially led to the preference forgroundwater sources in Bangladesh. The critical issues in arsenic-rich areas therefore concernwhether treating surface water for faecal contamination can be reliably achieved at a loweroverall cost than that of securing groundwater from low-arsenic sources or through treatmentto remove arsenic.
4.2.1 Surface water treatment
Treatment of surface water can be achieved by several means. Slow sand filtration,for example, is a typical method for treatment for rural areas and small towns. Thewater passes slowly through a large tank filled with sand and gravel. Fine particlesare filtered out and micro-organisms are inactivated by a thin layer formed on thesurface of the bed (Schmutzdecke). The latter consists of retained organic andinorganic material and a huge variety of biologically active micro-organisms whichbreak down organic matter. Reservation is given for the validity of this method interms of the sustainability in Bangladesh, despite the relatively limited requirementin terms of maintenance. The reasons include the fact that this method of treatmentmay require too much maintenance for water presenting high turbidity (more than30 mg/l) and carries a bacteriological risk when not operated properly. However,
9
Pond Sand Filters2 are still useful as an option in Bangladesh especially in the coastalbelt where there are few alternatives.
The key elements in the decision-making process leading to the selection of thistechnology as opposed to ground water deals with the costs involved not only interms of capital investment in infrastructure, but also the cost of maintenance,including supervisory support. If arsenic-containing wells are maintained in use thenongoing awareness raising and education will be required. The household burden ofwater collection is likely to increase (as the number of available sources is likely todecrease) unless opportunity of capital investment is taken to develop pipeddistribution.
4.2.2 Rainwater
Rainwater harvesting3 is a recognised water technology in use in many developingcountries around the world (WHO/IRC 1997). UNICEF has promoted dispersion ofthe technology since 1994 in Bangladesh. The rainwater is collected using either asheet material rooftop and guttering or a plastic sheet and is then diverted to a storagecontainer. Water is not collected during the first few minutes of a rainstorm to avoidcontamination by dust, insects, bird dropping, etc.
The costs of rainwater harvesting will be largely capital intensive, and will bedependent on the availability of suitable roofing, materials for guttering and storagetanks. Rainwater use has proven to be successful elsewhere, such as in China(Province of Taiwan), Sri Lanka and Thailand.
In some circumstances there is the possibility of chemical contamination of thecollected water, particularly where air pollution is a major problem and wherebacteriological contamination may be caused by bird drops. There is also thepossibility of contamination particularly when the water is stored for long periods dueto the intrusion of insects, etc. Health inspections are needed regularly to ensure thatthe water is of good quality. However, these reservations might be less problematicas rainwater quality in many circumstances is at least as good as the piped waterdistributed in many towns in Bangladesh.
The above are only examples of technologies that might be considered as analternative for the current ground water abstraction. There are other low-costtechnologies to be considered in a decision-making process such as springs,infiltration galleries, etc.
2 The pond sand filter (PSF) is a manually operated filtration unit built by the side of a pond which treats pond water byusing the principle of slow sand filtration. Recent bacteriological examination of the PSFs in Bangladesh show that theseare not functioning too badly when maintained well (Chowdhury 2000).3 In a country with a mean annual rainfall in excess of 1500mm this is an attractive mitigation technology. Rooftopcatchments are most suited to family requirements as corrugated iron roofs are ever-present in Bangladesh. Rainwateris collected in storage containers of various sizes above and below ground. Even a jar (200-1000 litre) will allow a highdegree of convenience and water security during 7-9 months of the year (Heijnen 1999).
10
4.3 Technology choice
The choice between these technologies should take into account their cost effectiveness inproviding arsenic free and microbiologically safe drinking water. Different options may havevery different balances of cost between for example capital and recurrent costs and may impactdifferently on the household costs of water management. However, the criteria ofsustainability and acceptance by rural users must be incorporated in the calculation of costeffectiveness, in order to aid the decision making process over which mitigation method(s) toimplement.
5. Arsenicosis and economic status: the poor suffer most
5.1 The relationship between household income and prevalence of arsenicosis
The Asia Arsenic Network conducted a demographic survey of Samta Village in the JessoreDistrict of Bangladesh in 1998 (Tani,1999a;b). A graphical representation of householdincome data versus arsenicosis prevalence, using data collected in this survey, showed anegative relationship. In an attempt to further quantify this relationship a regression analysiswas conducted using the same data. Prevalence of arsenicosis was based on evidence of skinlesions in the surveyed population. Household income was measured on an annual basis. Itis based on a self reported estimate by the household head for a given period. If the periodreported was less than one year, this estimate was multiplied by the appropriate factor to obtainthe annual income for the household. As most villagers are subsistence farmers, theseestimates should be considered as lower bounds for income, as it is likely that at least somevillagers will not have included the monetary value of produce consumed within thehousehold. Prevalence data were grouped by annual household income class using ranges of10,000 Taka. Data for households with an income above 170,000 Taka were excluded due tosmall sample size: typically one household per income class. Therefore, the data consisted of17 household income classes. There were no arsenicosis patients in any of the income classesabove the 140,000-150,000 Taka household income range.
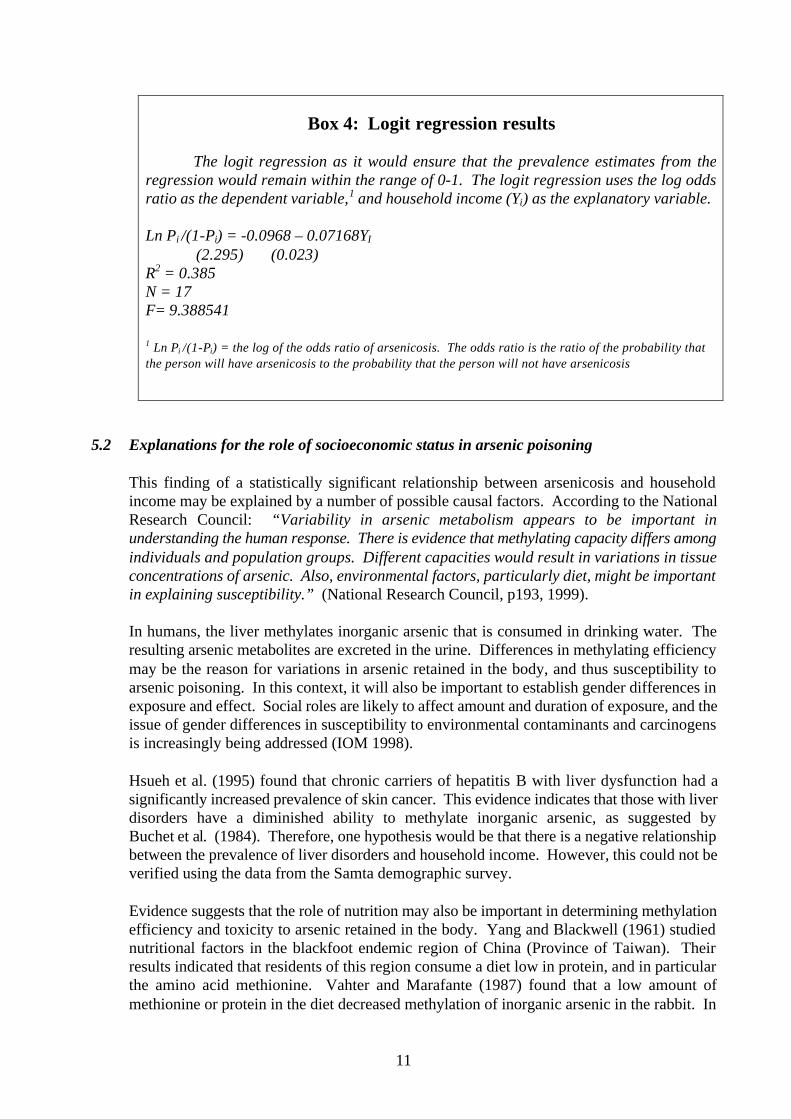
A logit regression form was found to be appropriate (Box 4). The coefficient for householdincome is significant beyond the 1% level (p=0.0078). The regression indicates the negativerelationship between arsenicosis and household income. Increasing levels of householdincome are associated with a lower prevalence of arsenicosis.4 The estimated α and βcoefficients from this regression are used to calculate the prevalence estimates that arepresented in Figure 5.1 along with the observed data5. It can be seen from reference toFigure 5.1 that the burden of arsenicosis falls mainly on those living in low incomehouseholds. This relationship between household income and health damage by arsenic washinted at, although not quantitatively proven, by Tani (1999a).
4 The errors terms were not found to be heteroskedastic using a Koenker test (Koenker 1981):E2
i = - 3.652174 + 0.188817YI; R2 = 0.14 N=17; F= 2.4431; p= 0.1389 (11.85142) (0.120801) Where E2
i = the error terms from the Logit regression. The null hypothesis of homoskedasticity could not be rejectedat the 5% significance level. (p = 0.13).5 Prevalence estimates are obtained using the formula: Pi = 1/1+e-(α+βYi). See Intriligator (1978).
11
Box 4: Logit regression results
The logit regression as it would ensure that the prevalence estimates from theregression would remain within the range of 0-1. The logit regression uses the log oddsratio as the dependent variable,1 and household income (Yi) as the explanatory variable.
Ln Pi /(1-Pi) = -0.0968 – 0.07168YI
(2.295) (0.023)R2 = 0.385N = 17F= 9.388541
1 Ln Pi /(1-Pi) = the log of the odds ratio of arsenicosis. The odds ratio is the ratio of the probability thatthe person will have arsenicosis to the probability that the person will not have arsenicosis
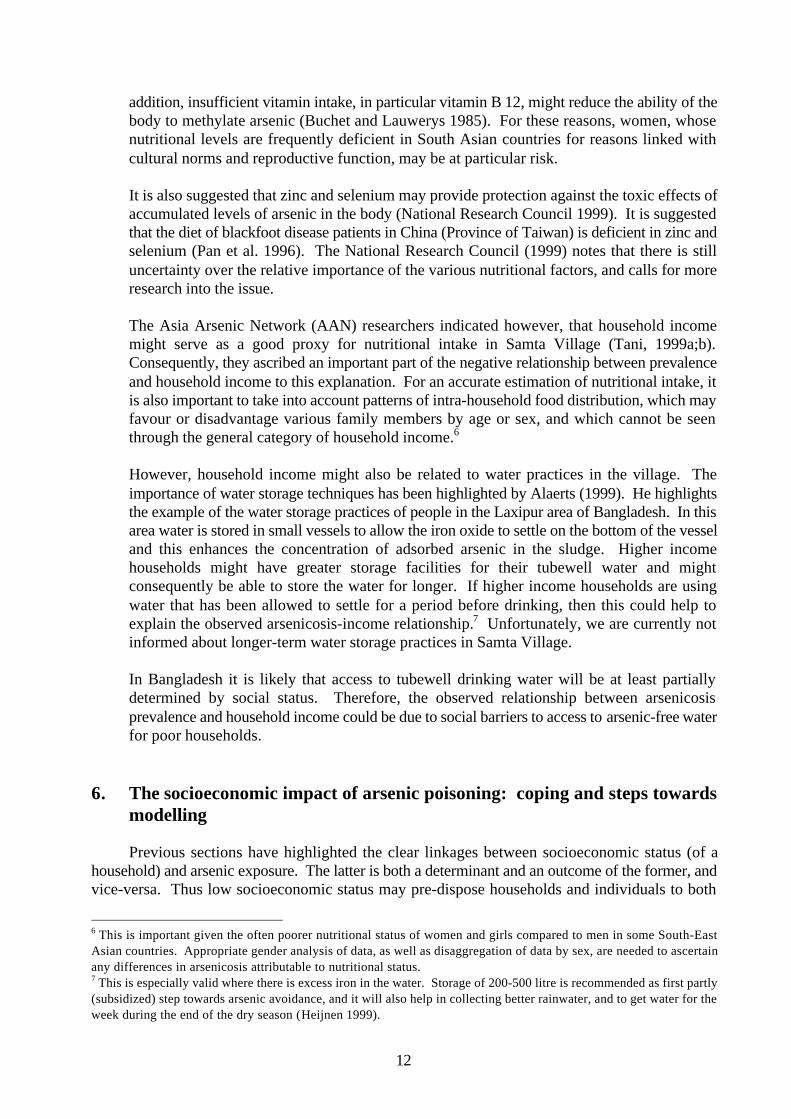
5.2 Explanations for the role of socioeconomic status in arsenic poisoning
This finding of a statistically significant relationship between arsenicosis and householdincome may be explained by a number of possible causal factors. According to the NationalResearch Council: “Variability in arsenic metabolism appears to be important inunderstanding the human response. There is evidence that methylating capacity differs amongindividuals and population groups. Different capacities would result in variations in tissueconcentrations of arsenic. Also, environmental factors, particularly diet, might be importantin explaining susceptibility.” (National Research Council, p193, 1999).
In humans, the liver methylates inorganic arsenic that is consumed in drinking water. Theresulting arsenic metabolites are excreted in the urine. Differences in methylating efficiencymay be the reason for variations in arsenic retained in the body, and thus susceptibility toarsenic poisoning. In this context, it will also be important to establish gender differences inexposure and effect. Social roles are likely to affect amount and duration of exposure, and theissue of gender differences in susceptibility to environmental contaminants and carcinogensis increasingly being addressed (IOM 1998).
Hsueh et al. (1995) found that chronic carriers of hepatitis B with liver dysfunction had asignificantly increased prevalence of skin cancer. This evidence indicates that those with liverdisorders have a diminished ability to methylate inorganic arsenic, as suggested byBuchet et al. (1984). Therefore, one hypothesis would be that there is a negative relationshipbetween the prevalence of liver disorders and household income. However, this could not beverified using the data from the Samta demographic survey.
Evidence suggests that the role of nutrition may also be important in determining methylationefficiency and toxicity to arsenic retained in the body. Yang and Blackwell (1961) studiednutritional factors in the blackfoot endemic region of China (Province of Taiwan). Theirresults indicated that residents of this region consume a diet low in protein, and in particularthe amino acid methionine. Vahter and Marafante (1987) found that a low amount ofmethionine or protein in the diet decreased methylation of inorganic arsenic in the rabbit. In
12
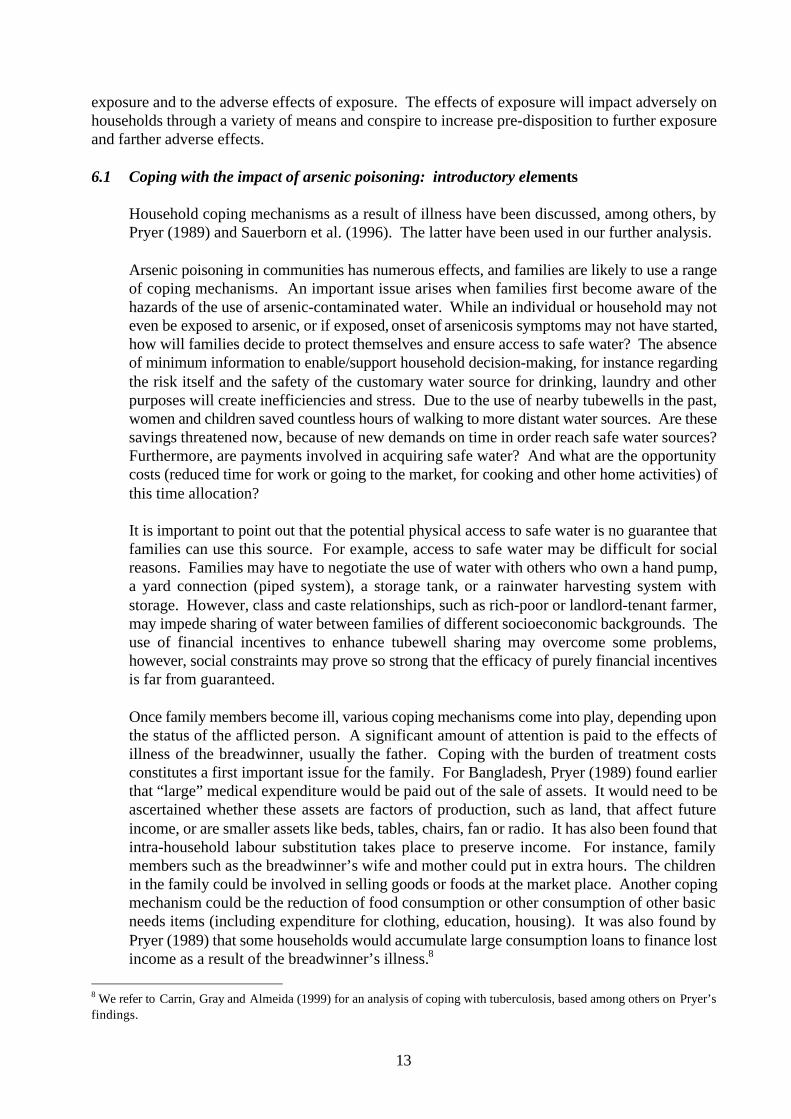
addition, insufficient vitamin intake, in particular vitamin B 12, might reduce the ability of thebody to methylate arsenic (Buchet and Lauwerys 1985). For these reasons, women, whosenutritional levels are frequently deficient in South Asian countries for reasons linked withcultural norms and reproductive function, may be at particular risk.
It is also suggested that zinc and selenium may provide protection against the toxic effects ofaccumulated levels of arsenic in the body (National Research Council 1999). It is suggestedthat the diet of blackfoot disease patients in China (Province of Taiwan) is deficient in zinc andselenium (Pan et al. 1996). The National Research Council (1999) notes that there is stilluncertainty over the relative importance of the various nutritional factors, and calls for moreresearch into the issue.
The Asia Arsenic Network (AAN) researchers indicated however, that household incomemight serve as a good proxy for nutritional intake in Samta Village (Tani, 1999a;b).Consequently, they ascribed an important part of the negative relationship between prevalenceand household income to this explanation. For an accurate estimation of nutritional intake, itis also important to take into account patterns of intra-household food distribution, which mayfavour or disadvantage various family members by age or sex, and which cannot be seenthrough the general category of household income.6
However, household income might also be related to water practices in the village. Theimportance of water storage techniques has been highlighted by Alaerts (1999). He highlightsthe example of the water storage practices of people in the Laxipur area of Bangladesh. In thisarea water is stored in small vessels to allow the iron oxide to settle on the bottom of the vesseland this enhances the concentration of adsorbed arsenic in the sludge. Higher incomehouseholds might have greater storage facilities for their tubewell water and mightconsequently be able to store the water for longer. If higher income households are usingwater that has been allowed to settle for a period before drinking, then this could help toexplain the observed arsenicosis-income relationship.7 Unfortunately, we are currently notinformed about longer-term water storage practices in Samta Village.
In Bangladesh it is likely that access to tubewell drinking water will be at least partiallydetermined by social status. Therefore, the observed relationship between arsenicosisprevalence and household income could be due to social barriers to access to arsenic-free waterfor poor households.
6. The socioeconomic impact of arsenic poisoning: coping and steps towardsmodelling
Previous sections have highlighted the clear linkages between socioeconomic status (of ahousehold) and arsenic exposure. The latter is both a determinant and an outcome of the former, andvice-versa. Thus low socioeconomic status may pre-dispose households and individuals to both
6 This is important given the often poorer nutritional status of women and girls compared to men in some South-EastAsian countries. Appropriate gender analysis of data, as well as disaggregation of data by sex, are needed to ascertainany differences in arsenicosis attributable to nutritional status.7 This is especially valid where there is excess iron in the water. Storage of 200-500 litre is recommended as first partly(subsidized) step towards arsenic avoidance, and it will also help in collecting better rainwater, and to get water for theweek during the end of the dry season (Heijnen 1999).
13
exposure and to the adverse effects of exposure. The effects of exposure will impact adversely onhouseholds through a variety of means and conspire to increase pre-disposition to further exposureand farther adverse effects.
6.1 Coping with the impact of arsenic poisoning: introductory elements
Household coping mechanisms as a result of illness have been discussed, among others, byPryer (1989) and Sauerborn et al. (1996). The latter have been used in our further analysis.
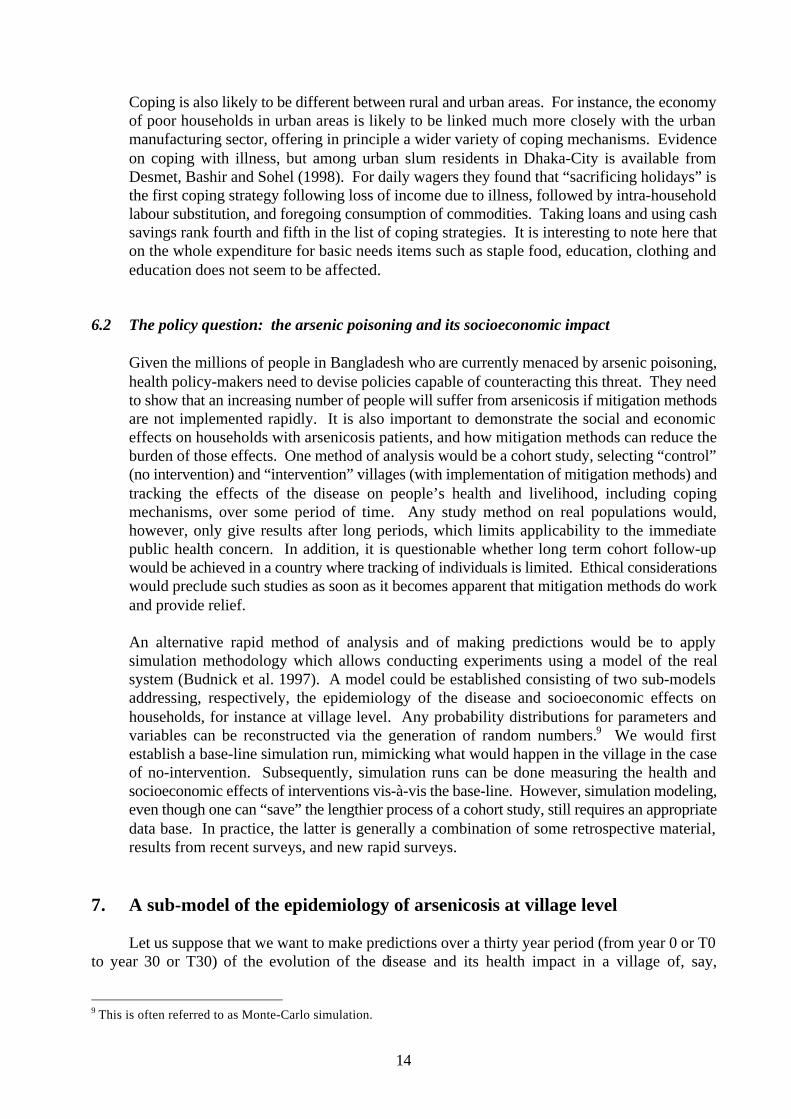
Arsenic poisoning in communities has numerous effects, and families are likely to use a rangeof coping mechanisms. An important issue arises when families first become aware of thehazards of the use of arsenic-contaminated water. While an individual or household may noteven be exposed to arsenic, or if exposed, onset of arsenicosis symptoms may not have started,how will families decide to protect themselves and ensure access to safe water? The absenceof minimum information to enable/support household decision-making, for instance regardingthe risk itself and the safety of the customary water source for drinking, laundry and otherpurposes will create inefficiencies and stress. Due to the use of nearby tubewells in the past,women and children saved countless hours of walking to more distant water sources. Are thesesavings threatened now, because of new demands on time in order reach safe water sources?Furthermore, are payments involved in acquiring safe water? And what are the opportunitycosts (reduced time for work or going to the market, for cooking and other home activities) ofthis time allocation?
It is important to point out that the potential physical access to safe water is no guarantee thatfamilies can use this source. For example, access to safe water may be difficult for socialreasons. Families may have to negotiate the use of water with others who own a hand pump,a yard connection (piped system), a storage tank, or a rainwater harvesting system withstorage. However, class and caste relationships, such as rich-poor or landlord-tenant farmer,may impede sharing of water between families of different socioeconomic backgrounds. Theuse of financial incentives to enhance tubewell sharing may overcome some problems,however, social constraints may prove so strong that the efficacy of purely financial incentivesis far from guaranteed.
Once family members become ill, various coping mechanisms come into play, depending uponthe status of the afflicted person. A significant amount of attention is paid to the effects ofillness of the breadwinner, usually the father. Coping with the burden of treatment costsconstitutes a first important issue for the family. For Bangladesh, Pryer (1989) found earlierthat “large” medical expenditure would be paid out of the sale of assets. It would need to beascertained whether these assets are factors of production, such as land, that affect futureincome, or are smaller assets like beds, tables, chairs, fan or radio. It has also been found thatintra-household labour substitution takes place to preserve income. For instance, familymembers such as the breadwinner’s wife and mother could put in extra hours. The childrenin the family could be involved in selling goods or foods at the market place. Another copingmechanism could be the reduction of food consumption or other consumption of other basicneeds items (including expenditure for clothing, education, housing). It was also found byPryer (1989) that some households would accumulate large consumption loans to finance lostincome as a result of the breadwinner’s illness.8
8 We refer to Carrin, Gray and Almeida (1999) for an analysis of coping with tuberculosis, based among others on Pryer’sfindings.
14
Coping is also likely to be different between rural and urban areas. For instance, the economyof poor households in urban areas is likely to be linked much more closely with the urbanmanufacturing sector, offering in principle a wider variety of coping mechanisms. Evidenceon coping with illness, but among urban slum residents in Dhaka-City is available fromDesmet, Bashir and Sohel (1998). For daily wagers they found that “sacrificing holidays” isthe first coping strategy following loss of income due to illness, followed by intra-householdlabour substitution, and foregoing consumption of commodities. Taking loans and using cashsavings rank fourth and fifth in the list of coping strategies. It is interesting to note here thaton the whole expenditure for basic needs items such as staple food, education, clothing andeducation does not seem to be affected.
6.2 The policy question: the arsenic poisoning and its socioeconomic impact
Given the millions of people in Bangladesh who are currently menaced by arsenic poisoning,health policy-makers need to devise policies capable of counteracting this threat. They needto show that an increasing number of people will suffer from arsenicosis if mitigation methodsare not implemented rapidly. It is also important to demonstrate the social and economiceffects on households with arsenicosis patients, and how mitigation methods can reduce theburden of those effects. One method of analysis would be a cohort study, selecting “control”(no intervention) and “intervention” villages (with implementation of mitigation methods) andtracking the effects of the disease on people’s health and livelihood, including copingmechanisms, over some period of time. Any study method on real populations would,however, only give results after long periods, which limits applicability to the immediatepublic health concern. In addition, it is questionable whether long term cohort follow-upwould be achieved in a country where tracking of individuals is limited. Ethical considerationswould preclude such studies as soon as it becomes apparent that mitigation methods do workand provide relief.
An alternative rapid method of analysis and of making predictions would be to applysimulation methodology which allows conducting experiments using a model of the realsystem (Budnick et al. 1997). A model could be established consisting of two sub-modelsaddressing, respectively, the epidemiology of the disease and socioeconomic effects onhouseholds, for instance at village level. Any probability distributions for parameters andvariables can be reconstructed via the generation of random numbers.9 We would firstestablish a base-line simulation run, mimicking what would happen in the village in the caseof no-intervention. Subsequently, simulation runs can be done measuring the health andsocioeconomic effects of interventions vis-à-vis the base-line. However, simulation modeling,even though one can “save” the lengthier process of a cohort study, still requires an appropriatedata base. In practice, the latter is generally a combination of some retrospective material,results from recent surveys, and new rapid surveys.
7. A sub-model of the epidemiology of arsenicosis at village level
Let us suppose that we want to make predictions over a thirty year period (from year 0 or T0to year 30 or T30) of the evolution of the disease and its health impact in a village of, say,
9 This is often referred to as Monte-Carlo simulation.
15
100 households. This is an important prerequisite before any socioeconomic modelling can beundertaken. We introduce basic prevalence data on arsenicosis in T0, including the stage ofarsenicosis that patients are in. Subsequently, we introduce the arsenicosis incidence rates, year byyear. We also define the probability of moving between the various stages of the disease, andintroduce the mortality rates associated with those stages.
As some minimum data are already available for Bangladesh, namely from the baselineepidemiological data for Samta Village in Jessore district (Tani, 1999a;b), we proceeded to establishan epidemiological sub-model, as follows.
A base case simulation was run to estimate the impact of arsenicosis on the village in theabsence of any mitigation methods over a 30 year period. The length of the simulation period waschosen because of epidemiological evidence that internal cancer health effects tended to occur fromaround 20 years after exposure (Smith et al. 1998).
7.1 Epidemiological model
A model of a rural village containing 100 households was constructed. It is based partly ondata collected from Samta Village, in the heavily arsenic contaminated Jessore district ofBangladesh together with published epidemiological literature. Arsenic concentrations in wellwater ranged from 0-1.37 mg/l, with the mode concentration (49% of wells) occurring in therange of 0.10-0.29 mg/l (Yokota et al. 1997). This is greatly in excess of the WHOrecommended value of 0.01mg/l (Box 5). It is this mode value that is used in the estimationof cancer risks. For simplicity in modelling, each household is assumed to members: a father,mother, son and daughter. It is assumed that each household has been using arsenic pollutedwater since tubewell installation began in the 1970s. The natural history of arsenicosis ismodelled over a 30 year period. A base case simulation of the model was run using the bestavailable estimates for parameter values. For sensitivity analysis, high and low impactscenarios were simulated using extreme values for the uncertain incidence parameter. Themain outcome measures analysed are the morbidity and mortality statistics at five-year timeintervals. Several assumptions are used, either for necessary simplification of the model orbecause of data unavailability. Each household was assigned an income based on the Samtademographic study income data (Tani, 1999a;b). This assignment was achieved using therandom sampling function of Microsoft Excel. These income figures were then used tocalculate prevalence as discussed in the following section.
The modelling of arsenicosis can be considered in three sections. Firstly, assignment ofprevalence at the beginning of the simulation, secondly, the assignment of incidence of newarsenicosis sufferers each year throughout the simulation and thirdly, the disease profile ofarsenicosis sufferers for the 30 year period.
Arsenicosis is modelled as having a number of clinical manifestations. It is not possible toinclude all the adverse health effects from arsenic reviewed in section 3. It has been possibleto include only skin lesions and cancers as the resulting health effects of arsenic exposure, asthese are the health effects for which data was available for Bangladesh. The definition ofhealth states used in the present analysis is based partly on the classification of patients usedby the AAN researchers. They classified skin lesion suffers as 1, 2 or 3 based on the severity
16
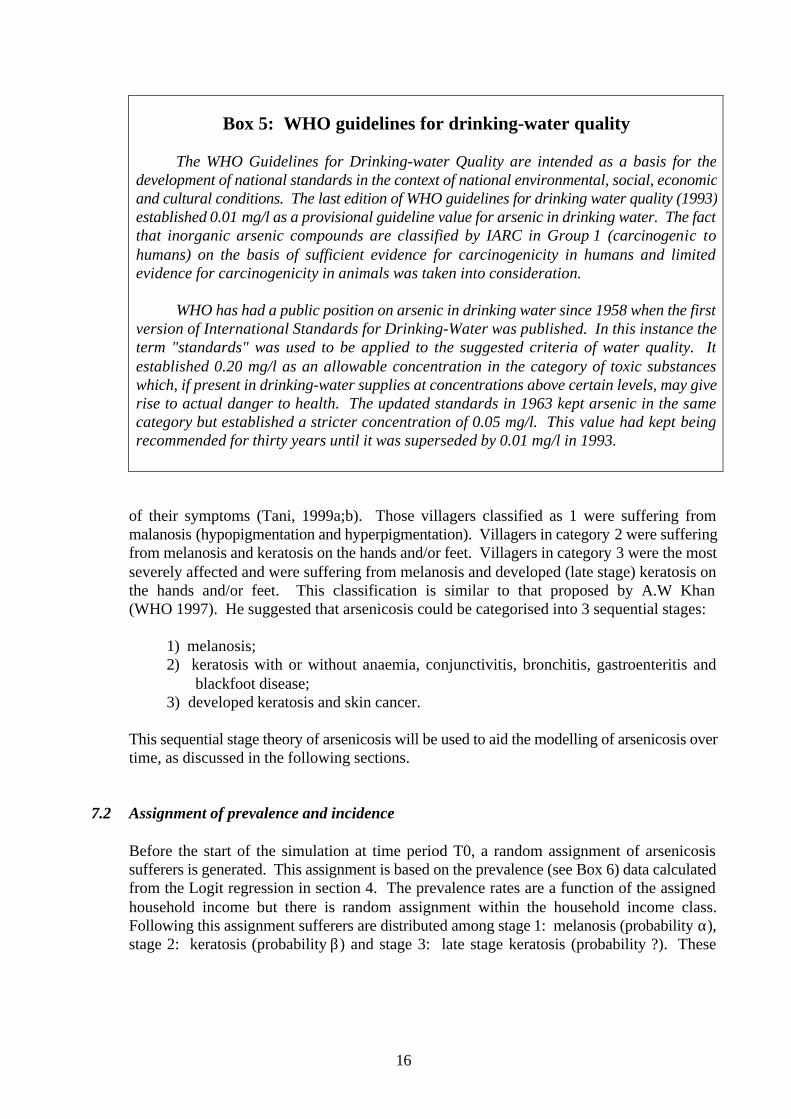
Box 5: WHO guidelines for drinking-water quality
The WHO Guidelines for Drinking-water Quality are intended as a basis for thedevelopment of national standards in the context of national environmental, social, economicand cultural conditions. The last edition of WHO guidelines for drinking water quality (1993)established 0.01 mg/l as a provisional guideline value for arsenic in drinking water. The factthat inorganic arsenic compounds are classified by IARC in Group 1 (carcinogenic tohumans) on the basis of sufficient evidence for carcinogenicity in humans and limitedevidence for carcinogenicity in animals was taken into consideration.
WHO has had a public position on arsenic in drinking water since 1958 when the firstversion of International Standards for Drinking-Water was published. In this instance theterm "standards" was used to be applied to the suggested criteria of water quality. Itestablished 0.20 mg/l as an allowable concentration in the category of toxic substanceswhich, if present in drinking-water supplies at concentrations above certain levels, may giverise to actual danger to health. The updated standards in 1963 kept arsenic in the samecategory but established a stricter concentration of 0.05 mg/l. This value had kept beingrecommended for thirty years until it was superseded by 0.01 mg/l in 1993.
of their symptoms (Tani, 1999a;b). Those villagers classified as 1 were suffering frommalanosis (hypopigmentation and hyperpigmentation). Villagers in category 2 were sufferingfrom melanosis and keratosis on the hands and/or feet. Villagers in category 3 were the mostseverely affected and were suffering from melanosis and developed (late stage) keratosis onthe hands and/or feet. This classification is similar to that proposed by A.W Khan(WHO 1997). He suggested that arsenicosis could be categorised into 3 sequential stages:
1) melanosis;2) keratosis with or without anaemia, conjunctivitis, bronchitis, gastroenteritis and
blackfoot disease;3) developed keratosis and skin cancer.
This sequential stage theory of arsenicosis will be used to aid the modelling of arsenicosis overtime, as discussed in the following sections.
7.2 Assignment of prevalence and incidence
Before the start of the simulation at time period T0, a random assignment of arsenicosissufferers is generated. This assignment is based on the prevalence (see Box 6) data calculatedfrom the Logit regression in section 4. The prevalence rates are a function of the assignedhousehold income but there is random assignment within the household income class.Following this assignment sufferers are distributed among stage 1: melanosis (probability α),stage 2: keratosis (probability β) and stage 3: late stage keratosis (probability ?). These
17
probabilities are obtained from the proportions of arsenicosis sufferers in each category inSamta Village (Tani, 1999a;b).10
In the years from T1 onwards, the incidence of disease (see Box 6) is used to simulate the newarsenicosis cases occurring each year. The incidence is defined as the number of newcases/population without arsenicosis. An incidence rate of 0.0038 is assumed for the base casescenario,11 with high and low impact scenarios also simulated using incidence rates of 0.0019and 0.0076 respectively. Assignment of incidence is randomly generated. If a person isassigned as having developed arsenicosis, they are then assigned to the initial melanosisstage 1.
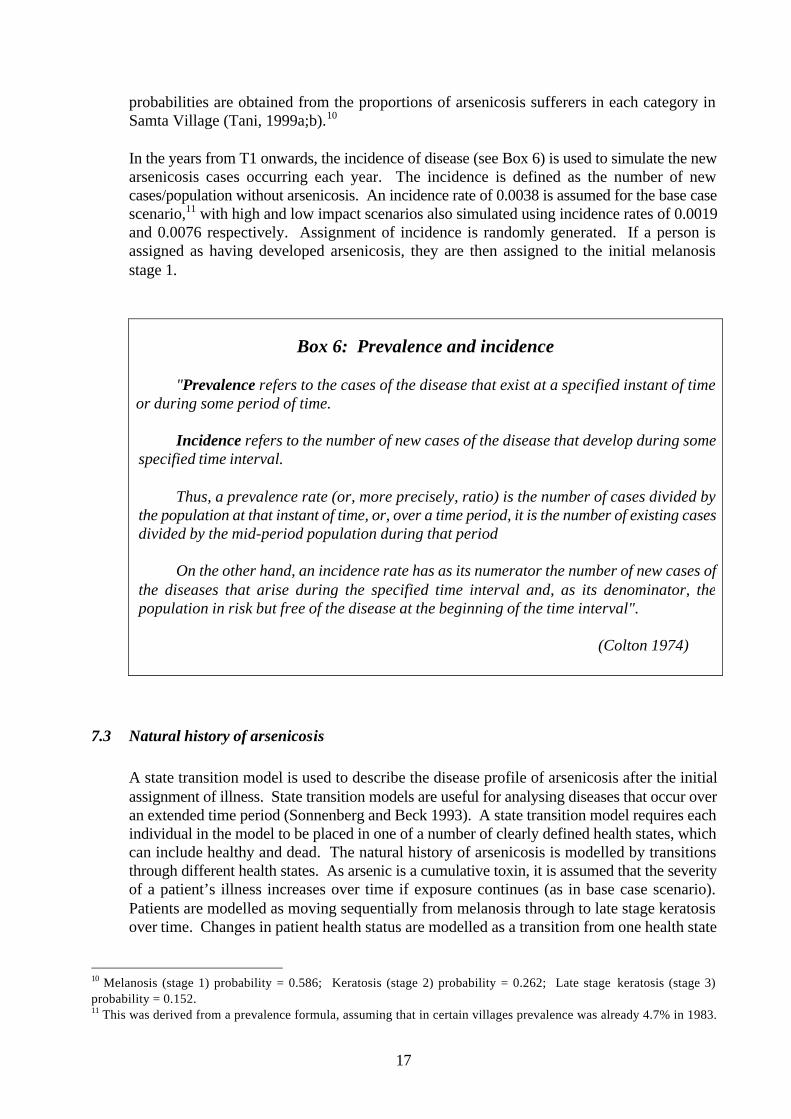
Box 6: Prevalence and incidence
"Prevalence refers to the cases of the disease that exist at a specified instant of timeor during some period of time.
Incidence refers to the number of new cases of the disease that develop during somespecified time interval.
Thus, a prevalence rate (or, more precisely, ratio) is the number of cases divided bythe population at that instant of time, or, over a time period, it is the number of existing casesdivided by the mid-period population during that period
On the other hand, an incidence rate has as its numerator the number of new cases ofthe diseases that arise during the specified time interval and, as its denominator, thepopulation in risk but free of the disease at the beginning of the time interval".
(Colton 1974)
7.3 Natural history of arsenicosis
A state transition model is used to describe the disease profile of arsenicosis after the initialassignment of illness. State transition models are useful for analysing diseases that occur overan extended time period (Sonnenberg and Beck 1993). A state transition model requires eachindividual in the model to be placed in one of a number of clearly defined health states, whichcan include healthy and dead. The natural history of arsenicosis is modelled by transitionsthrough different health states. As arsenic is a cumulative toxin, it is assumed that the severityof a patient’s illness increases over time if exposure continues (as in base case scenario).Patients are modelled as moving sequentially from melanosis through to late stage keratosisover time. Changes in patient health status are modelled as a transition from one health state
10 Melanosis (stage 1) probability = 0.586; Keratosis (stage 2) probability = 0.262; Late stage keratosis (stage 3)probability = 0.152.11 This was derived from a prevalence formula, assuming that in certain villages prevalence was already 4.7% in 1983.
18
to another. Each possible transition has an associated transition probability. The structure ofthe state transition model is presented in Figure 7.1. Table 7.1 presents the transitionprobability estimates.
Each arrow in Figure 7.1 refers to a possible transition at the end of each year. The boldarrows indicate that the person has remained in the same health state. The health state 7 (dead)has been included in the model to allow for future modelling of mortality in the skin lesionhealth states. In the following simulations the risk of mortality in these health states isassumed to be zero. Therefore, in the base case simulations discussed in this paper, noindividuals are in health state 7.
In addition to skin lesion health effects, a number of cancers are modelled. Skin cancer isassumed to be a hazard only in those with the most advanced stage of skin lesions. Assignmentis modelled as a transition from late stage keratosis (3) to skin cancer (4). Skin cancer risk isassumed to begin at T10, ten years into the simulation. Whilst mechanistically the assignmentof zero risk up to 10 years of exposure may be imprecise, it does reflect the informationreported to date from Bangladesh and has simplified the modelling undertaken.
There is currently disagreement over whether internal cancers are a risk that is independent ofskin lesions. Findings by Cuzick et al. (1992) indicate that internal cancers only occur forthose with skin lesions, whereas Tsuda et al. (1995) found cancer occurrence among thosewithout any skin lesions. Due to this uncertainty, a combined bladder and lung cancer risk isincorporated for both those with and without existing skin lesions. These internal cancers aremodelled as appearing after T20, 20 years into the simulation. This risk is modelled for thosewithout skin lesions as a transition from healthy (0) to the internal cancers health state (5). Themodelling of internal cancers for those with skin lesions is achieved by assuming a transitionfrom late stage keratosis (3) to internal cancers (5). The data used in the calculation of cancertransition probabilities is contained in Appendix I. Despite the existing uncertainty in themechanisms of disease causation it would probably be most appropriate to model non-skincancers as random events with probability increase with total exposure, and independent ofskin manifestations; whilst modelling skin cancer as a progression from stage 3 keratosis. Theapproach taken to date is a simplification that will subsequently be refined.
Mortality from cancers is modelled as a transition probability from the cancer health state tothe heath state; dead (6). It is assumed that those in the cancer health state die in the followingyear. This assumption of 100% cancer mortality was necessary because the epidemiologicaldata used was for cancer mortality from arsenic exposure. The latter reasonably reflects thereality in poor rural areas of Bangladesh.
7.4 Model results
Simulation results are presented at the end of the paper in Tables 7.2 to 7.4 and Figures 7.2to 7.4 using the base case, high and low impact estimates of arsenicosis incidence. The figureshighlight the health status of those exposed to arsenic. In the base case (Figure 7.2), 22.5% ofthe village is in one of the arsenicosis health states at the end of the 30 year simulation. 5.5%have died from skin or internal cancers and 0.5% of villagers have developed skin and internalcancers in the final year of the simulation. The prevalence of late stage keratosis has increasedfrom 1% in T0 to 7.5% in T30 at the end of the simulation. This highlights the progressive
19
decline in health status of arsenicosis sufferers over time. The overall prevalence of skinlesions has increased from 8% in T0 to 16.5% in T30.
Using the low impact estimate for arsenicosis incidence of 0.0019 shows the expectedreduction in arsenicosis health impact (Figure 7.3). 15.75% of the village is in one of thearsenicosis health states, as compared to 22.5% for the base case incidence simulation. Skinand internal cancer mortality is reduced by half a percentage point from the base casesimulation to 5%. 0.5% have developed skin and internal cancers in the final year of thesimulation. The overall prevalence of skin lesions in T30 is 10.25% as compared to 16.5% inthe base case, reflecting the lower growth rate in number of arsenicosis sufferers.
Using the high impact estimate for incidence of 0.0076 means that 29.25% of the village endsthe simulation in one of the arsenicosis health states (Figure 7.4). Cancer mortality isincreased to 6.5% with 0.75% having developed cancers in the final year of the simulation.The overall prevalence of skin lesions in T30 is 22% as compared to 16.5% in the base casesimulation.
8. Sub-model of arsenicosis and its socioeconomic impact on village households
8.1 Socioeconomic household survey at T0
Just as a minimum set of epidemiological data is needed for T0, an initial socioeconomicsurvey of households in the community is necessary to assess any changes in thesocioeconomic position of households due to the disease. In the case of the Samta Villagesurvey, this was undertaken at the level of the village as a whole. Alternatively, a surveyamong a sample of villagers can be envisaged.
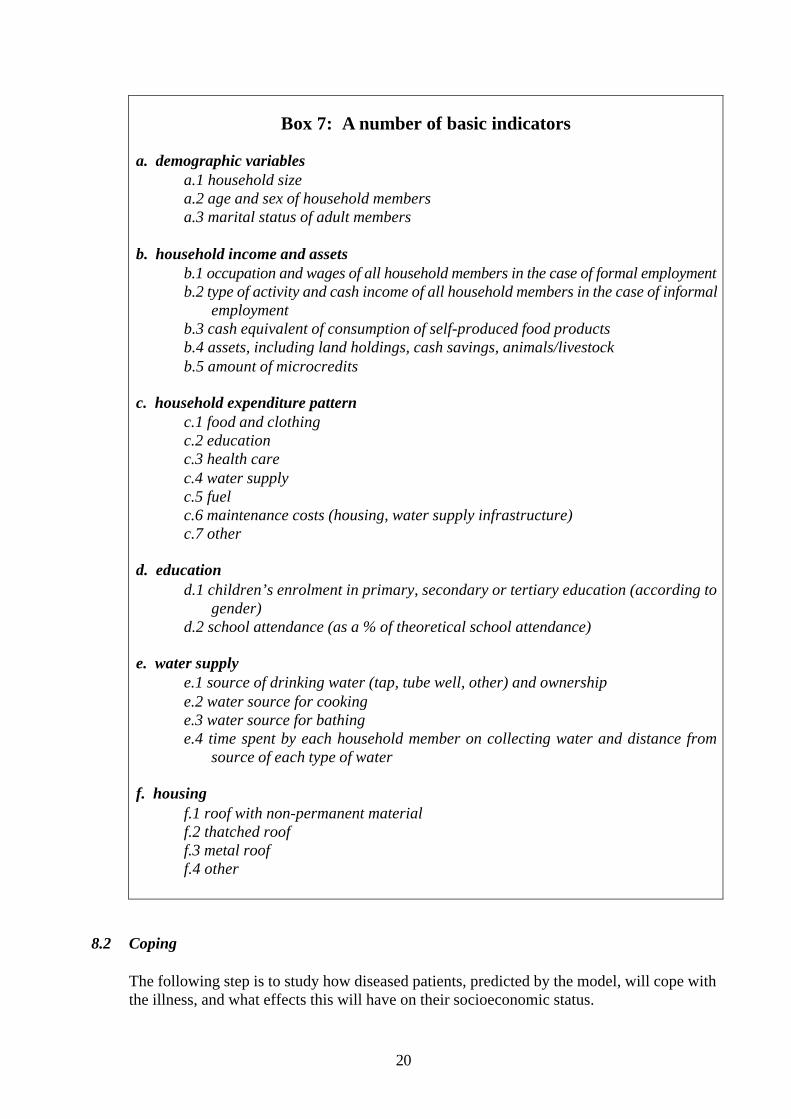
A socioeconomic household survey will have to include at the minimum a number of basicindicators as indicated in Box 7.
20
Box 7: A number of basic indicators
a. demographic variablesa.1 household sizea.2 age and sex of household membersa.3 marital status of adult members
b. household income and assetsb.1 occupation and wages of all household members in the case of formal employmentb.2 type of activity and cash income of all household members in the case of informal
employmentb.3 cash equivalent of consumption of self-produced food productsb.4 assets, including land holdings, cash savings, animals/livestockb.5 amount of microcredits
c. household expenditure patternc.1 food and clothingc.2 educationc.3 health carec.4 water supplyc.5 fuelc.6 maintenance costs (housing, water supply infrastructure)c.7 other
d. educationd.1 children’s enrolment in primary, secondary or tertiary education (according to
gender)d.2 school attendance (as a % of theoretical school attendance)
e. water supplye.1 source of drinking water (tap, tube well, other) and ownershipe.2 water source for cookinge.3 water source for bathinge.4 time spent by each household member on collecting water and distance from
source of each type of water
f. housingf.1 roof with non-permanent materialf.2 thatched rooff.3 metal rooff.4 other
8.2 Coping
The following step is to study how diseased patients, predicted by the model, will cope withthe illness, and what effects this will have on their socioeconomic status.
21
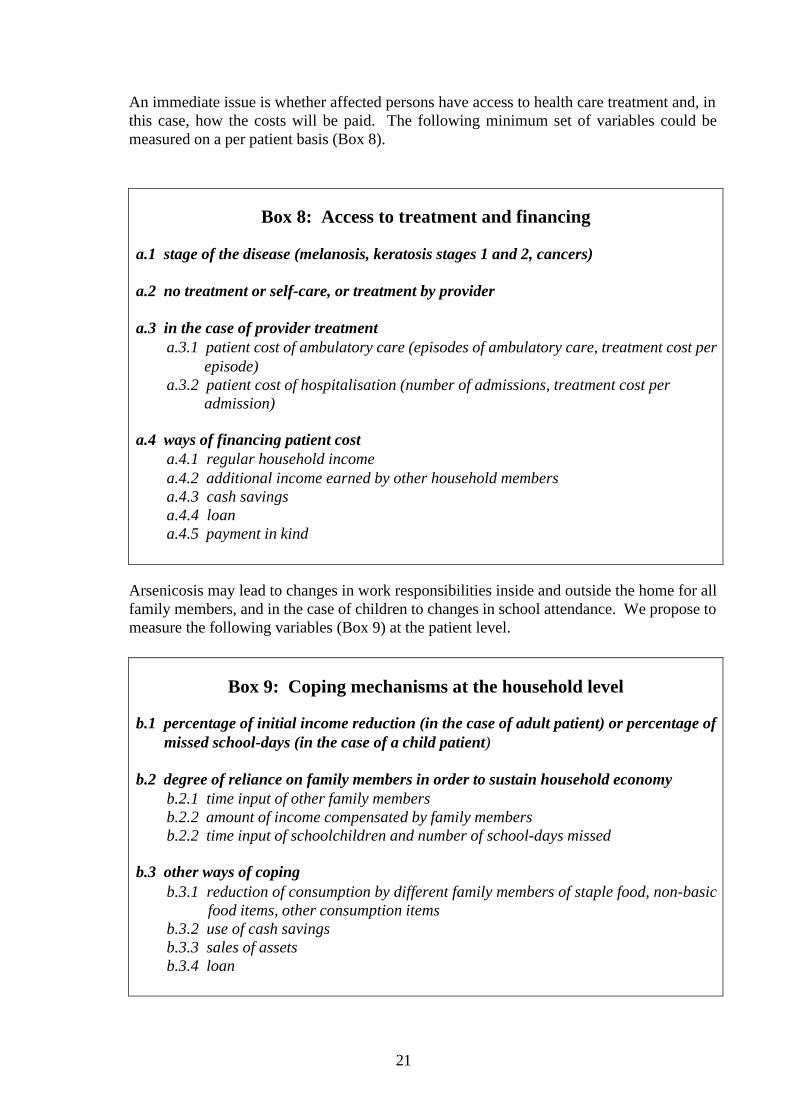
An immediate issue is whether affected persons have access to health care treatment and, inthis case, how the costs will be paid. The following minimum set of variables could bemeasured on a per patient basis (Box 8).
Box 8: Access to treatment and financing
a.1 stage of the disease (melanosis, keratosis stages 1 and 2, cancers)
a.2 no treatment or self-care, or treatment by provider
a.3 in the case of provider treatmenta.3.1 patient cost of ambulatory care (episodes of ambulatory care, treatment cost per
episode)a.3.2 patient cost of hospitalisation (number of admissions, treatment cost per
admission)
a.4 ways of financing patient costa.4.1 regular household incomea.4.2 additional income earned by other household membersa.4.3 cash savingsa.4.4 loana.4.5 payment in kind
Arsenicosis may lead to changes in work responsibilities inside and outside the home for allfamily members, and in the case of children to changes in school attendance. We propose tomeasure the following variables (Box 9) at the patient level.
Box 9: Coping mechanisms at the household level
b.1 percentage of initial income reduction (in the case of adult patient) or percentage ofmissed school-days (in the case of a child patient)
b.2 degree of reliance on family members in order to sustain household economyb.2.1 time input of other family membersb.2.2 amount of income compensated by family membersb.2.2 time input of schoolchildren and number of school-days missed
b.3 other ways of copingb.3.1 reduction of consumption by different family members of staple food, non-basic
food items, other consumption itemsb.3.2 use of cash savingsb.3.3 sales of assetsb.3.4 loan
22
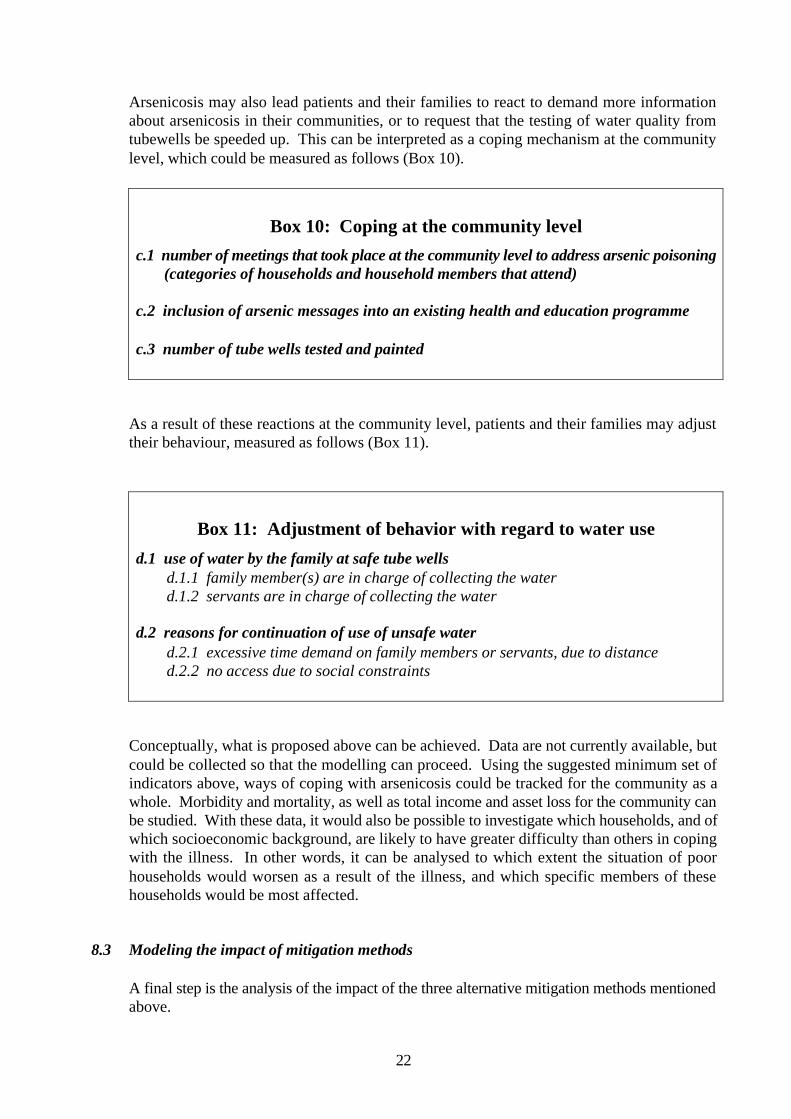
Arsenicosis may also lead patients and their families to react to demand more informationabout arsenicosis in their communities, or to request that the testing of water quality fromtubewells be speeded up. This can be interpreted as a coping mechanism at the communitylevel, which could be measured as follows (Box 10).
Box 10: Coping at the community levelc.1 number of meetings that took place at the community level to address arsenic poisoning
(categories of households and household members that attend)
c.2 inclusion of arsenic messages into an existing health and education programme
c.3 number of tube wells tested and painted
As a result of these reactions at the community level, patients and their families may adjusttheir behaviour, measured as follows (Box 11).
Box 11: Adjustment of behavior with regard to water use
d.1 use of water by the family at safe tube wellsd.1.1 family member(s) are in charge of collecting the waterd.1.2 servants are in charge of collecting the water
d.2 reasons for continuation of use of unsafe waterd.2.1 excessive time demand on family members or servants, due to distanced.2.2 no access due to social constraints
Conceptually, what is proposed above can be achieved. Data are not currently available, butcould be collected so that the modelling can proceed. Using the suggested minimum set ofindicators above, ways of coping with arsenicosis could be tracked for the community as awhole. Morbidity and mortality, as well as total income and asset loss for the community canbe studied. With these data, it would also be possible to investigate which households, and ofwhich socioeconomic background, are likely to have greater difficulty than others in copingwith the illness. In other words, it can be analysed to which extent the situation of poorhouseholds would worsen as a result of the illness, and which specific members of thesehouseholds would be most affected.
8.3 Modeling the impact of mitigation methods
A final step is the analysis of the impact of the three alternative mitigation methods mentionedabove.
23
• First, there is the expected effect on the epidemiology of arsenicosis, or the health effects. Significant attention will need to be paid to modelling the progress (including reversal) ofthe disease in some patients, as a result of use of safe (or safer) water. It is still unclear atwhat stage the disease becomes irreversible, but it is accepted that it is reversible in the veryearly stage of the disease.
• Secondly, effects on changes in socioeconomic variables measuring the livelihood ofhouseholds have to be studied. For instance, it should be possible to quantify expectedchange in important variables like treatment costs, household income and time allocationof household members. Any social or other impediments to access, especially for the poorand most vulnerable, despite the introduction of mitigation measures, will also have to beanalyzed.
• Thirdly, the proposed financial contribution of households to the implementation of thealternative mitigation methods has to be clarified and tested for feasibility and acceptability.Co-financing options with central and local Government, and donors, also need to beexplored, particularly where subsidies to the poor are shown to be the predominant way offinancing mitigation measures.
• Finally, this analysis will also enable us to undertake a cost-effectiveness analysis ofmitigation methods. Effectiveness could be measured, for instance, in terms of healthy daysgained or in terms of Disability Adjusted Life Years (DALY) (Murray and Lopez 1994).
9. Remaining challenges for modelling
Above we have outlined the major components of a simulation model, and presented a firstversion of the epidemiological sub-model. This section will describe additional methodological anddata problems, and will suggest where further work is needed to improve the realism of themodelling effort.
9.1 Including other health and social effects
In the epidemiological sub-model presented above, we have only considered the cutaneousmanifestations of arsenicosis and certain cancers. In reality, the likely health effects ofexposure to arsenic in drinking water are more wide-ranging as noted in section 3.Epidemiological studies have pointed to the existence of risk from numerous cancers due toinorganic arsenic ingestion in water. However, the decision to only consider lung, bladder andskin cancer risks was due to the strength of epidemiological findings for these cancers acrossdifferent populations and different ranges of arsenic dose exposure. A number of other siteshave been suggested for cancer (kidney, liver and colon according to Chen et al., 1985). Othernon-cancer health effects are noted as well, such as spontaneous abortions and still-births.These inferences may or may not be proven, but the main barrier to inclusion of the otherhealth effects is a lack of adequate epidemiological data relating to their prevalence. Thecurrent figures for the health impact of arsenic will therefore underestimate the true diseaseburden on the village. Ideally, further extensions should be made to the sub-model, in termsof inclusion of other health effects. However, for this to be possible, dose response estimatesof prevalence and incidence for village populations would have to become available.
24
When modelling the effect of mitigation methods, attention should be paid to the impact ofclean water on other water-related diseases like diarrhoeal disease and cholera. It should beinvestigated to what extent different mitigation methods have different impacts upon water-related disease incidence and subsequent morbidity and mortality. Only if these impacts areshown to be similar, can one limit oneself to the differential impacts on arsenicosis.
Arsenicosis has a strong social dimension, affecting issues such as relationships within thefamily, and the mental health of the sick. Many arsenicosis sufferers have been ostracised ateither the household or village level. The Harvard Public Health Review (1999) highlights thecase of a patient suffering from skin lesions whose children were unwilling to eat the food sheserved, and whose husband eventually divorced her. Social and gender relations thus poseadditional threats to security and wellbeing. It is essential to pay attention to these factors inassessing the effects of arsenicosis. The real impact on family and gender relations, and onlivelihoods, of the stigma attached to arsenicosis sufferers, would constitute a further usefulstudy.
9.2 Transition between stages of arsenicosis
The nature of arsenic as a cumulative toxin poses problems for modelling. In theepidemiological sub-model a simple disease profile has been used to illustrate patientsbecoming progressively more sick over time. This has been modelled as a probability oftransition to the next stage (e.g. progression from the melanosis to the keratosis stage ofarsenicosis.) An attempt to incorporate the cumulative toxic effect of arsenic has beenincluded by the simplistic method of increasing the transition probabilities every time periodof 10 years. However, this is only a proxy mechanism for analysing the effect of cumulativearsenic exposure over time.
In order to make arsenicosis fully time dependent in the model, one would need to havevarying transition probabilities related to the extent (level, time) of arsenic exposure. In otherwords, transitional probabilities should be made a function of exposure. However, this wouldrequire a more complex model structure than was possible for the present research. Futureextension to the model could make arsenicosis fully dependent on length of arsenic exposure.12
Conversely, in modelling the effects of mitigation methods the reverse transition probabilitiesshould also be a function of exposure. This is because the recovery process should also bedependent on the length of arsenic exposure.
9.3 Unit of time in the simulation model
In the epidemiological sub-model, the time unit was a year. The latter may have to bereconsidered in that shorter time units (monthly or quarterly) may be more appropriate.Impacts on households and coping strategies may be different according to the time of onsetof an episode of disease during the year. For instance, the burden of episodes of disease and
12 One possible functional form could be a linear one, with a constant increase in the transition probability related to an increase inyears of exposure: T i,j = αt where T i,j = transition probability from health state i to health state j; i = (1,2,3,4,5) and j = (1,2,3,4,5,6);α = probability term; t = number of years of arsenic exposure. This indicates that the transition probability is a function of the numberof years of arsenic exposure. In other words, there is a constant decrease in health over time due to the effects of arsenic exposure.However, if this is considered too simplistic, a more complex form could be utilised. An exponential functional form could be usedif it is believed that the effects of arsenic become increasingly damaging as the length of exposure increases.
25
treatment may be different according to the agricultural season: a potential loss of workingtime may constitute a greater burden at harvest time, but a lesser burden after harvest timewhen cash income could be expected to be at its highest. Or, if payment of treatment costscoincides with the beginning of the school year, families’ capacity to pay school fees or otherschool expenses may be affected.
10. Conclusion
Attention has been drawn to the fact that ingestion of arsenic contaminated water leads toserious skin disease and cancer in a significant number of exposed people. It is important to preventthe increase of arsenicosis for both health and economic reasons. However, drug treatment toeliminate arsenic from the body is expensive, leading to the conclusion that possibly palliative care,including application of ointment in the case of keratosis, is the only affordable treatment in ruralareas of Bangladesh. Bangladeshi villagers affected by arsenicosis are likely to lose a significantamount of productive time. In addition, the disease may become a burden on villagers’ overallfinancial and time resources. We have shown, using econometric analysis, that the poorest sufferthe most from arsenicosis.
It is clear that mitigation methods need to be implemented urgently, not least for reasons ofpoverty alleviation. It is important to assess the future health and socioeconomic impacts ofalternative mitigation methods, so that policy-makers in Bangladesh can take informed decisions.To avoid the time implications of a prospective cohort study, we propose to apply simulationmethodology. An appropriate simulation model would consist of basically three components: firstan epidemiological sub-model forecasting the natural history of the disease in the absence ofmitigation measures; second a socioeconomic sub-model showing how households cope with thedisease in the absence of intervention; third, a component that addresses how alternative mitigationmethods halt the progression of the disease, and prevent or reduce economic losses.
The paper gives a detailed account of the construction and results of the epidemiological sub-model. It also proposes to obtain socioeconomic information on households and their copingmechanisms through the organization of simple household surveys; it therefore lists a minimum setof core health and socioeconomic indicators to be considered. We hope this paper can be an inputinto further discussions and decision-making about mitigating existing damage and preventingfurther arsenic poisoning in Bangladesh. In particular, important discussion and analysis will beneeded on alternative financing strategies for hot-spot areas, thereby specifying the roles of donors,local and central Government, and households.
26
BIBLIOGRAPHY
Alaerts G (1999): personal communication. Water and sanitation specialist, World Bank.
Angle C (1995): “Treatment recommendations: arsenic poisoned children and adults in WestBengal.” Post Conference report of the International Conference on Arsenic in Ground Water: cause,effect and remedy; 1995 May, Jadavpur University, Calcutta.
Bartram J.K (1996): “Optimising the monitoring and assessment of rural water supplies.” PhDThesis, University of Surrey, UK.
Becker G.S (1971): “Economic theory.” Alfred A. Knopf, New York.
Becker G.S (1981): “A treatise on the family.” Harvard University Press, Cambridge, U.S.
British Geological Survey (1998): “Groundwater studies for arsenic contamination in Bangladesh.”British Geological Survey, Mott Macdonald Ltd. UK.
BSTI (1989): “Bangladesh Standard Specification for Drinking Water.” 116/A, Tejgaon industrialarea, Dhaka – 1208, Bangladesh Standards for Testing Institution, Bangladesh.
Buchet J.P, Geubel A, Pauwels S, Mahieu P and Lauwerys R (1984): “The influence of liverdisease on the methylation of arsenite in humans.” Archive of Toxicology. 55: pp151-154.
Buchet J.P and Lauwerys R (1985): “Study of inorganic arsenic methylation by rat liver in vitro:relevance for the interpretation of observations in man.” Archive of Toxicology. 57: pp125-129.
Budnick F.S, Mojena R and Vollmann T.E (1997): “Principles of Operations ResearchManagement.” Richard D. Urwin, Homewood, Illinois.
Carrin G, Gray E and Almeida J (1999): “Coping with ill-health in a rickshaw puller’s householdin Chittagong, Bangladesh.” Southeast Asian Journal of Tropical Medicine and Public Health,vol.30, no.1: pp136-148.
Chen C.J, Chuang Y.C, Lin T.M and Wu H.Y (1985): “Malignant neoplasms among residentsof a blackfoot disease-endemic area in Taiwan: High-arsenic artesian well water and cancers.”Cancer Research. 45: pp5895-5899.
Chen C.J and Wang C.J (1990): “Ecological correlation between arsenic level in well water andage adjusted mortality from malignant neoplasms.” Cancer Research. 50: pp5470-5474.
Chen C.J, Hsueh Y.M, Lai M.S, Shyu M.P, Chen S.Y, Wu M.M, Kuo T.L and Tai T.Y (1995):“Increased Prevalence of hypertension and long term arsenic exposure.” Hypertension. 25: pp53-60.
Chowdhury P.L (2000): “Pond Sand Filter and Ring Well as Alternative Water Source Options inArsenic Affected Areas.” DPHE/WHO WS&S Support Programme, April 2000, Report no. 22.
Colton T (1974): Statistics in Medicine, p.46, Little, Brown and Company, Boston.
27
Cuzick J, Sasieni P and Evans S (1992): “Ingested arsenic, keratoses and bladder cancer.”American Journal of Epidemiology. 136: pp417-421.
Cvjetanovic B (1986): “Health effects and impact of water supply and sanitation.” World HealthStatistics Quarterly. 39(1): pp105-117.
Danida (2000): “Quarterly Progress Report for DPHE-Danida Arsenic Mitigation Pilot Project.”March 2000, Noakhali, Bangladesh.
Desmet M, Bashir I and Sohel N (1998): “Direct and indirect health-care user expenditure by slumresidents in Dhaka-City, Bangladesh.” Center for Health and Policy Research, ICDDR -B, workingpaper no.5-98.
Dufaut A (1990): “How carrying water affects women’s health.” pp 30-35, in Kerr C ed.“Community Health & Sanitation.” Intermediate Technology publications Ltd. London, UK.
Guha Mazumder D.N, Chakraborty A.K, Ghose A, Gupta J.D, Chakraborty D.P, Dey S.B andChattopadhyay N (1988): “Chronic arsenic toxicity from drinking tubewell water in rural WestBengal.” Bulletin of the World Health Organization. 66(4): pp499-506.
Guha Mazumder D.N (1996): “Treatment of chronic arsenic toxicity as observed in West Bengal.”Journal of the Indian Medical Association. 94. No.2 February 1996: pp41-42.
Guha Mazumder D.N, Das Gupta J, Santra A, Pal A, Ghose A, Sarkar S, Chattopadhaya Nand Chakraborti (1997): “Non-cancer effects of chronic arsenicosis with special reference to liverdamage.” pp112-123 in “Arsenic: exposure and health effects.” Edited by C.O Abernathy, R.LCalderon and W.R Chappel, Chapman & Hall, London.
Guha Mazumder D.N, Haque R, Ghosh N, De B.K, Santra A, Chakraborty D and Smith A.H(1998): “Arsenic levels in drinking water and the prevalence of skin lesions in West Bengal, India.”International Journal of Epidemiology. 27: pp871-877.
Harvard Public Health Review (1999): “Good intentions, bad water”. Harvard Public HealthReview, Summer 1999: pp14-15.
Heijnen H (1999): “Bangladesh, consideration for storage of harvested rainwater.” Internaltechnical note, May 1999, WHO Environmental Health Advisor.
Hopenhayn-Rich C, Biggs M.L, Smith A.H, Kalman D.A and Moore L.E (1998): “Lung andkindney cancer mortality associated with arsenic in drinking water in Cordoba, Argentina.”International Journal of Epidemiology. 27: pp561-569.
Hsueh Y.M, Cheng G.S, Wu M.M, Yu H.S, Kuo T.L and Chen C-J (1995): “Multiple riskfactors associated with arsenic-induced skin cancer: effects of chronic liver disease andmalnutritional status.” British Journal of Cancer 71: pp109-114.
Hutchinson (1887): “Arsenic cancer.” British Medical Journal 2: pp1280-1281.
28
IARC: International Agency for Research on Cancer (1987): “Cancer incidence in fivecontinents. Volume V.” IARC Scientific Publication no.88, Lyon.
IARC: International Agency for Research on Cancer (1980): “Some metals and metalliccompounds.” IARC Monographs on the evaluation of carcinogenic risks to humans, vol. 23. IARC,Lyon.
Intriligator M.D (1978): “Econometric models, techniques and applications”, North-Holland,Amsterdam.
IOM (1998): Gender Differences in Susceptibility to Environmental Factors. A PriorityAssessment. Edited by Setlow VP et al. US Institute of Medicine. National Academy Press,Washington, D.C.
International Programme on Chemical Safety (IPCS) (1981): “Arsenic. Environmental HealthCriteria 18.” World Health Organization, Geneva.
Koenker R (1981): “A note on studentising a test for heteroskedasticity.” Journal of Econometrics.17: pp 107-112.
Krishna S (1990): “Not by pumps alone” in Kerr C ed. “Community Health & Sanitation”.Intermediate Technology publications Ltd. London, UK.
Murray C.J.L, and Lopez A.D (1994): “Global comparative assessments in the health sectordisease burden, expenditures and intervention packages edited by C. J. L. Murray & A. D. Lopez.”World Health Organization, Geneva.
National Research Council (1999): “Arsenic in Drinking Water.” National Academy Press,Washington, D.C.
Pan T.C, Chen Y.L, Wu W.J and Huang C.W (1996): “Determination of Se, Mn, Co, Cr and Znin urine specimens of patients with blackfoot disease.” Japanese Journal of Toxicology andEnvironmental Health. 42: pp437-442.
Park K (1997): “Text book of Preventive and Social medicine.” 15th ed. P 469, Banarsidas BhanotPub. India.
Pryer J (1989): “When breadwinners fall ill: preliminary findings from a case study inBangladesh.” Institute of Development Studies Bulletin, Vol.20, Number 2, April 1989: pp 49-57.
Rahman M, Tondel M, Ahmad S.A and Axelson O (1998): “Diabetes mellitus associated witharsenic exposure in Bangladesh.” American Journal of Epidemiology. 148: pp198-203.
Rosenberg H.G. (1974): “Systemic arterial disease and chronic arsenicism in infants”. Archive ofPathology. 97(6): pp 360-365.
Sauerborn R, Adams A, and Hien M (1996): “Household strategies to cope with the economiccosts of illness.” Social Sience and Medicine. 43(11), pp 291-301.
29
Smith A.H, Goycolea M, Haque R and Biggs M.L (1998): “Marked increase in bladder and lungcancer mortality in a region of northern Chile due to arsenic in drinking water.” American journalof Epidemiology. 147: pp660-669.
Sonnenberg & Beck (1993): “Markov Models in medical decision making: a practical guide.”Medical Decision Making, 13: pp322-338.
Tani M (1999a): “Ethnographic studies for mitigating arsenic poisoning in Samita”, Chapter 1-3of “Arsenic contamination of groundwater in Bangladesh, Interim report of the research at SamtaVillage”. Asia Arsenic Network, Research Group for Applied Geology, Department of Occupational& Environmental Health, National Institute of Preventive & Social Medicine, Bangladesh.April 1999.
Tani M (1999b): “Data set on demographic field work on Arsenic in Samta Village sponsored bythe Asia Arsenic Network in February 1998 and March 1999.” (in Excel)
Tseng W.P, Chu H.M, How S.W, Fong J.M, Lin C.S and Yeh S (1968): “Prevalence of skincancer in an endemic area of chronic arsenicism in Taiwan.” Journal of the National CancerInstitute. 40: pp453-463.
Tseng W.P (1977): “Effects and dose-response relationships of skin cancer and blackfoot diseasewith arsenic.” Environmental Health Perspectives 19: pp109-119.
Tsuda T, Babazono A, Yamamoto E, Kurumatani N, Mino Y, Ogawa T, Kishi Y andAoyama H. (1995): “Ingested arsenic and internal cancer: a historical cohort followed for33 years.” American Journal of Epidemiology. 141: pp198-209.
UNICEF (1998): “State of the Children’s Report”. UNICEF, New York.
UNICEF (1999): “Arsenic Mitigation in Bangladesh; Media brief”. UNICEF, Bangladesh.
US Environmental Protection Agency (1988): “Special Report on Inorganic Arsenic: Skin Cancer;Nutritional Essentiality.” EPA 625/387/013, US Environmental Protection Agency, Risk AssessmentForum, Washington, D.C.
Vahter M and Marafante E (1987): “Effects of low dietary intake of methionine, choline orproteins on the biotransformation of arsenite in the rabbit.” Toxicology letters 37: pp41-46.
WHO (1993): “Guidelines for drinking-water quality, second edition, volume 1”. World HealthOrganization, Geneva.
WHO (1996): “Guidelines for drinking-water quality, second edition, volume 2”. World HealthOrganization, Geneva.
WHO (1997): “Arsenic in drinking water and resulting arsenic toxicity in India and Bangladesh.”Page 4 from Report of a regional consultation. New Delhi, India, 29 April-1 May 1997. RegionalOffice for South-East Asia, New Delhi, World Health Organization.
30
WHO/IRC (1997): “Linking technology choice for Operation and Maintenance for low-cost watersupply and sanitation”. Operation and Maintenance Working Group of the Water supply andsanitation collaborative council. IRC International Water and Sanitation Centre: The Hague,Netherlands. World Health Organization, Geneva.
Yang T.H and Blackwell R.Q (1961): “Nutritional and environmental condition in the endemicblackfoot area.” Formosan Science. 15:pp101-129.
Yeh S (1973): “Skin cancer in chronic arsenicism” Human Pathology. 4: pp469-485.
Yokota H, Tanabe K, Akiyoshi Y, Kawahara K, Hashiguchi M, Tsushima S, Khan A.W,Ahmed A and Hadi A (1997): “The largest arsenic pollution of groudwater in Ganges Delta - Thereport of Samta Village. Think of Arsenic Contamination Problems in Asia.” pp95-104. TheAssociation for the Geological Collaboration (Chigaku Dentai Kenkyukai).

31
Figures and Tables
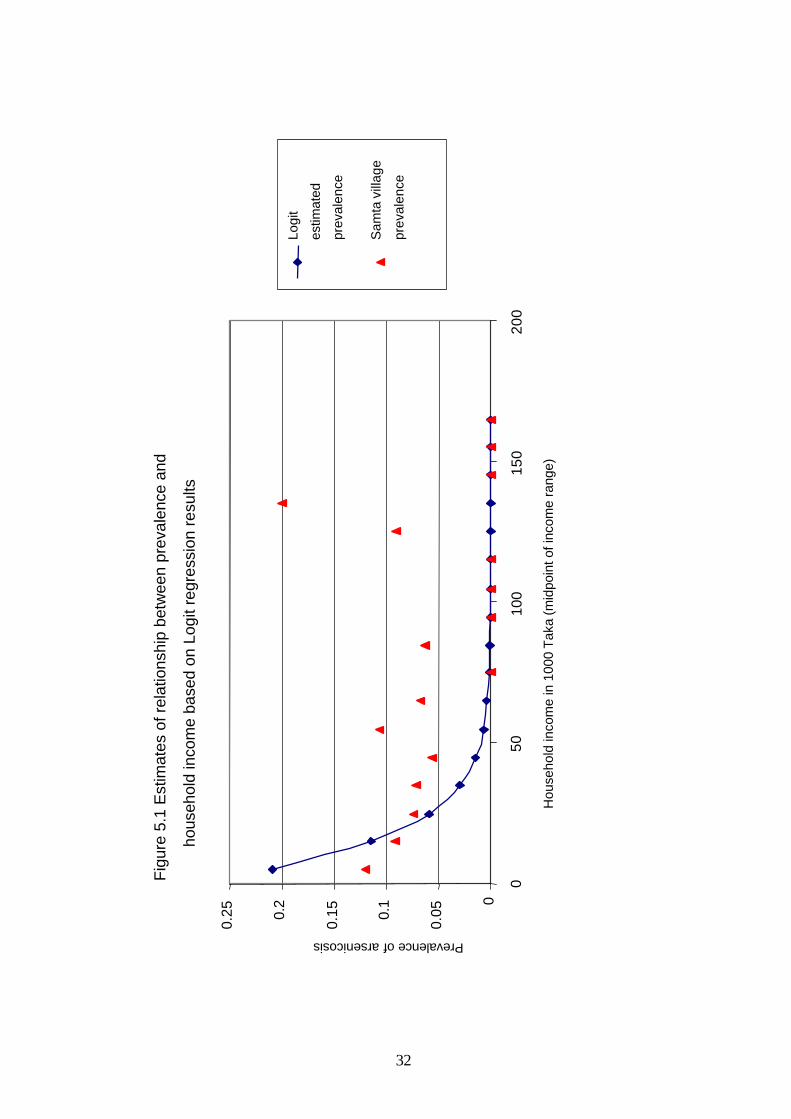
32
Fig
ure
5.1
Est
imat
es o
f rel
atio
nshi
p be
twee
n pr
eval
ence
and
hous
ehol
d in
com
e ba
sed
on L
ogit
regr
essi
on r
esul
ts
0
0.050.
1
0.150.
2
0.25
050
100
150
200
Hou
seho
ld in
com
e in
100
0 T
aka
(mid
poin
t of i
ncom
e ra
nge)
Prevalence of arsenicosis
Logi
t
estim
ated
prev
alen
ce
Sam
ta v
illag
e
prev
alen
ce
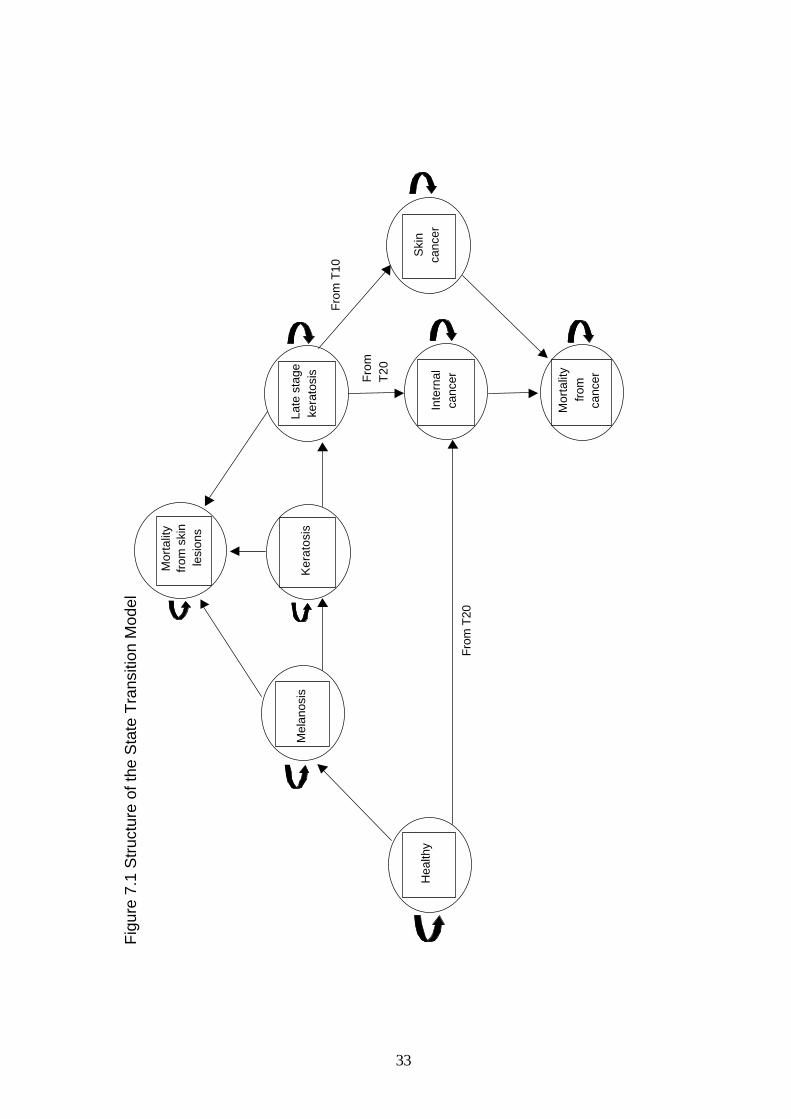
33
Hea
lthy
Mel
anos
isK
erat
osis
Late
sta
ge
kera
tosi
s
Ski
n ca
ncer
Inte
rnal
ca
ncer
Mor
talit
y fr
om s
kin
lesi
ons
Mor
talit
y fro
m
canc
er
From
T20
Fro
m
T20
Fro
m T
10
Fig
ure
7.1
Str
uctu
re o
f the
Sta
te T
rans
ition
Mod
el
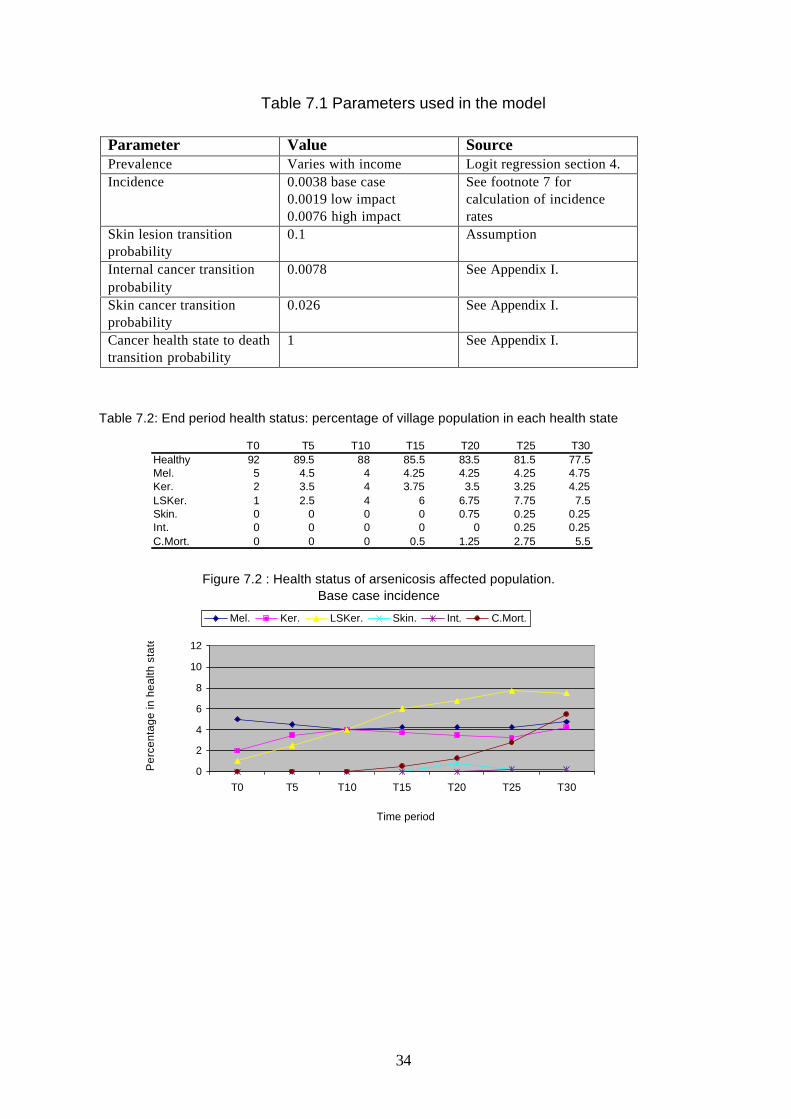
34
Table 7.1 Parameters used in the model
Parameter Value SourcePrevalence Varies with income Logit regression section 4.Incidence 0.0038 base case
0.0019 low impact0.0076 high impact
See footnote 7 forcalculation of incidencerates
Skin lesion transitionprobability
0.1 Assumption
Internal cancer transitionprobability
0.0078 See Appendix I.
Skin cancer transitionprobability
0.026 See Appendix I.
Cancer health state to deathtransition probability
1 See Appendix I.
Table 7.2: End period health status: percentage of village population in each health state
T0 T5 T10 T15 T20 T25 T30Healthy 92 89.5 88 85.5 83.5 81.5 77.5Mel. 5 4.5 4 4.25 4.25 4.25 4.75Ker. 2 3.5 4 3.75 3.5 3.25 4.25LSKer. 1 2.5 4 6 6.75 7.75 7.5Skin. 0 0 0 0 0.75 0.25 0.25Int. 0 0 0 0 0 0.25 0.25C.Mort. 0 0 0 0.5 1.25 2.75 5.5
Figure 7.2 : Health status of arsenicosis affected population. Base case incidence
0
2
4
6
8
10
12
T0 T5 T10 T15 T20 T25 T30
Time period
Per
cent
age
in h
ealth
sta
te
Mel. Ker. LSKer. Skin. Int. C.Mort.
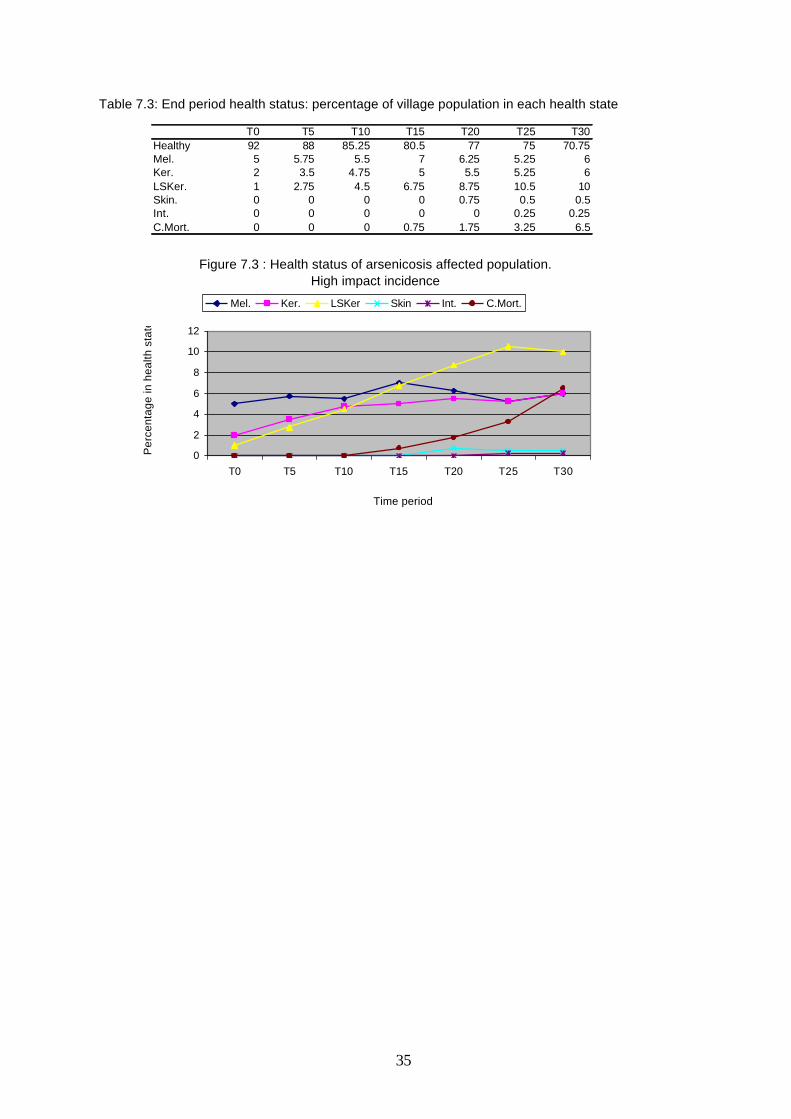
35
Table 7.3: End period health status: percentage of village population in each health state
T0 T5 T10 T15 T20 T25 T30Healthy 92 88 85.25 80.5 77 75 70.75Mel. 5 5.75 5.5 7 6.25 5.25 6Ker. 2 3.5 4.75 5 5.5 5.25 6LSKer. 1 2.75 4.5 6.75 8.75 10.5 10Skin. 0 0 0 0 0.75 0.5 0.5Int. 0 0 0 0 0 0.25 0.25C.Mort. 0 0 0 0.75 1.75 3.25 6.5
Figure 7.3 : Health status of arsenicosis affected population. High impact incidence
0
2
4
6
8
10
12
T0 T5 T10 T15 T20 T25 T30
Time period
Per
cent
age
in h
ealth
sta
te
Mel. Ker. LSKer Skin Int. C.Mort.
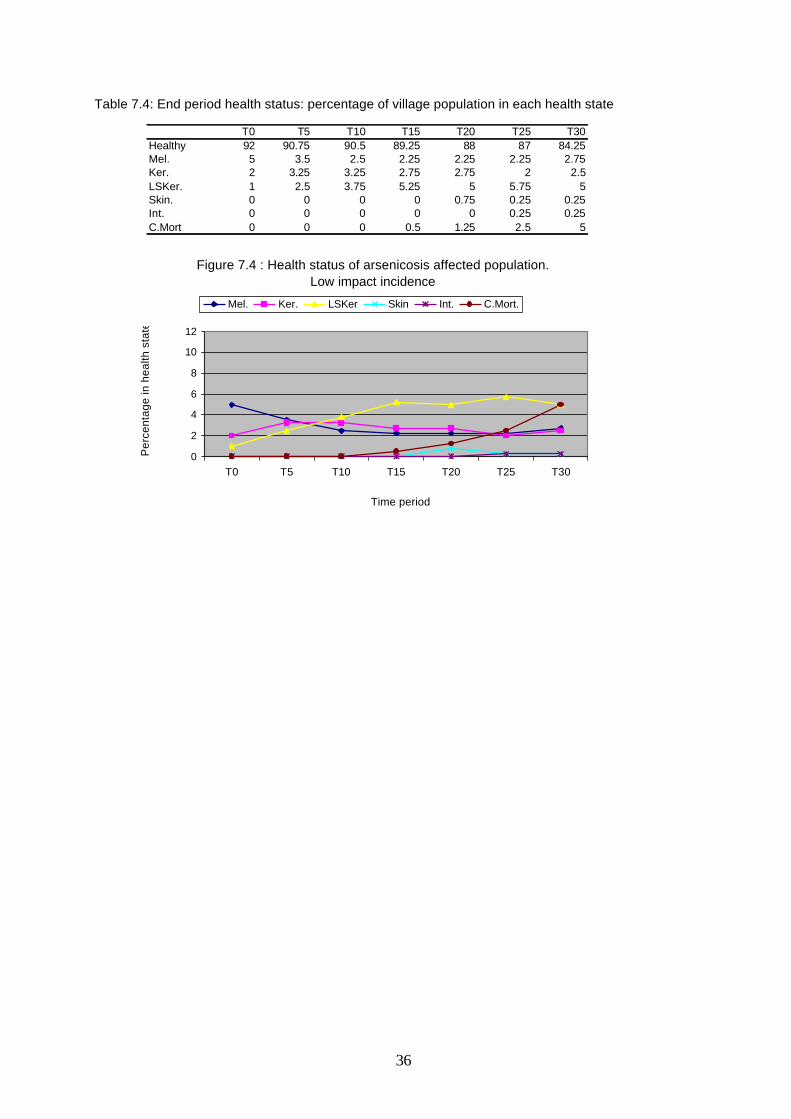
36
Table 7.4: End period health status: percentage of village population in each health state
T0 T5 T10 T15 T20 T25 T30Healthy 92 90.75 90.5 89.25 88 87 84.25Mel. 5 3.5 2.5 2.25 2.25 2.25 2.75Ker. 2 3.25 3.25 2.75 2.75 2 2.5LSKer. 1 2.5 3.75 5.25 5 5.75 5Skin. 0 0 0 0 0.75 0.25 0.25Int. 0 0 0 0 0 0.25 0.25C.Mort 0 0 0 0.5 1.25 2.5 5
Figure 7.4 : Health status of arsenicosis affected population. Low impact incidence
0
2
4
6
8
10
12
T0 T5 T10 T15 T20 T25 T30
Time period
Per
cent
age
in h
ealth
sta
te
Mel. Ker. LSKer Skin Int. C.Mort.
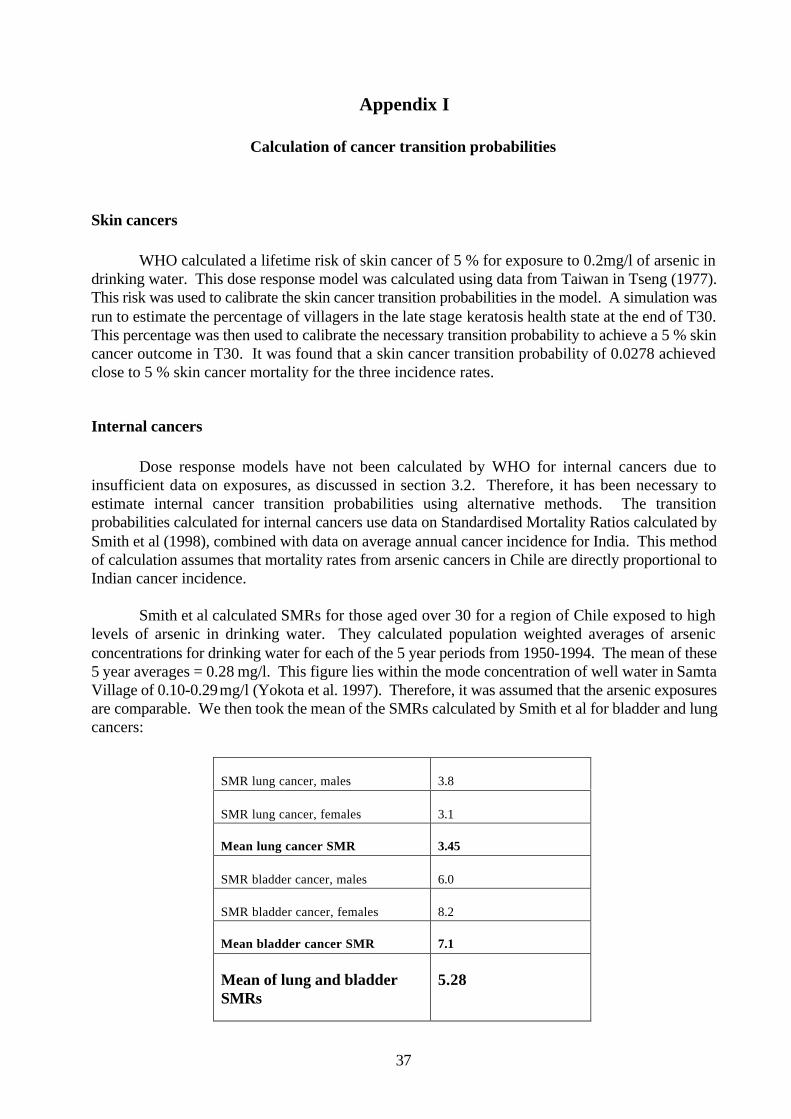
37
Appendix I
Calculation of cancer transition probabilities
Skin cancers
WHO calculated a lifetime risk of skin cancer of 5 % for exposure to 0.2mg/l of arsenic indrinking water. This dose response model was calculated using data from Taiwan in Tseng (1977).This risk was used to calibrate the skin cancer transition probabilities in the model. A simulation wasrun to estimate the percentage of villagers in the late stage keratosis health state at the end of T30.This percentage was then used to calibrate the necessary transition probability to achieve a 5 % skincancer outcome in T30. It was found that a skin cancer transition probability of 0.0278 achievedclose to 5 % skin cancer mortality for the three incidence rates.
Internal cancers
Dose response models have not been calculated by WHO for internal cancers due toinsufficient data on exposures, as discussed in section 3.2. Therefore, it has been necessary toestimate internal cancer transition probabilities using alternative methods. The transitionprobabilities calculated for internal cancers use data on Standardised Mortality Ratios calculated bySmith et al (1998), combined with data on average annual cancer incidence for India. This methodof calculation assumes that mortality rates from arsenic cancers in Chile are directly proportional toIndian cancer incidence.
Smith et al calculated SMRs for those aged over 30 for a region of Chile exposed to highlevels of arsenic in drinking water. They calculated population weighted averages of arsenicconcentrations for drinking water for each of the 5 year periods from 1950-1994. The mean of these5 year averages = 0.28 mg/l. This figure lies within the mode concentration of well water in SamtaVillage of 0.10-0.29 mg/l (Yokota et al. 1997). Therefore, it was assumed that the arsenic exposuresare comparable. We then took the mean of the SMRs calculated by Smith et al for bladder and lungcancers:
SMR lung cancer, males 3.8
SMR lung cancer, females 3.1
Mean lung cancer SMR 3.45
SMR bladder cancer, males 6.0
SMR bladder cancer, females 8.2
Mean bladder cancer SMR 7.1
Mean of lung and bladderSMRs
5.28
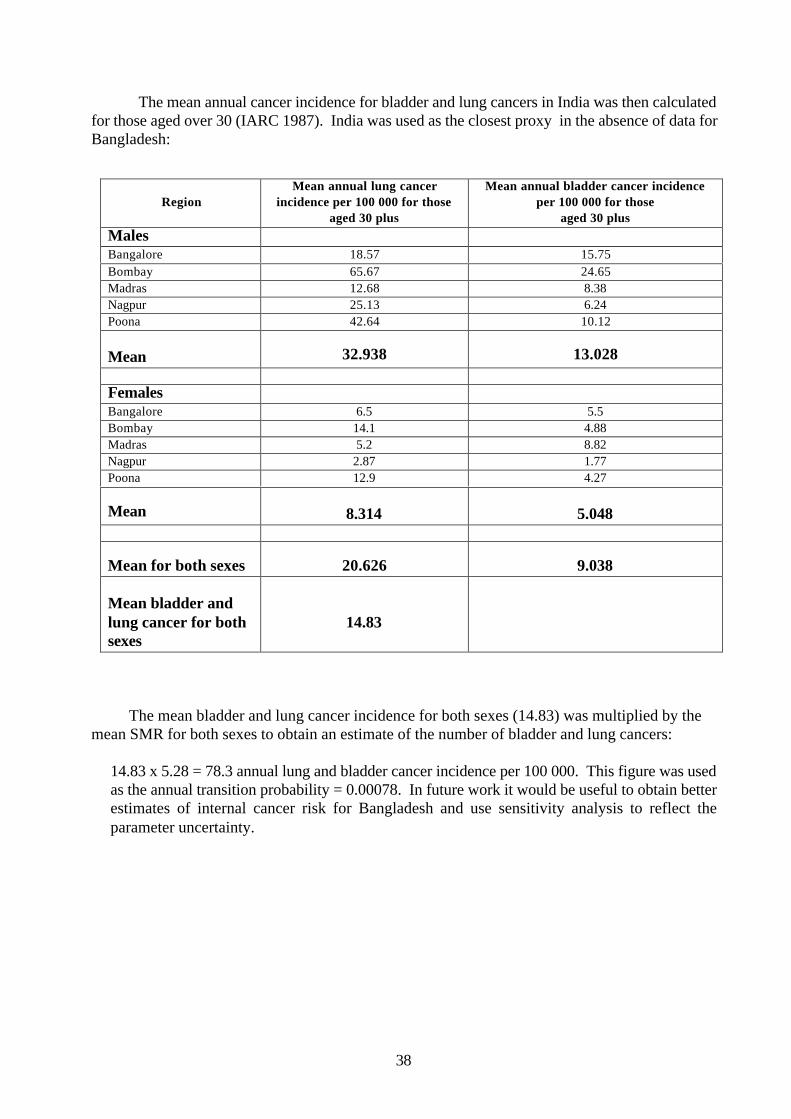
38
The mean annual cancer incidence for bladder and lung cancers in India was then calculatedfor those aged over 30 (IARC 1987). India was used as the closest proxy in the absence of data forBangladesh:
RegionMean annual lung cancer
incidence per 100 000 for thoseaged 30 plus
Mean annual bladder cancer incidenceper 100 000 for those
aged 30 plusMalesBangalore 18.57 15.75Bombay 65.67 24.65Madras 12.68 8.38Nagpur 25.13 6.24Poona 42.64 10.12
Mean 32.938 13.028
FemalesBangalore 6.5 5.5Bombay 14.1 4.88Madras 5.2 8.82Nagpur 2.87 1.77Poona 12.9 4.27
Mean 8.314 5.048
Mean for both sexes 20.626 9.038
Mean bladder andlung cancer for bothsexes
14.83
The mean bladder and lung cancer incidence for both sexes (14.83) was multiplied by themean SMR for both sexes to obtain an estimate of the number of bladder and lung cancers:
14.83 x 5.28 = 78.3 annual lung and bladder cancer incidence per 100 000. This figure was usedas the annual transition probability = 0.00078. In future work it would be useful to obtain betterestimates of internal cancer risk for Bangladesh and use sensitivity analysis to reflect theparameter uncertainty.