Embed Size (px)
Citation preview
________________________________________________________________________________________________
________________________________________________________________________________________________
The socioeconomic impact derived from the oil royalty allocation on
regional development
Mauro Viccaro1, Benedetto Rocchi2, Mario Cozzi1 and Severino Romano1
1 School of Agricultural, Forestry, Food and Environmental Sciences, University of Basilicata, Potenza, Italy 2 Department of Economics and Management, University of Florence, Firenze, Italy
Paper prepared for presentation at the 4th AIEAA Conference
“Innovation, productivity and growth: towards sustainable agri-food production”
11-12 June, 2015
Ancona, Italy
Summary
The aim of this work was to assess the socioeconomic impact derived from the oil royalty allocation on regional
development, using a multi-sector model based on a Social Accounting Matrix (SAM), appropriately implemented for
Basilicata region (Italy), the typical case of a region lagging behind in a developed economy. Our focus was on how
political decisions have influenced the economic development of the region and how a different set of choices can be more
effective in transforming public receipts into long-term benefits. Results clearly show that in the past the allocation of oil
royalties to the regional government (as a whole €990 million) generated a much lower impact than expected, in terms
of economic growth and employment. Given the structure of the regional economy, much of the impact of investments and
running expenses financed by royalties has maybe been lost outside the regional boundaries. A greater effect on income
and employment will not be possible unless resources are re-directed towards greater competitiveness of the regional
economic system. Better balancing the use of royalties between social expenditure and production investments would
probably be the first step towards a strategy of sustainable development of the regional economy.
Keywords: social accounting matrix, multi-sector models, natural resource curse, regional development, oil allocation
JEL Classification codes: E16 – Q01 – Q35 – R15 – R58
4th AIEAA Conference – Innovation, productivity and growth Ancona, 11-12 June 2015
________________________________________________________________________________________________
________________________________________________________________________________________________
1
The socioeconomic impact derived from the oil royalty allocation on
regional development
Mauro Viccaro1, Benedetto Rocchi2, Mario Cozzi1 and Severino Romano1
1 School of Agricultural, Forestry, Food and Environmental Sciences, University of Basilicata, Potenza, Italy 2 Department of Economics and Management, University of Florence, Firenze, Italy
1. INTRODUCTION
The countries and regions that use a new natural resource, such as, for example, an oil deposit, usually
see an increase in their financial resources due to the benefits (both direct and indirect) deriving from oil
drilling. Their ability in managing these additional resources in a sustainable way influences the future of their
entire economy. According to the big push theory (Rosenstein-Rodan, 1943; Hirschman, 1958), the new source
of income should lead to increase public investments, promote growth and result in long-term economic
development. However, empirical evidence reveals a negative correlation between the abundance of resources
and economic growth, known as natural resource curse (Sanchs and Warner, 2001). Different studies,
concerning not only economic but also political and social aspects, have provided different possible
explanations of this phenomenon (Larsen 2006; Torvik, 2009; Van der Ploeg, 2011). Two main factors seem
to cause of the natural resource curse: (i) the implementation of non-sustainable macroeconomic policies by
governments, due to the abundance of resources (Atkinsons and Hamilton, 2003), and (ii) the intrinsic volatility
of the international market of non-renewable resources (Van der Ploeg, 2011).
The planning and implementation of effective policies to contrast this process is a challenge for
governments, not an easy one, especially in developing countries; typical examples are Chad and Brazil where,
despite the huge financial re-sources derived from oil royalties, the living standard of populations has not
improved accordingly (Keenan, 2005; Pegg, 2005; Caselli and Michaels, 2013).
Different studies suggest that the appropriate policy to prevent the curse in developing countries is based
on the allocation of the financial resources derived from oil-related activities towards policies aimed at
promoting productivity, competitiveness and well-being improvement (Levy, 2006; Breisenger et al., 2010;
Rocchi et al., 2014).
It is worth noting that developing countries are not the unique countries involved by this curse, which
may also influence, to a different extent, the regions lagging behind in developed economies that start to exploit
a new natural resource, such as, for example, oil fields (Rocchi et al., 2014). The negative impact in these cases
seems to be mostly due to the following: (i) the opening of the regional economy would result in the loss of
most effects derived from the expenditure of royalties out of the regional boundaries; (ii) the sudden increase
in the export base may conceal the lack of competitiveness of the regional non-oil exporting sectors in relation
to the rest of the country, reducing the investments required to improve their competitiveness; (iii) part of oil
royalties are used in short-term local redistribution policies aimed at reducing the negative effect of the regional
economic gap (including unemployment and poverty), but are ineffective in improving the competitiveness of
the regional system in the long run. Lastly, if the allocation of these financial resources is not implemented
with due appropriateness and transparency, the entailed risks are bribery or rent-seeking behaviours.
4th AIEAA Conference – Innovation, productivity and growth Ancona, 11-12 June 2015
________________________________________________________________________________________________
________________________________________________________________________________________________
2
To prevent these adverse effects and favour the highest possible outfalls on the areas involved by
financial investments based on the use of royalties, the priority for decision-makers is to better focus on the
strategic objectives to promote long-term sustainable socioeconomic development, while compensating for the
deployment in environmental assets resulting from the exploitation of a non-renewable resource.
The possibility of setting out regional policies, assessing the impact on the main socioeconomic
indicators at the local level, monitoring the effectiveness over time, is largely dependent on the availability of
an adequate territorial information system that should be complete, relevant and coherent both internally and
with the national framework (Carbonaro et al., 2001). Different authors (Stone, 1961; Seers, 1970, 1972)
maintain that the most suitable statistical tool, in terms of information bases and economic model, is the Social
Accounting Matrix (SAM). As a matter of fact, it can include a regional dimension enabling to analyse different
economic and fiscal policies within the same country, notably when large internal differences coexist
(Thorbecke, 1985).
The aim of this work is to assess the socioeconomic impact derived from the allocation of oil royalties
on the regional development, using a multi-sector model based on a two-region SAM, specially tailored to
Basilicata region, a typical example of a region lagging behind in a developed economy.
2. MATERIALS AND METHODS
2.1. Case study: Basilicata region
The Basilicata region is the typical case of a region lagging behind the rest of the national economy.
Despite the presence - in its territory - of the largest onshore oil field in Europe, Basilicata’s economy shows
strong difficulties compared with the rest of the country, with a poverty index more than double the national
average (Istat, 2014).
When oil fields were discovered in the Agri valley (in the south-western part of the region) in the early
'90s, they were considered as an important opportunity for the regional economy. The oil regional industry
currently produces about 16,137 ton/d of crude oil: in 2013 the production was about 5.48 million tons, i.e.
9.3% of the gross national domestic consumption and about 71.7% of Italy’s total crude oil production
(Ministero dello Sviluppo Economico, 2014). There are indeed good opportunities for the regional economic
development (in addition to the direct impact on employment) in the form of royalties. Under the agreement
between the State and oil drilling companies, above a given (small) output threshold, the companies must give
7% of their earnings to the regions in the form of royalties and an additional 3% for safety and environmental
monitoring (Ministero dello Sviluppo Economico, 2014). This has meant that between the start of drilling in
1997 and the end of 2013, the regional balance has matured over €990 million earnings from oil. Moreover, a
recent national regulation (N° 99/2009) allocates an additional 3% of earnings the households living in
Basilicata as vouchers to purchase fuel (fuel card).
Surprisingly, oil earnings have not had a great impact on the local economy, despite the development of
the extraction industry and the huge quantity of additional financial resources channeled into regional
development policies. According to recent empirical studies, the Basilicata Economy didn't show an increase
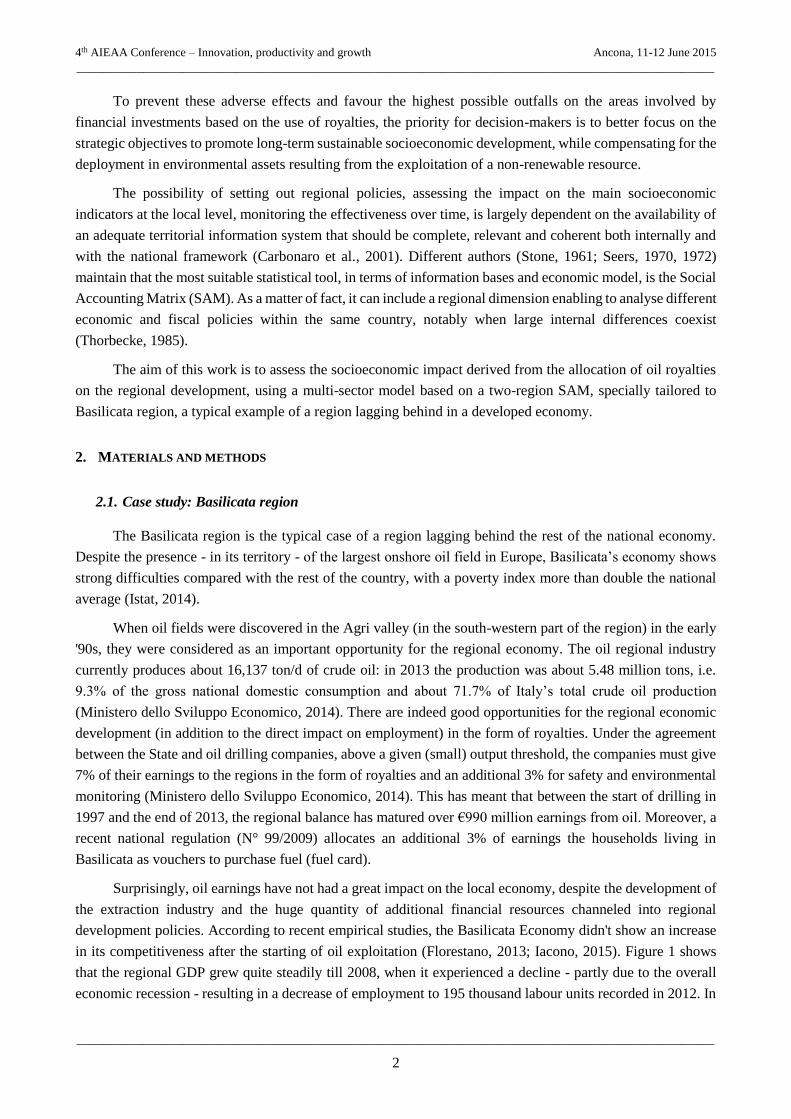
in its competitiveness after the starting of oil exploitation (Florestano, 2013; Iacono, 2015). Figure 1 shows
that the regional GDP grew quite steadily till 2008, when it experienced a decline - partly due to the overall
economic recession - resulting in a decrease of employment to 195 thousand labour units recorded in 2012. In
4th AIEAA Conference – Innovation, productivity and growth Ancona, 11-12 June 2015
________________________________________________________________________________________________
________________________________________________________________________________________________
3
accordance with the national trend, the unemployment rate has increased starting from 2007 till 16% in 2013
(Istat, 2014).
Figure 1: GDP (M€) and labour unit (K)
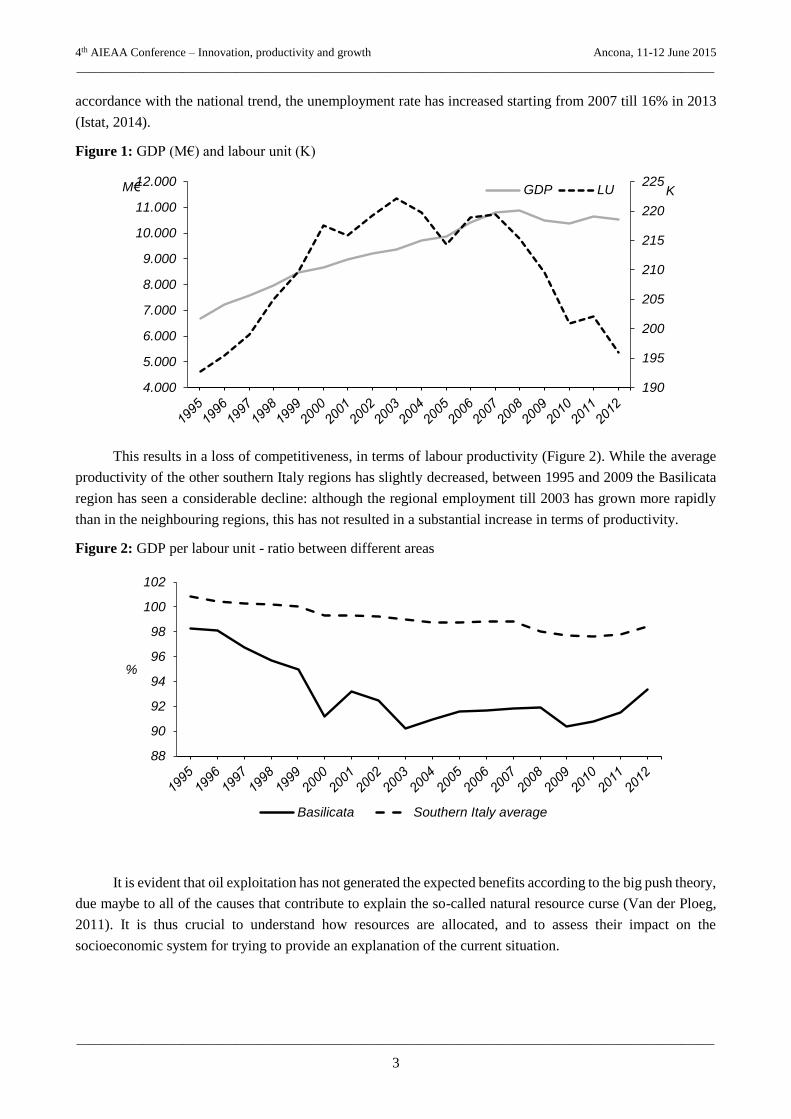
This results in a loss of competitiveness, in terms of labour productivity (Figure 2). While the average
productivity of the other southern Italy regions has slightly decreased, between 1995 and 2009 the Basilicata
region has seen a considerable decline: although the regional employment till 2003 has grown more rapidly
than in the neighbouring regions, this has not resulted in a substantial increase in terms of productivity.
Figure 2: GDP per labour unit - ratio between different areas
It is evident that oil exploitation has not generated the expected benefits according to the big push theory,
due maybe to all of the causes that contribute to explain the so-called natural resource curse (Van der Ploeg,
2011). It is thus crucial to understand how resources are allocated, and to assess their impact on the
socioeconomic system for trying to provide an explanation of the current situation.
190
195
200
205
210
215
220
225
4.000
5.000
6.000
7.000
8.000
9.000
10.000
11.000
12.000KM€ GDP LU
88
90
92
94
96
98
100
102
%
Basilicata Southern Italy average
4th AIEAA Conference – Innovation, productivity and growth Ancona, 11-12 June 2015
________________________________________________________________________________________________
________________________________________________________________________________________________
4
2.2. SAM: a two-region model
A model based on a SAM has been used to assess the impact of the allocation of the oil royalties earned
by Basilicata region since the start of drilling till now. The SAM (Pyatt 1991a, 1991b, 1994a, 1994b, 1999;
Pyatt and Round 1977, 1985) is a two-entry matrix that records the flows occurring between all actors of an
economic system, in a given place and for a given time period (usually one year). Each row/column pair
represents respectively the inflows and outflows of a given account, so that by definition the matrix is balanced
(the row totals equal the column totals). It may be considered as an expansion or a generalization of Leontief’s
input-output table (1936). While in the latter, emphasis is laid on the production system, in the SAM the
perspective is larger. The simultaneous representation of the accounts of production activities, production
factors, institutions (households, businesses, and public administration), capital formation and exchanges with
the rest of the world makes it possible to follow the formation of value-added and its distribution and
redistribution in the form of income to the institutions.
The utilization of SAMs in the analysis of development is by now a well-established branch of the
economic literature (Stone, 1961; Pyatt and Round, 1977, 1985; Pyatt, 1991a, 1991b, 1994a, 1994b, 1999;
Round, 2003; Miller and Blair, 2009). Applications refer both to developed and developing economies,
because it is not only an important tool to improve the consistency of national accounting estimates (United
Nations et al., 1993), but also the first step for the calibration of impact simulation multi-sector models, both
linear and computable general equilibrium ones (Pyatt, 1988). Through the implementation of a linear model
based on the calculation of multipliers (Miller and Blair, 2009), it is possible to calculate the impact that
variables have on the economic system. Endogenous accounts normally include the institutional sectors of
households and firms; the unique accounts that are considered, either alternatively or simultaneously,
exogenous to the model are those of Government, of the rest of the world and the capital account. Deciding
which and how many of these three accounts are exogenous means establishing the “closing rule” of the model
based on the SAM (Miller and Blair, 2009).
The SAM used in this study is a two-regions matrix referred to 2010, in which the existing flows between
Basilicata region and the rest of Italy are represented with a high level of detail. The structure of the matrix
includes 301 accounts, subdivided into 37 production activities, 54 production factors, 3 institutions
(households, businesses and Government). The household sector is subdivided by income deciles into ten
groups, whereas the Government is distinguished as local and central. There are of course also the accounts
entitled to the capital formation and to the rest of the world.
The advantage of a two-region model lies in the possibility of considering the rest of Italy as being
endogenous to the model; this makes it possible to break down impacts and estimate not only the total but also
the intraregional and interregional ones (spillovers and feedbacks).
In the present study, for the analysis of the impacts derived from the use of oil royalties considered as
exogenous shocks to the regional economy, a static analysis has been carried out, considering a closure of the
model with respect to the Government, capital formation and rest of the world: the estimated multipliers take
thus the meaning of Leontevian-Keynesian multipliers.
The structure of the block matrix of accounting coefficients of the two-region model is shown below
(Miller and Blair, 2009):
𝐴 = [𝐴𝑟𝑟 𝐴𝑟𝑠
𝐴𝑠𝑟 𝐴𝑠𝑠]
4th AIEAA Conference – Innovation, productivity and growth Ancona, 11-12 June 2015
________________________________________________________________________________________________
________________________________________________________________________________________________
5
where 𝑟 = Basilicata region and 𝑠 = rest of Italy.
By solving the linear system 𝑥 = 𝐴𝑥 + 𝑓 (where 𝑥 is the vector of totals of endogenous accounts and 𝑓
is the vector of exogenous account flows) for 𝑥 you have:
𝑥 = (𝐼 − 𝐴)−1𝑓
where 𝑀 = (𝐼 − 𝐴)−1 is the matrix of SAM multipliers.
Each coefficient 𝑚𝑖𝑗 quantifies the total increase for each account 𝑖 generated by a unit exogenous shock
on the account 𝑗.
While the matrix of multipliers 𝑀 enables the estimate of the total impact, the breakdown of the matrix
of accounting coefficients 𝐴 into intraregional [𝐴𝑟𝑟 0
0 𝐴𝑠𝑠] and interregional elements [0 𝐴𝑟𝑠
𝐴𝑠𝑟 0] enables to
estimate (Round, 1985, 2001; Dietzenbacher, 2002; Miller and Blair, 2009) the following:
Intraregional effects: 𝑀1 = (𝐼 − Ã)−1
where à = [𝐴𝑟𝑟 0
0 𝐴𝑠𝑠];
Interregional spillover effects: 𝑀2 = 𝐼 + 𝐴∗
where 𝐴∗ = (𝐼 − Ã)−1(𝐴 − Ã);
Interregional feedback effects: 𝑀3 = [𝐼 − (𝐴∗)2]−1
Let us consider the intraregional sub-matrix 𝐴𝑟𝑟 and the blocks constituting it:
𝐴𝑟𝑟 = [𝐵 0 𝐶𝑉 0 00 𝑌 𝐻
]
where 𝐵 is the matrix of inter-industry technical coefficients, 𝐶 is the matrix of endogenous final
expenditure coefficients, 𝑉 is the matrix of endogenous value-added factors shares, 𝑌 is the matrix of
endogenous coefficients distributing income to institutions and 𝐻 is the matrix of endogenous coefficients for
income re-distribution among institutions. The intraregional effect of impacts may in turn be broken down as
follows (Miller and Blair 2009):
Regional direct effect: 𝑀1𝑟𝑟 = (𝐼 − 𝑄)−1
where 𝑄 = [𝐵 0 00 0 00 0 𝐻
]
Regional indirect effect: 𝑀2𝑟𝑟 = 𝐼 + 𝑇
where 𝑇 = (𝐼 − 𝑄)−1𝑅, 𝑅 = [0 0 𝐶𝑉 0 00 𝑌 0
];
Regional feedback effect: 𝑀3𝑟𝑟 = (𝐼 − 𝑇2)−1
Once the multipliers required for the analysis are calculated and the vector of shocks 𝑑f defined, it will
be possible to define the vector of impacts 𝑑x as follows:
𝑑x = M𝑑f
4th AIEAA Conference – Innovation, productivity and growth Ancona, 11-12 June 2015
________________________________________________________________________________________________
________________________________________________________________________________________________
6
In the present study the vector of shocks is made up of the current and capital expenditures of the oil
royalties according to different scenarios.
2.2.1. The vectors of exogenous shocks: allocation of oil royalties
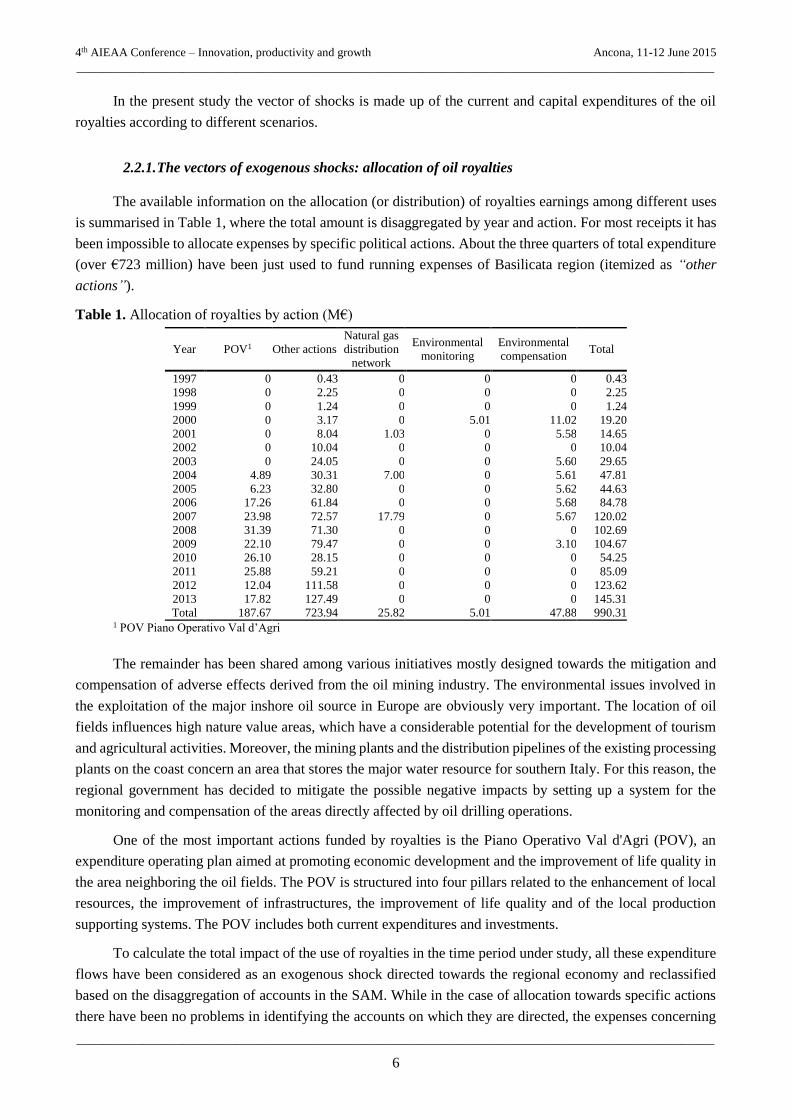
The available information on the allocation (or distribution) of royalties earnings among different uses
is summarised in Table 1, where the total amount is disaggregated by year and action. For most receipts it has
been impossible to allocate expenses by specific political actions. About the three quarters of total expenditure
(over €723 million) have been just used to fund running expenses of Basilicata region (itemized as “other
actions”).
Table 1. Allocation of royalties by action (M€)
Year POV1 Other actions
Natural gas
distribution
network
Environmental
monitoring
Environmental
compensation Total
1997 0 0.43 0 0 0 0.43
1998 0 2.25 0 0 0 2.25
1999 0 1.24 0 0 0 1.24
2000 0 3.17 0 5.01 11.02 19.20
2001 0 8.04 1.03 0 5.58 14.65
2002 0 10.04 0 0 0 10.04
2003 0 24.05 0 0 5.60 29.65
2004 4.89 30.31 7.00 0 5.61 47.81
2005 6.23 32.80 0 0 5.62 44.63
2006 17.26 61.84 0 0 5.68 84.78
2007 23.98 72.57 17.79 0 5.67 120.02
2008 31.39 71.30 0 0 0 102.69
2009 22.10 79.47 0 0 3.10 104.67
2010 26.10 28.15 0 0 0 54.25
2011 25.88 59.21 0 0 0 85.09
2012 12.04 111.58 0 0 0 123.62
2013 17.82 127.49 0 0 0 145.31
Total 187.67 723.94 25.82 5.01 47.88 990.31 1 POV Piano Operativo Val d’Agri
The remainder has been shared among various initiatives mostly designed towards the mitigation and
compensation of adverse effects derived from the oil mining industry. The environmental issues involved in
the exploitation of the major inshore oil source in Europe are obviously very important. The location of oil
fields influences high nature value areas, which have a considerable potential for the development of tourism
and agricultural activities. Moreover, the mining plants and the distribution pipelines of the existing processing
plants on the coast concern an area that stores the major water resource for southern Italy. For this reason, the
regional government has decided to mitigate the possible negative impacts by setting up a system for the
monitoring and compensation of the areas directly affected by oil drilling operations.
One of the most important actions funded by royalties is the Piano Operativo Val d'Agri (POV), an
expenditure operating plan aimed at promoting economic development and the improvement of life quality in
the area neighboring the oil fields. The POV is structured into four pillars related to the enhancement of local
resources, the improvement of infrastructures, the improvement of life quality and of the local production
supporting systems. The POV includes both current expenditures and investments.
To calculate the total impact of the use of royalties in the time period under study, all these expenditure
flows have been considered as an exogenous shock directed towards the regional economy and reclassified
based on the disaggregation of accounts in the SAM. While in the case of allocation towards specific actions
there have been no problems in identifying the accounts on which they are directed, the expenses concerning
4th AIEAA Conference – Innovation, productivity and growth Ancona, 11-12 June 2015
________________________________________________________________________________________________
________________________________________________________________________________________________
7
other actions, in the basic simulation, have been considered as an exogenous increase of the local public
administration expenditure and have been distributed as inputs towards the endogenous accounts, based on the
current expenditure coefficients of the regional administration included in the SAM.
Moreover, the analysis also takes into account the shares for the fuel card supplied so far1. These shares
have been considered as an exogenous increase in income of the households living in the region, according to
a distribution based on what is declared by the Ministry of Economic Development (2014) (Table 2).
Table 2. Amounts concerning the supply of the fuel card
Year Amounts (M€) n° beneficiaries
2009 32.22 320,000
2010 44.88 320,000
Since the envisaged uses refer to different years, the values have been converted into 2013 Euros (Istat,
2014). In this way it was possible to conduct an ex-post analysis of the total impacts derived from the total
expenditure of royalties till now, based on their actual use.
Moreover, to provide helpful indications on the possible effects of an alternative use of the financial
resources derived from mining, the four following simulations have been made that assume a different use of
the shares allocated to other actions:
1. Increase in current consumption for public administration (scenario I);
2. Increase in the current consumption of public administration and in transfers to households (scenario
II);
3. Funding of current activities of private enterprises (scenario III);
4. Funding of investments of private enterprises (scenario IV).
3. RESULTS
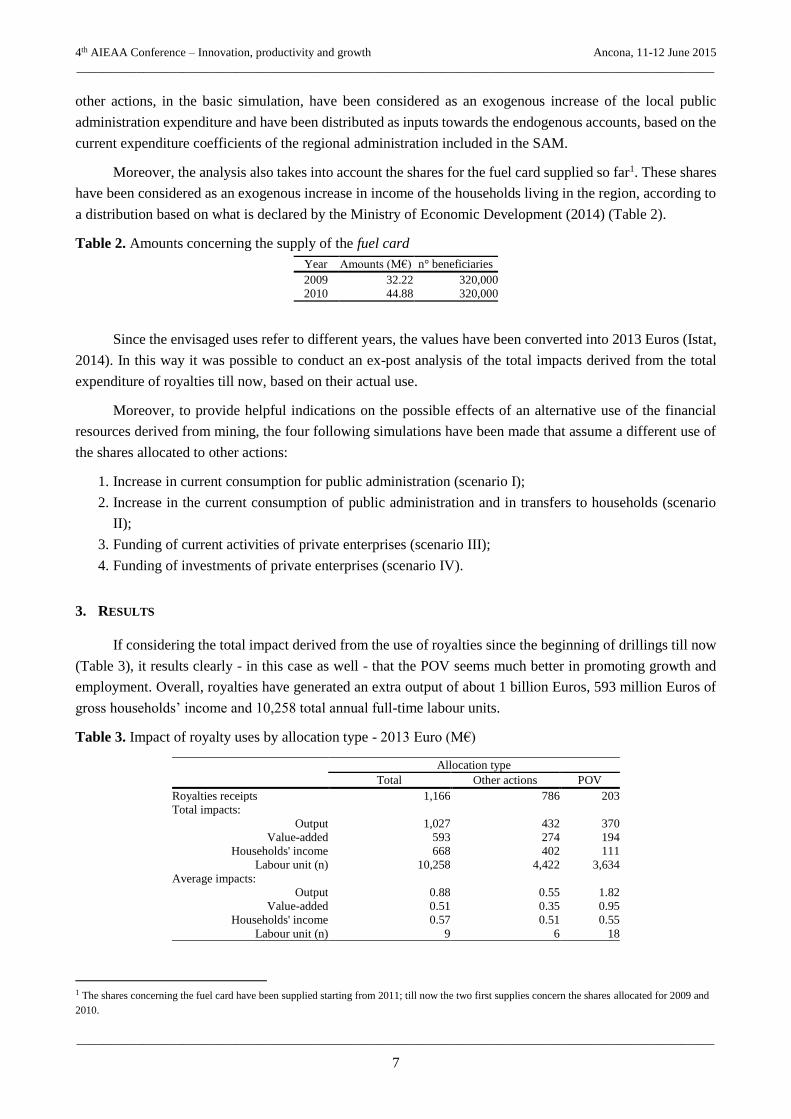
If considering the total impact derived from the use of royalties since the beginning of drillings till now
(Table 3), it results clearly - in this case as well - that the POV seems much better in promoting growth and
employment. Overall, royalties have generated an extra output of about 1 billion Euros, 593 million Euros of
gross households’ income and 10,258 total annual full-time labour units.
Table 3. Impact of royalty uses by allocation type - 2013 Euro (M€)
Allocation type
Total Other actions POV
Royalties receipts 1,166 786 203
Total impacts:
Output 1,027 432 370
Value-added 593 274 194
Households' income 668 402 111
Labour unit (n) 10,258 4,422 3,634
Average impacts:
Output 0.88 0.55 1.82
Value-added 0.51 0.35 0.95
Households' income 0.57 0.51 0.55
Labour unit (n) 9 6 18
1 The shares concerning the fuel card have been supplied starting from 2011; till now the two first supplies concern the shares allocated for 2009 and
2010.
4th AIEAA Conference – Innovation, productivity and growth Ancona, 11-12 June 2015
________________________________________________________________________________________________
________________________________________________________________________________________________
8
Table 3 shows that the ratio of generated output to the expenditure allocated to the POV is more than
three times the one recorded for the other actions (€1.82 vs €0.55 of additional output for each additional € of
expenditure). The POV has generated almost the same labour units using only 25% of the budget available for
the other actions. These higher impacts are mainly due to the fact that a considerable portion of the POV
expenditure is directed towards construction activities (both to improve infrastructures and to preserve the
cultural heritage), a sector mainly based on local businesses.
Through an analysis of the breakdown of impacts on the regional economy (Table 4), it seems clear that
a targeted programme like the POV results in a higher direct and indirect impact (through the production
system) on the output, as compared to that related to the expenses incurred by other actions aimed at supporting
the public administration expenditure. This expenditure has actually a direct impact on households’ income
leading to an induced impact on output and value-added (multiplier effect) only through the increase in
consumption.
Table 4. Breakdown of impacts by allocation of royalties (M€)
Output Value-added Households'income
Direct impact
POV 152.78 0.00 0.00
Other actions 0.000 0.25 231.98
Indirect impact
POV 144.08 0.00 0.00
Other actions 22.71 1.72 5.82
Induced impact
POV 72.86 193.60 110.95
Other actions 408.03 271.13 164.08
Regional total impact 800.46 466.70 512.84
Interregional feedback
POV 0.53 0.33 0.20
Other actions 0.81 0.54 0.31
Total impacts 801.80 467.57 513.35
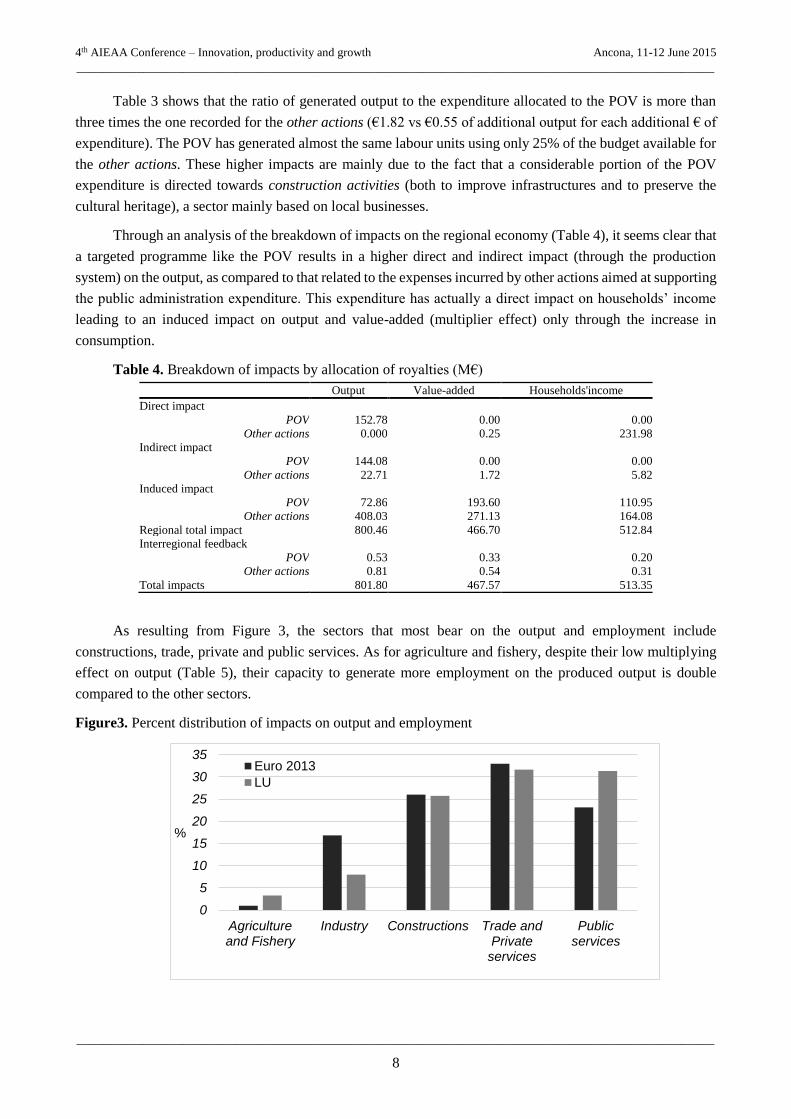
As resulting from Figure 3, the sectors that most bear on the output and employment include
constructions, trade, private and public services. As for agriculture and fishery, despite their low multiplying
effect on output (Table 5), their capacity to generate more employment on the produced output is double
compared to the other sectors.
Figure3. Percent distribution of impacts on output and employment
0
5
10
15
20
25
30
35
Agricultureand Fishery
Industry Constructions Trade andPrivate
services
Publicservices
%
Euro 2013
LU
4th AIEAA Conference – Innovation, productivity and growth Ancona, 11-12 June 2015
________________________________________________________________________________________________
________________________________________________________________________________________________
9
Table 5. Sector output multipliers
Sector Output multipliers
Agriculture and Fishery 1.56
Industry 1.78
Constructions 2.04
Trade 1.82
Public services 1.84
In general, however, most effects derived from the use of royalties have been lost by the regional
economy. The typical opening of a regional economy is expressed by the ratio of the generated output to the
total value of spent royalties: on average, only €0.88 of additional output has been produced at the regional
level for each € spent. The mean incidence on the income is even smaller, with only 51% of expenditure
converted into actual income earned by the households living in the region. The overall impact is thus moderate
compared to the absolute value of the available budget, which has stabilised around 100 million €/year (about
3% of the annual expenditure of public administration in Basilicata region). These results may only partly be
assessed by static simulations. The use of supplemental financial resources derived from royalties has maybe
played a fundamental role to tackle the regional economic decline. However, the allocation of these additional
financial resources could be significantly improved also in the short run.
We can deduce that a specific program like the POV is a better solution in promoting economic growth
in the short run; moreover, since this is a program supporting investments in production activities, it has greater
probabilities to improve the competitiveness of the regional economic system. An alternative use of the
resources, allocated so far to the public administration expenditure, might further contribute to development.
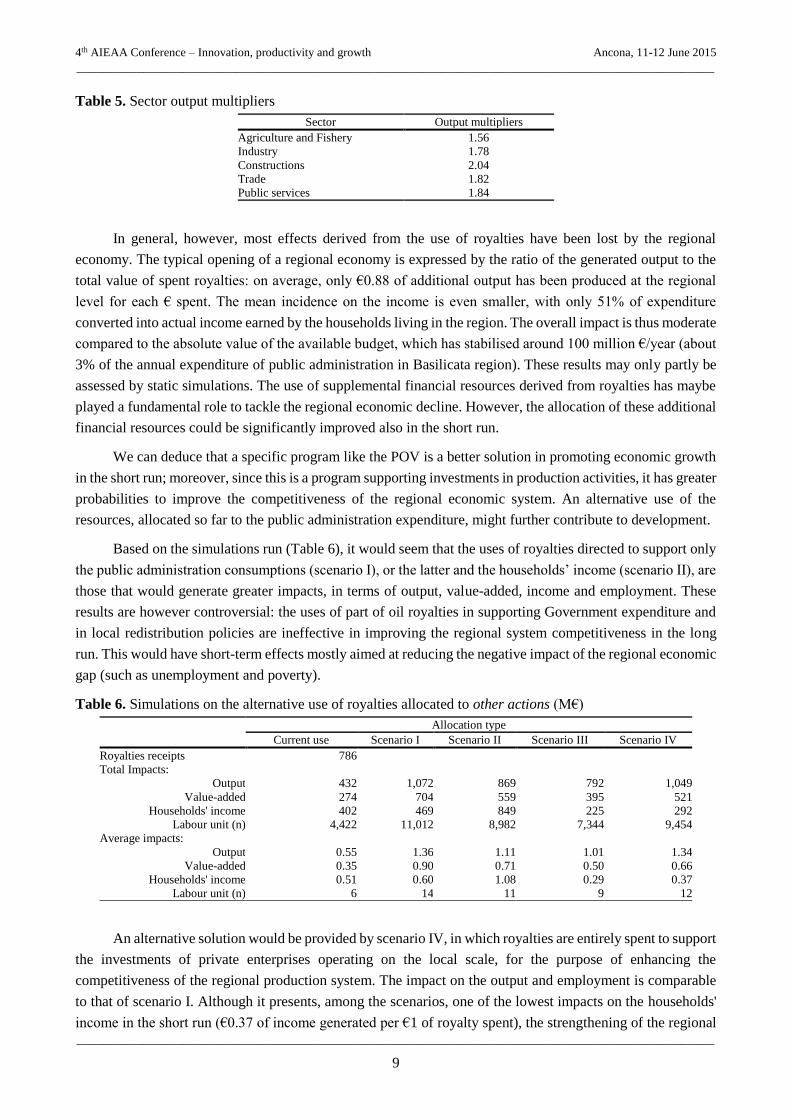
Based on the simulations run (Table 6), it would seem that the uses of royalties directed to support only
the public administration consumptions (scenario I), or the latter and the households’ income (scenario II), are
those that would generate greater impacts, in terms of output, value-added, income and employment. These
results are however controversial: the uses of part of oil royalties in supporting Government expenditure and
in local redistribution policies are ineffective in improving the regional system competitiveness in the long
run. This would have short-term effects mostly aimed at reducing the negative impact of the regional economic
gap (such as unemployment and poverty).
Table 6. Simulations on the alternative use of royalties allocated to other actions (M€)
Allocation type
Current use Scenario I Scenario II Scenario III Scenario IV
Royalties receipts 786
Total Impacts:
Output 432 1,072 869 792 1,049
Value-added 274 704 559 395 521
Households' income 402 469 849 225 292
Labour unit (n) 4,422 11,012 8,982 7,344 9,454
Average impacts:
Output 0.55 1.36 1.11 1.01 1.34
Value-added 0.35 0.90 0.71 0.50 0.66
Households' income 0.51 0.60 1.08 0.29 0.37
Labour unit (n) 6 14 11 9 12
An alternative solution would be provided by scenario IV, in which royalties are entirely spent to support
the investments of private enterprises operating on the local scale, for the purpose of enhancing the
competitiveness of the regional production system. The impact on the output and employment is comparable
to that of scenario I. Although it presents, among the scenarios, one of the lowest impacts on the households'
income in the short run (€0.37 of income generated per €1 of royalty spent), the strengthening of the regional
4th AIEAA Conference – Innovation, productivity and growth Ancona, 11-12 June 2015
________________________________________________________________________________________________
________________________________________________________________________________________________
10
production system competitiveness might lay the bases for sustainable economic development of the entire
region in the long run. A strategy that is in line with the notion of sustainability of natural resources and
involves a progressive replacement of the deployed natural assets (oil in this case) with the produced capital
(Hamilton and Atkinson, 2006).
4. CONCLUSIONS
In this work, a multi-sector model based on a two-region SAM was used to study the socioeconomic
impact of the use of oil royalties on the economic system of Basilicata region.
To this purpose, it was necessary to carry out an ex-post analysis of royalty allocation since the
beginning of drillings till now. Some simulations were performed to estimate the effect that might have been
generated by a different use of the royalties actually utilized in funding the Government expenditure.
Results clearly show that in the past the allocation of oil royalties granted to the regional government
(as a whole €990 million) generated a much lower impact than expected, in terms of economic growth and
employment. Given the structure of the regional economy, a large part of the impacts of investments and
current expenses funded by royalties have been probably lost outside the regional boundaries. As a whole, the
use of part of the royalties to support the regional Government expenditure has been less effective in promoting
the regional economic growth compared to a targeted program like the POV, aimed at supporting the areas
where oil fields are found.
These results, together with the macroeconomic indicators that describe the economic system of the
region, show clearly that Basilicata’s economy is at risk for the natural resource curse. The same opacity in the
distribution of royalties is a symptom of a potentially distorted policy and of the ineffective use of a
considerable amount of additional financial resources. Detailed information about the use of royalties was
actually available only for a quarter of the earnings received by Basilicata region between 1997 and 2013.
The additional financial resources derived from the exploitation of oil fields over the last few years have
undoubtedly played a role to mitigate the impacts of the overall macroeconomic crisis. This use is
understandable in a region, like Basilicata, that has an economic gap with the rest of Italy. However, the
absence of a clear strategy targeted to increase the regional economic system competitiveness might,
paradoxically, result in a deterioration of the relative position of Basilicata within the national economy. The
exploitation of non-renewable natural resources could also crowd-out the other production activities.
Simulations show that even expenditure programs directed to implement investments could favour economic
growth in the short run, without jeopardizing the regional system competitiveness prospects. Better balancing
in the allocation of royalties between social expenditure and production investments would probably constitute
the first step towards a sustainable development strategy of the regional economy.
REFERENCES
Atkinsons, G. and Hamilton, K. (2003). Savings, growth and the resource curse hypothesis. World
Development 31(11):1793-1807.
Breisenger, C., Diao, X., Wiebelt, S. and Wiebelt, M. (2010). Managing future oil revenues in Ghana: an
assessment of alternative allocation options. African Development Review 22(2):303-315.
4th AIEAA Conference – Innovation, productivity and growth Ancona, 11-12 June 2015
________________________________________________________________________________________________
________________________________________________________________________________________________
11
Carbonaro, G., Tenna, F. and Roberto, Z. (2001). I conti economici regionali: alcune possibili riflessioni.
Rapporto di ricerca 01.04, Commissione per la garanzia dell’informazione statistica, Presidenza del Consiglio
dei Ministri.
Caselli, F. and Michaels, G. (2013). Do oil windfalls improve living standards? Evidence from Brazil.
American Economic Journal-Applied Economics 5(1):208-238.
Dietzenbacher, E. (2002). Interregional Multipliers: Looking Backward, Looking Forward. Regional Studies
36:125–136.
Florestano, F. (2013). Hydrocarbon exploitation and macroeconomic performance: a structural VAR approach
for Basilicata. Economics and Policy of Energy and the Environment 1:148-174.
Hamilton, K. and Atkinson, G. (2006). Wealth, welfare and sustainability. Advances in measuring sustainable
development. Edward Elgar, Cheltenham, UK, Northamton, MA, USA.
Hirschman, A.O. (1958). The strategy of economic development, vol 58, Yale University Press, New Haven.
Iacono, R. (2015). No blessing, no curse? On the benefits of being a resource-rich southern region of Italy.
Research in Economics, forthcoming http://dx.doi.org/10.1016/j.rie.2015.03.003.
ISTAT (2014). I.stat: il tuo accesso diretto alla statistica italiana. http://dati.istat.it/Index.aspx. Accessed 27
Nov 2014
Keenan, J. (2005). Chad-Cameroon oil pipeline: World Band and ExxonMobil in ‘Last Chance Saloon’.
Review of African political economy 104(5):395-477.
Larsen, R. (2006). Escaping the resource curse and the Dutch disease? When and why Norway caught up and
forged ahead of its neighbours. American Journal of Economics and Sociology 65(3):605-640.
Leontief, W. (1936). Quantitative Input and Output Relations in the Economic System of the United States.
Review of Economics and Statistics 18:105-125.
Levy, S. (2006). Public Investment to Reverse the Dutch Disease: The Case of Chad. In IFPRI Development
Strategy and Governance Division Discussion Papers, No. 35.
http://www.ifpri.org/sites/default/files/publications/dsgdp35.pdf. Accessed 8 Sep 2014
Miller, R.E. and Blair, P.D. (2009). Input-output Analysis, Foundations and Extensions. Cambridge University
Press, New York.
Ministero dello sviluppo economico (2014). Direzione generale per le risorse minerarie ed energetiche.
http://unmig.sviluppoeconomico.gov.it/home.asp. Accessed 27 Nov 2014
Pegg, S. (2005). Can policy intervention beat the resource curse? Evidence from the Chad-Cameroon Pipeline
Project. African Affairs 105(418):1-25.
Pyatt, G. (1988). A SAM approach to modelling. Journal of Policy Modeling 10(3):327-352.
Pyatt, G. (1991a). Fundamentals of Social Accounting. Economic Systems Research 3:315–341.
Pyatt, G. (1991b). SAMs, the SNA and National Accounting Capabilities. Review of Income and Wealth
37:179–199.
Pyatt, G. (1994a). Modelling Commodity Balances: Part I. Economic Systems Research 6:5–20.
Pyatt, G. (1994b). Modelling Commodity Balances: Part II. Economic Systems Research 6:123–134.
Pyatt, G. (1999). Some Relationships between T-accounts, Input-Output Tables and Social Accounting
Matrices. Economic Systems Research 11:365–387.
Pyatt, G. and Round, J.I. (1977). Social Accounting Matrices for Development Planning. Review of Income
and Wealth 23:339–364.
Pyatt, G. and Round, J.I. (eds) (1985). Social Accounting Matrices: A Basis for Planning. The World Bank,
Washington DC
4th AIEAA Conference – Innovation, productivity and growth Ancona, 11-12 June 2015
________________________________________________________________________________________________
________________________________________________________________________________________________
12
Rocchi, B., Landi, C., Stefani, G,. Romano, S. and Cozzi, M. (2015). Escaping the resource curse in regional
development: a case study on the allocation of oil royalties. International Journal of Sustainable Development
18(1-2): 115-138.
Rosenstein-Rodan, P.N. (1943). Problems of industrialisation of eastern and south-eastern Europe. Economic
Journal, 202-211.
Round, J.I. (1985). Decomposing Multipliers for Economic Systems Involving Regional and World Trade.
Economic Journal 95:383–399.
Round, J.I. (2001). Feedback Effects in Interregional Input-Output Models: What Have We Learned?. In Lahr,
M.L. and Dietzenbacher, E. (eds), Input-Output Analysis: Frontiers and Extensions. Palgrave, New York, 54–
70.
Round, J.I. (2003). Constructing SAMs for development policy analysis: lessons learned and challenges ahead.
Economic Systems Research 15(2):161-183.
Sachs, J.D. and Warner, A.M. (2001). The curse of natural resources, European Economic Review 45(4–
6):827–838.
Seers, D. (1970). New approaches suggested by the Colombia Employment Programme. In ILO’70:
International Labour Review 102: 380.
Seers, D. (1972). New light on structural unemployment: Lessons of a mission to Ceylon. In ILO’72:
International Labour Review 105: 100.
Stone, R. (1961). Social Account at the Regional Level. In Isard, W. and Cumberland, J.H. (eds), Regional
Economic Planning: Techinques of Analysis for Less Developed Areas. OECD, Paris.
Thorbecke, E. (1985). The Social Accounting Matrix and Consistency – Type Planning Models. In Pyatt, G.
and Round, J.I. (eds), Social Accounting Matrices. A basis for planning. The World Bank, Washington DC
Torvik, R. (2009). Why do some resource-abundant countries succeed while others do not?, Oxford Review of
Economic Policy 25(2):241–256.
United Nations, Commission of the European Communities, International Monetary Fund, Organisation for
Economic Cooperation and Development and World Bank (1993). System of National Accounts. Bruxelles,
New York, Paris, Washington D.C.
Van der Ploeg, F. (2011). Natural resources: curse or blessing?. Journal of Economic Literature 49(2):366–
420.