Embed Size (px)
Citation preview
________________________________________________________________________________________________
________________________________________________________________________________________________
Toward the adaptation to new regulation on water pricing in the
agricultural sector: a case study from northern Italy
Elisa Guerra1, Francesco Galioto1, Meri Raggi2 and Davide Viaggi1 1 Department of Agricultural Sciences, University of Bologna, Bologna, Italy
2 Department of Statistical Sciences, University of Bologna, Bologna, Italy
Paper prepared for presentation at the 4th AIEAA Conference “Innovation, productivity and growth: towards sustainable agri-food production”
11-12 June, 2015
Ancona, Italy
Summary
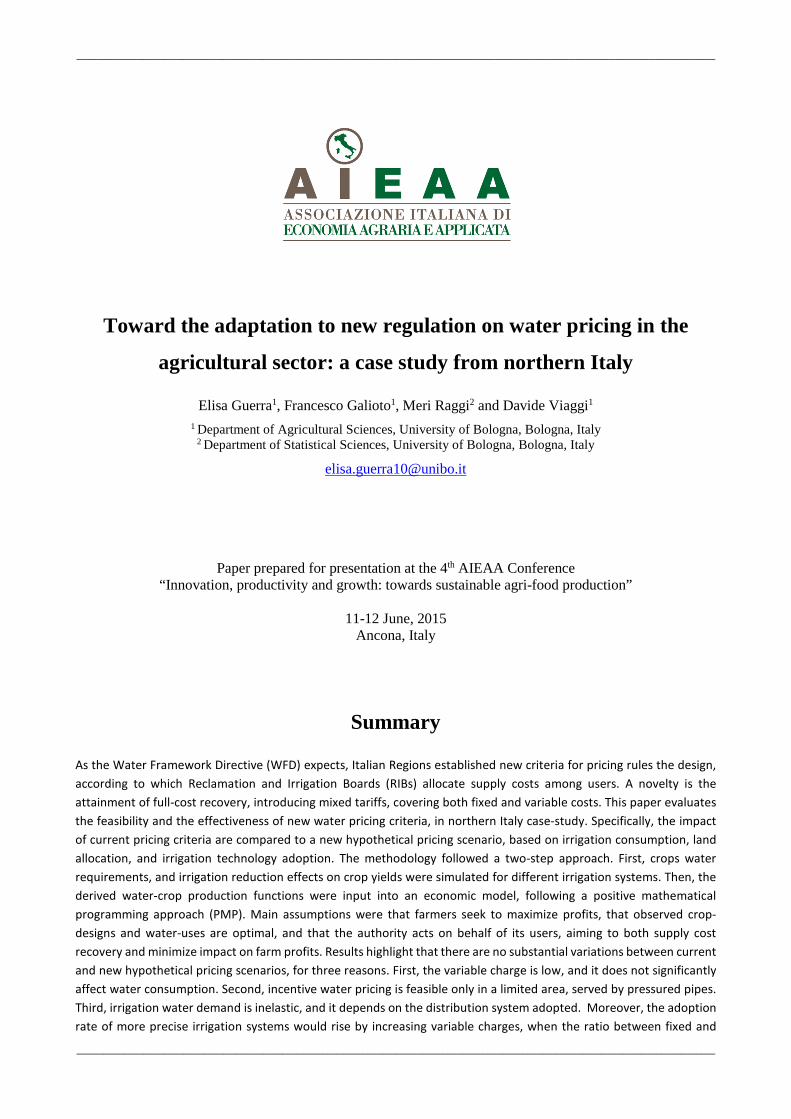
As the Water Framework Directive (WFD) expects, Italian Regions established new criteria for pricing rules the design,
according to which Reclamation and Irrigation Boards (RIBs) allocate supply costs among users. A novelty is the
attainment of full-cost recovery, introducing mixed tariffs, covering both fixed and variable costs. This paper evaluates
the feasibility and the effectiveness of new water pricing criteria, in northern Italy case-study. Specifically, the impact
of current pricing criteria are compared to a new hypothetical pricing scenario, based on irrigation consumption, land
allocation, and irrigation technology adoption. The methodology followed a two-step approach. First, crops water
requirements, and irrigation reduction effects on crop yields were simulated for different irrigation systems. Then, the
derived water-crop production functions were input into an economic model, following a positive mathematical
programming approach (PMP). Main assumptions were that farmers seek to maximize profits, that observed crop-
designs and water-uses are optimal, and that the authority acts on behalf of its users, aiming to both supply cost
recovery and minimize impact on farm profits. Results highlight that there are no substantial variations between current
and new hypothetical pricing scenarios, for three reasons. First, the variable charge is low, and it does not significantly
affect water consumption. Second, incentive water pricing is feasible only in a limited area, served by pressured pipes.
Third, irrigation water demand is inelastic, and it depends on the distribution system adopted. Moreover, the adoption
rate of more precise irrigation systems would rise by increasing variable charges, when the ratio between fixed and

________________________________________________________________________________________________
________________________________________________________________________________________________
variable components is flexible, hence also directly affecting irrigation demand. In fact, since fixed costs are usually
greater than variable costs, mixed tariff adoption in this area could both recover water supply costs, and co-finance
subsidies on irrigation technology investments, as was otherwise prevented by latest CAP-reform.
Keywords: WFD, PMP, water pricing, irrigation JEL Classification codes: Q5
4th AIEAA Conference – Innovation, productivity and growth Ancona, 11-12 June 2015
________________________________________________________________________________________________
________________________________________________________________________________________________
1
Toward the adaptation to new regulation on water pricing in the
agricultural sector: a case study from northern Italy
Elisa Guerra1, Francesco Galioto1, Meri Raggi2 and Davide Viaggi1 1 Department of Agricultural Sciences, University of Bologna, Bologna, Italy
2 Department of Statistical Sciences, University of Bologna, Bologna, Italy
1. INTRODUCTION
Recently, the regional administration of Emilia Romagna published new guidelines establishing the
criteria for local reclamation and irrigation boards to allocate water supply costs among users. These criteria
are in line with the WFD (2000/60/EC) pricing principles. A novelty is the attainment of full cost recovery,
promoted through the introduction of a mixed tariff, combining a flat rate and a variable charge. This provides
both a stable minimum revenue to the water supply authority and it promotes the adoption of more rational
irrigation water uses within the consumers’ network. According to Regional guidelines, the quota of supply
costs has to be recovered through a flat rate and a variable charge, and it should reflect the distribution of fixed
and variable costs, incurred by the water supplier authority. Fixed cost are supposed to include capital costs,
full-time labour, ordinary operating and maintenance costs that the water authority supports, regardless the
amount of irrigation water applied. Variable cost are assumed to comprehend mainly part-time labour,
conveyance and pumping costs that the water authority supports in relation to the quantity of supplied water.
Those farmers not using water for irrigation, but that can potentially use it, should contribute only paying for
the flat rate. The flat rate should further differ both with the distance of fields from the abduction source, and
with the type and density of the conveyance system, which is adopted to supply water to the different districts
of the irrigation network. The variable charge should be tied to the amount of water applied - when it is possible
to meter water - or to the alleged uses - when it is not possible to meter water. In the latter case, Regional
guidelines suggest to differentiate tariffs with crop water requirements, and with the type of irrigation systems
used. Tariffs for farmers not irrigating - or adopting more efficient irrigation techniques - should be lower than
for other farmers.
Several experts support the hypothesis that the imposition of volumetric tariffs may affect irrigation
water consumption until marginal revenues equal marginal costs, i.e. water price (Grimble, 1999; Rodgers and
Hellegers, 2005). This rule seldom occurs in practice as most of the irrigation water is supplied through open
canals and users pay for flat rates or according to alleged use of water (Molle and Berkoff, 2007). Even under
those circumstances where it is possible to meter irrigation water consumption (e.g. farmlands served by
pressure pipes), manometers for water uses monitoring may be exposed to sabotages. The transaction of
incurred costs by the regulator to limit such risk, may be in fact so high to preclude the possibility to impose
volumetric tariffs (Cornish et al, 2004). Finally, in those few irrigation networks, where volumetric tariff is
adopted, the effects on water uses are negligible, as the irrigation water demand is often inelastic (Fragoso and
Marques, 2013). Even though recent literature considers volumetric charge significantly affecting water uses,
some authors highlight that variable charges may incentivize a wider adoption of more efficient irrigation
technologies, and as a consequence, indirectly affecting water the demand for irrigation (Moreno and Sunding,
2005).

4th AIEAA Conference – Innovation, productivity and growth Ancona, 11-12 June 2015
________________________________________________________________________________________________
________________________________________________________________________________________________
2
The present paper contributes enriching this debate, evaluating the feasibility and the effectiveness of
the pricing criteria discussed previously. Specifically, the study draws inspiration from the actual pricing
system adopted by Burana, a Reclamation and Irrigation Board (RIB) located in Emilia Romagna, northern
Italy. The study analyses the associated consequences due to the implementation of the new pricing criteria,
both respect to the applied water amounts, land allocation and irrigation technology adoption.
The following four sections describe: (i) characteristics of the case study area, introducing policy issues and
tariffs scenarios; (ii) the two-steps methodological approach adopted, combining the water-crop production
function estimation, and nested in the economic optimization model, following a PMP approach; (iii)
preliminary results, addressing the impact of current and new pricing criteria, over the amount of applied water,
land allocation and irrigation technology adoption; (iiii) discussion and conclusion, providing some water
policy recommendations.
1.1. The case study, policy issue and tariff scenarios
The Burana RIB is a consortium administered by the same owners of land properties under its
jurisdiction and it is responsible of the maintenance and operation of the infrastructures for reclamation and
irrigation services. This territory is enclosed by the Po river (in the North), the Secchia river (in the East), the
Samoggia river (in the West), and the Tosco-Emiliano Apennines (in the South), and it covers 140.000
hectares, of which 16.500 are irrigated.
Open canals cross 90% of the area under the consortium jurisdiction. These canals play the twofold
functions of reclamation, mainly during the winter, and irrigation, mainly during the summer period. Pressure
pipes cross the remaining 10% of the region and water is delivered to end-users on demand. Four main sub-
regions are part of the area crossed by open canals, and they are characterized by differences in altitude (low-
plain and high-plain areas) and in network infrastructures. Differences in infrastructures condition the
possibility to fix rules (imposition of turns), as well as to impose incentivizing water use tariffs. Water is
priced on a per area basis, in most of the sub-regions, and on a per hour basis for those farmers using furrow
irrigation in two sub-regions. Arable crops account for more than a half of the total cultivated area in the
consortium region (56%) and they are mainly concentrated in the low plain areas. Orchards and vineyards
occupy 8% of the irrigated crop area, and most of them are located between low plains and high plain areas.
Finally, vegetable crops cover 2% of the total UAA, and most of them are located in the low plain region. In
the whole region, irrigated crops tend to be concentrated all along the irrigation network, with the exception
of those regions, characterized by lower density of the water abduction sources. Here, farmers use to integrate
surface water with ground water supply, and there is no significant correlation between type of crop and
distance from water abduction source.
Under the current tariff scenario, the water authority applies different tariff strategies among different
sub-areas of the irrigation network. According to the characteristics of each sub-area, tariffs are differentiated
with: (i) the distance from the main source of water; (ii) or the type of crop and type of irrigation system; (iii)
or connected to the hours of irrigation demand (only for farmers applying furrow irrigation); (iiii) or even
tariffs are proportional to the total farmland. The implementation of such different tariff strategies by the water
authority is partially justified, by differences in the irrigation network structure. Its coverage is not uniform:
for some regions the irrigation network wholly satisfy the irrigation water demand, while for some others the
irrigation network barely reach the field, because they are crossed by different types of irrigation network. In
particular, some sectors are served by pressure-pipes, and some others by open canals. In addition to this, sub-
4th AIEAA Conference – Innovation, productivity and growth Ancona, 11-12 June 2015
________________________________________________________________________________________________
________________________________________________________________________________________________
3
areas differ for irrigation water demands, since these last depend on both the main type of crop, and on the
main type of irrigation technology adopted by farmers.
Recently publication of regional guidelines - establishing the pricing rules, according to which each RIB
should accomplish with - brought the Burana RIB to question the water charge criteria currently implemented
for some sub-areas, and to assess the feasibility of a set of alternative pricing options. A new tariff scenario,
which is consistent with the regional guidelines, is described as follows. The regulator is supposed to impose
two alternative tariff systems, one for those districts served by pressure pipes, the other for those sectors served
by open canals. Farmers served by pressure pipes are assumed to correspond a two-part tariff, with a flat rate
related to the cultivated area, and a variable component connected with the applied water amount. Farmers
served by open canals are presumed to correspond tariffs, differentiated with the distance from the main source
of abduction, with the type of crop and irrigation system, and with applied water volumes (only for furrow
irrigation). That is, with the new tariffs scenario, the number of tariff options are essentially two, one for those
sectors of the irrigation network served by open canals, and one for those sectors served by pressure pipes.
2. METHODOLOGY
In order to assess the relevant impacts of the previously discussed alternative pricing scenarios, in relation to irrigation water amount, land uses and irrigation technology adoption, the authors applied a two-steps method: 1) Estimation of the production function, both for the main corps of the district, and for the main irrigation systems used; 2) Economic modellization, through a PMP approach.
2.1. The production function estimation
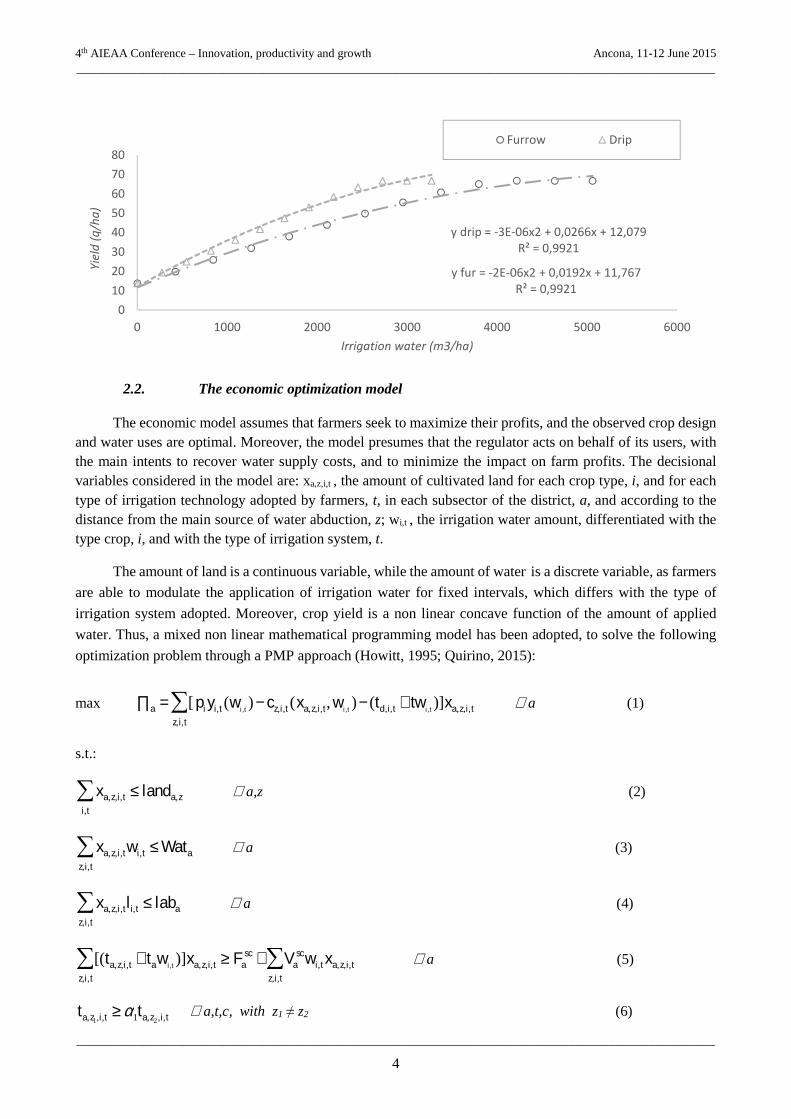
For the crop growth model, local meteorological and crop management data were used as input in an
evapotranspiration model, based on crop coefficient methods, to determine irrigation water requirement,
assuming well-watered conditions (Guerra et al, 2014). Then, yield responses to decreasing amounts of
irrigation water, enabled to estimate crop-water production functions (Steduto et al, 2012). As the example of
Figure 1 shows, the same crop, with same growing conditions, it is supposed to follow different production
functions, according to the different water application system.
Figure 1. Chart on the production functions of cherry, according to irrigation volumes applied by two of the main irrigation
methods used. 'y drip' is the production function of drip irrigated cherry; 'y fur' is the production function of furrow irrigated orchard.
The maximum value obtained for yields is the model output, assuming an optimal irrigation, for both irrigation techniques: 100% of
the optimal water volume, which means using drip irrigation = 2724.5 m3/ha, and 4216.7 m3/ha with furrow irrigation, both
correspond to a yield equal to 66,88 q/ha. The minimum value correspond, in both cases, to the dry or rainfed cultivation (i.e. 0% of
optimal irrigation volumes). Points above optimal irrigation volumes correspond to hypothetical over-irrigation applied, (i.e. equal to
110 and 120%).
4th AIEAA Conference – Innovation, productivity and growth Ancona, 11-12 June 2015
________________________________________________________________________________________________
________________________________________________________________________________________________
4
2.2. The economic optimization model
The economic model assumes that farmers seek to maximize their profits, and the observed crop design and water uses are optimal. Moreover, the model presumes that the regulator acts on behalf of its users, with the main intents to recover water supply costs, and to minimize the impact on farm profits. The decisional variables considered in the model are: xa,z,i,t , the amount of cultivated land for each crop type, i, and for each type of irrigation technology adopted by farmers, t, in each subsector of the district, a, and according to the distance from the main source of water abduction, z; wi,t , the irrigation water amount, differentiated with the type crop, i, and with the type of irrigation system, t.
The amount of land is a continuous variable, while the amount of water is a discrete variable, as farmers
are able to modulate the application of irrigation water for fixed intervals, which differs with the type of
irrigation system adopted. Moreover, crop yield is a non linear concave function of the amount of applied
water. Thus, a mixed non linear mathematical programming model has been adopted, to solve the following
optimization problem through a PMP approach (Howitt, 1995; Quirino, 2015):
max ∏a = [ pi yi,t (wi ,t)− cz,i,t (xa,z,i,t,wi ,t
)− (td,i,t + twi ,t)]xa,z,i,t
z,i,t
∑ ∀ a (1)
s.t.:
∀ a,z (2)
xa,z,i,twi,t ≤ Wataz,i,t
∑ ∀ a (3)
∀ a (4)
[(ta,z,i,t + tawi ,t)]xa,z,i,t
z,i,t
∑ ≥ Fasc + Va
scwi,txa,z,i,tz,i,t
∑ ∀ a (5)
ta,z1,i,t≥ α1ta,z2,i,t
∀ a,t,c, with z1 ≠ z2
(6)
xa,z,i,ti,t
∑ ≤ landa,z
xa,z,i ,tz,i,t
∑ li,t ≤ laba
y fur = -2E-06x2 + 0,0192x + 11,767
R² = 0,9921
y drip = -3E-06x2 + 0,0266x + 12,079
R² = 0,9921
0
10
20
30
40
50
60
70
80
0 1000 2000 3000 4000 5000 6000
Yie
ld (
q/h
a)
Irrigation water (m3/ha)
Furrow Drip

4th AIEAA Conference – Innovation, productivity and growth Ancona, 11-12 June 2015
________________________________________________________________________________________________
________________________________________________________________________________________________
5
ta,z,i1,t≥ α2ta,z,i2,t
∀ a,z,t, with i1 ≠ i2
(7)
ta,z,i,t1
≥ α3ta,z,i,t2
∀ a,z,i, with t1 ≠ t2
(8)
wi,t ≥ 0;xa,z,i,t ≥ 0
with wi,t ∈ N+ and xa,z,i,t ∈ N+
where, ∏a = net Benefits; pi yi,t(wi,t ) = revenues, differentiated with the type of crop and irrigation system; cz,i,t (xa,z,i,t, wi,t ) = costs, differentiated with the distance from the main source of water, with the type of crop and with the type of irrigation system; ta,d,i,t = tariff differentiated with the sector, with the distance from the irrigation network, with the type of crop and irrigation system; ta wi,t = tariff differentiated with the sector and proportional to the amount of water uses. Equation 2 is the constraint for land availability, landa,z. Equation 3 is the constraint for water availability, Wata. Equation 4, the constraint for labour availability, laba. Equation 5 is the cost recovery constraint, where Fa
sc and Vasc are respectively the fixed and variable supply costs,
differentiated with the sectors. The variable component of supply costs is active only for farmers served by pressure pipes, or for farmers applying furrow irrigation. Equations 6, 7,8 fix tariff differentials, in relation to the distance from the main source of water, z, to the type of crops, i, and to the type of irrigation systems, t.
3. RESULTS
This section briefly describes the results obtained from the two-steps methodology adopted, which are illustrated as follows: (i) the crop-water demand function, according to different irrigation systems; (2) the impact of water pricing scenarios, assessed with economic model; (iii) the relative and the absolute variation, both in irrigated farmland, and in applied water for the second water-pricing scenario.
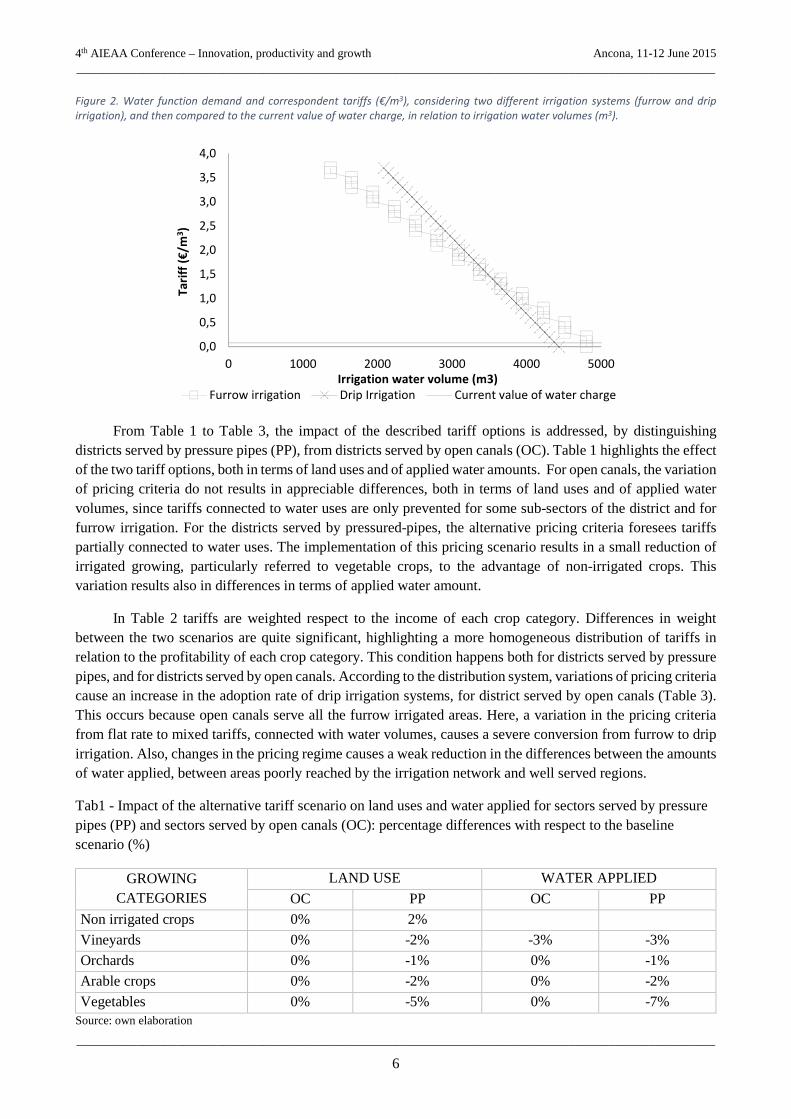
Figure 2 shows that the amount of water requirement for irrigation differs with the type of irrigation system adopted for a given crop, as well as it differs in shape and slope of the water demand function. Specifically, with incresing irrigation efficency, from furrow to drip irrigation, the slope of the water demand curve increases, and elasticity decreases. On the other hand, with sprinkler and furrow irrigation, farmer are able to control discrete amount of applied water, with the consequence that, even with the implementation of a volumetric tariff, there are no significant changes in water use attitudes, until a given pricing threshold is reached.
4th AIEAA Conference – Innovation, productivity and growth Ancona, 11-12 June 2015
________________________________________________________________________________________________
________________________________________________________________________________________________
6
Figure 2. Water function demand and correspondent tariffs (€/m3), considering two different irrigation systems (furrow and drip
irrigation), and then compared to the current value of water charge, in relation to irrigation water volumes (m3).
From Table 1 to Table 3, the impact of the described tariff options is addressed, by distinguishing districts served by pressure pipes (PP), from districts served by open canals (OC). Table 1 highlights the effect of the two tariff options, both in terms of land uses and of applied water amounts. For open canals, the variation of pricing criteria do not results in appreciable differences, both in terms of land uses and of applied water volumes, since tariffs connected to water uses are only prevented for some sub-sectors of the district and for furrow irrigation. For the districts served by pressured-pipes, the alternative pricing criteria foresees tariffs partially connected to water uses. The implementation of this pricing scenario results in a small reduction of irrigated growing, particularly referred to vegetable crops, to the advantage of non-irrigated crops. This variation results also in differences in terms of applied water amount.
In Table 2 tariffs are weighted respect to the income of each crop category. Differences in weight between the two scenarios are quite significant, highlighting a more homogeneous distribution of tariffs in relation to the profitability of each crop category. This condition happens both for districts served by pressure pipes, and for districts served by open canals. According to the distribution system, variations of pricing criteria cause an increase in the adoption rate of drip irrigation systems, for district served by open canals (Table 3). This occurs because open canals serve all the furrow irrigated areas. Here, a variation in the pricing criteria from flat rate to mixed tariffs, connected with water volumes, causes a severe conversion from furrow to drip irrigation. Also, changes in the pricing regime causes a weak reduction in the differences between the amounts of water applied, between areas poorly reached by the irrigation network and well served regions.
Tab1 - Impact of the alternative tariff scenario on land uses and water applied for sectors served by pressure pipes (PP) and sectors served by open canals (OC): percentage differences with respect to the baseline scenario (%)
GROWING CATEGORIES
LAND USE WATER APPLIED
OC PP OC PP
Non irrigated crops 0% 2%
Vineyards 0% -2% -3% -3%
Orchards 0% -1% 0% -1%
Arable crops 0% -2% 0% -2%
Vegetables 0% -5% 0% -7% Source: own elaboration
0,0
0,5
1,0
1,5
2,0
2,5
3,0
3,5
4,0
0 1000 2000 3000 4000 5000
Ta
riff
(€
/m3)
Irrigation water volume (m3)
Furrow irrigation Drip Irrigation Current value of water charge
4th AIEAA Conference – Innovation, productivity and growth Ancona, 11-12 June 2015
________________________________________________________________________________________________
________________________________________________________________________________________________
7
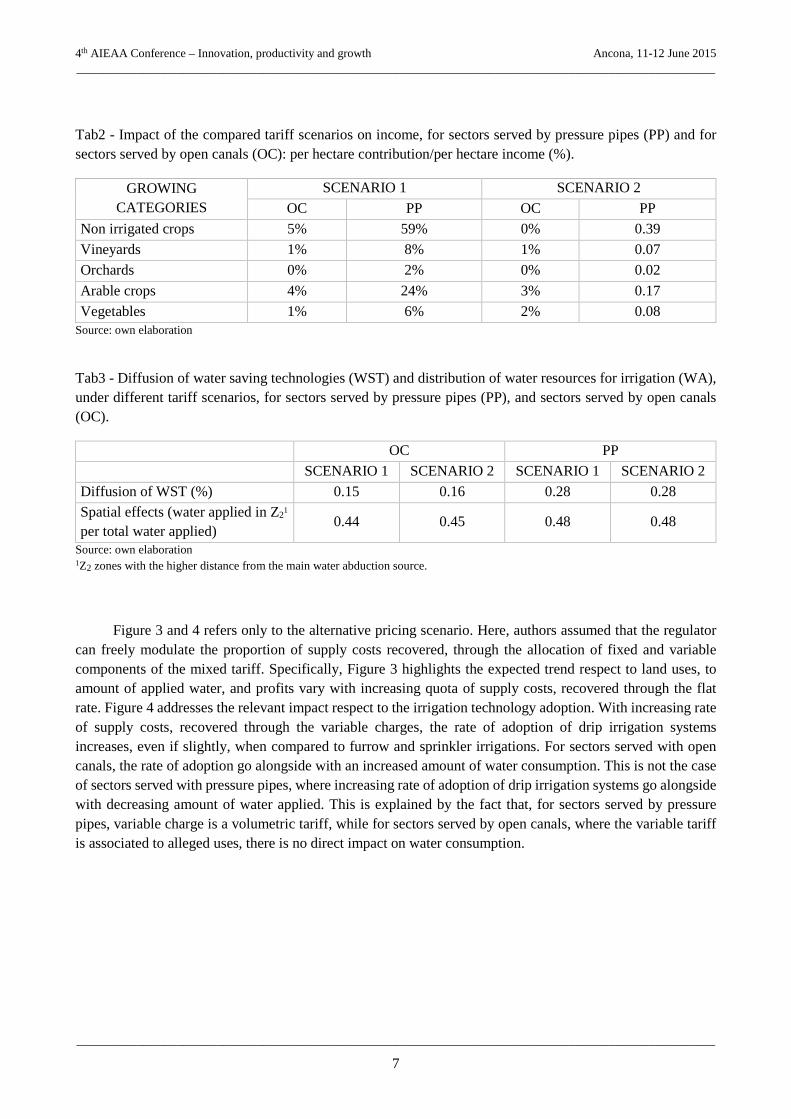
Tab2 - Impact of the compared tariff scenarios on income, for sectors served by pressure pipes (PP) and for sectors served by open canals (OC): per hectare contribution/per hectare income (%).
GROWING CATEGORIES
SCENARIO 1 SCENARIO 2
OC PP OC PP
Non irrigated crops 5% 59% 0% 0.39
Vineyards 1% 8% 1% 0.07
Orchards 0% 2% 0% 0.02
Arable crops 4% 24% 3% 0.17
Vegetables 1% 6% 2% 0.08 Source: own elaboration
Tab3 - Diffusion of water saving technologies (WST) and distribution of water resources for irrigation (WA), under different tariff scenarios, for sectors served by pressure pipes (PP), and sectors served by open canals (OC).
OC PP
SCENARIO 1 SCENARIO 2 SCENARIO 1 SCENARIO 2
Diffusion of WST (%) 0.15 0.16 0.28 0.28 Spatial effects (water applied in Z2
1 per total water applied)
0.44 0.45 0.48 0.48
Source: own elaboration 1Z2 zones with the higher distance from the main water abduction source.
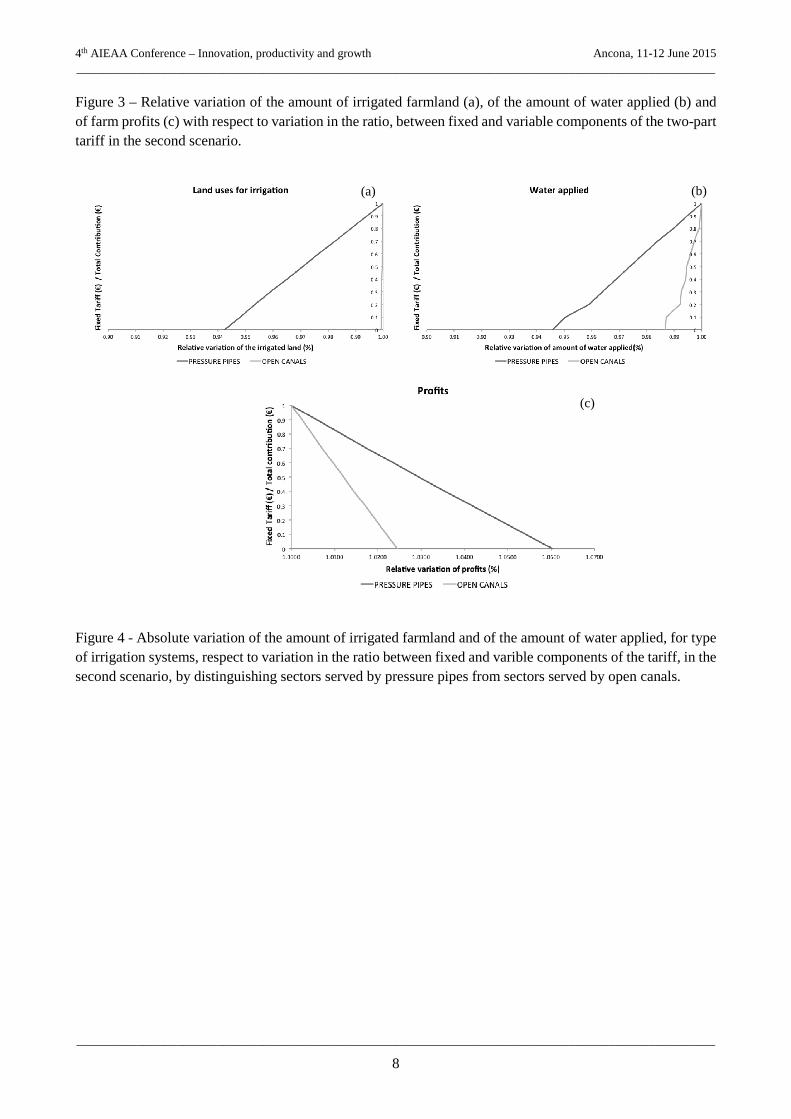
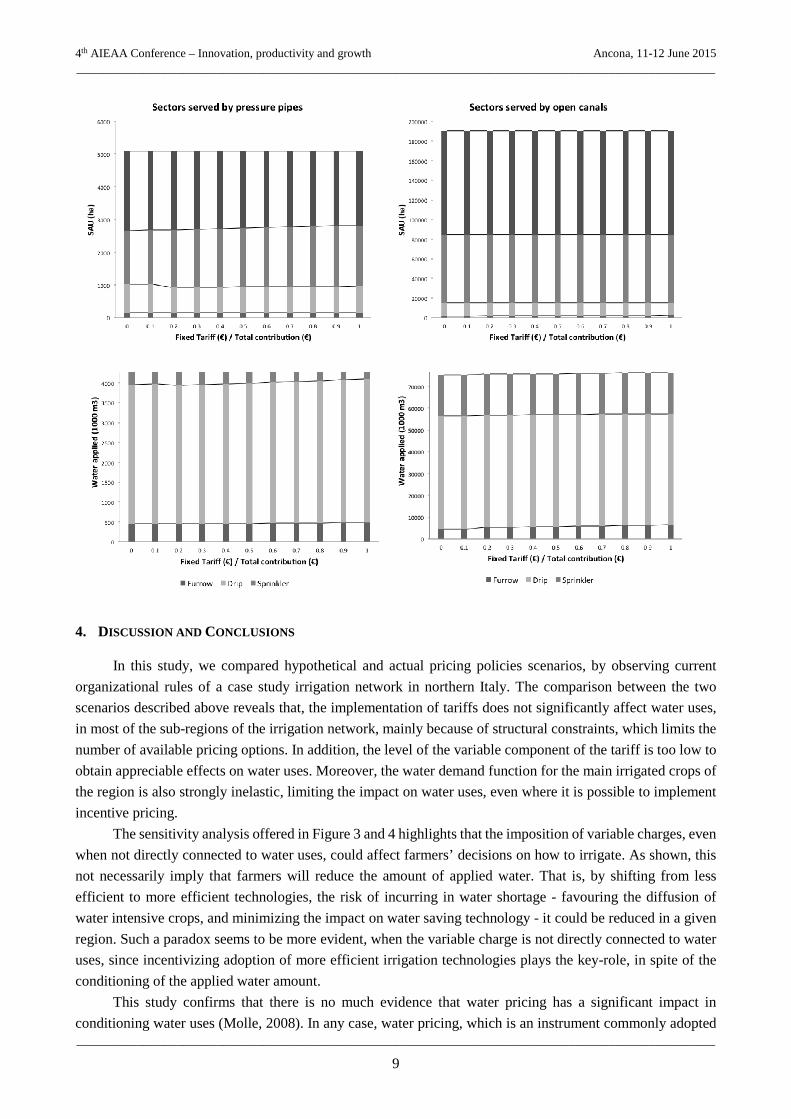
Figure 3 and 4 refers only to the alternative pricing scenario. Here, authors assumed that the regulator can freely modulate the proportion of supply costs recovered, through the allocation of fixed and variable components of the mixed tariff. Specifically, Figure 3 highlights the expected trend respect to land uses, to amount of applied water, and profits vary with increasing quota of supply costs, recovered through the flat rate. Figure 4 addresses the relevant impact respect to the irrigation technology adoption. With increasing rate of supply costs, recovered through the variable charges, the rate of adoption of drip irrigation systems increases, even if slightly, when compared to furrow and sprinkler irrigations. For sectors served with open canals, the rate of adoption go alongside with an increased amount of water consumption. This is not the case of sectors served with pressure pipes, where increasing rate of adoption of drip irrigation systems go alongside with decreasing amount of water applied. This is explained by the fact that, for sectors served by pressure pipes, variable charge is a volumetric tariff, while for sectors served by open canals, where the variable tariff is associated to alleged uses, there is no direct impact on water consumption.
4th AIEAA Conference – Innovation, productivity and growth Ancona, 11-12 June 2015
________________________________________________________________________________________________
________________________________________________________________________________________________
8
Figure 3 – Relative variation of the amount of irrigated farmland (a), of the amount of water applied (b) and of farm profits (c) with respect to variation in the ratio, between fixed and variable components of the two-part tariff in the second scenario.
Figure 4 - Absolute variation of the amount of irrigated farmland and of the amount of water applied, for type of irrigation systems, respect to variation in the ratio between fixed and varible components of the tariff, in the second scenario, by distinguishing sectors served by pressure pipes from sectors served by open canals.
(a) (b)
(c)
4th AIEAA Conference – Innovation, productivity and growth Ancona, 11-12 June 2015
________________________________________________________________________________________________
________________________________________________________________________________________________
9
4. DISCUSSION AND CONCLUSIONS
In this study, we compared hypothetical and actual pricing policies scenarios, by observing current
organizational rules of a case study irrigation network in northern Italy. The comparison between the two
scenarios described above reveals that, the implementation of tariffs does not significantly affect water uses,
in most of the sub-regions of the irrigation network, mainly because of structural constraints, which limits the
number of available pricing options. In addition, the level of the variable component of the tariff is too low to
obtain appreciable effects on water uses. Moreover, the water demand function for the main irrigated crops of
the region is also strongly inelastic, limiting the impact on water uses, even where it is possible to implement
incentive pricing.
The sensitivity analysis offered in Figure 3 and 4 highlights that the imposition of variable charges, even
when not directly connected to water uses, could affect farmers’ decisions on how to irrigate. As shown, this
not necessarily imply that farmers will reduce the amount of applied water. That is, by shifting from less
efficient to more efficient technologies, the risk of incurring in water shortage - favouring the diffusion of
water intensive crops, and minimizing the impact on water saving technology - it could be reduced in a given
region. Such a paradox seems to be more evident, when the variable charge is not directly connected to water
uses, since incentivizing adoption of more efficient irrigation technologies plays the key-role, in spite of the
conditioning of the applied water amount.
This study confirms that there is no much evidence that water pricing has a significant impact in
conditioning water uses (Molle, 2008). In any case, water pricing, which is an instrument commonly adopted
4th AIEAA Conference – Innovation, productivity and growth Ancona, 11-12 June 2015
________________________________________________________________________________________________
________________________________________________________________________________________________
10
by local water authorities to recover supply costs, could deserve to co-finance subsidies on investments, further
promoting the adoption of precise irrigation technologies (Lopez-Morales, 2011). Cross-compliance between
the WFD and the CAP-reform could enable to identify a set of complementary measures, which have the effect
of eliciting the diffusion of water saving technologies. The new CAP-reform is explicitly addressing this
aspect, both by financing advisory weather services and training for supporting investments, in order to support
farms adaptation to WFD cross-compliance (EC, 2013).
5. AKNOWLEDGMENTS
We would like to thank the Burana Irrigation and Reclamation Consortium for their kind and precious
collaboration.
REFERENCES
Albiac, J., Martínez, Y. and Tapia, X. (2006). Water quantity and quality issues in Mediterranean agriculture.
In: Water and Agriculture: Sustainability, Markets and Policies. OECD, Paris, Chapter 5, pp. 137–156.
Bartolini, F., Bazzani, G. M., Gallerani, V., Raggi, M., and Viaggi, D. (2007). The impact of water and
agriculture policy scenarios on irrigated farming systems in Italy: An analysis based on farm level multi-
attribute linear programming models. Agricultural Systems 93: 90-114.
Chambers, R. (1988). Managing Canal Irrigation: Practical Analysis from South Asia. Cambridge University
Press, Cambridge.
Cornish, G., Bosworth, B., Perry, C. and Burke, J. (2004). Water Charging in Irrigated Agriculture: An Analysis of International Experience. FAO Waters Reports 28. FAO, Rome, Italy, p. xi. Directive, Water Framework (2003). Common implementation strategy for the water framework directive
(2000/60/EC).
E. Guerra, F. Ventura, R. L. Snyder, D. Spano (2014). Correcting Midseason Crop Coefficients for Climate.
Journal of Irrigation and Drainage Engineering, ISSN: 1943-4774, doi: 10.1061/(ASCE)IR.1943-
4774.0000839 , 04014071
FAO (2015). AQUASTAT website, Food and Agriculture Organization of the United Nations (FAO). Website
accessed on [2015/05/13]
Fragoso, R., C. Marques (2013). The Economic Impact of Alternative Water Pricing Policies in Alentejo
Region, CEFAGE-UE Working Paper 2013/02.
Grimble, R.J. (1999). Economic instruments for improving water use efficiency: theory and practice. Agricultural Water Management 40(1), 77–82. Howitt, Richard E. (1995). Positive mathematical programming. American journal of agricultural economics
77.2, 329-342.
Legge Regionale 7/2012 (2012). Allegato a). Linee guida dell’attività di Bonifica. Regione Emilia Romagna.
López-Morales and Duchin (2011). Policies and technologies for a sustainable use of water in Mexico: a
scenario analysis. Economic Systems Research, 23:4, 387-407.
Molle, F. and Birkoff, J. (Eds.) (2007). Irrigation water pricing. The gap between theory and practice, CAB
International.
Moreno, G., and Sunding, D. L. (2005). Joint estimation of technology adoption and land allocation with
implications for the design of conservation policy. Amer. J. Agr. Econ. 87(4):1009-1019.
Paris, Quirino (2015). Pmp and Uniqueness of Calibrating Solution: A Revision.Available at SSRN.
4th AIEAA Conference – Innovation, productivity and growth Ancona, 11-12 June 2015
________________________________________________________________________________________________
________________________________________________________________________________________________
11
Rodgers, C. and Hellegers, P. (2005). Water Pricing and Valuation in Indonesia: Case Study of the Brantas
River Basin. EPT Discussion Paper 141. International Food Policy Research Institute, Washington, DC.
Snyder, R.L., 2014. MAD6 – Model for Yield Estimation Calculations based on the methodology of the FAO
Irrigation and Drainage Paper 33. Private concession.
Steduto, P., Hsiao, T. C., Fereres, E., Raes, D. (2012). Crop Yield Response to Water. FAO Irrigation and
Drainage paper, 66. Foood and Agriculture Organization of the United Nations, Rome, 2012, ISBN 978-92-5-
107274-5.
The Economist (2003) Priceless. Available at: http://www.economist.com/displaystory.cfm?story_id =
1906846
Viaggi, D. (2015). Uso Sostenibile dell’Acqua. La Visione Verde della Nuova PAC 2014-2020. Le Guide
dell’Informatore Agrario. 24-26.
WATECO (2003). Common implementation strategy for the Water Framework Directive (2000/60/EC).
Guidance document n.°1. Economics and the environment - The implementation challenge of the WFD.