Embed Size (px)
Citation preview

Toward Inclusive Growth in Indonesia :
Improving Trade and Employment
Guntur Sugiyarto*) Asian Development Bank
Conference on Trade and Employment in a Globalized World. Jakarta, Indonesia, 10-11 Desember 2012
*) The views expressed here are those of the author and do not necessarily reflect the views or policies of
the ADB.

Outline of Discussion
1. Key Outcomes: – Economy
– Trade and Employment
– Labor Market (LM) and Employment
2. Problems in LM and Employment
3. Key Issues on Trade and Industry
4. Government Interventions
5. Concluding Remarks

Failed Structural Transformation
• Declining industry replaced by service sector since 2000
• Higher growth of Agriculture compare than industry lately
• Four different areas with two “red districts”
Source: Calculated from the Key Indicators for Asia and the Pacific
-20.0
-15.0
-10.0
-5.0
0.0
5.0
10.0
15.0
1993
1994
1995
1996
1997
1998
1999
2000
2001
2002
2003
2004
2005
2006
2007
2008
2009
Perc
ent
GDP Agriculture Industry Services
Growth of GDP by Sector: Agriculture, Manufacturing and Services, 1993-2009 (%)

Sectoral GVA and Employment
Agriculture
0
5
10
15
20
25
30
20
25
30
35
40
45
50
55
60
198
0
199
0
200
0
200
1
200
2
200
3
200
4
200
5
200
6
200
7
200
8
200
9
2010
Sh
are
of
agri
cult
ure
gva
(%
to
gd
p a
t 20
00
pri
ces)
Em
plo
ymen
t in
ag
ricu
ltu
re (
% t
o t
ota
l em
plo
ymen
t)
Employment
Agri GVA
Industry
0
5
10
15
20
25
30
35
40
45
50
10
11
12
13
14
15
16
17
18
19
20
198
0
199
0
200
0
200
1
200
2
200
3
200
4
200
5
200
6
200
7
200
8
200
9
2010
Sh
are
of
agri
cult
ure
gva
(%
to
gd
p a
t 20
00
pri
ces)
Em
plo
ymen
t in
ag
ricu
ltu
re (
% t
o t
ota
l em
plo
ymen
t)
Employment
Ind GVA
0
5
10
15
20
25
30
35
40
45
50
20
25
30
35
40
45
19…
19…
20…
20…
20…
20…
20…
20…
20…
20…
20…
20…
20…
Sh
are
of
agri
cult
ure
gva
(%
to
gd
p a
t 20
00
pri
ces)
Em
plo
ymen
t in
ag
ricu
ltu
re (
% t
o t
ota
l em
plo
ymen
t)
Employment
Svc GVA
Services
Source: World Development Indicator Online
•Agr: Slowly declining and remain the main source of employment •Industry: remain low and declining with increasing empl share. Hence decreasing productivity •Services: relatively high and increasing

Trade and Employment
0
2
4
6
8
10
12
0
20
40
60
80
100
120
140
160
180
200
2001 2002 2003 2004 2005 2006 2007 2008 2009 2010
(un
emp
loym
ent
rate
, %
)
(In
dex
, %
)
Export Volume Index Import Volume Index Unemployment rate
Source: World Development Indicator Online
• Weak link between Trade and Employment

Labor Market Dynamics
-
20
40
60
80
100
120
140
160
180
-
10
20
30
40
50
60
70
80
1993
1994
1996
1997
1998
1999
2000
2001
2002
2003
2004
2005
2006
2007
2008
2009
Mn w
ork
ers
Perc
ent
Labor force participation rate
Unemployment Rate
Employee rate
Participation, age 15+
Stylized facts of labor market in Indonesia • Working age (15+) population accounts for 172 million in 2010, grew by 40m during 1993-2010.
• Labor force participation rate was relatively stable at 66-68%
• Unemployment rate is relatively low and stable.
• Wage earners remain lower vs. pre-AFC level as Self employed still dominant.

Employment by sector and education
• Agriculture remains dominant, followed by services and manufacturing industry.
• Higher among male and less educated groups.
Workers by Education Level, 1993-2009 (%)
Employment Rates by Sector, 1993-2009 (%)
Source: Calculated from Sakernas
Source: Calculated from Sakernas
-
10.0
20.0
30.0
40.0
50.0
60.0
1993
1994
1995
1996
1997
1998
1999
2000
2001
2002
2003
2004
2005
2006
2007
2008
2009
Perc
ent
Agriculture Manufacture Services
0.0
5.0
10.0
15.0
20.0
25.0
30.0
35.0
40.0
45.0
19
93
19
94
19
96
19
97
19
98
19
99
20
00
20
01
20
02
20
03
20
04
20
05
20
06
20
07
20
08
20
09
Pe
rce
nt
Less than primary school Primary school Junior secondary Senior secondary Tertiary

Underemployment
• Underemployment is massive.
• Mostly in rural and among woman.
• Rural-urban gap remains the same, while women-men gap narrows due to declining underemployment among women.
Underemployment Rates by Residence, 1993-2010 (%)
Underemployment Rates by Working Hours, 1993-2009 (%)
Source: Calculated from Sakernas
Source: Calculated from Sakernas
0
10
20
30
40
50
60
19
93
19
94
19
96
19
97
19
98
19
99
20
00
20
01
20
02
20
03
20
04
20
05
20
06
20
07
20
08
20
09
Pe
rce
nt
Less than 35 hours Less than 40 hours
0
10
20
30
40
50
60
19
93
19
94
19
96
19
97
19
98
19
99
20
00
20
01
20
02
20
03
20
04
20
05
20
06
20
07
20
08
20
09
Pe
rce
nt
Urban Rural Total

Employment rate in formal and informal
and by sector
Formal Informal
-
10.0
20.0
30.0
40.0
50.0
60.0
70.0
80.0
90.0
19
96
19
97
19
98
19
99
20
00
20
01
20
02
20
03
20
04
20
05
20
06
20
07
20
08
20
09
AFC GFC
Per
cen
t
Agriculture Manufacture
Services Total
-
10.0
20.0
30.0
40.0
50.0
60.0
70.0
80.0
90.0
100.0
19
96
19
97
19
98
19
99
20
00
20
01
20
02
20
03
20
04
20
05
20
06
20
07
20
08
20
09
AFC GFC
Per
cen
t
Agriculture Manufacture
Services Total
Source: Staff estimates using data from BPS (various years), SAKERNAS.
Informal Employment • Relatively widespread and
tends to increase.
• Higher in rural and among women.
• Gender gap narrowing but not between rural and urban.
Informal Employment by Residence, 1993-2009 (%)
Formal and Informal Employment Rates, 1993-2009 (%)
Source: Calculated from Sakernas
Source: Calculated from Sakernas
0
10
20
30
40
50
60
70
19
93
19
94
19
95
19
96
19
97
19
98
19
99
20
00
20
01
20
02
20
03
20
04
20
05
20
06
20
07
20
08
20
09
Pe
rce
nt
Informal Formal
-
10.0
20.0
30.0
40.0
50.0
60.0
70.0
80.0
90.0
19
93
19
94
19
95
19
96
19
97
19
98
19
99
20
00
20
01
20
02
20
03
20
04
20
05
20
06
20
07
20
08
20
09
Pe
rce
nt
Urban Rural Total
0
10
20
30
40
50
60
70
80
19
93
19
94
19
95
19
96
19
97
19
98
19
99
20
00
20
01
20
02
20
03
20
04
20
05
20
06
20
07
20
08
20
09
Pe
rce
nt
Male Female Total
Informal Employment by Gender, 1993-2009 (%)

Wage: Nominal and Real
• Real Wage is stagnant.
• Women earn less and the gender gap remains.
• Service sector is the highest, followed by industry and agriculture sectors.
Real Monthly Wage by Gender, 1993-2009 (000Rp)
Nominal and Real Wages, 1993-2009 (%)
Source: Calculated from Sakernas. Note: for employee only.
Source: Calculated from Sakernas
0
200
400
600
800
1000
1200
1400
19
93
19
94
19
95
19
96
19
97
19
98
19
99
20
00
20
01
20
02
20
03
20
04
20
05
20
06
20
07
20
08
20
09
('0
00
Rp
)
Nominal wages Real wages
0
50
100
150
200
250
300
350
19
93
19
94
19
95
19
96
19
97
19
98
19
99
20
00
20
01
20
02
20
03
20
04
20
05
20
06
20
07
20
08
20
09
('0
00
Rp
)
Male Female Total
0
50
100
150
200
250
300
350
1993
1994
1995
1996
1997
1998
1999
2000
2001
2002
2003
2004
2005
2006
2007
2008
2009
('000
Rp)
Agriculture Manufacture Services Total
Real Monthly Wage by Sector, 1993-2009 (000Rp)

Monthly wage of employee by sector
(000)
Nominal wage rate
-
50
100
150
200
250
300
350
19
96
19
97
19
98
19
99
20
00
20
01
20
02
20
03
20
04
20
05
20
06
20
07
20
08
20
09
AFC GFC
'00
0
Agriculture Manufacture
Services Total
Real wage rate (CPI deflator)
-
200
400
600
800
1,000
1,200
1,400
1,600
19
96
19
97
19
98
19
99
20
00
20
01
20
02
20
03
20
04
20
05
20
06
20
07
20
08
20
09
AFC GFC
'00
0
Agriculture Manufacture
Services Total
Source: Staff estimates using data from BPS (various years), SAKERNAS.

Merchandise trade (% of GDP)
0
50
100
150
200
250
2000 2001 2002 2003 2004 2005 2006 2007 2008 2009 2010 2011
Mer
chan
dis
e tr
ade
(% o
f g
dp
)
Brunei Darussalam Cambodia Indonesia
Lao PDR Malaysia Philippines
Source: ADB Key Indicators 2012
•Low trade-led growth •Relatively flat, lack of a big improvement

VOLUME INDEX (2000=100)
Export Import
0
50
100
150
200
250
300
350
2001 2002 2003 2004 2005 2006 2007 2008 2009 2010
Brunei Darussalam Cambodia
Indonesia Lao PDR
Malaysia Myanmar
0
50
100
150
200
250
300
350
2001 2002 2003 2004 2005 2006 2007 2008 2009 2010
Brunei Darussalam Cambodia Indonesia Lao PDR Malaysia Myanmar Philippines Thailand
Source: World Development Indicator Online
•Exports: relatively flat •Imports: tend to increase but small

Tariff rates
Tariff rate, applied, simple mean (%)
0
1
2
3
4
5
6
7
8
9
2000 2001 2002 2003 2004 2005 2006 2007 2009 2010
Sim
ple
mea
n,
%
all products
manufactured products
primary products
Source: World Development Indicator Online
• Already low and decreasing
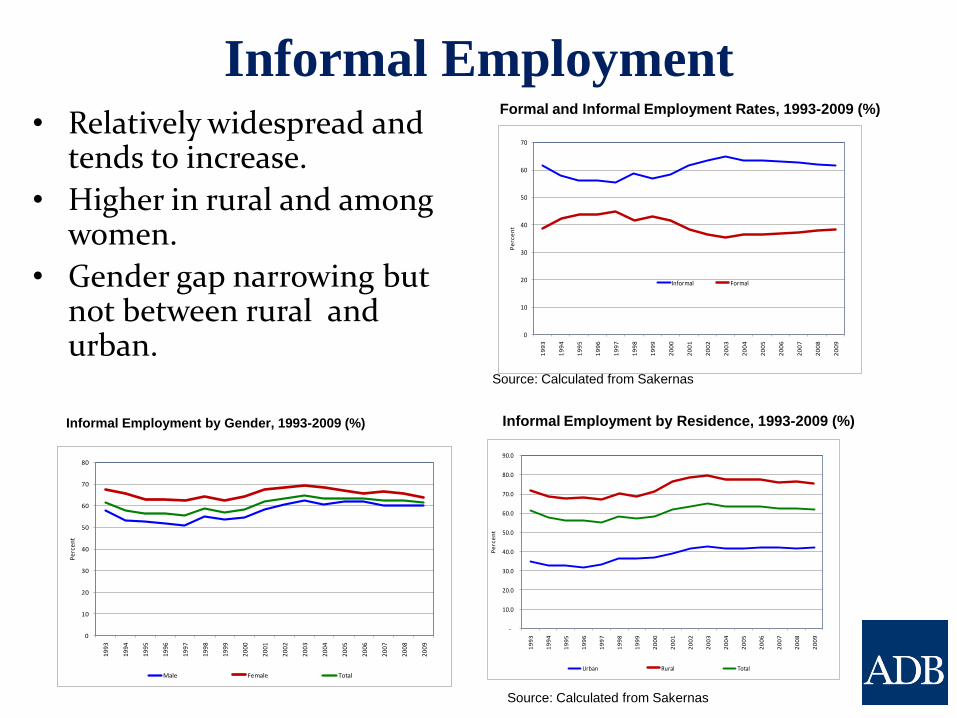
Japan 16.57 China, People's Rep. of 11.27 United States 8.11 Singapore 9.06 Korea, Rep. of 8.05 India 6.55 Malaysia 5.40 Australia 2.74 Thailand 2.90 Netherlands 2.52
Exports
Indonesia: Destination of merchandise goods, 2011
Source: Key Indicators for Asia and the Pacific 2012
•Limited destinations •Traditional markets or trading partners

Singapore 14.63 China, People's Rep. of 14.77 Japan 10.95 Malaysia 5.86 United States 6.11 Korea, Rep. of 7.33 Thailand 5.86 Saudi Arabia 3.06 Australia 2.92 India 2.44
Imports
Indonesia: Origin of Imports, 2011
Source: Key Indicators for Asia and the Pacific 2012
•Limited sources •Traditional trading partners

Production trade networks: importance of
global supply chains
Source: Ferrarini (2011)
All industries
•Not at the inner circle of GTN •Relatively weak trade connections
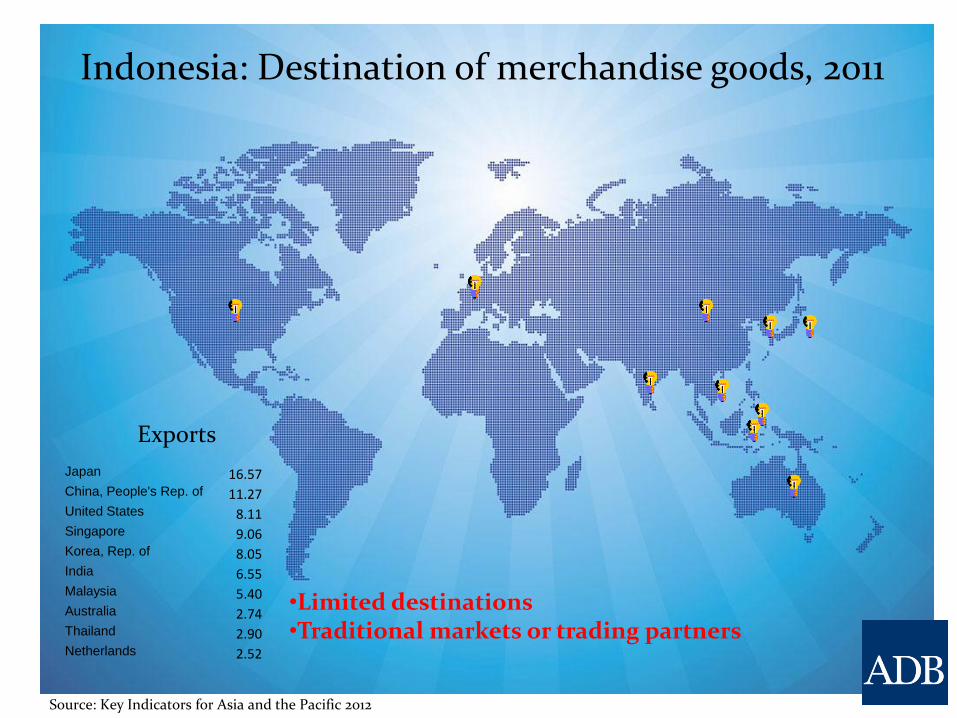
Automotives industry
Source: Ferrarini (2011)
•Part of auto GTN but weak link to JPN •Worse than THA

Electronics industry
Source: Ferrarini (2011)
•At the periphery with weak link to GTN •Worse than SIN, THA, MAL, and PHI

Export Sophistication (EXPY) Average 2001-2007
0 5,000 10,000 15,000 20,000 25,000
Lebanon
India
Romania
Bulgaria
Turkey
South Africa
Uruguay
Angola
Yemen
Azerbaijan
Brazil
Ukraine
Iran
Russia
Egypt
Venezuela
Libya
Lithuania
Latvia
Indonesia
Nigeria
Costa Rica
Thailand
China
Belarus
Poland
Algeria
Philippines
Mexico
Malaysia
Panel A: Non-high income countries
0 5,000 10,000 15,000 20,000 25,000
Saudi Arabia
Israel
Kuwait
UAE
Hong Kong
Portugal
Oman
New Zealand
Slovakia
Italy
Canada
Spain
Netherlands
Belgium
Slovenia
Czech Rep.
France
Rep. of Korea
Austria
Hungary
UK
Denmark
USA
Singapore
Sweden
Germany
Japan
Finland
Switzerland
Ireland
Panel B: High income countries
EXPY (2005 PPP $), 2001-2007 AverageSource: J. Felipe, et.al. 2011
•Less sophisticated •Improve sophistication
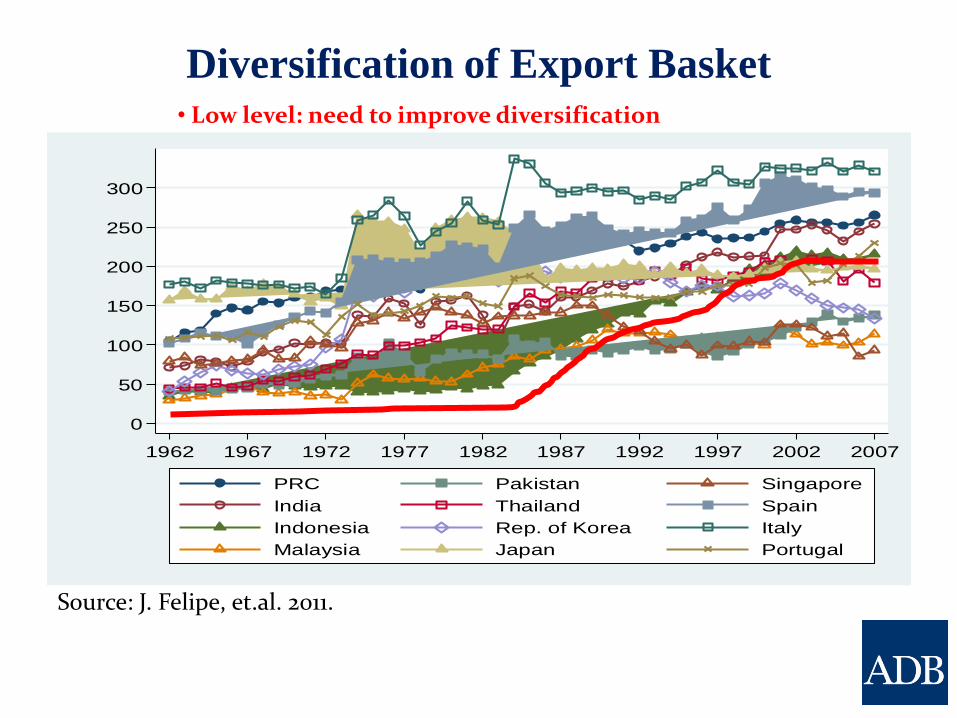
Diversification of Export Basket
Source: J. Felipe, et.al. 2011.
0
50
100
150
200
250
300
Div
ersi
ficat
ion
1962 1967 1972 1977 1982 1987 1992 1997 2002 2007
PRC
India
Indonesia
Malaysia
Pakistan
Thailand
Rep. of Korea
Japan
Singapore
Spain
Italy
Portugal
• Low level: need to improve diversification
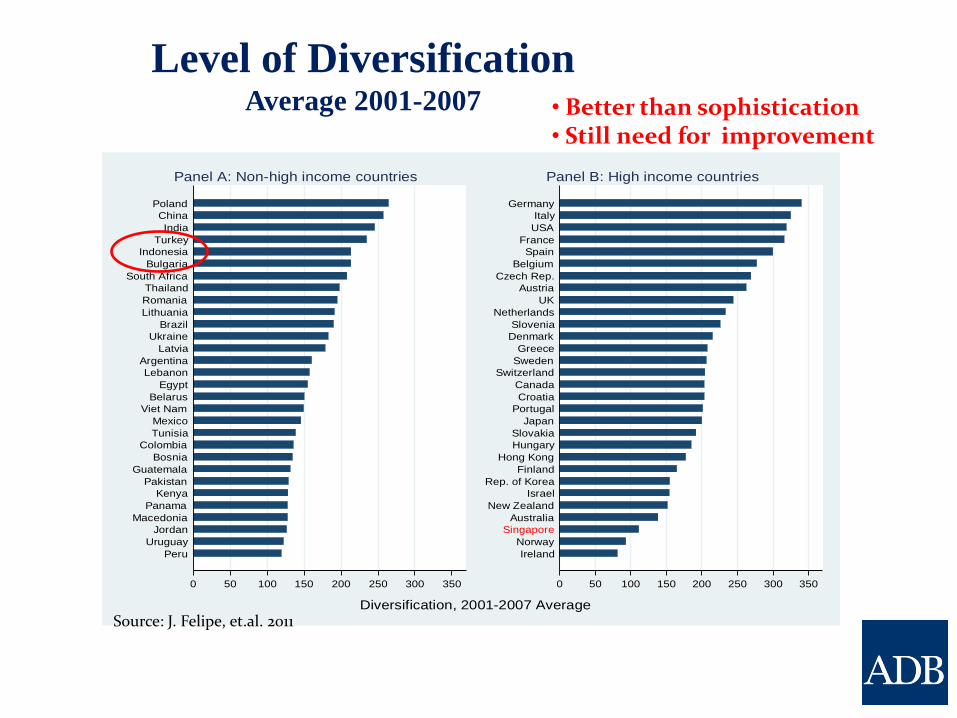
Level of Diversification Average 2001-2007
0 50 100 150 200 250 300 350
Peru
Uruguay
Jordan
Macedonia
Panama
Kenya
Pakistan
Guatemala
Bosnia
Colombia
Tunisia
Mexico
Viet Nam
Belarus
Egypt
Lebanon
Argentina
Latvia
Ukraine
Brazil
Lithuania
Romania
Thailand
South Africa
Bulgaria
Indonesia
Turkey
India
China
Poland
Panel A: Non-high income countries
0 50 100 150 200 250 300 350
Ireland
Norway
Singapore
Australia
New Zealand
Israel
Rep. of Korea
Finland
Hong Kong
Hungary
Slovakia
Japan
Portugal
Croatia
Canada
Switzerland
Sweden
Greece
Denmark
Slovenia
Netherlands
UK
Austria
Czech Rep.
Belgium
Spain
France
USA
Italy
Germany
Panel B: High income countries
Diversification, 2001-2007 Average
Source: J. Felipe, et.al. 2011
• Better than sophistication • Still need for improvement

Ease of doing business index
(1=most business-friendly)
0
20
40
60
80
100
120
140
160
180
Malaysia Thailand Brunei Darussalam Vietnam Indonesia Cambodia Philippines Lao PDR
2011 2012
Source: World Development Indicator Online
• Worse than comparable countries • Getting worse • Need some improvements

Lead time to trade, median (days)
Exports
0
1
2
3
4
5
6
7
Nu
mb
er o
f d
ays
2007 2010
Imports
0
1
2
3
4
5
6
7
8
9
Nu
mb
er o
f d
ays
2007 2010
Source: World Development Indicator Online
• Exports: Relatively good and improving • Imports: Worsening and need more improvement

Logistics performance index (1=low to 5=high)
0
0.5
1
1.5
2
2.5
3
3.5
4
Cambodia Indonesia Lao PDR Malaysia Myanmar Philippines Thailand Vietnam
Ind
ex (
1-lo
w t
o 5
-hig
h)
2007 2012
Source: World Development Indicator Online
• Declining LP •Lower than THAI and MAL

Logistics performance index (1=low to 5=high)
Ability to track and trace consignments
Competence and quality of logistics services
0
0.5
1
1.5
2
2.5
3
3.5
4
Cam
bo
dia
Ind
on
esia
Lao
PD
R
Mal
aysi
a
Mya
nm
ar
Ph
ilip
pin
es
Th
aila
nd
Vie
tnam
Ind
ex (
1-lo
w t
o 5
-hig
h)
2007 2012
0
0.5
1
1.5
2
2.5
3
3.5
4
Cam
bo
dia
Ind
on
esia
Lao
PD
R
Mal
aysi
a
Mya
nm
ar
Ph
ilip
pin
es
Th
aila
nd
Vie
tnam
Ind
ex (
1-lo
w t
o 5
-hig
h)
2007 2012
Source: World Development Indicator Online
• Declining: need to improve the system and service performances

Logistics performance index (1=low to 5=high)
Ease of arranging competitively priced shipments
Efficiency of customs clearance process
0
0.5
1
1.5
2
2.5
3
3.5
4
Cam
bo
dia
Ind
on
esia
Lao
PD
R
Mal
aysi
a
Mya
nm
ar
Ph
ilip
pin
es
Th
aila
nd
Vie
tnam
Ind
ex (
1-lo
w t
o 5
-hig
h)
2007 2012
0
0.5
1
1.5
2
2.5
3
3.5
4
Cam
bo
dia
Ind
on
esia
Lao
PD
R
Mal
aysi
a
Mya
nm
ar
Ph
ilip
pin
es
Th
aila
nd
Vie
tnam
Ind
ex (
1-lo
w t
o 5
-hig
h)
2007 2012
Source: World Development Indicator Online
• Declining: need to improve the system and service performances

Key Government Policies: Minimum Wage
• Key Problems: 1. Increasing significantly
regardless of other factors, i.e. higher than Average and Median Wages.
2. Arbitrary across different districts: adverse effects of decentralization worsening the matter.
3. Increasing non-compliance to MW especially after 2003.
4. Not an effective tool for social protection and poverty reduction, creating adverse effects.
5. Need to find a better way to determine MW to keep it relevant and competitive.
0.0
10.0
20.0
30.0
40.0
50.0
60.0
70.0
80.019
93
1994
1995
1996
1997
1998
1999
2000
2001
2002
2003
2004
2005
2006
2007
2008
2009
Agriculture Industry Services
Ratio of Minimum wage to median and average wage 1993 – 2009 (%)
Non-compliance to minimum wage by sector,1993-2009 (%)

Severance Pay
• Key Problems: 1. Firing is the most expensive.
2. Firms response by changing the labor contracts: • output based or other more flexible
arrangements.
3. Low enforcement .
4. High non-compliance.
5. Ineffective and creating adverse effects.
Receipt of Severance Pay, as reported by terminated workers
Source: Alatas and Newhouse (2010, p. 15)

Reality of the Policies
• Minimum Wage
• Severance Pay
Result: A cross-country survey
comparing labor regulation rigidity, Indonesia ranked 157 out of 181 countries. Compared with its neighbors in the East Asia and Pacific, Indonesia ranked 23 out of 24 countries with no other country in the region has firing costs as expensive as Indonesia (WB 2011).
Adverse Impacts
• Adverse effects of inconsistent rigid labor market regulations:
1. Driving away new investments (good firms), which are more likely to generate good jobs.
2. Encouraging existing (and new firms) to hire workers in short and less-permanent terms.
3. Creating more uncertainties, worsening governance (corruption) issue and investment climate.
4. Discouraging existing firms to expand and improve the quality of working relationship.
5. Lowering potential growth.

Concluding Remarks 1. The economy: needs to grow faster and generate more good
jobs to cater the growing number of labor force and to improve the overall quality of employment.
2. Trade : second generation of reforms
3. Employment: – As LM is very fragmented, improving the quality of employment must include
addressing informality and underutilization issues, in addition to gender, urbanity etc.
– Labor Market: workers always bear the costs of any economic downturns and the existing growth does not guarantee for quality employments. Therefore, a separate policy intervention is needed to improve LM and the quality of employment.
– Moreover, workers and self employed are trapped in “lose-lose situation” and reforming LM only will not solve the problem. A more comprehensive reform is needed including improving the investment climate and revamping the industrial policy to strengthen the performance of industry sector.

Thank You!

Additional Slides: LM Policies
• Increasing labor productivity: higher labor productivity leads to increased employment and higher wages that would be beneficial to workers.
• Improving industrial relation: unions and collective bargaining to maximize aggregate utility.
• Improving labor quality at entry, including improving quality of education and training and reducing education and skill mismatch to improve skill and competitiveness of workers.
• Improve regulations and increase the role of public employment services to get a better labor market outcome.

Social Protection and Programs
• Social protection to formal sector only will miss target. Need to move to a combination of different social insurances.
• Developing informal and formal social system such as unemployment benefits, better public services, and microfinance.
• Three cluster systems of social programs: Social assistance and protection, Community empowerment, and Micro and small enterprise development.