Embed Size (px)
Citation preview

Toward improved corrections for radiation-induced biasesin radiosonde temperature observations
Bomin Sun,1 Anthony Reale,2 Steven Schroeder,3 Dian J. Seidel,4 and Bradley Ballish5
Received 24 October 2012; revised 22 March 2013; accepted 26 March 2013; published 28 May 2013.
[1] Radiation-induced biases in global operational radiosonde temperature data fromMay 2008 to August 2011 are examined by using spatially and temporally collocatedConstellation Observing System for Meteorology, Ionosphere, and Climate (COSMIC)data as estimates of the truth. The data on average from most radiosonde types show anighttime cold bias and a daytime warm bias relative to COSMIC. Most daytime biasesincrease with altitude and solar elevation angle (SEA). The global average biases in the15–70 hPa layer are �0.05� 1.89K standard deviation (~52,000 profiles) at night and0.39� 1.80K standard deviation (~64,500 profiles) in daytime (SEA> 7.5�). Daytimewarm biases associated with clouds are smaller than those under clear conditions. Newersondes (post-2000) have smaller biases and appear to be less sensitive to effects of clouds.Biases at night show greater seasonal and zonal variations than those for daytime. Ingeneral, warm night biases are associated with warm climate regimes and less warm or coldnight biases with cold climate regimes. Bias characteristics for 13 major radiosonde typesare provided, as a basis for updating radiosonde corrections used in numerical weatherpredictions, for validating satellite retrievals, and for adjusting archived radiosonde data tocreate consistent climate records.
Citation: Sun, B., A. Reale, S. Schroeder, D. J. Seidel, and B. Ballish (2013), Toward improved corrections for radiation-induced biases in radiosonde temperature observations, J. Geophys. Res. Atmos., 118, 4231–4243, doi:10.1002/jgrd.50369.
1. Introduction
[2] Upper air temperature, pressure, humidity, and windobservations have been made by balloon-borne radiosondeinstruments for over 7 decades and have had importantapplications in weather prediction, upper air climateresearch, and satellite data calibration and validation.However, measurement biases undermine their value in allof these applications, and various approaches have beentaken to correct them [e.g., Teweles and Finger, 1960;Tarbell and Tower, 1980; Uddstrom, 1984; McMillin et al.,1988, 1992; Luers and Eskridge, 1995, 1998; Lanzanteet al., 2003; Free et al., 2004; Haimberger et al., 2008;Sherwood et al., 2008; Christy and Norris, 2009; Thorneet al., 2011]. Here we present an analysis of temperaturebiases in radiosonde observations (RAOBs), with
the intention of facilitating improvements in correctiontechniques.[3] Radiosonde temperature biases, where the sensor
temperature differs from the air temperature, are mainlycaused by radiative effects (typically a warm daytime biasfrom sunlight heating the sensor and a cold bias at night asthe sensor emits longwave radiation) with smaller errorsdue to lags in sensor response to changing temperaturesas the radiosonde rises. All factors affecting longwaveand shortwave fluxes around the sensor influence the bias,including sensor physical characteristics and mounting, andenvironmental factors including surface temperature, solarelevation angle (SEA), temperature lapse rate, ventilationvelocity, and clouds [e.g., McMillin et al., 1992; Luers andEskridge, 1995, 1998; Bower and Fitzgibbon, 2003, 2004;Mattioli et al., 2007].[4] Most soundings transmitted through the Global
Telecommunication System (GTS), and used in this study,contain radiation corrections applied at each site to attemptto compensate for the biases, based on algorithms providedby radiosonde manufacturers or national meteorologicalagencies. Because the algorithms were derived using limiteddata and most adjustments are a function of only a fewfactors (generally pressure level, SEA, and balloon ascentspeed), corrections might be too small or large, so biasesremain even in “corrected” temperature measurements [e.g.,Gaffen, 1994; Sherwood et al., 2005; Randel and Wu,2006; Haimberger et al., 2008]. Most forecast centers,including NOAA’s National Centers for Environmental
1I. M. Systems Group, Inc. at NOAA Center for Satellite Applicationsand Research, College Park, Maryland, USA.
2NOAA Center for Satellite Applications and Research, College Park,Maryland, USA.
3Department of Atmospheric Sciences, Texas A&M University, CollegeStation, Texas, USA.
4NOAA Air Resources Laboratory, College Park, Maryland, USA.5NOAA NCEP Environmental Modeling Center, College Park,
Maryland, USA.
Corresponding author: B. Sun, IMSG at NOAA Center for SatelliteApplications and Research, NCWCP, 5830 University Research Court,Office #2825, College Park, MD 20740, USA. ([email protected])
©2013. American Geophysical Union. All Rights Reserved.2169-897X/13/10.1002/jgrd.50369
4231
JOURNAL OF GEOPHYSICAL RESEARCH: ATMOSPHERES, VOL. 118, 4231–4243, doi:10.1002/jgrd.50369, 2013

Prediction (NCEP), develop and apply additional correctionsfor each radiosonde type to compensate for remaining biaseswhen ingesting GTS soundings into forecast models.This study does not use sounding data incorporating NCEPcorrections, but a major goal is to better quantify radiosondebiases to develop future improved corrections.[5] Using the phase delay of radio waves transmitted by
Global Positioning System (GPS) satellites as they passthrough the Earth’s atmosphere, high-resolution verticalprofiles of the atmospheric structure can be derived in allweather conditions [Kursinski et al., 1997; Hajj et al.,2002]. Dry temperature (Td) is one of the variables derivedfrom GPS radio occultation (RO) measurements, and itsaverage accuracy is < 0.1K where water vapor is negligible[Hajj et al., 2004]. By intercomparing GPSRO products of2002–2008 from five data processing centers, Ho et al.[2012] found out that four Td data products are consistentwithin ~ 0.1K relative to the mean in the 8–30 km layer.The high accuracy of GPSRO Td has been shown to be ofvalue in assessing the quality of temperature measurementsof other observing systems by several previous studies[Kuo et al., 2005; Ho et al., 2007; He et al., 2009].[6] This study employs over 3 years (May 2008 to August
2011) of GPSRO data as a reference to assess and quantifytemperature biases for the global operational radiosondenetwork. While Kuo et al. [2005] and He et al. [2009]analyzed the temperature biases at the upper troposphere andlower stratosphere (UTLS) in three to four sonde types, thiswork evaluates the biases for 13 different sonde types, whichaccount for 92% of global reports. The RO data used in thisstudy are from the University Corporation for AtmosphericResearch (UCAR) Constellation Observing System forMeteorology, Ionosphere, and Climate (COSMIC) [Antheset al., 2008]. In section 2, we describe the basic characteristicsof radiosonde and collocated COSMIC data. Using COSMICas a reference, section 3 presents the RAOB-minus-COSMICtemperature differences at different SEAs, for both individualsonde types and the global radiosonde network, and the zonaland seasonal variations and radiative impact of cloudsare also evaluated for the global data. Section 4 presentsradiosonde radiation error impact in numerical weatherprediction (NWP) data assimilation, and section 5 is devotedto conclusions and discussion.
2. Data
[7] Radiosonde and collocated COSMIC data are collectedwith the NOAA Products Validation System (NPROVS)operated at the NOAA/National Environmental Satellite,Data, and Information Service (NESDIS) Center for SatelliteApplications and Research [Reale et al., 2012]. NPROVSprovides a centralized, integrated near-real-time monitoringand validation function for intercomparing satellite-derivedtemperature and water vapor sounding products againstcollocated global radiosonde and dropsonde observationsand NWP products.[8] The NPROVS collocation approach considers the
spatial and temporal aspects of each satellite platformto ensure consistent and robust selection of a single“closest” sounding from each satellite product that lieswithin 6 h and 250 km of a given RAOB [Sun et al.,2010; Reale et al., 2012]. NPROVS began routine
collocations of global RAOBs with satellite soundingproducts in 2008, and data from May 2008 to August2011 are used in the analysis.
2.1. Radiosonde Data
[9] RAOBs in NPROVS collocations are those assimilatedoperationally by NOAA’s NCEP (http://www.emc.ncep.noaa.gov/mmb/data_processing/prepbufr.doc/document.htm). In addition to the mandatory and significant level reportdata for temperature, dew point temperature, and wind,quality control (QC) markers of these variables determinedduring the gross error check of the NCEP Global ForecastSystem (GFS) 6 h forecast data assimilation [Collins,2001a, 2001b] and ancillary information, such as balloondrift and collocated NWP data, are included for each RAOB.These RAOBs are then treated as the “anchor” for compilingNPROVS collocated satellite observations. Note that whilethis study considers the NCEP quality control results, it usesGTS soundings, which include site radiation corrections butnot NCEP corrections.[10] We rejected observations rejected by the NCEP
assimilation system or having temperature difference15K from the NCEP background, as well as those with avertical extent< 5 km or a vertical gap ≥ 4 km, totaling~3% of the observations. About 187,000 soundings from721 land stations and 27 ships were used. Approximately68% are from Northern Hemisphere midlatitude land areas.[11] Radiosonde instrument types, their radiation correc-
tions, and their tracking codes are identified in the “31313group” of the RAOB report in over 80% of worldwidesoundings since the late 1990s. Sounding stations in China,most stations in India, and a few stations in other locationsdo not report the 31313 group or started reporting after2008. Figure 1 shows the spatial distribution of majorradiosonde types, and Table 1 summarizes their characteristics.Vaisala RS92 (red circles) is the most widely used in thisperiod. Many countries use their own sonde types: Sippicanin the U.S., MRZ in Russia, Shang-E in China, and IMD inIndia. Although all sensors have lag errors, few operationalradiosonde types apply lag corrections, and the World Mete-orological Organization (WMO) does not define any variableto report if a lag correction is applied.[12] For most sonde types, corrections for radiation error
were applied at the site before the data were transmitted.Some are only solar radiation corrections, while others aresolar and infrared radiation corrections. Sippican-B2 (VIZ-B2 until December 1997) is an exception; no correctionsare applied at sites.[13] The 31313 group does not identify a changed correc-
tion at a station if the new and old corrections have the sametype (such as automatic solar correction). For example, sincetheir introduction in 1981 and 2003, respectively, there havebeen several versions of the corrections to Vaisala RS80 andRS92 (see section 3.2), and the dates of implementationcan vary from station to station. This analysis uses datafor 2008–2011 and therefore reflects whatever correctionalgorithms were in place during that period.
2.2. COSMIC Data
[14] The COSMIC data used in this study are from theUniversity Corporation for Atmospheric Research (UCAR)COSMIC Data Analysis and Archive Center (http://www.
SUN ET AL.: CORRECTION FOR RADIOSONDE BIASES
4232

cosmic.ucar.edu/cdaac) near-real-time processing, availablewithin a few hours of the measurements, and incorporatedin NPROVS. Postprocessed data products, generated usinga fixed processing algorithm and so more suitable for climatestudies, are also available. Ho et al. [2012] revealedthat UCAR postprocessed Td at 8–30 km is 0.03� 0.43Kdifferent from the mean value averaged from five productscompared. Using 13 days of data available to us, we foundthe differences between UCAR near-real-time andpostprocessed Td averaged from data at global radiosondesites (see Figure 1) are 0.05� 0.61 K (values afterreported throughout the paper are standard deviations)at 15–100 hPa and 0.01� 0.68 K at 15–70 hPa. Thesesmall differences assure us that UCAR near-real-time Tdcan be used as a reference to assess the UTLS biases inradiosonde data.
[15] COSMIC provides wet T (Tw) profiles in addition to Td.COSMIC Tw and water vapor profiles are developed using theCOSMIC bending angle or refractivity measurements inconjunction with one-dimensional variational analysis method(1DVar; see http://cosmic-io.cosmic.ucar.edu/cdaac/doc/doc-uments/1dvar.pdf for details). The near-real-time COSMICretrieval profiles are generated using the NCEP 12h forecastas the first guess, which are retained on the product files.Retrievals of Tw in the upper troposphere and stratosphereare expected to be accurate because the moisture affectingon GPSRO bending angle measurements is small. In the lowand middle troposphere, Tw and water vapor retrievals areinterdependent and strongly dependent on the first guess, butas will be shown in section 3.2, Tw still can be used to detecttropospheric temperature measurement anomalies in somesonde types.
Figure 1. Global distribution of radiosonde stations and ship reports collocated within 6 h and 250 km ofCOSMIC soundings for May 2008 to August 2011. See Table 1 for more information of radiosonde types(denoted with different colors) analyzed.
Table 1. Characteristics of Major Radiosonde Types Used in the Studya
Type ManufacturerCountry ofManufacture
TemperatureSensor
Site RadiationCorrection
BUFR Code(Subtype)
Number ofReports
Percent of GlobalReports
Approximate YearIntroduced
RS80 Vaisala Finland Bead thermocap Solar & IR 061, 067 3965 2.1% 1981RS80-57H Vaisala Finland Bead thermocap Solar & IR 052 3302 1.8% 1998RS90 Vaisala Finland Thin-wire F-
ThermocapSolar & IR 071 4017 2.1% 1995
RS92 Vaisala Finland Thin-wire F-Thermocap
Solar & IR 079, 080, 081 71,503 38.2% 2003
M2K2-DC Modem France Bead or chipthermistor
Solar & IR 057 4882 2.6% 2006
DFM-06 Graw Germany Bead thermistor Solar 017 1887 1.0% 2006RS-01G Meisei Japan Rod thermistor Solar 055 1194 0.6% 2001Sippican-B2 Sippican U.S. Rod thermistor None 051 4938 2.6% 1997SippicanMark IIA
Sippican U.S. Chip thermistor Solar 087 20,958 11.2% 2003
Mark IV IMD India Rod thermistor Solar or none 020 974 0.5% 2003Shang-E three
manufacturersChina Rod thermistor Solar & IR 131, 132, 133 12,409 6.6% 2002
VIZ Mark II Jinyang Korea Rod thermistor Solar 021 719 0.4% 1987MRZ JSC Vektor Russia Rod thermistor Solar 027, 058, 075,
088, 08941,841 22.4% 1986
aNumbers of reports are based on collocations with COSMIC within 3 h and 250 km for May 2008 to August 2011 (see Figure 1).
SUN ET AL.: CORRECTION FOR RADIOSONDE BIASES
4233
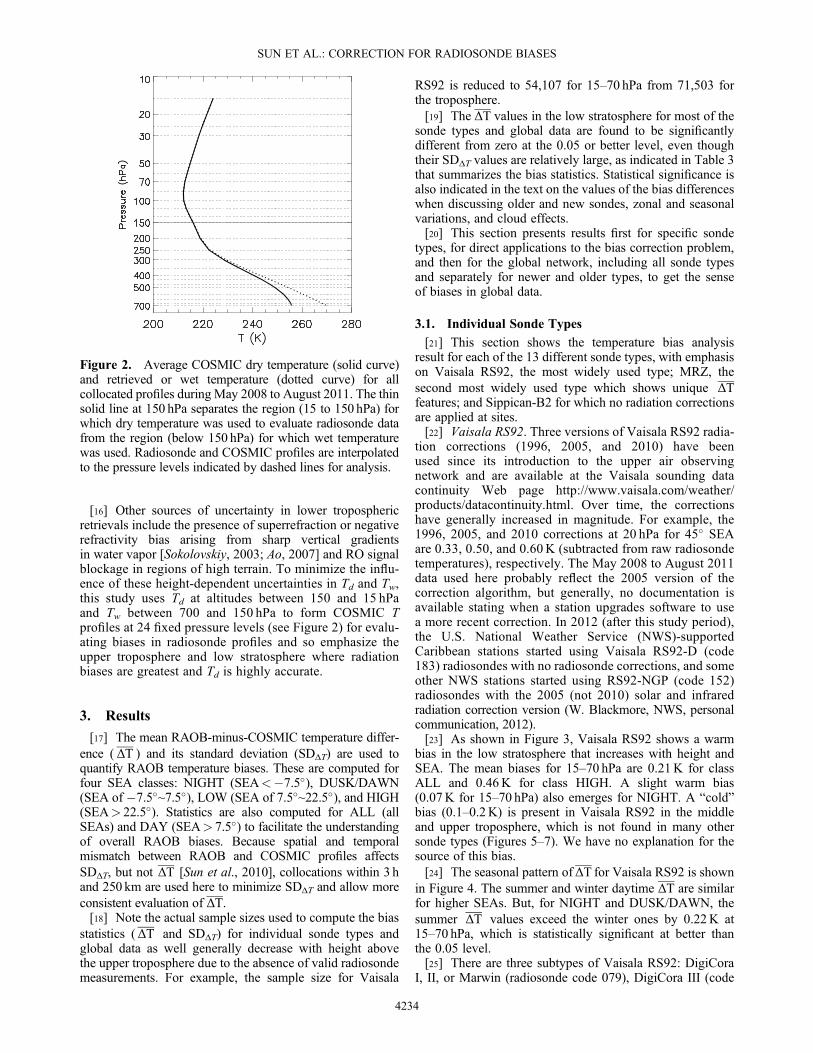
[16] Other sources of uncertainty in lower troposphericretrievals include the presence of superrefraction or negativerefractivity bias arising from sharp vertical gradientsin water vapor [Sokolovskiy, 2003; Ao, 2007] and RO signalblockage in regions of high terrain. To minimize the influ-ence of these height-dependent uncertainties in Td and Tw,this study uses Td at altitudes between 150 and 15 hPaand Tw between 700 and 150 hPa to form COSMIC Tprofiles at 24 fixed pressure levels (see Figure 2) for evalu-ating biases in radiosonde profiles and so emphasize theupper troposphere and low stratosphere where radiationbiases are greatest and Td is highly accurate.
3. Results
[17] The mean RAOB-minus-COSMIC temperature differ-ence ( ΔT ) and its standard deviation (SDΔT) are used toquantify RAOB temperature biases. These are computed forfour SEA classes: NIGHT (SEA<�7.5�), DUSK/DAWN(SEA of �7.5�~7.5�), LOW (SEA of 7.5�~22.5�), and HIGH(SEA> 22.5�). Statistics are also computed for ALL (allSEAs) and DAY (SEA> 7.5�) to facilitate the understandingof overall RAOB biases. Because spatial and temporalmismatch between RAOB and COSMIC profiles affectsSDΔT, but not ΔT [Sun et al., 2010], collocations within 3 hand 250 km are used here to minimize SDΔT and allow moreconsistent evaluation of ΔT.[18] Note the actual sample sizes used to compute the bias
statistics (ΔT and SDΔT) for individual sonde types andglobal data as well generally decrease with height abovethe upper troposphere due to the absence of valid radiosondemeasurements. For example, the sample size for Vaisala
RS92 is reduced to 54,107 for 15–70 hPa from 71,503 forthe troposphere.[19] The ΔT values in the low stratosphere for most of the
sonde types and global data are found to be significantlydifferent from zero at the 0.05 or better level, even thoughtheir SDΔT values are relatively large, as indicated in Table 3that summarizes the bias statistics. Statistical significance isalso indicated in the text on the values of the bias differenceswhen discussing older and new sondes, zonal and seasonalvariations, and cloud effects.[20] This section presents results first for specific sonde
types, for direct applications to the bias correction problem,and then for the global network, including all sonde typesand separately for newer and older types, to get the senseof biases in global data.
3.1. Individual Sonde Types
[21] This section shows the temperature bias analysisresult for each of the 13 different sonde types, with emphasison Vaisala RS92, the most widely used type; MRZ, thesecond most widely used type which shows unique ΔTfeatures; and Sippican-B2 for which no radiation correctionsare applied at sites.[22] Vaisala RS92. Three versions of Vaisala RS92 radia-
tion corrections (1996, 2005, and 2010) have beenused since its introduction to the upper air observingnetwork and are available at the Vaisala sounding datacontinuity Web page http://www.vaisala.com/weather/products/datacontinuity.html. Over time, the correctionshave generally increased in magnitude. For example, the1996, 2005, and 2010 corrections at 20 hPa for 45� SEAare 0.33, 0.50, and 0.60K (subtracted from raw radiosondetemperatures), respectively. The May 2008 to August 2011data used here probably reflect the 2005 version of thecorrection algorithm, but generally, no documentation isavailable stating when a station upgrades software to usea more recent correction. In 2012 (after this study period),the U.S. National Weather Service (NWS)-supportedCaribbean stations started using Vaisala RS92-D (code183) radiosondes with no radiosonde corrections, and someother NWS stations started using RS92-NGP (code 152)radiosondes with the 2005 (not 2010) solar and infraredradiation correction version (W. Blackmore, NWS, personalcommunication, 2012).[23] As shown in Figure 3, Vaisala RS92 shows a warm
bias in the low stratosphere that increases with height andSEA. The mean biases for 15–70 hPa are 0.21K for classALL and 0.46K for class HIGH. A slight warm bias(0.07K for 15–70 hPa) also emerges for NIGHT. A “cold”bias (0.1–0.2K) is present in Vaisala RS92 in the middleand upper troposphere, which is not found in many othersonde types (Figures 5–7). We have no explanation for thesource of this bias.[24] The seasonal pattern ofΔT for Vaisala RS92 is shown
in Figure 4. The summer and winter daytime ΔT are similarfor higher SEAs. But, for NIGHT and DUSK/DAWN, thesummer ΔT values exceed the winter ones by 0.22K at15–70 hPa, which is statistically significant at better thanthe 0.05 level.[25] There are three subtypes of Vaisala RS92: DigiCora
I, II, or Marwin (radiosonde code 079), DigiCora III (code
Figure 2. Average COSMIC dry temperature (solid curve)and retrieved or wet temperature (dotted curve) for allcollocated profiles during May 2008 to August 2011. The thinsolid line at 150 hPa separates the region (15 to 150 hPa) forwhich dry temperature was used to evaluate radiosonde datafrom the region (below 150 hPa) for which wet temperaturewas used. Radiosonde and COSMIC profiles are interpolatedto the pressure levels indicated by dashed lines for analysis.
SUN ET AL.: CORRECTION FOR RADIOSONDE BIASES
4234

080), and Autosonde (code 081). These codes refer todifferent ground stations, not different radiosondes, andthese subtypes use the same radiation corrections, but thespecific correction version used at each station is rarelydocumented. As expected, the biases are similar for all threetypes for daytime SEA classes (not shown). But, for NIGHT,ΔT for DigiCora I, II, or Marwin is 0.26K, while it isonly 0.04K and 0.08K for DigiCora III and Autosonde,respectively. All three types are used widely, but DigiCoraI, II, or Marwin tends to be more widely used in lowlatitudes or regions of warmer climates, indicating again
a warmer nighttime ΔT is associated with a warmerclimate regime.[26] Older white-painted rod thermistors have significant
infrared cooling at night [Luers and Eskridge, 1995].The Vaisala RS92 temperature sensor (F-Thermocap, alsoused in Vaisala RS90 [Miloshevich et al., 2006]), a verythin silver-coated wire, is expected to be insensitive to envi-ronmental temperature changes if other radiative parametersremain the same, such as SEA and cloud cover.[27] In a warm climate, temperature typically rises faster
with altitude in the stratosphere than in a cold climate. Ifsensor time lag error is a possible explanation for theseasonal or regional bias variations, it, if present, shouldcause the bias to be more negative in the warm climate,which is opposite to what we noticed in the data. Further-more, Luers [1997] pointed out the time lag error for theF-Thermocap sensor is insignificant due to the small sizeof this sensor plus its low emissivity of the aluminumcoating. In summary, it remains unclear why the VaisalaRS92 nighttime ΔT varies with climate regimes.[28] MRZ. The Russian Federation upper air network
includes ~ 124 stations including 2 stations in Antarctica.They usedMARS (codes 028 and 029, phased out during thisperiod) and MRZ (codes 027, 075, and 088 with differentground stations) sondes, introduced in the mid-1980s.All these models use an MMT-1 rod thermistor and agoldbeater’s skin humidity sensor. MRZ-3A* or MRZ*(previously called BAR), code 058 or 089, is being phasedin and has the same rod thermistor but a different humiditysensor. Here, we use only data from codes 027, 058, 075,088, and 089.[29] As shown in Figure 5, these sondes show a strong
warm bias above 200 hPa for daytime SEAs, with bias largerfor HIGH and LOW than for DUSK/DAWN. Unique amongthe sonde types analyzed in this study, the Russian sondebiases are almost constant with height above 150 hPa. A
Figure 3. Vaisala RS92 RAOB-minus-COSMIC (a) mean temperature difference and (b) its standarddeviation based on its global collocation data for May 2008 to August 2011. The curves in different colorsshow results segregated by solar elevation angle class.
winter-minus-summer
summer
Figure 4. Vaisala RS92 RAOB-minus-COSMIC meantemperature differences for Northern Hemisphere summer(solid curves) and winter-minus-summer differences(dashed curves).
SUN ET AL.: CORRECTION FOR RADIOSONDE BIASES
4235

cold bias at night increases slightly with altitude, reaching~0.15K at 15 hPa.[30] Another unique feature is a strong warm bias in the
middle and upper troposphere. These Russian sondes accountfor ~22% of total global reports and so contribute signifi-cantly to the warm tropospheric bias shown in Figure 10 forthe “older” sondes. Different from Vaisala RS92 and othertypes, the MRZ temperature in the middle and upper tropo-sphere is warmer (by ~0.23K) than GFS forecast with thelatter agreeing with COSMIC within 0.1K, suggesting thatMRZ measurements might be ignored in the NCEP NWPassimilation.[31] Sippican-B2. This sonde was introduced at many U.S.
upper air sites in 1997, but by 2012, only Caribou, Guam,five Alaskan, and eight Caribbean sites used this radiosonde.
The Sippican-B2 thermistor is a long white-coated rod, andit is expected to have a very large infrared error.[32] The Sippican-B2 profiles (Figure 6) reveal nighttime
cold biases and daytime warm biases. The NIGHT biasincreases with altitude, from 0.2K at 700 hPa to 1.7K at15 hPa. Daytime biases are small (< 0.35K) at 15–70 hPafor LOW and DUSK/DAWN; for class HIGH, the bias ismuch larger (1.38K). A strong regional variation is notedfor NIGHT. For example, the 15–150 hPa NIGHT biasfor stations in Alaska reaches �1.48K but is 0.35K fortropical stations.[33] Sippican Mark IIA. The NWS currently uses mainly
Sippican Mark IIA GPS radiosondes (code 087) with a chipthermistor, for which no corrections are applied for infraredeffects [Fitzgibbon and Facundo, 2003]. A systematic cold
Figure 5. Same as Figure 3 except for Russian MRZ.
Figure 6. Same as Figure 3 except for Sippican-B2.
SUN ET AL.: CORRECTION FOR RADIOSONDE BIASES
4236

bias is shown (Figure 7a) for all SEA classes except HIGHin Sippican Mark IIA for the middle troposphere to~100 hPa, which gradually decreases toward the strato-sphere. For class HIGH, a warm bias is found from 50 to15 hPa.[34] Shang-E. In China, starting January 2002, the digital
Shang-E with a rod thermistor and a carbon hygristor wasintroduced into the radiosonde network to replace theShang-M with a bimetal coil temperature sensor and agoldbeater’s skin humidity sensor. Chinese stations startedreporting 31313 instrument codes starting in October 2012,and about 80% of the stations used Shanghai GTS1 withnearly equal numbers of the other stations reporting TaiyuanGTS1-1 and Nanjing GTS1-2, but it is unknown if eachstation used the same variety back to 2008. In this work,we exclude data from seven stations that flew Shang-M(which was identified by persistently higher reported relativehumidity than any of the Shang-E models) during thestudy period and average data only for Shang-E sondes(but not differentiating its different models) to computethe bias statistics.[35] In general, the Chinese sonde bias is < 0.2K except
for HIGH SEA when the warm bias at altitudes above70 hPa exceeds 0.5K (Figure 7b). Note that only 5.6% ofthe total profiles are in the HIGH SEA class.[36] M2K2-DC. The Modem M2K2-DC (code 057) is
widely used in France and French ships, French-speakingcountries in Africa and Oceania, Iran, India, Malaysia, and
a few other countries. There are systematic warm biasesabove the tropopause that increase with heights for all SEAclasses (Figure 7c). The NIGHT warm bias is smaller thanthose of other SEA classes, but overall, the biases do notdistinguish among classes perhaps because the profilesample is not big enough.[37] Meisei RS-01G. Most stations on Japanese islands
have been frequently using Vaisala RS92 starting 2008.Meisei RS-01G sondes (code 055) are used primarilyover western tropical Pacific islands. The sample forthis instrument is only 1194 but distributes relativelyevenly among the SEA classes. As shown in Figure 7d,temperature measurements from this instrument are reason-ably consistent with COSMIC data for altitudes between70 and 150 hPa. But, above 70 hPa, Meisei RS-01G showswarm biases that increase with height for all SEAs. Theinstrument biases found here are similar to those from the2011 Yangjiang radiosonde intercomparison experiment[Nash et al., 2011].[38] Vaisala RS80. This is the sonde type NCEP used as
the reference to develop radiation correction for other sondetypes (http://www.emc.ncep.noaa.gov/mmb/papers/collins/new_tables/new_tables.html) in the late 1990s when theVaisala RS80 was the most widely used advanced sonde.[39] The radiosonde temperature for SEA class ALL (not
shown) matches well with COSMIC data in the tropospherebelow 200 hPa. Warm biases are exhibited starting ~100 hPathat increase with height and SEA (Figure 7e).
Figure 7. Same as Figure 3a except for other sonde types.
SUN ET AL.: CORRECTION FOR RADIOSONDE BIASES
4237

[40] Vaisala RS80-57H. This sonde was the U.S. NWSVaisala RS80 version used starting June 1998 at almost allU.S. stations not using Sippican-B2 but phased out afterDecember 2010. Since 2008, only a few stations in Alaskaand the Pacific and some stations in southern Africa haveused this sonde. Vaisala RS80-57H used standard RS80sensors, but their data processing procedures differedbecause RS80-57H operated with NWS instead of Vaisalaground systems [Redder et al., 2004].[41] The ΔT profiles for different SEAs are intertwined,
but they all show a cold bias that increases with heightstarting at the low troposphere (Figure 7f). It is uncertain ifthe bias is related to the error in the U.S. RS80/RSN93correction software found from WMO intercomparison datanoted by Redder et al. [2004].[42] Graw DFM-06. This sonde (reporting code 017
instead of 018) is mainly used in Germany, NATO militaryunits, Denmark, Turkey, India, and several other countries.Warm biases are shown in Figure 7g starting in the uppertroposphere and increasing with altitude toward the lowstratosphere for both daytime and NIGHT SEAs as well.This feature is somewhat consistent with the results fromthe 2010 Yangjiang intercomparison experiment [Nashet al., 2011] that Graw biases show a positive shift intemperature relative to other radiosonde systems when pass-ing the tropopause and these shifts occur in both day andnight measurements. Similar bias characteristics were alsonoticed in Graw DFM-97 in the WMO radiosonde intercom-parisons conducted at Vacoas, Mauritius, on 7–27 February2005 [Nash et al., 2006].[43] Jinyang. Only three stations in South Korea are
flying Jinyang radiosondes (code 21). While code 21 isassigned to Jinyang VIZ Mark II, the same code is probablyused to indicate Jinyang RSG-20A, the current radiosonde,which was also used in the 2010 Yangjiang intercomparison[Nash et al., 2011]. As displayed in Figure 7h, warm biasesare shown in the data with greater biases at higher SEAclasses.
[44] The bias for this sonde is the greatest among the typesanalyzed. But, it showed a slight cold bias for both night andday compared to other sondes in the Yangjiang radiosondeexperiment [Nash et al., 2011], where a radiation correctionwas implemented. Obviously, that correction workedeffectively to remove radiation biases shown in Figure 7h.[45] Vaisala RS90. This sonde, carrying sensors equivalent
to Vaisala RS92 in terms of calibration accuracy and timeresponse [Miloshevich et al., 2006], has been graduallyphased out, and the sample number for the period studiedis far less than that of Vaisala RS92, but they show similarbiases. The bias pattern plot is not given for this sondein Figure 7.[46] IMD Mark IV. Measurements from most of the Indian
stations flying IMD Mark IV are limited to below 100 hPa.For this analysis, data from only the stations flyingthat sonde were used, and a cold bias of 0.3K is noticedfor NIGHT and DAWN/DUSK between 200 and 300 hPaand a warm bias is then shown for all SEA classes at100–150 hPa (the bias plot for this sonde is not shown inFigure 7). For this sonde, the SDΔT shows a strong increasewith height from the low to the upper troposphere, which isnot seen in other sonde types.
3.2. Global Bias Pattern
[47] Figure 8 shows ΔT and SDΔT computed using all~187,000 global collocations for each SEA class (the actualsample size for 15–70 hPa for global data is ~145,000; seeTable 3). There are small (< 0.1K) nighttime cold biasesthat do not vary with altitude and larger daytime warmbiases that are larger above 200 hPa than below and thatincrease with increasing SEA. The daytime mean bias at15 hPa for SEA> 22.5� reaches 0.77� 2.34K. Note the“global” bias statistics shown in Figure 8 were computedby simply combining sounding data from all sonde typesavailable, not weighted by their area coverage, and the sameis true for other statistics computed from the mixture ofsonde types.
Figure 8. Same as Figure 3 except for global data.
SUN ET AL.: CORRECTION FOR RADIOSONDE BIASES
4238

[48] Although the NIGHT cold bias computed from globaldata is small, it varies with ambient temperature (Figure 9).At the lowest T (< 210K), the bias is positive (warm bias),but for T> 215K, the cold bias increases with increasingT. We find similar features for individual operational sondes,for example, in Russian MRZ and Vaisala RS92, consistentwith radiosonde intercomparison experiments (See docu-ment available at http://www.wmo.int/pages/prog/www/IMOP/meetings/Upper-Air/Systems-Intercomp/DocPlan.
html). Potential explanations for this pattern include the fol-lowing: (1) uncorrected time lag in the stratosphere where Tgenerally increases with height and (2) infrared radiativecooling by high level clouds as discussed in section 3.2.3.3.2.1. Older Versus Newer Sondes[49] To improve upon temperature corrections applied
at stations (or to correct uncorrected data), NCEP appliesadditional radiation corrections (http://www.emc.ncep.noaa.gov/mmb/papers/collins/new_tables/new_tables.html)
50 hPa
30 hPa
Figure 9. Variation of night RAOB-minus-COSMIC mean temperature difference with temperaturebased on global collocation data during May 2008 to October 2011 at 30 hPa and 50 hPa. The vertical linesare one standard deviation difference (K). Except for the leftmost (rightmost) values on the x axis whichare averaged from temperatures less (greater) than the specified values, other temperature values areaveraged in 2.5K bins, based on COSMIC dry temperature.
Older Sondes
Newer Sondes
Figure 10. Same as Figure 3a except for older and newer sonde types.
SUN ET AL.: CORRECTION FOR RADIOSONDE BIASES
4239

that depend on sonde type, height, and SEA. However, theyhave not been updated since around 2000, and NCEPcurrently applies no correction to newer sondes. To evaluatethe potential need to update NCEP’s correction scheme, wecompare the biases of “older” and “newer” sondes, where“older” sondes are defined as ones to which NCEP appliescorrections (including Vaisala RS80, RS80-57H, andRS90; Sippican-B2; and Russian MRZ) while “newer”sondes are those introduced since around 2000 (includingVaisala RS92, Sippican Mark IIA, and Chinese Shang-E).All comparisons use radiosonde data without NCEP correc-tions. The sample sizes are 33,516 soundings from oldersondes and 153,565 newer sondes.[50] Both older and newer sondes show nighttime cold
biases and daytime warm biases, the latter increasing withaltitude and SEA (Figure 10). But, newer sondes havesmaller biases. For example, above 150 hPa, the averageNIGHT biases are �0.05� 1.78K for newer sondes and�0.12� 1.81K for older sondes; at LOW SEA, newer andolder sonde biases are 0.19� 1.76K and 0.47� 1.82K,respectively. The differences in bias between the older andnewer sondes for these two SEA classes are statisticallysignificant at the 0.05 or better level.3.2.2. Latitudinal and Seasonal Variability[51] Collocations south of 10�S are included in global
analyses above but are not numerous enough to be analyzedhere by latitude belts. Table 2a gives ΔT averaged over15–70 hPa in four different zonal bands that span the regionfrom 10�S to 90�N, in each SEA class. All latitudinal bandsshow a warm bias for class ALL, and the bias increases fromhigh to low latitudes. Daytime warm biases increase withSEA, except in tropics, where the ΔT dependence on SEA issmaller than that in other zones and where the bias forclass HIGH is less than that for LOW by (statisticallyinsignificant) 0.11K. For NIGHT, a slight cold bias isfound at middle and high latitudes, which is significantlydifferent from the warm biases of 0.20K and 0.36K insubtropics and tropics, respectively.[52] Table 2b shows ΔT collocations north of 20�N for
each season and SEA class. All seasons show a warm bias
for class ALL, the largest in summer (0.28K) and thesmallest in winter (0.08K). In all seasons, the daytime biasincreases from DUSK/DAWN to LOW and to HIGH SEA.For NIGHT, ΔT is negative (0.06K–0.16K), except insummer which shows a significantly different warm biasof 0.14K.[53] The latitudinal or seasonal dependence of biases,
particularly for NIGHT, for individual sonde types (includ-ing Vaisala RS92 and Sippican-B2; see section 3.1) isqualitatively consistent with what we obtain using the dataof all sonde types listed in Tables 2a and 2b. For NIGHT,the zonal and seasonal analysis suggests a sonde warm biasis associated with warm climate conditions (summer, tropics)and a less warm or cold bias is associated with cold climateconditions. Some old temperature sensors using largewhite-coated rod thermistors absorb longwave energyemitted from the surface or atmosphere [Luers and Eskridge,1995, 1998; McMillin et al., 1992] and so have a warm biasin warm conditions. But, newer sondes, including VaisalaRS92, also have nighttime warm biases, as was discussedin section 3.1, and a ready explanation is not obvious.3.2.3. Cloud Effects[54] Clouds reflect and scatter solar radiation and emit
infrared radiation that can affect the radiative energy balancesurrounding radiosonde sensors. Different cloud types havedifferent radiative impacts. In general, these cloud effectsare not considered in radiation correction schemes foroperational sondes. The exception is the Mark IIA, forwhich reported cloud group is used to correct measurements[Bower and Fitzgibbon, 2004].[55] Cloud information reported at radiosonde sites
includes low or middle level cloud cover, low cloud type,height of low or middle cloud base, and middle and highlevel cloud types. Some sites do not report clouds, includingthose in Finland, Sweden, Iceland, South Korea, Japan,China, Canada, USA (military sites), Mexico, Venezuela,and Australia. We therefore use reports from other coun-tries/regions, which account for ~48% of the global observa-tions, to estimate the effect of cloud presence on radiosonderadiation biases.
Table 2a. RAOB-Minus-COSMIC Mean Differences (K) and Standard Deviations (K) for Different Latitude Bands and Solar ElevationAngles Over 15–70 hPaa
NIGHT DUSK/DAWN LOW HIGH ALL
Tropic (10�S–10�N) 0.36 (2.01, 919) 0.38 (2.05, 843) 0.42 (2.04, 709) 0.31 (2.01, 1055) 0.36 (2.02, 3526)Subtropic (10�N–30�N) 0.20 (1.96, 4561) 0.03 (2.06, 3478) 0.20 (2.04, 2191) 0.68 (1.94, 3023) 0.26 (2.01, 13,253)Midlatitude (30�N–50�N) �0.03 (1.86, 22,857) 0.06 (1.91, 10,256) 0.14 (1.94, 9512) 0.49 (1.80, 14,477) 0.15 (1.88, 57,102)High latitude (> 50�N) �0.20 (1.89, 20,076) 0.15 (1.82, 12,130) 0.34 (1.76, 11,949) 0.45 (1.58, 14,170) 0.15 (1.80, 58,325)
aValues in parentheses are standard deviation and sample size.
Table 2b. Global RAOB-Minus-COSMIC Mean Differences (K) and Standard Deviations (K) for Different Seasons and Solar ElevationAngles Averaged Over 15–70 hPa From Data of Northern Hemisphere North of 20�Na
NIGHT DUSK/DAWN LOW HIGH ALL
Winter �0.11 (2.16, 15,186) 0.10 (2.20, 5865) 0.28 (2.16, 5815) 0.55 (1.97, 3572) 0.08 (2.16, 30,438)Spring �0.16 (1.78, 13,261) 0.05 (1.83, 7206) 0.20 (1.81, 6335) 0.47 (1.75, 10,856) 0.12 (1.81, 37,658)Summer 0.14 (1.70, 9848) 0.13 (1.75, 9036) 0.26 (1.69, 8254) 0.47 (1.66, 15,060) 0.28 (1.70, 42,198)Autumn �0.06 (1.78, 11,739) 0.16 (1.86, 5589) 0.28 (1.86, 5593) 0.51 (1.72, 5774) 0.16 (1.81, 28,695)
aWinter is December-January-February, etc. Values in parentheses are standard deviation and sample size.
SUN ET AL.: CORRECTION FOR RADIOSONDE BIASES
4240

[56] We first examine ΔT for clear and cloudy sky condi-tions. Clear sky is defined as no cloud present at low, middle,and high levels and cloudy as cloud present at least one of thethree levels. Our results (Table 2c) indicate that for nighttime,there are a slight cold bias in cloudy sky conditions anda slight warm bias for clear sky. For daytime, both skycondition categories show a warm bias that increases withaltitude (figure not shown) and with SEA in the upper tropo-sphere and low stratosphere. However, the warm bias islarger in clear skies than for cloudy conditions particularlyfor the HIGH class for which their bias difference is 0.18K,statistically significant at better than the 0.05 level. Thestatistics in Table 2c were computed using data from botholder and newer sondes, as defined in section 3.2.1. We dida similar analysis but for newer sondes, which account for78% of all profiles used in Table 2c. In general, newer sondetypes have lower biases in all cloud categories than those inTable 2c. For example, the ΔT values for 15–70 hPa are0.27� 1.87K and 0.44� 1.73K for the LOW and HIGHclasses, respectively. The climatological biases may reflectthe overall effect of clouds, including their type, height,amount, and thickness and the location of the sonde (i.e.,below cloud deck or above cloud top; see Bower andFitzgibbon [2004] and McMillin et al. [1992]), and theysuggest that clouds can reduce the solar radiation impactson sensor temperature.[57] High clouds, which are generally cirrus clouds, are
colder than the surrounding environment and so cause aninfrared cooling of surrounding air. We examine the ΔTvalues separately for high level clouds and low or middlelevel clouds. For nighttime, there is a 0.05K cold bias inhigh cloud conditions, while the bias is close to zero whenonly low or middle level clouds are reported. For daytime,the warm biases in high cloud conditions are less thanthose in low or middle cloud conditions, for example, theirdifference being �0.12K, statistically significant for theHIGH class. Cooling from water or ice coating on the sensoras it passes through a cloud, generally stronger for high
clouds than for low or middle clouds, can contribute tothose bias differences. Restricting this analysis to newersondes, we found again biases are reduced for these twosky conditions compared with all sondes.
4. Radiation Errors in RAOBs, NWP Forecast,and COSMIC Retrievals
[58] Along with satellite and other in situ data, RAOBs areassimilated in the NWP system to generate a forecast[Ballish and Kumar, 2008], and the forecast is then usedfor many applications, including, pertinent to this work, asthe first guess in COSMIC wet retrievals. A comparison ofthe first-guess NCEP GFS forecast data with COSMIC Tdmay determine if the radiosonde radiation-induced biasesdiscussed in section 3 influence the forecast data. Figure 11indicates that there is a signature of the radiosonde warmbiases in the low stratosphere in the GFS forecast, eventhough the GFS warm biases are largely reduced relative toRAOBs, likely due to the assimilation of satellite radiancedata, which do not contain such biases.[59] A similar analysis was also done for COSMIC Tw for
which the biases are smaller than its first guess in all daytimeSEA classes (Figure 11), suggesting that COSMIC Twprofiles from 1DVar show improvement over its firstguess but still retain warm bias components in the uppertroposphere and low stratosphere via the initial NWPassimilation of “warm” RAOBs. Figure 11 emphasizes theimportance of eliminating radiosonde radiation biases inNWP assimilation.
5. Conclusion and Discussion
[60] Using COSMIC GPSRO as a reference, this study hasquantified temperature biases in radiosonde observations,with a focus on the upper troposphere and low stratospherewhere radiation-induced errors are greatest. Overall, theglobal radiosonde network has a nighttime cold bias and a
Table 2c. RAOB-Minus-COSMIC Mean Biases (K) and Standard Deviations (K) for Different Cloud Sky Conditions and Solar Eleva-tion Angles Averaged Over 15–70 hPaa
NIGHT DUSK/DAWN LOW HIGH ALL
Clear 0.03 (1.81, 9745) 0.33 (1.93, 2304) 0.41 (1.90, 1895) 0.64 (1.77, 3050) 0.22 (1.85, 16,994)Cloudy �0.02 (1.89, 15,433) 0.23 (1.88, 9898) 0.34 (1.88, 9862) 0.46 (1.73, 17,902) 0.25 (1.84, 53,095)
aThe statistics were computed from countries/regions where cloud information is included in radiosonde reports (see text for detail). Values in parenthesesare standard deviation and sample size.
Figure 11. Mean RAOB, NCEP GFS, and COSMIC wet retrieval temperature differences from COS-MIC dry temperature at 15–70 hPa for different solar elevation angle categories.
SUN ET AL.: CORRECTION FOR RADIOSONDE BIASES
4241

daytime warm bias with daytime bias increasing withaltitude and solar elevation angle. Daytime warm biasesassociated with clouds are smaller than those in clear condi-tions. Newer sondes (introduced after 2000) have smallerbiases than older sondes and appear to be less influencedby cloud effects, perhaps due to the improved sensortechnology. Biases at night show greater seasonal and zonalvariations than those for daytime. In general, warm NIGHTbiases are associated with warm climate regimes, andless warm or cold biases are associated with cold climateregimes. Temperature biases vary among sonde types(Table 3): The results for 13 types, accounting for 92% ofthe global network, are presented for eventual incorporationin new corrections to radiosonde temperature data in numer-ical weather prediction, satellite calibration and validation,and climate research applications.[61] The radiosonde biases in the low stratosphere
revealed in this analysis appear to be greater than thosefound in the most recent WMO Intercomparison of HighQuality Radiosonde Systems in Yangjiang, China, in July2010 [Nash et al., 2011]. That intercomparison useda combination of multiple sensors as a reference forcomparison, so a bias in any of the sensors may well berelated to the bias in the reference. Because it was a specialfield experiment, radiation correction schemes used in the2010 intercomparison may be more advanced than the onesused in the operational network (for example, the 2010correction version was used for Vaisala RS92 in the 2010intercomparison while the 2005 version for operationalones), and some manufacturers tuned their radiationcorrections to match that of Vaisala (H. Vömel, personalcommunication, 2012) in the 2010 intercomparison. Allthese factors can reduce the biases for individual sonde typesintercompared in the 2010 experiment. Our analysis usingCOSMIC as a reference provides a clearer indication ofbiases in different sonde types. Moreover, our analysis isnot limited to a single location and a short test period.[62] As shown in Table 3, not all radiosondes have warm
“daytime” biases and cold “nighttime” biases. Errors otherthan radiation-induced ones, such as calibration error, timelag error, or errors in data processing, could be responsiblefor those biases for some sonde types. Also, temperaturemeasurements for some sonde types might be overcorrected(undercorrected) by their existing schemes, e.g., corrections
that are too large could result in a cold daytime bias and awarm night bias while corrections that are too small couldcause a warm daytime bias and a cold night bias.[63] The statistics in this analysis were computed from
~ 3 year RAOB-COSMIC collocations. More data areneeded to obtain statistically more robust bias characteristicsfor sonde types particularly the minor ones. Also, the RAOBand COSMIC collocations are not perfectly collocated.GPSRO and radiosonde profiles differ in several ways interms of measurement characteristics, including profilegeometry and horizontal resolution. A radiosonde makespoint measurements but balloon drifts an average of~50 km horizontally during the ~100min ascent from thesurface to the stratosphere [Seidel et al., 2011]. AlthoughGPSRO profiles have fine vertical resolution (0.5 km in thelow troposphere and 1.5 km in the middle atmosphere) bysatellite retrieval standards, they have a wide horizontalresolution, ranging from ~ 160 km at the low troposphereto 320 km in the upper atmosphere (i.e., ~ 250 km, definedby the distance traversed by the radio path as it enters andexits a layer [Kursinski et al., 1997]). Future research isneeded to understand the impacts of those differences on adata comparison analysis like this.
[64] Acknowledgments. The authors thank Anthony Mannucci andChi Ao for the helpful discussions on COSMIC data, Holger Vömel andCarl Bower for the information on radiosonde instrument characteristics,Michael Hicks and John Kochendorfer for the comments on the manuscript,Frank Tilley and Michael Pettey for some data processing, and the threeanonymous reviewers for their constructive suggestions for improving thispaper.
ReferencesAnthes, R. A., et al. (2008), The COSMIC/FORMOSAT-3 mission: Earlyresults, Bull. Amer. Meteor. Soc., 89, 313–333.
Ao, C. O. (2007), Effect of ducting on radio occultation measurements: Anassessment based on high-resolution radiosonde soundings, Radio Sci.,42, RS2008, doi:10.1029/2006RS003485.
Ballish, B. A., and V. K. Kumar (2008), Systematic differences in aircraftand radiosonde temperatures: Implications for NWP and climate studies,Bull. Amer. Meteor. Soc., 89, 689–707, doi:10.1175/2008BAMS2332.1.
Bower, C. A., and J. J. Fitzgibbon (2004), National Weather Service in-situradiation temperature correction for Radiosonde Replacement SystemGPS radiosondes. Eighth Symposium on Integrated Observing andAssimilation Systems for Atmosphere, Oceans, and Land Surface. The84th American Meteorological Society Annual Meeting, Seattle, WA,10–16 January 2004 (available online at http://ams.confex.com/ams/pdfpapers/74046.pdf).
Table 3. RAOB-Minus-COSMIC Mean Biases (K) and Standard Deviation Differences (K) for Different Sonde Types and Solar Eleva-tion Angles Averaged Over 15–70 hPaa
Type NIGHT DUSK/DAWN LOW HIGH ALL
RS80 0.22 (1.82, 1162) 0.39 (1.77, 88) 0.42 (1.98, 198) 0.55 (1.78, 960) 0.37 (1.83, 2408)RS80-57H �0.35 (1.80, 1293) �0.20 (1.76, 418) �0.08 (1.79, 420) �0.19 (1.57, 974) �0.24 (1.73, 3105)RS90 0.06 (1.70, 1029) 0.07 (1.54, 302) 0.02 (1.55, 547) 0.35 (1.66, 866) 0.15 (1.65, 2744)RS92 0.07 (1.84, 19,719) 0.08 (1.77, 8507) 0.22 (1.78, 9955) 0.46 (1.67, 15,926) 0.21 (1.78, 54,107)M2K2-DC 0.28 (1.88, 948) 0.38 (2.11, 290) 0.59 (2.02, 315) 0.42 (1.81, 1074) 0.38 (1.90, 2627)DFM-06 0.45 (1.88, 651) 0.49 (2.12, 69) 0.88 (2.21, 31) 1.11 (2.13, 445) 0.71 (2.03, 1196)RS-01G 0.14 (1.87, 323) 0.02 (1.78, 204) 0.32 (1.76, 166) 0.45 (1.64, 271) 0.23 (1.78, 964)Sippican-B2 �0.87 (2.11, 1685) 0.22 (1.94, 996) 0.32 (1.91, 789) 1.38 (1.82, 1133) 0.12 (2.16, 4603)Sippican Mark IIA �0.25 (1.78, 7836) 0.00 (1.81, 3787) �0.18 (1.83, 3559) 0.19 (1.68, 5075) �0.08 (1.78, 20,257)Shang-E �0.16 (2.05, 2721) �0.12 (2.01, 4935) 0.00 (1.91, 2660) 0.40 (1.81, 615) �0.07 (1.99, 10,931)Jinyang 0.72 (2.21, 240) 1.50 (2.30, 67) 3.30 (2.08, 63) 3.65 (2.08, 188) 2.12 (2.57, 558)MRZ �0.11 (1.93, 10,598) 0.40 (1.91, 6935) 0.66 (1.84, 6531) 0.62 (1.67, 7462) 0.34 (1.88, 31,526)All types �0.05 (1.89, 51,827) 0.12 (1.90, 28,913) 0.26 (1.87, 27,191) 0.49 (1.74, 37,274) 0.18 (1.86, 145,205)
aValues inside the parentheses are standard deviation and sample size. All the biases are statistically significant at the 0.05 or better level except theitalicized ones.
SUN ET AL.: CORRECTION FOR RADIOSONDE BIASES
4242

Bower, C. A., and J. J. Fitzgibbon (2003), Flight temperature comparisonsbetween the NASA Three Thermistor Reference radiosonde and theNational Weather Service qualified GPS radiosondes. 12th Symposiumon Meteorological Observations and Instrumentation, the 83rd AmericanMeteorological Annual Meeting, Long Beach, CA, 9–14 February 2003(available online at http://ams.confex.com/ams/pdfpapers/51582.pdf).
Christy, J. R., andW. B. Norris (2009), Discontinuity issues with radiosondeand satellite temperatures in the Australian region 1979–2006, J. Atmos.Ocean. Tech., 26, 508–522.
Collins, W. G. (2001a), The operational complex quality control ofradiosonde heights and temperatures at the National Centers forEnvironmental Prediction. Part I: Description of the method, J. Appl.Meteor., 40, 137–151.
Collins, W. G. (2001b), The operational complex quality control ofradiosonde heights and temperatures at the National Centers forEnvironmental Prediction. Part II: Examples of error diagnosis andcorrection from operational use, J. Appl. Meteor., 40, 152–168.
Redder, C. R., J. K. Luers, and R. E. Eskridge (2004), Unexplaineddiscontinuity in the U.S. radiosonde temperature data. Part II: Strato-sphere, J. Atmos. Ocean. Tech., 21, 1133–1144.
Fitzgibbon, J. J., and J. Facundo (2003), Developing a technique forverifying radiosonde solar radiation correction algorithms. AmericanMeteorological Society [available online at http://ams.confex.com/ams/pdfpapers/54317.pdf].
Free, M., J. K. Angle, I. Durre, J. Lanzante, T. C. Peterson, and D. J. Seidel(2004), Using first differences to reduce inhomogeneity in radiosondetemperature datasets, J. Clim., 17, 4171–4179.
Gaffen, D. J. (1994), Temporal inhomogeneities in radiosonde temperaturerecords, J. Geophys. Res., 99 (D2), 3667–3676.
Haimberger L., C. Tavolato, and S. Sperka (2008), Toward elimination ofthe warm bias in historic radiosonde temperature records—Some newresults from a comprehensive intercomparison of upper-air data, J. Clim.,21, 4587–4606.
Hajj, G. A., E. R. Kursinski, L. J. Romans, W. I. Bertiger, and S. S. Leroy(2002), A technical description of atmospheric sounding by GPSoccultation, J. Atmos. Solar-Terrestrial Physic., 64, 451–469.
Hajj, G. A., C. O. Ao, B. A. Iijima, D. Kuang, E. R. Kursinski, A. J.Mannucci, T. K. Meehan, L. J. Romans, M. de la Torre Juarez, andT. P. Yunck (2004), CHAMP and SAC-C atmospheric occultation resultsand intercomparisons, J. Geophys. Res., 109, D06109, doi:10.1029/2003JD003909.
He, W., S.-P. Ho, H. Chen, X. Zhou, D. Hunt, and Y.-H. Kuo (2009),Assessment of radiosonde temperature measurements in the uppertroposphere and lower stratosphere using COSMIC radio occultation data,Geophys. Res. Lett., 36, L17807, doi:10.1029/2009GL038712.
Ho, S.-P., Y.-H. Kuo, Z. Zeng, and T. C. Peterson (2007), A comparison oflower stratosphere temperature from microwave measurements withCHAMP GPS RO data, Geophys. Res. Lett., 34, L15701, doi:10.1029/2007GL030202.
Ho, S.-P., et al. (2012): Reproducibility of GPS radio occultation data forclimate monitoring: Profile-to-profile inter-comparison of CHAMP cli-mate records 2002 to 2008 from six data centers, J. Geophys. Res., 117,D18111, doi:10.1029/2012JD017665.
Kuo, Y.-H., W. S. Schreiner, J. Wang, D. L. Rossiter, and Y. Zhang (2005),Comparison of GPS radio occultation soundings with radiosondes,Geophys. Res. Lett., 32, L05817, doi:10.1029/2004GL021443.
Kursinski, E. R., G. A. Hajj, J. T. Schofield, R. P. Linfield, and K. R. Hardy(1997), Observing Earth’s atmosphere with radio occultationmeasurements using the Global Positioning System, J. Geophys. Res.,102, (D19), 23,429–23,465.
Lanzante, J. R., S. A. Klein, and D. J. Seidel (2003), Temporalhomogeneization of monthly radiosonde temperature data. Part I:Methodology, J. Clim., 16, 224–240.
Luers, J. K., and R. E. Eskridge (1998), Use of radiosonde temperature datain climate studies, J. Clim., 11, 1002–1019.
Luers, J. K., 1997: Temperature error of the Vaisala RS90 radiosonde,J. Atmos. Oceanic Tech., 14, 1520–1532.
Luers, J. K., and R. E. Eskridge (1995), Temperature corrections for the VIZand Vaisala radiosondes, J. Appl. Meteor., 34, 1241–1253.
Mattioli, V., E. R. Westwater, D. Cimini, J. C. Liljegren, B. M. Lesht, S. I.Gutman, and F. J. Schmidlin (2007), Analysis of radiosonde andground-based remotely sensed PWV data from the 2004 North Slope ofAlaska Arctic winter radiometric experiment, J. Atmos. Oceanic Tech.,24, 415–430.
McMillin, L. M., M. Uddstrom, and A. Coletti (1992), A procedure forcorrecting radiosonde reports for radiation errors, J. Atmos. Oceanic.Tech., 9, 801–811.
McMillin, L. M., M. Gelman, A. Sanyal, and M. Sylva (1988), A methodfor the use of satellite retrievals as a transfer standard to determinesystematic radiosonde errors, Mon. Wea. Rev., 116, 1091–1102.
Miloshevich, L. M., H. Vömel, D. N. Whiteman, B. M. Lesht, F. J.Schmidlin, and F. Russo (2006), Absolute accuracy of water vapormeasurements from six operational radiosonde types launched duringAWEX-G and implications for AIRS validation, J. Geophys. Res., 111,D09S10, doi:10.1029/2005JD006083.
Nash, J., R. Smout, T. Oakley, B. Pathack, and S. Kurnosenko (2006),WMOIntercomparison of Radiosonde Systems, Vacoas, Mauritius, 2–25February 2005, WMO/TD-No. 1303,115 pp.
Nash, J., T. Oakley, H. Vömel, and W. Li (2011), WMO Intercomparison ofHigh Quality Radiosonde Systems, Yangjiang, China, 12 July–3 August2010. World Meteorological Organization, Instruments and Observingmethods, report No. 107, 238 pp.
Randel, W. J., and F. Wu (2006), Biases in stratospheric and tropospherictemperature trends derived from historical radiosonde data, J. Clim., 19,2094–2104.
Reale, A., B. Sun, F. Tilley, and M. Pettey (2012), NOAA ProductsValidation System (NPROVS), J. Atmos. Oceanic. Tech., 29, 629–645.
Seidel, D. J., B. Sun, M. Pettey, and A. Reale (2011), Global radiosonde balloondrift statistics, J. Geophys. Res., 116, D07102, doi:10.1029/2010JD014891.
Sun, B., A. Reale, D. J. Seidel, and D. C. Hunt (2010), Comparingradiosonde and COSMIC atmospheric profile data to quantify differencesamong radiosonde types and the effects of imperfect collocation oncomparison statistics, J. Geophys. Res., 115, D23104, doi:10.1029/2010JD014457.
Sherwood, S. C., J. R. Lanzante, C. L. Meyer (2005), Radiosonde daytimebiases and late-20th century warming, Science, 2 September 2005, 9,1556–1559.
Sherwood, S. C., C. L. Meyer, R. J. Allen, and H. A. Titchner (2008),Robust tropospheric warming revealed by iterative homogenizedradiosonde data, J. Clim., 21, 5336–5352, doi:10.1175/2008JCL2320.1.
Sokolovskiy, S. (2003), Effect of superrefraction on inversions of radiooccultation signals in the lower troposphere, Radio Sci., 38(3), 1058,doi:10.1029/2002RS002728.
Teweles, S., and F. G. Finger (1960), Reduction of diurnal variation in thereported temperatures and heights of stratospheric constant pressure sur-faces, J. Meteorol., 17, 177–194.
Tarbell, T. C., and F. G. Tower (1980), Radiation corrections used inthe AFGWC stratospheric analysis models, Rep. AFGWC/TN-80/004, 16 pp., U.S. Air Force, Air Weather Service (MAC), Air ForceGlobal Weather Central, Offutt AFB.
Thorne, P. W., et al. (2011), A quantification of uncertainties in historicaltropical tropospheric temperature trends from radiosondes, J. Geophys.Res., 116, D12116, doi:10.1029/2010JD015487.
Uddstrom, M. J. (1984), Solar radiation corrections for New Zealand andAustralian radiosondes, N. Z. Meteorol. Serv. Sci. Rep. 6, 43 pp., NewZealand Meteorological Service, Wellington.
SUN ET AL.: CORRECTION FOR RADIOSONDE BIASES
4243