Embed Size (px)
Citation preview
1TOWARDS CIRCULARITY OF POST-CONSUMER FLEXIBLE PACKAGING IN ASIA
DRIVING CIRCULAR ECONOMY IN ASIA
Report by: In support of SDGs: In collaboration with:
November 2017
TOWARD CIRCULARITY OFPOST-CONSUMER FLEXIBLE PACKAGINGIN ASIAExploring collection and recycling solutions

2 TOWARDS CIRCULARITY OF POST-CONSUMER FLEXIBLE PACKAGING IN ASIA
3TOWARDS CIRCULARITY OF POST-CONSUMER FLEXIBLE PACKAGING IN ASIA
CONTENTSFOREWORD 4EXECUTIVE SUMMARY 5
DISCLAIMER 8
ACKNOWLEDGEMENTS 8
1. OVERVIEW OF FLEXIBLE PACKAGING IN ASIA 91.1 BACKGROUND - DEFINITION AND CATEGORIES OF FLEXIBLE PACKAGING 9
1.2 GLOBAL FOOD PACKAGING AND FLEXIBLE FOOD PACKAGING IN ASIA 13
1.3 FLEXIBLE FOOD PACKAGING 13
1.4 ASIA’S DOMINANCE IN FLEXIBLE PACKAGING 14
2. REALITIES IN DEVELOPING ASIA AFFECTING COLLECTION AND CIRCULARITY OF FLEXIBLES 162.1 OVERFLOWING AND POORLY MANAGED DUMPSITES AND LANDFILLS 16
2.2 MISSING INFRASTRUCTURE INVESTMENTS FOR MSW 17
2.3 LACK OF SEGREGATION 18
2.4 LACK OF FUNDING AT FRONT-END AND LACK OF VALUE CREATION 18
2.5 LACK OF CITY-LEVEL REGULATIONS AND ENFORCEMENT 19
2.6 FRAGMENTED APPROACH TO MSW MANAGEMENT BY GOVERNMENT AND INDUSTRY 23
2.7 THE CHALLENGING ECONOMICS OF FLEXIBLE PACKAGING COLLECTION 25
2.8 OVERLOOKED INFORMAL SECTOR OF WASTE WORKERS 27
3. FLEXIBLES COLLECTION EFFORTS IN INDIA, INDONESIA AND THE PHILIPPINES 293.1 HASIRU DALA INNOVATIONS (INDIA) | WASTE COLLECTOR MOBILISATION 29
3.2 WASTE VENTURES INDIA (INDIA) | WASTE MANAGEMENT SOLUTIONS PROVIDER 32
3.3 ITC LIMITED (INDIA) | CSR FOR FLEXIBLE WASTE SOLUTIONS 34
3.4 HINDUSTAN UNILEVER ( INDIA) | CONSUMER FOCUSED COLLECTION INITIATIVES 35
3.5 WASTE4CHANGE (INDONESIA) | RESPONSIBLE WASTE MANAGEMENT 36
3.6 DEPOK CITY (INDONESIA) | HOUSEHOLD SEGREGATION AT SCALE 38
3.7 WASTE BANKS (INDONESIA) | COMMUNITY RECYCLING CENTRES 42
3.8 KAPAL API (INDONESIA) | CONSUMER FOCUSED INITIATIVES 44
3.9 MOTHER EARTH FOUNDATION (PHILIPPINES) | BUILDING MATERIALS RECOVERY FACILITIES 44
3.10 PROJECT RECYCLASS BY MONDELEZ (PHILIPPINES) | TARGETED FLEXIBLES COLLECTION 47
3.11 UNILEVER (PHILIPPINES) | RECOVERY OF POST-CONSUMER FLEXIBLE PACKAGING 48
3.12 VILLAR SIPAG FOUNDATION (PHILIPPINES) | DRIVING HOUSEHOLD SEGREGATION 49
4. FLEXIBLES AFTER-USE PROCESSING TECHNOLOGIES AND APPLICATIONS 514.1 MK AROMATICS LIMITED (INDIA) - DEPOLYMERISATION OF PLASTICS (PYROLYSIS) 51
4.2 GEOCYCLE INDIA (LAFARGE HOLCIM) - CO-PROCESSING IN CEMENT KILNS 53
4.3 BUILDING ROADS WITH PLASTICS (INDIA AND INDONESIA) 55
4.4 SOLVOLYSIS - CREASOLV 58
4.5 ENVIROTECH WASTE RECYCLING INC (PHILIPPINES) - MANUFACTURING FURNITURE 60
4.6 EARTH MANAGEMENT AND RECYCLING TECHNOLOGY (PHILIPPINES) - MAKING “ECOBRICKS” 63
5. ANALYSIS AND REVIEW OF WASTE COLLECTION AND END USE EFFORTS 655.1 COMPARATIVE ASSESSMENT OF FLEXIBLE WASTE COLLECTION AND PROCESSING EFFORTS 65
5.2 COMPARATIVE REVIEW OF POST-CONSUMER FLEXIBLE PACKAGING PROCESSING TECHNOLOGIES 70
6. SUMMARY OF FINDINGS AND RECOMMENDATIONS 73SOURCE-SEGREGATION 74
PROCESSING AND SORTING 74
VIABLE END USE 75
OTHER POLICY CONSIDERATIONS 75
APPENDICES 77APPENDIX A: REGULATIONS IMPACTING POST-CONSUMER FLEXIBLE PACKAGING 77
APPENDIX B: THE CASE FOR EPR 80
GLOSSARY 85ENDNOTES 88ABOUT GONE ADVENTURIN (GA) 92

4 TOWARDS CIRCULARITY OF POST-CONSUMER FLEXIBLE PACKAGING IN ASIA
FOREWORDOver the past 20 years, plastic packaging has transformed the way products are produced, protected, stored, distributed, and consumed. It has cut food waste, improved safety and human health, and reduced the environmental footprint of transportation.
The same qualities that make plastics such a great packaging material - low cost, light weight, strong and resilient – can create vexing problems when plastics enter the environment.
Most marine plastic originates from countries where consumer economies developed faster than their ability to manage waste. More than half comes from just five countries in Asia, according to research by the Ocean Conservancy and the McKinsey Center for Business and Environment.
Amcor commissioned this report to create an accurate picture of the collection and recycling of flexible plastic packaging in Asia. We asked the report writers to survey what is being done today in India, Indonesia, and the Philippines, and to propose ways in which Amcor and others can further increase our efforts to recover and recycle flexible plastic packaging.
Amcor is already a leader in collaborative efforts to address the issue of plastics in the ocean:
• As a core partner in the Ellen MacArthur Foundation’s New Plastics Economy initiative, a coalition of businesses, non-governmental organisations (NGOs), and government agencies working to create a circular economy for plastic packaging,
• As a member of the Ocean Conservancy’s Trash Free Seas Alliance, we actively promote efforts to recapture, reuse and recycle plastic packaging, and
• Amcor people are engaged, with more than 1,000 employees taking part in the International Coastal Clean-Up 2017, collecting 11,000 kilograms of trash from waterways around the world.
Enhanced sustainability is one outcome of our innovation, as we create packaging that is more easily recycled and attempt to increase the use of recycled plastics in Amcor’s products. A challenge is to bring the supply chain, governments, multinational companies and NGOs together to create permanent, scalable recycling systems and improve recycling rates – both of which are vital to keep plastics in use and out of the environment.
This report is a snapshot and is based on the best information available in a rapidly changing area. We asked for frank conclusions and recommendations, and some may not be widely accepted. We encourage you to read it in the positive spirit in which it was requested and written.
We are very grateful to the Gone Adventurin’ team for its research and insights. We would also like to thank the people and organisations who contributed to this paper – and appreciate those of you who take the time to read the full report. We welcome your feedback and contributions to the body of knowledge on reducing the prevalence of plastic packaging in the environment.
Roelof WesterbeekBusiness Group President
Amcor Flexibles Asia Pacific
David ClarkVice President, Sustainability
Amcor Ltd.Please send any comments to [email protected]
5TOWARDS CIRCULARITY OF POST-CONSUMER FLEXIBLE PACKAGING IN ASIA
EXECUTIVE SUMMARYThis report attempts to highlight the challenges and opportunities in addressing concerns around post-consumer flexible packaging. Given the backdrop of poor waste collection infrastructure and limited recycling technologies, this report shares on-ground insights so as to influence directed solutions to the snowballing post-consumer flexible waste situation in Asia. The report first examines flexible packaging within the context of Asia. It then provides an overview of waste management realities in Asia, especially in India, Indonesia and the Philippines. With this context, the report goes on to explores in detail, current efforts around collection and recycling of post-consumer flexible packaging across India, Indonesia and the Philippines. A comparative analysis of the various collection and recycling efforts highlights the key elements influencing success. Finally, the report provides a summary of findings and recommendations to effectively stem the flow of post-consumer flexible packaging into landfills and the environment.
Flexible Packaging
The global flexible packaging market is growing rapidly, driven by (i) the increasing demand in developing markets as well as (ii) the advances in technology resulting in numerous end use applications. Global flexible packaging consumption is estimated to have a market value of USD 182 billion for the year 2015 and is forecasted to reach USD 222 billion by the year 2020.1 Flexible packaging today uses varying combinations of plastic, paper and foil, to create a vast array of economical, lightweight, portable and effective means of packaging consumables and other products. Asia is the largest regional market for flexible packaging accounting for 40% of the global market volume, followed by Western Europe and North America.2 The growth in consumption of flexible packaging is especially accelerated in Asia, given large populations, growing consumption rates, increased urbanisation and the resulting growth in demand for fast-moving consumer goods.
Some key statistics around flexible packaging3: • Flexible Packaging as a percentage of the Global Packaging Market: 21.8% (2014). • Annual Projected Growth of Flexible Packaging Globally (consumption): 4.0% (2015-2020). • Annual Projected Growth of Flexible Packaging in Asia (consumption) : 5.0% (2015-2020).
Post-Consumer Flexible Packaging in Asia
Environmental and end use concerns for post-consumer flexible packaging are further challenged by the realities of solid waste management in Asia. First, the waste collection infrastructure in Asia is inadequate. For instance, according to recent studies in Indonesia, municipal solid waste collection is as low as 56% in urban areas and only about 5% in the rural areas.4 The inadequate collection and disposal of waste, combined with already overflowing and poorly managed landfills and dumpsites, result in waste leaking into the environment. It comes as no surprise that Asia contributes 82%5 of plastic pollution into the ocean.
Poor waste collection infrastructure implies that recycling facilities and infrastructure are also lagging in developing Asia. However, a robust informal waste collection network ensures most high value recyclables such as metal, glass, paper and rigid plastics are retrieved at different stages including once they reach landfills. Post-consumer flexible packaging materials are harder to pick out and collect given their lightweight and flimsy nature. Moreover, limited and low value end uses make them less attractive to waste pickers and scavengers. Often post-consumer flexible packaging materials are disposed off with other residual waste - rendering them unsanitary and even harder to recover and recycle. The lower collection rates of post-consumer flexible packaging increases littering and its entry into waterways and eventually the ocean.
Heeding the growing concern surrounding waste collection in general and post-consumer flexible packaging in particular, various efforts have been initiated by local social enterprises, NGOs, and consumer goods companies.
6 TOWARDS CIRCULARITY OF POST-CONSUMER FLEXIBLE PACKAGING IN ASIA
Environmental Concerns
Despite environmental benefits of reduced material usage and lower transportation-related carbon emissions and energy costs, the growth in consumption and disposal of flexible packaging still raises environmental concerns. These concerns mirror those of plastic packaging in general:
• Created from a non-renewable resource• Adds to growth in waste ending in landfills• Adds to growth in amounts of waste plastics in the oceans
While innovative and bio-based / renewable feedstock-based designs attempt to address the first concern listed above, post-consumer flexible packaging presents a unique set of challenges with respect to landfill waste and ocean leakage.
Collection Initiatives in India, Indonesia, and the Philippines:
This report explores in detail twelve collection initiatives across India, Indonesia and the Philippines. Efforts in these countries reflect a combination of local regulation, enforcement, waste worker organisation and citizen engagement. Almost all collection efforts targeting post-consumer flexible packaging are the result of a pilot / waste study by a packaging or consumer goods company. These efforts typically include the engaging of a social enterprise which then (i) collaborates with a local municipal body (ii) supervises a waste collector network (iii) promotes source-segregation at the consumer level before (iv) sorting and processing flexible waste and (v) sending to an end use facility. Depok City is a great example of how large scale source-segregation can result in outstanding results as far as collection goes, however the absence of a viable end use results in most of the collected flexible packaging ending up in the landfill. Social enterprises / NGOs, like Hasiru Dala in India, have identified source-segregation as critical and, along with operation of MRFs, have ensured that the necessary link to an end use process is maintained, resulting in a potentially scalable solution.
End State for Post-Consumer Flexible Packaging
Unlike other packaging materials, there are few readily available recycling solutions for flexible packaging. It is harder to retrieve and sort when compared to packaging types such as rigid plastics, metal cans or cardboard. This results in post-consumer flexible packaging getting commingled with other residual waste, hence reducing its potential for reuse. The most readily available solution in India, Indonesia, and to a limited extent in the Philippines for post-consumer flexible packaging is incineration in cement kilns. However, there are relatively high processing and transportation costs to contend with.
Other end use solutions discussed in this report that are also being increasingly commercialised in the developing world are:
• Pyrolysis : breaking down of the hydrocarbons in flexible plastics to return them to the original oil state.• Solvolysis: breaking down the polymers in flexible plastics to return them to monomer state.• Use in plastic roads: combining flexibles with bitumen and aggregate to lay plastic roads. • Use in manufacture of plastic lumber (via extrusion): creating bricks / low cost plastic furniture.
Each of these solutions rely on some level of source-segregation and sorting / processing before incorporating post-consumer flexible packaging into a recycling process. Working with local NGOs and waste collector networks and monitoring contamination / cleanliness of feedstock of post-consumer flexible packaging are prerequisites for the application of these solutions as discussed in the report.
In many nations, Extended Producer Responsibility (EPR) laws have been introduced in the context of packaging, to increase engagement of, and participation by packaging manufacturers in addressing the issues around post-consumer flexible packaging.
7TOWARDS CIRCULARITY OF POST-CONSUMER FLEXIBLE PACKAGING IN ASIA
What Works and Why?
A range of efforts and solutions currently being explored in India, Indonesia and the Philippines are listed in this report. While the report is not exhaustive it provides some key insights into the varying success of the different efforts. It must be noted that all of these efforts presuppose multiple stakeholders working alongside each other - government bodies, social enterprises and private businesses each participating in one or more of each of the three requirements.
The report establishes quite clearly that segregation of the waste at the source is critical to the retrieval of post-consumer flexible packaging. Supported by regulation, behaviour change campaigns and enforcement via refusal of waste collection services and / or fines, source-segregation is key to recovery of post-consumer flexible packaging regardless of the end use.
A second finding is the importance of material recovery facilities - facilities that can collect and sort dry waste into different recyclable streams. These centres are most effective when operations are subsidised by the income generated from high value recyclables and incentives exist for retrieval and processing of flexible packaging waste.
The third and final finding of this report is the requirement of financially viable end uses i.e. end uses for flexible packaging that are able to generate sufficient and consistent economic value to create a market for post-consumer flexible packaging.
Even as improvements in design and innovation in material types are being actively researched, it is clear that great intervention is needed to address growing post-consumer flexible packaging waste in Asia. Any effort to tackle this challenge must include a multi-stakeholder approach (local government participation is key), embrace source-segregation, support material recovery facilities and, ensure a financially viable end solution.

8 TOWARDS CIRCULARITY OF POST-CONSUMER FLEXIBLE PACKAGING IN ASIA
DISCLAIMER
The facts set out in this publication are obtained from sources which we believe to be reliable. However, we accept no legal liability of any kind for the publication contents, nor any information contained therein nor conclusions drawn by any party from it.
To quote this report, please use the following reference:Gone Adventurin, Driving Solutions for Post-Consumer Flexible Packaging in Asia(2017, http://www.goneadventurin.com/insights/flexibleplastics).
Gone Adventurin acknowledges product, service and company names referred to in this report, many of which are trade names, service marks, trademarks or registered trademarks.
All photos featured in this report are originally taken by Gone Adventurin unless otherwise stated.
ACKNOWLEDGEMENTS
Project Team from Gone Adventurin
Ashwin Subramaniam, Founder and CEOLaura Allen, Co-Founder and COOSumangali Krishnan, Head of Research and StrategyAbishek Balasubramanian, Project LeadEmilie Rost van Tonningen, Circular Economy LeadAmirul Adli Bin Zulkifli, Research Executive
Participating Organisations
We are very grateful for all of the below organisations for their contributions and support for this report:
Amcor Ltd - David Clark Amcor Flexibles Asia Pacific - Roelof Westerbeek Hasirudala Innovations, India - Nalini ShekarWaste4Change, Indonesia - Bijaksana JunerosanoDepok Sanitation Agency, Indonesia - Zamrowi Hasan and Isnarto MK Aromatics, India - Mahesh Merchant Envirotech Philippines - Winchester LemenMother Earth Foundation, Philippines - Rap VillavicencioWaste Ventures, India - Roshan MirandaUnilever South East Asia and AustralasiaVillar SIPAG Foundation, Philippines - Senator Cynthia A. Villar
9TOWARDS CIRCULARITY OF POST-CONSUMER FLEXIBLE PACKAGING IN ASIA
1. OVERVIEW OF FLEXIBLE PACKAGING IN ASIAAccounting for the fastest growing segments of the packaging industry, flexible packaging provides an economical method to package, preserve and distribute food, beverages, other consumables, pharmaceuticals and other products that need extended shelf life. This rapid growth can be attributed both to the increased packaging requirements and overall consumption growth patterns as well as replacement of other types of packaging (rigid plastics, metal, glass, paper etc.) with flexible packaging. Flexible packaging may be constructed from plastic film, paper or aluminium foil, or any combination of these and is now available in a wide variety of innovative shapes and sizes tailored to fit the product being packaged and / or its end use. Flexible packaging provides a range of convenience and environmental benefits including low package weight, portability, material efficiency and a high barrier to oxygen / moisture. Using less material, and with improved production technology, it reduces water and energy consumption and also reduces transportation-related energy and fossil fuel consumption. These advantages are especially amplified in developing nations and in Asia allowing for competitive production costs, reduced transportation costs to remote markets, smaller packaging to provide access to lower income consumers.
1.1 BACKGROUND - DEFINITION AND CATEGORIES OF FLEXIBLE PACKAGING
For the purposes of this report, we define flexible packaging as a packaging or container made of flexible or easily yielding materials that when filled or closed can be readily changed in shape. They may be made up of plastics, paper, metals or any combination of these.
We classify flexible packaging into 3 categories based on composition as per below. This report focuses on all 3 categories of flexible packaging.
A. Flexible Plastics i. Mono-material Plastics ii. Multi-material PlasticsB. Flexible Foils Multi-material (Plastics and Metal)C. Flexible Papers Multi-material (Plastics and Paper)
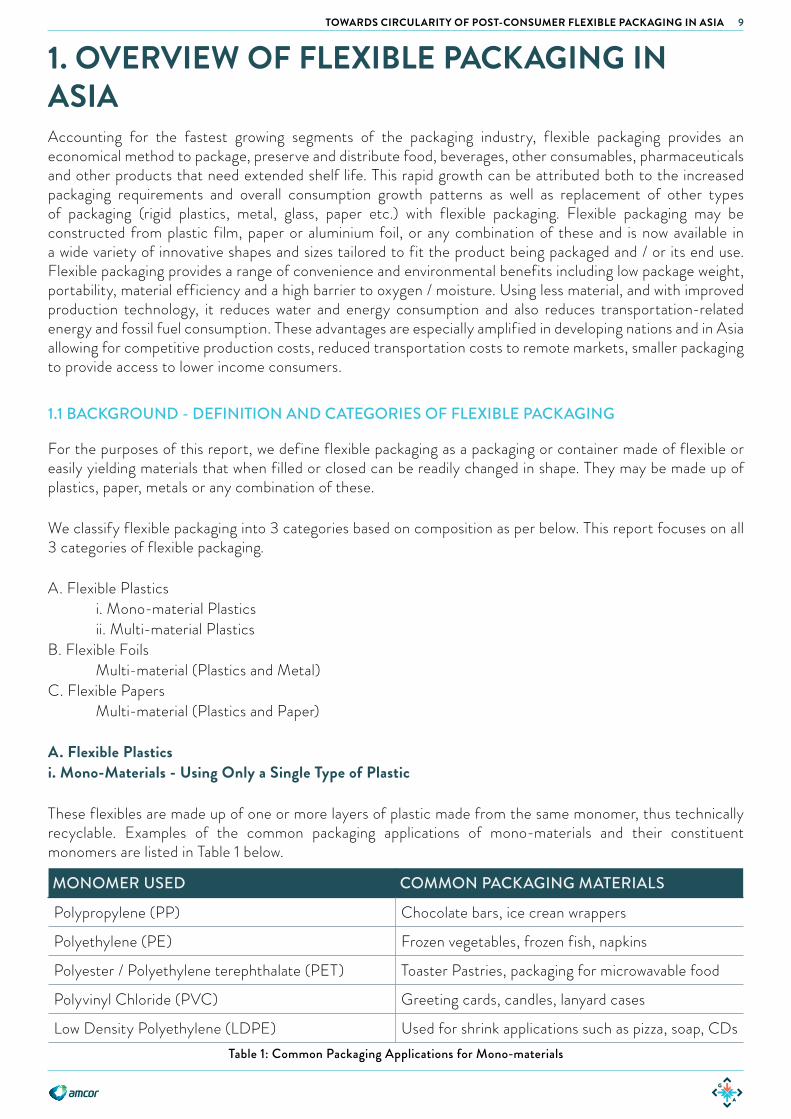
A. Flexible Plasticsi. Mono-Materials - Using Only a Single Type of Plastic
These flexibles are made up of one or more layers of plastic made from the same monomer, thus technically recyclable. Examples of the common packaging applications of mono-materials and their constituent monomers are listed in Table 1 below.
MONOMER USED COMMON PACKAGING MATERIALS
Polypropylene (PP) Chocolate bars, ice crean wrappers
Polyethylene (PE) Frozen vegetables, frozen fish, napkins
Polyester / Polyethylene terephthalate (PET) Toaster Pastries, packaging for microwavable food
Polyvinyl Chloride (PVC) Greeting cards, candles, lanyard cases
Low Density Polyethylene (LDPE) Used for shrink applications such as pizza, soap, CDsTable 1: Common Packaging Applications for Mono-materials

10 TOWARDS CIRCULARITY OF POST-CONSUMER FLEXIBLE PACKAGING IN ASIA
MONO-MATERIAL
Figure 1: Examples of Mono-Material Plastics
ii. Multi-Materials - Using Different Types of Plastics
These flexibles are made up of multiple layers of plastic made from different monomers. They typically also include one or more adhesive layers and printing layers. They offer some protection against moisture and air.
MATERIALS USED COMMON PACKAGING APPLICATIONS
Polypropylene (PP) and Acrylic Snack food wrappers (e.g instant noodle), candy wrappers, baked goods
Polyethylene (PE) and / or Polyethylene terephthalate (PET) and others e.g. Nylon
Refill pouches for fabric conditioner, cooking oil, dishwashing liquid, wet tissues
High Density Polyethylene (HDPE) and Low Density Polyethylene (LDPE)
Used as an outer layer along with LDPE for wrapping waffles, crackers, plastic cutlery
Table 2: Common Packaging Applications for Multi-Material Plastics
MULTI-MATERIAL - PLASTICS
Figure 2: Examples of Multi-Material Plastics
B. Multi-Materials - Using Different Types of Plastics With Metals
These flexibles are made up of multiple layers of plastic made from different monomers along with a metallic layer. They typically also include one or more adhesive layers and printing layers. Compared to multi-materials using different types of plastic only, the metallic layer offers additional protection against moisture, air, odors, and UV light.
MATERIALS USED COMMON PACKAGING APPLICATIONS
PP and aluminium layer Candy bars, breakfast bars and pharmaceutical applications
PET and LDPE / PE and metallic layer Sachets (e.g. Shampoo), coffee bags, fabric conditioner, detergent powder, wet tissues
Foil Laminations Pharmaceutical products and light sensitive products
Table 3: Common Packaging Applications for Multi-Materials (Plastics and Metals)
11TOWARDS CIRCULARITY OF POST-CONSUMER FLEXIBLE PACKAGING IN ASIA
MULTI-MATERIAL - PLASTICS AND METAL
Figure 3: Examples of Multi-Materials (Plastics and Metals)
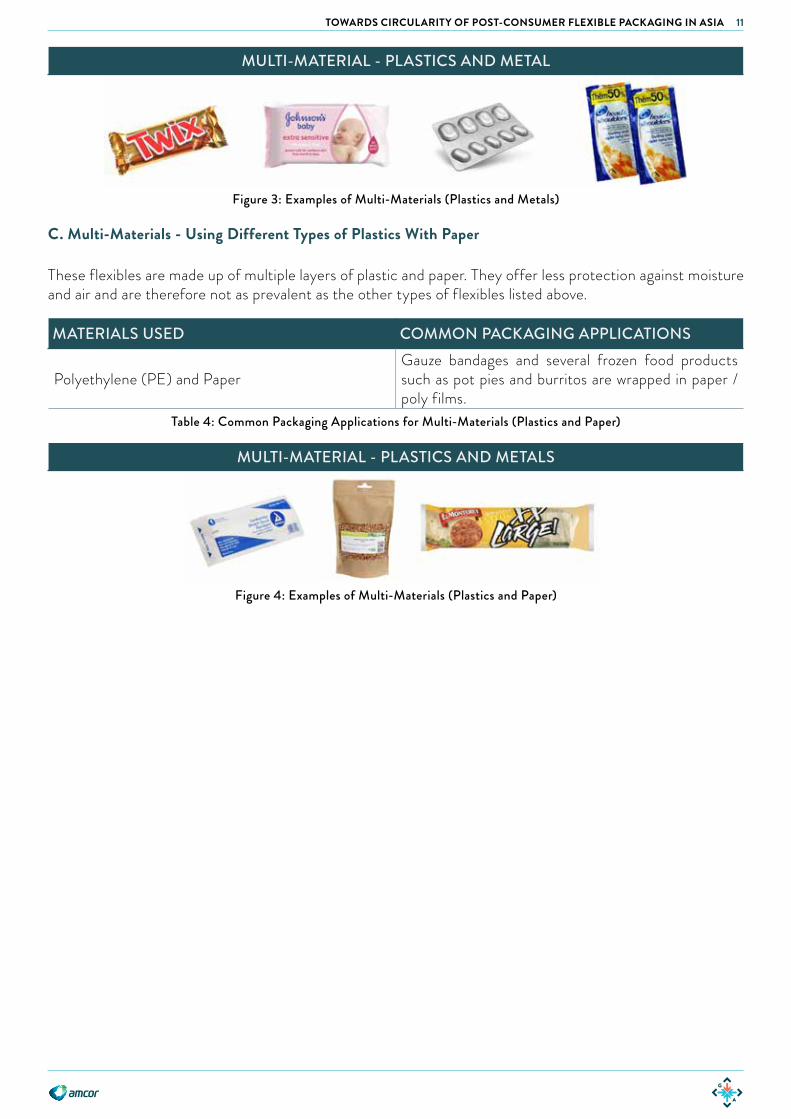
C. Multi-Materials - Using Different Types of Plastics With Paper
These flexibles are made up of multiple layers of plastic and paper. They offer less protection against moisture and air and are therefore not as prevalent as the other types of flexibles listed above.
MATERIALS USED COMMON PACKAGING APPLICATIONS
Polyethylene (PE) and PaperGauze bandages and several frozen food products such as pot pies and burritos are wrapped in paper / poly films.
Table 4: Common Packaging Applications for Multi-Materials (Plastics and Paper)
MULTI-MATERIAL - PLASTICS AND METALS
Figure 4: Examples of Multi-Materials (Plastics and Paper)

12 TOWARDS CIRCULARITY OF POST-CONSUMER FLEXIBLE PACKAGING IN ASIA
Mono-materials - using onlya single type of plastic
Multi-materials - using di�erent types of plastics with paper
TYPES OF FLEXIBLE PLASTIC PACKAGING
LDPEPVC
PETPEPP
Multi-materials - using di�erenttypes of plastics
HDPE +LDPE
PE / PET + Others (eg. Nylon)PP +
Acrylic
PET +LDPE / PE + METAL
PE & PAPER
PP + AI
FOIL LAMINATIONS
Multi-materials - using di�erenttypes of plastics with metals
Figure 5: Categories of Flexible Packaging
The above are examples of each category. This list is non-exhaustive.

13TOWARDS CIRCULARITY OF POST-CONSUMER FLEXIBLE PACKAGING IN ASIA
Mono-materials - using onlya single type of plastic
Multi-materials - using di�erent types of plastics with paper
TYPES OF FLEXIBLE PLASTIC PACKAGING
LDPEPVC
PETPEPP
Multi-materials - using di�erenttypes of plastics
HDPE +LDPE
PE / PET + Others (eg. Nylon)PP +
Acrylic
PET +LDPE / PE + METAL
PE & PAPER
PP + AI
FOIL LAMINATIONS
Multi-materials - using di�erenttypes of plastics with metals
1.2 GLOBAL FOOD PACKAGING AND FLEXIBLE FOOD PACKAGING IN ASIA
Flexible packaging accounted for 21.8% of the global packaging market in 2014, and has been the fastest growing packaging type in recent years with an annual growth rate of 5.2% between 2010-20146. Flexible plastics (this includes the mono-material and multi-material plastics subcategories listed above) account for 71.2% of all flexible packaging with a growth rate of 6.2% over the same period7 - higher than the growth rates of other types of flexible packaging. This is due to two reasons - inroads into the market share of other packaging types, and an increased level of packaging and packaging penetration.
Going forward, the global flexible packaging market is estimated to grow at 4.0% per annum, from USD 182 billion in 2015 to USD 222 billion by the year 2020.8
1.3 FLEXIBLE FOOD PACKAGING
In 2014, global food packaging accounted for 30.4% of the overall packaging market and has been growing strongly at an annual rate of 5.5% over the period 2010–14, reaching USD 246.5 billion. Going forward, growth is forecast to slow slightly to 3.7% per annum in real terms over the period 2015–20, reaching USD 307.9 billion.9
The food packaging market has performed relatively well in comparison to other markets when economic fluctuations occur.10 This is due to consumers’ dependance on this market - consumption rates might go down, but a certain level of food consumption will always be needed. The growth in modern retail has led to a sharp increase in the use of flexible plastics, with products such as fresh fruit and vegetables increasingly being packaged in order to extend shelf life. This has been driven both by economic considerations as well as the global movement to reduce food waste.
In Asia, the dominance of flexible plastics being used as food packaging is even more pronounced. The figure below was produced based on data of flexible packaging across markets in Asia Pacific from Euromonitor and broken down in terms of units.11 This is carried out because, for the purposes of driving circularity of post-consumer packaging, units are an important consideration as household segregation and collection of recyclables is done in terms of units. The figure shows that food packaging dominates the flexibles packaging market, accounting for 50% of total flexible packaging units. Tobacco packaging is the only other significant use, accounting for 37.3% of the total units while all other applications account for less than 5% each.
Figure 6: Production of Flexibles Packaging Units Per Usage Category in 2016
Beauty and Personal Care
Packaging
26,2543,216
43,93627,677
Beverages Packaging
Dog and Cat Food
Packaging
FoodPackaging
Home CarePackaging
Tissue and Hygiene
Packaging
Tobacco Packaging
Usage Category
600,000
400,000
200,000
0
Units
(in
mill
ions
)
565,963
426,979
49,898
Flexibles Packaging Units Produced for Each Usage Category for Asia Pacific in 2016
Flex
ible
Pac
kagi
ng C
onsu
mpt
ion
(USD
mill
ion)
Year
North America Western Europe Rest of the WorldAsia Pacific
0
25,000
50,000
75,000
100,000
55,962
65,162
70,49774,354 77,369
69,109
98,896
2010 2012 2014 2016 2018 2020
Flexible Packaging Consumption by Region

14 TOWARDS CIRCULARITY OF POST-CONSUMER FLEXIBLE PACKAGING IN ASIA
1.4 ASIA’S DOMINANCE IN FLEXIBLE PACKAGING
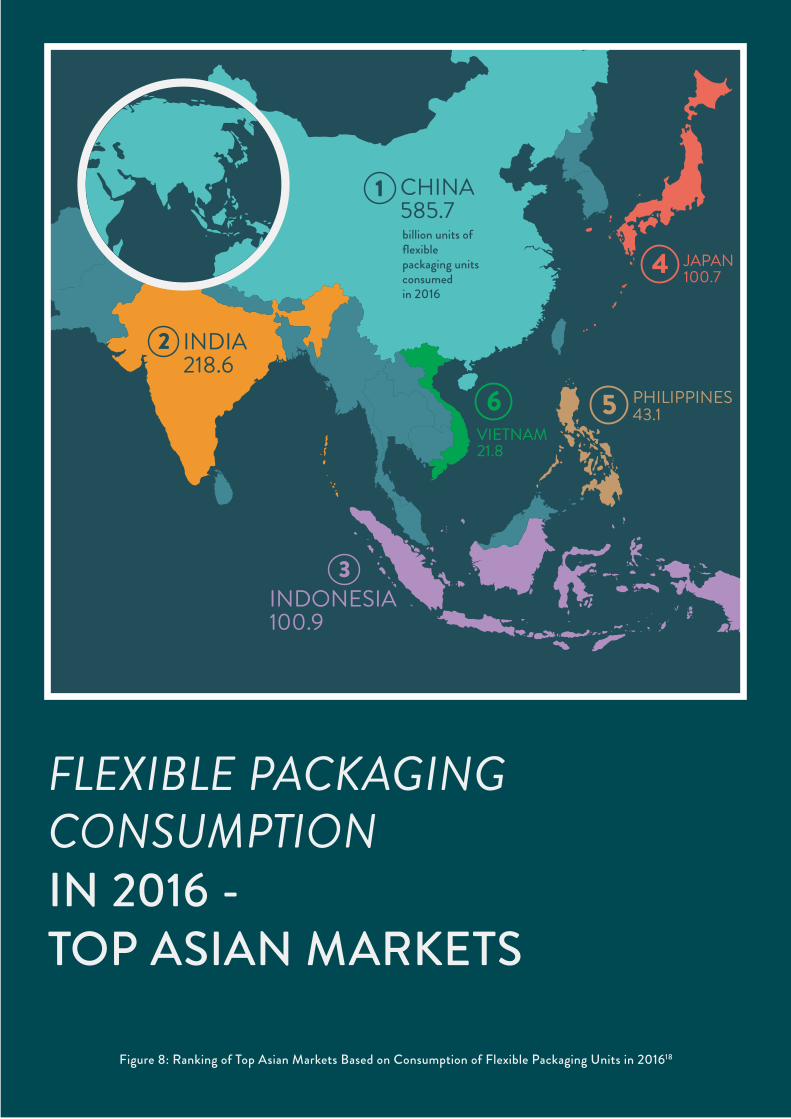
Asia dominates in the use of flexible packaging with a 42% market share in terms of value of total flexible packaging sales in 2014. This is set to increase to 45% by 2020.12 Asia is also projected to be the fastest growing market for consumer flexible packaging till 2020, with an annual average growth rate of 6.6% in volume terms.13
When measured in terms of flexible packaging units consumed, China is the world’s largest market with a total consumption of 585.7 billion flexible packaging units in 2016. In Asia, India ranks second with 281.6 billion units consumed and Indonesia third with 100.9 billion units consumed. On a per capita basis however, Japan is the highest at 793 units / capita, with China second at 425 units / capita and the Philippines a close third at 418 units / capita in 2016. Other Southeast Asian markets such as Vietnam and Thailand are also growing fast in their flexible packaging usage and share.14
The Asian flexible packaging market is the largest both in terms of both dollar value15 and units consumed.16 However, as shown in the coming sections of this report, this is not the primary reason for why an estimated 82% of the 8 million tons of plastics (including flexible plastics) that leak into the world’s oceans each year originate from Asia.17
Figure 7: Growth of Flexibles Packaging Consumption by Region Between 2010-2015 and 2020 Projection
Beauty and Personal Care
Packaging
26,2543,216
43,93627,677
Beverages Packaging
Dog and Cat Food
Packaging
FoodPackaging
Home CarePackaging
Tissue and Hygiene
Packaging
Tobacco Packaging
Usage Category
600,000
400,000
200,000
0
Units
(in
mill
ions
)
565,963
426,979
49,898
Flexibles Packaging Units Produced for Each Usage Category for Asia Pacific in 2016
Flex
ible
Pac
kagi
ng C
onsu
mpt
ion
(USD
mill
ion)
Year
North America Western Europe Rest of the WorldAsia Pacific
0
25,000
50,000
75,000
100,000
55,962
65,162
70,49774,354 77,369
69,109
98,896
2010 2012 2014 2016 2018 2020
Flexible Packaging Consumption by Region
15TOWARDS CIRCULARITY OF POST-CONSUMER FLEXIBLE PACKAGING IN ASIA
Figure 8: Ranking of Top Asian Markets Based on Consumption of Flexible Packaging Units in 201618
FLEXIBLE PACKAGING CONSUMPTIONIN 2016 - TOP ASIAN MARKETS
billion units of flexiblepackaging units consumedin 2016
2 INDIA218.6
3INDONESIA100.9
5 PHILIPPINES43.1
6VIETNAM21.8
4 JAPAN100.7
1 CHINA585.7billion units of flexiblepackaging units consumedin 2016
2 INDIA218.6
3INDONESIA100.9
5 PHILIPPINES43.16
VIETNAM21.8
4 JAPAN100.7
1 CHINA585.7
16 TOWARDS CIRCULARITY OF POST-CONSUMER FLEXIBLE PACKAGING IN ASIA
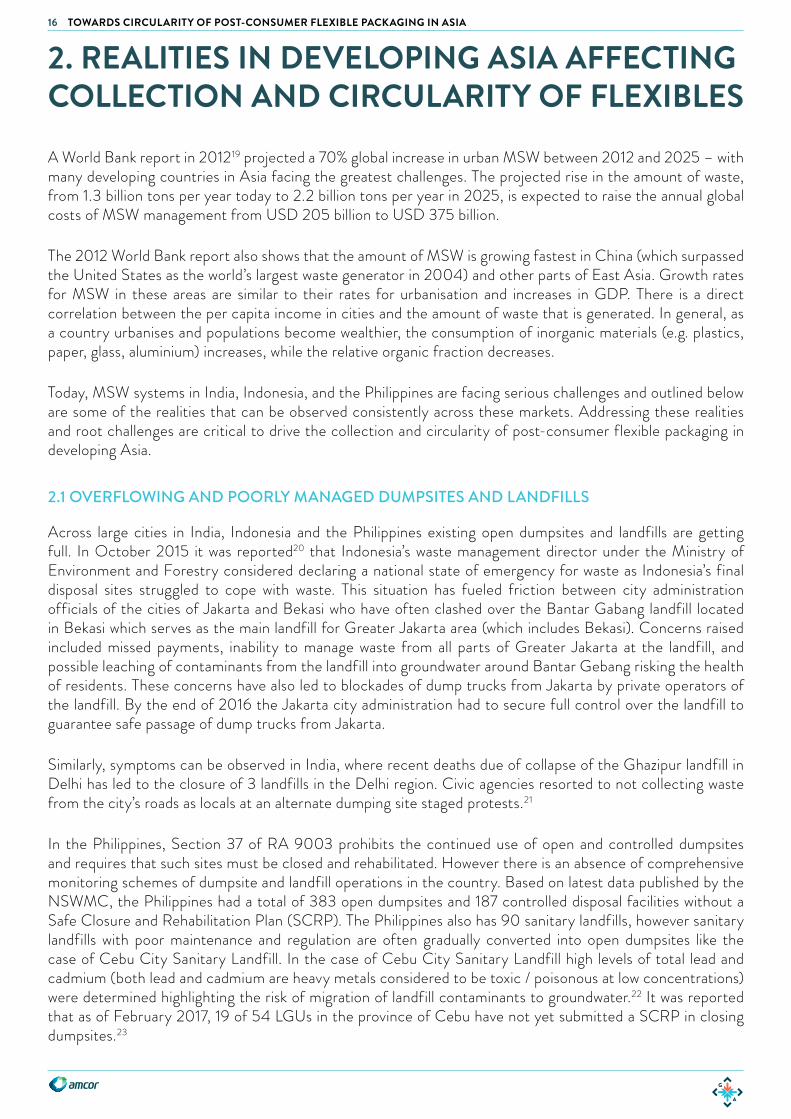
2. REALITIES IN DEVELOPING ASIA AFFECTING COLLECTION AND CIRCULARITY OF FLEXIBLES A World Bank report in 201219 projected a 70% global increase in urban MSW between 2012 and 2025 – with many developing countries in Asia facing the greatest challenges. The projected rise in the amount of waste, from 1.3 billion tons per year today to 2.2 billion tons per year in 2025, is expected to raise the annual global costs of MSW management from USD 205 billion to USD 375 billion.
The 2012 World Bank report also shows that the amount of MSW is growing fastest in China (which surpassed the United States as the world’s largest waste generator in 2004) and other parts of East Asia. Growth rates for MSW in these areas are similar to their rates for urbanisation and increases in GDP. There is a direct correlation between the per capita income in cities and the amount of waste that is generated. In general, as a country urbanises and populations become wealthier, the consumption of inorganic materials (e.g. plastics, paper, glass, aluminium) increases, while the relative organic fraction decreases.
Today, MSW systems in India, Indonesia, and the Philippines are facing serious challenges and outlined below are some of the realities that can be observed consistently across these markets. Addressing these realities and root challenges are critical to drive the collection and circularity of post-consumer flexible packaging in developing Asia.
2.1 OVERFLOWING AND POORLY MANAGED DUMPSITES AND LANDFILLS
Across large cities in India, Indonesia and the Philippines existing open dumpsites and landfills are getting full. In October 2015 it was reported20 that Indonesia’s waste management director under the Ministry of Environment and Forestry considered declaring a national state of emergency for waste as Indonesia’s final disposal sites struggled to cope with waste. This situation has fueled friction between city administration officials of the cities of Jakarta and Bekasi who have often clashed over the Bantar Gabang landfill located in Bekasi which serves as the main landfill for Greater Jakarta area (which includes Bekasi). Concerns raised included missed payments, inability to manage waste from all parts of Greater Jakarta at the landfill, and possible leaching of contaminants from the landfill into groundwater around Bantar Gebang risking the health of residents. These concerns have also led to blockades of dump trucks from Jakarta by private operators of the landfill. By the end of 2016 the Jakarta city administration had to secure full control over the landfill to guarantee safe passage of dump trucks from Jakarta.
Similarly, symptoms can be observed in India, where recent deaths due of collapse of the Ghazipur landfill in Delhi has led to the closure of 3 landfills in the Delhi region. Civic agencies resorted to not collecting waste from the city’s roads as locals at an alternate dumping site staged protests.21
In the Philippines, Section 37 of RA 9003 prohibits the continued use of open and controlled dumpsites and requires that such sites must be closed and rehabilitated. However there is an absence of comprehensive monitoring schemes of dumpsite and landfill operations in the country. Based on latest data published by the NSWMC, the Philippines had a total of 383 open dumpsites and 187 controlled disposal facilities without a Safe Closure and Rehabilitation Plan (SCRP). The Philippines also has 90 sanitary landfills, however sanitary landfills with poor maintenance and regulation are often gradually converted into open dumpsites like the case of Cebu City Sanitary Landfill. In the case of Cebu City Sanitary Landfill high levels of total lead and cadmium (both lead and cadmium are heavy metals considered to be toxic / poisonous at low concentrations) were determined highlighting the risk of migration of landfill contaminants to groundwater.22 It was reported that as of February 2017, 19 of 54 LGUs in the province of Cebu have not yet submitted a SCRP in closing dumpsites.23
17TOWARDS CIRCULARITY OF POST-CONSUMER FLEXIBLE PACKAGING IN ASIA
2.2 MISSING INFRASTRUCTURE INVESTMENTS FOR MSW
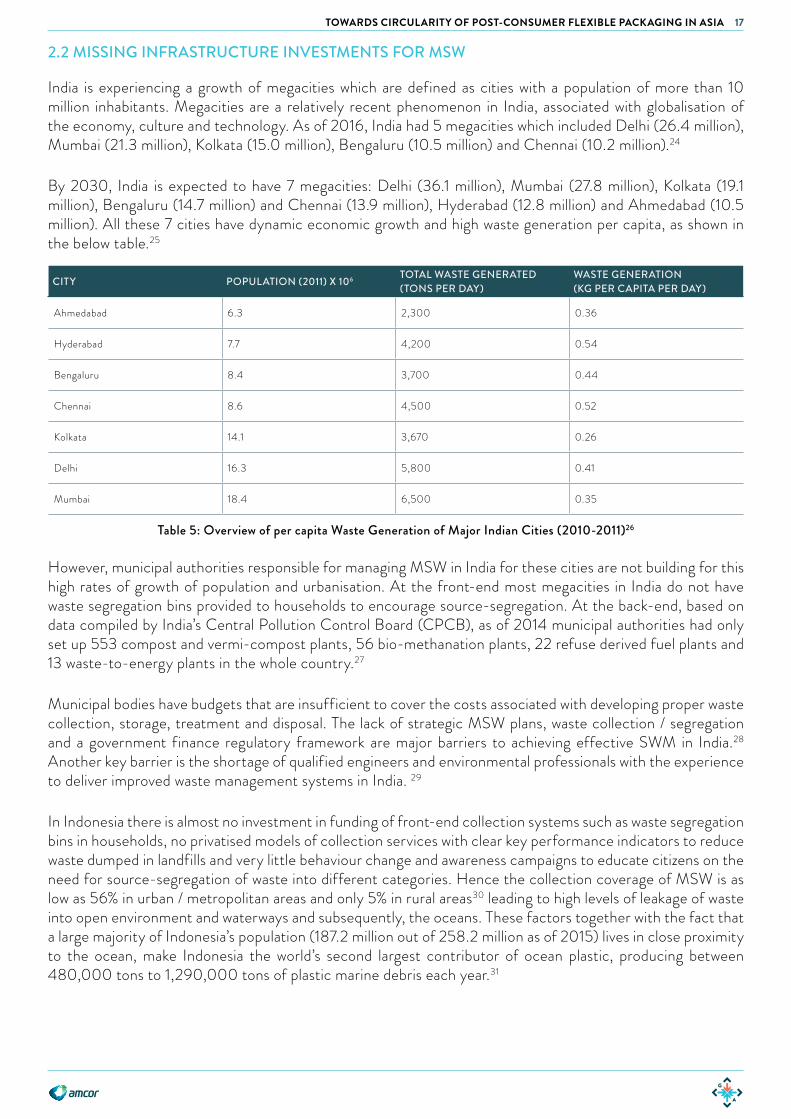
India is experiencing a growth of megacities which are defined as cities with a population of more than 10 million inhabitants. Megacities are a relatively recent phenomenon in India, associated with globalisation of the economy, culture and technology. As of 2016, India had 5 megacities which included Delhi (26.4 million), Mumbai (21.3 million), Kolkata (15.0 million), Bengaluru (10.5 million) and Chennai (10.2 million).24
By 2030, India is expected to have 7 megacities: Delhi (36.1 million), Mumbai (27.8 million), Kolkata (19.1 million), Bengaluru (14.7 million) and Chennai (13.9 million), Hyderabad (12.8 million) and Ahmedabad (10.5 million). All these 7 cities have dynamic economic growth and high waste generation per capita, as shown in the below table.25
CITY POPULATION (2011) X 106 TOTAL WASTE GENERATED(TONS PER DAY)
WASTE GENERATION(KG PER CAPITA PER DAY)
Ahmedabad 6.3 2,300 0.36
Hyderabad 7.7 4,200 0.54
Bengaluru 8.4 3,700 0.44
Chennai 8.6 4,500 0.52
Kolkata 14.1 3,670 0.26
Delhi 16.3 5,800 0.41
Mumbai 18.4 6,500 0.35
Table 5: Overview of per capita Waste Generation of Major Indian Cities (2010-2011)26
However, municipal authorities responsible for managing MSW in India for these cities are not building for this high rates of growth of population and urbanisation. At the front-end most megacities in India do not have waste segregation bins provided to households to encourage source-segregation. At the back-end, based on data compiled by India’s Central Pollution Control Board (CPCB), as of 2014 municipal authorities had only set up 553 compost and vermi-compost plants, 56 bio-methanation plants, 22 refuse derived fuel plants and 13 waste-to-energy plants in the whole country.27
Municipal bodies have budgets that are insufficient to cover the costs associated with developing proper waste collection, storage, treatment and disposal. The lack of strategic MSW plans, waste collection / segregation and a government finance regulatory framework are major barriers to achieving effective SWM in India.28 Another key barrier is the shortage of qualified engineers and environmental professionals with the experience to deliver improved waste management systems in India. 29
In Indonesia there is almost no investment in funding of front-end collection systems such as waste segregation bins in households, no privatised models of collection services with clear key performance indicators to reduce waste dumped in landfills and very little behaviour change and awareness campaigns to educate citizens on the need for source-segregation of waste into different categories. Hence the collection coverage of MSW is as low as 56% in urban / metropolitan areas and only 5% in rural areas30 leading to high levels of leakage of waste into open environment and waterways and subsequently, the oceans. These factors together with the fact that a large majority of Indonesia’s population (187.2 million out of 258.2 million as of 2015) lives in close proximity to the ocean, make Indonesia the world’s second largest contributor of ocean plastic, producing between 480,000 tons to 1,290,000 tons of plastic marine debris each year.31

18 TOWARDS CIRCULARITY OF POST-CONSUMER FLEXIBLE PACKAGING IN ASIA
2.3 LACK OF SEGREGATION
Indonesia has over 981 TPS 3Rs (temporary MSW sorting facilities) across all major cities. However approximately only 10% of these TPS 3Rs are currently being utilised.32 One of the main reasons for this is that funds are often put into infrastructure but no funds are allocated for behaviour change or day-to-day operations. The land space for these TPS 3R units is provided by the local government units as this land is owned by the local government but funding models have not been put in place to fund and sustainably operate the units. This is compounded by the fact that MSW is supposed to be segregated by houses before it comes to the TPS 3R, which is currently not happening in most cities. Hence its common to observe the TPS 3R units completely empty (50% of the units), not running in good condition (30% of the units) or local waste pickers sorting through mixed waste at the remaining units to find valuable materials which have already been contaminated due to contact with organic waste.
If segregated at source, these TPS 3R units could be utilised for receiving and treating organic waste such as the model currently in place in Depok city (see section 3.6) thereby saving a large portion of MSW from being sent to the landfills and ensuring maximum value recovery for the recyclables.
In Bengaluru, the Bruhat Bengaluru Mahanagara Palike (BBMP) or the local civic body has mandated segregation at source from February 2017. Having managed to get about 35% of the city to segregate its waste, BBMP has now set its sights on increasing this number to 60%.33 Consolidated efforts by civic bodies such as in Bengaluru to enforce source-segregation have only recently been adopted in other cities such as Mumbai and Chennai however the implementation of the initial phases of these rules have fallen far short.
Box 1: In Focus - The Reality of Low Segregation and Infrastructure Coverage in Metro Manila
In the Philippines where waste collection and separation is the responsibility of the barangays, the collection rate in Metro Manila is reported to be as high as 90%.34 However waste segregation at source from households in Metro Manila is only 62%35 and household waste separation remains poor because of the total 1,706 barangays in Metro Manila only 964 barangays are being served with an MRF36 (i.e. only 56% MRF coverage in Metro Manila).
In short, due to the lack of source-segregation and shortage of MRFs in urban areas, household waste in Metro Manila, although reportedly well-collected, is destined towards the National Capital Region’s already overflowing landfills.
2.4 LACK OF FUNDING AT FRONT-END AND LACK OF VALUE CREATION
As highlighted in The Ocean Conservancy’s 2017 Next Wave report, while well-designed waste management systems can generate revenue, current MSW management systems in cities in developing Asian countries operate at a net cost across all income levels.
To improve the financial equation, money must be spent at the front of the chain (collection and separation) to improve the value of what can be made in the middle of the chain (recycling and treatment). Some countries are able to generate enough profits to defray some of the front-end and back-end costs. But on average, only 70% of total integrated waste management costs can be covered by the profits from recycling and other waste treatment.37
Today, collection and landfill systems across developing countries in Asia are often inadequately funded from household fees and city proceeds. Moreover, waste items such as metal, glass, paper and PET bottles are removed with some efficiency by informal recyclers (“waste pickers”) and lost in the informal market, so these high-value items cannot reduce the net cost activities of the rest of the waste chain. The remaining low-value waste consists primarily of organics and plastic films that cannot be converted to higher value output without
19TOWARDS CIRCULARITY OF POST-CONSUMER FLEXIBLE PACKAGING IN ASIA
investment in waste separation and costly, sometimes unproven, treatment technologies; it is therefore destined for landfills in the majority of cases.38
Quantifying the Net Loss of Current Waste Management Models
The Ocean Conservancy estimates a net loss of USD 8 to USD 25 per metric ton from waste management and recycling activities. Specifically it calls for “Fixing the Front-End” by building modern waste source-segregation, collection and separation systems. Typically, front-end capital expenditure costs include costs of source-segregation, collection, and separation systems such as providing 2-3 collection bins in every household, carts or trucks with compactors and land and buildings for MRFs with an investment horizon of 5 to 10 years. Additionally operating expenses are required on an ongoing basis for manpower, public education, program expansion to additional locations, and other continuing improvement programs.
In contrast, back-end capital expenditure costs include costs of building composting or waste-to-energy (WTE) facilities and building sanitary landfills and require a investment horizon of between 10 to 30 years.
On average, between USD 40-70 / metric tons of waste is needed to cover basic, safe waste management services of collection and disposal in middle-income economies, depending on the model chosen with costs varying significantly depending on local conditions. Without building viable front-end systems i.e. without viable source-segregation, collection and separation systems, governments will not be able to turn waste management into a profitable service and the circularity of post-consumer flexible packaging will be severely affected and the value that can be extracted from waste will remain limited.
The Misplaced Focus on the Back-End of the Waste Value Chain without Fixing the Front-End
Alarmed by the rapid growth in waste generation and overflowing landfills, cities across India, Indonesia and the Philippines are rapidly moving to WTE technologies. This move to WTE without fixing the front-end issues of waste segregation, collection, separation and recycling represents a huge loss of intrinsic value of resources (both biological and technical resources) and locks the city governments into long-term contracts worth millions of dollars with no clear sustainable revenue stream from households or through recycling.
In short, the move towards back-end capital-intensive technologies robs city governments of the opportunity to turn waste management into a profitable utility and burdens the citizens through future taxes due to their long investment horizons.
2.5 LACK OF CITY-LEVEL REGULATIONS AND ENFORCEMENT
Of the 3 countries researched in this report, a basic foundation of national laws and pockets of local regulations in cities do exist in each country. However these laws and regulations are proving toothless due either weak implementation or complete lack of enforcement with a notable exception of just a few cities such as Depok in Indonesia, San Fernando Pampanga in the Philippines and Bengaluru in India.
The following table summarises key regulations impacting flexible plastics and post-consumer packaging in India, Indonesia, and the Philippines
See Appendix A: Regulations Impacting Post-consumer Flexible Packaging for full breakdown of relevant national laws impacting collection and circularity of post-consumer flexible packaging.

20 TOWARDS CIRCULARITY OF POST-CONSUMER FLEXIBLE PACKAGING IN ASIA
# ASPECTS OF NATIONAL-LEVEL REGULATION INDONESIA THE PHILIPPINES INDIA
1 Citizens required to segregate at household-level i.e. segregation at source Does not exist at national
level. Left to LGUs39 to mandate
Does not exist at national level. Left to LGUs to
mandate
Exists at a national-level although implementation
left to LGUs
2
Packaging producers required to limit waste generation by producing packaging that is easy to decompose and generates as little waste as possible
3Packaging producers required to produce raw materials using recycled materials pulled back used product packaging By 2022
4
Packaging producers required to produce an action plan of a post-consumer packaging collection system to collect back any plastic generated from their products
Due between September 2016 to March 2017.
Action plan needs to be implemented by March
2018
5Packaging producers required to phase out the manufacture and use of non-recyclable multilayer packaging By March 2018
6 Waste segregation and recycling awareness and infrastructure initiatives mandated in schools
7 Blanket ban on incineration of MSW
8 LGUs required to produce a roadmap for waste management within a prescribed deadline
Each city and municipality is mandated to draft a 10-year MSW Management
plan
9 Each smallest level of local government unit required to have a Materials Recovery Facility
10Publicly available national MSW management action plan with clear goals and roadmaps towards MSW reduction, segregation or recycling
Currently available National MSW
Management Strategy is from 2012-2016 which
does not include binding national-level goals or
roadmaps40
Action plan exists but has no national-level goals or
roadmaps41
11 Provision for penalties or fines for households that do not segregate
12Provision for penalties or fines for packaging producers who do not propose action plans for plastic waste management
State Pollution Control Boards will not grant / renew registration of plastic bags, or multi-
layered packaging unless the producer proposes
the action plan endorsed by the concerned State
Development Department
21TOWARDS CIRCULARITY OF POST-CONSUMER FLEXIBLE PACKAGING IN ASIA
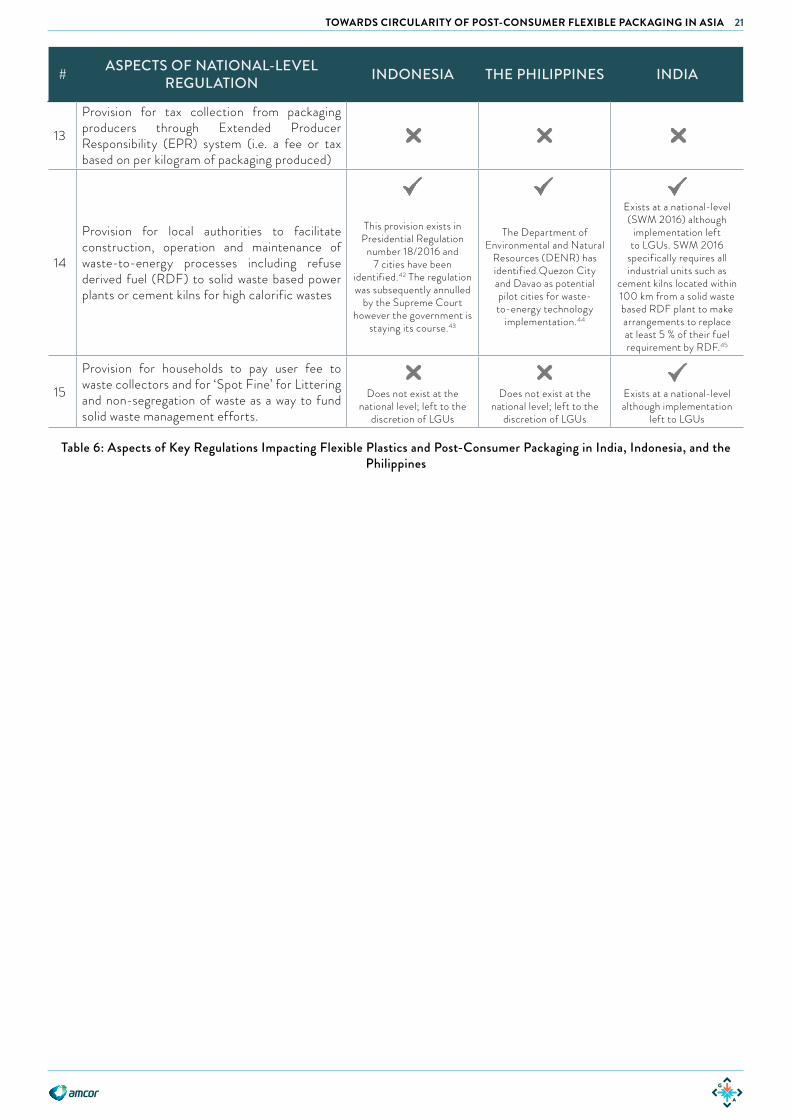
# ASPECTS OF NATIONAL-LEVEL REGULATION INDONESIA THE PHILIPPINES INDIA
13
Provision for tax collection from packaging producers through Extended Producer Responsibility (EPR) system (i.e. a fee or tax based on per kilogram of packaging produced)
14
Provision for local authorities to facilitate construction, operation and maintenance of waste-to-energy processes including refuse derived fuel (RDF) to solid waste based power plants or cement kilns for high calorific wastes
This provision exists in Presidential Regulation
number 18/2016 and 7 cities have been
identif ied.42 The regulation was subsequently annulled
by the Supreme Court however the government is
staying its course.43
The Department of Environmental and Natural
Resources (DENR) has identif ied Quezon City and Davao as potential pilot cities for waste-to-energy technology
implementation.44
Exists at a national-level (SWM 2016) although
implementation left to LGUs. SWM 2016
specifically requires all industrial units such as
cement kilns located within 100 km from a solid waste based RDF plant to make arrangements to replace at least 5 % of their fuel requirement by RDF.45
15
Provision for households to pay user fee to waste collectors and for ‘Spot Fine’ for Littering and non -segregation of waste as a way to fund solid waste management efforts.
Does not exist at the national level; left to the
discretion of LGUs
Does not exist at the national level; left to the
discretion of LGUs
Exists at a national-level although implementation
left to LGUs
Table 6: Aspects of Key Regulations Impacting Flexible Plastics and Post-Consumer Packaging in India, Indonesia, and the Philippines
22 TOWARDS CIRCULARITY OF POST-CONSUMER FLEXIBLE PACKAGING IN ASIA
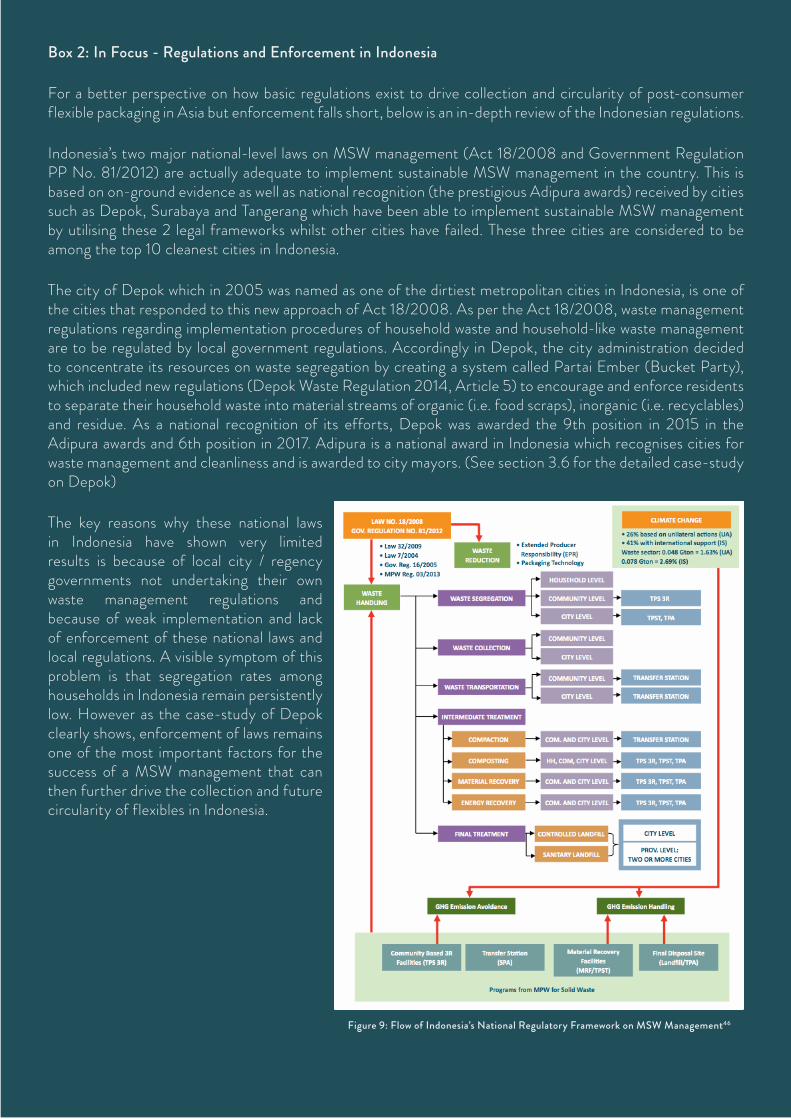
Box 2: In Focus - Regulations and Enforcement in Indonesia
For a better perspective on how basic regulations exist to drive collection and circularity of post-consumer flexible packaging in Asia but enforcement falls short, below is an in-depth review of the Indonesian regulations.
Indonesia’s two major national-level laws on MSW management (Act 18/2008 and Government Regulation PP No. 81/2012) are actually adequate to implement sustainable MSW management in the country. This is based on on-ground evidence as well as national recognition (the prestigious Adipura awards) received by cities such as Depok, Surabaya and Tangerang which have been able to implement sustainable MSW management by utilising these 2 legal frameworks whilst other cities have failed. These three cities are considered to be among the top 10 cleanest cities in Indonesia.
The city of Depok which in 2005 was named as one of the dirtiest metropolitan cities in Indonesia, is one of the cities that responded to this new approach of Act 18/2008. As per the Act 18/2008, waste management regulations regarding implementation procedures of household waste and household-like waste management are to be regulated by local government regulations. Accordingly in Depok, the city administration decided to concentrate its resources on waste segregation by creating a system called Partai Ember (Bucket Party), which included new regulations (Depok Waste Regulation 2014, Article 5) to encourage and enforce residents to separate their household waste into material streams of organic (i.e. food scraps), inorganic (i.e. recyclables) and residue. As a national recognition of its efforts, Depok was awarded the 9th position in 2015 in the Adipura awards and 6th position in 2017. Adipura is a national award in Indonesia which recognises cities for waste management and cleanliness and is awarded to city mayors. (See section 3.6 for the detailed case-study on Depok)
The key reasons why these national laws in Indonesia have shown very limited results is because of local city / regency governments not undertaking their own waste management regulations and because of weak implementation and lack of enforcement of these national laws and local regulations. A visible symptom of this problem is that segregation rates among households in Indonesia remain persistently low. However as the case-study of Depok clearly shows, enforcement of laws remains one of the most important factors for the success of a MSW management that can then further drive the collection and future circularity of flexibles in Indonesia.
Figure 9: Flow of Indonesia’s National Regulatory Framework on MSW Management46
23TOWARDS CIRCULARITY OF POST-CONSUMER FLEXIBLE PACKAGING IN ASIA
2.6 FRAGMENTED APPROACH TO MSW MANAGEMENT BY GOVERNMENT AND INDUSTRY
Waste management across developing countries in Asia remains a fragmented industry - which means there are no major players in the industry. Companies offering waste management services (this includes household waste collection, sorting services) and recycled materials tend to be small and business practices vary widely because individual owners use individual methods. However, this does not mean that the waste management and recycling industries are small. In fact, these industries remain robust and show various healthy and positive signs of growing as developing countries in Asia continue their path towards economic development.
This type of market fragmentation highlights a few realities about the waste management and recycling industry in developing Asia:
1. Growth of waste management and recycling infrastructure and services have simply not caught up with the growth of consumption and economic development
2. Government infrastructure spending on waste management is left as one of the last priorities3. The lack of recognition as an official industry in several countries4. Business or environmental standards have not emerged on a national basis and the industry is not
regulated5. Access to funding remains a challenge due to the lack of standards and lack of industry recognition6. Few large waste management companies of the calibre of the developed world 7. The industry lacks a pool of technically and financially competent talent8. Business efficiency and productivity remain low9. Companies operate under the radar leading to a huge informal sector of waste pickers in Asia who
collect the high value recyclables 10. Recycling of the high value items do not help to balance out the low value items
Too Many Government Agencies Involved in Waste Management with Overlapping Roles
An analysis of India and developing countries in Southeast Asia shows that anywhere between 5-14 government departments can be involved in several aspects of waste management and recycling at a national level.
For example in the Philippines the principal actor in the implementation of RA 9003 (the country’s Ecological Solid Waste Management Act) is the National Solid Waste Management Commission (NSWMC). Among the major functions and responsibilities of the NSWMC include:
1. Prepare the National Solid Waste Management Framework 2. Approve local SWM plans in accordance with RA 9003 rules and regulations 3. Review and monitor the implementation of local SWM plans4. Coordinate the operation of local SWM boards in the LGUs 5. Encourage private sector initiatives, community participation and investments in resource recovery-
based livelihood programs for local communities.
The NSWMC has 17 members of which 14 of them are government departments. These 14 include:1. Department of Environment and Natural Resources (DENR)2. Department of Health (DOH)3. Department of Agriculture (DA)4. Metro Manila Development Authority (MMDA)5. Department of Science and Technology (DOST)6. Department of Interior and Local Government (DILG)7. Department of Public Works and Highways (DPWH)8. Department of Trade and Industry (DTI)9. Technical Education and Skills Development Authority (TESDA)10. Philippine Information Authority (PIA)

24 TOWARDS CIRCULARITY OF POST-CONSUMER FLEXIBLE PACKAGING IN ASIA
11. League of Cities in the Philippines (LCP)12. League of Municipalities in the Philippines (LMP)13. League of Provinces in the Philippines (LPP)14. Liga ng Barangay (LnB)
NGOs have been given only 1 member seat while the industry has been given only 2 member seats.
In Indonesia, based on observations of the research team as many as three ministries - Ministry of Public Works and Public Housing, Ministry of Environment and Forestry and The Coordinating Ministry of Maritime Affairs, are involved in executing various aspects of MSW management.
In comparison, MSW management in Germany is completely under the purview of the UBA, the country’s Environment Protection Agency with a dedicated Department for Sustainable Products and Consumption Patterns and Municipal Waste Management. Similarly in Singapore MSW management is under the purview of the National Environment Agency’s Waste and Resource Management Department.
The main intention of having multiple government bodies sitting on national MSW management commissions appears to be having proper checks and balances in place. However, this thoroughly slows down the process of implementing and enforcing waste management regulations and makes it extremely hard for local waste management companies, recycling companies and companies from the manufacturing and packaging industry to navigate this overlapping maze of government agencies in terms of public sector engagement and public-private collaborations.
Lack of Up-to-Date Publicly Available Government Strategies
There is a lack of up-to-date publicly available strategies and roadmaps developed by the main government bodies in charge of waste management. The Philippines have a 2012-16 National Solid Waste Management Strategy however the 2017-2021 strategy is still not available on government websites. Similarly India has “The National Action Plan for Municipal Solid Waste Management” however it lacks goals, targets or a roadmap. While the action plan leaves it to each municipality to draw-up a time-targeted action plan for management of MSW, the national action plan itself fails to set clear overarching goals, targets or best-case practices for cities and towns to follow. In Indonesia there is no publicly available national-level strategy on MSW management.
Lack of Availability and Reliability of MSW Management and Recycling Data
Across India and developing countries in Southeast Asia it can be observed that no systematic, authentic and up to date data on MSW generation at national level and subsequently at state, district and at city / town level is available. Municipalities do not keep / maintain regular data on waste generation and its composition. This presents its own set of challenges as it is critical to have up to date data so the right set of policy, infrastructure and services interventions can be made to tackle the growing challenge of urban MSW management.
Any MSW data in developing Asian countries made available through government agencies should be considered with a degree of caution due to global inconsistencies in definitions, data collection methodologies, and completeness. The reliability of the data is influenced by undefined words or phrases, inconsistent or omitted units, estimates made without basis, incomplete or inconsistent data and information collected at a non-representative moment.
25TOWARDS CIRCULARITY OF POST-CONSUMER FLEXIBLE PACKAGING IN ASIA
In most developing Asian countries including India, Indonesia, and the Philippines the reliability of MSW data is further compromised by large seasonal variations (e.g. seasonal rains and un-containerised waste, horticultural variations), incomplete waste collection and disposal (e.g. a significant level of waste is disposed directly through local burning or thrown in waterways and low lying areas), and a lack of weighing scales at landfill sites to record waste quantities.
Lack of Large Waste Management Companies and the Need for Industry Status
It is common in developed Asian markets such as Singapore and Japan to find large waste management companies or a consortium of local and international companies involved in solid waste management contracts. Singapore, which operates a privatised waste collection and disposal model has 4 main general waste collectors (Veolia, Sembcorp, Colex, 800 Super)47 allocated to various geographical sections of the city and consortiums (such as Hyflux Singapore and Mitsubishi Heavy Industries) involved in the building and operations of WTE plants.48 Japan, which leads Asia in providing traditional and novel WTE technologies has several large waste management companies (such as Daiei Kankyo Co. Ltd., JFE Kankyo Corporation, Nakadaya Co. Ltd.).
However such consolidation of contracts of MSW management services or technologies in the hands of large companies is non-existent across India, Indonesia and the Philippines. Government contractors offering MSW management services or technologies in cities of these 3 countries are typically local companies, sometimes run by businessmen with close connections to city government officials, serving their local cities and it is extremely rare to find the same contractors offering services across multiple cities in a country. Furthermore, there is a distinct lack of presence of large multi-national MSW collection service operators such as Veolia in these countries.
While this lack of consolidation suggests room for growth in the industry, it also suggests there are significant barriers to newer waste management companies from entering the market and unseating the incumbent contractors. The lack of consolidation of services by a contractor across a country also results in a lack of best case practices shared and missed opportunities in bringing economic efficiencies in business operations.
Specifically in India, there is a need for the waste management sector to be given the status of ‘industry’ which would provide the sector the necessary boost and regulatory adherence with dedicated monitoring and compliance cell.49
2.7 THE CHALLENGING ECONOMICS OF FLEXIBLE PACKAGING COLLECTION
Recyclables collection and pre-recycling segregation remains highly concentrated in the hands of the informal sector across developing Asia. Based on the on-ground observations of the research team across India, Indonesia, and the Philippines as well other Southeast Asian countries, post-consumer flexible packaging is the least collected and least recycled item of all types of packaging.
The two key factors that makes flexible packaging highly sought after for packaging food, tobacco, cosmetics and other end-uses are its low packaging weight per unit and its multi-material, multi-layer nature. It is precisely these 2 factors of flexible packaging that make collection and recyclability challenging.

26 TOWARDS CIRCULARITY OF POST-CONSUMER FLEXIBLE PACKAGING IN ASIA
Based on on-ground interviews with informal waste and waste management companies the 2 main reasons given for the lack of collection and recycling of flexible packaging are:
1. The low weight per unit of flexible packaging - as waste pickers, who are paid by weight of recyclables collected, go after heavier packaging types which are quicker to collect per kilogram and occupy less volume.
2. The multi-material and multi-layer nature of flexible packaging (i.e. with layers of plastics, foil and / or paper) which makes it impossible for recyclers without sophisticated equipments to correctly identify the composition, sort and recycle them.
This is also why India has passed the national level regulation for a phase-out of non-recyclable multi-material plastic packaging.
Designing and producing mono-material flexible plastics which replicate the barrier and economic functionalities of multi-layer flexible packaging will be key to drive greater collection and circularity of post-consumer flexible packaging. This is a factor well within the control of the producers and packaging designers.
PET HDPE LDPE PP Low Value FlexiblesPlastic type
Time Spent to Collect 1kg of Plastic
0
25
50
75
100
125
Tim
e (m
inut
es)
Price Waste Pickers Receive for Di�erent Types of Plastics Collected
PET HDPE LDPE PP Higher Value Flexibles
Low Value Flexibles
Plastic type
0
0.1
0.2
0.3
Price
in U
SD /
kg
Figure 11: Collection Time for an Informal Waste Picker for 1kg of Various Plastic Types 34 35
Figure 12: Price Informal Waste Pickers Recieve per Plastic Type
Waste Collected from 5 schools in Metro Manila Jul-Oct 2017
Paper Plastics(Recyclable)
Metals Organic Residual(non-recyclable)
Hazardous
Material Type
2,500
kilo
gram
s
2,000
1,500
1,000
500
0
Figure 10: Collection Time for an Informal Waste Picker for 1kg of Various Plastic Type 50 51
Figure 11: Price Informal Waste Pickers Receive per Plastic Type
For Figures 11 and 12(1) Data obtained from in:terviews with waste banks throughout Indonesia. Amounts are representative of developing Asia, +/-10%.(2) High value flexibles include items such as large stand up refill pouches often made of PET / PE / Nylon layers.(3) Low value flexibles include small coffee or shampoo sachets with metals.(4) Data is representative of average amounts per material type. It is noted that PP can be as high as USD 0.60 / kg and LDPE can range significantly to be valued on par with low value flexibles.
27TOWARDS CIRCULARITY OF POST-CONSUMER FLEXIBLE PACKAGING IN ASIA
2.8 OVERLOOKED INFORMAL SECTOR OF WASTE WORKERS
The contribution of informal activities is by definition difficult to estimate as informal waste workers have no inherent reason, obligations or simply do not have the capabilities to keep records.52 Research estimates that as of 2010 India had approximately 1,500,000 informal waste workers with up to 300,000 workers in Delhi and 135,000 workers in Mumbai alone.53 The size of the informal waste workers in Jakarta is up to 37,000 and in Manila and Quezon City is upto 27,000.54
Informal systems may recycle up to 45% of the generated waste (in some specific cases even more).55 Thus, the informal sector plays a critical role in creating economic value from household waste by collecting high-value recyclables at different points (directly from households, from open dumpsites or from landfills) and therefore achieving some recovery and creating some value for certain types of packaging.
In order to further the impact of the sector, several challenges remain in bringing better livelihoods and working conditions for these workers across India, Indonesia and the Philippines.
The Need for Legitimacy and Respect
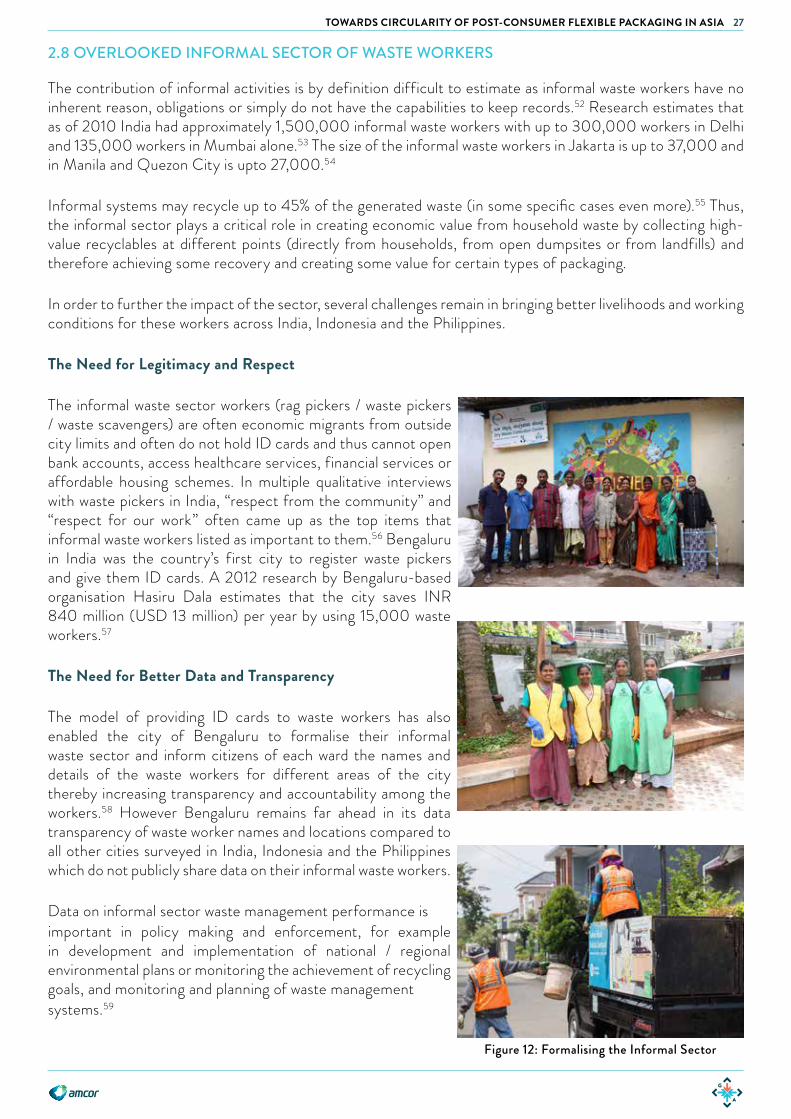
The informal waste sector workers (rag pickers / waste pickers / waste scavengers) are often economic migrants from outside city limits and often do not hold ID cards and thus cannot open bank accounts, access healthcare services, financial services or affordable housing schemes. In multiple qualitative interviews with waste pickers in India, “respect from the community” and “respect for our work” often came up as the top items that informal waste workers listed as important to them.56 Bengaluru in India was the country’s first city to register waste pickers and give them ID cards. A 2012 research by Bengaluru-based organisation Hasiru Dala estimates that the city saves INR 840 million (USD 13 million) per year by using 15,000 waste workers.57
The Need for Better Data and Transparency
The model of providing ID cards to waste workers has also enabled the city of Bengaluru to formalise their informal waste sector and inform citizens of each ward the names and details of the waste workers for different areas of the city thereby increasing transparency and accountability among the workers.58 However Bengaluru remains far ahead in its data transparency of waste worker names and locations compared to all other cities surveyed in India, Indonesia and the Philippines which do not publicly share data on their informal waste workers.
Data on informal sector waste management performance isimportant in policy making and enforcement, for example in development and implementation of national / regional environmental plans or monitoring the achievement of recycling goals, and monitoring and planning of waste managementsystems.59
Figure 12: Formalising the Informal Sector

28 TOWARDS CIRCULARITY OF POST-CONSUMER FLEXIBLE PACKAGING IN ASIA
Lack of Steady Income
A large portion of the informal waste sector earn their livelihoods by directly scavenging materials from open dumpsites or landfills instead of doing door-to-door collection from households under a contract with waste collection contractors or instead of becoming micro-entrepreneurs at recycling centres. This means the daily wages earned by the waste workers is highly volatile and is largely determined by the prices of materials per kg in the recycling sector. Therefore there is a lack of consistency in materials that are collected and city governments that rely on the informal waste workers are unable to ensure that all waste gets picked up.
Also, per kg prices of materials collected may increase by a factor of 3 up the recycling hierarchy60 so to ensure that the waste workers maintain sustainable livelihoods there is a need to integrate and move them up value chain or formalise their work through contracts with waste contractors.
Health Insurance, Protection Equipment and Better Living Conditions
Despite the poor environmental conditions of final disposal sites across India, Indonesia, and the Philippines, informal waste workers flock to these areas owing to perceived economic opportunities and the ability to collect valuable materials from mixed waste. Scavenging provides these settlers a semi-sustainable livelihood as they cannot secure employment in the formal urban market. Several research studies have shown the high prevalence of gastrointestinal, skin, upper-respiratory diseases, dengue, diarrhoea and other water borne illnesses among communities living adjacent to disposal sites in the Philippines.
Considering the informal waste workers are approximately 0.6% (0.5–2%) of the total population61 of any city in developing Asia, mobilising this segment of the population not only improves the way of life of millions of people but also creates a strong and empowered task force. Everyday the informal waste workers see first hand the environmental impact from waste and can be among the best advocates for circularity of flexible packaging.
Despite the above mentioned 8 challenges affecting the collection and circularity of flexibles, there are some promising collection efforts in India, Indonesia and the Philippines which are highlighted in the following section.

29TOWARDS CIRCULARITY OF POST-CONSUMER FLEXIBLE PACKAGING IN ASIA
3. FLEXIBLES COLLECTION EFFORTS IN INDIA, INDONESIA AND THE PHILIPPINES 3.1 HASIRU DALA INNOVATIONS (INDIA) | WASTE COLLECTOR MOBILISATION
Operating in Bengaluru, India, Hasiru Dala, an NGO, organises and trains the waste picker community to manage and operate Dry Waste Collection Centres (“DWCCs”). Hasiru Dala Innovations Pte Ltd. ( a separate for-profit entity) provides total waste solutions to bulk waste generators including apartment complexes, offices, hotels and food and beverage establishments. By organising an otherwise informal waste collector network, enforcing segregation at source and introducing waste measuring and reporting metrics, Hasiru Dala facilitates a smooth supply chain for recyclable waste solutions.
Box 3: Profile of Hasiru Dala, Bengaluru, India
Hasiru Dala NGO Founded: 2011 • Anslem Rosario • Nalini Shekhar
Hasiru Dala Innovations Founded: 2013 (Bengaluru)• Nalini Shekar (who also co founded KKPKP in
Pune in 1997, an NGO advocating for waste pickers rights as a trade union would)
• Shekar Prabhakar• Marwan Abubakar
Staff: 27
Hasiru Dala Operations: Bengaluru, Tumkur, Mysore
Focus Areas:Total waste management services (Dry, Wet, and Reject)• Serving Bulk Waste Generators• Driving Household Segregation and Public
Behaviour Change • Operating Dry Waste Collection Centres
Reach for Waste Management Services / Collection:• 43 DWCCs in Bengaluru, 14 DWCC in Mysore
and 5 DWCC in Tumkur• More than 25,000 Households • (access to) 7,500 workers
Tonnage of Materials Collected Per Year:• 3,400 tons
Tonnage of Flexibles Collected Per Year: • 300 tons per year
End State for Flexibles: Co-Processing in Cement Plants along with other combustible waste.
Key Challenges for Flexibles Waste Solutions:• Low investments in infrastructure • Low investments in operational costs • Existing solutions relies on non payment of
transport / co-processing fees to cement kilns.
Liaising with local municipal authorities, Hasiru Dala operates two separate entities, a social enterprise and a not-for-profit entity to support its waste collection efforts in Bengaluru, Mysore and Tumkur. Through its not-for-profit arm Hasiru Dala engages with municipal workers and waste pickers, providing training and financial assistance to ensure improved participation in collection efforts and citizen awareness building. Through the social enterprise entity, Hasiru Dala offers waste management services to businesses and apartment complexes. Leveraging on a city ordinance that requires bulk waste generators such as large apartment complexes, hotels, restaurants, convention halls etc. to segregate and better manage their waste, Hasiru Dala provides these establishments total waste management services.62
Bengaluru produces between 3,000 tons63 to 4,000 tons64 of waste a day, bringing their per capita waste generation to about 0.5kg per day.65 Collection and disposal of waste in Bengaluru is managed by the municipal board, Bruhat Bengaluru Mahanagara Palike (BBMP).66 Currently, the BBMP directly manages 30% of MSW, and the other 70% is outsourced.67 Spending USD 44 million per year on MSW management68, the BBMP
30 TOWARDS CIRCULARITY OF POST-CONSUMER FLEXIBLE PACKAGING IN ASIA
employs 14,000 formal waste pickers, and another 9,000 persons through private garbage contractors.69 These waste pickers operate auto tippers (one for every 1,000 households) and pushcarts (one for every 200 households) in their collection of household waste.70
Hasiru Dala, is engaged by the BBMP and works alongside the BBMP in collection and sorting of waste.71 Hasiru Dala partners with the local municipal authorities to manage and operate DWCCs in 43 (of 198) wards in Bengaluru, 14 DWCCs in Mysuru and 5 DWCCs in Tumkur. Hasiru Dala engages workers to conduct door-to-door collection, covering around 14,000 households for a total collection of 1.5-2 tons of dry waste per day in Bengaluru. In addition to collected waste, the DWCC’s managed / supervised by Hasiru Dala also buy recyclables from other waste pickers not employed / supervised by them directly.
Hasiru Dala’s success in implementing collection and segregation of recyclable waste can be attributed to the strict enforcement of the source-segregation rules. Empowering the local sanitation workers to deny collection of unsegregated waste has led to the required behaviour change amongst waste generators. Hasiru Dala promotes micro-entrepreneurship by encouraging waste workers to manage and operate DWCCs, which are operated by waste workers and are registered in their names, providing them with stability of income.
According to Hasiru Dala, the efficiency of the DWCCs can be improved with the introduction of better equipment and technology. In a relatively large DWCC (approx 5,000 sq ft) in Ward 44 (Maranpalya) in Bengaluru, a new conveyor belt system jointly sponsored by Hasiru Dala, SweepSmart, the Dutch Embassy and Dell EMC has been installed. With the addition of equipment, which includes a conveyor belt, a baler, a platform, and a Key Performance Indicator dashboard, the capacity of this DWCC has tripled from 1.5 to 5 tons / day. Such improvements, not only require larger operation area (space) but also result in increased electricity costs and additional staffing costs - approximately 8-12 people working when the system is in operation. Despite additional costs, according to Hasiru Dala, investment in equipment and infrastructure is key to increased and efficient treatment of municipal solid waste.
Post-Consumer Flexible Packaging Collection - Pilot Initiatives
Hasiru Dala has been engaged by many consumer goods companies as well industry associations to pilot different initiatives around flexibles collection, including those in partnership with Hindustan Unilever (HUL), Godrej, the Indian Beauty and Hygiene Association (IBHA), amongst others.
These initiatives have been implemented with the support of BBMP who provide the staff for collection efforts. The companies / associations sponsoring these pilots make payments to Hasiru Dala based on a per kilogram cost subsidy for the collection and segregation of post-consumer flexible waste. The amount of cost subsidies have ranged from INR 6.50 / kg to INR 12 / kg. These amounts subsidise the cost of collection, but they are not sufficient to cover costs for the entire recovery effort. The process of flexible waste collection includes costs of collection (payment to waste collectors), segregation costs, baling and packing costs as well as administrative and logistics costs. The DWCC can engage and incentivise waste collectors to collect flexible waste at a price of INR 5-6 / kg; when this amount drops INR 2-3 / kg, as is the case with lower priced pilots, the collection amounts drop as the waste workers are not adequately compensated for their efforts. Some of the segregation costs are absorbed by the DWCC due to the recovery of other more valuable waste (cross subsidies). However, the costs of baling / packing and loading unwieldy flexible waste, assessment of quality based on end solution, and measuring and recording tonnage and the costs of transportation to the end destination are not always taken care of by the amounts paid by sponsors for the pilots.
Post-consumer flexible waste collected under these pilot initiatives are sent by Hasiru Dala to cement kilns for co-processing along with other plastics, shoes, textiles and furniture as refused derived fuel (RDF) . The cement plants currently support these pilots by providing for transportation to the cement kilns. The DWCCs are required to collect flexible waste until a truckable tonnage amount is reached before transportation to cement kilns. This presents an additional cost of storage - being voluminous and lightweight, flexible waste
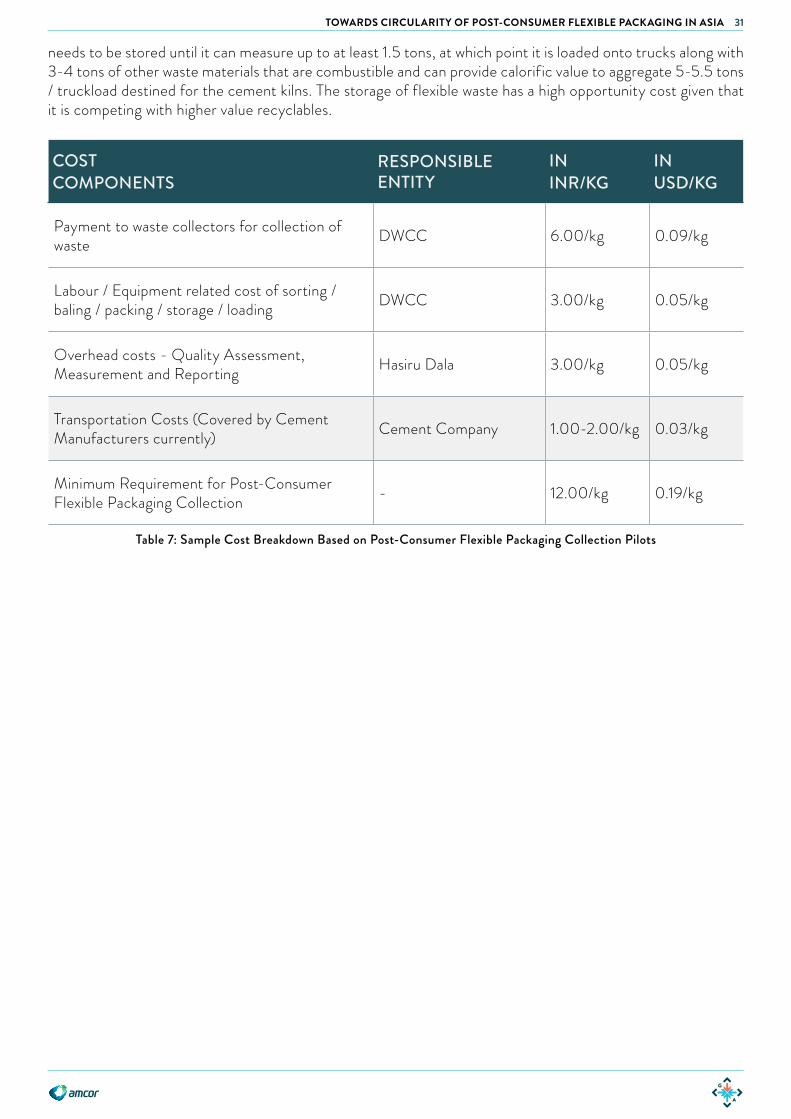
31TOWARDS CIRCULARITY OF POST-CONSUMER FLEXIBLE PACKAGING IN ASIA
COSTCOMPONENTS
RESPONSIBLE ENTITY
ININR/KG
INUSD/KG
Payment to waste collectors for collection of waste DWCC 6.00/kg 0.09/kg
Labour / Equipment related cost of sorting / baling / packing / storage / loading DWCC 3.00/kg 0.05/kg
Overhead costs - Quality Assessment, Measurement and Reporting Hasiru Dala 3.00/kg 0.05/kg
Transportation Costs (Covered by Cement Manufacturers currently) Cement Company 1.00-2.00/kg 0.03/kg
Minimum Requirement for Post-Consumer Flexible Packaging Collection - 12.00/kg 0.19/kg
Table 7: Sample Cost Breakdown Based on Post-Consumer Flexible Packaging Collection Pilots
needs to be stored until it can measure up to at least 1.5 tons, at which point it is loaded onto trucks along with 3-4 tons of other waste materials that are combustible and can provide calorific value to aggregate 5-5.5 tons / truckload destined for the cement kilns. The storage of flexible waste has a high opportunity cost given that it is competing with higher value recyclables.

32 TOWARDS CIRCULARITY OF POST-CONSUMER FLEXIBLE PACKAGING IN ASIA
3.2 WASTE VENTURES INDIA (INDIA) | WASTE MANAGEMENT SOLUTIONS PROVIDER
Waste Venture India (WVI), is a Hyderabad based waste management organisation that provides waste collection services to households and corporate clients.
Box 4: Profile of Waste Ventures, Hyderabad, India
Founded: 2011
Founded by: • Parag Gupta• Roshan Miranda
Staff: 15
Operations: Hyderabad
Focus Areas:Total waste management services (Dry, Wet, and Reject)• Serving Bulk Waste Generators• Driving Household Segregation and Public
Behaviour Change • Operating Dry Waste Collection Centres
Reach for Waste Management Services / Collection:• 1 Dry Waste Recycling Centres ( i.e. MRFs)• 14,000 Sq ft facility employing 68 workers• 22,000 Households• 15 Corporates • 1,200 workers (access to)
Tonnage of Materials Collected Per Year:• 720 tons of dry waste
Tonnage of Flexibles Collected Per Year:• Capacity to collect 360 tons per year• Based on current projections collecting 200
tons per year
End State for Flexibles: Pyrolysis and Cement Kilns
Key Challenges in Circularity for Flexibles:• Cost of Collection• Finding financially viable End Use
WVI provides waste collection services to communities in the city of Hyderabad, Telengana, engaging a trained network of over 1,200 municipal waste pickers and a 14,000 sq ft sorting facility. After an initial attempt at working for municipalities to collect and process waste failed due to payment delays and capital challenges, WVI repositioned itself as an intermediary between municipalities and waste generators. WVI collects segregated dry and organic waste, sorting it for sale to end users such as compost manufacturers and recyclers. WVI has established a viable business model that relies on revenues generated from the waste itself steering clear of capital intensive hauling and dumping activities.
WVI initiatives have been strengthened by a vast volunteer network called Green Champions, who work to mobilise new and existing waste collection workers, thus expanding WVI’s waste collection network. Additionally, through an on-demand mobile and internet technology solution, called Toter, where household recyclables are collected and weighed at an agreed upon time and location, households are incentivised to segregate their waste and receive cash for the recyclables. To empower the established but informal waste aggregator network, WVI also has launched a mobile application for junk collectors that provides daily price updates of waste materials and leased-vehicle availability to improve transparency and efficiency in the collection processes. Thus WVI gains access to the vast network of informal junk collectors and leased vehicle operators. WVI hopes to scale operations not only in Hyderabad but also in other Tier II and Tier III cities in India, so as to become a strong national player.
Post-Consumer Flexible Packaging Collection - Pilot Initiatives
WVI has partnered with companies such as Hindustan Unilever (HUL) and others to provide post-consumer flexible packaging collection in Hyderabad. Companies looking to identify solutions for post-consumer flexible
33TOWARDS CIRCULARITY OF POST-CONSUMER FLEXIBLE PACKAGING IN ASIA
waste generated as result of product packaging provide WVI with a cost subsidy to collect and process flexible waste within its dry waste processing systems. During an initial 45 day pilot, WVI collected only 4.5 tons of flexible waste. Upon scaling the pilot by engaging approximately 800 waste collectors within its network, WVI now collects upto 15-17 tons of flexible waste per month. WVI estimates collection can be increased to 25-30 tons based on their current waste collection network and sorting facilities.
As in other parts of Asia, the challenges of flexible waste collection are met when the financial incentive to collect such waste is sufficiently strong. WVI relies on the cost subsidy provided by the consumer goods companies as well as the cross subsidy generated through the recovery of other high value waste such as organic waste and PET etc. These subsidies are further strengthened by the recovery of waste from bulk waste generators such as housing societies and corporate campuses (like that of Google, Flipkart) where successful implementation of source-segregation efforts reduces sorting effort and ensures lower contamination of valuable materials.
According to WVI, despite effective collection and sorting subsidies in place, post-consumer flexible waste faces its greater challenge in the form of end use solutions. While other plastic waste materials such as PET, PP and PE all have a financially viable end use solution, flexible waste is yet to find its value in a viable end use business. WVI currently sends its flexible waste to a Hyderabad based pyrolysis facility, Hydroxy Systems Pvt. Ltd., where it is used as feedstock along with “dead plastic” (or plastic that has already been recycled 4-5 times and cannot be recycled further) to be depolymerised into fuel. A key challenge with this end use is that it requires the agglomeration (or heat compression) of the flexible waste, an energy intensive and therefore costly, additional step prior to recycling the flexible waste.
With the 2016 release of the guidelines for the co-processing of plastic waste in cement kilns, WVI is looking to explore partnerships with local cement companies to create a viable end use application for flexibles waste. A significant bottleneck is that, unlike other waste streams, cement factories are yet to recognise flexible waste as a valued /cost effective input, limiting the monetary incentives to transport and co-process flexible waste.
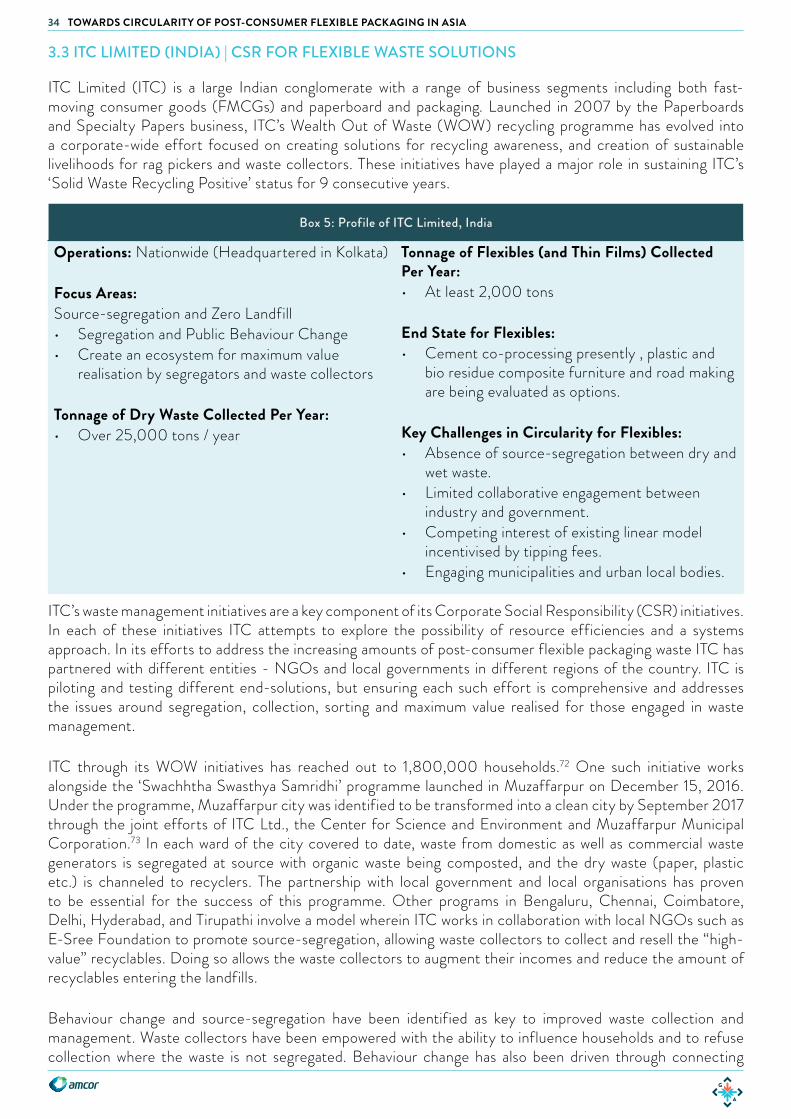
34 TOWARDS CIRCULARITY OF POST-CONSUMER FLEXIBLE PACKAGING IN ASIA
3.3 ITC LIMITED (INDIA) | CSR FOR FLEXIBLE WASTE SOLUTIONS
ITC Limited (ITC) is a large Indian conglomerate with a range of business segments including both fast-moving consumer goods (FMCGs) and paperboard and packaging. Launched in 2007 by the Paperboards and Specialty Papers business, ITC’s Wealth Out of Waste (WOW) recycling programme has evolved into a corporate-wide effort focused on creating solutions for recycling awareness, and creation of sustainable livelihoods for rag pickers and waste collectors. These initiatives have played a major role in sustaining ITC’s ‘Solid Waste Recycling Positive’ status for 9 consecutive years.
Box 5: Profile of ITC Limited, India
Operations: Nationwide (Headquartered in Kolkata)
Focus Areas:Source-segregation and Zero Landfill• Segregation and Public Behaviour Change • Create an ecosystem for maximum value
realisation by segregators and waste collectors
Tonnage of Dry Waste Collected Per Year:• Over 25,000 tons / year
Tonnage of Flexibles (and Thin Films) Collected Per Year: • At least 2,000 tons
End State for Flexibles:• Cement co-processing presently , plastic and
bio residue composite furniture and road making are being evaluated as options.
Key Challenges in Circularity for Flexibles:• Absence of source-segregation between dry and
wet waste. • Limited collaborative engagement between
industry and government.• Competing interest of existing linear model
incentivised by tipping fees. • Engaging municipalities and urban local bodies.
ITC’s waste management initiatives are a key component of its Corporate Social Responsibility (CSR) initiatives. In each of these initiatives ITC attempts to explore the possibility of resource efficiencies and a systems approach. In its efforts to address the increasing amounts of post-consumer flexible packaging waste ITC has partnered with different entities - NGOs and local governments in different regions of the country. ITC is piloting and testing different end-solutions, but ensuring each such effort is comprehensive and addresses the issues around segregation, collection, sorting and maximum value realised for those engaged in waste management.
ITC through its WOW initiatives has reached out to 1,800,000 households.72 One such initiative works alongside the ‘Swachhtha Swasthya Samridhi’ programme launched in Muzaffarpur on December 15, 2016. Under the programme, Muzaffarpur city was identified to be transformed into a clean city by September 2017 through the joint efforts of ITC Ltd., the Center for Science and Environment and Muzaffarpur Municipal Corporation.73 In each ward of the city covered to date, waste from domestic as well as commercial waste generators is segregated at source with organic waste being composted, and the dry waste (paper, plastic etc.) is channeled to recyclers. The partnership with local government and local organisations has proven to be essential for the success of this programme. Other programs in Bengaluru, Chennai, Coimbatore, Delhi, Hyderabad, and Tirupathi involve a model wherein ITC works in collaboration with local NGOs such as E-Sree Foundation to promote source-segregation, allowing waste collectors to collect and resell the “high-value” recyclables. Doing so allows the waste collectors to augment their incomes and reduce the amount of recyclables entering the landfills.
Behaviour change and source-segregation have been identified as key to improved waste collection and management. Waste collectors have been empowered with the ability to influence households and to refuse collection where the waste is not segregated. Behaviour change has also been driven through connecting
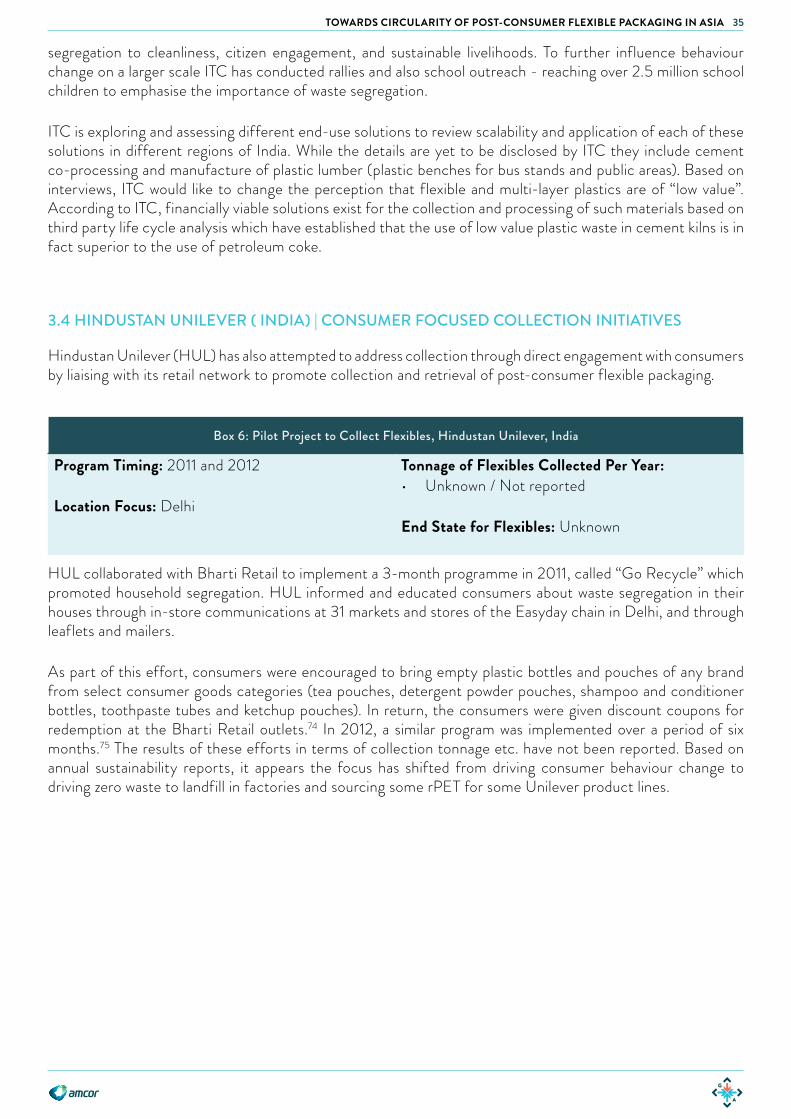
35TOWARDS CIRCULARITY OF POST-CONSUMER FLEXIBLE PACKAGING IN ASIA
segregation to cleanliness, citizen engagement, and sustainable livelihoods. To further influence behaviour change on a larger scale ITC has conducted rallies and also school outreach - reaching over 2.5 million school children to emphasise the importance of waste segregation.
ITC is exploring and assessing different end-use solutions to review scalability and application of each of these solutions in different regions of India. While the details are yet to be disclosed by ITC they include cement co-processing and manufacture of plastic lumber (plastic benches for bus stands and public areas). Based on interviews, ITC would like to change the perception that flexible and multi-layer plastics are of “low value”. According to ITC, financially viable solutions exist for the collection and processing of such materials based on third party life cycle analysis which have established that the use of low value plastic waste in cement kilns is in fact superior to the use of petroleum coke.
3.4 HINDUSTAN UNILEVER ( INDIA) | CONSUMER FOCUSED COLLECTION INITIATIVES
Hindustan Unilever (HUL) has also attempted to address collection through direct engagement with consumers by liaising with its retail network to promote collection and retrieval of post-consumer flexible packaging.
Box 6: Pilot Project to Collect Flexibles, Hindustan Unilever, India
Program Timing: 2011 and 2012
Location Focus: Delhi
Tonnage of Flexibles Collected Per Year: • Unknown / Not reported
End State for Flexibles: Unknown
HUL collaborated with Bharti Retail to implement a 3-month programme in 2011, called “Go Recycle” which promoted household segregation. HUL informed and educated consumers about waste segregation in their houses through in-store communications at 31 markets and stores of the Easyday chain in Delhi, and through leaflets and mailers.
As part of this effort, consumers were encouraged to bring empty plastic bottles and pouches of any brand from select consumer goods categories (tea pouches, detergent powder pouches, shampoo and conditioner bottles, toothpaste tubes and ketchup pouches). In return, the consumers were given discount coupons for redemption at the Bharti Retail outlets.74 In 2012, a similar program was implemented over a period of six months.75 The results of these efforts in terms of collection tonnage etc. have not been reported. Based on annual sustainability reports, it appears the focus has shifted from driving consumer behaviour change to driving zero waste to landfill in factories and sourcing some rPET for some Unilever product lines.

36 TOWARDS CIRCULARITY OF POST-CONSUMER FLEXIBLE PACKAGING IN ASIA
3.5 WASTE4CHANGE (INDONESIA) | RESPONSIBLE WASTE MANAGEMENT
A subsidiary of PT Greeneration Indonesia, Waste4Change (W4C) is social enterprise that provides waste management services primarily in Greater Jakarta and with an ambition to expand its services throughout Indonesia. Another subsidiary, Greeneration Foundation, drives campaigns and awareness about waste issues and recycling opportunities in Indonesia. Using technology and crowd-sourcing to drive data centric solutions and citizen engagement, Greeneration Foundation works closely with W4C in exploring forward thinking solutions to address waste concerns in Indonesia. W4C routinely conducts composition analyses and transparent data collection to arrive at improved solutions to responsible waste management. Companies and local governments have engaged W4C to conduct research, consultancy and feasibility analyses around waste solutions. W4C also conducts 3R (Reduce, Reuse, Recycle) training at schools and businesses to increase awareness and improve effectiveness of waste collection.
Box 7: Profile of Waste4Change, Indonesia
Founded: 2014
Founded by: Mohamad Bijaksana Junerosano(as a Partnership between Greeneration Foundation founded in 2005 and ecoBali Recycling founded in 2006)
Staff: • 10 full time• 10 temporary / volunteer staff
Operations: Greater Jakarta (with a focus on Jakarta, Bekasi and Tangerang)
Focus Areas:• Collection and Recycling Services • Event Waste Management • Campaigns and Awareness• Consulting Government on better policies
Reach / Capacity for Waste Management Services / Collection:• 1 Materials Recovery Facility in Bekasi • 2,000 Households • 10,000 People • 5 Corporate Clients
Materials Collected Per Year:• 300 tons of organic and inorganic
Flexibles Collected Per Year:• 9-12 tons
End State for Flexibles: • Higher value and uncontaminated flexibles sold
to recycler • Contaminated sent to Landfill as do not have
equipment to clean the contaminated flexibles and financial return would not be sufficient to justify cleaning
Key Challenges for Flexibles Waste Solutions:• W4C does not have a viable recycling location
to send flexibles. They are currently looking into logistics to send flexibles to Unilever’s Solvolysis plant in Surabaya once launched in December 2017.
Offering total waste management services since 2014, W4C has been providing waste collection services to approximately 2,000 households, as well as some corporate offices, event companies (at event locations) and the Potato Head restaurant group, all in Greater Jakarta. They also provide their services to businesses seeking end-of-life solutions for discontinued or branded products. Each month, W4C collects 22 tons from households and the remaining 10 tons from corporate offices. W4C processes organics into compost and is able to recycle an average of 50% of inorganic materials it collects. Based on research and on ground exprierence, approximately 4% of household waste that W4C collects is flexible packaging.
37TOWARDS CIRCULARITY OF POST-CONSUMER FLEXIBLE PACKAGING IN ASIA
W4C classifies flexible plastics under ‘residual waste’. Besides flexible plastics, residual waste comprises of non-recyclable items such as used tissue, textiles, styrofoam and rubber as well as sanitary waste. W4C processes the flexible waste in the following manner. • “Plastic-only” flexibles (such as detergent pouches) are recovered from this residual waste and sent to a
local recycler. The plastic is potentially shredded and sold to a plastic recycling factory, but information with respect to this process is scant.
• Unsegregated / commingled and / or post-consumer flexible packaging from household collection are sent to the landfill (Bekasi final disposal site / landfill - TPA Sumur Batu) so as to ensure that it is not burned or otherwise leaked into the environment as is commonly the case.
• Flexible waste from corporate collection are sent to Holcim’s GeoCycle - which is a cement plant that processes the waste as an energy input for manufacturing cement. Doing this achieves “zero waste to landfill” status for the companies, but comes at a cost, often covered by the companies themselves. Sending flexibles to GeoCycle costs a total of IDR 3,350,000 (USD 251) per ton (IDR 850,000 per ton for transportation and IDR 2,500,000 for pre-processing). This amount is prohibitive when compared to costs of transportation to and tipping at landfill of approximately IDR 400,000 (USD 30) per ton.
Box 8: Waste Pickers Collecting Flexibles
According to research conducted by W4C, one type of flexible plastic (detergent pouches) scavenged from the at Bantar Gebang Landfill of Greater Jakarta has an existing recycling market.
The waste pickers receive an established price of IDR 1,500 / USD 0.11 per kg for the pouches, and then the Bandar (aggregator) on sells at IDR 2,500 / USD 0.18 when selling to a larger aggregator or to end recycling factories. The plastics are collected and sold to an aggregator to be sent to a plastics recycling factory. The end use of the recycled material remains undisclosed. There are reports of similar collection in Surabaya and potentially throughout the rest of Indonesia.

38 TOWARDS CIRCULARITY OF POST-CONSUMER FLEXIBLE PACKAGING IN ASIA
While Indonesia’s Waste Management law No. 18/2008 does not require citizens to source-segregate their waste for recycling, individual LGUs can mandate citizens to do so through a LGU-level regulation. However implementation and enforcement of such LGU-level regulations plus behaviour change campaigns have been limited, so less than 5% of citizens nationwide segregate and even when they do, the government or contracted waste collector often mixes the materials back together as it is inefficient to create separate streams with limited participation.
Through Depok’s Bucket Party “Partai Ember” system, the 100,000 residents in the selected wards are required to segregate their waste into ‘buckets’ for organics, recyclables, and residual waste.
Organic waste is sent to community level composting centres (called UPS) where it is turned into compost. Prior to implementation of this program, there were 40 composting centres in Depok City measuring between 300-600m2 in size which were only being used as transfer stations for mixed waste. The mixed waste was
3.6 DEPOK CITY (INDONESIA) | HOUSEHOLD SEGREGATION AT SCALE
Depok, a city in Indonesia and a part of the administrative area of Greater Jakarta, is the first city in Indonesia to have enforced large scale segregation targeting a total of 100,000 households, which represents 22% of Depok’s 2.1 million population.
Household waste segregation was practically unheard of until 2012, when Pak Zamrowi Hasan, the Head of the Cleanliness Department of Depok decided to launch a new system called Partai Ember (“the Bucket System”). He was inspired by the segregation and zero-waste efforts of Osaki in Japan to combat the overflowing landfills in Depok, leachate leakage into waterways and landslides over recent years.
Box 9: Waste Management System in Depok, Greater Jakarta, Indonesia
Location: Depok City of Greater Jakarta
Recognition / Awards: Winner of much coveted ADIPURA prize76 in August 2017 - which recognises the cities in Indonesia for waste management and cleanliness.
Reach for Waste Management Services / Collection:• 100,000 Households • 400,000 people
Materials Collected Per Year: 61,320 tons
Flexibles Collected Per Year: 6,120 tons
End State for Flexibles: • Sent to Landfill (~ 90%) • Waste banks (~10%)
• To be sold to local recyclers (in the case of pouches)
• A minor amount for Handicrafts
Key Challenges in Circularity for Flexibles:• No viable recycling location to send flexibles.
Figure 13: Segregation and Material Flows for Depok

39TOWARDS CIRCULARITY OF POST-CONSUMER FLEXIBLE PACKAGING IN ASIA
picked up in small carts from households and aggregated into a big dump truck to be sent to landfill. With household segregation, these transfer stations have been converted into highly successful composting centres, each processing 1-3.5 tons of organic inputs per day. An additional 10-30 tons per day of city landscape organic matter from the whole of Depok City is also diverted from landfill and sent to UPS’s for composting. Inorganic recyclable materials are sent to community waste banks (bank sampah) and then sold to recyclers.There were only 3 waste banks before the launch of Partai Ember, but by 2016 there were 400 waste banks serving 2,000 wards of Depok.77
As flexible plastics and laminates currently do not have a recycling market, they are generally categorised as residual and sent to the landfill. A small amount (approximately 10%) of all flexibles are sent or sold to waste banks to be sent to recyclers (as in the case of pouches for example, which have a market) and upcycled into handicrafts.78
Figure 14: UPS (Composting Centre) in Depok. Organic Scraps Being Sorted to Remove Any Minor Plastic Pieces Wrongly Segregated, then Composted.
Within a year of implementation, 100,000 households (with a population of about 500,000 people) have been complying in segregating at home, which enables about 75% of materials (or about 127 tons per day) to be diverted from landfill every day. The estimated79 breakdown is as follows:
ITEM TONS % SENT TO / END STATE
Total Generation from 100,000 households 168 100
Organic 104 62% Composting Centres (UPS) and Compost
Recyclables (metal, plastic, paper, card and minimal amounts of flexibles) 23.5 14% Waste Banks and Recycled
Diverted from Landfill 127.5 76%
Reject / Residue - made up of:
• Reject / Residue (non-recyclable items such as flexible plastics, plastic bags)
• Reject / Residue (non segregated, sanitary / medical waste such as diapers, sanitary napkins, textiles, wood)
40.5
17
23.5
24%
10%
14%Landfill
Sent to Landfill 40.5 24%
Table 8: Materials Breakdown for 100,000 Households of Depok

40 TOWARDS CIRCULARITY OF POST-CONSUMER FLEXIBLE PACKAGING IN ASIA
Figure 15: Upcycling to Handicrafts. At Less than a Few Percent of All Flexibles Collected, it is Not a Scalable Option
The key enablers for segregation success in Depok city have been:
• Enforcement. The cleanliness department of the city government refused to pick up the waste if the households didn’t segregate. While this was, at first, thought to be an empty threat as the government had tried to enforce segregation in the past, after two or three days of residents’ waste not being picked up and calling up to complain to no avail, the residents realised they needed to segregate in order to get their ‘waste’ (now material streams) picked up.
• Fines and ‘waste police’. If any individuals were caught throwing their household trash into the rivers or open environment they were fined IDR 150,000 to 200,000 (USD 11 to 15) and taken to court. The fee was minimal, but upon being sent to court they had no choice but to plead guilty and this was then often covered by media. All of this raised awareness that if citizens litter into the open environment or do not segregate, they will be sent to court resulting in adverse attention. Over the course of a year, 300 people from Depok were sent to court. A total of 25 waste police covered the selected wards in Depok as well as the greater area of Depok, as the city soon realised people would travel to a different area to dispose of their waste - e.g. throw out of their motorbike or car on the way to work. Note that the police were not new hires, but were just transferred from other duties, so this is a process easily transferable to other parts of Indonesia and the region.
• New collection schedules and different vehicles for each material type. Depok changed from mixed collection (where all materials were collected at once and mixed together, even if the household was segregating) to different collection vehicles to ensure that the materials were not mixed up by the collectors. A small vehicle is used to transport the organic waste from households to the UPS of the ward. The recyclables are transported to the waste banks. And a different truck is used to transfer the non-recyclable / residual waste to the landfill.
• Financial incentives for households. Households that segregate their materials receive the benefit of no longer needing to pay their waste collection fee of IDR 15,000.
• Sister City Partnership and Learning. Since 2012, one hundred representatives from Depok per year have been visiting their sister city, Osaki, in Japan, to learn about waste management and cleanliness. However nothing happened as a result of this learning until Pak Zamrowi committed to creating an action plan and to continue implementing until success was achieved. He credits Osaki with much of his learning and knowledge to be able to implement the program: “We could not have done it without the knowledge, learning and technical support from Osaki” - Pak Zamrowi.
If the remaining 350,000 households and all bulk waste generators (buildings, schools, etc) of Depok City segregate, then a total of 900 tons (75%) of materials would be diverted from landfill out of the current city wide generation of 1,200 tons per day. With an effective technology and end use for flexibles in the vicinity of Greater Jakarta, a further 120 tons per day of flexibles and non-recyclable plastics could be diverted from landfill.
41TOWARDS CIRCULARITY OF POST-CONSUMER FLEXIBLE PACKAGING IN ASIA
The Case for the Depok System when Compared with Other Cities in Indonesia
Throughout Indonesia there are thousands of TPSs, which are buildings or covered areas intended as a location for materials to be segregated. However, these primarily function as transfer stations for mixed waste - i.e. the mixed waste would be picked up from households by small carts, dropped at a TPS and then loaded into a large truck to be taken to the landfill.
Recognising that the TPSs were being used as transfer stations, the Indonesian government started building TPS 3Rs, which are larger (ranging from 200m2 to 1,000m2 in size), with the vision that these would be used to receive already segregated household material streams. However, these TPS 3Rs are still functioning (if at all) as transfer stations for mixed waste. The cities of Malang and Surabaya are often seen as leaders in waste management in Indonesia, but as in other parts of the country their TPS 3Rs are still receiving mixed waste to be sorted at the TPS 3R. When compared to the Depok city example they are both extremely ineffective and inefficient. As noted by Pak Zamrowi TPS 3Rs can not do both organic and inorganic; TPS 3Rs should only process organic materials, and the recyclables should be sent to waste banks or recycling centres.
Box 10: Waste System in Malang and Greater Surabaya, Java, Indonesia
Malang is considered to have some of the best TPS 3Rs in Indonesia and Surabaya is considered as a leading city for waste management with some pockets of segregation success. However, upon closer inspection, both cities are using their TPS 3R’s as sorting facilities for mixed waste with anywhere between 25 to 100 people in each facility sorting through mixed waste from households.
Whilst this achieves some diversion from landfill (30% of materials are taken out for recycling)80, it is extremely inefficient due to high manpower needs and ineffective (low diversion of 30% from landfill compared to Depok at about 75%).
Population of Greater Malang:• 2.7 million People; 500,000 Households
Population of Greater Surabaya:• 2.8 million People; 700,000 Households
End State for flexibles:• Any picked out and cleaned, and which are
recyclable, are sent to recycler • Majority sent to Landfill
Key Challenges for Post-Consumer Flexible Packaging:• No source-segregation • Lack of technology for end processing
42 TOWARDS CIRCULARITY OF POST-CONSUMER FLEXIBLE PACKAGING IN ASIA
3.7 WASTE BANKS (INDONESIA) | COMMUNITY RECYCLING CENTRES
In 2008, the Unilever Indonesia Foundation (Yayasan Unilever) recognised Community waste banks (locally known as bank sampah) as a means to prevent inorganic waste materials including non-recyclables such as flexible plastics from entering the open environment and waterways. Supported by the Unilever Indonesia Foundation, there are now 1,600 waste banks in Indonesia which engage approximately 72,000 people / members throughout Indonesia who segregate their recyclables and drop them off at the nearby waste bank for a small monetary incentive. In 2015, the waste banks collected a total of over 3,700 tons of inorganic materials. In addition to the waste banks supported by Unilever, there are close to 3,500 additional waste banks in the country.
Box 11: Profile of Community Waste Banks
Operations: Throughout Indonesia. The highest density of waste banks is within Java island, followed by reach in Sulawesi (with Makassar city), Kalimantan (with Balikpapan city), Sumatra (Medan city) and other regions in Indonesia.
Reach for Collection:• 72,000 People, • 14,400 Households
Materials Collected by all 1,600 Waste Banks Per Year: • 3,700 tons inorganic (in 2015)• 40% Plastic: ~ 1,480 tons81
• 60% Other Recyclables (e.g. metals, paper): ~2,220 tons
Flexibles Collected Per Year: 740 tons (in 2015)82
Flexibles Collected Per Month: 62 tons (in 2015)
Flexibles Collected Per Month Per Waste Bank:38 kg (in 2015)
End State for Flexibles: Upcycling into Handicrafts (bags, purses, etc)
Key Challenges for Post-Consumer Flexible Packaging:• Whilst this provides incomes to communities,
it is not scalable to upcycle flexible plastics into handicrafts as it’s labor intense and there are many times more sachets than demand for items made from upcycled plastics.
Set up to serve their local neighbourhoods, each waste bank accepts recyclable waste (materials) and pays the residents money for the waste (materials) they bring in. This money is stored on ‘bank accounts’ under each residents’ name much like a regular bank. Thus, not only are the community members successfully feeding into the recycling system and diverting waste from landfill, they are also saving money by doing so. While members are able to withdraw money generally, in some cases, they receive other equivalent incentives such as health insurance. An innovative waste bank system in Malang called Garbage Clinical Insurance by Indonesia Medika uses garbage as an health insurance premium.
Typically operated by the community, some waste banks have been quite successful engaging up to 200-400 members, collecting up to 2 tons of materials per month and have had total turnover of IDR 5 to 8 million (USD 378 - 604) per month. However, the vast majority have not achieved such reach and collection rates, with low membership, with collections as low as 30 kg per month, earning IDR 1,000 (UDS 0.07) a month. Even successfully operating waste banks have had to supplement their income through providing training and workshops to companies, government, etc, which often brings more revenue (60-80% of total revenue) than sales of recyclables.83 The community run waste banks also aim at creating solutions for non-recyclable materials such as post-consumer flexible packaging and building sustainable livelihoods through upcycling of post-consumer flexible packaging into handicrafts - but since they are labour and time intensive, and given the high quantities of flexible waste being produced, these are not scalable.

43TOWARDS CIRCULARITY OF POST-CONSUMER FLEXIBLE PACKAGING IN ASIA
Figure 16: Women Upcycling Multilayer Sachets into Handicrafts in Bogor, Indonesia
Figure 17: Successful Waste Banks in 201584
Waste banks have been applauded by government and NGOs as the solution to Indonesia’s waste challenges (and a way to provide extra income to the community). However a key limitation of waste banks can be observed based on the level of community engagement - a total membership of 72,000 people across 1,600 waste banks equates to about 45 people / members on average per waste bank and thus a reach of only 0.03% of Indonesia’s total population of 261 million - i.e. the reach after almost 10 years of waste banks shows the model is not the solution to developing Asia’s waste management and recycling challenges.
Based on our observations and discussions with waste management companies based in Indonesia the key reasons for the low reach and tonnage managed by each waste banks on average are:
• Limited national level education and behaviour change campaigns. Lack of nationwide behaviour change campaigns and education on importance of segregation, recycling and not littering into the open environment
• Low financial incentive. The financial incentive for a family dropping off their recyclables and non-recyclable plastics such as some flexibles at the local waste bank is too low. On average, it is believed to be just IDR 10,000 (USD 0.75) / month per family. Even though 50% of Indonesians live below USD 2 / day (approx USD 60-120 / month per family), the potential upside of USD 0.75 has not been enough compared to the perceived work involved to segregate household materials and drop off at the local waste bank. As average household annual disposable income has increased (5% YoY from 2006-2011, up to USD 6,901), the relevance of waste banks as an extra income stream decreases significantly.
• Lack of convenience. Families need to make the extra time and effort to drop off their recyclables at the community waste bank which may be at considerable distance from their homes (as opposed to including it is in their waste for municipal collection at their homes). This is not solved when source-segregation rules are enforced, as while enforcement leads to an increased awareness regarding the benefits of segregation, a vast majority of houses still prefer to leave the recyclables in segregated manner outside their house and have it picked up by local government and then sold to recyclers, as opposed to them taking it to the waste banks.
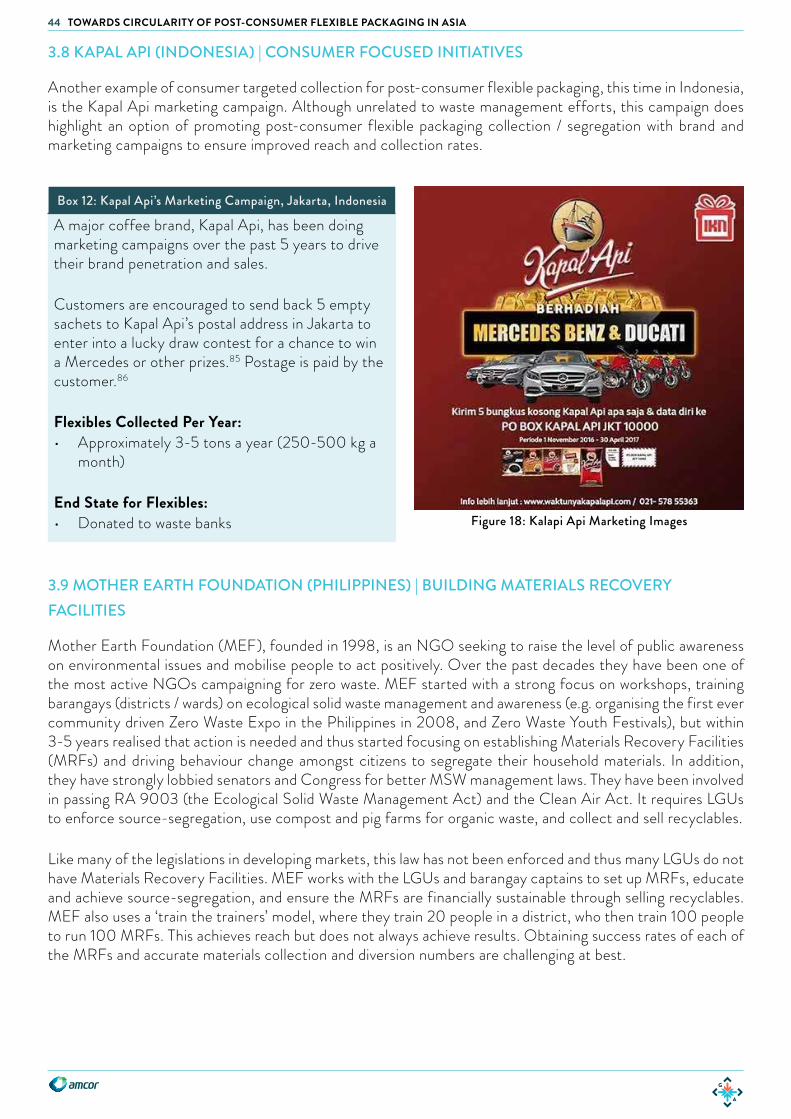
44 TOWARDS CIRCULARITY OF POST-CONSUMER FLEXIBLE PACKAGING IN ASIA
3.8 KAPAL API (INDONESIA) | CONSUMER FOCUSED INITIATIVES
Another example of consumer targeted collection for post-consumer flexible packaging, this time in Indonesia, is the Kapal Api marketing campaign. Although unrelated to waste management efforts, this campaign does highlight an option of promoting post-consumer flexible packaging collection / segregation with brand and marketing campaigns to ensure improved reach and collection rates.
Box 12: Kapal Api’s Marketing Campaign, Jakarta, Indonesia
A major coffee brand, Kapal Api, has been doing marketing campaigns over the past 5 years to drive their brand penetration and sales.
Customers are encouraged to send back 5 empty sachets to Kapal Api’s postal address in Jakarta to enter into a lucky draw contest for a chance to win a Mercedes or other prizes.85 Postage is paid by the customer.86
Flexibles Collected Per Year:• Approximately 3-5 tons a year (250-500 kg a
month)
End State for Flexibles: • Donated to waste banks Figure 18: Kalapi Api Marketing Images
3.9 MOTHER EARTH FOUNDATION (PHILIPPINES) | BUILDING MATERIALS RECOVERY FACILITIES
Mother Earth Foundation (MEF), founded in 1998, is an NGO seeking to raise the level of public awareness on environmental issues and mobilise people to act positively. Over the past decades they have been one of the most active NGOs campaigning for zero waste. MEF started with a strong focus on workshops, training barangays (districts / wards) on ecological solid waste management and awareness (e.g. organising the first ever community driven Zero Waste Expo in the Philippines in 2008, and Zero Waste Youth Festivals), but within 3-5 years realised that action is needed and thus started focusing on establishing Materials Recovery Facilities (MRFs) and driving behaviour change amongst citizens to segregate their household materials. In addition, they have strongly lobbied senators and Congress for better MSW management laws. They have been involved in passing RA 9003 (the Ecological Solid Waste Management Act) and the Clean Air Act. It requires LGUs to enforce source-segregation, use compost and pig farms for organic waste, and collect and sell recyclables.
Like many of the legislations in developing markets, this law has not been enforced and thus many LGUs do not have Materials Recovery Facilities. MEF works with the LGUs and barangay captains to set up MRFs, educate and achieve source-segregation, and ensure the MRFs are financially sustainable through selling recyclables. MEF also uses a ‘train the trainers’ model, where they train 20 people in a district, who then train 100 people to run 100 MRFs. This achieves reach but does not always achieve results. Obtaining success rates of each of the MRFs and accurate materials collection and diversion numbers are challenging at best.

45TOWARDS CIRCULARITY OF POST-CONSUMER FLEXIBLE PACKAGING IN ASIA
Box 13: Profile Mother Earth Foundation, Metro Manila, Philippines
Founded: 1998 as NGO
Founded by: Sonia Mendoza
Staff: 10
Operations: Metro Manila, San Fernando Pampanga
Focus Areas:• Campaigns and awareness• Driving segregation • Working with barangays and schools to create
successful MRFs
End State for Flexibles: Landfill
Key Challenges for Flexibles Waste Solutions:• In principle (and per Clean Air Act), against
incineration, pyrolysis, etc and would prefer to send to landfill.
MEF has been involved in creating several MRFs across the Philippines. As the majority of flexibles are not recyclable in an economically viable manner, all flexibles collected through MEF’s MRFs are sent to landfill. They are not sent to incineration, pyrolysis, solvolysis, or other processing methods as MEF is, on principle, opposed to incineration, pyrolysis and other processing technologies that MEF views as polluting the environment. In addition, these technologies are banned by the Clean Air Act. Even though flexibles are currently sent to landfill, MEF’s work in driving total waste management and behaviour change towards segregation is critical in achieving circularity for flexibles over the coming years.
Setting up MRFs for Barangays and Empowering Community
MEF’s work in setting up a model MRF for Fort Bonifacio barangay along with the barangay administration is a prime example of their work. The barangay is home to about 12,000 people in the highly populated Taguig area which has 28 barangays, a total population of more than 800,000 and a big waste management challenge with most “transfer stations” ending up as open dump sites. Results after 1 year include:
• 100% collection coverage and 95% of residents complying with segregation. • 80% materials diversion through composting and recycling at the Fort Bonifacio barangay MRF. Only
20% is sent to landfill. • Use of garbage trucks has dropped from 4 trips to 1 trip per day, leading to savings of at least PHP
15,000 (USD 293) per day from hauling and tipping fees. Equivalent to USD 107,000 per year.• From savings, 23 residents have been employed by the barangay as official community organisers,
MSW liaison officers and barangay collectors. • The informal waste collectors have been integrated into the project and now earn 5 times more (from
PHP 1,500 as waste pickers) to a minimum salary of PHP 8,000 plus all proceeds from the sale of recyclables divided amongst themselves.
• 300 tons of food and organic scraps composted every month through windrow composting.
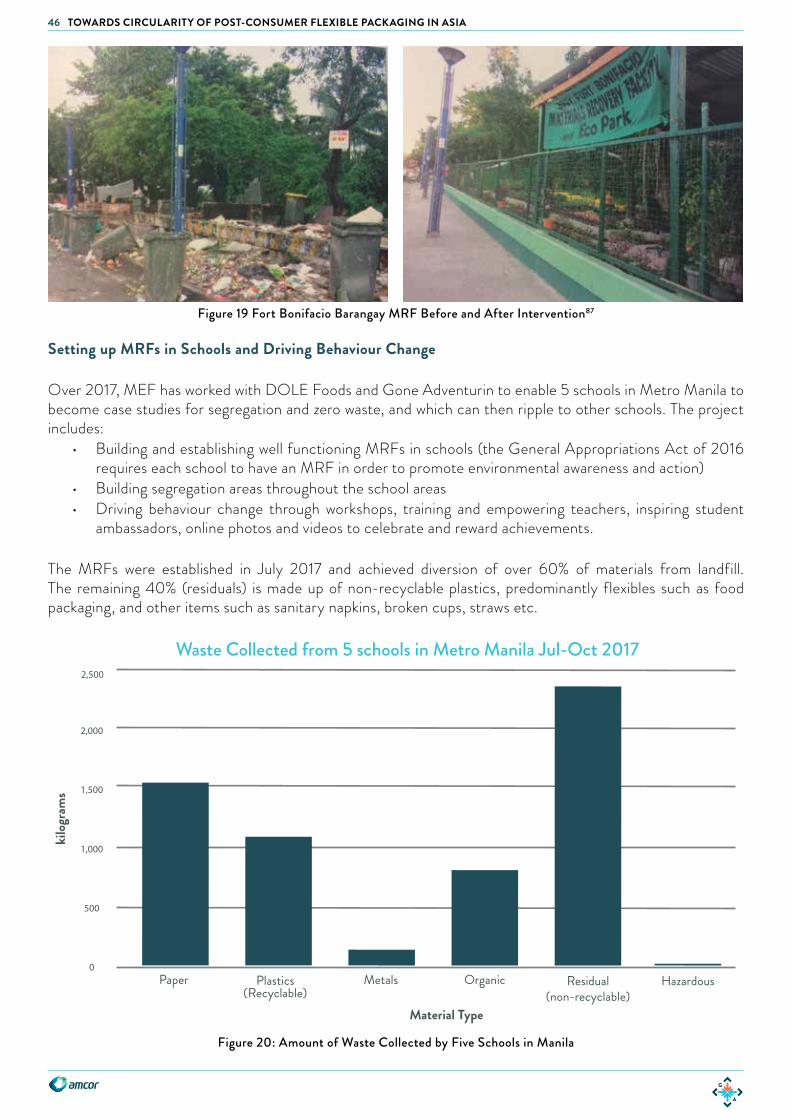
46 TOWARDS CIRCULARITY OF POST-CONSUMER FLEXIBLE PACKAGING IN ASIA
Figure 19 Fort Bonifacio Barangay MRF Before and After Intervention87
Setting up MRFs in Schools and Driving Behaviour Change
Over 2017, MEF has worked with DOLE Foods and Gone Adventurin to enable 5 schools in Metro Manila to become case studies for segregation and zero waste, and which can then ripple to other schools. The project includes:
• Building and establishing well functioning MRFs in schools (the General Appropriations Act of 2016 requires each school to have an MRF in order to promote environmental awareness and action)
• Building segregation areas throughout the school areas • Driving behaviour change through workshops, training and empowering teachers, inspiring student
ambassadors, online photos and videos to celebrate and reward achievements.
The MRFs were established in July 2017 and achieved diversion of over 60% of materials from landfill. The remaining 40% (residuals) is made up of non-recyclable plastics, predominantly flexibles such as food packaging, and other items such as sanitary napkins, broken cups, straws etc.
PET HDPE LDPE PP Low Value FlexiblesPlastic type
Time Spent to Collect 1kg of Plastic
0
25
50
75
100
125
Tim
e (m
inut
es)
Price Waste Pickers Receive for Di�erent Types of Plastics Collected
PET HDPE LDPE PP Higher Value Flexibles
Low Value Flexibles
Plastic type
0
0.1
0.2
0.3
Price
in U
SD /
kg
Figure 11: Collection Time for an Informal Waste Picker for 1kg of Various Plastic Types 34 35
Figure 12: Price Informal Waste Pickers Recieve per Plastic Type
Waste Collected from 5 schools in Metro Manila Jul-Oct 2017
Paper Plastics(Recyclable)
Metals Organic Residual(non-recyclable)
Hazardous
Material Type
2,500
kilo
gram
s
2,000
1,500
1,000
500
0
Figure 20: Amount of Waste Collected by Five Schools in Manila
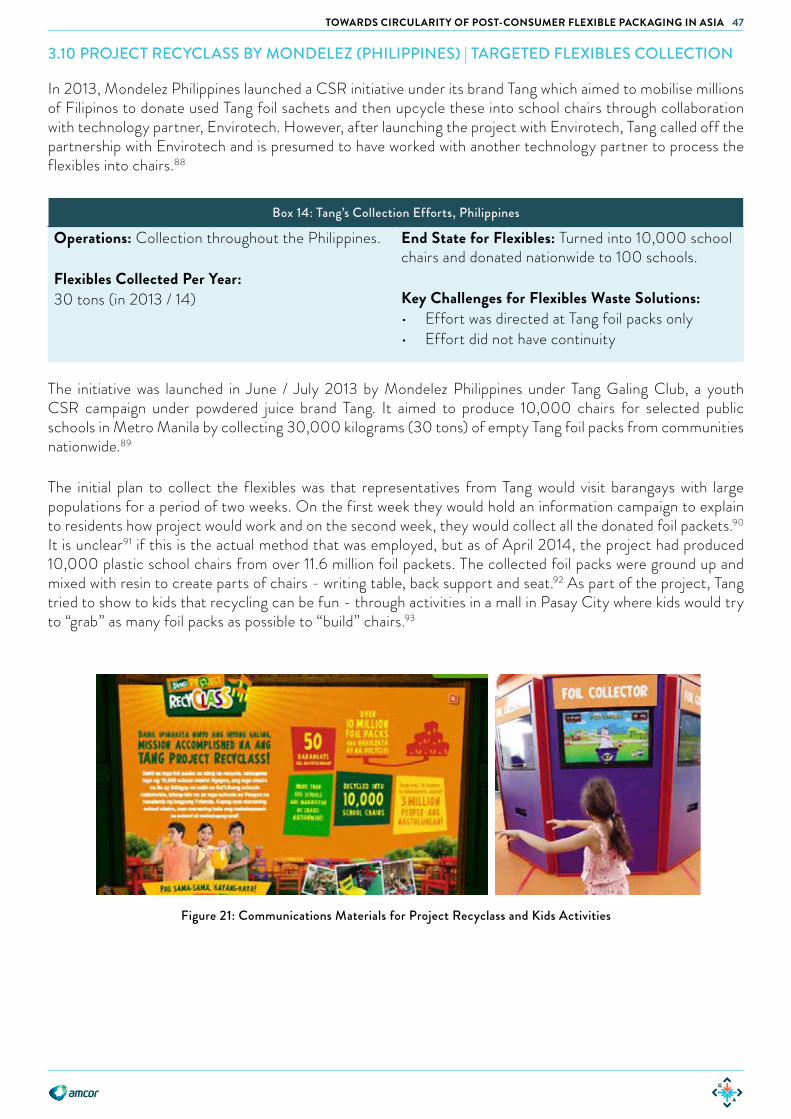
47TOWARDS CIRCULARITY OF POST-CONSUMER FLEXIBLE PACKAGING IN ASIA
3.10 PROJECT RECYCLASS BY MONDELEZ (PHILIPPINES) | TARGETED FLEXIBLES COLLECTION
In 2013, Mondelez Philippines launched a CSR initiative under its brand Tang which aimed to mobilise millions of Filipinos to donate used Tang foil sachets and then upcycle these into school chairs through collaboration with technology partner, Envirotech. However, after launching the project with Envirotech, Tang called off the partnership with Envirotech and is presumed to have worked with another technology partner to process the flexibles into chairs.88
Box 14: Tang’s Collection Efforts, Philippines
Operations: Collection throughout the Philippines.
Flexibles Collected Per Year: 30 tons (in 2013 / 14)
End State for Flexibles: Turned into 10,000 school chairs and donated nationwide to 100 schools.
Key Challenges for Flexibles Waste Solutions:• Effort was directed at Tang foil packs only • Effort did not have continuity
The initiative was launched in June / July 2013 by Mondelez Philippines under Tang Galing Club, a youth CSR campaign under powdered juice brand Tang. It aimed to produce 10,000 chairs for selected public schools in Metro Manila by collecting 30,000 kilograms (30 tons) of empty Tang foil packs from communities nationwide.89
The initial plan to collect the flexibles was that representatives from Tang would visit barangays with large populations for a period of two weeks. On the first week they would hold an information campaign to explain to residents how project would work and on the second week, they would collect all the donated foil packets.90 It is unclear91 if this is the actual method that was employed, but as of April 2014, the project had produced 10,000 plastic school chairs from over 11.6 million foil packets. The collected foil packs were ground up and mixed with resin to create parts of chairs - writing table, back support and seat.92 As part of the project, Tang tried to show to kids that recycling can be fun - through activities in a mall in Pasay City where kids would try to “grab” as many foil packs as possible to “build” chairs.93
Figure 21: Communications Materials for Project Recyclass and Kids Activities
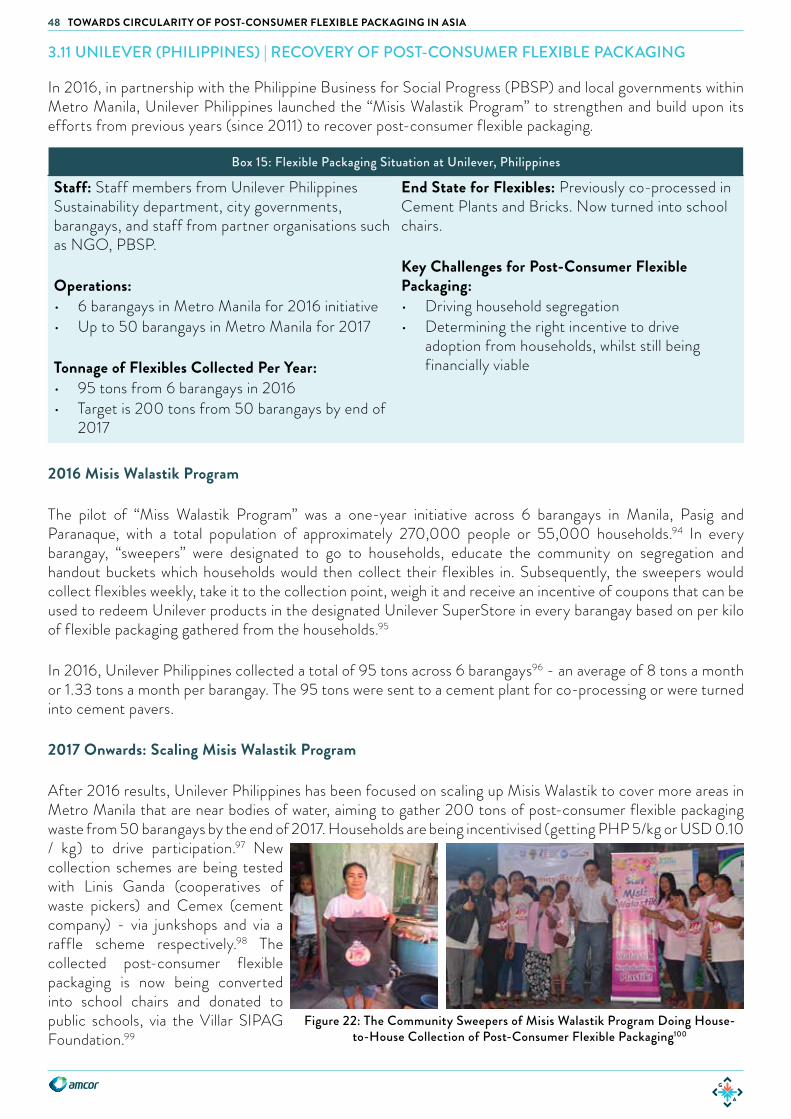
48 TOWARDS CIRCULARITY OF POST-CONSUMER FLEXIBLE PACKAGING IN ASIA
2016 Misis Walastik Program
The pilot of “Miss Walastik Program” was a one-year initiative across 6 barangays in Manila, Pasig and Paranaque, with a total population of approximately 270,000 people or 55,000 households.94 In every barangay, “sweepers” were designated to go to households, educate the community on segregation and handout buckets which households would then collect their flexibles in. Subsequently, the sweepers would collect flexibles weekly, take it to the collection point, weigh it and receive an incentive of coupons that can be used to redeem Unilever products in the designated Unilever SuperStore in every barangay based on per kilo of flexible packaging gathered from the households.95
In 2016, Unilever Philippines collected a total of 95 tons across 6 barangays96 - an average of 8 tons a month or 1.33 tons a month per barangay. The 95 tons were sent to a cement plant for co-processing or were turned into cement pavers.
2017 Onwards: Scaling Misis Walastik Program
After 2016 results, Unilever Philippines has been focused on scaling up Misis Walastik to cover more areas in Metro Manila that are near bodies of water, aiming to gather 200 tons of post-consumer flexible packaging waste from 50 barangays by the end of 2017. Households are being incentivised (getting PHP 5/kg or USD 0.10 / kg) to drive participation.97 New collection schemes are being tested with Linis Ganda (cooperatives of waste pickers) and Cemex (cement company) - via junkshops and via a raffle scheme respectively.98 The collected post-consumer flexible packaging is now being converted into school chairs and donated to public schools, via the Villar SIPAG Foundation.99
3.11 UNILEVER (PHILIPPINES) | RECOVERY OF POST-CONSUMER FLEXIBLE PACKAGING
In 2016, in partnership with the Philippine Business for Social Progress (PBSP) and local governments within Metro Manila, Unilever Philippines launched the “Misis Walastik Program” to strengthen and build upon its efforts from previous years (since 2011) to recover post-consumer flexible packaging.
Box 15: Flexible Packaging Situation at Unilever, Philippines
Staff: Staff members from Unilever Philippines Sustainability department, city governments, barangays, and staff from partner organisations such as NGO, PBSP.
Operations: • 6 barangays in Metro Manila for 2016 initiative • Up to 50 barangays in Metro Manila for 2017
Tonnage of Flexibles Collected Per Year:• 95 tons from 6 barangays in 2016 • Target is 200 tons from 50 barangays by end of
2017
End State for Flexibles: Previously co-processed in Cement Plants and Bricks. Now turned into school chairs.
Key Challenges for Post-Consumer Flexible Packaging:• Driving household segregation • Determining the right incentive to drive
adoption from households, whilst still being financially viable
Figure 22: The Community Sweepers of Misis Walastik Program Doing House-to-House Collection of Post-Consumer Flexible Packaging100
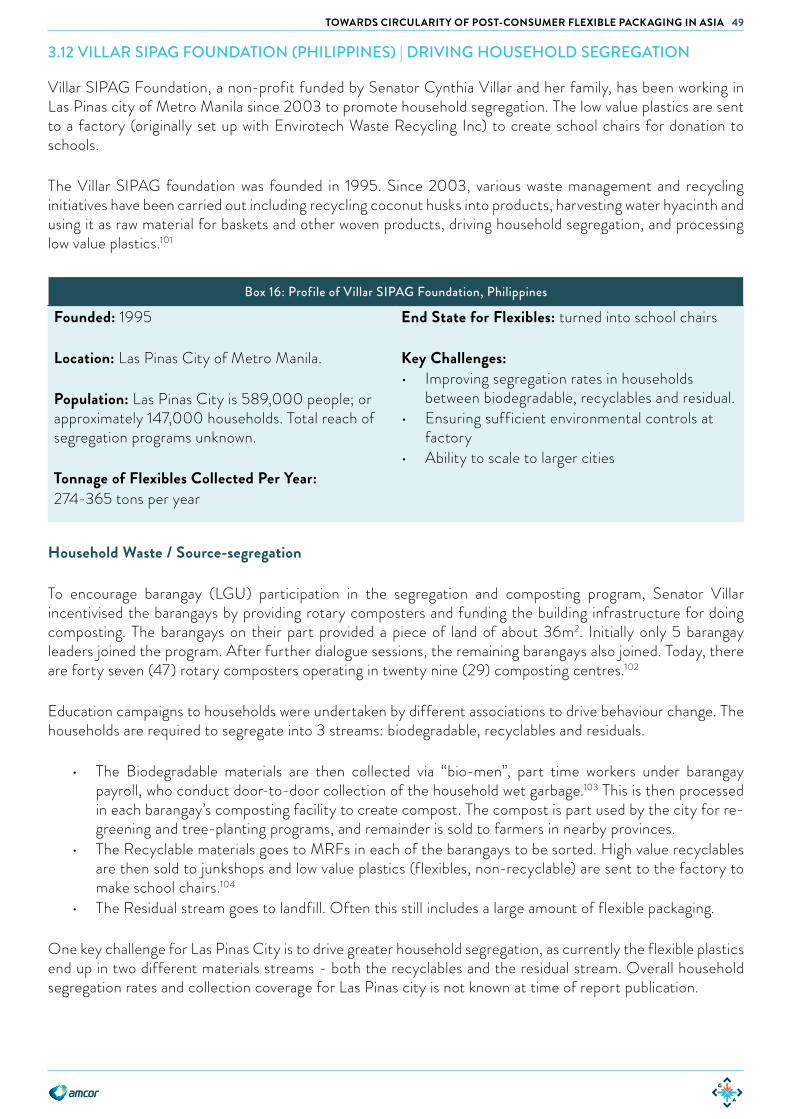
49TOWARDS CIRCULARITY OF POST-CONSUMER FLEXIBLE PACKAGING IN ASIA
3.12 VILLAR SIPAG FOUNDATION (PHILIPPINES) | DRIVING HOUSEHOLD SEGREGATION
Villar SIPAG Foundation, a non-profit funded by Senator Cynthia Villar and her family, has been working in Las Pinas city of Metro Manila since 2003 to promote household segregation. The low value plastics are sent to a factory (originally set up with Envirotech Waste Recycling Inc) to create school chairs for donation to schools.
The Villar SIPAG foundation was founded in 1995. Since 2003, various waste management and recycling initiatives have been carried out including recycling coconut husks into products, harvesting water hyacinth and using it as raw material for baskets and other woven products, driving household segregation, and processing low value plastics.101
Box 16: Profile of Villar SIPAG Foundation, Philippines
Founded: 1995
Location: Las Pinas City of Metro Manila.
Population: Las Pinas City is 589,000 people; or approximately 147,000 households. Total reach of segregation programs unknown.
Tonnage of Flexibles Collected Per Year:274-365 tons per year
End State for Flexibles: turned into school chairs
Key Challenges:• Improving segregation rates in households
between biodegradable, recyclables and residual.• Ensuring sufficient environmental controls at
factory• Ability to scale to larger cities
Household Waste / Source-segregation
To encourage barangay (LGU) participation in the segregation and composting program, Senator Villar incentivised the barangays by providing rotary composters and funding the building infrastructure for doing composting. The barangays on their part provided a piece of land of about 36m2. Initially only 5 barangay leaders joined the program. After further dialogue sessions, the remaining barangays also joined. Today, there are forty seven (47) rotary composters operating in twenty nine (29) composting centres.102
Education campaigns to households were undertaken by different associations to drive behaviour change. The households are required to segregate into 3 streams: biodegradable, recyclables and residuals.
• The Biodegradable materials are then collected via “bio-men”, part time workers under barangay payroll, who conduct door-to-door collection of the household wet garbage.103 This is then processed in each barangay’s composting facility to create compost. The compost is part used by the city for re-greening and tree-planting programs, and remainder is sold to farmers in nearby provinces.
• The Recyclable materials goes to MRFs in each of the barangays to be sorted. High value recyclables are then sold to junkshops and low value plastics (flexibles, non-recyclable) are sent to the factory to make school chairs.104
• The Residual stream goes to landfill. Often this still includes a large amount of flexible packaging.
One key challenge for Las Pinas City is to drive greater household segregation, as currently the flexible plastics end up in two different materials streams - both the recyclables and the residual stream. Overall household segregation rates and collection coverage for Las Pinas city is not known at time of report publication.
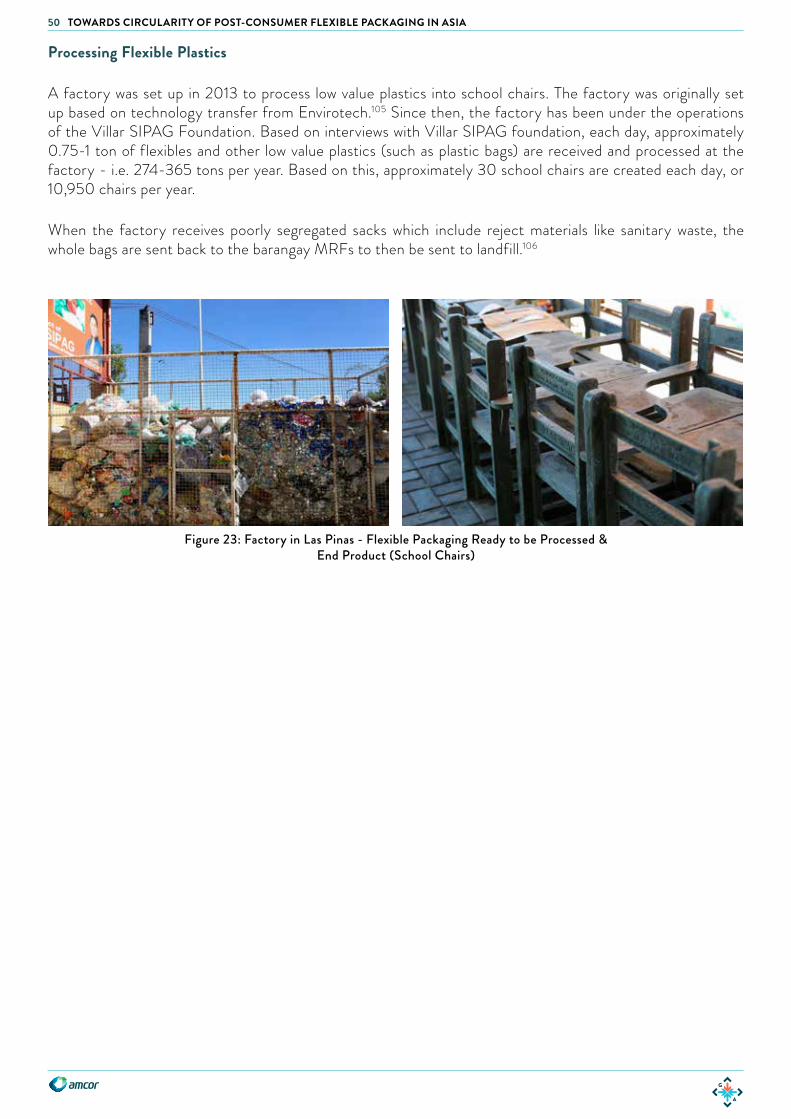
50 TOWARDS CIRCULARITY OF POST-CONSUMER FLEXIBLE PACKAGING IN ASIA
Processing Flexible Plastics
A factory was set up in 2013 to process low value plastics into school chairs. The factory was originally set up based on technology transfer from Envirotech.105 Since then, the factory has been under the operations of the Villar SIPAG Foundation. Based on interviews with Villar SIPAG foundation, each day, approximately 0.75-1 ton of flexibles and other low value plastics (such as plastic bags) are received and processed at the factory - i.e. 274-365 tons per year. Based on this, approximately 30 school chairs are created each day, or 10,950 chairs per year.
When the factory receives poorly segregated sacks which include reject materials like sanitary waste, the whole bags are sent back to the barangay MRFs to then be sent to landfill.106
Figure 23: Factory in Las Pinas - Flexible Packaging Ready to be Processed & End Product (School Chairs)
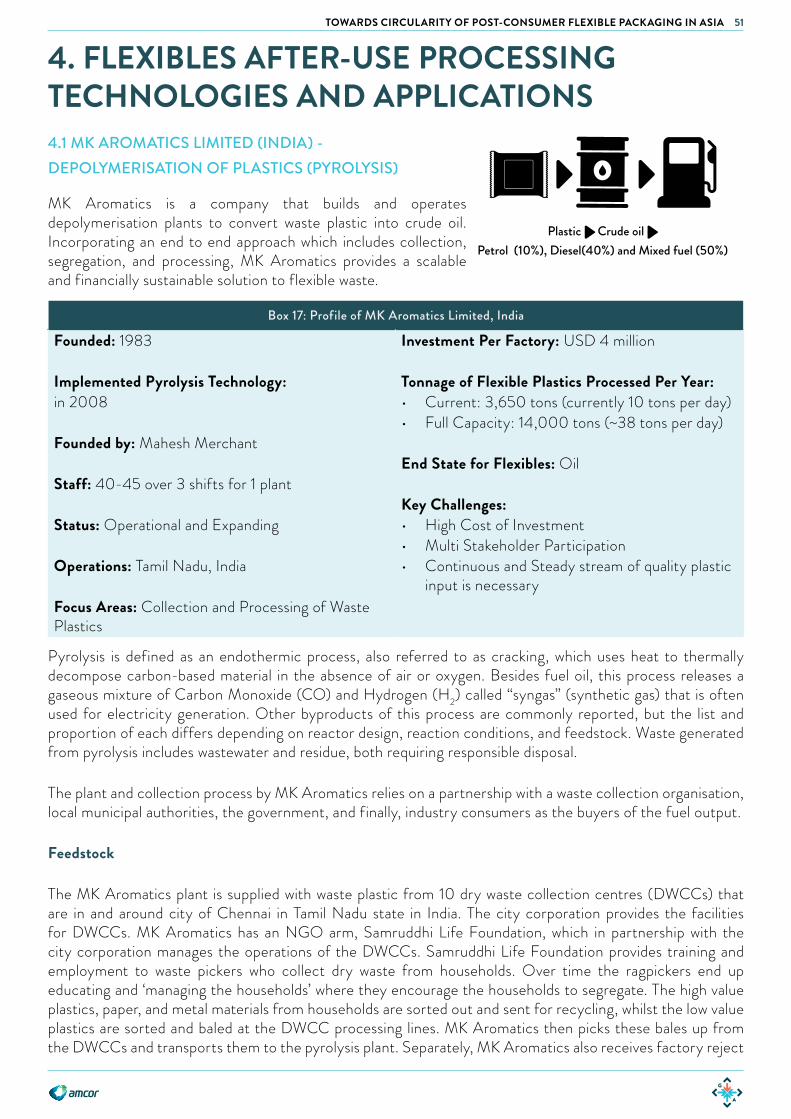
51TOWARDS CIRCULARITY OF POST-CONSUMER FLEXIBLE PACKAGING IN ASIA
4. FLEXIBLES AFTER-USE PROCESSING TECHNOLOGIES AND APPLICATIONS4.1 MK AROMATICS LIMITED (INDIA) - DEPOLYMERISATION OF PLASTICS (PYROLYSIS)
MK Aromatics is a company that builds and operates depolymerisation plants to convert waste plastic into crude oil. Incorporating an end to end approach which includes collection, segregation, and processing, MK Aromatics provides a scalable and financially sustainable solution to flexible waste.
Plastic -> Crude oil ->Petrol (10%), Diesel(40%) and Mixed fuel (50%)
Plastic -> Energy Input for Cement (part replacing coke)
Plastic-> 5% material in concrete bricksPlastic -> Monomer or Polymer
Plastic -> Roads Plastic -> Furniture
Box 17: Profile of MK Aromatics Limited, India
Founded: 1983
Implemented Pyrolysis Technology:in 2008
Founded by: Mahesh Merchant
Staff: 40-45 over 3 shifts for 1 plant
Status: Operational and Expanding
Operations: Tamil Nadu, India
Focus Areas: Collection and Processing of Waste Plastics
Investment Per Factory: USD 4 million
Tonnage of Flexible Plastics Processed Per Year:• Current: 3,650 tons (currently 10 tons per day)• Full Capacity: 14,000 tons (~38 tons per day)
End State for Flexibles: Oil
Key Challenges:• High Cost of Investment • Multi Stakeholder Participation • Continuous and Steady stream of quality plastic
input is necessary
Pyrolysis is defined as an endothermic process, also referred to as cracking, which uses heat to thermally decompose carbon-based material in the absence of air or oxygen. Besides fuel oil, this process releases a gaseous mixture of Carbon Monoxide (CO) and Hydrogen (H2) called “syngas” (synthetic gas) that is often used for electricity generation. Other byproducts of this process are commonly reported, but the list and proportion of each differs depending on reactor design, reaction conditions, and feedstock. Waste generated from pyrolysis includes wastewater and residue, both requiring responsible disposal.
The plant and collection process by MK Aromatics relies on a partnership with a waste collection organisation, local municipal authorities, the government, and finally, industry consumers as the buyers of the fuel output.
Feedstock
The MK Aromatics plant is supplied with waste plastic from 10 dry waste collection centres (DWCCs) that are in and around city of Chennai in Tamil Nadu state in India. The city corporation provides the facilities for DWCCs. MK Aromatics has an NGO arm, Samruddhi Life Foundation, which in partnership with the city corporation manages the operations of the DWCCs. Samruddhi Life Foundation provides training and employment to waste pickers who collect dry waste from households. Over time the ragpickers end up educating and ‘managing the households’ where they encourage the households to segregate. The high value plastics, paper, and metal materials from households are sorted out and sent for recycling, whilst the low value plastics are sorted and baled at the DWCC processing lines. MK Aromatics then picks these bales up from the DWCCs and transports them to the pyrolysis plant. Separately, MK Aromatics also receives factory reject
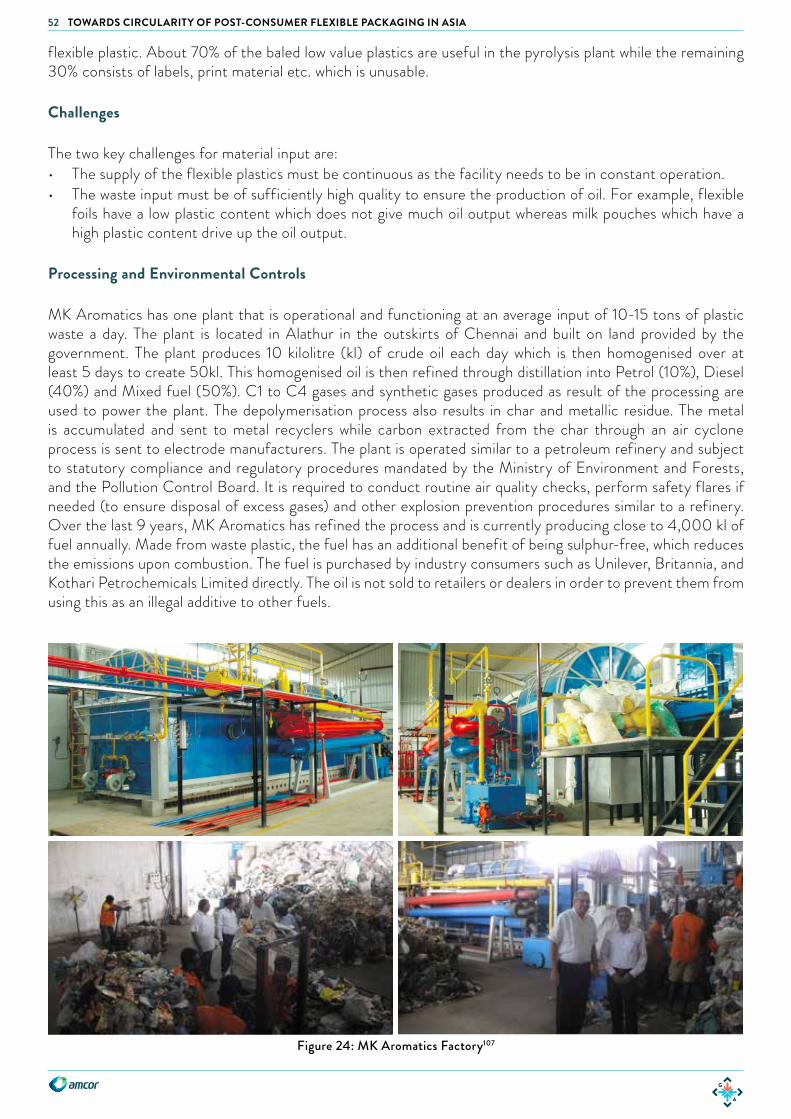
52 TOWARDS CIRCULARITY OF POST-CONSUMER FLEXIBLE PACKAGING IN ASIA
flexible plastic. About 70% of the baled low value plastics are useful in the pyrolysis plant while the remaining 30% consists of labels, print material etc. which is unusable.
Challenges
The two key challenges for material input are:• The supply of the flexible plastics must be continuous as the facility needs to be in constant operation.• The waste input must be of sufficiently high quality to ensure the production of oil. For example, flexible
foils have a low plastic content which does not give much oil output whereas milk pouches which have a high plastic content drive up the oil output.
Processing and Environmental Controls
MK Aromatics has one plant that is operational and functioning at an average input of 10-15 tons of plastic waste a day. The plant is located in Alathur in the outskirts of Chennai and built on land provided by the government. The plant produces 10 kilolitre (kl) of crude oil each day which is then homogenised over at least 5 days to create 50kl. This homogenised oil is then refined through distillation into Petrol (10%), Diesel (40%) and Mixed fuel (50%). C1 to C4 gases and synthetic gases produced as result of the processing are used to power the plant. The depolymerisation process also results in char and metallic residue. The metal is accumulated and sent to metal recyclers while carbon extracted from the char through an air cyclone process is sent to electrode manufacturers. The plant is operated similar to a petroleum refinery and subject to statutory compliance and regulatory procedures mandated by the Ministry of Environment and Forests, and the Pollution Control Board. It is required to conduct routine air quality checks, perform safety flares if needed (to ensure disposal of excess gases) and other explosion prevention procedures similar to a refinery. Over the last 9 years, MK Aromatics has refined the process and is currently producing close to 4,000 kl of fuel annually. Made from waste plastic, the fuel has an additional benefit of being sulphur-free, which reduces the emissions upon combustion. The fuel is purchased by industry consumers such as Unilever, Britannia, and Kothari Petrochemicals Limited directly. The oil is not sold to retailers or dealers in order to prevent them from using this as an illegal additive to other fuels.
Figure 24: MK Aromatics Factory107
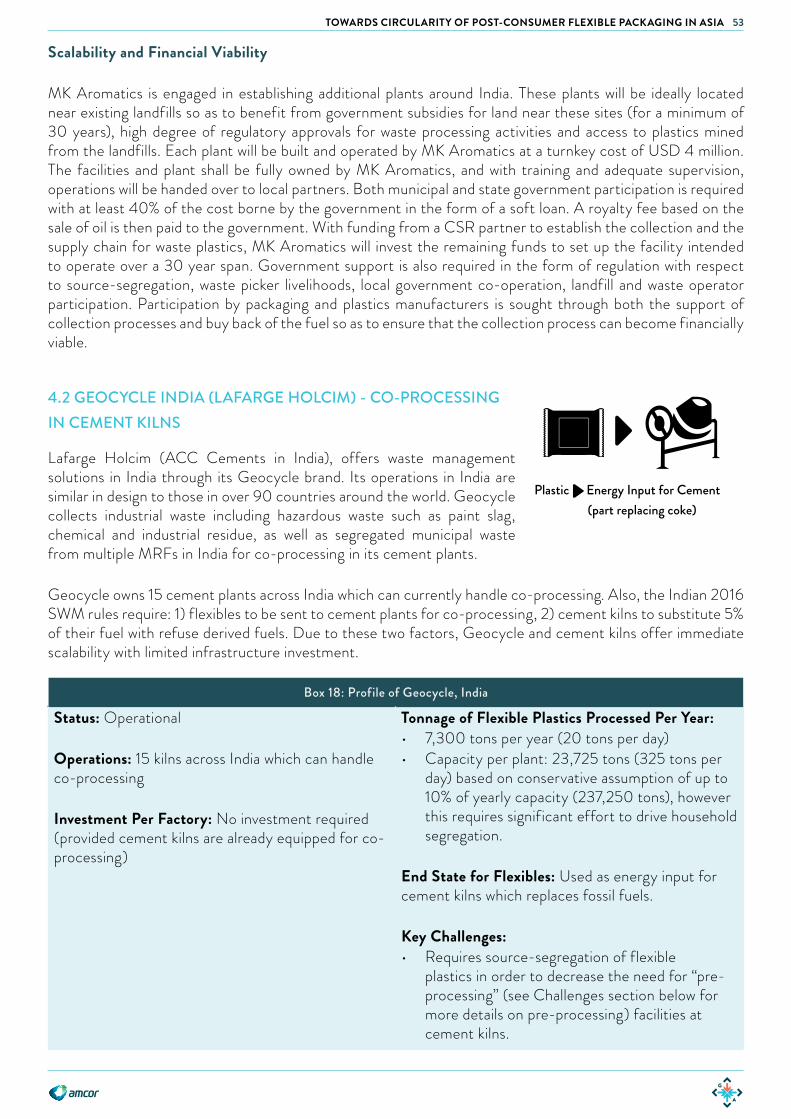
53TOWARDS CIRCULARITY OF POST-CONSUMER FLEXIBLE PACKAGING IN ASIA
Scalability and Financial Viability
MK Aromatics is engaged in establishing additional plants around India. These plants will be ideally located near existing landfills so as to benefit from government subsidies for land near these sites (for a minimum of 30 years), high degree of regulatory approvals for waste processing activities and access to plastics mined from the landfills. Each plant will be built and operated by MK Aromatics at a turnkey cost of USD 4 million. The facilities and plant shall be fully owned by MK Aromatics, and with training and adequate supervision, operations will be handed over to local partners. Both municipal and state government participation is required with at least 40% of the cost borne by the government in the form of a soft loan. A royalty fee based on the sale of oil is then paid to the government. With funding from a CSR partner to establish the collection and the supply chain for waste plastics, MK Aromatics will invest the remaining funds to set up the facility intended to operate over a 30 year span. Government support is also required in the form of regulation with respect to source-segregation, waste picker livelihoods, local government co-operation, landfill and waste operator participation. Participation by packaging and plastics manufacturers is sought through both the support of collection processes and buy back of the fuel so as to ensure that the collection process can become financially viable.
4.2 GEOCYCLE INDIA (LAFARGE HOLCIM) - CO-PROCESSING IN CEMENT KILNS
Lafarge Holcim (ACC Cements in India), offers waste management solutions in India through its Geocycle brand. Its operations in India are similar in design to those in over 90 countries around the world. Geocycle collects industrial waste including hazardous waste such as paint slag, chemical and industrial residue, as well as segregated municipal waste from multiple MRFs in India for co-processing in its cement plants.
Geocycle owns 15 cement plants across India which can currently handle co-processing. Also, the Indian 2016 SWM rules require: 1) flexibles to be sent to cement plants for co-processing, 2) cement kilns to substitute 5% of their fuel with refuse derived fuels. Due to these two factors, Geocycle and cement kilns offer immediate scalability with limited infrastructure investment.
Box 18: Profile of Geocycle, India
Status: Operational
Operations: 15 kilns across India which can handle co-processing
Investment Per Factory: No investment required (provided cement kilns are already equipped for co-processing)
Tonnage of Flexible Plastics Processed Per Year:• 7,300 tons per year (20 tons per day)• Capacity per plant: 23,725 tons (325 tons per
day) based on conservative assumption of up to 10% of yearly capacity (237,250 tons), however this requires significant effort to drive household segregation.
End State for Flexibles: Used as energy input for cement kilns which replaces fossil fuels.
Key Challenges:• Requires source-segregation of flexible
plastics in order to decrease the need for “pre-processing” (see Challenges section below for more details on pre-processing) facilities at cement kilns.
Plastic -> Crude oil ->Petrol (10%), Diesel(40%) and Mixed fuel (50%)
Plastic -> Energy Input for Cement (part replacing coke)
Plastic-> 5% material in concrete bricksPlastic -> Monomer or Polymer
Plastic -> Roads Plastic -> Furniture
54 TOWARDS CIRCULARITY OF POST-CONSUMER FLEXIBLE PACKAGING IN ASIA
Processing and Environmental Controls
In co-processing, waste is used as an energy resource, replacing fossil fuels such as coal, petroleum and gas (for energy recovery) in energy intensive industries such as cement. Waste materials used for co-processing are referred to as alternative fuels and raw materials (also known as refuse derived fuels or RDF). In co-processing, these waste materials are destroyed at a high temperature of up to 1,450°C, where they generate energy and create residue. Due to a long residence time within the kiln the residue created becomes part of the cement produced leaving no further residue. This is in contrast with incineration, where the residual ash generated is required to be sent to landfills as hazardous waste.
As the temperatures in the cement kilns are predetermined, the complete destruction of waste is assured, whereas in the case of incineration, the combustion levels may not be monitored. The high temperature also allows for use of uncleaned plastic waste or plastics contaminated with toxic chemicals like pesticides without creating any increased emissions in the air or water.108 109 The acidic gases, generated during co-processing are neutralised in the largely alkaline environment available within the kiln system. Cement kilns are subject to quality control guidelines as well as emissions restrictions. Working within the regulated cement industry, cement kilns are held to industry standards and subject to government guidelines, resulting in transparency and accountability.
Feedstock
Based on interviews with Geocycle India, a Geocycle kiln in Karnataka, southern India, is currently taking in 300 tons per day of waste, consisting of sorted MSW including flexible plastic waste, textile waste and footwear, and industry waste and agricultural waste that can not be composted, like shells or husk. Geocycle estimates that flexible plastics only consists of 20-30 tons per day (contrasted with 500 tons of petroleum coke for energy). This kiln is scheduled to be scaled up in 2019 with a new line dedicated to sorted MSW, bringing its total capacity for taking in waste, to 650 tons per day in the coming years.
Challenges
Geocycle owns 15 kilns across India that can handle the co-processing, out of which 7 kilns also have “pre-processing” facilities . Pre-processing is a process where Geocycle takes in all the waste, stores it in a warehouse and has a team of scientists and analysts who analyse the incoming waste. They then select the ratios of different waste coming in and through physical processes of shredding, mixing etc., make a uniform mixture that is optimum for use in cement co-processing. The kilns that have pre-processing facilities can take in a lot more waste than the kilns without this facility, as the ones without the facility have to ensure through other means that the waste coming in is of good quality for the kiln (i.e. of sufficiently high calorific value, is relatively homogenous and not contaminated, does not contain unwanted materials such as chlorine from PVC (type 3 plastic) and radioactive materials etc.).
Financial Viability and Scalability
Segregated plastic serves as a good alternative for fuel with a calorific value of 3,500 kcal/kg. Although this is lower than conventional petroleum coke at 8,000 kcal/kg, the low cost of plastic waste when compared to petroleum coke makes the use of plastic waste in cement production economically sound and environmentally favourable. According to studies on the matter, the energy required for the production of 1 ton of cement amounts to some 788,718.9 kcal which corresponds to about 120 kg of coal.110 The cost of energy accounts for about 30-40 % of the total costs of cement production. The use of plastic waste as fuel will therefore allow kilns to reduce the production costs. Utilising plastic waste to generate energy for existing cement kilns, reduces the need for additional investment in incineration / other waste-to-energy infrastructure.
Geocycle works with clients, usually manufacturing companies, to provide safe disposal of hazardous and

55TOWARDS CIRCULARITY OF POST-CONSUMER FLEXIBLE PACKAGING IN ASIA
4.3 BUILDING ROADS WITH PLASTICS (INDIA AND INDONESIA)
Construction of roads requires the use of bitumen or asphalt, a residual by-product resulting from the distillation of crude oil in petroleum refineries. To improve durability of roads, bitumen / asphalt has often been modified by the inclusion of various additives such as polymers, rubber latex and treated crumb rubber in order to achieve improved performance especially in areas with high temperatures and high traffic. Such processes, originally developed in the United States and Europe, require the addition of virgin materials, crumb rubber in the presence oxygen rich gases, and blending / processing at high temperatures, often increasing the costs of road construction. Adapting these processes to low grade polymers and / or post-consumer flexible packaging has resulted in the development of two techniques discussed below:112
Technique 1: A New Mix Process of Waste Plastic Aggregate Bitumen (“Dry Process”)
Polymer modified asphalt, as this invention is called, has been favoured for its increased strength and greater water impermeability. An invention patented by Professor Vasudevan from Thiagarajar College of Engineering, India, in 2006 has gained much attention and application in India, as well as other countries in South-East Asia. Polymers including Polyethylene (PE), Polypropylene (PP) and Polystyrene (PS) are combined with aggregate - treated polymer added to hot rock aggregate - and hot bitumen is added to this mixture to create a mix with improved qualities, specifically reduced cracking and increased water resistance of roads.
In India, plastic roads were pioneered in Professor Vasudevan’s home state of Tamil Nadu and subsequently have been used in roads across various other parts of India. According to Professor Vasudevan, a stretch of 3,000 m2 of plastic road consumes at least 1 ton of waste plastic, suggesting that these roads are an attractive solution for otherwise non-recyclable post-consumer flexible packaging. In India alone, 34,000 kilometres of roads have been laid using this technique.113
Endorsing the use of waste plastics in road construction, the Indian Roads Congress has released guidelines (IRC: SP: 98: 2013) for the application of the plastic road technology developed by Thiagarajar College of Engineering. The guidelines stipulate the weight and particle size of the waste plastic that may be included as well as the climate conditions where such roads may be laid. A government order was issued in November 2015, making it mandatory for all road developers in the country to use waste plastic for road construction.
difficult to dispose waste materials. Geocycle charges these companies a co-processing fee, which varies depending on the calorific value of the material, the cost of transportation, the degree of difficulty in handling the waste (loading and unloading costs, hazardous or toxic waste which requires additional care), as well as size and quality of the waste bales.
The Indian 2016 SWM rules regulate the following which support scalability of co-processing by cement kilns for processing post-consumer flexible packaging:
• Cement kilns are required to substitute 5% of their fuel with refuse derived fuels.111
• Non-recyclable waste having calorific value of 1,500 kcal/kg or more shall not be disposed of on landfills and shall only be utilised for generating energy either or through refuse derived fuel or by giving away as feedstock for preparing refuse derived fuel.
• High calorific wastes shall be used for co-processing in cement or thermal power plants.
Figure 25: Professor Vasudevan114
Plastic -> Crude oil ->Petrol (10%), Diesel(40%) and Mixed fuel (50%)
Plastic -> Energy Input for Cement (part replacing coke)
Plastic-> 5% material in concrete bricksPlastic -> Monomer or Polymer
Plastic -> Roads Plastic -> Furniture

56 TOWARDS CIRCULARITY OF POST-CONSUMER FLEXIBLE PACKAGING IN ASIA
Box 19: Profile of Professor Vasudevan’s Patented Invention
Patented: 2006
Founded by: Professor Vasudevan
Status: In operation in India and technology being used in Indonesia
Focus Areas: New mix process of waste plastic-aggregate-bitumen.
Investment Per Factory: No investment needed as process uses existing infrastructure.
Tonnage of Plastics Processed Per Year:• Unknown
Tonnage of Flexibles Processed Per Year:• Unknown
End State for Flexibles: Roads
Key Challenges:• Source-segregation (Cost of segregating
required and excluded plastics)
Feedstock
Based on interviews with Professor Vasudevan, the patented process requires collection and segregation of waste PE, PP and PS. Polyvinyl Chloride (PVC) is meant to be excluded from this process, due its toxic properties and unsuitability for road laying. Dry segregated plastic is shredded into small pieces and sieved before being sprayed onto solid, heated aggregate consisting of granite and concrete and then mixed with heated bitumen and mixed at a specified temperature range (155°C to 163°C). After mixing, the material is withdrawn at or below 140°C to be used for road laying. The addition of the plastic not only improves the quality of the aggregate, it also improves the binding capacity of the bitumen. The polymer coating of the bitumen also reduces voids or air pockets which can cause moisture absorption and oxidation resulting from entrapped air. Reduced voids in turn reduces rutting and raveling of roads, thus improving the durability.
Through this dry process, the dry shredded plastic waste is added to the hot mix to lay the roads without requiring any additional technology or mixing assembly. It is claimed that the dry process can be used in varying conditions by varying the amount of plastic.
Challenges
Challenges to this process may arise in the form of collection and segregation of adequate amounts of waste plastic, ensuring that PVC and other sometimes indistinguishable toxic materials do not contaminate the mixture, as well as observing if wear and tear of the plastic roads shall result in release of microplastics. Notwithstanding these challenges this technology has gained attention of municipal and national governments and is being explored as a solution for post-consumer flexible waste.
Technology Transfer to Indonesia
In June 2017, the Coordinating Ministry for Maritime Affairs for Indonesia signed a Memorandum of Understanding (MoU) for technology transfer and use of the technology under trial with Professor Vasudevan. Under the Indonesian MoU, the Ministry of Maritime Affairs proposes to replace the entire country’s road network with plastic roads between 2017 and 2025 using the Indian process. A pilot project was executed on the island of Bali on a 700 meter stretch of road near Udayana University to take approximately 2.5 tons of mixed plastic pellets - derived from HDPE bottles, flexible pouches, shopping bags and the like - and mix it with asphalt as road sealant.

57TOWARDS CIRCULARITY OF POST-CONSUMER FLEXIBLE PACKAGING IN ASIA
Technique 2: A Process For The Preparation Of Waste Plastic Modified Bitumen (“Wet Process”)
Based in Bengaluru, KK Plastic Waste Management had originally been in the plastic business. The threat of a potential ban on plastics prompted them to research alternative uses for plastic to reduce the harm caused by their products.
Formerly a plastic bag manufacturer, by the name of KK Plastic, they initially developed a dry process approach in 1996, where waste plastic was combined with heated aggregates to then create a bituminous mix similar to the process discussed above. Studies however revealed that that there were some challenges wherein there was too much variation on the quality based on the type of aggregate and the bitumen. Building on this initial approach, KK Plastic Waste Management and the Central Road Research Institute developed and patented a unique wet process technique wherein powdered waste plastic is shredded and added to the bitumen, followed by addition of an additive (hydrogenated tallow) and then homogenising the blend to obtain waste plastic modified bitumen.
Box 20: Profile of KK Plastic Waste Management, Bengaluru, India
Founded by: Rasool Khan and Ahmed Khan
Staff: 30
Status: In Operation
Operations: 15,000 tons since 2002
Focus Areas: Manufacture of Waste Plastic Polymer Blend
Investment Per Factory: USD 100,000
Tonnage of Plastics Processed Per Year:• 360 tons (1 ton per day) with capacity of 1,825
tons (5 tons per day)
Tonnage of Flexibles Processed Per Year:• Approximately 180 tons (½ ton per day) with
capacity of 912 tons (2 ½ tons per day)
End State for Flexibles: Roads and Pavement Blocks
Key Challenges:• Capital Investment in Technology• Source-segregation (Cost of processing plastic
waste) • Requires supervision at site to ensure correct
temperatures are maintained and proper blending on site is achieved
Figure 26: Road Signs in Bengaluru, India, Showing Roads Made from Recycled Plastic115

58 TOWARDS CIRCULARITY OF POST-CONSUMER FLEXIBLE PACKAGING IN ASIA
4.4 SOLVOLYSIS - CREASOLV
Solvolysis, also referred to as CreaSolv technology by Unilever, is the first technology which enables circularity for some flexibles by separating plastic and metal layers and turning the flexible plastics back into their monomers. Whilst the technology provides a promising possibility of achieving the circular economy for flexibles, there is a key constraint of the plant not being able to process all types of flexibles that are currently being put out in the market.
The Case For Plastic Roads
Support from recent government regulation in India and similar efforts in Indonesia requiring the use of plastic waste in the construction of roads is paving the way for plastic roads as a potential end use for flexible plastics.116 The case of plastic roads is strengthened when you factor in the increased durability.
While there are additional costs such the costs of collection and processing of waste plastic, by doubling the life of the paved road, the cost of upgrading / repaving the road is completely omitted. The below calculations do not account for reduced landfill costs and environmental costs from direct leakage of post-consumer waste plastics into the environment. A life cycle assessment or more focused research will take into account environmental benefits of landfill avoidance and also, more importantly, reveal potential environmental costs117 such as release of microplastics, photo-degradation, and release of fumes upon heating beyond recommended temperatures etc. While such analysis is outside the scope of this report, a more detailed cost-benefit analysis is warranted if plastic roads are to be considered as a potential end use for post-consumer flexible packaging in Asia.
Plastic -> Crude oil ->Petrol (10%), Diesel(40%) and Mixed fuel (50%)
Plastic -> Energy Input for Cement (part replacing coke)
Plastic-> 5% material in concrete bricksPlastic -> Monomer or Polymer
Plastic -> Roads Plastic -> FurnitureBox 21: Profile of CreaSolv by Unilever
Launched: 2017 Operations: 1 x plant under construction in West Java, Indonesia
Investment Per Factory: Unknown
Tonnage of Flexibles Processed Per Year: • Per Plant once fully operational: 10,950 tons
Key Challenges: Technology can not handle PP structures which creates segregation challenges and higher costs to obtain input material.
LAYING NEW ROADS UPGRADING ON EXISTING ROADS
RAW MATERIAL REQUIRED(KG / KM)
RAW MATERIAL COST*
(INR / KM)
RAW MATERIAL COST*
(USD / KM)
RAW MATERIAL REQUIRED(KG / KM)
RAW MATERIAL COST*
(INR / KM)
RAW MATERIAL COST*
(USD / KM)
Typical bitumen road 21,300 894,600 13,790 11,925 500,850 7,720
Bitumen to be substituted by plastic 1,704 71,568 1,103 954 40,068 618
LESS: Plastic substituted for bitumen(upto 8% of total bitumen)
1,704 20,448 315 954 11,448 176
Savings(per km of road) 51,120 788 28,620 441
*Bitumen Cost = INR 42 / kg; Cost of Waste Plastic = INR 12 / kg
Table 9: Savings from Using Plastic Modified Bitumen Recycled Plastic in Roads118
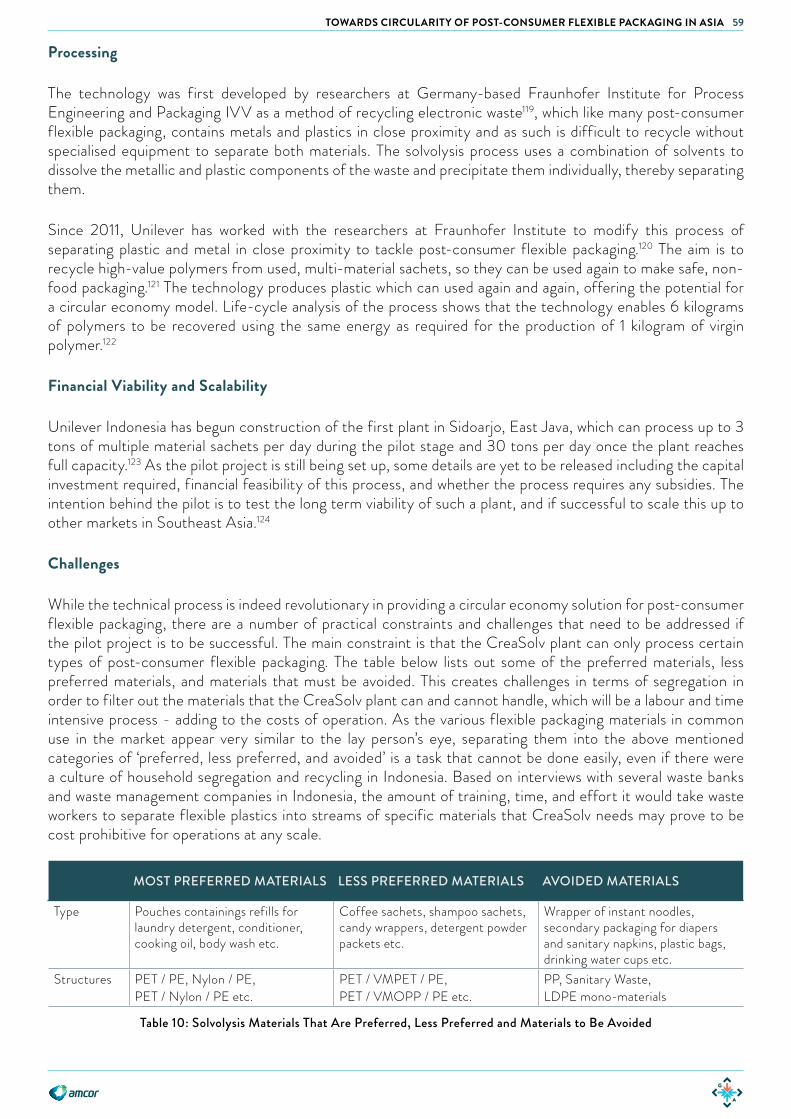
59TOWARDS CIRCULARITY OF POST-CONSUMER FLEXIBLE PACKAGING IN ASIA
Processing
The technology was first developed by researchers at Germany-based Fraunhofer Institute for Process Engineering and Packaging IVV as a method of recycling electronic waste119, which like many post-consumer flexible packaging, contains metals and plastics in close proximity and as such is difficult to recycle without specialised equipment to separate both materials. The solvolysis process uses a combination of solvents to dissolve the metallic and plastic components of the waste and precipitate them individually, thereby separating them.
Since 2011, Unilever has worked with the researchers at Fraunhofer Institute to modify this process of separating plastic and metal in close proximity to tackle post-consumer flexible packaging.120 The aim is to recycle high-value polymers from used, multi-material sachets, so they can be used again to make safe, non-food packaging.121 The technology produces plastic which can used again and again, offering the potential for a circular economy model. Life-cycle analysis of the process shows that the technology enables 6 kilograms of polymers to be recovered using the same energy as required for the production of 1 kilogram of virgin polymer.122
Financial Viability and Scalability
Unilever Indonesia has begun construction of the first plant in Sidoarjo, East Java, which can process up to 3 tons of multiple material sachets per day during the pilot stage and 30 tons per day once the plant reaches full capacity.123 As the pilot project is still being set up, some details are yet to be released including the capital investment required, financial feasibility of this process, and whether the process requires any subsidies. The intention behind the pilot is to test the long term viability of such a plant, and if successful to scale this up to other markets in Southeast Asia.124
Challenges
While the technical process is indeed revolutionary in providing a circular economy solution for post-consumer flexible packaging, there are a number of practical constraints and challenges that need to be addressed if the pilot project is to be successful. The main constraint is that the CreaSolv plant can only process certain types of post-consumer flexible packaging. The table below lists out some of the preferred materials, less preferred materials, and materials that must be avoided. This creates challenges in terms of segregation in order to filter out the materials that the CreaSolv plant can and cannot handle, which will be a labour and time intensive process - adding to the costs of operation. As the various flexible packaging materials in common use in the market appear very similar to the lay person’s eye, separating them into the above mentioned categories of ‘preferred, less preferred, and avoided’ is a task that cannot be done easily, even if there were a culture of household segregation and recycling in Indonesia. Based on interviews with several waste banks and waste management companies in Indonesia, the amount of training, time, and effort it would take waste workers to separate flexible plastics into streams of specific materials that CreaSolv needs may prove to be cost prohibitive for operations at any scale.
MOST PREFERRED MATERIALS LESS PREFERRED MATERIALS AVOIDED MATERIALS
Type Pouches containings refills for laundry detergent, conditioner, cooking oil, body wash etc.
Coffee sachets, shampoo sachets, candy wrappers, detergent powder packets etc.
Wrapper of instant noodles, secondary packaging for diapers and sanitary napkins, plastic bags, drinking water cups etc.
Structures PET / PE, Nylon / PE,PET / Nylon / PE etc.
PET / VMPET / PE,PET / VMOPP / PE etc.
PP, Sanitary Waste,LDPE mono-materials
Table 10: Solvolysis Materials That Are Preferred, Less Preferred and Materials to Be Avoided

60 TOWARDS CIRCULARITY OF POST-CONSUMER FLEXIBLE PACKAGING IN ASIA
4.5 ENVIROTECH WASTE RECYCLING INC (PHILIPPINES) - MANUFACTURING FURNITURE
Envirotech Waste Recycling Inc. (EWRI) is Philippines-based company that converts non-recyclable plastics into plastic school chairs, park benches and other furniture. Incorporating an end-to-end approach of working with Local Government Units to collect segregated low value and non-recyclable plastics, transportation and processing, Envirotech provides a scalable and financially sustainable solution to dealing with post-consumer flexible plastics.
Plastic -> Crude oil ->Petrol (10%), Diesel(40%) and Mixed fuel (50%)
Plastic -> Energy Input for Cement (part replacing coke)
Plastic-> 5% material in concrete bricksPlastic -> Monomer or Polymer
Plastic -> Roads Plastic -> Furniture
Box 22: Profile of Envirotech, Mindanao, Philippines
Founded: 2010
Founded by: Winchester Lemen
Staff: 2-10 people
Operations: • 2 x Operational Plants: Davao City (Mindanao);
Candelaria (Zambales)• 2 x Under Construction Plants: General Santos
City (Mindanao) and Koronadal, South Cotabato (Mindanao)
Technology Transferred to:• 1 x Las Piñas City (Metro Manila). Technology
transfer from Envirotech. Plant under operations of Villar SIPAG Foundation (see earlier section 3.12 for further details)
Focus Areas: Developing soft plastics recycling technology and operating recycling plants
Investment Per Factory: USD 200,000 - 230,000
Tonnage of Flexibles Processed Per Year: • Per Plant: 630 tons (90% of approximately 700
ton input)• 2 Plants: 1,260 tons (630 x 2 plants)
End State for Flexibles: School chairs, paving blocks, planks, park benches, lounge chairs
Key Challenges: Funding from LGUs to build new plants; lack of segregation enforcement of waste across barangays which affects material input; increasing plant capacity
Founder Winchester Lemen, a trained engineer, saw the need to solve the problem of plastic waste in Davao and started developing a technology that turns non-recyclable plastic into school chairs. This was also driven by the lack of about 2.5 million school chairs in the Philippines,125 which results in children having to sit on the floor in many poorer schools that can not afford enough chairs.
Based on interviews with Winchester, each Envirotech plant receives about 80-120 tons of materials every month, but after cleaning away the water, dirt, oil, and other residues on the plastics, is left with approximately 50-60 tons of plastics per plant per month, or approximately 600-720 tons per year, to turn into furniture and other products. Output per year is about 10,000 school chairs, 18,000 paving blocks, 9,000 planks, 1,000 bench chairs and 1,000 lounge chairs. The table below lists out the items produced per plant per year and associated weight of each product, in addition to material input and output.
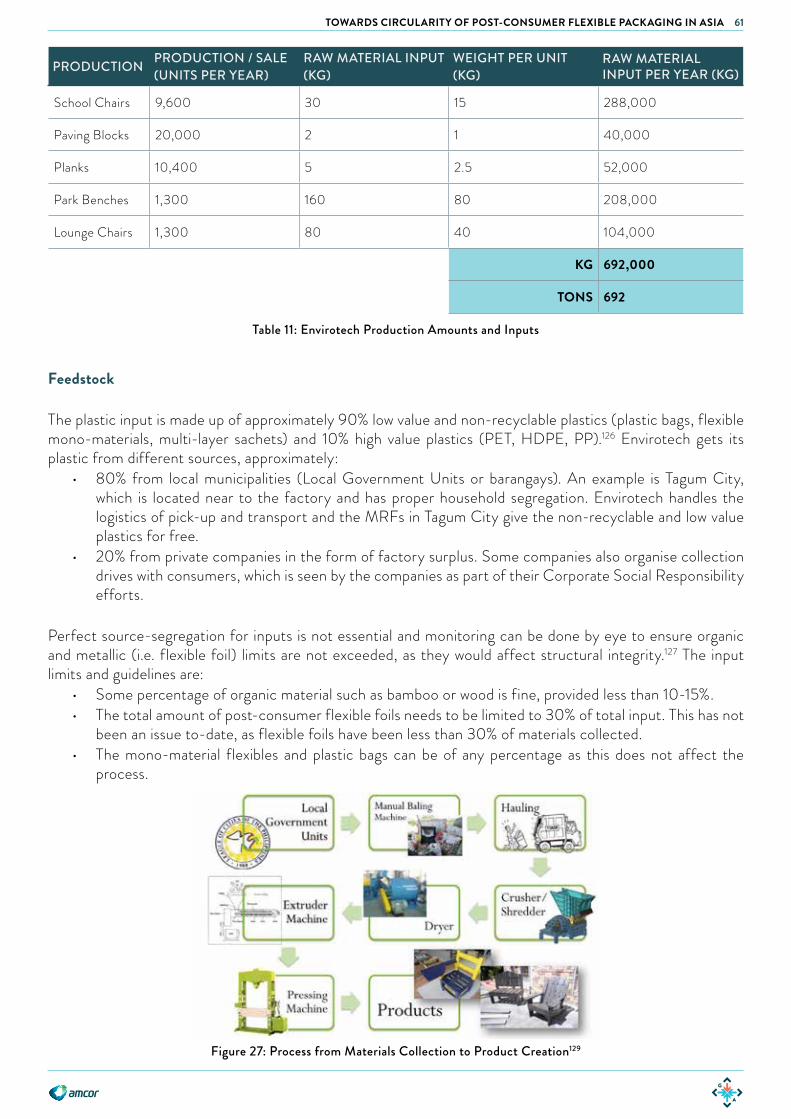
61TOWARDS CIRCULARITY OF POST-CONSUMER FLEXIBLE PACKAGING IN ASIA
Feedstock
The plastic input is made up of approximately 90% low value and non-recyclable plastics (plastic bags, flexible mono-materials, multi-layer sachets) and 10% high value plastics (PET, HDPE, PP).126 Envirotech gets its plastic from different sources, approximately:
• 80% from local municipalities (Local Government Units or barangays). An example is Tagum City, which is located near to the factory and has proper household segregation. Envirotech handles the logistics of pick-up and transport and the MRFs in Tagum City give the non-recyclable and low value plastics for free.
• 20% from private companies in the form of factory surplus. Some companies also organise collection drives with consumers, which is seen by the companies as part of their Corporate Social Responsibility efforts.
Perfect source-segregation for inputs is not essential and monitoring can be done by eye to ensure organic and metallic (i.e. flexible foil) limits are not exceeded, as they would affect structural integrity.127 The input limits and guidelines are:
• Some percentage of organic material such as bamboo or wood is fine, provided less than 10-15%. • The total amount of post-consumer flexible foils needs to be limited to 30% of total input. This has not
been an issue to-date, as flexible foils have been less than 30% of materials collected. • The mono-material flexibles and plastic bags can be of any percentage as this does not affect the
process.
PRODUCTION PRODUCTION / SALE(UNITS PER YEAR)
RAW MATERIAL INPUT(KG)
WEIGHT PER UNIT(KG)
RAW MATERIAL INPUT PER YEAR (KG)
School Chairs 9,600 30 15 288,000
Paving Blocks 20,000 2 1 40,000
Planks 10,400 5 2.5 52,000
Park Benches 1,300 160 80 208,000
Lounge Chairs 1,300 80 40 104,000
KG 692,000
TONS 692
Table 11: Envirotech Production Amounts and Inputs
Figure 27: Process from Materials Collection to Product Creation129
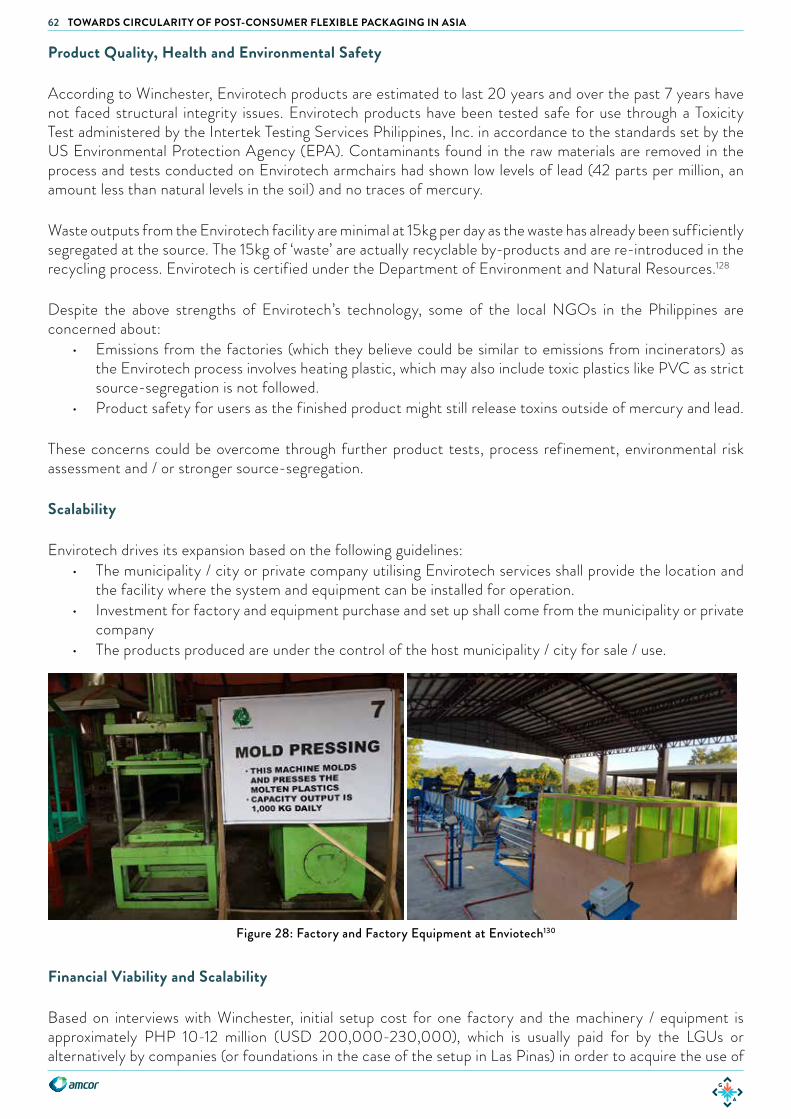
62 TOWARDS CIRCULARITY OF POST-CONSUMER FLEXIBLE PACKAGING IN ASIA
Product Quality, Health and Environmental Safety
According to Winchester, Envirotech products are estimated to last 20 years and over the past 7 years have not faced structural integrity issues. Envirotech products have been tested safe for use through a Toxicity Test administered by the Intertek Testing Services Philippines, Inc. in accordance to the standards set by the US Environmental Protection Agency (EPA). Contaminants found in the raw materials are removed in the process and tests conducted on Envirotech armchairs had shown low levels of lead (42 parts per million, an amount less than natural levels in the soil) and no traces of mercury.
Waste outputs from the Envirotech facility are minimal at 15kg per day as the waste has already been sufficiently segregated at the source. The 15kg of ‘waste’ are actually recyclable by-products and are re-introduced in the recycling process. Envirotech is certified under the Department of Environment and Natural Resources.128
Despite the above strengths of Envirotech’s technology, some of the local NGOs in the Philippines are concerned about:
• Emissions from the factories (which they believe could be similar to emissions from incinerators) as the Envirotech process involves heating plastic, which may also include toxic plastics like PVC as strict source-segregation is not followed.
• Product safety for users as the finished product might still release toxins outside of mercury and lead.
These concerns could be overcome through further product tests, process refinement, environmental risk assessment and / or stronger source-segregation.
Scalability
Envirotech drives its expansion based on the following guidelines:• The municipality / city or private company utilising Envirotech services shall provide the location and
the facility where the system and equipment can be installed for operation. • Investment for factory and equipment purchase and set up shall come from the municipality or private
company• The products produced are under the control of the host municipality / city for sale / use.
Financial Viability and Scalability
Based on interviews with Winchester, initial setup cost for one factory and the machinery / equipment is approximately PHP 10-12 million (USD 200,000-230,000), which is usually paid for by the LGUs or alternatively by companies (or foundations in the case of the setup in Las Pinas) in order to acquire the use of
Figure 28: Factory and Factory Equipment at Enviotech130
63TOWARDS CIRCULARITY OF POST-CONSUMER FLEXIBLE PACKAGING IN ASIA
4.6 EARTH MANAGEMENT AND RECYCLING TECHNOLOGY (PHILIPPINES) - MAKING “ECOBRICKS”
Earth Management and Recycling Technologies, Inc. (EMRTI) conducted experiments on incorporating non-recyclable plastic materials into concrete in 2002 and was able to get a patent for this. In 2006 the company branded the product as EcoBricks and began manufacturing them. Due to environmental and quality concerns, EMRTI suspended operations in 2015.
the technology. The LGU additionally provides the land, so there is no rental cost for land, and the LGU pays for the transportation of plastics to the Envirotech plants. There is no yearly depreciation cost for equipment as initial investment into machinery / equipment has been done by the LGU. Thus, the only operating costs are electricity, labor for operating the factory, spare parts and maintenance, delivery of finished products and minor miscellaneous costs.
Envirotech sells its chairs, furniture and other items, which coupled with zero investment by Envirotech and low operating costs, enables a high monthly profitability of about USD 8,000 per factory per month. When the initial factory investment is completed by the LGU, the profit is shared with the LGU.
The factories can be setup at a larger size in order to process higher tonnage per day (i.e. 180 tons instead of 60 tons), however, to date the current size has proved optimum in providing the LGU their own factory (in order to avoid legal problems or disagreements between LGUs sharing a facility, as mayors change) and optimising transportation distance between the factory and source of plastic within the LGU.
Challenges
The major challenge to scalability is in obtaining LGU funding to setup the factory and machinery / equipment, plus securing the land from LGUs. However, with about 4,000 LGUs throughout the Philippines struggling with waste issues and a reasonably low investment compared to alternative solutions, Envirotech offers a viable solution to diverting non-recyclable plastics from landfill.
The other challenge is source-segregation of materials, however, to date this has been achieved by Envirotech working in close collaboration with the LGUs.
The final challenge to overcome is as shared above regarding NGO concerns about emissions from the factories and safety of the finished product. This is possible through further product tests, process refinement and / or stronger source-segregation. Plastic -> Crude oil ->
Petrol (10%), Diesel(40%) and Mixed fuel (50%) Plastic -> Energy Input for Cement
(part replacing coke)
Plastic-> 5% material in concrete bricksPlastic -> Monomer or Polymer
Plastic -> Roads Plastic -> Furniture
Box 23: Profile of EMRTI, Metro Manila, Philippines
Founded: 2002. Suspended Operations in 2015 due to environment and quality concerns
Founded by: Brian Arevalo
Operations: Metro Manila
Focus Areas: Upcycling non-recyclable plastics into construction materials
End State for Flexibles: 3 million EcoBricks
Key Challenges:• Structural integrity of bricks once plastic
incorporated with concrete • Environmental concerns of microplastic leakage • Plastic input could not be more than 5% per
brick limiting the solution as viable for managing post-consumer flexible plastics
64 TOWARDS CIRCULARITY OF POST-CONSUMER FLEXIBLE PACKAGING IN ASIA
EMRTI used to manufacture EcoBricks by incorporating non-recyclable plastics, such as post-consumer flexible packaging and polystyrene into concrete to make bricks for pavements. From 2002-2015 they produced 3 million EcoBricks. To ensure a final product strength of 1,400 psi (pounds per square inch) compressive strength which is the grade required for concrete used for pavements, the maximum plastic EMRTI could incorporate was 5% per brick.
Environmental and Structural Problems Which Resulted in Closure
EMRTI conducted periodic studies to analyse structural integrity and to look at environmental impacts of using plastic within concrete for bricks. Over time they realised that EcoBricks had the following key problems:
• Plastics and concrete are not homogenous• Plastics photodegrade and thus create microcracks in concrete when subjected to weathering• Plastics are flat (2-dimensional) and thus create voids in concrete• Plastics affect compressive strength of concrete - the compressive, tensile and flexural strength of
concrete decrease by 4-6% as the sample ages• The weathering, voids and decreased strength enables plastics to enter the environment in the form of
nanoparticles or microparticles
Upon recognising some of these environmental and structural problems, EMRTI stopped the production of more EcoBricks. EMRTI is now engaged in providing solutions for industrial waste destruction (including flexible packaging), end of life solutions (for consumer goods and flexible packaging) and processing of small amounts of post-consumer flexible packaging. EMRTI currently processes approximately 700-1,000 tons of flexible packaging as part of the services it provides. Upon processing by a third party provider, the materials including flexible packaging are sent to Cemex facilities in (Bulacan and Rizal) for incineration in cement kilns.

65TOWARDS CIRCULARITY OF POST-CONSUMER FLEXIBLE PACKAGING IN ASIA
5. ANALYSIS AND REVIEW OF WASTE COLLECTION AND END USE EFFORTS5.1 COMPARATIVE ASSESSMENT OF FLEXIBLE WASTE COLLECTION AND PROCESSING EFFORTS
The various collection efforts and processing efforts discussed in the report are useful in identifying the direction that future efforts must take in order to be both feasible and effective. At initial glance, it is clear that collection efforts are strong where there is government regulation and enforcement - as depicted by the columns in blue in the chart below. It is further evident that these collection efforts are effective when there is high value ascribed to the end product (see columns in red).
ITC India(Throughout India)
2,0002,000
300300
200200
3,6503,650
740740
126
55
1,2601,260
9595
3030
6,120
612
Hasiru Dala (Bangalore, India)
Waste Ventures(Hyderabad, India)
MK Aromatics(Tamil Nadu, India)
Depok City(Greater Jakarta,
Indonesia)
Waste Banks(Indonesia, 1600 units)
Waste for Change(Jakarta, Indonesia)
Kapai Api(Indonesia)
Envirotech(Manila & Mindanao,
PH)
UnileverPhilippines
(Metro Manila, PH)
300300
Villar SIPAG(Metro Manila,
PH)
Mondelez(Metro Manila, PH)
Collection e�orts (and location of)
Summary of Flexible Packaging Collection E�orts in India, Indonesia, andthe Phillipines (Total Tons Collected per Year)
Tons of flexible packaging responsibly managed (not leaking to waterways) Tons of flexible packaging with end use (Circular or Downcycled)
Tota
l ton
s col
lecte
d pe
r yea
r
6,000
4,000
2,000
0
Figure 29: Summary of Collection Tons per Year
1. Responsible collection and management means that materials have been responsibly collected and transported to landfill, ensuring no illegal dumping into open dumpsites or waterways.
2. End uses include recycling for mono-materials, cement co-processing, pyrolysis, roads and furniture. 3. This table is a summary of the data from the case studies presented in previous sections.
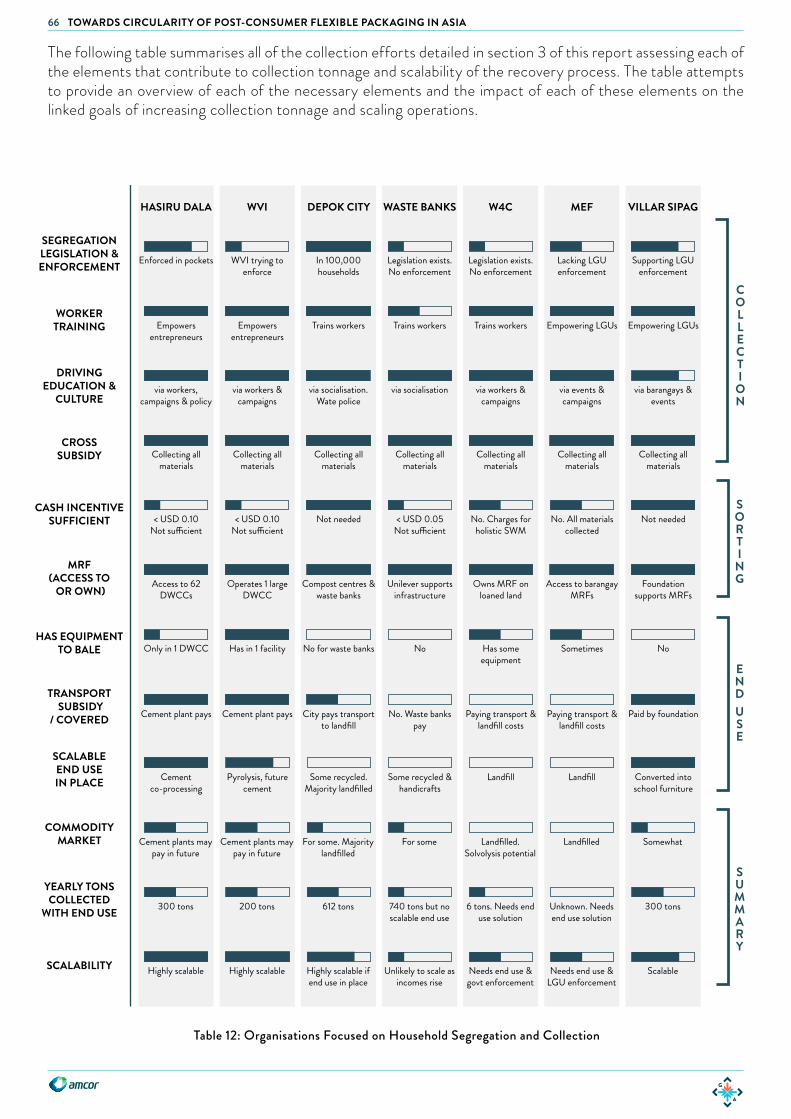
66 TOWARDS CIRCULARITY OF POST-CONSUMER FLEXIBLE PACKAGING IN ASIA
COLLECTION
SORTING
END
USE
SUMMARY
SEGREGATIONLEGISLATION &ENFORCEMENT
WORKERTRAINING
MRF (ACCESS TO OR OWN)
CASH INCENTIVESUFFICIENT
CROSSSUBSIDY
DRIVINGEDUCATION &
CULTURE
HAS EQUIPMENTTO BALE
TRANSPORT SUBSIDY
/ COVERED
COMMODITYMARKET
SCALABLEEND USEIN PLACE
YEARLY TONSCOLLECTED
WITH END USE
SCALABILITY
HASIRU DALA WVI DEPOK CITY WASTE BANKS W4C MEF VILLAR SIPAG
Lacking LGU enforcement
Empowering LGUs
via events & campaigns
Collecting all materials
No. All materials collected
Access to barangay MRFs
Sometimes
Paying transport & landfill costs
Landfill
Landfilled
Unknown. Needs end use solution
Needs end use & LGU enforcement
WVI trying to enforce
Empowers entrepreneurs
via workers & campaigns
Collecting all materials
< USD 0.10Not su�cient
Operates 1 large DWCC
Has in 1 facility
Cement plant pays
Pyrolysis, future cement
Cement plants may pay in future
200 tons
Highly scalable
Legislation exists. No enforcement
Trains workers
via socialisation
Collecting all materials
< USD 0.05Not su�cient
Unilever supports infrastructure
No
No. Waste banks pay
Some recycled & handicrafts
For some
740 tons but no scalable end use
Unlikely to scale as incomes rise
Legislation exists. No enforcement
Trains workers
via workers & campaigns
Collecting all materials
No. Charges for holistic SWM
Owns MRF on loaned land
Has some equipment
Paying transport & landfill costs
Landfill
Landfilled. Solvolysis potential
6 tons. Needs end use solution
Needs end use & govt enforcement
In 100,000 households
Trains workers
via socialisation. Wate police
Collecting all materials
Not needed
Compost centres & waste banks
No for waste banks
City pays transport to landfill
Some recycled. Majority landfilled
For some. Majority landfilled
612 tons
Highly scalable if end use in place
Supporting LGU enforcement
Empowering LGUs
via barangays & events
Collecting all materials
Not needed
Foundation supports MRFs
No
Paid by foundation
Converted into school furniture
Somewhat
300 tons
Scalable
Enforced in pockets
Empowers entrepreneurs
via workers, campaigns & policy
Collecting all materials
< USD 0.10Not su�cient
Access to 62 DWCCs
Only in 1 DWCC
Cement plant pays
Cement co-processing
Cement plants may pay in future
300 tons
Highly scalable
Table 12: Organisations Focused on Household Segregation and Collection
The following table summarises all of the collection efforts detailed in section 3 of this report assessing each of the elements that contribute to collection tonnage and scalability of the recovery process. The table attempts to provide an overview of each of the necessary elements and the impact of each of these elements on the linked goals of increasing collection tonnage and scaling operations.
67TOWARDS CIRCULARITY OF POST-CONSUMER FLEXIBLE PACKAGING IN ASIA
The previous table brings to attention the following findings:
Source-segregation is a Necessary Component
While not all of the efforts benefit from government legislations supporting household segregation at source, the benefit of both existence and enforcement of such a law is a key requirement for any waste collection effort. This benefit is clearly underscored in Depok city’s collection and segregation tonnage. Also enforced in parts of Bengaluru along with the requirement that bulk waste generators (includes apartment complexes) must arrange for private disposal of waste, it ensured that households separate dry and wet waste - which allows for more efficient sorting and segregation.
Awareness and Training is Integral to Every Effort
Several of the organisations and projects explored within the scope of this report, and also several other waste collection efforts, small and large, include the social and professional development of the overlooked and often exploited waste collectors, scavengers, and ragpickers. Bringing this workforce within the fold of an organised effort and empowering them through education, financial assistance and micro-entrepreneurship opportunities allows for a reliable, engaged and trained workforce. Existence of Sorting Facilities and Equipment
Waste management organisations that have access to sorting facilities / dry waste collection centers and equipment to bale and sort waste have greater potential to scale and ensure quality control. The existence of a conveyor belt and baling machinery in one of the 43 wards operated by Hasiru Dala allows for recovery of 5 tons of flexibles per month contrasted with wards where sorting is undertaken by hand resulting in only 1-1.5 tons / month.
Cross Subsidy is an Important Supporting Factor
Efforts where the focus of collection efforts has been solely post-consumer flexible waste, have been largely unsuccessful or unsustainable. An effort initiated by a consortium of companies comprising the Indian Beauty and Hygiene Association was able to collect only 0.76 tons of multi-layer flexibles over a period of 2 years and across half of Mumbai through engaging and incentivising 200 waste pickers.131 There are many other ad-hoc efforts throughout the region to collect flexibles which have resulted in even less tonnage. Such efforts are often met with much press coverage as they are launched and are lauded as major successes. The success is less laudable when viewing the low tonnage collected and high costs. Both WVI and Hasiru Dala India, emphasise that it is the presence of high value plastics and other materials that allows the dry waste collection centers to gain financial viability.
Cash Incentive for Collection of Flexibles
With the exception of Depok, where the collection effort has been entirely subsidised by the local government, all other efforts require the payment of a cash incentive to ensure that there is collection and processing of flexible waste. The amount of this incentive has varied from USD 0.60 / kg to USD 0.10 / kg. In India, a financially viable cash incentive, not accounting for infrastructure and equipment costs would be approximately USD 0.20 / kg. A useful comparison is the cash receivable upon collection of PET bottles which is approximately USD 0.50 / kg, bearing in mind that the collection and sorting of PET bottles is less time consuming and physically less challenging to the waste picker. A cash incentive that is too high such as Unilever’s effort in the Philippines, will prove to be unsustainable in the longer term, while a low cash incentive will not justify the opportunity cost. The absence of a cash incentive as in the case of Kapal Api, where consumers had to mail in empty sachets to participate in a lucky draw, is neither scalable in terms of quantity, nor does it guarantee participation by every consumer for every flexible product, resulting in a very fragmented effort.
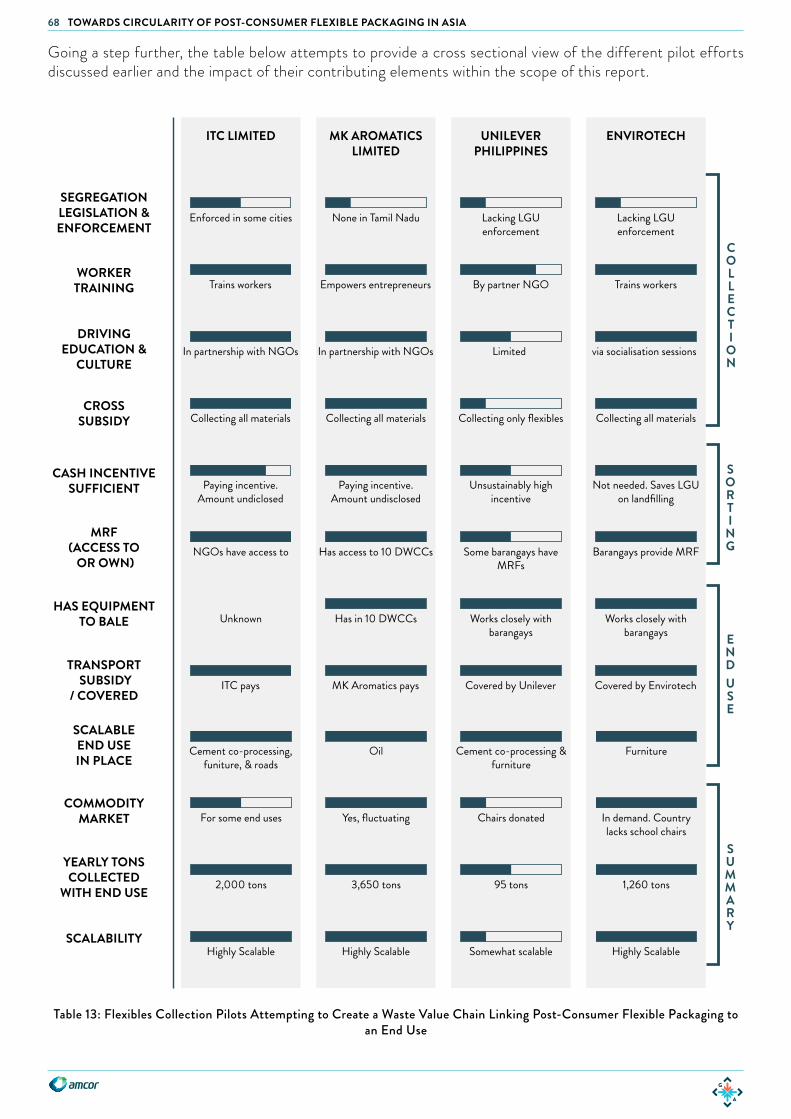
68 TOWARDS CIRCULARITY OF POST-CONSUMER FLEXIBLE PACKAGING IN ASIA
COLLECTION
SORTING
END
USE
SUMMARY
ITC LIMITED MK AROMATICSLIMITED
UNILEVERPHILIPPINES
ENVIROTECH
Enforced in some cities
Trains workers
In partnership with NGOs
Collecting all materials
Paying incentive.Amount undiclosed
NGOs have access to
Unknown
ITC pays
Cement co-processing, funiture, & roads
For some end uses
2,000 tons
Highly Scalable
None in Tamil Nadu
Empowers entrepreneurs
In partnership with NGOs
Collecting all materials
Paying incentive.Amount undisclosed
Has access to 10 DWCCs
Has in 10 DWCCs
MK Aromatics pays
Oil
Yes, fluctuating
3,650 tons
Highly Scalable
Lacking LGUenforcement
By partner NGO
Limited
Collecting only flexibles
Unsustainably high incentive
Some barangays have MRFs
Works closely with barangays
Covered by Unilever
Cement co-processing & furniture
Chairs donated
95 tons
Somewhat scalable
Lacking LGUenforcement
Trains workers
via socialisation sessions
Collecting all materials
Not needed. Saves LGU on landfilling
Barangays provide MRF
Works closely with barangays
Covered by Envirotech
Furniture
In demand. Countrylacks school chairs
1,260 tons
Highly Scalable
SEGREGATIONLEGISLATION &ENFORCEMENT
WORKERTRAINING
MRF (ACCESS TO OR OWN)
CASH INCENTIVESUFFICIENT
CROSSSUBSIDY
DRIVINGEDUCATION &
CULTURE
HAS EQUIPMENTTO BALE
TRANSPORT SUBSIDY
/ COVERED
COMMODITYMARKET
SCALABLEEND USEIN PLACE
SCALABILITY
YEARLY TONSCOLLECTED
WITH END USE
Going a step further, the table below attempts to provide a cross sectional view of the different pilot efforts discussed earlier and the impact of their contributing elements within the scope of this report.
Table 13: Flexibles Collection Pilots Attempting to Create a Waste Value Chain Linking Post-Consumer Flexible Packaging to an End Use
69TOWARDS CIRCULARITY OF POST-CONSUMER FLEXIBLE PACKAGING IN ASIA
The table above highlights the following additional findings:
Financially Beneficial End Use
The existence of a financially beneficial end use is big driver in the success of both the collection and processing of flexible waste. The absence of commodity market as in the case of Depok, only serves to ensure that the waste is not leaked into the environment - it does not allow for recovery of the waste material nor a reduction in the flow of waste to the landfill. Furthermore, the absence of end use solutions as in the case of W4C Indonesia and MEF Philippines’ efforts, results in an additional waste management cost borne by the these enterprises having to sort the materials (labour cost) and send them to landfill (tipping cost). Existence of transport cost subsidies and operational assistance, ensures that efforts undertaken by MK Aromatics, Enviro Tech, Hasiru Dala and WVI are reliable and sustainable in the longer term.
Multi-Stakeholder Participation
As is evident from the report and especially in the case of the pilots - it is clear that any engagement requires the joint participation of business, government and social enterprises to bring together the necessary elements of funding, regulation, infrastructure, waste worker organisation and training, equipment and technology. It is clear that no one entity can unilaterally contribute to each of the necessary elements.
End to End Management Results in Improved Efforts
As in the efforts undertaken of MK Aromatics, Envirotech and ITC Limited, a strategy that covers all aspects of collection, sorting and end use solution, provides additional benefits of a stronger supply chain, and ability to address challenges in the quality / quantity of collection and to create economies of scale. Efforts such as those undertaken by Hasiru Dala and WVI can only be a complete solution when seamlessly integrated with an appropriate end use.

70 TOWARDS CIRCULARITY OF POST-CONSUMER FLEXIBLE PACKAGING IN ASIA
CO-PROCESSING CEMENT KILNS
PYROLYSIS PLASTIC ROADS CONVERSION TO FURNITURE
SOLVOLYSIS
REGULATORY SUPPORT
INFRASTRUCTURE SUPPORT
LOW ENVIRONMENTAL
RISK / IMPACT
DEGREE OF CIRCULARITY
PROCESSING CAPACITY /
SCALABILITY
END USE /FINANCIAL BENEFIT
LOW PRE-PROCESSING
NEEDS
OVERALL SCORE
Ind - yesIndo/Ph - neutral
Cement kilns exist inall markets
Reduces cement production costs
20 TPD per plant.65 TPD by 2019
Reduces virginenergy needs
Fully combusted
All flexibles, must bedry & shredded
Ind - govt subsidyIndo - neutral, Ph - banned
USD 4 mil for 40 TPD plant
Challenge of fluctuating oil prices
40 TPD per plant
Turns plastic into oil
Minimal, if factory isof high quality
Requires cleaning, and must limit foils
Ind / Indo - supportPh - neutral
USD 100k forwet mix process
Lower cost and stronger roads. High demand
Small amount per kmof road
Replaces virginmaterial input
Potential for microplastics / fumes
Uses <25% flexibles
In / Indo - neutralPh - allowed
USD 200k for2 TPD plant
Furniture sold atmarket price
2 TPD per plant
Replaces virginmaterial input
Limited waste & emissions if high quality
Needs source segregation & <30% foils
In / Indo - neutralPh - allowed
High capital investment
Monomers in demand. Less fluctuation than oil
30 TPD per plantby 2018
Enables full circularityfor some flexibles
Some waste to be manageed
Can not process all flexibles, <30% metals
5.2 COMPARATIVE REVIEW OF POST-CONSUMER FLEXIBLE PACKAGING PROCESSING TECHNOLOGIES
The table below summarises the existing technologies and end use solutions for post-consumer flexible packaging. This summary is an attempt to identify favourable indicators and potential costs and challenges presented by each of the end use solutions. There is no one solution that clearly outranks others, and each effort comes with its own unique set of characteristics. The list of potential costs and risks is by no means comprehensive and a detailed study into each of the technologies is recommended.
Table 14: Summary of Processing Technologies in India, Indonesia and the Philippines
The above table provides a summary of each of the end use solutions in light of the various regulatory, financial and other inputs:
Cement kilns provide an available solution and a ready alternative to incineration or waste-to-energy which require the building of additional plant and facilities. While the flexible waste serves as alternative fuel, it is only one step closer in the direction of circular economy but still a long distance from closing the loop. Additionally, not all regulation is in favour of cement kiln incineration as in the case of the Philippines and furthermore the costs of transportation and pre-processing do present a challenge, especially in towns / cities without easy access to cement kilns.
Solutions such pyrolysis and solvolysis, which call for the depolymerisation of flexible waste require a high capital investment along with substantial government participation and reliance on strong collection efforts. Unlike mechanical processing which can be halted or cement kilns which may continue to fire using fossil fuels, these chemical processes require sustained conditions and a steady flow of waste to ensure both quality and
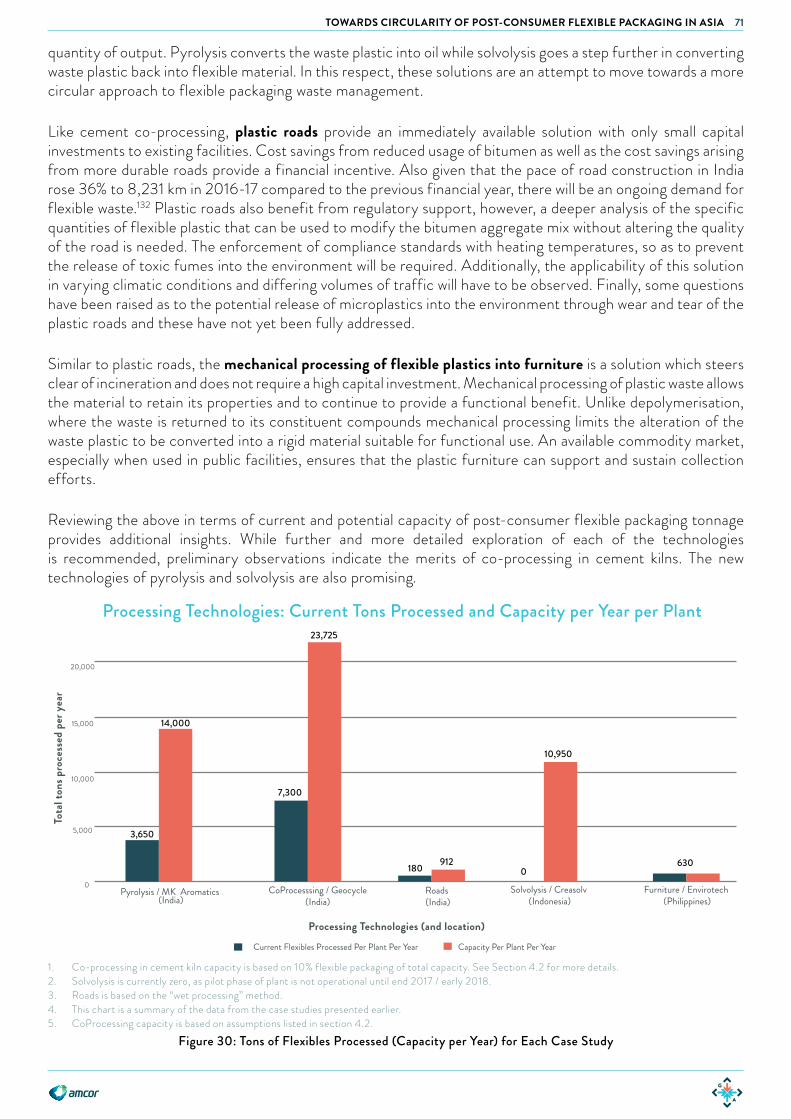
71TOWARDS CIRCULARITY OF POST-CONSUMER FLEXIBLE PACKAGING IN ASIA
quantity of output. Pyrolysis converts the waste plastic into oil while solvolysis goes a step further in converting waste plastic back into flexible material. In this respect, these solutions are an attempt to move towards a more circular approach to flexible packaging waste management.
Like cement co-processing, plastic roads provide an immediately available solution with only small capital investments to existing facilities. Cost savings from reduced usage of bitumen as well as the cost savings arising from more durable roads provide a financial incentive. Also given that the pace of road construction in India rose 36% to 8,231 km in 2016-17 compared to the previous financial year, there will be an ongoing demand for flexible waste.132 Plastic roads also benefit from regulatory support, however, a deeper analysis of the specific quantities of flexible plastic that can be used to modify the bitumen aggregate mix without altering the quality of the road is needed. The enforcement of compliance standards with heating temperatures, so as to prevent the release of toxic fumes into the environment will be required. Additionally, the applicability of this solution in varying climatic conditions and differing volumes of traffic will have to be observed. Finally, some questions have been raised as to the potential release of microplastics into the environment through wear and tear of the plastic roads and these have not yet been fully addressed.
Similar to plastic roads, the mechanical processing of flexible plastics into furniture is a solution which steers clear of incineration and does not require a high capital investment. Mechanical processing of plastic waste allows the material to retain its properties and to continue to provide a functional benefit. Unlike depolymerisation, where the waste is returned to its constituent compounds mechanical processing limits the alteration of the waste plastic to be converted into a rigid material suitable for functional use. An available commodity market, especially when used in public facilities, ensures that the plastic furniture can support and sustain collection efforts.
Reviewing the above in terms of current and potential capacity of post-consumer flexible packaging tonnage provides additional insights. While further and more detailed exploration of each of the technologies is recommended, preliminary observations indicate the merits of co-processing in cement kilns. The new technologies of pyrolysis and solvolysis are also promising.
Pyrolysis / MK Aromatics (India)
CoProcesssing / Geocycle (India)
Roads (India)
Solvolysis / Creasolv (Indonesia)
Furniture / Envirotech (Philippines)
Capacity Per Plant Per YearCurrent Flexibles Processed Per Plant Per Year
Processing Technologies (and location)
Processing Technologies: Current Tons Processed and Capacity per Year per Plant
0
5,000
10,000
15,000
20,000
Tota
l ton
s pro
cess
ed p
er y
ear
14,000
7,300
23,725
180 9120
10,950
630
3,650
0 2,000,0001,000,000-50
0
50
100
150
150
250
300
350
400
3,000,000 4,000,000
Capital Investment (Capex) Per Plant (USD)
Capex Per Plant and Capex Per Tonne Processed (Directional Only)
Cape
x Pe
r Ton
ne o
f Fle
xibl
es P
roce
ssed
(USD
)
Furniture / Envirotech(Philippines)
Roads / KK Plastics(India)
Cement co-processing/ Geocycle
(India)
Pyrolysis / MK Aromatics(India)
Figure 30: Tons of Flexibles Processed (Capacity per Year) for Each Case Study
1. Co-processing in cement kiln capacity is based on 10% flexible packaging of total capacity. See Section 4.2 for more details. 2. Solvolysis is currently zero, as pilot phase of plant is not operational until end 2017 / early 2018. 3. Roads is based on the “wet processing” method. 4. This chart is a summary of the data from the case studies presented earlier.5. CoProcessing capacity is based on assumptions listed in section 4.2.
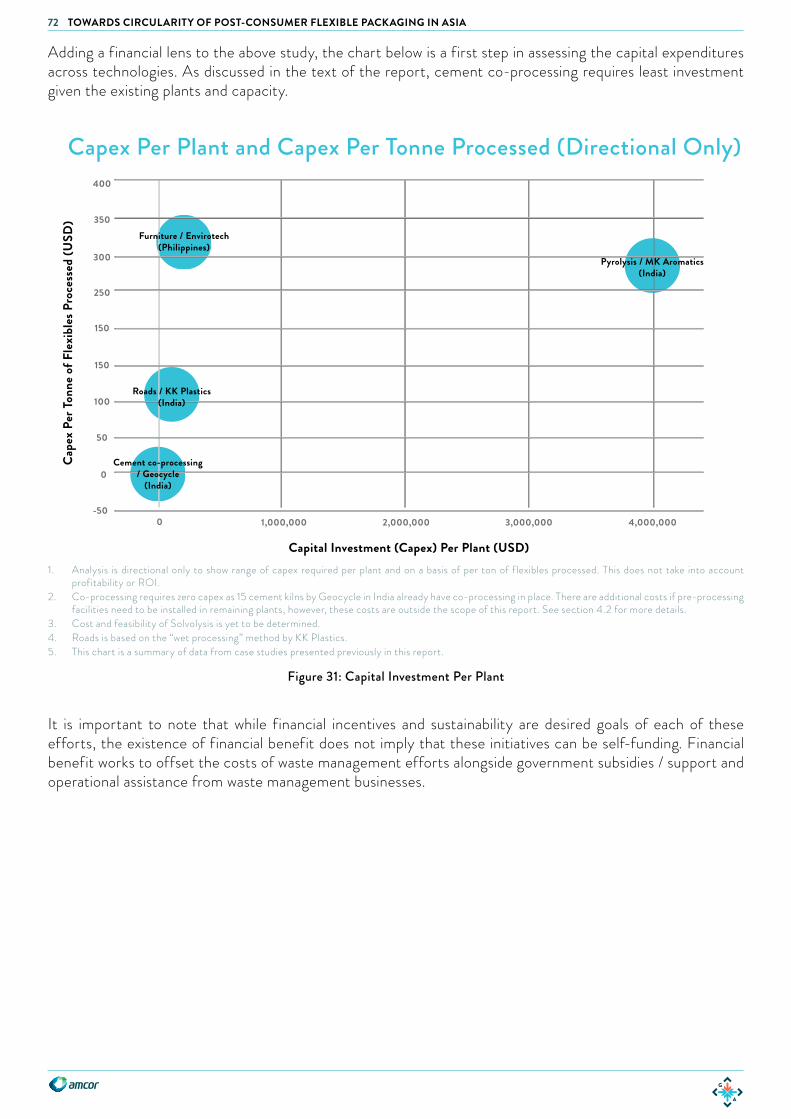
72 TOWARDS CIRCULARITY OF POST-CONSUMER FLEXIBLE PACKAGING IN ASIA
Adding a financial lens to the above study, the chart below is a first step in assessing the capital expenditures across technologies. As discussed in the text of the report, cement co-processing requires least investment given the existing plants and capacity.
It is important to note that while financial incentives and sustainability are desired goals of each of these efforts, the existence of financial benefit does not imply that these initiatives can be self-funding. Financial benefit works to offset the costs of waste management efforts alongside government subsidies / support and operational assistance from waste management businesses.
Pyrolysis / MK Aromatics (India)
CoProcesssing / Geocycle (India)
Roads (India)
Solvolysis / Creasolv (Indonesia)
Furniture / Envirotech (Philippines)
Capacity Per Plant Per YearCurrent Flexibles Processed Per Plant Per Year
Processing Technologies (and location)
Processing Technologies: Current Tons Processed and Capacity per Year per Plant
0
5,000
10,000
15,000
20,000
Tota
l ton
s pro
cess
ed p
er y
ear
14,000
7,300
23,725
180 9120
10,950
630
3,650
0 2,000,0001,000,000-50
0
50
100
150
150
250
300
350
400
3,000,000 4,000,000
Capital Investment (Capex) Per Plant (USD)
Capex Per Plant and Capex Per Tonne Processed (Directional Only)
Cape
x Pe
r Ton
ne o
f Fle
xibl
es P
roce
ssed
(USD
)
Furniture / Envirotech(Philippines)
Roads / KK Plastics(India)
Cement co-processing/ Geocycle
(India)
Pyrolysis / MK Aromatics(India)
Figure 31: Capital Investment Per Plant
1. Analysis is directional only to show range of capex required per plant and on a basis of per ton of flexibles processed. This does not take into account profitability or ROI.
2. Co-processing requires zero capex as 15 cement kilns by Geocycle in India already have co-processing in place. There are additional costs if pre-processing facilities need to be installed in remaining plants, however, these costs are outside the scope of this report. See section 4.2 for more details.
3. Cost and feasibility of Solvolysis is yet to be determined. 4. Roads is based on the “wet processing” method by KK Plastics.5. This chart is a summary of data from case studies presented previously in this report.

73TOWARDS CIRCULARITY OF POST-CONSUMER FLEXIBLE PACKAGING IN ASIA
6. SUMMARY OF FINDINGS AND RECOMMENDATIONSConcerns of post-consumer flexible packaging in Asia, cannot be addressed without building an unbroken value chain, supported by relevant stakeholders. Thus, any strategy to prevent the flow of post-consumer flexible packaging to landfill or leakage of such waste into the environment should first identify the desired value chain and its component stakeholders. Local governments, non-governmental organisations and social enterprises, waste businesses, plastics manufacturers, and businesses that use plastic packaging are all necessary players for effective action in this space.
This value chain must include the following key components of source-segregation, processing facilities to retrieve post-consumer flexible packaging and a financially viable end use. Of course, each of these components has its own dependencies on other relevant stakeholders.
Figure 32: Key Pillars for Successful Waste Management Systems
SOURCESEGREGATION
MATERIALRECOVERY
RECYCLING ANDEND USE
SUCCESSFUL WASTE MANAGEMENT SYSTEM
Legislation mandatingend use applications
Facilities, land,and buildings
Investment in equipment
Demand forpost consumer materials
Demand for recycled materials in packaging
Demand for recycledcontent in packaging
Investment in R&D
NATIONALGOVERNMENT
LOCALGOVERNMENT
RECYCLERS /PROCESSORS
CONSUMERS
MANUFACTURERSAND
BRAND OWNERS
SOCIAL ENTERPRISENGO
Segregation legislation
Segregated collectionsystem
Provision of manpower
Enforcement ofsegregation legislation
Awareness and behaviour change campaigns
Awareness and behaviour change campaigns
Householdwaste segregation
Awareness and behaviour change campaigns
Worker training and empowerment
Awareness and behaviour change campaigns
Awareness and behaviour change campaigns
National policy
Facilities, land,and buildings
Facilities, land,and buildings
Provision of manpower
Worker training
Communityengagement
Operation andmanagement
Construction and operation of MRFs
Sponsorship / subsidyto MRFs

74 TOWARDS CIRCULARITY OF POST-CONSUMER FLEXIBLE PACKAGING IN ASIA
SOURCE-SEGREGATION
Existence of Government Regulation and Enforcement for Source-segregation
When governments mandate segregation at source, even at a basic level of separating dry, wet, and sanitary waste as in Depok and Bengaluru, the collection and retrieval of waste has been more efficient. As this regulation is typically enacted and enforced at the municipal level, there is great variation in collection efforts even not only across India, Indonesia, and the Philippines but also in different regions within these countries. Source-segregation at the household level is a prerequisite for recovery of higher volumes of flexible waste. Flexible waste contaminated by organic matter poses a challenge both in terms of recovery - taking more time, posing health and hygiene risks - and end use applications - high moisture content and contaminants increase the cost of pre-processing and reduce efficiency of end use output.
Training and Development of Waste Collector
A recurring theme is the training and development of waste workers. Financial assistance, skills training, and social assistance not only ensure that waste workers form a reliable and consistent workforce, they also empower the waste workers to encourage segregation at the household level. Addressing the socio-economic needs of an otherwise overlooked section of the workforce, sits squarely within the scope and initiatives of different social organisations working to improve this sector. Partnering with the NGOs and waste collectives is a critical step in improving both the quality and quantity of the flexible waste recovered. These partners can also be mobilised to build awareness amongst households and to support data collection to improve transparency.
PROCESSING AND SORTING
Requirement of Municipal Infrastructure
Another key factor underlying the collection efforts is that municipal facilities (land, buildings) are utilised in the storing and sorting of post-consumer waste. Moreover, existing registered municipal workers and contract waste pickers are engaged typically by non-governmental entities (except the unique instance of Depok city by the city) to collect post-consumer waste.
Cross Subsidy through Collection of High Value Recyclables
Any effort to retrieve post-consumer plastic flexibles is premised on a larger dry waste collection effort comprising of other types of waste. The monetisation of higher value waste in recovery efforts provides a cross subsidy for the collection of low value, harder to retrieve post-consumer flexible waste.
Collection Incentives
An ideal investment to ensure and boost collection of flexible plastic waste would work with an established framework of an engaged municipal government and existing waste collection organisations. An incentive supporting increased collection of flexible waste should take into consideration the opportunity cost of collection as well as ensuring adequate sorting equipment and segregation facilities. Investment in an existing waste management organisation, such as Hasiru Dala would not only boost collection, it would benefit from existing worker development and local regulation.
At Hasiru Dala, an ideal cash incentive to incentivise workers and cover operational costs would be approximately USD 0.20/kg. A one-time investment of USD 25,000 alongside a monthly cash incentive of USD 1,000 would drive up collection in a single ward to from 12 tons to 60 tons annually. With existing source-segregation laws in effect and Hasiru Dala’s reach of households, flexible collection can be multiplied with immediate effect.
75TOWARDS CIRCULARITY OF POST-CONSUMER FLEXIBLE PACKAGING IN ASIA
VIABLE END USE
Government Regulation Impacting End Use
The divergence in the efforts and initiatives included in this report can be viewed as a result of the interplay between government regulation and focus and the end use application for the flexible waste. For instance, solutions such as pyrolysis and alternative fuels for cement kilns are unlikely candidates in the Philippines, where the Clean Air Act, disallows the combustion of waste. In contrast, the SWM Rules of 2016 in India, mandate the use of waste plastic in solutions such as plastic road construction and for use as an alternative fuel, especially in cement kilns. Similarly, with pyrolysis and solvolysis, government support is being sought to ensure that the solution aligns with the general legislation of the government and can be monitored under existing or new guidelines.
Scalability of End Use Applications
Another aspect of divergence arises from the scalability of the end use application. Solutions that provide a financial incentive, either through a commodity market such as pyrolysis, solvolysis and plastic furniture, or through cost savings in the case of cement kilns will provide a sustainable and scalable end use for the collection efforts - allowing financial benefit to trickle down the supply chain. Factors impacting the scalability include:
• Access / availability of the end use application (existing cement kilns vs. building new pyrolysis plants)• Amount / quantity of flexible plastic waste that can be consumed by the solution without altering the
quality of the end-use (pyrolysis requires between 10-35 tons a day whereas cement kilns require can handle up to 50 tons per day)
• Actual financial benefit (price for end commodity / cost savings)• Costs of preprocessing, transportation, and processing.• Scalability will also be impacted by the environmental risks posed by each of these solutions and to
what extent these risks are offset by the environmental benefits of removing these materials from the linear system.
Bridging Collection Efforts and End Use Solutions
Working with waste collection organisations such WVI and W4C, provision of operational assistance subsidising access to end use solutions such as cement kilns or plastic roads or furniture would ensure that the collection efforts and even cash incentives provided by other interested stakeholders are channelised to an effective end use application. Actual costs of these efforts would vary based on transportation or pre-processing costs.
OTHER POLICY CONSIDERATIONS
Change of Focus Away from Waste-to-Energy
The compounding factors of rapid growth in waste generation and overflowing landfills are leading cities across India, Indonesia and the Philippines to move rapidly towards waste-to-energy (WTE) technologies without fixing the front-end issues of waste segregation, collection and recycling. Such a move towards end of the waste value chain capital-intensive technologies robs city governments of the opportunity to turn waste management into a profitable utility and burdens the citizens through future taxes.
Industry-initiated EPR Fee System
There is an incomplete understanding and lack of proper communications of the characteristics of good EPR systems. For example, it is assumed that EPR is a tax and is only a responsibility of the producer. As explained in detail in Appendix B: The Case for EPR, a well-implemented EPR fee system takes away the need for a government eco-tax for packaging (as the EPR system would enable the industry to self-govern
76 TOWARDS CIRCULARITY OF POST-CONSUMER FLEXIBLE PACKAGING IN ASIA
and fund packaging recycling) and requires participation of all stakeholders - government legislators, industry, municipalities, waste operators, recyclers and citizens. A well-implemented EPR regulation and fee system would also create a level-playing field for all packaging producers and ensure that all packaging - especially non-recyclable flexible packaging, gets collected and either recycled or incinerated for energy recovery. Detailed economic and environmental impact analysis of any government-initiated or voluntary EPR system needs to be carried out proactively by the FMCG and packaging industry to be able to effectively engage with government agencies that are already considering mandating EPR systems. Based on the analysis, an investment in the creation and operation of a non-profit entity to establish and manage a voluntary EPR fee system, thereby leapfrogging the fragmented efforts by governments in India, Indonesia and the Philippines, would ensure the participation of additional stakeholders and also create a pool of funds that could be invested in the different approaches reviewed under this report as well as in funding research for more effective technologies and solutions. Embracing this approach would ensure improved solutions not only for flexible waste but also other plastics, materials and even e-waste.
77TOWARDS CIRCULARITY OF POST-CONSUMER FLEXIBLE PACKAGING IN ASIA
APPENDICESAPPENDIX A: REGULATIONS IMPACTING POST-CONSUMER FLEXIBLE PACKAGING
INDIA
Most Relevant Features of Plastic Waste Management Rules 2016133 - March 2016• Section 2 - Collect Back System
• The producers, importers and brand owners who introduce the plastic carry bags, multi-layered plastic sachet, or pouches, or packaging in the market within a period of six months from the date of publication of these rules (by 18th September 2016), need to establish a system for collecting back the plastic waste generated due to their products. Systems and programs are to be implemented within two years thereafter (by 18th September 2018).
• They shall work out modalities for waste collection system based on Extended Producer’s Responsibility and involving State Urban Development Departments, either individually or collectively, through their own distribution channel or through the local body concerned. This plan of collection has to be submitted to the State Pollution Control Boards while applying for consent to Establish or Operate or Renewal. The producers / brand owners whose consent has been renewed before the notification of these rules shall submit such plan within one year from the date of notification of these rules and implement within two years thereafter.
• The introduction of the collect back system of waste generated from various products by the producers / brand owners of those products will improve the collection of plastic waste, its reuse / recycle.
• Section 3 - Phasing out of manufacture and use of non-recyclable multilayered plastic. • Manufacture and use of non-recyclable multilayered plastic if any should be phased out in two
years’ time.• Section 8 - Reuse of plastic waste. The options on reuse of plastic in various applications namely, road
construction, waste to oil, waste-to-energy will enhance the recycling of plastic.• First time, responsibility of waste generators is being introduced. Individual and bulk generators
like offices, commercial establishments, industries are to segregate the plastic waste at source, handover segregated waste, pay user fee as per bye-laws of the local bodies
• Extended Producer Responsibility: Earlier, EPR was left to the discretion of the local bodies. First time, the producers (i.e persons engaged in manufacture, or import of carry bags, multi-layered packaging and sheets or like and the persons using these for packaging or wrapping their products) and brand owners have been made responsible for collecting waste generated from their products. They have to approach local bodies for formulation of plan / system for the plastic waste management within the prescribed timeframe.
• State Pollution Control Boards will not grant / renew registration of plastic bags, or multi-layered packaging unless the producer proposes the action plan endorsed by the concerned State Development Department.
• Producers to keep a record of their vendors to whom they have supplied raw materials for manufacturing carry bags, plastic sheets, and multi-layered packaging. This is to curb manufacturing of these products in unorganised sector.
Most Relevant Features of Solid Waste Management Rules 2016134 - April 2016• Part 3: Responsibilities of Generators have been introduced to segregate waste into three streams,
Wet (Biodegradable), Dry (Plastic, Paper, metal, wood, etc.) and domestic hazardous wastes (diapers, napkins, empty containers of cleaning agents, mosquito repellents, etc.) and handover segregated wastes to authorised rag-pickers or waste collectors or local bodies.
• Part 6: Generator will have to pay ‘User Fee’ to waste collector and for ‘Spot Fine’ for Littering and Non-segregation.
78 TOWARDS CIRCULARITY OF POST-CONSUMER FLEXIBLE PACKAGING IN ASIA
• Part 15: All manufacturers of disposable products such as tin, glass, plastics packaging etc. or brand owners who introduce such products in the market shall provide necessary financial assistance to local authorities for the establishment of waste management system.
• Part 16: All such brand owners who sale or market their products in such packaging material which are non biodegradable should put in place a system to collect back the packaging waste generated due to their production.
• Section 17: Manufacturers or Brand Owners or marketing companies of sanitary napkins and diapers should explore the possibility of using all recyclable materials in their products or they shall provide a pouch or wrapper for disposal of each napkin or diapers along with the packet of their sanitary products.
• Part 18: All such manufacturers, brand owners or marketing companies should educate the masses for wrapping and disposal of their products.
• Part 19: All industrial units using fuel and located within 100 km from a solid waste based RDF plant shall make arrangements within six months from the date of notification of these rules to replace at least 5 % of their fuel requirement by RDF so produced.
• Part 20: Non-recyclable waste having calorific value of 1,500 Kcal/kg or more shall not be disposed of on landfills and shall only be utilised for generating energy either or through refuse derived fuel or by giving away as feedstock for preparing refuse derived fuel.
• Part 21: High calorific wastes shall be used for co-processing in cement or thermal power plants.
INDONESIA
Relevant Laws Regarding Flexible Plastics in IndonesiaIndonesia has a set of Acts and Government Regulations associated with MSW management in place at the national level. For example, Act 18/2008 regarding Solid Waste Management (UURI: 18/2008), Government Regulation 81/2012 on Municipal Solid Waste (PP: 81/2012), and Minister of Environment’s Regulation 13/ 2012 on 3Rs have been enacted and firmly in place.
It must be noted that the Act 18/2008 adopted a new waste policy direction and a new paradigm of waste management, which considers waste to have economic value and that it could be utilised as energy, compost, fertilizer and industrial raw material. It is also the first law in Indonesia focused on reducing the amount of MSW sent to landfill.
Relevant Waste Management Features of Act 18/2008 (Translated from Bahasa Indonesia to English):Responsibility:
• Article 13: The management of settlement areas, commercial area, industrial area, specific area, public facility, social facility, and other facilities are obliged to provide waste segregation facilities.
• Article 15: The producer is obliged to manage the packaging of their product and /or their product which is unable to be or is difficult to be decomposed.
Finance:• Article 24: The Government and the local government are obliged to finance the implementation of
waste management. The finance shall be derived from state revenue and local revenue.
Criminal Provision:• Article 39: Any person who is in contravention of the law of bringing in and / or importing household
waste and/or household-like waste to the area of the Republic of Indonesia shall be sentenced to imprisonment for a minimum of 3 years and a maximum of 9 years; and a minimum fine of IDR 100,000,000 and a maximum fine IDR 300,000,000. Any person who in contravention of the law of bringing in and/or importing specific waste to the area of the State of the Republic of Indonesia shall be sentenced to imprisonment for a minimum of 4 years and a maximum of 12 years and a minimum fine of IDR 200,000,000 and a maximum fine of IDR 5,000,000,000.
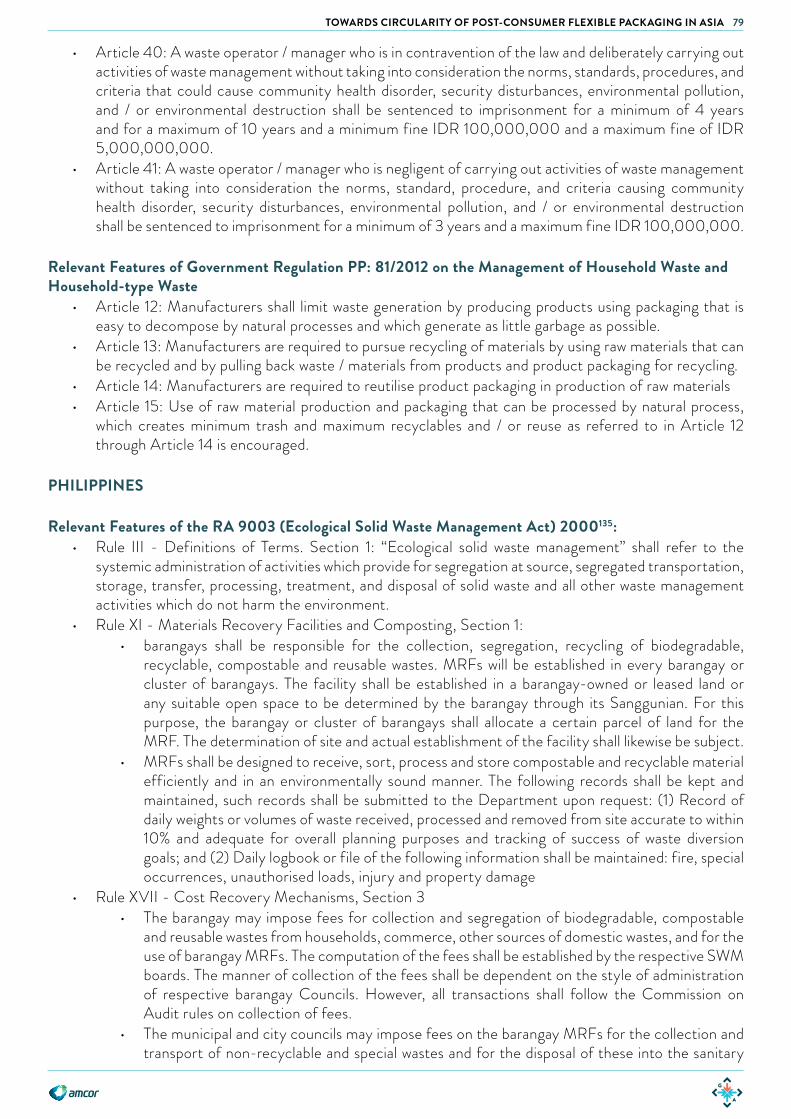
79TOWARDS CIRCULARITY OF POST-CONSUMER FLEXIBLE PACKAGING IN ASIA
• Article 40: A waste operator / manager who is in contravention of the law and deliberately carrying out activities of waste management without taking into consideration the norms, standards, procedures, and criteria that could cause community health disorder, security disturbances, environmental pollution, and / or environmental destruction shall be sentenced to imprisonment for a minimum of 4 years and for a maximum of 10 years and a minimum fine IDR 100,000,000 and a maximum fine of IDR 5,000,000,000.
• Article 41: A waste operator / manager who is negligent of carrying out activities of waste management without taking into consideration the norms, standard, procedure, and criteria causing community health disorder, security disturbances, environmental pollution, and / or environmental destruction shall be sentenced to imprisonment for a minimum of 3 years and a maximum fine IDR 100,000,000.
Relevant Features of Government Regulation PP: 81/2012 on the Management of Household Waste and Household -type Waste
• Article 12: Manufacturers shall limit waste generation by producing products using packaging that is easy to decompose by natural processes and which generate as little garbage as possible.
• Article 13: Manufacturers are required to pursue recycling of materials by using raw materials that can be recycled and by pulling back waste / materials from products and product packaging for recycling.
• Article 14: Manufacturers are required to re utilise product packaging in production of raw materials• Article 15: Use of raw material production and packaging that can be processed by natural process,
which creates minimum trash and maximum recyclables and / or reuse as referred to in Article 12 through Article 14 is encouraged.
PHILIPPINES
Relevant Features of the RA 9003 (Ecological Solid Waste Management Act) 2000135:• Rule III - Definitions of Terms. Section 1: “Ecological solid waste management” shall refer to the
systemic administration of activities which provide for segregation at source, segregated transportation, storage, transfer, processing, treatment, and disposal of solid waste and all other waste management activities which do not harm the environment.
• Rule XI - Materials Recovery Facilities and Composting, Section 1: • barangays shall be responsible for the collection, segregation, recycling of biodegradable,
recyclable, compostable and reusable wastes. MRFs will be established in every barangay or cluster of barangays. The facility shall be established in a barangay-owned or leased land or any suitable open space to be determined by the barangay through its Sanggunian. For this purpose, the barangay or cluster of barangays shall allocate a certain parcel of land for the MRF. The determination of site and actual establishment of the facility shall likewise be subject.
• MRFs shall be designed to receive, sort, process and store compostable and recyclable material efficiently and in an environmentally sound manner. The following records shall be kept and maintained, such records shall be submitted to the Department upon request: (1) Record of daily weights or volumes of waste received, processed and removed from site accurate to within 10% and adequate for overall planning purposes and tracking of success of waste diversion goals; and (2) Daily logbook or file of the following information shall be maintained: fire, special occurrences, unauthorised loads, injury and property damage
• Rule XVII - Cost Recovery Mechanisms, Section 3• The barangay may impose fees for collection and segregation of biodegradable, compostable
and reusable wastes from households, commerce, other sources of domestic wastes, and for the use of barangay MRFs. The computation of the fees shall be established by the respective SWM boards. The manner of collection of the fees shall be dependent on the style of administration of respective barangay Councils. However, all transactions shall follow the Commission on Audit rules on collection of fees.
• The municipal and city councils may impose fees on the barangay MRFs for the collection and transport of non-recyclable and special wastes and for the disposal of these into the sanitary
80 TOWARDS CIRCULARITY OF POST-CONSUMER FLEXIBLE PACKAGING IN ASIA
landfill. The level and procedure for exacting fees shall be defined by the Local SWM Board / Local SWM Cluster Board and supported by LGU ordinances, however, payments shall be consistent with the accounting system of government.
Relevant Features of the RA 8749 (Clean Air Act) 1999136:• Section 20 - Ban on Incineration:
• Incineration, hereby defined as the burning of municipal, biomedical and hazardous waste, whereby process emits poisonous and toxic fumes is hereby prohibited
• Local government units are hereby mandated to promote, encourage and implement in their respective jurisdiction a comprehensive ecological waste management that includes waste segregation, recycling and composting.
• With due concern on the effects of climate change, the Department shall promote the use of state-of-the-art, environmentally-sound and safe non-burn technologies for the handling, treatment, thermal destruction, utilisation, and disposal of sorted, unrecycled, uncomposted, biomedical and hazardous wastes.
APPENDIX B: THE CASE FOR EPR
How Europe Embraced EPR Systems as a Solution for Managing Packaging WasteEuropean economies which were a few decades early in their economic development curve identified the huge costs to the taxpayers and government associated with household waste collection, separation and treatment of packaging waste and put in place EPR systems funded by producers of packaging materials as well as producers of large and difficult to recycle items such as mattresses, refrigerators and electronics. With EPR, producers are given a responsibility for funding or managing the recycling, treatment or responsible disposal of their products in the post-consumption stage. The EPR system shifts the bulk of the responsibility for end-of-life management of recyclable products and packaging to producers and consumers and away from taxpayers and governments.
These EPR systems first emerged in Europe in the 1994 Packaging and Packaging Waste Directive and the 1999 Landfill Directive and continued with regular new directives including the 2011 Roadmap on Resource Efficiency and 7th Environmental Action Program with a vision towards a Circular Economy and a low-carbon society. This has meant that municipal waste in the EU going to landfills has fallen from 302 kg per capita in 1995 to almost 176 kg per capita in 2015.137
During the initial years of EPR implementation the consumer goods industry was worried when calculating the negative effect the European EPR systems would have on their business. In hindsight, more than 20 years later it became clear that the calculations used were widely exaggerated and on the contrary by following EPR systems a wave of innovation and entrepreneurship in the field of waste management and recycling was created. Well implemented EPR systems have led to a flourishing industry with an overall employment related to materials recovery in Europe that has increased steadily from 422 inhabitants per million in 2000 to 611 in 2007 (an increase of 45%)138 and an EU-wide average recycling rate of 65% as of 2014139 for all household and industrial packaging. The ambitious Circular Economy Package recently adopted by the European Commission now has a target of 75% recycling rates for all packaging materials by 2030.140
The Arguments Against EPR Implementation One of the common arguments raised by industry groups in India, Indonesia, and the Philippines is that waste management is the responsibility of all stakeholders, not just producers and therefore should be looked at as a new framework ESR (Extended Stakeholder Responsibility) instead of EPR.
Another common argument is that EPR is a threat to business, a burden to the plastics industry and that it would do not solve the waste leakage and environmental problems associated with packaging.
81TOWARDS CIRCULARITY OF POST-CONSUMER FLEXIBLE PACKAGING IN ASIA
As the below section on “Characteristics of a good EPR system” will show, these arguments stem from an incomplete understanding and lack of proper communications of the characteristics of good EPR systems.
It must be noted that the research team observed several piecemeal post-consumer packaging collection initiatives in India, Indonesia and the Philippines and these initiatives were often presented as the packaging and consumer goods industry’s response to the problem of packaging waste ending up in open dumpsites or landfills.
However, based on the examples of Bengaluru in India and Depok in Indonesia urban areas across India, Indonesia, and the Philippines are likely to take between 1-5 years to significantly increase their household segregation rates. Almost all ongoing post-consumer packaging collection initiatives with a few notable exceptions can be considered to be annual box-ticking Corporate Social Responsibility (CSR) exercises which have a maximum of 100 : 5 ratio in terms of packaging put into the market by the producers compared to post-consumer packaging collected by the producers through these initiatives. Most of these initiatives also cannot be counted as pilots / experiments as they have been running for over several years, well past what pilots would need to last for, and have resulted in no significant reduction in plastics leakage into the oceans, minimal improvement of the above-mentioned ratio and compounding of the problem of unsustainable management of post-consumer packaging.
Even in the United States where overall recycling rate of all MSW remains at a low 34.6%141 and where there has been organised trade association opposition against EPR for decades, voluntary efforts such as the Closed Loop Fund show signs of change with consumer brands taking a pro-active role in supporting municipalities to increase their recycling rates. For example, the Closed Loop Fund is a debt fund that has raised USD 100 million from retail and consumer goods companies to loan to city governments to boost recycling. Similarly, Recycling Partnership is a non-profit organisation that develops public-private partnerships funded by consumer goods, packaging companies and the wider paper, plastics and waste management industry to increase curb-side recycling. Characteristics of Good EPR SystemsOutlined below are some of the key characteristics observed in well-functioning EPR systems in several European countries as well as in Japan:
1. A well-implemented EPR fee system only funds the collection, separation and treatment of packaging waste and not other types of household waste which consumer goods and packaging companies are not responsible for generating i.e. EPR systems must be viewed as a solution to only one part of a MSW system (i.e. packaging) and not as a blanket funding mechanism for all parts of a MSW program. A fair EPR system does not expect packaging, which makes up a relatively small volume of total MSW, to fund the entire MSW system
2. Communications by government bodies on proposed EPR regulations clarify that EPR systems would only be used to fund packaging and other types of large, hard to recycle items and not entire MSW systems
3. A well-implemented EPR fee system takes away the need for a government eco-tax for packaging as the EPR system would enable the industry to manage recycling for packaging i.e. EPR fees and government eco-taxes are not the same thing
4. Consumer goods companies in their European and Japanese operations have accepted EPR fees as a pre-competitive, appropriate cost of doing business and of being responsible corporate citizens. This shows that the industry in Europe and Japan instead to looking at EPR fees as a burden sees it as an opportunity for resource recovery and innovation
5. All stakeholders are required to play their roles i.e. EPR and responsibility of all stakeholders are not mutually exclusive
6. Municipalities have an obligation to cooperate with the EPR scheme and actively do so. Municipalities have a contractual agreement with the organisation managing the EPR system and get funding from the EPR system to further fund waste management companies to pick up post-consumer packaging

82 TOWARDS CIRCULARITY OF POST-CONSUMER FLEXIBLE PACKAGING IN ASIA
and send to recyclers7. Governments do not condone piecemeal, unsustainable post-consumer packaging collection initiatives
undertaken by packaging producers and importers as a permission to keep to business as usual. Instead government policies encourage and incentivise consumer goods and packaging companies to voluntarily kick-start programs to make funding available for packaging recycling as an alternative to paying an eco-tax
8. EPR fees collected are directed towards funding major recycling costs including capital expenditure (for land, buildings, trucks, carts etc one-time costs with investment horizon of several years or longer), operating expenses required on an ongoing basis and funding for public education, program expansion, and other continuing improvement programs
9. EPR systems tend to be better-financed and -managed overall and are therefore more resilient in down markets. In an EPR system, the risk of down or collapsed markets is on industry, not on communities.142 This is especially relevant in Asia where the informal sector plays a significant role in recycling packaging
Box 24: In Focus: Belgium’s Fost Plus EPR system
Fost Plus, a non-profit organisation in Belgium with a team of 50 employees today, was founded in 1994 as a voluntary initiative of the private sector on the concept of EPR whereby the obliged companies take responsibility for the end-of-life management of the products they put on the market. Shortly after its founding, the selective collection of household packaging waste was implemented throughout Belgium. Today no other European country scores better than Belgium when it comes to the quantity and quality of sorting and recycling.
Belgium has an 87.4% recycling rate for packaging with 679,937 tons of household packaging getting recycled in 2016. The Fost Plus EPR model collected EUR 157 million in revenue in 2016 with EUR 78 million coming from producers and importers of packaging and EUR 65.2 million coming from sales of packaging materials.143
Fost Plus uses its business model to allocate funds for pilot programs to further improve recycling rates. For example in 2016 six Belgian municipalities began test projects to investigate the extended collection of plastic packaging - especially flexible plastics and flexible foils.
In terms of fees, producers and importers of PET (bottles and flasks) pay EUR 0.2107/kg while the fee for drink cartons is EUR 0.2455/kg. The fee for readily recyclable packaging materials such as aluminium is as low as EUR 0.0326/kg and as high as EUR 0.3106 for non-valorised packaging (packaging that can not be recycled, composted or incinerated with energy recovery).144 All companies which declare their production tonnage (declaration can be done online) and pay the required fee are able to put the Green Dot logo on their products. The alternative for companies that choose not to join the Fost Plus system or recycle packaging on their own is an expensive Belgian eco-tax per can or container.
While Belgium remains most advanced in Europe when it comes to packaging recycling, it has further room for improvement. For example, its overall plastics recycling rate is only 36.2% (although PET recycling rate is 75.3%)145 and litter from recyclables still remains an issue, although litter levels per capita are much smaller compared to many parts of developing Asia.
On the whole, the Fost Plus EPR scheme is a worthy benchmark because it provides a significant source of funding to Belgium’s waste management efforts, offers producers of packaging a strong economic alternative to eco-taxes, has the desired effect of increasing recycling rates and through market mechanisms encourages producers and importers to either produce packaging that be recycled or innovate in developing recycling technologies which turn non-valorised packaging into recyclable packaging.
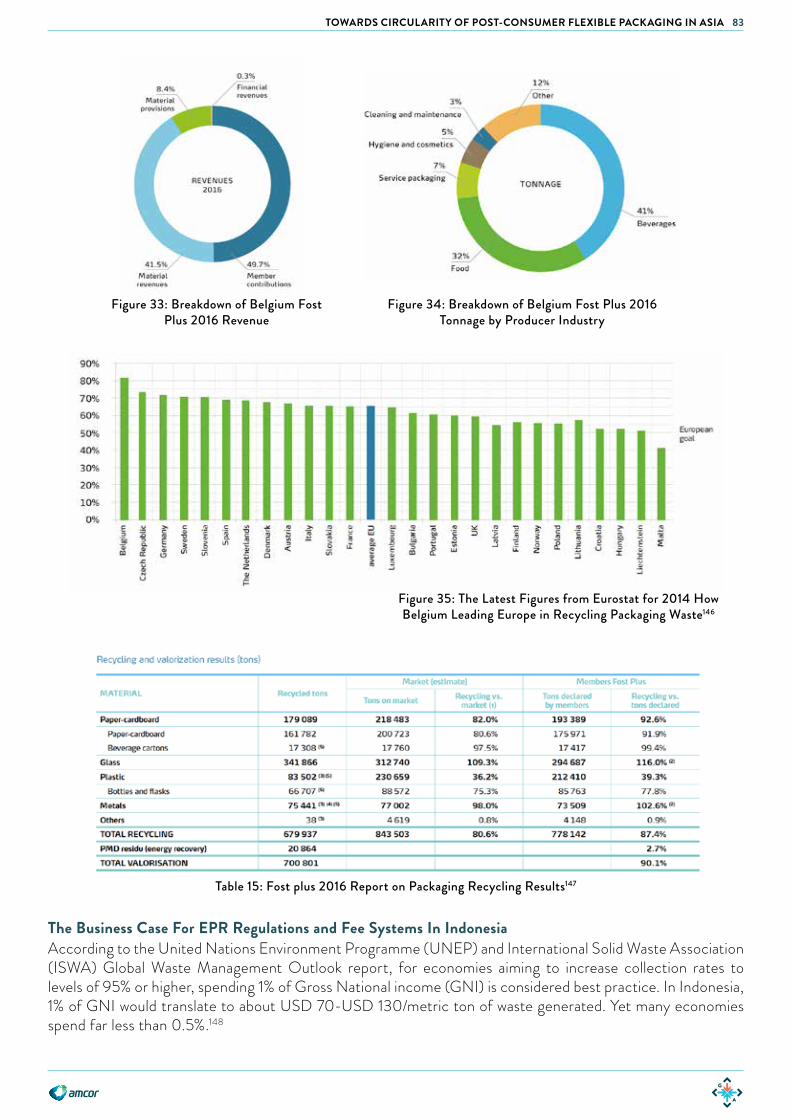
83TOWARDS CIRCULARITY OF POST-CONSUMER FLEXIBLE PACKAGING IN ASIA
Figure 33: Breakdown of Belgium Fost Plus 2016 Revenue
Figure 34: Breakdown of Belgium Fost Plus 2016 Tonnage by Producer Industry
Figure 35: The Latest Figures from Eurostat for 2014 How Belgium Leading Europe in Recycling Packaging Waste146
Table 15: Fost plus 2016 Report on Packaging Recycling Results147
The Business Case For EPR Regulations and Fee Systems In IndonesiaAccording to the United Nations Environment Programme (UNEP) and International Solid Waste Association (ISWA) Global Waste Management Outlook report, for economies aiming to increase collection rates to levels of 95% or higher, spending 1% of Gross National income (GNI) is considered best practice. In Indonesia, 1% of GNI would translate to about USD 70-USD 130/metric ton of waste generated. Yet many economies spend far less than 0.5%.148
84 TOWARDS CIRCULARITY OF POST-CONSUMER FLEXIBLE PACKAGING IN ASIA
While basic EPR regulations that put the onus of collecting back post-consumer packaging to packaging producers exist in Indonesia and India, both countries do not have any producer fee system embedded in them. A specific provision for a higher fee for packaging and other materials that cannot be recycled is also not provided in these basic EPR regulations. In fact Japan is the only country in Asia which has both a robust EPR regulation and a consistent fee system for packaging producers and importers that ensures that collection, separation and recycling of waste is well-funded and waste leakage is minimal.
There are no official sources of national waste management budget data available for Indonesia. However reports indicate that in 2013 the budget for solid waste management of the Directorate General of Human Settlements was USD 229 million (or 0.03% of Indonesia’s GNI of USD 888.98 billion) including funding for regulations, development, oversight, and implementation of solid waste and wastewater programs.149
Indonesia produced and imported a total of 4.2 million tons of plastic in 2014. Assuming all of this was plastic PET (most recyclable type of plastic) and a Belgian-style EPR fee of EUR 0.0593/kg150 was collected, the EPR revenue in Indonesia would be EUR 249 million (USD 300 million) which is approximately the amount that Indonesia is currently allocating for its MSW management. These conservative assumptions show that if properly implemented a Belgian-style EPR would enable India, Indonesia, and the Philippines to net a significant amount of additional funding which can then be allocated to further improve waste segregation, collection and recycling services and drive circularity of packaging materials.
RecommendationsA EU-style EPR regulation and EPR fee system for producers of packaging and other large, difficult to recycle items should be considered by the consumer goods and packaging industry in India, Indonesia, and the Philippines to fund the collection, separation and treatment of packaging waste. Economic and environmental impact analysis of any proposed EPR system needs to be carried out proactively by the consumer goods and packaging industry to be able to effectively engage with government agencies that are already considering mandating EPR systems. Since Japan and several countries in Europe have almost 2 decades worth of experience in working on EPR systems, any recommendations for or against EPR systems must be supported with strong evidence based on the experience of these other countries which have implemented EPR.
Since the government sector’s approach to waste management in India, Indonesia and the Philippines remains highly fragmented we also recommend that the EPR fee system, if implemented, should be independently managed by an industry-run non-profit similar to the Belgian Fost Plus model with minimal government involvement in day-to-day operations.
Well-implemented EPR regulations and fee systems would create a level-playing field for all packaging producers and ensure that all packaging - especially non-recyclable flexible packaging, gets collected and either recycled or incinerated for energy recovery. It would also bring much needed funding into the collection, separation and treatment of packaging waste in MSW programs and into packaging recycling sector both of which is remain severely underfunded today.
We recommend 2-3 companies to take the lead in pro-actively analysing and creating EPR systems in India, Indonesia, and the Philippines similar to how Danone co-created Eco-Emballages in France in 1992151, thereby pioneering the EPR systems for packaging now in place in 22 countries in the EU and 27 worldwide and helping many of these European countries become world leaders in packaging recycling.
In summary, we call for the producers and importers of packaging in developing Asian countries to collaborate as an industry to proactively embrace EPR (similar to how the industry in Belgium and Japan voluntarily embraced it), internalise the negative externalities of post-consumer packaging instead of fearing EPR as a risk and leveraging on EPR as a powerful tool to drive innovation towards circularity of all packaging materials.

85TOWARDS CIRCULARITY OF POST-CONSUMER FLEXIBLE PACKAGING IN ASIA
GLOSSARYBBMP – Bruhat Bengaluru Mahanagara Palike
CSR – Corporate Social Responsibility
DWCC – Dry Waste Collection Center
EMRTI – Earth Management and Recycling Technologies, Inc.
EPR – Extended Producer Responsibility
EU – European Union
EWRI – Envirotech Waste Recycling Inc.
FMCG – Fast-Moving Consumer Goods
GNI – Gross National Income
HDPE – High Density Polyethylene
HUL – Hindustan Unilever
IBHA – Indian Beauty and Hygiene Association
ISWA – International Solid Waste Association
LDPE – Low Density Polyethylene, a type of polymer
LGU – Local Government Units
MEF – Mother Earth Foundation
MOU – Memorandum of Understanding
MRF – Materials Recovery Facility
MSW – Municipal Solid Waste
NSWMC – National Solid Waste Management Commission of the Philippines
PBSP – Philippine Business for Social Progress
PPWD – Packaging and Packaging Waste Directive
PE - Polyethylene, a type of polymer
PP – Polypropylene, a type of polymer
PET – Polyethylene terephthalate, a type of polymer
RDF – Refused Derived Fuel
TPD - Tons Per Day
UNEP – United Nations Environment Programme
UPS – Ward-Level Composting Centres
VMPET – Vaccum Metallised Polyethylene terephthalate
VMOPP – Vaccum Metallised Biaxially Oriented PolyPropylene
W4C – Waste4Change
WOW – Wealth out of Waste
WTE – Waste-to-Energy
WVI – Waste Ventures India
86 TOWARDS CIRCULARITY OF POST-CONSUMER FLEXIBLE PACKAGING IN ASIA
LIST OF BOXES, FIGURES, AND TABLESBox 1: In Focus - The Reality of Low Segregation and Infrastructure Coverage in Metro Manila 18
Box 2: In Focus - Regulations and Enforcement in Indonesia 22
Box 3: Profile of Hasiru Dala, Bengaluru, India 29
Box 4: Profile of Waste Ventures, Hyderabad, India 32
Box 5: Profile of ITC Limited, India 34
Box 6: Pilot Project to Collect Flexibles, Hindustan Unilever, India 35
Box 7: Profile of Waste4Change, Indonesia 36
Box 8: Waste Pickers Collecting Flexibles 37
Box 9: Waste Management System in Depok, Greater Jakarta, Indonesia 38
Box 10: Waste System in Malang and Greater Surabaya, Java, Indonesia 41
Box 11: Profile of Community Waste Banks 42
Box 12: Kapal Api’s Marketing Campaign, Jakarta, Indonesia 44
Box 13: Profile Mother Earth Foundation, Metro Manila, Philippines 45
Box 14: Tang’s Collection Efforts, Philippines 47
Box 15: Flexible Packaging Situation at Unilever, Philippines 48
Box 16: Profile of Villar SIPAG Foundation, Philippines 49
Box 17: Profile of MK Aromatics Limited, India 51
Box 18: Profile of Geocycle, India 53
Box 19: Profile of Professor Vasudevan’s Patented Invention 56
Box 20: Profile of KK Plastic Waste Management, Bengaluru, India 57
Box 21: Profile of CreaSolv by Unilever 58
Box 22: Profile of Envirotech, Mindanao, Philippines 60
Box 23: Profile of EMRTI, Metro Manila, Philippines 63
Box 24: In Focus: Belgium’s Fost Plus EPR system 82
Figure 1: Examples of Mono-Material Plastics 10
Figure 2: Examples of Multi-Material Plastics 10
Figure 3: Examples of Multi-Materials (Plastics and Metals) 11
Figure 4: Examples of Multi-Materials (Plastics and Paper) 11
Figure 5: Categories of Flexible Packaging 12
Figure 6: Production of Flexibles Packaging Units Per Usage Category in 2016 13
Figure 7: Growth of Flexibles Packaging Consumption by Region Between 2010-2015 and 2020 Projection 14
Figure 8: Ranking of Top Asian Markets Based on Consumption of Flexible Packaging Units in 2016 15
Figure 9: Flow of Indonesia’s National Regulatory Framework on MSW Management 22
Figure 10: Collection Time for an Informal Waste Picker for 1kg of Various Plastic Type 26
Figure 11: Price Informal Waste Pickers Receive per Plastic Type 26
Figure 12: Formalising the Informal Sector 27
Figure 13: Segregation and Material Flows for Depok 38
Figure 14: UPS (Composting Centre) in Depok. Organic Scraps Being Sorted to Remove Any Minor Plastic Pieces Wrongly Segregated, then Composted. 39
Figure 15: Upcycling to Handicrafts. At Less than a Few Percent of All Flexibles Collected, it is Not a Scalable Option 40
Figure 16: Women Upcycling Multilayer Sachets into Handicrafts in Bogor, Indonesia 43
Figure 17: Successful Waste Banks in 2015 43
Figure 18: Kalapi Api Marketing Images 44
Figure 19 Fort Bonifacio Barangay MRF Before and After Intervention 46
Figure 20: Amount of Waste Collected by Five Schools in Manila 46
Figure 21: Communications Materials for Project Recyclass and Kids Activities 47
Figure 22: The Community Sweepers of Misis Walastik Program Doing House-to-House Collection of Post-Consumer Flexible Packaging 48
Figure 23: Factory in Las Pinas - Flexible Packaging Ready to be Processed & End Product (School Chairs) 50
Figure 24: MK Aromatics Factory 52
Figure 25: Professor Vasudevan 55
Figure 26: Road Signs in Bengaluru, India, Showing Roads Made from Recycled Plastic 57
Figure 27: Process from Materials Collection to Product Creation 61
Figure 28: Factory and Factory Equipment at Enviotech 62
87TOWARDS CIRCULARITY OF POST-CONSUMER FLEXIBLE PACKAGING IN ASIA
Figure 29: Summary of Collection Tons per Year 65
Figure 30: Tons of Flexibles Processed (Capacity per Year) for Each Case Study 71
Figure 31: Capital Investment Per Plant 72
Figure 32: Key Pillars for Successful Waste Management Systems 73
Figure 33: Breakdown of Belgium Fost Plus 2016 Revenue 83
Figure 34: Breakdown of Belgium Fost Plus 2016 Tonnage by Producer Industry 83
Figure 35: The Latest Figures from Eurostat for 2014 How Belgium Leading Europe in Recycling Packaging Waste 83
Table 1: Common Packaging Applications for Mono-materials 9
Table 2: Common Packaging Applications for Multi-Material Plastics 10
Table 3: Common Packaging Applications for Multi-Materials (Plastics and Metals) 10
Table 4: Common Packaging Applications for Multi-Materials (Plastics and Paper) 11
Table 5: Overview of per capita Waste Generation of Major Indian Cities (2010-2011) 17
Table 6: Aspects of Key Regulations Impacting Flexible Plastics and Post-Consumer Packaging in India, Indonesia, and the Philippines 21
Table 7: Sample Cost Breakdown Based on Post-Consumer Flexible Packaging Collection Pilots 31
Table 8: Materials Breakdown for 100,000 Households of Depok 39
Table 9: Savings from Using Plastic Modified Bitumen Recycled Plastic in Roads 58
Table 10: Solvolysis Materials That Are Preferred, Less Preferred and Materials to Be Avoided 59
Table 11: Envirotech Production Amounts and Inputs 61
Table 12: Organisations Focused on Household Segregation and Collection 66
Table 13: Flexibles Collection Pilots Attempting to Create a Waste Value Chain Linking Post-Consumer Flexible Packaging to an End Use 68
Table 14: Summary of Processing Technologies in India, Indonesia and the Philippines 70
Table 15: Fost plus 2016 Report on Packaging Recycling Results 83

88 TOWARDS CIRCULARITY OF POST-CONSUMER FLEXIBLE PACKAGING IN ASIA
ENDNOTES1 Boyce, P., Palmer, J., (2015), The Future of Global Flexible Packaging to 2020, Smithers Pira
2 Boyce, P., Palmer, J., (2015), The Future of Global Flexible Packaging to 2020, Smithers Pira
3 Boyce, P., Palmer, J., (2015), The Future of Global Flexible Packaging to 2020, Smithers Pira
4 Ocean Conservancy (2017) The Next Wave, Investment Strategies for Plastic Free Seas, Washington, D.C. Ocean Conservancy
5 MacArthur, D. E., Waughray, D., & Stuchtey, M. R. (2016). The New Plastics Economy, Rethinking the Future of Plastics. In World Economic Forum
6 Boyce, P., Palmer, J., (2015), The Future of Global Flexible Packaging to 2020, Smithers Pira
7 Boyce, P., Palmer, J., (2015), The Future of Global Flexible Packaging to 2020, Smithers Pira
8 Boyce, P., Palmer, J., (2015), The Future of Global Flexible Packaging to 2020, Smithers Pira
9 Boyce, P., Palmer, J., (2015), The Future of Global Flexible Packaging to 2020, Smithers Pira
10 Boyce, P., Palmer, J., (2015), The Future of Global Flexible Packaging to 2020, Smithers Pira
11 Euromonitor (n.d.), Euromonitor International Passport Database, Euromonitor [Accessed 12 Sep 2017]
12 Boyce, P., Palmer, J., (2015), The Future of Global Flexible Packaging to 2020, Smithers Pira
13 Boyce, P., Palmer, J., (2015), The Future of Global Flexible Packaging to 2020, Smithers Pira
14 Euromonitor (n.d.), Euromonitor International Passport Database, Euromonitor [Accessed 12 Sep 2017]
15 Boyce, P., Palmer, J., (2015), The Future of Global Flexible Packaging to 2020, Smithers Pira
16 Euromonitor (n.d.), Euromonitor International Passport Database, Euromonitor [Accessed 12 Sep 2017]
17 MacArthur, D. E., Waughray, D., & Stuchtey, M. R. (2016). The New Plastics Economy, Rethinking the Future of Plastics. In World Economic Forum
18 Euromonitor (n.d.), Euromonitor International Passport Database, Euromonitor [Accessed 12 Sep 2017]
19 Hoornweg, D., & Bhada-Tata, P. (2012). What a waste: a global review of solid waste management, World Bank
20 Jong, H. N. (2015) Indonesia in state of waste emergency, [online] www.thejakartapost.com Available at http://www.thejakartapost.com/news/2015/10/09/indonesia-state-waste-emergency.html [Accessed 22 Oct 2017]
21 Ghosal, A. (2017) With three landfills shut, Delhi becomes overflowing trash can [online] Available at http://indianexpress.com/article/cities/delhi/with-three-ghazipur-landfills-collapse-shut-delhi-becomes-overflowing-trash-can-4829037/ [Accessed 29 Oct 2017]
22 Van Ryan Kristopher, R. (2017). REVIEW ON THE IMPACTS OF WASTE DISPOSAL SITES IN THE PHILIPPINES. Science International, 29(2), 379-379.
23 The Freeman (2017) DENR tells LGUs: Close prohibited dumpsites, [online] Available at http://www.philstar.com/cebu-news/2017/02/09/1670545/denr-tells-lgus-close-prohibited-dumpsites [Accessed 28 Oct 2017]
24 United Nation (2016) The World’s Cities in 2016 [online] Available at http://www.un.org/en/development/desa/population/publications/pdf/urbanization/the_worlds_cities_in_2016_data_booklet.pdf
25 Kumar, S., Smith, S. R., Fowler, G., Velis, C., Kumar, S. J., Arya, S., … Cheeseman. (2017). Challenges and opportunities associated with waste management in India. Royal Society Open Science, 4(3), 160764. http://doi.org/10.1098/rsos.160764
26 Census of India (2011), CPCB Report (2011)
27 Ministry of Environment and Forests, Press Information Bureau (2016), Solid Waste Management Rules Revised After 16 Years; Rules Now Extend to Urban and Industrial Areas [Press release] Retrieved from http://pib.nic.in/newsite/PrintRelease.aspx?relid=138591 [Accessed 12 Oct 2017]
28 Kumar, S., Smith, S. R., Fowler, G., Velis, C., Kumar, S. J., Arya, S., … Cheeseman. (2017). Challenges and opportunities associated with waste management in India. Royal Society Open Science, 4(3), 160764. http://doi.org/10.1098/rsos.160764
29 Kumar, S., Smith, S. R., Fowler, G., Velis, C., Kumar, S. J., Arya, S., … Cheeseman. (2017). Challenges and opportunities associated with waste management in India. Royal Society Open Science, 4(3), 160764. http://doi.org/10.1098/rsos.160764
30 Ocean Conservancy (2017) The Next Wave, Investment Strategies for Plastic Free Seas, Washington, D.C. Ocean Conservancy
31 Jambeck, J. R., Geyer, R., Wilcox, C., Siegler, T. R., Perryman, M., Andrady, A., ... & Law, K. L. (2015). Plastic waste inputs from land into the ocean. Science, 347(6223), 768-771.
32 Based on Gone Aventurin research estimates
33 The Hindu (2017), Segregate your waste or pay fine from Wednesday [online] http://www.thehindu.com Available at http://www.thehindu.com/news/cities/bangalore/Segregate-your-waste-or-pay-fine-from-Wednesday/article17118659.ece [Accessed 1 Nov 2017]
34 National Solid Waste Management Commission (n.d) SOLID WASTE MANAGEMENT - Dashboard [online] Available at http://119.92.161.4/nswmc4/default3.aspx [Accessed 14 Oct]
35 National Solid Waste Management Commission (n.d) SOLID WASTE MANAGEMENT - Dashboard [online] Available at http://119.92.161.4/nswmc4/default3.aspx [Accessed 14 Oct]
36 National Solid Waste Management Commission (n.d) SOLID WASTE MANAGEMENT - Dashboard [online] Available at http://119.92.161.4/nswmc4/default3.aspx [Accessed 14 Oct]
37 Ocean Conservancy (2017) The Next Wave, Investment Strategies for Plastic Free Seas, Washington, D.C. Ocean Conservancy
38 Ocean Conservancy (2017) The Next Wave, Investment Strategies for Plastic Free Seas, Washington, D.C. Ocean Conservancy
39 LGU = Local Government Unit
40 National Solid Waste Management Commision (2016), National Solid Waste Management Strategy 2012 – 2016, Quezon City, Metro Manila, National Solid Waste Management Commision
41 Central Pollution Control Board (2016), The National Action Plan for Municipal Solid Waste Management, Delhi, India, Central Pollution Control Board
42 Lokahita, B., Takahashi, F. (2016). Enhanced Landfill Mining for Energy and Resource Recovery. Tokyo Institute of Technology
43 Mecca, B. M. (2017), Is Waste-to-Energy technology a permanent solution to Indonesia’s garbage problem? [online] http://www.thejakartapost.com Available at http://www.thejakartapost.com/academia/2017/02/01/is-waste-to-energy-technology-a-permanent-solution-to-indonesias-garbage-problem.html

89TOWARDS CIRCULARITY OF POST-CONSUMER FLEXIBLE PACKAGING IN ASIA
[Accessed 3 Nov 2017]
44 Mayuga, J. L. (2016), DENR sees rollout of waste-to-energy projects in Philippine cities next year, [online] businessmirror.com.ph Available at https://businessmirror.com.ph/denr-sees-rollout-of-waste-to-energy-projects-in-philippine-cities-next-year/ [Accessed 3 Nov 2017]
45 Ministry of Environment and Forests, Press Information Bureau (2016), Solid Waste Management Rules Revised After 16 Years; Rules Now Extend to Urban and Industrial Areas [Press release] Retrieved from http://pib.nic.in/newsite/PrintRelease.aspx?relid=138591 [Accessed 12 Oct 2017]
46 Indii (2013, October) Journal of the Indonesia Infrastructure Initiative PRAKARSA [online] Available at http://www.indii.co.id/images/dx_publication_file/7390/prakarsa-oct-2013-eng-full-colour.pdf [Accessed 25 Oct 2017]
47 NEA (n.d.) Waste Management [online] Available at http://www.nea.gov.sg/energy-waste/waste-management [Accessed 1 Nov 2017]
48 NEA (2015) Hyflux Ltd And Consortium Partner Mitsubishi Heavy Industries Ltd To Build New Waste-To-Energy Plant In Tuas [Press Release] Available at http://www.nea.gov.sg/corporate-functions/newsroom/news-releases/hyflux-ltd-and-consortium-partner-mitsubishi-heavy-industries-ltd-to-build-new-waste-to-energy-plant-in-tuas [Accessed 2 Nov 2017]
49 PWC (2017), Waste Management in India - Shifting Gears [online] Available at https://smartnet.niua.org/sites/default/files/resources/waste-management-in-india-shifting-gears.pdf [Accessed 29 Oct 2017]
50 Ocean Conservancy (2017) The Next Wave, Investment Strategies for Plastic Free Seas, Washington, D.C. Ocean Conservancy
51 Data on ‘Low Value’ Plastics calculated based on in-person interviews with waste pickers from Indonesia
52 Linzner, R., & Lange, U. (2013). Role and size of informal sector in waste management–a review. In Proceedings of the Institution of Civil Engineers-Waste and Resource Management (Vol. 166, No. 2, pp. 69-83). ICE Publishing.
53 Linzner, R., & Lange, U. (2013). Role and size of informal sector in waste management–a review. In Proceedings of the Institution of Civil Engineers-Waste and Resource Management (Vol. 166, No. 2, pp. 69-83). ICE Publishing.
54 Linzner, R., & Lange, U. (2013). Role and size of informal sector in waste management–a review. In Proceedings of the Institution of Civil Engineers-Waste and Resource Management (Vol. 166, No. 2, pp. 69-83). ICE Publishing.
55 Linzner, R., & Lange, U. (2013). Role and size of informal sector in waste management–a review. In Proceedings of the Institution of Civil Engineers-Waste and Resource Management (Vol. 166, No. 2, pp. 69-83). ICE Publishing.
56 Gone Adventurin research
57 Soumya, E. (2014) Nalini Shekar put aside retirement to help India’s waste pickers, [online] Available at https://www.csmonitor.com/World/Making-a-difference/2014/1212/Nalini-Shekar-put-aside-retirement-to-help-India-s-waste-pickers [Accessed 18 Oct 2017]
58 Open City (n.d.) BBMP PK (Pourakarmika) Details Ward 181 (Kumara Swamy Layout) – 2017 [online] Available at http://opencity.in/documents/bbmp-pk-pourakarmika-details-ward-181-kumara-swamy-layout-2017 [Accessed 19 Oct 2017]
59 Linzner, R., & Lange, U. (2013). Role and size of informal sector in waste management–a review. In Proceedings of the Institution of Civil Engineers-Waste and Resource Management (Vol. 166, No. 2, pp. 69-83). ICE Publishing
60 Linzner, R., & Lange, U. (2013). Role and size of informal sector in waste management–a review. In Proceedings of the Institution of Civil Engineers-Waste and Resource Management (Vol. 166, No. 2, pp. 69-83). ICE Publishing
61 Linzner, R., & Lange, U. (2013). Role and size of informal sector in waste management–a review. In Proceedings of the Institution of Civil Engineers-Waste and Resource Management (Vol. 166, No. 2, pp. 69-83). ICE Publishing
62 Bruhat Bengaluru Mahanagara Palike (2016) SWM Public Notices and Other Informations [online] Retrieved from http://bbmp.gov.in/public-notice
63 Chengappa, C. (2013). Organizing Informal Waste Pickers: A Case Study of Bengaluru, India. Cambridge, Manchester: WIEGO-Women in Informal Employment: Globalizing and Organizing
64 Chakraberty, S. (2014). From waste picker to recycling manager. [online] Citiscope.org. Available at: http://citiscope.org/story/2014/waste-picker-recycling-manager [Accessed 1 Nov. 2017]
65 Naveen BP, Sivapullaiah PV (2016) Solid Waste Management in Bengaluru-Current Scenario and Future Challenges. Innov Ener Res 5:139. doi:10.4172/ier.1000139
66 Chengappa, C. (2013). Organizing Informal Waste Pickers: A Case Study of Bengaluru, India. Cambridge, Manchester: WIEGO-Women in Informal Employment: Globalizing and Organizing
67 Naveen BP, Sivapullaiah PV (2016) Solid Waste Management in Bengaluru-Current Scenario and Future Challenges. Innov Ener Res 5:139. doi:10.4172/ier.1000139
68 Chengappa, C. (2013). Organizing Informal Waste Pickers: A Case Study of Bengaluru, India. Cambridge, Manchester: WIEGO-Women in Informal Employment: Globalizing and Organizing
69 Siraj, M. (2014). Will Bangalore ever be garbage-free?. [online] The Hindu. Available at: http://www.thehindu.com/features/homes-and-gardens/green-living/will-Bengaluru-ever-be-garbagefree/article6040441.ece [Accessed 1 Nov. 2017]
70 Naveen BP, Sivapullaiah PV (2016) Solid Waste Management in Bengaluru-Current Scenario and Future Challenges. Innov Ener Res 5:139. doi:10.4172/ier.1000139
71 Hasiru Dala Innovations Private Limited. (n.d.). Waste Management. [online] Available at: https://www.hasirudalainnovations.com/pages/total-waste-management [Accessed 1 Nov 2017]
72 Parida, R. (n.d.). ITC Launches its celebrated ‘Wellbeing Out of Waste’ (WOW) initiative for school children - India Education Diary. [online] India Education Diary. Available at: https://indiaeducationdiary.in/itc-launches-celebrated-wellbeing-waste-wow-initiative-school-children/ [Accessed 23 Oct. 2017]
73 Centre for Science and Environment (n.d), Status of Solid and Biomedical Waste Management in Muzaffarpur City and Proposed Plan for Swachh Muzaffarpur, New Delhi, India, Centre for Science and Environment
74 Hindustan Unilever Ltd (2011), Unilever India 2011 Sustainable Living Plan, Mumbai, India, Hindustan Unilever Ltd
75 Hindustan Unilever Ltd (2014), Hindustan Unilever Business Responsibility Report 2012-13: Making Sustainable Living Commonplace, Mumbai, India, Hindustan Unilever Ltd
76 P Putra, Y. (n.d.). Wali Kota: Piala Adipura Berkat Kerja Keras Warga Depok [online] Republika Online. Available at: http://nasional.republika.co.id/berita/nasional/jabodetabek-nasional/17/08/02/ou1ujm284-wali-kota-piala-adipura-berkat-kerja-keras-warga-depok [Accessed 24 Oct. 2017]
77 Notosusanto, I. (2013). Shell Indonesia Supports Bank Sampah Depok (BSD) to Help Manage Waste in Depok. [online] Shell.co.id. Available at: http://www.shell.co.id/en_id/media/archived-news-and-media-releases/news-2013/shell-indonesia-supports-bank-sampah-depok-to-help-waste-management.html [Accessed 13 Oct. 2017]
78 For more information on waste banks, see following section on collection initiatives by Unilever Indonesia through Waste Banks
79 Based on interviews with Depok City team who developed and executed the segregation program, Partai Ember. These statistics are +/- 5%
80 Based on interviews with Pak Zamrowi and Pak Isanarto of Depok, plus Waste Management companies based in Greater Jakarta
90 TOWARDS CIRCULARITY OF POST-CONSUMER FLEXIBLE PACKAGING IN ASIA
81 Interviews with Waste Banks in Java throughout 2016-17 including Baron Noorwendo (Bank Sampah WPL in Depok), Bambang Suwerda (Bank Sampah Gemah Ripah in Yogyakarta)
82 Estimated at 50% of all plastics collected based on Interviews with Wate banks throughout Java in 2016-17
83 Interviews with Waste Banks in Java throughout 2016-17 including Baron Noorwendo (Bank Sampah WPL in Depok), Bambang Suwerda
84 Unillever Indonesia (2014, June 25) The Unilever Waste Bank - Reducing waste and improving communities [Video File]. Retrieved from https://www.youtube.com/watch?v=9FiVknh6pL0
85 Kopi Kapal Api (2014, August 13), FAQ - Kejutan Special Kapal Api, [Facebook Status Update] Retrieved from https://www.facebook.com/notes/kopi-kapal-api/faq-kejutan-special-kapal-api/826583450708926/
86 Info Kuis Network. (2017). Promo Undian Kapal Api 2017 Berhadiah Mercedez Benz & Ducati. [online] Available at: http://infokuisnetwork.com/promo-undian-kapal-api-2017-berhadiah-mercedez-benz-ducati/ [Accessed 1 Nov. 2017]
87 Image Credit: Mother Earth Foundation
88 Multiple attempts to contact Mondelez to find out results of the project have been unsuccessful and there is no media coverage of project results. Only the project launch has been covered by media
89 Granali, R. (2013). PS kids can be active and interactive recyclers. [online] Newsinfo.inquirer.net. Available at: http://newsinfo.inquirer.net/440961/ps-kids-can-be-active-and-interactive-recyclers [Accessed 25 Oct. 2017]
90 Macairan, E. (2013). Kids urged to help in recycling campaign. [online] philstar.com. Available at: http://www.philstar.com/headlines/2013/06/30/959841/kids-urged-help-recycling-campaign [Accessed 1 Nov. 2017]
91 Multiple attempts to contact Mondelez to find out results of the project have been unsuccessful and there is no media coverage of project results. Only the project launch has been covered by media
92 Rappler. (2014). Tang Galing: School chairs for impoverished schools. [online] Available at: https://www.rappler.com/bulletin-board/53465-tang-galing-school-chairs [Accessed 1 Nov. 2017]
93 Granali, R. (2013). PS kids can be active and interactive recyclers. [online] Newsinfo.inquirer.net. Available at: http://newsinfo.inquirer.net/440961/ps-kids-can-be-active-and-interactive-recyclers [Accessed 25 Oct. 2017]
94 PBSPLRC (2016). Unilever Misis Walastik Launched in 6 Barangays. [online] Available at: http://pbsplrc.blogspot.sg/2016/02/unilever-misis-walastik-launched-in-6.html [Accessed 13 Oct. 2017]
95 Based on interviews with Unilever Philippines team
96 Based on interviews with Unilever Philippines team
97 Unilever Philippines. (n.d.). Unilever Strengthens Waste Recovery Efforts. [online] Available at: https://www.unilever.com.ph/news/press-releases/2017/MisisWalastikProgramCynthiaVillar.html [Accessed 13 Oct. 2017]
98 Based on interviews with Unilever Philippines team
99 Based on interviews with Unilever Philippines team
100 Image Credit: Unilever Philippines
101 Based on Interviews with Villar SIPAG Foundation
102 Villar SIPAG (n.d.). Solid Waste Management City-wide Practices. [online] Available at: http://www.villarsipag.org/page?id=14&menu=4 [Accessed 1 November 2017]
103 Villar SIPAG (n.d.). Solid Waste Management City-wide Practices. [online] Available at: http://www.villarsipag.org/page?id=14&menu=4 [Accessed 1 November 2017]
104 Based on Interviews with Villar SIPAG Foundation
105 Based on Interviews with Winchester Lemen, Envirotech
106 Based on interviews with Villar SIPAG Foundation
107 Source: www.mkaromatics.com
108 Poddar, S. K., & Paranjpe, P. A. (2015). Energy Recovery through Plastic Waste in Cement Industry: a Review. Int J Recent Dev Eng Technol, 4(5), 15-18
109 Rabindra Singh (2015), AFR and its relelvance to Indian cement industry [online], Available at http://www.cmaindia.org/templates/magicaltie/images/conference/Technical-IV/Mr-Rabindra-Singh.pdf [Accessed on 3 Nov 2017]
110 Chatziaras, N., Psomopoulos, C. S., & Themelis, N. J. (2016). Use of waste derived fuels in cement industry: a review. Management of Environmental Quality: An International Journal, 27(2), 178-193
111 Government of India, Press Information Bureau (2016) Solid Waste Management Rules, 2016 What is new? [Press release] Retrieved from http://pibphoto.nic.in/documents/rlink/2016/apr/p20164502.pdf
112 Source: https://storiesofworld.com/indias-plastic-man-and-his-incredible-innovation/
113 Subramaniam, S. (2016) Plastic roads: India’s radical plan to bury its garbage beneath the streets [online] Retrieved from https://www.theguardian.com/sustainable-business/2016/jun/30/plastic-road-india-tar-plastic-transport-environment-pollution-waste [Accessed 24 Oct 2017]
114 Source: www. safaigiri.in
115 Source: www.kkplasticroads.in
116 Arora, R. (2015). Government makes use of plastic waste in road construction mandatory. [online] The Economic Times. Available at: http://economictimes.indiatimes.com/news/economy/infrastructure/government-makes-use-of-plastic-waste-in-road-construction-mandatory/articleshow/49919167.cms [Accessed 1 Nov. 2017]
117 There are concerns regarding degradation of the roads and subsequently, micro or nano-plastics entering the environment and waterways. Subramaniam, S. (2016) Plastic roads: India’s radical plan to bury its garbage beneath the streets [online] Retrieved from https://www.theguardian.com/sustainable-business/2016/jun/30/plastic-road-india-tar-plastic-transport-environment-pollution-waste [Accessed 24 Oct 2017]
118 Based on interviews with KK Plastic
119 Creacycle.de. (n.d.). Creacycle - The Process. [online] Available at: http://www.creacycle.de/en/the-process.html [Accessed 17 Oct. 2017]
120 MAULIA, E. (2017). Unilever to test new packaging-recycling tech in Indonesia [online] Nikkei Asian Review. Available at: https://asia.nikkei.com/Business/Companies/Unilever-to-test-new-packaging-recycling-tech-in-Indonesia [Accessed 16 Oct. 2017]
121 Unilever global company website. (n.d.). CreaSolv®: a breakthrough recycling technology we want to share. [online] Available at: https://www.unilever.
91TOWARDS CIRCULARITY OF POST-CONSUMER FLEXIBLE PACKAGING IN ASIA
com/news/Join-in/2017/CreaSolv-a-breakthrough-waste-recycling-technology-that-we-want-to-share.html [Accessed 16 Oct. 2017]
122 Unilever global company website. (n.d.). CreaSolv®: a breakthrough recycling technology we want to share. [online] Available at: https://www.unilever.com/news/Join-in/2017/CreaSolv-a-breakthrough-waste-recycling-technology-that-we-want-to-share.html [Accessed 16 Oct. 2017]
123 MAULIA, E. (2017). Unilever to test new packaging-recycling tech in Indonesia [online] Nikkei Asian Review. Available at: https://asia.nikkei.com/Business/Companies/Unilever-to-test-new-packaging-recycling-tech-in-Indonesia [Accessed 16 Oct. 2017]
124 MAULIA, E. (2017). Unilever to test new packaging-recycling tech in Indonesia [online] Nikkei Asian Review. Available at: https://asia.nikkei.com/Business/Companies/Unilever-to-test-new-packaging-recycling-tech-in-Indonesia [Accessed 16 Oct. 2017]
125 Porcalla, D. (2014). No more classroom shortage in Phl – Noy. [online] philstar.com. Available at: http://www.philstar.com/headlines/2014/02/04/1286394/no-more-classroom-shortage-phl-noy [Accessed 1 Nov. 2017]
126 Based on interviews with Founder, Winchester Lemen
127 Based on interviews with Founder, Winchester Lemen
128 Source: envirotech.com.ph
129 Based on interviews with Founder, Winchester Lemen
130 Source: Winchester Lemen, Envirotech
131 Ibhaindia.com. (n.d.). AIPMA – IBHA. [online] Available at: http://ibhaindia.com/aipma/ [Accessed 1 Nov. 2017]
132 Pace of laying of roads rises to 22 km daily in 2016-17 [online] Retrieved from http://www.thehindu.com/business/Industry/pace-of-laying-of-roads-rises-to-22-km-daily-in-2016-17/article18113295.ece [Accessed 18 Nov 2017]
133 Ministry of Environment and Forests, Press Information Bureau (2016), Government Notifies Plastic Waste Management Rules, 2016 [Press release] Retrieved from http://pib.nic.in/newsite/PrintRelease.aspx?relid=138144 [Accessed 19 Oct 2017]
134 Ministry of Environment and Forests, Press Information Bureau (2016), Solid Waste Management Rules Revised After 16 Years; Rules Now Extend to Urban and Industrial Areas [Press release] Retrieved from http://pib.nic.in/newsite/PrintRelease.aspx?relid=138591 [Accessed 12 Oct 2017]
135 Ecolex (n.d.) Implementing Rules and Regulations of the Philippine Ecological Solid Waste Management Act of 2000 [online] www.ecolex.org Available at https://www.ecolex.org/details/legislation/implementing-rules-and-regulations-of-the-philippine-ecological-solid-waste-management-act-of-2000-lex-faoc068080/?q=RA+9003 [Accessed 12 Oct 2017]
136 Ecolex (n.d.) Philippine Clean Air Act of 1999, Republic Act No. 8749 [online] www.ecolex.org Available at https://www.ecolex.org/details/legislation/philippine-clean-air-act-of-1999-republic-act-no-8749-lex-faoc045271/ [Accessed 12 Oct 2017]
137 Eurostat (n.d.) Municipal waste by waste operations - Landfill disposal [online] Available at http://ec.europa.eu/eurostat/cache/metadata/en/env_wasmun_esms.htm [Accessed 7 Nov 2017]
138 EEA (2011) Earnings, Jobs and Innovation: The Role of Recycling in a Green Economy (EEA Report No 8/2011) Available at https://www.eea.europa.eu/publications/earnings-jobs-and-innovation-the/download Accessed 8 Nov 2017)
139 Eurostat (2014) Eurostats Statistics Explained Available at http://ec.europa.eu/eurostat/statistics-explained/index.php/File:Recovery_and_recycling_rates_for_packaging_waste,_2014.png [Accessed 7 Nov 2017]
140 European Commission (2017). Circular Economy Strategy - Environment - European Commission. [online] Available at: http://ec.europa.eu/environment/circular-economy/index_en.htm [Accessed 8 Nov. 2017]
141 EPA (2016) Advancing Sustainable Materials Management :2014 Fact Sheet, Washington, D.C, EPA
142 Prindiville, M. and Rhodes, J. (2016). 5 Reasons EPR Is the Answer for Plastics Recycling | Sustainable Brands. [online] sustainablebrands.com. Available at: http://www.sustainablebrands.com/news_and_views/packaging/matt_prindiville/why_epr_answer_plastics_recycling [Accessed 1 Oct. 2017].
143 Fost Plus (2016), Annual Report 2016, Packaging management for a world on the move: evolution or revolution?, Evere, Belgium, Fost Plus
144 Fost Plus (2016), Annual Report 2016, Packaging management for a world on the move: evolution or revolution?, Evere, Belgium, Fost Plus
145 Fost Plus (2016), Annual Report 2016, Packaging management for a world on the move: evolution or revolution?, Evere, Belgium, Fost Plus
146 Eurostat (2014) Eurostats Statistics Explained Available at http://ec.europa.eu/eurostat/statistics-explained/index.php/File:Recovery_and_recycling_rates_for_packaging_waste,_2014.png [Accessed 7 Nov 2017]
147 Fost Plus (2016), Annual Report 2016, Packaging management for a world on the move: evolution or revolution?, Evere, Belgium, Fost Plus
148 Ocean Conservancy (2017) The Next Wave, Investment Strategies for Plastic Free Seas, Washington, D.C. Ocean Conservancy
149 Indii (2013, October) Journal of the Indonesia Infrastructure Initiative PRAKARSA [online] Available at http://www.indii.co.id/images/dx_publication_file/7390/prakarsa-oct-2013-eng-full-colour.pdf [Accessed 25 Oct 2017]
150 After taking into account Indonesia’s Purchasing Power Parity (PPP) of 3.4 based on 2016 World Bank data €0.2107/kg would be €0.0593/kg
151 Danone (2016) Packaging Policy Co-Build The Circular Economy of Packaging By Sourcing Sustainable Materials And Creating A Second Life For All Plastics, Paris, France, Danone
92 TOWARDS CIRCULARITY OF POST-CONSUMER FLEXIBLE PACKAGING IN ASIA
ABOUT GONE ADVENTURIN (GA) Asia is the biggest contributor to post-consumer waste mismanagement in the world. Gone Adventurin is a Business Consultancy and Program Execution Partner focused on driving Circular Economy in Asia. We are on a mission to tackle the fast-growing streams of packaging, food and electronic materials in Asia and to help unlock business opportunities from post-consumer waste. We envision a world without waste.
Since we started in 2011 we have enabled dozens of businesses, government agencies and NGOs to tackle important environmental challenges while helping grow their bottom line.
We help companies design circular business strategies, implement deployments to recycle post-consumer waste, create closed loop supply chains so that nothing goes to waste and engage stakeholders through storytelling.
We have worked with clients such as P&G in India, Danone in Indonesia, Dole Foods in the Philippines, Unilever in Vietnam and the National Environment Agency in Singapore.

93TOWARDS CIRCULARITY OF POST-CONSUMER FLEXIBLE PACKAGING IN ASIA
goneadventurin.com