Embed Size (px)
Citation preview

i '
,ii' : ....
' j 1 ~I
I ' I
·~
J.K. Cable
Evaluation of Maturity and Pulse Velocity Measurements for PCC Traffic
Opening Decisions
March, 1998
Sponsored by.the Project Development Division of the
Iowa Department of Transportation and the Iowa Highway Research Board
~'1&. towa Department ~i of Transportation
Final
IOWA STATE UNIVERSITY OF SCIENCE AND TECHNOLOGY
Iowa DOT Project HR-380
Department of Civil and Construction Engineering
I r ;
\ . J
I
)
J
Dr. James K. Cable P.E.
EVALUATION OF MATURITY AND PULSE VELOCITY
MEASUREMENTS FOR PCC TRAFFIC OPENING DECISIONS
March, 1998
Sponsored by the
Project Development Division of the
Iowa Department of Transportation and the
Iowa Highway Research Board
Iowa DOT Project HR-380
Civil and Construction Engineering
College of Engineering
Iowa State University
i

DISCLAIMER
"The opinions, findings, and conclusions expressed in this publication are those of the author and not necessarily those of the Iowa Department of Transportation."
ii

I ,~
)
~
I, \
( I
ACKNOWLEDGEMENTS
This project was made possible by the interest of Dennis
Osipowicz, Lee County Engineer, the Iowa DOT and the Iowa
Concrete Paving Association cooperative efforts in research.
~ Funding for the project was made possible through the efforts of
the above mentioned groups through the Iowa Highway Research
Board in the form of project HR-380.
I A special thanks goes to Jim Reinsche tor his work in the
I collection of data for this project. Without his dedication and
knowledge 9f concrete the project would not have been a success.
This daily data collection effort was aided by Jennifer Ries and
Shane Tymcowicz of the Iowa DOT. Without Shanna Duggan, Trevor
Brown, Greg Mulder, and Lisa McDaniel much of the data analysis
would not have been completed. They not only assisted in the
work, but had the chance to learn much about the research work
and concrete pavement construction. This project was truly a
) partnership between the research team and members of the Off ice
of Materials; Iowa DOT in Ames, the Southeast Iowa Transportation
Center office and the Mount Pleasant Construction Residency.
f This type of project would not be possible without the
cooperation of the Fred Carlson Co. and Superintendent Charlie
) Davis. This is another example of how Iowa and the construction
industry benefits from cooperative research efforts.
iii

ABSTRACT
Concrete paving is often at a disadvantage in terms of pavement
type selection due to the time of curing required prior to
opening the pavement to traffic. The State of Iowa has been
able to reduce traffic delay constraints through material
selection and construction methods to date. Methods for
monitoring concrete strength gain and quality have not changed
since the first concrete pavements were constructed in Iowa. In
19 9 5, Lee County and the Iowa DOT cooperated in a research
project, HR-3 8 0, to construct a 7. 1 mile ( 11. 43 km) project to
evaluate the use of maturity and pulse velocity nondestructive
testing (NDT) methods in the estimation of concrete strength
gain.
The research identified the pros and cons of each method
and suggested an instructional memorandum to utilize maturity
measurements to meet traffic delay demands. Maturity was used to
reduce the traffic delay opening time from 5-7 days to less· than
2 days through the implementation of maturity measurements and
special traffic control measures. Recommendations on the
development of the maturity curve for each project and the
location and monitoring of the maturity thermocouples are
included. Examples of equipment that could easily be used by
project personnel to estimate the concrete strength using the
maturity methods is described.
iv

' \
r r /,. I
TABLE OF CONTENTS CHAPTER
DISCLAIMER
ACKNOWLEDGEMENTS
ABSTRACT
LIST OF FIGURES
INTRODUCTION
RESEARCH OBJECTIVES
EXPERIMENTAL DESIGN
Data Collection Methods
Instrumentation Data Collection Device Selection
TEST SITE CHARACTERISTICS
Test Site Selection
NDT Preproject Preparations
CONSTRUCTION SITE ADMINISTRATION
CONSTRUCTION PROBLEMS
RESEARCH RESULTS
Maturity and Pulse Velocity Relationships
Field Measured Concrete Strength Relationships Maturity Results Pulse Velocity Results Air Temperature and Humidity Relationships
Visual Distress Survey Results
Deflection Survey Results
Concrete Core Laboratory Testing
v
Page
II
Ill
!V
VII
1
2
4
4
5
10
10
13
26
27
30
30
34 34 43 45
46
50
52

Equipment Laboratory Testing
NDT Instructional Memorandum
SUMMARY AND CONCLUSIONS
REFERENCES
vi
53
54
58
62

I
1 LIST OF FIGURES
Figure Title Page
FIGURE 1, FLEXURAL STRENGTH TEST BEAMS ......................................................................................................... 2
FIGURE 2, COMPRESSIVE STRENGTH TEST CYLINDERS ............................................................................................ 3 FIGURE 3, HUMBOLT MODEL H-2680, SYSTEM 4101 MATURITY RECORDER ......................................................... 6
FIGURE 4, MATURITY THERMOCOUPLE DOWEL ASSEMBLY .................................................................................... 7
FIGURE 5, OMEGA INDUSTRIES DIGITAL THERMOMETER ........................................................................................ 8 FIGURE 6, JAMES INDUSTRIES INC. PULSE VELOGITY METER, MARK II ................................................................. 9
FIGURE 7, OMEGA INDUSTRIES TEMPERATURE/RELATIVE HUMIDITY DEVICE .................................................... 10
FIGURE 8 CONSTRUCTION PROJECT SITE MAP ······································································································· 11 FIGURE 9, PULSE VELOCITY METAL ACCESS TEMPLATE ....................................................................................... 14
FIGURE 10 PULSE VELOCITY MEASUREMENT TEMPLATE ...................................................................................... I 5
FIGURE 11, PULSE VELOCITY ACCESS INSERTION LAYOUT .................................................................................... 16 FiGURE 12 PULSE VELOCITY TEST CONCRETE REMOVAL METHODS .................................................................... 17 FIGURE 13 PULSE VELOCITY TEST TUBE EXTRACTION .......................................................................................... I 8
FIGURE 14, PULSE VELOCITY MEASUREMENT ACTIVITY ....................................................................................... I 9 FIGURE 15, PULSE VELOCITY ACCESS PREPARATION EQUIPMENT ........................................................................ 20
FIGURE 16, MATURITY THERMOCOUPLE INSTALLATION ....................................................................................... 23
FIGURE 17, MATURITY RECORDER LAYOUT ....................... : .................................................................................... 24
FIGURE 18 MANUAL MATURITY MEASUREMENT .................................................................................................... 25
FIGURE 19, NDT SITE LAYOUT ...................... , .................................................................................................. : ...... 26 FIGURE 20, DATA COLLECTION VEHICLE ................................................................................................................ 29
FIGURE 21 LABORATORY FLEXURAL STRENGTH VS MATURITY RELATIONSHIP ................................................... 31 FIGURE 22, LABORATORY COMPRESSIVE STRENGTH VS TIME RELATIONSHIP ..................................................... 33
11
FIGURE 23, LABORATORY COMPRESSIVE STRENGTH VS PULSE VELOCITY RELATIONSHIP ................................. 33
\. FIGURE 24, FIELD MATURITY CURVE ...................................................................................................................... 36
I I
FIGURE 25, MATURITY STRENGTH VS CURE TIME VS HUMIDITY (TOP OF SLAB) ................................................. 39
FIGURE 26, MATURITY STRENGTH VS TIME VS HUMIDITY (MIDSLAB) .................................................................. 40 FIGURE 27, MATURITY STRENGTH VS TIME VS HUMIDITY (BOTTOM OF SLAB) .................................................... 40 FIGURE 28, MATURITY STRENGTH VS TIME VS HUMIDITY (TOP OF SHOULDER) .................................................. 41
FIGURE 29, MATURITY STRENGTH VS TIME VS HUMIDITY (MIDDEPTH) ............................................................... 41
vii
I ' i

r INTRODUCTION
. \
The Iowa Department of Transportation and the concrete
I paving industry are continuing to explore new ways to develop
concrete pavement technology. One area of research focuses on
finding more accurate assessment of pavement strength to reduce
traffic delay due to road closures. Fast Track paving has been
used for full depth paving of 6 inches (150 mm) or more in areas
where early opening to traffic is the concern. Currently
flexural test beams are used to determine when the pavement has
reached sufficient strength to allow traffic (construction and
private vehicles) passage without causing pavement damage.
Standard paving techniques require 5-14 days of curing prior to
opening.
A Lee County paving project provided concrete pavement i •
construction where an evaluation of new NDT methods could be
employed in the construction of full depth paving. The project
\ I
location is the sole access for large numbers of commuters living
along the roadway. People from approximately 150 homes, work in
town and require the use of the highway daily. They agreed to 1-
2 day road closure for paving. The county was faced with
considering ways to place a portland cement concrete pavement and
meet the short time of closure requirement.
During the summer of 1994, research was conducted on the use
of pulse velocity and maturity meter (types of non-destructive
testing, NDT) methods to identify concrete strength in a thin
concrete overlay on Iowa 3 in Franklin County. The strength
1
l 1
information gained from this project was used to determine the
time of traffic opening. Implementation of this technology in
full depth paving was required to move toward an NDT methodology
as a replacement for physical test specimens.
RESEARCH OBJECTIVES
The project was designed to investigate .ways to reduce
traffic delays through the use of NDT methods to estimate the
rate and magnitude of concrete strength gain in concrete
pavements under field conditions. Currently a road project of
I
..I
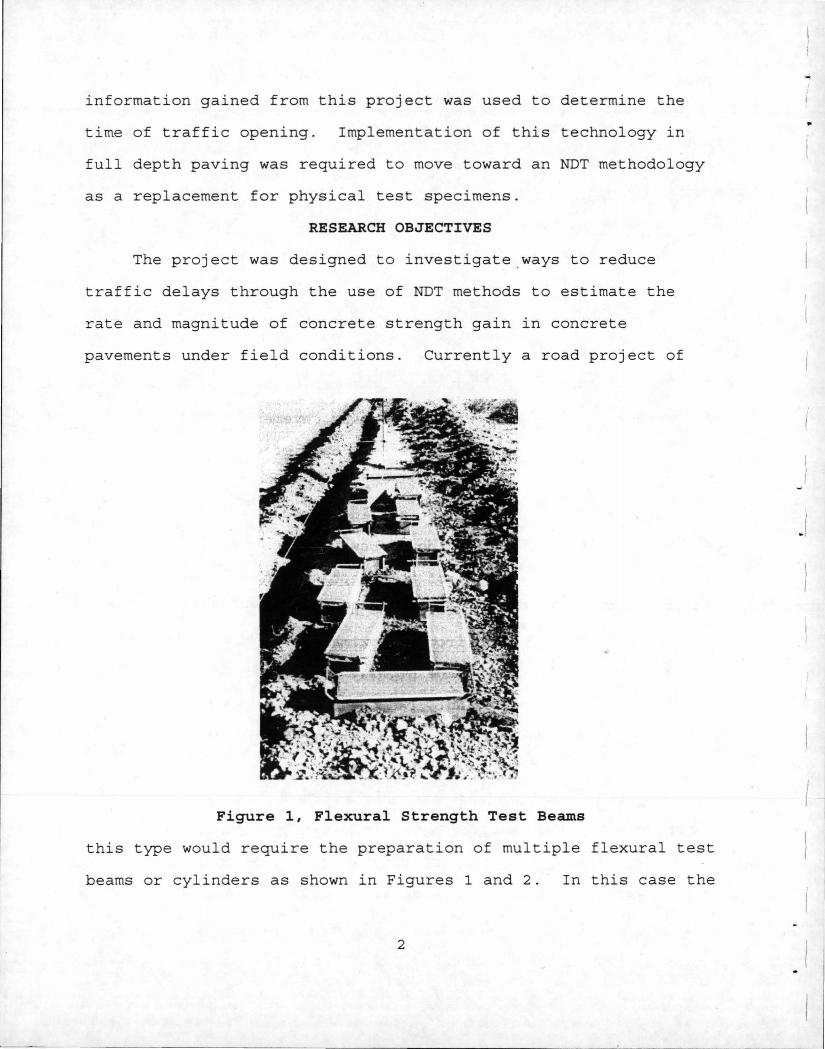
Figure 1, Flexural Strength Test Beams
this type would require the preparation of multiple flexural test
beams or cylinders as shown in Figures 1 and 2. In this case the
2

. I I
Figure 2, Compressive Strength Test Cylinders
test specimens are not part of the slab and the results of the
testing can be affected greatly by the curing location and care,
handling and transportation and the differences in testing
personnel and procedures. The goals for the Lee County research
were as follows:
1. Develop a knowledge base in the application of
Nondestructive testing methods for the determination of
pavement concrete strengths required for traffic opening.
2. Investigate possible equipment needed to effectively and
efficiently monitor concrete strength gain as related to
time and temperature (maturity) measurements in the field.
3
. I
3. Evaluate the effectiveness of maturity measurements made I at various depths in the pavement and the effect of the
subgrade temperature on the rate of strength gain.
4. Identify practical nondestructive testing equipment and
methods for field staff to monitor rate of strength gain for
traffic opening determination.
5. Monitor visual pavement distresses (cracking and patching
by type, extent and severity) on an annual basis, for two
years after construction to identify the effect of early
opening of pavements to vehicular traffic on pavement
performance.
6. Develop an instructional memorandum for use by
construction field staff and contractor personnel in the
operation of selected NDT measuring devices for measurement
of strength gain under field conditions.
EXPERIMENTAL DESIGN
Data Collection Methods The research team for this project consisted of personnel
from ISU with assistance from Iowa DOT personnel on the project.
Data collection methods centered on the use of pulse velocity and
maturity for this project. Both types of data were correlated to
laboratory values for flexural and compressive strengths of the
I constructed pavement.
Maturity measurements were taken at the beginning and ending
of each day's concrete placement with recording maturity meters.
The researchers planned to utilize some form of the pulse
4
~ ,.
I. i I
\ \
l !
\ I
velocity measurements at 500-ft. ( 152. 4 m) intervals between the
beginning and ending of days' placement to monitor strength gain
in addition to the maturity meters.
In addition,· hand held temperature and humidity recording
devices were used to measure slab and air temperature and air
humidity at each of the previously identified maturity meter and
pulse velocity locations (500 ft, 152.4 m intervals). These
devices were also used to measure strength gain in the paved
shoulder construction as an NDT control for construction of the
earth shoulders behind the curbs and along the pavement.
Instrumentation Data Collection Device Selection Maturity meters selected for this project were the Mcidel H-
2680, System 4101, manufactured by Humbolt Manufacturing Co. This
device provides the potential for monitoring four channels or
thermocouples simultaneously. Each meter can be programmed to
begin recording at a user specified time, sample at a specified
time interval, record time and temperature, and calculate
maturity relationships in terms of time/temperature or equivalent
age. It also provided the storage capacity for data of 365 days
of recording and could be downloaded to most popular computer
spreadsheets. It was chosen for its programming and recording
abilities, number of channels and download capabilities. Figure
3 shows an example of the devices used in this project. Four such
5

Of' C; . ATtH~f!Y ill iLr,
, ft.Tf. ~A ~•;.. t
Figure 3, Humbolt Model H-2680, System 4101 Maturity Recorder
devices were utilized for this project. Each device came with a
handy carrying case, thermocouple connectors, and cabling for
downloading. The device is connected to the pavement by a simple
two-pole connector and "T" type thermocouple wire. One end of
the wire is attached to the connector and the other is stripped
approximately 1 in. (25 mm) to allow for twisting of the metal
wire ends. The twisted end of the wire was positioned on a wood
dowel for the desired depth of measurement. The dowel is then
inserted into the concrete to measure temperatures at a 1-in. (25
mm) and 3.5 in. (87-mm) depth. The dowel is illustrated in
Figure 4.
6
... I

r I
: \ i . ~
..
j I
1 .. ; l ~ • l
'
I ' ' ' \ .. ~
\
. . ...
Figure 4, Maturity Thermocouple Dowel Assembly
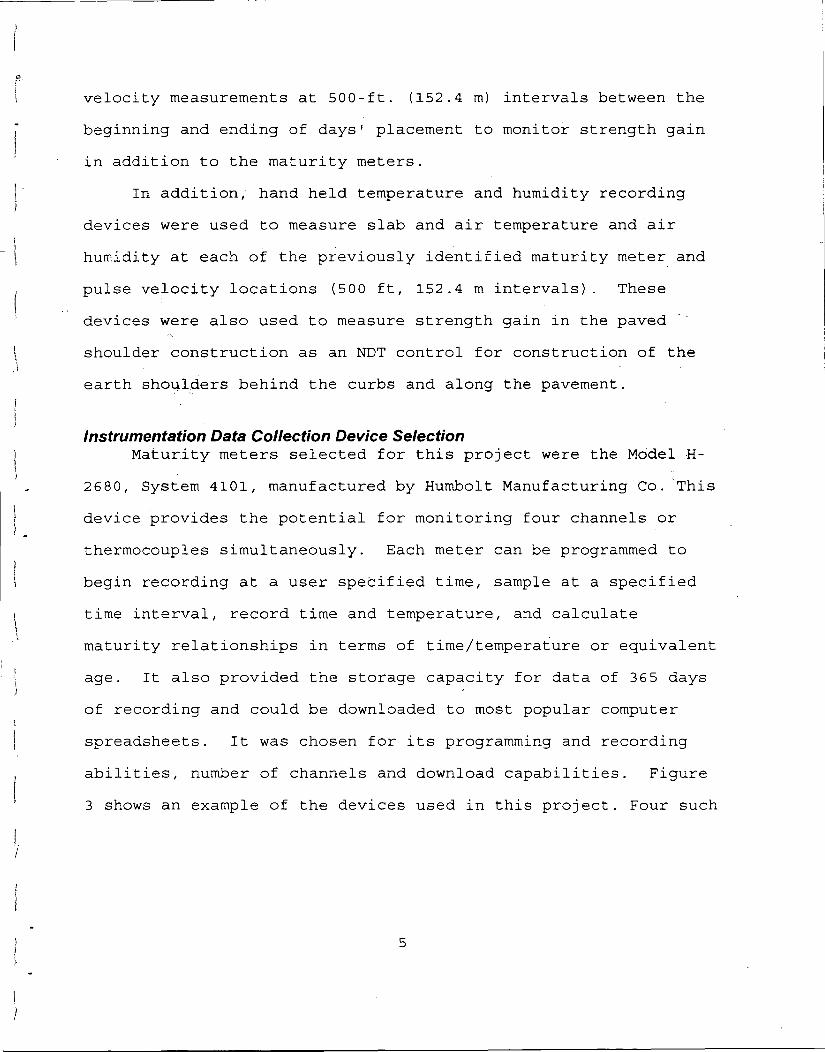
Maturity temperatures were also measured with the use of
digital thermometers manufactured by Omega Industries. These
devices came in two models, the HH-23 and HH-25. An example of
these devices is shown in Figure 5. They utilized the same type
"T" thermocouple wire and connec ors as used with the recording
maturity meters. In the case of the Model HH-25 one thermocouple
may be connected and evaluated. The Model HH-23 utilizes two
connectors and can evaluate each t he r mocoup l e output or the
differences between outputs. This unit also is equipped with an
adapter that allows for the connection of six
7
- I ../ """ . • - - ..... 4 - .- ...
"'I!- -~ ..
..... - ...... -- .,,. ·~ ... ": - .. ~ -"' --" - ...... _
--
Figure 5, Omega Industries .Digital Thermometer . I thermocouples at the same time.
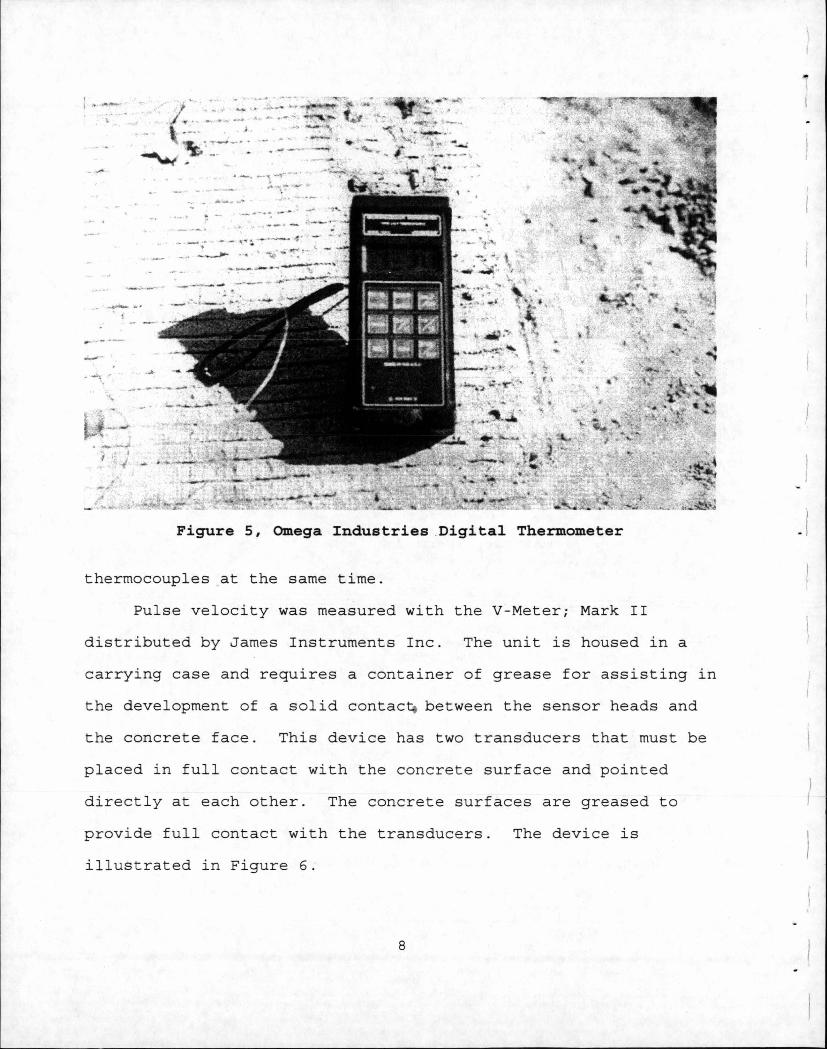
Pulse velocity was measured with the V-Meter; Mark II
distributed by James Instruments Inc. The unit is housed in a
carrying case and requires a container of grease for assisting in
the development of a solid contac between the sensor heads and
the concrete face. This device has two transducers that must be
placed in full contact with the concrete surface and pointed
directly at each other. The concrete surf aces are greased to
provide full contact with the transducers. The device is
illustrated in Figure 6.
8

Figure 6, James Industries Inc. Pulse Velocity Meter, Mark II
A final device selected for this project consisted of a
simple hand held temperature and relative humidity measuring
instrument. The Pen Humidity/Temperature distributed by Omega
was selected for this project. This device measures temperature
in degrees Fahrenheit or Celsius and the relative humidity of the
air at the site. It can be carried in a pocket or carrying case.
It was used to provide a comparison between the air temperature
and relative humidity to the temperature and maturity of the
concrete at each manual temperature measurement location. An
example of this device is shown below the clipboard, in Figure 7,
which provides an insight into the relative size.
9
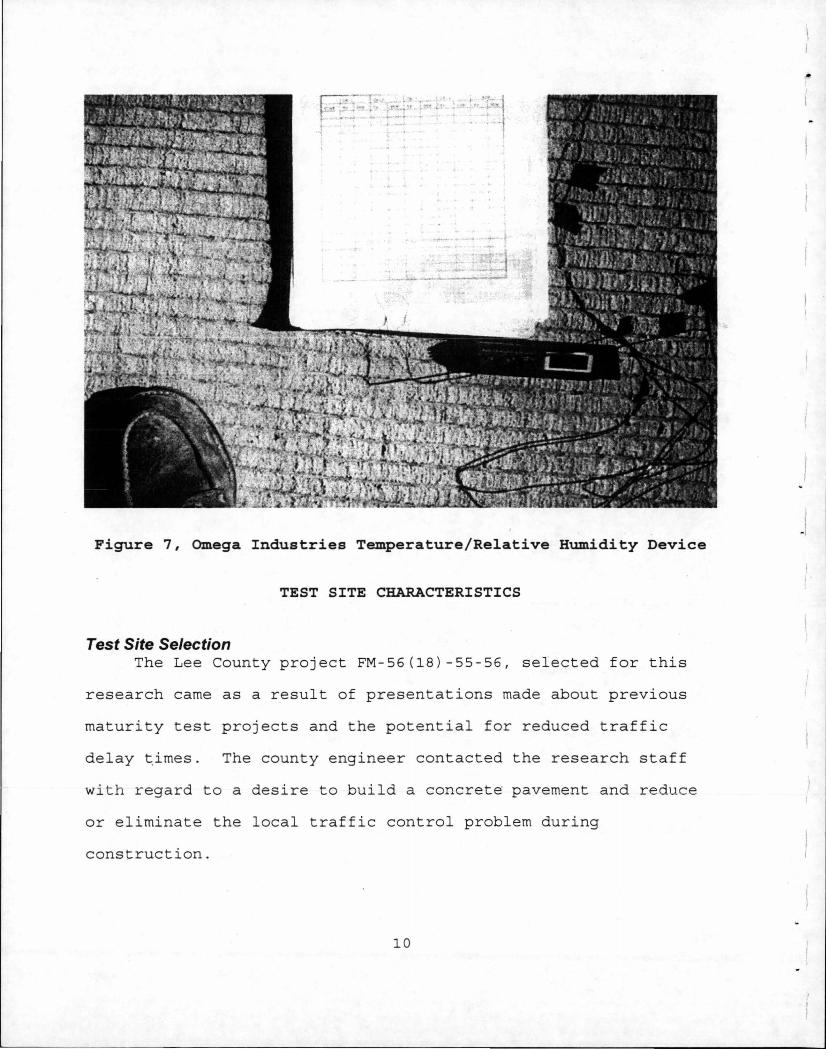
Figure 7, Omega Industries Temperature/Relative Humidity Device
TEST SITE CHARACTERISTICS
Test Site Selection The Lee County project FM-56(18)-55-56, selected for this
research came as a result of presentations made about previous
maturity test projects and the potential for reduced traffic
delay t,imes. The county engineer contacted the research staff
wi th regard to a desire to build a concrete pavement and reduce
or eliminate the local traffic control problem during
construction.
10
\ ,1.
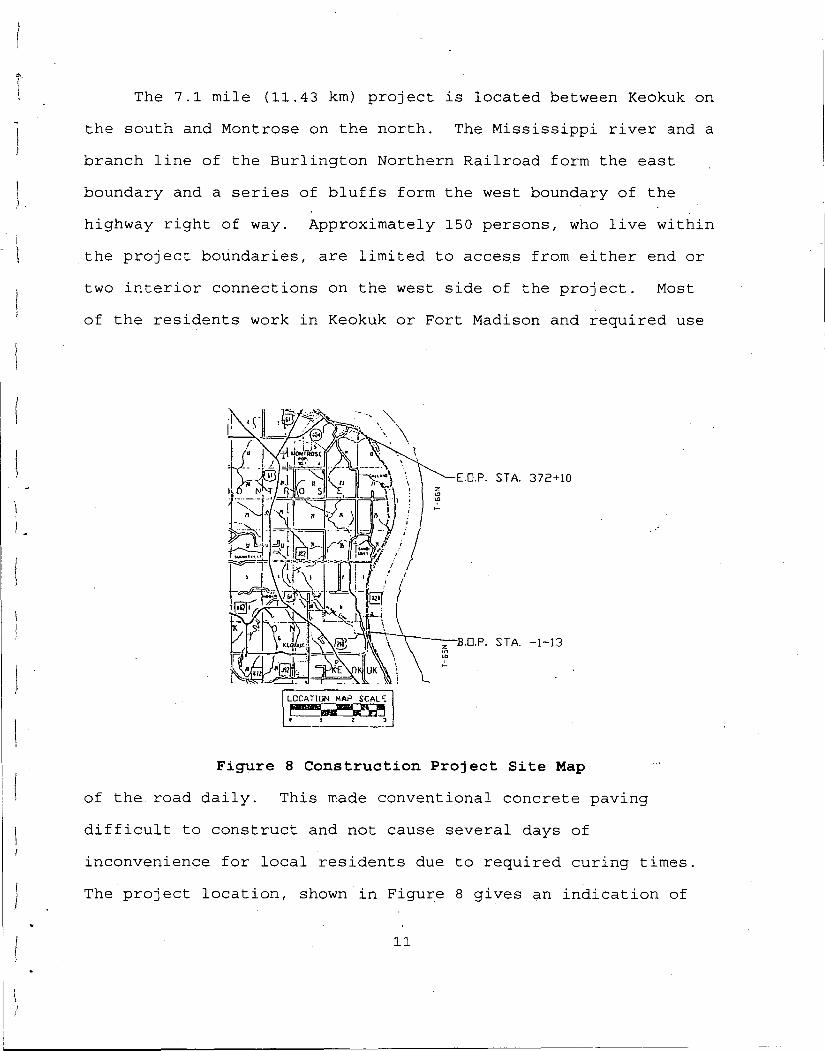
The 7.1 mile (11.43 km) project is located between Keokuk on
the south and Montrose on the north. The Mississippi river and a
branch line of the Burlington Northern Railroad form the east
boundary and a series of bluffs form the west boundary of the
highway right of way. Approximately 150 persons, who live within i
- I the project boundaries, are limited to access from either end or
two interior connections on the west side of the project. Most
of the residents work in Keokuk or Fort Madison and required use
E.O.P. STA. 372+10
z B.O.P. STA. -1-13 "' .. t-
Fiffi.Lre 8 Construction Project Site Map
of the road daily. This made conventional concrete paving
difficult to construct and not cause several days of
inconvenience for local residents due to required curing times.
The project location, shown in Figure 8 gives an indication of
11
the lack of access points into the project and the problems that
this causes for the construction of the pavement and materials
handling.
After reviewing previqus maturity research results and the
project with the research staff, the 'county engineer decided to
utilize maturity measurements for project control in an attempt
to limit the time of local traffic restriction to less than two
days. This meant that residents would not be allowed in or out
of their driveways during the day of paving and until the
concret~ had reached a safe maturity estimated flexural strength.
This provided a satisfactory traffic plan for local residents.
It also provided the county with a way to reduce construction
times for each portion of the paving sequence for mainline and.
shoulder construction.
The site provided the research staff with the first
opportunity to test the maturity concept of project control on a
full depth pavement and shoulders. It represents a typical
paving situation for county projects in terms of the pavement
cross section and paving sequence. In this case the center
portion of the pavement was to be placed 7 inches (180 mmr·in
depth and 22 ft. (6.7 m) in width. The concrete was placed
directly on an existing granular roadway surface. In some
locations the roadway had been reconstructed in the previous year
for short di~tances to correct geometric deficiencies. Full
depth concrete paved shoulders of 5.5 ft. (1.7 m) width in urban
areas and 4.0 ft. (1.2 m) width in rural areas, were placed after
12
_(
I
. I I ,
l completion of the mainline pavement. These sections were also
monitored by maturity measurements.
This project was different from many county projects in that
no large farms are located along the project and there was no
need for truck traffic to use the project. I
- \ NDT Preproject Preparations
One of the objectives asso~iated with this work involved the
investigation of the maturity gain over a period of greater than
24 hours. To achieve this objective it was necessary to obtain
additional maturity recording devices and pulse velocity
equipment. Two recording maturity meters purchased for previous
research work with the Iowa DOT were coupled with two additional
devices from the same manufacturer. This provided enough
equipment to monitor concrete placed at the beginning or end of
each day of concrete placement for at least 48 hours or 2 days
before the equipment was required at a new site on the project.
Due to the anticipated speed of paving, over 1 mile (1.61
km) per day, multiple pulse velocity readings were anticipated at
various locations simultaneously. A total of two pulse velocity
devices were used to meet these needs.
Based on previous research in overlay construction in 1994,
the research team looked at new and improved ways to develop the
1. test holes for the pulse velocity transducers to be
placed in the plastic concrete. The Iowa DOT was
interested in the variability and impact on strength
j estimation in data obtained from transducers between:
• 13
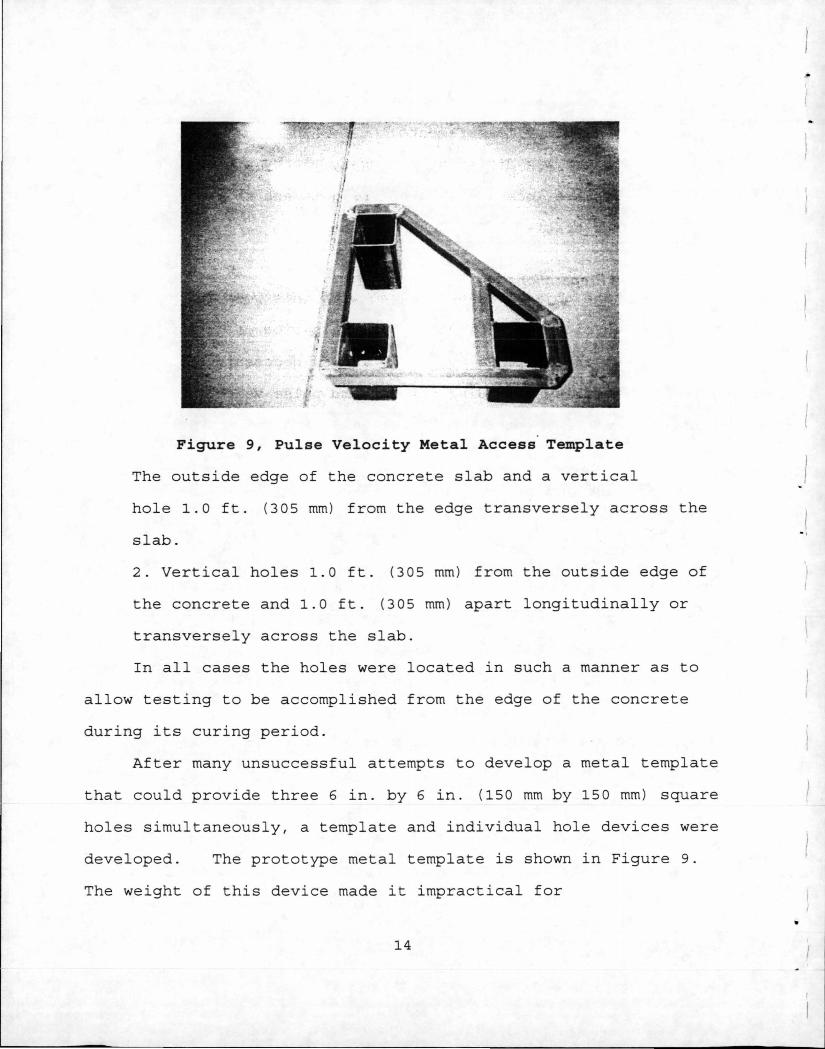
Figure 9, Pulse Velocity Metal Access' Template
The outside edge of the concrete slab and a vertical
hole 1.0 ft. (305 mm) from the edge transversely across the I
slab. . ,
2. Vertical holes 1.0 ft. (305 mm) from the outside edge of
the concrete and 1.0 ft. (305 mm) apart longitudinally or
transversely across the slab.
In all cases the holes were located in such a manner as to
allow testing to be accomplished from the edge of the concrete
during its curing period.
After many unsuccessful attempts to develop a metal template
that could provide three 6 in. by 6 in. (150 mm by 150 mm) square
holes simultaneously, a template and individual hole devices were
developed . The prototype metal template is shown in Figure 9.
The weight of this device made it impractical for
•
14
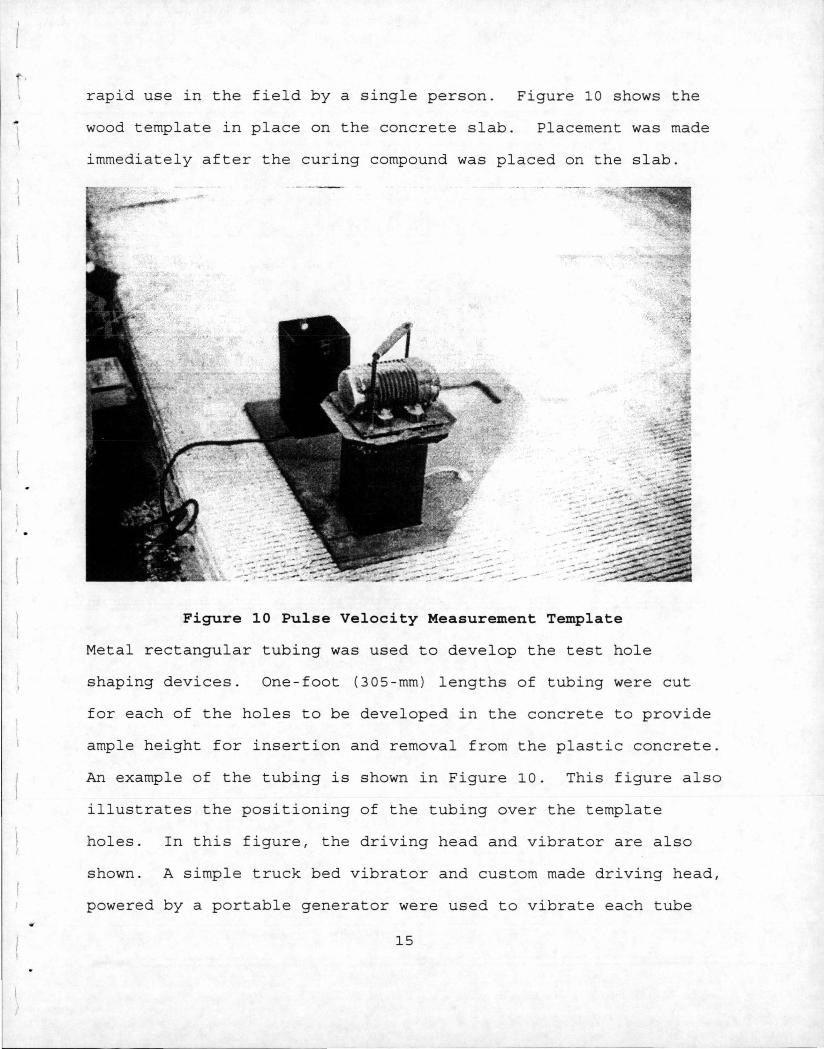
rapid use in the field by a single person. Figure 10 shows the
wood template in place on the concrete slab. Placement was made
immediately after the curing compound was placed on the slab.
Figure 10 Pulse Velocity Measurement Template
Metal rectangular tubing was used to develop the test hole
shaping devices. One-foot (305-mm) lengths of tubing were cut
for each of the holes to be developed in the concrete to provide
ample height for insertion and removal from the plastic concrete.
An example of the tubing is shown in Figure 10. This figure also
illustrates the positioning of the tubing over the template
holes. In this figure, the driving head and vibrator are also
shown. A simple truck bed vibrator and custom made driving head,
powered by a portable generator were used to vibrate each tube
15

section into the plastic concrete. Concrete form oil was placed
on each side of the insert to release it from the fresh concrete.
The wood template was first positioned on the slab and then the
three tubes were positioned on the template. Figure 11
illustrates the template and tubes ready for insertion in the
I
I ..
Figure 11, Pulse Velocity Access Insertion Layout
concrete. Next the driving head was positioned over each tube and
the vibrator operated until the tube reached the bottom of the
slab. Depth was measured on the side of the tube and by feel of
the vibrator. In this case the use of the contractor's portable
paving bridge aided access to a location directly over the access
holes for driving the tubing and removing it. It also served as
a way to insert the maturity thermocouple wires near the center
of the pavement cross section. The metal inserts allowed for the
16
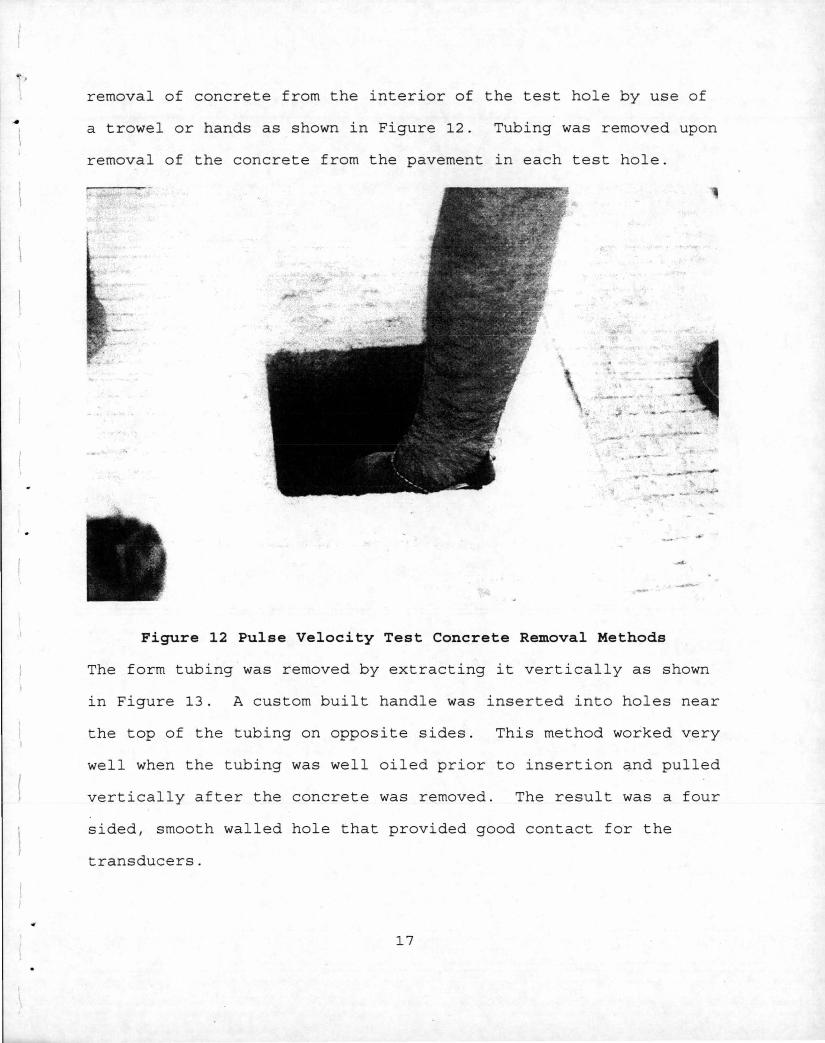
removal of concrete from the interior of the test hole by use of
a trowel or hands as shown in Figure 12. Tubing was removed upon
removal of the concrete from the pavement in each test hole.
- - ·~·,......;.
...
Figure 12 Pulse Velocity Test Concrete Removal Methods
The form tubing was removed by extracting it vertically as shown
in Figure 13. A custom built handle was inserted into holes near
the top of the tubing on opposite sides. This method worked very
well when the tubing was well oiled prior to insertion and pulled
vertically after the concrete was removed. The result was a four
sided, smooth walled hole that provided good contact for the
transducers.
17

Figure 13 Pulse Velocity Test Tube Extraction
Pulse velocity measurements were taken by attaching the two
geophones to the readout device, greasing the geophone heads and
positioning them in two adjacent holes with the heads pointing at
each other. The grease served to make an airtight contact with
sidewall of the hole and prevent adhesion of the concrete with
the device. This test is illustrated in Figure 14. Note the
presence of insulation blocks on the pavement. These were
inserted in the access holes during the time between pulse
readings to assure the retention of temperature and moisture in
the walls of the access holes. Upon completion of the pulse
18
I

• \
Figure 14, Pulse Velocity Measurement Activity
velocity measurements, the access holes were filled with concrete
from the paving operation by members of the research team.
One of the major problems with the pulse velocity measurement
process was the access to the pavement area. Figure 15
illustrates the amount of equipment required to develop the
access holes for the test. In addition to this equipment the
pulse velocity meter had to be moved between test locations.
There was insufficient room on the road shoulders to move the
equipment by vehicle and -the actual movement resulted from human
packing or attaching the generator to the contractor work bridge.
This option required work by two or more persons to transport
• 19

~
I '
• Figure 15, Pulse Velocity Access Preparation Equipment
the equipment along the roadway. As a result of these
constraints and the inconsistent results, the method was
terminated early in the construction.
Preparations for the development of the maturity
relationships included laboratory testing of the field mixed
materials. Previous research had developed laboratory maturity
relationships (temperature/strength vs. time from placement )
prior to construction. This project concentrated on transferring
that activity to the field and the first day of paving.
Laboratory tests were conducted utilizing both the maturity
and pulse velocity equipment. Both flexural test beams and
20
•

compressive cylinders were cast to measure strength gain. A
maturity meter served as the base measurement device for time and
was connected to a compressive cylinder and flexural test beam
with a "T" thermocouple. Additional beams and cylinders, cast
from the same mix batch, were tested for strength at
predetermined times. The pulse velocity was measured transversely
across each specimen prior to destructive testing, and recorded
with the measured maturity at each test. This activity resulted
in a maturity curve relating concrete strength to curing time
required to meet the 350 psi (2.41 MPa) and 500 psi (3.45 MPa)
Iowa DOT flexural strength targets for this project.
Similar preparations were made at the field concrete plant
site. At this location, a test pit was built to house the
flexural beams in wet sand. Beams and cylinders were cast from a
randomly selected load of concrete. The load was selected from
the trucks after the paver achieved a steady rate of movement
from the header for the day. This represented the consistent
flow of concrete from the plant and an acceptable sample of what
was being delivered to the grade. The cylinders were transported
to the Southeast Iowa Transportation Center for curing and
testing at predetermined times due to the availability of testing
equipment and pulse velocity meter. One of the flexural beams in
the sand pit was connected to the maturity meter by the
I thermocouple wire. Flexural testing was accomplished at the
l field laboratory of the Iowa DOT. This provided strength/time
relationships that could be compared to laboratory results and
21
I !

~
\ considered for future project control methods. I
Other preparations for field installation of maturity
measuring devices included the development of thermocouple leads
and meter connections. Each of the meters is equipped with one
or more pairs of receptacles for a two pole plug. The plug is
attached to the thermocouple on one end and the wires on the
opposite end are stripped for approximately 1 in. (25 mm). The
stripped end is braided for insertion in the concrete. The probe
end of the wires was taped along a 7 in. (180 mm) wood dowel rod
at locations near the bottom end, the middle and 1 in. (25 mm)
from the top end. Care was taken to not place tape on the
braided portion of the sensor.
The research team established sensor locations along the rod
to allow testing at 500 to 1,000 ft. (152.4 to 305.0 m) I
J intervals. Temperature data was required at each location to
establish a temperature gradient throughout the depth of the
concrete. The top sensor can also be used to control the time of
joint sawing or preparation. The attachment of the connectors to
the wire requires time and effort due to the small size of the
wire and connector screws. Lead wire lengths were established
based on the lateral location in th~ slab where they were to be
placed:· This included locations at 1 ft. (305 mm) and 11 ft.
(3.4 m) fr6m the edge of the pavement.
Maturity meters were preset to time zero and a datum
temperature of -10 Celsius. Laboratory relationships between
concrete flexural strength and con~truction curing time were made
22
available to the field data collection team. This provided a way
to determine when the concrete had reached sufficient strength to
allow opening to local cars and to construction traffic for the
next phase of the project.
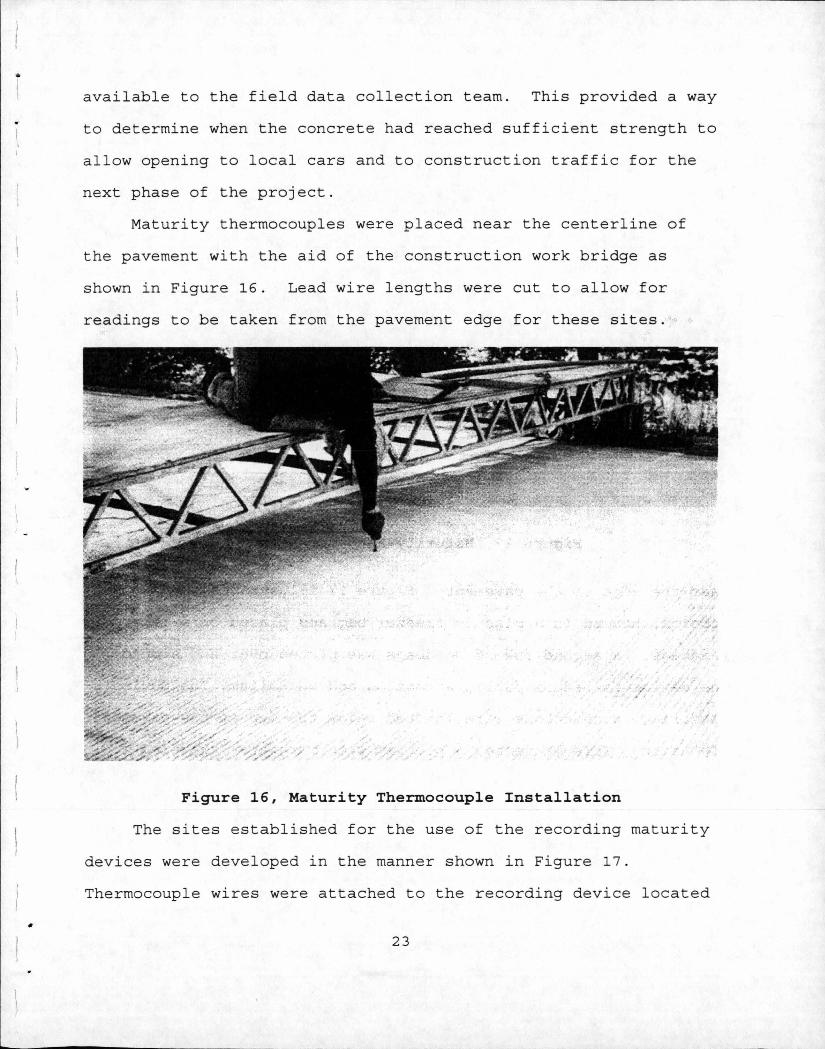
Maturity thermocouples were placed near the centerline of
the pavement with the aid of the construction work bridge as
shown in Figure 16. Lead wire lengths were cut to allow for
readings to be taken from the pavement edge for these sites.
Figure 16, Maturity Thermocouple Installation
The sites established for the use of the recording maturity
devices were developed in the manner shown in Figure 17.
Thermocouple wires were attached to the recording device located
23
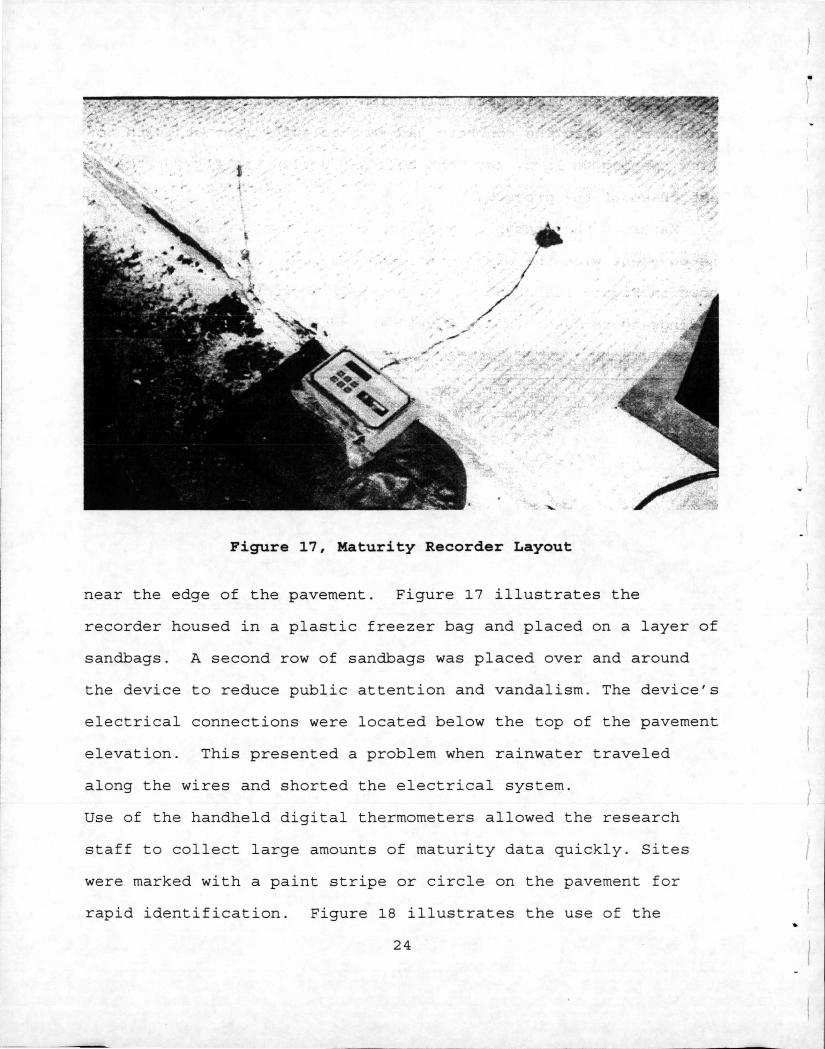
Figure 17, Maturity Recorder Layout
near the edge of the pavement. Figure 17 illustrates the
recorder housed in a plastic freezer bag and placed on a layer of
sandbags. A second row of sandbags was placed over and around
the device to reduce public attention and vandalism. The device's
electrical connections were located below the top of the pavement
elevation. This presented a problem when rainwater traveled
along the wires and shorted the electrical system.
Use of the handheld digital thermometers allowed the research
staff to collect large amounts of maturity data quickly. Sites
were marked with a paint stripe or circle on the pavement for
rapid identification. Figure 18 illustrates the use of the
24
...
i I
I
{
I

r .
• I : ( .-
.• "
Figure 18 Manual Maturity Measurement
thermometer to collect data at one of these sites.
A full test site setup including the pulse velocity access
points, and the maturity probes with one in a test beam at the
site are shown in Figure 19. This provides a view of the amount
of work that was required by the research staff to accomplish
this effort.
25

Figure 19, NDT Site Layout
CONSTRUCTION SITE ADMINISTRATION
The construction project was under the supervision of the
Lee County Engineer, Dennis Osipowicz P.E. The county inspection
staff consisted of Ernie Steffensnmeier, Howard Spiez, and
various other county staff at alternate times during the
construction. Jim Cable represented ISU on the project. Field
operations for ISU were carried out by Jim Riensche with a large
amount of assistance from Jennifer Ries and Shane Tymcowicz of
the Office of Materials, Iowa DOT. Iowa DOT Central Materials
Off ice and the Southeast Iowa Transportation Center Materials
Staff provided assistance in the development of the maturity
26
"I l relationships.
I
\ Maturity data collected by the ISU staff on the project was
1·
shared with the Lee County inspectors present on the site as it
was collected on the central slab.construction. Lee County
inspectors made the decisions on when to open a day's i - l construction to traffic and conducted all the direct
communications with the contractor, based on the data provided by
the ISU staff. The ISU staff trained the Lee County staff on
the use of the hand held temperature and temperature/humidity
devices for use in the project control of the concrete and earth
shoulder construction. County staff assisted ISU during this
part of the construction by gathering additional research data.
CONSTRUCTION PROBLEMS
The project was designed and contract documents were
developed to provide for construction during the warmest months
of the construction season (June through August) . In this way
the maximum benefit of the sun and long periods of warm
temperatures could be utilized in the development of rapid curing
and strength gain desired in he maturity concept for acteptance
and traffic use. Pavement construction in the southeast corner
of the state usually occurs early in the spring or late ih the
fall due to the difference in temperatures available.
In this case the contractor suggested paving in early May or
in late August and September being associated the company's other
paving work in the area. Due to scheduling conflicts at ISU and
27
- --------
the county, the later date was selected. Normal weather delays
postponed paving construction until late September. Paving of
the center portion of the pavement started on September 25 and
was completed on October 5, 1995.
No partic~lar problems were noted in the paving operation
that impacted the monitoring effort. Temperatures remained
relatively high during the daytime hours and the location of the
highway sheltered it from cool winds during the nighttime hours.
Strength gain remained steady even though not as fast as
anticipated iri the laboratory. Good contractor, county, DOT and
ISU relations made the project proceed very smoothly to
completion.
The speed of paving and the accessibility to various parts
of the project did make data collection more difficult. The lack
of access roads at the end of each mile and the narrow shoulders
did not allow for full size vehicles to traverse the project
during con6rete curing. The research team was able to minimize
the problem with the rental of a small four wheel drive vehicle
to navigate the shoulders and new pavement area prior to full
vehicle access. A John Deere "Gator", shown in Figure 20 was
found to be very helpful to the research team and county
28
. I
\
)

1
Figure 20, Data Collection Vehicle
personnel for movement of testing equipment and supplies along
the length of the project. It allowed for collection of large
amounts of maturity data in small amounts of time.
Due to the timing of the project some problems were
identified in the availability of research personnel. This
\ I.
contributed to problems in conducting the tests at the
predetermined locations. The contractor was able to make the l+
mile per day (1.6 km) paving pace. Due to the lack of available
shoulder space and limited personnel, the movement of the
generator and pulse velocity equipment was very difficult. This
pointed out the importance of the maturity concept and the ease
29

at which the thermocouples can be inserted into the concrete and r the data collected over any time interval with a simple
thermometer and notebook in the hands of an inspector. As the
construction area increased over several days, the gator allowed
the research team to monitor many locations in a matter of an
hour.
RESEARCH RESULTS
Maturity,aqd Pulse Velocity Relationships As previously noted, samples of the materials to be used in
the concrete mix were brought to Ames and used to develop a
laboratory relationships between the elapsed time from placement
vs. concrete temperature and concrete strength (flexural or
compressive) and pulse velocity. Time, temperature and the . I
J strength relationship comprise what is referred to as maturity of
the concrete in terms of time-temperature factor or equivalent
concrete age. Ten flexural test beams were constructed and nine
were broken as part of the test. Previously noted compressive
strength cylinders were not cast as part of the laboratory work.
The resulting relationship between modulus of rupture and curing
time under center point loading is shown in Figure 21. This
graph indicates the design strength of 350 psi (2.41 MPa) could
be reached at approximately 80 hours under laboratory conditions.
The area under the time-temperature curve for 80 hours of curing
under cool laboratory temperatures represented approximately 1000
degree-hours of maturity. The maturity data collected in this
30 I
J

1
\ .
I -
4.00
3.95
3.00
ii 3.85 c.. !. i= 3.80 C} z w i= 3.75 en ..J
~ 3.70 :::> >< w ..J IL. 3.65
3.00
3.55
3.50
00 70 80
STRENGllVTENPERTURE VS MATURITY L...cb Data Endrg ALG 28195 9:32 PM
00 100 110 120 13> 140 150
11PtE (HOt.RS)
100
00
80
70
30
20
10
0
100
Figure 21 Laboratory Flexural Strength vs Maturity Relationship
test also indicated for example, if the temperature in the
concrete could be maintained at 60 degrees Fahrenheit (15.5
degrees Celsius) for approximately 17 hours, the concrete
pavement could be opened to car only traffic. Due to the fall
paving dates, temperatures were reduced at night and the total \ / amount of time necessary to meet the requirement for maturity was
extended to 20-24 hours.
31

Laboratory tests, to relate concrete time and temperature 3rd
point flexural strength and compressive strength were not
conducted as part of the reconstruction testing on this project.
As a result, the comparison of 3rd point loading and center point
loading of flexural test specimen strengths could not be made.
Concrete compressive strength test cylinders were made in
the field and tested at the Southeast Iowa Transportation Center
staff during the course of the construction. One cylinder was
connected to maturity meter for data recording. Pulse velocity
was measured on each cylinder prior to compressive testing. The
results of the maturity measurement vs compressive strength are
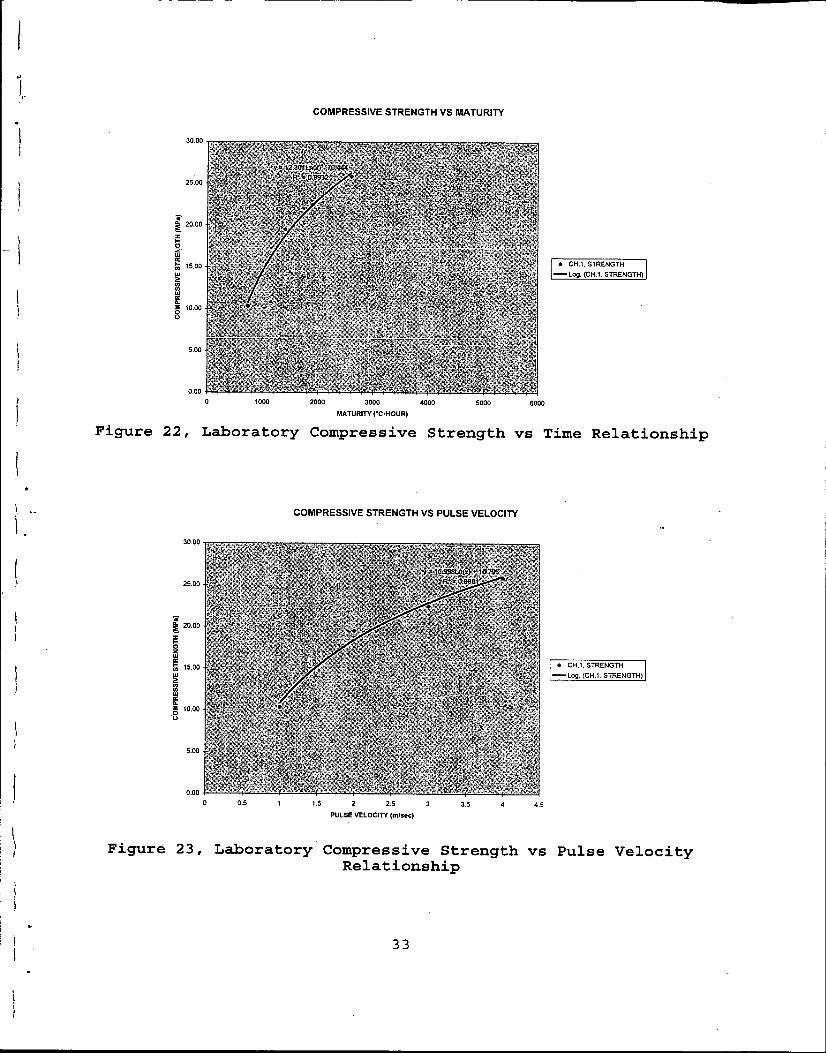
shown in Figure 22. ·Compressive strengths of 16.72 MPa and
23.99 MPa correspond with 350 and 500 psi flexural strengths that
were specified for this project. It also indicates that the
required opening strength for cars only was reached in 1000
degree-hours. Figure 23 represents the relationship between
pulse velocity measured in the lab at the time of cylinder
testing and the compressive strength of cylinders. The
relationship between pulse velocity and compressive strength was
supported as shown with a good relationship. The same data did
not provide a positive relationship to curing time. This type
of measurement appears to be very dependent on the moisture
content of the specimen and the general way the specimen is cured
and handled after construction.
32
30.00
25.00
~
~ 20.00
I= ~ w
"' t; 15.00
~ ill w
"' Q. i5 10.00 (J
5.00
0.00
1000
COMPRESSIVE STRENGTH VS MATURITY
2000 3000
MATURITY ("C•HOUR)
4000 5000 6000
• CH.1, STRENGTH
-Log. (CH.1. STRENGTH)
Figure 22, Laboratory Compressive Strength vs Time Relationship
\ COMPRESSIVE STRENGTH VS PULSE VELOCITY
I. 30.00
25.00
~ ! 20.00
I= ~ "' ~ 15.00
~ ~ "' Q. .fl 10.00
5.00
0.00
0.5 1.5 2.5
PULSE VELOCITY (m/sec)
3.5
• CH.1, STRENGTH
- Log. (CH.1, STRENGTH)
4.5
Figure 23, Laboratory Compressive Strength vs Pulse Velocity Relationship
33
Use of this measuring device requires a large amount of training
in the settings to be used in conducting measurements.
If the pulse velocity switch and gain switch is not set at
"high", the calibration and data collection for this type of
measurement are very difficult to obtain. Field experience on
this project indicates that significant differences can be
obtained in data from two different meters utilized in the same
test holes, only minutes apart.
Field Measured Concrete Strength Relationships
Maturity Results The following items of work were performed during the
pavement construction by the research team members and
representatives of the Iowa DOT and Lee County:
1. Ten flexural beams were cast from a randomly selected
truckload of concrete on day one of the concrete
placement for use in development of the maturity curve.
Since no changes in the mix design or material sources
were required during the construction, no additional
such testing of this type was required. The ten test
beams cast for this test were in addition to the normal
record requirements currently in place by the Iowa DOT
and Lee County for internal record purposes. Test beam
molds and a testing apparatus were obtained the Iowa
DOT. Due to the loss of the wire connection between the
34

I ~
\.
test beam constructed on day one and the recorder, a
second set of beams was constructed on day three of the
construction and these flexural beams were used to
identify the maturity control strengths for the
construction project. Construction and testing of the
research flexural beams were accomplished by ISU staff
using Iowa DOT testing equipment. The test beams were
stored in a wet sand bed near the project inspection
trailer and a recording maturity meter was attached to
one beam and housed in the trailer for to prevent loss
or damage. Beam breaks were made at times that
represent 8, 12, 24, and 48 hour curing periods under
field curing conditions.
A laboratory test was conducted with the project
materials at the Iowa DOT Central Laboratory, prior to
the construction. The test conducted in August of 1995
indicated that 350 psi (2.41 MPa) could be attained
with a combination time-temperature value (TTF factor)
of 700 degree C-hours.
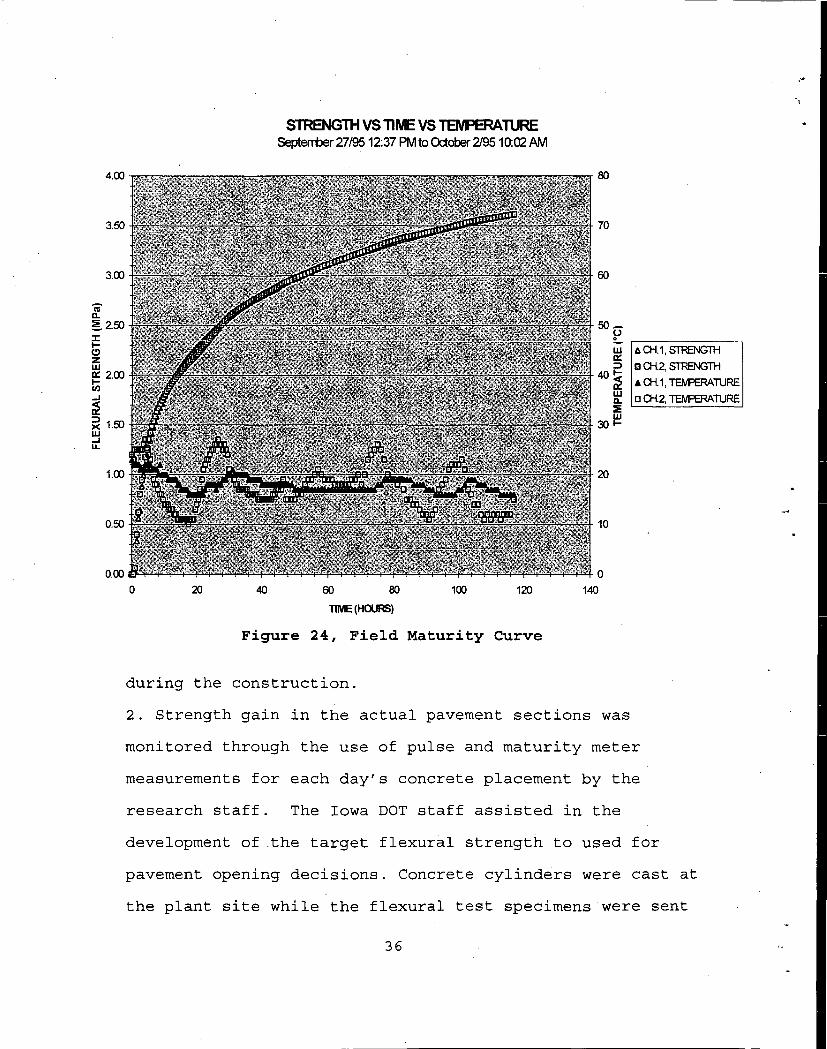
The results of the project control test are shown in
Figure 24. The graph indicates that the desired minimum
strength of 350 psi flexural (2.41 MPa) strength was reached
in approximately 24-26 hours under the field conditions.
The project staff was able to use this relationship
throughout the project for mainline and shoulder opening
decisions because no changes in materials were introduced
35
-----------------------------------------
4.00
3.50
3.00
Ii a.. ~2.50
·~ (!) z w ~ 2.00 (/)
...I
~ ~ 1.50 w ...I LL
1.00
0.50
0 20 40
S1RENG1H VS TINE VS TENPERATURE Septerrber27/9512:37 PMto0ctober2/9510:02AM
60 80 100 120
TIME (HOURS)
Figure 24, Field Maturity Curve
during the construction.
80
70
60
50-u ~ w a: :::>
40~ w a.. :iii: w
30 I-
20
10
0
140
2. Strength gain in the actual pavement sections was
t. CH.1, STRENGTH
m CH.2, STRENGTH
• CH.1, TEMPERAIURE o CH.2, TEMPERA"TURE
monitored through the use of pulse and maturity meter
measurements for each day's concrete placement by the
research staff. The Iowa DOT staff assisted in the
development of the target flexural strength to used for
pavement opening decisions. Concrete cylinders were cast at
the plant site while the flexural test specimens were sent
36
,.

to the Southeastern Iowa Transportation Center to determine
the relationship between the pulse velocity or maturity
values and compressive strength. The results of the plant
site flexural strength/maturity relationship was used as a
guide for evaluation of on site maturity measurements for a
given section at any given time to advise the construction
inspection staff of the estimated pavement strength.
Pavement traffic opening decisions based on this information
from the research staff were made by the Lee County
construction staff.
Temperature measurements used to calculate maturity for·
opening were obtained from a location near the edge of slab and
at the following slab depths with a maturity meter:
I
\ ... a. Top one inch (25 mm) of the pavement
b. Middepth, 3.5 inches (90 mm) of the pavement
c. Six inches (150 mm) below the top of slab
d. Surface of subgrade, 7 inches (175 mm) below the surface
of slab
This type of installation was made at the beginning and end of
the days' placement of concrete. Similar measurements were taken
with a separate maturity meter:
a. One.inch (25 mm) below the surface at midpanel location
and near centerline joint
b. Middepth 3.5 in. (90 mm) below the slab surface at
midpanel location and near centerline joint.
This effort was aimed at determining a single location that
37

would best represent the rate of slab strength gain and relate
that to locations near the edge of the pavement that are easily
monitored by field staff. The different depth points were used
to gather data relative to the temperature gradients throughout
the depth of the concrete during the development of strength
gain. The results were aimed at both establishing a time window
for sawing and a knowledge of the differences in strength of the
concrete at various depths as it relates to the opening of the
surface to traffic.
Hand held temperature measuring devices were used at regular
intervals of 500 ft. (152.4 m) locations at the edge of the
pavement and at the 1 in. (25 mm) and 3.5 in. (90 mm) depths in
the slab. Research team staff monitored these multiple times
daily as time permitted to establish the rate of strength gain of
various sections of the pavement. The results of that data were
used to develop a project wide relationship of maturity and
estimated flexural strength. The paving of the mainline was
completed in less than two weeks and the shoulder paving was
completed in two weeks. The maturity data is available in
tabular or graphical form for each of the self recording and'
handheld recording stations utilized on the project. The data
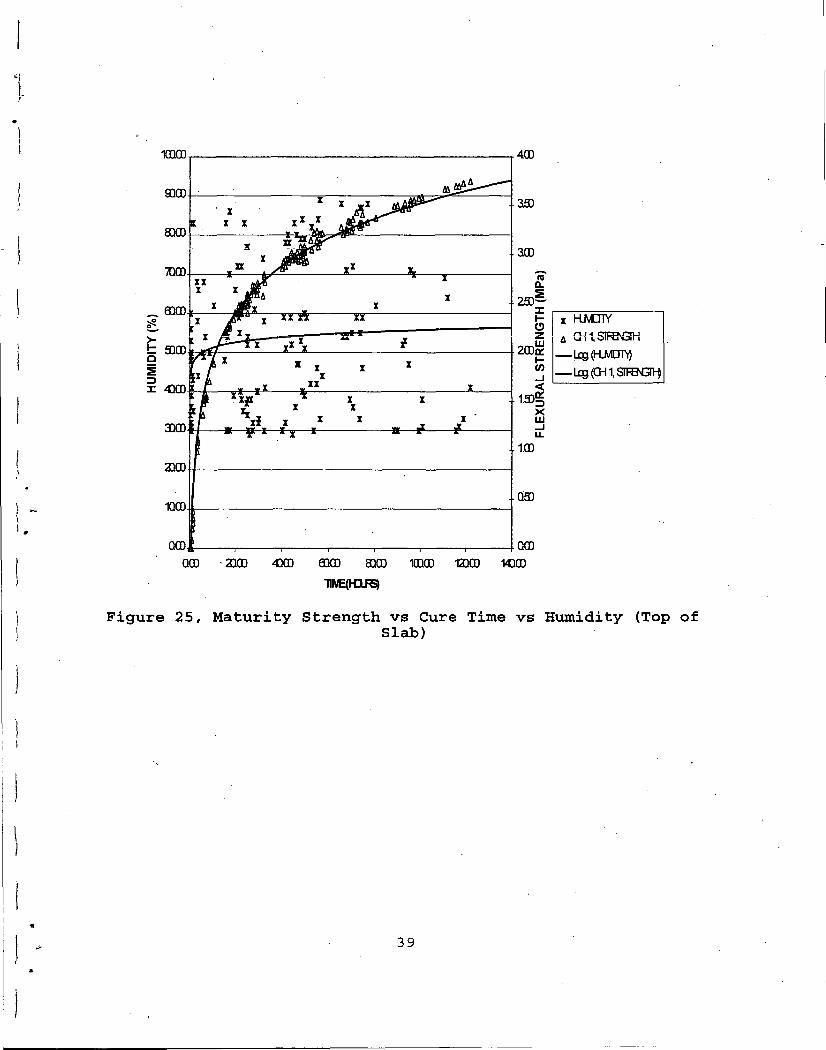
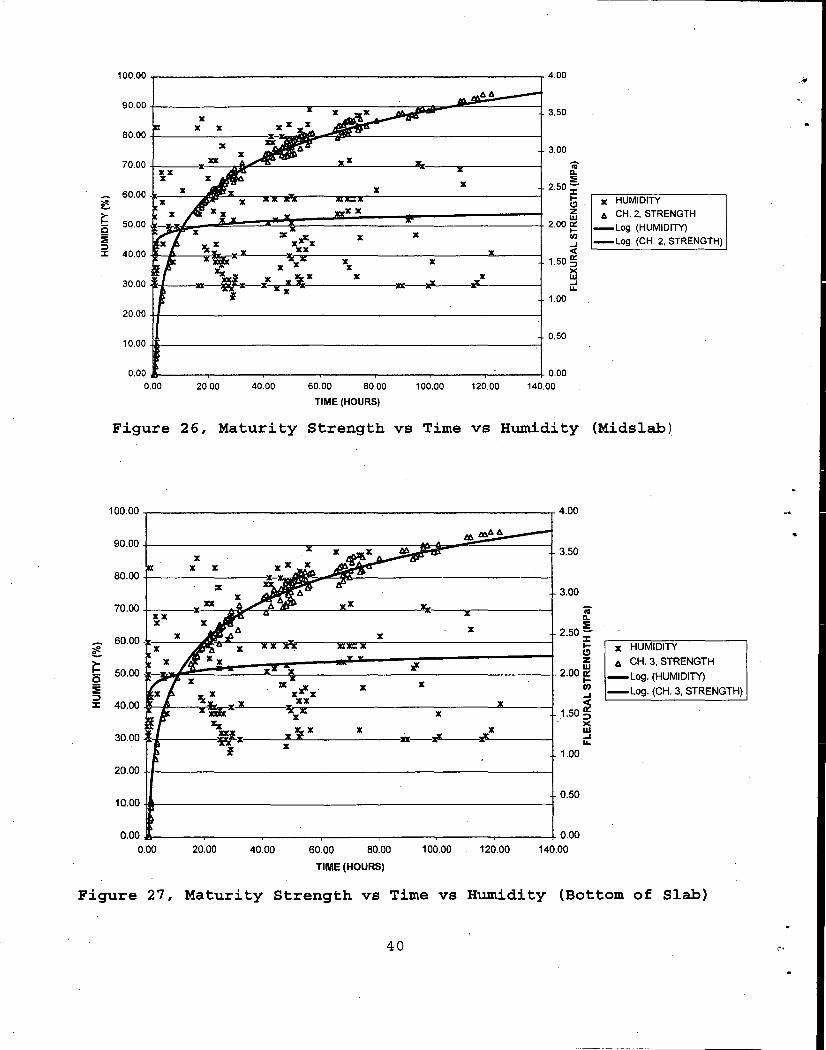
from each of the maturity test sites was combined to develop a
mathematical relationship between the flexural strength, time of
curing and the relative humidity. The results of those
measurements are illustrated in Figures 25 through 27 for the
mainline paving and 28 through 29 for the shoulder paving.
38
-,
l •
l
l -I•
«
1mm 4CD
rom x 35)
x x fflCD
:! 3CD
iOO) JX Ci a.
_rum .. 2.!D~ ~
:I:
~ ~Ix HMrnY I >-!:: fflCD r ffi 6 CH 1, SIRN3lH
c 2CD~ _Leg (1-l.MITT'r1 I.
:iE x x :::>
en
:I: 4)Q)
..J - Leg (G-11, SIR:N3l1i <(
1.!D~ ><
3)(l)l I .... .. • Ill' :I :I u :I .. J. I w
• ..J u..
1.CD
aim++-'-~~~~~~~~~~~~~~~~--<
10CD O!D
am am am · aim 4lCD fflffi !DCD men mm 14:lCD
llM:(l-ORS)
Figure 25, Maturity Strength vs Cure Time vs Humidity (Top of Slab)
39
:oe e.... ~ i5 :ii ::> ::c
100.00 ..-------------------------------.. 4.00
JC JC JC
80.00 +---------: 3.00
70.00 -r-JC_JC __ ----:ll""Dtr'--=-----------"llt---..--------j JC
1.00
20.00 +t-------------------------------t 0.50
10.00 -16-------------------------------t
0.00 6--------..---------..-------------1- 0.00 0.00 20.00 40.00 60.00 80.00 100.00 120.00 140.00
TIME (HOURS)
JC HUMIDITY 6 CH. 2, STRENGTH
-Log. (HUMIDITY) -Log. (CH. 2, STRENGTH)
Figure 26, Maturity Strength vs Time vs Humidity (Midslab)
100.00 4.00
90.00 3.50
JC JC JI:
80.00 x 3.00
70.00 iG JC llC a. JI:
250~ 60.00. JI: . ::c
I- JI: HUMIDITY C>
r z 6 CH. 3, STRENGTH 50.00 2.00 ~
JI: I- -Log. (HUMIDITY) !/)
-Log. (CH. 3, STRENGTH) ..J 40.00 ~
lC lC 1.50 ::> )(
JJ: ~lC lC w 30.00 D:--P ..J
lC LI.
1.00
20.00
0.50 10.00 -i...------------------------------!
0.00 6----.,-----..-----..-----,------,,..------,----+ 0.00 0.00 20.00 40.00 60.00 80.00 100.00 120.00 140.00
TIME (HOURS)
Figure 27, Maturity Strength vs Time vs Humidity (Bottom of Slab)
40

•
~ 0
~ i5 :E ::::> ::c
•
•
120.00 ..---------------------------------r 4.00
Dit-~;:::::==r 3.50
3.00
40.00
:c llC :c 1.00
20.00 +-11~-----------------------------1 '·" 0.00 ----.-----,.-----.------T-----,---.----...-----------+- 0.00
0.00 10.00 20.00 30.00 40.00 50.00 60.00 70.00 80.00 90.00 100.00
TIME (HOURS)
x HUMIDITY
"' CH. 1 STRENGTH -Log. (HUMIDITY)
--Log. (CH. 1 STRENGTH)
Figure 28, Maturity Strength vs Time vs Humidity (Top of Shoulder)
120.00 4.00
"' 3.50 100.00
"' llC :m: llC llC 3.00
llC \.x:cx :c
ii 80.00 :c a. :c :c 2.50~
::c I- HUMIDITY (!) llC z CH. 2, STRENGTH w "' 60.00 2.00 !!: -Log. (HUMIDITY) fl)
..J -Log. (CH. 2, STRENGTH) x:cx:c ia::ri: x llCllC-=c ~ :c B IMI l!Jc~:c '9i fall 1.50 ::::>
r..~:s: :c >< 40.00 x-:aca::c :c :c llC w
..J :c :aca::c IL
:c :c :c 1.00
20.00 +-1r------------------------------l 0.50
0.00 0.00 G,00 ~ ~ 3().,00 4G,OO W,00 00.00 ~ ~ W.,00 400,00
TIME (HOURS)
Figure 29, Maturity Strength vs Time vs Humidity (Middepth)
41

The relationship (curve shape) between the time of curing
and the concrete strengths for both the mainline and shoulders is
as would be expected for most concrete mixes tested thus far for
the Iowa DOT. The points shown on the graphs for each represent
the data from all the sites measured by the handheld recording
devices. Differences in the curve shape would be expected if
changes in the mix materials were made during the project to
produce an earlier or later setting mix. If the graphs
representing the top, middepth and bottom of the mainline slab,
or top and middepth of the shoulders, are superimposed, the
impact of the temperature gradient from top to bottom of slab can
be identified. In this project the temperature differences
between top and bottom did not have a large impact on the final
curve. They could have impacted the time of sawing vs time of
opening if the contractor has chosen to use the early sof tcut
method of joint development.
The statistical equation for each of these lines is
available, but only applicable to these project mix and site
conditions. The R-squared values for each of the mainline and
shoulder equations exceeded 0.98 when the data was fit with a
natural log function equation. Data points that exhibited zeros
or incomplete data in terms of temperature and humidity were not
included in the analysis.
Relative humidity was also correlated to the strength and
cure time relationship in the same manner for both the mainline
and shoulder data. A natural log function equation was developed
42

for the top, middepth and bottom of the mainline and top and
• middepth of the shoulder pavement. The R-squared values of 0.03
for the mainline and 0.04 for the shoulders indicated that the
relationship was almost nonexistent. The graphs indicated the
large amount of scatter and the difficulty encountered in
attempting to find a relationship. This type of data may be very
helpful in understanding the reasons for premature or shrinkage
cracking in some pavements, but does not apply well to maturity
measurements.
Individual graphs of the relationships are available upon
request and are stored with the project files.
Pulse Velocity Results This project was designed to identify the difference in the
J _- pulse velocities measured transversely between the edge of the I.
r-
slab and a point 1 ft. (305 mm) across the slab; between 1 ft.
(305 mm) and 2 ft. (610 mm) from the edge of slab; and
longitudinally in holes 1 ft. (305 mm) from the edge of the slab
and 1 ft. (305 mm) apart. The Pulse velocity measurements were
designed to be obtained near the maturity measuring device
locations at the edge of the pavement. Pulse velocity was to be
measured in a longitudinal direction at locations near the
beginning (near the first maturity location) of the day's
placement and at locations of approximately 500-ft. (152.4 m)
intervals during the day's placement (excluding the end of day
maturity location) . The first location each day was designed to
include a third well placed at right angles to one of those in
43
the longitudinal direction. Measurements were made in both
transverse and longitudinal directions at this site to determine
the effect of testing location relative to the edge of slab.
Several problems were encountered in the use of the pulse
velocity equipment. They can be summarized as follows:
1. The equipment developed to install the metal tubing for
shaping the test wells in the plastic concrete required
the use of electrical power. The work had to be
accomplished after the pavement texturing and curing was
completed behind the paver. This meant that a portable
generator had to be moved by hand between sites or
carried on some type of contractor wheel mounted bridge.
The lack of shoulder space prevented the use of vehicles
for rapid movement of this test equipment. A contractor
work bridge was used the first day with some success.
The paving speed of over 1 mile per day (1.609 km/day)
made movement of this test equipment difficult at best.
2. The test well side wall must be smooth to provide for
complete contact with the geophone sensors. This was
accomplished with the use of the rectangular metal
tubing inserts to form the hole. Thee tubing inserts
must be well greased or oiled prior to insertion to
allow for ease of removal and retainage of the smooth
wall surface.
3. The test well holes must be protected from loss of
moisture in the sidewalls to properly represent a valid
44
•
..
test of the concrete strength. This was met to a large
degree by the insertion of styrofoam blocks in the test
wells for the periods of time between the tests.
4. Pulse velocity measurements were not consistent between
holes at a given site and between consecutive times of
measurement. We learned that they are difficult for
inspection people to understand in terms of electrical
control, calibration and achievement of a solid contact
on the test well wall. Even with the use of grease on
the surface of the geophone prior to testing, errors of
large magnitudes were easy to obtain. Changes in
temperature, moisture content ~nd contact between the
test well wall and the geophone can greatly effect the
answer in terms of estimated pavement strength.
The overall problems in manpower requirements for
development of the test wells and movement of the equipment;
coupled with the difficulties in obtaining consistent information
caused the research team to discard this test method after the
first day of mainline paving.
! Air Temperature and Humidity Relationships This portion of the research was aimed at monitoring the air
1, I temperatures and relative humidity using selected thermometers
I and insert devices to examine the relationships between these
variables and their impact on the rate of pavement strength gain.
The devices were also evaluated as to the effectiveness of their
use by field staff. This monitoring was done by ISU Staff at
.. 45
each of the pavement test locations where the hand held
temperature measuring devices were used.
It was the· intent of the research staff to record air
temperature at the initiation of joint sawing vs concrete
placement time and maturity values to determine the effect of
that timing and development of any visual distresses. On this
project the contractor chose to retain the conventional sawing
plans and saw in the evenings when the construction was not under
way. This type of operation did not provide the type of early
opening information that the research team desired and therefore
was not recorded.
Visual Distress Survey Results Visual walking distress surveys were conducted on three
separate occasions on this project. The project was first
surveyed on November 10, 1995. This consisted of a partial
survey conducted by the principal investigator walking from north
to south on the noith portion (Station 321+75 to Station 353+40)
of the project. The survey was halted due to rain and mud from
. construction equipment on the slab obscuring the surf ace
condition. The principal investigator also conducted a second
survey on April 6, 1996. This consisted of a complete survey
conducted from north to south of the project length. Greg
Mulder, Lisa McDaniel and the principal investigator conducted
the third survey on April 5, 1997.
The surveys identified three major types of cracking:
46
·J
l r
l
~ ..... . ,
1. Longitudinal cracking in the mainline panels at the
outer wheel path and midpanel location.
2. Corner cracks in mainline panels
3. Diagonal cracking in mainline panels
4. Transverse cracking in the shoulder units associated
with the joint construction.
Each of the individual distresses can be explained to some
degree due to the dates of formation, type of distress, location
and the construction practices employed on the project.
1. Transverse cracking. This distress has been noted only
in the concrete shoulder sections at the transverse
joints. In the southbound shoulder it occurs at some 45
joints in the areas of stations 92+00 to 93+00, 196+00
to 197+00, and 318+00 to 368+00. These sections were
paved on days 18, 17 and 16 consecutively of the paving
operation. They represent paving of shoulder.s in a
mainline area paved two weeks prior to the shoulder
work. Nineteen of the cracks appeared immediately after
paving and the remaining 24 were observed the following
spring. Each began at the mainline joint and traveled
transversely across the shoulder section rather than
follows the skewed joint across the shoulder.
The transverse cracks in the northbound shoulder
follow the same location pattern relative to the sawed
skewed joint. In this case some 60 shoulder slabs are
cracked in the areas of stations 49+00 to 157, 206+00 to
47
236+00, and 296+00 to 367+00. These areas were paved on
days 19 and 26, 22 and 15. Again the data indicates a
full two weeks between the mainline and shoulder paving.
The Transverse cracking in the shoulders is
attributed to three causes by the researcher:
A. The mainline transverse joints were cracked to the
point that movement took place from the paving
operation on the shoulder area near the joint
construction. Vertical movement in the mainline
caused undue stress on the shoulder due to the tied
condition.
B. Failure to saw the shoulder joint immediately
behind the paver allowed the stresses to build in
the joint area due to construction traffic during
the curing period. Cracking most likely occurred
prior to t~e sawing of the joint in the shoulder.
C. Due to the widening of the base within one year of
the pavement construction and the limited width of
embankment outside the shoulder areas, the addition
of the shoulder concrete weight causes extra stress
on the joint areas.and the ties to the mainline.
Much of the shoulder cracking could have been averted
.by formation of the transverse joint immediately behind
the paver while the concrete is still plastic.
The mainline pavement exhibited only minor amounts
of longitudinal, diagonal, and corner cracked slabs.
48
l l
l
Each of these types of distress was not noted until the
1997 survey or 1.5 years after construction. The
cbrner-ciracked slabs were isolated in two slabs located
in the southbound lane at stations 343+00 to 344+00,
and 224+00 to 225+00. In the northbound lane one· corner
crack was found between stations 243+00 and 244+00.
These cracks are tight and not showing any signs of
movement. They appear to be the result of nonuniform
settlement from the widening of the subgrade prior to
paving.
The four diagonal cracks all occurred in day seven
of the paving and are located between stations 30+00 to
31+00 and 71+00 to 72+00 in the northbound lanes. This
area is one where the action of the shoulder addition
on a relatively new and narrow fill area caused undue
stress on the mainline slab. This type of crack is
usually the result of nonuniform settlement under the
slab. This project experienced heavy rains prior to
paving and in the following spring that created large
movements of ground water around and under this
pavement. This could account for some of the isolated
pavement cracks such as this.
The longitudinal cracks are primarily located in
the outside wheelpath areas with a small amount being
near the. midpanel location. Eighteen such cracked
slabs were noted in the southbound lane between
49
stations 16+00 to 27+00, 176+00 to 177, and 222+00 to ,,,
223+00. Due to their observance at 1.5 years and the
specific isolated locations being primarily in the
outer wheelpath, they appear to be the result of shifts
in the subgrade due to the widening operation. This
conclusion is borne out to a greater degree in the
northbound lanes were some 58 cracked panels were
observed. Forty-nine of those slabs were found in the
area between stations 0+00 and 74+00. The remaining
cracked slabs were noted between stations 245+00 to
246+00 and 290+00 to 292+00.
This typ.e of cracking could be reduced where
additional right of way can be purchased. On this
project there were geographical features that
prohibited this solution short of major grading work.
The surf ace distresses noted in the mainline paving do not
appear to be the· result of any of the research into the use of
NDT measurements and r~duced strength of concrete at opening to
traffic. Those in the shoulders do indicate that the joint
construction timing must be reduced to account for movement in
the mainline slabs or consider the use of rectangular joints in
both the mainline and shoulder areas.
Deflection Survey Results Roadrater deflection testing was suggested for approximately
35 joint and 35 midslab locations in each direction by Iowa DOT
Materials staff upon completion of the paving in the project
50
I l
,_ I I
proposal. The program was designed to provide joint load
transfer data at approximately 0.2 mile (0.3 km) increments in
both directions of travel. Midslab deflection information was
also gathered in the same manner and at the same interval but
offset from the joints by 0.005 mile (0.008 km) This data was
collected on November 8, 1995, immediately after all paving was
completed.
Deflection load transfer is defined as the ratio of the
deflection of the unloaded side of the joint to the deflection on
the loaded side of the joint. Testing was accomplished by the
use of the Iowa Roadrater device. Most pavement evaluation
personnel consider load transfer values of 80% or more to be
desirable. Values between 50% and 80% indicate potential
problems that may develop at the joint in the future. In this
project three values of 72% to 78% were noted at spot locations
in the northbound lane and one 76% spot location in the
southbound lane. Each of these value falls in an acceptable
range for pavements that do not contain positive load transfer
(dowels) in the transverse joints. They also represent areas
where construction of the widening in the subgrade may represent
a difference or inconsistency in the subgrade support across the
roadway at the test locations.
The Iowa DOT staff also conducted deflection testing at
selected midslab locations in each direction. Two estimates can
be obtained from this analysis. In one case the Iowa DOT
estimates the "k" value for the subgrade support at the site.
51
The range of values found in this testing was typical for Iowa
soils in this area (145 to 225 psi in the northbound direction
and 97 to 225 psi in the southbound direction) and reflects some
of the inconsistencies in soil support that can be expected with
the mix of rock and soils found here and the widening/
reconstruction areas occurring along the roadway.
The estimated effective thickness of the pavement can be
obtained from dividing the deflection under the load by a factor
of 0.50 as identified by AASHTO as the structural coefficient of
sound concrete. It is an estimate of the load carrying capacity
of the pavement. In this case the results indicate .values in
excess of the design/construct depth of 7 inches (180 mm). This
is a satisfactory measurement for the time at which it was taken.
Construction records indicate that the actual constructed depths ••
did exceed the design depth as a result of contractor decision
and the fact that paving was placed on a granular base area. The
lack of dowels in the transverse joints may have contributed to
increased deflection values and increased structural ratings. In
any case this represents a benefit for the county in the load
carrying capacity of this pavement.
Concrete Core Laboratory Testing The proposal included obtaining pavement cores from the
completed slab by the Iowa DOT Materials staff and compression
testing by the Iowa State University staff to represent 7, 14 and
28 day compressive strengths for each days construction placement
of concrete. This portion of the research effort was deleted
52
after discussions between the two agency staffs identified no
major relationship of this work to the objectives of the project.
The Southeast Iowa Transportation Center Materials staff,
for the purpose of developing a curve to relate time,
temperature, strength, and maturity and pulse velocity did
compression testing. Those results were illustrated earlier in
this report.
Equipment Laboratory Testing It became evident during the first three days of paving that the
level of available personnel to gather the researdh data in the
field was not adequate to meet the needs of the pulse velocity
and maturity measurements. Adjustments were made as a result of
the forward paving speed to allow for use of the recording
maturity meters at the beginning and end of each day. The pulse
velocity devices were not used for the reasons stated previously.
The hand held thermometers were used to measure maturity at 5aO-
1,000 foot (152.4-304.8 m) intervals. In making these changes,
the existing project staff were able to conduct several
measurements at each location during a given day regardless of
the distance between successive paving locations on the project.
The changes also drove the need for the preparation of many
additional maturity wire leads and the addition of the metal
plugs on the wire lead end for insertion into the recording
devices. It was not possible on some days to prepare the wire
lead connections in a timely manner and thus the wires were
directly inserted (bare) into the thermometer connections. A
53
•

test was needed to measure the impact of that decision on the
accuracy of the data collected.
In December of 1995, four flexural test beams were
constructed in the Civil Engineering Structures laboratory at
ISU. Thermocouple wire leads were installed at locations 3, 6
and 9 inches (75, _150, and 225 mm) from each end of the beams.
The first thermocouple on each end was connected with.the aid of
the two prong connectors to a recording maturity meter. The same
type of connectors was placed on the second set of lead wires at
each end of the beams. The third thermocouple at each end of the
four beams was stripped of insulation for approximately 1 inch
(25 mm). The· recording devices were used to monitor the maturity
gain at each end of the beam for some 71 hours. The hand held
Thermometers were used to measure the temperature in degree
Celsius at 2-4 hour increments during the daytime hours only.
These measurements were made by both handheld devices at the
wires with connectors and those without connectors. The
measurements from each of the devices and the combinations of
connector/no connector wires were analyzed for variance. No
variance was found to be significant between the handheld
devices, the handheld and recording devices and the use or
deletion of the connectors from the thermocouple leads.
NDT Instructional Memorandum The development of an instructional memorandum (I.M.) for the
use of the maturity, pulse velocity or other identified NDT
methods to determine the rate concrete pavement strength gain was
54

i an objective of this research work. The memorandum was directed
to identify testing equipment that could be practically deployed
by highway agency personnel or contractor forces. It was to
include but not be limited to the use of pulse velocity or
maturity devices and thermometers of various types. The I.M. - I
I would describe the equipment to be used, materials required,
..
~''
•
frequency of testing, and the methods to be employed in the
laboratory or field to establish the initial relationships and
the field construction verification information.
The Iowa DOT staff saw the benefits in the methodology
during the Lee County research project data collection phase. In
consultation with the ISU research team, Iowa DOT field staff and
contractor assistance, I.M.-383 was developed and implemented on
a limited basis. Data was collected from each of the
Transportation Centers on a variety of projects and used to
revise the I.M.-383.
Based on that I.M.-383 input, the research team sought
comments from the same field staff on how the next revision of
the I.M.-383 should be developed. The following comments are the
result of that survey. They are made in response to IM-383 dated
May 2, 1997.
1. The initial maturity curve should be developed at the
project site using the same materials that are used in
the paving mix. If at any time during the project any
of the dry materials, water or additives are changed by
the contractor or contracting authority, a new or
55
validation curve should be developed from the new mix
being sent to the pavement construction site.
2. It is important to develop the maturity curve at the
·project site to most closely represent the material and
climatic conditions.at the time and place of
c6nstruction. This will provide the best relationship
for the particular site, time of year and material being
sent to the paving site.
3. Twelve flexural test beams should be made for the
development of the maturity curve. This will allow for
the development of four points with up to three beams
being tested for each point.
4. A factor of safety could be built into the maturity
curve development process with the use of concrete that
was produced with air content and slump near the upper
specification limits.
5. The research team suggests that the use of the random
truck sample for the original curve development and the
implementation of the validation curve process. The
validation test provides a check on changes or
irregularities in the construction process and provides
a better form of protection for the contractor and
contracting authority.
6. Hot cement may cause more rapid strength gain in the
field placed concrete. It is suggested that the curve
be developed from cement that is not exhibiting this
56
l
I'
I ·-..
"
,r)
·I ~~-
•
trait to represent the average cement being used. The
result of the hot cement will reduce the time required
to meet the maturity strength desired.
7. Consider the use of compressive cylinders vs flexural
test beams for the curve development. The current
philosophy of the Iowa DOT and the research team is that
the mode of pavement failure has been flexural rather
than compression failures. No change is recommended at
this time.
8. Does the wet sand cure of the flexural test beams
replicate the cure being experienced by the pavement
under the white-sprayed cure method? The data gathered
at various locations on this project indicates that the
relationship of temperatures achieved in both situations
is similar in magnitude.
9. The general portion of the I.M. indicates that the
contractor and the agency shall jointly develop a plan
for performing the maturity testing. Current general
specification changes being made in Iowa, provide for
more control of the process by the contractor and will
require changes in this language. The contractor should
be charged with developing the plan and curve. The
highway agency should only cooperate, assist, review and
approve or reject the contractor recommended plan.
57
SUMMARY AND CONCLUSIONS
This research effort was designed to provide Lee County, Iowa DOT
and other governmental units with information on
possible NDT ways to monitor the rate of concrete strength gain
for determination of traffic opehing times under field
conditions. The research resulted in the following conclusions
relative the selection of NDT equipment, methods of data
. collection and use of the data for construction project traffic
control decisions.
1. Information DataBase Development
a. The project provided a large database of maturity
data for mainline and shoulder construction
direction.
b. Data from multiple Iowa Transportation Centers and
multiple types of paving or repair supplemented the
development of the Instructional Memorandum.
c. Project data was limited by the lack of fluctuations
in temperatures during construction.
d. Project data did identify the importance of curing
methods and the rapid gain in concrete flexural
strength during the first 24-48 hours after
placement. Supplemental methods of retaining the
heat in the slab may be required during Spring and
Fall paving to achieve desired rates of strength
gain.
2. NDT Equipment selection:
58
., -· ..
,
Ii
• I
I
I· I
'
a . Pulse Velocity devices are not recommended for
measurement of pavement strength gain due to
equipment/space needs, limitations in field
measurement operation and operator training
requirements.
b. Reco~ding maturity meters should be used for
research purposes where long periods of recording
are required or where personnel are scarce. They
are susceptible to water damage and theft.
c. Handheld digital thermometers were found to be very
successful in the monitoring of many maturity sites
by one person. They can be connected adequately to
the thermocouple wires with a two-prong connector or
the insertion of the two bare, clean and dry
thermocouple wires into the gage connection point.
3. Maturity Depth and Location Measurements:
a. Location and depth of the thermocouple wire is
dependent on the use of the data. The ideal lateral
location for the wire is at least one foot (310 mm)
from the edge of the pavement.
b. Decisions regarding joint sawing timing should be
based on data from a thermocouple placed within one
inch (25 mm) of the concrete surface.
c. Measurements taken at the middepth of the concrete are
useful in the determination of the average strength of
the slab and should be used 1n the determination of
59
pavement opening times.
d. Temperature data taken at variable depths in the
pavement or subgrade are helpful in understanding the
temperature gradients through the depth of the slab.
e. Thermocouples can easily be mounted on wood dowels and
inserted to the required depth in the slab. They may
be left in th~ slab after measurements have been
completed.
f. LongituQinally, the thermocouples should be inserted
at intervals of 500 to 1,000 ft. (152.4 to 305 m's')
to account for changes in climatic conditions during
the day and to provide for accurate estimation of
joint formation timing. ')
4. Pavement Visual Distress Relationships.
a. Transverse cracking in shoulders was found where
shoulder joints were not formed in a timely manner. -
b. Minimal longitudinal and corner/diagonal cracking was
observed on the project two years after construction
in the outer wheel path locations in areas of subgrade
wid~ning. Irregularities in the subgrade due to
construction were identified as the primary cause of
the cracks.
5. Maturity Instructional Memorandum Development.
a. Instructional Memorandum #383, dated Octobe.r 28, 1997
includes many of the comments and suggestions by those
using the equipment in the field.
60
b. The recommendations regarding the use of the
• I
validation tests and the target opening strength time
temperature factors represent results noted in this
research and are recommended for future use.
Project engineers now have more flexibility in the
development of project construction specifications to meet both
public traffic demands and long term pavement performance.
r
' 61
•
REFERENCES
1. Use of Maturity and Pulse Velocity Techniques to Predict
Strength Gain of Rapid Concrete Pavement Repairs During the
Curing Period, P.A. Okamoto, D. Whiting, Construction
Technology laboratories, Inc., 1994
2. Maturity and Pulse Velocity for Early Strength Development of
Concrete Pavement, C. Ouyang, Iowa DOT, 1995.
3. Fast Track Paving: Concrete Temperature Control and Traffic
Opening Criteria for Bonded Concrete Overlays, Transtec Inc.,
FHWA DTFH61-C-0016, 1996.
4. Fast Track Concrete Pavements, Concrete Paving Technology,
ACPA, 1994.
5. Fast Track and Fast Track II, Cedar Rapids, Iowa, HR-544 and
FHWA Special Project 201, Iowa Department of Transportation,
1993.
6. Guidelines for timing Contraction Joint Sawing and Earliest
Loading for Concrete Pavements, Volume I: Final Report, FHWA-
RD-91-079, February, 1994.
7. Flexural Strength Criteria For Opening Concrete Roadways to
Traffic, L. Cole and P. Okamoto, Transportation Research
Record 1478, 1996.
8. Thermal Effects During the Curing of Concrete Pavements, D.
Kapila, J. Falkowsky, and J.L. Plawsky, ACI Materials
Journal, March-April, 1997.
62