Embed Size (px)
Citation preview
Tough choices ahead
Illustrating the choices and trade-offs in the next spending review
Kayte Lawton and Amna SilimSeptember 2012
All major political parties face tough choices on tax and spend over the next few years
• The Coalition’s 2010 spending review ends in 2014/15• The government must publish its spending plans for 2015/16
before the 2015 general election – and may set out plans for further ahead at the same time
• The state of the public finances and the UK economy, combined with the Coalition’s fiscal targets, implies some very difficult choices on tax and spend – for 2015/16 and beyond
• These are not just questions for the Coalition partners – Labour will have to deal with them too if elected to government in 2015
• This presentation sets out the scale of the challenge facing all political parties as they look ahead to the next spending review
Note: all figures in this presentation are taken from the Office for Budget Responsibility’s March 2012 Economic and Fiscal Outlook unless otherwise stated and are based on the OBR’s medium-term growth forecasts
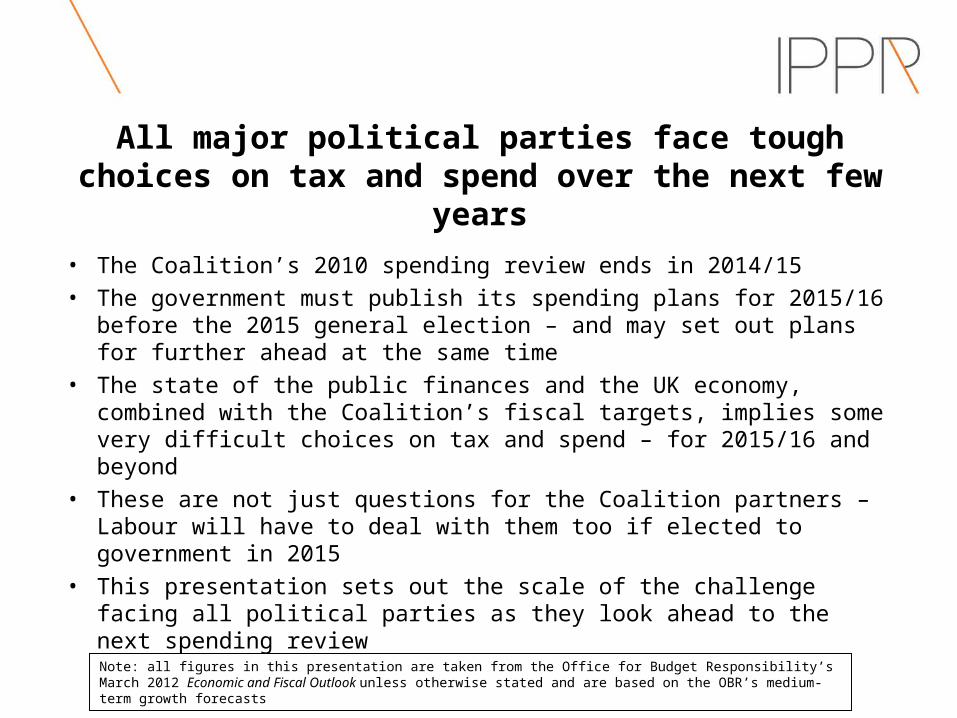
Context: the 2010 spending review, covering the years 2011/12 to 2014/15, was tough for most departments
Departmental spending is being cut by an average 2.3% in each year of the spending review
•The NHS budget is flat in real terms
•Education is being cut by less than 1% a year in real terms
•The Home Office and capital spending are experiencing particularly large cuts
The Coalition has set out broad plans for the public finances in 2015/16 and 2016/17
The Coalition has set out its plans for total public spending and revenues for the two years after the current spending review. These are intended to enable it to achieve its two fiscal targets:
1.The cyclically-adjusted current budget moves into surplus at the end of a rolling, five-year period – now set for 2016/17
2.Public sector net debt falls as a share of GDP after 2015/16
But these figures rest on the OBR’s economic and fiscal forecasts from March 2012
• The Coalition’s plans to 2016/17 rest on forecasts produced by the Office for Budget Responsibility (OBR) in March 2012
• Since then, leading economists (including the Bank of England, the IMF and the OECD) have revised down their growth forecasts for the UK over the medium term
• The fiscal challenge set out in this presentation is therefore likely to be larger than implied by the OBR’s March 2012 figures
• This has generate considerable speculation about the likelihood of the chancellor meeting both his fiscal targets
• The OBR will produce new medium-term forecasts on 5 December
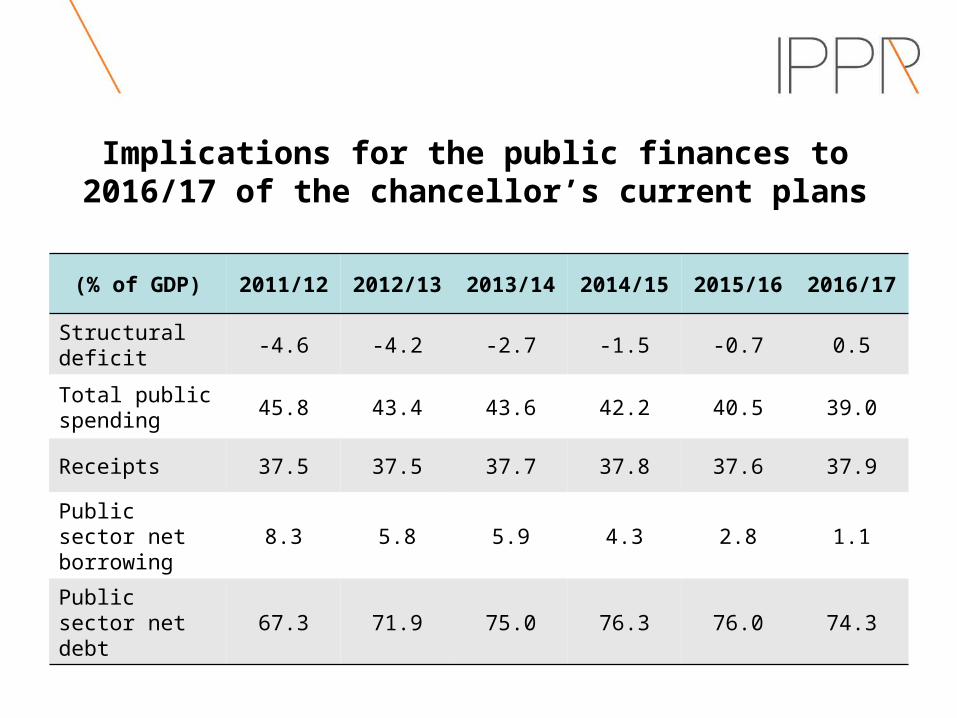
Implications for the public finances to 2016/17 of the chancellor’s current plans
(% of GDP) 2011/12 2012/13 2013/14 2014/15 2015/16 2016/17
Structural deficit -4.6 -4.2 -2.7 -1.5 -0.7 0.5
Total public spending
45.8 43.4 43.6 42.2 40.5 39.0
Receipts 37.5 37.5 37.7 37.8 37.6 37.9
Public sector net borrowing
8.3 5.8 5.9 4.3 2.8 1.1
Public sector net debt
67.3 71.9 75.0 76.3 76.0 74.3
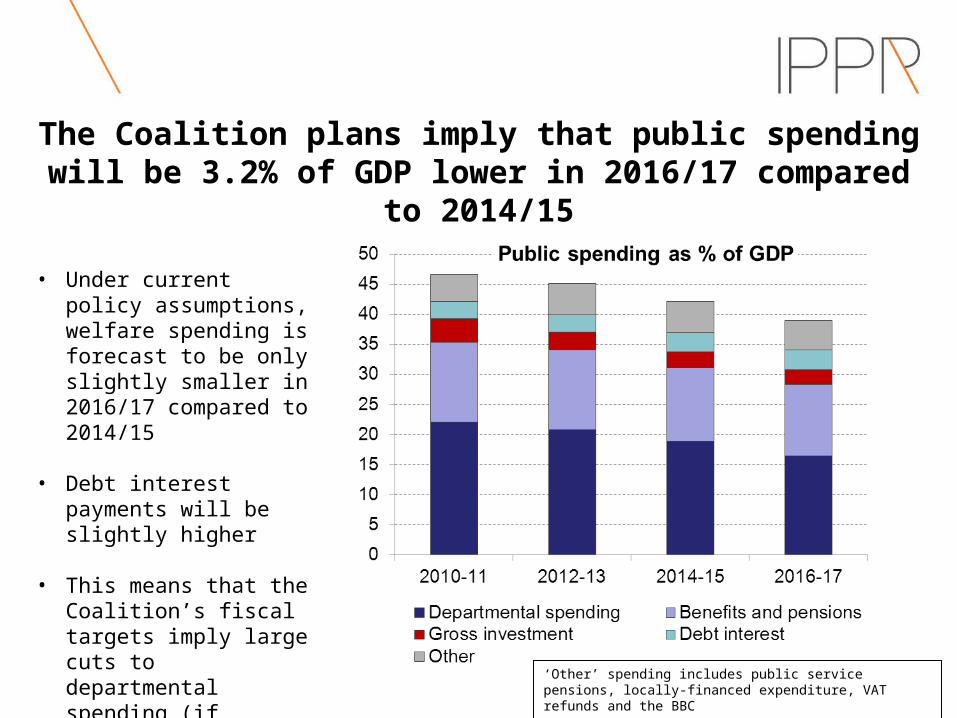
The Coalition plans imply that public spending will be 3.2% of GDP lower in 2016/17 compared to 2014/15
• Under current policy assumptions, welfare spending is forecast to be only slightly smaller in 2016/17 compared to 2014/15
• Debt interest payments will be slightly higher
• This means that the Coalition’s fiscal targets imply large cuts to departmental spending (if welfare policy remains unchanged)
‘Other’ spending includes public service pensions, locally-financed expenditure, VAT refunds and the BBC
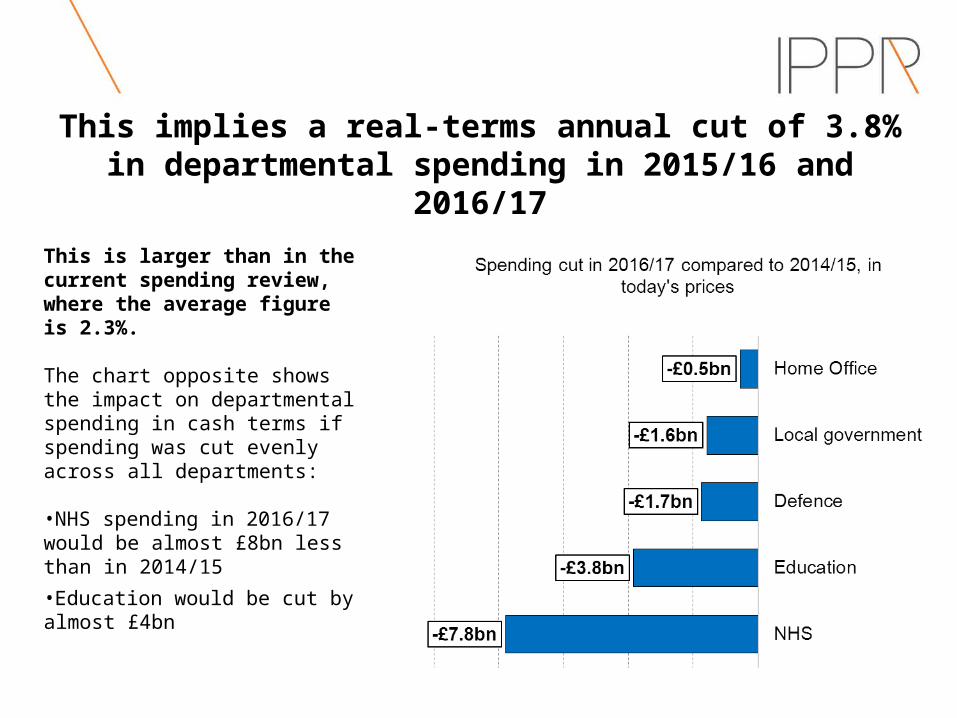
This implies a real-terms annual cut of 3.8% in departmental spending in 2015/16 and 2016/17
This is larger than in the current spending review, where the average figure is 2.3%.
The chart opposite shows the impact on departmental spending in cash terms if spending was cut evenly across all departments:
•NHS spending in 2016/17 would be almost £8bn less than in 2014/15
•Education would be cut by almost £4bn
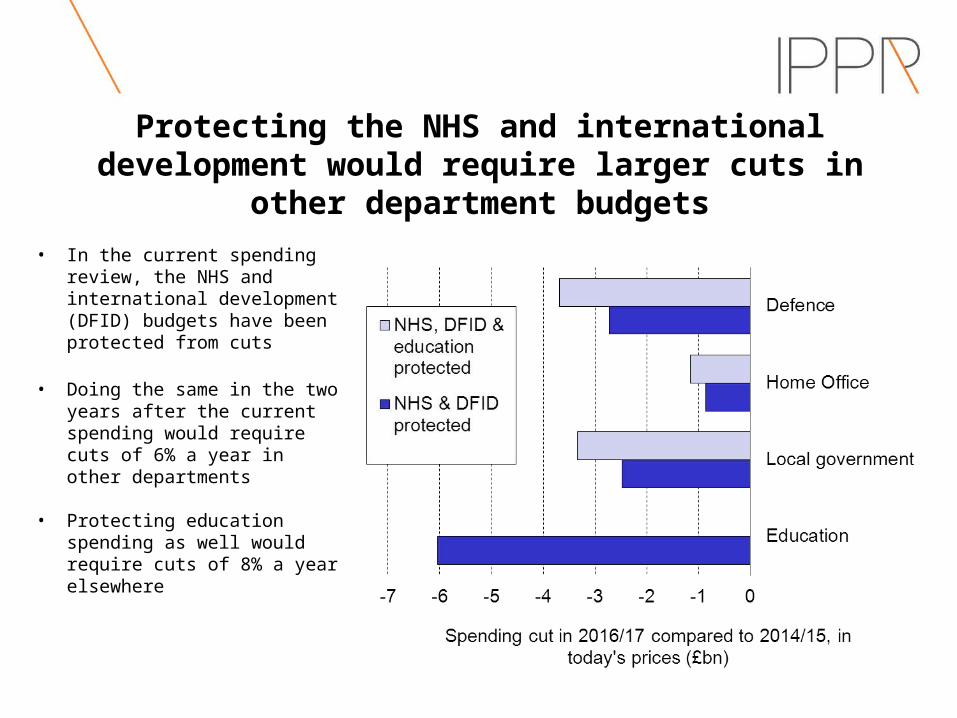
Protecting the NHS and international development would require larger cuts in other department budgets
• In the current spending review, the NHS and international development (DFID) budgets have been protected from cuts
• Doing the same in the two years after the current spending would require cuts of 6% a year in other departments
• Protecting education spending as well would require cuts of 8% a year elsewhere
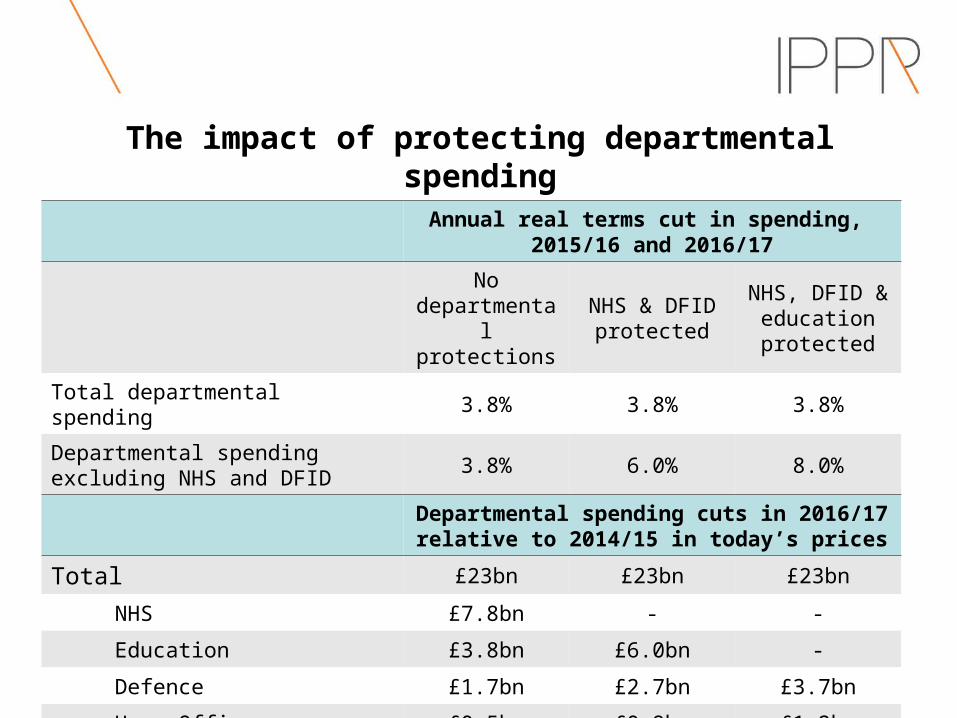
The impact of protecting departmental spending
Annual real terms cut in spending, 2015/16 and 2016/17
No departmental protections
NHS & DFID protected
NHS, DFID & education protected
Total departmental spending 3.8% 3.8% 3.8%
Departmental spending excluding NHS and DFID
3.8% 6.0% 8.0%
Departmental spending cuts in 2016/17 relative to 2014/15 in today’s prices
Total £23bn £23bn £23bn
NHS £7.8bn - -
Education £3.8bn £6.0bn -
Defence £1.7bn £2.7bn £3.7bn
Home Office £0.5bn £0.9bn £1.2bn
What could these cuts mean in practice?
• Education: £1bn in the education budget pays for the equivalent of approximately 22,000 teachers
• Home Office: £1bn in the Home Office budget is equivalent to around 20,000 police officers
• Defence: £1bn in the defence budget is equivalent to around 22,000 service personnel – or a single Type 45 destroyer
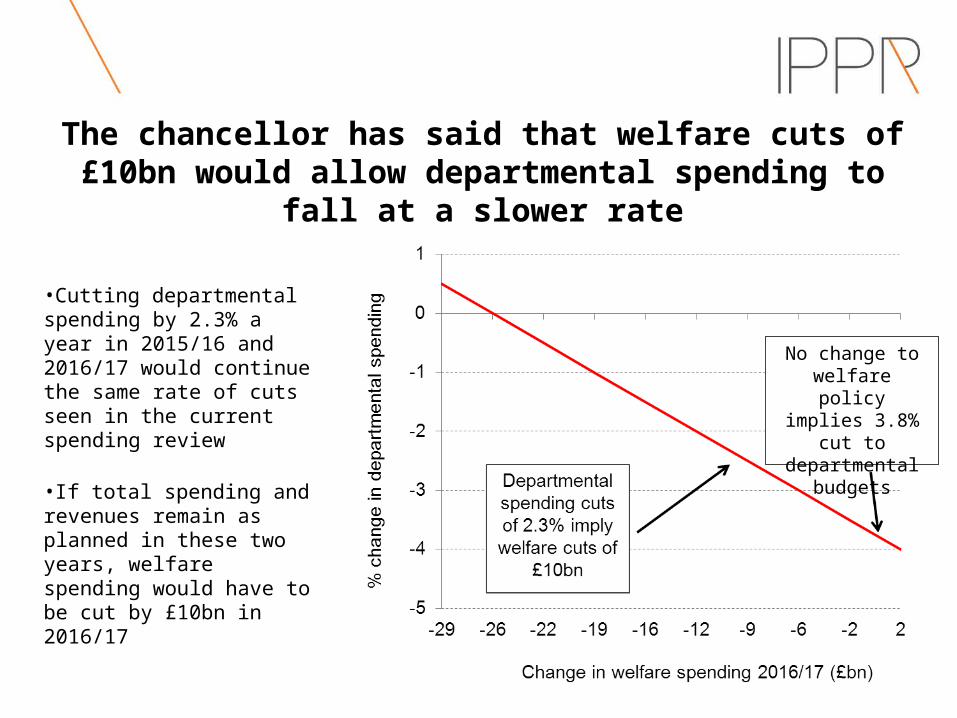
The chancellor has said that welfare cuts of £10bn would allow departmental spending to fall at a slower rate
•Cutting departmental spending by 2.3% a year in 2015/16 and 2016/17 would continue the same rate of cuts seen in the current spending review
•If total spending and revenues remain as planned in these two years, welfare spending would have to be cut by £10bn in 2016/17
No change to welfare policy
implies 3.8% cut to departmental
budgets
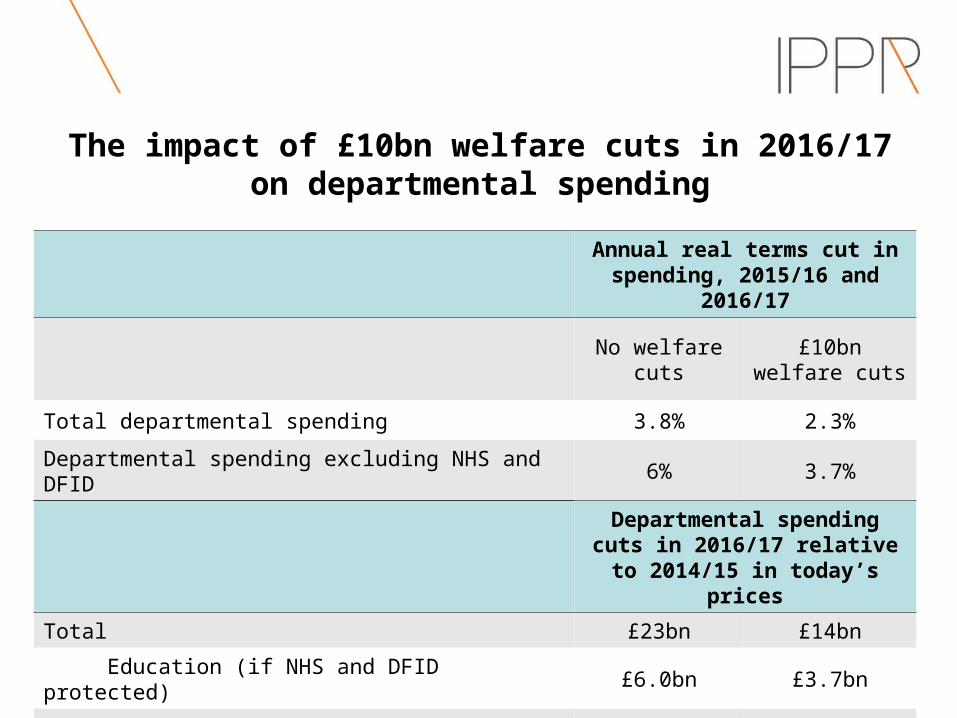
The impact of £10bn welfare cuts in 2016/17 on departmental spending
Annual real terms cut in spending, 2015/16 and 2016/17
No welfare cuts£10bn welfare
cuts
Total departmental spending 3.8% 2.3%
Departmental spending excluding NHS and DFID 6% 3.7%
Departmental spending cuts in 2016/17 relative to 2014/15 in
today’s prices
Total £23bn £14bn
Education (if NHS and DFID protected) £6.0bn £3.7bn
Defence (if NHS and DFID protected) £2.7bn £1.7bn
Home Office (if NHS and DFID protected) £0.9bn £0.5bn
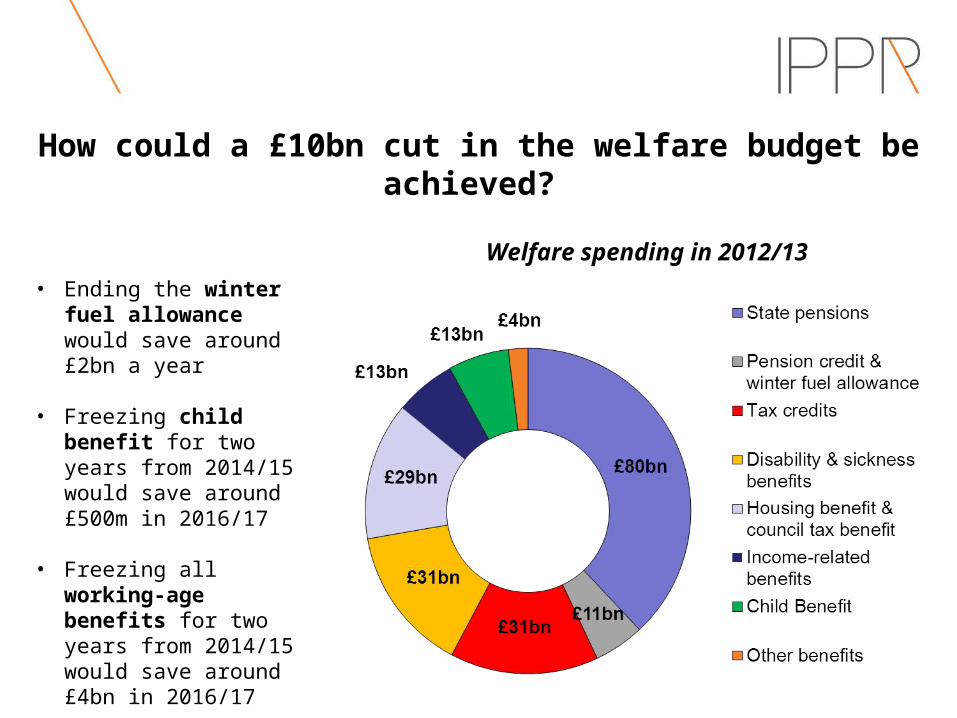
How could a £10bn cut in the welfare budget be achieved?
Welfare spending in 2012/13
• Ending the winter fuel allowance would save around £2bn a year
• Freezing child benefit for two years from 2014/15 would save around £500m in 2016/17
• Freezing all working-age benefits for two years from 2014/15 would save around £4bn in 2016/17
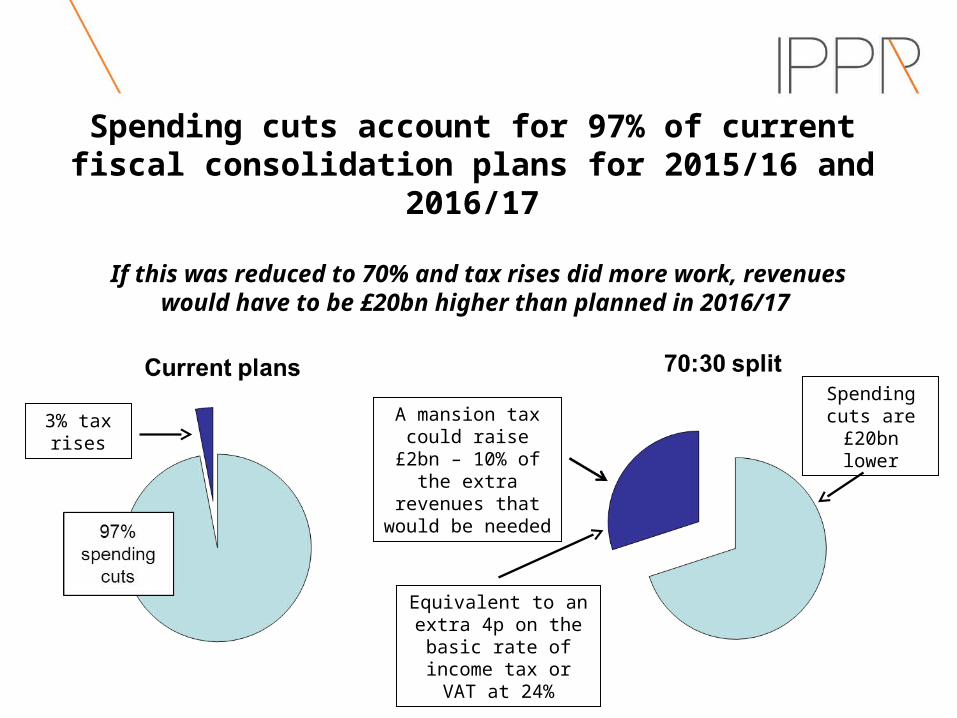
Spending cuts account for 97% of current fiscal consolidation plans for 2015/16 and 2016/17
3% tax rises
If this was reduced to 70% and tax rises did more work, revenues would have to be £20bn higher than planned in 2016/17
Equivalent to an extra 4p on the basic rate of income tax or VAT
at 24%
Spending cuts are
£20bn lower
A mansion tax could raise £2bn – 10% of the extra revenues
that would be needed
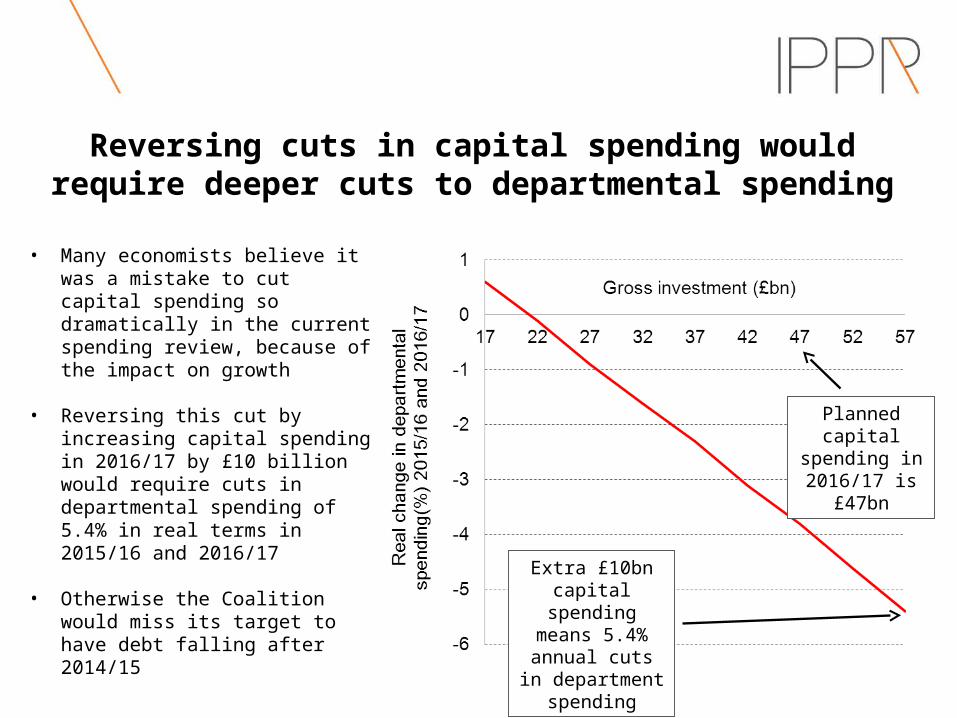
Reversing cuts in capital spending would require deeper cuts to departmental spending
• Many economists believe it was a mistake to cut capital spending so dramatically in the current spending review, because of the impact on growth
• Reversing this cut by increasing capital spending in 2016/17 by £10 billion would require cuts in departmental spending of 5.4% in real terms in 2015/16 and 2016/17
• Otherwise the Coalition would miss its target to have debt falling after 2014/15
Extra £10bn capital spending
means 5.4% annual cuts in
department spending
Planned capital
spending in 2016/17 is
£47bn
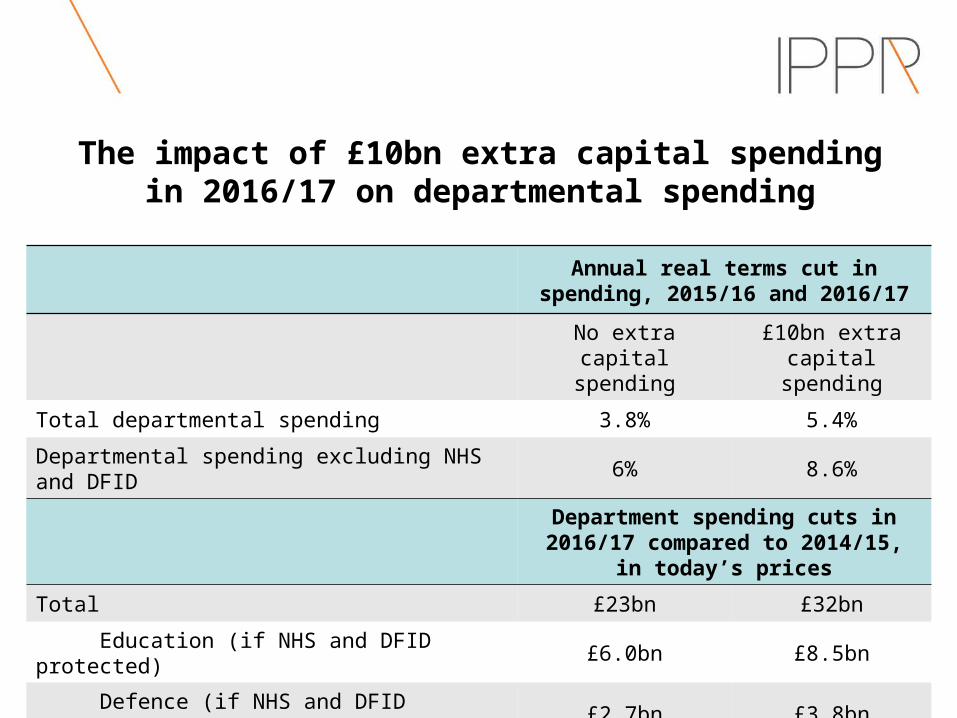
The impact of £10bn extra capital spending in 2016/17 on departmental spending
Annual real terms cut in spending, 2015/16 and 2016/17
No extra capital spending
£10bn extra capital spending
Total departmental spending 3.8% 5.4%
Departmental spending excluding NHS and DFID 6% 8.6%
Department spending cuts in 2016/17 compared to 2014/15, in today’s prices
Total £23bn £32bn
Education (if NHS and DFID protected) £6.0bn £8.5bn
Defence (if NHS and DFID protected) £2.7bn £3.8bn
Home Office (if NHS and DFID protected) £0.9bn £1.2bn
An alternative option would be to delay fiscal consolidation by two years
• Shifting the goal of achieving a surplus on the structural budget back to 2018/19 would generate an extra £20bn in 2016/17
• The government could use this £20bn to:– Increase planned investment in capital projects– Lower the planned cuts to departmental spending
without cutting welfare spending– Temporarily cut taxes
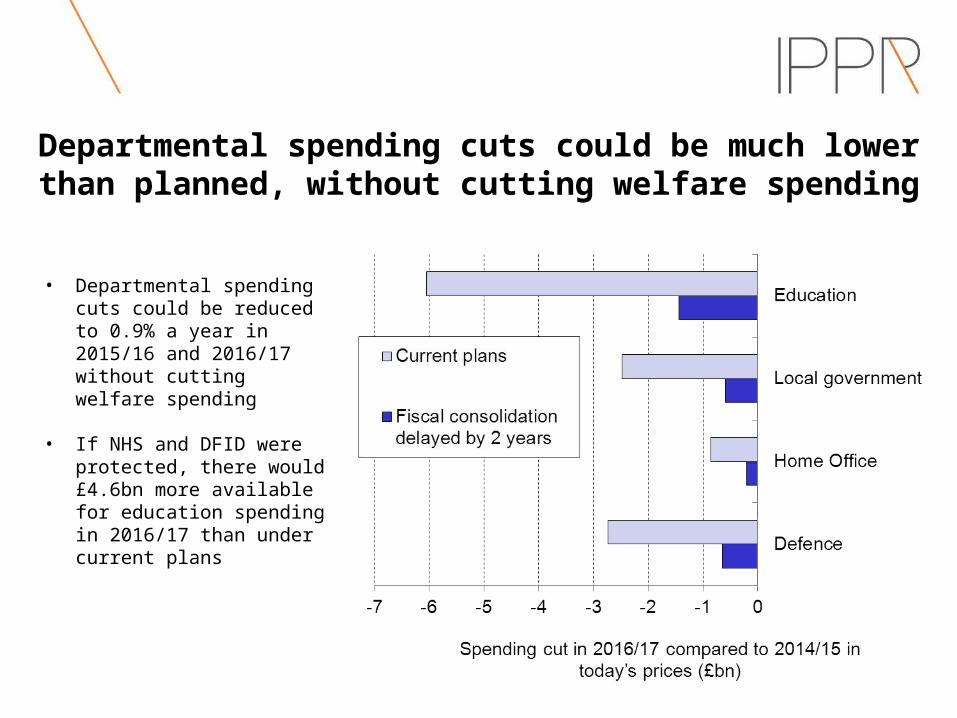
Departmental spending cuts could be much lower than planned, without cutting welfare spending
• Departmental spending cuts could be reduced to 0.9% a year in 2015/16 and 2016/17 without cutting welfare spending
• If NHS and DFID were protected, there would £4.6bn more available for education spending in 2016/17 than under current plans
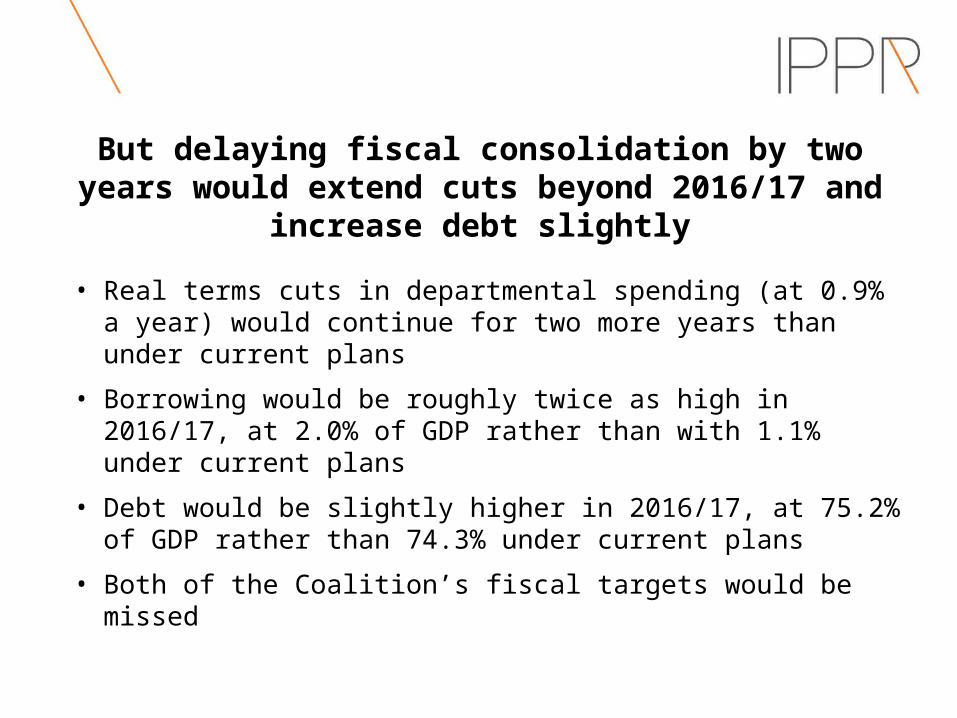
But delaying fiscal consolidation by two years would extend cuts beyond 2016/17 and increase debt slightly
• Real terms cuts in departmental spending (at 0.9% a year) would continue for two more years than under current plans
• Borrowing would be roughly twice as high in 2016/17, at 2.0% of GDP rather than with 1.1% under current plans
• Debt would be slightly higher in 2016/17, at 75.2% of GDP rather than 74.3% under current plans
• Both of the Coalition’s fiscal targets would be missed
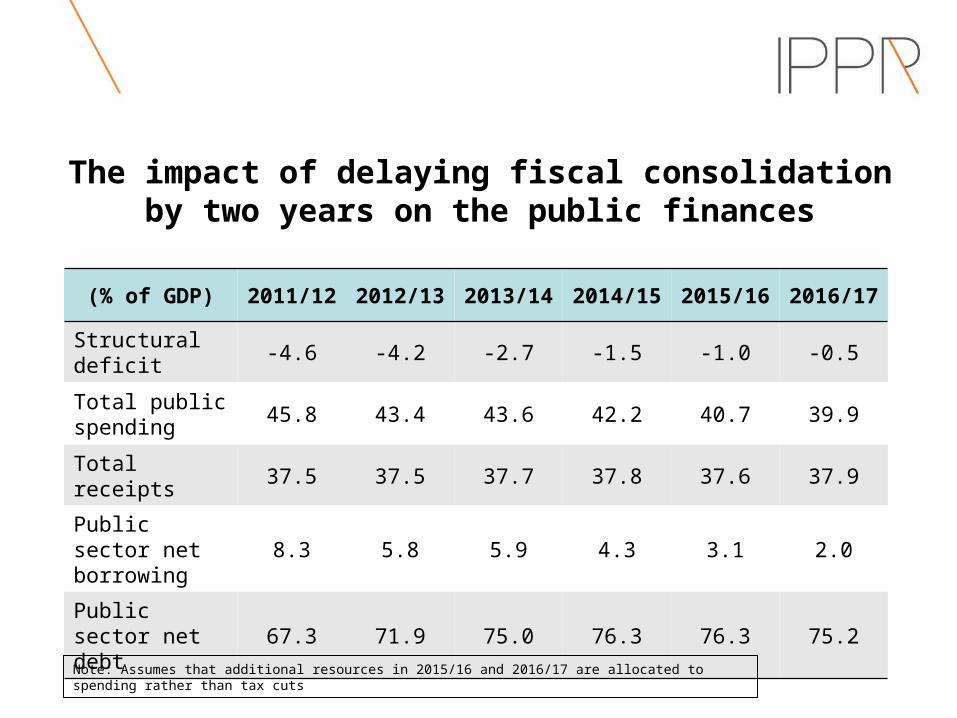
The impact of delaying fiscal consolidation by two years on the public finances
(% of GDP) 2011/12 2012/13 2013/14 2014/15 2015/16 2016/17
Structural deficit -4.6 -4.2 -2.7 -1.5 -1.0 -0.5
Total public spending
45.8 43.4 43.6 42.2 40.7 39.9
Total receipts 37.5 37.5 37.7 37.8 37.6 37.9
Public sector net borrowing
8.3 5.8 5.9 4.3 3.1 2.0
Public sector net debt
67.3 71.9 75.0 76.3 76.3 75.2
Note: Assumes that additional resources in 2015/16 and 2016/17 are allocated to spending rather than tax cuts
Summary
• Without changes to tax or welfare policy, the Coalition’s fiscal plans to 2016/17 imply large cuts in departmental spending
• These would be larger in other departments if the NHS budget continues to receive protection
• Departmental cuts would be smaller if welfare was also cut, but this is difficult to achieve without dramatically reducing entitlements
• Departmental cuts would also be smaller if tax revenues were increased but popular options like a mansion tax raise too little to have a significant impact
• Raising capital spend would be good for growth but would require extra borrowing or deeper cuts to departmental spending
• Delaying fiscal consolidation by two years would reduce the scale of spending cuts to 2016/17 but borrowing and debt would be higher than currently planned
Conclusion
• No major political party will be able to avoid tough choices on tax and spend in the years ahead
• These challenges should be central to the public debate in the run-up to the next spending review and 2015 general election
• This analysis rests on OBR economic and fiscal forecasts published in March 2012 and which now look optimistic