Embed Size (px)
Citation preview
Total Internal reflection Fluorescence Microscopy: Instrumentation and
Applications in Cell biology

Background
Basic conceptInstrumentationModifications and developmentsApplications in cell biology

What is TIR?
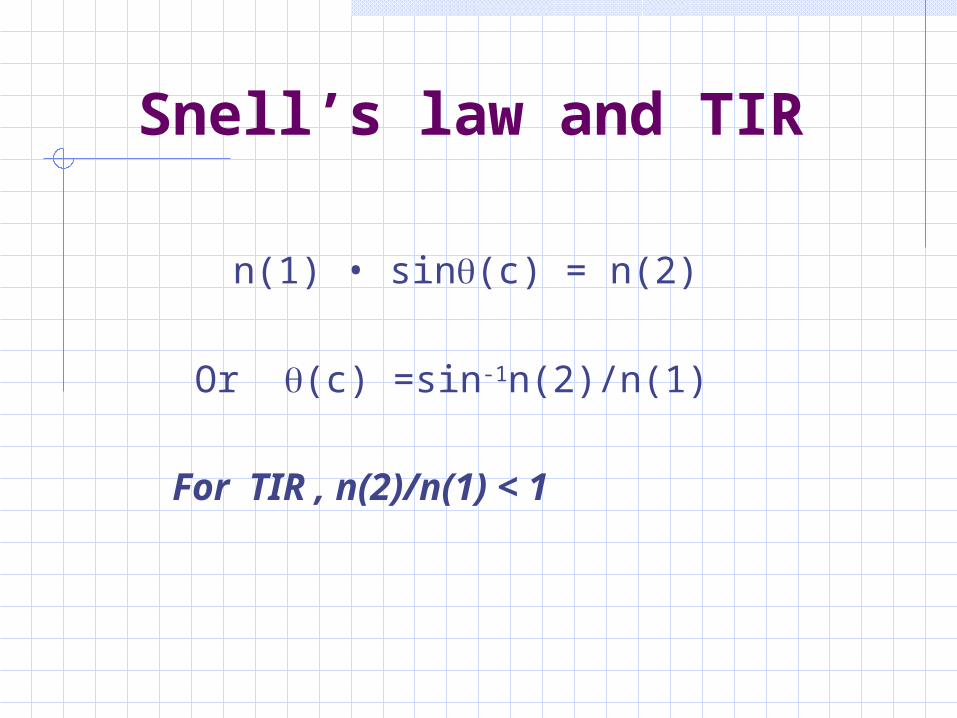
Snell’s law and TIR
n(1) • sin(c) = n(2)
Or (c) =sin-1n(2)/n(1)
For TIR , n(2)/n(1) < 1
Basic points
TIR can be achieved at all angles greater than critical angle.
When TIR occurs, there is always small amount of light penetration across the interface.
This light generates an evanescent wave within the limited region of interface
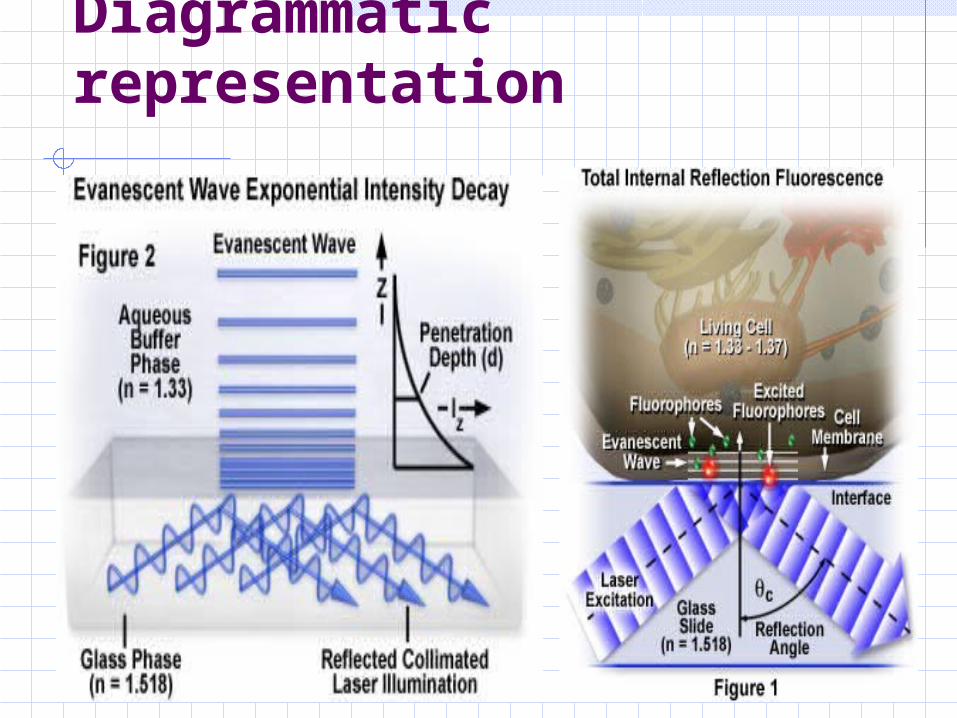
Diagrammatic representation
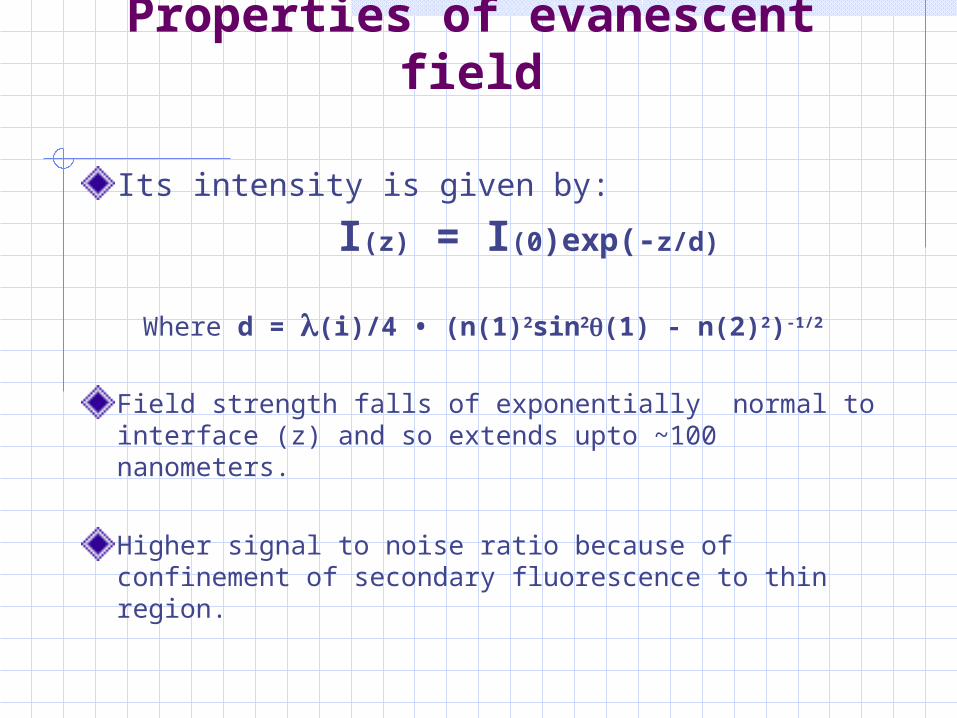
Properties of evanescent field
Its intensity is given by:
I(z) = I(0)exp(-z/d)
Where d = (i)/4 • (n(1)2sin2(1) - n(2)2)-1/2
Field strength falls of exponentially normal to interface (z) and so extends upto ~100 nanometers.
Higher signal to noise ratio because of confinement of secondary fluorescence to thin region.
Requirements for Instrumentation
Illumination: laser preferred: it is coherent, polarized, and well collimated, so that it can be easily directed.
Beam expanders, Mirrors, and Focusing lenses.
Objective with High NA or
Prism to obtain total internal reflection.

Basic Setup
Objective lens method
Objective is employed to introduce light
Prism is employed to introduce light
Prism method
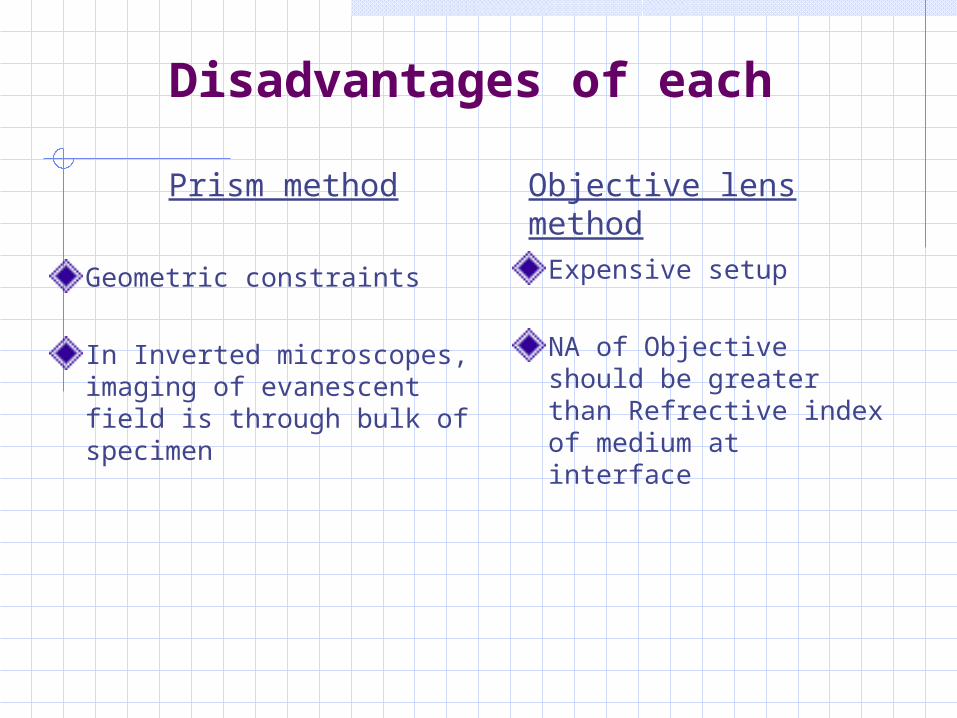
Disadvantages of each
Geometric constraints
In Inverted microscopes, imaging of evanescent field is through bulk of specimen
Expensive setup
NA of Objective should be greater than Refrective index of medium at interface
Prism method Objective lens method
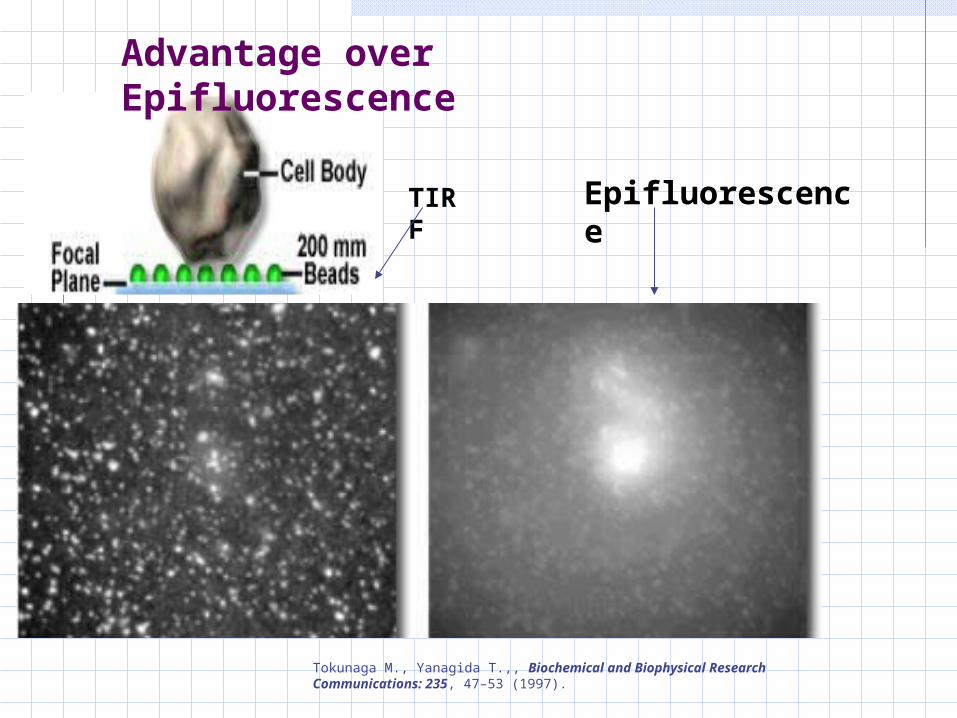
Tokunaga M., Yanagida T.,, Biochemical and Biophysical Research Communications: 235, 47–53 (1997).
EpifluorescenceTIRF
Advantage over Epifluorescence

TIRFM
Normal fluorescence
http://www.microscopyu.com/articles/fluorescence/tirf/tirfintro.html
Comparison of Signal to noise ratio

Measurement of distance from the surface
Distance ‘z ‘ of the fluorophore from the surface can be calculated from fluorescence intensity that , in turn, is proportional to evanescent intensity I(z).
If fluorophore moves from z1 to z2,
z= z1- z2 = dln (I2/I1)
This relationship is valid even in those cases where there are multiple fluorophores attached to the same structure or irregularly shaped fluorophores.

Distance measurements for biologists
Distance of fluorophore from the membrane is of importance rather than from surface.
Membrane impermeant fluorescent dye + fluorescent dye in cell organelle
TIR illumination
Offcell fluorescence is uniformly bright ; in cell substrate contact, dye is confined to thin layer
So, fluorescence f in contact region will be darker by a factor that can be
converted to separation distance h:
h = -dln[1-f/foffcell]Daniel Axelrod, Methods in enzymology, (2003) Vol 361, p1-33
.
Monitoring Amyloid fibril growth with TIFR
• Amyloid fibril : a protein that has self-assembled into an insoluble antiparallel β-pleated sheet.
• These fibrils give rise to the amyloid plaques that are seen in a number of pathological processes (eg Alzheimer's disease)
• To know the mechanism of amyloid fibril formation, it should be observed at single fibril level.
• Thioflavin (ThT) binds to amyloid fibril with increase in fluorescence at 455 nm ; em 485 nm
• Combination of ThT fluorescence and TIRFM can be used to monitor Amyloid growth

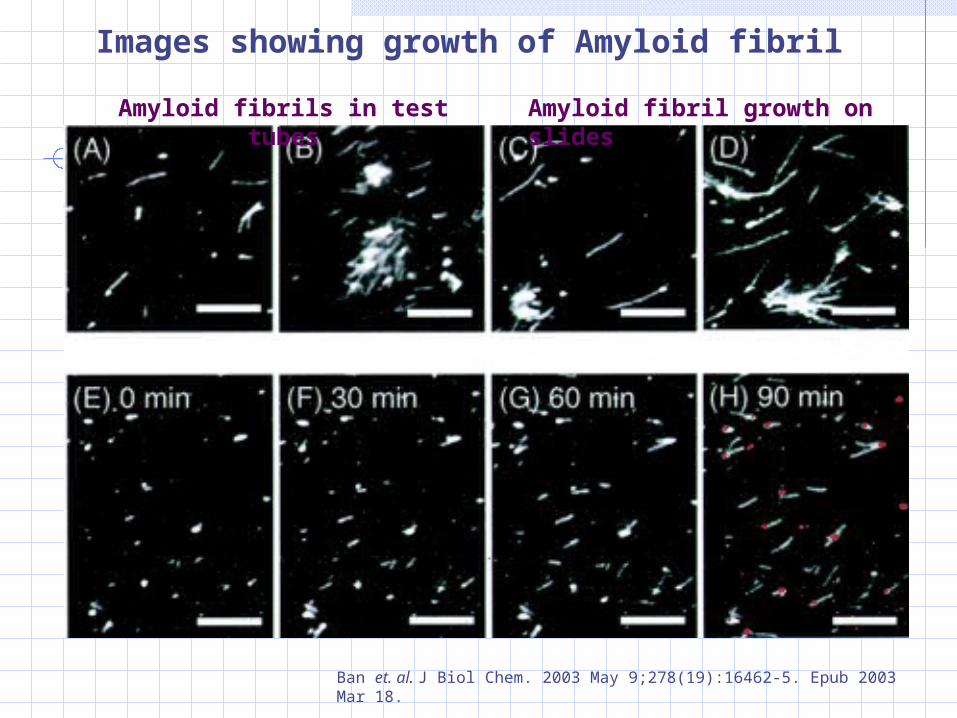
Ban et. al. J Biol Chem. 2003 May 9;278(19):16462-5. Epub 2003 Mar 18
-Amyloid fibril observed through TIRFM
• Penetration depth of evanescent field upon excitation at 455 nm is 150 nm
• Amyloid fibrils have diameter of 10-15 nm, so fibrils lying in parallel with slide glass surface is observed.
Ban et. al. J Biol Chem. 2003 May 9;278(19):16462-5. Epub 2003 Mar 18.
Images showing growth of Amyloid fibril
Amyloid fibrils in test tubes
Amyloid fibril growth on slides

Visualizing membrane trafficking using TIFR
Example : imaging of insulin vesicle membrane and cargo during exocytotic event.
1. Target flurophore (EGFP) to secretory vesicle membrane
2. Use of some dye (acridine orange) that can go inside vesicle
3. Monitoring colocalization of the two fluorophores.
4. Visualizing the movement by the help of TIFR
Tsuboi et al Current Biology (2000) Vol 10 No 20
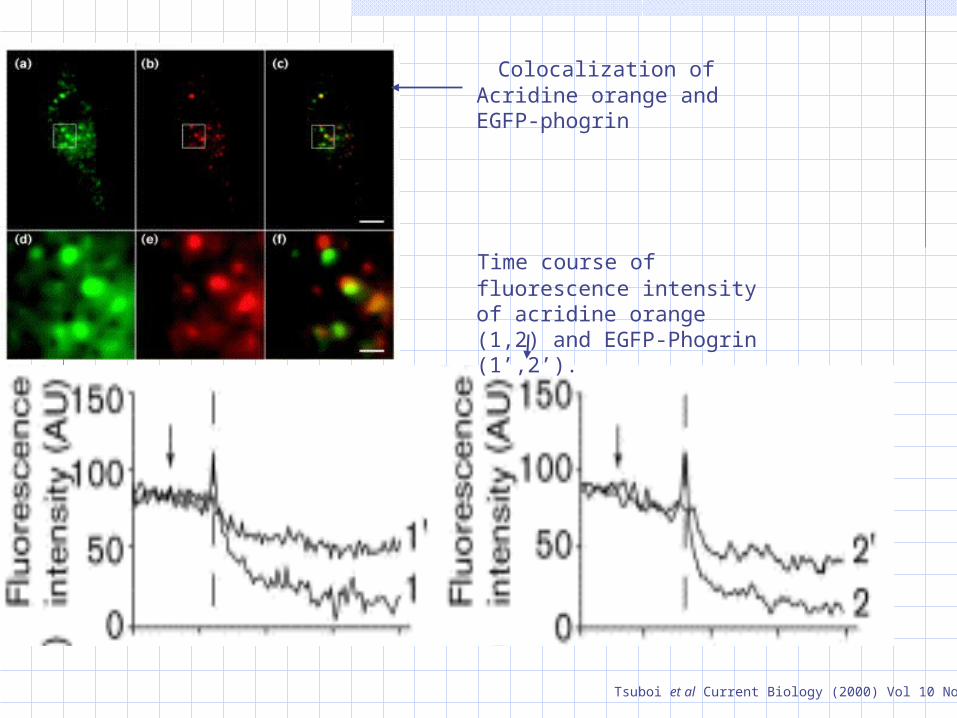
Tsuboi et al Current Biology (2000) Vol 10 No 20
Colocalization of Acridine orange and EGFP-phogrin
Time course of fluorescence intensity of acridine orange (1,2) and EGFP-Phogrin (1’,2’).
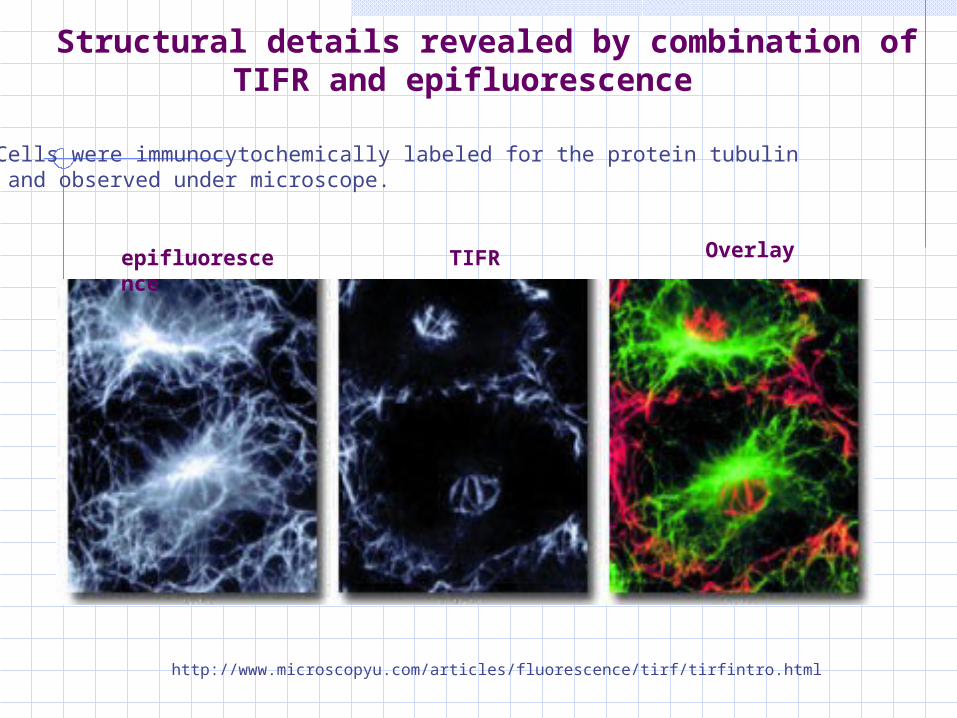
Structural details revealed by combination of TIFR and epifluorescence
epifluorescence TIFR Overlay
• Cells were immunocytochemically labeled for the protein tubulin and observed under microscope.
http://www.microscopyu.com/articles/fluorescence/tirf/tirfintro.html

TIRF versus Confocal microscopy
The depth of optical section ~ 100-150 nm for TIRF whereas in confocal microscopy it is ~600 nm
TIRF can be adapted to standard microscopic optics with less expense; confocal microscopy is very expensive
Unlike confocal microscopy, TIRF can be applied to macroscopic applications
Best suited for applications where illumination as well as detected emission is restricted to a thin section.
Tsuboi et al Current Biology (2000) Vol 10 No 20

Future work
Analyze molecular mechanisms of exocytosis and endocytosis; study process of synaptic vesicle fusion.
Study the interactions ‘in situ’ in living cells.

Thank you