Embed Size (px)
Citation preview
2003 Consortium Survey Reports
Autumn 2003 Torvalds
Improving Chicago’s SchoolsA report specially preparedto assist in self-assessmentand long-term planning
Consortium on Chicago School Research1313 E. 60th Street · Chicago IL 60637Tel: 773-702-3364 Fax: 773-702-2010www.consortium-chicago.org
Report Authors
Stuart Luppescu is Chief Psychometrician at the Consortium, specializing in educationalmeasurement. He received his PhD in Educational Measurement from the Universityof Chicago. Before coming to Chicago, Stuart taught English in Japan and Hawaii for13 years. His research interests are in language acquisition and in multilevel modelingof achievement data.
Holly Hart is a Research Associate and the Survey Coordinator at the Consortium on ChicagoSchool Research. Before joining the Consortium, Holly was a Senior Project Coordinatorat the Survey Research Laboratory of the University of Illinois at Chicago. She receivedher BA in Psychology from Loyola University and her PhD in Human Development andSocial Policy from Northwestern University. Holly is currently researching the use oftechnology in Chicago public school classrooms.
Sandra Jennings is the Associate Director for Publications and Communications. She isresponsible for the design and editorial services for all Consortium publications, andoversees the Consortium website. This includes the development, design and produc-tion of new publications, computer-generated visual presentations, media releases, anda wide range of collateral print materials. In addition, she assists in developing com-munications strategies for the Consortium, as well as creating and maintaining graphicand editorial identity of the organization.
Melissa Dean is Publications Editor at the Consortium. Melissa holds an MA from the Uni-versity of Chicago, where she studied writing and writing pedagogy. Prior to her gradu-ate work, she was a Director at BSMG Worldwide, where she created and managed NewYork Stock Exchange-traded companies’ communications programs and advised seniormanagement on business strategies. She has written numerous articles and researchreports and performed as the chief editor of an investment journal.
Acceptance of this report implies endorsement of the conditions listed below.The Consortium on Chicago School Research has promised to maintain the confidentiality
of all schools and survey participants. This report is the property of Torvalds, and will not bedistributed to anyone outside of your school without the written permission of your principal.Anyone accepting a copy of this report promises to adhere to this agreement as well.
Torvalds
Improving Chicago’s Schools
2003 Survey Report
Consortium on Chicago School Research
Acknowledgments
In the spring of 2003, over 101,000 students, teachers, and principals participated in theConsortium on Chicago School Research’s biannual survey of Chicago Public Schools. Withoutthe time and support teachers and principals gave to this effort, this massive undertakingwould never have been possible.
Chicago Public Schools staff supported this survey administration in a variety of ways.Thanks to Daniel Bugler, Chief Officer of the Office of Research, Evaluation, and Account-ability for supporting this effort. Thanks to the enthusiastic and untiring efforts of the AreaInstructional Officers for encouraging their schools to participate. Andrea Ross, Jason Frost,and Janet Elenbogen provided us with necessary student and teacher data. John Jablonskiwrote our scan programs and scanned all surveys with the advice and assistance of John Del-monte and Bill Galante. Ian Thomson and his staff at the Bureau of Warehouse Servicesmade sure surveys were distributed to and collected from schools safely and efficiently. JoyceCopeland and Roy Humphrey made sure our intake crew had everything they needed to maketheir jobs easier.
The Consortium also owes many thanks to our own Survey Data Manager, Loretta Morris,for investing her considerable talent and energy toward making this survey effort successful.We are also very grateful to Sabrina Billings for providing much needed assistance to the sur-vey office and for managing the intake crew. Sherrecia Jones, Stephany Price, and BrandonHalcott also assisted in the survey office. Last but never least, thanks to the efficient and pa-tient intake crew, also managed by Messina Robinson, who monitored, recorded and preparedsurveys for scanning. Many thanks to Dolores Brown, W.C. Brown, Dallas Crawford, VictorGavin, Darnell Morris, Gussie Ross, Lauren Smylie, Ashley Stroud, Dale Thomas, and MaryWilliams.
Torvalds 1
Contents
About the Consortium 2About the Improving Chicago’s Schools Surveys 2Understanding Your Report 3
Creating Measures from Item Responses . . . . . . . . . . . . . . . . . . . . . . . . . . 3How to Read the Display for Each Measure . . . . . . . . . . . . . . . . . . . . . . . . . 3How Your Report is Organized: A Set of Profiles . . . . . . . . . . . . . . . . . . . . . . 5New for 2003 . . . . . . . . . . . . . . . . . . . . . . . . . . . . . . . . . . . . . . . . . . . 7
Using this Report 8
Summary Profiles 9School Leadership: Inclusive Process and Strategic Orientation . . . . . . . . . . . . . 10Parent and Community Partnerships: Participant Relations . . . . . . . . . . . . . . . 12Parent and Community Partnerships: Students’ Sense of Support . . . . . . . . . . . . 14Student-Centered Learning Climate: Safety and Order . . . . . . . . . . . . . . . . . . 16Student-Centered Learning Climate: Involvement and Support . . . . . . . . . . . . . 18Professional Capacity: Professional Community . . . . . . . . . . . . . . . . . . . . . . 20Professional Capacity: Professional Workplace . . . . . . . . . . . . . . . . . . . . . . . 22Professional Capacity: Professional Development . . . . . . . . . . . . . . . . . . . . . 24Support for Technology Integration in Schools . . . . . . . . . . . . . . . . . . . . . . . 26Availability and Use of Technology in the Classroom . . . . . . . . . . . . . . . . . . . . 28
For Further Reading 30
2 About the Consortium
About the Consortium
The Consortium on Chicago School Research possesses the nation’s largest collection of dataon any single city’s public school system and its students. Our archive includes data providedby the school system, information from a variety of other public sources, and original datacollected by us. In 1991, the Consortium began to survey regularly all Chicago public schoolprincipals, teachers, and students to learn their views on the state of our public schools andtheir experiences in them.
About the Improving Chicago’s Schools Surveys
This past year, more than 101,000 students, teachers, and principals across the Chicago publicschool system participated in the Consortium’s 2003 Improving Chicago’s Schools survey. Stu-dents told us about their school experiences, attitudes, and activities. Teachers and principalstold us about instruction in their classrooms and their professional development experiences,and answered our questions about the conditions under which they work.
Data from the Improving Chicago’s Schools survey are used in many ways. One of themost important is the individualized reports that the Consortium prepares for every schoolin which a sufficient response rate is achieved.1 This year, 412 elementary and high schoolsmet the response rate criteria. Over the summer the Consortium prepared thousands ofpages of school profiles, collected into 412 school-specific, confidential reports for those schools’principals, teachers, and Local School Councils.
These reports paint a picture of the type of learning climate, quality of instructional pro-gram, nature of student-teacher relationships, and kind of leadership that exists in eachschool. They also say something about the professional environment within the school, andthe nature of the school’s relationships with parents and others in the community. BecauseChicago public schools have participated in the Consortium’s surveys for the past ten years,the individual school reports also show how these things have changed over time. Taken to-gether, this information about where a school is and how it is developing can help the schoolassess its progress and plan for the future. Among other things, this information can proveinvaluable in carrying out an internal program review as part of the preparations for theSchool Improvement Plan for Advancing Academic Achievement (SIPAAA).
Survey data are used in many other ways as well. Teacher, principal, and student reportssupplement the Consortium’s analyses of student test scores and other performance indica-tors (like graduation and attendance rates) to provide a comprehensive picture of Chicagopublic school improvement. Along with extensive field work and other research, surveys helpidentify the classroom practices and school organizational characteristics that are most effec-tive in enhancing student engagement and improving learning. As a result, the public reportsprepared from analyses of these data help us to describe the current conditions in schools, thechallenges schools face, and the impact of different improvement initiatives and reforms.
1At least 42 percent of teachers or 50 percent of students must respond in order for a school to receive a report.If the Consortium receives responses from only one group at a school (i.e., teachers, but not students), only thatgroup’s measures are reported.
Torvalds 3
Understanding Your ReportCreating Measures from Item Responses
The 542 items on the teachers’ surveys and the 191 items on the students’ survey offer reportsof how often something happens (e.g., how often a teacher has conversations with colleaguesabout what helps students learn best), how someone feels (e.g., to what extent teachers feel re-spected by their students’ parents), or someone’s perceptions (e.g., the extent to which teachersthink their principal takes a personal interest in the professional development of teachers).
Sometimes several questions ask about the same thing in different ways (e.g., are teachersinvolved in making important decisions in their school? do they have a lot of informal oppor-tunities to influence what happens there?). We ask similar questions to reach a more accurateunderstanding of, for example, teachers’ views of their school as a workplace. So, while it canbe interesting to analyze responses to individual survey questions (items) independently, it isoften more useful to consider multiple responses to sets of related items.
We are able to do this by constructing measures that combine information obtained fromseveral items that are conceptually related. So, for example, the measure of Program Coher-ence, described on page 10, combines information we obtained from teachers in response toquestions about the extent to which curriculum and instruction are well coordinated acrossgrades, the extent to which they are consistent among teachers in the same grade, reports ofwhether the focus of instruction has changed for the better in the last two years, and otherrelated issues. The Program Coherence measure assesses the overall extent to which theschool’s instructional programs are coordinated and consistent both within and across gradelevels.
Each question on the 2003 Improving Chicago’s Schools survey is linked to such a measure.Your school is described in terms of how high or low it scores on 33 different measures.
Please note: while in most instances being on the high end of a scale is most desirable, onone measure, Incidence of Disciplinary Action (on page 16), being on the low end is desirable.
How to Read the Display for Each Measure
The following figure illustrates the basic reporting format developed by the Consortium forpresenting a school’s data on each measure. It compares your school both to other schools thatare demographically similar to yours, and to the Chicago public school system as a whole.2 Inmost instances, the profiles also include time-trend information about your school based on itsresponses to previous Consortium surveys.3 In addition to providing information about yourschool’s standing in 2003, this trend data can provide useful information about the overalldirection of your reform efforts. Has there been improvement or not?
2The Consortium relies on test scores, enrollment, mobility, racial composition, neighborhood characteristics,and other indicators from 2002 to identify schools that are demographically comparable to your school.
3A year’s data may be missing on some of the profiles. This is because either the questions that comprised theseparticular measures were not included on the Consortium’s surveys that year, or your school did not completesurveys that year.
4 How to Read the Display for Each Measure
Yourschool
Program Coherence
1994
1997
1999
2001
2003
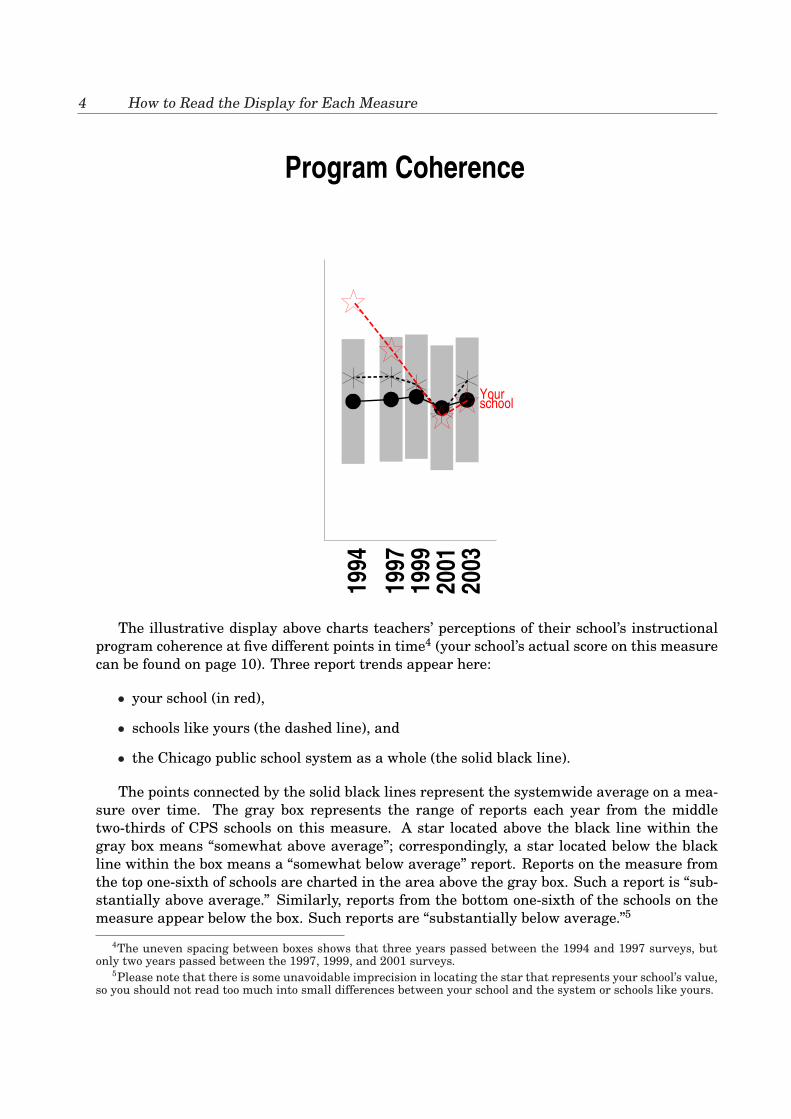
The illustrative display above charts teachers’ perceptions of their school’s instructionalprogram coherence at five different points in time4 (your school’s actual score on this measurecan be found on page 10). Three report trends appear here:
• your school (in red),
• schools like yours (the dashed line), and
• the Chicago public school system as a whole (the solid black line).
The points connected by the solid black lines represent the systemwide average on a mea-sure over time. The gray box represents the range of reports each year from the middletwo-thirds of CPS schools on this measure. A star located above the black line within thegray box means “somewhat above average”; correspondingly, a star located below the blackline within the box means a “somewhat below average” report. Reports on the measure fromthe top one-sixth of schools are charted in the area above the gray box. Such a report is “sub-stantially above average.” Similarly, reports from the bottom one-sixth of the schools on themeasure appear below the box. Such reports are “substantially below average.”5
4The uneven spacing between boxes shows that three years passed between the 1994 and 1997 surveys, butonly two years passed between the 1997, 1999, and 2001 surveys.
5Please note that there is some unavoidable imprecision in locating the star that represents your school’s value,so you should not read too much into small differences between your school and the system or schools like yours.
Torvalds 5
Looking at the figure then, we see that in 1994 the teachers in this school rated the co-herence of their instructional program well above average as compared to the school systemoverall. Their levels decreased in 1997, and by 1999 they were about at the average of allschools. In 2003, teachers in this school rated Program Coherence at about the average of theschool system overall, and slightly below demographically similar schools.
Please note: Even though a school as a whole may have met the criteria for receiving aspecially prepared report, it is possible that some measures are not reported. At least sevenstudents or seven teachers need to respond to all of the survey items that comprise a measurein order to get a valid reading of that measure. If less than seven respond, only the systemmean and the “schools like yours” trend appear on the profile.6 Also, if your school did notcomplete surveys in a previous year, no star will appear on the red trend line for that year.
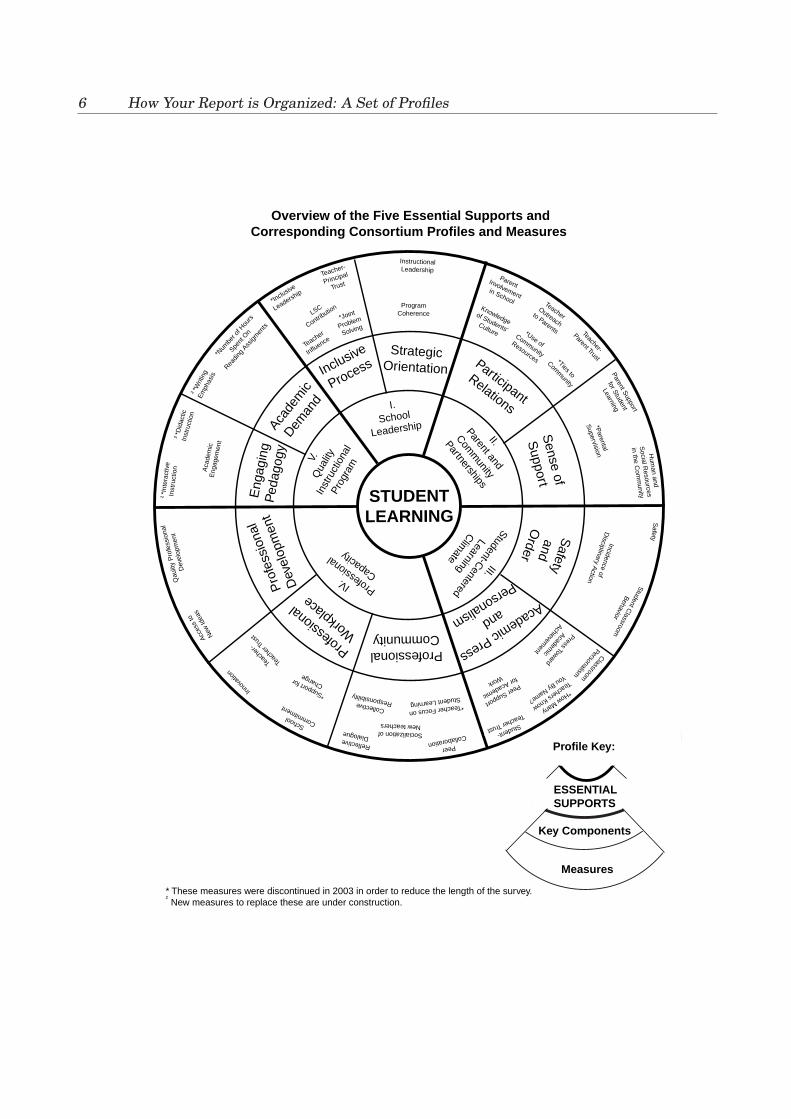
How Your Report is Organized: A Set of Profiles
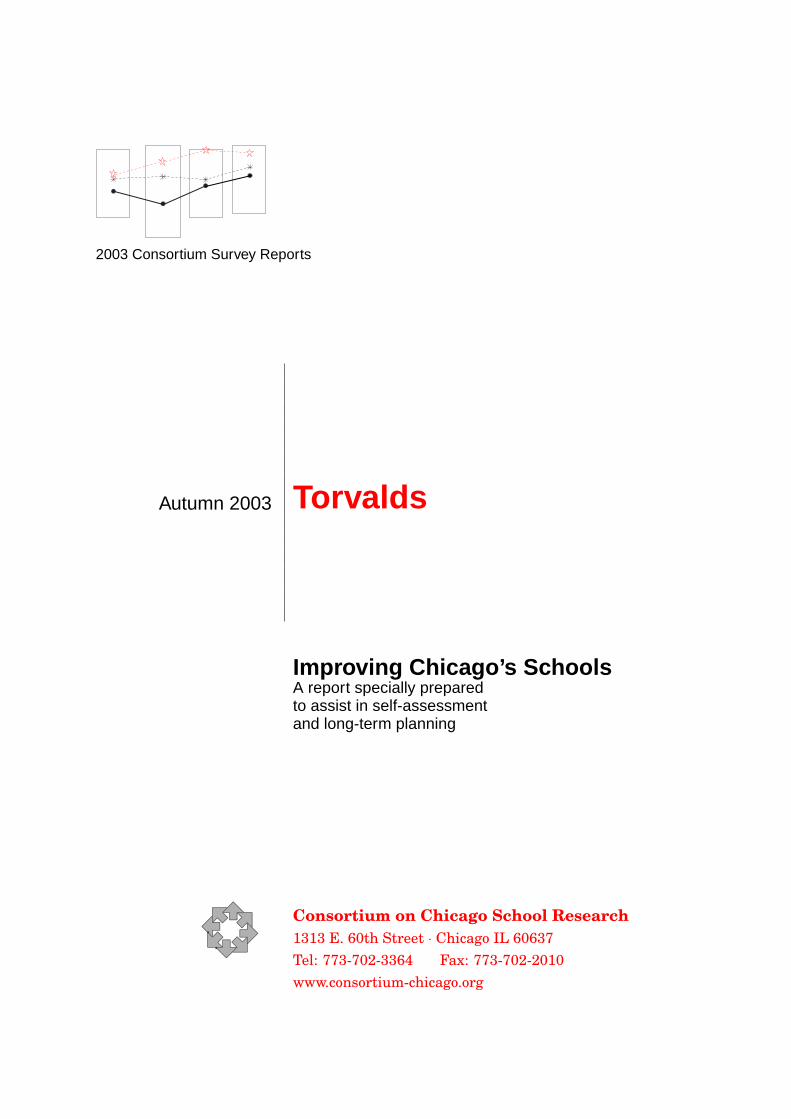
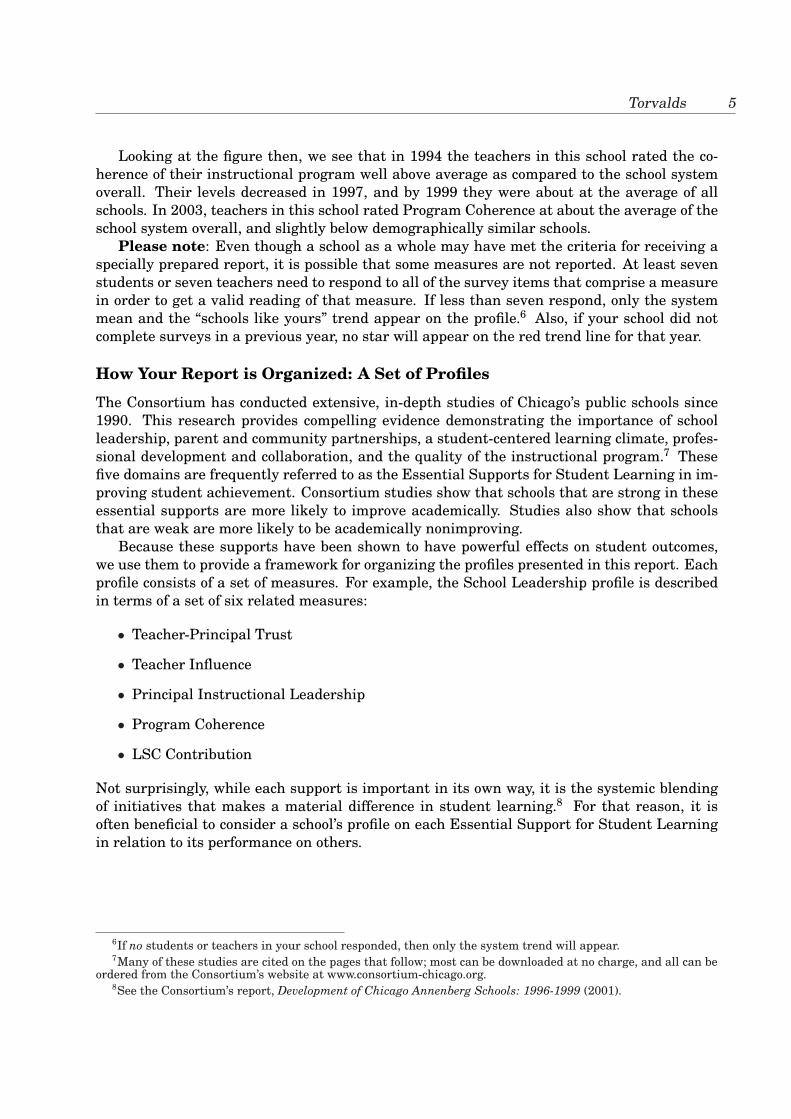
The Consortium has conducted extensive, in-depth studies of Chicago’s public schools since1990. This research provides compelling evidence demonstrating the importance of schoolleadership, parent and community partnerships, a student-centered learning climate, profes-sional development and collaboration, and the quality of the instructional program.7 Thesefive domains are frequently referred to as the Essential Supports for Student Learning in im-proving student achievement. Consortium studies show that schools that are strong in theseessential supports are more likely to improve academically. Studies also show that schoolsthat are weak are more likely to be academically nonimproving.
Because these supports have been shown to have powerful effects on student outcomes,we use them to provide a framework for organizing the profiles presented in this report. Eachprofile consists of a set of measures. For example, the School Leadership profile is describedin terms of a set of six related measures:
• Teacher-Principal Trust
• Teacher Influence
• Principal Instructional Leadership
• Program Coherence
• LSC Contribution
Not surprisingly, while each support is important in its own way, it is the systemic blendingof initiatives that makes a material difference in student learning.8 For that reason, it isoften beneficial to consider a school’s profile on each Essential Support for Student Learningin relation to its performance on others.
6If no students or teachers in your school responded, then only the system trend will appear.7Many of these studies are cited on the pages that follow; most can be downloaded at no charge, and all can be
ordered from the Consortium’s website at www.consortium-chicago.org.8See the Consortium’s report, Development of Chicago Annenberg Schools: 1996-1999 (2001).
6 How Your Report is Organized: A Set of Profiles
Measures
ESSENTIAL SUPPORTS
Key Components
STUDENTLEARNING
I.School
Leadership
Inclusive
Process
InstructionalLeadership
*Inclusive
Leadership
Teacher-
Principal
Trust
Teach
er
Influence
*Joint
Problem
Solving
ProgramCoherence
ParentInvolvementin School Teacher
Outreachto Parents Teacher-
Parent Trust
Knowledgeof Students'Culture *Use of
Community
Resources
Parent Support
for Student
Learning
*Parental
Supervision H
uman and
Social R
esources
in the Com
munity
Safety
Participant
Relations
Sense of
Support
Safety
andO
rder
Academic Press
and
Personalism
II.
Parent and
Comm
unity
PartnershipsIII.
Student-Centered
LearningClim
ate
Student C
lassroom
Behavior
Incidence ofD
isciplinary Action
ProfessionalCommunity
Professional
Workp
laceIV.
Professional
Capacity
Peer
CollaborationReflective Dialogue
*Teacher Focus on
Student LearningCollective Responsibility
SchoolCommitm
ent
Inno
vatio
n
*Support for
Change
Teac
her-
Teac
her T
rust
Pro
fess
iona
l
Dev
elop
men
tE
ngag
ing
Ped
agog
y
V.Q
ualit
yIn
stru
ctio
nal
Prog
ram
Acce
ss to
New
Idea
s
Qau
lity
Pro
fess
iona
l
Dev
elop
men
t
†*In
tera
ctiv
eIn
stru
ctio
n
†*W
ritin
g E
mph
asis
Aca
dem
icE
ngag
emen
t
†*D
idac
ticIn
stru
ctio
n
Overview of the Five Essential Supports andCorresponding Consortium Profiles and Measures
*Ties to
Comm
unity
StrategicOrientation
Acade
mic
Deman
d
*Num
ber o
f Hou
rs
Spent
On
Readin
g Ass
igmen
ts
Profile Key:
Classroom
PersonalismPress Toward
Academic
Achievement
Peer Support
for Academic
Work*How Many
Teachers Know
You By Name?
Student-
Teacher Trust
LSC
Contributio
n
Socialization ofNew teachers
* These measures were discontinued in 2003 in order to reduce the length of the survey. New measures to replace these are under construction.†
Torvalds 7
New for 2003
In 2003, we expanded the survey’s instruction and literacy sections. These data will providethe foundation for future analyses of instruction-related outcomes as well as an in-depth anal-ysis of the Chicago Reading Initiative, a program that has provided reading specialists to anumber of Chicago Public Schools. To make room for the expanded instruction and literacysections, we removed those measures that had become redundant over time.
The measure called “Press Toward Academic Achievement” in previous years has beenreconstructed to more accurately reflect what teachers actually do to push their students toachieve. The measure this year is not comparable to the measure in previous years, and soresults only for this year are presented in this report. In addition, we have changed the titleof the measure to “Academic Press” to minimize confusion with the previous version.
Additionally, we shortened the student surveys to encourage completion. The originalstudent survey was divided into two separate surveys – one for math and one for English, andselection of which survey a student would take was done randomly, instead of being based onbirthdates as in previous years.
Since there are now a number of schools that serve elementary as well as high schoolgrades, for a few schools we are providing two different reports. This elementary gradesreport reports the results from your students in grades six through eight. This report has theschool name on the front page (and on other parts) printed in red. The high school report,with the school name (and the other parts) printed in purple, presents the results from yourstudents in ninth and 10th grades. If the majority of your teachers teach in grades K througheight, their results will be in this report. If, on the other hand, most of your teachers teach inthe higher grades, their results will be in the high school report.
8 Using this Report
Using this Report
The information presented in this report can be used in a variety of ways. It is intendedto supplement your assessments of test-score data and other performance indicators on theSchool Improvement Plan for Advancing Academic Achievement. It will identify areas thatare becoming stronger over time or have always been strong. And it may identify areas thatare weak or getting weaker. The definitions of the measures that comprise each profile de-scribe in detail what high levels signify, including if they report teacher or student responses,if they are positive or negative measures, and what their questions on the surveys addressed.Measures constructed from teacher responses are marked with a “(T)” after the measure title;measures from student responses are marked with an “(S).”
The information provided in this report can stimulate discussion among your school’s prin-cipal, teachers, and members of your Local School Council about setting priorities. It may helpyou decide which external partnerships are most likely to benefit your school, how much moreeffort you should devote to integrating community resources in your programs of instruction,or whether you should focus more attention on increasing students’ personal safety inside andoutside the school building.
In the pages that follow, we explain your school data through figures, descriptions of mea-sures, and questions you might like to ask about your school’s position on these measures.These are by no means exhaustive lists of the issues you may wish to consider as you use thisreport in your SIPAAA planning or for other purposes. But we hope they give you a feeling forthe many ways this information can help you assess your school’s accomplishments and planfor your future.
Item reports for each measure are also available from the Consortium by request. Thesesupplemental reports provide your school’s specific responses to each of the survey items thatmake up the measures compared to the systemwide average, and to high- and low-ratedschools.
Torvalds 9
Summary Profiles for Torvalds
10 School Leadership: Inclusive Process and Strategic Orientation
System trendSchoolslike yours
Yourschool
Yourschool
Yourschool
Yourschool
Yourschool
School LeadershipInclusive Process
and Strategic Orientation
Teacher-PrincipalTrust
Scales
on These
Low
Scales
on These
High
1994
1997
1999
2001
2003
Teacher Influence
1994
1997
1999
2001
2003
Principal InstructionalLeadership
1994
1997
1999
2001
2003
Program Coherence
Scales
on These
Low
Scales
on These
High
1994
1997
1999
2001
2003
LSC Contribution
1994
1997
1999
2001
2003
Torvalds 11
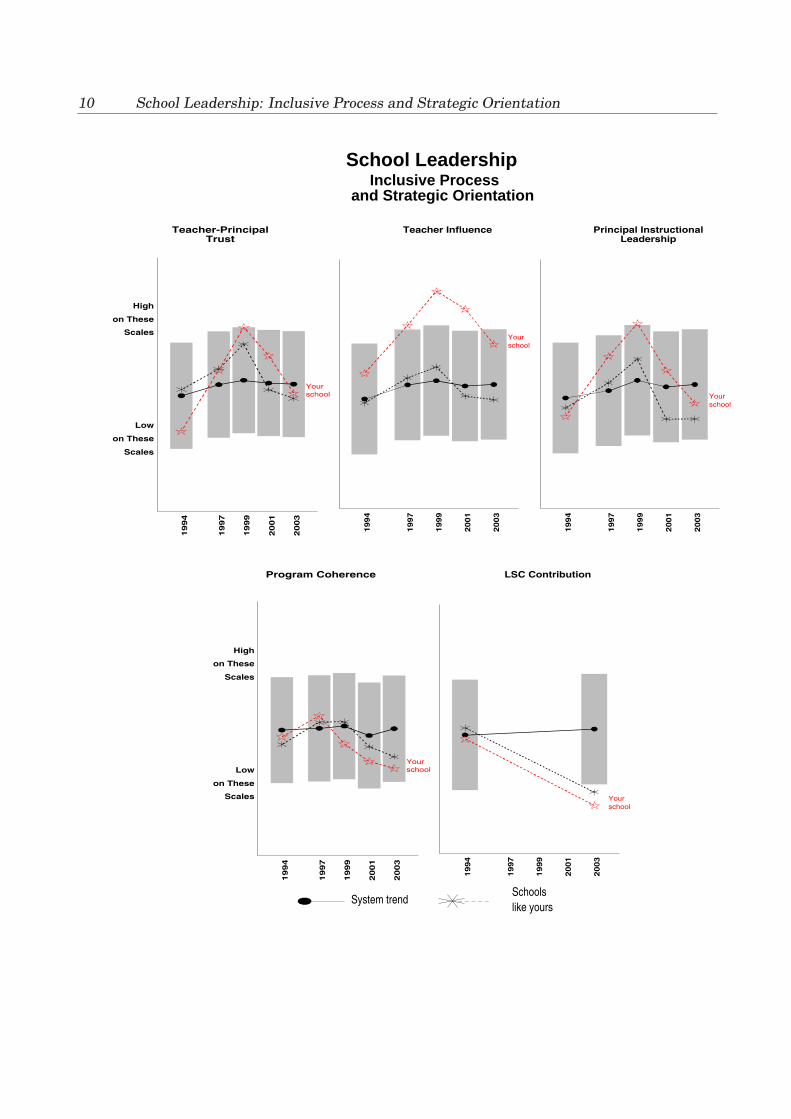
Teacher-Principal Trust (T) The extent to which teachers feel their principal respects andsupports them. Questions ask teachers if the principal looks out for their welfare, hasconfidence in their expertise, and if they respect the principal as an educator. High levelsindicate that teachers share deep mutual trust and respect with the principal.
Teacher Influence (T) Measures the extent of teachers’ involvement in school decision mak-ing. It assesses teachers’ influence on the selection of instructional materials, setting ofschool policy, in-service program planning, discretionary funds spending, and hiring ofprofessional staff. High levels indicate that teachers have influence on a broad range ofissues at the school.
Principal Instructional Leadership (T) Teachers’ perception of their principal as an in-structional leader with respect to the teaching and learning standards, communicationof a clear vision for the school, and tracking of academic progress. High levels indicatethat teachers view their principal as very involved in classroom instruction.
Program Coherence (T) The degree to which teachers feel the programs at their school arecoordinated with each other and with the school’s mission. Questions ask teachers if in-structional materials are consistent within and across grades and if there is sustainedattention to quality program implementation. High levels indicate that the school’s pro-grams are coordinated and consistent with its goals for student learning.
LSC Contribution (T) Measures the degree to which teachers view the contribution of theLocal School Council (LSC) as positive in the areas of curriculum, safety, parent involve-ment, and community relations. High levels indicate that the teachers view the LSC asmaking positive contributions to the school.
TO CONSIDER: Previous Consortium studies have documented that principals in improvingschools actively reach out to teachers, parents, and local community leaders to engage them in thetasks of strengthening teaching and learning at the school.9 Effective processes are establishedfor involving local actors in school improvement planning. Moreover, in these schools there isa strong strategic orientation toward and concern about program coordination and the quality ofimplementation.
A recent Consortium report showed that instructional program coherence greatly facilitatesschool improvement initiatives.10 Although a school may have many different and exciting pro-grams, a lack of coordination among them may thwart their positive impact.
• Is your school’s report on the program coherence measure what you expected?
• As you think about all of your school’s efforts to improve over the last two years, do theyreflect a coordinated plan?
• Has there been real attention to quality implementation of each initiative?
• Is there a coherent instructional framework that teachers share for each subject, or are therecompeting goals and programs?
9See Democratic Localism as a Lever for Change (Westview Press, 1998) and the Consortium report SchoolLeadership and the Bottom Line in Chicago (2000).
10See the Consortium report School Instructional Program Coherence (2001).
12 Parent and Community Partnerships: Participant Relations
System trendSchoolslike yours
Yourschool Your
school
Yourschool
Yourschool
Parent and Community Partnerships:Participant Relations
Parent Involvementin School
Scales
on These
Low
Scales
on These
High
1994
1997
1999
2001
2003
Teacher Outreachto Parents
1994
1997
1999
2001
2003
Teacher-ParentTrust
Scales
on These
Low
Scales
on These
High
1994
1997
1999
2001
2003
Knowledgeof Student Culture
1994
1997
1999
2001
2003
Torvalds 13
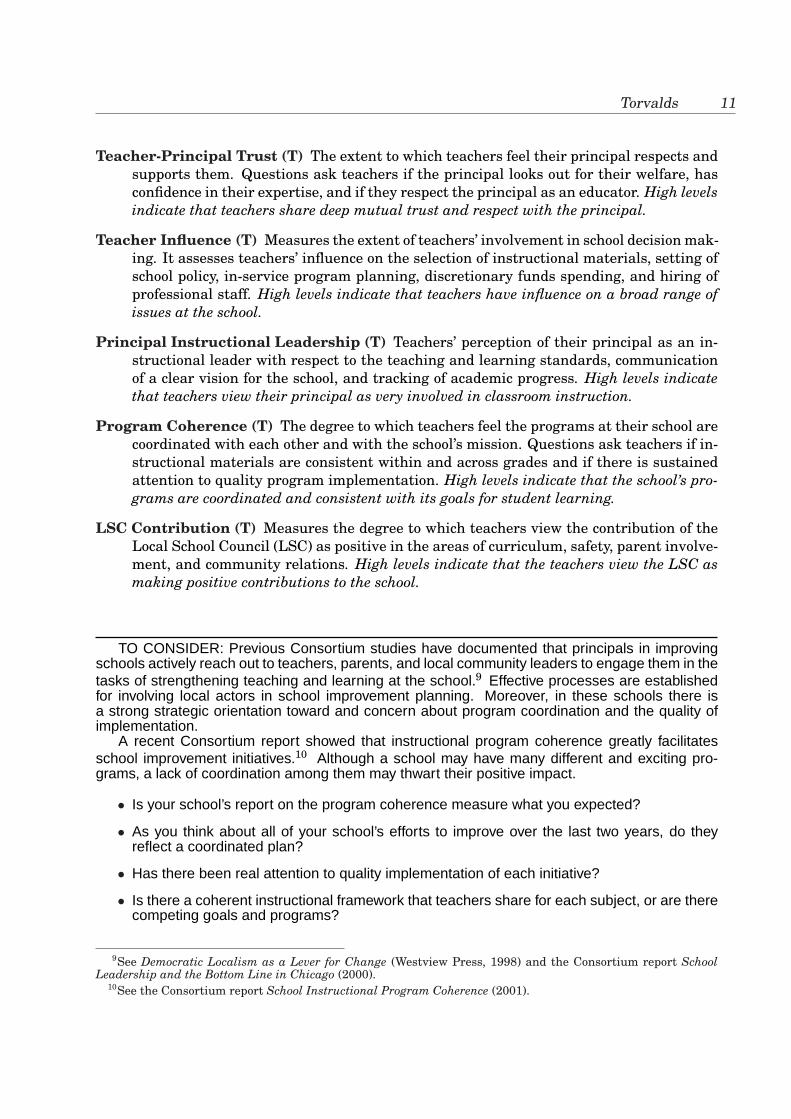
Parent Involvement in School (T) Teachers’ reports on the level of parent involvementand support for the school. Questions ask teachers how often parents pick up reportcards, attend parent-teacher conferences and school events, volunteer to help in theclassroom, and participate in fundraising events. High levels indicate that many parentsare actively engaged with the school.
Teacher Outreach to Parents (T) A measure of the school’s effort to work with parents todevelop common goals, good communication, and strengthen student learning. Ques-tions ask teachers about their efforts to understand parents’ problems, invite parents tovisit classrooms, seek parents’ feedback, and build relations with parents. High levelsindicate that teachers actively reach out to parents.
Teacher-Parent Trust (T) Teachers’ perceptions of the degree of mutual respect betweenthemselves and parents, and their support of each other’s efforts to improve studentlearning. Questions ask teachers if they consider themselves partners with parents ineducating children, if they receive strong parental support and if the school staff workshard to build trust with parents. High levels indicate mutually supportive relationshipsamong parents and teachers.
Knowledge of Students’ Culture (T) Teachers’ reports about their efforts to better under-stand their students. Questions ask teachers how many of their colleagues talk withstudents about their culture and home lives, and whether they know about the issuesfacing the surrounding community. High levels indicate that many teachers are commit-ted to learning more about their students and the community where they live.
TO CONSIDER: A major issue for urban school reform involves reconnecting local schoolprofessionals to the parents and communities they are intended to serve. Unless this occurs,major improvements in student learning remain unlikely. It is incumbent on principals and teachersto reach out to parents, to seek to establish trusting relationships, and to engage them in the tasksof enhancing student learning. For schools in low-income and immigrant communities, teachersoften need to learn more about their distinctive local context and how they can use this knowledgeto promote their students’ interest in school and actual learning.
• How do your school’s levels on Teacher-Parent Trust compare to Teacher-Principal Trust onthe previous page?
• Are levels for Parent Involvement in School and Teacher Outreach to Parents similar?
• Should your school be doing more outreach to increase parent involvement?
Look at Parent Support for Student Learning on the next page.
• Are your results on that profile what you expected given teachers’ outreach to parents?
• What else could your school do to encourage parents’ involvement and support?
14 Parent and Community Partnerships: Students’ Sense of Support
System trendSchoolslike yours
Yourschool
Yourschool
Parent and Community Partnerships:Students’ Sense of Support
Parent Supportfor Student Learning
Scales
on These
Low
Scales
on These
High
1994
1997
1999
2001
2003
Human & Social Resourcesin the Community
1994
1997
1999
2001
2003
Torvalds 15
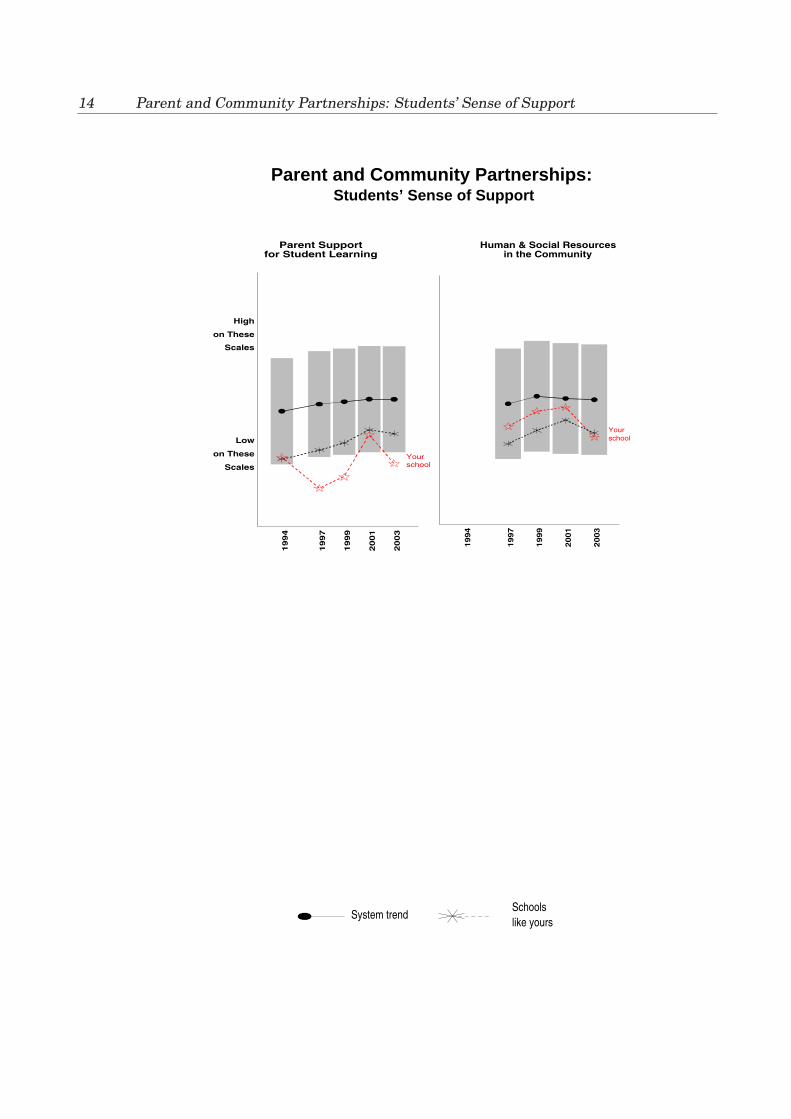
Parent Support for Student Learning (S) Students’ perceptions of their parents’ supportfor their school performance. Questions ask students how often their parents or otheradults encourage them to work hard, do their homework, and take responsibility fortheir actions. High levels indicate strong parental support.
Human and Social Resources in the Community (S) Students’ assessment of the levelof their trust in and reliance upon neighbors and community members, and whetherthey feel adults in the community know and care about them and each other. Questionsask students if adults know who the local children are, make sure they are safe, and canbe trusted. High levels indicate that many students can turn to community resources forsupport.
TO CONSIDER: Compare students’ perception of their parents’ support to teachers’ reportsabout parent and school relations.
• What else could your school do to make it easier for parents to contact the school with theirconcerns and questions?
• What are some promising ideas for improving communication with parents about your school’sgoals?
• How can you draw on organizations and agencies in the community to support studentsmore? Could the LSC help with this?
16 Student-Centered Learning Climate: Safety and Order
System trendSchoolslike yours
Yourschool
Yourschool
Yourschool
Student-Centered Learning Climate:Safety and Order
Safety
Scales
on These
Low
Scales
on These
High
1994
1997
1999
2001
2003
StudentClassroom Behavior
1994
1997
1999
2001
2003
Incidenceof Disciplinary Action
Scales
on These
Low
Scales
on These
High
1994
1997
1999
2001
2003
Torvalds 17
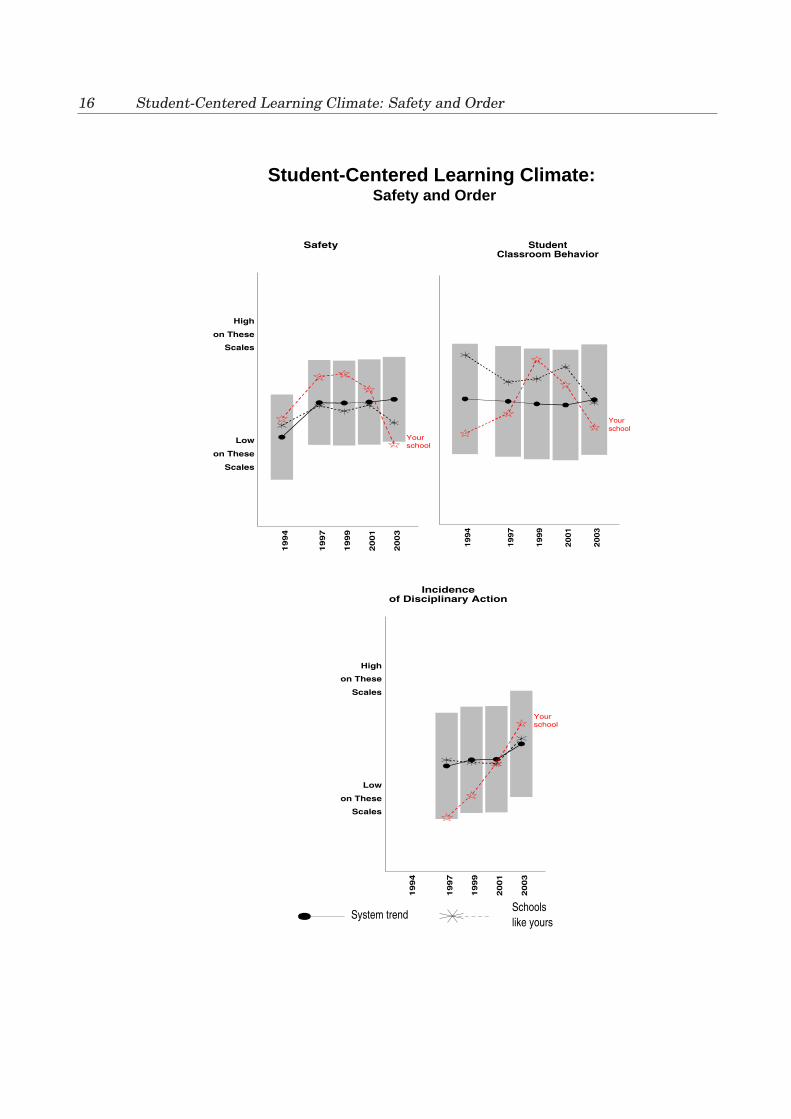
Safety (S) A reflection of students’ sense of personal safety inside the school, outside theschool, and traveling to and from school. High levels indicate that students feel very safein all these areas.
Student Classroom Behavior (S) Students’ assessment of their peers’ classroom behaviorwith regard to how they treat each other, how often they disrupt class, if they haverespect for each other, and if they help each other learn. High levels indicate that positivebehaviors are more prevalent and problem behaviors are less so.
Incidence of Disciplinary Action (S) A measure of how often students get into troubleand are disciplined. Questions ask students how many times they have been sent to theoffice or suspended, and how often their parents have been contacted about disciplineproblems. High levels indicate that students get into trouble frequently and often receivedisciplinary action. This is a negative scale; low levels are more desirable than highones.
TO CONSIDER: Good schools have a strong student-centered learning climate. Such schoolsare safe and orderly environments—an absolute prerequisite for student learning. Such schoolsare also very personal environments. Teachers know students by name. While teachers pressstudents toward ambitious academic work, they also provide considerable personal support tohelp all students attain these high goals. Similarly, students generally support each other in theiracademic work.
• Is there consensus among the faculty about standards for student behavior and are thesecommunicated consistently with students?
• Consider your school’s Academic Engagement measure (page 18). How does it comparewith the measures on this page?
18 Student-Centered Learning Climate: Involvement and Support
System trendSchoolslike yours
Yourschool Your
school
Yourschool
Student-Centered Learning Climate:Involvement and Support
Student-TeacherTrust
Scales
on These
Low
Scales
on These
High
1994
1997
1999
2001
2003
Academic Engagement
1994
1997
1999
2001
2003
Academic Press
Scales
on These
Low
Scales
on These
High
1994
1997
1999
2001
2003
Torvalds 19
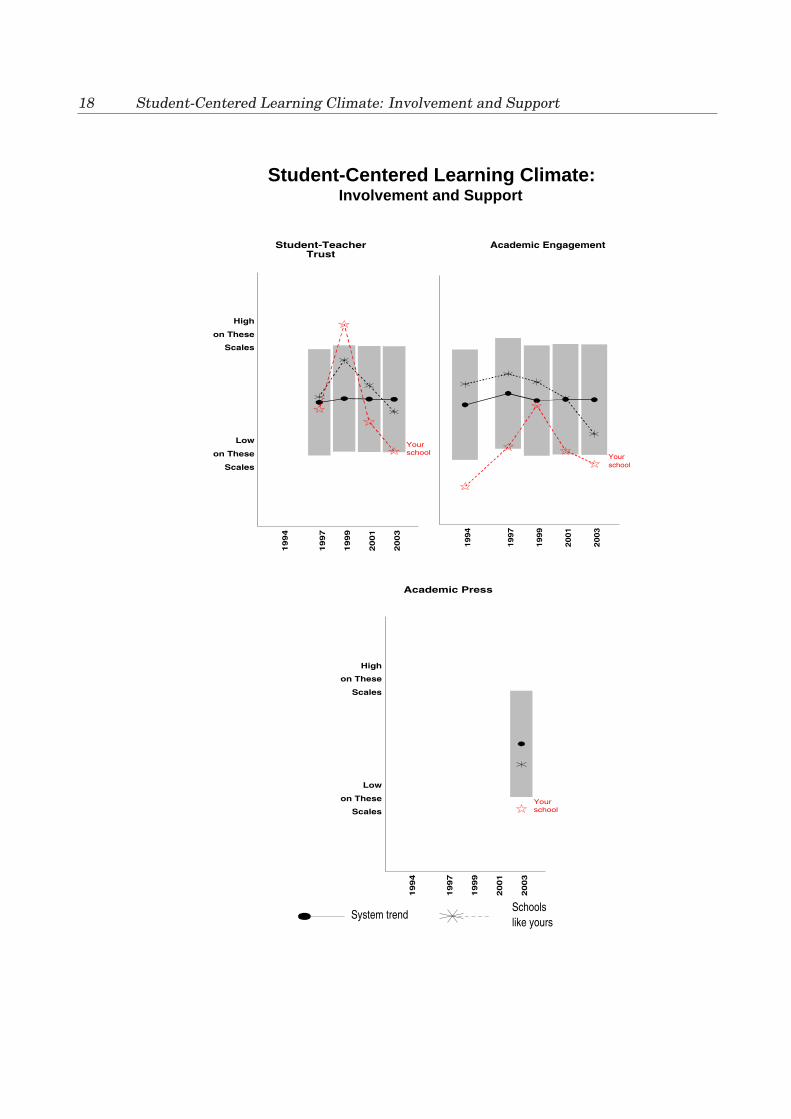
Student-Teacher Trust (S) Students’ perceptions about the quality of their relationshipswith teachers. Questions ask students if teachers care about them, keep promises, lis-ten to their ideas, and try to be fair. High levels indicate that there is trust and opencommunication between students and teachers.
Academic Engagement (S) Students’ reports about their interest and engagement in learn-ing. Questions ask about students’ interest in the topics they are studying and theirengagement in the classroom in general. High levels indicate that students are highlyengaged in learning.
Academic Press (S) Students’ views of their teachers’ efforts to push students to higher lev-els of academic performance. Students also report on teachers’ expectations of studenteffort and participation. High levels indicate that most teachers press all students towardacademic achievement.
TO CONSIDER: Student-Teacher Trust (page 18), Teacher-Parent Trust (page 12), Teacher-Principal Trust (page 10) and Teacher-Teacher Trust (page 22) are the social foundations for mean-ingful school development.11 How does your school measure up?
11See the Consortium report Social Trust: A Moral Resource for School Improvement (1996). and Bryk andSchneider (2002) Trust in Schools: A Core Resource for Improvement.
20 Professional Capacity: Professional Community
System trendSchoolslike yours
Yourschool
Yourschool
Yourschool
Yourschool
Professional Capacity:Professional Community
Peer Collaboration
Scales
on These
Low
Scales
on These
High
1994
1997
1999
2001
2003
Reflective Dialogue
1994
1997
1999
2001
2003
Collective Responsibility
Scales
on These
Low
Scales
on These
High
1994
1997
1999
2001
2003
Socializationof New Teachers
1994
1997
1999
2001
2003
Torvalds 21
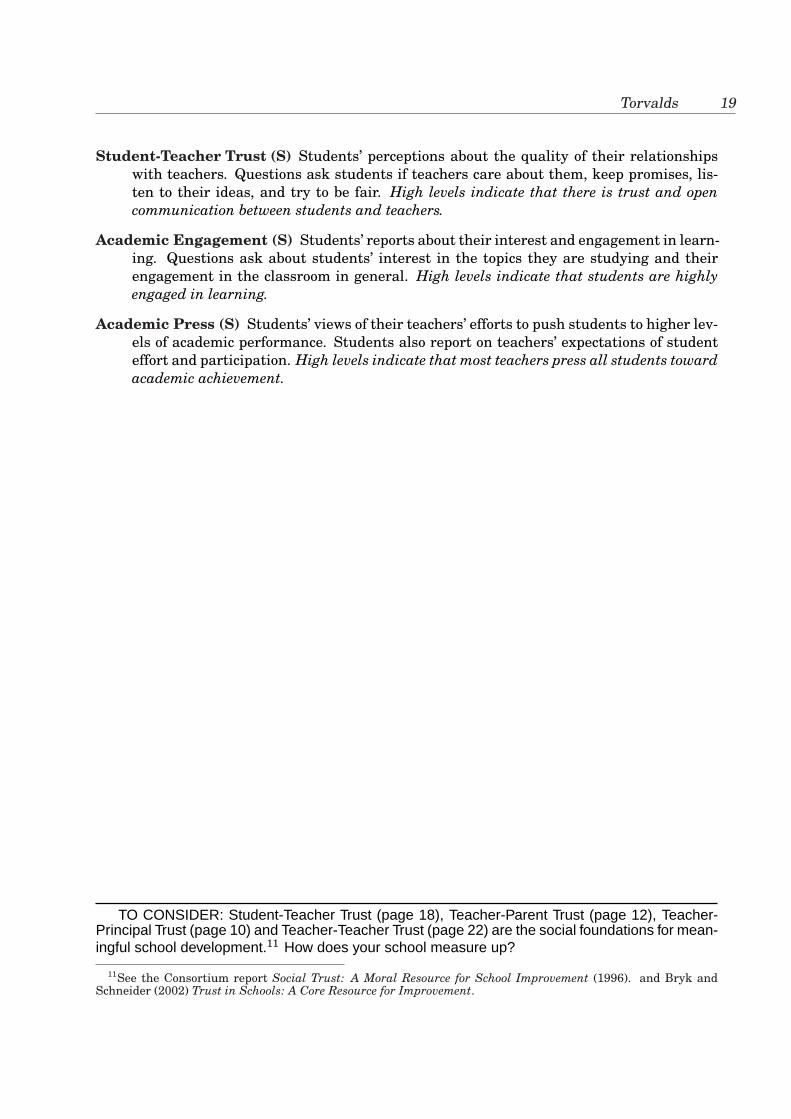
Peer Collaboration (T) Teachers’ reports about the level of cooperation and collaborationamong staff. Questions ask teachers about the quality of the relationships among fac-ulty, if staff coordinates teaching and learning across grades, and if teachers collaboratein their design of new instructional programs. High levels indicate that teachers havemoved beyond cordial relationships with their colleagues to ones in which they are ac-tively working together.
Reflective Dialogue (T) Teachers’ assessment of how often they talk with one another aboutinstruction and student learning. Questions ask teachers about their discussion of cur-riculum and instruction, the school’s goals, and the best ways to help students learnand manage classroom behavior. High levels indicate that teachers frequently discussinstruction and student learning.
Collective Responsibility (T) Teachers’ assessment of the strength of their shared commit-ment to improve the school so that all students learn. Questions ask teachers how manycolleagues feel responsible for students’ academic and social development, set high stan-dards for professional practice, and take responsibility for school improvement. Highlevels indicate a strong sense of shared responsibility among faculty.
Socialization of New Teachers (T) Teachers’ reports of the extent to which teachers aremade to feel welcome and are given helpful feedback on their instructional practices.High levels indicate strong, positive efforts to include new teachers in the professionalcommunity of the school.
TO CONSIDER: Teachers need support from colleagues in order to improve their practice.When a school is organized as a professional community, many opportunities exist for teachersto learn from one another, to plan and implement instructional initiatives together, and to supporteach other in the hard tasks of school improvement. At base, teachers in such schools share acollective responsibility for the learning of all students.
• When and how does your school make time for teachers to collaborate and talk with eachother about teaching and learning?
• What structures exist within grades, across grades, and schoolwide to promote such conver-sations?
• Would increased collaboration improve your school’s program coherence (page 10), and/ordeepen the trust among school community members?
22 Professional Capacity: Professional Workplace
System trendSchoolslike yours
Yourschool
Yourschool
Yourschool
Professional Capacity:Professional Workplace
School Commitment
Scales
on These
Low
Scales
on These
High
1994
1997
1999
2001
2003
Innovation
1994
1997
1999
2001
2003
Teacher-TeacherTrust
Scales
on These
Low
Scales
on These
High
1994
1997
1999
2001
2003
Torvalds 23
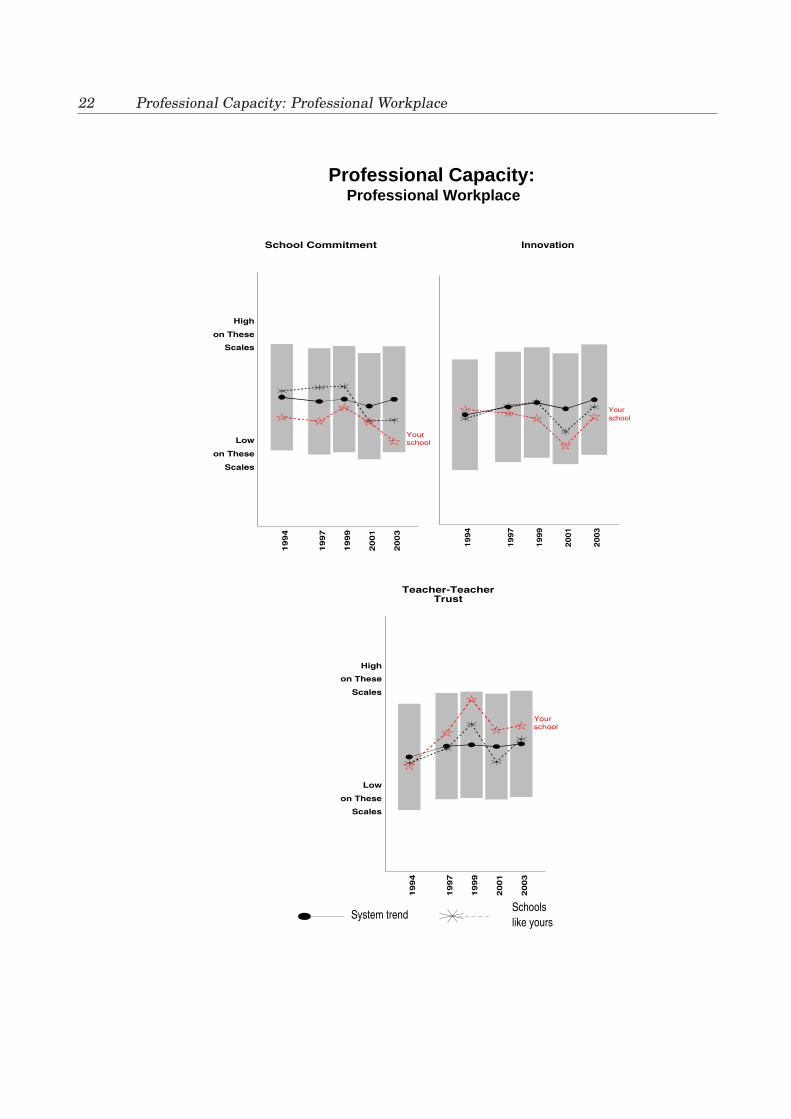
School Commitment (T) The extent to which teachers feel loyal and committed to the school.Questions ask teachers if they look forward to going to work, would rather work some-where else, and if they would recommend the school to parents. High levels indicateteachers are deeply committed to the school.
Innovation (T) Teachers’ perceptions of whether or not they are continually learning andseeking new ideas, have a “can do” attitude, and are encouraged to try new ideas in theirteaching. High levels indicate that there is a strong orientation toward improvement anda willingness to be part of an active learning environment.
Teacher-Teacher Trust (T) The extent to which teachers feel they have mutual respectfor each other, for those who lead school improvement efforts, and for those who areexperts at their craft. Questions also ask teachers if they feel comfortable discussingtheir feelings and worries and really care about each other. High levels indicate teacherstrust and respect each other.
TO CONSIDER: The nature of teachers’ underlying beliefs and values plays a key role ininstructional improvement. In improving schools, teachers maintain a “can do” attitude. Theybelieve that changes in their practice can result in enhanced student learning, and they share acommitment with colleagues to promote such changes.
Taken with the measures under Professional Community on page 20, use the measures onthis page to consider the following questions:
• Do the teachers here consider themselves a team?
• Are the teachers ready/willing to improve the school?
• Are there circumstances that undermine trust? And, if so, how can teachers resolve these?
24 Professional Capacity: Professional Development
System trendSchoolslike yours
Yourschool
Yourschool
Professional Capacity:Professional Development
Accessto New Ideas
Scales
on These
Low
Scales
on These
High
1994
1997
1999
2001
2003
Quality ProfessionalDevelopment
1994
1997
1999
2001
2003
Torvalds 25
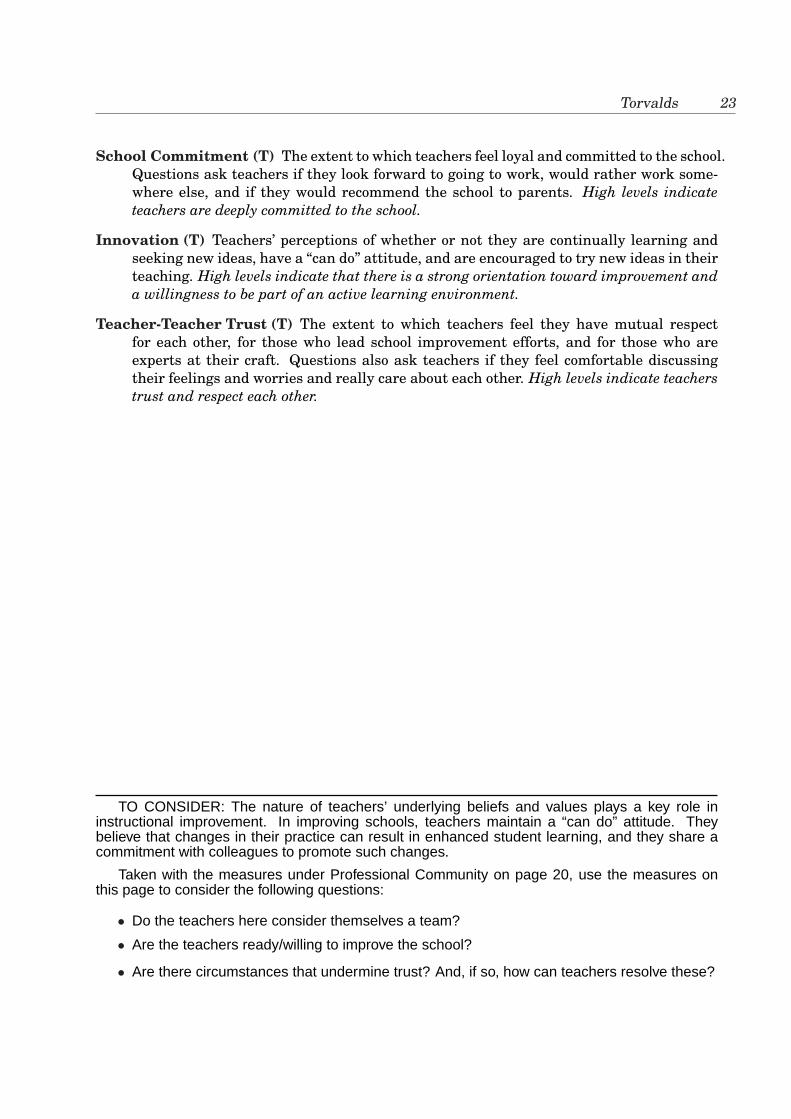
Access to New Ideas (T) The extent to which teachers participate in professional develop-ment. Questions ask teachers how often they attend professional development activitiessponsored by the school, district, or union; take continuing education courses at a collegeor university; and network with teachers from other schools. High levels indicate thatteachers are actively involved in professional development activities.
Quality Professional Development (T) Teachers’ assessment of the degree to which pro-fessional development has influenced their teaching, helped them understand studentsbetter, and provided them with opportunities to work with colleagues and teachers fromother schools. High levels indicate that teachers are involved in sustained professionaldevelopment focused on important school goals.
TO CONSIDER: Enhancing teachers’ knowledge and skills is arguably the single most impor-tant initiative schools can undertake to improve student learning.12
If your staff is poised to make real improvements in instruction, the necessary learning oppor-tunities must be in place for teachers. The measures on this page will help you assess if newinstruction initiatives have a greater likelihood of being implemented well.
12See the Consortium’s report Teacher Professional Development in Chicago: Supporting Professional Practice(2001).
26 Support for Technology Integration in Schools
System trendSchoolslike yours
Yourschool
Yourschool
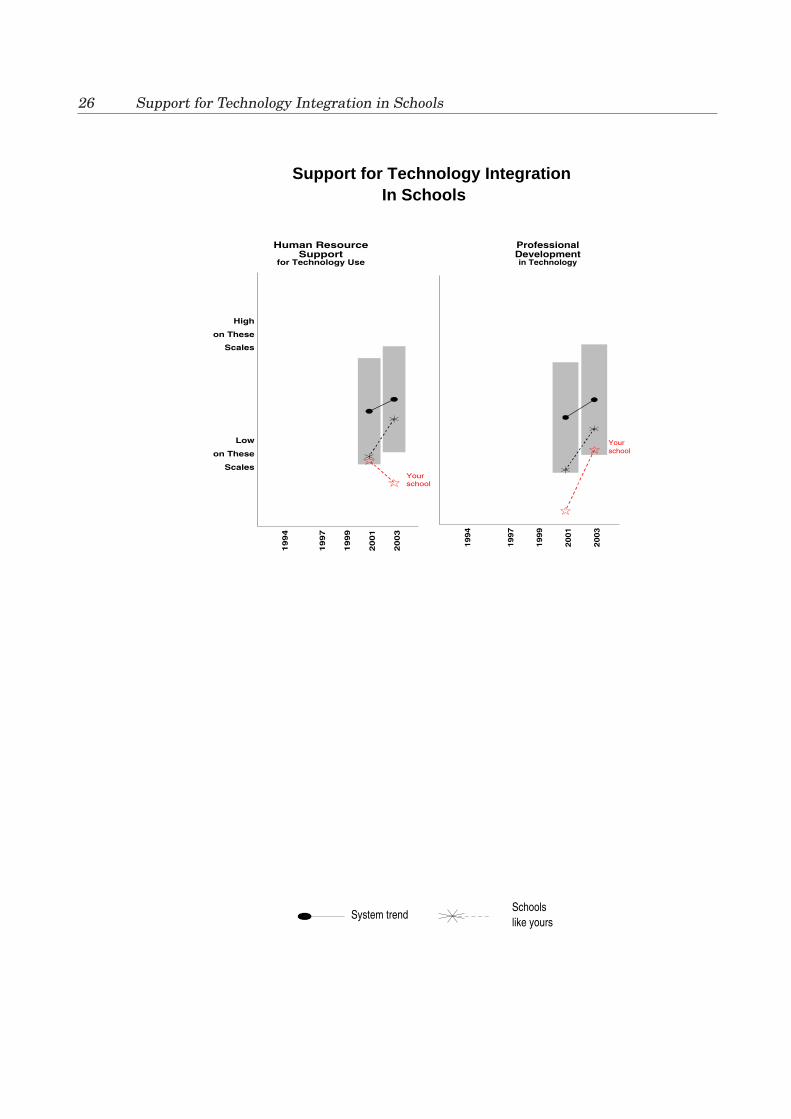
Support for Technology IntegrationIn Schools
Human ResourceSupport
for Technology Use
Scales
on These
Low
Scales
on These
High
1994
1997
1999
2001
2003
ProfessionalDevelopmentin Technology
1994
1997
1999
2001
2003
Torvalds 27
Human Resource Support for Technology Use (T) Teachers’ reports about the amountof support they receive for using technology as a teaching tool. Support here meansaccess to a technology coordinator, assistance with curriculum integration, and hardwarein good working order.
Professional Development in Technology (T) Teachers’ assessment of their awarenessof and participation in professional development activities designed to integrate tech-nology in the classroom. High levels indicate that teachers are able to find and takeadvantage of such professional development.
TO CONSIDER: Technology has changed virtually every workplace, except schools. Now, itis beginning to happen here too. The meaningful integration of technology into the work lives ofstudents and teachers requires extensive support. Schools need to be wired, computers need tobe purchased, Internet access assured. Many teachers need collegial support and professionaldevelopment in order to learn how to use these new resources well in their classrooms. Withoutthese developments, the school will likely remain digitally divided.
• How do the data on your school’s support for technology integration relate to students’ andteachers’ reports about the availability and use of technology found on the next page?
28 Availability and Use of Technology in the Classroom
System trendSchoolslike yours
Yourschool
Yourschool
Yourschool
Yourschool
Yourschool
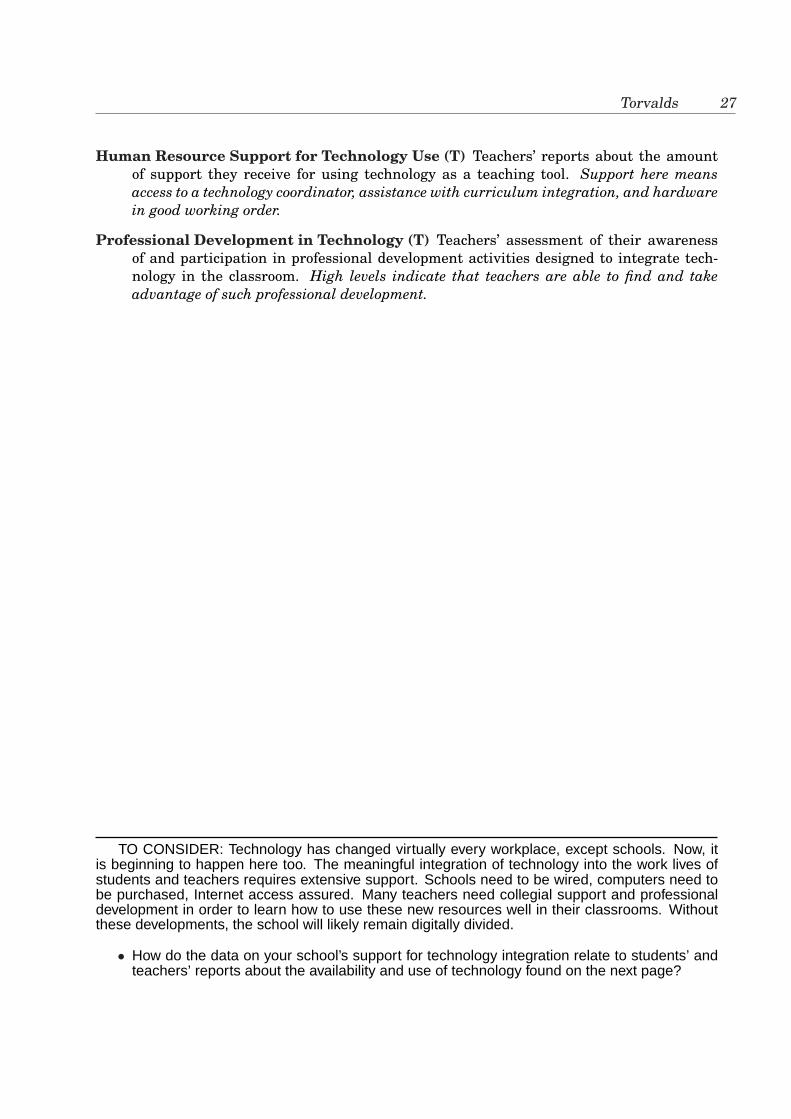
Availability and Use of Technologyin the Classroom
Accessto ComputersStudent Reports
Scales
on These
Low
Scales
on These
High
1994
1997
1999
2001
2003
Availabilityof TechnologyTeacher Reports
1994
1997
1999
2001
2003
Teacher Useof Technology
1994
1997
1999
2001
2003
Student Useof TechnologyTeacher Reports
Scales
on These
Low
Scales
on These
High
1994
1997
1999
2001
2003
Student Useof TechnologyStudent Reports
1994
1997
1999
2001
2003
Torvalds 29
Access to Computers (S) Students’ reports about the extent to which computer hardwareis available to them. High levels indicate greater access by students to computers.
Availability of Technology (T) Teachers’ reports about the extent to which they are able touse technology, including computers, the Internet, and email in their classrooms. Highlevels indicate more extensive availability of technology for teachers.
Teacher Use of Technology (T) Teachers’ assessment of how often they use technology intheir own work. Possible uses include creating instructional materials, accessing modellesson plans, and creating multimedia presentations. High levels indicate more frequentand diverse use among teachers.
Student Use of Technology (T) Teachers’ assessment of how often they incorporate tech-nology into their assignments. Possible uses include practice drills, word processing,creating presentations, and research on the Internet. High levels indicate more frequentand diverse use among students.
Student Use of Technology (S) Students’ reports about their use of technology at schoolfor a variety of purposes such as practice drills, word processing, research on the In-ternet, and creating presentations. High levels indicate more frequent and diverse useamong students in school.
30 For Further Reading
For Further Reading
Leadership
Blase, Joseph (Ed.). (1995). Democratic Principals in Action: Eight Pioneers. Thousand Oaks,CA: Corwin Press, Inc.
Bolman, Lee G. and Terrance E. Deal. (1997). Reframing Organization: Artistry, Choice, andLeadership. 2d ed. San Francisco: Jossey-Bass.
Donaldson, Gordan A. (2001). Cultivating Leadership in Schools: Connecting People, Purpose,and Practice. New York: Teachers’ College Press.
Schumaker, David R., and William A. Sommers. (2001). Being a Successful Principal. Thou-sand Oaks, CA: Corwin Press.
Sebring, Penny Bender and Anthony S. Bryk. (2000). School Leadership and the Bottom Linein Chicago. Chicago: Consortium on Chicago School Research.
Parent and Community Involvement
Epstein, Joyce (Ed.), Lucretia Salinas, Karen Clark Sanders, Mavis G. Sanders, and BethS. Simon. (1997). School, Family and Community Partnerships: Your Handbook forAction. Thousand Oaks, CA: Corwin.
Roderick, Melissa, Susan Stone, Michael Arney, James Chiong, Kneia DaCosta, and ElaineWaxman. (1998). Changing Standards, Changing Relationships: Building Family-School Relationships to Promote Achievement in High Schools. Chicago: Consortiumon Chicago School Research.
Learning Environments
Lee, Valerie E., Julia B. Smith, Tamara E. Perry, and Mark A. Smylie. (1999). Social Sup-port, Academic Press, and Student Achievement: A View from the Middle Grades inChicago. Chicago: Consortium on Chicago School Research.
Sebring, Penny Bender, Anthony S. Bryk, Melissa Roderick, Eric Camburn, Stuart Luppescu,Yeow Meng Thum, BetsAnn Smith, and Joseph Kahne. (1996). Charting Reform inChicago: The Students Speak. Chicago: Consortium on Chicago School Research.
Professional Community and Professional Development
Deal, Terrance E. and Kent D. Peterson. (1998). Shaping School Culture: The Heart of Lead-ership. San Francisco: Jossey-Bass.
DuFour, Richard and Robert Eaker. (1998). Professional Learning Communities at Work.Bloomington, IN: National Education Service.
Torvalds 31
Hansen, David T. (1995). The Call to Teach. New York: Teachers College Press.
Katzenmeyer, Marilyn and Gayle Moller. (2001). Awakening the Sleeping Giant: HelpingTeachers Develop as Leaders. Thousand Oaks, CA: Corwin Press.
McLaughlin, Milbrey W. and Joan E. Talbert. (2001). Professional Communities and the Workof High School Teaching. Chicago: University of Chicago Press.
Seashore Louis, Karen, Sharon Kruse, and Associates. (1995). Professionalism and Commu-nity: Perspectives on Reforming Urban Schools. Thousand Oaks, CA: Corwin Press,Inc.
Smylie, Mark A., Elaine Allensworth, Rebecca C. Greenberg, Rodney Harris, and Stuart Lup-pescu. (2001). Teacher Professional Development in Chicago: Supporting EffectivePractice. Chicago: Consortium on Chicago School Research.
Quality Instruction
Ladson-Billings, Gloria. (1994). The Dreamkeepers: Successful Teachers of African AmericanStudents. San Francisco: Jossey-Bass.
Newmann, Fred M. and Associates (Eds.). (1996). Authentic Achievement: RestructuringSchools for Intellectual Quality. San Francisco: Jossey Bass.
Newmann, Fred M., Gudelia Lopez, and Anthony S. Bryk. (1998). The Quality of IntellectualWork in Chicago Schools: A Baseline Report. Chicago: Consortium on Chicago SchoolResearch.
Newmann, Fred M., Anthony S. Bryk, and Jenny K. Nagaoka. (2001). Authentic Intellec-tual Work and Standardized Tests: Conflict or Coexistence? Chicago: Consortium onChicago School Research.
North Central Regional Educational Laboratory. Pathways to School Improvement.www.ncrel.org/sdrs/.
Smith, BetsAnn. (1998). It’s About Time: Opportunities to Learn in Chicago’s ElementarySchools. Chicago: Consortium on Chicago School Research.
Smith, Julia B. and Anthony S. Bryk. (1998). Setting the Pace: Opportunities to Learn inChicago’s Elementary Schools. Chicago: Consortium on Chicago School Research.
Smith, Julia B., Valerie E. Lee, and Fred M. Newmann. (2001). Instruction and Achievementin Chicago Elementary Schools. Chicago: Consortium on Chicago School Research.
Talbert, Joan E., David Cohen, and Milbrey McLaughlin (Eds). (1993). Teaching for Under-standing: Challenges for Policy and Practice. San Francisco: Jossey Bass.
Technology Use and Integration
32 For Further Reading
Grabe, Mark and Cindy Grabe. (1998). Integrating Technology for Meaningful Learning.Boston: Houghton Mifflin Co.
Hart, Holly, Elaine Allensworth, Douglas L. Lauen and Robert M. Gladden. (2002). Ed-ucational Technology: Availability and Use in Chicago’s Public Schools. Chicago:Consortium on Chicago School Research.
McKenzie, Jamie. (2001). Planning Good Change With Technology and Learning. Belling-ham, WA: From Now On Press.
Leu, Donald J. and Deborah Diandiun Leu. (2000). Teaching With the Internet: Lessons fromthe Classroom. 3d ed. Norwood, MA: Christopher-Gordon Publishers.
Means, Barbara, William R. Penuel, and Christina Padilla. (2001). The Connected School:Technology and Learning in High School. San Francisco: John Wiley and Sons.
Northwest Educational Technology Consortium. Classrooms@Work/[email protected]/classrooms@work/index.html.
Whole School Change
Bryk, Anthony S., Penny Bender Sebring, David Kerbow, Sharon G. Rollow, and John Q.Easton. (1995). Charting Chicago School Reform: Democratic Localism as a Lever forChange. Boulder, CO: Westview Press.
Bryk, Anthony S. and Barbara Schneider. (1996). Social Trust: A Moral Resource for SchoolImprovement. Chicago: Consortium on Chicago School Research.
Bryk, Anthony S. and Barbara Schneider. (2002). Trust in Schools: A Core Resource forImprovement. New York: Russell Sage Foundation.
Darling-Hammond, L. (1997). The Right to Learn: A Blueprint for Creating Schools that Work.San Francisco: Jossey-Bass.
Fullen, Michael. (2001). Leading in a Culture of Change. San Francisco: Jossey-Bass.
Newmann, Fred M., BetsAnn Smith, Elaine Allensworth, and Anthony S. Bryk. (2001).School Instructional Program Coherence: Benefits and Challenges. Chicago: Con-sortium on Chicago School Research.
Schlechty, Phillip. (2000). Shaking Up the School House: How to Support and Sustain Edu-cational Innovation. San Francisco: Jossey-Bass.
To order any Consortium reports, please visit the Consortium websiteat www.consortium-chicago.org, or call 773/834-2499.


Steering CommitteeJohn Ayers, Co-Chair
Leadership for Quality EducationVictoria Chou, Co-Chair
University of Illinois at ChicagoInstitutional Members
Chicago Principals and AdministratorsAssociationClarice Berry
Chicago Public SchoolsChristy Harris
for the Chicago Board of EducationBarbara Eason-Watkins
for the Chief Executive OfficerDan Bugler
Office ofResearch, Evaluation and Accountability
Academic Accountability CouncilVacant
Chicago Teachers UnionDebby Pope
Illinois State Board of EducationConnie Wise
for the SuperintendentIndividual Members
Gina BurkhardtLearning Point Associates
Louis M. GomezNorthwestern University
G. Alfred Hess, Jr.Northwestern University
Janet KnuppChicago Public Education Fund
James LewisRoosevelt UniversityRachel W. Lindsey
Chicago State UniversityGeorge Lowery
Roosevelt UniversityAngela Perez Miller
Donald R. MooreDesigns for Change
Sharon RansomUniversity of Illinois at Chicago
Barbara A. SizemoreDePaul University
James SpillaneNorthwestern University
Steve ZemelmanLeadership for Quality Education
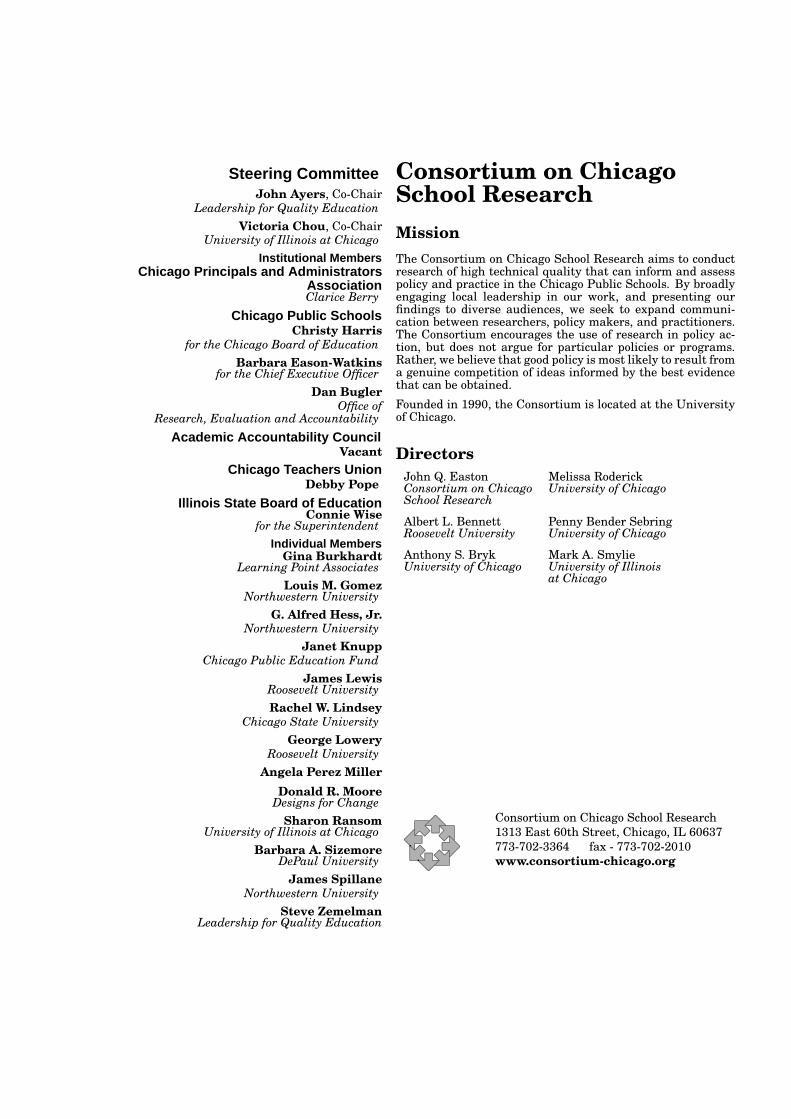
Consortium on ChicagoSchool ResearchMissionThe Consortium on Chicago School Research aims to conductresearch of high technical quality that can inform and assesspolicy and practice in the Chicago Public Schools. By broadlyengaging local leadership in our work, and presenting ourfindings to diverse audiences, we seek to expand communi-cation between researchers, policy makers, and practitioners.The Consortium encourages the use of research in policy ac-tion, but does not argue for particular policies or programs.Rather, we believe that good policy is most likely to result froma genuine competition of ideas informed by the best evidencethat can be obtained.
Founded in 1990, the Consortium is located at the Universityof Chicago.
DirectorsJohn Q. Easton Melissa RoderickConsortium on Chicago University of ChicagoSchool Research
Albert L. Bennett Penny Bender SebringRoosevelt University University of Chicago
Anthony S. Bryk Mark A. SmylieUniversity of Chicago University of Illinois
at Chicago
Consortium on Chicago School Research1313 East 60th Street, Chicago, IL 60637773-702-3364 fax - 773-702-2010www.consortium-chicago.org