Embed Size (px)
Citation preview
TORSIONAL IRREGULARITY IN
MULTI-STORY STRUCTURES
Günay Özmen Konuralp Girgin Yavuz Durgun
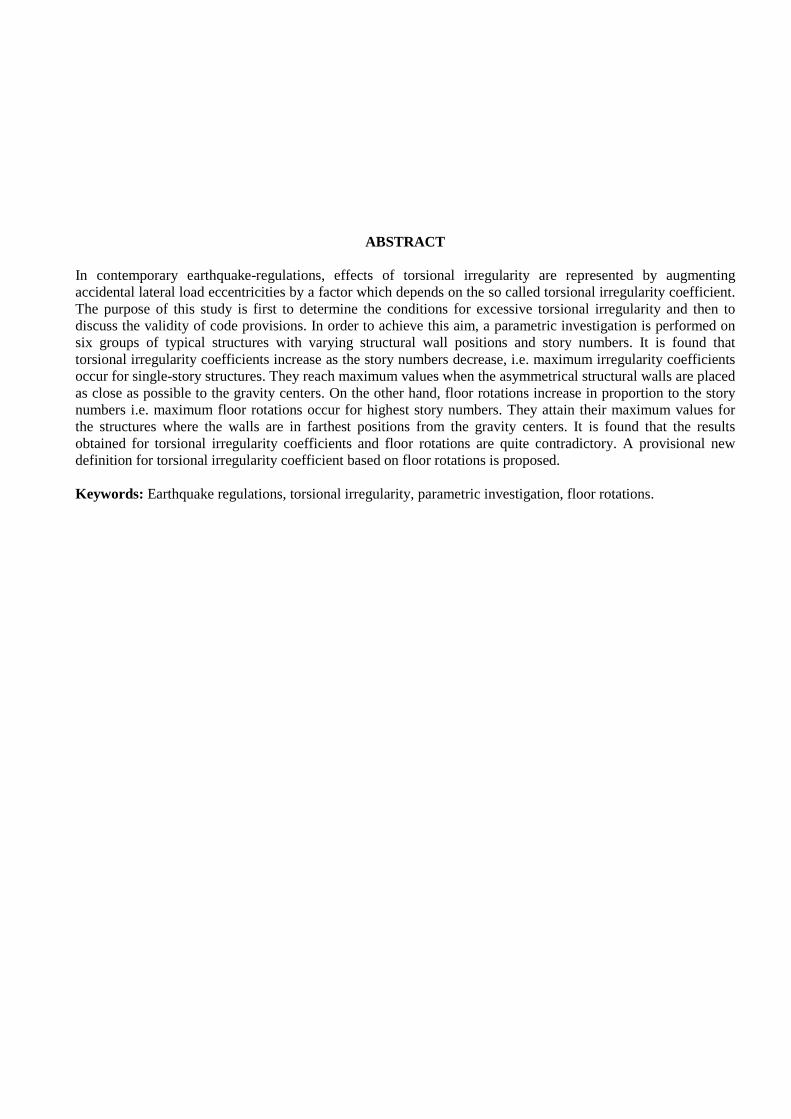
ABSTRACT In contemporary earthquake-regulations, effects of torsional irregularity are represented by augmenting accidental lateral load eccentricities by a factor which depends on the so called torsional irregularity coefficient. The purpose of this study is first to determine the conditions for excessive torsional irregularity and then to discuss the validity of code provisions. In order to achieve this aim, a parametric investigation is performed on six groups of typical structures with varying structural wall positions and story numbers. It is found that torsional irregularity coefficients increase as the story numbers decrease, i.e. maximum irregularity coefficients occur for single-story structures. They reach maximum values when the asymmetrical structural walls are placed as close as possible to the gravity centers. On the other hand, floor rotations increase in proportion to the story numbers i.e. maximum floor rotations occur for highest story numbers. They attain their maximum values for the structures where the walls are in farthest positions from the gravity centers. It is found that the results obtained for torsional irregularity coefficients and floor rotations are quite contradictory. A provisional new definition for torsional irregularity coefficient based on floor rotations is proposed. Keywords: Earthquake regulations, torsional irregularity, parametric investigation, floor rotations.
CONTENTS
Page No.
1. INTRODUCTION …………………………………………………………………………… 1
2. CODE PROVISIONS FOR TORSIONAL IRREGULARITY ……………………. 2
3. TYPICAL STRUCTURES ....................................................................................... .............. 3
4. INVESTIGATION OF TORSIONAL IRREGULARITY COEFFICIENT ………….. 7 4.1. STRUCTURE GROUP WİTH FIVE AXES ...........................................………. 7 4.1.1. Structures Type A with Five Axes ..................................................………. 10 4.1.2. All Structure Types with Five Axes ...............................................………. 11 4.2. STRUCTURE GROUP WİTH SIX AXES ..............................................………. 13 4.2.1. Structures Type A with Six Axes ....................................................………. 15 4.2.2. All Structure Types with Six Axes .................................................………. 17 4.3. STRUCTURE GROUP WİTH SEVEN AXES .......................................………. 18 4.3.1. Structures Type A with Seven Axes ...............................................………. 20 4.3.2. All Structure Types with Seven Axes ............................................………. 22 4.4 GENERAL EVALUATION .................................................................................. 22
5. INVESTIGATION OF FLOOR ROTATIONS ................................................ .............. 25 5.1. STRUCTURE GROUP WİTH FIVE AXES ...........................................………. 25 5.1.1. All Structure Types with Five Axes ...............................................………. 26 5.2. STRUCTURE GROUP WİTH SIX AXES ..............................................………. 28 5.2.1. All Structure Types with Six Axes .................................................………. 29 5.3. STRUCTURE GROUP WİTH SEVEN AXES .......................................………. 31 5.3.1. All Structure Types with Seven Axes ............................................………. 32 5.4 GENERAL EVALUATION .................................................................................. 34
6. A NEW TORSIONAL IRREGULARITY DEFINITION PROPOSAL ..................... 36
7. CONCLUSIONS ...................................................................................................... .............. 36
8. REFERENCES ......................................................................................................................... 37
1
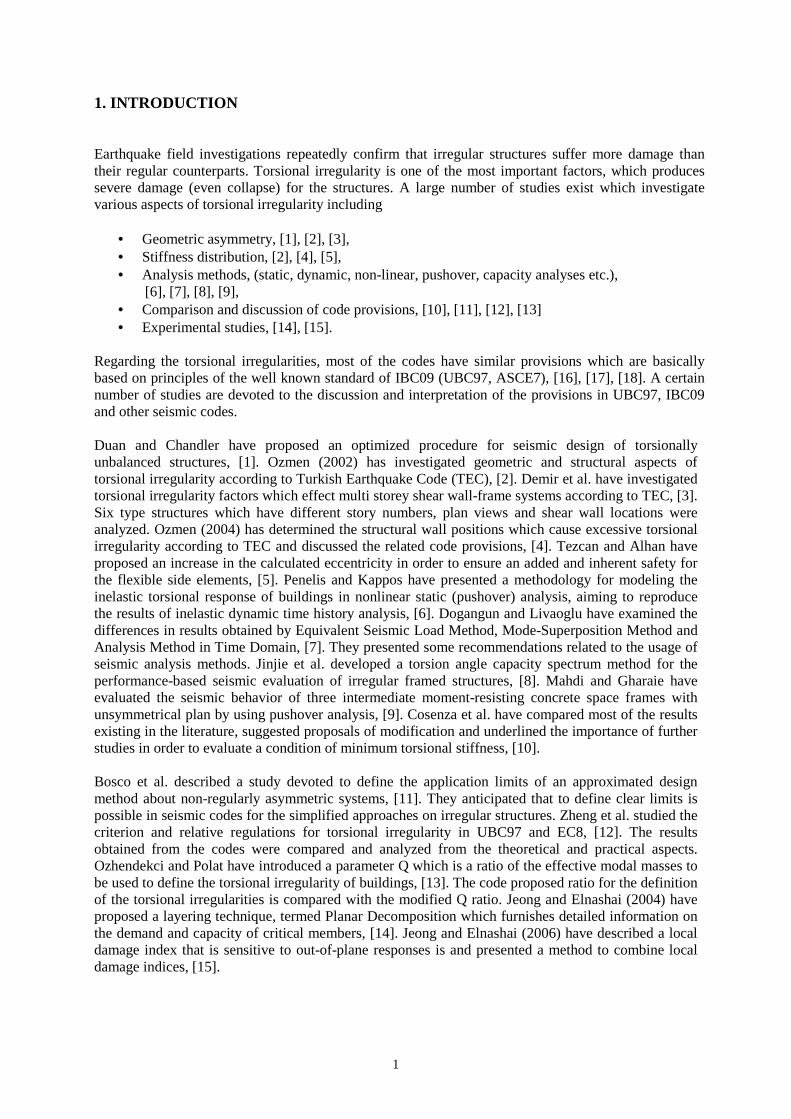
1. INTRODUCTION Earthquake field investigations repeatedly confirm that irregular structures suffer more damage than their regular counterparts. Torsional irregularity is one of the most important factors, which produces severe damage (even collapse) for the structures. A large number of studies exist which investigate various aspects of torsional irregularity including
• Geometric asymmetry, [1], [2], [3], • Stiffness distribution, [2], [4], [5], • Analysis methods, (static, dynamic, non-linear, pushover, capacity analyses etc.),
[6], [7], [8], [9], • Comparison and discussion of code provisions, [10], [11], [12], [13] • Experimental studies, [14], [15].
Regarding the torsional irregularities, most of the codes have similar provisions which are basically based on principles of the well known standard of IBC09 (UBC97, ASCE7), [16], [17], [18]. A certain number of studies are devoted to the discussion and interpretation of the provisions in UBC97, IBC09 and other seismic codes. Duan and Chandler have proposed an optimized procedure for seismic design of torsionally unbalanced structures, [1]. Ozmen (2002) has investigated geometric and structural aspects of torsional irregularity according to Turkish Earthquake Code (TEC), [2]. Demir et al. have investigated torsional irregularity factors which effect multi storey shear wall-frame systems according to TEC, [3]. Six type structures which have different story numbers, plan views and shear wall locations were analyzed. Ozmen (2004) has determined the structural wall positions which cause excessive torsional irregularity according to TEC and discussed the related code provisions, [4]. Tezcan and Alhan have proposed an increase in the calculated eccentricity in order to ensure an added and inherent safety for the flexible side elements, [5]. Penelis and Kappos have presented a methodology for modeling the inelastic torsional response of buildings in nonlinear static (pushover) analysis, aiming to reproduce the results of inelastic dynamic time history analysis, [6]. Dogangun and Livaoglu have examined the differences in results obtained by Equivalent Seismic Load Method, Mode-Superposition Method and Analysis Method in Time Domain, [7]. They presented some recommendations related to the usage of seismic analysis methods. Jinjie et al. developed a torsion angle capacity spectrum method for the performance-based seismic evaluation of irregular framed structures, [8]. Mahdi and Gharaie have evaluated the seismic behavior of three intermediate moment-resisting concrete space frames with unsymmetrical plan by using pushover analysis, [9]. Cosenza et al. have compared most of the results existing in the literature, suggested proposals of modification and underlined the importance of further studies in order to evaluate a condition of minimum torsional stiffness, [10]. Bosco et al. described a study devoted to define the application limits of an approximated design method about non-regularly asymmetric systems, [11]. They anticipated that to define clear limits is possible in seismic codes for the simplified approaches on irregular structures. Zheng et al. studied the criterion and relative regulations for torsional irregularity in UBC97 and EC8, [12]. The results obtained from the codes were compared and analyzed from the theoretical and practical aspects. Ozhendekci and Polat have introduced a parameter Q which is a ratio of the effective modal masses to be used to define the torsional irregularity of buildings, [13]. The code proposed ratio for the definition of the torsional irregularities is compared with the modified Q ratio. Jeong and Elnashai (2004) have proposed a layering technique, termed Planar Decomposition which furnishes detailed information on the demand and capacity of critical members, [14]. Jeong and Elnashai (2006) have described a local damage index that is sensitive to out-of-plane responses is and presented a method to combine local damage indices, [15].
2
Torsional irregularity which is recognized in most of the seismic design codes, varies depending on a number of factors including
• Plan geometry, • Dimensions and positions of structural elements, • Story numbers.
The purpose of this study is first to determine the conditions for excessive torsional irregularity and then to discuss the validity of code provisions. In order to achieve this aim, a parametric investigation is performed on six groups of “Typical structures” with varying structural wall positions and story numbers. Number of axes of typical structure groups is varied between 5, 6 and 7 while story numbers are chosen as 1, 2, 4, 6, 8 and 10. All the structures are chosen as symmetrical in plan with respect to horizontal axis X. Hence, the behavior of structures will be examined only for the lateral loading in vertical Y direction only. 2. CODE PROVISIONS FOR TORSIONAL IRREGULARITY The provisions of IBC09 regarding the torsional irregularities are summarized in the following, [15]. Here the accidental lateral load eccentricities of ±5% are amplified by the amplification factor
2
avg
maxx
δ2.1
δA
= (2.1)
where δmax = the maximum displacement at Level x computed assuming Ax = 1, δavg = the average of the displacements at the extreme points of the structure at Level x computed
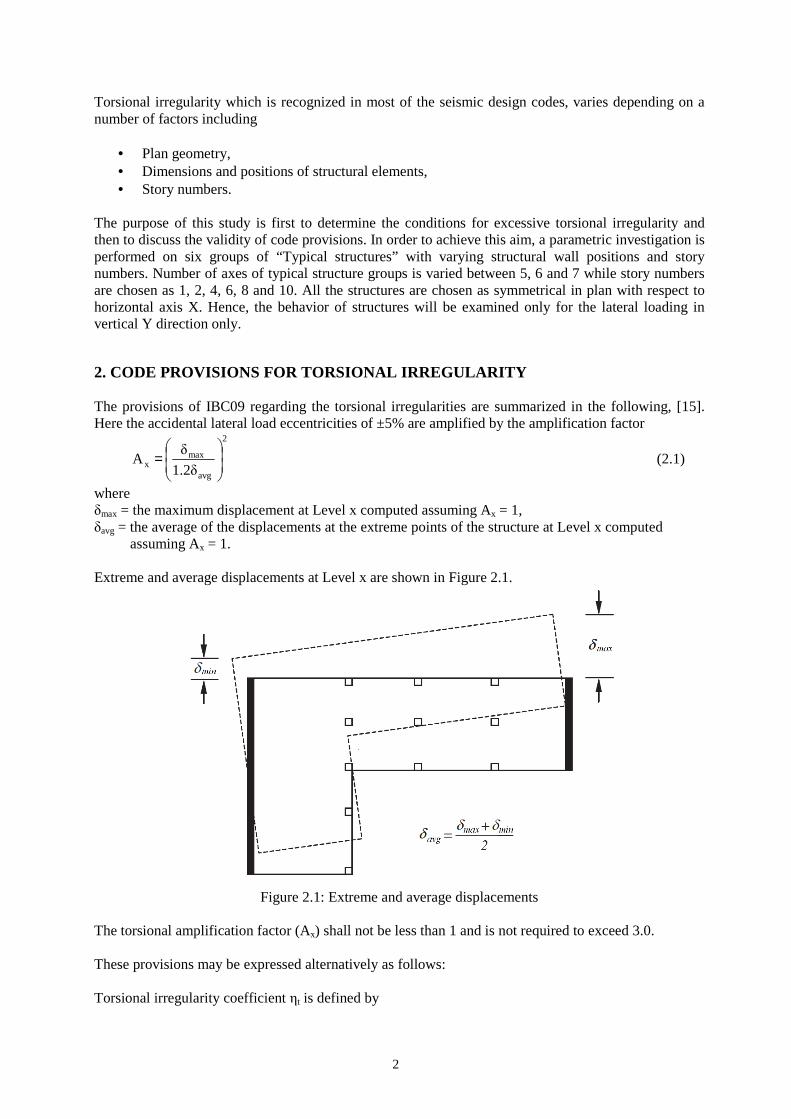
assuming Ax = 1. Extreme and average displacements at Level x are shown in Figure 2.1.
Figure 2.1: Extreme and average displacements
The torsional amplification factor (Ax) shall not be less than 1 and is not required to exceed 3.0. These provisions may be expressed alternatively as follows: Torsional irregularity coefficient ηt is defined by
3
avg
maxtδ
δη = . (2.2)
Then a) If 2.1η t ≤ then torsional irregularity does not exist, i.e. Ax = 1;
b) If 083.2η2.1 t ≤< then torsional irregularity exists and eccentricity amplification factor is computed by
2
tx 2.1
ηA
= ; (2.3)
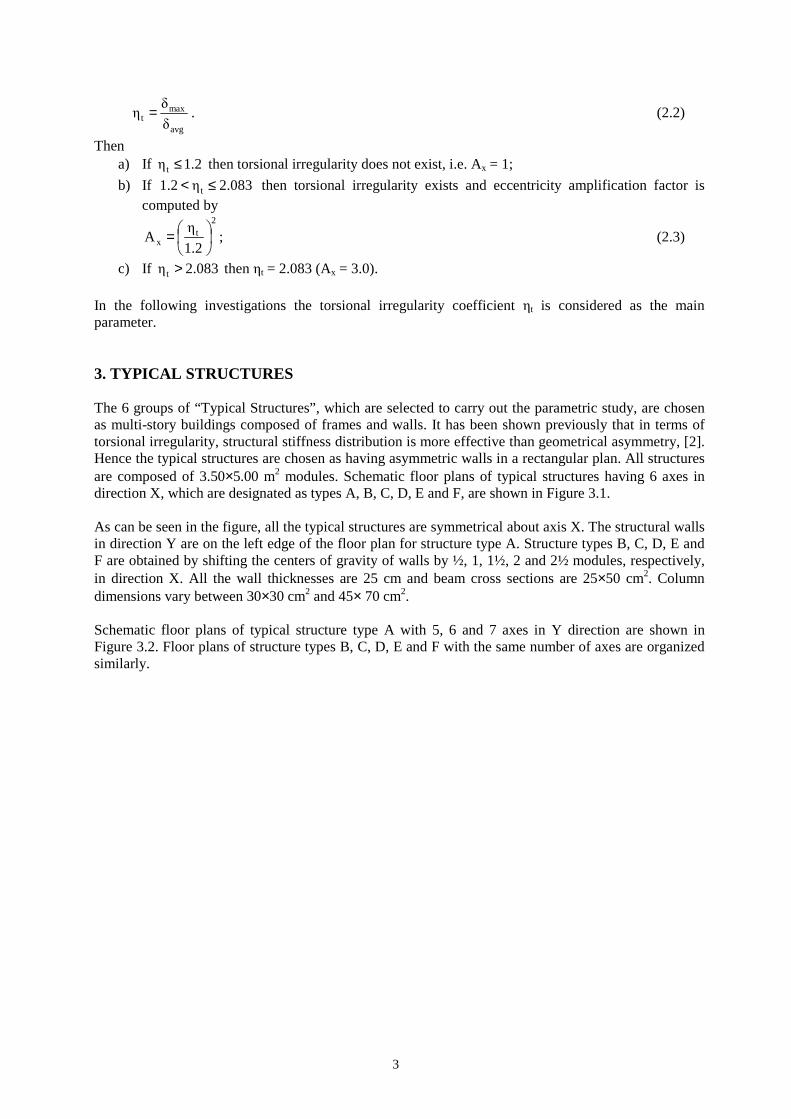
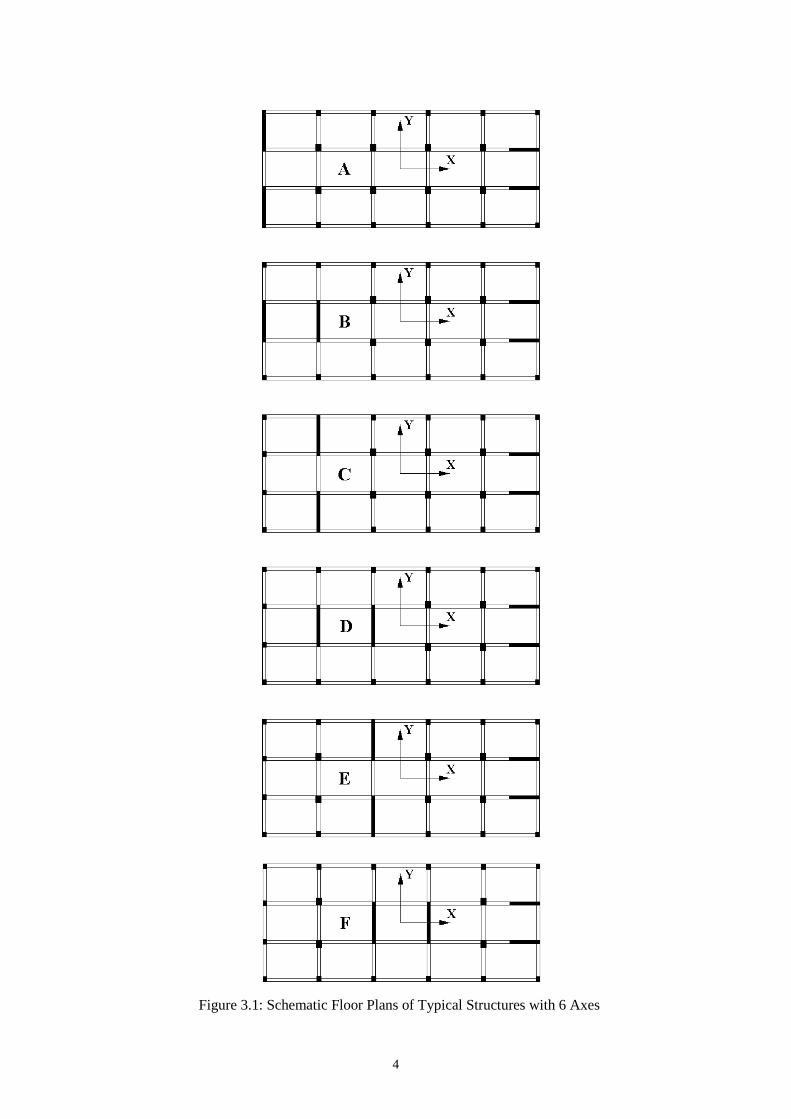
c) If 083.2η t > then ηt = 2.083 (Ax = 3.0). In the following investigations the torsional irregularity coefficient ηt is considered as the main parameter. 3. TYPICAL STRUCTURES The 6 groups of “Typical Structures”, which are selected to carry out the parametric study, are chosen as multi-story buildings composed of frames and walls. It has been shown previously that in terms of torsional irregularity, structural stiffness distribution is more effective than geometrical asymmetry, [2]. Hence the typical structures are chosen as having asymmetric walls in a rectangular plan. All structures are composed of 3.50×5.00 m2 modules. Schematic floor plans of typical structures having 6 axes in direction X, which are designated as types A, B, C, D, E and F, are shown in Figure 3.1. As can be seen in the figure, all the typical structures are symmetrical about axis X. The structural walls in direction Y are on the left edge of the floor plan for structure type A. Structure types B, C, D, E and F are obtained by shifting the centers of gravity of walls by ½, 1, 1½, 2 and 2½ modules, respectively, in direction X. All the wall thicknesses are 25 cm and beam cross sections are 25×50 cm2. Column dimensions vary between 30×30 cm2 and 45× 70 cm2. Schematic floor plans of typical structure type A with 5, 6 and 7 axes in Y direction are shown in Figure 3.2. Floor plans of structure types B, C, D, E and F with the same number of axes are organized similarly.
4
Figure 3.1: Schematic Floor Plans of Typical Structures with 6 Axes
5
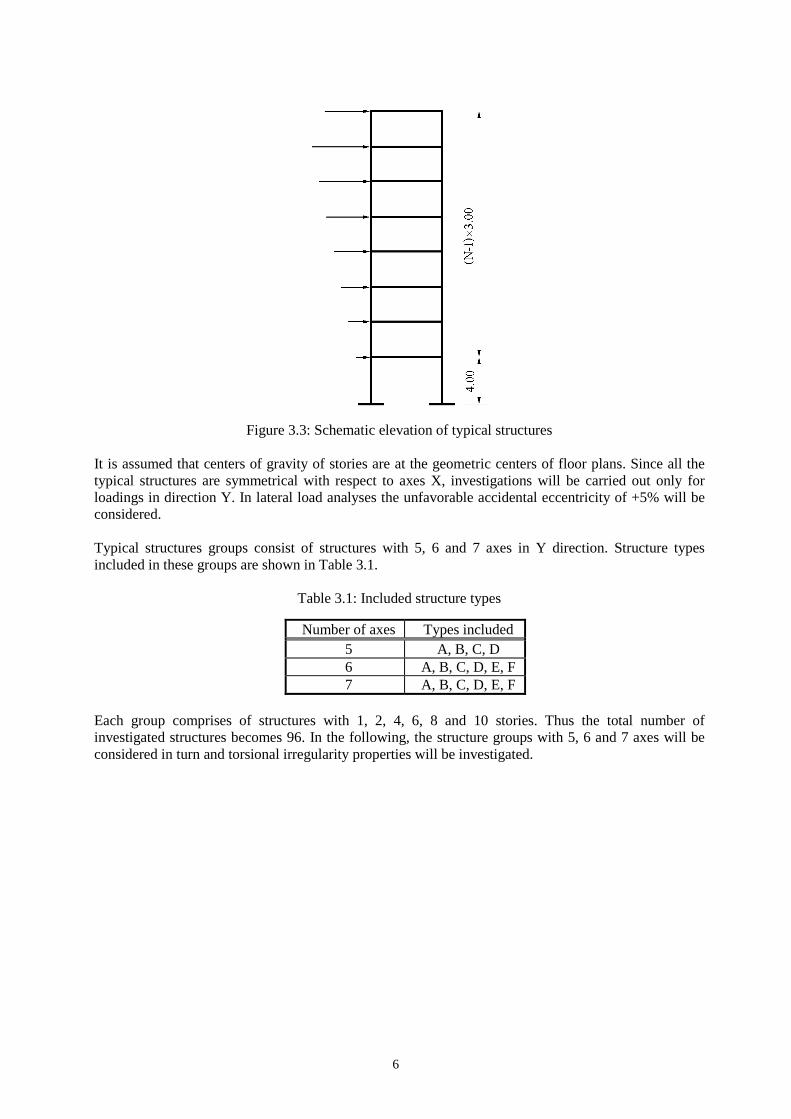
Figure 3.2: Schematic floor plans of structure type A with 5, 6 and 7 axes The parametric studies of this study are independent of the magnitude of seismic forces that affect the structure. However, since it is aimed to obtain realistic results, the dimensions of the structural elements are determined by using a preliminary design process. Seismic parameters used in the analyses and designs of typical structures are as follows: MCE Spectral Acceleration Parameters SMS = 0.75g SM1 = 0.33g Site Coefficients Fa = 1 Fv = 1 Importance Factor I = 1 Response Modification Coefficient R = 7 Schematic elevation of typical structures is shown in Figure 3.3. Story heights for all the typical structures are 4.00 m for lowermost story and 3.00 m for upper stories.
6
Figure 3.3: Schematic elevation of typical structures
It is assumed that centers of gravity of stories are at the geometric centers of floor plans. Since all the typical structures are symmetrical with respect to axes X, investigations will be carried out only for loadings in direction Y. In lateral load analyses the unfavorable accidental eccentricity of +5% will be considered. Typical structures groups consist of structures with 5, 6 and 7 axes in Y direction. Structure types included in these groups are shown in Table 3.1.
Table 3.1: Included structure types
Number of axes Types included 5 A, B, C, D 6 A, B, C, D, E, F 7 A, B, C, D, E, F
Each group comprises of structures with 1, 2, 4, 6, 8 and 10 stories. Thus the total number of investigated structures becomes 96. In the following, the structure groups with 5, 6 and 7 axes will be considered in turn and torsional irregularity properties will be investigated.
7
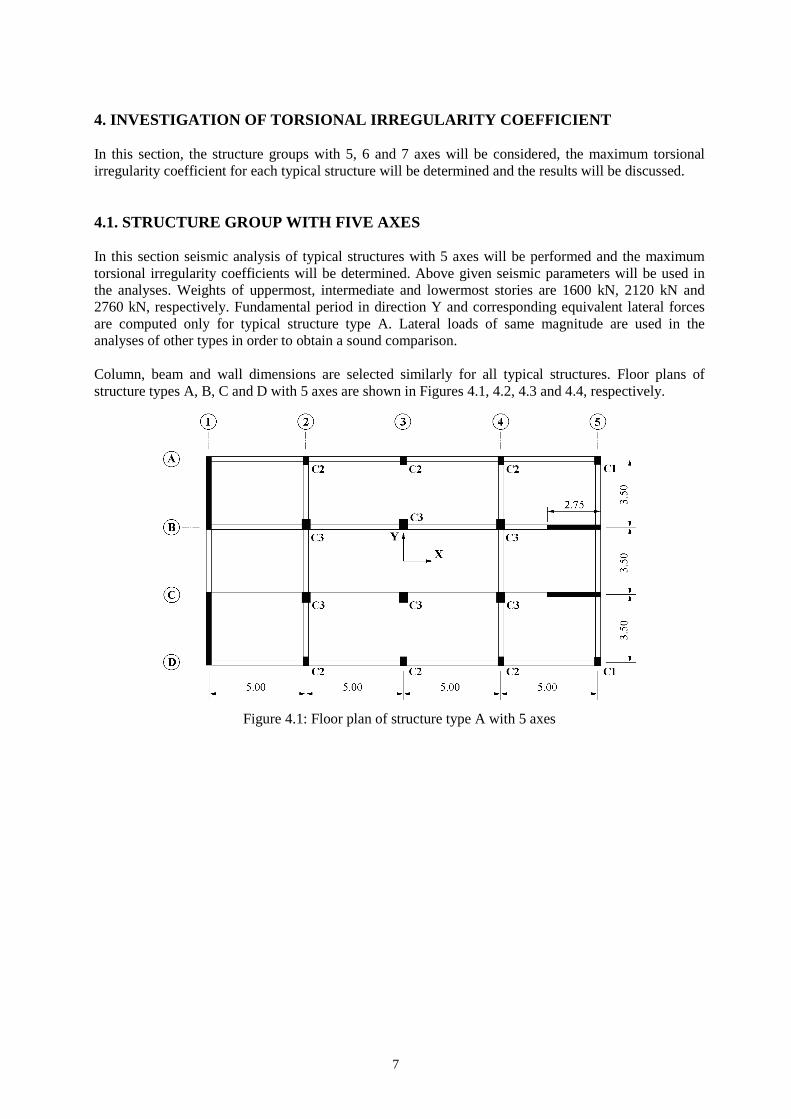
4. INVESTIGATION OF TORSIONAL IRREGULARITY COEFFICIENT In this section, the structure groups with 5, 6 and 7 axes will be considered, the maximum torsional irregularity coefficient for each typical structure will be determined and the results will be discussed. 4.1. STRUCTURE GROUP WITH FIVE AXES In this section seismic analysis of typical structures with 5 axes will be performed and the maximum torsional irregularity coefficients will be determined. Above given seismic parameters will be used in the analyses. Weights of uppermost, intermediate and lowermost stories are 1600 kN, 2120 kN and 2760 kN, respectively. Fundamental period in direction Y and corresponding equivalent lateral forces are computed only for typical structure type A. Lateral loads of same magnitude are used in the analyses of other types in order to obtain a sound comparison. Column, beam and wall dimensions are selected similarly for all typical structures. Floor plans of structure types A, B, C and D with 5 axes are shown in Figures 4.1, 4.2, 4.3 and 4.4, respectively.
Figure 4.1: Floor plan of structure type A with 5 axes
8
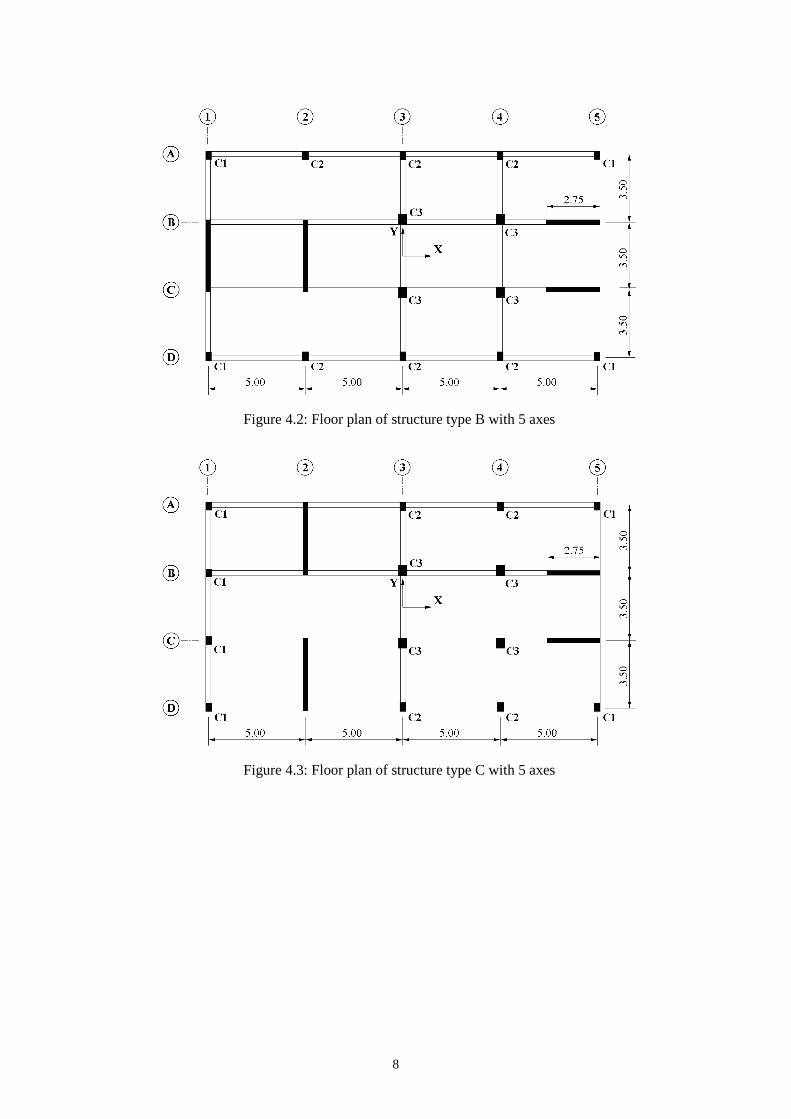
Figure 4.2: Floor plan of structure type B with 5 axes
Figure 4.3: Floor plan of structure type C with 5 axes
9
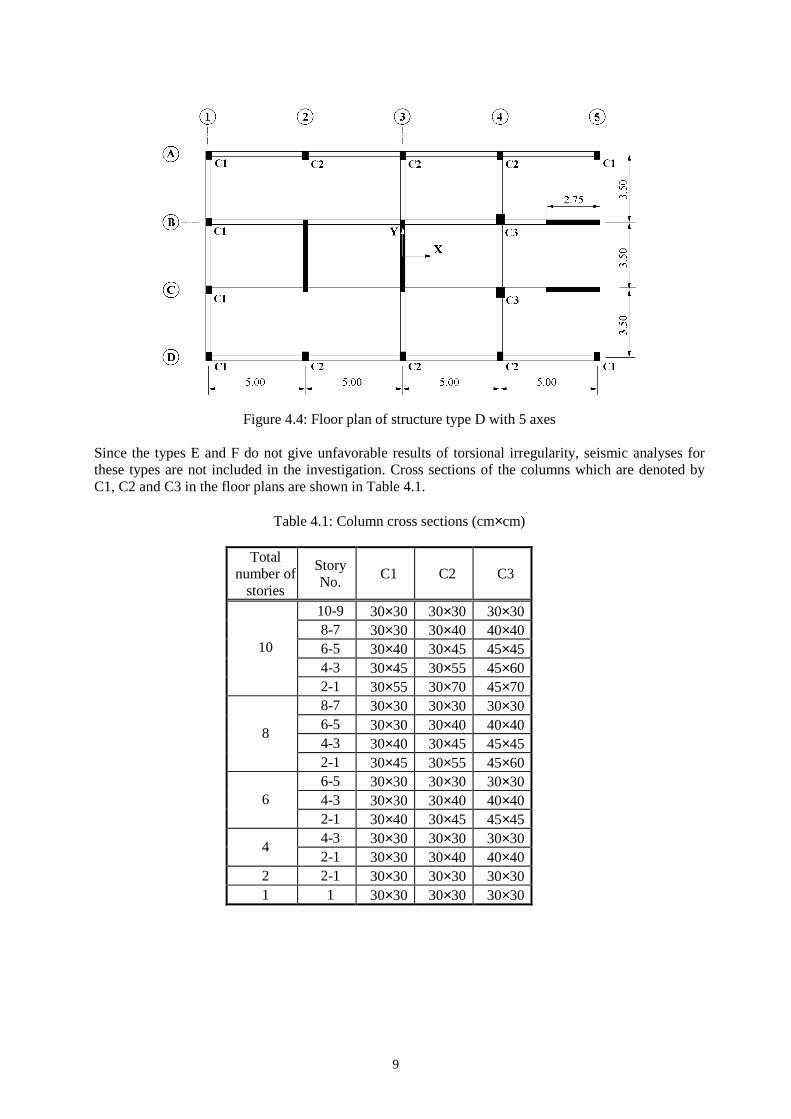
Figure 4.4: Floor plan of structure type D with 5 axes
Since the types E and F do not give unfavorable results of torsional irregularity, seismic analyses for these types are not included in the investigation. Cross sections of the columns which are denoted by C1, C2 and C3 in the floor plans are shown in Table 4.1.
Table 4.1: Column cross sections (cm×cm)
Total number of
stories
Story No.
C1 C2 C3
10-9 30×30 30×30 30×30 8-7 30×30 30×40 40×40 6-5 30×40 30×45 45×45 4-3 30×45 30×55 45×60
10
2-1 30×55 30×70 45×70 8-7 30×30 30×30 30×30 6-5 30×30 30×40 40×40 4-3 30×40 30×45 45×45
8
2-1 30×45 30×55 45×60 6-5 30×30 30×30 30×30 4-3 30×30 30×40 40×40 6 2-1 30×40 30×45 45×45 4-3 30×30 30×30 30×30
4 2-1 30×30 30×40 40×40
2 2-1 30×30 30×30 30×30 1 1 30×30 30×30 30×30
10
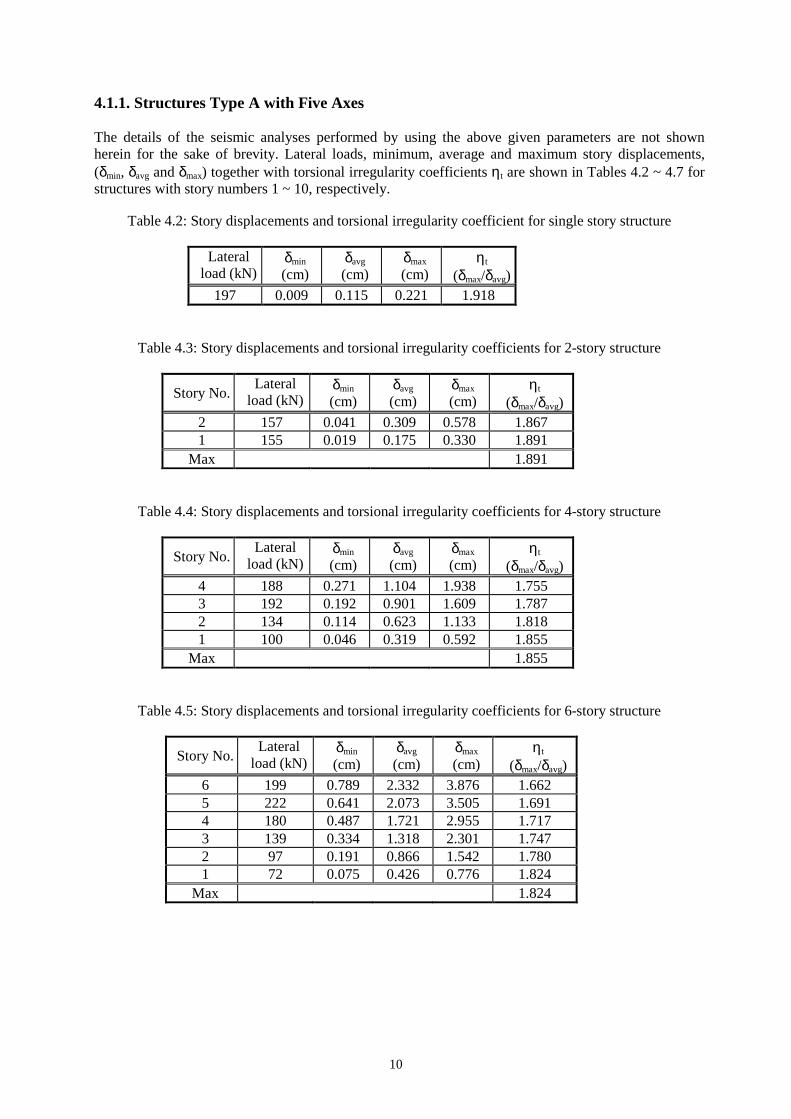
4.1.1. Structures Type A with Five Axes The details of the seismic analyses performed by using the above given parameters are not shown herein for the sake of brevity. Lateral loads, minimum, average and maximum story displacements, (δmin, δavg and δmax) together with torsional irregularity coefficients ηt are shown in Tables 4.2 ~ 4.7 for structures with story numbers 1 ~ 10, respectively.
Table 4.2: Story displacements and torsional irregularity coefficient for single story structure
Lateral load (kN)
δmin (cm)
δavg (cm)
δmax (cm)
ηt
(δmax/δavg) 197 0.009 0.115 0.221 1.918
Table 4.3: Story displacements and torsional irregularity coefficients for 2-story structure
Table 4.4: Story displacements and torsional irregularity coefficients for 4-story structure
Table 4.5: Story displacements and torsional irregularity coefficients for 6-story structure
Story No. Lateral
load (kN) δmin (cm)
δavg (cm)
δmax (cm)
ηt
(δmax/δavg) 6 199 0.789 2.332 3.876 1.662 5 222 0.641 2.073 3.505 1.691 4 180 0.487 1.721 2.955 1.717 3 139 0.334 1.318 2.301 1.747 2 97 0.191 0.866 1.542 1.780 1 72 0.075 0.426 0.776 1.824
Max 1.824
Story No. Lateral
load (kN) δmin (cm)
δavg (cm)
δmax (cm)
ηt
(δmax/δavg) 2 157 0.041 0.309 0.578 1.867 1 155 0.019 0.175 0.330 1.891
Max 1.891
Story No. Lateral
load (kN) δmin (cm)
δavg (cm)
δmax (cm)
ηt
(δmax/δavg) 4 188 0.271 1.104 1.938 1.755 3 192 0.192 0.901 1.609 1.787 2 134 0.114 0.623 1.133 1.818 1 100 0.046 0.319 0.592 1.855
Max 1.855
11
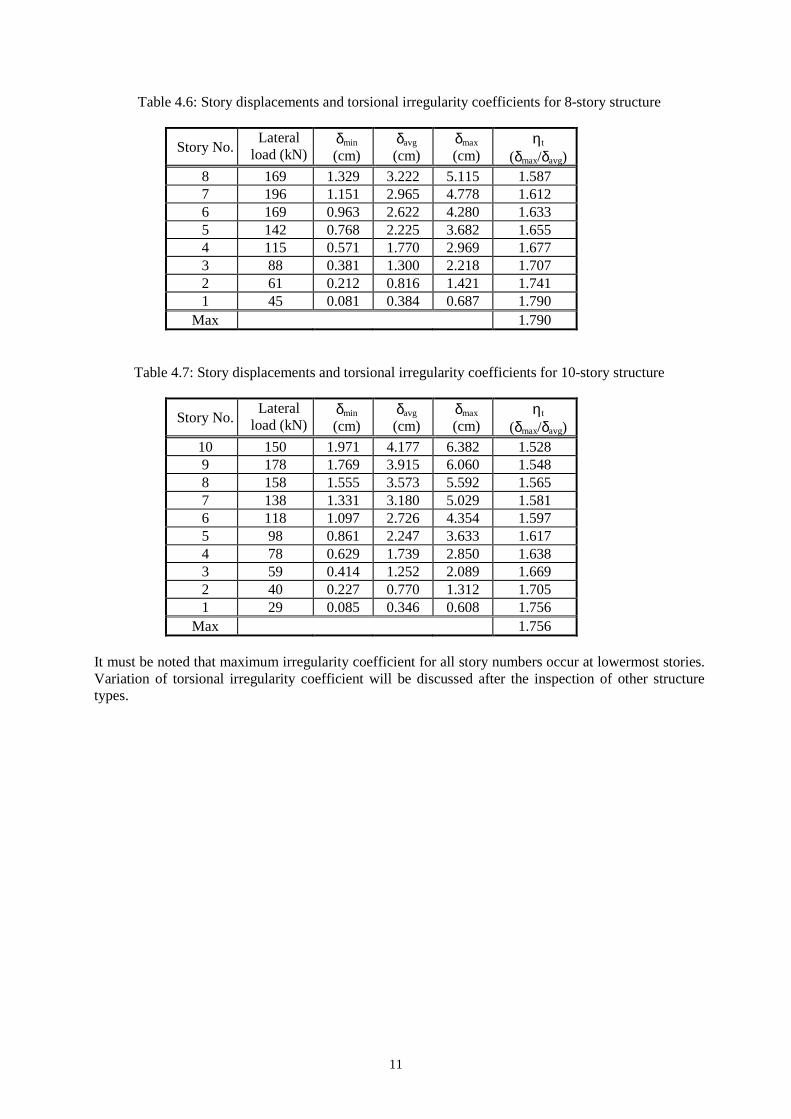
Table 4.6: Story displacements and torsional irregularity coefficients for 8-story structure
Story No. Lateral
load (kN) δmin (cm)
δavg (cm)
δmax (cm)
ηt
(δmax/δavg) 8 169 1.329 3.222 5.115 1.587 7 196 1.151 2.965 4.778 1.612 6 169 0.963 2.622 4.280 1.633 5 142 0.768 2.225 3.682 1.655 4 115 0.571 1.770 2.969 1.677 3 88 0.381 1.300 2.218 1.707 2 61 0.212 0.816 1.421 1.741 1 45 0.081 0.384 0.687 1.790
Max 1.790
Table 4.7: Story displacements and torsional irregularity coefficients for 10-story structure
Story No. Lateral
load (kN) δmin (cm)
δavg (cm)
δmax (cm)
ηt
(δmax/δavg) 10 150 1.971 4.177 6.382 1.528 9 178 1.769 3.915 6.060 1.548 8 158 1.555 3.573 5.592 1.565 7 138 1.331 3.180 5.029 1.581 6 118 1.097 2.726 4.354 1.597 5 98 0.861 2.247 3.633 1.617 4 78 0.629 1.739 2.850 1.638 3 59 0.414 1.252 2.089 1.669 2 40 0.227 0.770 1.312 1.705 1 29 0.085 0.346 0.608 1.756
Max 1.756 It must be noted that maximum irregularity coefficient for all story numbers occur at lowermost stories. Variation of torsional irregularity coefficient will be discussed after the inspection of other structure types.
12
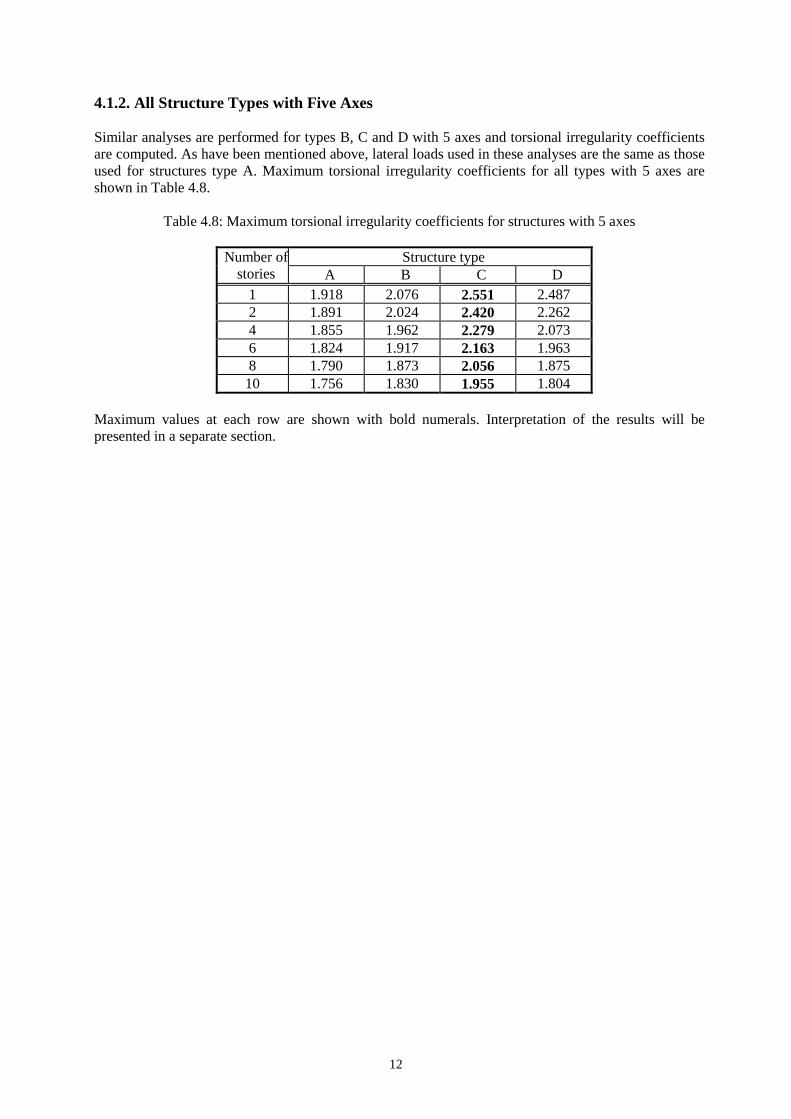
4.1.2. All Structure Types with Five Axes Similar analyses are performed for types B, C and D with 5 axes and torsional irregularity coefficients are computed. As have been mentioned above, lateral loads used in these analyses are the same as those used for structures type A. Maximum torsional irregularity coefficients for all types with 5 axes are shown in Table 4.8.
Table 4.8: Maximum torsional irregularity coefficients for structures with 5 axes Structure type Number of
stories A B C D 1 1.918 2.076 2.551 2.487 2 1.891 2.024 2.420 2.262 4 1.855 1.962 2.279 2.073 6 1.824 1.917 2.163 1.963 8 1.790 1.873 2.056 1.875 10 1.756 1.830 1.955 1.804
Maximum values at each row are shown with bold numerals. Interpretation of the results will be presented in a separate section.
13
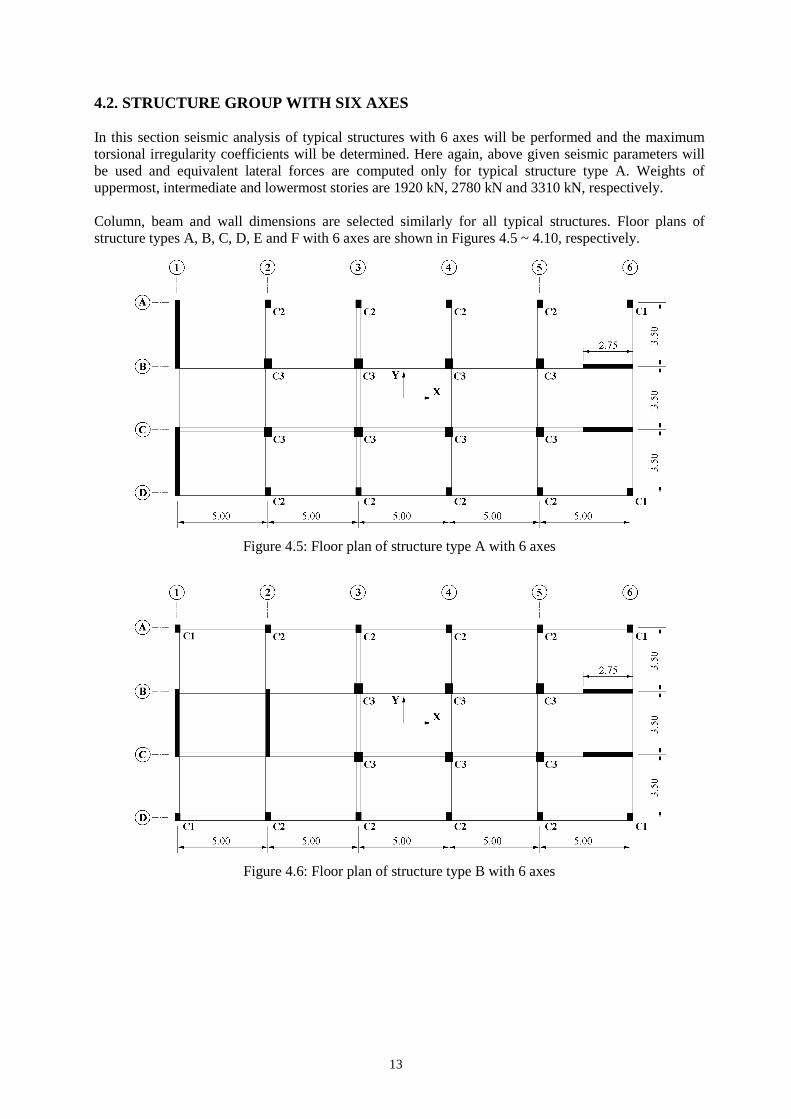
4.2. STRUCTURE GROUP WITH SIX AXES In this section seismic analysis of typical structures with 6 axes will be performed and the maximum torsional irregularity coefficients will be determined. Here again, above given seismic parameters will be used and equivalent lateral forces are computed only for typical structure type A. Weights of uppermost, intermediate and lowermost stories are 1920 kN, 2780 kN and 3310 kN, respectively. Column, beam and wall dimensions are selected similarly for all typical structures. Floor plans of structure types A, B, C, D, E and F with 6 axes are shown in Figures 4.5 ~ 4.10, respectively.
Figure 4.5: Floor plan of structure type A with 6 axes
Figure 4.6: Floor plan of structure type B with 6 axes
14
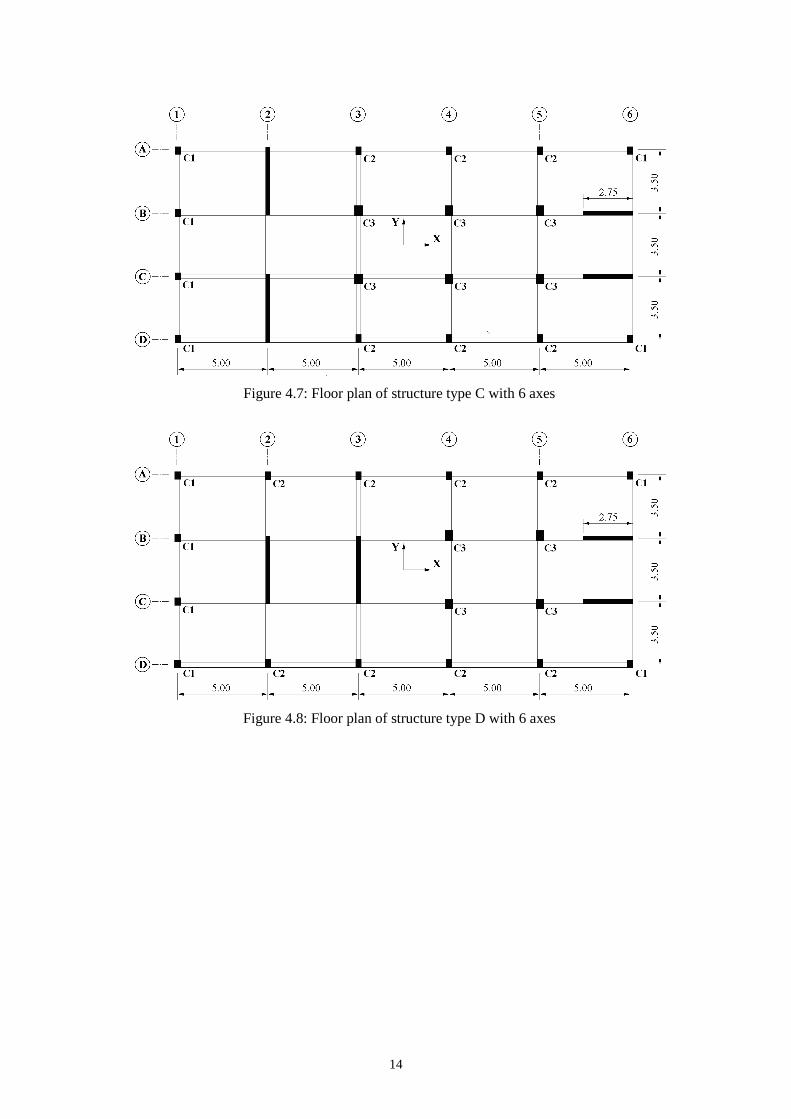
Figure 4.7: Floor plan of structure type C with 6 axes
Figure 4.8: Floor plan of structure type D with 6 axes
15
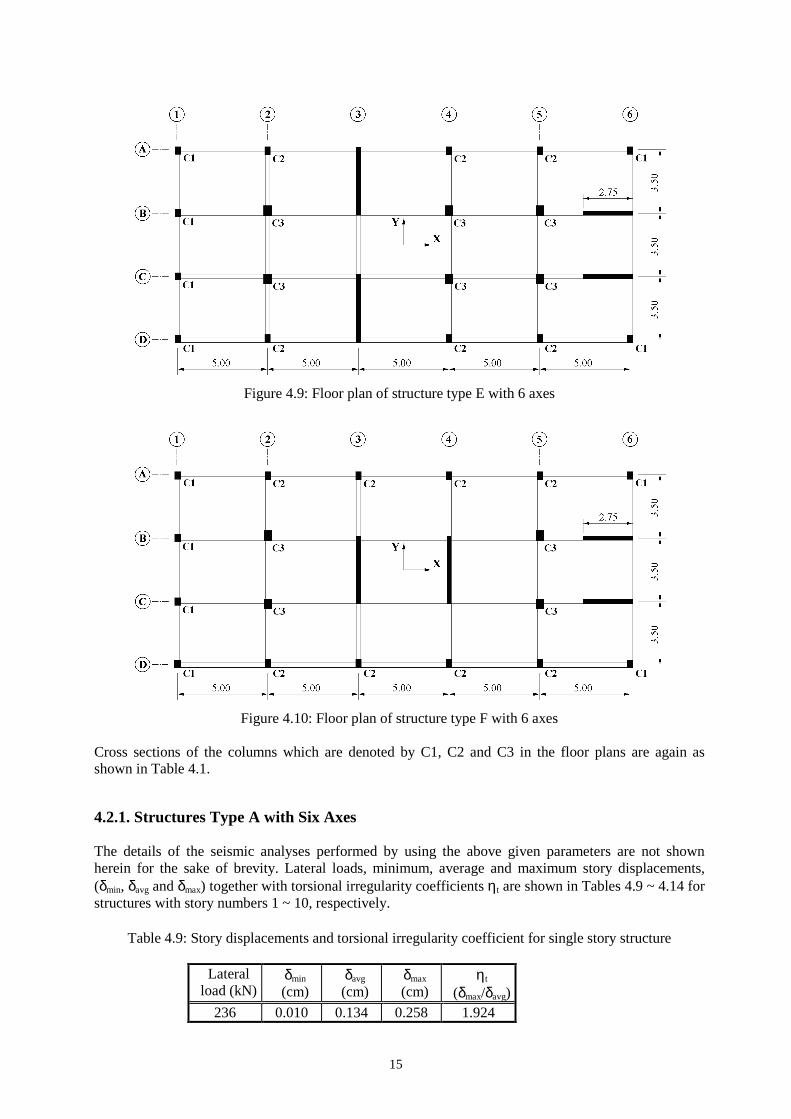
Figure 4.9: Floor plan of structure type E with 6 axes
Figure 4.10: Floor plan of structure type F with 6 axes
Cross sections of the columns which are denoted by C1, C2 and C3 in the floor plans are again as shown in Table 4.1. 4.2.1. Structures Type A with Six Axes The details of the seismic analyses performed by using the above given parameters are not shown herein for the sake of brevity. Lateral loads, minimum, average and maximum story displacements, (δmin, δavg and δmax) together with torsional irregularity coefficients ηt are shown in Tables 4.9 ~ 4.14 for structures with story numbers 1 ~ 10, respectively.
Table 4.9: Story displacements and torsional irregularity coefficient for single story structure
Lateral load (kN)
δmin (cm)
δavg (cm)
δmax (cm)
ηt
(δmax/δavg) 236 0.010 0.134 0.258 1.924
16
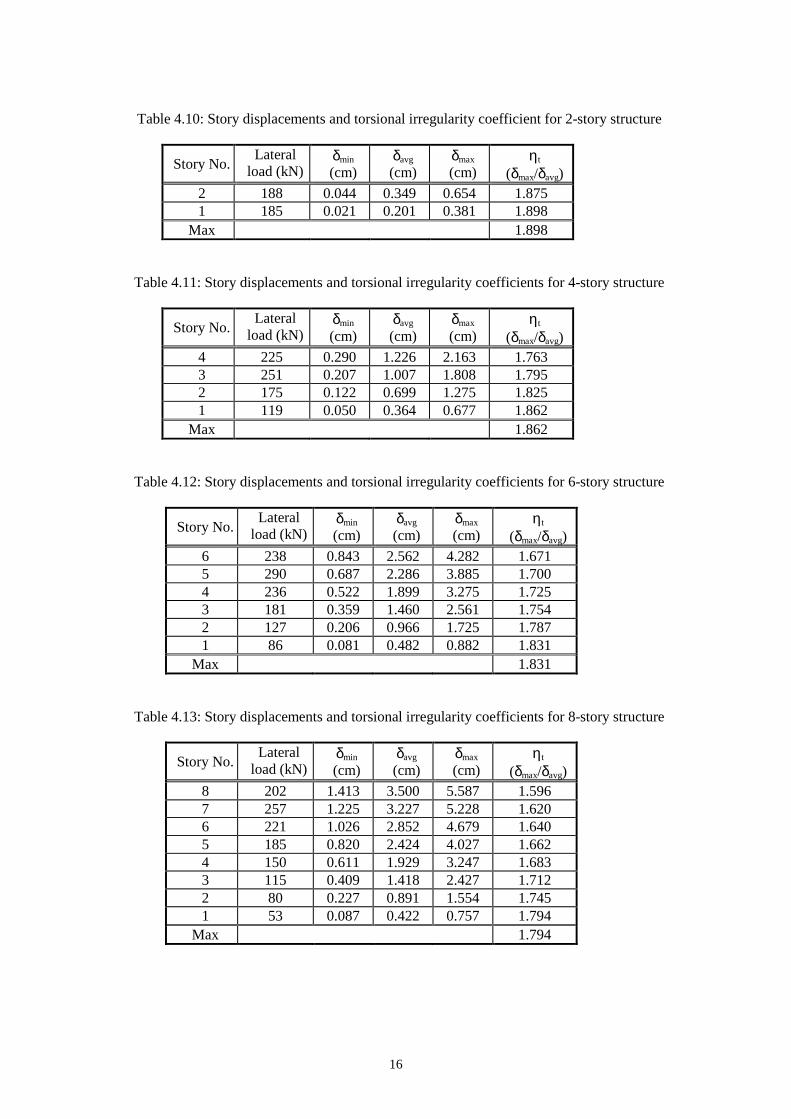
Table 4.10: Story displacements and torsional irregularity coefficient for 2-story structure
Table 4.11: Story displacements and torsional irregularity coefficients for 4-story structure
Table 4.12: Story displacements and torsional irregularity coefficients for 6-story structure
Story No. Lateral
load (kN) δmin (cm)
δavg (cm)
δmax (cm)
ηt
(δmax/δavg) 6 238 0.843 2.562 4.282 1.671 5 290 0.687 2.286 3.885 1.700 4 236 0.522 1.899 3.275 1.725 3 181 0.359 1.460 2.561 1.754 2 127 0.206 0.966 1.725 1.787 1 86 0.081 0.482 0.882 1.831
Max 1.831
Table 4.13: Story displacements and torsional irregularity coefficients for 8-story structure
Story No. Lateral
load (kN) δmin (cm)
δavg (cm)
δmax (cm)
ηt
(δmax/δavg) 8 202 1.413 3.500 5.587 1.596 7 257 1.225 3.227 5.228 1.620 6 221 1.026 2.852 4.679 1.640 5 185 0.820 2.424 4.027 1.662 4 150 0.611 1.929 3.247 1.683 3 115 0.409 1.418 2.427 1.712 2 80 0.227 0.891 1.554 1.745 1 53 0.087 0.422 0.757 1.794
Max 1.794
Story No. Lateral
load (kN) δmin (cm)
δavg (cm)
δmax (cm)
ηt
(δmax/δavg) 2 188 0.044 0.349 0.654 1.875 1 185 0.021 0.201 0.381 1.898
Max 1.898
Story No. Lateral
load (kN) δmin (cm)
δavg (cm)
δmax (cm)
ηt
(δmax/δavg) 4 225 0.290 1.226 2.163 1.763 3 251 0.207 1.007 1.808 1.795 2 175 0.122 0.699 1.275 1.825 1 119 0.050 0.364 0.677 1.862
Max 1.862
17
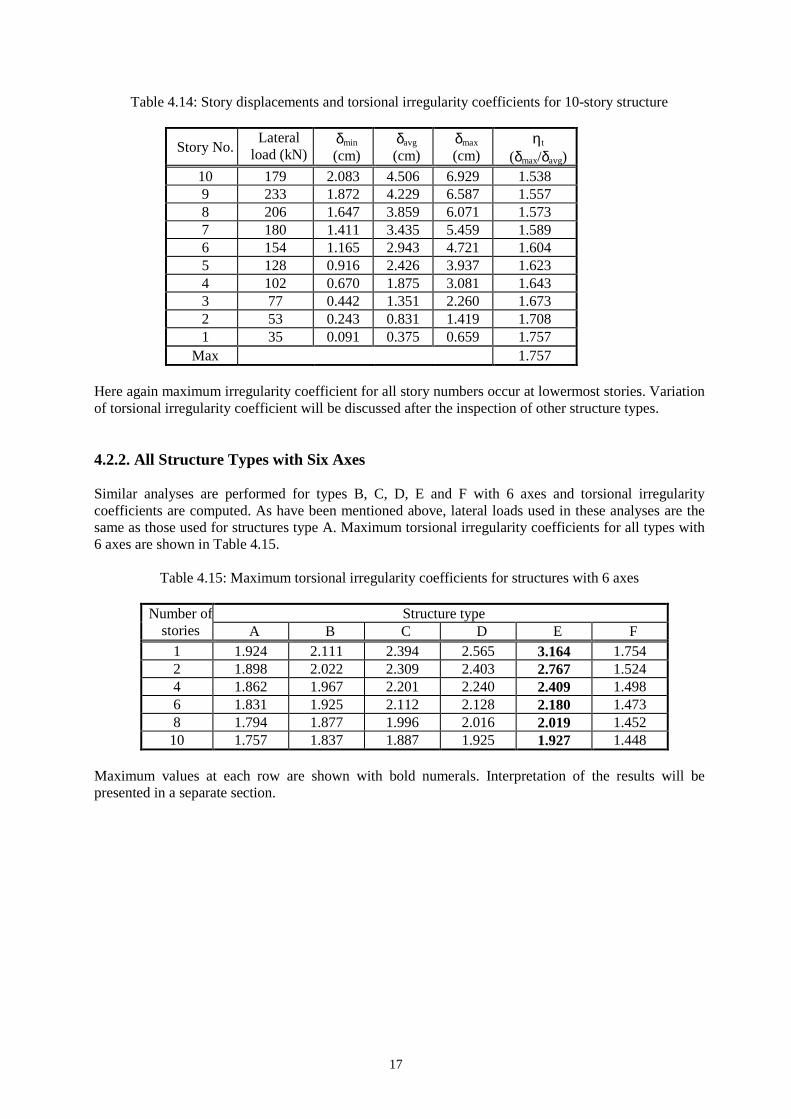
Table 4.14: Story displacements and torsional irregularity coefficients for 10-story structure
Story No. Lateral
load (kN) δmin (cm)
δavg (cm)
δmax (cm)
ηt
(δmax/δavg) 10 179 2.083 4.506 6.929 1.538 9 233 1.872 4.229 6.587 1.557 8 206 1.647 3.859 6.071 1.573 7 180 1.411 3.435 5.459 1.589 6 154 1.165 2.943 4.721 1.604 5 128 0.916 2.426 3.937 1.623 4 102 0.670 1.875 3.081 1.643 3 77 0.442 1.351 2.260 1.673 2 53 0.243 0.831 1.419 1.708 1 35 0.091 0.375 0.659 1.757
Max 1.757 Here again maximum irregularity coefficient for all story numbers occur at lowermost stories. Variation of torsional irregularity coefficient will be discussed after the inspection of other structure types. 4.2.2. All Structure Types with Six Axes Similar analyses are performed for types B, C, D, E and F with 6 axes and torsional irregularity coefficients are computed. As have been mentioned above, lateral loads used in these analyses are the same as those used for structures type A. Maximum torsional irregularity coefficients for all types with 6 axes are shown in Table 4.15.
Table 4.15: Maximum torsional irregularity coefficients for structures with 6 axes Structure type Number of
stories A B C D E F 1 1.924 2.111 2.394 2.565 3.164 1.754 2 1.898 2.022 2.309 2.403 2.767 1.524 4 1.862 1.967 2.201 2.240 2.409 1.498 6 1.831 1.925 2.112 2.128 2.180 1.473 8 1.794 1.877 1.996 2.016 2.019 1.452 10 1.757 1.837 1.887 1.925 1.927 1.448
Maximum values at each row are shown with bold numerals. Interpretation of the results will be presented in a separate section.
18
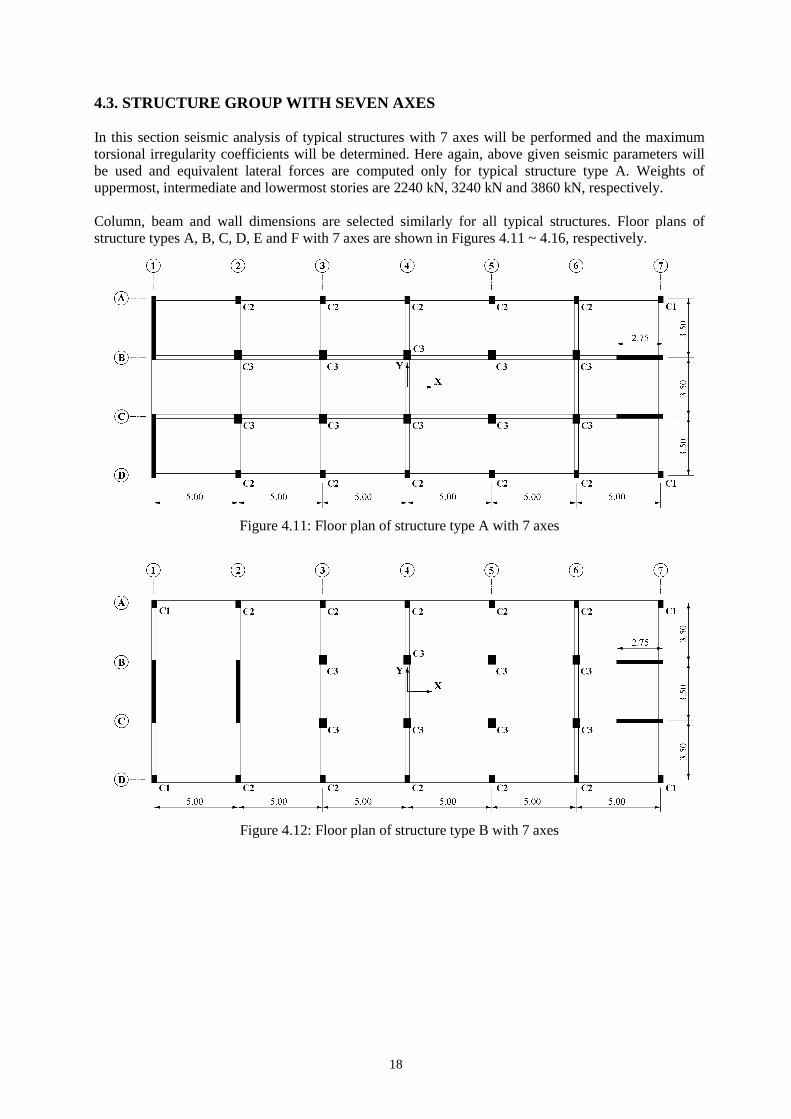
4.3. STRUCTURE GROUP WITH SEVEN AXES In this section seismic analysis of typical structures with 7 axes will be performed and the maximum torsional irregularity coefficients will be determined. Here again, above given seismic parameters will be used and equivalent lateral forces are computed only for typical structure type A. Weights of uppermost, intermediate and lowermost stories are 2240 kN, 3240 kN and 3860 kN, respectively. Column, beam and wall dimensions are selected similarly for all typical structures. Floor plans of structure types A, B, C, D, E and F with 7 axes are shown in Figures 4.11 ~ 4.16, respectively.
Figure 4.11: Floor plan of structure type A with 7 axes
Figure 4.12: Floor plan of structure type B with 7 axes
19
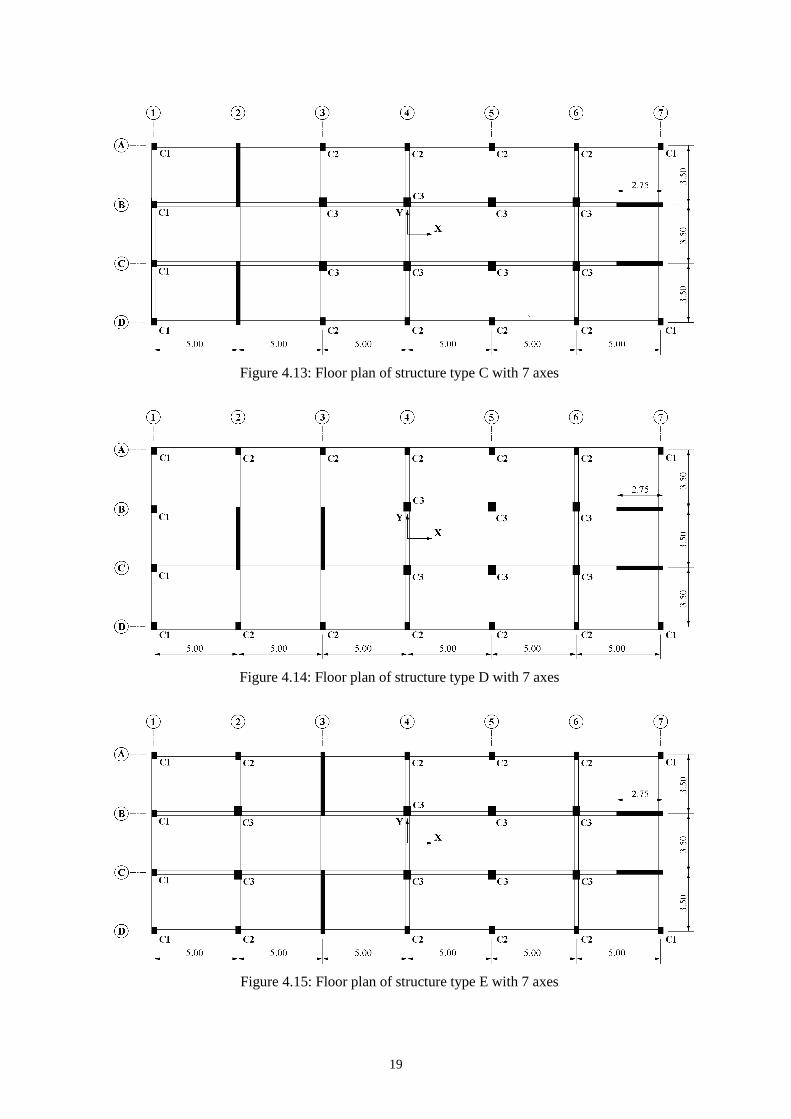
Figure 4.13: Floor plan of structure type C with 7 axes
Figure 4.14: Floor plan of structure type D with 7 axes
Figure 4.15: Floor plan of structure type E with 7 axes
20
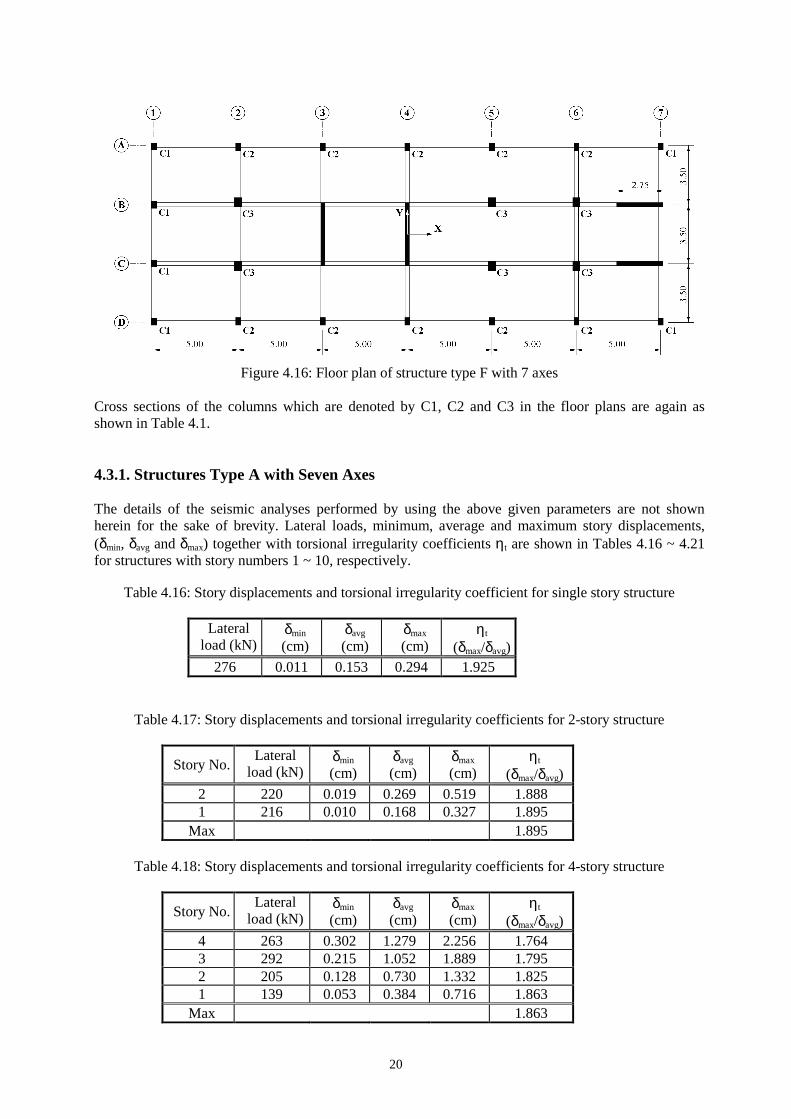
Figure 4.16: Floor plan of structure type F with 7 axes
Cross sections of the columns which are denoted by C1, C2 and C3 in the floor plans are again as shown in Table 4.1. 4.3.1. Structures Type A with Seven Axes The details of the seismic analyses performed by using the above given parameters are not shown herein for the sake of brevity. Lateral loads, minimum, average and maximum story displacements, (δmin, δavg and δmax) together with torsional irregularity coefficients ηt are shown in Tables 4.16 ~ 4.21 for structures with story numbers 1 ~ 10, respectively.
Table 4.16: Story displacements and torsional irregularity coefficient for single story structure
Lateral load (kN)
δmin (cm)
δavg (cm)
δmax (cm)
ηt
(δmax/δavg) 276 0.011 0.153 0.294 1.925
Table 4.17: Story displacements and torsional irregularity coefficients for 2-story structure
Table 4.18: Story displacements and torsional irregularity coefficients for 4-story structure
Story No. Lateral
load (kN) δmin (cm)
δavg (cm)
δmax (cm)
ηt
(δmax/δavg) 2 220 0.019 0.269 0.519 1.888 1 216 0.010 0.168 0.327 1.895
Max 1.895
Story No. Lateral
load (kN) δmin (cm)
δavg (cm)
δmax (cm)
ηt
(δmax/δavg) 4 263 0.302 1.279 2.256 1.764 3 292 0.215 1.052 1.889 1.795 2 205 0.128 0.730 1.332 1.825 1 139 0.053 0.384 0.716 1.863
Max 1.863
21
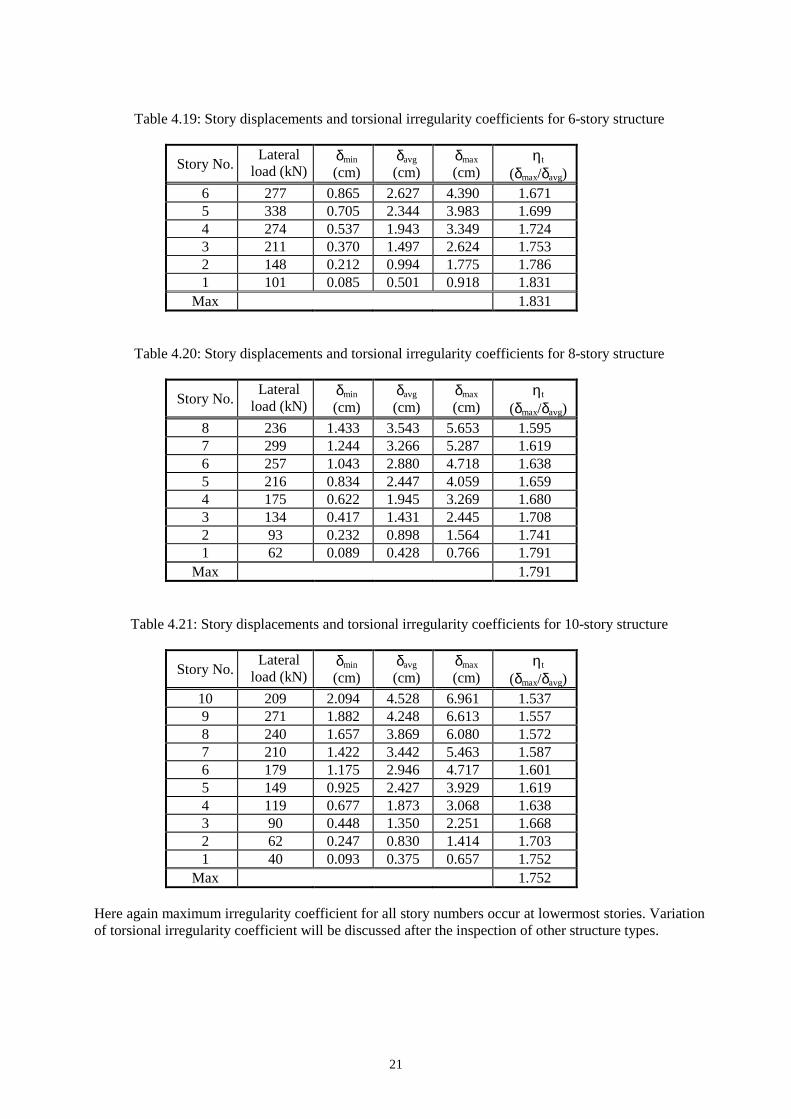
Table 4.19: Story displacements and torsional irregularity coefficients for 6-story structure
Story No. Lateral
load (kN) δmin (cm)
δavg (cm)
δmax (cm)
ηt
(δmax/δavg) 6 277 0.865 2.627 4.390 1.671 5 338 0.705 2.344 3.983 1.699 4 274 0.537 1.943 3.349 1.724 3 211 0.370 1.497 2.624 1.753 2 148 0.212 0.994 1.775 1.786 1 101 0.085 0.501 0.918 1.831
Max 1.831
Table 4.20: Story displacements and torsional irregularity coefficients for 8-story structure
Story No. Lateral
load (kN) δmin (cm)
δavg (cm)
δmax (cm)
ηt
(δmax/δavg) 8 236 1.433 3.543 5.653 1.595 7 299 1.244 3.266 5.287 1.619 6 257 1.043 2.880 4.718 1.638 5 216 0.834 2.447 4.059 1.659 4 175 0.622 1.945 3.269 1.680 3 134 0.417 1.431 2.445 1.708 2 93 0.232 0.898 1.564 1.741 1 62 0.089 0.428 0.766 1.791
Max 1.791
Table 4.21: Story displacements and torsional irregularity coefficients for 10-story structure
Story No. Lateral
load (kN) δmin (cm)
δavg (cm)
δmax (cm)
ηt
(δmax/δavg) 10 209 2.094 4.528 6.961 1.537 9 271 1.882 4.248 6.613 1.557 8 240 1.657 3.869 6.080 1.572 7 210 1.422 3.442 5.463 1.587 6 179 1.175 2.946 4.717 1.601 5 149 0.925 2.427 3.929 1.619 4 119 0.677 1.873 3.068 1.638 3 90 0.448 1.350 2.251 1.668 2 62 0.247 0.830 1.414 1.703 1 40 0.093 0.375 0.657 1.752
Max 1.752 Here again maximum irregularity coefficient for all story numbers occur at lowermost stories. Variation of torsional irregularity coefficient will be discussed after the inspection of other structure types.
22
4.3.2. All Structure Types with Seven Axes Similar analyses are performed for types B, C, D, E and F with 7 axes and torsional irregularity coefficients are computed. As have been mentioned above, lateral loads used in these analyses are the same as those used for structures type A. Maximum torsional irregularity coefficients for all types with 7 axes are shown in Table 4.22.
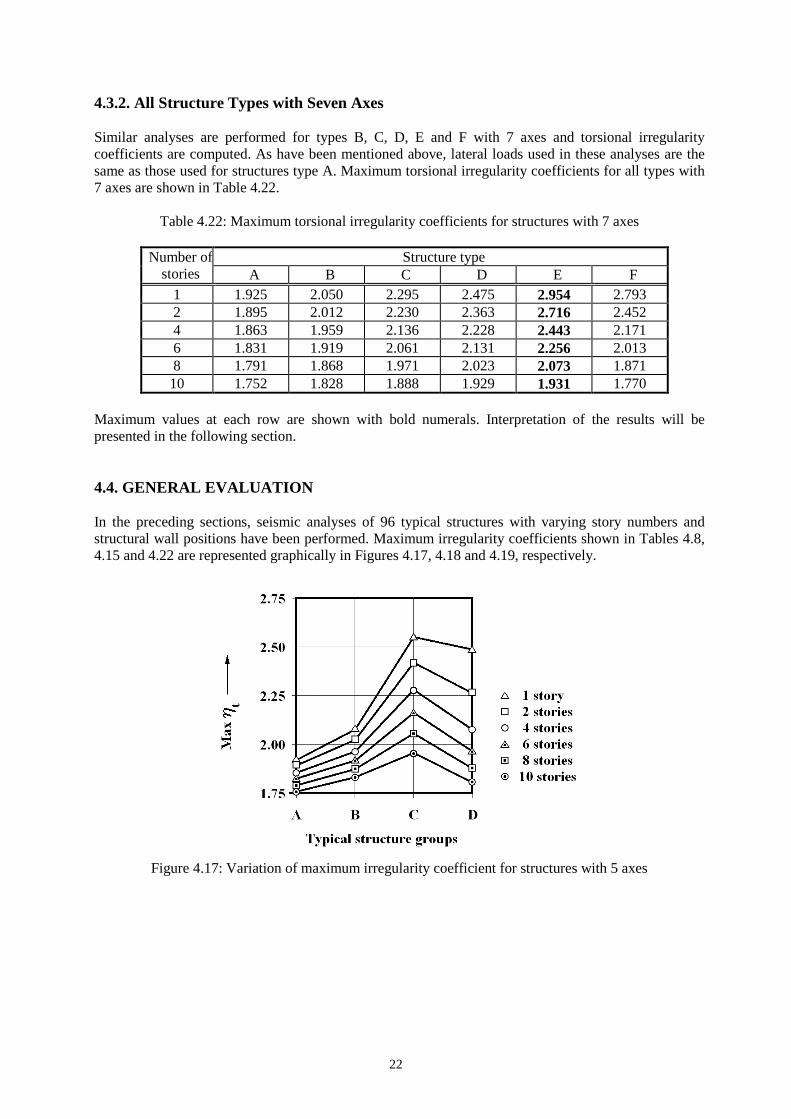
Table 4.22: Maximum torsional irregularity coefficients for structures with 7 axes Structure type Number of
stories A B C D E F 1 1.925 2.050 2.295 2.475 2.954 2.793 2 1.895 2.012 2.230 2.363 2.716 2.452 4 1.863 1.959 2.136 2.228 2.443 2.171 6 1.831 1.919 2.061 2.131 2.256 2.013 8 1.791 1.868 1.971 2.023 2.073 1.871 10 1.752 1.828 1.888 1.929 1.931 1.770
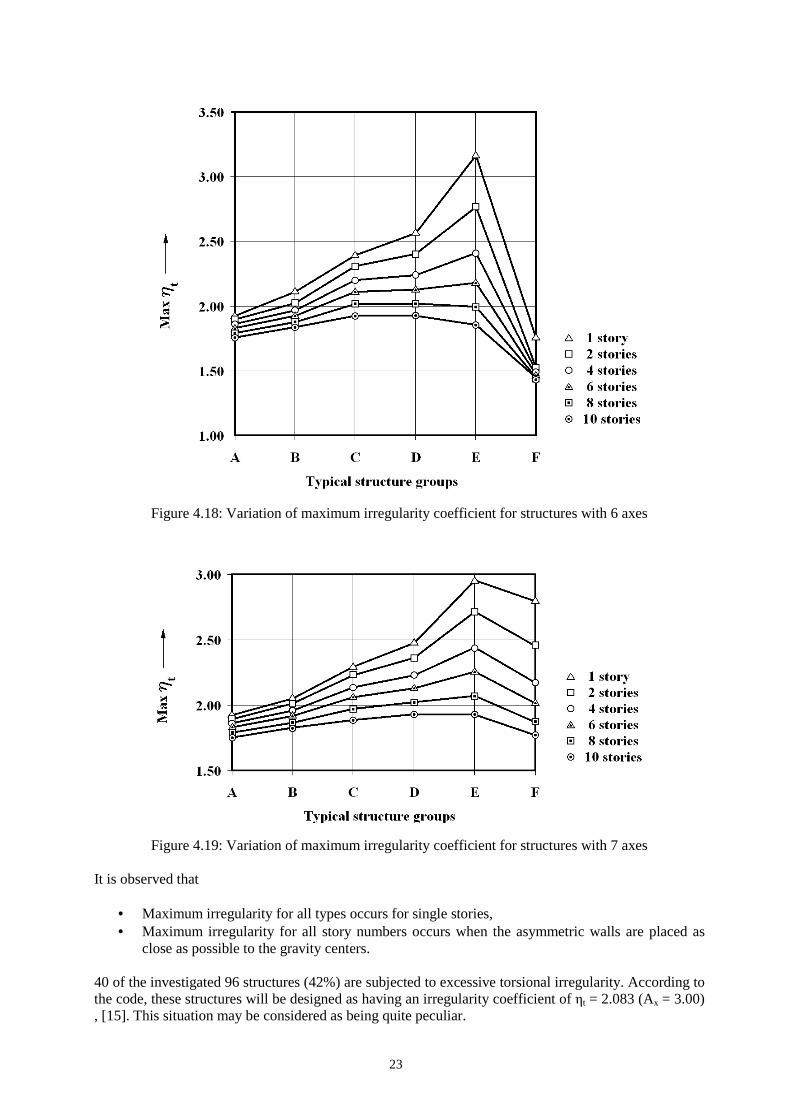
Maximum values at each row are shown with bold numerals. Interpretation of the results will be presented in the following section. 4.4. GENERAL EVALUATION In the preceding sections, seismic analyses of 96 typical structures with varying story numbers and structural wall positions have been performed. Maximum irregularity coefficients shown in Tables 4.8, 4.15 and 4.22 are represented graphically in Figures 4.17, 4.18 and 4.19, respectively.
Figure 4.17: Variation of maximum irregularity coefficient for structures with 5 axes
23
Figure 4.18: Variation of maximum irregularity coefficient for structures with 6 axes
Figure 4.19: Variation of maximum irregularity coefficient for structures with 7 axes
It is observed that
• Maximum irregularity for all types occurs for single stories, • Maximum irregularity for all story numbers occurs when the asymmetric walls are placed as
close as possible to the gravity centers. 40 of the investigated 96 structures (42%) are subjected to excessive torsional irregularity. According to the code, these structures will be designed as having an irregularity coefficient of ηt = 2.083 (Ax = 3.00) , [15]. This situation may be considered as being quite peculiar.
24
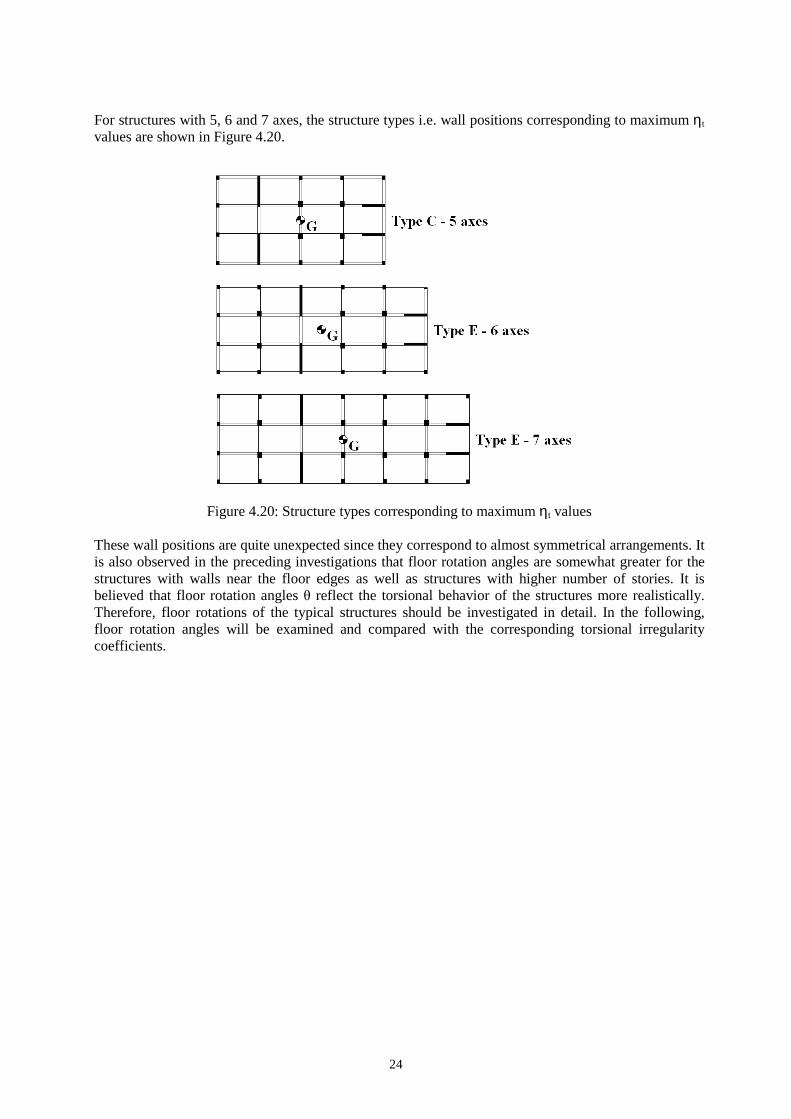
For structures with 5, 6 and 7 axes, the structure types i.e. wall positions corresponding to maximum ηt values are shown in Figure 4.20.
Figure 4.20: Structure types corresponding to maximum ηt values
These wall positions are quite unexpected since they correspond to almost symmetrical arrangements. It is also observed in the preceding investigations that floor rotation angles are somewhat greater for the structures with walls near the floor edges as well as structures with higher number of stories. It is believed that floor rotation angles θ reflect the torsional behavior of the structures more realistically. Therefore, floor rotations of the typical structures should be investigated in detail. In the following, floor rotation angles will be examined and compared with the corresponding torsional irregularity coefficients.
25
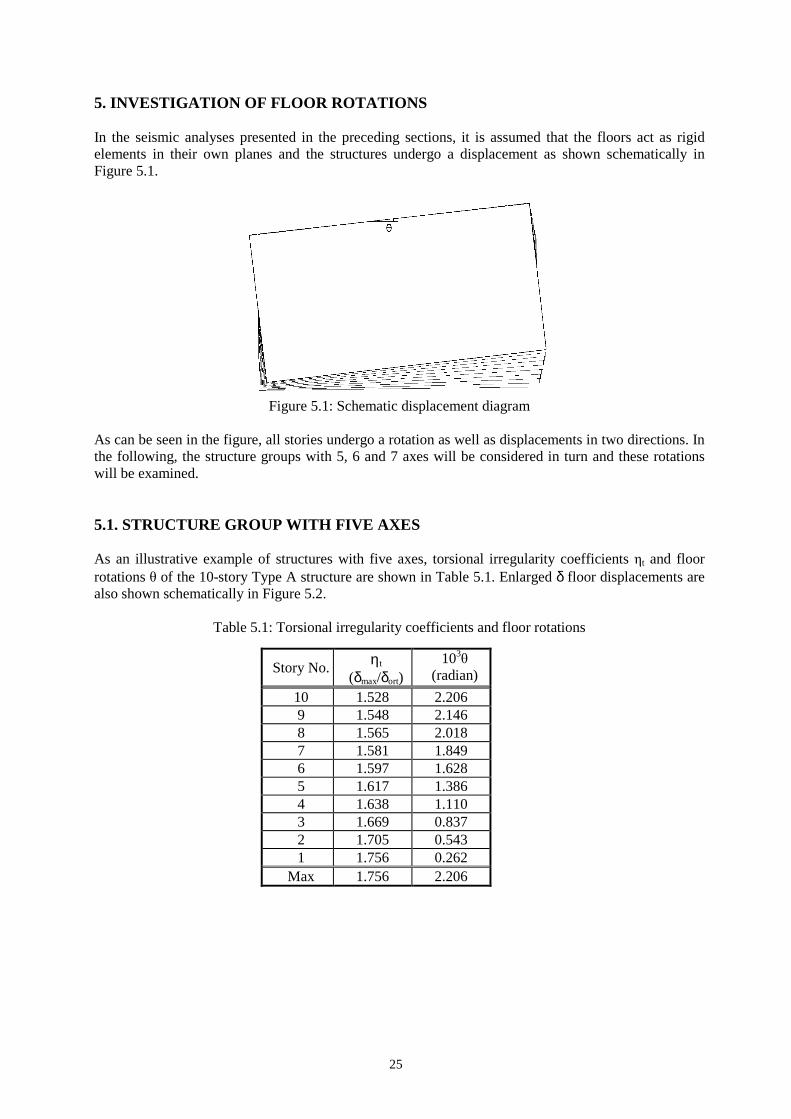
5. INVESTIGATION OF FLOOR ROTATIONS In the seismic analyses presented in the preceding sections, it is assumed that the floors act as rigid elements in their own planes and the structures undergo a displacement as shown schematically in Figure 5.1.
Figure 5.1: Schematic displacement diagram
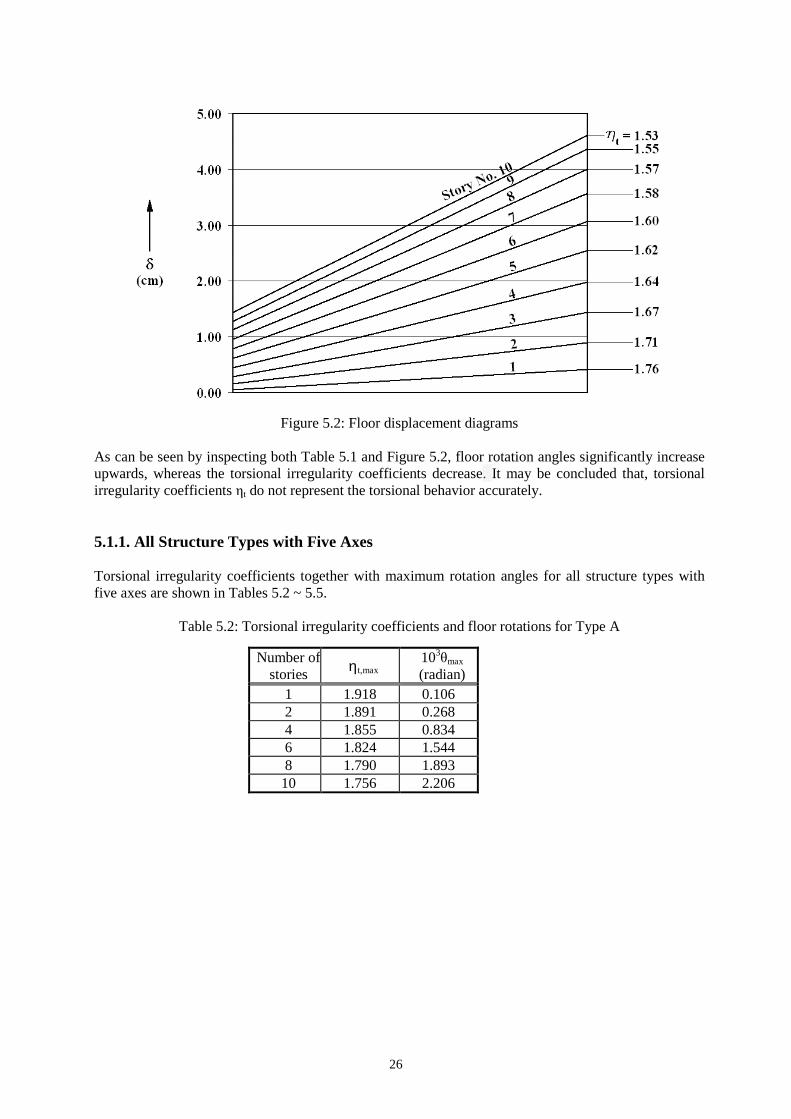
As can be seen in the figure, all stories undergo a rotation as well as displacements in two directions. In the following, the structure groups with 5, 6 and 7 axes will be considered in turn and these rotations will be examined. 5.1. STRUCTURE GROUP WITH FIVE AXES As an illustrative example of structures with five axes, torsional irregularity coefficients ηt and floor rotations θ of the 10-story Type A structure are shown in Table 5.1. Enlarged δ floor displacements are also shown schematically in Figure 5.2.
Table 5.1: Torsional irregularity coefficients and floor rotations
Story No. ηt
(δmax/δort) 103θ
(radian)
10 1.528 2.206 9 1.548 2.146 8 1.565 2.018 7 1.581 1.849 6 1.597 1.628 5 1.617 1.386 4 1.638 1.110 3 1.669 0.837 2 1.705 0.543 1 1.756 0.262
Max 1.756 2.206
26
Figure 5.2: Floor displacement diagrams
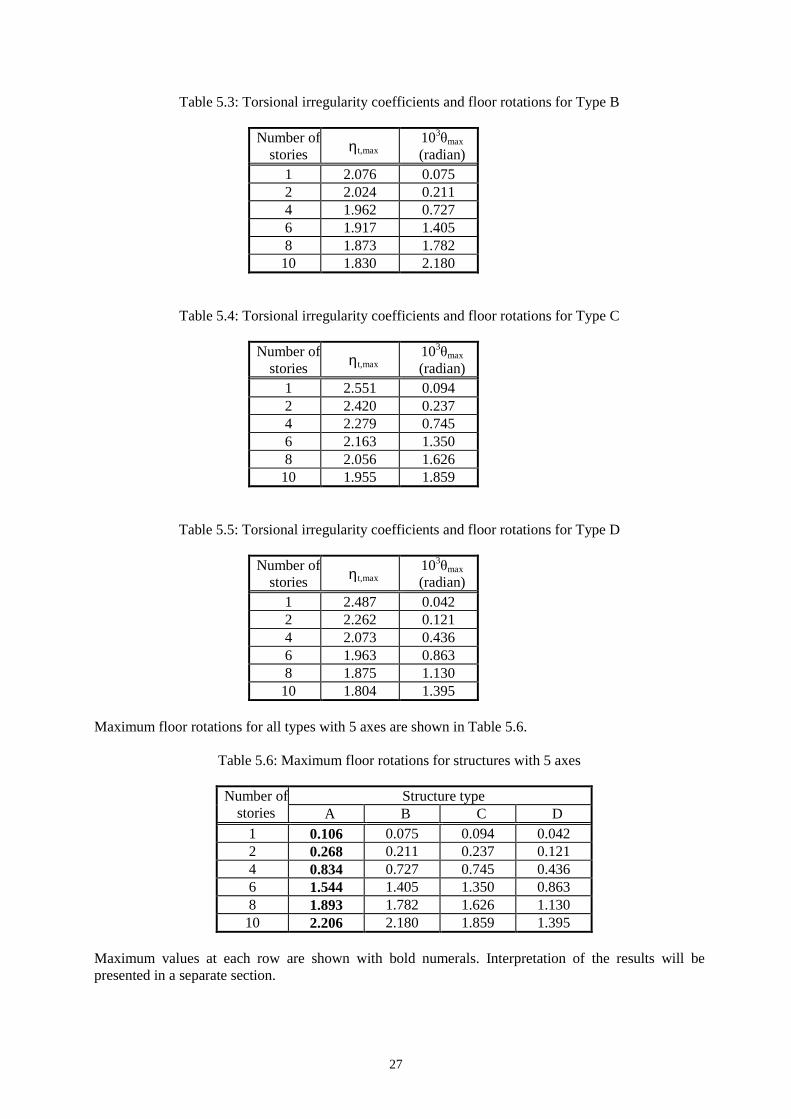
As can be seen by inspecting both Table 5.1 and Figure 5.2, floor rotation angles significantly increase upwards, whereas the torsional irregularity coefficients decrease. It may be concluded that, torsional irregularity coefficients ηt do not represent the torsional behavior accurately. 5.1.1. All Structure Types with Five Axes Torsional irregularity coefficients together with maximum rotation angles for all structure types with five axes are shown in Tables 5.2 ~ 5.5.
Table 5.2: Torsional irregularity coefficients and floor rotations for Type A
Number of stories ηt,max
103θmax (radian)
1 1.918 0.106 2 1.891 0.268 4 1.855 0.834 6 1.824 1.544 8 1.790 1.893 10 1.756 2.206
27
Table 5.3: Torsional irregularity coefficients and floor rotations for Type B
Number of stories ηt,max
103θmax (radian)
1 2.076 0.075 2 2.024 0.211 4 1.962 0.727 6 1.917 1.405 8 1.873 1.782 10 1.830 2.180
Table 5.4: Torsional irregularity coefficients and floor rotations for Type C
Number of stories ηt,max
103θmax (radian)
1 2.551 0.094 2 2.420 0.237 4 2.279 0.745 6 2.163 1.350 8 2.056 1.626 10 1.955 1.859
Table 5.5: Torsional irregularity coefficients and floor rotations for Type D
Number of stories ηt,max
103θmax (radian)
1 2.487 0.042 2 2.262 0.121 4 2.073 0.436 6 1.963 0.863 8 1.875 1.130 10 1.804 1.395
Maximum floor rotations for all types with 5 axes are shown in Table 5.6.
Table 5.6: Maximum floor rotations for structures with 5 axes Structure type Number of
stories A B C D 1 0.106 0.075 0.094 0.042 2 0.268 0.211 0.237 0.121 4 0.834 0.727 0.745 0.436 6 1.544 1.405 1.350 0.863 8 1.893 1.782 1.626 1.130 10 2.206 2.180 1.859 1.395
Maximum values at each row are shown with bold numerals. Interpretation of the results will be presented in a separate section.
28
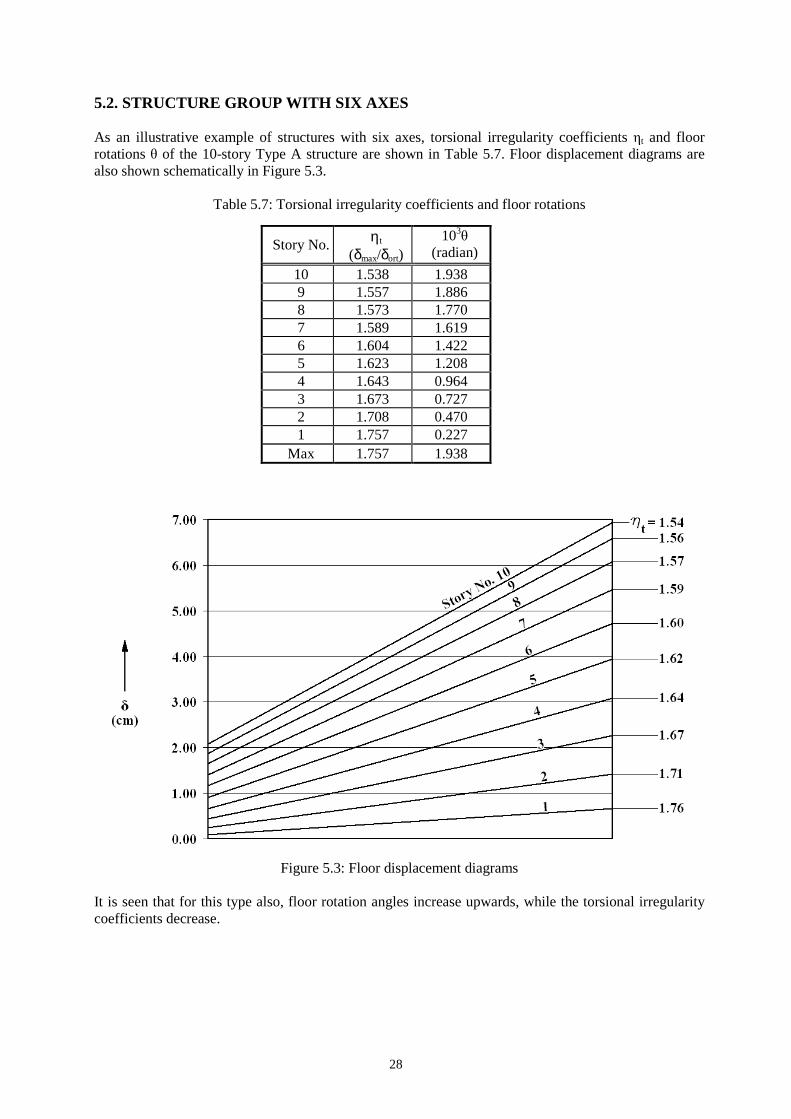
5.2. STRUCTURE GROUP WITH SIX AXES As an illustrative example of structures with six axes, torsional irregularity coefficients ηt and floor rotations θ of the 10-story Type A structure are shown in Table 5.7. Floor displacement diagrams are also shown schematically in Figure 5.3.
Table 5.7: Torsional irregularity coefficients and floor rotations
Story No. ηt
(δmax/δort) 103θ
(radian)
10 1.538 1.938 9 1.557 1.886 8 1.573 1.770 7 1.589 1.619 6 1.604 1.422 5 1.623 1.208 4 1.643 0.964 3 1.673 0.727 2 1.708 0.470 1 1.757 0.227
Max 1.757 1.938
Figure 5.3: Floor displacement diagrams
It is seen that for this type also, floor rotation angles increase upwards, while the torsional irregularity coefficients decrease.
29
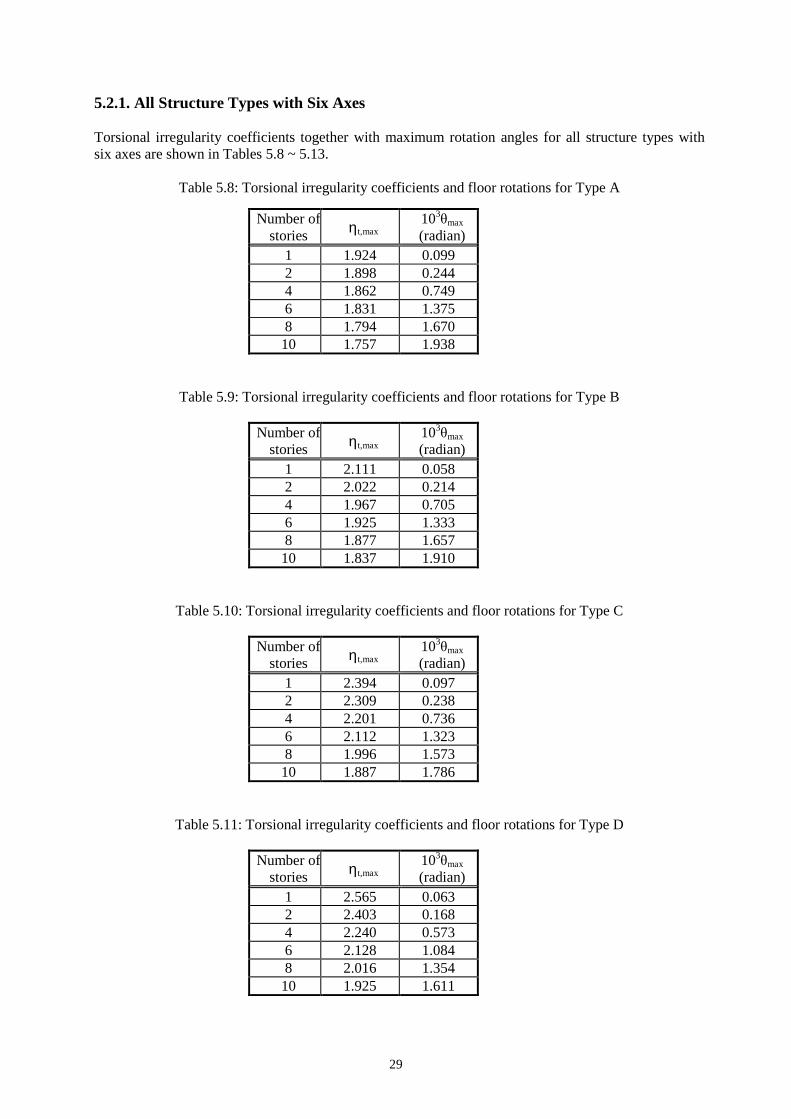
5.2.1. All Structure Types with Six Axes Torsional irregularity coefficients together with maximum rotation angles for all structure types with six axes are shown in Tables 5.8 ~ 5.13.
Table 5.8: Torsional irregularity coefficients and floor rotations for Type A
Number of stories ηt,max
103θmax (radian)
1 1.924 0.099 2 1.898 0.244 4 1.862 0.749 6 1.831 1.375 8 1.794 1.670 10 1.757 1.938
Table 5.9: Torsional irregularity coefficients and floor rotations for Type B
Number of stories ηt,max
103θmax (radian)
1 2.111 0.058 2 2.022 0.214 4 1.967 0.705 6 1.925 1.333 8 1.877 1.657 10 1.837 1.910
Table 5.10: Torsional irregularity coefficients and floor rotations for Type C
Number of stories ηt,max
103θmax (radian)
1 2.394 0.097 2 2.309 0.238 4 2.201 0.736 6 2.112 1.323 8 1.996 1.573 10 1.887 1.786
Table 5.11: Torsional irregularity coefficients and floor rotations for Type D
Number of stories ηt,max
103θmax (radian)
1 2.565 0.063 2 2.403 0.168 4 2.240 0.573 6 2.128 1.084 8 2.016 1.354 10 1.925 1.611
30
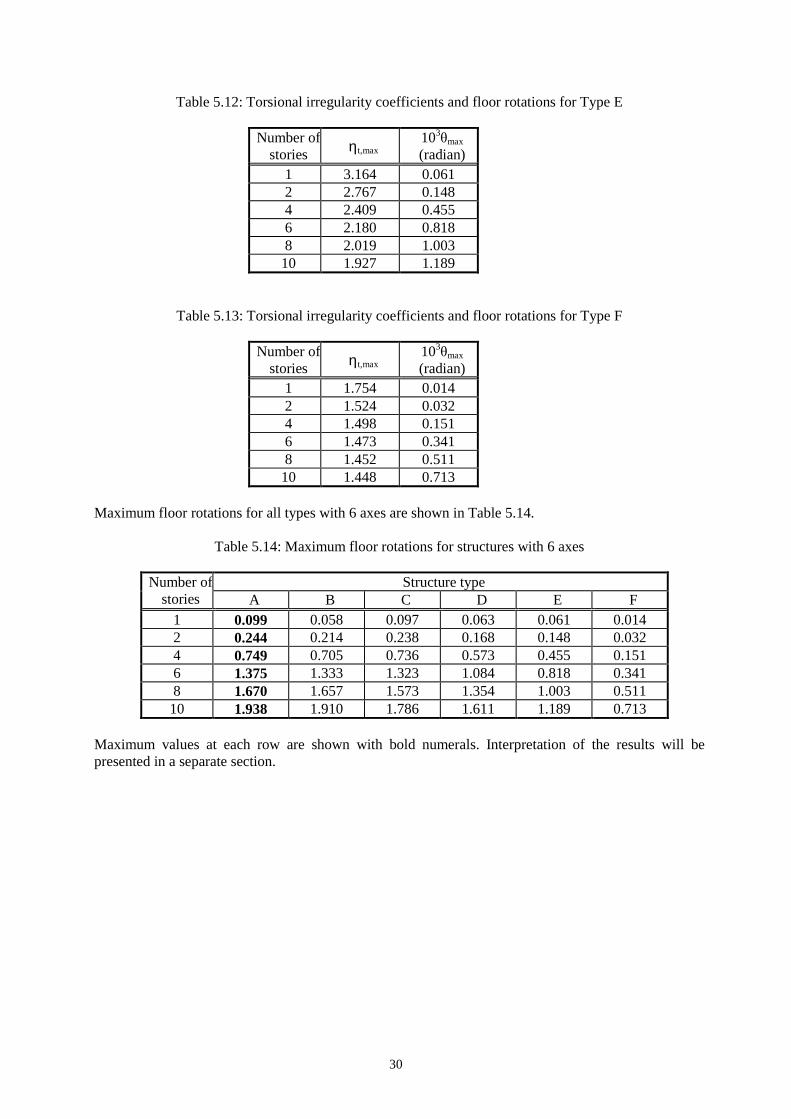
Table 5.12: Torsional irregularity coefficients and floor rotations for Type E
Number of stories ηt,max
103θmax (radian)
1 3.164 0.061 2 2.767 0.148 4 2.409 0.455 6 2.180 0.818 8 2.019 1.003 10 1.927 1.189
Table 5.13: Torsional irregularity coefficients and floor rotations for Type F
Number of stories ηt,max
103θmax (radian)
1 1.754 0.014 2 1.524 0.032 4 1.498 0.151 6 1.473 0.341 8 1.452 0.511 10 1.448 0.713
Maximum floor rotations for all types with 6 axes are shown in Table 5.14.
Table 5.14: Maximum floor rotations for structures with 6 axes Structure type Number of
stories A B C D E F 1 0.099 0.058 0.097 0.063 0.061 0.014 2 0.244 0.214 0.238 0.168 0.148 0.032 4 0.749 0.705 0.736 0.573 0.455 0.151 6 1.375 1.333 1.323 1.084 0.818 0.341 8 1.670 1.657 1.573 1.354 1.003 0.511 10 1.938 1.910 1.786 1.611 1.189 0.713
Maximum values at each row are shown with bold numerals. Interpretation of the results will be presented in a separate section.

31
5.3. STRUCTURE GROUP WITH SEVEN AXES As an illustrative example of structures with seven axes, torsional irregularity coefficients ηt and floor rotations θ of the 10-story Type A structure are shown in Table 5.15. Floor displacement diagrams are also shown schematically in Figure 5.4.
Table 5.15: Torsional irregularity coefficients and floor rotations
Story No. ηt
(δmax/δort) 103θ
(radian)
10 1.537 1.622 9 1.557 1.577 8 1.572 1.474 7 1.587 1.347 6 1.601 1.181 5 1.619 1.002 4 1.638 0.797 3 1.668 0.601 2 1.703 0.389 1 1.752 0.188
Max 1.752 1.622
Figure 5.4: Floor displacement diagrams
It is seen that for this type also, floor rotation angles increase upwards, while the torsional irregularity coefficients decrease.
32
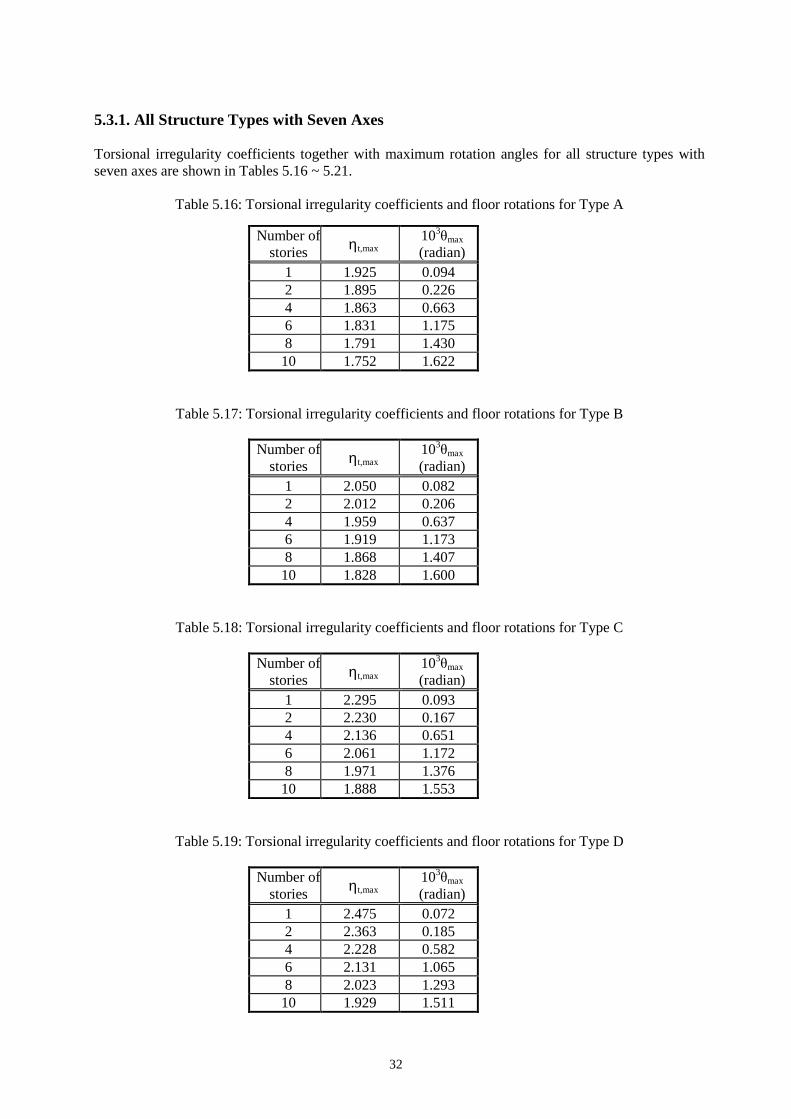
5.3.1. All Structure Types with Seven Axes Torsional irregularity coefficients together with maximum rotation angles for all structure types with seven axes are shown in Tables 5.16 ~ 5.21.
Table 5.16: Torsional irregularity coefficients and floor rotations for Type A
Number of stories ηt,max
103θmax (radian)
1 1.925 0.094 2 1.895 0.226 4 1.863 0.663 6 1.831 1.175 8 1.791 1.430 10 1.752 1.622
Table 5.17: Torsional irregularity coefficients and floor rotations for Type B
Number of stories ηt,max
103θmax (radian)
1 2.050 0.082 2 2.012 0.206 4 1.959 0.637 6 1.919 1.173 8 1.868 1.407 10 1.828 1.600
Table 5.18: Torsional irregularity coefficients and floor rotations for Type C
Number of stories ηt,max
103θmax (radian)
1 2.295 0.093 2 2.230 0.167 4 2.136 0.651 6 2.061 1.172 8 1.971 1.376 10 1.888 1.553
Table 5.19: Torsional irregularity coefficients and floor rotations for Type D
Number of stories ηt,max
103θmax (radian)
1 2.475 0.072 2 2.363 0.185 4 2.228 0.582 6 2.131 1.065 8 2.023 1.293 10 1.929 1.511
33
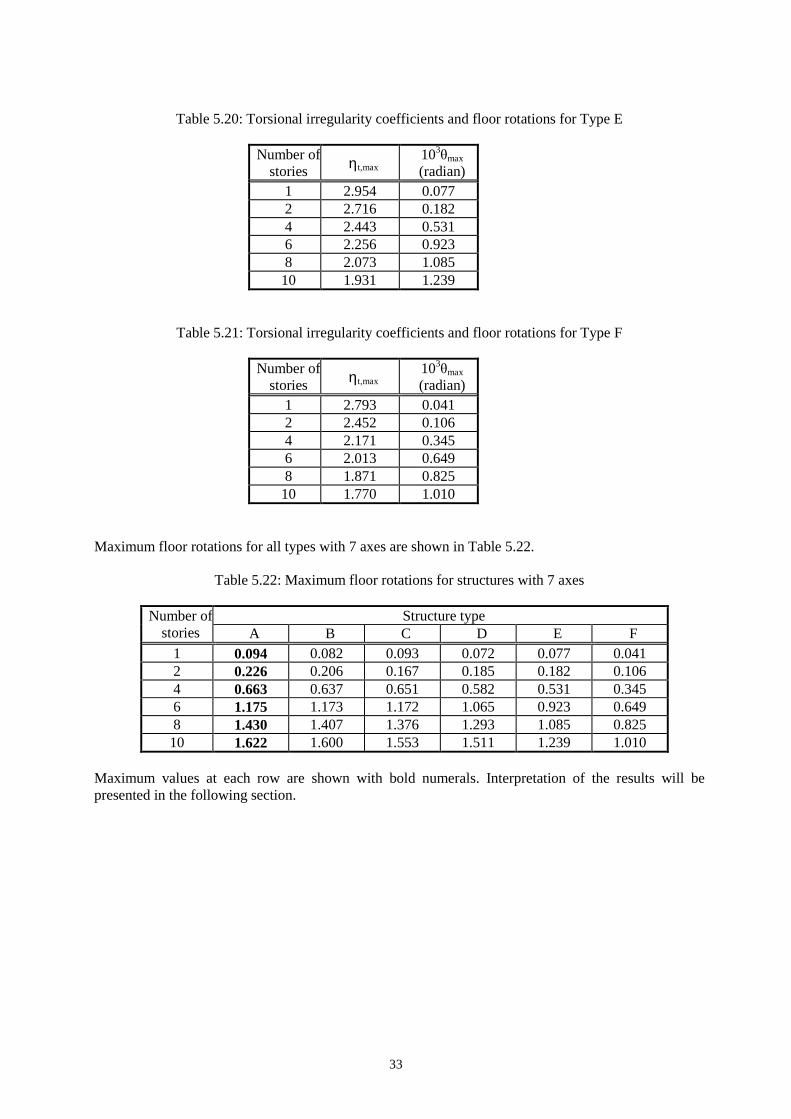
Table 5.20: Torsional irregularity coefficients and floor rotations for Type E
Number of
stories ηt,max 103θmax (radian)
1 2.954 0.077 2 2.716 0.182 4 2.443 0.531 6 2.256 0.923 8 2.073 1.085 10 1.931 1.239
Table 5.21: Torsional irregularity coefficients and floor rotations for Type F
Number of stories ηt,max
103θmax (radian)
1 2.793 0.041 2 2.452 0.106 4 2.171 0.345 6 2.013 0.649 8 1.871 0.825 10 1.770 1.010
Maximum floor rotations for all types with 7 axes are shown in Table 5.22.
Table 5.22: Maximum floor rotations for structures with 7 axes Structure type Number of
stories A B C D E F 1 0.094 0.082 0.093 0.072 0.077 0.041 2 0.226 0.206 0.167 0.185 0.182 0.106 4 0.663 0.637 0.651 0.582 0.531 0.345 6 1.175 1.173 1.172 1.065 0.923 0.649 8 1.430 1.407 1.376 1.293 1.085 0.825 10 1.622 1.600 1.553 1.511 1.239 1.010
Maximum values at each row are shown with bold numerals. Interpretation of the results will be presented in the following section.
34
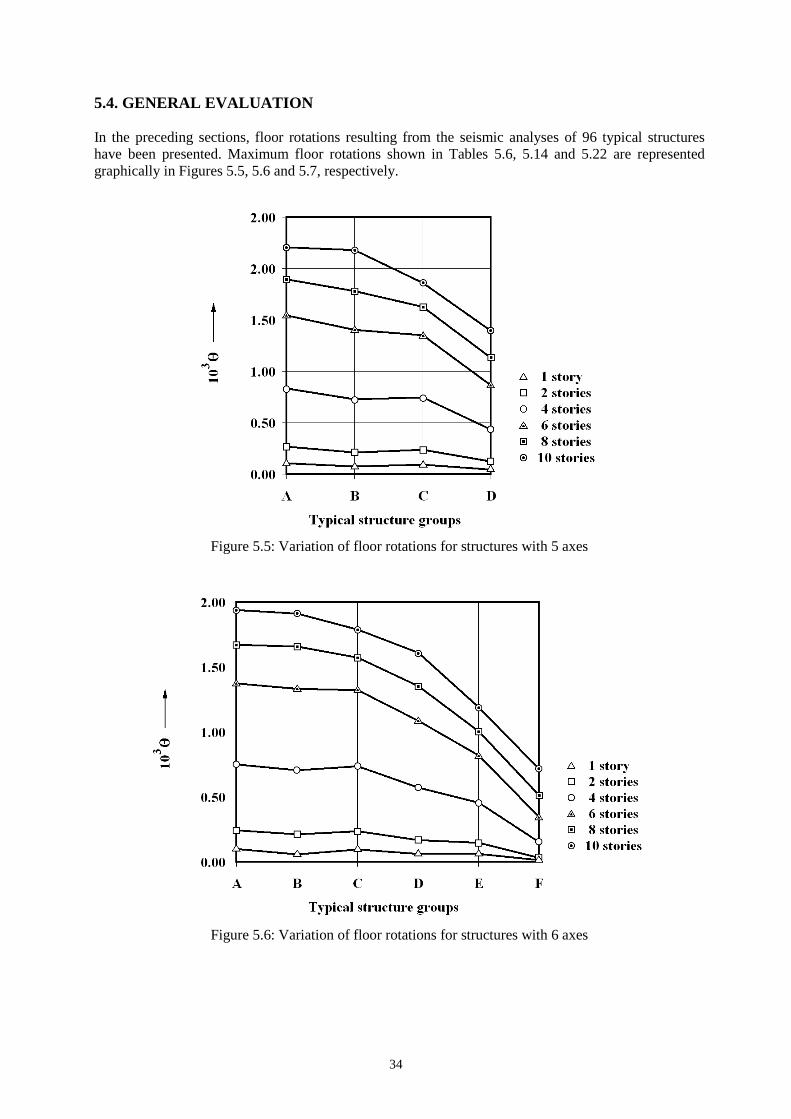
5.4. GENERAL EVALUATION In the preceding sections, floor rotations resulting from the seismic analyses of 96 typical structures have been presented. Maximum floor rotations shown in Tables 5.6, 5.14 and 5.22 are represented graphically in Figures 5.5, 5.6 and 5.7, respectively.
Figure 5.5: Variation of floor rotations for structures with 5 axes
Figure 5.6: Variation of floor rotations for structures with 6 axes
35
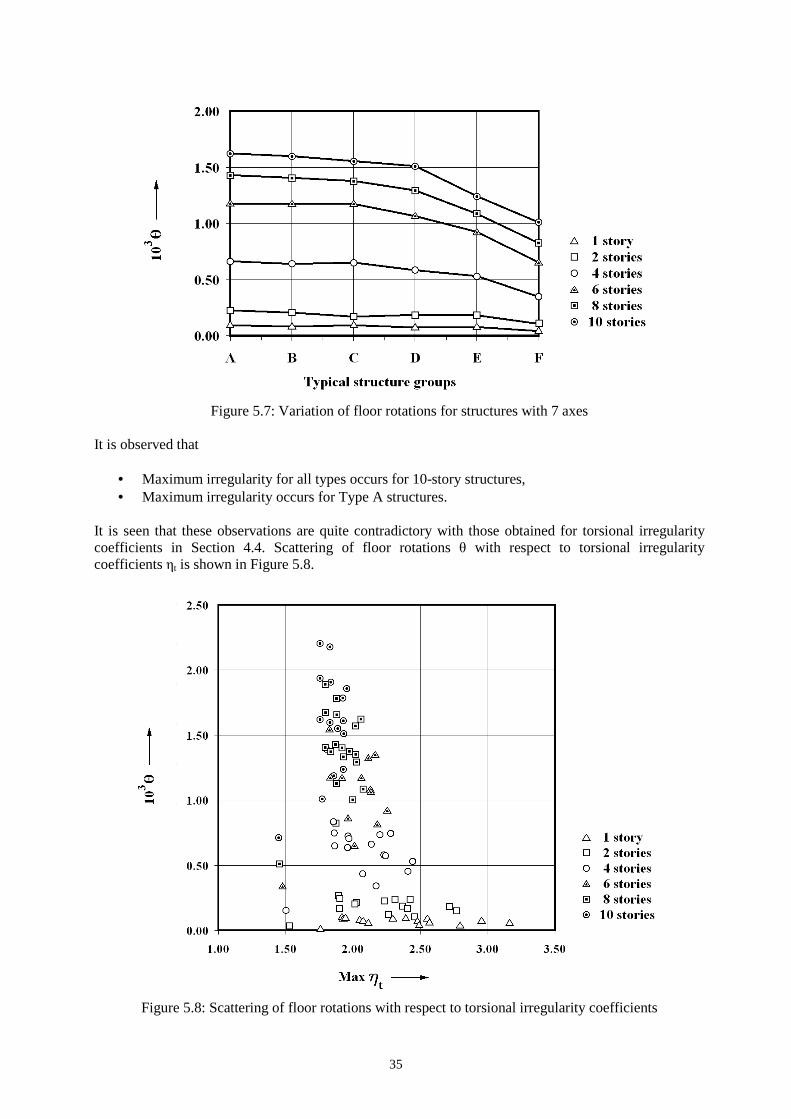
Figure 5.7: Variation of floor rotations for structures with 7 axes
It is observed that
• Maximum irregularity for all types occurs for 10-story structures, • Maximum irregularity occurs for Type A structures.
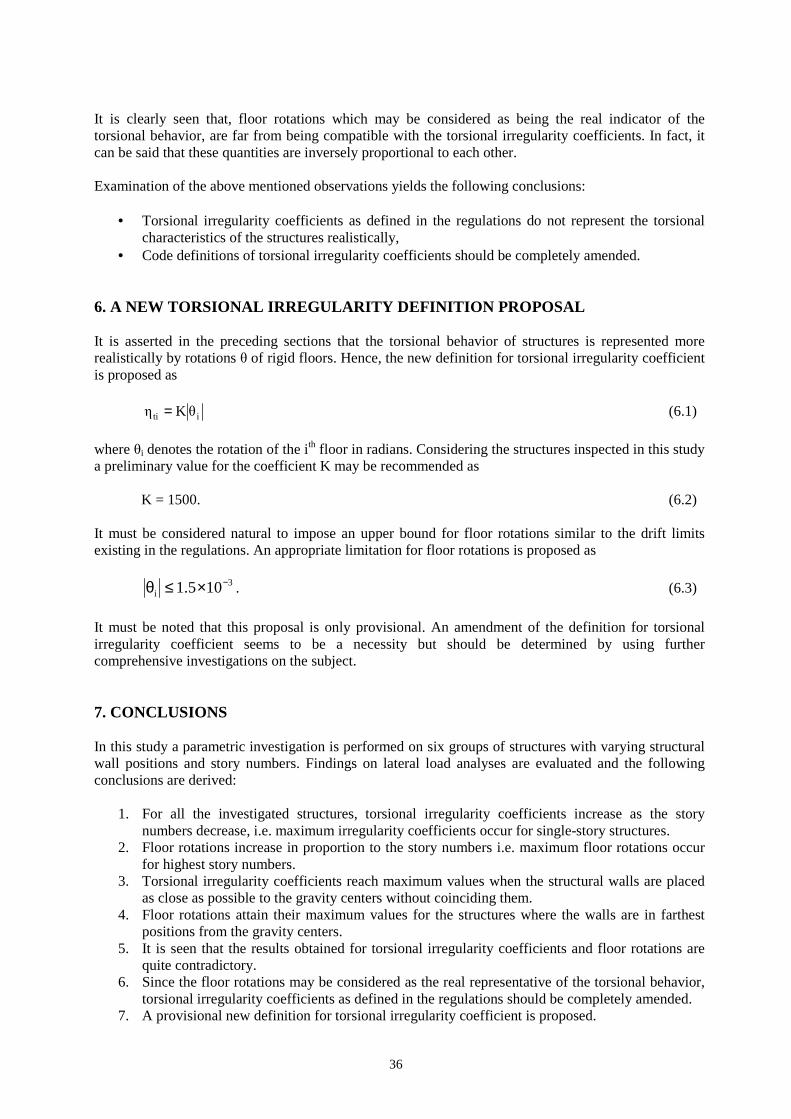
It is seen that these observations are quite contradictory with those obtained for torsional irregularity coefficients in Section 4.4. Scattering of floor rotations θ with respect to torsional irregularity coefficients ηt is shown in Figure 5.8.
Figure 5.8: Scattering of floor rotations with respect to torsional irregularity coefficients
36
It is clearly seen that, floor rotations which may be considered as being the real indicator of the torsional behavior, are far from being compatible with the torsional irregularity coefficients. In fact, it can be said that these quantities are inversely proportional to each other. Examination of the above mentioned observations yields the following conclusions:
• Torsional irregularity coefficients as defined in the regulations do not represent the torsional characteristics of the structures realistically,
• Code definitions of torsional irregularity coefficients should be completely amended. 6. A NEW TORSIONAL IRREGULARITY DEFINITION PROPOSAL It is asserted in the preceding sections that the torsional behavior of structures is represented more realistically by rotations θ of rigid floors. Hence, the new definition for torsional irregularity coefficient is proposed as iti θKη = (6.1)
where θi denotes the rotation of the ith floor in radians. Considering the structures inspected in this study a preliminary value for the coefficient K may be recommended as K = 1500. (6.2) It must be considered natural to impose an upper bound for floor rotations similar to the drift limits existing in the regulations. An appropriate limitation for floor rotations is proposed as
3i 105.1 −×≤θ . (6.3)
It must be noted that this proposal is only provisional. An amendment of the definition for torsional irregularity coefficient seems to be a necessity but should be determined by using further comprehensive investigations on the subject. 7. CONCLUSIONS In this study a parametric investigation is performed on six groups of structures with varying structural wall positions and story numbers. Findings on lateral load analyses are evaluated and the following conclusions are derived:
1. For all the investigated structures, torsional irregularity coefficients increase as the story numbers decrease, i.e. maximum irregularity coefficients occur for single-story structures.
2. Floor rotations increase in proportion to the story numbers i.e. maximum floor rotations occur for highest story numbers.
3. Torsional irregularity coefficients reach maximum values when the structural walls are placed as close as possible to the gravity centers without coinciding them.
4. Floor rotations attain their maximum values for the structures where the walls are in farthest positions from the gravity centers.
5. It is seen that the results obtained for torsional irregularity coefficients and floor rotations are quite contradictory.
6. Since the floor rotations may be considered as the real representative of the torsional behavior, torsional irregularity coefficients as defined in the regulations should be completely amended.
7. A provisional new definition for torsional irregularity coefficient is proposed.
37
8. REFERENCES [1] Duan, XN., Chandler, AM., An optimized procedure for seismic design of torsionally unbalanced
structures, Earthquake Engineering and Structural Dynamics 26:7, (1997), pp.737-757. [2] Ozmen, G., Structural Aspects of Torsional Irregularity, Fifth International Congress on
Advances in Civil Engineering, Istanbul, 2002. [3] Demir, A., Demir, D.D., Erdem, R.T., Bagci, M., Torsional irregularity effects of local site
classes in multiple storey structures, International journal of research and reviews in applied sciences, (August 2010), pp.258-262.
[4] Ozmen, G., Excessive Torsional Irregularity in Multi-Storey Structures, İnşaat Mühendisleri Odası Teknik Dergi Digest, Vol.15, No.1, (2004), pp.3331-3144.
[5] Tezcan, S.S., Alhan, C., Parametric analysis of irregular structures under seismic loading according to the new Turkish Earthquake Code, Engineering Structures, 23, (2001), pp.600–609.
[6] Penelis, Gr.G., Kappos, A.J., 3D pushover analysis: the issue of torsion, 12th European Conference on Earthquake Engineering Paper Reference: 015, (2002).
[7] Dogangun, A., Livaoglu, R. Comparison of seismic analysis methods for multistory buildings, First European Conference on Earthquake Engineering and Seismology, Geneva, Switzerland, 3-8 September, (2006), Paper No. 1314.
[8] Jinjie, M., Qingxuan, S., Qi, Z, Method of performance based seismic evaluation for irregular plane reinforced concrete frame structures, The 14th World Conference on Earthquake Engineering, October 12-17, Beijing, China, (2008).
[9] Mahdi, T., Gharaie, V.S., Plan irregular RC frames: comparison of pushover with nonlinear dynamic analysis, Asian Journal of Civil Engineering (Building and Housing) Vol. 12, No. 6, (2011), pp.679-690.
[10] Cosenza E., Manfredi G., Realfonzo R., Torsional effects and regularity conditions in RC buildings, 12th World Conference on Earthquake Engineering, Auckland, New Zealand, 30 January-4 February, (2000).
[11] Bosco, M., Marino, E., Rossi, P.P., Limits of application of simplified design procedures to non-regularly asymmetric buildings, 13th World Conference on Earthquake Engineering, (2004), Paper No. 886.
[12] Zheng, N., Yang, Z., Shi, C., Chang, Z., Analysis of criterion for torsional irregularity of seismic structures, 13th World Conference on Earthquake Engineering, Vancouver, B.C., Canada. August 1-6, (2004), Paper No. 1465.
[13] Ozhendekci, N., Polat, Z., Torsional irregularity of buildings, The 14th World Conference on Earthquake Engineering, Oct. 12-17, Beijing, China, (2008).
[14] Jeong S.H., Elnashai, A.S., Analytical and experimental seismic assessment of irregular RC buildings”, 13th World Conference on Earthquake Engineering, Vancouver, B.C., Canada. August 1-6, (2004), Paper No. 113.
[15] Jeong S.H., Elnashai, A.S., New three-dimensional damage index for RC buildings with planar irregularities, Journal of Structural Engineering, Vol. 132, No. 9, (September 2006).
[16] International Building Code (IBC09), International Code Council (ICC), (2009). [17] UBC97, Uniform Building Code, International Conference of Building Officials, Vol.2,
Structural Engineering Design Provisions, USA, (1997). [18] Minimum Design Loads for Buildings and other Structures, (ASCE7), American Society of Civil
Engineers, (2010).