Embed Size (px)
Citation preview

Disclaimer: The views and opinions expressed in this paper are those of the author and do not necessarily reflect the views of the American Council on Renewable Energy (ACORE).
The Challenges and Opportunities Posed by Distributed Solar and Net Energy Metering Torrey Beek, ACORE Intern, Winter/Spring 2014
Globally, the outlook for the solar energy sector is bright. In 2013, for the first time since at least 2000, solar surpassed wind energy in the amount of new generating capacity installed, with capacity additions totaling 36.5 gigawatts (GW)1. Longer term projections indicate that in terms of capacity and investment, solar will continue as the dominant renewable energy technology.2 This worldwide trend was also mirrored in the U.S., where according to the Federal Energy Regulatory Commission (FERC), solar accounted for 29% of all new electricity generation capacity in 2013, second only to natural gas;3 through the end of March 2014, solar energy has accounted for over 51% of new capacity additions year to date.4
A significant portion of the growth of the solar industry is due to the uptake of solar photovoltaic (PV) technology.5 Solar PV saw a 41% increase in 2013, installing 4,751 megawatts (MW),6 to bring total U.S.-‐wide PV installations to just under 10GW.7 The PV sector is braced for continued expansion with estimates for 6.6GW of installations in 2014 (a 33% gain from 2013), and could grow to 12GW by the end of 2016.8 The confluence of decreasing costs of solar panels and installations,9 availability of federal and state tax credits for solar PV systems,10 and attractive rate schedules, such as net energy metering (NEM), have driven robust expansion of small-‐scale applications of solar PV, particularly for residential buildings.11 In 2013 alone, residential homeowners installed 792MW of solar PV capacity, a 60% increase from 2012.12 Through the first quarter of 2014, residential installations of solar PV exceeded commercial installations for the first time since 2002, with 232MW installed.13
The proliferation of the residential PV market can be attributed in large part to the popularity of the NEM tariff. Adopted in 43 states in the U.S., NEM tariffs are designed to encourage the growth of distributed generation (DG), or generation of small amounts of electricity at the point of consumption (such as the customer’s home).14 NEM allows the renewable energy produced by a customer-‐owned system that is not used by the customer to feed into the electric grid, offsetting the grid electricity consumed by the customer at other times (i.e. the customer is only billed for their “net” energy use).15,16 State NEM rules, such as which types of renewable energy systems qualify and how they are credited, vary widely. With photovoltaic generation being responsible for 85.8% of the electricity sold back to utilities through NEM in 2012,17 the program has served as an important catalyst for enabling the growth of distributed solar PV in the residential sector.18
However, in recent years NEM has also proved to be a politically contentious issue, stirring conflicts between the regulated electric utility industry and solar power advocates. The U.S. electricity grid is an enormous, $840 Bn machine comprised of 2.7 Mn miles of labyrinthine transmission wires delivering $400 Bn worth of electricity each year (and requiring substantial and continual maintenance). The capitally intensive nature of the grid’s functionality and operation and maintenance (O&M) is under the purview of a regulated utility for the portions of the grid in their

respective territory.19 Given that electricity supply and demand must be perfectly balanced every moment of every day, these entities must ensure that all aspects of the sprawling grid are in perfect working order and that generating facilities are able to instantaneously respond to changes in customer demand. As the density of distributed solar PV increases on the distribution system, greater uncertainty in grid reliability has emerged as an obstacle for the growth of the solar energy industry in the U.S.20
Regulated utilities have traditionally obtained the funds necessary for grid O&M and service provision as fixed costs from customers.21 Some utilities regard NEM policies as a cross-‐subsidy: residential customers who install distributed solar PV are able to reduce their monthly electricity bills, shifting an increasing proportion of the charges associated with grid O&M onto non-‐solar customers.22 The roots of the conflict, however, may be more deeply-‐seated than the issue of cross-‐subsidies. The rise of residential net-‐metered distributed solar PV has led to a potential existential crisis for the regulated electric utility industry. In its seminal publication, Disruptive Challenges: Financial Implications and Strategic Responses to a Changing Retail Electric Business, the Edison Electric Institute (EEI), an association of U.S. shareholder-‐owned electric companies, noted:
The threats posed to the electric utility industry from disruptive forces, particularly from distributed resources, have serious long-‐term implications for the traditional electric utility business model and investor opportunities. While the threat of disruptive forces on the utility industry has been limited to date, economic fundamentals and public policies in place are likely to encourage significant future disruption to the utility business model.23
In February 2014, the Rocky Mountain Institute (RMI) published a report on the possibility of “grid defection”, a concept wherein customers detach from the centralized grid that was fundamental to the development of the U.S. society and economy in the 20th century, and operate autonomous, individual or community-‐level systems. The report noted that the confluence of inexorably increasing utility bills (exacerbated by greater numbers of customers leaving utility service plans), increasing grid charges for those customers remaining with the utilities, decreasing costs of solar PV systems and battery/energy storage systems, and increasing sophistication of off-‐grid solutions available for customers to become autonomous energy service entities could result in mass “grid defection” in the coming years or decades.24
Recent recognition of the threats posed to the regulated utility business model by distributed solar PV, net-‐metered and otherwise, and battery storage technology from investment banking firms like Bank of America Merrill Lynch25 and Barclays26 speaks to the heart of the debate surrounding utilities and distributed solar PV: what is the most effective, efficient, and fair way to assess the value that distributed solar generation provides to the electricity grid? While solar supporters have championed the retail rate compensation commonly employed through NEM tariffs, others have proposed alternative rate schedules and strategies to ensure the continued survival of the investor-‐owned utilities (IOUs) while also continuing the growth of the solar industry in the U.S. Even more long-‐term challenges exist beyond rate allocations, namely the attendant regulatory and technical challenges of a transforming electricity grid.27
This white paper will delve into the heart of the debate over distributed solar PV and NEM, from the impact on the regulated utility business model; to the counter-‐arguments from solar PV advocates; to the technical and regulatory challenges that could stymie continued growth of the residential

distributed solar PV sector; and finally to the potential approaches that exist to address the concerns of both the regulated utilities and of solar advocates. A case study of how California, presently the nation’s leader in annual installations and total capacity of solar PV, is reconciling the debate over the growth of distributed solar PV and NEM, and even embracing new forms of distributed generation and energy storage, is included to evaluate best practices and important first-‐mover strategies.
1. Setting the stage
In order to gain a proper context for the debate around distributed solar PV and NEM, it is first necessary to understand how the regulated utility business model is affected by the technology and NEM, and how utilities and solar supporters advocate for the technology to be valued.
The Investment Background of the Regulated Electric Utility Industry For over one hundred years, the regulated electric utility industry has driven economic growth and societal development in the U.S. As American society became increasingly electrified, the utility industry benefited greatly from a constant demand of electricity and the inelasticity of short-‐term power demand, helping to make it one of the safest and most investor-‐friendly industries.28 In fact, regulated utilities have been classified as a defensive industry: one which has a proven product, stable demand for that product, and low volatility in its revenue streams and cash flows.29
This historically stable regulatory environment has allowed the industry to maintain higher amounts of debt relative to cash flow (termed debt leverage) than other industries.30 High debt leverage, enabled by the confidence investors place in the utility industry, provided the industry with the means to access low-‐cost capital. This low-‐cost capital was necessary to maintain generation facility and grid functionality to provide customers with reliable and safe services. Within the traditional cost-‐of-‐service ratemaking paradigm, this access to low-‐cost capital has also allowed utilities to provide a lower cost of service, and in turn lower rates to customers.31
The emergence of distributed energy resources, particularly distributed solar PV on residential rooftops, has introduced risk into the traditionally stable utility business model.32 The worry among utility executives is that as net-‐metered distributed solar PV grows, these customers’ PV will be able to offset portions of their monthly electricity bills as the PV panels produce electricity. In jurisdictions where customer rates are a function of usage sales, these decreased electricity bills33 would force the incumbent utilities to increase customer rates to earn their requisite cost of capital. If the utilities are unable to make up this lost revenue, they risk credit erosion and the concomitant reductions in debt leverage.34
In recent years, a multitude of economic, political, and societal factors have increased pressure on the regulated electric utility industry. The industry has seen returns on equity decline to a multi-‐decade low of 10%, while at the same time seeing its cost of procuring new sources of equity increase.35 The pervasive need for capital expenditures to address crucial grid and system upgrades (often times at almost twice the rate of depreciation) to comply with various regulatory and environmental mandates have exacerbated the fears of revenue shortfall.36 Some have argued that, with forecasts for anemic electricity demand growth of less than one% per year from 2012 to 2040,37

regulators may be reluctant to approve a utility’s capitally-‐intensive investment plan.38 These factors, coupled with the aforementioned rapid decrease in price of solar PV systems, have raised the prospect that NEM may “destabilize the entire utility industry,” pushing it into a “death spiral.”39
The Arguments from Both Sides The electric utility industry maintains that its foremost responsibility is to deliver safe and reliable electricity supply, and to ensure that the rates customers pay for service are fair and affordable for all customers.40 The notion of fair and affordable rate schedules for all customer classes has become a focal point of the debate over NEM. Historically, the creation of qualifying facilities under the Public Utilities Regulatory Policy Act (PURPA) entitled homeowners to host a generation device on their property, interconnect with the electricity grid, and receive the avoided cost41 of generation from the incumbent utility for any generation they provided.42 In a sense, PURPA provided a federal “floor” for benefits given to distributed energy resources.
Some NEM policies have moved beyond avoided-‐cost compensation to allow net-‐metered distributed solar PV customers to receive the full retail rate for the electricity their panels produce and send back to the electricity grid. Often, utilities argue that compensation at the retail electricity rate allows net-‐metered customers to avoid paying the costs of maintaining the electricity grid; these customers procure significant benefits from connection to the electricity grid and should be compensated at the wholesale electricity rate (a rate lower than the retail rate).43
Utilities further argue that distributed solar PV customers procure several benefits from grid connectivity.44 At the most basic level, as Figure 1 illustrates, grid connection provides solar PV customers with the opportunity to engage in transactions through a NEM program:
Figure 1: Grid interaction between rooftop distributed solar PV system and electricity grid45
Further benefits, such as increased reliability, startup power,46 voltage quality, and increased efficiency, not only incentivize installation of distribution solar PV systems on residential property: they also make these systems far more affordable. A study by the Electric Power Research Institute (EPRI) found that without the grid-‐level services that these customers now enjoy, grid-‐connection costs would increase in the range of $275-‐$430 per month above the cost of the original array.47

Solar advocates argue for either continued compensation at the retail rate or to have compensation be designed based on marginal costs (vide infra).48 In some cases, solar advocates have recommended a higher rate, which in their view accurately conveys the holistic benefits of distributed solar PV generation.49 The disagreements over adequate and fair compensation for distributed solar customers on NEM schedules threaten a bifurcation of utility customers into solar and non-‐solar classes. EEI predicted that with a compounded annual growth rate of 22%, distributed solar PV could grow to 10% of available capacity in key markets. If this growth occurs, non-‐solar customers would experience a cross-‐subsidy in the form of an increase in their electricity rates, in excess of 20%.50 A study performed by the Vermont Public Service Department contested that notion when it found that net metered systems did not impose significant net cost to non-‐solar customers.51 Furthermore, Moody’s, a bond credit rating agency, found that in California, presently the nation’s leader in NEM participation, the cost shifts onto these customers in 2013 equaled just 0.73% of the combined revenue of the state’s three IOUs.52
Understanding the value of solar Codifying the true value of distributed solar PV to the electricity grid has emerged as a critical issue in evaluating the efficacy of programs like NEM. While the regulated utility industry utilizes a cost-‐based approach obtained from ratepayer-‐impact studies,53 solar advocates argue for a totality approach to determine the impact of distributed solar on the electricity grid. The impetus for the totality approach is the variety of benefits they see distributed solar providing to aspects of a regulated utility’s portfolio. In October 2013, the Interstate Renewable Energy Council (IREC) published a guidebook designed to assist regulators in properly assessing the benefits and costs that can be associated with distributed solar PV. The guidebook highlights nine criteria that a regulator should consider when performing a totality approach of the impacts of the technology:
1. The extent to which distributed solar PV would contribute to the utilities’ avoided cost of generation by offsetting some production from the next marginal generator54 in the merit order, and in the process offset O&M costs and the cost of the fuel used to supply the generating unit;55
2. The ability of distributed solar PV generation to reduce transmission line losses, as locally-‐produced solar generation can be exported to the grid and consumed by neighboring customers on the same circuit;56
3. The need to assign capacity credits to distributed solar generators based on their actual generation, and the ability for these credited generators to reduce utility load demand;57
4. Potential deferment of transmission and distribution system upgrades;58 5. The value utilities and regulators place upon the ancillary services provided to the grid by
distributed solar PV systems, such as volt-‐ampere reactive (VAR) support and low voltage and low frequency ride-‐through;59
6. The inclusion of a fuel hedge price;60 7. The impacts of distributed solar PV generation on the dynamics of market prices through a
reduction in overall electricity demand (particularly in peak demand usage times) and reductions in the number and amount of purchases a utility has to make on the capacity and wholesale markets;61
8. How distributed solar PV increases the resiliency and reliability of the electricity grid through decreased risk of blackouts;62 and
9. The level of environmental and societal benefits associated with distributed solar PV.63

When viewed in totality, some solar advocacy groups contend that the benefits of solar not only outweigh the costs, they also justify compensation above the retail rate guaranteed in most NEM policies.
The Solar Energy Industries Association (SEIA), the leading solar trade group in the U.S., articulated what it believes are the “best practices” for net metering and rate design for distributed solar generation. They argue that each customer has a right to self-‐generate via distributed solar PV, and that this generation should not be imputed as a cost to the utility.64 The generation should be designed according to a marginal cost that emphasizes the “long-‐run perspective in which a utility can gradually replace its current energy infrastructure” with more efficient technologies.65 While they argue that the entire array of benefits distributed solar PV provide should be considered, they maintain the need for utilities to “recover [their] cost of providing service and earn a return on investments as determined by regulators,” and that efforts should be undertaken to minimize cross-‐subsidizing and cost-‐shifts within and among customer classes.66
SEIA maintains that externalities, such as those relating to the environmental impacts of utility power generation, should be borne by market participants;67 rate-‐setting should be based on how the costs were incurred in the first placed or how they will likely be incurred in the future; and that the focus should be on reductions of utility peak load.68 Overall, utilities should act transparently with regard to rate-‐setting and price signaling: customers should be informed of how the rates set by regulators and enforced by utilities impact them, and the rate schedules themselves should be understandable to all customers.69
Reconciling competing motivations Many regulated utilities already understand that their customers want access to distributed solar PV: the technology offers an opportunity to democratize energy production. However, the crux of the debate lies in the cost-‐accounting performed to determine how to compensate these customers. The utilities contend that while the generation should be compensated for what it supplies, there is no clear set of metrics to determine what exactly these technologies are adding to the grid. Utilities prefer ratepayer impact studies that exclude externalities such as fuel costs, job benefits, and environmental compliance costs in the rate-‐valuation of distributed solar PV.70 Long the industry standard, this analysis often leads to compensation at the avoided cost of generation or wholesale rate rather than the retail rate desired by solar customers and advocates. Conversely, solar advocates believe that a totality approach that takes all externalities into account is the fairest way to determine adequate compensation; reductions in customers’ electricity bills should not be imputed as a cost to the utilities. The roots of issues over a proper valuation of distributed solar PV, however, may lie in the way this resource is evaluated by utilities: either as a net load reduction or as a net resource.
How best to integrate solar With the ubiquity of electricity in everyday life, regulated utilities must exercise due diligence in the planning process to ensure they can reliably meet the needs of customers for a long-‐term period. The integrated resource plan (IRP) is a utility function that is designed to find a least-‐cost strategy to “evaluate a wide-‐range of potential supply and demand-‐side resources to meet energy requirements and peak demand, plus a reserve margin,” including forecasted price swings of fossil fuel, risk and uncertainties associated with near-‐term construction of generation facilities, and potential

environmental mandates and regulations.71 IRPs enable utilities to model potential uncertainties in load forecasting and generation fleet performance and best assess how the full range of resources available in their portfolio can facilitate a least-‐cost approach to providing service.72 Historically, utility IRPs have focused on supply-‐side options, such as new generation units to meet a growth in demand. The implementation of state renewable energy standards and natural gas market disruptions, coupled with increases in the number of installations of distributed solar PV systems, has begun shifting the analysis to include demand-‐side resources.73
Residential distributed solar PV systems are often classified by utilities as a “behind-‐the-‐meter” resource: the incumbent utility does not own or operate it, providing them with zero transparency into the system’s operation.74 Distributed solar PV is often used to reduce on-‐site electricity demand, in which case the lower load growth projections made by a utility in its IRP would likely have already incorporated this localized demand reduction.75 Heretofore, distributed solar PV has constituted such a small portion of the electricity generation mix that utilities have had little incentive to view it as a supply-‐side resource; as such, a majority of utilities have considered it as a net load reduction, not as a resource contributor.76 However, PricewaterhouseCooper’s 2013 survey indicated that 82% of respondents in North America predict that future energy needs will be met with a mix of centralized generation and distributed generation, including sources like distributed solar PV, suggesting this classification may soon be changing.77
A questionnaire of several utilities, regulated and unregulated, conducted by the National Renewable Energy Laboratory (NREL), on the evaluation of solar (both distributed and utility-‐scale) in IRPs found that most utilities were concerned not only with the rapid adoption of distributed solar PV: some expressed anxiety that they underestimated the popularity of incentives and programs like NEM to spur demand for the technology. Most utilities have indicated that they see the groundswell of support among customers in their territories for distributed solar and plan on evaluating solar as a resource in future IRPs.78
Consideration of distributed solar PV as a supply-‐side resource would complicate the modeling analyses performed in the IRP process, as load assumptions borne out of the models would have difficulties accounting for this distributed generation on the system at the distribution or bulk levels.79 For most of the utilities polled, a key factor was determining the “threshold level” where distributed solar PV proliferated to the point where it must be considered a net resource contributor. Several factors confound clearly identifying the threshold level, such as uncertainty among utility executives over future solar PV panel prices, what capacity credit and value to attribute to the systems, and how to properly account for the integration costs associated with distributed solar PV.80
Several approaches are available to utilities to plan for the expected growth of the solar PV sector, and the results from the NREL survey indicate that utilities themselves are adjusting their business-‐practices to accommodate. As uptake of the technology continues, utilities and solar PV customers alike need to work together through cooperation and robust planning to ensure grid reliability functionality and reliability. In order to gain a more robust understanding of the engineering challenges ahead, it is worth considering the attendant technological impacts of distributed solar PV.

Technical Difficulties Presently, the contribution of distributed solar to the overall U.S. generation mix is negligible, accounting for less than 2% of total installed generation capacity.81 As the density of solar approaches the “threshold level”, it will likely be important from a grid reliability-‐standpoint for utilities to have the ability to monitor the performance of distributed solar PV systems and have the capacity when needed to affect some degree of control over the output of these systems.82
By virtue of the technology’s connection on distribution feeders,83 inverter-‐connected distributed solar resources are often located without attention to the design of the electricity grid or consideration of potential limitations in its power flow capabilities.84 As the deployment of distributed solar PV resources increases apace, distinct technical challenges that impinge on the reliability of the electricity grid may arise, including:
1. The location of distributed solar PV systems at less-‐than-‐optimal points on the network from a grid-‐operator perspective;
2. The risk of over-‐voltage or reverse power flows85 at the point of common coupling (PCC)86 leading to potential overloading of the components of the circuit and an exceedance of the thermal capacity of the network lines;87
3. Immediate disconnection of several distributed solar generators in the event that frequency variations exceed the acceptable limits set out in the grid code(s), potentially forcing the utility to reduce demand by cutting service to particular loads;88
4. General instability in generation dispatch to meet anticipated demand; and 5. Loss of stabilizing inertia as increasing amounts of inverter-‐based distributed solar PV
generation come online.89
Without robust technical planning, utilities, and by extension utility customers, could be left with the financial burden of upgrading their existing infrastructure to mitigate these issues similar to what has occurred in Germany.90 Recently, some utilities have portended the emergence of the “duck curve” as a harbinger for the unprecedented impacts of high integrations of distributed solar PV.91
The “Duck Curve” The “duck curve” was first identified in Hawaii and California, two states with high penetration of solar (both utility-‐scale and distributed, generation), and has been likened to a “worst-‐case scenario” in which:
1. A sunny but cool day in spring or fall where generation from the distributed solar PV systems drives demand for electricity down during the mid-‐day periods;92
2. Larger (i.e. baseload93) generation units markedly decrease their output, forcing these units to operate below their normal efficiencies; and
3. In the late afternoon, as the electricity generation of the distributed solar PV systems tapers off and residential end-‐user demand increases as these users return home, flexible generating resources (such as natural gas-‐fired generation units) are required to come online very quickly, and in large numbers, to ensure that the supply perfectly matches demand.94
The curve is shown below in Figure 2, using a load profile in California in 202095 for illustrative purposes:
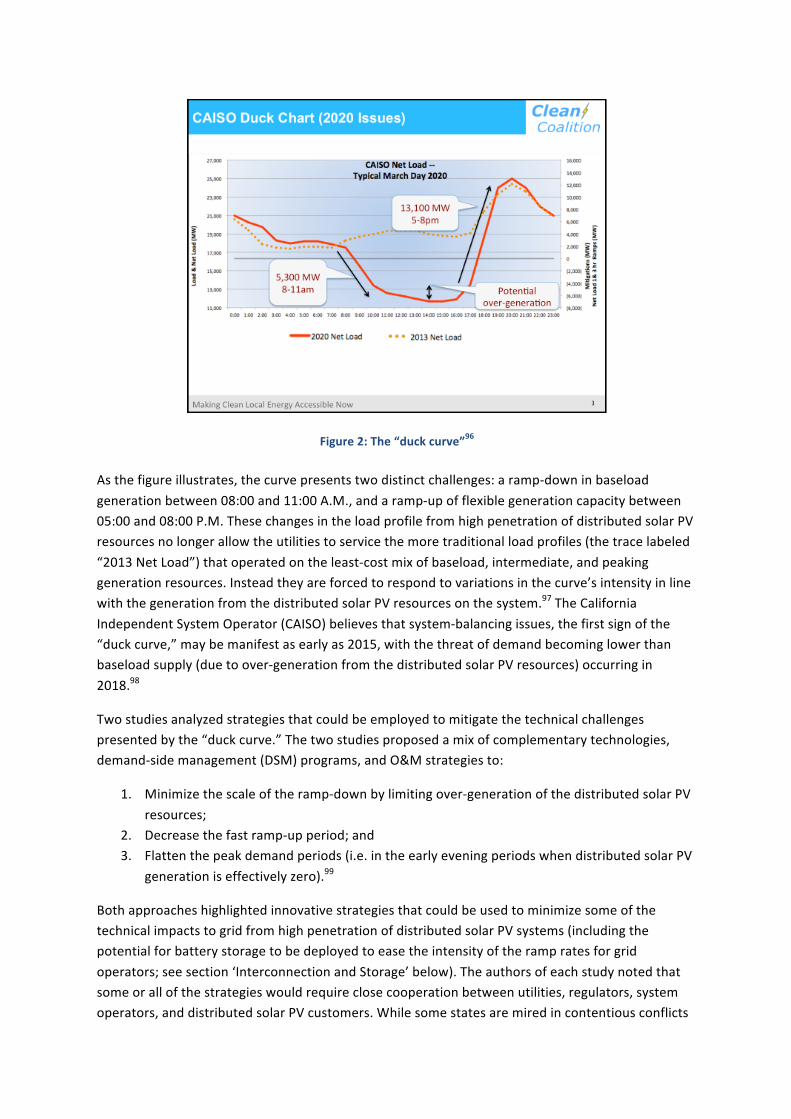
Figure 2: The “duck curve”96
As the figure illustrates, the curve presents two distinct challenges: a ramp-‐down in baseload generation between 08:00 and 11:00 A.M., and a ramp-‐up of flexible generation capacity between 05:00 and 08:00 P.M. These changes in the load profile from high penetration of distributed solar PV resources no longer allow the utilities to service the more traditional load profiles (the trace labeled “2013 Net Load”) that operated on the least-‐cost mix of baseload, intermediate, and peaking generation resources. Instead they are forced to respond to variations in the curve’s intensity in line with the generation from the distributed solar PV resources on the system.97 The California Independent System Operator (CAISO) believes that system-‐balancing issues, the first sign of the “duck curve,” may be manifest as early as 2015, with the threat of demand becoming lower than baseload supply (due to over-‐generation from the distributed solar PV resources) occurring in 2018.98
Two studies analyzed strategies that could be employed to mitigate the technical challenges presented by the “duck curve.” The two studies proposed a mix of complementary technologies, demand-‐side management (DSM) programs, and O&M strategies to:
1. Minimize the scale of the ramp-‐down by limiting over-‐generation of the distributed solar PV resources;
2. Decrease the fast ramp-‐up period; and 3. Flatten the peak demand periods (i.e. in the early evening periods when distributed solar PV
generation is effectively zero).99
Both approaches highlighted innovative strategies that could be used to minimize some of the technical impacts to grid from high penetration of distributed solar PV systems (including the potential for battery storage to be deployed to ease the intensity of the ramp rates for grid operators; see section ‘Interconnection and Storage’ below). The authors of each study noted that some or all of the strategies would require close cooperation between utilities, regulators, system operators, and distributed solar PV customers. While some states are mired in contentious conflicts

over distributed solar PV and NEM, California has emerged as a vanguard by actively working to placate the concerns of both the regulated utilities and solar advocates, and in the process encouraging the continued growth of the technology.
2. Sunny California By almost any metric, California is the king of solar in the U.S. The state ranks first in terms of total solar energy jobs,100 has over 50% of the total solar rooftop installations with over 100,000 systems connected to the grid,101 and accounted for 38% of all net-‐metered solar capacity in the U.S.102 The state’s NEM policy, established in 1995, has served as an important catalyst for the growth of California’s distributed solar, rooftop solar, and utility-‐scale solar PV markets.103 On a single day, March 16, 2014, 4,143MW of solar energy, enough to power 3 M homes, was recorded by the CAISO. The record-‐setting figure, which accounted for 16.5% of total demand, did not even include the estimated 1,100MW of distributed solar PV capacity installed throughout the state. From a grid operational standpoint, the magnitude of solar output indicated that California’s grid is ready for a high integration of renewable energy capacity, and that solar energy is likely to lead the charge.104
A brief history of solar energy in California California’s status as a leader in the solar energy space can be traced to its commitment to renewable energy. In December 2011, the California Public Utilities Commission (CPUC) updated the state’s renewable portfolio standard (RPS) in Senate Bill X1-‐2, stipulating that 33% of the sales from each retail seller of electricity in 2020 must come from RPS-‐eligible resources like solar power.105 Moreover, the solar boom in California has been promulgated by a mix of government drivers, incentives, and regulatory policies. The California Solar Initiative (CSI), borne out of the “Million Solar Roofs” vision and launched in January 2007, provides upfront incentives in the form of solar rebates to customers of California’s three investor owned utilities (IOUs) under the direction of the CPUC.106 Through the CSI, the Go Solar California program was created pursuant to a statewide goal to install 3,000MW of distributed solar capacity by 2017.107
The Self-‐Generation Incentive Program was developed to provide incentives for qualifying technologies like distributed solar PV systems installed on the customer’s side of the meter (i.e. “behind-‐the-‐meter”).108 In 2012, California Governor Brown further galvanized the growth of the state’s solar industry when he called for 12,000MW of distributed generation to be in place by 2020. Solar energy, and distributed solar PV in particular, is expected to play a large role in meeting the mandate.
2013 was an active year for the state’s solar PV sector: California led the nation with an increase in PV capacity of 2,621MW, and placed second with 400MW of residential distributed solar PV installations;109 the technology alone suppressed electricity demand growth by an estimated 47%.110 The first few months of 2014 are continuing that trend, as California accounted for more than 55% of nationwide residential solar PV installations.111 As of April 30, 2014, Pacific Gas & Electric (PG&E) and Southern California Edison (SCE), two of the state’s three IOUs, had 572.6MW of residential distributed solar PV energy on their grids, with an additional 41.3MW pending.112

AB-‐327 Although distributed solar PV only accounted for 0.4% of the state’s 2013 demand, California was the scene of a contentious debate over electricity rate-‐setting, NEM, and the role of distributed solar PV in meeting a utility’s peak load.113 For years, California employed a tiered-‐pricing structure that charged customers rates depending on their monthly electricity consumption (i.e. the more electricity a customer consumes, the higher price they pay per kilowatt-‐hour). The tiered-‐pricing scheme proved unpopular, leading to the drafting of Assembly Bill 327 (AB 327) to reduce the number of customer rate tiers from four to “at least two.”114
California’s three IOUs and the CPUC had noted the destabilizing potential of net-‐metered distributed solar PV in advance of AB 327: a September 2013 study drafted by the CPUC estimated that by 2020, NEM generation (both residential and non-‐residential) would impose a “direct cost to ratepayers” of $1.1 Bn, an amount equal to 3.2% of the forecasted revenue for the state’s IOUs, and an annual “cost shift” of $359 M from distributed solar PV customers to non-‐solar customers.115 However, several critiques and inconsistencies within the study were quickly noted, namely the oversight that the figures the CPUC used for direct-‐cost and the cost-‐shift attributable to NEM were based on the very tiered-‐pricing schedule that AB 327 will alter.116
Although AB 327 was designed to address rate-‐setting for all customer classes, solar advocates quickly highlighted aspects of the proposed legislation that would abrogate several benefits provided to distributed solar PV customers and the possibility that the legislation could end the state’s NEM program at the end of 2014.117 Governor Brown and California state legislators offered a novel approach to the conflict when they amended AB 327. The amended bill removed the threat of an end to NEM and developed a procedure to standardize the process by which each IOU would calculate its individual statutory cap for accepting NEM applications. In the process, they laid the foundation stone for the development of a more long-‐term program that would ensure “customer-‐sited renewable distributed generation continues to grow sustainably”.118
On March 27, 2014, the CPUC handed down a decision on AB 327 that identified two potential “trigger level” dates when a “Standard Contract” conveying a new level of NEM compensation will come into effect: July 1, 2017, or the date at which a particular customer’s IOU reaches its 5% of nameplate capacity statutory cap. Furthermore, the ruling:
1. Establishes a 20-‐year transition period, beginning on the date the solar customer is interconnected with the grid, during which a customer will be included on the current NEM policy provided the date in question is on the earlier of July 1, 2017 or the date on which the customer’s utility reaches its cap;
2. Mandates that customers who interconnect with their incumbent utility on the earlier of one of the transition-‐dates must be given a “reasonable opportunity to recoup the costs of their investment” in a distributed generation system; and
3. Mandates that by the end of 2015 the CPUC must decide what rules will apply to solar customers who wish to net meter after the earlier of the two transition-‐dates and to existing net-‐metered customers after their 20-‐year transition period expires.
The CPUC’s decision was significant in that it provided certainty for both customers who are interested in installing a distributed solar PV system with the benefit of a NEM incentive and the state’s IOUs working to accommodate the popularity of NEM, bolster their electricity grid to handle

increasing amounts of intermittent generation, and comply with the state’s aggressive RPS mandate. The 20-‐year transition period was selected due to the expected life of most solar PV systems and reflects the terms of a typical power purchase agreement that distributed solar PV customers often enter into with a solar development company.119
Figure 3 illustrates, the policy and regulatory decisions affecting California’s NEM policy from 2013 to the “trigger level” dates on the earlier of July 1, 2017 or the reaching of an IOU’s cap:
Figure 3: Timeline for NEM in California, 2013 to 2017120
The Impact of the closure of SONGS In January 2012, the 2.2GW San Onofre Nuclear Generating Station (SONGS) was initially shut down due to premature wear on the tubes in the plant’s replacement steam generators. The closure of SONGS, owed to regulatory uncertainty following the initial shutdown, was not only a heavy financial burden for SCE and San Diego Gas and Electric (SDG&E), at an estimated price tag of $4.1 Bn, it also represented the loss of generation capacity capable of powering 2.3 M homes in between the massive load centers of Los Angeles and San Diego.121 Worse yet, the costs associated with the plant’s closure and generation shortfall risked a potential bifurcation of the California market from large price differentials between Northern California (largely unaffected by SONGS) and Southern California (whose customers would experience significantly increased energy prices from the closure).122
Following the closure of SONGS, the CPUC had to ensure that all customers in California received reliable electricity service without unduly burdening one segment of the state’s customers with the closure and clean-‐up costs. The Commission ruled that approximately 1.0GW –1.5GW of generation would be required to make up the shortfall in generation,123 and that 600MW would come from “preferred sources,” or those that have lower environmental impacts and lower public health costs vis-‐à-‐vis fossil-‐fuel generation.124 The emphasis on preferred sources, combined with Governor Brown’s mandate for 12,000MW of distributed generation, provided further opportunity for the growth of distributed solar PV energy. However, the impact of the SONGS closure also demonstrated that research and innovation in the development of smart inverters, the interconnection application

process, and battery storage technologies will prove crucial to addressing the manifold technical and regulatory challenges facing California’s push for increased integration of distributed solar PV and renewable energy resources. One example of a technological solution is the smart inverter.
The Smart Inverter Working Group California’s Smart Inverter Working Group (SIWG) was formed in January 2013 in response to growing interest in the potential of smart inverter technology. Smart inverters have the potential to mitigate some of the localized voltage issues and other technological challenges125 that could arise as the density of sources like distributed solar PV increases, and in the process further strengthen the grid to accommodate increasing amounts of other forms of distributed energy resources.126 They are unique in that they allow for communication between the distribution system (where the solar PV systems are installed) and grid operators charged with monitoring the balance between electricity supply and demand. Incorporation of smart inverters into the larger Information and Communication’s Technology platform can allow utility and retail energy providers to communicate with distributed solar PV systems to override autonomous functionalities in response to several factors, including:
1. Demand-‐response price signals; 2. Real and reactive power requirements for grid stability; 3. Schedules for energy and ancillary services; 4. Increasing cyber security; 5. Utility load-‐shedding and safety settings; and 6. More-‐efficient operation of expensive distribution equipment like capacitor banks.127
The SIWG is tasked with researching and modeling the ability for smart inverters to ease the transition from the traditional uni-‐directional power flow from a centralized generating plant to the bi-‐directional power flows that characterizes a grid replete with distributed energy resources.128 The group’s goal is to technically evaluate the ability for smart inverters to improve the autonomous functions129 that distributed energy resources like solar PV may be required to perform, define and propose various communication standards that will be necessary for these systems to communicate with grid operators,130 and analyze the specific technical challenges131 that smart inverters may face on the road to deployment and grid-‐integration. As experience in Germany has shown, where the cost of retrofits for existing inverters to have “smart” functionalities is estimated to total $300 M, the financial penalties of delaying the deployment of smart meters as the density of distributed solar PV increases can be sizeable.132 Presently, smart inverters are not code-‐compliant with the U.S. national standards,133 and with the often significant timespans between revisions of grid code standards,134 it appears unlikely that full-‐scale adoption of smart inverters into the U.S. grid code will occur in the near future. Despite the slow gears of change on the federal level, California amended its grid code standard in 2000 in response to the influence of NEM on the uptake of distributed solar PV systems, and expects the first phase of the SIWG’s results to be published in October 2015.135 While the state continues to pioneer development of legislative, regulatory, and technological solutions to the impacts of net-‐metered distributed solar PV, it has also been forced to address even more fundamental, and potentially paradigm-‐shifting, changes to the relationship between regulated utilities and their customers.

Interconnection and Storage As the popularity of NEM has driven growth in residential distributed solar PV, California’s three IOUs have been faced with almost consistent increases in the volume of interconnection requests they receive from their customers. SDG&E saw a 108% increase in NEM authorizations from 2012 to 2013, with over 11,000 new customer-‐projects interconnected to the grid in 2013 alone, and a 73% growth rate predicted from 2013 to 2014. PG&E, which currently services 25% of rooftop distributed solar PV systems in the U.S. with 107,680 systems installed to date, has seen increasing numbers of customers applying for their NEM program, with 2,790 applications per month expected in 2014.136 In an April 2014 NREL-‐sponsored webinar, both IOUs discussed how the deluge of interconnection applications and requests they have seen in recent years have forced them to develop new interconnection application processes designed to handle the breadth and volume of requests. At the same time, both SDG&E and PG&E are refining methods to more effectively allocate the human and technical resources necessary to adequately retrofit their grid in line with the increasing amounts of distributed generation coming on-‐line.137
Concurrent with the growth of NEM-‐interconnection requests, the California legislature approved Assembly Bill 2514 (AB 2514),138 a first-‐of-‐its-‐kind storage mandate, in October 2013. The mandate required the state’s three IOUs to install 1.325GW of storage by 2020,139 with the goals of the mandate focusing on how to better interconnect renewable energy resources and meet the state’s aggressive RPS mandate.140 From the perspective of distributed solar PV, the mandate included some aspects of behind-‐the-‐meter storage and encouraged more third-‐party ownership, two points of emphasis that feed into the nascent distributed solar-‐plus-‐battery storage movement already underway in the state.141
The prospect of distributed solar-‐plus-‐battery storage, referred to as the “utility-‐in-‐a-‐box”, could allow a residential customer to completely sever its ties with the utility: customers can utilize distributed energy systems like solar PV to meet on-‐site electricity demand, use the battery storage system to store excess generation, and finally use this stored energy to meet on-‐site demand when the solar PV system is not producing enough electricity. Although the economics of energy storage are at least several decades away from being a viable option for residential customers in the U.S., RMI’s report found that California is one state that could see the predicted price declines of the “utility-‐in-‐a-‐box” model allow residential customers to pursue this option within the next 30 years.142
The state’s IOUs noted that although storage would be beneficial in easing the ramp-‐up rates and that the locational value of storage on distribution feeders could ease some of the technological challenges associated with the growth of distributed solar PV systems, the prospect of these customers could store both grid and solar-‐produced electricity in their battery systems and then sell this electricity back to the utility at higher rates than it cost to produce would further threaten their revenue recovery mechanisms.143 Despite the risk of customers going off-‐grid with the aid of storage systems, RMI’s study found that the greatest benefit for both distributed solar customers and utilities exists when these solar-‐plus-‐storage systems are integrated into the grid, not divorced from it.144
The tension between the IOUs and residents seeking interconnection agreements for distributed solar-‐plus-‐battery storage reached a head in early 2014, when SolarCity, a leading solar PV system provider, discontinued its applications for storage systems amidst what it saw as excessive utility

interconnection fees.145 Customers who had already applied for interconnection complained of long-‐wait times for approval and protested what they saw as exorbitant and unjust fees imposed on them by the incumbent IOUs.146 The conflict forced the CPUC to address the unprecedented changes to customer empowerment and electricity provision associated with interconnection and battery storage, and once again thrust California to the forefront of the debate.
In response, the CPUC began considering the issue of the imposition of interconnection fees on residential customers seeking solar-‐plus-‐battery storage systems. The utilities noted in their comments leading up to a proposed decision that these systems would accelerate the cost-‐shift for grid maintenance to non-‐solar customers and could even impose safety hazards to the function of the distribution system.147 Furthermore, SDG&E contended that the existing NEM subsidy, combined with AB 2514, was sufficient to incent the deployment of distributed storage technologies. Solar advocacy groups countered that storage combined with renewables provided the highest operational value for utilities by giving them the opportunity to manage loads more effectively (and locally) and to smooth power quality issues on the distribution circuits.148
In April 2014, the CPUC issued a proposed decision declaring that storage devices paired with NEM-‐eligible generation facilities like solar PV were exempt from the interconnection application fees, supplemental review fees, costs for distribution upgrades, and standby charges when interconnecting. It did not consider storage to be a “Generator” as defined in and subject to Rule 21 Interconnection tariffs; rather, it considered a “generation facility” to include a generator (distributed solar PV) plus an addition or enhancement (i.e. battery storage). The Commission’s decision openly criticized the state’s IOUs, noting that they “disagree with IOUs’ conclusions [regarding interconnection fees and storage] and would have preferred that the IOUs had taken a more proactive and collaborative approach to avoid creating barriers” in the interconnection process.149 Although the proposed decision was not an out-‐right win for solar advocacy groups, it did result in SolarCity restarting its interconnection applications.150
The basic economics of storage need to improve, although the potential for falling costs and regulatory mandates like FERC Order 755151 provide opportunities for storage to become more economical for residential customers. Overall, California has recognized the need to support the nascent storage industry with the prescience to see that distributed solar combined with battery storage is a powerful development to democratize energy production. In a broader sense, the emphasis the state has placed on crafting legislation that mandates and incentivizes the uptake of renewable energy and storage technologies, seeking regulatory decisions that take the concerns of all parties into account, and undertaking detailed studies on the technological impacts associated with distributed solar PV and storage systems, demonstrates its commitment to stand at the vanguard of the growing distributed energy revolution.
Heretofore, this white paper has examined the impact of net-‐metered distributed solar PV on the utility business model, the regulatory processes evolved in ascribing a value of the services distributed solar PV supplies to the grid, and the general technological function of the electricity grid. Regulated utility customers are actively seeking to democratize the production of energy, and as evidenced by the popularity of NEM in parts of the country, this movement has proved popular. The regulated utility industry, cognizant of their history as a defensive industry that recoups both fixed and variable costs through customer rates,152 has tended to view distributed solar PV, NEM,

and even battery storage as the potential beginning steps towards a new paradigm wherein customers could disintermediate themselves from utilities.
3. Alternatives to NEM
With a raft of legislative and regulatory filings regarding NEM emerging in states across the U.S, significant interest has been shown and research undertaken from both regulated utilities and solar advocacy groups to determine possible alternatives to than NEM. When NREL asked a sample of utilities throughout the U.S. what options other than NEM they would consider, the questionnaire returned three potential options: fixed cost recovery, a value of solar tariff (VOST) rate schedule, and a reframing of the cost-‐of-‐service framework.153
A fixed cost recovery system could involve the use of demand charges, customer chargers, or standby charges to recover portions of the fixed costs that utilities claim distributed solar PV could shift from one rate class to another. This revenue-‐recovery model was implemented in Arizona in January 2014,154 while Oklahoma is presently considering the option of imposing a fixed cost to distributed generation customers.155 However, utilities have been reticent to implement such charges for fear it could be viewed as cost for “going solar.”156
A VOST is a rate schedule in which a utility customer pays all applicable charges on their monthly electricity bill while the utility purchases all of the distributed solar PV system’s output at a rate that represents the value provided to the utility by the distributed energy resource. 157 In other words, the tariff separates an end-‐user’s consumption of energy from the compensation they receive from the utility, allowing the utility to pay a transparent and market-‐based price for the system’s output.158 In March 2014, Minnesota established the nation’s first VOST as a potential alternative to NEM. The Minnesota Department of Commerce developed a framework for the VOST based on the annually-‐adjusted savings from several of the benefits that IREC argued can be attributed to distributed solar PV generation.159 The state’s VOST is designed to reflect the monetary value that solar provides to utilities, power producers, and society and ultimately reduce the need for incentives to drive the continued growth of the technology. 160
The VOST provides utilities with an economic equation specified in the tariff-‐framework to define the level of market price that should be provided to distributed solar PV power producers, levelized over 25 years (the estimated life of a solar PV panel) at a discount rate of 3%, adjusted for inflation, and updated annually.161 The transparency of the market price would uncouple the compensation from the retail electricity rate, helping to mitigate the potential for a cross-‐subsidy for non-‐solar customers.162 Several addition benefits were identified, including:
1. The ability for the utility to recover the infrastructure costs associated with the grid’s functionality and O&M through the separate billing structure,
2. The obviating of any standby charges for residential customers who install net-‐metered PV systems,163 and
3. The opportunity for the Minnesota Public Utilities Commission to adjust future VOS rates according to the previous year’s inflation rate, as noted above.164

The tariff would be set at $0.145/kWh, higher than the state’s NEM level of $0.115/kWh. Using these rates, a customer with a 5-‐kilowatt solar PV system under the VOST would earn $200 above the compensation they would receive using the state’s NEM program, although the cost of NEM is expected to increase substantially in-‐line with future increases in the retail cost of electricity.165
The VOST model approved by Minnesota has faced critique from both sides. Utility advocates objecting to calculation of the environmental benefits associated with distributed solar PV,166 while solar advocates objected to the limits on on-‐site consumption and the forfeiture of solar renewable energy credits to the customer’s incumbent utility.167 Further criticism has highlighted the possibility that, due to the separation of consumption and production, net-‐metered solar PV customers could have their production rebates considered as taxable ordinary income, and that these customers may be ineligible for the investment tax credit to help finance the system.168
Finally, utilities could consider an overhaul of the cost-‐of-‐service framework wherein they would line-‐up all of the services a utility provides to its customers and all of the services a distributed solar PV system provides to the utility and the grid. Such a “line item” cost review is very complex, not in the least due to the disagreement over the specific services provided by distributed solar PV to the utility and the grid.169
4. Moving forward
As the growth of net-‐metered distributed solar PV has focused attention on the future of the regulated utility industry, much has been made of comparisons between the industry and the events that befell the telecommunications industry beginning in the 1970s. The telecommunications industry, once fully regulated and dominated by monopolies, was completely overhauled by the introduction of new, “disruptive” technologies and upstart market entrants eager to erode the legacy of the sector’s stalwarts.170 Although important distinctions exist, regulated utilities, like the telecommunications industry, may be forced to shift their regulatory strategies to focus on setting long-‐term goals to meet changing customer demands. Such performance-‐based regulation would augment the cost-‐of-‐service regulatory design by inserting an upside for utilities willing to innovate to improve the service provided to their ratebase,171 and potentially shift their role more towards that of grid service providers.172
As investors are hinting at divesting pension funds from electric utility stocks, citing the revenue-‐erosion and introduction of new risk from distributed generation sources,173 and as electric sector stocks are being downgraded, the optics appear to be shifting towards a radically new view of the regulated utility industry and the very nature of electricity supply and demand.174 The confluence of several complimentary factors increasing demand for distributed solar PV energy have led some to argue for regulated utilities to abandon the ad hoc approaches focused on cost-‐recovery mechanisms or incentives schemes.175
In fact there is nothing preventing the development of a model that financially rewards a utility for considering distributed solar PV and distributed energy generation in general as opportunities for the industry to grow and change. As NEM spurs the further growth of distributed solar PV, regulated utilities must find a way to work with, rather than compete against customers adopting these

technologies.176 The electrical generating system of the future, one of greater complexity at the behind-‐the-‐meter distribution, wholesale distribution, and transmission levels than today’s current formulation, may indeed necessitate the transformative and “disruptive” changes envisaged by EEI.177

Endnotes 1 See Pernick, Ron, Clint Wilder, and James Belcher. Clean Energy Trends 2014. Review, Clean Edge, 2014, (2). 2 See The Pew Charitable Trusts. Who's Winning the Clean Energy Race 2013. Review, Washington: The Pew Charitable Trusts, 2014, (31). 3 See The American Council on Renewable Energy. The Outlook for Renewable Energy in America 2014. Review, Washington: The American Council on Renewable Energy, 2014, (16). 4 Solar added 47 new generation units (either new build or expansion) through January, February, and March 2014, totaling 584MW of installed capacity. Total installed capacity additions through March 2014 for all energy sources totaled 1,150MW. See The Federal Energy Regulatory Commission. Energy Infrastructure Update for March 2014. Update, Washington: The Federal Energy Regulatory Commission, 2014, (3). In terms of nameplate capacity additions, solar energy of all types (see footnote 5) accounted for 74% of new electric generating capacity additions in 2013. See Solar Energy Industries Association. U.S. Solar Market Insight Report: Q1 2014 Executive Summary. Executive Summary, SEIA, 2014, available at: http://www.greentechmedia.com/research/ussmi, (3). 5 Solar energy technologies include photovoltaic (PV), solar hot water, solar electricity (usually involving concentrated solar power), passive solar heating and daylighting, and solar process space heating and cooling technologies. This paper will focus exclusively on solar PV. See Types of Solar Energy. n.d. http://www.renewableenergyworld.com/rea/tech/solar-‐energy (accessed April 7, 2014). 6 See The American Council on Renewable Energy. The Outlook for Renewable Energy in America 2014. Review, Washington: The American Council on Renewable Energy, 2014, (16). 7 See Electric Power Research Institute. (2014). The Integrated Grid: Realizing the Full Value of Central and Distributed Energy Resources. Palo Alto: EPRI, (10). 8 See Stromsta, Karl-‐Erik. Solar tops US Q1 power additions. May 29, 2014. http://www.rechargenews.com/solar/article1363739.ece (accessed May 29, 2014). 9 The cost of residential PV systems decreased by 8.8% in 2013, from $5.03 per watt in 2012 to $4.59 per watt. See Solar Energy Industries Assocation. U.S. Solar Market Insight Report: 2013 Year-‐In-‐Review Executive Summary. Review, Washington: Solar Energy Industries Assocation, 2013, (16). As Figures A.1 illustrates, the nationally averaged price of a PV panel has decreased by 60% since the beginning of 2011.

Figure A.1: Average PV System Price, 2001-‐2013
See Solar Energy Industries Association. "Solar Energy Facts: 2013 Year In Review." U.S. PV Market Installs 4751MW; Largest Year On Record. Washington: Solar Energy Industries Assocation, March 5, 2014. For a more complete discussion of the declining price of solar PV systems in the U.S., See Barbose, Galen, Naim Darghouth, Samantha Weaver, and Ryan Wiser. Tracking the Sun VI: An Historical Summary of the Installed Price of Photovoltaics in the United States from 1998 to 2012. Report, Washington: Lawrence Berkeley National Laboratory, 2013. 10 The primary federal tax credit is the Investment Tax Credit (ITC), which provides a 30% tax credit for solar PV systems to residential (under Section 25D) and commercial (under Section 48) properties. The ITC has been credited with driving a 1,600% growth in annual solar installations since 2016. See Solar Investment Tax Credit (ITC). n.d. http://www.seia.org/policy/finance-‐tax/solar-‐investment-‐tax-‐credit (accessed April 7, 2014). Several state-‐specific tax credits exist to encourage installation and build-‐out of solar energy projects and systems. For a comprehensive database, See Database of State Incentives for Renewables & Efficiency. Tax Credits. 2013-‐2014. http://www.dsireusa.org/solar/solarpolicyguide/?id=13 (accessed April 7, 2014). 11 See Bloomberg New Energy Finance and The Business Council for Sustainable Energy. 2014 Sustainable Energy in America Factbook. Washington: Bloomberg New Energy Finance, 2014, (53-‐54). 12 See Doom, Justin. Crowdfunding Seen Topping $5 Billion for Rooftop Solar. April 8, 2014. http://www.bloomberg.com/news/2014-‐04-‐08/crowdfunding-‐seen-‐topping-‐5-‐billion-‐for-‐rooftop-‐solar.html (accessed April 8, 2014). 13 See Solar Energy Industries Association. U.S. Solar Market Insight Report: Q1 2014 Executive Summary. Executive Summary, SEIA, 2014, available at: http://www.greentechmedia.com/research/ussmi. 14 In theory this eliminates the transmission and distribution losses associated with the generation of large amounts of power from a centralized location. See U.S. Energy Information Administration. "Policies for compensating behind-‐the-‐meter generation vary by State." Today in Energy, May 9, 2012. 15 See Solar Energy Industries Association. Issues & Policies: Net Metering. n.d. http://www.seia.org/policy/distributed-‐solar/net-‐metering (accessed April 7, 2014). 16 Strictly speaking, NEM tariffs were introduced to provide a customer who installs a qualifying facility (QF), such as a solar rooftop PV array, with greater compensation than would be provided to them through the

Public Utility Regulatory Policies Act of 1978 (PURPA). Under PURPA, a customer who installed a QF on their property would be compensated at the utility’s avoided cost of energy, a rate historically below the retail rate. NEM tariffs increased the compensation given to solar customers by remunerating them at the retail rate for any generation in excess of their on-‐site consumption. See Wan, Yih-‐huei, and H. James Green. "Current Experience with Net Metering Programs." Windpower '98. Bakersfield: NREL, 1998. 1-‐9. 17 90.7% of NEM customers were residential. See Marcacci, Silvio. Fitch Ratings: Net Metering Can Destabilize Entire Utility Industry. December 27, 2013. http://theenergycollective.com/silviomarcacci/321161/fitch-‐ratings-‐net-‐metering-‐can-‐destabilize-‐entire-‐utility-‐industry (accessed April 10, 2014). Figure A.2 shows the quarterly growth in U.S. residential PV installations from Q2 2010-‐Q4 2013:
Figure A.2: Growth of U.S. residential solar PV, Q2 2010-‐Q4 2013 See Solar Energy Industries Assocation. U.S. Solar Market Insight Report: 2013 Year-‐In-‐Review Executive Summary. Review, Washington: Solar Energy Industries Assocation, 2013, (11). 18 As the U.S. Energy Information Administration notes in its Short-‐term Energy Outlook 2014, “customer-‐sited photovoltaic capacity growth is projected to exceed [the 52%] utility-‐scale solar growth between 2013 and 2015.” See U.S. Energy Information Administration. Short-‐term Energy Outlook: Renewables and CO2 Emissions. March 11, 2014. http://www.eia.gov/forecasts/steo/report/renew_co2.cfm (accessed April 7, 2014). 19 See Martin, Christopher, and Will Wade. America’s Power Machine: Hulking, Creaky, and Losing Its Grip. December 26, 2013. http://www.bloomberg.com/quicktake/u-‐s-‐electrical-‐grid/ (accessed April 7, 2014). 20 See International Energy Agency. Insights Series 2012: Securing Power during the Transition. Paris: IEA, 2012, (36-‐44). 21 The analysis contained in this white paper will focus exclusively on the impacts of distributed solar PV and NEM on the regulated electric utilities. 22 See Martin, Christopher, and Will Wade. America’s Power Machine: Hulking, Creaky, and Losing Its Grip. December 26, 2013. http://www.bloomberg.com/quicktake/u-‐s-‐electrical-‐grid/ (accessed April 7, 2014).
23 See Kind, Peter. Disruptive Challenges: Financial Implications and Strategic Responses to a Changing Retail Electric Business. White Paper, Washington: Edison Electric Institute, 2013, (17, 19). 24 See Creyts, Jon, and Leia Guccione. The Economics of Grid Defection: When and Where Distributed Solar Generation Plus Storage Competes with Traditional Utility Service. White Paper, Boulder: Rocky Mountain Institute, 2014, (17). 25 In March of 2014, Bank of America Merrill Lynch noted that they were “downgrading shares” of regulated utilities held by Pinnacle West Corporation because of “challenging” rate cases resulting from “the continued adoption of distributed generation” such as solar PV in Arizona, noting that the $5 fixed charge for solar PV installations instigated in January 2014 did “little to stem the spread of distributed generation” in the state. See Chin, Brian, and Robert Koryl. A Difficult Regulatory Cycle Ahead Prompts Neutral Rating. March 28, 2014. http://dontkillsolar.com/tusk/wp-‐content/uploads/2014/03/BOA-‐Pinnacle-‐West-‐Downgrade-‐3.28.14-‐with-‐highlights.pdf (accessed May 30, 2014). 26 In May 2014, the Barclays credit strategy team downgraded shares of U.S. high-‐grade corporate bonds of the entire electric sector due to the challenges facing the regulated utility industry from distributed solar PV and residential energy storage, noting that this combination could for the first time in over 100 years “reconfigure the organization and regulation of the electric power business over the coming decade.” See Aneiro, Michael. Barclays Downgrades Electric Utility Bonds, Sees Viable Solar Competition. May 23, 2014. http://blogs.barrons.com/incomeinvesting/2014/05/23/barclays-‐downgrades-‐electric-‐utility-‐bonds-‐sees-‐viable-‐solar-‐competition/ (accessed May 30, 2014) and Wile, Rob. Barclays Has The Best Explanation Yet Of How Solar Will Destroy America's Electric Utilities. 28 2014, May. http://www.businessinsider.com/barclays-‐downgrades-‐utilities-‐on-‐solar-‐threat-‐2014-‐5 (accessed May 30, 2014). 27 A survey conducted in 2013 by PricewaterhouseCoopers revealed that only six% of international industry representatives expect the utility business model to remain “more or less the same.” See PricewaterhouseCoopers. Energy transformation: The impact on the power sector business model. Survey, PricewaterhouseCoopers, 2013 quoted in Sklar, Scott. Utility Nightmares: Distributed Generation and Halving Electricity Consumption. April 16, 2014. http://www.renewableenergyworld.com/rea/news/article/2014/04/utility-‐nightmares-‐halving-‐electricity-‐consumption-‐and-‐distributed-‐generation (accessed April 28, 2014). 28 Utility stocks were once considered to be the quintessential “window and orphan” stock, carrying low risk and paying out high dividends to shareholders. See Investopedia Staff. The Industry Handbook: The Utilities Industry. n.d. http://www.investopedia.com/features/industryhandbook/utilities.asp (accessed April 9, 2014). Furthermore, utility stocks and bonds have been the preferred asset classes for U.S. pension funds due to the absence of virtually all market risks and competitions, and almost assured guaranteed rates of return and revenue recovery. See Peterson, Lee. Pension Funds Hold a Key to Renewable Energy Finance. April 30, 2014. http://www.renewableenergyworld.com/rea/news/article/2014/04/pension-‐funds-‐hold-‐a-‐key-‐to-‐renewable-‐energy-‐finance?cmpid=rss (accessed April 30, 2014). 29 By virtue of its stability, a defensive industry does not require the same expected returns as compared to investments in less mature or more volatile industries. This expectation of lower returns in turn leads to lower borrowing costs and higher relative share values for shareholders/investors. See Kind, Peter. Disruptive Challenges: Financial Implications and Strategic Responses to a Changing Retail Electric Business. White Paper, Washington: Edison Electric Institute, 2013, (8). 30 See Investopedia. Leverage. n.d. http://www.investopedia.com/terms/l/leverage.asp (accessed April 9, 2014). 31 See Kind, Peter. Disruptive Challenges: Financial Implications and Strategic Responses to a Changing Retail Electric Business. White Paper, Washington: Edison Electric Institute, 2013, (7, 8).

32 See Peterson, Lee. Pension Funds Hold a Key to Renewable Energy Finance. April 30, 2014. http://www.renewableenergyworld.com/rea/news/article/2014/04/pension-‐funds-‐hold-‐a-‐key-‐to-‐renewable-‐energy-‐finance?cmpid=rss (accessed April 30, 2014). 33 That is, the distributed solar PV customer’s total monthly usage less the output of their PV panel. 34 As Figure A.3 illustrates, the evolution of the utility industry’s credit ratings has been towards progressively lower levels.
Figure A.3: Evolution of Electric Utility Industry Credit Ratings, 1970-‐2011
If the credit rating continues to erode beyond the BBB ratings currently held by a majority of the industry, utilities would face “a significant rerating of capital costs, credit availability, and investor receptivity to the sector.” See Kind, Peter. Disruptive Challenges: Financial Implications and Strategic Responses to a Changing Retail Electric Business. White Paper, Washington: Edison Electric Institute, 2013, (8, 10).
35 As John Whitlock of S&P notes, “Favorable borrowing costs are essential for regulated utilities’ ability to meet the industry’s high capital demands.” See Graf, Bill, Pauline M. Ahern, Ellen Lapson, and Branko Terzic. "Standard & Poor's." Regulated Utilites: Access to Capital. Deloitte, May 2013. 36 See Kind, Peter. Disruptive Challenges: Financial Implications and Strategic Responses to a Changing Retail Electric Business. White Paper, Washington: Edison Electric Institute, 2013, (11, 13). 37 See U.S. Energy Information Administration. Electricty Explained: Use of Electricity. April 26, 2012. http://www.eia.gov/energyexplained/index.cfm?page=electricity_use (accessed April 9, 2014) and Martin, Laura. Implications of low electricity demand growth. Annual Energy Outlook 2014, Washington: U.S. Energy Information Administration, 2014. 38 See Denning, Liam. Lights Flicker for Utilities. December 22, 2013. http://online.wsj.com/news/articles/SB10001424052702304773104579270362739732266 (accessed March 31, 2014).

39 See Marcacci, Silvio. Fitch Ratings: Net Metering Can Destabilize Entire Utility Industry. December 27, 2013. http://theenergycollective.com/silviomarcacci/321161/fitch-‐ratings-‐net-‐metering-‐can-‐destabilize-‐entire-‐utility-‐industry (accessed April 10, 2014). 40 See Edison Electric Institute. Straight Talk About Net Metering. Washington: Edison Electric Institute, (1). 41 The avoided cost of generation is the “incremental costs of electric energy or other services, if a utility did not purchase from the existing power seller; the focus is on the cost of the alternatives available to the buyer/utility.” See National Renewable Energy Laboratory. (2013). Treatment of Solar Generation in Electric Utility Resource Planning. Golden: NREL, (46). 42 See Union of Concerned Scientists. (n.d.). Public Utilities Regulatory Policies Act (PURPA). Retrieved April 10, 2014, from Union of Concerned Scientists: http://www.ucsusa.org/clean_energy/smart-‐energy-‐solutions/strengthen-‐policy/public-‐utility-‐regulatory.html. 43 The retail electricity rate is the “final rate charged to customers by an electricity company, based on all of the costs involved in generating, transporting, and delivering power.” As such, it “includes not only the cost of power but also the fixed costs of the poles, wires, meters, advanced technologies, and other infrastructure that make the electric grid safe, reliable, and able to accommodate solar panels and other DG systems.” Generation facilities that are connected “behind-‐the-‐meter”, such as residential distributed solar PV systems, sell their electricity into a retail market rather than the wholesale market. The wholesale electricity rate includes the cost of the fuel required to generate electricity and the cost of purchasing power on the competitive wholesale electricity market. Unlike the retail electricity rate, the wholesale electricity rate does not include the cost of transporting and delivering electricity through the grid to customers. The utility industry maintains that, as the solar panels are producing power directly into the distribution system (hence the nomenclature “distributed” generation), they should be compensated at the wholesale rate and not the retail rate. See Kind, Peter. Disruptive Challenges: Financial Implications and Strategic Responses to a Changing Retail Electric Business. White Paper, Washington: Edison Electric Institute, 2013, (1, 2). 44 See Edison Electric Institute. Straight Talk About Net Metering. Washington: Edison Electric Institute, (2) and Edison Electric Institute. (2014). EEI Comments on Value and Cost of Distributed Generation (Including Net Metering) E-‐00000J-‐14-‐0023. Phoeniz: EEI, (5). 45 See Parkinson, Giles. Rooftop Solar: Does it really need the grid? April 23, 2014. http://reneweconomy.com.au/wp-‐content/uploads/2014/04/bernstein-‐solar-‐day.jpg (accessed April 25, 2014). 46 For motor-‐based devices, startup power can be orders of magnitude higher than the power that is consumed during normal running operation. 47 See Electric Power Research Institute. (2014). The Integrated Grid: Realizing the Full Value of Central and Distributed Energy Resources. Palo Alto: EPRI, (16, 23). 48 See Solar Energy Industries Association. Rate Design Guiding Principles for Solar Distributed Generation. Washington: SEIA, (1). 49 See Keyes, J. B., & Rabago, K. R. (2013). A Regulator's Guidebook: Calculating the Benefits and Costs of Distributed Solar Generation. Latham: Interstate Renewable Energy Council, (36). 50 EEI notes, “Lost revenues from distributed energy resources are being recovered from non-‐distributed energy resource customers in order to encourage distributed generation implementation. This type of lost revenue recovery drives up prices of those non-‐participating customers and leads to higher rates of customer loss.” See Kind, Peter. Disruptive Challenges: Financial Implications and Strategic Responses to a Changing Retail Electric Business. White Paper, Washington: Edison Electric Institute, 2013, (5, 13, 17).

51 Furthermore, the study found that net benefits, either positive or negative, depend on the discount rate chosen and whether non-‐internalized greenhouse gas emissions are considered in the analysis, particularly if these costs are assumed to be stagnant in the longer term (i.e. for up to 20 years). See Vermont Public Service Department. (2013). Evaluation of Net Metering in Vermont Conducted Pursuant to Act 125 of 2012. Montpelier: Vermont Public Service Department, (31). 52 See Denning, L. (2013, December 22). Lights Flicker for Utilities. Retrieved March 31, 2014, from http://online.wsj.com/news/articles/SB10001424052702304773104579270362739732266. 53 See Edison Electric Institute. (2014). EEI Comments on Value and Cost of Distributed Generation (Including Net Metering) E-‐00000J-‐14-‐0023. Phoeniz: EEI, (3-‐5). 54 The next marginal generator in the merit order would likely be a natural gas combined-‐cycle combustion turbine. 55 See Keyes, J. B., & Rabago, K. R. (2013). A Regulator's Guidebook: Calculating the Benefits and Costs of Distributed Solar Generation. Latham: Interstate Renewable Energy Council, (21, 36). 56 As the authors note: “Considering losses on a marginal basis…reflects the likely correlation of solar PV to heavy loading periods where congestion and transformer thermal conditions tend to exacerbate losses.” In this arrangement, the use of transformers to step-‐up voltage for long-‐range transmission is obviated, decreasing marginal loss rates, reducing the utility’s peak load, generation capacity, and ultimately lowering customer rates. Ibid, (23). 57 The capacity credit assigned to a generator is related to its effective load carrying capability (ELCC). ELCC is “the ability of a power generator to support additional peak load without reducing the reliability of the electrical system (in terms of loss of load probability or loss of load expectation).” See National Renewable Energy Laboratory. (2013). Treatment of Solar Generation in Electric Utility Resource Planning. Golden: NREL, (47). If the distributed solar panel’s output has high coincidence with a utility’s peak demand, the panel will earn a high capacity credit. Conversely, the panel would receive a lower capacity credit when demand is low. Strictly speaking, the capacity credit can be calculated as “the capital cost ($/MWh) of the displaced unit times the effective capacity provided by PV.” For a more complete explanation of capacity credit and ELCC, see Keyes, J. B., & Rabago, K. R. (2013). A Regulator's Guidebook: Calculating the Benefits and Costs of Distributed Solar Generation. Latham: Interstate Renewable Energy Council, (24-‐26). 58 The study pointed out the ability for distributed solar PV to reduce absolute peak utility load, and in the process avoid overloading transformers and distribution system components. Furthermore, aggregation of distributed solar PV systems on a circuit, per interconnection procedures, would obviate transmission system upgrades by reducing the need to service these circuits. Ibid, (26-‐28). That being said, prediction of any transmission and distribution deferment is complicated and unlikely to be incorporated into any rate-‐setting studies. 59 Ibid (29-‐30). While many states at the moment lack a centralized market for ancillary services, FERC Order 784 may open the door for storage systems, and potential distributed solar PV systems, to participate in these markets in the future by requiring transmission-‐owning utilities to consider the “speed and accuracy” of resources providing ancillary services. See NRDC Switchboard. FERC Affirms Support for Removing Market Barriers to Energy Storage, Other Clean Energy Resources. February 28, 2014. http://theenergycollective.com/nrdcswitchboard/346136/ferc-‐affirms-‐support-‐removing-‐market-‐barriers-‐energy-‐storage-‐other-‐clean-‐ener (accessed April 28, 2014). 60 The inclusion of a fuel hedge is complicated by the assumed volatility of the price of the fuel used in the generating units in a utility’s portfolio. Some utilities, on the other hand, have a long-‐term contract to purchase fuel at a fixed price. See Keyes, Jason B., and Karl R. Rabago. A Regulator's Guidebook: Calculating the Benefits and Costs of Distributed Solar Generation. Latham: Interstate Renewable Energy Council, 2013, (30).

61 An exact valuation of the cost reductions is hypothetical at best, and therefore must be modeled. Ibid, (31). 62 Ibid. 63 The authors note that the societal benefits could include avoided water usage and local economic development through construction and locally-‐circulated tax revenue; environmental benefits include avoided carbon emissions from fossil fuel power plants, avoided renewable portfolio standard compliance costs, and reduced costs of complying with various regulatory and statutory environmental regulations (such as stipulations on airborne pollutants and air quality pursuant to the Clean Air Act of 1970). Ibid, (32-‐35). In June 2014, the EPA proposed the Clean Power Plan Proposed Rule aimed at “maintaining an affordable, reliable energy system, while cutting pollution and protecting our health and environment” by lowering the carbon intensity of existing power plants in the U.S. The Proposed Rule serves as a compliment to the rule for new power plants unveiled in early 2014. See Environmental Protection Agency. Carbon Pollution Emission Guidelines for Existing Stationary Sources: Electric Utility Generating Units. Proposed Rule, Washington: Federal Register, 2014. 64 See Solar Energy Industries Association. (n.d.). Net Energy Metering Guiding Principles. Retrieved April 10, 2014, from Research & Resources: http://www.seia.org/research-‐resources/net-‐energy-‐metering-‐guiding-‐principles. 65 See Solar Energy Industries Association. Rate Design Guiding Principles for Solar Distributed Generation. Washington: SEIA, (1). 66 See Solar Energy Industries Association. (n.d.). Net Energy Metering Guiding Principles. Retrieved April 10, 2014, from Research & Resources: http://www.seia.org/research-‐resources/net-‐energy-‐metering-‐guiding-‐principles. 67 “Utility ratemaking (and other regulatory policies) should strive to minimize negative externalities.” See Solar Energy Industries Association. Rate Design Guiding Principles for Solar Distributed Generation. Washington: SEIA, (2). 68 In its comments to the Arizona Corporation Commission in February 2014 pursuant to their evaluation of distributed generation and NEM, EEI asserted that, “…”value” of service propositions are inherently uncertain and speculative,” and that no consideration of environmental or societal externalities should be considered in rate-‐setting for distributed solar PV generation. See Edison Electric Institute. (2014). EEI Comments on Value and Cost of Distributed Generation (Including Net Metering) E-‐00000J-‐14-‐0023. Phoeniz: EEI. 69 See Solar Energy Industries Association. Rate Design Guiding Principles for Solar Distributed Generation. Washington: SEIA, (2). 70 See Edison Electric Institute. (2014). EEI Comments on Value and Cost of Distributed Generation (Including Net Metering) E-‐00000J-‐14-‐0023. Phoeniz: EEI. 71 See National Renewable Energy Laboratory. (2013). Treatment of Solar Generation in Electric Utility Resource Planning. Golden: NREL, (v, 4). 72 One of the aims of the IRP structure is to minimize total costs, not simply the average rates incident on customers. Moreover, “equity necessitates the additional balancing of the interests of the various customer classes as well as the interests of present and future generations.” A robust IRP would evaluate the full suite of options available to meet forecasted load demand, including: power purchases, renewable energy resources, demand-‐side management strategies/programs, cogeneration, and independent power plants. See Kushler, Marty, and Dan York. Utility Initiatives: Integrated Resource Planning. Policy Brief, Washington: American Council for an Energy-‐Efficient Economy, 2010. Most IRPs involve six steps:
1. An evaluation of state policies and mandates;

2. A review of the existing generation fleet in the utility’s portfolio; 3. A forecast of load demand (with built-‐in flexibility to prepare for unexpected demand growth or
decline); 4. Plans for capacity expansion to meet predicted increases in load; 5. Production-‐cost modeling; and 6. A select portfolio based on metrics such as revenue requirements, capital expenditures, water usage,
emissions, average system cost, and fuel diversity. See National Renewable Energy Laboratory. (2013). Treatment of Solar Generation in Electric Utility Resource Planning. Golden: NREL, (vi-‐vii). 73 Ibid, (4); and See Kushler, Marty, and Dan York. Utility Initiatives: Integrated Resource Planning. Policy Brief, Washington: American Council for an Energy-‐Efficient Economy, 2010. 74 See Rosenbaum, Eric. A dirty clean energy battle becoming a utility war. March 6, 2014. http://www.cnbc.com/id/101472289 (accessed April 10, 2014). 75 See National Renewable Energy Laboratory. (2013). Treatment of Solar Generation in Electric Utility Resource Planning. Golden: NREL, (25). 76 See Rosenbaum, Eric. A dirty clean energy battle becoming a utility war. March 6, 2014. http://www.cnbc.com/id/101472289 (accessed April 10, 2014). 77 See Sklar, Scott. Utility Nightmares: Distributed Generation and Halving Electricity Consumption. April 16, 2014. http://www.renewableenergyworld.com/rea/news/article/2014/04/utility-‐nightmares-‐halving-‐electricity-‐consumption-‐and-‐distributed-‐generation (accessed April 28, 2014). 78 See National Renewable Energy Laboratory. (2013). Treatment of Solar Generation in Electric Utility Resource Planning. Golden: NREL, (18). EEI advocates “revision(s) of NEM programs in all states so that self-‐generated distributed energy resource sales to utilities are treated as supply-‐side purchases at a market-‐derived price. From a load provider’s perspective, this would support the adoption of distributed resources on economically driven bases, as opposed to being incentivized by cross subsidies.” See Kind, Peter. Disruptive Challenges: Financial Implications and Strategic Responses to a Changing Retail Electric Business. White Paper, Washington: Edison Electric Institute, 2013, (18). 79 Because solar is an intermittent resource, if the utility seeks to meet its future load demand needs with greater build-‐outs of solar, it may risk over-‐building its capacity due to the mismatch of solar output and system load profiles. See National Renewable Energy Laboratory. (2013). Treatment of Solar Generation in Electric Utility Resource Planning. Golden: NREL, (34, 5). 80 The analysis notes, “One risk associated with solar generation without storage is adequately integrating its production fluctuations into the overall resource mix” (most estimates from the questionnaires were in the $2-‐$11/MWh range). 33% of utilities do not incorporate an integration cost adder for solar resources, while 10% say that they do not at present but plan on adding one into the next IRP process. The remaining 57% do not and do not plan to include an adder for solar. Ibid, (vii, 25, 67). 81 See Electric Power Research Institute. (2014). The Integrated Grid: Realizing the Full Value of Central and Distributed Energy Resources. Palo Alto: EPRI, (10). 82 See Greentech Media Staff. (2014, April 8). Enphase CEO on Solar Growth Markets and New Microinverter Features. Retrieved April 14, 2014, from Greentech Solar: http://www.greentechmedia.com/articles/read/Enphase-‐CEO-‐on-‐Solar-‐Growth-‐Markets-‐and-‐New-‐Microinverter-‐Features. GTM Research noted that distributed solar PV could become technically-‐disruptive to grid reliability at levels of 20-‐25% of total power, or at a point where capacity equals 25% of daytime minimum load demand on a particular distribution feeder. See Munsell, Mike. 3 Solar Integration Questions Utility Executives Must

Confront. April 28, 2014. http://www.greentechmedia.com/articles/read/three-‐questions-‐utility-‐executives-‐will-‐face-‐regarding-‐pv-‐integration (accessed April 28, 2014). It has been noted that the some of the benefits of distributed solar PV resources, such as capacity credit attributed to the solar generating units, are reduced as the penetration of this technology eclipses a certain level (i.e. 15% of generation capacity). See Keyes, J. B., & Rabago, K. R. (2013). A Regulator's Guidebook: Calculating the Benefits and Costs of Distributed Solar Generation. Latham: Interstate Renewable Energy Council, (41). 83 Electrical feeders are parts of the primary distribution system; they “run along the streets and supply the distribution transformers that step the voltage down to the secondary level” for distribution to residential and commercial users. See Karady, G. G. (1997). Energy Distribution. In R. C. Dorf, The Electrical Engineering Handbook, Second Edition (pp. 1435-‐1445). Boca Raton: CRC Press LLC, (1435). Connection of residential solar PV systems at the low voltages seen in the distribution system is the industry standard due to the proximity to residential electrical loads (on-‐site consumption) and the increased costs of connecting to higher voltage levels (due to the increased costs of transformers and switchgears and the need for longer transmission lines to connect to the existing network). See Freris, L., & Infield, D. (2008). Renewable Energy in Power Systems. Chichester: John Wiley & Sons, Ltd, (177). 84 Distributed solar resources are connected to the grid through inverters: these “brains” of the solar PV system provide the interface between the electricity grid, the PV system, and the utility. In addition to their ability to facilitate the conversion of DC-‐produced electricity to the AC waveform needed for transmission and distribution, inverters also enable the crucial bi-‐directional communication capabilities between the solar system and the utility required for a well-‐functioning electricity grid. See Greentech Media Staff. (2014, April 8). Enphase CEO on Solar Growth Markets and New Microinverter Features. Retrieved April 14, 2014, from Greentech Solar: http://www.greentechmedia.com/articles/read/Enphase-‐CEO-‐on-‐Solar-‐Growth-‐Markets-‐and-‐New-‐Microinverter-‐Features. 85 See Smart Inverter Working Group. (2014). Recommendations for Updating the Technical Requirements for Inverters in Distributed Energy Resources. Sacramento: Smart Inverter Working Group, (9). 86 The point of common coupling (PCC) is the closest point on the distribution network where a customer with a load demand is or could be located. See Freris, L., & Infield, D. (2008). Renewable Energy in Power Systems. Chichester: John Wiley & Sons, Ltd, (176). 87 Ibid; and See Electric Power Research Institute. (2014). The Integrated Grid: Realizing the Full Value of Central and Distributed Energy Resources. Palo Alto: EPRI, (13). 88 Frequency can be understood as an instantaneous measure of the imbalance between the supply of electricity and the demand at various load points on the network. If frequency drifts downward, demand for electricity exceeds supply, and vice versa. In the case of distributed solar PV resources, it is likely that electricity production from the systems exceeds the demand, creating the possibility that the frequency may rise to values outside of the acceptable range. The setting of exact frequency operating envelope is in the purview of distribution system operators, although individual utilities may set their own, stricter limits on frequency variation. Ibid, (15); and See Freris, L., & Infield, D. (2008). Renewable Energy in Power Systems. Chichester: John Wiley & Sons, Ltd, (56). 89 As the frequency begins to drift downwards due to a shortfall in electricity supply, for example, large rotating machines, hallmarks of centralized generation, are able to supply inertia to soften the destabilizing effects of frequency dips. The inertial qualities of large rotating machines, which are important for maintaining voltage control and dynamic behavior of generation units, are often absent in inverter-‐based generation units. See Freris, L., & Infield, D. (2008). Renewable Energy in Power Systems. Chichester: John Wiley & Sons, Ltd, (87-‐88) and Electric Power Research Institute. (2014). The Integrated Grid: Realizing the Full Value of Central and Distributed Energy Resources. Palo Alto: EPRI, (13).

90 Germany was faced with these challenges which ultimately necessitated an upgrade to all inverters with capacities greater than 3.68 kilo volt-‐amperes (kVA). The upgrades are estimated to cost over $300 million. Ibid, (15). 91 A load profile recorded on March 18, 2014, reproduced below in Figure A.4, illustrates that the state may already be experiencing the early stages of a possible “duck curve”:
Figure A.4: Load curve in California, recorded on March 18, 2014
See Wesoff, Eric. Slideshow: Solar Disrupting Wholesale Energy Markets. April 16, 2014. http://www.greentechmedia.com/articles/read/Slideshow-‐Solar-‐Disrupting-‐Wholesale-‐Energy-‐Markets (accessed April 25, 2014). 92 Cool days reduce the need for air conditioning (a high-‐demand appliance/service); the mid-‐afternoon period is, on a workday, generally one of the lowest demand periods of the day. 93 Baseload resources are those that contribute to the portion of the electricity demand load that is always present. Baseload resources are usually incapable of responding in timeframes shorter than a few hours. See Freris, L., & Infield, D. (2008). Renewable Energy in Power Systems. Chichester: John Wiley & Sons, Ltd, (22). 94 John, J. S. (2014, March 24). Retired CPUC Commissioner Takes Aim at CAISO's Duck Curve. Retrieved April 10, 2014, from GreentechGrid: http://www.greentechmedia.com/articles/read/retired-‐cpuc-‐commissioner-‐takes-‐aim-‐at-‐caisos-‐duck-‐curve. 95 2020 is the deadline for implementation of California’s mandate to procure 33% of its electricity demand from renewable sources, and as such represents a period of high distributed generation penetration. 96 See The Clean Coalition. (2013, December 16). Flattening the Duck: Dynamic Grid Solutions for Integrating Renewables. The Clean Coalition. 97 See Lazar, J. (2014). Teaching the "Duck" to Fly. Montpelier: The Regulatory Assistance Project, (1). 98 See The Clean Coalition. (2013, December 16). Flattening the Duck: Dynamic Grid Solutions for Integrating Renewables. The Clean Coalition. 99 The Clean Coalition’s study, Flattening the Duck: Dynamic Grid Solutions for Integrating Renewables, proposed the following strategies:

1. Strategically schedule the O&M of baseload power plants in a given utility’s portfolio during the
shoulder months (i.e. months when power plants are typically shut down for periods of O&M) to limit the effects of over-‐generation;
2. Instigate DSM programs that shift consumption from high-‐demand periods to periods of lower demand, with a concomitant emphasis on informing policymakers as to which DSM programs and resources could be used to address the need for innovative pricing schedules that incentivize customer participation. Some of these strategies could involve use of electrical vehicle batteries as storage devices; and
3. Curtail solar generation during periods of potential over-‐generation. Figure A.5 shows the resultant change in load profile with these three strategies; the bolded red line is the load profile after the three strategies are implemented:
Figure A.5: Utility load profile before and after implementation of The Clean Coalition’s strategies See The Clean Coalition. (2013, December 16). Flattening the Duck: Dynamic Grid Solutions for Integrating Renewables. The Clean Coalition. The strategy advocated by The Regulatory Assistance Project (RAP) doesn’t evolve any curtailment of distributed solar resources on the part of grid operators. They suggested ten strategies:
1. Target energy efficiency programs to the hours around the ramp-‐up. RAP’s modeling indicated that this strategy could save 5% of total electricity usage during the targeted peak hours.
2. Orient solar panels on residential roofs towards the west, shifting their peak electricity production periods to later in the day. Although solar panels maximize output when oriented towards the south, western-‐orientation helps to align their generation profiles with the utility load profile (i.e. maximum generation closer to the ramp-‐up period).
3. Divert some of the production from the distributed solar PV systems during periods of low demand to heat water. This use of solar PV as a solar thermal resource provides an opportunity for the heated water to serve as a storage tool for the evening ramp-‐up.
4. Update service standards so that grid operators are allowed to deploy the roughly 45 million electric water heaters in the U.S. to reduce peak demand (“shave demand”).
5. Utilize ice and chilled water as storage by pre-‐chilling the fluid in air conditioning and cooling systems when distributed solar PV generation is prevalent and discharging the cooling in the high-‐demand, early evening period. This strategy would in effect require air conditioning units and cooling systems to include two hours of thermal storage.
6. Retire older, more inflexible generating plants, such as older coal, nuclear, and gas steam units. 7. Target demand charges during the ramp-‐up periods. Demand charges were instituted when the utility
generation fleet was characterized by similar cost levels across all types of capacity; they were employed to ensure that commercial and industrial customers with lower-‐than-‐average consumption

paid a higher price relative to users with higher demand to encourage all users to improve their load factors (the ratio of average electricity consumption to peak electricity usage).
8. Strategic placement of electrical energy storage in targeted locations, such as those that would require expensive transmission and distribution system upgrades in response to increased generation from distributed solar PV resources, by utilizing the storage devices to reduce over-‐generation during ramp-‐down or provide electricity during ramp-‐up periods. Placement of storage systems in these locations would also open up the opportunity for the provision of ancillary services to the electricity grid.
9. Implementation of aggressive demand-‐response programs, such as those that encourage customers to change their electricity-‐use patterns.
10. Use of inter-‐regional power exchanges with neighboring states to employ diversity of load and resources. This strategy utilizes the geographic diversity of renewable energy resources, both distributed and other, as a means of smoothing out generation profiles. Although the analysis focused on California, almost any state in the contiguous U.S. would be able to engage in some form of regional power exchange.
Figure A.6 shows the resultant change in load profile with these ten strategies; the convention total load refers to the situation with no renewable energy resources included, while net load refers to the total load less the input from renewable energy resources:
Figure A.6: Utility load profile before and after implementation of RAP’s strategies RAP’s model incorporating all ten strategies highlighted above showed that the load factor was improved (i.e. the discrepancy between average usage and peak usage decreased), the maximum hourly ramp rate was decreased from 500MW to 350MW, and the total difference between highest and lowest demand was reduced from 1800MW to 950MW. See Lazar, J. (2014). Teaching the "Duck" to Fly. Montpelier: The Regulatory Assistance Project, (1-‐22). 100 California has over 47,100 people employed in the solar energy sector. See Solar Energy Industries Association. 2013 Top 10 Solar States. 2014. http://www.seia.org/sites/default/files/resources/Top-‐10-‐Solar-‐States-‐Infographic.pdf (accessed April 15, 2014). 101 See Miller, Peter. Celebrating a Solar Energy Milestone with Big Clean Energy Implications. March 31, 2014. http://theenergycollective.com/nrdcswitchboard/361211/celebrating-‐solar-‐milestone-‐big-‐clean-‐energy-‐implications (accessed April 15, 2014).

102 See Energy Information Agency. Electricity Monthly Update: Solar-‐electric Generating Capacity Increases Drastically in the Last Four Years. April 22, 2014. http://www.eia.gov/electricity/monthly/update/ (accessed April 29, 2014). 103 See California Public Utilities Commission. Decision Establishing a Transition Period Pursuant to Assembly Bill 327 For Customers Enrolled in Net Energy Metering Tariffs. Proposed Decision, San Francisco: California Public Utilities Commission, 2014, (2-‐3). 104 See Trabish, Herman. Solar Energy Usage Shattering Records in California as New Capacity Comes On-‐Line. March 22, 2014. http://theenergycollective.com/hermantrabish/356771/solar-‐usage-‐shattering-‐records-‐california-‐new-‐capacity-‐comes-‐line (accessed April 15, 2014). 105 See California Public Utilities Commission. Order Instituting Rulemaking to Continue Implementation and Administration of California Renewables Portfolio Standard Program, Rulemaking 11-‐05-‐005. Decision 11-‐12-‐020, San Francisco: California Public Utilities Commission, 2011, (2-‐3). 106 The program continued the momentum started with the state’s Emerging Renewables Program and the Self-‐Generation Incentive Program (two programs which no longer provide investment support for distributed solar PV systems). The incentives provided within the program are demand-‐driven and designed to step-‐down in line with expected cost declines of solar PV systems and the local solar market conditions. See California Public Utilities Commission. About the California Solar Initiative. January 31, 2014. http://www.cpuc.ca.gov/puc/energy/solar/aboutsolar.htm (accessed April 15, 2014). The CSI program also provides a rebate system for low-‐income residents who own their single-‐family homes. See California Solar Initiative. About the California Solar Initiative (CSI). 2013. http://www.gosolarcalifornia.ca.gov/about/csi.php (accessed April 15, 2014). 107 Ibid. 108 See California Public Utilities Commission. Self-‐Generation Incentive Program. http://www.cpuc.ca.gov/PUC/energy/DistGen/sgip/ (accessed April 15, 2014). 109 See Solar Energy Industries Assocation. U.S. Solar Market Insight Report: 2013 Year-‐In-‐Review Executive Summary. Review, Washington: Solar Energy Industries Assocation, 2013, (9). 110 See Wesoff, Eric. Slideshow: How to Really Disrupt the Retail Energy Market With Solar. April 17, 2014. http://www.greentechmedia.com/articles/read/Slide-‐Show-‐How-‐to-‐Really-‐Disrupt-‐the-‐Retail-‐Energy-‐Market-‐with-‐Solar (accessed April 17, 2014). 111 See Solar Energy Industries Association. U.S. Solar Market Insight Report: Q1 2014 Executive Summary. Executive Summary, SEIA, 2014, available at: http://www.greentechmedia.com/research/ussmi, (8). 112 See California Solar Initiative. Program Totals by Administrator. April 30, 2014. http://www.californiasolarstatistics.ca.gov/reports/agency_stats/ (accessed May 5, 2014). 113 See Wesoff, Eric, and Shayle Kann. Capital Keeps Pouring Into Booming US Residential Solar Market. April 7, 2014. 114 See Paulos, Bentham. Surpassing Milestone of 100,000 Solar Roofs, PG&E Calls for 'Sustainable' Solar Policy. April 21, 2014. http://www.greentechmedia.com/articles/read/pge-‐hits-‐100000-‐solar-‐roofs (accessed April 28, 2014). 115 The study also noted that because “rates are adjusted over time such that utilities meet their revenue requirement, this revenue reduction ($1.1 billion by 2020) will be made up by ratepayers.” See California Public Utilities Commission Energy Division. California Net Energy Metering (NEM) Draft Cost-‐Effectiveness Evaluation: NEM Study Introduction. San Francisco: CPUC, 2013, (6, 42).
116 See Trabish, Herman K. New California Net Metering Study Appears to be DOA. September 30, 2013. http://www.greentechmedia.com/articles/read/new-‐california-‐net-‐metering-‐study-‐appears-‐doa (accessed April 7, 2014). The CPUC study itself noted: “The bill savings for NEM customers are entirely a function of the retail rate designs for each customer class and utility…possible changes to the residential rate structure could have significant impacts on the costs associated with residential NEM generation.” See California Public Utilities Commission Energy Division. California Net Energy Metering (NEM) Draft Cost-‐Effectiveness Evaluation: NEM Study Introduction. San Francisco: CPUC, 2013, (7-‐8). 117 Solar advocates noted that an abandonment of the tiered-‐pricing schedule would erode the benefits that the highest electricity consumers (and thus those who pay the most per month for their electricity) enjoy by using the electricity produced from distributed solar PV systems to decrease their monthly bills, and that the monthly flat charges proposed in AB 327 would add costs, they argued, to each customer’s bill that no amount of distributed solar PV generation could reduce. The state’s IOUs, on the other hand, had been seeking a transition period from NEM to some other form of compensation based on the “breakeven point”, or the point where the average customer recoups their cost of investment in a distributed solar PV system. See John, Jeff St. AB 327: From California Solar Killer to Net Metering Savior? September 3, 2013. http://www.greentechmedia.com/articles/read/ab-‐327-‐from-‐california-‐solar-‐killer-‐to-‐net-‐metering-‐savior (accessed April 7, 2014). 118 The amended bill addressed uncertainty regarding how each IOU would calculate its individual cap on the level of NEM generation. The amended bill established a 5% cap of each IOU’s nameplate capacity equivalent to:
1. 607MW for San Diego Gas and Electric (SDG&E); 2. 2,240MW for SCE; and 3. 2,409 for PG&E
The bill called for a new study to be finished by the end of 2015 that would serve as the basis for each IOU to develop a new NEM program by 2017. See California Legislative Information. "AB-‐327 Electricity: natural gas: rates: net energy metering: California Renewables Portfolio Standard Program." October 7, 2013. http://leginfo.legislature.ca.gov/faces/billNavClient.xhtml?bill_id=201320140AB327 (accessed April 17, 2014). The amended bill also granted the CPUC authority to include a $5 surcharge on monthly electricity bills for low-‐income customers and a $10 surcharge for all other customers in an IOU’s territory. This aspect provides some measure of protection against cross-‐subsidies for “residential customers in disadvantaged communities” in forthcoming NEM rate schedules. See American Public Power Association. Distributed Generation: An Overview of Recent Policy and Market Developments. White paper, APPA, 2013, (23) and Kaufmann, K. How long will solar-‐paneled homes keep their current deals? March 1, 2014. http://www.desertsun.com/story/tech/science/energy/2014/03/02/how-‐long-‐will-‐solar-‐paneled-‐homes-‐keep-‐their-‐current-‐deals/5943343/ (accessed April 17, 2014). 119 See California Public Utilities Commission. Decision Establishing a Transition Period Pursuant to Assembly Bill 327 For Customers Enrolled in Net Energy Metering Tariffs. Proposed Decision, San Francisco: California Public Utilities Commission, 2014, (3-‐4). 120 See The Solar Report. Cenergy Alert: Update on Assembly Bill 327: Proposed Decision on Net-‐Metering Transition Period. February 26, 2014. http://cenergypower.com/blog/wp-‐content/uploads/2014/04/nem-‐transition-‐timeline.jpg (accessed April 1, 2014). 121 While the plant’s nameplate capacity was only 2.2GW, SONGS effectively left a 2.502GW hole in California’s electricity grid due to its location, its role as a supplier of one-‐tenth of the state’s overall energy demand, and the need to meet demand locally due to transmission system constraints. In the first twelve months alone, the plant’s closure was estimated to have increased the cost of electricity generation by $370 million, an amount equivalent to a 15% of overall generation costs. See Lifsher, Mark. Public sounds off on San Onofre shutdown costs. October 2, 2013. http://articles.latimes.com/2013/oct/02/business/la-‐fi-‐mo-‐public-‐san-‐onofre-‐20131001 (accessed April 20, 2014) and Martinez, Sierra. It's Official: Efficiency, Clean Energy to

Help Fill California's Nuclear Generation Gap. March 13, 2014. http://switchboard.nrdc.org/blogs/smartinez/its_official_efficiency_clean_energy.html (accessed April 20, 2014). Furthermore, the loss of the low-‐carbon generation risked an increase in California’s carbon emissions of 8 million metric tons per annum. See The Breakthrough Institute. San Onofre Nuclear Closure to Boost State Carbon Emissions by 8 Million Tons. June 7, 2013. http://thebreakthrough.org/index.php/programs/energy-‐and-‐climate/san-‐onofre-‐nuclear-‐closure-‐to-‐boost-‐state-‐carbon-‐emissions-‐by-‐8-‐million-‐tons (accessed April 20, 2014). 122 See Lifsher, Mark. Public sounds off on San Onofre shutdown costs. October 2, 2013. http://articles.latimes.com/2013/oct/02/business/la-‐fi-‐mo-‐public-‐san-‐onofre-‐20131001 (accessed April 20, 2014). 123 An additional 400MW–900MW would come from any new type of energy resource as needed (e.g. natural gas-‐fired generation). The decision suggested that energy efficiency and demand-‐response programs would preclude the need for a complete replacement of SONGS’ output of 2.2GW. See Martinez, Sierra. It's Official: Efficiency, Clean Energy to Help Fill California's Nuclear Generation Gap. March 13, 2014. http://switchboard.nrdc.org/blogs/smartinez/its_official_efficiency_clean_energy.html (accessed April 20, 2014). 124 The state considers preferred sources to include “energy efficiency and demand response [sources] first, followed by renewable sources and clean distributed generation. To the extent that these efforts are unable to satisfy increasing energy and capacity needs, the state supports clean and efficient fossil-‐fired generation.” See California Public Utilities Commission. Aggressive Renewable Power Targets. n.d. http://www.cpuc.ca.gov/NR/rdonlyres/1F71A749-‐6424-‐4F49-‐B7CA-‐C7C58A181722/0/EnergyLeadership1pagers_v13.pdf (accessed April 20, 2014). 125 The technology could provide:
1. Voltage and frequency support in the form of localized voltage reduction to improve hosting capacity (the amount of generation that a distribution circuit can handle to meet localized demand);
2. Alteration of the power output and power factor (the ratio of real power output to total power output, which is the sum of real power and reactive power) of the distributed solar PV system to improve power quality and efficiency;
3. Monitoring of voltage and frequency levels, increasing the grid’s stability by allowing for low-‐voltage and low-‐frequency ride-‐through capabilities; and
4. Greater ease with ramping-‐down solar generation in the afternoon periods of low-‐demand and high distributed solar output.
High or low frequency ride-‐through refers to a situation when a distributed solar resource may cause a momentary disturbance in the local voltage level on a distribution feeder outside of the levels currently allowed in the national standard for voltage regulation, ANSI C84.1. In normal operation, this voltage disturbance would force the system to instantly trip-‐off (resulting in a loss of the generation source). Smart inverters would instead allow the distributed solar PV system to continue to run until the voltage can be brought within an acceptable range (usually within a few percentage points of 60 Hz). See:
1. Electric Power Research Institute. The Integrated Grid: Realizing the Full Value of Central and Distributed Energy Resources. Palo Alto: EPRI, 2014, (5, 14)
2. California Public Utilities Commission. Biennial Report on Impacts of Distributed Generation: Prepared in Compliance with AB 578. FInal Report, San Francisco: CPUC, 2013, (6-‐1)
3. Smart Inverter Working Group. Recommendations for Updating the Technical Requirements for Inverters in Distributed Energy Resources. White Paper, San Francisco: California Public Utilities Commission, 2014, (9-‐10)
126 See California Public Utilities Commission. Biennial Report on Impacts of Distributed Generation: Prepared in Compliance with AB 578. FInal Report, San Francisco: CPUC, 2013, (6-‐1).

127 See Smart Inverter Working Group. Recommendations for Updating the Technical Requirements for Inverters in Distributed Energy Resources. White Paper, San Francisco: California Public Utilities Commission, 2014, (10-‐11). 128 Ibid, (7, 13). 129 Autonomous functionalities could include actions like the production of electricity to serve an on-‐site load. 130 The three phases are:
1. autonomous functionalities of smart inverters on the grid (Phase 1), 2. communication standards for smart inverters (Phase 2), 3. advanced functionalities of smart inverters utilizing the communication standards developed under
Phase 2 (Phase 3). Ibid, (7, 14). 131 As was outlined above, the SIWG noted the following technical challenges:
1. The location of distributed energy resources like solar is usually chosen for the convenience of the system owner (i.e. a residential customer on a utility’s network);
2. The size and purpose of a particular distributed energy system can vary greatly from customer to customer, making a standardized approach for integrating the entire suite of systems complicated; and
3. The potential, without coordination, for distributed energy resources to induce voltage oscillations in response to variable power output and reverse power flows on circuits normally designed for uni-‐directional energy flow (i.e. centralized generating facility sending electricity to a distant load demand).
Ibid, (9). 132 Ibid, (11). As San Diego Gas & Electric notes, “estimated benefits [from the introduction of new utility and technology investments such as smart inverters] are expected to be realized over the life of the investment, which in nearly all cases is long beyond the time period in which costs are incurred. However, some Smart Grid projects with phased implementations such as Smart Meters or Condition-‐Based Maintenance may also accrue benefits during the course of project implementation.” See San Diego Gas & Electric. Smart Grid Deployment Plan. 2013 Annual Report, San Diego: San Diego Gas & Electric, 2013, (14). 133 The relevant standards for inverters on the grid are IEEE-‐1457, which pertains to the technical abilities of inverters on the grid, and UL 1741, which deals with the safety and reliability issues resulting from the introduction of smart grid technologies. Ibid; and See California Public Utilities Commission. Biennial Report on Impacts of Distributed Generation: Prepared in Compliance with AB 578. FInal Report, San Francisco: CPUC, 2013. 134 Both the CPUC and the California Energy Commission noted that the gears of IEEE standardization, required to ensure the flexibility of manifold systems across the entire U.S., turn far slower than the pace of technological change and popularity of NEM policies. The national grid code was recently updated to IEEE-‐1547a, allowing some distributed energy systems to actively regulate voltage at the PCC, and for incidents of high/low voltage or frequency to be extended for specific time periods to avoid shortfall in generation via mass trip-‐off. See Smart Inverter Working Group. Recommendations for Updating the Technical Requirements for Inverters in Distributed Energy Resources. White Paper, San Francisco: California Public Utilities Commission, 2014, (12-‐13). 135 In California, all interconnection, operational, and metering aspects of a generating facility are governed according to Electric Tariff Rule 21. Ibid, (7-‐8). 136 PG&E expects that solar generation, both utility-‐scale and distributed, will grow from its current 8% contribution to their generation portfolio in 2012 to 45% in 2020. See Parks, Ken, and Bob Woerner.

"Distributed Generation Interconnection Collaborative (DGIC)." Innovation in the Interconnection Application Process. Golden: NREL, April 2, 2014. 137 Ibid. 138 For the decision, See California Public Utilities Commission. Order Instituting Rulemaking Pursuant to Assembly Bill 2514 to Consider the Adoption of Procurement Targets for Viable and Cost-‐Effective Energy Storage Systems. Decision 13-‐10-‐040 October 17, 2013, Sacremento: CPUC, 2014. 139 Each utility is responsible for:
1. SCE: 580MW 2. PG&E: 580MW 3. SDG&E: 165MW
of storage. See Sweet, Bill. California's First-‐in-‐Nation Energy Storage Mandate. October 25, 2013. http://spectrum.ieee.org/energywise/energy/renewables/californias-‐firstinnation-‐energy-‐storage-‐mandate (accessed April 21, 2014). 140 Strictly speaking, the mandate’s goals are to optimize the grid via peak electricity reduction, increase the reliability of the electricity grid as increasing amounts of intermittent generation come on-‐line, defer transmission and distribution system upgrade investments, and reduce greenhouse gas emissions to 80% below 1990 levels by 2050. See Hornbrook, Chuck. "The benefits of the California storage procurement framework." ACORE Advisory Committee Call. Washington: ICFI, April 16, 2014. 141 The mandate stipulated that each IOU cannot claim ownership of more than 50% of the storage projects they propose, and that the burden of proof with regard to cost-‐effectiveness rests on the owners of the storage project(s). 142 See Creyts, Jon, and Leia Guccione. The Economics of Grid Defection: When and Where Distributed Solar Generation Plus Storage Competes with Traditional Utility Service. White Paper, Boulder: Rocky Mountain Institute, 2014, (6). 143 As the Rocky Mountain Institute study noted: “The coming grid parity of solar-‐plus-‐battery systems in the foreseeable future, among other factors, signals the eventual demise of traditional utility business models…[utilities] could also see solar-‐plus-‐battery systems as an opportunity to add value to the grid and their business. When solar-‐plus-‐battery systems are integrated into a network, new opportunities open up that generate even greater value for customers and the network (e.g. potentially better customer-‐side economics, additional sizing options, ability of distributed systems to share excess generation or storage). [emphasis added]” Ibid, (17, 39). 144 Ibid; and See John, Jeff St. SolarCity Halts Battery-‐Grid Connect Apps Until CA Utilities Open Bottleneck. March 21, 2014. http://www.greentechmedia.com/articles/read/solarcity-‐to-‐ca-‐utilities-‐no-‐more-‐batteries-‐until-‐grid-‐opens-‐up (accessed April 22, 2014). 145 The fees were reported to be:
1. an $800 application fee and a $600 fee for a new meter installation and operations cost for customers in the PG&E territory, and
2. $2,900 in total fees for customers in the SCE territory. The costs for customers in the SDG&E territory were not disclosed. Ibid. 146 SolarCity reported that since 2011, out of a total of 500 applications it received, only 11 PG&E, one SDG&E, and zero SCE customers were approved for interconnection. Ibid. 147 See Martin, Christopher. SolarCity Resumes Applications for California Batteries. April 16, 2014. http://www.bloomberg.com/news/2014-‐04-‐16/solarcity-‐resumes-‐applications-‐for-‐california-‐batteries.html (accessed April 21, 2014).
148 See California Public Utilities Commission. Decision Regarding Net Energy Metering Interconnection Eligibility for Storage Devices Paired with Net Energy Metering Generation Facilities. Proposed Decision, San Franciso: CPUC, 2014, (9). 149 The proposed decision did place some limitations on the size of the storage system, as requested by the IOUs, but also removed the potential for penalties relating to de minimis consumption (i.e. when a storage system consumes some amounts of power to maintain system services), in line with the requests from solar advocacy groups. Ibid, (10, 11, 12-‐13, 18). 150 See Martin, Christopher. SolarCity Resumes Applications for California Batteries. April 16, 2014. http://www.bloomberg.com/news/2014-‐04-‐16/solarcity-‐resumes-‐applications-‐for-‐california-‐batteries.html (accessed April 21, 2014). 151 FERC Order 755 “revises the regulations to remedy undue discrimination in the procurement of frequency regulation in the organized wholesale electric markets and ensure that providers of frequency regulation receive just and reasonable and not unduly discriminatory or preferential rates,” effectively opening the door for fast-‐reacting battery devices to contribute to ramping-‐up and ramping-‐down challenges for the generation fleet and respond automatically to grid operators’ requests for frequency regulation. See Federal Energy Regulatory Commission. Frequency Regulation Compensation in the Organized Wholesale Power Markets. Final Rule, Washington: FERC, 2011. 152 “…the cost of supply and delivery capacity can account for almost 50% of the overall cost of electricity for an average residential customer. Traditionally, residential rate structures are based on metered energy usage. With no separate charge for capacity costs, the energy charge has traditionally been set to recover both costs. Customers that use distributed resources to reduce their grid-‐provided energy consumption significantly but remain connected to the grid may pay significantly less than the costs incurred by the utility to provide capacity and grid connectivity. In effect, the burden of paying for that capacity can potentially shift to consumers without distributed energy resources.” See Electric Power Research Institute. The Integrated Grid: Realizing the Full Value of Central and Distributed Energy Resources. Palo Alto: EPRI, 2014, (24). 153 Several other options exist, including revenue decoupling, time-‐of-‐use pricing, and real-‐time pricing (such as day-‐ahead hourly pricing) mechanisms. See Solar Energy Industries Association. Utility Rate Structure. n.d. http://www.seia.org/policy/distributed-‐solar/utility-‐rate-‐structure (accessed April 24, 2014). California is currently considering implementing time-‐of-‐use rates to better match customer rates with marginal costs. The docket item, R.12-‐06-‐013, would implement a winter off-‐peak rate of $0.114/kWh, a summer-‐peak rate of $0.466/kWh, and an average customer rate of approximately $0.19/kWh. An analysis performed by the Institute for Local Self Reliance found that the application of time-‐of-‐use rates to net metering could increase the value of solar to the customer by as much as 250% when compared to the normal rate schedule. See Paulos, Bentham. Surpassing Milestone of 100,000 Solar Roofs, PG&E Calls for 'Sustainable' Solar Policy. April 21, 2014. http://www.greentechmedia.com/articles/read/pge-‐hits-‐100000-‐solar-‐roofs (accessed April 28, 2014). 154 Arizona’s fixed charge is $0.70/kW of system capacity; for an average system this works out to roughly $5 per month. See Cardwell, Diane. Compromise in Arizona Defers a Solar Power Fight. November 15, 2013. http://www.nytimes.com/2013/11/16/business/energy-‐environment/compromise-‐in-‐arizona-‐defers-‐a-‐solar-‐power-‐fight.html?_r=0 (accessed April 24, 2014). 155 Oklahoma’s Governor Mary Fallin issued an order following the passage of Senate Bill 1456, which authorizes utilities to apply for the authority to impose higher base-‐rates for customers with distributed generation facilities on their property. Governor Fallin’s executive order mandates that the utilities must consider distributed generation sources like solar PV as integral to Oklahoma’s energy policy moving forward. See Colthorpe, Andy. US governor rules in favour of distributed generation. April 24, 2014. http://www.pv-‐tech.org/news/us_governor_rules_in_favour_of_distributed_generation (accessed April 24, 2014).

156 See National Renewable Energy Laboratory. (2013). Treatment of Solar Generation in Electric Utility Resource Planning. Golden: NREL, (37). 157 Ibid. 158 See Farrell, John. The Method and Meaning of Minnesota's New Value of Solar Policy. April 09, 2014. http://www.renewableenergyworld.com/rea/blog/post/2014/04/the-‐method-‐and-‐meaning-‐of-‐minnesotas-‐new-‐value-‐of-‐solar-‐policy (accessed April 24, 2014). 159 See Minnesota Department of Commerce, Division of Energy Resources. Minnesota Value of Solar: Methodology. St. Paul: Minnesota Department of Commerce; Clean Power Research, 2014, (ii). 160 These benefits include:
1. Fuel savings; 2. O&M savings; 3. Deferment of generation and reserve capacity additions; 4. Deferment in transmission and distributed system upgrades; and 5. Environmental benefits, including the estimated avoided cost of climate change-‐related impacts.
The environmental benefit component of the VOST was controversial due to its use of the Social Cost of Carbon (SCC) calculator. The SCC, developed in May 2013, ascribes a cost to carbon dioxide emissions based upon the human health problems, property damage, and agricultural disruptions that can be attributed to increasing carbon dioxide emissions and climate change. The SCC is set to increase from $39 in 2015 to $76 in 2050 using a 3% discount rate. See Friedrich, Kat. Minnesota May Reward Solar Producers for Climate Change Reduction. March 21, 2014. http://www.renewableenergyworld.com/rea/news/article/2014/03/minnesota-‐may-‐reward-‐solar-‐producers-‐for-‐climate-‐change-‐reduction (accessed April 24, 2014). 161 Ibid. 162 See Farrell, John. The Method and Meaning of Minnesota's New Value of Solar Policy. April 09, 2014. http://www.renewableenergyworld.com/rea/blog/post/2014/04/the-‐method-‐and-‐meaning-‐of-‐minnesotas-‐new-‐value-‐of-‐solar-‐policy (accessed April 24, 2014). 163 See Brandt, Yann. Does VOST=FIT, What is a Value of Solar Tariff (VOST)? February 25, 2014. http://www.solarwakeup.com/2014/02/25/does-‐vostfit-‐what-‐is-‐a-‐value-‐of-‐solar-‐tariff-‐vost/ (accessed May 30, 2014). 164 See Minnesota Department of Commerce, Division of Energy Resources. Minnesota Value of Solar: Methodology. St. Paul: Minnesota Department of Commerce; Clean Power Research, 2014, (6). 165 See Friedrich, Kat. Minnesota May Reward Solar Producers for Climate Change Reduction. March 21, 2014. http://www.renewableenergyworld.com/rea/news/article/2014/03/minnesota-‐may-‐reward-‐solar-‐producers-‐for-‐climate-‐change-‐reduction (accessed April 24, 2014) and Vartabedian, Ralph. U.S. electricity prices may be going up for good. April 25, 2014. http://www.latimes.com/nation/la-‐na-‐power-‐prices-‐20140426,0,6329274.story -‐ axzz3024QCO00 (accessed April 28, 2014). 166 Critics have focused their ire on the use of the SCC, noting that Minnesota does not impose a monetary penalty on a utility for carbon emissions, nor are the cost metrics and cost of carbon dioxide known and measureable. In short, Minnesota residents should not be charged for externalities that have yet to be quantified or societal benefits that have yet to be realized. See Friedrich, Kat. Minnesota May Reward Solar Producers for Climate Change Reduction. March 21, 2014. http://www.renewableenergyworld.com/rea/news/article/2014/03/minnesota-‐may-‐reward-‐solar-‐producers-‐for-‐climate-‐change-‐reduction (accessed April 24, 2014). 167 See Farrell, John. The Method and Meaning of Minnesota's New Value of Solar Policy. April 09, 2014. http://www.renewableenergyworld.com/rea/blog/post/2014/04/the-‐method-‐and-‐meaning-‐of-‐minnesotas-‐new-‐value-‐of-‐solar-‐policy (accessed April 24, 2014).

168 See Brandt, Yann. Does VOST=FIT, What is a Value of Solar Tariff (VOST)? February 25, 2014. http://www.solarwakeup.com/2014/02/25/does-‐vostfit-‐what-‐is-‐a-‐value-‐of-‐solar-‐tariff-‐vost/ (accessed May 30, 2014). 169 See National Renewable Energy Laboratory. (2013). Treatment of Solar Generation in Electric Utility Resource Planning. Golden: NREL, (37). 170 See Kind, Peter. Disruptive Challenges: Financial Implications and Strategic Responses to a Changing Retail Electric Business. White Paper, Washington: Edison Electric Institute, 2013, (14-‐15). 171 See Lehr, Ron, and Ron Binz. New Utility Business Models: Implications of a High-‐Penetration Renewable Energy Future. Presentation, Western Governors Association, 2013, (18). 172 See Wesoff, Eric. EPRI Reveals Its Worldview on the Integrated Electrical Grid. April 22, 2014. http://www.greentechmedia.com/articles/read/EPRI-‐Reveals-‐Its-‐Worldview-‐on-‐The-‐Integrated-‐Electrical-‐Grid (accessed April 25, 2014). 173 See Peterson, Lee. Pension Funds Hold a Key to Renewable Energy Finance. April 30, 2014. http://www.renewableenergyworld.com/rea/news/article/2014/04/pension-‐funds-‐hold-‐a-‐key-‐to-‐renewable-‐energy-‐finance?cmpid=rss (accessed April 30, 2014). 174 See Aneiro, Michael. Barclays Downgrades Electric Utility Bonds, Sees Viable Solar Competition. May 23, 2014. http://blogs.barrons.com/incomeinvesting/2014/05/23/barclays-‐downgrades-‐electric-‐utility-‐bonds-‐sees-‐viable-‐solar-‐competition/ (accessed May 30, 2014) and Wile, Rob. Barclays Has The Best Explanation Yet Of How Solar Will Destroy America's Electric Utilities. 28 2014, May. http://www.businessinsider.com/barclays-‐downgrades-‐utilities-‐on-‐solar-‐threat-‐2014-‐5 (accessed May 30, 2014). 175 Ron Lehr and Ron Binz label this the “Grand Bargain” model, where “the direction from the commission would be to negotiate a multi-‐year agreement concerning rates, cost recovery mechanisms, quality of service goals, environmental performance, energy efficiency goals, incentives, etc.” Lehr, Ron, and Ron Binz. New Utility Business Models: Implications of a High-‐Penetration Renewable Energy Future. Presentation, Western Governors Association, 2013, (20). In April 2014, the New York State Department of Public Service published a report entitled Reforming the Energy Vision detailing the state’s plans to rebrand the electric utility sector (and the distribution system in particular) to reflect the entrance of new distributed generation, energy storage, and customer preferences. While the report itself notes the prodigious challenges that accompany such a paradigm shift, the strategies outlined closely mirror the “Grand Bargain” model proposed by Ron Lehr and Ron Binz. See New York State Department of Public Service. Reforming the Energy Vision. Staff Report and Proposal, Albany: New York State Department of Public Service, 2014. 176 See Rosenbaum, Eric. A dirty clean energy battle becoming a utility war. March 6, 2014. http://www.cnbc.com/id/101472289 (accessed April 10, 2014). 177 See National Renewable Energy Laboratory. (2013). Treatment of Solar Generation in Electric Utility Resource Planning. Golden: NREL, (37).