Embed Size (px)
Citation preview

TOPICAL ISSUE:
Potential Macroeconomic Implications of the Trans-Pacific Partnership

CHAPTER 4 GLOBAL ECONOMIC PROSPECTS | JANUARY 2016 219
Introduction
Over the last quarter century, trade flows of goods and services have increased rapidly (Figure 4.1.1). The value of world trade has more than quintupled, from $8.7 trillion in 1990, to more than $46 trillion in 2014. The relative importance of trade has increased too, from 39 percent of world GDP in 1990, to 60 percent in 2014. That said, global trade growth has slowed to about 4 percent per year since the crisis from about 7 percent, on average, during 1990-07. This slowdown in world trade reflects weak global investment growth, maturing global supply chains, and slowing momentum in trade liberalization (World Bank 2015).
On October 4, 2015, 12 Pacific Rim countries concluded negotiations on the Trans-Pacific Partnership (TPP), the largest, most diverse and potentially most comprehensive regional trade agreement yet. The 12 member countries are Australia, Brunei, Canada, Chile, Japan, Malaysia, Mexico, New Zealand, Peru, Singapore, United States, and Vietnam. While a detailed assessment will take time, this analysis and the assumptions used in its modelling exercise are based on a preliminary assessment of the agreement published in early November 2015.
The TPP is one of several Mega-Regional Trade Agreements (MRTAs) that have emerged since the mid-1990s. As a deep and comprehensive “new-generation” trade agreement, the TPP covers traditional barriers to trade in goods and services (e.g. tariffs, restrictions on the movement of professionals), investment activities, and other trade-related areas. Such areas include formal restrictions on some trade and investment activities, burdensome and inconsistent regulations, varying treatment of intellectual property, differing labor and environmental standards, issues specific to small and medium-size enterprises, and new challenges arising from rapidly growing digital technologies. China, the largest trading partner for most member countries of the agreement, is not included, nor is the Republic of Korea. The TPP, however, is designed as a “living agreement” to allow for membership expansion as well as broadening of coverage.
This analysis aims to address the following questions:
• How do new-generation trade agreements (such as the TPP) differ from traditional free trade agreements (FTAs)?
• What are the main features of the Trans-Pacific Partnership?
• What are the potential macroeconomic implications of the TPP?
Potential Macroeconomic Implications
of the Trans-Pacific Partnership
Note: Cis analysis was prepared by Csilla Lakatos, Maryla Maliszewska, Franziska Ohnsorge, Peter Petri, and Michael Plum-mer. It partly draws from a background paper by Petri and Plum-mer (forthcoming).
On October 4, 2015, 12 Pacific Rim countries concluded negotiations on the Trans-Pacific Partnership. If
ratified by all, the agreement could raise GDP in member countries by an average of 1.1 percent by 2030. It
could also increase member countries’ trade by 11 percent by 2030, and represent a boost to regional trade
growth, which had slowed to about 5 percent, on average, during 2010-14 from about 10 percent during 1990
-07. To the extent that the benefits of reforms have positive spillovers for the rest of the world, the detrimental
effects of the agreement due to trade diversion and preference erosion on non-members, would be limited. -e
global significance of the agreement depends on whether it gains broader international traction.

CHAPTER 4 GLOBAL ECONOMIC PROSPECTS | JANUARY 2016 220
How do new generation
trade agreements differ from
traditional FTAs?
Rule-making in the world trading system has shifted from global to bilateral, regional, and sectoral agreements. The Uruguay Round of multilateral trade negotiations, which culminated in the establishment of the World Trade Organization (WTO) in 1994, produced a comprehensive agreement to reduce tariffs on manufactured goods. It also expanded into areas such as agriculture, trade in services, and intellectual property. However, complex trade policy issues, including regulatory barriers, modern services trade and cross-border investment (covered in the General Agreement on Trade in Services, GATS) and the knowledge economy (key aspects covered under the Trade-Related Aspects of Intellectual Property Rights Agreement (TRIPS) have been challenging to address at a multilateral level. Hence, cooperation on these issues has recently taken place through bilateral and/or regional agreements. While there were only a few of these before 2000, their number ballooned to 266 by 2014 (Figure 4.1.2).
At the same time, the concept of deep and comprehensive FTAs has taken hold. These FTAs offer expanded market access, even for products that have previously aroused domestic sensitivities.
Provisions can go well beyond WTO standards. Specific measures include the following:
• a negative-list approach for liberalizing trade in services, which covers all sectors except those explicitly listed (as opposed to the positive list of sectors under GATS);
• new rules for internet and digital commerce;
• across-the-board national treatment for foreign investors, both pre- and post-establishment;
• streamlined regulations through standardized principles;
• enhanced intellectual property protection, with more comprehensive rules and greater enforcement obligations than in the TRIPS agreement;
• government procurement commitments (covered under the plurilateral Government Procurement Agreement in the WTO);
• competitive neutrality for state-owned enterprises;
• labor and environment codes; and
• improved dispute resolution for many issues covered in the agreement.
Regional and mega-regional trade
agreements
In the 1990s, before the surge in bilateral and smaller regional agreements of the 2000s, two large Regional Trade Agreements (RTAs) emerged: the European Union (EU) Single Market (established 1993) and the North American Free Trade Agreement between Canada, Mexico, and the United States (NAFTA, established 1994). These agreements had evolved from two earlier agreements—the European Economic Community, established in 1957 with six member countries, and the Canada-US Free Trade Agreement in 1987.
Source: World Development Indicators 2015.
A. EAP = East Asia and Pacific, ECA = Europe and Central Asia, LAC = Latin America and the
Caribbean, MNA = Middle East and North Africa, SAR = South Asia, SSA = Sub-Saharan Africa.
Regional aggregates include high-income and advanced countries, including the European Union.
FIGURE 4.1.1 Growth in world trade
A. Trade B. Trade
International trade flows of goods and services have increased rapidly until
the global financial crisis but then slowed.

CHAPTER 4 GLOBAL ECONOMIC PROSPECTS | JANUARY 2016 221
Several other RTAs were established in the 1990s.
• Mercosur: Established in 1991, the agreement has six member states in Latin America, including Argentina, Bolivia, Brazil, Paraguay, Uruguay and the Republica Bolivariana de Venezuela.
• South Asian Preferential Trading Arrangement (SAPTA): Originally signed in 1993, the agreement deepened into the South Asian Free Trade Area (SAFTA) in 2004 and now covers eight South Asian countries, including India and Pakistan.
• Association of South East Asian Nations Free Trade Area (ASEAN): Signed in 1992, the agreement now includes ten East Asian countries, including Indonesia, Malaysia, and Thailand.
By 2015, the number of RTAs reached 274. The EU Single Market—now covering 28 members—and NAFTA are by far the largest RTAs in terms of GDP and trade. Together, their member countries account for 50 percent of global GDP and 37 percent of global trade (more than two times as much as the members of the smaller three RTAs combined). The EU Single Market and NAFTA are also the agreements with the largest intra-regional trade. Intra-EU trade accounts for 60 percent of total member trade, while intra-NAFTA trade accounts for 41 percent of total member trade. This compares with less than 20 percent among members of the other three RTAs (Figure 4.1.2).
Mega-regional trade agreements (MRTAs), as defined here, are regional agreements that have systemic, global impact. In other words, they are sufficiently large and ambitious to influence trade rules and trade flows beyond their areas of application.
Earlier RTAs began as initiatives to reduce tariffs. Over time they grew to reduce non-tariff barriers. More recent regional negotiations have, from the outset, focused on more ambitious, deep, and comprehensive agreements. In addition to the TPP, major new negotiations include the Regional
Sources: World Trade Organization’s Regional Trade Agreement database; World Development
Indicators; World Integrated Trade Solution (WITS) database.
B. RTAs are reciprocal trade agreements between two or more partners and include both free trade
agreements and customs unions.
C. D. SAPTA = South Asian Preferential Trading Arrangement; ASEAN = Association of South East
Asian Nations Free Trade Area; EU = European Union; NAFTA = North American Free Trade
Agreement; RCEP = Regional Comprehensive Economic Partnership; FTAAP = Free Trade Area of
the Asia-Pacific; TPP = Trans-Pacific Partnership; TTIP = Transatlantic Trade and Investment
Partnership.
A. Number of regional trade agree-
ments
B. GDP and trade covered by major
RTAs
C. Share of major RTAs in global GDP
and trade
D. Intra-RTA trade
FIGURE 4.1.2 Importance of regional trade agreements
The number of regional trade agreements (RTAs) has grown rapidly.
FIGURE 4.1.3 RTAs: Tariffs and membership
While earlier RTAs predominantly aimed at reducing tariffs, the new
generation of trade agreements focuses more on reducing the
restrictiveness of non-tariff measures. There is considerable overlap in the
membership of the three agreements currently under discussion in Asia.
Sources: World Integrated Trade Solution (WITS) database; Petri and Raheem (2014).
A. Average tariffs B. Pacific mega-RTAs

CHAPTER 4 GLOBAL ECONOMIC PROSPECTS | JANUARY 2016 222
Comprehensive Economic Partnership (RCEP) among 16 Asian economies, and the Trans-Atlantic Trade and Investment Partnership between the European Union and the United States. An even larger Free Trade Area of the Asia-Pacific (FTAAP) among 21 Asia-Pacific Economic Cooperation (APEC) economies is also in early stages of discussion. There is substantial overlap in membership of these groups (Figure 4.1.3).
Benefits offered and challenges posed
by RTAs
The rise of regional agreements has rekindled debate on whether they support or impede global efficiency and activity in member and non-member countries (WTO 2011; Freund and Ornelas 2010; World Bank 2005, Maggi 2014).
Benefits for members. RTAs open markets between partners, leading to a more efficient division of labor, technology spillovers and related productivity growth (“trade creation”; Hoekman and Javorcik 2006, Blyde 2004). A growing literature suggests that trade agreements foster domestic reforms in developing countries (Baccini and Urpelainen, 2014a,b). For example, a range of regulatory reforms have followed EU enlargement (Schönfelder and Wagner 2015; Staehr 2011; Mattli and Plümper 2004; Milner and Kubota 2005). RTAs are also often a step toward larger agreements through the process of competitive liberalization (Baldwin and Jaimovich 2010). For example, the European integration project has expanded from six to 28 members so far. NAFTA grew out of an agreement between Canada and the United States, and while it did not itself expand further, it did spawn a network of agreements between its members and third partners. The Asia-Pacific integration process appears to be following this path.
Studies of the internal political economy of trading blocs point to other positive impacts of RTAs. The domino theory of regionalism argues that as a bloc grows, potential partners likely benefit more from joining, and therefore offer better deals to secure admission (Baldwin 1993). This tilts the political calculus within blocs toward admitting new members (McCulloch and Petri
1997). Blocs that gain critical mass—for example, the European Union—will therefore likely attract a growing membership. Outside the bloc, the bloc’s policies could become an external anchor for institutional reforms in potential future member countries (IMF 2003). In addition, internal political constituencies change as blocs grow.
Drawbacks for members and non-members. While RTAs may significantly benefit members, they can set back economic activity for non-members (Baldwin and Wyplosz, 2006; Krueger 1999). The competitiveness gains developed in these new blocs could potentially divert trade away from more efficient non-member exporters towards less efficient member ones (Viner 1950; Balassa 1967; Baldwin 2006), a phenomenon called the “trade diversion” effect. In addition, RTAs can result in the erosion in the value of preferences given to Least Developed Countries (LDCs) under existing duty-free, quota-free, preferential schemes, such as the “Everything but Arms Initiative” of the European Union and the “African Growth and Opportunities Act” of the U.S. This phenomenon (which applies to both regional and multilateral agreements) is sometimes called the “preference erosion” effect.
RTAs within natural trading blocs—among countries that already trade intensively with each other—tend to have modest diversion effects (Eicher et al. 2012). As a percentage of their total trade, trade among the prospective member states of TPP, FTAAP, and RCEP (35-60 percent) already exceeds that within NAFTA (Figure 4.1.2).
What are the main features
of the Trans-Pacific
Partnership?
The TPP will expand mutual market access among member countries by lowering tariffs and easing the restrictiveness of non-tariff measures. Non-tariff measures (NTMs) cover a wide range of measures that can be obstacles to trade, including import licensing requirements, rules for customs valuations, discriminatory standards, pre-shipment

CHAPTER 4 GLOBAL ECONOMIC PROSPECTS | JANUARY 2016 223
only moderately restrictive NTMs (from zero to 10 percent) and a lower incidence of highly restrictive NTMs (greater than 100 percent) than other countries. Within the TPP group, NTMs are more restrictive in Asia than in North America and Latin America. Studies have noted that more restrictive NTMs have partially offset lower tariffs in advanced economies (Kee, Nicita and Olarreaga 2008). That said, assessing NTMs and their impact is particularly fraught with uncertainty since data on the existence of restrictive NTMs are highly uneven. Unlike tariffs, data on the intensity of NTMs is typically only inferred from bilateral trade flows.
inspections, rules of origin to qualify for lower tariffs, investment measures (e.g. local content requirements), and local sourcing for government procurement. In addition, the TPP will facilitate supply chain integration by encouraging greater regional coherence in standards and regulations.
Tariff and non-tariff measures
Although both tariffs and restrictions caused by non-tariff measures between many TPP members are already low by historical and international comparison, the currently negotiated TPP, would over time eliminate nearly all of tariffs among its members, including very high ones such as the 350 percent tariff on US tobacco imports (Oliver 2015). Also, it would lower trade barriers associated with sizeable non-tariff measures in many member countries (Figure 4.1.4).
Partly due to the general decline in worldwide tariffs, but also because of the proliferation of free trade agreements among TPP countries, average intra-TPP tariffs have more than halved since 1996, to 2.7 percent in 2014 from 5.6 percent in 1996. Much of TPP trade is already covered by trade agreements, including NAFTA; the ASEAN Free Trade Area; the free trade agreement between ASEAN, Australia, and New Zealand; the free trade agreement between ASEAN and Japan; and the P4 Agreement. 1
These averages, however, hide some high tariff barriers on individual goods. Product lines with average tariffs exceeding 15 percent—sometimes dubbed “international peaks”—often protect key domestic interests or industries (UNCTAD, 2000). In the United States and Canada, peaks comprise 3-5 percent of tariff lines. Some advanced countries still apply very high tariff rates on imports of certain items. Peru and Chile, in contrast, have zero peak tariffs.
Restrictions caused by NTMs, measured as ad-valorem equivalents, appear to be less prevalent among TPP member countries than elsewhere. TPP member countries have a higher incidence of
1Ce P4 agreement between Brunei, Chile, Singapore, and New Zealand came into force in 2006.
The TPP is primarily focused on reducing the restrictiveness of non-tariff
measures (NTMs), but also incorporates provisions to cut tariffs. The use of
restrictive NTMs is more prevalent in TPP advanced market economies,
with a higher incidence of restrictive NTMs and lower incidence of less
restrictive NTMs.
Sources: International Trade Center MACMAP database; Kee et al. (2009)
D. AM = TPP advanced market economies (Australia, Canada, Japan, New Zealand, Singapore,
United States), EM = TPP emerging and frontier market economies (Brunei, Chile, Malaysia, Mexico,
Peru, Vietnam).
A. Intra-TPP tariffs B. Average intra-TPP non-tariff
measures by ad-valorem equivalent
size
C. Foreign value-added share of
exports D. Distribution of non-tariff barriers by
ad-valorem equivalent size
FIGURE 4.1.4 The main features of the TPP

CHAPTER 4 GLOBAL ECONOMIC PROSPECTS | JANUARY 2016 224
• Labor and environment. Standards for labor and environmental sustainability are politically contentious. What some interpret as civil rights and sustainability concerns are seen by others as hidden protectionism and restrictions on competition (Lukauskas et al. 2013). The TPP seeks to incorporate International Labor Organization (ILO) obligations, require domestic laws to be consistent with international standards, and provides for enforcement. Environmental standards introduced in the agreement address illegal wildlife trafficking, logging and fishing. They also include provisions on conservation, biodiversity, protecting the ozone layer and environmental goods and services.
• Intellectual property rights. The TPP goes somewhat beyond the WTO’s TRIPS agreement. It requires penalties for the unlawful commercial exploitation of copyrighted work, and prescribes measures to reduce the illegal online distribution of copyrighted material and strengthen copyright terms.4 Some of the IP-related TPP provisions are highly controversial, including those for biologics and trademarks.5 Proponents argue that strong rules and enforcement are necessary in order to support investments in innovation, whereas critics maintain that current levels of IP protection already stifle innovation and generate monopoly rents.6 There is also a concern that greater IP protection will raise the cost of necessary medicines (Hersh and Stiglitz 2015; Stiglitz 2008; Gosselin 2015).
Development of production and supply
chains
In addition to promoting comprehensive market access by reducing tariffs and the restrictiveness of NTMs, the TPP seeks to facilitate the development of supply chains among its members. Supply chain integration has deepened rapidly since 1995, raising the share of foreign value added in TPP member countries’ exports. TPP member countries’ share of foreign value added in exports ranges from 15 percent in advanced countries such as the United States, Australia, and Japan, to 40 percent in Singapore and Malaysia (Figure 4.1.4). The upper end of this range is high by international comparison, and broadly in line with foreign content shares in Eastern Europe, which is deeply integrated into Western European supply chains (OECD 2015).2 The expertise of advanced country firms—at either the marketing end of the chain, or in providing crucial production technologies at the upstream end of the chain—could contribute to the development of more complex value chains (Humphrey and Schmitz 2002; Kowalski et al. 2015). Conversely, supply chains also create interdependencies that can accelerate the transmission of shocks.
Supply chains involve the close coordination of production decisions among different locations. They depend on rapid and reliable ways for shipping goods, making investments, and transferring information. Attracting supply chains to an economy requires good physical connectivity through ports, roads and telecommunications—along with policies that facilitate trade in intermediate products and services, as well as foreign investment. Research suggests that liberal service sector rules are especially important, since high-quality logistics, transportation, financial and consulting services help to support supply chain connections (World Economic Forum, 2012).
The TPP also includes social and environmental provisions that may impact trade and production chains:3
2Foreign value added accounts for 45-49 percent of exports in Hungary, Czech Republic, and Slovak Republic (OECD 2015).
3In addition, for the first time in the context of a free trade agreement, countries have adopted a Declaration (Ce Joint
Declaration of the Macroeconomic Policy Authorities of Trans-Pacific Partnership Countries) that addresses unfair currency practices by promoting transparency and accountability.
4IP provisions lengthen copyright terms, protect clinical data developed by pharmaceutical firms from being used by competitors for a certain period of time, and set transparency standards for choosing medicines for reimbursement by national health plans.
5Ce debate around biologics (drugs and vaccines created from living organisms) centers on data developed by the innovator to demonstrate the safety and effectiveness of a product. Ce US was reportedly seeking 12 years of data protection while the agreement settled on five years plus additional commitments by some members.
6See Pugatch (2006) for a review of legal and political economy issues associated with this debate; and Boldrin and Levine (2013) for a critical view of the economic benefits of patent protection.

CHAPTER 4 GLOBAL ECONOMIC PROSPECTS | JANUARY 2016 225
What are the potential
macroeconomic
implications of the TPP?
The estimations are based on a computable general equilibrium model as originally described in Zhai (2008). Annex 4.1.1 provides details of the analytical approach. The model is particularly well suited to analyzing trade policies and trade links because it allows the emergence of trade in products which were not previously traded between pairs of countries. While the model has some dynamic features (through savings and investment), it lacks positive dynamic feedback loops in member countries such as the accumulation of knowledge and the absorption of foreign technology through TPP-facilitated FDI. As a result, the benefits derived here could underestimate the eventual impact on member countries. Conversely, TPP-triggered productivity increases in member countries could undermine the competitiveness of non-member countries and exacerbate the detrimental effects on non-members.
The results rest on planned tariff cuts in accordance with the provisions of TPP and on several key assumptions about the theoretically desirable and politically feasible non-tariff barrier cuts, dubbed “actionable,” and the actual cuts implemented in the TPP. The macroeconomic implications of the TPP are evaluated relative to a baseline scenario that includes pre-existing trade agreements among member countries (e.g. NAFTA, AFTA, the ASEAN-Australia-New Zealand FTA, the ASEAN-Japan FTA and the P4 Agreement).
Three assumptions are of particular importance to the results: the restrictiveness of new rules of origin, cuts in barriers to services, and spillovers from regulatory harmonization.8
• “Cumulative” rules of origin could encourage regional production networks but may require
Although not explicitly modelled in this study, the harmonization of labor and environmental standards within the TPP could have important implications for participating developing countries, such as Malaysia, Mexico, Peru, and Vietnam. While such harmonization, which goes beyond product standards to encompass production process standards, has social and environmental benefits, it may also affect competitiveness of firms in countries that currently do not meet such standards. Trade-related product standards typically apply only to products destined for specific destinations, and a firm can choose whether to meet them. However, labor and environmental standards apply across the board to all production, including that destined for consumption at home and in non-TPP countries, and compliance is mandatory (and subject to dispute settlement).7
Some of these broader provisions, including labor, environmental, pharmaceutical and state-owned enterprise regulation, may require deep reforms and a difficult adjustment process in member countries. They are not modelled in the approach taken here, but could affect aggregate gains if fully implemented. For example, state-owned enterprise reform could generate significant productivity gains; tightened labor and environmental regulation could reduce competitiveness and GDP
gains but achieve other regulatory objectives (Box 4.1.1). Similarly, free trade agreements are often followed by tariff reductions for non-members, which are not modelled here (Estevadeordal, Freund and Ornelas 2008; Freund and Ornelas 2010). Policy changes in non-members could enhance the benefits of TPP to them (Ciuriak and Singh 2015).
8A further assumption is that the agreement will be implemented in 2017. However, the agreement has yet to be ratified by all its members.
7See Mattoo (2001). A review of the literature finds no clear empirical evidence that adherence to stronger labor standards has a significant impact on trade performance (Salem and Rozental 2012). However, there is some evidence that certain types of envi-ronmental regulation can adversely affect productivity (e.g., Green-stone, List and Syverson 2012).
CHAPTER 4 GLOBAL ECONOMIC PROSPECTS | JANUARY 2016 226
some producers to replace more inputs with higher-cost inputs from TPP members to qualify for low TPP tariffs. The rules of origin affect the share of exports that benefit from tariff preferences. These shares are assumed to rise from 30 percent to 69 percent over a decade in the case of apparel, but more quickly for other products. The model assumes that rules of origin lead to the replacement of 40 percent of imported inputs with higher-cost regionally originating ones, on average.
• Existing services barriers are estimated indirectly from bilateral trade flows (Fontagne, Guillin and Mitaritonna 2011). Only half of these estimated barriers are assumed to be actionable through policy changes, and only a part of those are assumed to be eliminated by the TPP. While this fraction will depend on actual implementation, a preliminary assessment of the TPP suggests that the provisions are broadly in line with those in the existing agreement between Korea and the
United States (e.g. provisions pertaining to greater transparency and enforceable negative lists). Therefore, the fraction of actual reductions in actionable services barriers is assumed to be similar to that observed in the agreement between Korea and the United States.
• Non-discriminatory trade liberalization (positive spillovers) will be a byproduct of the TPP, to some extent, as common and more transparent regulatory approaches also facilitate trade of non-members with TPP members (Box 4.1.1). Many TPP provisions that are designed to reduce the restrictiveness of NTMs focus on increasing the transparency and predictability of regulations, and still others require policies (such as rules for government procurement or electronic commerce) that are not easily restricted to members. Provided these provisions are fully implemented in a non-discriminatory manner, they will benefit members and non-members alike. At an aggregate level, 20 percent of NTM liberalization adopted in the TPP is assumed to consist of such non-discriminatory provisions. Although the debate on the precise number is not yet settled, this is at the low end of assumptions used in other studies based on business surveys (European Commission 2013).9
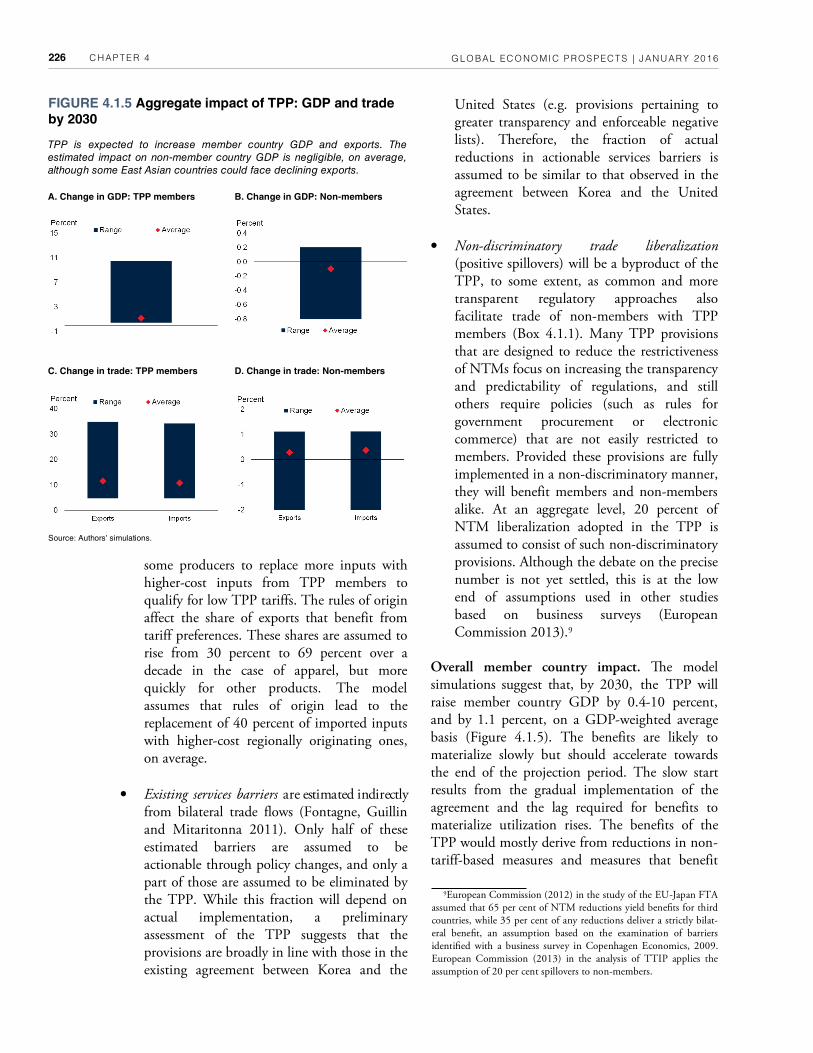
Overall member country impact. Ce model simulations suggest that, by 2030, the TPP will raise member country GDP by 0.4-10 percent, and by 1.1 percent, on a GDP-weighted average basis (Figure 4.1.5). The benefits are likely to materialize slowly but should accelerate towards the end of the projection period. The slow start results from the gradual implementation of the agreement and the lag required for benefits to materialize utilization rises. The benefits of the TPP would mostly derive from reductions in non-tariff-based measures and measures that benefit
9European Commission (2012) in the study of the EU-Japan FTA assumed that 65 per cent of NTM reductions yield benefits for third countries, while 35 per cent of any reductions deliver a strictly bilat-eral benefit, an assumption based on the examination of barriers identified with a business survey in Copenhagen Economics, 2009. European Commission (2013) in the analysis of TTIP applies the assumption of 20 per cent spillovers to non-members.
FIGURE 4.1.5 Aggregate impact of TPP: GDP and trade by 2030
TPP is expected to increase member country GDP and exports. The
estimated impact on non-member country GDP is negligible, on average,
although some East Asian countries could face declining exports.
Source: Authors’ simulations.
A. Change in GDP: TPP members B. Change in GDP: Non-members
C. Change in trade: TPP members D. Change in trade: Non-members
CHAPTER 4 GLOBAL ECONOMIC PROSPECTS | JANUARY 2016 227
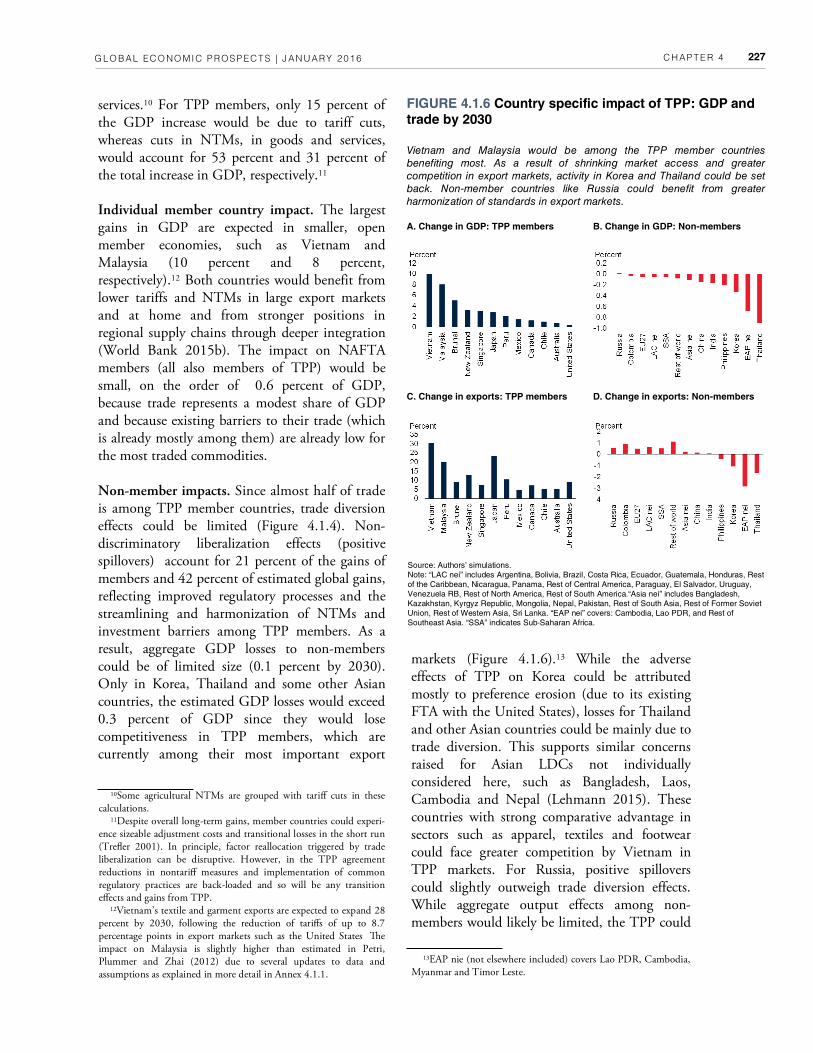
services.10 For TPP members, only 15 percent of the GDP increase would be due to tariff cuts, whereas cuts in NTMs, in goods and services, would account for 53 percent and 31 percent of the total increase in GDP, respectively.11
Individual member country impact. The largest gains in GDP are expected in smaller, open member economies, such as Vietnam and Malaysia (10 percent and 8 percent, respectively).12 Both countries would benefit from lower tariffs and NTMs in large export markets and at home and from stronger positions in regional supply chains through deeper integration (World Bank 2015b). The impact on NAFTA members (all also members of TPP) would be small, on the order of 0.6 percent of GDP, because trade represents a modest share of GDP and because existing barriers to their trade (which is already mostly among them) are already low for the most traded commodities.
Non-member impacts. Since almost half of trade is among TPP member countries, trade diversion effects could be limited (Figure 4.1.4). Non-discriminatory liberalization effects (positive spillovers) account for 21 percent of the gains of members and 42 percent of estimated global gains, reflecting improved regulatory processes and the streamlining and harmonization of NTMs and investment barriers among TPP members. As a result, aggregate GDP losses to non-members could be of limited size (0.1 percent by 2030). Only in Korea, Thailand and some other Asian countries, the estimated GDP losses would exceed 0.3 percent of GDP since they would lose competitiveness in TPP members, which are currently among their most important export
FIGURE 4.1.6 Country specific impact of TPP: GDP and trade by 2030
Vietnam and Malaysia would be among the TPP member countries
benefiting most. As a result of shrinking market access and greater
competition in export markets, activity in Korea and Thailand could be set
back. Non-member countries like Russia could benefit from greater
harmonization of standards in export markets.
A. Change in GDP: TPP members B. Change in GDP: Non-members
C. Change in exports: TPP members D. Change in exports: Non-members
Source: Authors’ simulations.
Note: “LAC nei” includes Argentina, Bolivia, Brazil, Costa Rica, Ecuador, Guatemala, Honduras, Rest
of the Caribbean, Nicaragua, Panama, Rest of Central America, Paraguay, El Salvador, Uruguay,
Venezuela RB, Rest of North America, Rest of South America.“Asia nei” includes Bangladesh,
Kazakhstan, Kyrgyz Republic, Mongolia, Nepal, Pakistan, Rest of South Asia, Rest of Former Soviet
Union, Rest of Western Asia, Sri Lanka. “EAP nei” covers: Cambodia, Lao PDR, and Rest of
Southeast Asia. “SSA” indicates Sub-Saharan Africa.
10Some agricultural NTMs are grouped with tariff cuts in these calculations.
11Despite overall long-term gains, member countries could experi-ence sizeable adjustment costs and transitional losses in the short run (Trefler 2001). In principle, factor reallocation triggered by trade liberalization can be disruptive. However, in the TPP agreement reductions in nontariff measures and implementation of common regulatory practices are back-loaded and so will be any transition effects and gains from TPP.
12Vietnam’s textile and garment exports are expected to expand 28 percent by 2030, following the reduction of tariffs of up to 8.7 percentage points in export markets such as the United States Ce impact on Malaysia is slightly higher than estimated in Petri, Plummer and Zhai (2012) due to several updates to data and assumptions as explained in more detail in Annex 4.1.1.
13EAP nie (not elsewhere included) covers Lao PDR, Cambodia, Myanmar and Timor Leste.
markets (Figure 4.1.6).13 While the adverse effects of TPP on Korea could be attributed mostly to preference erosion (due to its existing FTA with the United States), losses for Thailand and other Asian countries could be mainly due to trade diversion. This supports similar concerns raised for Asian LDCs not individually considered here, such as Bangladesh, Laos, Cambodia and Nepal (Lehmann 2015). These countries with strong comparative advantage in sectors such as apparel, textiles and footwear could face greater competition by Vietnam in TPP markets. For Russia, positive spillovers could slightly outweigh trade diversion effects. While aggregate output effects among non-members would likely be limited, the TPP could
CHAPTER 4 GLOBAL ECONOMIC PROSPECTS | JANUARY 2016 228
sectors of non-member economies towards services sectors.
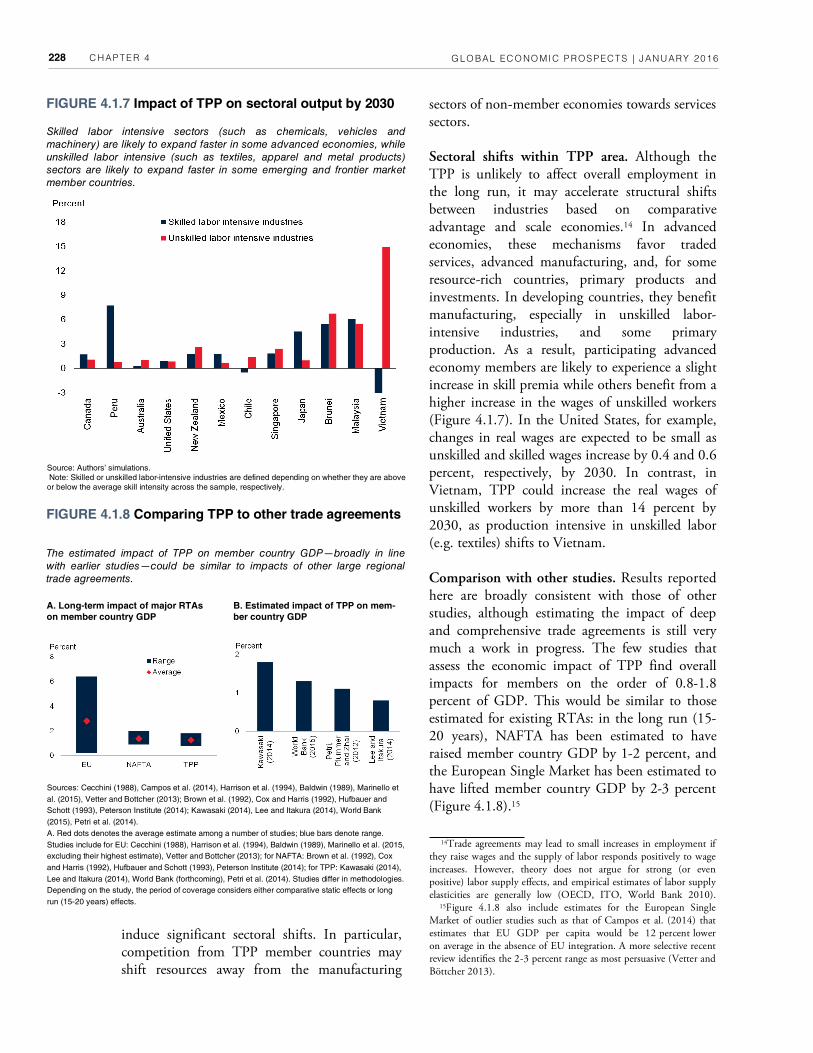
Sectoral shifts within TPP area. Although the TPP is unlikely to affect overall employment in the long run, it may accelerate structural shifts between industries based on comparative advantage and scale economies.14 In advanced economies, these mechanisms favor traded services, advanced manufacturing, and, for some resource-rich countries, primary products and investments. In developing countries, they benefit manufacturing, especially in unskilled labor-intensive industries, and some primary production. As a result, participating advanced economy members are likely to experience a slight increase in skill premia while others benefit from a higher increase in the wages of unskilled workers (Figure 4.1.7). In the United States, for example, changes in real wages are expected to be small as unskilled and skilled wages increase by 0.4 and 0.6 percent, respectively, by 2030. In contrast, in Vietnam, TPP could increase the real wages of unskilled workers by more than 14 percent by 2030, as production intensive in unskilled labor (e.g. textiles) shifts to Vietnam.
Comparison with other studies. Results reported here are broadly consistent with those of other studies, although estimating the impact of deep and comprehensive trade agreements is still very much a work in progress. The few studies that assess the economic impact of TPP find overall impacts for members on the order of 0.8-1.8 percent of GDP. This would be similar to those estimated for existing RTAs: in the long run (15-20 years), NAFTA has been estimated to have raised member country GDP by 1-2 percent, and the European Single Market has been estimated to have lifted member country GDP by 2-3 percent (Figure 4.1.8).15
14Trade agreements may lead to small increases in employment if they raise wages and the supply of labor responds positively to wage increases. However, theory does not argue for strong (or even positive) labor supply effects, and empirical estimates of labor supply elasticities are generally low (OECD, ITO, World Bank 2010). 15Figure 4.1.8 also include estimates for the European Single Market of outlier studies such as that of Campos et al. (2014) that estimates that EU GDP per capita would be 12 percent lower on average in the absence of EU integration. A more selective recent review identifies the 2-3 percent range as most persuasive (Vetter and Böttcher 2013).
FIGURE 4.1.8 Comparing TPP to other trade agreements
Sources: Cecchini (1988), Campos et al. (2014), Harrison et al. (1994), Baldwin (1989), Marinello et
al. (2015), Vetter and Bottcher (2013); Brown et al. (1992), Cox and Harris (1992), Hufbauer and
Schott (1993), Peterson Institute (2014); Kawasaki (2014), Lee and Itakura (2014), World Bank
(2015), Petri et al. (2014).
A. Red dots denotes the average estimate among a number of studies; blue bars denote range.
Studies include for EU: Cecchini (1988), Harrison et al. (1994), Baldwin (1989), Marinello et al. (2015,
excluding their highest estimate), Vetter and Bottcher (2013); for NAFTA: Brown et al. (1992), Cox
and Harris (1992), Hufbauer and Schott (1993), Peterson Institute (2014); for TPP: Kawasaki (2014),
Lee and Itakura (2014), World Bank (forthcoming), Petri et al. (2014). Studies differ in methodologies.
Depending on the study, the period of coverage considers either comparative static effects or long
run (15-20 years) effects.
A. Long-term impact of major RTAs
on member country GDP
B. Estimated impact of TPP on mem-
ber country GDP
The estimated impact of TPP on member country GDP—broadly in line
with earlier studies—could be similar to impacts of other large regional
trade agreements.
FIGURE 4.1.7 Impact of TPP on sectoral output by 2030
Skilled labor intensive sectors (such as chemicals, vehicles and
machinery) are likely to expand faster in some advanced economies, while
unskilled labor intensive (such as textiles, apparel and metal products)
sectors are likely to expand faster in some emerging and frontier market
member countries.
Source: Authors’ simulations.
Note: Skilled or unskilled labor-intensive industries are defined depending on whether they are above
or below the average skill intensity across the sample, respectively.
induce significant sectoral shifts. In particular, competition from TPP member countries may shift resources away from the manufacturing
CHAPTER 4 GLOBAL ECONOMIC PROSPECTS | JANUARY 2016 229
countries see the liberalization required by the TPP as a driver for difficult policy changes. However, implementation of MRTAs, including the TPP, requires institutional capacity not available to some developing countries (Michalopoulos 1999; Hoekman et al. 2003). As the TPP is implemented over time, emphasis on the following issues would be important to mitigate unfavorable effects on developing countries:
• Capacity building. Capacity building and technical assistance for developing country members are an important building block of the TPP.
• Liberal rules of origin. TPP members and non-members will benefit if rules of origin mandating higher-cost inputs from TPP members are implemented in a permissive rather than restrictive manner.
• Liberalize labor- and resource-intensive industries. Low- and middle-income economies often have a comparative advantage in labor- and natural-resource intensive industries. By cutting tariffs for labor-intensive garments, the TPP thus benefits countries like Vietnam.
• Multilateral framework. Bringing MRTAs into a global framework would broaden the gains to a wider set of countries and reduce detrimental diversion effects for non-members. Implementation of the “living agreement” clause that keeps TPP membership open is particularly important.
Against the background of slowing trade growth, rising non-tariff impediments to trade, and insufficient progress in global negotiations, the TPP represents an important milestone. The TPP stands out among FTAs for its size, diversity and rulemaking. Its ultimate implications, however, remain unclear. Much will depend on whether the TPP is quickly adopted and effectively implemented, and whether it triggers productive reforms in developing and developed countries. Broader systemic effects, in turn, will require expanding such reforms to global trade, whether through TPP enlargement, competitive effects on other trade agreements, or new global rules.
Conclusion
This analysis discussed the features of new-generation free-trade agreements and TPP, specifically, and traced out potential macroeconomic implications for member and non-member countries. As a new-generation, deep and comprehensive trade agreement, TPP addresses a wide range of complex trade policy issues that go beyond the scope of traditional trade agreements. The agreement will reduce tariffs and restrictiveness of non-tariff measures as well as harmonize a range of regulations to encourage the integration of supply chains and cross-border investment.
TPP could be an important complement to other policies to lift medium-term growth:
• By shifting resources towards the most productive firms and sectors and expanding export markets, TPP has the potential to lift overall GDP of member countries by 1.1 percent by 2030. The impact could be considerably more in countries facing currently elevated barriers to trade (as much as 10 percent in Vietnam and 8 percent in Malaysia). In countries that export labor-intensive products, incomes of low-income and low-skilled households could expand strongly.
• To the extent that the TPP produces positive spillover benefits for other countries, detrimental effects on non-member countries may be limited. Such positive spillovers could arise from harmonized regulatory regimes in TPP export markets.
• TPP could also lift member countries’ trade by 11 percent by 2030. This would be an important counterweight to the trade slowdown underway since 2011. At current 2011-14 trends, member countries’ trade would fall 25 percent below pre-crisis trend by 2030.
Policy reforms are needed to enhance the benefits of TPP—like other RTAs—in developing countries. Governments in several member

CHAPTER 4 GLOBAL ECONOMIC PROSPECTS | JANUARY 2016 230
BOX 4.1.1 Regulatory convergence in mega-regional trade agreements
Introduction
Trade policy makers like to think of standards as the seabed rocks that are revealed as the tide of tariffs ebbs. Not surprisingly, the European Union and the United States, with their relatively low tariffs, have decided to address the trade impact of mandatory standards—referred to formally as Technical Barriers to Trade (TBT) and, when they concern food safety and animal and plant health standards, as Sanitary and Phytosanitary (SPS) measures—in the context of the prospective Transatlantic Trade and Investment Partnership (T-TIP). To a more limited extent, the diverse group of countries that has just concluded the Transpacific Partnership (TPP) have also decided to adopt a “common regulatory approach” in certain respects. For the most part, the TPP initiates a cooperative process rather than an obligation of early implementation. Would all countries, within and outside the TPP, benefit from these developments?
Whereas the T-TIP has an ambitious agenda on regulatory convergence, parties to the TPP have settled on a dual approach. First, they have agreed on “transparent, non-discriminatory rules for developing regulations, standards and conformity assessment procedures, while preserving TPP Parties’ ability to fulfill legitimate objectives.” In this respect, the TPP rules broadly reflect, and in fact, directly incorporate some of the main rules already contained in the WTO, TBT, and SPS agreements. In specific sectors, the Parties have also agreed to promote a more streamlined regulatory approach across the TPP region. The sectors selected for such an approach include cosmetics, medical devices, pharmaceuticals, information and communications technology products, wine and distilled spirits, proprietary formulas for prepackaged foods and food additives, and organic agricultural products. The provisions of the agreement cover labelling requirements for wine, marketing authorizations for pharmaceuticals, medical devices and cosmetics, and encourage mutual recognition of standards for organic products as well as mutual recognition of conformity assessment of telecommunications equipment.
What does regulatory convergence as envisaged in the T-TIP and TPP imply? The voluminous research on
preferential trade agreements, with its almost exclusive focus on tariffs and (sometimes) quotas, provides only limited illumination on the implications of agreements on standards. Baldwin (2000) presented a useful analytical framework for the analysis of mutual recognition agreements (MRAs), but assumed identical countries with identical costs of complying with standards. Few previous studies have empirically explored the impact of shared standards on trade (e.g., Swann et al. 1996, Moenius 2004, Shepherd 2007, Reyes 2011, and Orefice et al. 2012).
This box draws on one of the few papers to analyze the implications of preferential agreements on standards (Chen and Mattoo, 2008). It addresses the following questions pertaining to a common regulatory approach:
• How could it be implemented?
• What are its implications?
• What policy choices would ensure that it produces wider gains?
How could a common regulatory approach be
implemented?
Based on earlier experience, notably in the European Union, three broad types of agreements are available to deal with technical barriers to trade. The TPP seems to place emphasis primarily on the third type of agreement listed below.
Mutual recognition of existing standards. The simplest, and potentially most powerful, is the mutual recognition of existing standards, whereby a country grants unrestricted access to its market to products that meet any participating country’s standards. This was the approach taken in principle by the European Union following the Cassis de Dijon judgment of the European Court of Justice. Mutual Recognition Agreements (MRAs) are, however, not likely to be an option if there is a significant difference in the initial standards of the countries, as became evident in the context of the European Union.
Harmonization of standards. In such cases, a certain degree of harmonization is a precondition for countries to
Note: Cis box was prepared by Aaditya Mattoo.
TPP aims to promote a common regulatory approach, either through mutual recognition agreements or outright harmonization. Benefits for members and non-members tend to be higher when members choose mutual recognition and rules of origin are not restrictive.
CHAPTER 4 GLOBAL ECONOMIC PROSPECTS | JANUARY 2016 231
BOX 4.1.1 Regulatory convergence in mega-regional trade agreements (continued)
allow products of other countries to access their markets. The most important example of such harmonization is the current approach of the European Union where directives from the European Commission set out essential health and safety requirements for most regulated products.
Mutual recognition of conformity assessments of requirements. In many other cases, neither mutual recognition nor harmonization of substantive standards are deemed feasible or desirable. Instead, countries may choose to mutually recognize each other’s conformity assessment requirements (e.g., Country A trusts Country B to certify that the products made by Country B conform to Country A’s standards). Examples of such initiatives are the intra-EU MRAs on some unharmonized industries and the EU’s agreements with a number of other countries. A key element of these agreements is the rule of origin. Previous MRAs between the EU and US and the EU and Canada specify that conformity assessments done in one of the MRA countries, in which products are manufactured or through which they are imported, is accepted throughout the entire agreement region. Other agreements, such as the MRAs the EU has concluded with Australia and New Zealand, impose restrictive rules of origin that require third country products to meet the conformity assessment of each country in the region.
What are the implications of a common regulatory approach?
The implications of a common regulatory approach depend on the chosen approach. A significant upward harmonization of standards can be more detrimental to exporters in non-member countries than mutual recognition of standards that avoids restrictive rules of origin.
Harmonization of standards. Harmonization of product standards implies that firms do not need to create different products for different markets. In the resulting integrated market, firms can reap economies of scale. These benefits accrue not just to firms of participating countries but also to firms in third countries. However, the economic impact of standards harmonization also depends on the level at which the harmonized standard is set. The impact on the firms of a specific country depends on how the costs of meeting the new harmonized level of the standard compare with the benefits from economies of scale in integrated markets. If firms from some countries incur a higher cost in meeting the harmonized standard and reap fewer scale economy benefits in integrated markets than
firms from other countries, then the former can suffer a decline in exports to the integrated market when harmonization raises some destination countries’ standards.
Available evidence suggests that harmonization within the EU tended toward the high range of initial standards due to pressure from the EU’s richer members (see Vogel 1995). For example, in the late 1990s, when the EU decided to harmonize standards for aflatoxins (a group of toxic compounds produced by certain molds), eight member states—including Italy, the Netherlands, and Spain—raised their national standards substantially. This likely caused African exports of cereals, dried fruits, and nuts to Europe to decline by as much as $670 million (Otsuki et al. 2001). Recent research using firm-level data for 42 developing countries also suggests that an increase in the distance between source and destination country standards can have an adverse effect on both firm entry into exporting and export volumes (Fernandes et al. 2015).
Mutual recognition of standards. The economic impact of an MRA depends critically on the choice of rules of origin.
• Member countries. An MRA of standards is in effect a downward harmonization of standards since firms are now free to meet the least costly of the initial standards: trade is stimulated not only by market integration but also by the reduced stringency of the standard.
• Non-member countries. The implications for imports from third countries differ dramatically with rules of origin. If the firms of non-participating countries are also entitled to access the entire region by conforming to the least costly standard, then they too reap benefits.16 In contrast, if firms of third countries are denied the benefits of the MRA and must continue to meet the original standard in each market, they will face unchanged absolute conditions but suffer a decline in relative competitiveness—and hence a decline in exports to the region.17
16Ce best example of liberal rules of origin is the EU’s regime for goods: thanks to the Cassis de Dijon judgment, even the products of a third country, say a Korean medical device, admitted for sale in one EU country are free to circulate in all EU countries.
17Restrictive rules of origin have proved problematic for some of the EU’s previous recognition agreements, such as those governing profes-sional-services standards. For example, while a Brazilian orange admitted for sale in Portugal can be sold throughout the EU, a Brazilian engineer or accountant licensed in Portugal must fulfill separate licensing require-ments to work elsewhere in the EU, forcing non-European services pro-
viders to endure costly and inefficient bureaucratic procedures.
CHAPTER 4 GLOBAL ECONOMIC PROSPECTS | JANUARY 2016 232
BOX 4.1.1 Regulatory convergence in mega-regional trade agreements (continued)
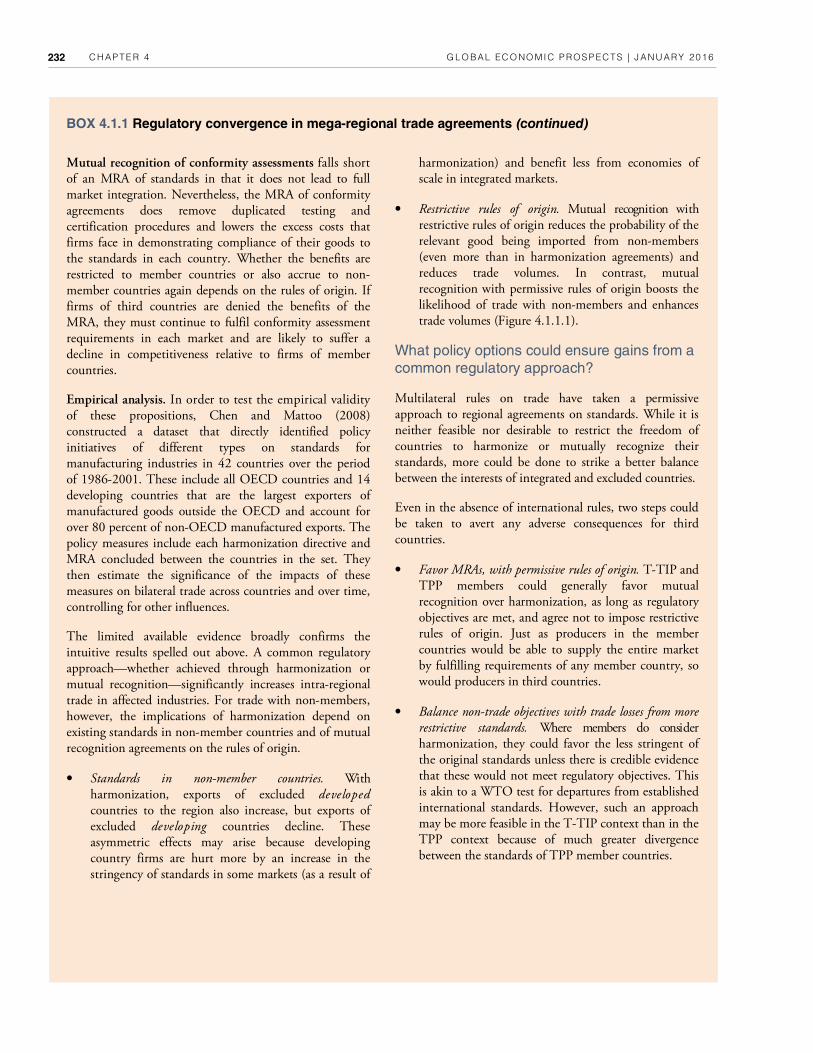
Mutual recognition of conformity assessments falls short of an MRA of standards in that it does not lead to full market integration. Nevertheless, the MRA of conformity agreements does remove duplicated testing and certification procedures and lowers the excess costs that firms face in demonstrating compliance of their goods to the standards in each country. Whether the benefits are restricted to member countries or also accrue to non-member countries again depends on the rules of origin. If firms of third countries are denied the benefits of the MRA, they must continue to fulfil conformity assessment requirements in each market and are likely to suffer a decline in competitiveness relative to firms of member countries.
Empirical analysis. In order to test the empirical validity of these propositions, Chen and Mattoo (2008) constructed a dataset that directly identified policy initiatives of different types on standards for manufacturing industries in 42 countries over the period of 1986-2001. These include all OECD countries and 14 developing countries that are the largest exporters of manufactured goods outside the OECD and account for over 80 percent of non-OECD manufactured exports. The policy measures include each harmonization directive and MRA concluded between the countries in the set. They then estimate the significance of the impacts of these measures on bilateral trade across countries and over time, controlling for other influences.
The limited available evidence broadly confirms the intuitive results spelled out above. A common regulatory approach—whether achieved through harmonization or mutual recognition—significantly increases intra-regional trade in affected industries. For trade with non-members, however, the implications of harmonization depend on existing standards in non-member countries and of mutual recognition agreements on the rules of origin.
• Standards in non-member countries. With harmonization, exports of excluded developed countries to the region also increase, but exports of excluded developing countries decline. These asymmetric effects may arise because developing country firms are hurt more by an increase in the stringency of standards in some markets (as a result of
harmonization) and benefit less from economies of scale in integrated markets.
• Restrictive rules of origin. Mutual recognition with restrictive rules of origin reduces the probability of the relevant good being imported from non-members (even more than in harmonization agreements) and reduces trade volumes. In contrast, mutual recognition with permissive rules of origin boosts the likelihood of trade with non-members and enhances trade volumes (Figure 4.1.1.1).
What policy options could ensure gains from a common regulatory approach?
Multilateral rules on trade have taken a permissive approach to regional agreements on standards. While it is neither feasible nor desirable to restrict the freedom of countries to harmonize or mutually recognize their standards, more could be done to strike a better balance between the interests of integrated and excluded countries.
Even in the absence of international rules, two steps could be taken to avert any adverse consequences for third countries.
• Favor MRAs, with permissive rules of origin. T-TIP and TPP members could generally favor mutual recognition over harmonization, as long as regulatory objectives are met, and agree not to impose restrictive rules of origin. Just as producers in the member countries would be able to supply the entire market by fulfilling requirements of any member country, so would producers in third countries.
• Balance non-trade objectives with trade losses from more restrictive standards. Where members do consider harmonization, they could favor the less stringent of the original standards unless there is credible evidence that these would not meet regulatory objectives. This is akin to a WTO test for departures from established international standards. However, such an approach may be more feasible in the T-TIP context than in the TPP context because of much greater divergence between the standards of TPP member countries.

CHAPTER 4 GLOBAL ECONOMIC PROSPECTS | JANUARY 2016 233
BOX 4.1.1 Regulatory convergence in mega-regional trade agreements (continued)
Mutual recognition without restrictive rules of origin promises the greatest benefits to third countries.
FIGURE 4.1.1.1 Implications of a common regulatory approach
Source: Chen and Mattoo (2008).
Notes: ROO = Rules of origin.
A. Bars indicate the percentage point increase in the probability that a good is traded as a result of a common regulatory approach (Chen and Mattoo 2008).
B. Bars indicate the percent increase in average annual trade volume as a result of a common regulatory approach (Chen and Mattoo 2008).
A. Impact on the probability of trading with non-members B. Impact on trade volumes with non-members
CHAPTER 4 GLOBAL ECONOMIC PROSPECTS | JANUARY 2016 234
productivity increases from the accumulation of knowledge and other endogenous growth effects, TPP-induced inflows of foreign technology and capital, and follow-up trade liberalization that may result from an agreement. Introducing such effects can dramatically change the results, as demonstrated by experiments reported in Todo (2013).
Retrospective studies have shown that estimates based on conventional CGE models have under-predicted actual increases in trade (Kehoe, 2005). Ce likely reason is that traditional models projected trade increases only for products already exported (the intensive margin of trade), but had no mechanisms for anticipating new trading activities (the extensive margin of trade) (see Kehoe 2005, Zhai 2008, Hammouda and Osakewe 2008, Costinot and Rodriguez-Clare 2013). Cis confirms the need for modeling the extensive margin of trade in assessing trade agreements as implemented in this study. In addition, several previous CGE applications were based on comparative static models with constant returns to scale, not incorporating the potential of FTAs for stimulating investment, capital stock growth, and productivity gains (Nielsen 2003, Hammouda and Osakewe 2008, Costinot and Rodriguez-Clare 2013, Kose, Meredith and Towe 2005, Kouparitsas 1998). Ce present study allows for the dynamic accumulation of capital stock via investment and increases in productivity following entry and exit of firms in increasing returns to scale sectors. It does not however capture the dynamic growth effects via technological spillovers and “learning by doing” (Arrow 1962).
Compared to Petri et al. (2012), the modeling framework used here introduces numerous updates to the underlying data and modeling specifications. First, the underlying database has been updated to 2011 (compared to 2007 in the previous study) to incorporate not only macroeconomic changes but also updated tariff information. Baseline projections are updated (World Bank 2014; World Bank, forthcoming). Ce estimates also incorporate new trade balance
Modelling strategy
Results are based on a 19-sector, 29-region, dynamic computable general equilibrium (CGE) model. CGE models account simultaneously for interactions among firms, households, and governments in multiple product markets—and across several countries and regions of the world economy. Firms are assumed to maximize profits and consumers to maximize utility. After transfers among firms, households, and governments, incomes are spent on goods, or are saved and invested, both at home and abroad. Ce model finds an equilibrium solution by calculating prices that equate supply to demand for each product and factor of production (labor, capital, and land) in every region. Ce effects of FTAs are simulated by introducing changes in tariffs and other parameters, finding a new equilibrium, and comparing new prices, output, trade, income, and demand to pre-change levels.
Several innovative features of the model are based on a specification as in Zhai (2008). Cis relies on the theoretical work of Melitz (2003) and others that recognizes heterogeneity in firms’ productivity levels, even within narrowly defined sectors. Ce model assumes that exports in any given sector involve special fixed costs, which only the most productive firms in the sector can cover. In this setting, FTAs affect not only inter-sectoral specialization, but also the range of products traded, and the distribution of firms within industries. Liberalization causes more varieties to be exported and imported, the expansion of the most productive firms, and the contraction of the least productive firms. Cis specification predicts more trade and greater benefits than conventional approaches based on inter-sectoral specialization effects alone.
Ce model is dynamic in the sense that simulations track changes in the volume of savings, which affects capital accumulation over time. However, the model does not include other dynamic factors proposed in the literature, such as
Annex 4.1 Methodology
CHAPTER 4 GLOBAL ECONOMIC PROSPECTS | JANUARY 2016 235
more than that for some commodities and in early stages of the agreement. For large tariffs cuts, for which the preference margin changes by more than 5 percentage points, the effect of tariffs cuts is reduced by only 10 percent (rather than 31 percent) in the long run.
• Rules of origin. To qualify for preferential intra-TPP tariffs, TPP member countries need to comply with sector-specific rules of origin, which require a minimum share of inputs from inside the TPP.1 On the surface, rules of origin are particularly stringent for garments and apparel (“yarn forward”); however, a number of exceptions soften the impact. Rules of origin in automotives, in contrast, appear less restrictive than in the agreement between the United States and Korea (45 percent within-TPP content compared with 55 percent in the Korea-U.S. agreement). Again, the impact is mitigated by a revised definition of domestic and foreign content. As a result of rules of origin, where the tariff reduction is high, some inputs may now be sourced from within the TPP membership, replacing lower-cost inputs used earlier. Ce fraction of inputs thus replaced is estimated to depend on the tariff preference margin and the economic size (GDP) of the membership of the agreement, since larger agreements are more likely to include more efficient input suppliers (Petri and Plummer forthcoming). Specifically, for 40 percent of inputs, costs are assumed to rise by 10 percent of the tariff reductions offered by the agreement.
Actionable non-tariff measures. NTMs for goods and services sectors are constructed from the estimates of Kee, Nicita, and Olarreaga (2009), updated to 2012 for goods, and from estimates by Fontagne, Guillin, and Mitaritonna (2011), for services. Cree-quarters of these measured barriers—which include regulations that increase consumer welfare—are assumed to be impediments to trade and subject to reduction
projections (IMF 2015). Second, based on the latest news about the TPP, the published TPP agreement, tariffs and the scoring of NTM provisions have been updated. Finally, the updated results include, as explained below, revised non-tariff barriers and limited non-discriminatory liberalization effects (positive spillovers).
Assumptions
Ce results rest on a number of key assumptions, which are elaborated in more depth below. Tariff and non-tariff cuts are benchmarked against existing trade agreements. Since cross-country data is scarce, assumptions about utilization of preferential tariffs are based on eclectic survey information.
Tariff cuts. The results incorporate the full, published schedule of tariff cuts under the TPP agreement. Cese commit the eventual elimination of nearly all tariffs, including on major imports into the United States (such as textiles and apparel) and developing countries (such as motor vehicles). Sixty percent of these tariff cuts will enter into force immediately, but a few, like those on trucks imported by the United States, are very back-loaded. Cese potential tariff cuts are, however, de facto mitigated by (i) less than full utilization rate of preferential tariffs and (ii) additional costs to meet rules of origin requirements.
• Utilization rate of preferential tariffs. As demonstrated by prior bilateral agreements, preferential tariff rates are seldom fully utilized due to either restrictive rules of origin, the high cost of compliance compared to benefits from preferential rates, or low initial tariffs. Ce exercise here assumes that less than full utilization of preferences will reduce the effective tariff cuts from TPP membership. A formula is constructed to estimate utilization rates based on the preferential tariff margin and the size of the TPP relative to other agreements for which some survey data is available (Petri et al. 2012). As a result, the effect of tariff cuts introduced by TPP are reduced by 31 percent in the long run, and by
1For example, the “yarn forward” rule of origin requires a TPP member to use a TPP member produced yarn in textiles in order to qualify for duty-free access. Cese ”yarn forward” rules in apparel seem restrictive, while rules of origin in automobiles are more liberal according to the text of the TPP agreement.
CHAPTER 4 GLOBAL ECONOMIC PROSPECTS | JANUARY 2016 236
similar to that in the Korea-US agreement, with some modifications based on analysis of the TPP text. Cis fraction is derived—for 21 separate issues areas—based on a score from 0-100, with a higher score indicating larger reductions in trade barriers by TPP compared with existing FTAs (Figure 4.1.1). Ce issues areas range widely from government procurement, dispute settlement, and environment to tariffs and customs procedures.
Non-discriminatory liberalization (positive spillovers). As noted above, some of the bilateral reductions in the restrictiveness of NTMs and investment barriers that countries make under an agreement are assumed to reduce barriers also against countries not participating in the agreement. Cese include especially efforts to improve the transparency and predictability of regulations and mechanisms to bring together regulators to encourage streamlining of regulations. Estimates of this “spillover” ratio range from 20 to 65 percent in the literature (Francois et al. 2013, Kawasaki 2014); the exercise here uses the low end of this range, or 20 percent.
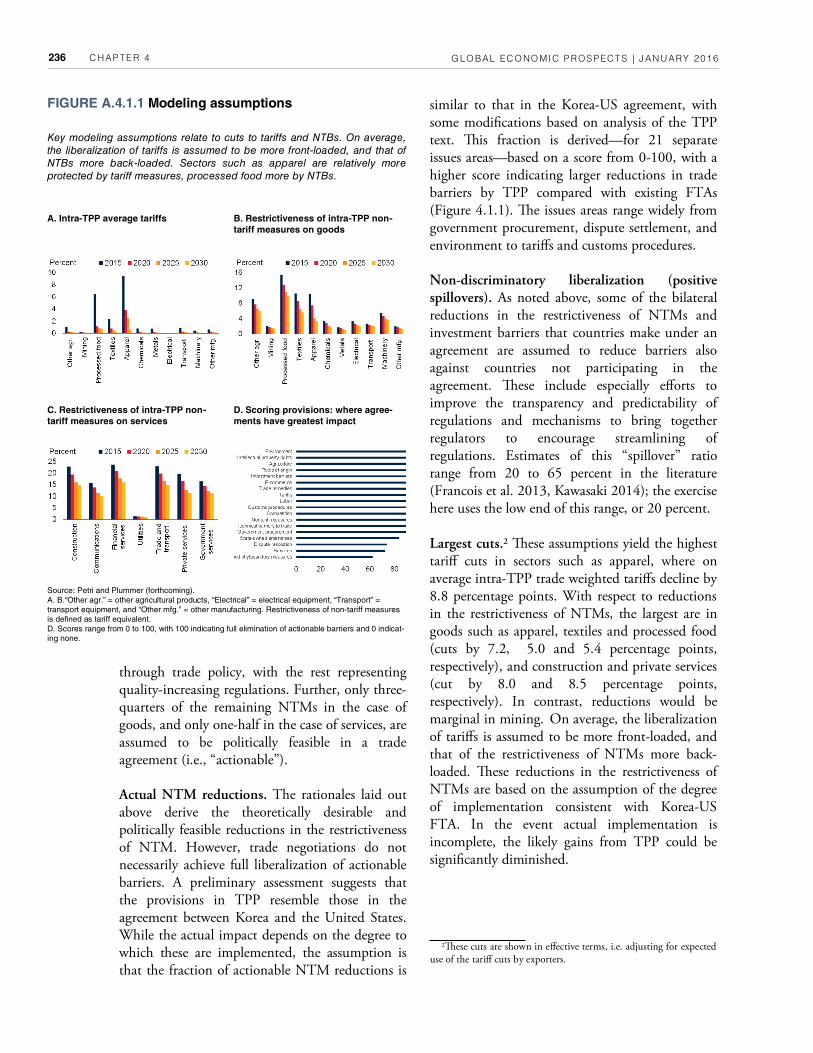
Largest cuts.2 Cese assumptions yield the highest tariff cuts in sectors such as apparel, where on average intra-TPP trade weighted tariffs decline by 8.8 percentage points. With respect to reductions in the restrictiveness of NTMs, the largest are in goods such as apparel, textiles and processed food (cuts by 7.2, 5.0 and 5.4 percentage points, respectively), and construction and private services (cut by 8.0 and 8.5 percentage points, respectively). In contrast, reductions would be marginal in mining. On average, the liberalization of tariffs is assumed to be more front-loaded, and that of the restrictiveness of NTMs more back-loaded. Cese reductions in the restrictiveness of NTMs are based on the assumption of the degree of implementation consistent with Korea-US FTA. In the event actual implementation is incomplete, the likely gains from TPP could be significantly diminished.
through trade policy, with the rest representing quality-increasing regulations. Further, only three-quarters of the remaining NTMs in the case of goods, and only one-half in the case of services, are assumed to be politically feasible in a trade agreement (i.e., “actionable”).
Actual NTM reductions. The rationales laid out above derive the theoretically desirable and politically feasible reductions in the restrictiveness of NTM. However, trade negotiations do not necessarily achieve full liberalization of actionable barriers. A preliminary assessment suggests that the provisions in TPP resemble those in the agreement between Korea and the United States. While the actual impact depends on the degree to which these are implemented, the assumption is that the fraction of actionable NTM reductions is
FIGURE A.4.1.1 Modeling assumptions
Key modeling assumptions relate to cuts to tariffs and NTBs. On average,
the liberalization of tariffs is assumed to be more front-loaded, and that of
NTBs more back-loaded. Sectors such as apparel are relatively more
protected by tariff measures, processed food more by NTBs.
A. Intra-TPP average tariffs B. Restrictiveness of intra-TPP non-
tariff measures on goods
Source: Petri and Plummer (forthcoming).
A. B.“Other agr.” = other agricultural products, “Electrical” = electrical equipment, “Transport” =
transport equipment, and “Other mfg.” = other manufacturing. Restrictiveness of non-tariff measures
is defined as tariff equivalent.
D. Scores range from 0 to 100, with 100 indicating full elimination of actionable barriers and 0 indicat-
ing none.
C. Restrictiveness of intra-TPP non-
tariff measures on services
D. Scoring provisions: where agree-
ments have greatest impact
2Cese cuts are shown in effective terms, i.e. adjusting for expected use of the tariff cuts by exporters.
CHAPTER 4 GLOBAL ECONOMIC PROSPECTS | JANUARY 2016 249
References
Arrow, K. 1962. “Ce Economic Implications of Learning-by-Doing.” Review of Economic Studies 29 (3): 155-173.
Arteta, C., M. Klein, and J. Shambaugh. Forthcoming. “Determinants of Exchange Rate and Capital Account Policies.” World Bank Working Paper, Washington, DC: World Bank.
Baccini, L., and J. Urpelainen. 2014a. “Before Ratification: Understanding the Timing of Inter-national Treaty Effects on Domestic Poli-cies.” International Studies Quarterly 58 (1): 29-43.
__________. 2014b. International Institutions and Domestic Politics: Can Preferential Trading Agreements Help Leaders Promote Economic Re-form?” -e Journal of Politics 76 (01): 195-214.
Balassa, B. 1967. "Trade Creation and Trade Di-version in the European Common Market." Ce Economic Journal 77 (305): 1-21.
Baldwin, R. E. 1989. “On the Growth Effects of 1992.” NBER Working Paper 3119, National Bureau of Economic Research, Cambridge, Massa-chusetts.
Baldwin, R. E., and C. Wyplosz. 2006. Ce Eco-nomics of European Integration. Vol. 2. London: McGraw-Hill.
Baldwin, R., and D. Jaimovich. 1993. “A Domino Ceory of Regionalism.” NBER Working Paper 4465, National Bureau of Economic Research, Cambridge, Massachusetts..
__________. 2000. “Regulatory Protectionism, Developing Nations and a Two-tier World Trade System.” Center for Economic and Policy Re-search Discussion Paper 2574, Washington, DC.
__________. 2006. "Multilateralising Regional-ism: Spaghetti Bowls as Building Blocs on the Path to Global Free Trade." Ce World Economy 29 (11): 1451-1518.
__________. 2010. “Are Free Trade Agreements Contagious?” NBER Working Paper No. 16084. Cambridge, Massachusetts.
Beck, T., A. Demirgüç-Kunt, and R. Levine. 2007. “Finance, Inequality, and the Poor.” Journal of Economic Growth 12 (1): 27-49.
Berdiev, A., Y. Kim, and C.P. Chang. 2012. “Ce Political Economy of Exchange Rate Regimes in Developed and Developing Countries.” European Journal of Political Economy 28 (1): 38-53.
Berg, A., E. Borensztein, and C. Pattillo. 2005. “Assessing Early Warning Systems: How Have Cey Worked in Practice?” IMF Sta Papers 52 (3): 462-502.
Blyde, J. 2004. “Trade and Technology Diffusion in Latin America.” -e International Trade Jour-nal 18 (3): 177-197.
Boldrin, M., and D. Levine. 2013. “Ce Case Against Patents.” Journal of Economic Perspec-tives 27 (1): 3–22.
Brown, D. K., A. V. Deardorff, and R. M. Stern. 1992. “A North American Free Trade Agreement: Analytical Issues and a Computational Assess-ment.” Ce World Economy 15 (1): 11–30.
Calvo, G. 1998. “Capital Flows and Capital-Market Crises: Ce Simple Economics of Sudden Stops.” Journal of Applied Economics 1 (1): 35-54.
Campos, N., F. Coricelli, and L. Moretti. 2014. “Economic Growth and Political Integration: Esti-mating the Benefits from Membership in the Eu-ropean Union Using the Synthetic Counterfactu-als Method”. IZA Discussion Paper Series No. 8162.
Carmignani, F., E. Colombo, and P. Tirelli. 2008. “Exploring Different View of Exchange Rate Re-gime Choice.” Journal of International Money and Finance 27 (7): 1177-1197.
Cecchini, P. 1988. The European Challenge 1992: -e Benefits of a Single Market. Aldershot, U.K.:

CHAPTER 4 GLOBAL ECONOMIC PROSPECTS | JANUARY 2016 250
Wildwood House.
Chen, M. X., and A. Mattoo. 2008. “Regionalism in Standards: Good or Bad for Trade?” Canadian Journal of Economics 41 (3): 838–863.
Chinn, M., and H. Ito. 2008. “A New Measure of Financial Openness.” Journal of Comparative Pol-icy Analysis, 10 (3): 307-320.
Ciuriak, D. and H. V. Singh. 2015. Mega Region-al Trade Agreements: How Excluded Countries Can Meet the Challenge. Available at SSRN 2680215.
Copenhagen Economics. 2009. Assessment of Barriers to Trade and Investment Between the EU and Japan. http://trade.ec.europa.eu/doclib/docs/2012/july/tradoc_149809.pdf.
Cordella, T., and P. Gupta. 2015. "What Makes a Currency Procyclical? An Empirical Investiga-tion." Journal of International Money and Fi-nance 55 (July): 240-259
Costinot, A., and A. Rodriguez-Clare. 2014. “Trade Ceory with Numbers: Quantifying the Con-sequences of Globalization.” NBER Working Paper 18896, National Bureau of Economic Research, Cambridge, Massachusetts.
Cox, D. J., and R. G. Harris. 1992. “North Amer-ican Free Trade Area and Its Implications for Can-ada: Results from a CGE Model of North Ameri-can Trade.” Ce World Economy 15: 31–4.
Economics and Statistics Administration and U.S. Patent Office. 2012. “Intellectual Property and the U.S. Economy: Industries in Focus.” Washington, DC.
Eicher, T.S., C. Henn, and C. Papageorgiou. 2012. "Trade Creation and Diversion Revisited: Accounting for Model Uncertainty and Natural Trading Partner Effects." Journal of Applied Econometrics 27 (2): 296-321.
Estevadeordal A., C. Freund, and E. Ornelas. 2008. “Does Regionalism Affect Trade Liberaliza-tion Toward Nonmembers?” Ce Quarterly Jour-nal of Economics 123 (4): 1531-1575.
European Commission. 2012. Impact Assessment Report on EU-Japan Trade Relations. Brussels. http://trade.ec.europa.eu/doclib/docs/2012/july/tradoc_149809.pdf.
———. 2013. Reducing Transatlantic Barriers to Trade and Investment: An Economic Assessment. http://trade.ec.europa.eu/doclib/docs/2013/march/tradoc_150737.pdf.
Fernandes, A., E. Ferro, and J. Wilson. 2015. “Product Standards and Firms’ Export Decisions?” Working Paper 7315, World Bank, Washington, DC.
Fernández, A., A. Rebucci, and M. Uribe. 2014. “Are Capital Controls Countercyclical?” Mimeo, Columbia University.
Fernández, A., M. Klein, A. Rebucci, M. Schindler, and M. Uribe. 2015. “Capital Control Measures: A New Dataset.” NBER Working Paper 20970, National Bureau of Economic Research, Cam-
bridge, Massachusetts.
Fontagne, L., A. Guillin, and C. Mitaritonna. 2011. “Estimations of Tariff Equivalents for the Services Sector.” CEPII Working Papers. 2011-24. Paris.
Forbes, K., and M. Klein. 2015. “Pick Your Poi-son: Ce Choices and Consequences of Policy Re-sponses to Crises.” International Monetary Fund Economic Review 63 (1): 197-237.
Francois, J., M. Manchin, H. Norberg, O. Pindy-uk, and P. Tomberger. 2013. “Reducing Transat-lantic Barriers to Trade and Investment: an Eco-nomic Assessment.” Center for Economic Policy Research, London.
Frankel, J., and A. Rose. 2002. “An Estimate of the Effect of Common Currencies on Trade and Income.” Quarterly Journal of Economics 117 (2): 437-466.
Frankel, J., S. Schmukler, and L. Serven. 2004. "Global Transmission of Interest Rates: Monetary Independence and Currency Regime." Journal of International Money and Finance 23 (5): 701-733.

CHAPTER 4 GLOBAL ECONOMIC PROSPECTS | JANUARY 2016 251
Freund, C. L., and E. Ornelas. "Regional Trade Agreements." Policy Research Working Paper 5314, Washington, D.C.: World Bank.
Ghosh, A. R., J. D. Ostry, and M. S. Qureshi. 2015. “Exchange Rate Management and Crisis Susceptibility: A Reassessment.” IMF Economic Review 63 (1): 238-276.
Gosselin, P. 2015. “Obama Is in a Bind on Drugs Cat Could Cost Consumers Billions of Dollars - Bloomberg Business.” Bloomberg Business.
Greenstone, M., J. A. List, and C. Syverson. 2012. “Ce Effects of Environmental Regulation on the Competitiveness of U.S. Manufacturing.” NBER Working Paper 18392, National Bureau of Eco-nomic Research, Cambridge, Massachusetts.
Grilli, V., and G. Milesi-Ferretti. 1995. “Economic Effects and Structural Determinants of Capital Controls.” IMF Staff Papers 42 (3): 517-551.
Hammouda, H., and P. N. Osakwe. 2008. "Global Trade Models and Economic Policy Anal-yses: Relevance, Risks and Repercussions for Afri-ca." Development Policy Review 26 (2): 151-170.
Harrison, G. W., T. F. Rutherford, and D. G. Tarr. 1994. “Product Standards, Imperfect Com-petition and Completion of the Market in the Eu-ropean Union.” Policy Research Working Paper 1293, World Bank, Washington, DC.
Henry, P. 2007. “Capital Account Liberalization: Ceory, Evidence and Speculation.” Journal of Economic Literature 45 (4): 887-935.
Hoekman, B. M., and B. K. S. Javorcik, eds. 2006. Global Integration and Technology Transfer. Washington, DC: World Bank.
Hoekman, B. M., C. Michalopoulos, and L. A. Winters. 2003. “More Favorable and Differential Treatment of Developing Countries: Toward a New Approach in the World Trade Organiza-tion”. Policy Research Working Paper 3107, World Bank, Washington, DC.
Hufbauer, G. C., and J. Schott. 2005. NAFTA Revisited: Achievements and Challenges. Washing-ton, DC: Peterson Institute for International Eco-nomics.
Humphrey, J., and H. Schmitz. 2002. "How Does Insertion in Global Value Chains Affect Upgrad-ing in Industrial Clusters?" Regional Studies 36 (9): 1017-1027.
International Monetary Fund (IMF). 2003. World Economic Outlook; Growth and Institutions. Washington, DC: International Monetary Fund.
International Monetary Fund (IMF). 2015. World Economic Outlook: Uneven Growth, Short and Long-Term Factors. Washington, DC: Interna-tional Monetary Fund.
Jeanne, O., and A. Korinek. 2010. “Managing Capital Flows: A Pigouvian Taxation Approach.” American Economic Review Papers and Proceedings (May): 403 – 407.
Jeanne, O., A. Subramanian, and J. Williamson. 2012. Who Needs to Open the Capital Account. Washington, DC: Peterson Institute for Interna-tional Economics.
Kawasaki, K. 2014. “Ce Relative Significance of EPAs in Asia-Pacific.” RIETI Discussion Paper Series 14-E-000.
Kee, H. L., A. Nicita, and M. Olarreaga. 2008. “Import Demand Elasticities and Trade Distor-tions.” -e Review of Economics and Statistics 90 (4): 666-682
__________. 2009. “Estimating Trade Restric-tiveness Indices.” Ce Economic Journal 119 (1): 172–99.
Kehoe, T. J. 2005. “An Evaluation of the Perfor-mance of Applied General Equilibrium Models on the Impact of NAFTA.” In Frontiers in Applied General Equilibrium Modeling: In Honor of Herbert Scarf, edited by T. J. Kehoe, T. N. Srinivasan, and J. Whalley. Cambridge, UK: Cambridge University Press.
CHAPTER 4 GLOBAL ECONOMIC PROSPECTS | JANUARY 2016 252
Kharas, H. 2010. “Ce Emerging Middle Class in Developing Countries.” Working Paper 285, Or-ganization for Economic Co-operation and Devel-opment, Paris, France.
King, R., and R. Levine. 1993. “Finance and Growth: Schumpeter Might be Right.” Quarterly Journal of Economics 108 (3): 717-737.
Klein, M. 2012. “Capital Controls: Gates versus Walls.” Brookings Papers on Economic Activity, Washington, DC.
Klein, M., and G. Olivei. 2008. “Capital Account Liberalization, Financial Deepness and Economic Growth.” Journal of International Money and Finance 27 (6): 861-875.
Klein, M., and J. Shambaugh. 2006. “Fixed Ex-change Rates and Trade.” Journal of International Economics 70 (2): 359-383.
_______________. 2008. “Ce Dynamics of Ex-change Rate Regimes: Fixes, Floats and Flips.” Journal of International Economics 75 (1): 70-92.
_______________. 2010. Exchange Rate Regimes in the Modern Era. Cambridge, MA: MIT Press.
_______________. 2015. “Rounding the Corners of the Policy Trilemma: Sources of Monetary Au-tonomy.” American Economic Journal: Macroeco-nomics 7 (4): 33-66.
Kose, A., E. Prasad, K. Rogoff, and S. Wei, 2009. “Financial Globalization: A Reappraisal.” Interna-tional Monetary Fund Staff Papers 56 (1): 8-62.
Kose, M. A., G. M. Meredith, and C. M. Towe. 2005. "How has NAFTA Affected the Mexican Economy? Review and Evidence." In Monetary Policy and Macroeconomic Stabilization in Latin America, edited by R. J. Langhammer and L. V. de Souza. Heidelberg, Germany: Springer.
Kowalski, P., J. Gonzales, A. Ragoussis, and C. Ugarte. 2015. "Participation of Developing Coun-tries in Global Value Chains: Implications for Trade and Trade-Related Policies." OECD Trade Policy Paper 179, OECD Publishing, Paris.
Krueger, A. O. 1999. “Trade Creation and Trade Diversion under NAFTA”. NBER Working Paper 7429, National Bureau of Economic Research, Cambridge, Massachusetts.
Kydland, F., and E. Prescott. 1977. “Rules Rather than Discretion: Ce Inconsistence of Optimal Plans.” Ce Journal of Political Economy 85 (3): 473-492.
Leblang, D. 1999. “Domestic Political Institutions and Exchange Rate Commitments in the Develop-ing World.” International Studies Quarterly 43 (4): 599-620.
Lee, H., and K. Itakura. 2014. “TPP, RCEP, and Japan’s Agricultural Policy Reforms.” OSIPP Dis-cussion Paper 14E003, Osaka, Japan.
Lehmann, J. P. 2015. “Ce TPP, the WTO, the 21st Century Global Trade Mess and the Poverty of Nations.” Forbes, August 3, 2015.
Lukauskas, A., R. M. Stern, and G. Zanini. 2013. Handbook of Trade Policy for Development. Oxford, U.K.: Oxford University Press.
Maggi, G., 2014, International Trade Agreements, Chapter 6 in Handbook of International Econom-ics 4: 317-390. In Handbook of International Economics, edited by G. Gopinath, E. Helpman, and K. Rogoff . Oxford, U.K.: Elsevier.
Mariniello, M., A. Sapir, and A. Terzi. 2015. “Ce Long Road Towards the European Single Mar-ket.” Bruegel Working Paper 11, Brussels, Bel-gium.
Mattli, W., and T. Plümper. 2004. “Ce Internal Value of External Options How the EU Shapes the Scope of Regulatory Reforms in Transition Countries.” European Union Politics 5 (3): 307-330.
Mattoo, A. 2001. “Discriminatory Consequences of Non-discriminatory Standards.” Journal of Eco-nomic Integration 16 (1): 78-105.
McCulloch, R., and P.A. Petri. 1997. “Alternative Paths Toward Open Global Markets.” In Quiet

CHAPTER 4 GLOBAL ECONOMIC PROSPECTS | JANUARY 2016 253
Pioneering: Robert M. Stern and His International Economic Legacy, edited by K. E. Maskus and J. D. Richardson. Ann Arbor: University of Michigan Press.
Melitz, M. J. 2003. “Ce Impact of Trade on Intra-Industry Reallocations and Aggregate Industry Productivity.” Econometrica 71 (6): 1695–1725.
Michalopoulos, C. 1999. "Trade Policy and Mar-ket Access Issues for Developing Countries: Impli-cations for the Millennium Round." Policy Re-search Working Paper 2214, World Bank, Wash-ington, DC.
Milner, H. V., and K. Kubota. 2005. “Why the Move to Free Trade? Democracy and Trade Policy in the Developing Countries.” International organ-ization 59 (01): 107-143.
Moenius, J. 2005. “Information Versus Product Adaptation: the Role of Standards in Trade” Mimeo, University of Redlands.
Mundell, R. 1961. “A Ceory of Optimum Cur-rency Areas.” American Economic Review 51 (3): 657-665.
Nielsen, C. 2003. “Regional and Preferential Trade Agreements: A Literature Review and Iden-tification of Future Steps.” Fødevareøkonomisk Institut Report 155, Copenhagen, Denmark.
Obstfeld, M., J. Shambaugh, and A. Taylor. 2010. “Financial Stability, the Trilemma, and Interna-tional Reserves.” American Economic Association Journal – Macroeconomics 2 (2): 57-94.
OECD and WTO. 2015. “Measuring Trade in Value Added: An OECD-WTO Joint Initiative.” Paris, France.
Oliver, S.. 2015. “How Quickly Are Tariffs Elimi-
nated in the TPP?” PIIE Trade and Investment
Policy Watch Blog. December 2, 2015. Washing-
ton, D.C.: Peterson Institute for International
Economics.
Orefice, G., R. Piermartini, and N. Rocha. 2012. “Harmonization and Mutual Recognition: What
are the Effects on Trade?” Mimeo. World Trade Organization.
Ostry, J., A. Ghosh, and M. Chamon. 2012. “Two Targets, Two Instruments: Monetary and Exchange Rate Policies in Emerging Market Econ-omies.” IMF Staff Discussion Note SDN/12/01, International Monetary Fund, Washington, DC.
Ostry, J., A. Ghosh, M. Chamon, and M Qureshi. 2011. “Capital Controls: When and Why?” IMF Economic Review 59 (3): 562-580.
Otsuki, T., J. S. Wilson, and M. Sewadeh. 2001. “Saving Two in a Billion: Quantifying the Trade Effect of European Food Safety Standards on Afri-can Exports.” Food Policy 26 (5): 495–514.
Peterson Institute for International Economics. 2014. “NAFTA 20 Years Later.” PIIE Briefing. Washington, DC.: Peterson Institute for Interna-tional Economics.
Petri, P., and A. A. Raheem. 2014. “Can RCEP and the TPP Be Pathways to FTAAP?” In State of the Region, 2014-2015. Singapore: Pacific Eco-nomic Cooperation Council.
Petri, P., M. Plummer, and F. Zhai. 2012. “Ce Trans-Pacific Partnership and Asia-Pacific Integra-tion: A Quantitative Assessment.” East-West Cen-ter Working Papers 119, Peterson Institute for International Economics, Washington, DC.
Petri, P., and M. Plummer, forthcoming. “Mega-Regional Trade Agreements and Developing Economies.” Mimeo. World Bank, Washington, DC.
Poole, W. 1970. “Optimal Choice of Monetary Policy Instrument in a Simple Stochastic Macro Model.” Quarterly Journal of Economics 84 (2): 197-216.
Pugatch, M. P., ed. 2006. Ce Intellectual Property Debate: Perspectives from Law, Economics and Polit-ical Economy. London: Edward Elgar.
Quinn, D. 1997. “Ce Correlates of Change in International Financial Regulation.” American

CHAPTER 4 GLOBAL ECONOMIC PROSPECTS | JANUARY 2016 254
Political Science Review 91 (3): 531-51.
Rey, H. 2013. “Dilemma not Trilemma: Ce Global Financial Cycle and Monetary Independ-ence.” In Global Dimensions of Unconventional Monetary Policy, Federal Reserve Bank of Kansas City Jackson Hole Conference.
Reyes, J. D. 2011. “International Harmonization of Product Standards and Firm Heterogeneity in International Trade.” Policy Research Working Paper 5677, World Bank, Washington DC.
Rose, A. 2000. “One Money, One Market: Ce Effect of Common Currencies on Trade.” Eco-nomic Policy 15 (30): 7-33.
Rose, A., and E. van Wincoop, 2001. “National Money as a Barrier to International Trade: Ce Real Case for Currency Union.” American Eco-nomic Review 91 (2): 386-390.
Sahay, R., M. Cihak, P. N'Diaye, A. Barajas, D. Ayala Pena, R. Bi, Y. Gao, et al. 2015. “Rethinking Financial Deepening: Stability and Growth in Emerging Markets.” IMF Staff Discus-sion Note SDN/15/08, International Monetary Fund, Washington, DC.
Salem, S., and F. Rozental. 2012. “Labor Stand-ards and Trade: A Review of the Recent Empirical Evidence.” Journal of International Commerce and Economics 4 (2): 63-98.
Schönfelder, N., and H. Wagner. 2015. “Ce Im-pact of European Integration on Institutional De-velopment.” MPRA Paper 63392, Munich, Ger-many.
Shambaugh, J. 2004. “Ce Effect of Fixed Ex-change Rates on Monetary Policy.” Quarterly Journal of Economics 119 (1): 300-351.
Shepherd, B. 2007. “Product Standards, Harmo-nization, and Trade: Evidence from the Extensive Margin.” Policy Research Working Paper 4390, World Bank, Washington, DC.
Staehr, K. 2011. “Democratic and Market-Economic Reforms in the Postcommunist Coun-
tries: Ce Impact of Enlargement of the European Union.” Eastern European Economics 49 (5): 5-28.
Stiglitz, J. E. 2008. "Economic Foundations of Intellectual Property Rights." Duke Law Journal 57: 1693-1724.
Stiglitz, J. E., and A. S. Hersh. 2015. "Ce Trans-Pacific Trade Charade." Project Syndicate website. October 2, 2015.
Todo, Y. 2013. “Estimating the TPP’s Expected Growth Effects.” RIETI Report 153, Tokyo, Ja-pan.
Trefler, D. 2001. “Ce Long and Short of the Can-ada-US Free Trade Agreement.” National Bureau of Economic Research Working Paper 8293.
UNCTAD (United Nations Conference on Trade and Development). 2000. “Ce Post-Uruguay Round Tariff Environment for Developing Coun-try Exports: Tariff Peaks and Tariff Escalation.” Geneva, Switzerland.
Venables, A. J. 1999. "Regional Integration Agree-ments: a Force for Convergence or Divergence?" Policy Research Working Paper 2260, World Bank, Washington, DC.
Vetter, S., and B Böttcher. 2013. “Ce Single Eu-ropean Market 20 Years on.” DB Research, Deutsche Bank, Frankfurt, Germany.
Viner, J. 1950. Ce Customs Union Issue. New York: Carnegie.
Vogel, D. 1995. “Trading Up: Consumer and Environmental Regulation in a Global Economy” Cambridge, MA: Harvard University Press.
von Hagen, J., and J. Zhou. 2007. “Ce Choice of Exchange Rate Regimes in Developing Countries: A Multinomial Panel Analysis.” Journal of Inter-national Money and Finance 26 (7): 1071-1094.
World Bank. 2005. “Regional Trade and Preferen-tial Trading Agreements: A Global Perspective”. In Global Economic Prospects 2005: Trade, Re-

CHAPTER 4 GLOBAL ECONOMIC PROSPECTS | JANUARY 2016 255
gionalism, and Development. Washington, DC: World Bank.
__________. 2014. Urban China: Toward Effi-cient, Inclusive, and Sustainable Urbanization. Washington DC: World Bank.
__________. 2015. Global Economic Prospects: Having Fiscal Space and Using It. Washington DC: World Bank.
__________. Forthcoming. “Vietnam 2035: A Prosperous Country, Creative People, and Just Society.” World Bank, Washington, DC.
World Economic Forum. 2012. Ce Shifting Ge-ography of Global Value Chains: Implications for Developing Countries and Trade Policy. Cologny, Switzerland: World Economic Forum.
WTO (World Trade Organization). 2011. World Trade Report 2011: -e WTO and Preferential Trade Agreements: from Co-existence to Coherence.” Geneva, Switzerland: World Trade Organization.
Wylie, P. J. 1995. "Partial Equilibrium Estimates of Manufacturing Trade Creation and Diversion due to NAFTA." Ce North American Journal of Economics and Finance 6 (1): 65-84.
Zhai, F. 2008. “Armington Meets Melitz: Intro-ducing Firm Heterogeneity in a Global CGE Model of Trade.” Journal of Economic Integra-tion 23 (3): 575–604.