Embed Size (px)
Citation preview

2015. 11. 6.
Director, Dong-ryul Lee
Hydrological Radar Disaster Research & Data Center
Korea Institute of Civil Engineering and Building Technology
Typhoon Committee Roving Seminar
Lao DPR, 4-6 Nov., 2015
Topic C: River and Urban Flood Forecasting and Mitigation
(C-3) Strategies and Methods for Urban
Flash Flood Forecasting and Warning
1

Outline
2
1 Characteristics of Flash Flood
2 Strategies and Methods of FF Warning
3 KICT Hydrological RADAR
4 Its Applications for Urban FF

What is a Flash Flood ?
3
• Flash floods are quick response flood events causing
sudden flooding in small river basins. Flooding follows within
6 hours or less after the heavy rain event
– Typically associated with small fast responding basins
– Can occur in normally dry areas with no visible stream
channel, including urban areas
• River floods are caused by heavy rain over long periods
(days) in the upper catchment leading to rising water levels
and flooding as the flood wave takes days to move down river

Hourly rainfall rate (mm/hr) on 27/JUL/2011 (07:30-08:30) Flood damages at downtown Seoul
in 2012 (12mm/15min)
Flash floods occurred by localized extreme rainfall with short duration of a few hours
Difficulties of flash flood forecasting with high spatial-temporal resolution
Floods in the ungauged areas
Characteristics of flash flood
4
Characteristics of flash flood
Urban areas (2010, 2011, Seoul)
5

Characteristics of flash flood
Urban areas (2010, 2011, Seoul)
6

Rapidly rising stream water level (within an hour) due to heavy rainfall
Typical damages by inundation: depths of 0.1–0.5 m, durations of 2–3 hours
Optimal operation of drainage systems requires quick decision making
processes (within 3 hours) with high spatiotemporal resolution.
Characteristics of flash flood
Urban areas (Seoul)
Hongje stream
(Seoul, 2010)
Cheonggye stream
(Seoul, 2012)
Inundation at downtown
Seoul, 2010
Residential area
Seoul, 2011
7

Characteristics of flash flood
Urban areas (2014, Busan)
8

Characteristics of flash flood
Heavy Rainfall Evolution during 2014 FF in Busan
9

Characteristics of flash flood
Heavy Rainfall Evolution during 2014 FF in Busan
10
11
◈ Mountainous areas
2006년 평창지역 산사태 전경
Frequent and localized severe rainfall (880mm/24hr)
Orographic effects but coarse ground rainfall gages
Torrential flood runoff in the valley and steep streams
<torrential flood in steep stream> <landslides in mountainous areas>
Characteristics of flash flood

Severe snowstorms in Winter
12
[Massive traffic accident, Seoul]
[Greenhouse collapse]
CCTV Installation to monitor
snowstorms in Seoul: 5 → 8 points
13
What is a practical flash flood warning system?
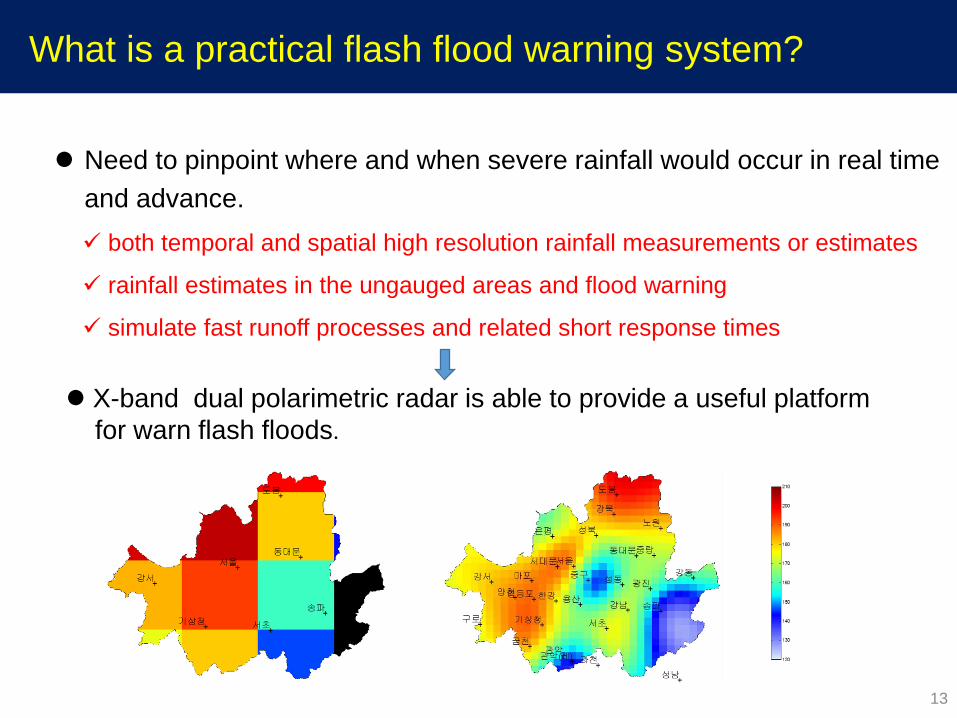
Need to pinpoint where and when severe rainfall would occur in real time
and advance.
both temporal and spatial high resolution rainfall measurements or estimates
rainfall estimates in the ungauged areas and flood warning
simulate fast runoff processes and related short response times
X-band dual polarimetric radar is able to provide a useful platform
for warn flash floods.

Establishment of HRDRC (Hydrological Radar Disaster Research & Data Center)
14
Promoting R&D for disaster prevention of flash flood and snow using
hydrological radar
Building hub to disseminate rainfall radar data of Minstry of Land,
Infrastructure, and Transportaion
Supporting actual work-site operations of flash flood & snow management
in local governments around KICT
Strenthening international radar R&D networks
<Urban Area Flooding> <GyungBu Highway Snowstorm>

HRDRC Activities
15
Rainfall/Snow estimation and forecasting technology
development
Short-term flood forecasting technology to use hydrologic
model of high accuracy
Landslides, snow(transportaion, agriculture) and other
natural disasters detection technology using hydrological
data radar
Disaster alarm technology development of rainfall radar
network utilizing GIS mobile systems
Data Dissemination of MOLIT rainfall radar
International Hydro-Radar Workshop
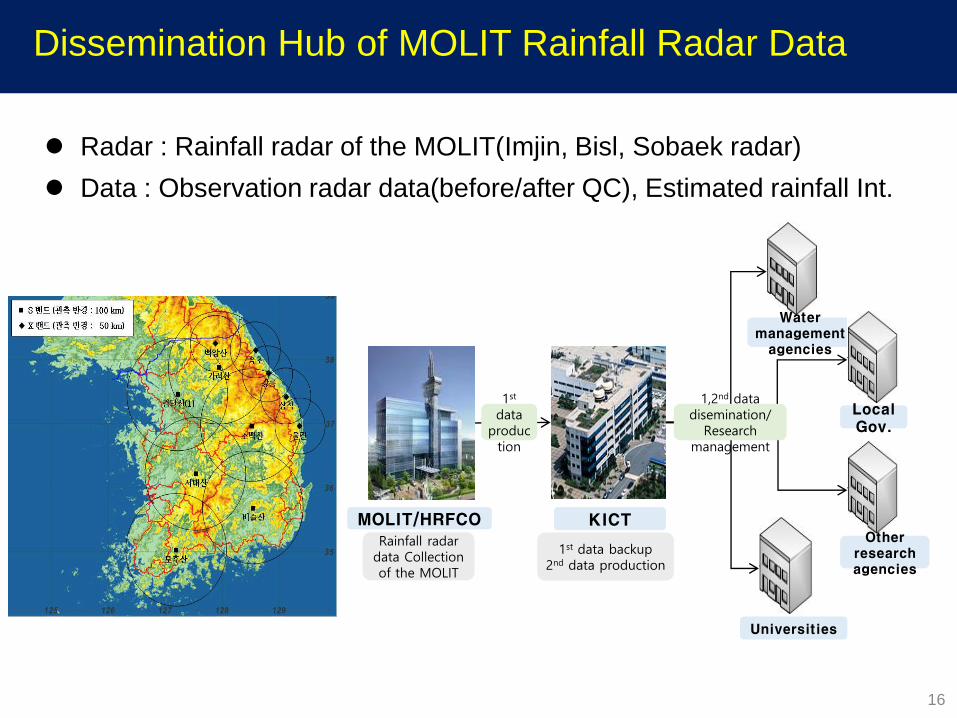
Dissemination Hub of MOLIT Rainfall Radar Data
16
MOLIT/HRFCO KICT
Water management
agencies
Local Gov.
Other research agencies
1st data
production
1,2nd data disemination/
Research management
1st data backup 2nd data production
Rainfall radar data Collection of the MOLIT
Universities
Radar : Rainfall radar of the MOLIT(Imjin, Bisl, Sobaek radar)
Data : Observation radar data(before/after QC), Estimated rainfall Int.

KICT Hydrological RADAR
17
Manufacturer: Ridgeline Instruments (RLI)
Type: Magnetron with solid state modulator
Weight: 633 kg
Antenna: Parabola/1.8 m diameter
Peak power: 8 kW
Beam width: 1.4°
Max range: 50 km
Frequency: 9410±30 MHz
Scan speed: 10 rpm (max)
Operation of a X band dual-polarization radar for hydrological purposes
Coverage: 40 km radius
17
Current Research Work
18
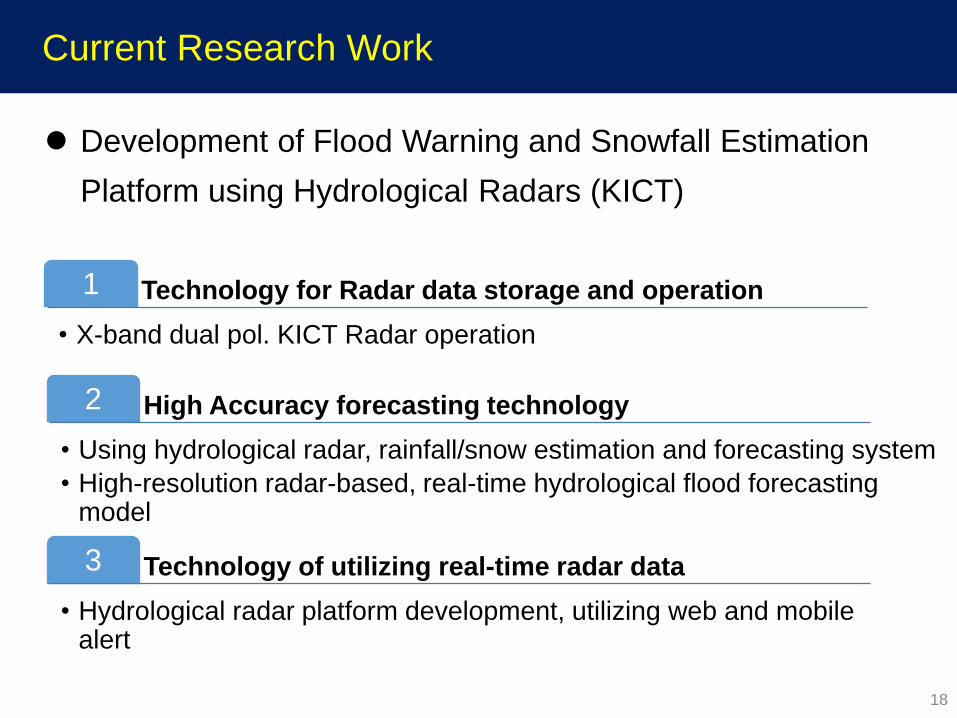
Development of Flood Warning and Snowfall Estimation
Platform using Hydrological Radars (KICT)
1 Technology for Radar data storage and operation
• X-band dual pol. KICT Radar operation
2 High Accuracy forecasting technology
• Using hydrological radar, rainfall/snow estimation and forecasting system
• High-resolution radar-based, real-time hydrological flood forecasting model
3 Technology of utilizing real-time radar data
• Hydrological radar platform development, utilizing web and mobile alert

Introduction Video of HRDRC
19

HRDRC Website
20
Website : http://hrdrc.kict.re.kr

KICT Radar Scan Strategy
21
5 Minutes Volume Scan
1
1
2 3 4 5
6
2 3 4 5
6
9 8 7
10
9 8 7
10
PPI-5° PPI-6°
RHIs
PPI-10°
1 PPI + 2 RHIs in 1 minute
Observe vertical precipitation and volume scale hydrometeor
PPI is scanned 5° and 6° azimuth by turns.
can make one CAPPI (1.0km, 1.5km, 2km) per one turn(1 minute).
One 10° PPI is scanned for redundant time in 5 minutes scanning
for CAPPI interpolation in case of upper area than 6° . For the second 5 minutes scanning, all RHIs’ azimuths are shifted +9° to minimize the angles between adjacent RHIs for 10 minutes scanning(18° to 9°)

Scan Type Azimuth Elevation Deg. / Sec.
PPI 0.0 to 359.9 deg. 5.0 deg. 15.0
RHI 0.0 deg. 0 to 180.0 deg. 19.0
RHI 18.0 deg. 180 to 0.0 deg. 19.0
PPI 36.0 to 35.9 deg. 6.0 deg. 15.0
RHI 36.0 deg. 0 to 180.0 deg. 19.0
RHI 54.0 deg. 180 to 0.0 deg. 19.0
PPI 72.0 to 71.9 deg. 5.0 deg. 15.0
RHI 72.0 deg. 0 to 180.0 deg. 19.0
RHI 90.0 deg. 180 to 0.0 deg. 19.0
PPI 108.0 to 107.9 deg. 6.0 deg. 15.0
RHI 108.0 deg. 0 to 180.0 deg. 19.0
RHI 126.0 deg. 180 to 0.0 deg. 19.0
PPI 144.0 to 143.9 deg. 5.0 deg. 15.0
RHI 144.0 deg. 0 to 180.0 deg. 19.0
RHI 162.0 deg. 180 to 0.0 deg. 19.0
PPI 180.0 to 179.9 deg. 10.0 deg. 15.0
Scan Type Azimuth Elevation Deg. / Sec.
PPI 189.0 to 188.9 deg. 6.0 deg. 15.0
RHI 189.0 deg. 0 to 180.0 deg. 19.0
RHI 207.0 deg. 180 to 0.0 deg. 19.0
PPI 225.0 to 224.9 deg. 5.0 deg. 15.0
RHI 225.0 deg. 0 to 180.0 deg. 19.0
RHI 243.0 deg. 180 to 0.0 deg. 19.0
PPI 261.0 to 260.9 deg. 6.0 deg. 15.0
RHI 261.0 deg. 0 to 180.0 deg. 19.0
RHI 279.0 deg. 180 to 0.0 deg. 19.0
PPI 297.0 to 296.9 deg. 5.0 deg. 15.0
RHI 297.0 deg. 0 to 180.0 deg. 19.0
RHI 315.0 deg. 180 to 0.0 deg. 19.0
PPI 333.0 to 332.9 deg. 6.0 deg. 15.0
RHI 333.0 deg. 0 to 180.0 deg. 19.0
RHI 351.0 deg. 180 to 0.0 deg. 19.0
PPI 0.0 to 359.9 deg. 10.0 deg. 15.0
5 minutes 5 minutes(RHI: AZ 9.0 deg. Shifted)
10-minutes Hybrid Scan Strategy In
1 m
inu
te
In 1
min
ute
In
1 m
inu
te
In 1
min
ute
In
1 m
inu
te
In 1
min
ute
In
1 m
inu
te
In 1
min
ute
In
1 m
inu
te
In 1
min
ute
22

[Spatial resolution] (As) 125~250 m → (To be) 60~100 m
[Temporal resolution] (As) 2.5~10min → (To be) 1 min 23
Target spatial and temporal resolutions

KICT X-band Radar Variables
RHI Scan
Reflectivity Velocity Copolar Corelation Differential Phase Spectral Width
Velocity Differential Phase
PPI Scan
Reflectivity
24

High Resolution Radar Data Application
Moment data based time-spanned radar observation
25

High Resolution Radar Data Application
RHI Data
26

High Resolution Radar 3-D Display
27

Beam based 3D radar observation
28
Urban QPE Challenge
• High spatiotemporal observations are required in order to capture and monitor the highly localized, rapidly evolving rainfall events.
• Urbanization significantly magnifies the scale and impact of floods. Both the spatial resolution and temporal resolution are critically important in monitoring urban floods and flash floods.
• At urban area, ground clutters (buildings) and beam blockage are significant error sources of radar based QPE
29

Why Classification and R-Kdp?
• Precipitation estimation using radar reflectivity can be overestimated by contamination of ground clutter, whereas partial beam blockage can cause underestimation.
• QC (non-meteorological target detection) is important
• fdp is not significantly impacted by partial beam blockage.
• Kdp based rainfall conversion is attractive at X-band
• Responds well to low rainfall rate
• Avoids the uncertainty in attenuation correction
• Immune to calibration factors
30

31
Slant Beam Radar Variables

2. Kdp Retrieval
3. Rainfall estimation
1. QC & Hydrometeor Classification
Precipitation Classification and Quantification Using X-
band Dual-Polarization Weather Radar (C & Q)
32

33
07:33:59UTC, Oct. 29, 2013
KICT RADAR OBSERVATIONS

34
01:25:57UTC, Sep. 13, 2013
Legacy Kdp C&Q Kdp

Black : rain gauge
Red : 𝑹 𝑲𝒅𝒑 = 𝟐𝟑. 𝟕𝑲𝒅𝒑𝟎.𝟖𝟕 (New)
Blue: 𝑅 𝐾𝑑𝑝 = 18.15𝐾𝑑𝑝0.791 (CSU)
KMA
Hangang
35
Comparison of Radar and Ground Gauge Rainfall
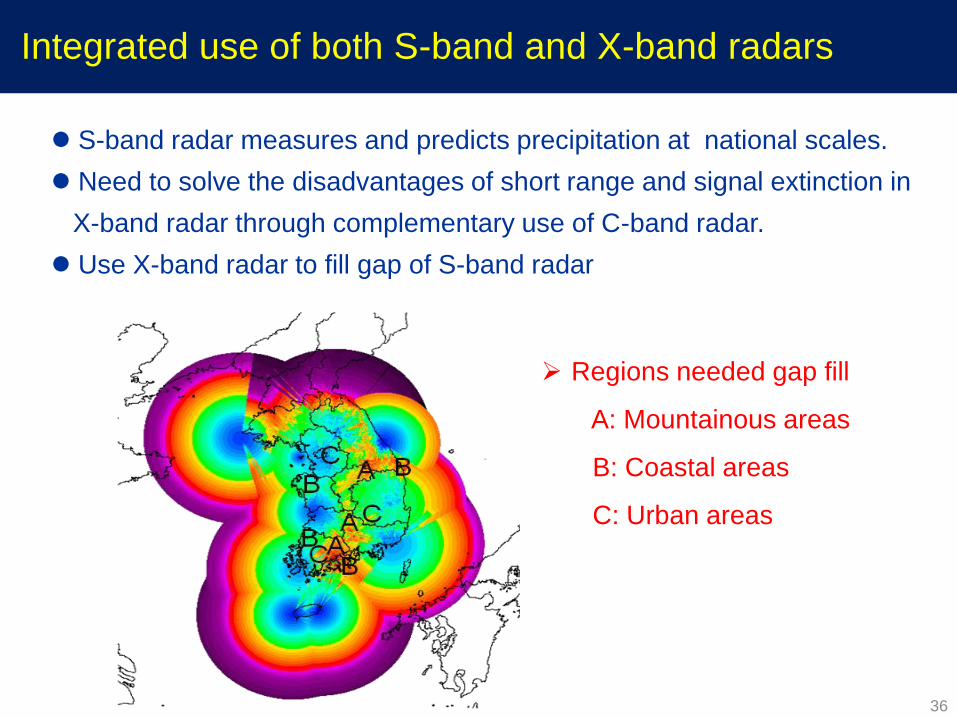
36
Regions needed gap fill
A: Mountainous areas
B: Coastal areas
C: Urban areas
S-band radar measures and predicts precipitation at national scales.
Need to solve the disadvantages of short range and signal extinction in
X-band radar through complementary use of C-band radar.
Use X-band radar to fill gap of S-band radar
Integrated use of both S-band and X-band radars

37
Integrated use of both S-band and X-band radars
<KMA:S-band> <KICT:X-band>
<Overlapped>

38
Urban Flash Flood Forecasting and Warning
Pre-analysis of relationship
between historic rainfalls and flash floods
Threshold rainfall(mm) triggering flash flood
district 10min 30min 1hr 3hr 6hr
Gangnam 20 30 47 73 108
Seocho 18 34 40 77 110

39
Urban Flash Flood Forecasting and Warning

40
Location-based Mobile Service of Flash Flood Warning

41
Combination of Radar Information and Augmented Reality

42
Combination of Radar Information and Augmented Reality

Mobile 3D precipitation information system
: Iphone, IPad
43
Combination of Radar Information and Augmented Reality

KICT radar observation:
Tornado case (June 10, 2014 19:20-19:45 KST)
44

1.5 cm
45
KICT radar observation:
Tornado case (June 10, 2014 19:20-19:45 KST)

46
KICT radar observation:
Tornado case (June 10, 2014 19:20-19:45 KST)

Reflectivity Differential Reflectivity
Correlation coefficient
Velocity
47
KICT radar observation:
Tornado case (June 10, 2014 19:20-19:45 KST)

48
KICT radar observation
Snow storm (Dec. 12 2013 11:00-17:00 KST)

49