Embed Size (px)
Citation preview
1
W I T H I N T O P I C Q U E S T I O N S
© Oxford University Press 2014: this may be reproduced for class use solely for the purchaser’s institute
Topic 2 - data-based questionsPage 79
1. a) (i) wild birds 13.3 kg;
(ii) captive birds 16.2 kg;
b) both groups lose most of their lipid; captive birds lose more of their lipids than wild ones; 11.2 versus 9.6 kg/93% lost versus 81%/other valid figures comparing the change;
c) insulation/source of waste heat when metabolized/source of metabolic water;
Page 81
1. a) BMI 34;
b) obese;
2. a) 100 kg;
b) BMI is 24, so status is normal weight;
3. a) current weight is 104 kg; needs to reach 57 kg; 104-57 kg = 47 kg;
b) increased exercise; reduced energy intake;
4. as height increases, BMI decreases; at an increasing rate/exponential rate;
Page 85–86
1. gender differences in fat deposition patterns controlled for;
2. moderate/weak positive correlation;
3. age is a factor in the onset of CHD symptoms; hormonal changes with age may impact CHD; physical activity varies with age;
4. 100% - 99% = 1%;
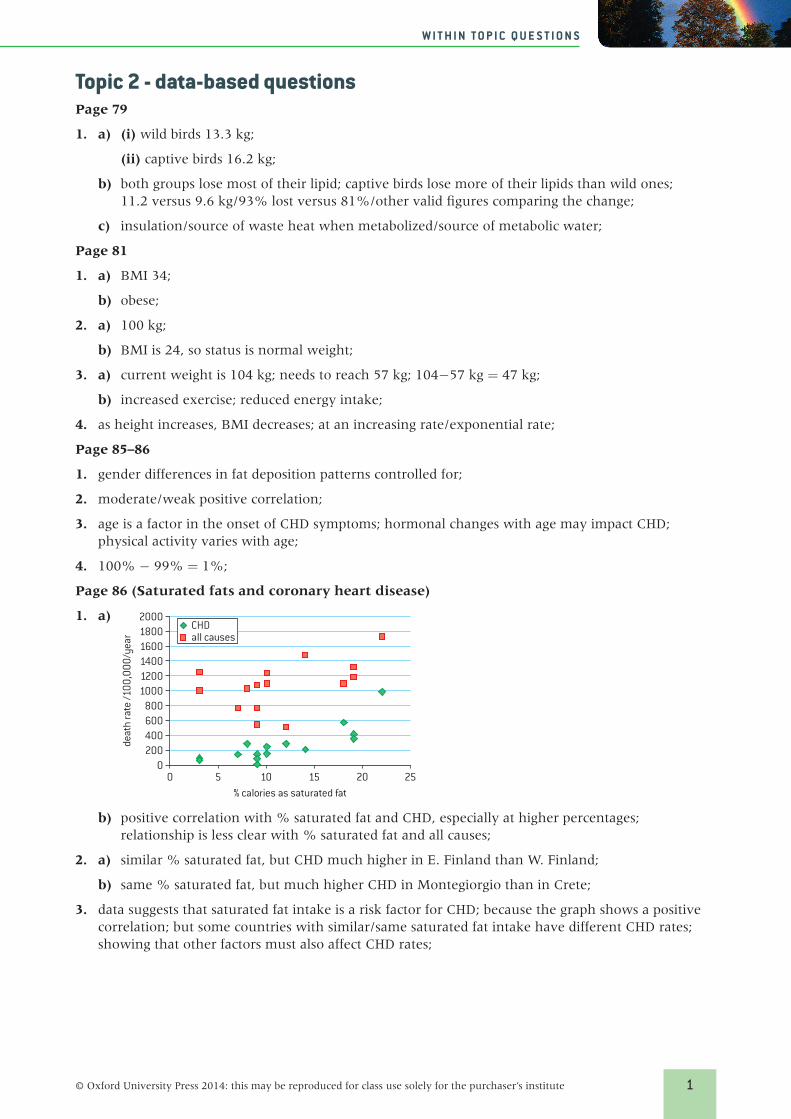
Page 86 (Saturated fats and coronary heart disease)
1. a)
% calories as saturated fat
deat
h ra
te /1
00,0
00/y
ear
0200
0 5 10 15 20 25
400600800
100012001400160018002000
CHDall causes
b) positive correlation with % saturated fat and CHD, especially at higher percentages; relationship is less clear with % saturated fat and all causes;
2. a) similar % saturated fat, but CHD much higher in E. Finland than W. Finland;
b) same % saturated fat, but much higher CHD in Montegiorgio than in Crete;
3. data suggests that saturated fat intake is a risk factor for CHD; because the graph shows a positive correlation; but some countries with similar/same saturated fat intake have different CHD rates; showing that other factors must also affect CHD rates;
839211_Answers_T02.indd 1 11/28/14 10:47 AM
2
W I T H I N T O P I C Q U E S T I O N S
© Oxford University Press 2014: this may be reproduced for class use solely for the purchaser’s institute
Page 90
1. a) hypothesis 1 not supported as it isn’t known whether these were the 20 amino acids on pre-biotic Earth; hypothesis 1 not supported as simulation experiments / comets suggest other amino acids were present; hypothesis 2 not supported as it isn’t known whether other amino acids would have been useful; hypothesis 2 not supported as some other amino acids are used in protein by modification of one of the 20 amino acids; hypothesis 3 is supported as there is other evidence for the common origin of life; hypothesis 3 is supported as all organisms use the same genetic code / use D glucose/L amino acids;
b) simulate conditions on pre-biotic Earth to find which amino acids could have been present; find another planet where life has evolved and see which amino acids are used; look for organisms on Earth that do not use the same 20 amino acids;
2. not a significant discrepancy; oligopeptides aren’t polypeptides; amino acids in peptidoglycan are not linked together by ribosomes; linked together by a simpler process catalysed by enzymes; does not involve the use of the genetic code; evolved separately from the genetic code and translation on ribosomes;
Page 97
1. one enzyme catalyses the formation of 1,4 bonds; the other enzyme catalyses the formation of 1,6 bonds;
2. once the 1,6 bond is formed, then this starts a new chain that can be extended by the enzyme that makes 1,4 bonds; in other words the substrate for this enzyme is doubled;
3. heat-treatment denatures enzyme; curve A shows no enzyme activity/no enzyme mediated conversion;
4. a) increasing rate of conversion earlier/until 35 minutes; rate of conversion levels off;
b) every bond formed can either be creating a new glycogen molecule or adding to an existing one; the former leads to an exponential increase in number of glycogen molecules/substrate molecules; until growth in new glycogen molecules slows and available enzyme becomes limiting;
Page 100–101
1. a) no; method is subjective and not quantified so can’t express as a rate;
b) yes; the faster the rate of reaction, the darker the colour;
c) yes; the faster the rate of reaction, the larger the change in mass; will need to measure mass of cubes before starting;
2. finding the mass altogether; will control for variability; or finding the masses individually; allows the reliability of the mass changes to be assessed;
3. a) not precise enough to detect changes;
b) yes, it will be precise enough to detect changes;
c) yes, it will be precise enough to detect changes (but it may be more precise than is justified);
4. to remove the immersion solution from the surface; to reduce errors in mass measurements;
5. results for pH 2 to 6 are reliable; results for pH 7 to 9 are not reliable, as the third result in each case is much lower;
6. a) final column, pH 7, 8 and 9;
b) freshness of pineapple; older pineapple has degraded tissue and less functional enzyme;
7. x-axis legend is pH; y-axis legend is mass decrease (mg); mean results plotted; all points plotted correctly; straight lines joining point to point;
8. optimum pH 6; activity decreases above and below pH 6; activity greater at basic pH as compared to acidic pH values;
9. precise value is between 5 and 7; more active at 6 than 5 or 7; but not clear if fractional pH doesn’t give a higher rate;
839211_Answers_T02.indd 2 11/28/14 10:47 AM
3
W I T H I N T O P I C Q U E S T I O N S
© Oxford University Press 2014: this may be reproduced for class use solely for the purchaser’s institute
Page 103
1. a) temperature (other variables could be investigated); varied using a thermostatically controlled water bath;
b) degrees Celsius;
c) 20 to 80 °C at 10 °C intervals;
2. a) use an electronic timer; compare the colour in the tube to another tube containing only milk, which will show when the phenolphthalein has turned colourless;
b) seconds;
c) to assess the reliability of the results; to avoid relying on one result which might be atypical/anomalous;
3. a) volume and concentration of lipase; volume of milk; pH of reaction mixture;
b) use the same sample of lipase solution for the whole experiment; measure the milk with an accurate syringe/pipette; put the same volume and concentration of sodium carbonate into each tube;
c) 1 ml of 1% lipase; 5 ml of milk; pH 8;
4. a) the fat is in small droplets with a large total surface area;
b) the larger volume will take longer to reach the target temperature than the small volume;
c) a smaller proportion of the liquid will be left behind on the sides of the tube/there will be better mixing of the liquids;
5. sketch graph should show a steeper and steeper rise to a peak at about 50 °C; followed by a steep drop to zero at higher temperatures;
6. human pancreas because it is adapted to work at 37 °C, while the lipase from castor oil seeds will be adapted to work at lower temperatures;
Page 107
1. the quantities of the four bases are reasonably similar across all of the eukaryotes: the relative quantities of bases in Mycobacterium are distinct from eukaryotes; Mycobacterium has less adenine and thymine but more guanine and cytosine; the amount of adenine approximately equal to the amount of thymine in both; the amount of guanine is approximately equal to the amount of cytosine in both groups;
2. 1.00 in both cases;
3. within experimental error the data supports the hypothesis; differences in amounts of G/C and A/T are too small to be significant;
4. complementary base pairing between A and T would mean that they would need to be present in equal quantities – same argument for C and G;
5. Polio virus may be single stranded/may be RNA virus; (need uracil data to know); bacteriophage T2 may be double stranded;
Page 109
1. all other bases contain oxygen;
2. it is used for the linkage between the base and the deoxyribose; base is linked to C1 of the deoxyribose;
3. both have two rings of atoms on their molecule; both have one six-membered and one five-membered ring; the nitrogen and carbon atoms are in the same places in the rings; both are purine bases;
4. both have one six-membered ring with carbons and nitrogens in the same positions; both have an oxygen linked to a carbon in the ring; both are pyrimidines;
5. distinctive shape needed for complementary base pairing; each base only pairs with one other; A to T and G to C; hydrogen bonds formed between complementary bases; allows accurate replication of DNA; essential for producing genetically identical cells/organisms/ needed for inheritance; allows gene regulators to recognise specific sequences of bases;
839211_Answers_T02.indd 3 11/28/14 10:47 AM
4
W I T H I N T O P I C Q U E S T I O N S
© Oxford University Press 2014: this may be reproduced for class use solely for the purchaser’s institute
Page 113–114
1. DNA was produced containing 14N, rather than 15N in the organic bases; 14N has a lower mass than 15N;
2. a) 1.717 g cm-3
b) falsifies conservative replication because that method would give two bands of DNA with densities of 1.710 and 1.724 g cm-3; dispersive unlikely to give a band half way between the higher and lower densities;
3. a) two bands; density 1.717 and 1.710 g cm-3; equal amounts of the two bands;
b) falsifies the dispersive mechanism; there would only be one band; all the DNA would be partly 1.710 and partly 1.724 g cm-3;
4. less and less 1.717 g cm-3 DNA; because all new strands are 1.710 g cm-3; and when these strands are replicated the DNA produced is 1.714 g cm-3;
5. semi-conservative redrawn; next generation has two red-green molecules and two all green ones; generation after has two red-green molecules and six all green ones;
6. three bands with 1.710, 1.717 and 1.724 g cm-3 density;
Page 118
1. left picture: translation (polysomes / ribosomes are visible); middle picture: DNA replication (replication bubble is shown / two replication forks are visible); right picture: transcription (possibly coupled with translation; increasing lengths of mRNA are visible);
2. a) DNA
b) DNA
c) mRNA with ribosomes attached
d) DNA
e) mRNA
Page 125
1. (560-544) g; 15/16 g total mass loss divided by 13 days; 1.2 g per day;
2. anaerobic cell respiration / alcoholic fermentation; CO2 is a waste product; release of CO
2 leads to
loss of mass from the solution;
3. population growth of yeast/more yeast respiring; positive feedback/increasing amounts of CO2
from higher population leads to lower solubility/higher rate of release; waste heat decreases CO
2 solubility;
4. substrate has run out; death of yeast (from high alcohol);
Page 128
1. a) respiration rate increases;
b) all cells/tissues in the larva are respiring; so respiration rate increases as number of respiring cells/mass of respiring tissue increases;
2. a) slight increase in 3rd and 4th instar larvae as larval weight increases; slight decrease/no significant change in 5th instar larvae; changes may not be statistically significant;
b) oxygen consumption is proportional to the mass of respiring tissue below critical weight; above critical weight the supply of oxygen by the tracheal system reaches a maximum because tracheae are part of the exoskeleton and cannot grow;
3. lower maximum rate of oxygen supply by the tracheal system; oxygen supply to the larva becomes insufficient at a lower mass; the insect has to moult and develop a larger tracheal system at a lower mass;
839211_Answers_T02.indd 4 11/28/14 10:47 AM
5
W I T H I N T O P I C Q U E S T I O N S
© Oxford University Press 2014: this may be reproduced for class use solely for the purchaser’s institute
Page 134
1. wavelength on the x axis and leaf area and height on two y axes; suitable scales on the x axis and the two y axes; appropriate legends on each axis stating what the variable is; units stated on each axis; all points plotted correctly; all points joined with straight lines between the points;
2. inverse correlation/larger leaf area with lower height;
3. red only makes the seedlings very tall so plants might need more support/height to grow; orange only gives the lowest leaf area which might reduce photosynthesis rate; blue only gives the largest leaf area which might increase photosynthesis rate; red, green and blue combined gives the lowest height and second highest leaf area; data does not indicate photosynthesis rates with the different wavelengths; data does not indicate crop yields with the different wavelengths.
839211_Answers_T02.indd 5 11/28/14 10:47 AM
6
E N D O F T O P I C Q U E S T I O N S
© Oxford University Press 2014: this may be reproduced for class use solely for the purchaser’s institute
Topic 2 - end of topic questions1. substrate is triglyceride; product is glycerol; and fatty acids; which lower pH when generated;
2. a) (i) no effect due to temperature between 20°C and 40°C; rate of activity falls above 40°C
(ii) higher temperature causes changes to enzyme structure; active site no longer fits the substrate; denaturation;
b) (i) also becomes less active at higher temperatures; activity is higher than soluble papain at temperatures above 40°C;
(ii) immobilized papain is more heat stable; binding to a solid surface makes the enzyme molecule more stable;
(iii) maltase; in the cell membrane / microvilli of epithelium cells lining the small intestine;
3. a) (i) dm3;
(ii) g and kg;
b) (i) 18.25 kg ATP
__ 134.4 dm3
= 0.1358 kg dm-3;
(ii) Length of race/m
Volume of oxygen/dm3
Mass of ATP produced/kg
1500 36 4.88810,000 150 20.3742,300 700 95.06
c) ATP produced in a cyclic process; synthesis of ATP only involves addition of phosphate to pre-existing ADP; same ADP molecules phosphorylated many times during the race; cycle of rephosphorylation only takes seconds; mass of ATP produced as a result of oxidation of glucose is much larger than the mass of glucose;
d) 0.5 dm3 of oxygen consumption would allow production of only 69 g of ATP; sprints must involve a degree of anaerobic cell respiration;
4. a) (i) light intensity;
(ii) carbon dioxide concentration;
(iii) temperature;
(iv) light intensity or carbon dioxide concentration or photosynthetic capacity;
b) because carbon dioxide concentration is the limiting factor; they are at the same carbon dioxide concentration; the light intensity is not affecting the rate of photosynthesis;
c) rate of photosynthesis is very low because of low light intensity; carbon dioxide is released in respiration; rate of respiration is greater than rate of photosynthesis;
5. a) with increasing wavelength there is limited effect up until about 680 nm; then there is a significant decrease in yield as wavelength increases;
b) supplementary light has limited effect up to about 680 nm; above 680nm supplementary light increases oxygen yield/rate of photosynthesis;
c) the error bars show the variability of the data; where the error bars overlap up to 680 nm. Suggest that there is no significant difference; up to 680 nm;
d) 1 photon
__ 0.125 molecules
= 8 photons/molecule
e) eight photons produce one oxygen molecule; eight electrons are excited per oxygen molecule; eight electrons are excited per four electrons produced by photolysis; so each electron must be excited twice.
839211_Answers_T02.indd 6 11/28/14 10:47 AM