Embed Size (px)
Citation preview
Top Management Team Size, CEO Dominance, and Firm Performance: The Moderating Roles ofEnvironmental Turbulence and DiscretionAuthor(s): Jerayr Haleblian and Sydney FinkelsteinReviewed work(s):Source: The Academy of Management Journal, Vol. 36, No. 4 (Aug., 1993), pp. 844-863Published by: Academy of ManagementStable URL: http://www.jstor.org/stable/256761 .Accessed: 23/11/2011 02:44
Your use of the JSTOR archive indicates your acceptance of the Terms & Conditions of Use, available at .http://www.jstor.org/page/info/about/policies/terms.jsp
JSTOR is a not-for-profit service that helps scholars, researchers, and students discover, use, and build upon a wide range ofcontent in a trusted digital archive. We use information technology and tools to increase productivity and facilitate new formsof scholarship. For more information about JSTOR, please contact [email protected].
Academy of Management is collaborating with JSTOR to digitize, preserve and extend access to The Academyof Management Journal.
http://www.jstor.org

o Academy of Management Journal 1993, Vol. 36, No. 4, 844-863.
TOP MANAGEMENT TEAM SIZE, CEO DOMINANCE, AND FIRM PERFORMANCE: THE MODERATING ROLES OF ENVIRONMENTAL TURBULENCE AND DISCRETION
JERAYR HALEBLIAN SYDNEY FINKELSTEIN
University of Southern California
Adopting an information-processing perspective and drawing on work in social psychology, this study examined the effects of top management team size and chief executive officer (CEO) dominance on firm perfor- mance in different environments. Data from 47 organizations revealed that firms with large teams performed better and firms with dominant CEOs performed worse in a turbulent environment than in a stable one. In addition, the association between team size and CEO dominance, and firm performance, is significant in an environment that allows top managers high discretion in making strategic choices but is not signif- icant in a low-discretion environment.
Scholars in strategic management have recently emphasized the role of top management teams in strategy formation and organizational perfor- mance (Hambrick & Mason, 1984). In explaining the choices top managers make, scholars taking this perspective often emphasize the importance of understanding such demographic characteristics as the ages, organizational tenures, functional backgrounds, and educations of top managers as well as the distributional properties of those variables. Empirical work on the asso- ciation between top team demographics and firm performance is not abun- dant, even though there is evidence that they are related (Norburn & Birley, 1988). For example, several researchers have examined the association be- tween functional backgrounds and firm performance (Gupta & Govindarajan, 1984; Michel & Hambrick, 1992). Murray (1989) extended this work by ex- amining temporal and occupational heterogeneity, reporting mixed results. Eisenhardt and Schoonhoven (1990) and Cooper and Bruno (1977), studying new ventures, reported associations between top team demographics and sales growth. Finally, in a study of bankrupt and survivor firms in a matched-pair sample, Hambrick and D'Aveni (1992) found that average top management team tenure and functional experience in marketing, opera- tions, and R&D were lower in bankrupts than in survivors.
We would like to thank Gregory Dess and Yong Min Kim for their valuable comments on earlier drafts of this article.
844

Haleblian and Finkelstein
This brief review indicates that important aspects of group composition have been somewhat underexplored; those aspects include both the extent to which a firm's chief executive officer (CEO) dominates the distribution of power within its top management team and the size of the team. CEO dom- inance and team size, both potentially important constructs because of their impact on the information-processing capabilities of top management teams, were the focus of this study.
A top management team can be considered the information-processing center of an organization in its relationship with its environment (Thomp- son, 1967). Environments vary in their degree of turbulence or stability (Dess & Beard, 1984) and in the degree of managerial discretion they permit (Ham- brick & Finkelstein, 1987). Although environments can be characterized along several dimensions, in this study we focused on turbulence and dis- cretion because of their expected impact on the relationship between top management team characteristics and performance.
Turbulence refers to volatility or difficult-to-predict discontinuities in an environment (Aldrich, 1979; Dess & Beard, 1984; Keats & Hitt, 1988). Turbulent environments increase both an organization's external linkages and the rate of change in those linkages (Aldrich, 1979; Emery & Trist, 1965). In contrast, stable environments are more predictable, with a more estab- lished set of relatively unchanging actors. Team size and power distribution help determine the nature of a top team's information-processing capabili- ties. Largeness provides increased capabilities and viewpoints, and a bal- anced power distribution facilitates information sharing and idea exchange, all of which can be critical in turbulent environments. Hence, an underlying premise to this study was that firms that match information-processing ca- pabilities to environmental requirements do better than those that do not.
Managerial discretion refers to the latitude of action top management teams have in making strategic choices (Hambrick & Finkelstein, 1987). Al- though discretion can be conceptualized at individual, organizational, and environmental levels of analysis, in this study we focused only on environ- ment-level discretion, henceforth called environmental discretion. Because environments differ in the extent to which they confer discretion to top managers, managerial characteristics will not always predict organizational outcomes. As a result, we would expect team size and CEO dominance to be related to performance when environmental discretion is high, but not when it is low.
BACKGROUND AND HYPOTHESES
Top Management Team Size
There has been relatively little work on the effects of team size in the research literature on top management teams, and team size has typically been modeled as a control variable (Bantel & Jackson, 1989; Jackson, Brett, Sessa, Cooper, Julin, & Peyronnin, 1991; Wagner, Pfeffer, & O'Reilly, 1984; Wiersema & Bantel, 1992). In one of the few studies that modeled team size
1993 845

Academy of Management Journal
as a predictor variable, Hambrick and D'Aveni (1992) found that firms near- ing bankruptcy tended to have smaller teams than matched-paired survi- vors. In addition, two studies of founding teams in high-technology firms reported that team size was associated with growth, ostensibly because larger teams provided more capabilities (Cooper & Bruno, 1977; Eisenhardt & Schoonhoven, 1990).
In contrast to the researchers studying top teams, social psychology scholars have been studying the effects of group size for some time. This work is informative because, although top teams are unique in terms of their level of decision-making responsibility and impact on the organizations, they are also similar to other groups in some fundamental ways. For exam- ple, other groups are "integrated by direct communication demands, inter- act[ing] functionally and continuously towards the achievement of an end" (James, 1951: 475), just as top teams are (Keck, 1990).
Steiner (1972) argued that group productivity is composed of potential productivity minus losses resulting from faulty process. He defined poten- tial group productivity as the "maximum level of productivity that can occur when an individual or group employs its supply of resources to meet the task demands of the work situation" (1972: 68). However, evidence on how group size affects process gains and losses is conflicting.
Several scholars have argued that large groups are superior to small ones because big groups have more capabilities and resources with which to solve group tasks (Hill, 1982; Jackson, 1992; Shull, Delbecq, & Cummings, 1970). Large groups can enhance problem-solving capabilities by (1) increasing the number of items of information that can be absorbed and recalled, (2) in- creasing the number of critical judgments available to correct errors in inference and analysis, (3) increasing the number of potential solution strat- egies, and (4) increasing the range of perspectives brought to bear on a problem (Harrison, 1975; Hoffman & Maier, 1961; Shaw, 1981; Shull et al., 1970). Such an increase in capabilities and resources may help account for the higher-quality decisions sometimes reported in large groups (Cummings, Huber, & Arendt, 1974; Ziller, 1957). For example, a group's performance has been found to be a positive function of its members' abilities (Hoffman, 1979; Shaw, 1976), with increases in team size expanding the resources available to solve a problem (Hare, 1976). This view is consistent with Hambrick and D'Aveni's argument that "at a basic level, the resources available on a team result from how many people are on it" (1992: 1449). It is also the logic that Eisenhardt and Schoonhoven (1990) used in discussing why large teams were advantageous in the new ventures they studied. Hence, large top man- agement teams have greater information-processing and decision-making ca- pabilities than small teams.
Although the advantages of large groups are considerable, their size also tends to create coordination and communication problems that smaller groups do not have (Blau, 1970; Shaw & Harkey, 1976). Small groups tend to be more cohesive, and their members experience more satisfaction than is common in large groups (Shaw, 1981; Swap, 1984). They also tend to make
846 August

Haleblian and Finkelstein
decisions and reach consensus faster than large groups (Shull et al., 1970; Thomas & Fink, 1963). So, although decision quality in small groups tends not to match that in large groups, small groups may be more appropriate when problem-solving tasks are relatively easy (Hare, 1952).
Environmental Turbulence as a Moderator
Although existing research is split on the relative merits of large and small top management teams, the team size that is appropriate may very well depend on an organization's environment. The degree of environmental tur- bulence or stability greatly influences the information-processing require- ments of a top team and the complexity of managerial work. In much the same way that the nature of a group's task moderates the relationship be- tween group size and productivity (Goodman, Ravlin, & Schminke, 1987), the turbulence of an organization's environment moderates the association between top team size and firm performance. The more turbulent the envi- ronment, the more varied and fragmented the nature of managerial work (Mintzberg, 1973) and the greater the information-processing demands on the top team (Daft, Sormunen, & Parks, 1988). As Galbraith argued, "The greater the task uncertainty, the greater the amount of information that must be processed among decision makers during task execution in order to achieve a given level of performance" (1973: 4). Turbulent environments increase information-processing needs by creating new opportunities and crises that often necessitate strategic and structural adaptations (Galbraith, 1973). Hence, as an environment grows more turbulent and a firm's deci- sion-making tasks grow more difficult, managers have greater information- processing requirements.
Under these conditions, there is great need for large teams to cope with the added unpredictability of the environment (Thompson, 1967; Tushman & Keck, 1990). The greater information-processing capabilities of large teams (e.g., Shull et al., 1970) are needed to help firms adapt to the greater infor- mation-processing requirements of turbulent environments. The benefits that accrue from the enhanced capabilities of large teams are likely to out- weigh the costs associated with the communication and coordination prob- lems that also arise in large teams. As Miller noted, "The hiring of more managers to reduce the burden of the CEO" (1992: 162) may be needed in turbulent environments. Hence, we would expect firm performance to be positively associated with top team size in turbulent environments.
In contrast, although all top managerial jobs are characterized by some complexity, information-processing requirements are not as intense in stable environments (Ancona, 1990). For example, Kotter found that top manage- rial information and decision-making requirements in stable environments were "more standardized and routine" than in turbulent environments (1982: 29). Stable environments tend to attenuate learning requirements (Tushman & Keck, 1990), making problem solving more systematic than it is in turbulent environments (Eisenhardt, 1989). Thus, firms in stable environ- ments cannot benefit as much from increases in top managerial inputs as
1993 847

Academy of Management Journal
firms in turbulent environments. Yet, because such firms are prone to the same inefficiencies associated with increases in team size as firms in more turbulent environments, the costs associated with increases in team size may outweigh the benefits, creating process losses in excess of process gains. Hence, top teams in a stable environment may be more efficiently managed with a small group at the top.
Hypothesis 1: Top management team size will be more positively associated with firm performance in a turbu- lent environment than in a stable environment.
Distribution of Power Within Top Management Teams and CEO Dominance
Power is defined here as the capacity of individual actors to exert their will. This definition is consistent with other scholars' views (Pfeffer, 1981) and lends itself to an analysis of relative power among top managers in organizations. Although power often carries negative connotations (Pfeffer, 1981), there is no reason to expect any particular distribution of power, whether it conveys power to one person or distributes it more equally to many, to be more advantageous than another in a general sense. However, following our earlier arguments on team size, we considered it likely that the association between top team power and firm performance would depend on the nature of the environment.
Dominant CEOs tend to restrict the flow of information in "high- velocity" environments (Eisenhardt & Bourgeois, 1988). Such restriction may happen when a dominant CEO nullifies the contribution of a member with less power (Diesing, 1962) or when other team members fear reporting information or ideas that run counter to those preferred by a dominant CEO (Hambrick & D'Aveni, 1992). Alternatively, a top group may spend much of its time either supporting or rejecting the ideas of a powerful person, such as the CEO, rather than searching for alternative solutions to a problem (Maier & Hoffman, 1961). When information-processing requirements are low, as is generally true in more stable environments (Ancona, 1990), top teams with dominant CEOs may minimize process loss by restricting unnecessary com- munication and conflict. In addition, CEOs may be more likely to have sufficient information with which to make high-quality decisions in stable environments. In a review of the group size literature, Hill concluded that when tasks are relatively simple, as they would be in a stable environment, "Performance was often determined by one competent individual" (1982: 529). In contrast, because problems in a turbulent environment require sub- stantial information processing (Daft et al., 1988), information restriction can lead to poor performance. When the distribution of power within a top team is balanced, the broader participation and information sharing needed to process complex decisions in turbulent environments is more likely to exist, enhancing firm performance. Hence, the impact of CEO dominance on firm performance is expected to differ in turbulent and stable environments.
848 August

Haleblian and Finkelstein
Hypothesis 2: CEO dominance will be more negatively associated with firm performance in a turbulent environ- ment than in a stable environment.
Environmental Discretion as a Moderator
Hypotheses 1 and 2 are based on the idea that environmental turbulence moderates the association between team size and CEO dominance, and firm performance. However, environments differ in the degree of discretion they confer to top management teams (Hambrick & Finkelstein, 1987). In high- discretion environments, top teams have a high degree of control over out- comes, so it makes sense to posit team effects on performance. But when environmental discretion is low, it is not clear that team characteristics such as size and power distribution get translated into performance outcomes. This logic suggests that the expectations summarized in Hypotheses 1 and 2 may only be supported in a high-discretion environment. As a result, an alternative hypothesis that recognizes the restricted latitude of options top teams face in low-discretion contexts is possible. Namely, when an environ- ment constrains the range of choices top managers face, as low-discretion environments do, the effects of such factors as CEO dominance and team size on firm performance are likely to be attenuated. Hence, the following hy- pothesis underlines how environmental discretion serves as a complemen- tary perspective to environmental turbulence by positing significant top team effects in a high-discretion environment, but not in a low-discretion environment.
Hypothesis 3: CEO dominance and team size will be sig- nificantly associated with firm performance in an envi- ronment allowing top managers a high level of discretion in strategic decision making but will not be significantly associated with firm performance in a low-discretion en- vironment.
METHODS
Study Group
Interested in studying two industries that varied significantly in envi- ronmental turbulence and discretion, we chose the computer industry, which is characterized by continuous product innovation, high growth rates, and high product differentiation, as the turbulent, high-discretion environ- ment, and chose the natural gas distribution industry, which is governed by regulations controlling pricing and capital acquisition, as the stable, low- discretion environment.1 To confirm that those characterizations were cor-
1 Although we considered industries in which turbulence and discretion did not covary, it was problematic to identify such industries. Some of the factors that promote discretion, such as product differentiability and demand growth, may also be related to turbulence. Neverthe- less, all hypotheses are testable in the two industries we studied.
1993 849

Academy of Management Journal
rect, we compared measures of environmental stability and environmental discretion across industries. Our two indicators of turbulence-stability were performance risk, measured as the average coefficient of variation of firms' return on assets from 1978 to 1982, and demand instability, measured as the average coefficient of variation of firms' sales from 1978 to 1982. The values of both indicators were significantly greater in the computer industry than in the natural gas industry, supporting our classification of those industries in terms of environmental turbulence.2
To measure environmental discretion, we relied on work by Hambrick and Finkelstein (1987). We computed the following indicators of environ- mental discretion for each industry studied: (1) the average advertising in- tensity, (2) the average R&D intensity, (3) the average annual sales growth, (4) the standard deviation of annual sales growth, and (5) the degree of regula- tion. The regulation indicator was based on the percentage of articles about either industry cited in Funk & Scott Predicasts that emphasized regulatory issues. These items corresponded to the environmental determinants of dis- cretion Hambrick and Finkelstein (1987) discussed, with advertising inten- sity and R&D intensity signifying product differentiability, sales growth rep- resenting market growth, the standard deviation of sales growth representing sales instability, and the degree of regulation capturing regulatory con- straints. We standardized these five indicators (x = 0; s.d. = 1) and averaged them to yield an overall measure of environmental discretion; the degree of regulation was reverse-scored (a = .80). The computed index score was .54 in the computer industry and -.63 in the gas industry (t = 9.07, p < .001), supporting our classification of those industries in terms of environmental discretion.
The names of 47 firms (26 computer and 21 natural gas distribution companies) for which data were available for all top management team mem- bers between 1978-82 were drawn from Ward's Directory of 50,000 Largest U.S. Corporations. With pooling, which is discussed below, there were 235 observations (47 firms for five years). The study group was restricted to large firms because (1) a fairly homogenous set of firms was required to ensure comparability and (2) it was difficult to obtain data on CEO dominance for smaller firms.
Given our focus on top teams as groups, we thought it important to study a relatively small set of managers at the top rather than a more diffuse cluster of top managers that might not really be a group. As a result, we defined a top management team as all corporate officers who were also board members (D'Aveni & Kesner, 1993). A manager's sitting on a firm's board of di- rectors is an objective and formal indicator of membership in its dominant coalition, the group of top managers in the inner circle of an organization
2 The means for performance risk and demand instability were 93.04 and 23.98 for firms in the computer industry and 42.56 and 14.22 for firms in the natural gas industry. The corre- sponding t-statistics were 3.05 (p < .001) for performance risk and 2.47 (p < .01) for demand instability.
850 August

Haleblian and Finkelstein
that has ultimate responsibility for setting policy (Cyert & March, 1963; Thompson, 1967). In addition, such inside board membership represents an absolute cutoff point between top managers and other managers that is anal- ogous across firms and industries. The study excluded all firms with only one inside board member because power distribution measures are not meaningful in such organizations.
Data were gathered from multiple sources. We collected data on top managerial characteristics from corporate proxy statements, Standard & Poor's Directory of Directors, and Dun & Bradstreet's Reference Book of Corporate Management. Data on firm characteristics were collected from COMPUSTAT, Moody's Manual, and Standard & Poor's Directory of Corpo- rations.
Measures
Firm performance. Three indicators of performance were used: return on assets, return on sales, and return on equity. Following the recommen- dations of Venkatraman and Ramanujam (1986), we standardized these three indicators (x = 0, s.d. = 1) and averaged their values to create a composite measure of firm performance. Correlations among these performance mea- sures ranged from .75 to .89, with the global measure yielding a Cronbach alpha of .93.
Top management team size. We counted the number of corporate offic- ers who were also board members in each firm for each year. The average size of the top management teams so defined was 3.39, with a standard deviation of 1.46.
CEO dominance. To assess CEO dominance for the large study group used here, we relied on ten objective measures of power that were thought to cumulatively explain overall power. Attempting to "provide a reasonably good approximation of the distribution of power" (Pfeffer, 1981: 59), we created an overall index of power by averaging the standardized (x = 0, s.d. = 1) coefficients of variation for each of ten indicators of power over all top team members in each firm in each year. When the coefficient of variation is high, power is unevenly concentrated in a firm's CEO, so CEO dominance is high.3 When the coefficient of variation is low, power is relatively evenly distributed among team members; the distribution of power in such firms is balanced. The indicators we used were based on work by Finkelstein (1992). A brief description of each indicator follows, but we refer readers to Finkel- stein for a fuller discussion of these measures and their validation.4
3 Actually, a high coefficient of variation only suggests that power is unevenly distributed and concentrated in one particular team member. However, when we examined teams with the
highest coefficient of variation scores (the upper 20th percentile), we found that it was the CEO who scored highest in every case.
4 We did not use the ownership variables described in Finkelstein because "ownership power may not translate into active involvement in strategic decision making" (1992: 530). Given that our focus was on strategic decision making, it was important to include only those
(continued)
1993 851
Academy of Management Journal
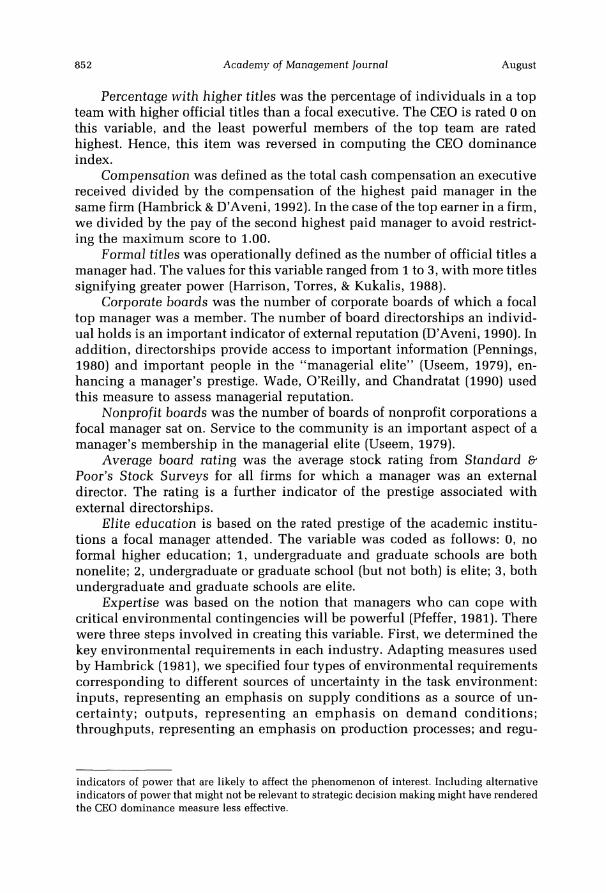
Percentage with higher titles was the percentage of individuals in a top team with higher official titles than a focal executive. The CEO is rated 0 on this variable, and the least powerful members of the top team are rated highest. Hence, this item was reversed in computing the CEO dominance index.
Compensation was defined as the total cash compensation an executive received divided by the compensation of the highest paid manager in the same firm (Hambrick & D'Aveni, 1992). In the case of the top earner in a firm, we divided by the pay of the second highest paid manager to avoid restrict- ing the maximum score to 1.00.
Formal titles was operationally defined as the number of official titles a manager had. The values for this variable ranged from 1 to 3, with more titles signifying greater power (Harrison, Torres, & Kukalis, 1988).
Corporate boards was the number of corporate boards of which a focal top manager was a member. The number of board directorships an individ- ual holds is an important indicator of external reputation (D'Aveni, 1990). In addition, directorships provide access to important information (Pennings, 1980) and important people in the "managerial elite" (Useem, 1979), en- hancing a manager's prestige. Wade, O'Reilly, and Chandratat (1990) used this measure to assess managerial reputation.
Nonprofit boards was the number of boards of nonprofit corporations a focal manager sat on. Service to the community is an important aspect of a manager's membership in the managerial elite (Useem, 1979).
Average board rating was the average stock rating from Standard & Poor's Stock Surveys for all firms for which a manager was an external director. The rating is a further indicator of the prestige associated with external directorships.
Elite education is based on the rated prestige of the academic institu- tions a focal manager attended. The variable was coded as follows: 0, no formal higher education; 1, undergraduate and graduate schools are both nonelite; 2, undergraduate or graduate school (but not both) is elite; 3, both undergraduate and graduate schools are elite.
Expertise was based on the notion that managers who can cope with critical environmental contingencies will be powerful (Pfeffer, 1981). There were three steps involved in creating this variable. First, we determined the key environmental requirements in each industry. Adapting measures used by Hambrick (1981), we specified four types of environmental requirements corresponding to different sources of uncertainty in the task environment: inputs, representing an emphasis on supply conditions as a source of un- certainty; outputs, representing an emphasis on demand conditions; throughputs, representing an emphasis on production processes; and regu-
indicators of power that are likely to affect the phenomenon of interest. Including alternative indicators of power that might not be relevant to strategic decision making might have rendered the CEO dominance measure less effective.
852 August

Haleblian and Finkelstein
latory concerns, representing an emphasis on regulatory conditions. We identified key environmental requirements by counting the number of arti- cles cited in Funk & Scott Predicasts that emphasized each of the four con- tingencies.
Second, all functional areas that managers had direct experience in were identified. And third, we assessed managerial expertise by matching func- tional experience with environmental requirements as follows: purchasing, personnel, and exploration corresponded to inputs; sales and marketing and product R&D corresponded to outputs; operations, accounting, and process R&D corresponded to throughputs; and government service and law corre- sponded to regulatory concerns (Hambrick, 1981). The actual measure was computed by summing the proportion of articles cited featuring each envi- ronmental requirement for which a manager had corresponding functional experience. For example, the distribution of cites from the Funk & Scott analysis in the computer industry was inputs, .10; outputs, .63; throughputs, .18; and regulatory concerns, .09; hence, a manager with functional experi- ence in marketing and law would score .72.
Functional areas was a count of the number of different functional areas a manager had experience in. It is a broader measure of experience that does not limit itself to the functional areas deemed important by Funk & Scott.
Positions in firm, defined as the number of different positions a manager has had in a firm, captured interactions with environmental actors. The wider a manager's external contacts, the greater his or her power (Thomp- son, 1967). Control Variables
Although many variables may help explain firm performance, it is not possible to include them all. Our approach was to select control variables that appeared to be related to performance at multiple levels of analysis. We included control variables at the environmental level, the firm level, and the top management team level.
Environment. As we discussed above, the computer industry was char- acterized by significantly more environmental turbulence and discretion than the natural gas industry. We used one industry dummy variable, coding firms in the computer industry as 1 and firms in the natural gas industry as 0 (Dess, Ireland, & Hitt, 1990).5
Firm size. The size of a firm was included as a control variable because, given Hypothesis 1, it was important to ensure that team size was not con- founded with firm size. To reduce "heteroscedasticity" (Kerlinger, 1973), we defined firm size as the natural logarithm of annual sales expressed in 1983 dollars.
Strategic unrelatedness. The nature and type of firm diversification may be related to firm performance (Bass, Cattin, & Wittink, 1977). Strategic
5 Results using the actual turbulence and discretion scores discussed earlier were identical to those reported below using an industry dummy variable.
1993 853

Academy of Management Journal
unrelatedness was measured as the percentage of industries in which a firm was operating that were different from the company's primary industry; all industries were defined by two-digit Standard Industrial Classification codes. Similar measures of diversification based on product counts have been used for some time (Montgomery, 1982), and they have recently been recommended for use in research that models diversification as a control variable, as this study did (Hoskisson, Hitt, Johnson, & Moesel, 1993).
Efficiency. Cost factors may be important to success in the natural gas distribution industry; hence, we included a control for efficiency. To mea- sure this construct, we standardized (x = 0, s.d. = 1) and summed nonpro- duction overhead costs (selling, general, and administrative expenses to sales ratio, an indicator of cost inefficiency) and inventory levels (invento- ries to sales ratio, an indicator of lack of asset parsimony), and multiplied the results by -1 to bring the score in line with efficiency. Several previous studies have used nonproduction overhead and inventory levels to measure efficiency (e.g., Hambrick, 1983).
Borrowing capacity. Borrowing capacity, defined as equity over debt, represents the extent to which a firm has not tapped into potential sources of leverage. As such, it is a commonly used indicator of organizational slack (Bourgeois, 1981). When a firm's balance sheet reflects unused borrowing capacity, its debt payments tend to be lower, directly affecting performance. Given that firms in the natural gas industry in particular are highly capital- intensive, borrowing capacity may be an important determinant of firm per- formance.
Tenure heterogeneity and functional heterogeneity. At the top team level, we examined two team composition variables to control for team ef- fects and to ensure that the power distribution and team size variables were not confounded with demographic heterogeneity. Tenure heterogeneity was measured as the coefficient of variation of tenure in a firm for top team members. Functional heterogeneity was measured with the formula 1 - Spi2 (Blau, 1977), where p was the weighted proportion of each func- tional background represented on a team (weighted by the number of func- tions each manager had experience in) and i was the number of different areas of functional experience on the team.
Data Analysis
The data were pooled across firms and years. Although pooling yields more precise estimates because it makes a larger sample possible, the result- ing observations are no longer independent because enduring individual firm characteristics are correlated over time. Hence, we used modified gen- eralized-least-squares (GLS) models to control explicitly for autocorrelation (Hannan & Young, 1977). We tested Hypotheses 1 and 2 by conducting moderated regression analysis to assess the form of the relationship between team size and CEO dominance and firm performance (Arnold, 1982). Mod- erated regression analysis is an appropriate test of these hypotheses because they are relational. We used subgroup analysis to test Hypothesis 3 because
854 August

Haleblian and Finkelstein
it predicts a significant effect in one industry but not the other. Subgroup analysis was the preferred analytical technique because Hypothesis 3 was nonrelational, making it necessary for us to independently test for main effects within each industry.
RESULTS
Table 1 presents means, standard deviations, and correlations among variables. Although we note significance levels, they should be interpreted with caution because the data have been pooled. Although there were sev- eral significant correlations among independent variables, the magnitude of those associations is not large (r < .50), indicating multicollinearity did not present a significant problem and that all the independent variables could be included in the GLS regressions.6
Table 2 presents regression analysis results. Because we used GLS re- gressions, the coefficients reported are not biased. Model 1 reports coeffi- cients for control variables and main effects. Of note here are the significant coefficients for team size (p < .05) and CEO dominance (p < .10).
Hypothesis 1 predicts that team size will be more positively related to performance in the computer industry than in the natural gas industry. To test this hypothesis, we added the interaction of team size and the computer industry dummy variable to the base model. As is evident from model 2 of Table 2, this interaction term was positive and significant, supporting Hy- pothesis 1.7
Hypothesis 2 predicts that CEO dominance will be more negatively associated with firm performance in the computer industry than in the nat- ural gas industry. To test this hypothesis, we added the interaction of CEO dominance and the computer industry dummy to the base model. As model 3 indicates, the coefficient for this interaction term was negative and signif- icant, supporting Hypothesis 2.
Hypothesis 3 predicts that top team characteristics will be significantly associated with firm performance in the computer industry but not in the natural gas industry. We tested this idea by conducting two regression analyses, one for each industry. As the results reported in Table 3 indicate, the coefficients for team size and CEO dominance were significant in the computer industry but not in the natural gas industry, supporting Hypoth- esis 3.
6 Although correlations among independent variables were generally small, the association
between firm size and strategic unrelatedness was .49. To ensure multicollinearity was not a problem, we conducted the same analyses reported below dropping each of these two variables in successive regression equations. Results did not change, indicating the correlation between firm size and strategic unrelatedness did not bias results.
7 We also tested the possibility that the relationship between team size and firm perfor- mance was curvilinear, with performance increasing with size up to a point and then decreasing because of process problems. When we added a squared term for team size to the model, the coefficients were not significant, indicating that, at least in our data, firm performance was a positive function of team size.
1993 855

TABLE 1 Means, Standard Deviations, and Correlations for All Variablesa
Variables Means s.d. 1 2 3 4 5 6 7 8 9
1. Computer industry 0.55 0.50 2. Firm size 6.82 1.50 -.17** 3. Strategic unrelatedness 5.78 5.31 .21** .49** 4. Efficiency 0.00 1.51 .00 .01 -.08 5. Borrowing capacity 5.78 14.35 .30** .02 .12t .20** 6. Tenure heterogeneity 45.86 31.57 - .08 .07 .07 -.18** -.15* 7. Functional heterogeneity 0.57 0.19 .23** .11 .12 .01 .16* 8. Team size 3.39 1.46 .06 .41** .31** .1it .31*i
9. CEO dominance 0.00 3.65 .00 .08 .00 .12t .07 10. Firm performance 0.00 2.20 .29** -.04 -.01 .14* .20*"
-.18** .21** .32** .07 .15*
-.19** .01
"N = 235. tp < .10 *
p < .05 **
p < .01
0
CL CD
0 Q a
CD
e-4 .14* ' .11t -.05 |
Q

Haleblian and Finkelstein
TABLE 2 GLS Regression Estimates of the Effects of Team Size and CEO
Dominance on Firm Performancea
Model 1 Model 2 Model 3
Variables b s.e. b s.e b s.e.
Intercept -1.37 1.67 0.14 1.49 -1.53 1.28
Computer industry 1.67** 0.49 0.01 0.97 1.69** 0.49 Firm size 0.22 0.17 0.14 0.18 0.24 0.17
Strategic unrelatedness -0.10* 0.04 -0.09* 0.04 -0.10* 0.04
Efficiency -0.08 0.13 -0.12 0.13 -0.09 0.13
Borrowing capacity 0.00 0.01 0.00 0.01 0.00 0.01 Tenure heterogeneity -0.01* 0.01 -0.01* 0.00 -0.01* 0.00 Functional heterogeneity -1.79t 1.02 -2.12* 1.03 -1.88t 1.02 Team size 0.34* 0.17 0.11 0.17 0.34* 0.14 CEO dominance -0.07t 0.04 -0.07t 0.04 0.05 0.07
Computer industry x team size 0.49* 0.25
Computer industry x CEO dominance -0.19* 0.08
a N = 235. t p < .10 * p < .05
**p < .01
DISCUSSION AND CONCLUSIONS
Effects of Team Size and CEO Dominance
This article presents the argument that environmental turbulence and discretion moderate the association between top management team size and CEO dominance, and firm performance. Our finding that large teams and teams with less dominant CEOs were more profitable in a turbulent envi- ronment (the computer industry) than in a stable environment (natural gas distribution) was consistent with our conceptualization of team size and CEO dominance as important information-processing variables.
The second major finding of this study was that top management team effects were not significant in the natural gas distribution industry. This industry is not only a stable one; it also constrains the choices available to top teams operating in it. With only a restricted level of discretion available to top managers, information processing within a top team may be of less consequence to performance than historical norms, standard operating pro- cedures, and the actions of regulatory agencies (Hambrick & Finkelstein, 1987).8 Finkelstein and Hambrick (1990) suggested that top management
8 To test the idea that performance differences in a low-discretion industry may be due to historical, firm-specific factors that change little over time, we added binary variables for 20 of 21 natural gas firms and redid the analysis reported in Table 3. We found 6 of 20 binary
(continued)
1993 857

Academy of Management Journal
TABLE 3 GLS Regression Estimates by Industrya
Natural Gas Computer Industry Distribution Industry
Variables b s.e. b s.e.
Intercept -0.17 1.97 -2.75t 1.56 Firm size 0.32 0.28 0.04 0.19 Strategic unrelatedness -0.15* 0.06 -0.05 0.06 Efficiency - 0.15 0.21 - 0.06 0.15 Borrowing capacity -0.01 0.01 1.62* 0.44 Tenure heterogeneity -0.02* 0.01 0.01 0.01 Functional heterogeneity - 3.22t 1.94 0.66 0.93 Team size 0.70** 0.24 0.07 0.12 CEO dominance -0.11* 0.05 0.06 0.05
a For the computer industry, N = 130; for the natural gas distribution industry, N = 105. t p < .10 * p < .05
**p < .01
team characteristics may not predict organizational outcomes such as per- formance in low-discretion contexts.
Environmental turbulence and discretion appear to operate as comple- mentary constructs. Turbulence and discretion are two important environ- mental dimensions that affect the relationship between top management team attributes and firm performance. However, these constructs are also complementary because predictions based on the impact of environmental turbulence were supported only when environmental discretion was high. In contrast, top team attributes were not predictive of outcomes when tested in a low-discretion environment. Hence, these results illustrate how envi- ronmental turbulence and discretion represent complementary explanations for the association between team size and CEO dominance, and firm perfor- mance.
Theoretical Implications, Limitations, and Directions for Future Research
The reported results have two important theoretical implications. First, it appears the increased capabilities and resources a large team brings to the strategic decision-making process are more advantageous in turbulent envi- ronments than in stable ones. Although this finding is consistent with re-
variables were significant at 5 percent or better, providing some support for this idea. Hence, it may be that firms that have done well in the past continue to do well because of inertial tendencies in the natural gas industry. For comparative purposes, we followed the same pro- cedure in the computer industry by adding a series of binary variables for firms. In this case, only one firm binary variable was significant, supporting our supposition that it is organiza- tional inertia that accounts for the significant binary variables in the natural gas industry.
858 August

Haleblian and Finkelstein
search on group processes in social psychology, its implications for top teams and strategic decision making is new. In addition, this result suggests that team size, usually modeled as a control variable, may be a construct of some theoretical importance in research on top management teams.
The second important implication concerns the results for CEO domi- nance. Our findings are consistent with those of Eisenhardt and Bourgeois (1988), who found that top teams with dominant CEOs, which they referred to as "centralized," contributed to poor performance in a turbulent (high- velocity) environment. Given that precedent, the results of this study con- firm that top managerial power is an important construct to model in re- search on top teams and strategic decision making (Finkelstein, 1992).
Several limitations of the study warrant discussion. First, our data were restricted to large firms, and our findings therefore may not be generalizable to small firms. Managerial effects may be more intense in small firms be- cause they are less constrained by organizational inertia (Miller, Kets de Vries, & Toulouse, 1982). Second, although we stated our hypotheses in associational terms, the logic behind them implies that team size and CEO dominance "cause" performance. Unfortunately, even with multiple years of data it was not possible to completely disentangle causal direction. Third, our discussion of team size and CEO dominance focused on their effects on decision quality and firm performance. However, we did not ex- plicitly consider the implementation process, which may affect outcomes, although it is complex (Nutt, 1989). Hence, our hypotheses should be con- sidered ceteris paribus. Finally, to study team size and CEO dominance more effectively requires data on a greater number of industries. Important patterns emerged in our examination of two widely disparate industries, but our study of only two industries leaves considerable opportunity for other researchers.
Both top management team size and CEO dominance hold considerable promise as future research topics. The literature on group size in social psychology may help clarify issues of relevance to researchers on top man- agement teams. For example, if large top management teams offer greater capabilities but also greater coordination and communication problems than small teams, managing team interactions to minimize process losses be- comes critical. However, little research on top teams has addressed such process issues. CEO dominance also warrants further study. Although we found that CEO dominance influenced firm profitability differentially across environments, future work could focus on the strategic implications of CEO dominance. Questions of interest include the following: Do dominant CEOs seek firm growth above other objectives, such as profits? How do dominant CEOs affect top management team staffing and succession processes? Under what conditions could boards of directors remove dominant but underper- forming CEOs? There are abundant research opportunities for scholars in- terested in learning more about such understudied top management team attributes as team size and CEO dominance. Hopefully, this article will help encourage such work.
1993 859
Academy of Management Journal
REFERENCES
Aldrich, H. E. 1979. Organizations and environments. Englewood Cliffs, NJ: Prentice-Hall.
Ancona, D. G. 1990. Top management teams: Preparing for the revolution. In J. Carroll (Ed.), Applied social psychology and organizational settings: 99-128. Hillsdale, NJ: Erlbaum.
Arnold, H. J. 1982. Moderator variables: A classification of conceptual, analytic, and psycho- metric issues. Organizational Behavior and Human Performance, 29: 143-174.
Bantel, K., & Jackson, S. 1989. Top management and innovations in banking: Does the compo- sition of the top team make a difference? Strategic Management Journal, 10: 107-124.
Bass, F. M., Cattin, P., & Wittink, D. 1977. Market structure and industry influence on profit- ability. In H. Thorelli (Ed.), Strategy + structure = performance: 181-201. Bloomington: Indiana University Press.
Blau, P. M. 1970. A formal theory of differentiation in organizations. American Sociological Review, 35: 201-218.
Blau, P. M. 1977. Inequality and heterogeneity. New York: Free Press.
Bourgeois, L. J., III. 1981. On the measurement of organizational slack. Academy of Manage- ment Review, 6: 29-39.
Cooper, A. C., & Bruno, A. 1977. Success among high-technology firms. Business Horizons, 20(2): 16-22.
Cummings, L. L., Huber, G. P., & Arendt, E. 1974. Effects of team size and spatial arrangements on group decision making. Academy of Management Journal, 17: 460-475.
Cyert, R. M., & March, J. G. 1963. A behavioral theory of the firm. Englewood Cliffs, NJ: Prentice-Hall.
Daft, R. L., Sormunen, J., & Parks, D. 1988. Chief executive scanning, environmental character- istics, and company performance: An empirical study. Strategic Management Journal, 9: 123-140.
D'Aveni, R. A. 1990. Top managerial prestige and organizational bankruptcy. Organization Science, 1: 123-142.
D'Aveni, R. A., & Kesner, I. F. 1993. Top managerial prestige, power and tender offer response: A study of elite social networks and target firm cooperation during takeovers. Organization Science, 4: 123-151.
Dess, G. G., & Beard, D. 1984. Dimensions of organizational task environments. Administrative Science Quarterly, 29: 52-73.
Dess, G. G., Ireland, R. D., & Hitt, M. A. 1990. Industry effects and strategic management re- search. Journal of Management, 16: 7-27.
Diesing, P. 1962. Reason in society. Urbana: University of Illinois Press.
Eisenhardt, K. M. 1989. Making fast strategic decisions in high-velocity environments. Acad- emy of Management Journal, 32: 543-576.
Eisenhardt, K. M., & Bourgeois, L. J., III. 1988. Politics of strategic decision making in high- velocity environments: Toward a midrange theory. Academy of Management Journal, 31: 737-770.
Eisenhardt, K. M., & Schoonhoven, C. B. 1990. Organizational growth: Linking founding team, strategy, environment, and growth among U.S. semiconductor ventures, 1978-1988. Ad- ministrative Science Quarterly, 35: 504-529.
Emery, F. E., & Trist, E. L. 1965. The causal texture of organizational environments. Human Relations, 18: 21-32.
860 August
Haleblian and Finkelstein
Finkelstein, S. 1992. Power in top management teams: Dimensions, measurement, and valida- tion. Academy of Management Journal, 35: 505-538.
Finkelstein, S., & Hambrick, D. C. 1990. Top-management-team tenure and organizational out- comes: The moderating role of managerial discretion. Administrative Science Quarterly, 35: 484-503.
Galbraith, J. 1973. Designing complex organizations. Reading, MA: Addison-Wesley.
Goodman, P. S., Ravlin, E., & Schminke, M. 1987. Understanding groups in organizations. In L. L. Cummings & B. M. Staw (Eds.), Research in organizational behavior, vol. 9: 121- 174. Greenwich, CT: JAI Press.
Gupta, A. K., & Govindarajan, V. 1984. Business unit strategy, managerial characteristics, and business unit effectiveness at strategy implementation. Academy of Management Review, 27: 25-41.
Hambrick, D. C. 1981. Environment, strategy, and power within top management teams. Ad- ministrative Science Quarterly, 26: 253-276.
Hambrick, D. C. 1983. High profit strategies in mature canital goods industries: A contingency approach. Academy of Management Journal, 26: t -707.
Hambrick, D. C., & D'Aveni, R. A. 1992. Top team deterioration as part of the downward spiral of large corporate bankruptcies. Management Science, 38: 1445-1466.
Hambrick, D. C., & Finkelstein, S. 1987. Managerial discretion: A bridge between polar views on organizations. In L. L. Cummings & B. M. Staw (Eds.), Research in organizational behav- ior, vol. 9: 369-406. Greenwich, CT: JAI Press.
Hambrick, D. C., & Mason, P. 1984. Upper echelons: The organization as a reflection of its top managers. Academy of Management Review, 9: 193-206.
Hannan, M., & Young, A. 1977. Estimation in multi-wave panel models: Results on pooling cross-section and time series. In D. Heise (Ed.), Sociological methodology: 52-83. San Francisco: Jossey-Bass.
Hare, A. P. 1952. A study of interaction and consensus in different sized groups. American Sociological Review, 17: 261-268.
Hare, A. P. 1976. Handbook of small group research. New York: Free Press.
Harrison, E. F. 1975. The managerial decision-making process. Boston: Houghton Mifflin.
Harrison, J. R., Torres, D. L., & Kukalis, S. 1988. The changing of the guard: Turnover and structural change in the top management positions. Administrative Science Quarterly, 33: 211-232.
Hill, G. W. 1982. Group versus individual performance: Are n + 1 heads better than one? Psychological Bulletin, 91: 517-539.
Hoffman, L. R. 1979. Applying experimental research on group problem solving to organiza- tions. Journal of Applied Behavioral Science, 15: 375-391.
Hoffman, L. R., & Maier, N. R. F. 1961. Quality and acceptance of problem solutions by mem- bers of homogenous and heterogeneous groups. Journal of Abnormal and Social Psychol- ogy, 58: 27-32.
Hoskisson, R. E., Hitt, M. A., Johnson, R. A., & Moesel, D. D. 1993. Construct validity of objec- tive (entropy and SIC-count-based) categorical measures of diversification strategy. Stra- tegic Management Journal, 14: 215-235.
Jackson, S. E. 1992. Consequences of group composition for the interpersonal dynamics of strategic issue processing. In P. Shrivastava, A. Huff, & J. Dutton (Eds.), Advances in strategic management, vol. 8: 345-382. Greenwich, CT: JAI Press.
Jackson, S. E., Brett, J. F., Sessa, V. I., Cooper, D. M., Julin, J. A., & Peyronnin, K. 1991. Some
1993 861

Academy of Management Journal
differences make a difference: Individual dissimilarity and group heterogeneity as corre- lates of recruitment, promotions, and turnover. Journal of Applied Psychology, 76: 675- 689.
James, J. 1951. A preliminary study of the size determinant in small group interaction. Amer- ican Sociological Review, 16: 474-477.
Keats, B., & Hitt, M. 1988. A causal model of linkages among environmental dimensions, macro-organizational characteristics and performance. Academy of Management Journal, 31: 570-598.
Keck, S. L. 1990. Determinants and consequences of top executive team structure. Unpub- lished doctoral dissertation, Columbia University, New York.
Kerlinger, F. N. 1973. Foundations of behavior research. New York: Holt, Rinehart & Winston.
Kotter, J. F. 1982. The general managers. New York: Free Press.
Maier, N. R. F., & Hoffman, L. R. 1961. Organization and creative problem solving. Journal of Applied Psychology, 45: 277-280.
Michel, J. G., & Hambrick, D. C. 1992. Diversification posture and top management team char- acteristics. Academy of Management Journal, 35: 9-37.
Miller, D., Kets de Vries, M. F. R., & Toulouse, J. 1982. Top executive locus of control and its relationship to strategy making, structure, and environment. Academy of Management Journal, 25: 237-253.
Miller, D. 1992. Environmental fit versus internal fit. Organization Science, 3: 159-178.
Mintzberg, H. 1973. The nature of managerial work. New York: Harper & Row.
Montgomery, C. A. 1982. The measurement of firm diversification: Some new empirical evi- dence. Academy of Management Journal, 25: 299-307.
Murray, A. I. 1989. Top management group heterogeneity and firm performance. Strategic Management Journal, 10: 125-141.
Norburn, D., & Birley, S. 1988. The top management team and corporate performance. Strategic Management Journal, 9: 225-237.
Nutt, P. C. 1989. Selecting tactics to implement strategic plans. Strategic ManagementJournal, 10: 145-161.
Pennings, J. M. 1980. Interlocking directorates: Origins and consequences of connections among organizations' boards of directors. San Francisco: Jossey-Bass.
Pfeffer, J. 1981. Power in organizations. Marshfield, MA: Pitman.
Shaw, M. E. 1976. Group dynamics. New York: McGraw-Hill.
Shaw, M. E. 1981. Group dynamics. New York: McGraw-Hill.
Shaw, M. E., & Harkey, B. 1976. Some effects of congruency of member characteristics and group structure upon group behavior. Journal of Personality and Social Psychology, 34: 412-418.
Shull, F. A., Delbecq, A. L., & Cummings, L. L. 1970. Organizational decision making. New York: McGraw-Hill.
Steiner, I. D. 1972. Group process and productivity. New York: Academic Press.
Swap, W. C. 1984. Group decision making. Beverly Hills: Sage.
Thomas, E. J., & Fink, C. F. 1963. Effects of group size. Psychological Bulletin, 60: 371-384.
Thompson, J. D. 1967. Organizations in action. New York: McGraw-Hill.
Tushman, M., & Keck, S. 1990. Environmental and organizational context and executive
862 August

Haleblian and Finkelstein
team characteristics: An organizational learning approach. Working paper, Columbia University Graduate School of Business, New York.
Useem, M. 1979. The social organization of the American business elite and participation of corporation directors in the governance of American institutes. American Sociological Review, 44: 553-572.
Venkatraman, N., & Ramanujam, V. 1986. Measurement of business performance in strategy research: A comparison of approaches. Academy of Management Review, 11: 801-814.
Wade, J., O'Reilly, C. A., III, & Chandratat, I. 1990. Golden parachutes: CEOs and the exercise of social influence. Administrative Science Quarterly, 35: 587-603.
Wagner, G. L., Pfeffer, J., & O'Reilly, C. A. 1984. Organizational demography and turnover in top management groups. Administrative Science Quarterly, 29: 74-92.
Wiersema, M. F., & Bantel, K. A. 1992. Top management demography and corporate strategic change. Academy of Management Review, 35: 91-121.
Ziller, R. C. 1957. Group size: A determinant of the quality and stability of group decisions. Sociometry, 20: 165-173.
Jerayr Haleblian is currently working on his Ph.D. degree in management and organ- ization at the University of Southern California. His current research interests include top management teams and organizational change.
Sydney Finkelstein is an assistant professor of management and organization in the Graduate School of Business Administration at the University of Southern California. He received his Ph.D. degree at Columbia University. His current research interests include the analysis of discretion and power in top management teams, executive compensation, corporate governance, and institutional processes in strategic manage- ment.
1993 863