Embed Size (px)
DESCRIPTION
Entrepreneurship Award, Estonian Companies' Competitiveness Ranking - charts and success stories
Citation preview
TOP ESTONIANENTERPRISES 2010ENTREPRENEURSHIP AWARD • COMPETITIVENESS RANKING
Copywriters:Estonian Chamber of Commerce and IndustryPiret Salmistu – [email protected]: +372 604 0060
Enterprise EstoniaMargit Shein – [email protected]: +372 627 9700
Estonian Institute of Economic ResearchMarje Josing – [email protected] Reiman – [email protected]: +372 668 1242
Articles and photos:Director&Partners
Layout:Disainikorp
Print:Kroonpress
Measuring the business success and competitiveness of Estonian enterprises onthe basis of the data of the financial year 2009 was bound to be and indeed was anexciting task. The toughest year of the economic crisis has left its mark. In manycompanies, conclusions are perhaps still being drawn from these lessons, but thedependence of the Estonian economy on external factors as well as the effect of thetrust and distrust of the financial sector on the real economy became clear to all.
Looking at the developments of the year 2010, it is hard to overestimate the im-portance of export in the recovery of the economy. The former slogans and calls toaction have become the reality – the replacement of lost domestic demand withnew foreign markets has provided valuable experience, but also increased bold-ness. At the level of each individual enterprise as well as the whole country, the fac-tor that defines competitiveness became even clearer – it is the ability to generateprofit. The more successful ones have retained that ability.
In 2010, we still use kroons for accounting in the Estonian economy, but the cal-culations of the next year’s Entrepreneurship Award and competitiveness rankingare already done in euros. A more stable and reliable finance combined with signsof the retreat of the crisis make it possible to look ahead more optimistically andwish the best of luck to all participants •
Ülari Alamets
Enterprise Estonia,Chairman of the Board
Enn Veskimägi
Estonian Employers' Confederation,
Chairman of the Council
Toomas Luman
Estonian Chamber of Commerce and Industry,
Chairman of the Board
The Best Estonian Enterprises
2010
2
Estonian Companies’ Competitiveness Ranking 2010
• Estonian Companies’ Competitiveness Ranking 2010 3
• Overall winner, the Most Competitive Enterprise in Estonia — Tallink Grupp 18
• The Most Competitive Small and Medium-sized Enterprise — Rentest 20
• The Most Competitive Industrial and Energy Enterprise — BLRT Grupp 30
• The Most Competitive Food Industry Enterprise — A. Le Coq 36
• The Most Competitive Business Service and Real Estate Enterprise — Riigi Kinnisvara 38
• The Most Competitive Tourism Enterprise — DenEesti 42
• The Most Competitive Wholesale Enterprise — Mazeikiu Nafta Trading House 46
• The Most Competitive Retail Enterprise — Humana Sorteerimiskeskus 48
• The Most Competitive Construction Enterprise — Merko Ehitus 52
• The Most Competitive Transport and Logistics Enterprise — Vopak E.O.S. 56
• The Most Competitive Communication and IT-services Enterprise — EMT 60
• The Most Competitive Agriculture and Forestry Enterprise — Markilo 64
• The Most Competitive Financial Brokerage Enterprise — IF Eesti Kindlustus 68
• The Most Competitive Service Enterprise — G4S Eesti 70
Entrepreneurship Award 2010
• Overall winner of Entrepreneurship Award 2010 and Foreign Investor 2010 – Ericsson Eesti 76
• Exporter 2010 — Wendre 80
• Developer of the Year 2010 — Polarwerk 82
• Tourism Innovator 2010 — Maarja-Magdaleena Gild 86
• Innovator 2010 — Massi Miliano 88
• Design Applier 2010 — Balteco 92
Special awards
• Award “Recognise Promoters of Enterprise 2010“ — Testmarket.eu 96
• Swedbank’s special award — Mobi Solutions 98
• Best Student Company 2010 — Pääsuke / Rolling Art 100
Overviews
• Second Year of Crisis. Leev Kuum, Estonian Institute of Economic Research 104
• History of Entrepreneurship Competitions 108
• Overview of the 2009 and 2010 Award Gala of Entrepreneurship Competitions 109
TABLE OF CONTENTS
The Best Estonian Enterprises
Competitiveness Ranking
The Best Estonian Enterprises
2010
Competitiveness is an indication of the pro-ductivity with which the company uses itsresources. To buyers, the ranking is a goodsour ce of information on the nature of thepartner. It is precisely the competitivenessof companies that is the focus of the Com-petitiveness Ranking. This ranking meas-ures companies’ success, productivity,abili ty for development, etc. Of course, thesecharacteristics cannot be expressed bynumbers only in full, but around 2/3 of com-petitiveness is reflected in statistical data.
Unfortunately, not all statistical data thatcharacterise competitiveness can be takeninto account, which is why the organisers ofthe competition had to make a selectionfrom the possible criteria. The compilershave used a total of eight indicators:• sales revenue,• change in sales revenue, • net profit, • change in net profit, • productivity of equity capital, • average labour cost per employee, • productivity per employee, • investments in fixed assets.
The selection reflects the size of the enter-prise, the dynamic of development, as wellas the efficiency of work.
Just like the selection of inputs, the uniformprocessing of the collected statistical datais also based on agreement. The compilershave chosen a methodology recommendedby the Estonian Institute of Economic Re-search, who cooperates in that field with theInternational Institute for Management De-velopment, Lausanne. Such an approachmakes it possible to compare and add indi-cators (financial, proportional) and ulti-
mately to determine each company’s com-petitiveness in relation to that of the mostsuccessful enterprise.
Rankings by business areas and companysize have been calculated on a separatebasis in each case, proceeding from the sta-tistical indicators of the companies con-tained in them (therefore the order ofcompanies in different charts might not al-ways be exactly the same).
The order of companies in the ranking is de-termined by summing up the nominal devi-ations of all their indicators (the bigger thepositive sum or the smaller the negativesum, the higher the rank).
The change in sales revenue and profit aspresented in the chart, the percentage beingcalculated by dividing the sales revenue(profit) of the accounting year with the sameindicator of the previous year and multipliedby 100, deserves special mention. Indicatorunchanged compared to the base year(2008) = 100%.
The global economic crisis has changed themethodology of the ranking insofar that alsothose companies that were in deficit in theaccounting year were able to compete thisyear. The indicator “change in net profit”was taken to be 0% in that case.
The technical calculations needed for com-piling the ranking are done by the operatorcompany Estonian Institute of Economic Re-search, who submits the results to the proj-ect management group of the EstonianChamber of Commerce and Industry, Es-tonian Employers’ Confederation and Enter-prise Estonia for review and approval •
5
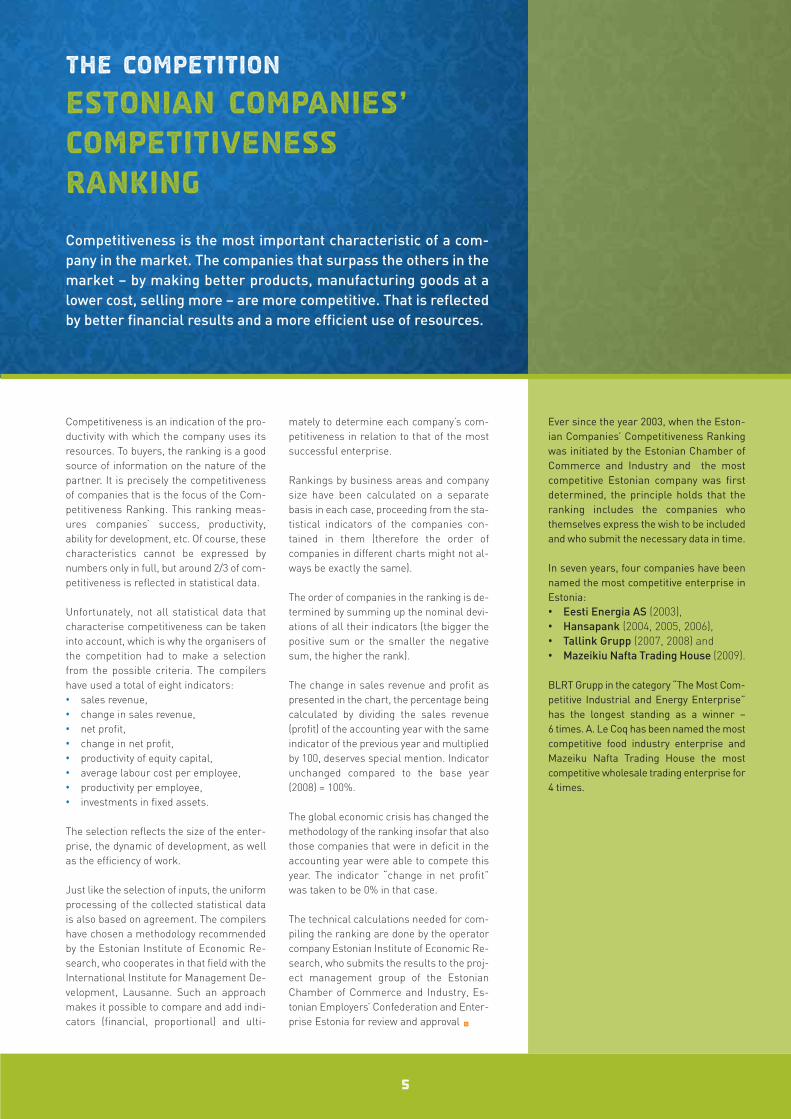
Competitiveness is the most important characteristic of a com-pany in the market. The companies that surpass the others in themarket – by making better products, manufacturing goods at alower cost, selling more – are more competitive. That is reflectedby better financial results and a more efficient use of resources.
The competition
Estonian Companies’ Competitiveness Ranking
Ever since the year 2003, when the Eston-ian Companies’ Competitiveness Rankingwas initiated by the Estonian Chamber ofCommerce and Industry and the mostcompetitive Estonian company was firstdetermined, the principle holds that theranking includes the companies whothemselves express the wish to be includedand who submit the necessary data in time.
In seven years, four companies have beennamed the most competitive enterprise inEstonia:• Eesti Energia AS (2003), • Hansapank (2004, 2005, 2006), • Tallink Grupp (2007, 2008) and• Mazeikiu Nafta Trading House (2009).
BLRT Grupp in the category “The Most Com-petitive Industrial and Energy Enterprise”has the longest standing as a winner – 6 times. A. Le Coq has been named the mostcompetitive food industry enterprise andMazeiku Nafta Trading House the most competitive wholesale trading enterprise for4 times.
7
Estonian Companies’ Competitiveness Ranking 2010
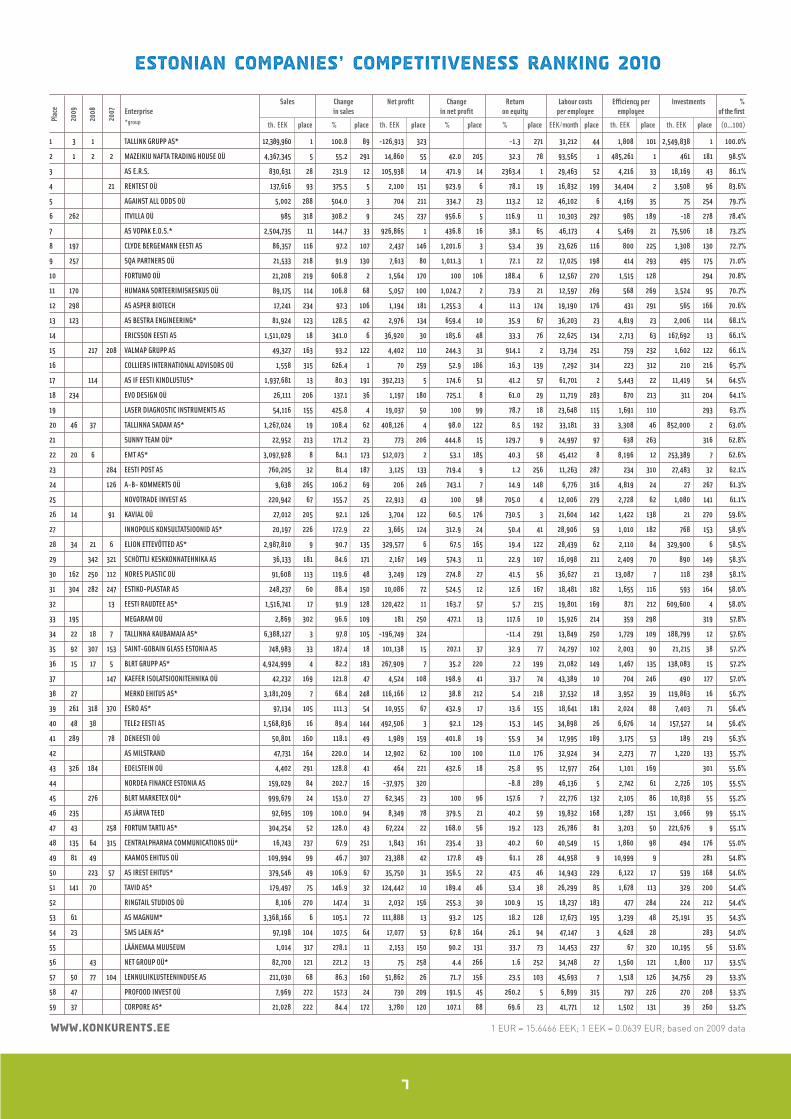
Sales Change Net profit Change Return Labour costs Efficiency per Investments %Enterprise in sales in net profit on equity per employee employee of the first*group th. EEK place % place th. EEK place % place % place EEK/month place th. EEK place th. EEK place (0...100)
Plac
e
2009
2008
2007
www.konkurents.ee 1 EUR = 15.6466 EEK; 1 EEK = 0.0639 EUR; based on 2009 data
1 3 1 TALLINK GRUPP AS* 12,389,960 1 100.8 89 -126,913 323 -1.3 271 31,212 44 1,808 101 2,549,838 1 100.0%
2 1 2 2 MAZEIKIU NAFTA TRADING HOUSE OÜ 4,367,345 5 55.2 291 14,860 55 42.0 205 32.3 78 93,565 1 485,261 1 461 181 98.5%
3 AS E.R.S. 830,631 28 231.9 12 105,938 14 471.9 14 2363.4 1 29,463 52 4,216 33 18,169 43 86.1%
4 21 RENTEST OÜ 137,616 93 375.5 5 2,100 151 923.9 6 78.1 19 16,832 199 34,404 2 3,508 96 83.6%
5 AGAINST ALL ODDS OÜ 5,002 288 504.0 3 704 211 334.7 23 113.2 12 46,102 6 4,169 35 75 254 79.7%
6 262 ITVILLA OÜ 985 318 308.2 9 245 237 956.6 5 116.9 11 10,303 297 985 189 -18 278 78.4%
7 AS VOPAK E.O.S.* 2,504,735 11 144.7 33 926,865 1 436.8 16 38.1 65 46,173 4 5,469 21 75,506 18 73.2%
8 197 CLYDE BERGEMANN EESTI AS 86,357 116 97.2 107 2,437 146 1,201.6 3 53.4 39 23,626 116 800 225 1,308 130 72.7%
9 257 SQA PARTNERS OÜ 21,533 218 91.9 130 7,613 80 1,011.3 1 72.1 22 17,025 198 414 293 495 175 71.0%
10 FORTUMO OÜ 21,208 219 606.8 2 1,564 170 100 106 188.4 6 12,567 270 1,515 128 294 70.8%
11 170 HUMANA SORTEERIMISKESKUS OÜ 89,175 114 106.8 68 5,057 100 1,024.7 2 73.9 21 12,597 269 568 269 3,524 95 70.7%
12 298 AS ASPER BIOTECH 17,241 234 97.3 106 1,194 181 1,255.3 4 11.3 174 19,190 176 431 291 565 166 70.6%
13 123 AS BESTRA ENGINEERING* 81,924 123 128.5 42 2,976 134 659.4 10 35.9 67 36,203 23 4,819 23 2,006 114 68.1%
14 ERICSSON EESTI AS 1,511,029 18 341.0 6 36,920 30 185.6 48 33.3 76 22,625 134 2,713 63 167,692 13 66.1%
15 217 208 VALMAP GRUPP AS 49,327 163 93.2 122 4,402 110 244.3 31 914.1 2 13,734 251 759 232 1,602 122 66.1%
16 COLLIERS INTERNATIONAL ADVISORS OÜ 1,558 315 626.4 1 70 259 52.9 186 16.3 139 7,292 314 223 312 210 216 65.7%
17 114 AS IF EESTI KINDLUSTUS* 1,937,681 13 80.3 191 392,213 5 174.6 51 41.2 57 61,701 2 5,443 22 11,419 54 64.5%
18 234 EVO DESIGN OÜ 26,111 206 137.1 36 1,197 180 725.1 8 61.0 29 11,719 283 870 213 311 204 64.1%
19 LASER DIAGNOSTIC INSTRUMENTS AS 54,116 155 425.8 4 19,037 50 100 99 78.7 18 23,648 115 1,691 110 293 63.7%
20 46 37 TALLINNA SADAM AS* 1,267,024 19 108.4 62 408,126 4 98.0 122 8.5 192 33,181 33 3,308 46 852,000 2 63.0%
21 SUNNY TEAM OÜ* 22,952 213 171.2 23 773 206 444.8 15 129.7 9 24,997 97 638 263 316 62.8%
22 20 6 EMT AS* 3,097,928 8 84.1 173 512,073 2 53.1 185 40.3 58 45,412 8 8,196 12 253,389 7 62.6%
23 284 EESTI POST AS 760,205 32 81.4 187 3,125 133 719.4 9 1.2 256 11,263 287 234 310 27,483 32 62.1%
24 126 A-B- KOMMERTS OÜ 9,638 265 106.2 69 206 246 743.1 7 14.9 148 6,776 316 4,819 24 27 267 61.3%
25 NOVOTRADE INVEST AS 220,942 67 155.7 25 22,913 43 100 98 705.0 4 12,006 279 2,728 62 1,080 141 61.1%
26 14 91 KAVIAL OÜ 27,012 205 92.1 126 3,704 122 60.5 176 730.5 3 21,604 142 1,422 138 21 270 59.6%
27 INNOPOLIS KONSULTATSIOONID AS* 20,197 226 172.9 22 3,665 124 312.9 24 50.4 41 28,906 59 1,010 182 768 153 58.9%
28 34 21 6 ELION ETTEVÕTTED AS* 2,987,810 9 90.7 135 329,577 6 67.5 165 19.4 122 28,439 62 2,110 84 329,900 6 58.5%
29 342 321 SCHÖTTLI KESKKONNATEHNIKA AS 36,133 181 84.6 171 2,167 149 574.3 11 22.9 107 16,098 211 2,409 70 890 149 58.3%
30 162 250 112 NORES PLASTIC OÜ 91,608 113 119.6 48 3,249 129 274.8 27 41.5 56 36,627 21 13,087 7 118 238 58.1%
31 304 282 247 ESTIKO-PLASTAR AS 248,237 60 88.4 150 10,086 72 524.5 12 12.6 167 18,481 182 1,655 116 593 164 58.0%
32 13 EESTI RAUDTEE AS* 1,516,741 17 91.9 128 120,422 11 163.7 57 5.7 215 19,801 169 871 212 609,600 4 58.0%
33 195 MEGARAM OÜ 2,869 302 96.6 109 181 250 477.1 13 117.6 10 15,926 214 359 298 319 57.8%
34 22 18 7 TALLINNA KAUBAMAJA AS* 6,388,127 3 97.8 105 -196,749 324 -11.4 291 13,849 250 1,729 109 188,799 12 57.6%
35 92 307 153 SAINT-GOBAIN GLASS ESTONIA AS 748,983 33 187.4 18 101,138 15 207.1 37 32.9 77 24,297 102 2,003 90 21,215 38 57.2%
36 15 17 5 BLRT GRUPP AS* 4,924,999 4 82.2 183 267,909 7 35.2 220 7.2 199 21,082 149 1,467 135 138,083 15 57.2%
37 147 KAEFER ISOLATSIOONITEHNIKA OÜ 42,232 169 121.8 47 4,524 108 198.9 41 33.7 74 43,389 10 704 246 490 177 57.0%
38 27 MERKO EHITUS AS* 3,181,209 7 68.4 248 116,166 12 38.8 212 5.4 218 37,532 18 3,952 39 119,863 16 56.7%
39 261 318 370 ESRO AS* 97,134 105 111.3 54 10,955 67 432.9 17 13.6 155 18,641 181 2,024 88 7,403 71 56.4%
40 48 38 TELE2 EESTI AS 1,568,836 16 89.4 144 492,506 3 92.1 129 15.3 145 34,898 26 6,676 14 157,527 14 56.4%
41 289 78 DENEESTI OÜ 50,801 160 118.1 49 1,989 159 401.8 19 55.9 34 17,995 189 3,175 53 189 219 56.3%
42 AS MILSTRAND 47,731 164 220.0 14 12,902 62 100 100 11.0 176 32,924 34 2,273 77 1,220 133 55.7%
43 326 184 EDELSTEIN OÜ 4,402 291 128.8 41 464 221 432.6 18 25.8 95 12,977 264 1,101 169 301 55.6%
44 NORDEA FINANCE ESTONIA AS 159,029 84 202.7 16 -37,975 320 -8.8 289 46,136 5 2,742 61 2,726 105 55.5%
45 276 BLRT MARKETEX OÜ* 999,679 24 153.0 27 62,345 23 100 96 157.6 7 22,776 132 2,105 86 10,838 55 55.2%
46 235 AS JÄRVA TEED 92,695 109 100.0 94 8,349 78 379.5 21 40.2 59 19,832 168 1,287 151 3,066 99 55.1%
47 43 258 FORTUM TARTU AS* 304,254 52 128.0 43 67,224 22 168.0 56 19.2 123 26,786 81 3,203 50 221,676 9 55.1%
48 135 64 315 CENTRALPHARMA COMMUNICATIONS OÜ* 16,743 237 67.9 251 1,843 161 235.4 33 40.2 60 40,549 15 1,860 98 494 176 55.0%
49 81 49 KAAMOS EHITUS OÜ 109,994 99 46.7 307 23,388 42 177.8 49 61.1 28 44,958 9 10,999 9 281 54.8%
50 223 57 AS IREST EHITUS* 379,546 49 106.9 67 35,750 31 356.5 22 47.5 46 14,943 229 6,122 17 539 168 54.6%
51 141 70 TAVID AS* 179,497 75 146.9 32 124,442 10 189.4 46 53.4 38 26,299 85 1,678 113 329 200 54.4%
52 RINGTAIL STUDIOS OÜ 8,106 270 147.4 31 2,032 156 255.3 30 100.9 15 18,237 183 477 284 224 212 54.4%
53 61 AS MAGNUM* 3,368,166 6 105.1 72 111,888 13 93.2 125 18.2 128 17,673 195 3,239 48 25,191 35 54.3%
54 23 SMS LAEN AS* 97,198 104 107.5 64 17,077 53 67.8 164 26.1 94 47,147 3 4,628 28 283 54.0%
55 LÄÄNEMAA MUUSEUM 1,014 317 278.1 11 2,153 150 90.2 131 33.7 73 14,453 237 67 320 10,195 56 53.6%
56 43 NET GROUP OÜ* 82,700 121 221.2 13 75 258 4.4 266 1.6 252 34,748 27 1,560 121 1,800 117 53.5%
57 50 77 104 LENNULIIKLUSTEENINDUSE AS 211,030 68 86.3 160 51,862 26 71.7 156 23.5 103 45,693 7 1,518 126 34,756 29 53.3%
58 47 PROFOOD INVEST OÜ 7,969 272 157.3 24 730 209 191.5 45 260.2 5 6,899 315 797 226 270 208 53.3%
59 37 CORPORE AS* 21,028 222 84.4 172 3,780 120 107.1 88 69.6 23 41,771 12 1,502 131 39 260 53.2%

8
Estonian Companies’ Competitiveness Ranking 2010
Sales Change Net profit Change Return Labour costs Efficiency per Investments %Enterprise in sales in net profit on equity per employee employee of the first*group th. EEK place % place th. EEK place % place % place EEK/month place th. EEK place th. EEK place (0...100)
Plac
e
2009
2008
2007
www.konkurents.ee 1 EUR = 15.6466 EEK; 1 EEK = 0.0639 EUR; based on 2009 data
60 RIIGI KINNISVARA AS* 557,760 39 147.6 30 22,284 44 24.8 236 1.3 254 29,693 49 6,411 16 214,037 10 53.1%
61 MEIREN ENGINEERING OÜ 16,759 236 184.2 19 966 195 87.0 138 26.3 93 29,161 56 1,524 125 535 169 53.0%
62 21 237 LINXTELECOM ESTONIA OÜ 84,792 118 90.3 139 9,611 74 94.3 124 25.6 96 42,336 11 2,231 79 26,249 33 52.9%
63 166 ADM INTERACTIVE OÜ 14,181 249 79.5 196 1,097 185 267.4 29 38.5 64 27,151 75 506 278 317 52.8%
64 54 352 462 MOBI SOLUTIONS OÜ* 45,705 166 193.0 17 5,127 99 177.2 50 57.3 33 14,679 234 1,063 176 129 233 52.7%
65 205 COLUMBUS IT PARTNER EESTI AS* 58,551 150 107.1 66 1,253 178 100 108 12.8 166 40,743 14 1,148 163 151 228 52.7%
66 35 35 31 BALTIC AGRO AS 883,112 27 54.4 293 18,137 51 59.9 181 8.5 191 40,756 13 30,452 3 84 248 52.6%
67 PALMSE METALL OÜ 58,495 151 55.9 290 4,599 106 302.1 26 26.6 92 25,101 95 2,250 78 1,683 120 52.2%
68 33 91 52 ABB AS* 1,921,000 14 74.7 226 76,000 19 51.7 189 14.0 152 28,611 61 2,134 82 99,000 17 52.1%
69 85 METAL EXPRESS OÜ 30,256 197 103.5 82 906 197 96.7 123 22.0 114 36,377 22 10,085 11 64 256 51.9%
70 BCS INFRA AS 19,990 228 78.9 202 1,400 174 206.2 38 45.8 49 29,323 54 1,176 162 300 51.9%
71 BCS KOOLITUS AS 16,252 241 152.9 28 1,699 166 107.6 86 28.5 87 27,623 68 1,083 171 83 249 51.8%
72 111 133 PROEKSPERT AS* 67,609 136 93.3 121 13,988 60 88.5 134 39.4 62 38,242 16 901 205 305 51.7%
73 39 15 33 NORDIC CONTRACTORS AS* 2,542,763 10 64.0 264 -77,621 322 -8.0 288 27,181 74 2,185 81 195,453 11 51.6%
74 64 181 90 REGIO AS 62,675 146 87.4 154 7,456 83 126.6 73 30.5 83 35,209 25 764 230 898 148 51.5%
75 36 130 AIR MAINTENANCE ESTONIA AS 196,270 71 99.0 98 26,017 36 87.2 136 46.0 48 34,396 28 1,250 155 7,521 68 51.4%
76 121 185 58 RAKVERE LIHAKOMBINAAT AS* 1,969,743 12 91.5 132 95,761 16 132.2 67 8.4 195 15,432 224 1,472 134 72,900 19 51.4%
77 POLVEN FOODS OÜ 40,944 174 142.0 34 4,046 116 211.8 36 101.8 14 10,952 290 931 198 130 232 51.3%
78 TELEVÕRGU AS 225,258 66 100.7 90 69,889 21 102.6 94 44.3 52 29,385 53 4,022 37 34,130 30 51.2%
79 25 39 61 VKG OIL AS* 1,251,708 20 83.9 176 49,354 27 20.3 245 3.5 236 14,694 233 2,006 89 539,017 5 51.1%
80 107 19 BDA CONSULTING OÜ 17,529 233 93.4 120 810 201 81.2 143 75.6 20 33,574 31 1,348 143 110 240 50.9%
81 44 AS GALVI-LINDA 65,489 138 141.9 35 19,894 49 201.6 39 66.4 25 12,409 272 532 272 4,591 83 50.8%
82 4 RIVERSIDE OÜ* 88,543 115 67.6 254 14,106 58 127.3 71 55.4 35 23,353 120 4,216 34 225,785 8 50.7%
83 275 NAPAL AS 65,163 139 130.5 40 1,000 189 120.5 79 10.6 179 25,904 89 4,654 27 338 198 50.7%
84 117 OÜ HIIU TEED 91,877 112 103.4 83 9,757 73 147.2 60 30.1 84 26,590 83 1,997 91 214 215 50.6%
85 24 136 69 FILTER AS* 550,678 40 91.0 133 21,208 47 26.4 233 13.5 157 36,673 20 3,278 47 6,180 78 50.3%
86 ES SADOLIN AS* 643,190 36 76.1 220 84,663 18 115.4 80 33.9 72 26,890 80 3,806 40 8,612 62 50.3%
87 265 86 TIPTIPTAP OÜ 16,978 235 69.9 243 2,920 136 273.0 28 61.4 27 16,256 208 999 185 303 50.2%
88 101 98 A. LE COQ AS 1,020,070 22 90.6 137 157,893 9 84.7 140 17.4 132 23,180 122 3,000 57 51,961 24 50.2%
89 2 1 SWEDBANK AS* 11,700,000 2 76.1 219-13,651,000 325 -43.1 309 23,022 126 1,529 124 667,000 3 50.2%
90 329 351 445 PEETRI PUIT OÜ 41,491 171 135.5 37 3,794 118 215.8 35 15.3 144 13,363 259 1,338 146 523 173 50.1%
91 69 106 194 WEBMEDIA AS 162,568 81 96.1 110 21,686 46 73.0 154 23.1 104 33,415 32 774 228 357 197 50.1%
92 52 174 AS PLANSERK 20,145 227 61.5 270 4,867 102 154.0 59 44.0 53 30,434 45 1,343 145 764 154 50.0%
93 AHRENS INVESTING* 7,161 277 112.5 52 970 194 127.1 72 54.6 36 23,656 113 895 207 307 50.0%
94 209 AS NURME TURVAS* 13,653 252 112.3 53 4,974 101 239.3 32 39.3 63 12,775 266 683 253 3,934 90 49.9%
95 203 NOVATERRA TRADE AS 84,072 119 104.5 75 1,711 165 129.2 69 25.0 99 25,003 96 6,467 15 269 209 49.9%
96 62 139 VIRAITO OÜ 13,592 253 78.9 203 4,198 113 303.0 25 23.0 106 13,143 262 715 245 175 221 49.9%
97 AQ LASERTOOL OÜ 163,499 80 108.9 61 10,605 69 126.3 74 36.8 66 21,022 150 1,220 159 64,723 20 49.8%
98 ICOSAGEN CELL FACTORY OÜ 3,881 297 320.8 8 195 247 100 117 24,100 105 299 307 2,903 103 49.8%
99 103 LUISA TÕLKEBÜROO OÜ 22,839 214 89.2 146 599 214 145.4 61 3.7 234 27,659 67 531 273 900 147 49.5%
100 KILPLANE OÜ* 251 321 58.7 281 183 249 396.7 20 60.9 30 2,131 320 251 309 321 49.4%
101 269 242 349 KINDLUSTUSEST KINDLUSTUSMAAKLER OÜ 14,594 247 94.9 112 479 219 199.8 40 33.4 75 18,223 184 384 296 770 152 49.3%
102 229 OÜ MAVAM 2,552 307 102.1 87 230 242 64.6 169 19.5 120 32,038 39 1,276 152 299 49.3%
103 SCANFOR EESTI OÜ 60,254 148 77.7 213 538 218 25.4 235 5.6 216 37,725 17 15,063 6 279 49.3%
104 WINDAK OÜ 27,833 203 60.4 275 3,206 132 170.8 55 16.1 140 27,518 70 1,988 92 291 49.2%
105 RUUM JA MAASTIK OÜ 1,837 312 52.5 298 267 235 141.3 64 49.7 42 29,556 50 918 199 32 265 49.1%
106 AS LTH-BAAS* 156,728 85 98.4 100 8,745 76 100 101 90.2 16 21,459 145 917 200 664 160 49.1%
107 145 128 454 ESTANC AS* 74,405 130 87.7 152 7,002 86 107.1 87 35.1 69 26,985 77 1,583 120 3,030 100 49.0%
108 273 EUMAR SANTEHNIKA OÜ 27,157 204 105.0 73 5,213 98 192.0 44 35.2 68 15,528 220 905 202 2,789 104 49.0%
109 67 218 174 ADDINOL MINERALÖL MARKETING OÜ 155,841 86 78.7 206 5,837 91 60.8 175 10.5 182 32,772 35 4,722 25 12,041 53 48.9%
110 17 ADVISIO OÜ* 11,361 256 109.3 58 2,099 152 61.1 174 57.6 31 26,539 84 668 255 149 230 48.9%
111 INGVER OÜ 23 324 337.6 7 -303 283 -47.0 312 1,436 321 23 321 274 207 48.9%
112 137 252 161 KRIMELTE OÜ* 813,036 29 80.2 192 53,416 24 106.7 89 20.5 118 20,495 156 3,985 38 16,522 45 48.7%
113 72 65 TELEGRUPP AS 108,732 100 73.3 232 9,308 75 65.5 168 34.9 71 31,807 43 2,364 74 9,433 58 48.7%
114 26 107 K-PROJEKT AS 64,641 141 81.0 188 14,693 56 123.3 76 52.5 40 24,148 104 839 218 97 241 48.7%
115 307 345 319 RAJA K.T. OÜ 62,903 145 103.8 79 5,828 92 223.1 34 24.1 102 11,065 289 1,906 94 8,391 63 48.6%
116 82 58 GSMVALVE OÜ 20,655 223 89.9 143 4,058 115 171.0 54 68.5 24 16,372 206 861 215 3,544 94 48.6%
117 32 285 CYBERNETICA AS 69,207 135 98.3 101 4,220 112 39.4 208 11.6 170 32,389 38 647 261 327 202 48.5%
118 AS KROONPRESS 438,992 46 115.0 50 6,227 87 100 102 2.8 242 20,200 160 1,749 108 1,154 135 48.5%

10
Estonian Companies’ Competitiveness Ranking 2010
Sales Change Net profit Change Return Labour costs Efficiency per Investments %Enterprise in sales in net profit on equity per employee employee of the first*group th. EEK place % place th. EEK place % place % place EEK/month place th. EEK place th. EEK place (0...100)
Plac
e
2009
2008
2007
www.konkurents.ee 1 EUR = 15.6466 EEK; 1 EEK = 0.0639 EUR; based on 2009 data
119 AS TOOTSI TURVAS 280,242 55 94.0 116 24,610 39 100 97 5.1 222 23,260 121 1,475 133 39,694 27 48.5%
120 158 51 195 SONA SYSTEMS OÜ 6,997 279 127.8 44 3,685 123 127.6 70 80.9 17 11,454 285 6,997 13 -211 282 48.4%
121 192 HARJU EHITUS AS* 141,072 92 65.3 261 14,678 57 188.5 47 16.9 136 19,937 166 4,275 32 574 165 48.4%
122 198 193 SCHETELIG EV AS* 95,576 107 90.7 136 5,606 95 61.9 171 9.9 186 29,860 46 3,186 52 1,247 131 48.3%
123 76 216 168 TEEDE TEHNOKESKUS AS 58,292 152 83.3 180 3,305 126 60.1 180 11.5 171 31,966 42 857 216 651 161 48.3%
124 104 388 VIIMSI KEEVITUS AS 159,641 82 79.0 199 38,340 29 111.2 83 43.3 55 22,629 133 4,695 26 8,057 65 48.3%
125 KWH PIPE EESTI AS 52,894 157 71.6 237 2,751 138 88.2 135 12.5 168 29,501 51 5,877 18 119 236 48.2%
126 169 136 GRUNDFOS PUMPS EESTI OÜ* 50,518 161 80.0 193 81 256 11.2 256 2.0 251 37,127 19 4,593 29 40 259 48.2%
127 75 112 E-PROFIIL AS 169,707 79 93.7 118 5,812 93 65.7 167 27.0 90 26,156 87 981 191 18,490 42 48.2%
128 188 280 298 JELD-WEN EESTI AS 570,421 38 87.9 151 74,258 20 138.3 65 26.8 91 16,129 209 908 201 2,205 112 48.1%
129 260 WINDOOR AS 63,529 144 110.6 56 7,170 85 130.7 68 23.0 105 17,812 190 1,513 129 295 48.1%
130 87 54 274 TELORA-E AS 30,791 195 64.4 263 3,993 117 74.5 151 24.2 100 31,974 41 855 217 1,131 136 48.1%
131 227 354 NÕO LIHATÖÖSTUS AS 208,478 69 109.0 60 10,092 71 171.0 53 15.0 146 12,471 271 1,458 136 7,570 67 47.9%
132 EPC FINANCE OÜ 2,198 310 133.5 38 78 257 100 118 57.5 32 14,569 235 733 237 310 47.9%
133 SOFTREFLECTOR OÜ 11,253 257 102.4 85 3,303 127 160.0 58 47.4 47 14,106 242 938 197 3,375 97 47.9%
134 57 ÜLEMISTE CITY AS 102,687 103 104.6 74 17,593 52 15.6 250 2.1 249 29,782 47 5,705 20 13,600 50 47.9%
135 124 129 227 HARJU ELEKTER AS* 632,675 37 72.6 234 21,687 45 51.6 191 4.7 225 27,139 76 1,400 139 29,349 31 47.9%
136 139 235 ERGO KINDLUSTUSE AS* 722,800 34 78.2 212 87,267 17 70.0 160 10.6 180 23,158 123 1,490 132 12,676 52 47.8%
137 QUATTROMED HTI LABORID OÜ 60,046 149 99.0 99 11,429 66 103.0 93 39.5 61 20,386 158 1,072 173 876 150 47.8%
138 ECOPRINT AS 30,696 196 104.3 76 1,198 179 100 109 22.2 112 21,334 146 903 204 304 47.7%
139 231 HEA TAVA OÜ 6,087 284 100.3 93 241 239 44.3 204 18.0 130 28,308 63 1,015 181 37 263 47.7%
140 214 METOS AS 124,689 95 79.3 197 10,215 70 77.0 149 21.9 115 26,937 79 1,685 111 380 192 47.7%
141 295 456 PÕLTSAMAA FELIX AS 255,996 59 85.2 168 4,790 104 173.8 52 4.4 227 15,889 215 1,515 127 4,433 84 47.7%
142 136 46 102 PALMSE MEHAANIKAKODA OÜ 120,932 96 79.0 200 14,020 59 79.3 145 28.2 88 25,558 92 3,779 41 476 179 47.6%
143 177 82 KULBERT AS 67,289 137 88.5 149 2,331 147 92.5 128 13.4 158 23,982 108 4,486 31 91 244 47.6%
144 221 265 HANSAB AS 80,328 126 73.1 233 2,253 148 76.2 150 6.7 203 29,272 55 1,607 118 923 146 47.6%
145 OÜ MARKILO 61,518 147 103.8 80 5,468 96 198.3 42 31.7 79 8,941 304 2,366 73 9,009 60 47.6%
146 176 7 AF-ESTIVO AS 64,566 142 87.6 153 47 262 8.0 262 1.2 258 33,939 30 3,587 43 32 266 47.6%
147 143 215 DPD EESTI AS 95,645 106 78.7 207 3,235 131 69.0 163 18.9 124 27,604 69 1,805 102 1,106 138 47.5%
148 102 343 ESTKO AS* 65,020 140 89.2 145 6,088 89 88.8 133 15.7 141 24,073 106 1,445 137 729 157 47.5%
149 187 228 369 PÕLVAMAA HOIU-LAENUÜHISTU TUÜ 2,448 308 99.5 96 10 269 8.2 261 0.3 264 32,580 36 816 222 308 47.5%
150 111 187 22 KPMG BALTICS OÜ* 159,143 83 90.6 138 -732 289 -11.6 293 34,341 29 773 229 292 206 47.4%
151 230 261 BCS ITERA AS* 20,287 225 74.5 227 822 200 34.7 221 16.6 138 32,475 37 751 234 122 235 47.4%
152 206 189 WENDRE AS* 1,014,423 23 99.7 95 52,149 25 60.3 177 12.1 169 14,118 241 1,546 123 60,674 22 47.3%
153 CREDITREFORM EESTI OÜ 7,358 276 133.4 39 1,125 183 105.5 91 48.7 44 12,139 278 307 306 447 183 47.2%
154 138 263 ISIS MEDICAL OÜ* 36,505 179 107.4 65 416 226 21.0 244 9.4 187 27,454 72 3,042 56 523 174 47.2%
155 216 109 222 NORDECON INFRA AS* 1,142,104 21 92.6 124 -11,132 314 -4.8 281 23,833 111 1,749 107 4,423 85 47.1%
156 161 344 INLOOK COLOR OÜ 30,998 194 100.4 92 720 210 21.1 243 2.3 245 29,112 57 1,292 150 440 185 47.1%
157 213 308 RAGN-SELLS AS 299,557 54 86.4 158 25,873 37 92.5 127 13.1 160 19,992 163 1,037 177 20,226 40 47.1%
158 303 B.I.A. OÜ* 3,209 298 105.4 70 83 255 39.2 211 17.3 133 25,564 91 401 294 15 273 47.1%
159 129 TNT EXPRESS WORLDWIDE EESTI AS 64,170 143 63.2 267 10,775 68 48.0 201 4.9 223 32,004 40 1,395 141 330 199 47.0%
160 172 126 197 KENTEK EESTI OÜ* 18,514 229 94.2 115 268 234 29.2 229 4.4 228 28,821 60 1,851 99 86 246 47.0%
161 285 AS KRISLING 21,170 220 80.5 190 552 216 121.2 78 10.1 185 21,318 147 756 233 309 47.0%
162 146 AS PRINTALL 355,125 50 84.0 175 35,183 32 70.1 159 14.1 151 22,335 139 1,776 104 1,923 115 47.0%
163 193 AS EESTI TURBATOOTED 39,051 176 90.0 140 5,645 94 105.7 90 30.5 82 19,224 175 1,627 117 434 187 46.9%
164 COCA-COLA HBC EESTI AS 545,799 41 75.3 222 2,440 145 8.5 260 0.9 259 29,091 58 2,394 71 13,904 48 46.9%
165 5 BLOOM OÜ 2,797 303 176.6 21 5 270 6.8 265 8.5 193 16,521 203 1,399 140 83 250 46.9%
166 3K&T RAAMATUPIDAMINE OÜ 1,902 311 94.0 117 252 236 57.6 184 45.6 50 22,919 129 476 286 318 46.9%
167 120 63 EVERDEAL EESTI AS 83,892 120 105.2 71 5,442 97 74.0 152 21.0 117 19,990 164 1,864 97 86 247 46.9%
168 312 330 278 SWIPE EESTI OÜ* 3,011 299 92.0 127 800 204 145.0 62 104.6 13 9,385 301 1,506 130 296 46.9%
169 119 236 PINTAVÄRI EESTI OÜ 14,005 251 58.4 283 1,528 172 77.5 148 19.4 121 28,169 65 2,334 76 6 277 46.8%
170 K.MET AS 23,035 212 69.0 247 304 229 197.0 43 2.3 246 15,319 226 490 281 459 182 46.8%
171 165 137 AS GLAMOX HE 235,156 63 86.9 156 25,041 38 67.5 166 16.9 135 22,177 140 2,119 83 3,141 98 46.8%
172 AS VILJANDI AKEN JA UKS 392,002 48 89.9 141 13,514 61 104.6 92 25.6 97 15,634 219 881 210 13,639 49 46.8%
173 45 AS G4S EESTI* 943,469 26 79.2 198 202,072 8 92.8 126 18.3 127 12,656 267 288 308 26,081 34 46.7%
174 271 45 41 NORDECON BETOON OÜ* 179,340 76 78.7 205 3,550 125 87.1 137 13.1 161 22,416 136 1,196 161 197 217 46.7%
175 26 BALTI EHITUSMASIN - BALTEM AS 148,831 90 56.0 289 -3,730 306 -4.2 279 36,045 24 4,510 30 6,889 75 46.7%
176 183 176 358 EXCELLENT GRUPP AS 31,503 192 67.6 255 5,904 90 51.1 193 12.9 165 27,346 73 10,501 10 24 268 46.7%
177 T-TAMMER OÜ 85,003 117 103.2 84 2,569 144 45.6 203 15.4 143 22,941 128 1,546 122 2,934 102 46.7%
12
Estonian Companies’ Competitiveness Ranking 2010
Sales Change Net profit Change Return Labour costs Efficiency per Investments %Enterprise in sales in net profit on equity per employee employee of the first*group th. EEK place % place th. EEK place % place % place EEK/month place th. EEK place th. EEK place (0...100)
Plac
e
2009
2008
2007
www.konkurents.ee 1 EUR = 15.6466 EEK; 1 EEK = 0.0639 EUR; based on 2009 data
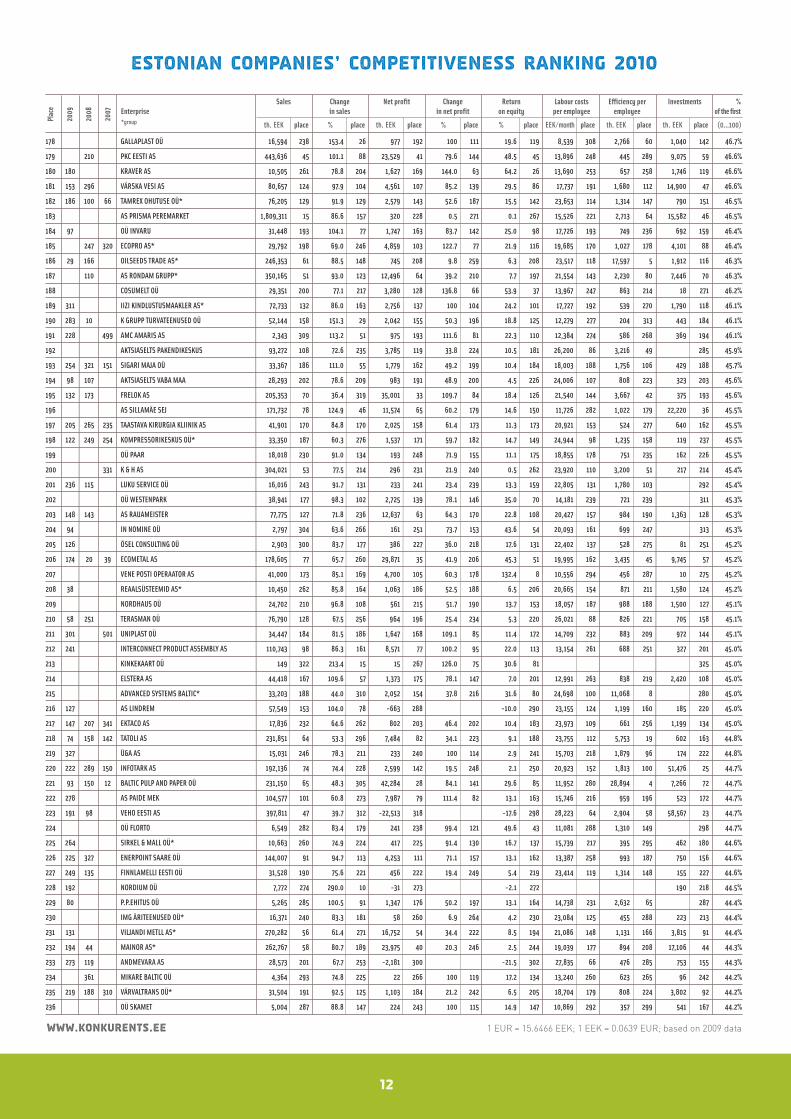
178 GALLAPLAST OÜ 16,594 238 153.4 26 977 192 100 111 19.6 119 8,539 308 2,766 60 1,040 142 46.7%
179 210 PKC EESTI AS 443,636 45 101.1 88 23,529 41 79.6 144 48.5 45 13,896 248 445 289 9,075 59 46.6%
180 180 KRAVER AS 10,505 261 78.8 204 1,627 169 144.0 63 64.2 26 13,690 253 657 258 1,746 119 46.6%
181 153 296 VÄRSKA VESI AS 80,657 124 97.9 104 4,561 107 85.2 139 29.5 86 17,737 191 1,680 112 14,900 47 46.6%
182 186 100 66 TAMREX OHUTUSE OÜ* 76,205 129 91.9 129 2,579 143 52.6 187 15.5 142 23,653 114 1,314 147 790 151 46.5%
183 AS PRISMA PEREMARKET 1,809,311 15 86.6 157 320 228 0.5 271 0.1 267 15,526 221 2,713 64 15,582 46 46.5%
184 97 OÜ INVARU 31,448 193 104.1 77 1,747 163 83.7 142 25.0 98 17,726 193 749 236 692 159 46.4%
185 247 320 ECOPRO AS* 29,792 198 69.0 246 4,859 103 122.7 77 21.9 116 19,685 170 1,027 178 4,101 88 46.4%
186 29 166 OILSEEDS TRADE AS* 246,353 61 88.5 148 745 208 9.8 259 6.3 208 23,517 118 17,597 5 1,912 116 46.3%
187 110 AS RONDAM GRUPP* 350,165 51 93.0 123 12,496 64 39.2 210 7.7 197 21,554 143 2,230 80 7,446 70 46.3%
188 COSUMELT OÜ 29,351 200 77.1 217 3,280 128 136.8 66 53.9 37 13,967 247 863 214 18 271 46.2%
189 311 IIZI KINDLUSTUSMAAKLER AS* 72,733 132 86.0 163 2,756 137 100 104 24.2 101 17,727 192 539 270 1,790 118 46.1%
190 283 10 K GRUPP TURVATEENUSED OÜ 52,144 158 151.3 29 2,042 155 50.3 196 18.8 125 12,279 277 204 313 443 184 46.1%
191 228 499 AMC AMARIS AS 2,343 309 113.2 51 975 193 111.6 81 22.3 110 12,384 274 586 268 369 194 46.1%
192 AKTSIASELTS PAKENDIKESKUS 93,272 108 72.6 235 3,785 119 33.8 224 10.5 181 26,200 86 3,216 49 285 45.9%
193 254 321 151 SIGARI MAJA OÜ 33,367 186 111.0 55 1,779 162 49.2 199 10.4 184 18,003 188 1,756 106 429 188 45.7%
194 98 107 AKTSIASELTS VABA MAA 28,293 202 78.6 209 983 191 48.9 200 4.5 226 24,006 107 808 223 323 203 45.6%
195 132 173 FRELOK AS 205,353 70 36.4 319 35,001 33 109.7 84 18.4 126 21,540 144 3,667 42 375 193 45.6%
196 AS SILLAMÄE SEJ 171,732 78 124.9 46 11,574 65 60.2 179 14.6 150 11,726 282 1,022 179 22,220 36 45.5%
197 205 265 235 TAASTAVA KIRURGIA KLIINIK AS 41,901 170 84.8 170 2,025 158 61.4 173 11.3 173 20,921 153 524 277 640 162 45.5%
198 122 249 254 KOMPRESSORIKESKUS OÜ* 33,350 187 60.3 276 1,537 171 59.7 182 14.7 149 24,944 98 1,235 158 119 237 45.5%
199 OÜ PAAR 18,018 230 91.0 134 193 248 71.9 155 11.1 175 18,855 178 751 235 162 226 45.5%
200 331 K & H AS 304,021 53 77.5 214 296 231 21.9 240 0.5 262 23,920 110 3,200 51 217 214 45.4%
201 236 115 LUKU SERVICE OÜ 16,016 243 91.7 131 233 241 23.4 239 13.3 159 22,805 131 1,780 103 292 45.4%
202 OÜ WESTENPARK 38,941 177 98.3 102 2,725 139 78.1 146 35.0 70 14,181 239 721 239 311 45.3%
203 148 143 AS RAUAMEISTER 77,775 127 71.8 236 12,637 63 64.3 170 22.8 108 20,427 157 984 190 1,363 128 45.3%
204 94 IN NOMINE OÜ 2,797 304 63.6 266 161 251 73.7 153 43.6 54 20,093 161 699 247 313 45.3%
205 126 ÖSEL CONSULTING OÜ 2,903 300 83.7 177 386 227 36.0 218 17.6 131 22,402 137 528 275 81 251 45.2%
206 174 20 39 ECOMETAL AS 178,605 77 65.7 260 29,871 35 41.9 206 45.3 51 19,995 162 3,435 45 9,745 57 45.2%
207 VENE POSTI OPERAATOR AS 41,000 173 85.1 169 4,700 105 60.3 178 132.4 8 10,556 294 456 287 10 275 45.2%
208 38 REAALSÜSTEEMID AS* 10,450 262 85.8 164 1,063 186 52.5 188 6.5 206 20,665 154 871 211 1,580 124 45.2%
209 NORDHAUS OÜ 24,702 210 96.8 108 561 215 51.7 190 13.7 153 18,057 187 988 188 1,500 127 45.1%
210 58 251 TERASMAN OÜ 76,790 128 67.5 256 964 196 25.4 234 5.3 220 26,021 88 826 221 705 158 45.1%
211 301 501 UNIPLAST OÜ 34,447 184 81.5 186 1,647 168 109.1 85 11.4 172 14,709 232 883 209 972 144 45.1%
212 241 INTERCONNECT PRODUCT ASSEMBLY AS 110,743 98 86.3 161 8,571 77 100.2 95 22.0 113 13,154 261 688 251 327 201 45.0%
213 KINKEKAART OÜ 149 322 213.4 15 15 267 126.0 75 30.6 81 325 45.0%
214 ELSTERA AS 44,418 167 109.6 57 1,373 175 78.1 147 7.0 201 12,991 263 838 219 2,420 108 45.0%
215 ADVANCED SYSTEMS BALTIC* 33,203 188 44.0 310 2,052 154 37.8 216 31.6 80 24,698 100 11,068 8 280 45.0%
216 127 AS LINDREM 57,549 153 104.0 78 -663 288 -10.0 290 23,155 124 1,199 160 185 220 45.0%
217 147 207 341 EKTACO AS 17,836 232 64.6 262 802 203 46.4 202 10.4 183 23,973 109 661 256 1,199 134 45.0%
218 74 158 142 TATOLI AS 231,851 64 53.3 296 7,484 82 34.1 223 9.1 188 23,755 112 5,753 19 602 163 44.8%
219 327 Ü&A AS 15,031 246 78.3 211 233 240 100 114 2.9 241 15,703 218 1,879 96 174 222 44.8%
220 222 289 150 INFOTARK AS 192,136 74 74.4 228 2,599 142 19.5 248 2.1 250 20,923 152 1,813 100 51,476 25 44.7%
221 93 150 12 BALTIC PULP AND PAPER OÜ 231,150 65 48.3 305 42,284 28 84.1 141 29.6 85 11,952 280 28,894 4 7,266 72 44.7%
222 278 AS PAIDE MEK 104,577 101 60.8 273 7,987 79 111.4 82 13.1 163 15,746 216 959 196 523 172 44.7%
223 191 98 VEHO EESTI AS 397,811 47 39.7 312 -22,513 318 -17.6 298 28,223 64 2,904 58 58,567 23 44.7%
224 OÜ FLORTO 6,549 282 83.4 179 241 238 99.4 121 49.6 43 11,081 288 1,310 149 298 44.7%
225 264 SIRKEL & MALL OÜ* 10,663 260 74.9 224 417 225 91.4 130 16.7 137 15,739 217 395 295 462 180 44.6%
226 225 327 ENERPOINT SAARE OÜ 144,007 91 94.7 113 4,253 111 71.1 157 13.1 162 13,387 258 993 187 750 156 44.6%
227 249 135 FINNLAMELLI EESTI OÜ 31,528 190 75.6 221 456 222 19.4 249 5.4 219 23,414 119 1,314 148 155 227 44.6%
228 192 NORDIUM OÜ 7,772 274 290.0 10 -31 273 -2.1 272 190 218 44.5%
229 80 P.P.EHITUS OÜ 5,265 285 100.5 91 1,347 176 50.2 197 13.1 164 14,738 231 2,632 65 287 44.4%
230 IMG ÄRITEENUSED OÜ* 16,371 240 83.3 181 58 260 6.9 264 4.2 230 23,084 125 455 288 223 213 44.4%
231 131 VILJANDI METLL AS* 270,282 56 61.4 271 16,752 54 34.4 222 8.5 194 21,086 148 1,131 166 3,815 91 44.4%
232 194 44 MAINOR AS* 262,767 58 80.7 189 23,975 40 20.3 246 2.5 244 19,039 177 894 208 17,106 44 44.3%
233 273 119 ANDMEVARA AS 28,573 201 67.7 253 -2,181 300 -21.5 302 27,835 66 476 285 753 155 44.3%
234 361 MIKARE BALTIC OÜ 4,364 293 74.8 225 22 266 100 119 17.2 134 13,240 260 623 265 96 242 44.2%
235 219 188 310 VÄRVALTRANS OÜ* 31,504 191 92.5 125 1,103 184 21.2 242 6.5 205 18,704 179 808 224 3,802 92 44.2%
236 OÜ SKAMET 5,004 287 88.8 147 224 243 100 115 14.9 147 10,869 292 357 299 541 167 44.2%
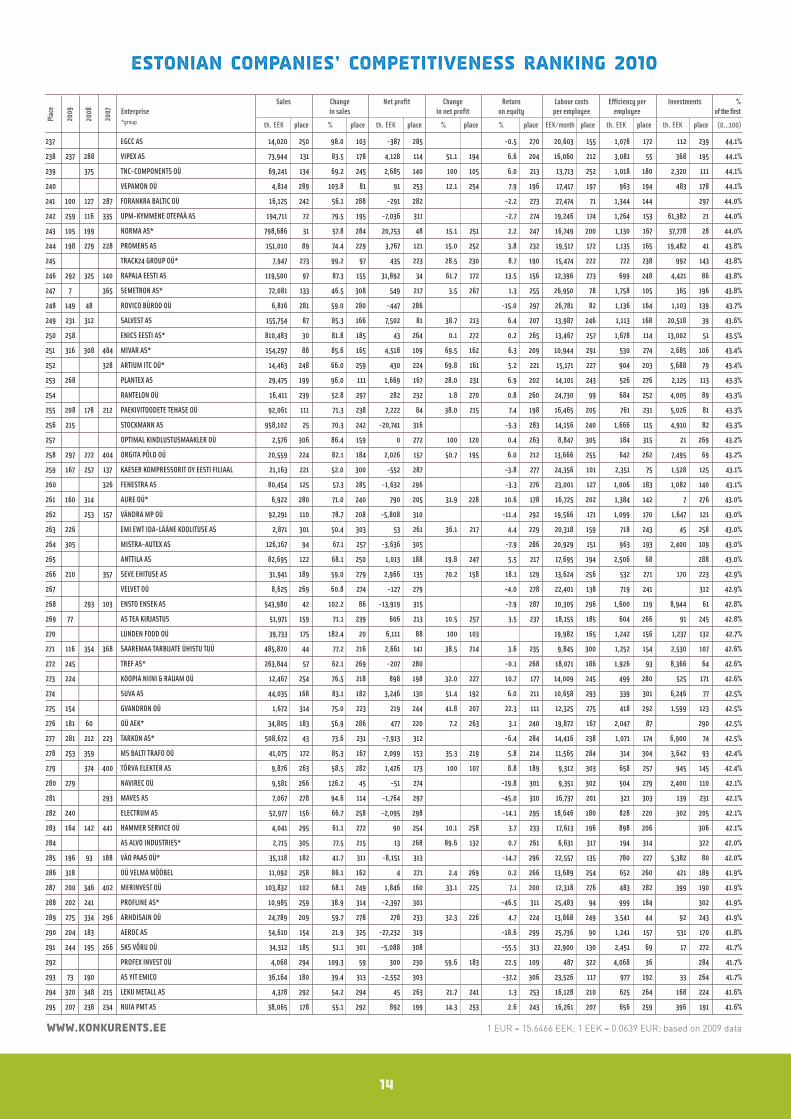
14
Estonian Companies’ Competitiveness Ranking 2010
Sales Change Net profit Change Return Labour costs Efficiency per Investments %Enterprise in sales in net profit on equity per employee employee of the first*group th. EEK place % place th. EEK place % place % place EEK/month place th. EEK place th. EEK place (0...100)
Plac
e
2009
2008
2007
www.konkurents.ee 1 EUR = 15.6466 EEK; 1 EEK = 0.0639 EUR; based on 2009 data
237 EGCC AS 14,020 250 98.0 103 -387 285 -0.5 270 20,603 155 1,078 172 112 239 44.1%
238 237 288 VIPEX AS 73,944 131 83.5 178 4,128 114 51.1 194 6.6 204 16,060 212 3,081 55 368 195 44.1%
239 375 TNC-COMPONENTS OÜ 69,241 134 69.2 245 2,685 140 100 105 6.0 213 13,713 252 1,018 180 2,320 111 44.1%
240 VEPAMON OÜ 4,814 289 103.8 81 91 253 12.1 254 7.9 196 17,417 197 963 194 483 178 44.1%
241 100 127 287 FORANKRA BALTIC OÜ 16,125 242 56.1 288 -291 282 -2.2 273 27,474 71 1,344 144 297 44.0%
242 259 116 335 UPM-KYMMENE OTEPÄÄ AS 194,711 72 79.5 195 -7,036 311 -2.7 274 19,246 174 1,264 153 61,382 21 44.0%
243 105 199 NORMA AS* 798,686 31 57.8 284 20,753 48 15.1 251 2.2 247 16,749 200 1,130 167 37,778 28 44.0%
244 198 279 228 PROMENS AS 151,010 89 74.4 229 3,767 121 15.0 252 3.8 232 19,517 172 1,135 165 19,482 41 43.8%
245 TRACK24 GROUP OÜ* 7,947 273 99.2 97 435 223 28.5 230 8.7 190 15,474 222 722 238 992 143 43.8%
246 292 325 140 RAPALA EESTI AS 119,500 97 87.3 155 31,892 34 61.7 172 13.5 156 12,396 273 699 248 4,421 86 43.8%
247 7 365 SEMETRON AS* 72,081 133 46.5 308 549 217 3.5 267 1.3 255 26,950 78 1,758 105 365 196 43.8%
248 149 48 ROVICO BÜROO OÜ 6,816 281 59.0 280 -447 286 -15.0 297 26,781 82 1,136 164 1,103 139 43.7%
249 231 312 SALVEST AS 155,754 87 85.3 166 7,502 81 38.7 213 6.4 207 13,987 246 1,113 168 20,518 39 43.6%
250 258 ENICS EESTI AS* 810,483 30 81.8 185 43 264 0.1 272 0.2 265 13,467 257 1,678 114 13,002 51 43.5%
251 316 308 484 MIVAR AS* 154,297 88 85.6 165 4,518 109 69.5 162 6.3 209 10,944 291 530 274 2,685 106 43.4%
252 328 ARTIUM ITC OÜ* 14,463 248 66.0 259 430 224 69.8 161 5.2 221 15,171 227 904 203 5,688 79 43.4%
253 268 PLANTEX AS 29,475 199 96.0 111 1,669 167 28.0 231 6.9 202 14,101 243 526 276 2,125 113 43.3%
254 RANTELON OÜ 16,411 239 52.8 297 282 232 1.8 270 0.8 260 24,730 99 684 252 4,005 89 43.3%
255 208 178 212 PAEKIVITOODETE TEHASE OÜ 92,061 111 71.3 238 7,222 84 38.0 215 7.4 198 16,465 205 761 231 5,026 81 43.3%
256 215 STOCKMANN AS 958,102 25 70.3 242 -20,741 316 -5.3 283 14,156 240 1,666 115 4,910 82 43.3%
257 OPTIMAL KINDLUSTUSMAAKLER OÜ 2,576 306 86.4 159 0 272 100 120 0.4 263 8,847 305 184 315 21 269 43.2%
258 297 272 404 ORGITA PÕLD OÜ 20,559 224 82.1 184 2,026 157 50.7 195 6.0 212 13,666 255 642 262 7,495 69 43.2%
259 167 257 137 KAESER KOMPRESSORIT OY EESTI FILIAAL 21,163 221 52.0 300 -552 287 -3.8 277 24,356 101 2,351 75 1,528 125 43.1%
260 326 FENESTRA AS 80,454 125 57.3 285 -1,632 296 -3.3 276 23,001 127 1,006 183 1,082 140 43.1%
261 160 314 AURE OÜ* 6,922 280 71.0 240 790 205 31.9 228 10.6 178 16,725 202 1,384 142 7 276 43.0%
262 253 157 VÄNDRA MP OÜ 92,291 110 78.7 208 -5,808 310 -11.4 292 19,566 171 1,099 170 1,647 121 43.0%
263 226 EMI EWT IDA-LÄÄNE KOOLITUSE AS 2,871 301 50.4 303 53 261 36.1 217 4.4 229 20,318 159 718 243 45 258 43.0%
264 305 MISTRA-AUTEX AS 126,167 94 67.1 257 -3,636 305 -7.9 286 20,929 151 963 193 2,400 109 43.0%
265 ANTTILA AS 82,695 122 68.1 250 1,013 188 19.8 247 5.5 217 17,695 194 2,506 68 288 43.0%
266 210 357 SEVE EHITUSE AS 31,941 189 59.0 279 2,966 135 70.2 158 18.1 129 13,624 256 532 271 170 223 42.9%
267 VELVET OÜ 8,625 269 60.8 274 -127 279 -4.0 278 22,401 138 719 241 312 42.9%
268 293 103 ENSTO ENSEK AS 543,980 42 102.2 86 -13,919 315 -7.9 287 10,305 296 1,600 119 8,944 61 42.8%
269 77 AS TEA KIRJASTUS 51,971 159 71.1 239 606 213 10.5 257 3.5 237 18,155 185 604 266 91 245 42.8%
270 LUNDEN FOOD OÜ 39,733 175 182.4 20 6,111 88 100 103 19,982 165 1,242 156 1,237 132 42.7%
271 116 354 368 SAAREMAA TARBIJATE ÜHISTU TUÜ 485,820 44 77.2 216 2,661 141 38.5 214 3.6 235 9,845 300 1,252 154 2,530 107 42.6%
272 245 TREF AS* 263,844 57 62.1 269 -207 280 -0.1 268 18,071 186 1,926 93 8,366 64 42.6%
273 224 KOOPIA NIINI & RAUAM OÜ 12,467 254 76.5 218 898 198 32.0 227 10.7 177 14,009 245 499 280 525 171 42.6%
274 SUVA AS 44,035 168 83.1 182 3,246 130 51.4 192 6.0 211 10,658 293 339 301 6,246 77 42.5%
275 154 GVANDRON OÜ 1,672 314 75.0 223 219 244 41.8 207 22.3 111 12,325 275 418 292 1,599 123 42.5%
276 181 60 OÜ AEK* 34,805 183 56.9 286 477 220 7.2 263 3.1 240 19,872 167 2,047 87 290 42.5%
277 281 212 223 TARKON AS* 508,672 43 73.6 231 -7,913 312 -6.4 284 14,416 238 1,071 174 6,900 74 42.5%
278 253 359 MS BALTI TRAFO OÜ 41,075 172 85.3 167 2,099 153 35.3 219 5.8 214 11,565 284 314 304 3,642 93 42.4%
279 374 400 TÕRVA ELEKTER AS 9,876 263 58.5 282 1,426 173 100 107 8.8 189 9,312 303 658 257 945 145 42.4%
280 279 NAVIREC OÜ 9,581 266 126.2 45 -51 274 -19.8 301 9,351 302 504 279 2,400 110 42.1%
281 293 MAVES AS 7,067 278 94.6 114 -1,764 297 -45.0 310 16,737 201 321 303 139 231 42.1%
282 240 ELECTRUM AS 52,977 156 66.7 258 -2,095 298 -14.1 295 18,646 180 828 220 302 205 42.1%
283 164 142 441 HAMMER SERVICE OÜ 4,041 295 61.1 272 90 254 10.1 258 3.7 233 17,613 196 898 206 306 42.1%
284 AS ALVO INDUSTRIES* 2,715 305 77.5 215 13 268 89.6 132 0.7 261 6,631 317 194 314 322 42.0%
285 196 93 188 VÄO PAAS OÜ* 35,118 182 41.7 311 -8,151 313 -14.7 296 22,557 135 780 227 5,382 80 42.0%
286 318 OÜ VELMA MÖÖBEL 11,092 258 86.1 162 4 271 2.4 269 0.2 266 13,689 254 652 260 421 189 41.9%
287 200 346 402 MERINVEST OÜ 103,832 102 68.1 249 1,846 160 33.1 225 7.1 200 12,318 276 483 282 399 190 41.9%
288 202 241 PROFLINE AS* 10,985 259 38.9 314 -2,397 301 -46.5 311 25,483 94 999 184 302 41.9%
289 275 334 296 ARHDISAIN OÜ 24,789 209 59.7 278 278 233 32.3 226 4.7 224 13,868 249 3,541 44 92 243 41.9%
290 204 183 AEROC AS 54,610 154 21.9 325 -27,232 319 -18.6 299 25,736 90 1,241 157 531 170 41.8%
291 244 195 266 SKS VÕRU OÜ 34,312 185 51.1 301 -5,088 308 -55.5 313 22,900 130 2,451 69 17 272 41.7%
292 PROFEX INVEST OÜ 4,068 294 109.3 59 300 230 59.6 183 22.5 109 487 322 4,068 36 284 41.7%
293 73 190 AS YIT EMICO 36,164 180 39.4 313 -2,552 303 -37.2 306 23,526 117 977 192 33 264 41.7%
294 320 348 215 LEKU METALL AS 4,378 292 54.2 294 45 263 21.7 241 1.3 253 16,128 210 625 264 168 224 41.6%
295 207 238 234 NUIA PMT AS 38,065 178 55.1 292 892 199 14.3 253 2.6 243 16,261 207 656 259 396 191 41.6%
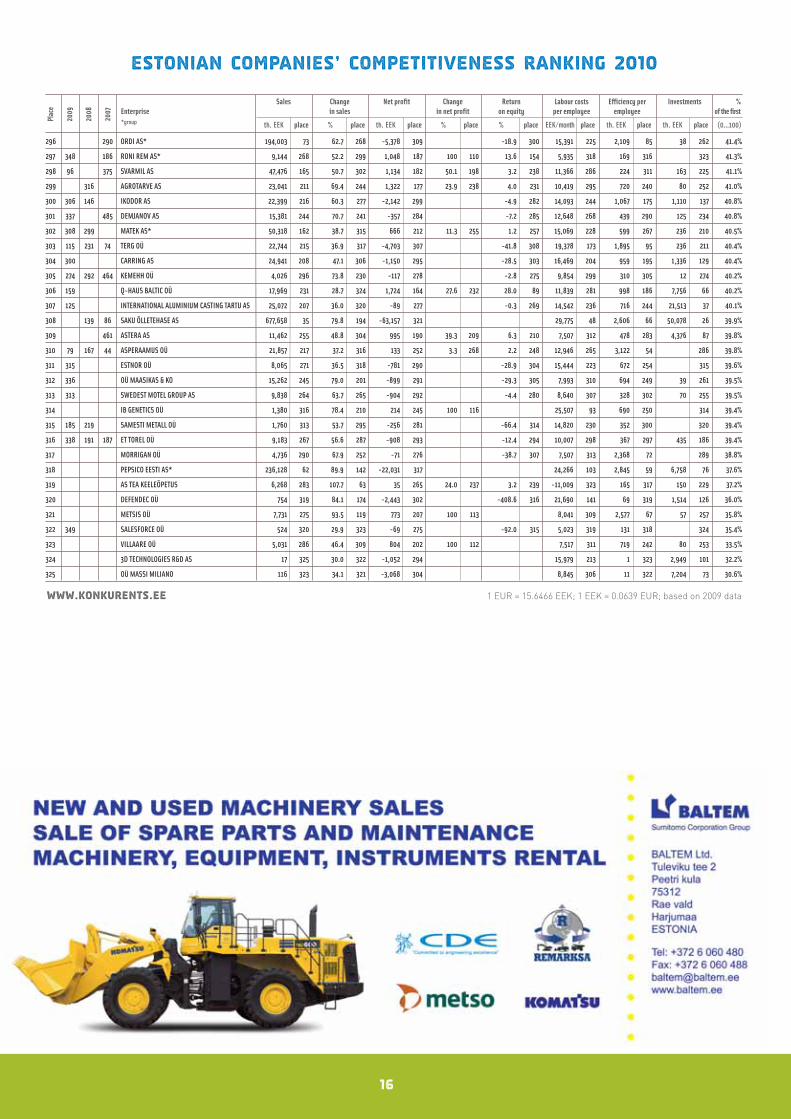
16
Estonian Companies’ Competitiveness Ranking 2010
Sales Change Net profit Change Return Labour costs Efficiency per Investments %Enterprise in sales in net profit on equity per employee employee of the first*group th. EEK place % place th. EEK place % place % place EEK/month place th. EEK place th. EEK place (0...100)
Plac
e
2009
2008
2007
www.konkurents.ee 1 EUR = 15.6466 EEK; 1 EEK = 0.0639 EUR; based on 2009 data
296 290 ORDI AS* 194,003 73 62.7 268 -5,378 309 -18.9 300 15,391 225 2,109 85 38 262 41.4%
297 348 186 RONI REM AS* 9,144 268 52.2 299 1,048 187 100 110 13.6 154 5,935 318 169 316 323 41.3%
298 96 375 SVARMIL AS 47,476 165 50.7 302 1,134 182 50.1 198 3.2 238 11,366 286 224 311 163 225 41.1%
299 316 AGROTARVE AS 23,041 211 69.4 244 1,322 177 23.9 238 4.0 231 10,419 295 720 240 80 252 41.0%
300 306 146 IKODOR AS 22,399 216 60.3 277 -2,142 299 -4.9 282 14,093 244 1,067 175 1,110 137 40.8%
301 337 485 DEMJANOV AS 15,381 244 70.7 241 -357 284 -7.2 285 12,648 268 439 290 125 234 40.8%
302 308 299 MATEK AS* 50,318 162 38.7 315 666 212 11.3 255 1.2 257 15,069 228 599 267 236 210 40.5%
303 115 231 74 TERG OÜ 22,744 215 36.9 317 -4,703 307 -41.8 308 19,378 173 1,895 95 236 211 40.4%
304 300 CARRING AS 24,941 208 47.1 306 -1,150 295 -28.5 303 16,469 204 959 195 1,336 129 40.4%
305 274 292 464 KEMEHH OÜ 4,026 296 73.8 230 -117 278 -2.8 275 9,854 299 310 305 12 274 40.2%
306 159 Q-HAUS BALTIC OÜ 17,969 231 28.7 324 1,724 164 27.6 232 28.0 89 11,839 281 998 186 7,756 66 40.2%
307 125 INTERNATIONAL ALUMINIUM CASTING TARTU AS 25,072 207 36.0 320 -89 277 -0.3 269 14,542 236 716 244 21,513 37 40.1%
308 139 86 SAKU ÕLLETEHASE AS 677,658 35 79.8 194 -63,157 321 29,775 48 2,606 66 50,078 26 39.9%
309 461 ASTERA AS 11,462 255 48.8 304 995 190 39.3 209 6.3 210 7,507 312 478 283 4,376 87 39.8%
310 79 167 44 ASPERAAMUS OÜ 21,857 217 37.2 316 133 252 3.3 268 2.2 248 12,946 265 3,122 54 286 39.8%
311 315 ESTNOR OÜ 8,065 271 36.5 318 -781 290 -28.9 304 15,444 223 672 254 315 39.6%
312 336 OÜ MAASIKAS & KO 15,262 245 79.0 201 -899 291 -29.3 305 7,993 310 694 249 39 261 39.5%
313 313 SWEDEST MOTEL GROUP AS 9,838 264 63.7 265 -904 292 -4.4 280 8,640 307 328 302 70 255 39.5%
314 IB GENETICS OÜ 1,380 316 78.4 210 214 245 100 116 25,507 93 690 250 314 39.4%
315 185 219 SAMESTI METALL OÜ 1,760 313 53.7 295 -256 281 -66.4 314 14,820 230 352 300 320 39.4%
316 338 191 187 ET TOREL OÜ 9,183 267 56.6 287 -908 293 -12.4 294 10,007 298 367 297 435 186 39.4%
317 MORRIGAN OÜ 4,736 290 67.9 252 -71 276 -38.7 307 7,507 313 2,368 72 289 38.8%
318 PEPSICO EESTI AS* 236,128 62 89.9 142 -22,031 317 24,266 103 2,845 59 6,758 76 37.6%
319 AS TEA KEELEÕPETUS 6,268 283 107.7 63 35 265 24.0 237 3.2 239 -11,009 323 165 317 150 229 37.2%
320 DEFENDEC OÜ 754 319 84.1 174 -2,443 302 -408.6 316 21,690 141 69 319 1,514 126 36.0%
321 METSIS OÜ 7,731 275 93.5 119 773 207 100 113 8,041 309 2,577 67 57 257 35.8%
322 349 SALESFORCE OÜ 524 320 29.9 323 -69 275 -92.0 315 5,023 319 131 318 324 35.4%
323 VILLAARE OÜ 5,031 286 46.4 309 804 202 100 112 7,517 311 719 242 80 253 33.5%
324 3D TECHNOLOGIES R&D AS 17 325 30.0 322 -1,052 294 15,979 213 1 323 2,949 101 32.2%
325 OÜ MASSI MILIANO 116 323 34.1 321 -3,068 304 8,845 306 11 322 7,204 73 30.6%
Competitiveness Ranking 2010
The Most Competitive Enterprise
2010
Tallink grupp
18
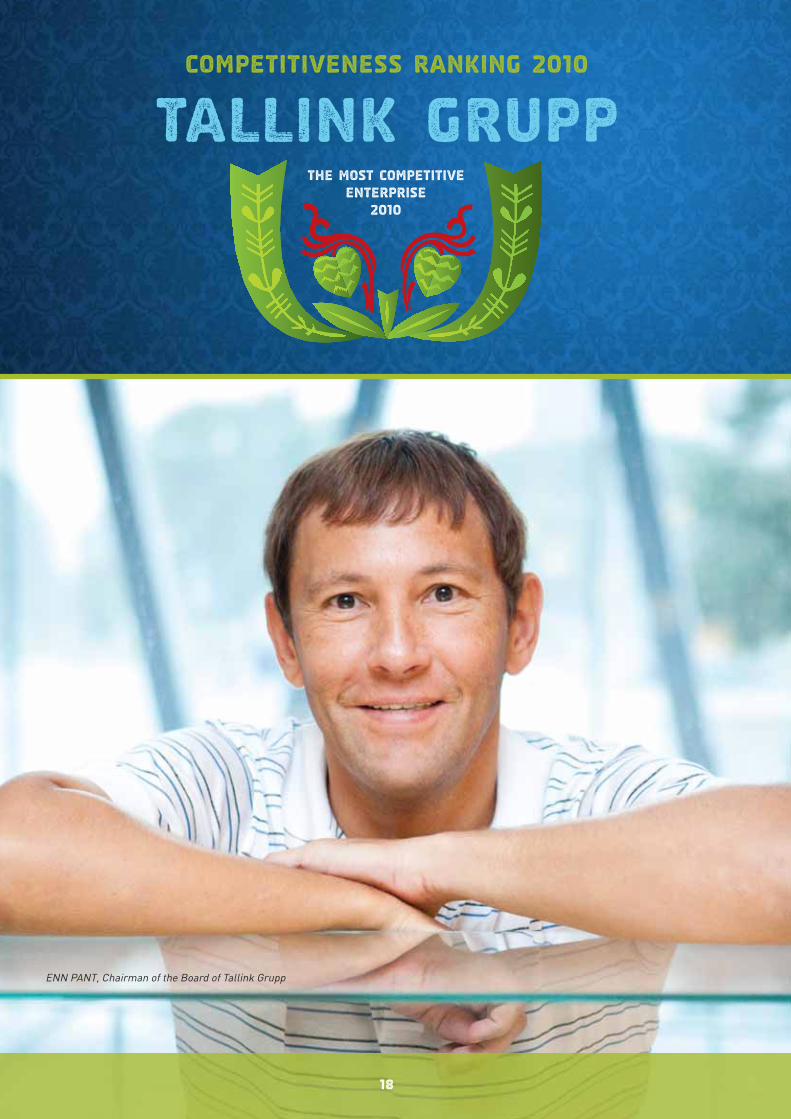
ENN PANT, Chairman of the Board of Tallink Grupp
When I came to Tallink, the company hadtwo small, old ferries – Georg Ots andMeloodia, and even those were rented. Wefaced a dilemma: whether to wind up busi-ness or start acquiring new ferries in orderto remain competitive. At the time, manylaughed at it, but by now no old ferries areleft on any line. There was a lot of disputeback then, but my opinion that we needednew ferries prevailed.
Even though there are always certain risks,a leader has to have the willingness to un-derstand and consider things fully.
The renovation process of Tallink has beencompleted successfully, now the time ofearning the money back is about to arrive.Our situation should be improving with everypassing year. In July, 1.1 million people trav-elled on our ferries; that is the all-timerecord.
I personally still have a lot to do in the com-pany, so there is no time or desire to stepaside right now. It will take another tenyears to pay back the bank loans, each yearwe pay about 100 million euros to banks.Euros, not kroons. Plus interests.
And thanks to the fact that we no longerhave to think of any new lines, we are able tofocus more on service quality.
I absolutely do not agree that Tallink hasbeen in a crisis over recent years. It wassimply an unpleasant fact that by the begin-ning of the economic recession, our loanburden had reached its peak. Naturally, wehad to adjust our plans and defer as manyexpenses as possible. As well as make cut-
backs where possible. First of all, the man-agement went after their own salaries, afterwhich everybody’s salaries, except for thoseof seamen, were reduced by 5–20%.
In every normal company – as well as stateagency – cutbacks may and can be done inhard times. That, however, means balanc-ing the conscious and the perceptual. If thebelt is tightened too much, it starts to hurt.And if the person begins to cry too much, ithas to be loosened a bit. You can never knowhow much you can tighten the belt, it is amatter of trial and error.
In Tallink, there are a lot of professionalleaders on the sea as well as land whom Itrust very much, because one person can-not know everything about everything. At thesame time, I have reserved the final say formyself in strategic matters.
The ability to delegate and at the same timecontrol things is very important.
Back when we had two ferries, I even knewthe names and stories of the wait-staff; astime passed, I had less and less time to getto know things thoroughly. At first, it scaredme, I wondered if I had reached the finalstage of incompetence and it was time forme to leave. Then I realised that one personwas indeed unable to do and manage every-thing.
It is important to have the team run thingsby themselves. In the past, I often had topush and convince someone, but now I havenot had the need to do that for quite sometime already. The team is increasingly start-ing to pull me along instead •
19
Enn Pant:
There is still a lot for me to do in Tallink
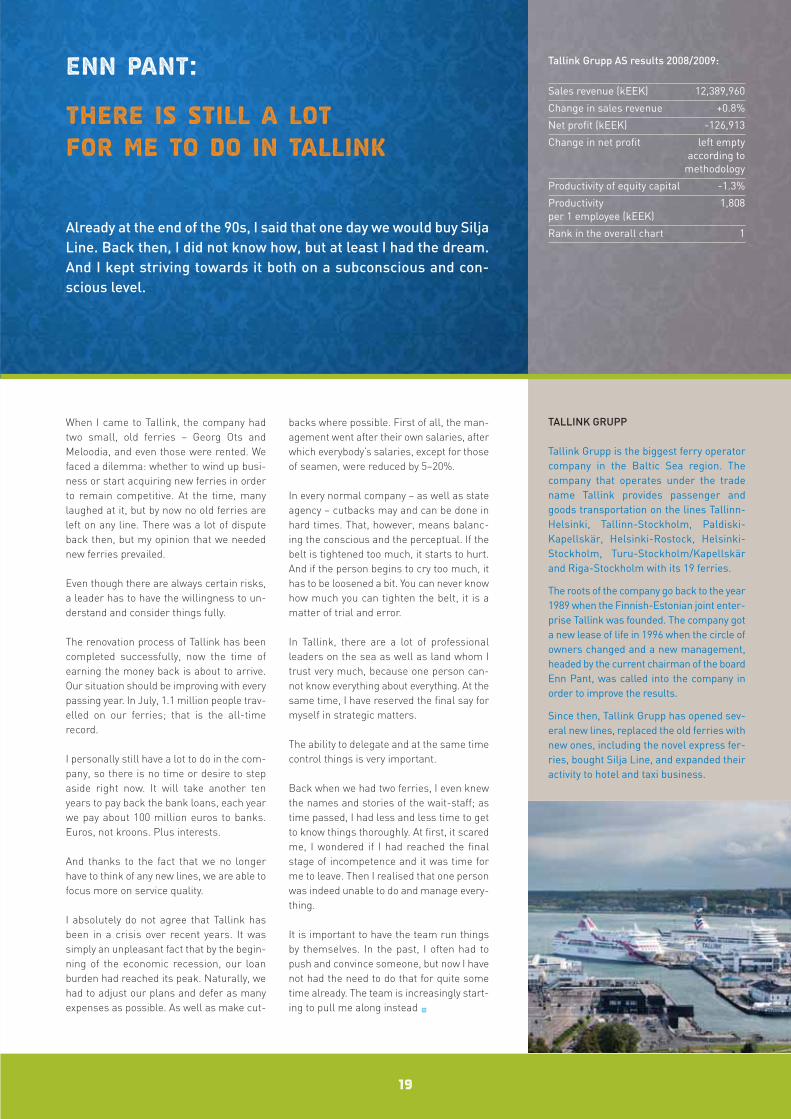
TALLINK GRUPP
Tallink Grupp is the biggest ferry operatorcompany in the Baltic Sea region. Thecom pany that operates under the tradename Tallink provides passenger andgoods transportation on the lines Tallinn-Helsinki, Tallinn-Stockholm, Paldiski-Kapellskär, Helsinki-Rostock, Helsinki-Stockholm, Turu-Stockholm/Kapellskärand Riga-Stockholm with its 19 ferries.
The roots of the company go back to the year1989 when the Finnish-Estonian joint enter-prise Tallink was founded. The company gota new lease of life in 1996 when the circle ofowners changed and a new management,headed by the current chairman of the boardEnn Pant, was called into the company inorder to improve the results.
Since then, Tallink Grupp has opened sev-eral new lines, replaced the old ferries withnew ones, including the novel express fer-ries, bought Silja Line, and expanded theiractivity to hotel and taxi business.
Tallink Grupp AS results 2008/2009:
Sales revenue (kEEK) 12,389,960
Change in sales revenue +0.8%
Net profit (kEEK) -126,913
Change in net profit left empty according to
methodology
Productivity of equity capital -1.3%
Productivity 1,808per 1 employee (kEEK)
Rank in the overall chart 1Already at the end of the 90s, I said that one day we would buy SiljaLine. Back then, I did not know how, but at least I had the dream.And I kept striving towards it both on a subconscious and con-scious level.
Competitiveness Ranking 2010
The Most Competitive Small and Medium-sized
Enterprise 2010
Rentest
20
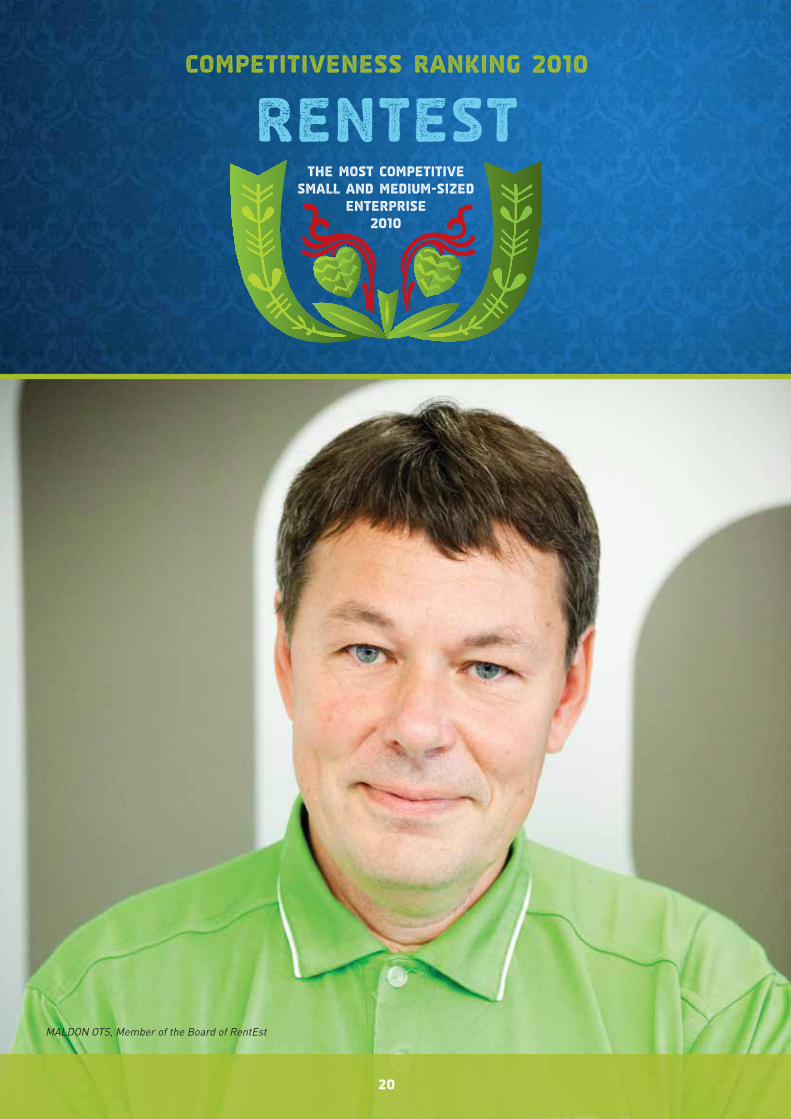
MALDON OTS, Member of the Board of RentEst
Our efficiency has increased and we havemanaged to keep our profit on the level of2009. We also recently expanded our busi-ness to Latvia and Lithuania by creatingsubsidiaries there. It is interesting to notethat our clients in both countries are thesame as in Estonia, but they want to use ourservice in all of the Baltic States. To me, thatis a sign of quality, of the fact that the clientsappreciate our efforts and want to use ourservices also outside of Estonia.
Actually, our company has been doing oneand the same kind of work for a long time,and I believe that this is exactly what hashelped us progress throughout the years.When you do something for a long time andwith at least some dedication, you gain ex-
perience that you can lean on in order tomove forward. I cannot see any other spe-cial trick or secret behind our survival.
We try to always find solutions to the prob-lems of our current as well as potentialclients, be very flexible and help them asmuch as possible. Clients recommend usbecause of the good service, and that gen-erates new contacts.
Thanks to the temporary weakening of com-petition in our sector, we gained new op-portunities and were smart enough to usethem as effectively as possible to our ad-vantage. We also narrowed down our targetgroup and started with active targeted salesto international big clients •
21
Maldon Ots:
It is good to move forwardwith experience to lean on
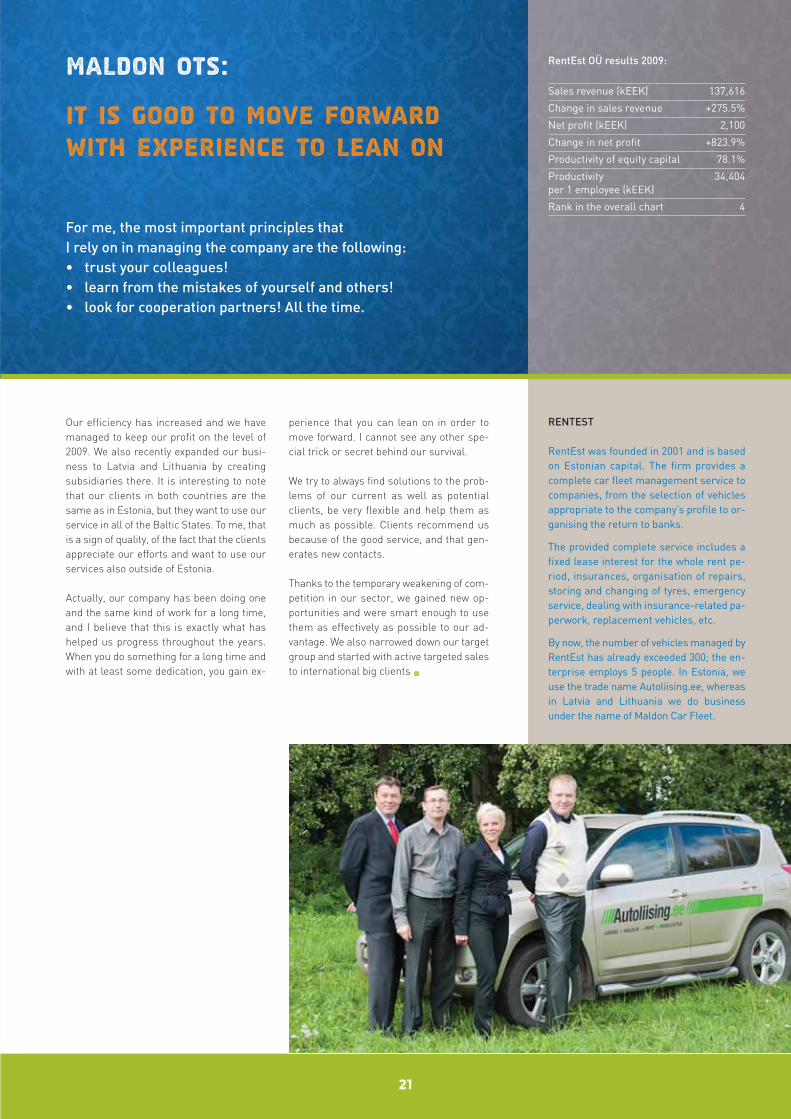
RENTEST
RentEst was founded in 2001 and is basedon Estonian capital. The firm provides acomplete car fleet management service tocompanies, from the selection of vehiclesappropriate to the company’s profile to or-ganising the return to banks.
The provided complete service includes afixed lease interest for the whole rent pe-riod, insurances, organisation of repairs,storing and changing of tyres, emergencyservice, dealing with insurance-related pa-perwork, replacement vehicles, etc.
By now, the number of vehicles managed byRentEst has already exceeded 300; the en-terprise employs 5 people. In Estonia, weuse the trade name Autoliising.ee, whereasin Latvia and Lithuania we do businessunder the name of Maldon Car Fleet.
RentEst OÜ results 2009:
Sales revenue (kEEK) 137,616
Change in sales revenue +275.5%
Net profit (kEEK) 2,100
Change in net profit +823.9%
Productivity of equity capital 78.1%
Productivity 34,404per 1 employee (kEEK)
Rank in the overall chart 4
For me, the most important principles that I rely on in managing the company are the following:• trust your colleagues!• learn from the mistakes of yourself and others! • look for cooperation partners! All the time.
23
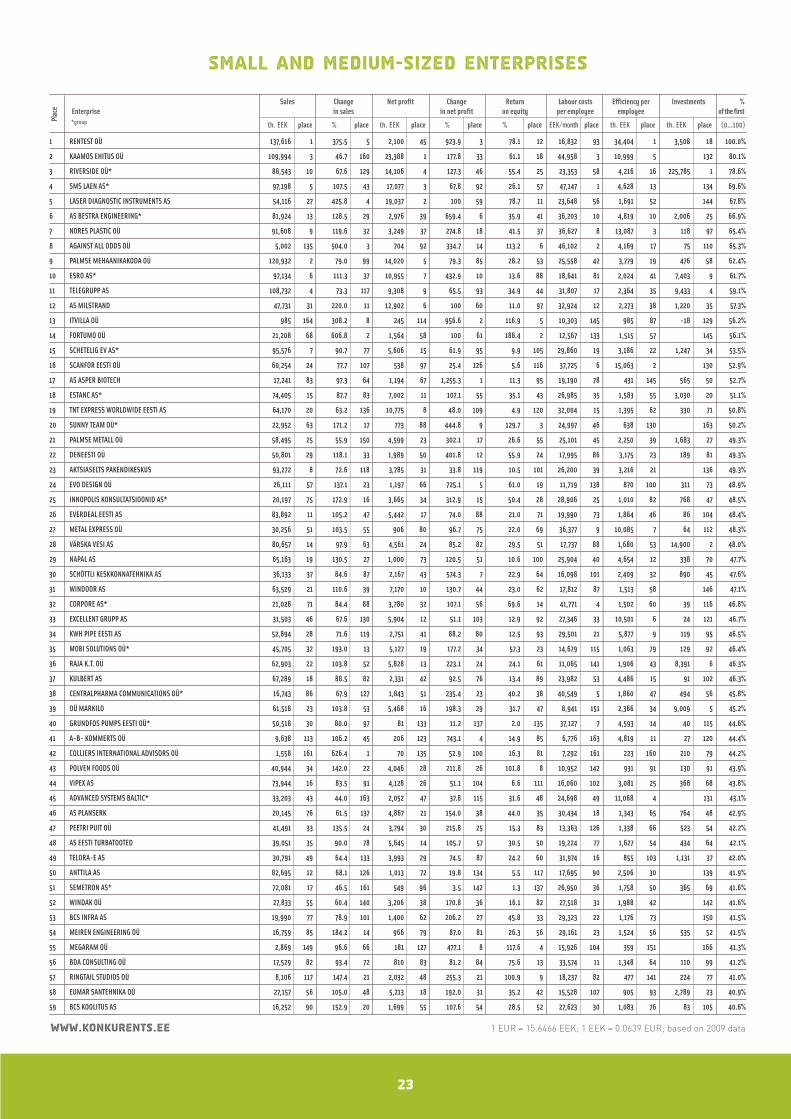
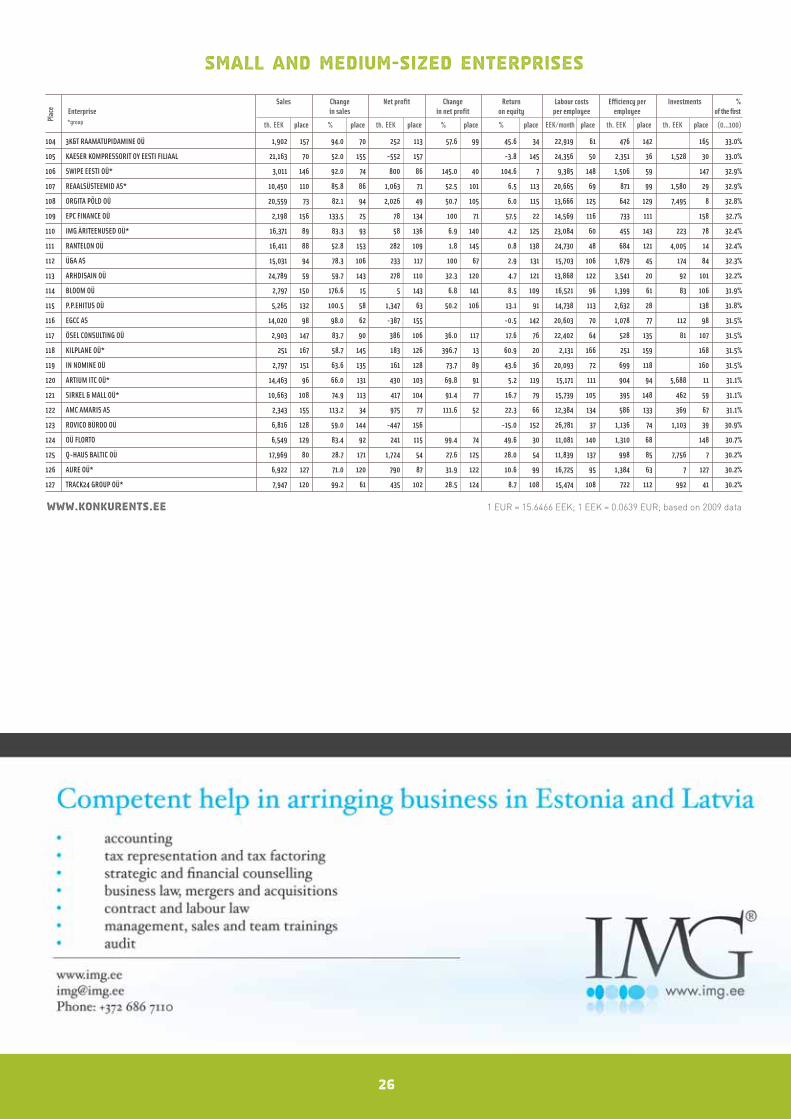
Small and Medium-sized Enterprises
Sales Change Net profit Change Return Labour costs Efficiency per Investments %Enterprise in sales in net profit on equity per employee employee of the first*group th. EEK place % place th. EEK place % place % place EEK/month place th. EEK place th. EEK place (0...100)
Plac
e
www.konkurents.ee 1 EUR = 15.6466 EEK; 1 EEK = 0.0639 EUR; based on 2009 data
1 RENTEST OÜ 137,616 1 375.5 5 2,100 45 923.9 3 78.1 12 16,832 93 34,404 1 3,508 18 100.0%
2 KAAMOS EHITUS OÜ 109,994 3 46.7 160 23,388 1 177.8 33 61.1 18 44,958 3 10,999 5 132 80.1%
3 RIVERSIDE OÜ* 88,543 10 67.6 129 14,106 4 127.3 46 55.4 25 23,353 58 4,216 16 225,785 1 78.6%
4 SMS LAEN AS* 97,198 5 107.5 43 17,077 3 67.8 92 26.1 57 47,147 1 4,628 13 134 69.6%
5 LASER DIAGNOSTIC INSTRUMENTS AS 54,116 27 425.8 4 19,037 2 100 59 78.7 11 23,648 56 1,691 52 144 67.8%
6 AS BESTRA ENGINEERING* 81,924 13 128.5 29 2,976 39 659.4 6 35.9 41 36,203 10 4,819 10 2,006 25 66.9%
7 NORES PLASTIC OÜ 91,608 9 119.6 32 3,249 37 274.8 18 41.5 37 36,627 8 13,087 3 118 97 65.4%
8 AGAINST ALL ODDS OÜ 5,002 135 504.0 3 704 92 334.7 14 113.2 6 46,102 2 4,169 17 75 110 65.3%
9 PALMSE MEHAANIKAKODA OÜ 120,932 2 79.0 99 14,020 5 79.3 85 28.2 53 25,558 42 3,779 19 476 58 62.4%
10 ESRO AS* 97,134 6 111.3 37 10,955 7 432.9 10 13.6 88 18,641 81 2,024 41 7,403 9 61.7%
11 TELEGRUPP AS 108,732 4 73.3 117 9,308 9 65.5 93 34.9 44 31,807 17 2,364 35 9,433 4 59.1%
12 AS MILSTRAND 47,731 31 220.0 11 12,902 6 100 60 11.0 97 32,924 12 2,273 38 1,220 35 57.3%
13 ITVILLA OÜ 985 164 308.2 8 245 114 956.6 2 116.9 5 10,303 145 985 87 -18 129 56.2%
14 FORTUMO OÜ 21,208 68 606.8 2 1,564 58 100 61 188.4 2 12,567 133 1,515 57 145 56.1%
15 SCHETELIG EV AS* 95,576 7 90.7 77 5,606 15 61.9 95 9.9 105 29,860 19 3,186 22 1,247 34 53.5%
16 SCANFOR EESTI OÜ 60,254 24 77.7 107 538 97 25.4 126 5.6 116 37,725 6 15,063 2 130 52.9%
17 AS ASPER BIOTECH 17,241 83 97.3 64 1,194 67 1,255.3 1 11.3 95 19,190 78 431 145 565 50 52.7%
18 ESTANC AS* 74,405 15 87.7 83 7,002 11 107.1 55 35.1 43 26,985 35 1,583 55 3,030 20 51.1%
19 TNT EXPRESS WORLDWIDE EESTI AS 64,170 20 63.2 136 10,775 8 48.0 109 4.9 120 32,004 15 1,395 62 330 71 50.8%
20 SUNNY TEAM OÜ* 22,952 63 171.2 17 773 88 444.8 9 129.7 3 24,997 46 638 130 163 50.2%
21 PALMSE METALL OÜ 58,495 25 55.9 150 4,599 23 302.1 17 26.6 55 25,101 45 2,250 39 1,683 27 49.3%
22 DENEESTI OÜ 50,801 29 118.1 33 1,989 50 401.8 12 55.9 24 17,995 86 3,175 23 189 81 49.3%
23 AKTSIASELTS PAKENDIKESKUS 93,272 8 72.6 118 3,785 31 33.8 119 10.5 101 26,200 39 3,216 21 136 49.3%
24 EVO DESIGN OÜ 26,111 57 137.1 23 1,197 66 725.1 5 61.0 19 11,719 138 870 100 311 73 48.9%
25 INNOPOLIS KONSULTATSIOONID AS* 20,197 75 172.9 16 3,665 34 312.9 15 50.4 28 28,906 25 1,010 82 768 47 48.5%
26 EVERDEAL EESTI AS 83,892 11 105.2 47 5,442 17 74.0 88 21.0 71 19,990 73 1,864 46 86 104 48.4%
27 METAL EXPRESS OÜ 30,256 51 103.5 55 906 80 96.7 75 22.0 69 36,377 9 10,085 7 64 112 48.3%
28 VÄRSKA VESI AS 80,657 14 97.9 63 4,561 24 85.2 82 29.5 51 17,737 88 1,680 53 14,900 2 48.0%
29 NAPAL AS 65,163 19 130.5 27 1,000 73 120.5 51 10.6 100 25,904 40 4,654 12 338 70 47.7%
30 SCHÖTTLI KESKKONNATEHNIKA AS 36,133 37 84.6 87 2,167 43 574.3 7 22.9 64 16,098 101 2,409 32 890 45 47.6%
31 WINDOOR AS 63,529 21 110.6 39 7,170 10 130.7 44 23.0 62 17,812 87 1,513 58 146 47.1%
32 CORPORE AS* 21,028 71 84.4 88 3,780 32 107.1 56 69.6 14 41,771 4 1,502 60 39 116 46.8%
33 EXCELLENT GRUPP AS 31,503 46 67.6 130 5,904 12 51.1 103 12.9 92 27,346 33 10,501 6 24 121 46.7%
34 KWH PIPE EESTI AS 52,894 28 71.6 119 2,751 41 88.2 80 12.5 93 29,501 21 5,877 9 119 95 46.5%
35 MOBI SOLUTIONS OÜ* 45,705 32 193.0 13 5,127 19 177.2 34 57.3 23 14,679 115 1,063 79 129 92 46.4%
36 RAJA K.T. OÜ 62,903 22 103.8 52 5,828 13 223.1 24 24.1 61 11,065 141 1,906 43 8,391 6 46.3%
37 KULBERT AS 67,289 18 88.5 82 2,331 42 92.5 76 13.4 89 23,982 53 4,486 15 91 102 46.3%
38 CENTRALPHARMA COMMUNICATIONS OÜ* 16,743 86 67.9 127 1,843 51 235.4 23 40.2 38 40,549 5 1,860 47 494 56 45.8%
39 OÜ MARKILO 61,518 23 103.8 53 5,468 16 198.3 29 31.7 47 8,941 151 2,366 34 9,009 5 45.2%
40 GRUNDFOS PUMPS EESTI OÜ* 50,518 30 80.0 97 81 133 11.2 137 2.0 135 37,127 7 4,593 14 40 115 44.6%
41 A-B- KOMMERTS OÜ 9,638 113 106.2 45 206 123 743.1 4 14.9 85 6,776 163 4,819 11 27 120 44.4%
42 COLLIERS INTERNATIONAL ADVISORS OÜ 1,558 161 626.4 1 70 135 52.9 100 16.3 81 7,292 161 223 160 210 79 44.2%
43 POLVEN FOODS OÜ 40,944 34 142.0 22 4,046 28 211.8 26 101.8 8 10,952 142 931 91 130 91 43.9%
44 VIPEX AS 73,944 16 83.5 91 4,128 26 51.1 104 6.6 111 16,060 102 3,081 25 368 68 43.8%
45 ADVANCED SYSTEMS BALTIC* 33,203 43 44.0 163 2,052 47 37.8 115 31.6 48 24,698 49 11,068 4 131 43.1%
46 AS PLANSERK 20,145 76 61.5 137 4,867 21 154.0 38 44.0 35 30,434 18 1,343 65 764 48 42.9%
47 PEETRI PUIT OÜ 41,491 33 135.5 24 3,794 30 215.8 25 15.3 83 13,363 126 1,338 66 523 54 42.2%
48 AS EESTI TURBATOOTED 39,051 35 90.0 78 5,645 14 105.7 57 30.5 50 19,224 77 1,627 54 434 64 42.1%
49 TELORA-E AS 30,791 49 64.4 133 3,993 29 74.5 87 24.2 60 31,974 16 855 103 1,131 37 42.0%
50 ANTTILA AS 82,695 12 68.1 126 1,013 72 19.8 134 5.5 117 17,695 90 2,506 30 139 41.9%
51 SEMETRON AS* 72,081 17 46.5 161 549 96 3.5 142 1.3 137 26,950 36 1,758 50 365 69 41.6%
52 WINDAK OÜ 27,833 55 60.4 140 3,206 38 170.8 36 16.1 82 27,518 31 1,988 42 142 41.6%
53 BCS INFRA AS 19,990 77 78.9 101 1,400 62 206.2 27 45.8 33 29,323 22 1,176 73 150 41.5%
54 MEIREN ENGINEERING OÜ 16,759 85 184.2 14 966 79 87.0 81 26.3 56 29,161 23 1,524 56 535 52 41.5%
55 MEGARAM OÜ 2,869 149 96.6 66 181 127 477.1 8 117.6 4 15,926 104 359 151 166 41.3%
56 BDA CONSULTING OÜ 17,529 82 93.4 72 810 83 81.2 84 75.6 13 33,574 11 1,348 64 110 99 41.2%
57 RINGTAIL STUDIOS OÜ 8,106 117 147.4 21 2,032 48 255.3 21 100.9 9 18,237 82 477 141 224 77 41.0%
58 EUMAR SANTEHNIKA OÜ 27,157 56 105.0 48 5,213 18 192.0 31 35.2 42 15,528 107 905 93 2,789 23 40.9%
59 BCS KOOLITUS AS 16,252 90 152.9 20 1,699 55 107.6 54 28.5 52 27,623 30 1,083 76 83 105 40.6%
24
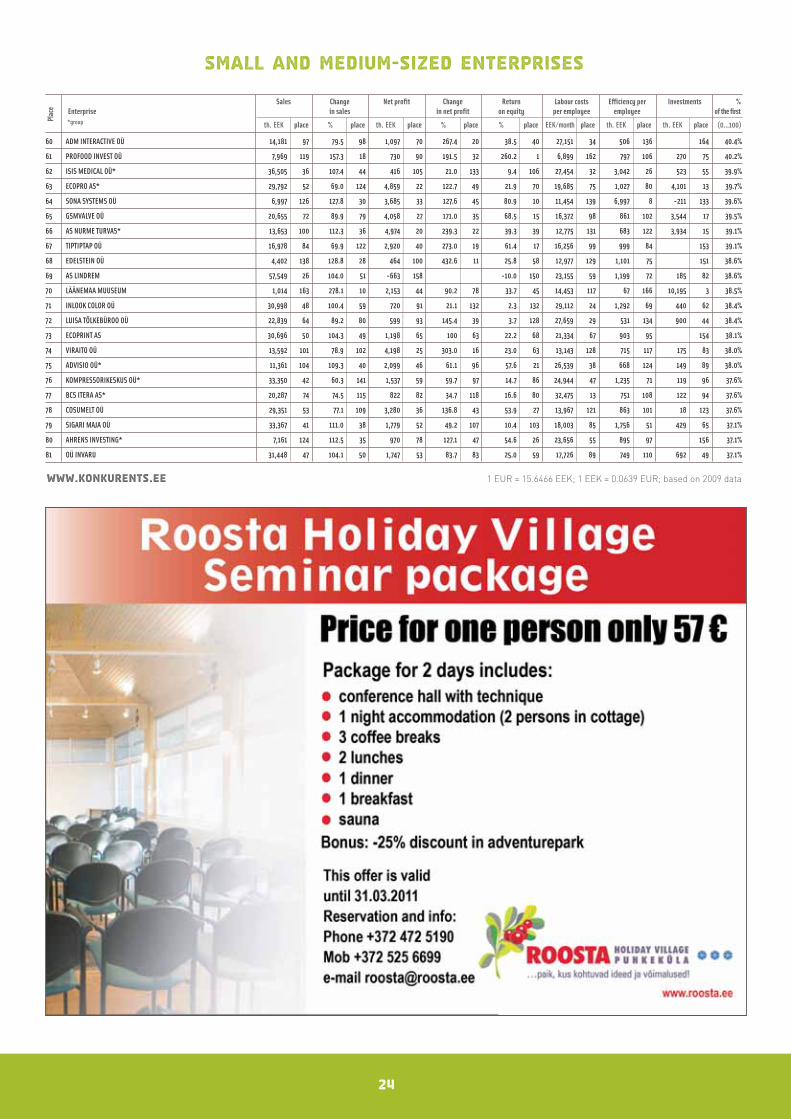
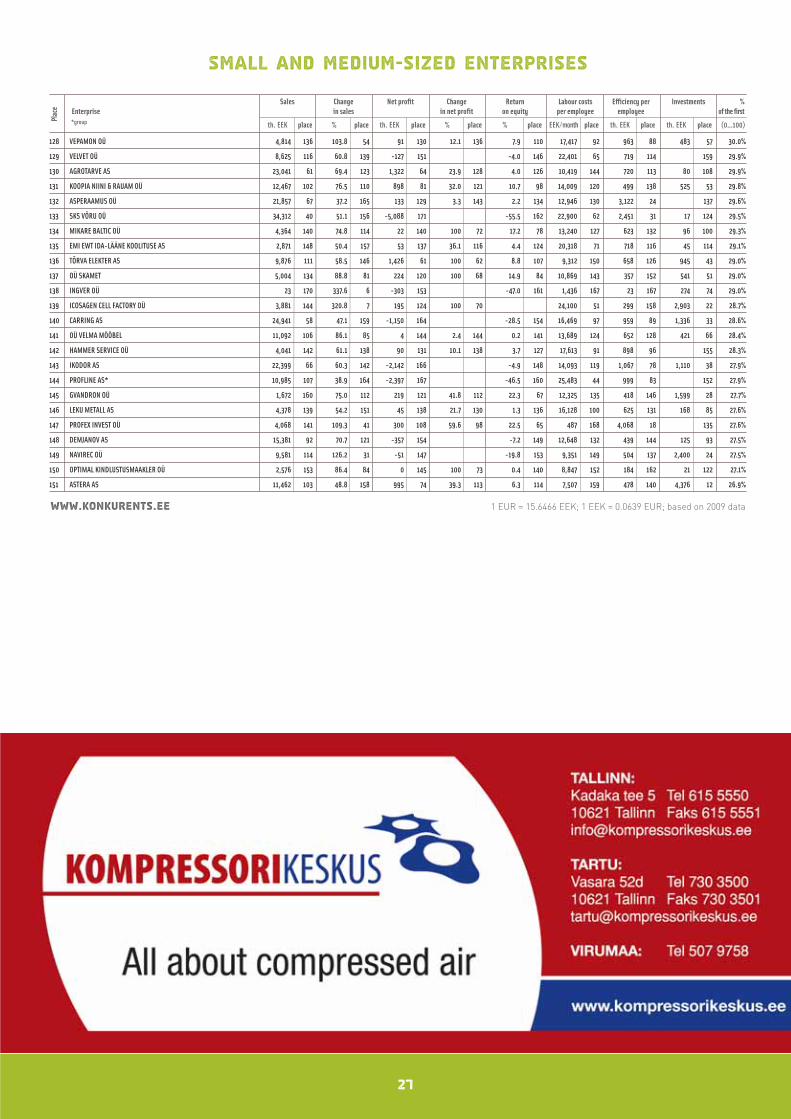
Small and Medium-sized Enterprises
Sales Change Net profit Change Return Labour costs Efficiency per Investments %Enterprise in sales in net profit on equity per employee employee of the first*group th. EEK place % place th. EEK place % place % place EEK/month place th. EEK place th. EEK place (0...100)
Plac
e
www.konkurents.ee 1 EUR = 15.6466 EEK; 1 EEK = 0.0639 EUR; based on 2009 data
60 ADM INTERACTIVE OÜ 14,181 97 79.5 98 1,097 70 267.4 20 38.5 40 27,151 34 506 136 164 40.4%
61 PROFOOD INVEST OÜ 7,969 119 157.3 18 730 90 191.5 32 260.2 1 6,899 162 797 106 270 75 40.2%
62 ISIS MEDICAL OÜ* 36,505 36 107.4 44 416 105 21.0 133 9.4 106 27,454 32 3,042 26 523 55 39.9%
63 ECOPRO AS* 29,792 52 69.0 124 4,859 22 122.7 49 21.9 70 19,685 75 1,027 80 4,101 13 39.7%
64 SONA SYSTEMS OÜ 6,997 126 127.8 30 3,685 33 127.6 45 80.9 10 11,454 139 6,997 8 -211 133 39.6%
65 GSMVALVE OÜ 20,655 72 89.9 79 4,058 27 171.0 35 68.5 15 16,372 98 861 102 3,544 17 39.5%
66 AS NURME TURVAS* 13,653 100 112.3 36 4,974 20 239.3 22 39.3 39 12,775 131 683 122 3,934 15 39.1%
67 TIPTIPTAP OÜ 16,978 84 69.9 122 2,920 40 273.0 19 61.4 17 16,256 99 999 84 153 39.1%
68 EDELSTEIN OÜ 4,402 138 128.8 28 464 100 432.6 11 25.8 58 12,977 129 1,101 75 151 38.6%
69 AS LINDREM 57,549 26 104.0 51 -663 158 -10.0 150 23,155 59 1,199 72 185 82 38.6%
70 LÄÄNEMAA MUUSEUM 1,014 163 278.1 10 2,153 44 90.2 78 33.7 45 14,453 117 67 166 10,195 3 38.5%
71 INLOOK COLOR OÜ 30,998 48 100.4 59 720 91 21.1 132 2.3 132 29,112 24 1,292 69 440 62 38.4%
72 LUISA TÕLKEBÜROO OÜ 22,839 64 89.2 80 599 93 145.4 39 3.7 128 27,659 29 531 134 900 44 38.4%
73 ECOPRINT AS 30,696 50 104.3 49 1,198 65 100 63 22.2 68 21,334 67 903 95 154 38.1%
74 VIRAITO OÜ 13,592 101 78.9 102 4,198 25 303.0 16 23.0 63 13,143 128 715 117 175 83 38.0%
75 ADVISIO OÜ* 11,361 104 109.3 40 2,099 46 61.1 96 57.6 21 26,539 38 668 124 149 89 38.0%
76 KOMPRESSORIKESKUS OÜ* 33,350 42 60.3 141 1,537 59 59.7 97 14.7 86 24,944 47 1,235 71 119 96 37.6%
77 BCS ITERA AS* 20,287 74 74.5 115 822 82 34.7 118 16.6 80 32,475 13 751 108 122 94 37.6%
78 COSUMELT OÜ 29,351 53 77.1 109 3,280 36 136.8 43 53.9 27 13,967 121 863 101 18 123 37.6%
79 SIGARI MAJA OÜ 33,367 41 111.0 38 1,779 52 49.2 107 10.4 103 18,003 85 1,756 51 429 65 37.1%
80 AHRENS INVESTING* 7,161 124 112.5 35 970 78 127.1 47 54.6 26 23,656 55 895 97 156 37.1%
81 OÜ INVARU 31,448 47 104.1 50 1,747 53 83.7 83 25.0 59 17,726 89 749 110 692 49 37.1%
25
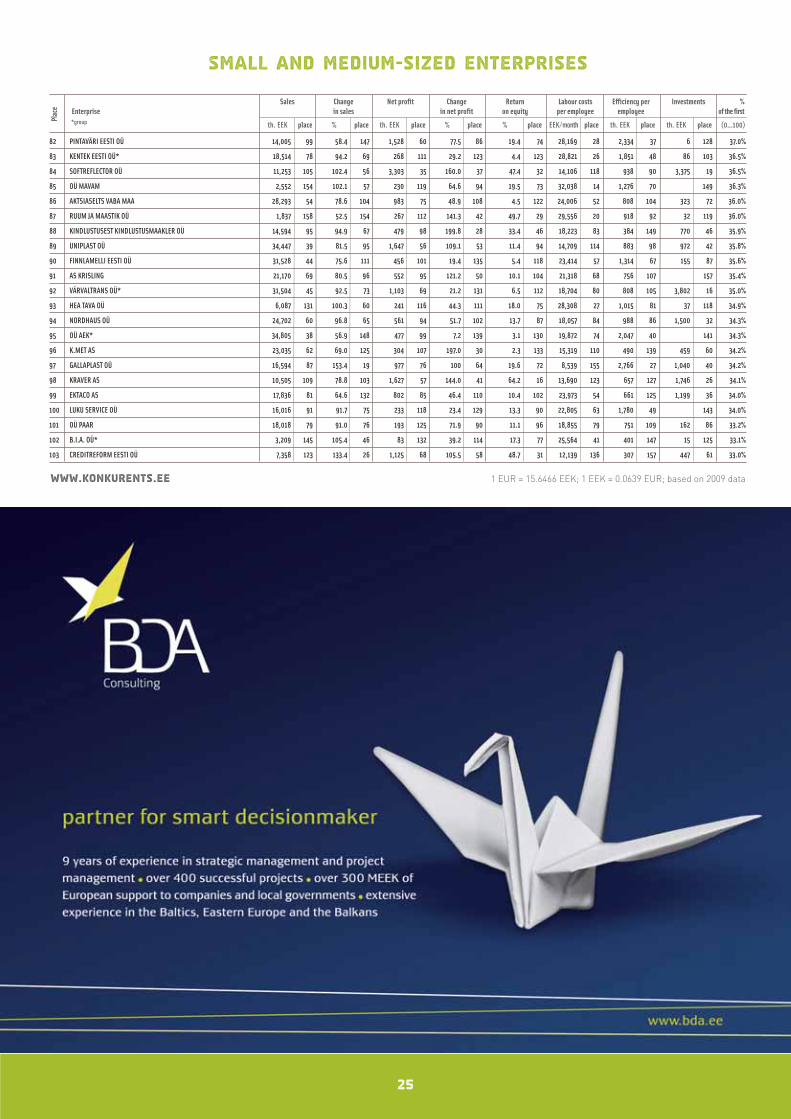
Small and Medium-sized Enterprises
Sales Change Net profit Change Return Labour costs Efficiency per Investments %Enterprise in sales in net profit on equity per employee employee of the first*group th. EEK place % place th. EEK place % place % place EEK/month place th. EEK place th. EEK place (0...100)
Plac
e
www.konkurents.ee 1 EUR = 15.6466 EEK; 1 EEK = 0.0639 EUR; based on 2009 data
82 PINTAVÄRI EESTI OÜ 14,005 99 58.4 147 1,528 60 77.5 86 19.4 74 28,169 28 2,334 37 6 128 37.0%
83 KENTEK EESTI OÜ* 18,514 78 94.2 69 268 111 29.2 123 4.4 123 28,821 26 1,851 48 86 103 36.5%
84 SOFTREFLECTOR OÜ 11,253 105 102.4 56 3,303 35 160.0 37 47.4 32 14,106 118 938 90 3,375 19 36.5%
85 OÜ MAVAM 2,552 154 102.1 57 230 119 64.6 94 19.5 73 32,038 14 1,276 70 149 36.3%
86 AKTSIASELTS VABA MAA 28,293 54 78.6 104 983 75 48.9 108 4.5 122 24,006 52 808 104 323 72 36.0%
87 RUUM JA MAASTIK OÜ 1,837 158 52.5 154 267 112 141.3 42 49.7 29 29,556 20 918 92 32 119 36.0%
88 KINDLUSTUSEST KINDLUSTUSMAAKLER OÜ 14,594 95 94.9 67 479 98 199.8 28 33.4 46 18,223 83 384 149 770 46 35.9%
89 UNIPLAST OÜ 34,447 39 81.5 95 1,647 56 109.1 53 11.4 94 14,709 114 883 98 972 42 35.8%
90 FINNLAMELLI EESTI OÜ 31,528 44 75.6 111 456 101 19.4 135 5.4 118 23,414 57 1,314 67 155 87 35.6%
91 AS KRISLING 21,170 69 80.5 96 552 95 121.2 50 10.1 104 21,318 68 756 107 157 35.4%
92 VÄRVALTRANS OÜ* 31,504 45 92.5 73 1,103 69 21.2 131 6.5 112 18,704 80 808 105 3,802 16 35.0%
93 HEA TAVA OÜ 6,087 131 100.3 60 241 116 44.3 111 18.0 75 28,308 27 1,015 81 37 118 34.9%
94 NORDHAUS OÜ 24,702 60 96.8 65 561 94 51.7 102 13.7 87 18,057 84 988 86 1,500 32 34.3%
95 OÜ AEK* 34,805 38 56.9 148 477 99 7.2 139 3.1 130 19,872 74 2,047 40 141 34.3%
96 K.MET AS 23,035 62 69.0 125 304 107 197.0 30 2.3 133 15,319 110 490 139 459 60 34.2%
97 GALLAPLAST OÜ 16,594 87 153.4 19 977 76 100 64 19.6 72 8,539 155 2,766 27 1,040 40 34.2%
98 KRAVER AS 10,505 109 78.8 103 1,627 57 144.0 41 64.2 16 13,690 123 657 127 1,746 26 34.1%
99 EKTACO AS 17,836 81 64.6 132 802 85 46.4 110 10.4 102 23,973 54 661 125 1,199 36 34.0%
100 LUKU SERVICE OÜ 16,016 91 91.7 75 233 118 23.4 129 13.3 90 22,805 63 1,780 49 143 34.0%
101 OÜ PAAR 18,018 79 91.0 76 193 125 71.9 90 11.1 96 18,855 79 751 109 162 86 33.2%
102 B.I.A. OÜ* 3,209 145 105.4 46 83 132 39.2 114 17.3 77 25,564 41 401 147 15 125 33.1%
103 CREDITREFORM EESTI OÜ 7,358 123 133.4 26 1,125 68 105.5 58 48.7 31 12,139 136 307 157 447 61 33.0%
26
Small and Medium-sized Enterprises
Sales Change Net profit Change Return Labour costs Efficiency per Investments %Enterprise in sales in net profit on equity per employee employee of the first*group th. EEK place % place th. EEK place % place % place EEK/month place th. EEK place th. EEK place (0...100)
Plac
e
www.konkurents.ee 1 EUR = 15.6466 EEK; 1 EEK = 0.0639 EUR; based on 2009 data
104 3K&T RAAMATUPIDAMINE OÜ 1,902 157 94.0 70 252 113 57.6 99 45.6 34 22,919 61 476 142 165 33.0%
105 KAESER KOMPRESSORIT OY EESTI FILIAAL 21,163 70 52.0 155 -552 157 -3.8 145 24,356 50 2,351 36 1,528 30 33.0%
106 SWIPE EESTI OÜ* 3,011 146 92.0 74 800 86 145.0 40 104.6 7 9,385 148 1,506 59 147 32.9%
107 REAALSÜSTEEMID AS* 10,450 110 85.8 86 1,063 71 52.5 101 6.5 113 20,665 69 871 99 1,580 29 32.9%
108 ORGITA PÕLD OÜ 20,559 73 82.1 94 2,026 49 50.7 105 6.0 115 13,666 125 642 129 7,495 8 32.8%
109 EPC FINANCE OÜ 2,198 156 133.5 25 78 134 100 71 57.5 22 14,569 116 733 111 158 32.7%
110 IMG ÄRITEENUSED OÜ* 16,371 89 83.3 93 58 136 6.9 140 4.2 125 23,084 60 455 143 223 78 32.4%
111 RANTELON OÜ 16,411 88 52.8 153 282 109 1.8 145 0.8 138 24,730 48 684 121 4,005 14 32.4%
112 Ü&A AS 15,031 94 78.3 106 233 117 100 67 2.9 131 15,703 106 1,879 45 174 84 32.3%
113 ARHDISAIN OÜ 24,789 59 59.7 143 278 110 32.3 120 4.7 121 13,868 122 3,541 20 92 101 32.2%
114 BLOOM OÜ 2,797 150 176.6 15 5 143 6.8 141 8.5 109 16,521 96 1,399 61 83 106 31.9%
115 P.P.EHITUS OÜ 5,265 132 100.5 58 1,347 63 50.2 106 13.1 91 14,738 113 2,632 28 138 31.8%
116 EGCC AS 14,020 98 98.0 62 -387 155 -0.5 142 20,603 70 1,078 77 112 98 31.5%
117 ÖSEL CONSULTING OÜ 2,903 147 83.7 90 386 106 36.0 117 17.6 76 22,402 64 528 135 81 107 31.5%
118 KILPLANE OÜ* 251 167 58.7 145 183 126 396.7 13 60.9 20 2,131 166 251 159 168 31.5%
119 IN NOMINE OÜ 2,797 151 63.6 135 161 128 73.7 89 43.6 36 20,093 72 699 118 160 31.5%
120 ARTIUM ITC OÜ* 14,463 96 66.0 131 430 103 69.8 91 5.2 119 15,171 111 904 94 5,688 11 31.1%
121 SIRKEL & MALL OÜ* 10,663 108 74.9 113 417 104 91.4 77 16.7 79 15,739 105 395 148 462 59 31.1%
122 AMC AMARIS AS 2,343 155 113.2 34 975 77 111.6 52 22.3 66 12,384 134 586 133 369 67 31.1%
123 ROVICO BÜROO OÜ 6,816 128 59.0 144 -447 156 -15.0 152 26,781 37 1,136 74 1,103 39 30.9%
124 OÜ FLORTO 6,549 129 83.4 92 241 115 99.4 74 49.6 30 11,081 140 1,310 68 148 30.7%
125 Q-HAUS BALTIC OÜ 17,969 80 28.7 171 1,724 54 27.6 125 28.0 54 11,839 137 998 85 7,756 7 30.2%
126 AURE OÜ* 6,922 127 71.0 120 790 87 31.9 122 10.6 99 16,725 95 1,384 63 7 127 30.2%
127 TRACK24 GROUP OÜ* 7,947 120 99.2 61 435 102 28.5 124 8.7 108 15,474 108 722 112 992 41 30.2%
27
Small and Medium-sized Enterprises
Sales Change Net profit Change Return Labour costs Efficiency per Investments %Enterprise in sales in net profit on equity per employee employee of the first*group th. EEK place % place th. EEK place % place % place EEK/month place th. EEK place th. EEK place (0...100)
Plac
e
www.konkurents.ee 1 EUR = 15.6466 EEK; 1 EEK = 0.0639 EUR; based on 2009 data
128 VEPAMON OÜ 4,814 136 103.8 54 91 130 12.1 136 7.9 110 17,417 92 963 88 483 57 30.0%
129 VELVET OÜ 8,625 116 60.8 139 -127 151 -4.0 146 22,401 65 719 114 159 29.9%
130 AGROTARVE AS 23,041 61 69.4 123 1,322 64 23.9 128 4.0 126 10,419 144 720 113 80 108 29.9%
131 KOOPIA NIINI & RAUAM OÜ 12,467 102 76.5 110 898 81 32.0 121 10.7 98 14,009 120 499 138 525 53 29.8%
132 ASPERAAMUS OÜ 21,857 67 37.2 165 133 129 3.3 143 2.2 134 12,946 130 3,122 24 137 29.6%
133 SKS VÕRU OÜ 34,312 40 51.1 156 -5,088 171 -55.5 162 22,900 62 2,451 31 17 124 29.5%
134 MIKARE BALTIC OÜ 4,364 140 74.8 114 22 140 100 72 17.2 78 13,240 127 623 132 96 100 29.3%
135 EMI EWT IDA-LÄÄNE KOOLITUSE AS 2,871 148 50.4 157 53 137 36.1 116 4.4 124 20,318 71 718 116 45 114 29.1%
136 TÕRVA ELEKTER AS 9,876 111 58.5 146 1,426 61 100 62 8.8 107 9,312 150 658 126 945 43 29.0%
137 OÜ SKAMET 5,004 134 88.8 81 224 120 100 68 14.9 84 10,869 143 357 152 541 51 29.0%
138 INGVER OÜ 23 170 337.6 6 -303 153 -47.0 161 1,436 167 23 167 274 74 29.0%
139 ICOSAGEN CELL FACTORY OÜ 3,881 144 320.8 7 195 124 100 70 24,100 51 299 158 2,903 22 28.7%
140 CARRING AS 24,941 58 47.1 159 -1,150 164 -28.5 154 16,469 97 959 89 1,336 33 28.6%
141 OÜ VELMA MÖÖBEL 11,092 106 86.1 85 4 144 2.4 144 0.2 141 13,689 124 652 128 421 66 28.4%
142 HAMMER SERVICE OÜ 4,041 142 61.1 138 90 131 10.1 138 3.7 127 17,613 91 898 96 155 28.3%
143 IKODOR AS 22,399 66 60.3 142 -2,142 166 -4.9 148 14,093 119 1,067 78 1,110 38 27.9%
144 PROFLINE AS* 10,985 107 38.9 164 -2,397 167 -46.5 160 25,483 44 999 83 152 27.9%
145 GVANDRON OÜ 1,672 160 75.0 112 219 121 41.8 112 22.3 67 12,325 135 418 146 1,599 28 27.7%
146 LEKU METALL AS 4,378 139 54.2 151 45 138 21.7 130 1.3 136 16,128 100 625 131 168 85 27.6%
147 PROFEX INVEST OÜ 4,068 141 109.3 41 300 108 59.6 98 22.5 65 487 168 4,068 18 135 27.6%
148 DEMJANOV AS 15,381 92 70.7 121 -357 154 -7.2 149 12,648 132 439 144 125 93 27.5%
149 NAVIREC OÜ 9,581 114 126.2 31 -51 147 -19.8 153 9,351 149 504 137 2,400 24 27.5%
150 OPTIMAL KINDLUSTUSMAAKLER OÜ 2,576 153 86.4 84 0 145 100 73 0.4 140 8,847 152 184 162 21 122 27.1%
151 ASTERA AS 11,462 103 48.8 158 995 74 39.3 113 6.3 114 7,507 159 478 140 4,376 12 26.9%
28
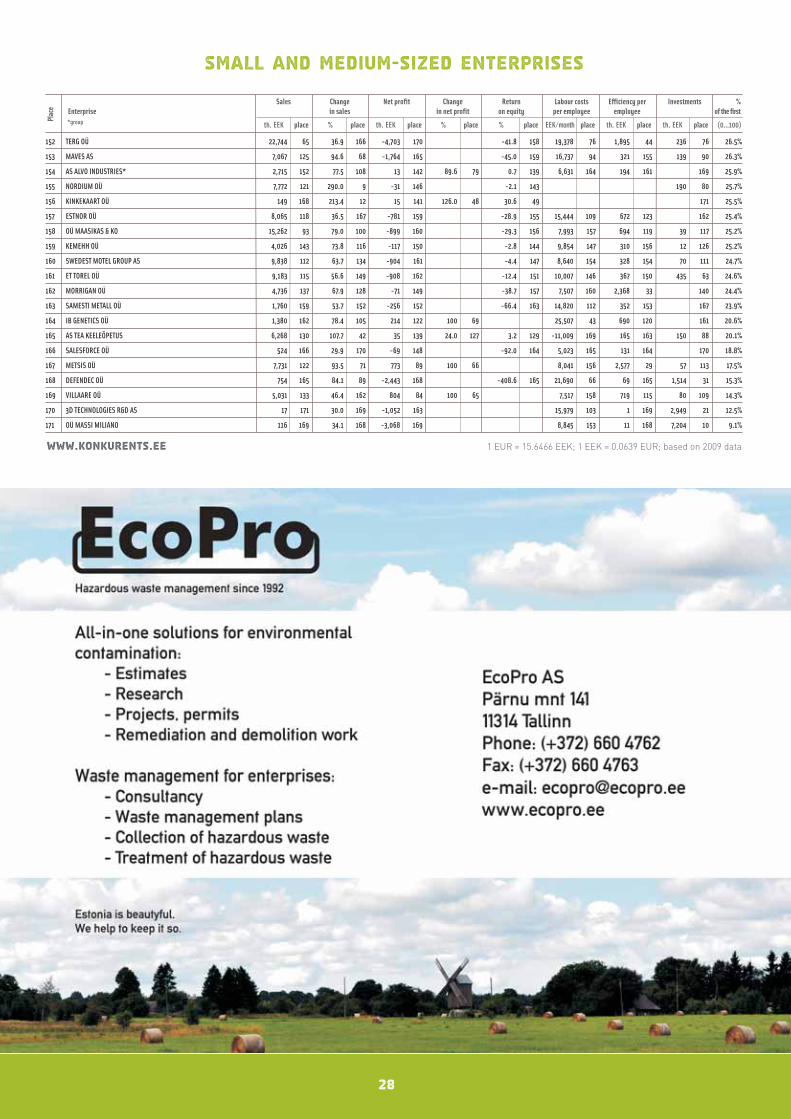
Small and Medium-sized Enterprises
Sales Change Net profit Change Return Labour costs Efficiency per Investments %Enterprise in sales in net profit on equity per employee employee of the first*group th. EEK place % place th. EEK place % place % place EEK/month place th. EEK place th. EEK place (0...100)
Plac
e
www.konkurents.ee 1 EUR = 15.6466 EEK; 1 EEK = 0.0639 EUR; based on 2009 data
152 TERG OÜ 22,744 65 36.9 166 -4,703 170 -41.8 158 19,378 76 1,895 44 236 76 26.5%
153 MAVES AS 7,067 125 94.6 68 -1,764 165 -45.0 159 16,737 94 321 155 139 90 26.3%
154 AS ALVO INDUSTRIES* 2,715 152 77.5 108 13 142 89.6 79 0.7 139 6,631 164 194 161 169 25.9%
155 NORDIUM OÜ 7,772 121 290.0 9 -31 146 -2.1 143 190 80 25.7%
156 KINKEKAART OÜ 149 168 213.4 12 15 141 126.0 48 30.6 49 171 25.5%
157 ESTNOR OÜ 8,065 118 36.5 167 -781 159 -28.9 155 15,444 109 672 123 162 25.4%
158 OÜ MAASIKAS & KO 15,262 93 79.0 100 -899 160 -29.3 156 7,993 157 694 119 39 117 25.2%
159 KEMEHH OÜ 4,026 143 73.8 116 -117 150 -2.8 144 9,854 147 310 156 12 126 25.2%
160 SWEDEST MOTEL GROUP AS 9,838 112 63.7 134 -904 161 -4.4 147 8,640 154 328 154 70 111 24.7%
161 ET TOREL OÜ 9,183 115 56.6 149 -908 162 -12.4 151 10,007 146 367 150 435 63 24.6%
162 MORRIGAN OÜ 4,736 137 67.9 128 -71 149 -38.7 157 7,507 160 2,368 33 140 24.4%
163 SAMESTI METALL OÜ 1,760 159 53.7 152 -256 152 -66.4 163 14,820 112 352 153 167 23.9%
164 IB GENETICS OÜ 1,380 162 78.4 105 214 122 100 69 25,507 43 690 120 161 20.6%
165 AS TEA KEELEÕPETUS 6,268 130 107.7 42 35 139 24.0 127 3.2 129 -11,009 169 165 163 150 88 20.1%
166 SALESFORCE OÜ 524 166 29.9 170 -69 148 -92.0 164 5,023 165 131 164 170 18.8%
167 METSIS OÜ 7,731 122 93.5 71 773 89 100 66 8,041 156 2,577 29 57 113 17.5%
168 DEFENDEC OÜ 754 165 84.1 89 -2,443 168 -408.6 165 21,690 66 69 165 1,514 31 15.3%
169 VILLAARE OÜ 5,031 133 46.4 162 804 84 100 65 7,517 158 719 115 80 109 14.3%
170 3D TECHNOLOGIES R&D AS 17 171 30.0 169 -1,052 163 15,979 103 1 169 2,949 21 12.5%
171 OÜ MASSI MILIANO 116 169 34.1 168 -3,068 169 8,845 153 11 168 7,204 10 9.1%

Competitiveness Ranking 2010
The Most Competitive Industrial and Energy
Enterprise 2010
BLRT grupp
30
FJODOR BERMAN, Chairman of the Board of BLRT Grupp
It is very important to keep your face, yourreputation. That is something that moneycannot buy. And it is not enough if the chair-man of the board is the only one who keepsthat in mind; it is something each employeemust understand. One of our factories is located in Finland,and there everyone from the welder to themanager seems to have an innate attitudethat work must be done with good quality.Every day. It is my dream that one day, thewhole group has the same attitude towardswork.For as long as you work, you must learn. Iam glad that young people, too, are begin-ning to understand the necessity of acquir-ing professional skills. Fortunately, peoplehave started to value their work and jobmore. Many good specialists have returnedfrom Sweden, Germany and Finland to workfor us, both in Estonia and Lithuania.One of my principles concerns the conflictwe had in BLRT. People want – especially inNew Europe – to quickly draw money fromthe business in order to buy yachts and vil-las in Spain or make unrealistic investmentsin real estate. I am glad that we preservedgood sense even during the time of crisisand continued to make investments in bothpeople and equipment. For example, we didnot buy the Loksa shipyard, even though itwas on sale. But we did buy the Baltija ship-yard in Klaipeda, because that suited ourstrategic plans.Shipbuilding is a complicated thing. Someeven consider it more complicated thanspace industry, because it combines com-pletely different fields from engineering toelectronics.The setback of shipbuilding has been enor-mous throughout the world, and recovery hasbeen very weak. But we were committed to
finding more complex orders even before thecrisis. That requires more resources and ahigher qualification from people, but the de-cision has justified itself. Thanks to it, wehave received several big orders in difficulttimes. For instance, in the North Sea, 80 kmfrom the shore, there is a unique platform,made by BLRT, that builds wind farms. 400people worked on its construction, speaking12 different languages, but we managed toget the work done.In our Norwegian factory FiskerstrandBLRT, we started building the largest gas-powered ferry in the world. We have madesubway tunnel constructions for Swedenand a metal bridge construction for Den-mark. We have maintained the leading posi-tion in the world in the production of floatingfish farming complexes. There are floatingfish farms built by us from Japan to Canada,most of all in Norway.Of course, there has been a drastic declinein construction-related sectors, such as thesale of metals and gases. But in the end, wehave created more jobs in new sectors thanwe have lost in the old ones.Before the crisis, it was good times foreveryone – we realised that it could not goon like that forever. In Lithuania, for exam-ple, we started with a crisis program at atime when the crisis was not mentioned atall due to the upcoming elections. Fortu-nately, our Lithuanian colleagues believedus, and when orders declined by 40% in thatfactory four months later, we were preparedfor that. Of course, what helped us survivethe crisis was the fact that we do businessin 7 countries and in 10 different fields. Butour main strength was still the fact that ourleaders did not panic but kept looking for asolution to the situation. And in most cases,we did find a solution •
31
Fjodor Berman:
Pressure must remain, otherwise you will drop out of business
BLRT GRUPP
BLRT Grupp is Estonia’s biggest industrialgroup that operates in 10 different fields,including shipbuilding and ship repair, theproduction of metal constructions, metalsales, port and stevedore services, engi-neering, scrap metal processing, sale ofmedicinal and industrial gases, etc. The 65subsidiaries of BLRT Grupp do business inseven countries – Estonia, Latvia, Lithua-nia, Ukraine, Russia, Finland and Norway.BLRT Grupp employs 2000 people in Esto-nia and 3000 people in other countries.
BLRT Grupp AS results 2009:
Sales revenue (kEEK) 4,924,999
Change in sales revenue -17.8%
Net profit (kEEK) 267,909
Change in net profit -64.8%
Productivity of equity capital 7.2%
Productivity 1,467per 1 employee (kEEK)
Rank in the overall chart 36
I always tell my people that there must be some pressure on thecompany at all times. Not the kind that would exceed the limit oftolerance, but the kind that helps you move forward. Because assoon as you relax too much, you are no longer in business.
32
Industrial and Energy Enterprises
Sales Change Net profit Change Return Labour costs Efficiency per Investments %Enterprise in sales in net profit on equity per employee employee of the first*group th. EEK place % place th. EEK place % place % place EEK/month place th. EEK place th. EEK place (0...100)
Plac
e
www.konkurents.ee 1 EUR = 15.6466 EEK; 1 EEK = 0.0639 EUR; based on 2009 data
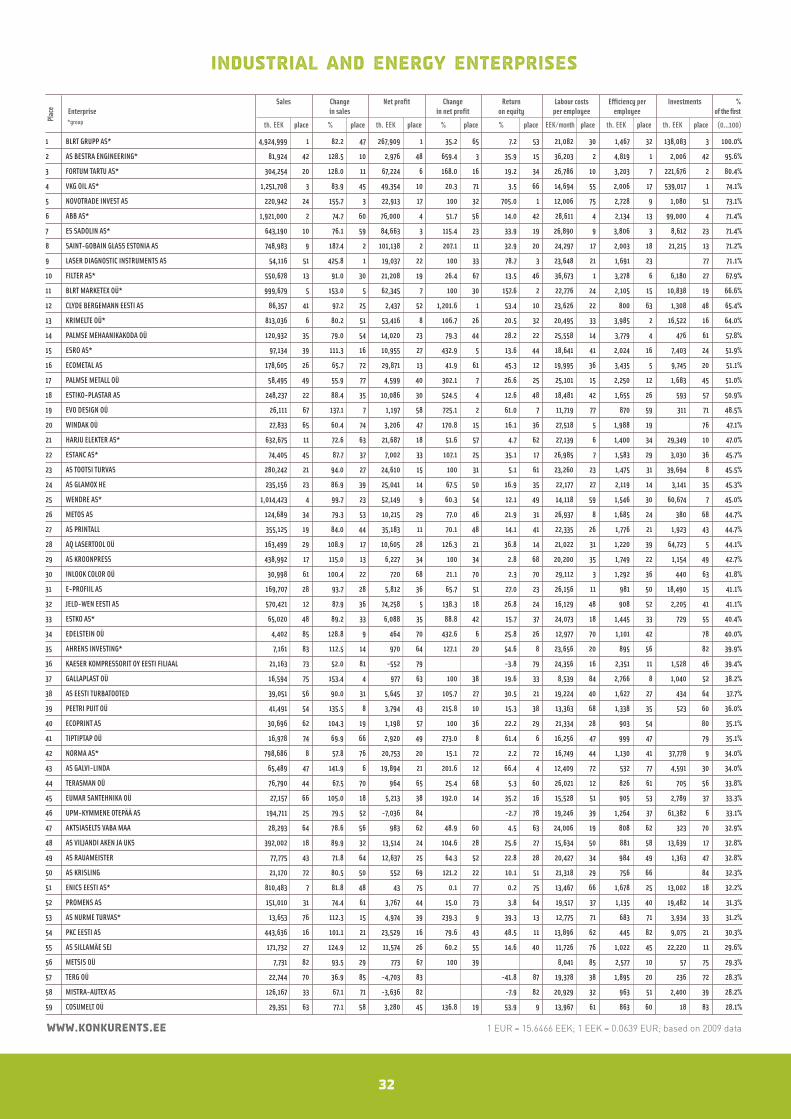
1 BLRT GRUPP AS* 4,924,999 1 82.2 47 267,909 1 35.2 65 7.2 53 21,082 30 1,467 32 138,083 3 100.0%
2 AS BESTRA ENGINEERING* 81,924 42 128.5 10 2,976 48 659.4 3 35.9 15 36,203 2 4,819 1 2,006 42 95.6%
3 FORTUM TARTU AS* 304,254 20 128.0 11 67,224 6 168.0 16 19.2 34 26,786 10 3,203 7 221,676 2 80.4%
4 VKG OIL AS* 1,251,708 3 83.9 45 49,354 10 20.3 71 3.5 66 14,694 55 2,006 17 539,017 1 74.1%
5 NOVOTRADE INVEST AS 220,942 24 155.7 3 22,913 17 100 32 705.0 1 12,006 75 2,728 9 1,080 51 73.1%
6 ABB AS* 1,921,000 2 74.7 60 76,000 4 51.7 56 14.0 42 28,611 4 2,134 13 99,000 4 71.4%
7 ES SADOLIN AS* 643,190 10 76.1 59 84,663 3 115.4 23 33.9 19 26,890 9 3,806 3 8,612 23 71.4%
8 SAINT-GOBAIN GLASS ESTONIA AS 748,983 9 187.4 2 101,138 2 207.1 11 32.9 20 24,297 17 2,003 18 21,215 13 71.2%
9 LASER DIAGNOSTIC INSTRUMENTS AS 54,116 51 425.8 1 19,037 22 100 33 78.7 3 23,648 21 1,691 23 77 71.1%
10 FILTER AS* 550,678 13 91.0 30 21,208 19 26.4 67 13.5 46 36,673 1 3,278 6 6,180 27 67.9%
11 BLRT MARKETEX OÜ* 999,679 5 153.0 5 62,345 7 100 30 157.6 2 22,776 24 2,105 15 10,838 19 66.6%
12 CLYDE BERGEMANN EESTI AS 86,357 41 97.2 25 2,437 52 1,201.6 1 53.4 10 23,626 22 800 63 1,308 48 65.4%
13 KRIMELTE OÜ* 813,036 6 80.2 51 53,416 8 106.7 26 20.5 32 20,495 33 3,985 2 16,522 16 64.0%
14 PALMSE MEHAANIKAKODA OÜ 120,932 35 79.0 54 14,020 23 79.3 44 28.2 22 25,558 14 3,779 4 476 61 57.8%
15 ESRO AS* 97,134 39 111.3 16 10,955 27 432.9 5 13.6 44 18,641 41 2,024 16 7,403 24 51.9%
16 ECOMETAL AS 178,605 26 65.7 72 29,871 13 41.9 61 45.3 12 19,995 36 3,435 5 9,745 20 51.1%
17 PALMSE METALL OÜ 58,495 49 55.9 77 4,599 40 302.1 7 26.6 25 25,101 15 2,250 12 1,683 45 51.0%
18 ESTIKO-PLASTAR AS 248,237 22 88.4 35 10,086 30 524.5 4 12.6 48 18,481 42 1,655 26 593 57 50.9%
19 EVO DESIGN OÜ 26,111 67 137.1 7 1,197 58 725.1 2 61.0 7 11,719 77 870 59 311 71 48.5%
20 WINDAK OÜ 27,833 65 60.4 74 3,206 47 170.8 15 16.1 36 27,518 5 1,988 19 76 47.1%
21 HARJU ELEKTER AS* 632,675 11 72.6 63 21,687 18 51.6 57 4.7 62 27,139 6 1,400 34 29,349 10 47.0%
22 ESTANC AS* 74,405 45 87.7 37 7,002 33 107.1 25 35.1 17 26,985 7 1,583 29 3,030 36 45.7%
23 AS TOOTSI TURVAS 280,242 21 94.0 27 24,610 15 100 31 5.1 61 23,260 23 1,475 31 39,694 8 45.5%
24 AS GLAMOX HE 235,156 23 86.9 39 25,041 14 67.5 50 16.9 35 22,177 27 2,119 14 3,141 35 45.3%
25 WENDRE AS* 1,014,423 4 99.7 23 52,149 9 60.3 54 12.1 49 14,118 59 1,546 30 60,674 7 45.0%
26 METOS AS 124,689 34 79.3 53 10,215 29 77.0 46 21.9 31 26,937 8 1,685 24 380 68 44.7%
27 AS PRINTALL 355,125 19 84.0 44 35,183 11 70.1 48 14.1 41 22,335 26 1,776 21 1,923 43 44.7%
28 AQ LASERTOOL OÜ 163,499 29 108.9 17 10,605 28 126.3 21 36.8 14 21,022 31 1,220 39 64,723 5 44.1%
29 AS KROONPRESS 438,992 17 115.0 13 6,227 34 100 34 2.8 68 20,200 35 1,749 22 1,154 49 42.7%
30 INLOOK COLOR OÜ 30,998 61 100.4 22 720 68 21.1 70 2.3 70 29,112 3 1,292 36 440 63 41.8%
31 E-PROFIIL AS 169,707 28 93.7 28 5,812 36 65.7 51 27.0 23 26,156 11 981 50 18,490 15 41.1%
32 JELD-WEN EESTI AS 570,421 12 87.9 36 74,258 5 138.3 18 26.8 24 16,129 48 908 52 2,205 41 41.1%
33 ESTKO AS* 65,020 48 89.2 33 6,088 35 88.8 42 15.7 37 24,073 18 1,445 33 729 55 40.4%
34 EDELSTEIN OÜ 4,402 85 128.8 9 464 70 432.6 6 25.8 26 12,977 70 1,101 42 78 40.0%
35 AHRENS INVESTING* 7,161 83 112.5 14 970 64 127.1 20 54.6 8 23,656 20 895 56 82 39.9%
36 KAESER KOMPRESSORIT OY EESTI FILIAAL 21,163 73 52.0 81 -552 79 -3.8 79 24,356 16 2,351 11 1,528 46 39.4%
37 GALLAPLAST OÜ 16,594 75 153.4 4 977 63 100 38 19.6 33 8,539 84 2,766 8 1,040 52 38.2%
38 AS EESTI TURBATOOTED 39,051 56 90.0 31 5,645 37 105.7 27 30.5 21 19,224 40 1,627 27 434 64 37.7%
39 PEETRI PUIT OÜ 41,491 54 135.5 8 3,794 43 215.8 10 15.3 38 13,363 68 1,338 35 523 60 36.0%
40 ECOPRINT AS 30,696 62 104.3 19 1,198 57 100 36 22.2 29 21,334 28 903 54 80 35.1%
41 TIPTIPTAP OÜ 16,978 74 69.9 66 2,920 49 273.0 8 61.4 6 16,256 47 999 47 79 35.1%
42 NORMA AS* 798,686 8 57.8 76 20,753 20 15.1 72 2.2 72 16,749 44 1,130 41 37,778 9 34.0%
43 AS GALVI-LINDA 65,489 47 141.9 6 19,894 21 201.6 12 66.4 4 12,409 72 532 77 4,591 30 34.0%
44 TERASMAN OÜ 76,790 44 67.5 70 964 65 25.4 68 5.3 60 26,021 12 826 61 705 56 33.8%
45 EUMAR SANTEHNIKA OÜ 27,157 66 105.0 18 5,213 38 192.0 14 35.2 16 15,528 51 905 53 2,789 37 33.3%
46 UPM-KYMMENE OTEPÄÄ AS 194,711 25 79.5 52 -7,036 84 -2.7 78 19,246 39 1,264 37 61,382 6 33.1%
47 AKTSIASELTS VABA MAA 28,293 64 78.6 56 983 62 48.9 60 4.5 63 24,006 19 808 62 323 70 32.9%
48 AS VILJANDI AKEN JA UKS 392,002 18 89.9 32 13,514 24 104.6 28 25.6 27 15,634 50 881 58 13,639 17 32.8%
49 AS RAUAMEISTER 77,775 43 71.8 64 12,637 25 64.3 52 22.8 28 20,427 34 984 49 1,363 47 32.8%
50 AS KRISLING 21,170 72 80.5 50 552 69 121.2 22 10.1 51 21,318 29 756 66 84 32.3%
51 ENICS EESTI AS* 810,483 7 81.8 48 43 75 0.1 77 0.2 75 13,467 66 1,678 25 13,002 18 32.2%
52 PROMENS AS 151,010 31 74.4 61 3,767 44 15.0 73 3.8 64 19,517 37 1,135 40 19,482 14 31.3%
53 AS NURME TURVAS* 13,653 76 112.3 15 4,974 39 239.3 9 39.3 13 12,775 71 683 71 3,934 33 31.2%
54 PKC EESTI AS 443,636 16 101.1 21 23,529 16 79.6 43 48.5 11 13,896 62 445 82 9,075 21 30.3%
55 AS SILLAMÄE SEJ 171,732 27 124.9 12 11,574 26 60.2 55 14.6 40 11,726 76 1,022 45 22,220 11 29.6%
56 METSIS OÜ 7,731 82 93.5 29 773 67 100 39 8,041 85 2,577 10 57 75 29.3%
57 TERG OÜ 22,744 70 36.9 85 -4,703 83 -41.8 87 19,378 38 1,895 20 236 72 28.3%
58 MISTRA-AUTEX AS 126,167 33 67.1 71 -3,636 82 -7.9 82 20,929 32 963 51 2,400 39 28.2%
59 COSUMELT OÜ 29,351 63 77.1 58 3,280 45 136.8 19 53.9 9 13,967 61 863 60 18 83 28.1%
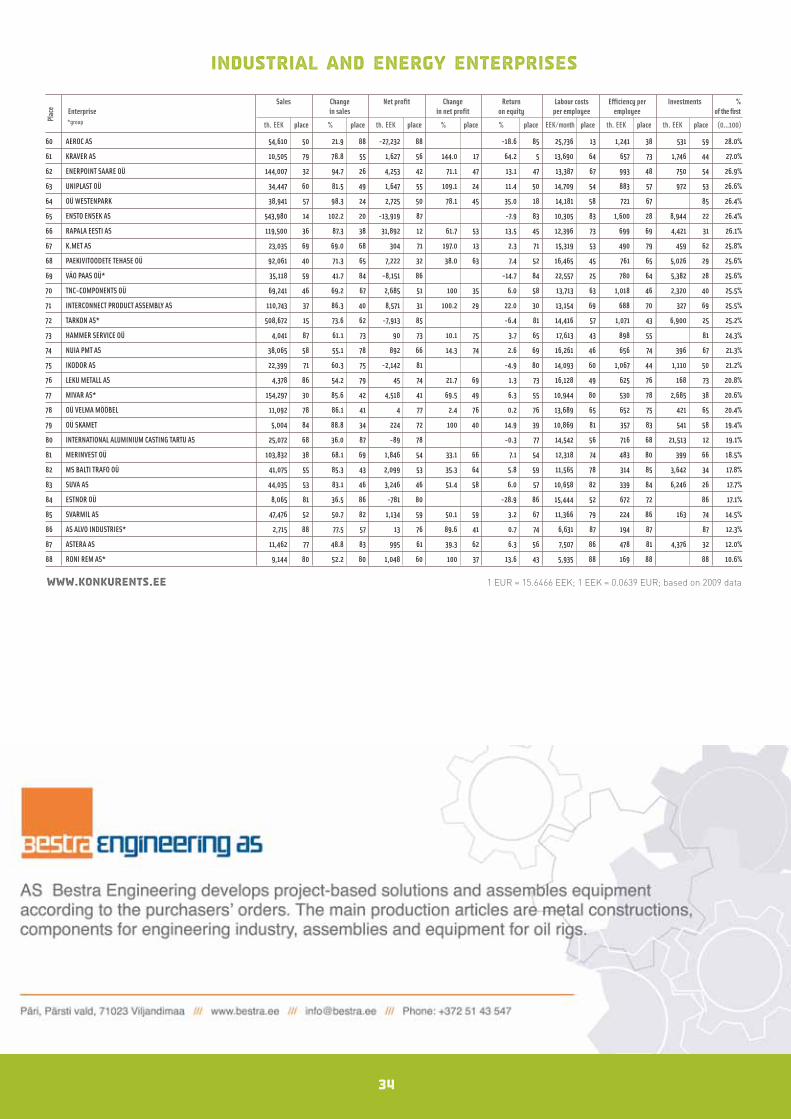
34
Industrial and Energy Enterprises
Sales Change Net profit Change Return Labour costs Efficiency per Investments %Enterprise in sales in net profit on equity per employee employee of the first*group th. EEK place % place th. EEK place % place % place EEK/month place th. EEK place th. EEK place (0...100)
Plac
e
www.konkurents.ee 1 EUR = 15.6466 EEK; 1 EEK = 0.0639 EUR; based on 2009 data
60 AEROC AS 54,610 50 21.9 88 -27,232 88 -18.6 85 25,736 13 1,241 38 531 59 28.0%
61 KRAVER AS 10,505 79 78.8 55 1,627 56 144.0 17 64.2 5 13,690 64 657 73 1,746 44 27.0%
62 ENERPOINT SAARE OÜ 144,007 32 94.7 26 4,253 42 71.1 47 13.1 47 13,387 67 993 48 750 54 26.9%
63 UNIPLAST OÜ 34,447 60 81.5 49 1,647 55 109.1 24 11.4 50 14,709 54 883 57 972 53 26.6%
64 OÜ WESTENPARK 38,941 57 98.3 24 2,725 50 78.1 45 35.0 18 14,181 58 721 67 85 26.4%
65 ENSTO ENSEK AS 543,980 14 102.2 20 -13,919 87 -7.9 83 10,305 83 1,600 28 8,944 22 26.4%
66 RAPALA EESTI AS 119,500 36 87.3 38 31,892 12 61.7 53 13.5 45 12,396 73 699 69 4,421 31 26.1%
67 K.MET AS 23,035 69 69.0 68 304 71 197.0 13 2.3 71 15,319 53 490 79 459 62 25.8%
68 PAEKIVITOODETE TEHASE OÜ 92,061 40 71.3 65 7,222 32 38.0 63 7.4 52 16,465 45 761 65 5,026 29 25.6%
69 VÄO PAAS OÜ* 35,118 59 41.7 84 -8,151 86 -14.7 84 22,557 25 780 64 5,382 28 25.6%
70 TNC-COMPONENTS OÜ 69,241 46 69.2 67 2,685 51 100 35 6.0 58 13,713 63 1,018 46 2,320 40 25.5%
71 INTERCONNECT PRODUCT ASSEMBLY AS 110,743 37 86.3 40 8,571 31 100.2 29 22.0 30 13,154 69 688 70 327 69 25.5%
72 TARKON AS* 508,672 15 73.6 62 -7,913 85 -6.4 81 14,416 57 1,071 43 6,900 25 25.2%
73 HAMMER SERVICE OÜ 4,041 87 61.1 73 90 73 10.1 75 3.7 65 17,613 43 898 55 81 24.3%
74 NUIA PMT AS 38,065 58 55.1 78 892 66 14.3 74 2.6 69 16,261 46 656 74 396 67 21.3%
75 IKODOR AS 22,399 71 60.3 75 -2,142 81 -4.9 80 14,093 60 1,067 44 1,110 50 21.2%
76 LEKU METALL AS 4,378 86 54.2 79 45 74 21.7 69 1.3 73 16,128 49 625 76 168 73 20.8%
77 MIVAR AS* 154,297 30 85.6 42 4,518 41 69.5 49 6.3 55 10,944 80 530 78 2,685 38 20.6%
78 OÜ VELMA MÖÖBEL 11,092 78 86.1 41 4 77 2.4 76 0.2 76 13,689 65 652 75 421 65 20.4%
79 OÜ SKAMET 5,004 84 88.8 34 224 72 100 40 14.9 39 10,869 81 357 83 541 58 19.4%
80 INTERNATIONAL ALUMINIUM CASTING TARTU AS 25,072 68 36.0 87 -89 78 -0.3 77 14,542 56 716 68 21,513 12 19.1%
81 MERINVEST OÜ 103,832 38 68.1 69 1,846 54 33.1 66 7.1 54 12,318 74 483 80 399 66 18.5%
82 MS BALTI TRAFO OÜ 41,075 55 85.3 43 2,099 53 35.3 64 5.8 59 11,565 78 314 85 3,642 34 17.8%
83 SUVA AS 44,035 53 83.1 46 3,246 46 51.4 58 6.0 57 10,658 82 339 84 6,246 26 17.7%
84 ESTNOR OÜ 8,065 81 36.5 86 -781 80 -28.9 86 15,444 52 672 72 86 17.1%
85 SVARMIL AS 47,476 52 50.7 82 1,134 59 50.1 59 3.2 67 11,366 79 224 86 163 74 14.5%
86 AS ALVO INDUSTRIES* 2,715 88 77.5 57 13 76 89.6 41 0.7 74 6,631 87 194 87 87 12.3%
87 ASTERA AS 11,462 77 48.8 83 995 61 39.3 62 6.3 56 7,507 86 478 81 4,376 32 12.0%
88 RONI REM AS* 9,144 80 52.2 80 1,048 60 100 37 13.6 43 5,935 88 169 88 88 10.6%

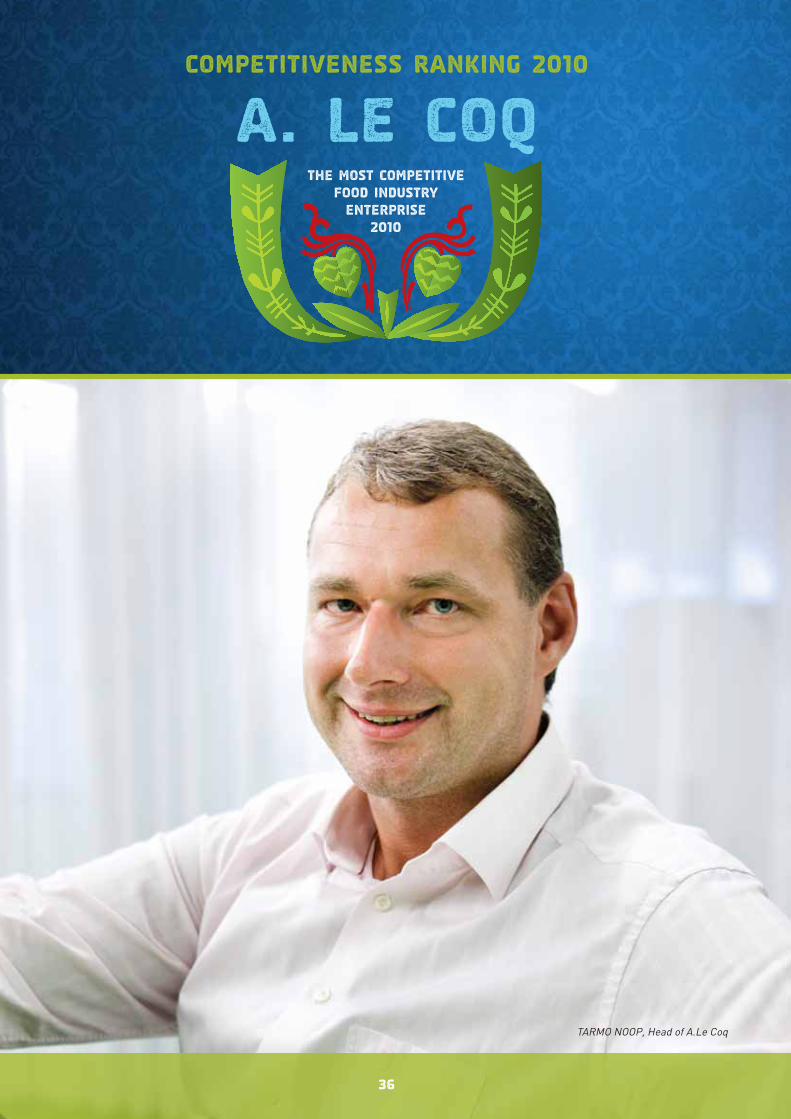
Competitiveness Ranking 2010
The Most Competitive Food Industry Enterprise
2010
A. Le Coq
36
TARMO NOOP, Head of A.Le Coq
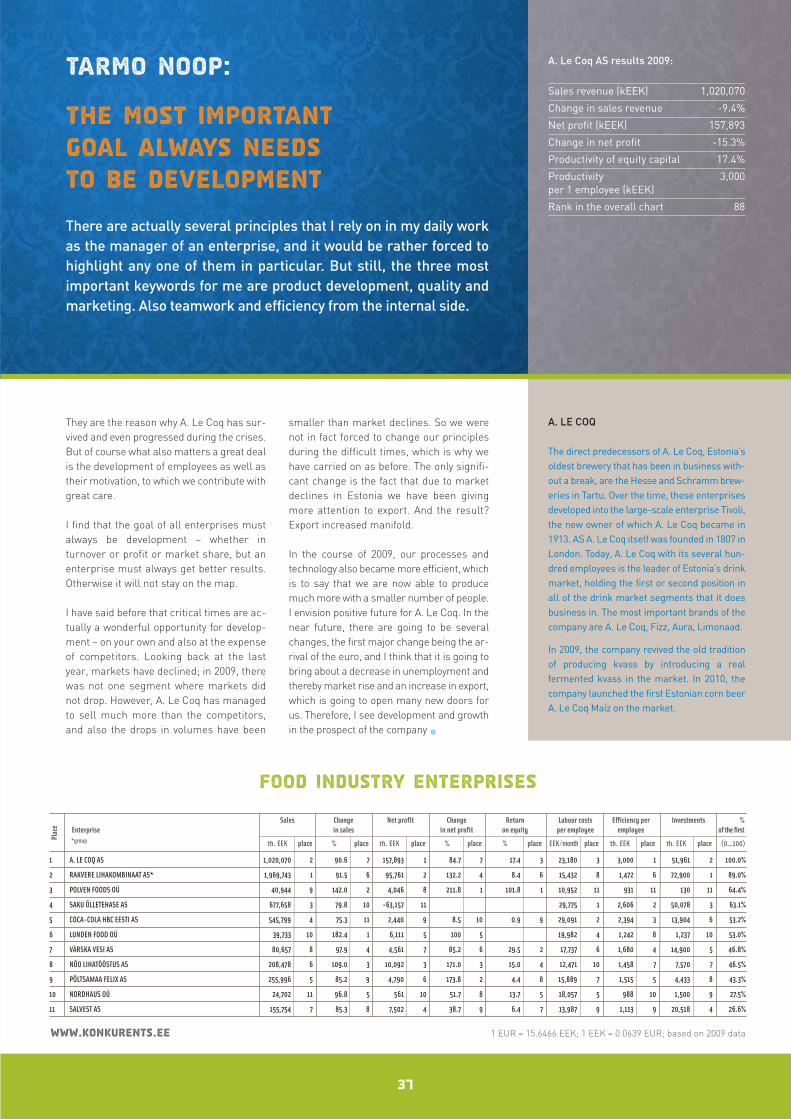
They are the reason why A. Le Coq has sur-vived and even progressed during the crises.But of course what also matters a great dealis the development of employees as well astheir motivation, to which we contribute withgreat care.
I find that the goal of all enterprises mustalways be development – whether inturnover or profit or market share, but anenterprise must always get better results.Otherwise it will not stay on the map.
I have said before that critical times are ac-tually a wonderful opportunity for develop-ment – on your own and also at the expenseof competitors. Looking back at the lastyear, markets have declined; in 2009, therewas not one segment where markets didnot drop. However, A. Le Coq has managedto sell much more than the competitors,and also the drops in volumes have been
smaller than market declines. So we werenot in fact forced to change our principlesduring the difficult times, which is why wehave carried on as before. The only signifi-cant change is the fact that due to marketdeclines in Estonia we have been givingmore attention to export. And the result?Export increased manifold.
In the course of 2009, our processes andtechnology also became more efficient, whichis to say that we are now able to producemuch more with a smaller number of people.I envision positive future for A. Le Coq. In thenear future, there are going to be severalchanges, the first major change being the ar-rival of the euro, and I think that it is going tobring about a decrease in unemployment andthereby market rise and an increase in export,which is going to open many new doors forus. Therefore, I see development and growthin the prospect of the company •
37
Tarmo Noop:
The most important goal always needs to be development
A. LE COQ
The direct predecessors of A. Le Coq, Estonia’soldest brewery that has been in business with-out a break, are the Hesse and Schramm brew-eries in Tartu. Over the time, these enterprisesdeveloped into the large-scale enterprise Tivoli,the new owner of which A. Le Coq became in1913. AS A. Le Coq itself was founded in 1807 inLondon. Today, A. Le Coq with its several hun-dred employees is the leader of Estonia’s drinkmarket, holding the first or second position inall of the drink market segments that it doesbusiness in. The most important brands of thecompany are A. Le Coq, Fizz, Aura, Limonaad.
In 2009, the company revived the old traditionof producing kvass by introducing a real fermented kvass in the market. In 2010, thecompany launched the first Estonian corn beerA. Le Coq Maíz on the market.
A. Le Coq AS results 2009:
Sales revenue (kEEK) 1,020,070
Change in sales revenue -9.4%
Net profit (kEEK) 157,893
Change in net profit -15.3%
Productivity of equity capital 17.4%
Productivity 3,000per 1 employee (kEEK)
Rank in the overall chart 88
There are actually several principles that I rely on in my daily workas the manager of an enterprise, and it would be rather forced tohighlight any one of them in particular. But still, the three most important keywords for me are product development, quality andmarketing. Also teamwork and efficiency from the internal side.
Food Industry Enterprises
Sales Change Net profit Change Return Labour costs Efficiency per Investments %Enterprise in sales in net profit on equity per employee employee of the first*group th. EEK place % place th. EEK place % place % place EEK/month place th. EEK place th. EEK place (0...100)
Plac
e
www.konkurents.ee 1 EUR = 15.6466 EEK; 1 EEK = 0.0639 EUR; based on 2009 data
1 A. LE COQ AS 1,020,070 2 90.6 7 157,893 1 84.7 7 17.4 3 23,180 3 3,000 1 51,961 2 100.0%
2 RAKVERE LIHAKOMBINAAT AS* 1,969,743 1 91.5 6 95,761 2 132.2 4 8.4 6 15,432 8 1,472 6 72,900 1 89.0%
3 POLVEN FOODS OÜ 40,944 9 142.0 2 4,046 8 211.8 1 101.8 1 10,952 11 931 11 130 11 64.4%
4 SAKU ÕLLETEHASE AS 677,658 3 79.8 10 -63,157 11 29,775 1 2,606 2 50,078 3 63.1%
5 COCA-COLA HBC EESTI AS 545,799 4 75.3 11 2,440 9 8.5 10 0.9 9 29,091 2 2,394 3 13,904 6 53.2%
6 LUNDEN FOOD OÜ 39,733 10 182.4 1 6,111 5 100 5 19,982 4 1,242 8 1,237 10 53.0%
7 VÄRSKA VESI AS 80,657 8 97.9 4 4,561 7 85.2 6 29.5 2 17,737 6 1,680 4 14,900 5 46.8%
8 NÕO LIHATÖÖSTUS AS 208,478 6 109.0 3 10,092 3 171.0 3 15.0 4 12,471 10 1,458 7 7,570 7 46.5%
9 PÕLTSAMAA FELIX AS 255,996 5 85.2 9 4,790 6 173.8 2 4.4 8 15,889 7 1,515 5 4,433 8 43.3%
10 NORDHAUS OÜ 24,702 11 96.8 5 561 10 51.7 8 13.7 5 18,057 5 988 10 1,500 9 27.5%
11 SALVEST AS 155,754 7 85.3 8 7,502 4 38.7 9 6.4 7 13,987 9 1,113 9 20,518 4 26.6%
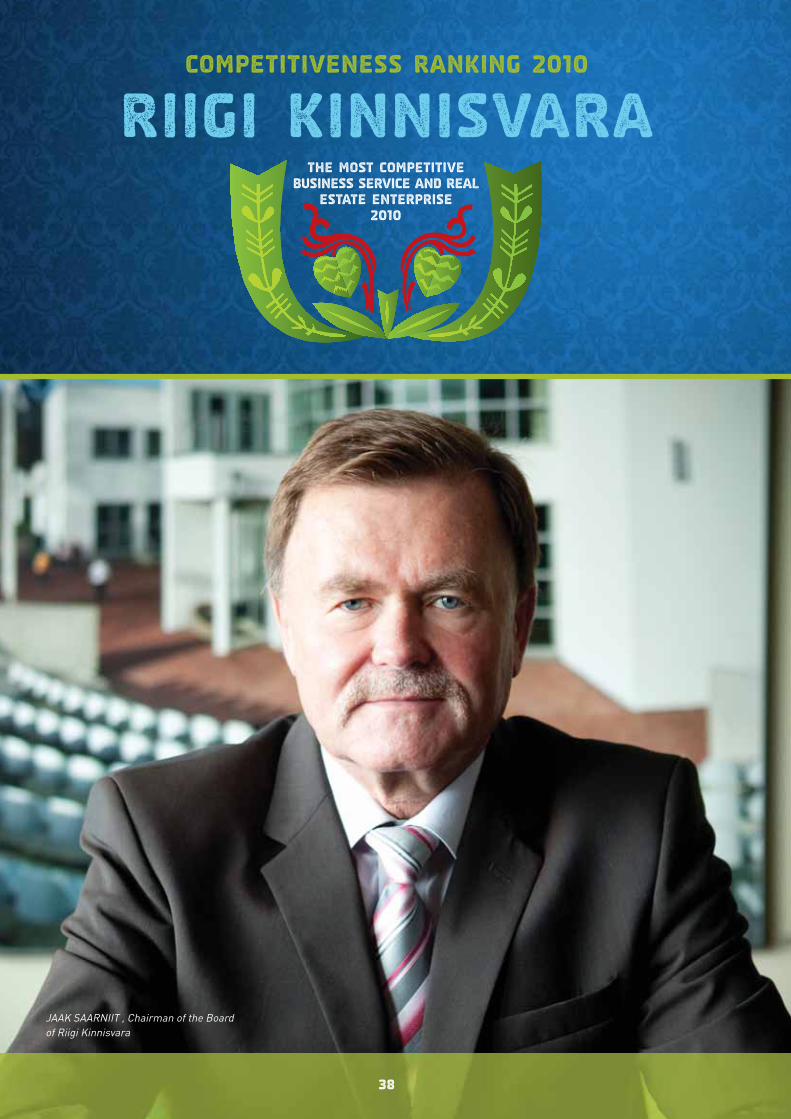
Competitiveness Ranking 2010
The Most Competitive Business Service and Real
Estate Enterprise 2010
Riigi Kinnisvara
38
JAAK SAARNIIT , Chairman of the Board of Riigi Kinnisvara
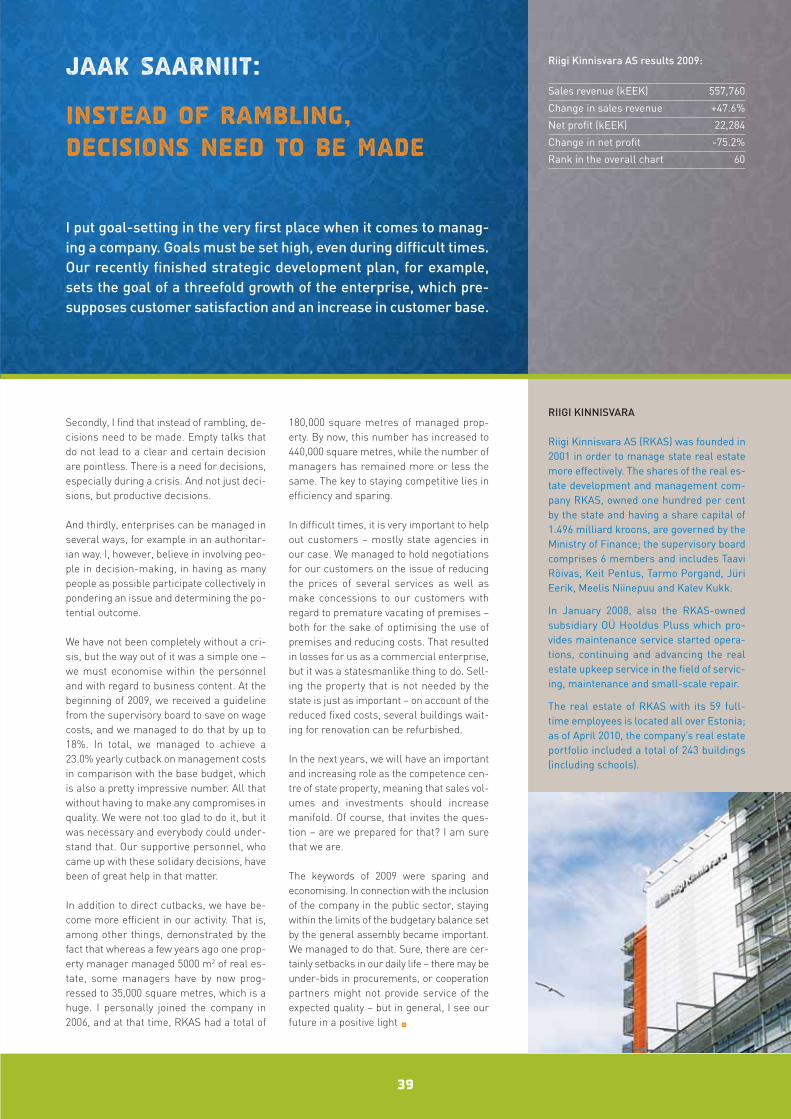
Secondly, I find that instead of rambling, de-cisions need to be made. Empty talks thatdo not lead to a clear and certain decisionare pointless. There is a need for decisions,especially during a crisis. And not just deci-sions, but productive decisions.
And thirdly, enterprises can be managed inseveral ways, for example in an authoritar-ian way. I, however, believe in involving peo-ple in decision-making, in having as manypeople as possible participate collectively inpondering an issue and determining the po-tential outcome.
We have not been completely without a cri-sis, but the way out of it was a simple one –we must economise within the personneland with regard to business content. At thebeginning of 2009, we received a guidelinefrom the supervisory board to save on wagecosts, and we managed to do that by up to18%. In total, we managed to achieve a23.0% yearly cutback on management costsin comparison with the base budget, whichis also a pretty impressive number. All thatwithout having to make any compromises inquality. We were not too glad to do it, but itwas necessary and everybody could under-stand that. Our supportive personnel, whocame up with these solidary decisions, havebeen of great help in that matter.
In addition to direct cutbacks, we have be-come more efficient in our activity. That is,among other things, demonstrated by thefact that whereas a few years ago one prop-erty manager managed 5000 m2 of real es-tate, some managers have by now prog -ressed to 35,000 square metres, which is ahuge. I personally joined the company in2006, and at that time, RKAS had a total of
180,000 square metres of managed prop-erty. By now, this number has increased to440,000 square metres, while the number ofmanagers has remained more or less thesame. The key to staying competitive lies inefficiency and sparing.
In difficult times, it is very important to helpout customers – mostly state agencies inour case. We managed to hold negotiationsfor our customers on the issue of reducingthe prices of several services as well asmake concessions to our customers withregard to premature vacating of premises –both for the sake of optimising the use ofpremises and reducing costs. That resultedin losses for us as a commercial enterprise,but it was a statesmanlike thing to do. Sell-ing the property that is not needed by thestate is just as important – on account of thereduced fixed costs, several buildings wait-ing for renovation can be refurbished.
In the next years, we will have an importantand increasing role as the competence cen-tre of state property, meaning that sales vol-umes and investments should increasemanifold. Of course, that invites the ques-tion – are we prepared for that? I am surethat we are.
The keywords of 2009 were sparing andeconomising. In connection with the inclusionof the company in the public sector, stayingwithin the limits of the budgetary balance setby the general assembly became important.We managed to do that. Sure, there are cer-tainly setbacks in our daily life – there may beunder-bids in procurements, or cooperationpartners might not provide service of the expected quality – but in general, I see ourfuture in a positive light •
39
Jaak Saarniit:
Instead of rambling, decisions need to be made
RIIGI KINNISVARA
Riigi Kinnisvara AS (RKAS) was founded in2001 in order to manage state real estatemore effectively. The shares of the real es-tate development and management com-pany RKAS, owned one hundred per centby the state and having a share capital of1.496 milliard kroons, are governed by theMinistry of Finance; the supervisory boardcomprises 6 members and includes TaaviRõivas, Keit Pentus, Tarmo Porgand, JüriEerik, Meelis Niinepuu and Kalev Kukk.
In January 2008, also the RKAS-ownedsubsidiary OÜ Hooldus Pluss which pro-vides maintenance service started opera-tions, continuing and advancing the realestate upkeep service in the field of servic-ing, maintenance and small-scale repair.
The real estate of RKAS with its 59 full-time employees is located all over Estonia;as of April 2010, the company’s real estateportfolio included a total of 243 buildings(including schools).
Riigi Kinnisvara AS results 2009:
Sales revenue (kEEK) 557,760
Change in sales revenue +47.6%
Net profit (kEEK) 22,284
Change in net profit -75.2%
Rank in the overall chart 60
I put goal-setting in the very first place when it comes to manag-ing a company. Goals must be set high, even during difficult times.Our recently finished strategic development plan, for example,sets the goal of a threefold growth of the enterprise, which pre-supposes customer satisfaction and an increase in customer base.
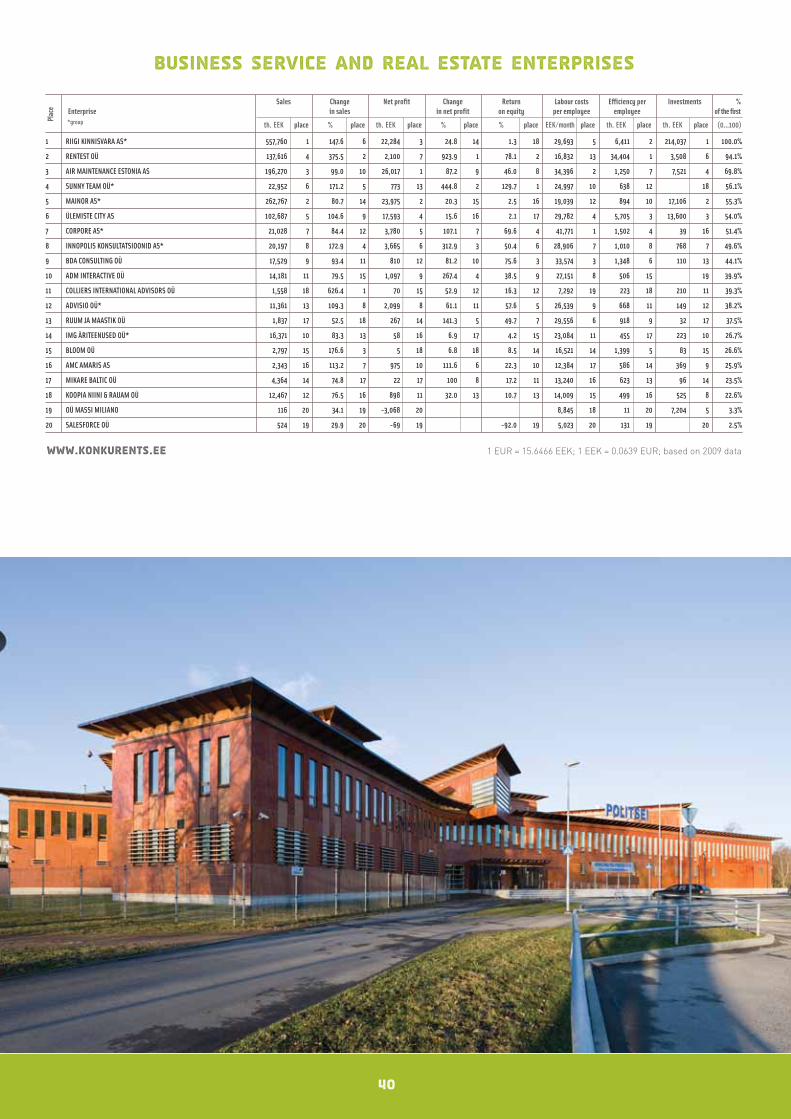
40
Business Service and Real Estate Enterprises
Sales Change Net profit Change Return Labour costs Efficiency per Investments %Enterprise in sales in net profit on equity per employee employee of the first*group th. EEK place % place th. EEK place % place % place EEK/month place th. EEK place th. EEK place (0...100)
Plac
e
www.konkurents.ee 1 EUR = 15.6466 EEK; 1 EEK = 0.0639 EUR; based on 2009 data
1 RIIGI KINNISVARA AS* 557,760 1 147.6 6 22,284 3 24.8 14 1.3 18 29,693 5 6,411 2 214,037 1 100.0%
2 RENTEST OÜ 137,616 4 375.5 2 2,100 7 923.9 1 78.1 2 16,832 13 34,404 1 3,508 6 94.1%
3 AIR MAINTENANCE ESTONIA AS 196,270 3 99.0 10 26,017 1 87.2 9 46.0 8 34,396 2 1,250 7 7,521 4 69.8%
4 SUNNY TEAM OÜ* 22,952 6 171.2 5 773 13 444.8 2 129.7 1 24,997 10 638 12 18 56.1%
5 MAINOR AS* 262,767 2 80.7 14 23,975 2 20.3 15 2.5 16 19,039 12 894 10 17,106 2 55.3%
6 ÜLEMISTE CITY AS 102,687 5 104.6 9 17,593 4 15.6 16 2.1 17 29,782 4 5,705 3 13,600 3 54.0%
7 CORPORE AS* 21,028 7 84.4 12 3,780 5 107.1 7 69.6 4 41,771 1 1,502 4 39 16 51.4%
8 INNOPOLIS KONSULTATSIOONID AS* 20,197 8 172.9 4 3,665 6 312.9 3 50.4 6 28,906 7 1,010 8 768 7 49.6%
9 BDA CONSULTING OÜ 17,529 9 93.4 11 810 12 81.2 10 75.6 3 33,574 3 1,348 6 110 13 44.1%
10 ADM INTERACTIVE OÜ 14,181 11 79.5 15 1,097 9 267.4 4 38.5 9 27,151 8 506 15 19 39.9%
11 COLLIERS INTERNATIONAL ADVISORS OÜ 1,558 18 626.4 1 70 15 52.9 12 16.3 12 7,292 19 223 18 210 11 39.3%
12 ADVISIO OÜ* 11,361 13 109.3 8 2,099 8 61.1 11 57.6 5 26,539 9 668 11 149 12 38.2%
13 RUUM JA MAASTIK OÜ 1,837 17 52.5 18 267 14 141.3 5 49.7 7 29,556 6 918 9 32 17 37.5%
14 IMG ÄRITEENUSED OÜ* 16,371 10 83.3 13 58 16 6.9 17 4.2 15 23,084 11 455 17 223 10 26.7%
15 BLOOM OÜ 2,797 15 176.6 3 5 18 6.8 18 8.5 14 16,521 14 1,399 5 83 15 26.6%
16 AMC AMARIS AS 2,343 16 113.2 7 975 10 111.6 6 22.3 10 12,384 17 586 14 369 9 25.9%
17 MIKARE BALTIC OÜ 4,364 14 74.8 17 22 17 100 8 17.2 11 13,240 16 623 13 96 14 23.5%
18 KOOPIA NIINI & RAUAM OÜ 12,467 12 76.5 16 898 11 32.0 13 10.7 13 14,009 15 499 16 525 8 22.6%
19 OÜ MASSI MILIANO 116 20 34.1 19 -3,068 20 8,845 18 11 20 7,204 5 3.3%
20 SALESFORCE OÜ 524 19 29.9 20 -69 19 -92.0 19 5,023 20 131 19 20 2.5%
41
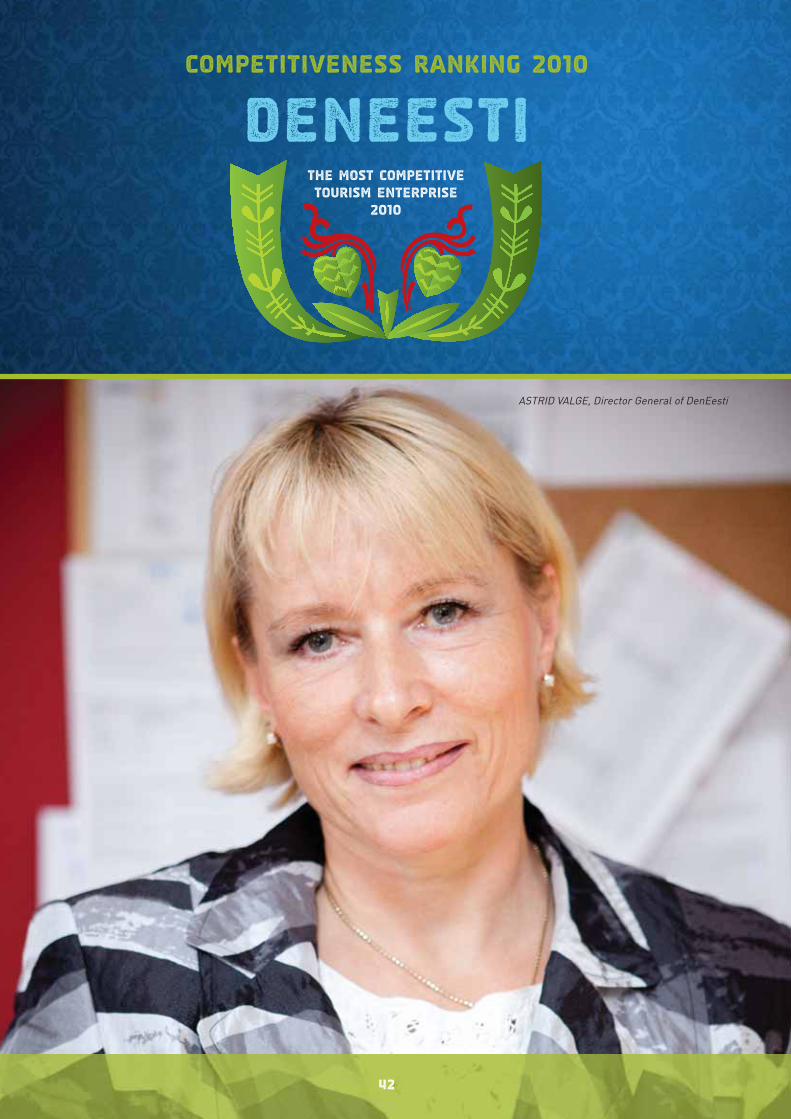
Competitiveness Ranking 2010
The Most Competitive Tourism Enterprise
2010
Deneesti
42
ASTRID VALGE, Director General of DenEesti
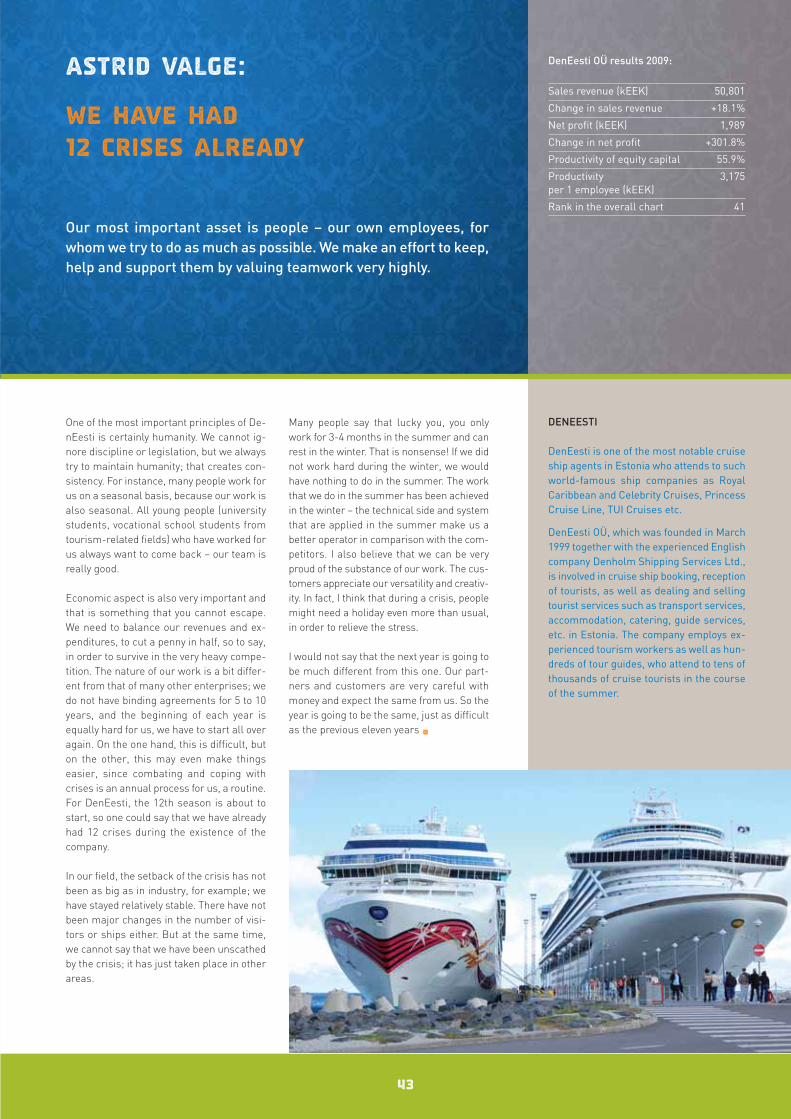
One of the most important principles of De-nEesti is certainly humanity. We cannot ig-nore discipline or legislation, but we alwaystry to maintain humanity; that creates con-sistency. For instance, many people work forus on a seasonal basis, because our work isalso seasonal. All young people (universitystudents, vocational school students fromtourism-related fields) who have worked forus always want to come back – our team isreally good.
Economic aspect is also very important andthat is something that you cannot escape.We need to balance our revenues and ex-penditures, to cut a penny in half, so to say,in order to survive in the very heavy compe-tition. The nature of our work is a bit differ-ent from that of many other enterprises; wedo not have binding agreements for 5 to 10years, and the beginning of each year isequally hard for us, we have to start all overagain. On the one hand, this is difficult, buton the other, this may even make thingseasier, since combating and coping withcrises is an annual process for us, a routine.For DenEesti, the 12th season is about tostart, so one could say that we have alreadyhad 12 crises during the existence of thecompany.
In our field, the setback of the crisis has notbeen as big as in industry, for example; wehave stayed relatively stable. There have notbeen major changes in the number of visi-tors or ships either. But at the same time,we cannot say that we have been unscathedby the crisis; it has just taken place in otherareas.
Many people say that lucky you, you onlywork for 3-4 months in the summer and canrest in the winter. That is nonsense! If we didnot work hard during the winter, we wouldhave nothing to do in the summer. The workthat we do in the summer has been achievedin the winter – the technical side and systemthat are applied in the summer make us abetter operator in comparison with the com-petitors. I also believe that we can be veryproud of the substance of our work. The cus-tomers appreciate our versatility and creativ-ity. In fact, I think that during a crisis, peoplemight need a holiday even more than usual,in order to relieve the stress.
I would not say that the next year is going tobe much different from this one. Our part-ners and customers are very careful withmoney and expect the same from us. So theyear is going to be the same, just as difficultas the previous eleven years •
43
Astrid Valge:
We have had 12 crises already
DENEESTI
DenEesti is one of the most notable cruiseship agents in Estonia who attends to suchworld-famous ship companies as RoyalCaribbean and Celebrity Cruises, PrincessCruise Line, TUI Cruises etc.
DenEesti OÜ, which was founded in March1999 together with the experienced Englishcompany Denholm Shipping Services Ltd.,is involved in cruise ship booking, receptionof tourists, as well as dealing and sellingtourist services such as transport services,accommodation, catering, guide services,etc. in Estonia. The company employs ex-perienced tourism workers as well as hun-dreds of tour guides, who attend to tens ofthousands of cruise tourists in the courseof the summer.
DenEesti OÜ results 2009:
Sales revenue (kEEK) 50,801
Change in sales revenue +18.1%
Net profit (kEEK) 1,989
Change in net profit +301.8%
Productivity of equity capital 55.9%
Productivity 3,175per 1 employee (kEEK)
Rank in the overall chart 41
Our most important asset is people – our own employees, forwhom we try to do as much as possible. We make an effort to keep,help and support them by valuing teamwork very highly.
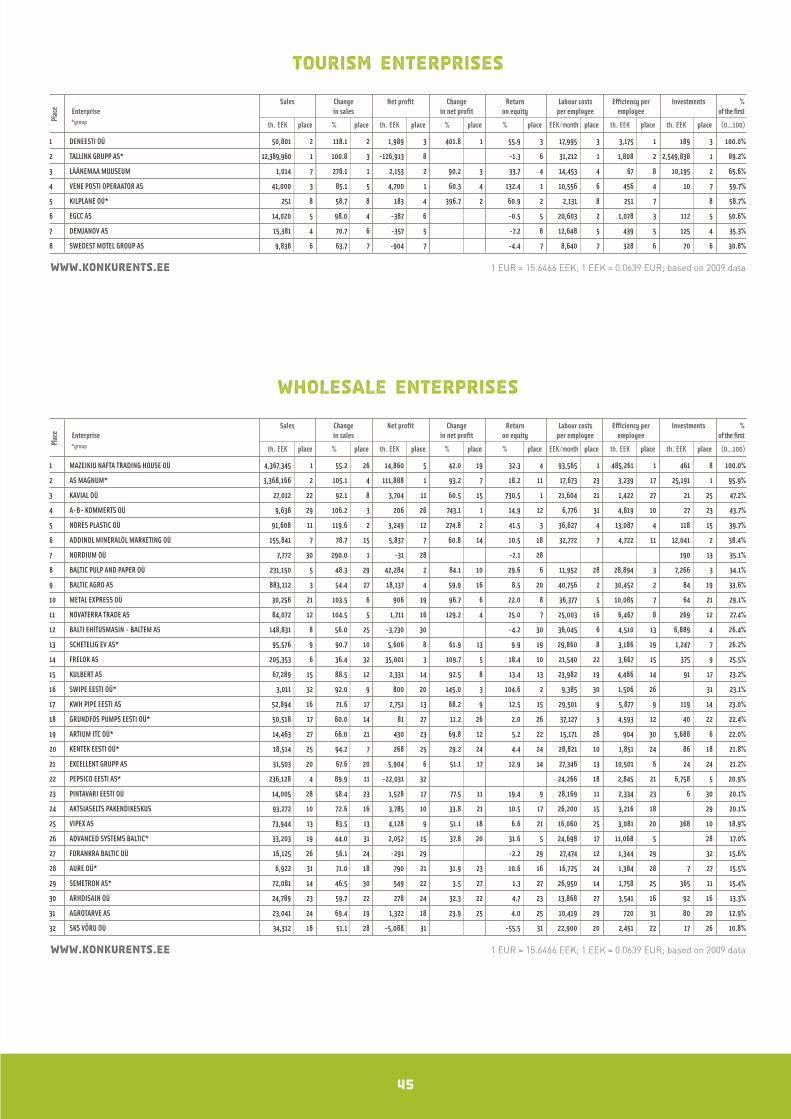
45
Tourism Enterprises
Sales Change Net profit Change Return Labour costs Efficiency per Investments %Enterprise in sales in net profit on equity per employee employee of the first*group th. EEK place % place th. EEK place % place % place EEK/month place th. EEK place th. EEK place (0...100)
Plac
e
www.konkurents.ee 1 EUR = 15.6466 EEK; 1 EEK = 0.0639 EUR; based on 2009 data
1 DENEESTI OÜ 50,801 2 118.1 2 1,989 3 401.8 1 55.9 3 17,995 3 3,175 1 189 3 100.0%
2 TALLINK GRUPP AS* 12,389,960 1 100.8 3 -126,913 8 -1.3 6 31,212 1 1,808 2 2,549,838 1 89.2%
3 LÄÄNEMAA MUUSEUM 1,014 7 278.1 1 2,153 2 90.2 3 33.7 4 14,453 4 67 8 10,195 2 65.6%
4 VENE POSTI OPERAATOR AS 41,000 3 85.1 5 4,700 1 60.3 4 132.4 1 10,556 6 456 4 10 7 59.7%
5 KILPLANE OÜ* 251 8 58.7 8 183 4 396.7 2 60.9 2 2,131 8 251 7 8 58.7%
6 EGCC AS 14,020 5 98.0 4 -387 6 -0.5 5 20,603 2 1,078 3 112 5 50.6%
7 DEMJANOV AS 15,381 4 70.7 6 -357 5 -7.2 8 12,648 5 439 5 125 4 35.3%
8 SWEDEST MOTEL GROUP AS 9,838 6 63.7 7 -904 7 -4.4 7 8,640 7 328 6 70 6 30.8%
Wholesale Enterprises
Sales Change Net profit Change Return Labour costs Efficiency per Investments %Enterprise in sales in net profit on equity per employee employee of the first*group th. EEK place % place th. EEK place % place % place EEK/month place th. EEK place th. EEK place (0...100)
Plac
e
www.konkurents.ee 1 EUR = 15.6466 EEK; 1 EEK = 0.0639 EUR; based on 2009 data
1 MAZEIKIU NAFTA TRADING HOUSE OÜ 4,367,345 1 55.2 26 14,860 5 42.0 19 32.3 4 93,565 1 485,261 1 461 8 100.0%
2 AS MAGNUM* 3,368,166 2 105.1 4 111,888 1 93.2 7 18.2 11 17,673 23 3,239 17 25,191 1 95.9%
3 KAVIAL OÜ 27,012 22 92.1 8 3,704 11 60.5 15 730.5 1 21,604 21 1,422 27 21 25 47.2%
4 A-B- KOMMERTS OÜ 9,638 29 106.2 3 206 26 743.1 1 14.9 12 6,776 31 4,819 10 27 23 43.7%
5 NORES PLASTIC OÜ 91,608 11 119.6 2 3,249 12 274.8 2 41.5 3 36,627 4 13,087 4 118 15 39.7%
6 ADDINOL MINERALÖL MARKETING OÜ 155,841 7 78.7 15 5,837 7 60.8 14 10.5 18 32,772 7 4,722 11 12,041 2 38.4%
7 NORDIUM OÜ 7,772 30 290.0 1 -31 28 -2.1 28 190 13 35.1%
8 BALTIC PULP AND PAPER OÜ 231,150 5 48.3 29 42,284 2 84.1 10 29.6 6 11,952 28 28,894 3 7,266 3 34.1%
9 BALTIC AGRO AS 883,112 3 54.4 27 18,137 4 59.9 16 8.5 20 40,756 2 30,452 2 84 19 33.6%
10 METAL EXPRESS OÜ 30,256 21 103.5 6 906 19 96.7 6 22.0 8 36,377 5 10,085 7 64 21 29.1%
11 NOVATERRA TRADE AS 84,072 12 104.5 5 1,711 16 129.2 4 25.0 7 25,003 16 6,467 8 269 12 27.4%
12 BALTI EHITUSMASIN - BALTEM AS 148,831 8 56.0 25 -3,730 30 -4.2 30 36,045 6 4,510 13 6,889 4 26.4%
13 SCHETELIG EV AS* 95,576 9 90.7 10 5,606 8 61.9 13 9.9 19 29,860 8 3,186 19 1,247 7 26.2%
14 FRELOK AS 205,353 6 36.4 32 35,001 3 109.7 5 18.4 10 21,540 22 3,667 15 375 9 25.5%
15 KULBERT AS 67,289 15 88.5 12 2,331 14 92.5 8 13.4 13 23,982 19 4,486 14 91 17 23.2%
16 SWIPE EESTI OÜ* 3,011 32 92.0 9 800 20 145.0 3 104.6 2 9,385 30 1,506 26 31 23.1%
17 KWH PIPE EESTI AS 52,894 16 71.6 17 2,751 13 88.2 9 12.5 15 29,501 9 5,877 9 119 14 23.0%
18 GRUNDFOS PUMPS EESTI OÜ* 50,518 17 80.0 14 81 27 11.2 26 2.0 26 37,127 3 4,593 12 40 22 22.4%
19 ARTIUM ITC OÜ* 14,463 27 66.0 21 430 23 69.8 12 5.2 22 15,171 26 904 30 5,688 6 22.0%
20 KENTEK EESTI OÜ* 18,514 25 94.2 7 268 25 29.2 24 4.4 24 28,821 10 1,851 24 86 18 21.8%
21 EXCELLENT GRUPP AS 31,503 20 67.6 20 5,904 6 51.1 17 12.9 14 27,346 13 10,501 6 24 24 21.2%
22 PEPSICO EESTI AS* 236,128 4 89.9 11 -22,031 32 24,266 18 2,845 21 6,758 5 20.9%
23 PINTAVÄRI EESTI OÜ 14,005 28 58.4 23 1,528 17 77.5 11 19.4 9 28,169 11 2,334 23 6 30 20.1%
24 AKTSIASELTS PAKENDIKESKUS 93,272 10 72.6 16 3,785 10 33.8 21 10.5 17 26,200 15 3,216 18 29 20.1%
25 VIPEX AS 73,944 13 83.5 13 4,128 9 51.1 18 6.6 21 16,060 25 3,081 20 368 10 18.9%
26 ADVANCED SYSTEMS BALTIC* 33,203 19 44.0 31 2,052 15 37.8 20 31.6 5 24,698 17 11,068 5 28 17.0%
27 FORANKRA BALTIC OÜ 16,125 26 56.1 24 -291 29 -2.2 29 27,474 12 1,344 29 32 15.6%
28 AURE OÜ* 6,922 31 71.0 18 790 21 31.9 23 10.6 16 16,725 24 1,384 28 7 27 15.5%
29 SEMETRON AS* 72,081 14 46.5 30 549 22 3.5 27 1.3 27 26,950 14 1,758 25 365 11 15.4%
30 ARHDISAIN OÜ 24,789 23 59.7 22 278 24 32.3 22 4.7 23 13,868 27 3,541 16 92 16 13.3%
31 AGROTARVE AS 23,041 24 69.4 19 1,322 18 23.9 25 4.0 25 10,419 29 720 31 80 20 12.9%
32 SKS VÕRU OÜ 34,312 18 51.1 28 -5,088 31 -55.5 31 22,900 20 2,451 22 17 26 10.8%
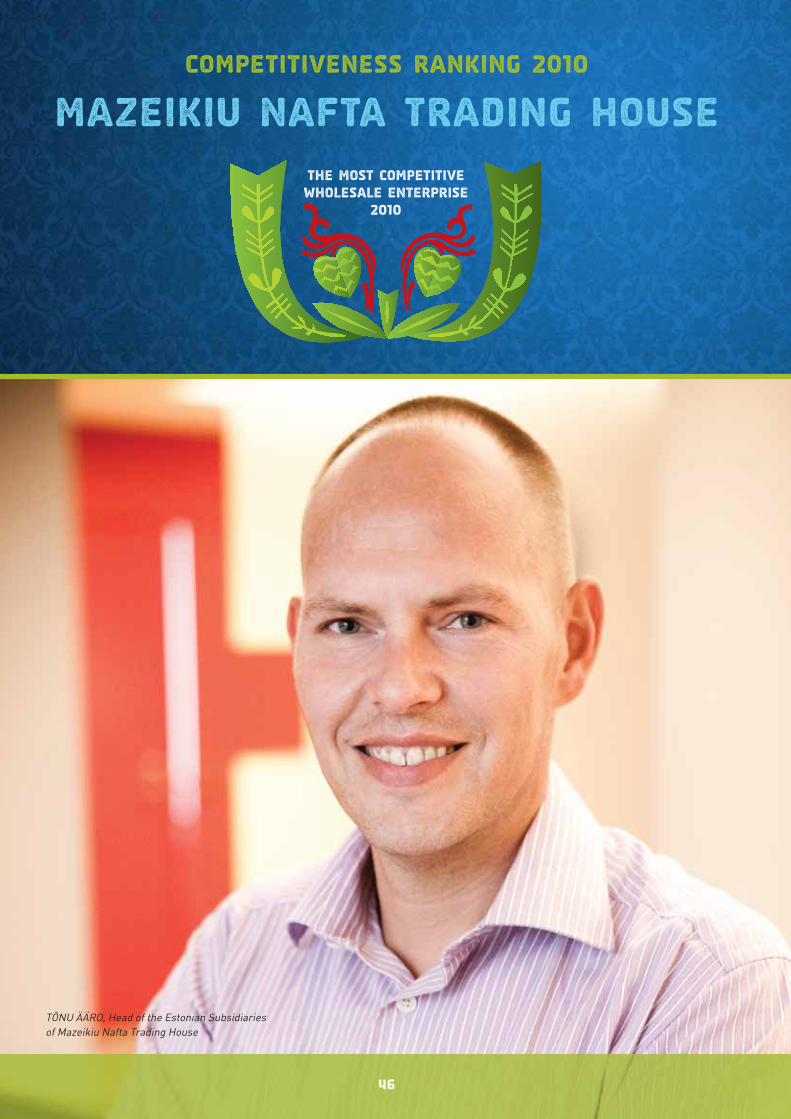
Competitiveness Ranking 2010
The Most Competitive Wholesale Enterprise
2010
Mazeikiu Nafta Trading House
46
TÕNU ÄÄRO, Head of the Estonian Subsidiaries of Mazeikiu Nafta Trading House
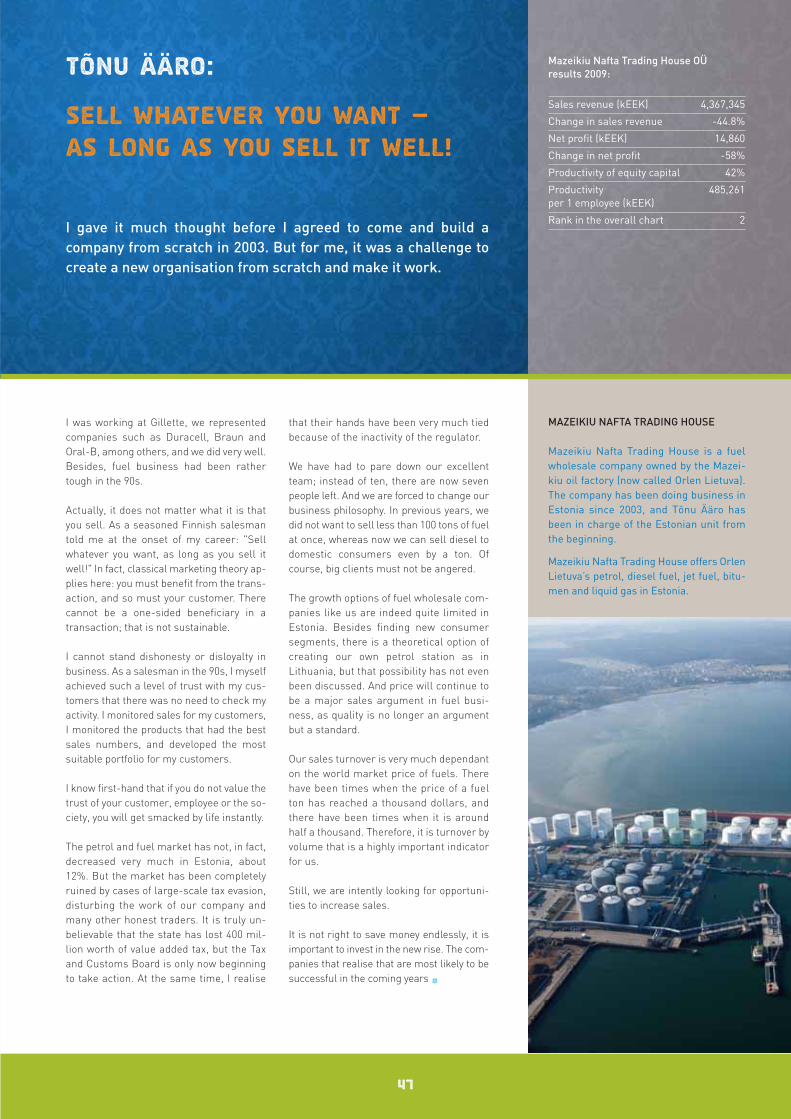
I was working at Gillette, we representedcompanies such as Duracell, Braun andOral-B, among others, and we did very well.Besides, fuel business had been rathertough in the 90s.
Actually, it does not matter what it is thatyou sell. As a seasoned Finnish salesmantold me at the onset of my career: "Sellwhatever you want, as long as you sell itwell!" In fact, classical marketing theory ap-plies here: you must benefit from the trans-action, and so must your customer. Therecannot be a one-sided beneficiary in atransaction; that is not sustainable.
I cannot stand dishonesty or disloyalty inbusiness. As a salesman in the 90s, I myselfachieved such a level of trust with my cus-tomers that there was no need to check myactivity. I monitored sales for my customers,I monitored the products that had the bestsales numbers, and developed the mostsuitable portfolio for my customers.
I know first-hand that if you do not value thetrust of your customer, employee or the so-ciety, you will get smacked by life instantly.
The petrol and fuel market has not, in fact,decreased very much in Estonia, about12%. But the market has been completelyruined by cases of large-scale tax evasion,disturbing the work of our company andmany other honest traders. It is truly un-believable that the state has lost 400 mil-lion worth of value added tax, but the Taxand Customs Board is only now beginningto take action. At the same time, I realise
that their hands have been very much tiedbecause of the inactivity of the regulator.
We have had to pare down our excellentteam; instead of ten, there are now sevenpeople left. And we are forced to change ourbusiness philosophy. In previous years, wedid not want to sell less than 100 tons of fuelat once, whereas now we can sell diesel todomestic consumers even by a ton. Ofcourse, big clients must not be angered.
The growth options of fuel wholesale com-panies like us are indeed quite limited in Estonia. Besides finding new consumersegments, there is a theoretical option ofcreating our own petrol station as inLithuania, but that possibility has not evenbeen discussed. And price will continue tobe a major sales argument in fuel busi-ness, as quality is no longer an argumentbut a standard.
Our sales turnover is very much dependanton the world market price of fuels. Therehave been times when the price of a fuelton has reached a thousand dollars, andthere have been times when it is aroundhalf a thousand. Therefore, it is turnover byvolume that is a highly important indicatorfor us.
Still, we are intently looking for opportuni-ties to increase sales.
It is not right to save money endlessly, it isimportant to invest in the new rise. The com-panies that realise that are most likely to besuccessful in the coming years •
47
Tõnu Ääro:
Sell whatever you want — as long as you sell it well!
MAZEIKIU NAFTA TRADING HOUSE
Mazeikiu Nafta Trading House is a fuelwholesale company owned by the Mazei -kiu oil factory (now called Orlen Lietuva).The company has been doing business inEstonia since 2003, and Tõnu Ääro hasbeen in charge of the Estonian unit fromthe beginning.
Mazeikiu Nafta Trading House offers OrlenLietuva’s petrol, diesel fuel, jet fuel, bitu-men and liquid gas in Estonia.
Mazeikiu Nafta Trading House OÜ results 2009:
Sales revenue (kEEK) 4,367,345
Change in sales revenue -44.8%
Net profit (kEEK) 14,860
Change in net profit -58%
Productivity of equity capital 42%
Productivity 485,261per 1 employee (kEEK)
Rank in the overall chart 2I gave it much thought before I agreed to come and build a company from scratch in 2003. But for me, it was a challenge tocreate a new organisation from scratch and make it work.
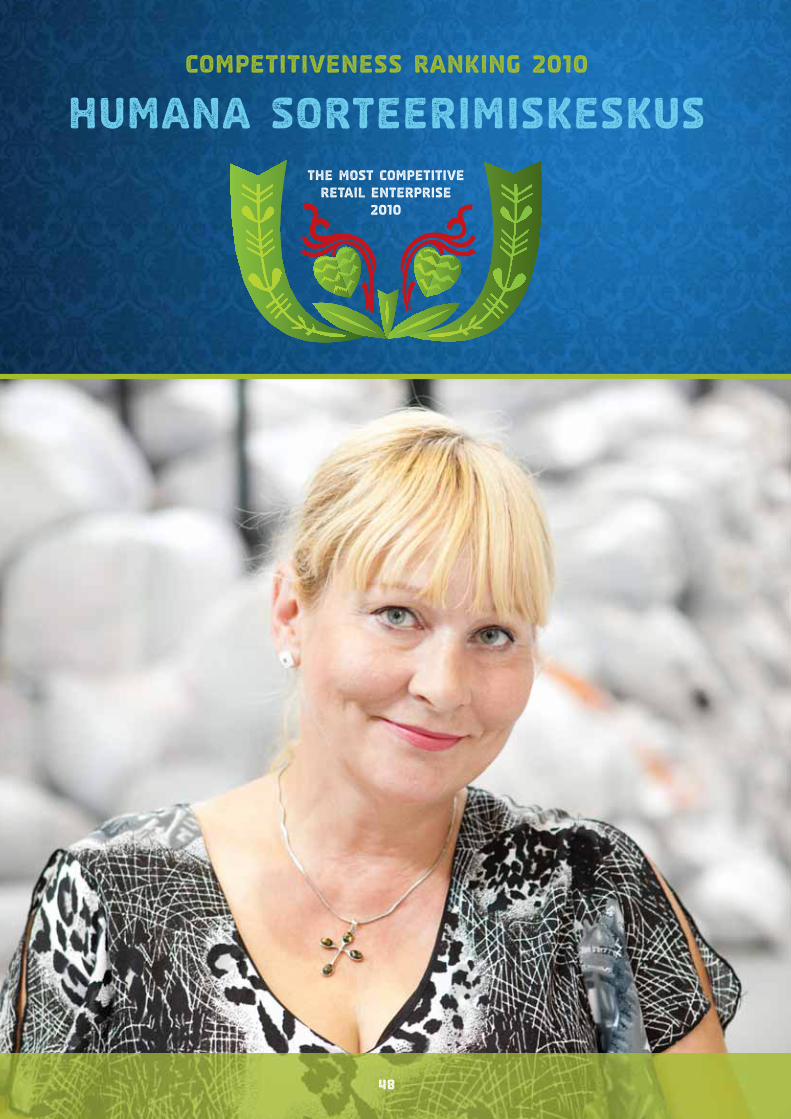
Competitiveness Ranking 2010
The Most Competitive Retail Enterprise
2010
Humana Sorteerimiskeskus
48
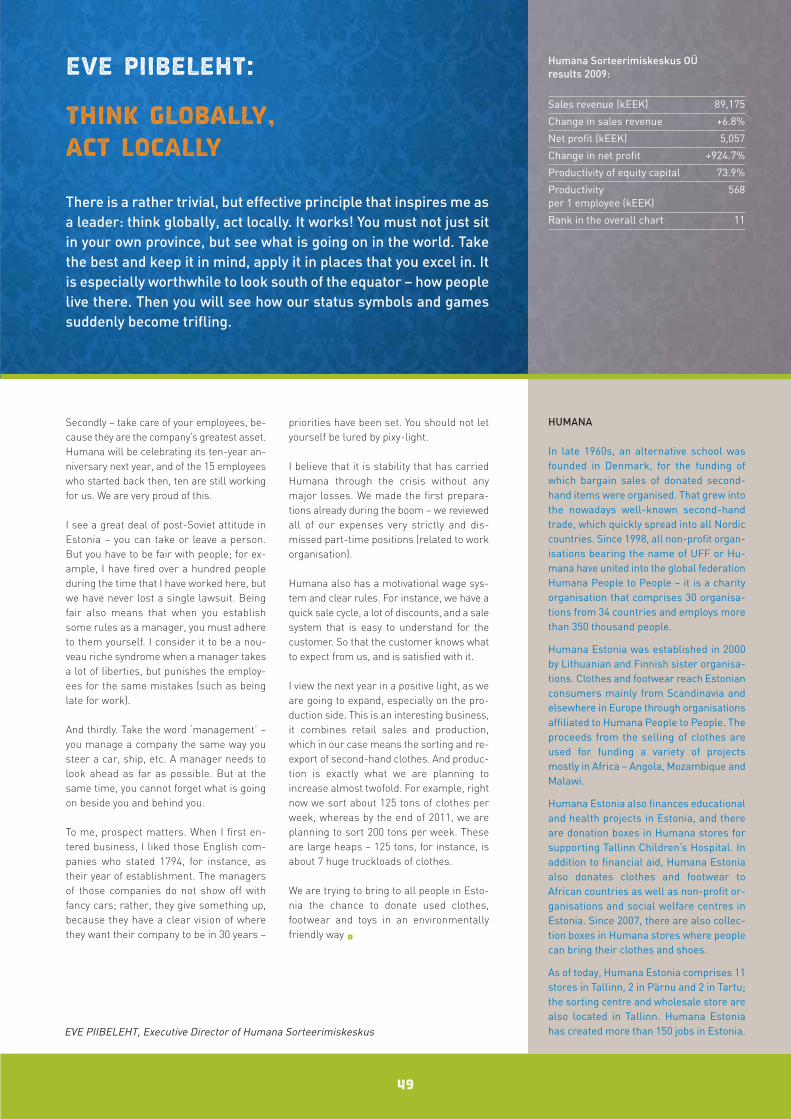
Secondly – take care of your employees, be-cause they are the company’s greatest asset.Humana will be celebrating its ten-year an-niversary next year, and of the 15 employeeswho started back then, ten are still workingfor us. We are very proud of this.
I see a great deal of post-Soviet attitude inEstonia – you can take or leave a person.But you have to be fair with people; for ex-ample, I have fired over a hundred peopleduring the time that I have worked here, butwe have never lost a single lawsuit. Beingfair also means that when you establishsome rules as a manager, you must adhereto them yourself. I consider it to be a nou-veau riche syndrome when a manager takesa lot of liberties, but punishes the employ-ees for the same mistakes (such as beinglate for work).
And thirdly. Take the word ‘management’ –you manage a company the same way yousteer a car, ship, etc. A manager needs tolook ahead as far as possible. But at thesame time, you cannot forget what is goingon beside you and behind you.
To me, prospect matters. When I first en-tered business, I liked those English com-panies who stated 1794, for instance, astheir year of establishment. The managersof those companies do not show off withfancy cars; rather, they give something up,because they have a clear vision of wherethey want their company to be in 30 years –
priorities have been set. You should not letyourself be lured by pixy-light.
I believe that it is stability that has carriedHumana through the crisis without anymajor losses. We made the first prepara-tions already during the boom – we reviewedall of our expenses very strictly and dis-missed part-time positions (related to workorganisation).
Humana also has a motivational wage sys-tem and clear rules. For instance, we have aquick sale cycle, a lot of discounts, and a salesystem that is easy to understand for thecustomer. So that the customer knows whatto expect from us, and is satisfied with it.
I view the next year in a positive light, as weare going to expand, especially on the pro-duction side. This is an interesting business,it combines retail sales and production,which in our case means the sorting and re-export of second-hand clothes. And produc-tion is exactly what we are planning toincrease almost twofold. For example, rightnow we sort about 125 tons of clothes perweek, whereas by the end of 2011, we areplanning to sort 200 tons per week. Theseare large heaps – 125 tons, for instance, isabout 7 huge truckloads of clothes.
We are trying to bring to all people in Esto-nia the chance to donate used clothes,footwear and toys in an environmentallyfriendly way •
49
Eve Piibeleht:
Think globally, act locally
HUMANA
In late 1960s, an alternative school wasfounded in Denmark, for the funding ofwhich bargain sales of donated second-hand items were organised. That grew intothe nowadays well-known second-handtrade, which quickly spread into all Nordiccountries. Since 1998, all non-profit organ-isations bearing the name of UFF or Hu-mana have united into the global federationHumana People to People – it is a charityorganisation that comprises 30 organisa-tions from 34 countries and employs morethan 350 thousand people.
Humana Estonia was established in 2000by Lithuanian and Finnish sister organisa-tions. Clothes and footwear reach Estonianconsumers mainly from Scandinavia andelsewhere in Europe through organisationsaffiliated to Humana People to People. Theproceeds from the selling of clothes areused for funding a variety of projectsmostly in Africa – Angola, Mozambique andMalawi.
Humana Estonia also finances educationaland health projects in Estonia, and thereare donation boxes in Humana stores forsupporting Tallinn Children’s Hospital. Inaddition to financial aid, Humana Estoniaalso donates clothes and footwear toAfrican countries as well as non-profit or-ganisations and social welfare centres inEstonia. Since 2007, there are also collec-tion boxes in Humana stores where peoplecan bring their clothes and shoes.
As of today, Humana Estonia comprises 11stores in Tallinn, 2 in Pärnu and 2 in Tartu;the sorting centre and wholesale store arealso located in Tallinn. Humana Estoniahas created more than 150 jobs in Estonia.
Humana Sorteerimiskeskus OÜ results 2009:
Sales revenue (kEEK) 89,175
Change in sales revenue +6.8%
Net profit (kEEK) 5,057
Change in net profit +924.7%
Productivity of equity capital 73.9%
Productivity 568per 1 employee (kEEK)
Rank in the overall chart 11
There is a rather trivial, but effective principle that inspires me asa leader: think globally, act locally. It works! You must not just sitin your own province, but see what is going on in the world. Takethe best and keep it in mind, apply it in places that you excel in. Itis especially worthwhile to look south of the equator – how peoplelive there. Then you will see how our status symbols and gamessuddenly become trifling.
EVE PIIBELEHT, Executive Director of Humana Sorteerimiskeskus
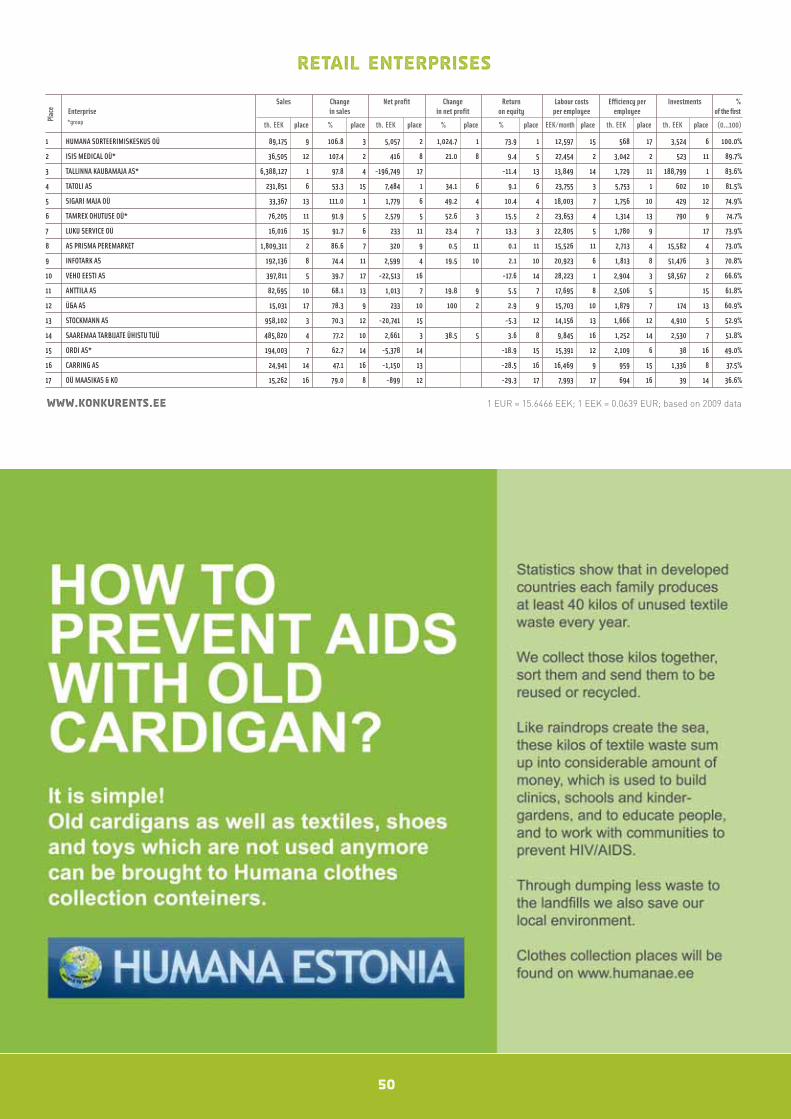
50
Retail Enterprises
Sales Change Net profit Change Return Labour costs Efficiency per Investments %Enterprise in sales in net profit on equity per employee employee of the first*group th. EEK place % place th. EEK place % place % place EEK/month place th. EEK place th. EEK place (0...100)
Plac
e
www.konkurents.ee 1 EUR = 15.6466 EEK; 1 EEK = 0.0639 EUR; based on 2009 data
1 HUMANA SORTEERIMISKESKUS OÜ 89,175 9 106.8 3 5,057 2 1,024.7 1 73.9 1 12,597 15 568 17 3,524 6 100.0%
2 ISIS MEDICAL OÜ* 36,505 12 107.4 2 416 8 21.0 8 9.4 5 27,454 2 3,042 2 523 11 89.7%
3 TALLINNA KAUBAMAJA AS* 6,388,127 1 97.8 4 -196,749 17 -11.4 13 13,849 14 1,729 11 188,799 1 83.6%
4 TATOLI AS 231,851 6 53.3 15 7,484 1 34.1 6 9.1 6 23,755 3 5,753 1 602 10 81.5%
5 SIGARI MAJA OÜ 33,367 13 111.0 1 1,779 6 49.2 4 10.4 4 18,003 7 1,756 10 429 12 74.9%
6 TAMREX OHUTUSE OÜ* 76,205 11 91.9 5 2,579 5 52.6 3 15.5 2 23,653 4 1,314 13 790 9 74.7%
7 LUKU SERVICE OÜ 16,016 15 91.7 6 233 11 23.4 7 13.3 3 22,805 5 1,780 9 17 73.9%
8 AS PRISMA PEREMARKET 1,809,311 2 86.6 7 320 9 0.5 11 0.1 11 15,526 11 2,713 4 15,582 4 73.0%
9 INFOTARK AS 192,136 8 74.4 11 2,599 4 19.5 10 2.1 10 20,923 6 1,813 8 51,476 3 70.8%
10 VEHO EESTI AS 397,811 5 39.7 17 -22,513 16 -17.6 14 28,223 1 2,904 3 58,567 2 66.6%
11 ANTTILA AS 82,695 10 68.1 13 1,013 7 19.8 9 5.5 7 17,695 8 2,506 5 15 61.8%
12 Ü&A AS 15,031 17 78.3 9 233 10 100 2 2.9 9 15,703 10 1,879 7 174 13 60.9%
13 STOCKMANN AS 958,102 3 70.3 12 -20,741 15 -5.3 12 14,156 13 1,666 12 4,910 5 52.9%
14 SAAREMAA TARBIJATE ÜHISTU TUÜ 485,820 4 77.2 10 2,661 3 38.5 5 3.6 8 9,845 16 1,252 14 2,530 7 51.8%
15 ORDI AS* 194,003 7 62.7 14 -5,378 14 -18.9 15 15,391 12 2,109 6 38 16 49.0%
16 CARRING AS 24,941 14 47.1 16 -1,150 13 -28.5 16 16,469 9 959 15 1,336 8 37.5%
17 OÜ MAASIKAS & KO 15,262 16 79.0 8 -899 12 -29.3 17 7,993 17 694 16 39 14 36.6%
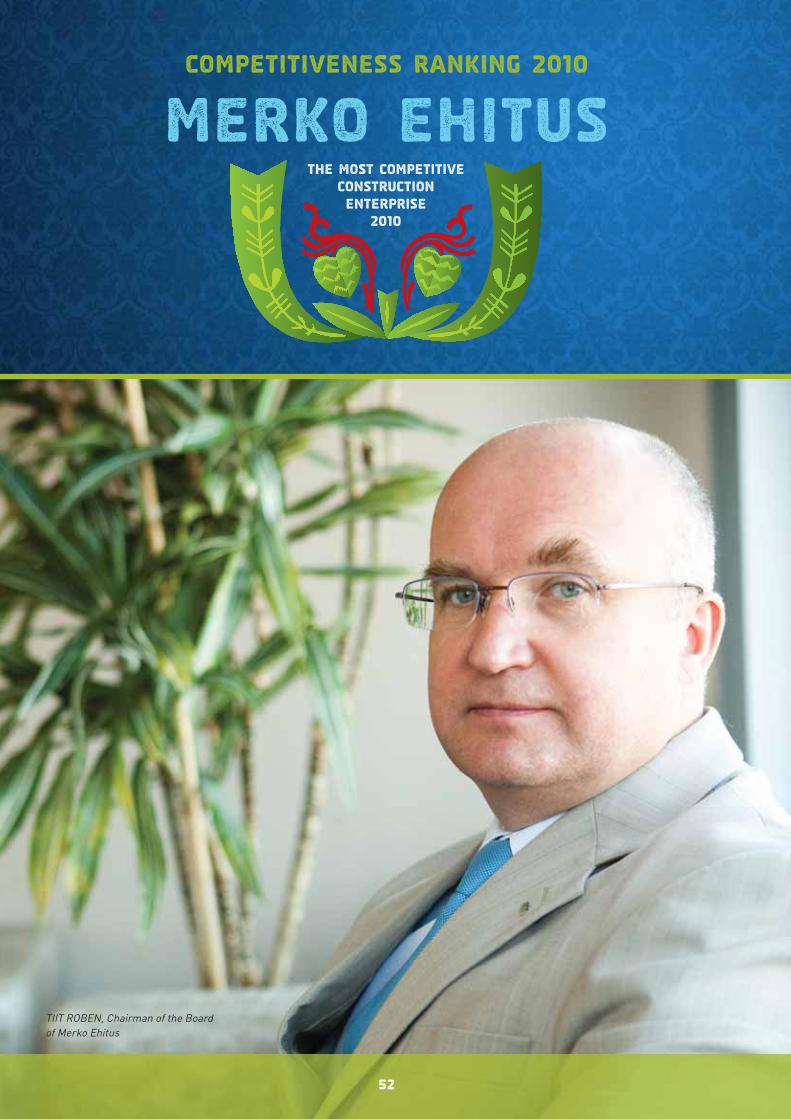
Competitiveness Ranking 2010
The Most Competitive Construction Enterprise
2010
Merko Ehitus
52
TIIT ROBEN, Chairman of the Board of Merko Ehitus
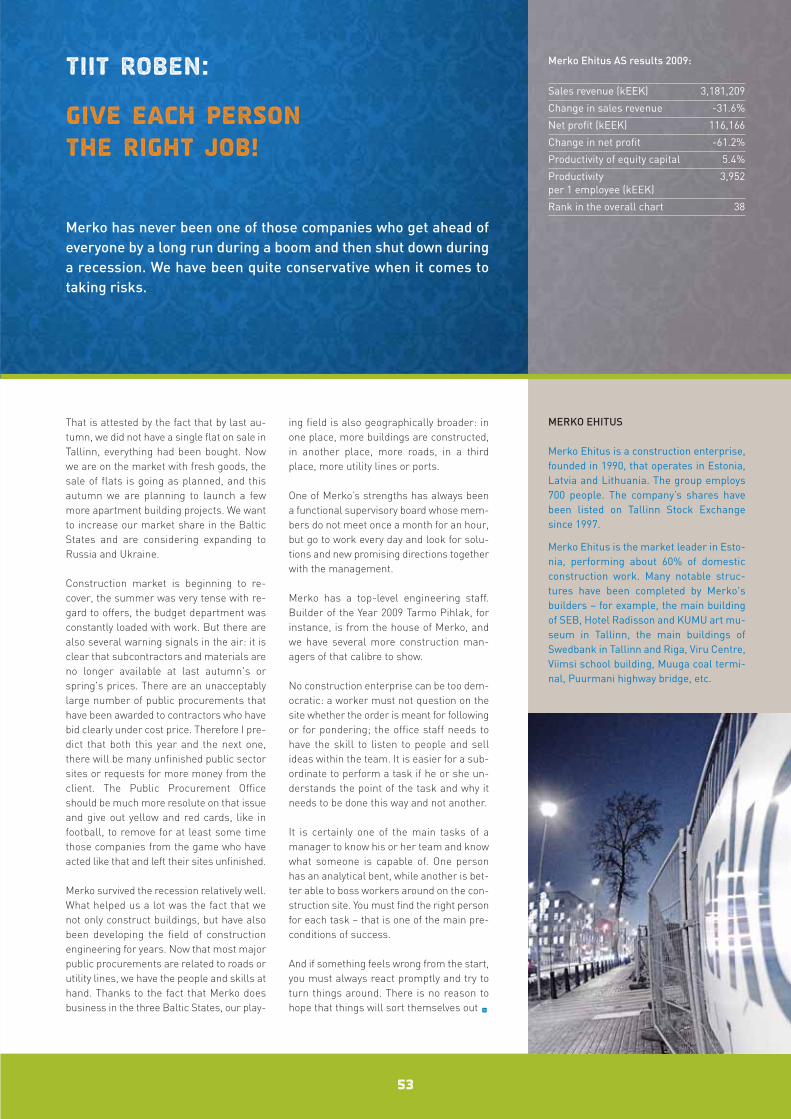
That is attested by the fact that by last au-tumn, we did not have a single flat on sale inTallinn, everything had been bought. Nowwe are on the market with fresh goods, thesale of flats is going as planned, and thisautumn we are planning to launch a fewmore apartment building projects. We wantto increase our market share in the BalticStates and are considering expanding toRussia and Ukraine.
Construction market is beginning to re-cover, the summer was very tense with re-gard to offers, the budget department wasconstantly loaded with work. But there arealso several warning signals in the air: it isclear that subcontractors and materials areno longer available at last autumn's orspring's prices. There are an unacceptablylarge number of public procurements thathave been awarded to contractors who havebid clearly under cost price. Therefore I pre-dict that both this year and the next one,there will be many unfinished public sectorsites or requests for more money from theclient. The Public Procurement Officeshould be much more resolute on that issueand give out yellow and red cards, like infootball, to remove for at least some timethose companies from the game who haveacted like that and left their sites unfinished.
Merko survived the recession relatively well.What helped us a lot was the fact that wenot only construct buildings, but have alsobeen developing the field of constructionengineering for years. Now that most majorpublic procurements are related to roads orutility lines, we have the people and skills athand. Thanks to the fact that Merko doesbusiness in the three Baltic States, our play-
ing field is also geographically broader: inone place, more buildings are constructed,in another place, more roads, in a thirdplace, more utility lines or ports.
One of Merko’s strengths has always beena functional supervisory board whose mem-bers do not meet once a month for an hour,but go to work every day and look for solu-tions and new promising directions togetherwith the management.
Merko has a top-level engineering staff.Builder of the Year 2009 Tarmo Pihlak, forinstance, is from the house of Merko, andwe have several more construction man-agers of that calibre to show.
No construction enterprise can be too dem-ocratic: a worker must not question on thesite whether the order is meant for followingor for pondering; the office staff needs tohave the skill to listen to people and sellideas within the team. It is easier for a sub-ordinate to perform a task if he or she un-derstands the point of the task and why itneeds to be done this way and not another.
It is certainly one of the main tasks of amanager to know his or her team and knowwhat someone is capable of. One personhas an analytical bent, while another is bet-ter able to boss workers around on the con-struction site. You must find the right personfor each task – that is one of the main pre-conditions of success.
And if something feels wrong from the start,you must always react promptly and try toturn things around. There is no reason tohope that things will sort themselves out •
53
Tiit Roben:
Give each person the right job!
MERKO EHITUS
Merko Ehitus is a construction enterprise,founded in 1990, that operates in Estonia,Latvia and Lithuania. The group employs700 people. The company’s shares havebeen listed on Tallinn Stock Exchangesince 1997.
Merko Ehitus is the market leader in Esto-nia, performing about 60% of domesticconstruction work. Many notable struc-tures have been completed by Merko'sbuilders – for example, the main buildingof SEB, Hotel Radisson and KUMU art mu-seum in Tallinn, the main buildings ofSwedbank in Tallinn and Riga, Viru Centre,Viimsi school building, Muuga coal termi-nal, Puurmani highway bridge, etc.
Merko Ehitus AS results 2009:
Sales revenue (kEEK) 3,181,209
Change in sales revenue -31.6%
Net profit (kEEK) 116,166
Change in net profit -61.2%
Productivity of equity capital 5.4%
Productivity 3,952per 1 employee (kEEK)
Rank in the overall chart 38
Merko has never been one of those companies who get ahead ofeveryone by a long run during a boom and then shut down duringa recession. We have been quite conservative when it comes totaking risks.

54
Construction Enterprises
Sales Change Net profit Change Return Labour costs Efficiency per Investments %Enterprise in sales in net profit on equity per employee employee of the first*group th. EEK place % place th. EEK place % place % place EEK/month place th. EEK place th. EEK place (0...100)
Plac
e
www.konkurents.ee 1 EUR = 15.6466 EEK; 1 EEK = 0.0639 EUR; based on 2009 data
1 MERKO EHITUS AS* 3,181,209 1 68.4 21 116,166 1 38.8 22 5.4 24 37,532 3 3,952 7 119,863 3 100.0%
2 KAAMOS EHITUS OÜ 109,994 11 46.7 35 23,388 4 177.8 7 61.1 2 44,958 1 10,999 1 34 75.5%
3 RIVERSIDE OÜ* 88,543 16 67.6 22 14,106 8 127.3 10 55.4 3 23,353 13 4,216 6 225,785 1 71.7%
4 AS IREST EHITUS* 379,546 4 106.9 4 35,750 3 356.5 3 47.5 5 14,943 31 6,122 2 539 18 70.3%
5 KAEFER ISOLATSIOONITEHNIKA OÜ 42,232 27 121.8 2 4,524 13 198.9 5 33.7 8 43,389 2 704 33 490 20 66.5%
6 NORDIC CONTRACTORS AS* 2,542,763 2 64.0 25 -77,621 39 -8.0 32 27,181 5 2,185 11 195,453 2 66.1%
7 VALMAP GRUPP AS 49,327 26 93.2 10 4,402 14 244.3 4 914.1 1 13,734 34 759 31 1,602 12 64.5%
8 NAPAL AS 65,163 19 130.5 1 1,000 23 120.5 12 10.6 21 25,904 7 4,654 4 338 22 62.1%
9 SCHÖTTLI KESKKONNATEHNIKA AS 36,133 29 84.6 12 2,167 19 574.3 1 22.9 12 16,098 28 2,409 10 890 15 59.4%
10 AS JÄRVA TEED 92,695 13 100.0 9 8,349 10 379.5 2 40.2 7 19,832 23 1,287 19 3,066 9 56.5%
11 VIIMSI KEEVITUS AS 159,641 9 79.0 16 38,340 2 111.2 14 43.3 6 22,629 17 4,695 3 8,057 5 54.5%
12 OÜ HIIU TEED 91,877 15 103.4 6 9,757 9 147.2 8 30.1 9 26,590 6 1,997 13 214 26 53.1%
13 HARJU EHITUS AS* 141,072 10 65.3 24 14,678 7 188.5 6 16.9 15 19,937 21 4,275 5 574 17 47.4%
14 NORDECON INFRA AS* 1,142,104 3 92.6 11 -11,132 38 -4.8 31 23,833 10 1,749 15 4,423 7 47.2%
15 WINDOOR AS 63,529 21 110.6 3 7,170 12 130.7 9 23.0 11 17,812 27 1,513 17 37 46.7%
16 T-TAMMER OÜ 85,003 17 103.2 7 2,569 18 45.6 21 15.4 16 22,941 16 1,546 16 2,934 10 44.4%
17 TEEDE TEHNOKESKUS AS 58,292 22 83.3 14 3,305 16 60.1 19 11.5 20 31,966 4 857 28 651 16 44.1%
18 K-PROJEKT AS 64,641 20 81.0 15 14,693 6 123.3 11 52.5 4 24,148 8 839 29 97 31 43.6%
19 K & H AS 304,021 5 77.5 19 296 29 21.9 26 0.5 28 23,920 9 3,200 8 217 25 42.4%
20 AS LINDREM 57,549 23 104.0 5 -663 32 -10.0 33 23,155 14 1,199 20 185 28 40.8%
21 P.P.EHITUS OÜ 5,265 36 100.5 8 1,347 22 50.2 20 13.1 19 14,738 33 2,632 9 35 40.0%
22 NORDECON BETOON OÜ* 179,340 8 78.7 17 3,550 15 87.1 17 13.1 17 22,416 18 1,196 21 197 27 39.8%
23 ÖSEL CONSULTING OÜ 2,903 38 83.7 13 386 28 36.0 23 17.6 14 22,402 19 528 37 81 32 35.7%
24 FINNLAMELLI EESTI OÜ 31,528 32 75.6 20 456 27 19.4 27 5.4 25 23,414 12 1,314 18 155 30 35.4%
25 VILJANDI METLL AS* 270,282 6 61.4 27 16,752 5 34.4 24 8.5 23 21,086 20 1,131 22 3,815 8 35.1%
26 VÄNDRA MP OÜ 92,291 14 78.7 18 -5,808 37 -11.4 34 19,566 24 1,099 23 1,647 11 32.1%
27 TREF AS* 263,844 7 62.1 26 -207 30 -0.1 29 18,071 26 1,926 14 8,366 4 32.1%
28 AS PAIDE MEK 104,577 12 60.8 28 7,987 11 111.4 13 13.1 18 15,746 29 959 27 523 19 31.8%
29 OÜ AEK* 34,805 30 56.9 32 477 26 7.2 29 3.1 26 19,872 22 2,047 12 36 29.8%
30 FENESTRA AS 80,454 18 57.3 31 -1,632 34 -3.3 30 23,001 15 1,006 24 1,082 13 29.6%
31 ELECTRUM AS 52,977 24 66.7 23 -2,095 35 -14.1 36 18,646 25 828 30 302 23 28.1%
32 SEVE EHITUSE AS 31,941 31 59.0 29 2,966 17 70.2 18 18.1 13 13,624 35 532 36 170 29 26.3%
33 TÕRVA ELEKTER AS 9,876 34 58.5 30 1,426 21 100 15 8.8 22 9,312 38 658 34 945 14 24.4%
34 AS YIT EMICO 36,164 28 39.4 37 -2,552 36 -37.2 37 23,526 11 977 26 33 38 24.3%
35 SAMESTI METALL OÜ 1,760 39 53.7 34 -256 31 -66.4 38 14,820 32 352 39 39 20.0%
36 MATEK AS* 50,318 25 38.7 38 666 25 11.3 28 1.2 27 15,069 30 599 35 236 24 19.6%
37 ET TOREL OÜ 9,183 35 56.6 33 -908 33 -12.4 35 10,007 37 367 38 435 21 19.0%
38 VILLAARE OÜ 5,031 37 46.4 36 804 24 100 16 7,517 39 719 32 80 33 18.6%
39 Q-HAUS BALTIC OÜ 17,969 33 28.7 39 1,724 20 27.6 25 28.0 10 11,839 36 998 25 7,756 6 18.1%
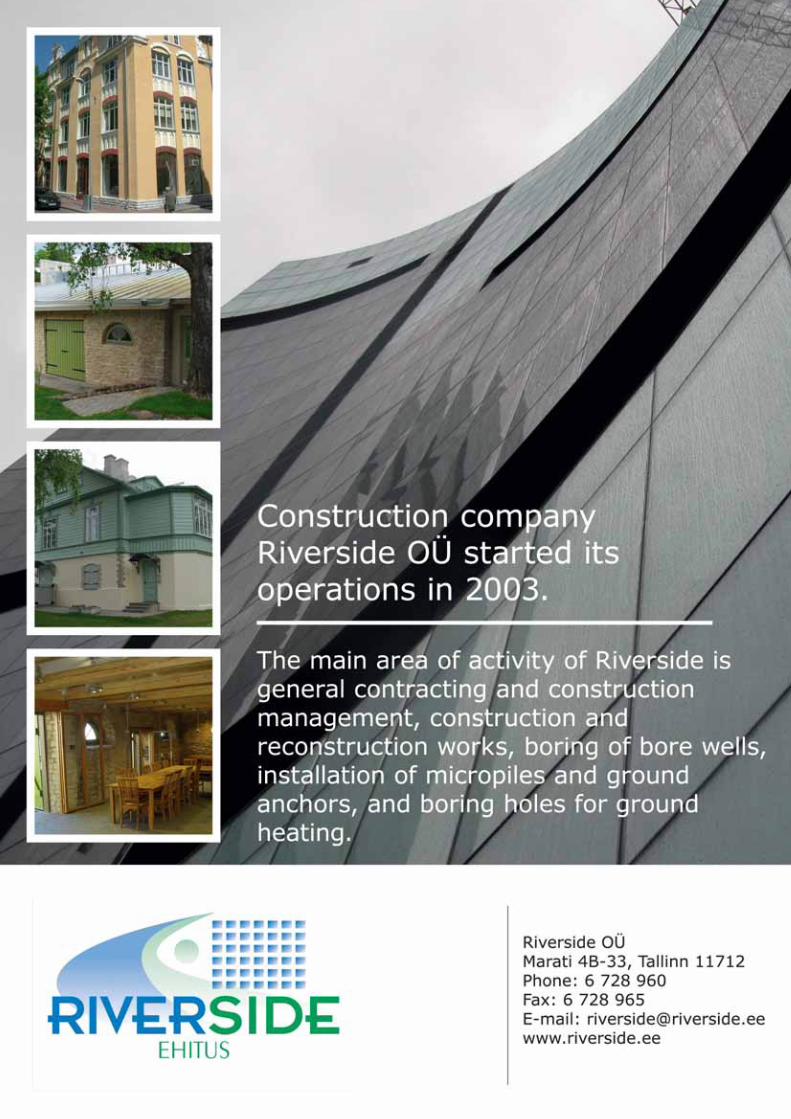
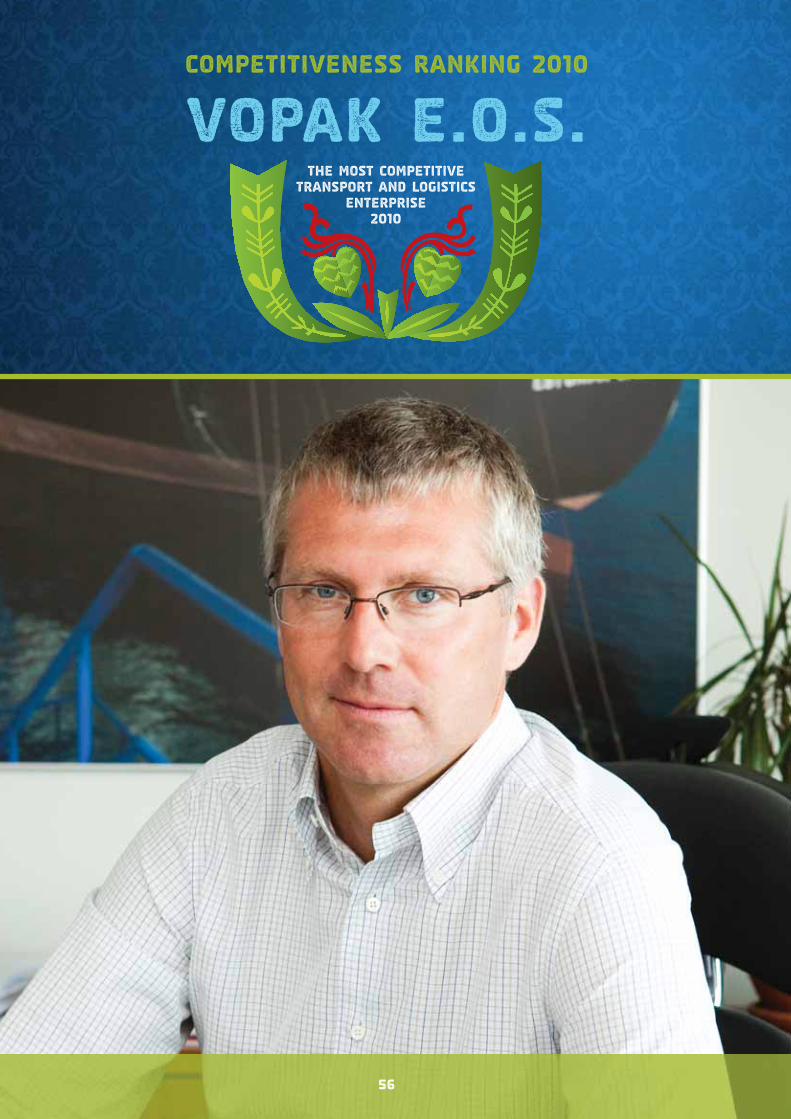
Competitiveness Ranking 2010
The Most Competitive Transport and Logistics
Enterprise 2010
Vopak E.O.S.
56
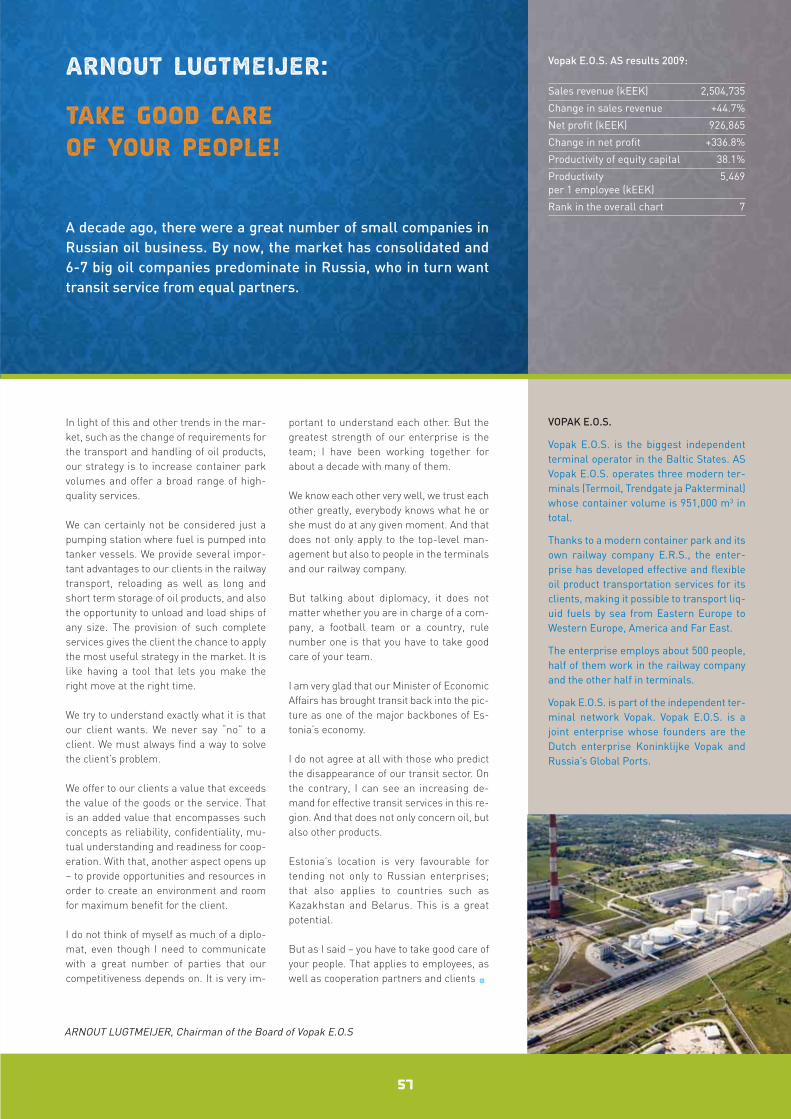
In light of this and other trends in the mar-ket, such as the change of requirements forthe transport and handling of oil products,our strategy is to increase container parkvolumes and offer a broad range of high-quality services.
We can certainly not be considered just apumping station where fuel is pumped intotanker vessels. We provide several impor-tant advantages to our clients in the railwaytransport, reloading as well as long andshort term storage of oil products, and alsothe opportunity to unload and load ships ofany size. The provision of such completeservices gives the client the chance to applythe most useful strategy in the market. It islike having a tool that lets you make theright move at the right time.
We try to understand exactly what it is thatour client wants. We never say “no” to aclient. We must always find a way to solvethe client’s problem.
We offer to our clients a value that exceedsthe value of the goods or the service. Thatis an added value that encompasses suchconcepts as reliability, confidentiality, mu-tual understanding and readiness for coop-eration. With that, another aspect opens up– to provide opportunities and resources inorder to create an environment and roomfor maximum benefit for the client.
I do not think of myself as much of a diplo-mat, even though I need to communicatewith a great number of parties that ourcompetitiveness depends on. It is very im-
portant to understand each other. But thegreatest strength of our enterprise is theteam; I have been working together forabout a decade with many of them.
We know each other very well, we trust eachother greatly, everybody knows what he orshe must do at any given moment. And thatdoes not only apply to the top-level man-agement but also to people in the terminalsand our railway company.
But talking about diplomacy, it does notmatter whether you are in charge of a com-pany, a football team or a country, rulenumber one is that you have to take goodcare of your team.
I am very glad that our Minister of EconomicAffairs has brought transit back into the pic-ture as one of the major backbones of Es-tonia’s economy.
I do not agree at all with those who predictthe disappearance of our transit sector. Onthe contrary, I can see an increasing de-mand for effective transit services in this re-gion. And that does not only concern oil, butalso other products.
Estonia’s location is very favourable fortending not only to Russian enterprises;that also applies to countries such asKazakhstan and Belarus. This is a greatpotential.
But as I said – you have to take good care ofyour people. That applies to employees, aswell as cooperation partners and clients •
57
Arnout Lugtmeijer:
Take good care of your people!
VOPAK E.O.S.
Vopak E.O.S. is the biggest independentterminal operator in the Baltic States. ASVopak E.O.S. operates three modern ter-minals (Termoil, Trendgate ja Pakterminal)whose container volume is 951,000 m3 intotal.
Thanks to a modern container park and itsown railway company E.R.S., the enter-prise has developed effective and flexibleoil product transportation services for itsclients, making it possible to transport liq-uid fuels by sea from Eastern Europe toWestern Europe, America and Far East.
The enterprise employs about 500 people,half of them work in the railway companyand the other half in terminals.
Vopak E.O.S. is part of the independent ter-minal network Vopak. Vopak E.O.S. is ajoint enterprise whose founders are theDutch enterprise Koninklijke Vopak andRussia’s Global Ports.
Vopak E.O.S. AS results 2009:
Sales revenue (kEEK) 2,504,735
Change in sales revenue +44.7%
Net profit (kEEK) 926,865
Change in net profit +336.8%
Productivity of equity capital 38.1%
Productivity 5,469per 1 employee (kEEK)
Rank in the overall chart 7
A decade ago, there were a great number of small companies inRussian oil business. By now, the market has consolidated and 6-7 big oil companies predominate in Russia, who in turn wanttransit service from equal partners.
ARNOUT LUGTMEIJER, Chairman of the Board of Vopak E.O.S
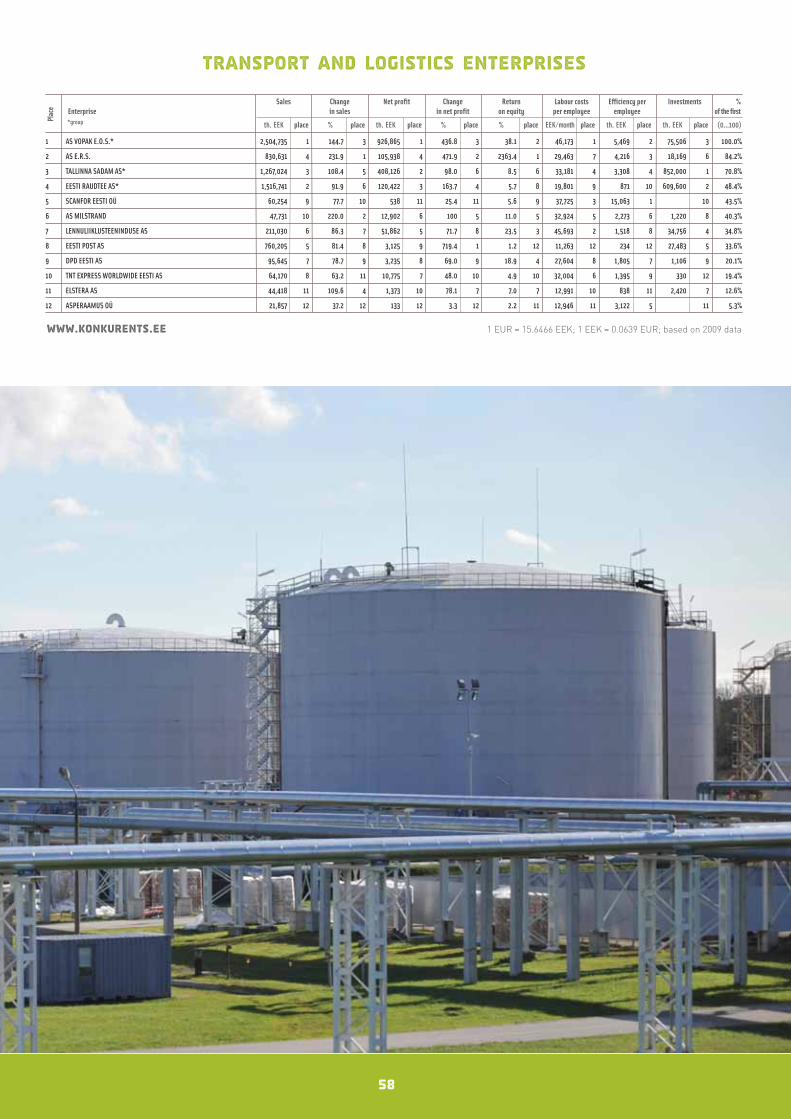
58
Transport and Logistics Enterprises
Sales Change Net profit Change Return Labour costs Efficiency per Investments %Enterprise in sales in net profit on equity per employee employee of the first*group th. EEK place % place th. EEK place % place % place EEK/month place th. EEK place th. EEK place (0...100)
Plac
e
www.konkurents.ee 1 EUR = 15.6466 EEK; 1 EEK = 0.0639 EUR; based on 2009 data
1 AS VOPAK E.O.S.* 2,504,735 1 144.7 3 926,865 1 436.8 3 38.1 2 46,173 1 5,469 2 75,506 3 100.0%
2 AS E.R.S. 830,631 4 231.9 1 105,938 4 471.9 2 2363.4 1 29,463 7 4,216 3 18,169 6 84.2%
3 TALLINNA SADAM AS* 1,267,024 3 108.4 5 408,126 2 98.0 6 8.5 6 33,181 4 3,308 4 852,000 1 70.8%
4 EESTI RAUDTEE AS* 1,516,741 2 91.9 6 120,422 3 163.7 4 5.7 8 19,801 9 871 10 609,600 2 48.4%
5 SCANFOR EESTI OÜ 60,254 9 77.7 10 538 11 25.4 11 5.6 9 37,725 3 15,063 1 10 43.5%
6 AS MILSTRAND 47,731 10 220.0 2 12,902 6 100 5 11.0 5 32,924 5 2,273 6 1,220 8 40.3%
7 LENNULIIKLUSTEENINDUSE AS 211,030 6 86.3 7 51,862 5 71.7 8 23.5 3 45,693 2 1,518 8 34,756 4 34.8%
8 EESTI POST AS 760,205 5 81.4 8 3,125 9 719.4 1 1.2 12 11,263 12 234 12 27,483 5 33.6%
9 DPD EESTI AS 95,645 7 78.7 9 3,235 8 69.0 9 18.9 4 27,604 8 1,805 7 1,106 9 20.1%
10 TNT EXPRESS WORLDWIDE EESTI AS 64,170 8 63.2 11 10,775 7 48.0 10 4.9 10 32,004 6 1,395 9 330 12 19.4%
11 ELSTERA AS 44,418 11 109.6 4 1,373 10 78.1 7 7.0 7 12,991 10 838 11 2,420 7 12.6%
12 ASPERAAMUS OÜ 21,857 12 37.2 12 133 12 3.3 12 2.2 11 12,946 11 3,122 5 11 5.3%
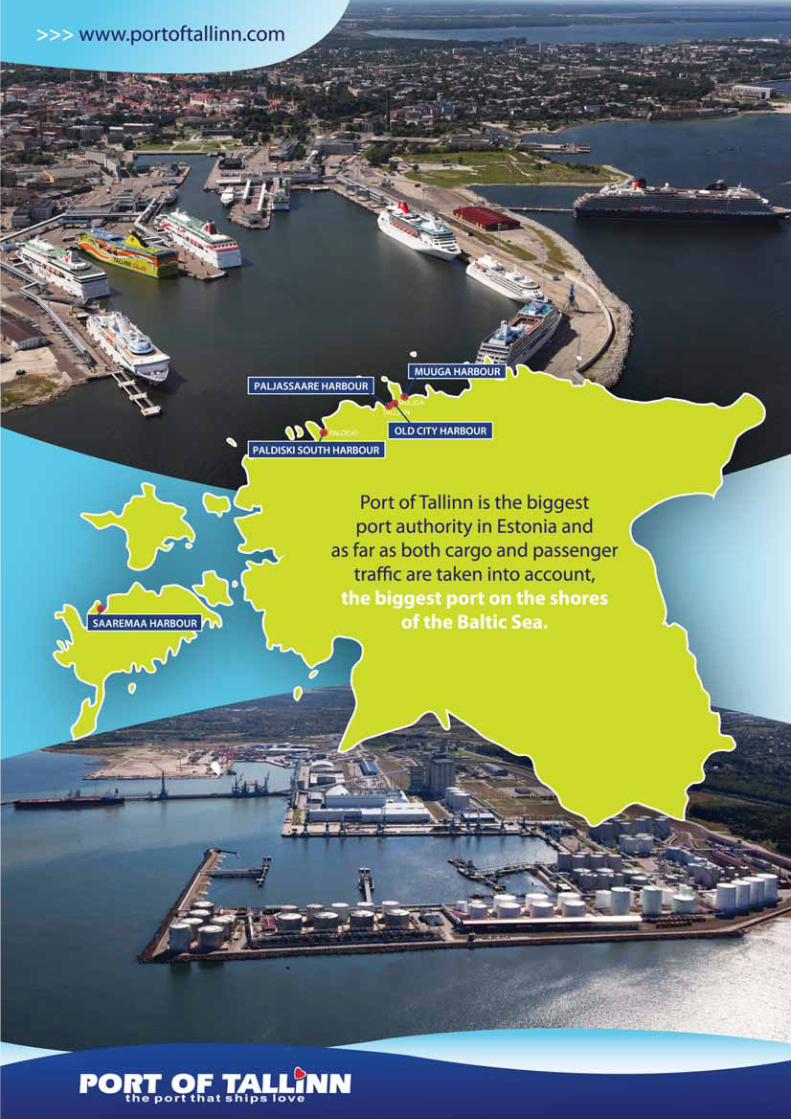
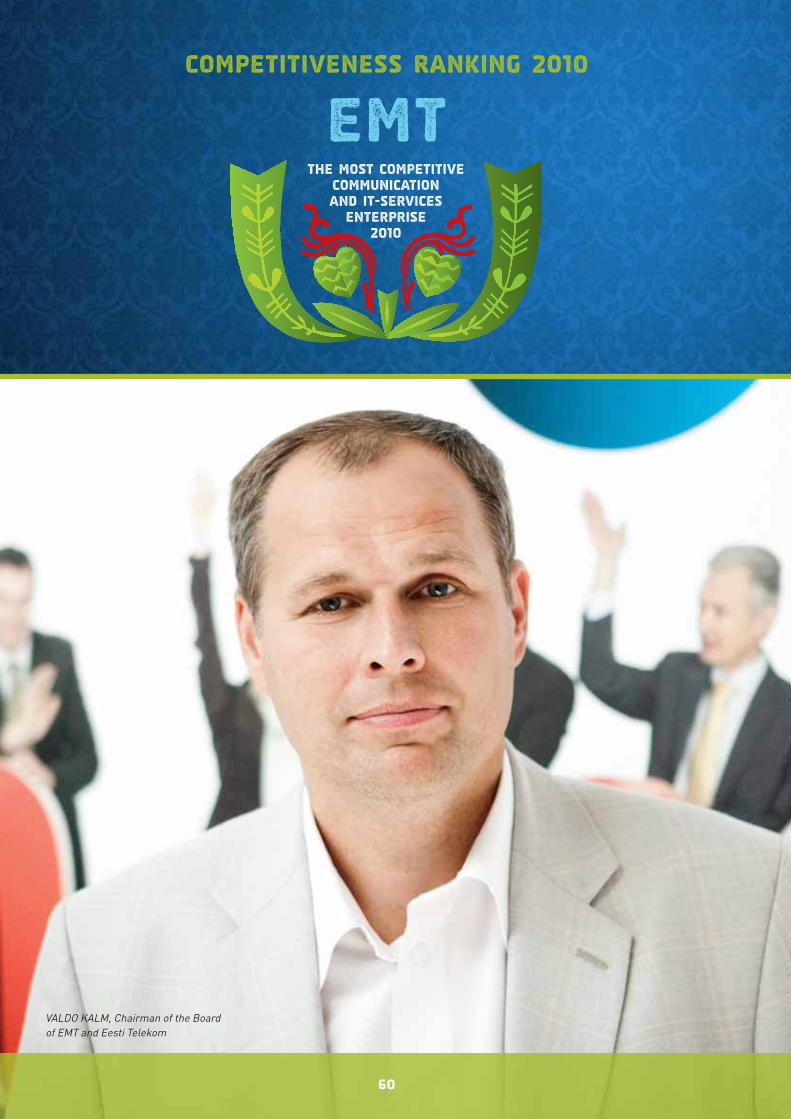
Competitiveness Ranking 2010
The Most Competitive Communication and IT-services
Enterprise 2010
EMT
60
VALDO KALM, Chairman of the Board of EMT and Eesti Telekom
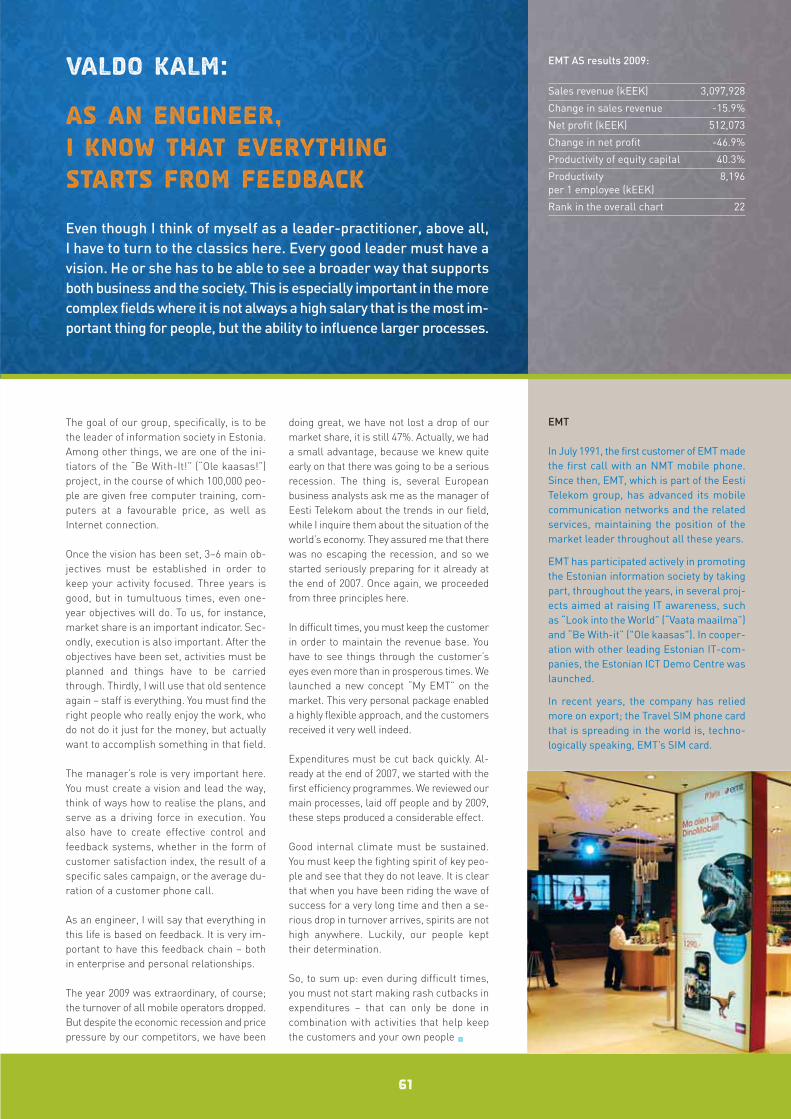
61
Valdo Kalm:
As an engineer, I know that everything starts from feedback
EMT
In July 1991, the first customer of EMT madethe first call with an NMT mobile phone.Since then, EMT, which is part of the EestiTelekom group, has advanced its mobilecommunication networks and the relatedservices, maintaining the position of themarket leader throughout all these years.
EMT has participated actively in promotingthe Estonian information society by takingpart, throughout the years, in several proj-ects aimed at raising IT awareness, suchas “Look into the World” (“Vaata maailma”)and “Be With-it” ("Ole kaasas"). In cooper-ation with other leading Estonian IT-com-panies, the Estonian ICT Demo Centre waslaunched.
In recent years, the company has reliedmore on export; the Travel SIM phone cardthat is spreading in the world is, techno-logically speaking, EMT’s SIM card.
EMT AS results 2009:
Sales revenue (kEEK) 3,097,928
Change in sales revenue -15.9%
Net profit (kEEK) 512,073
Change in net profit -46.9%
Productivity of equity capital 40.3%
Productivity 8,196per 1 employee (kEEK)
Rank in the overall chart 22
Even though I think of myself as a leader-practitioner, above all, I have to turn to the classics here. Every good leader must have a vision. He or she has to be able to see a broader way that supportsboth business and the society. This is especially important in the morecomplex fields where it is not always a high salary that is the most im-portant thing for people, but the ability to influence larger processes.
The goal of our group, specifically, is to bethe leader of information society in Estonia.Among other things, we are one of the ini-tiators of the “Be With-It!” (“Ole kaasas!”)project, in the course of which 100,000 peo-ple are given free computer training, com-puters at a favourable price, as well asInternet connection.
Once the vision has been set, 3–6 main ob-jectives must be established in order tokeep your activity focused. Three years isgood, but in tumultuous times, even one-year objectives will do. To us, for instance,market share is an important indicator. Sec-ondly, execution is also important. After theobjectives have been set, activities must beplanned and things have to be carriedthrough. Thirdly, I will use that old sentenceagain – staff is everything. You must find theright people who really enjoy the work, whodo not do it just for the money, but actuallywant to accomplish something in that field.
The manager’s role is very important here.You must create a vision and lead the way,think of ways how to realise the plans, andserve as a driving force in execution. Youalso have to create effective control andfeedback systems, whether in the form ofcustomer satisfaction index, the result of aspecific sales campaign, or the average du-ration of a customer phone call.
As an engineer, I will say that everything inthis life is based on feedback. It is very im-portant to have this feedback chain – bothin enterprise and personal relationships.
The year 2009 was extraordinary, of course;the turnover of all mobile operators dropped.But despite the economic recession and pricepressure by our competitors, we have been
doing great, we have not lost a drop of ourmarket share, it is still 47%. Actually, we hada small advantage, because we knew quiteearly on that there was going to be a seriousrecession. The thing is, several Europeanbusiness analysts ask me as the manager ofEesti Telekom about the trends in our field,while I inquire them about the situation of theworld’s economy. They assured me that therewas no escaping the recession, and so westarted seriously preparing for it already atthe end of 2007. Once again, we proceededfrom three principles here.
In difficult times, you must keep the customerin order to maintain the revenue base. Youhave to see things through the customer’seyes even more than in prosperous times. Welaunched a new concept “My EMT” on themarket. This very personal package enableda highly flexible approach, and the customersreceived it very well indeed.
Expenditures must be cut back quickly. Al-ready at the end of 2007, we started with thefirst efficiency programmes. We reviewed ourmain processes, laid off people and by 2009,these steps produced a considerable effect.
Good internal climate must be sustained.You must keep the fighting spirit of key peo-ple and see that they do not leave. It is clearthat when you have been riding the wave ofsuccess for a very long time and then a se-rious drop in turnover arrives, spirits are nothigh anywhere. Luckily, our people kepttheir determination.
So, to sum up: even during difficult times,you must not start making rash cutbacks inexpenditures – that can only be done incombination with activities that help keepthe customers and your own people •
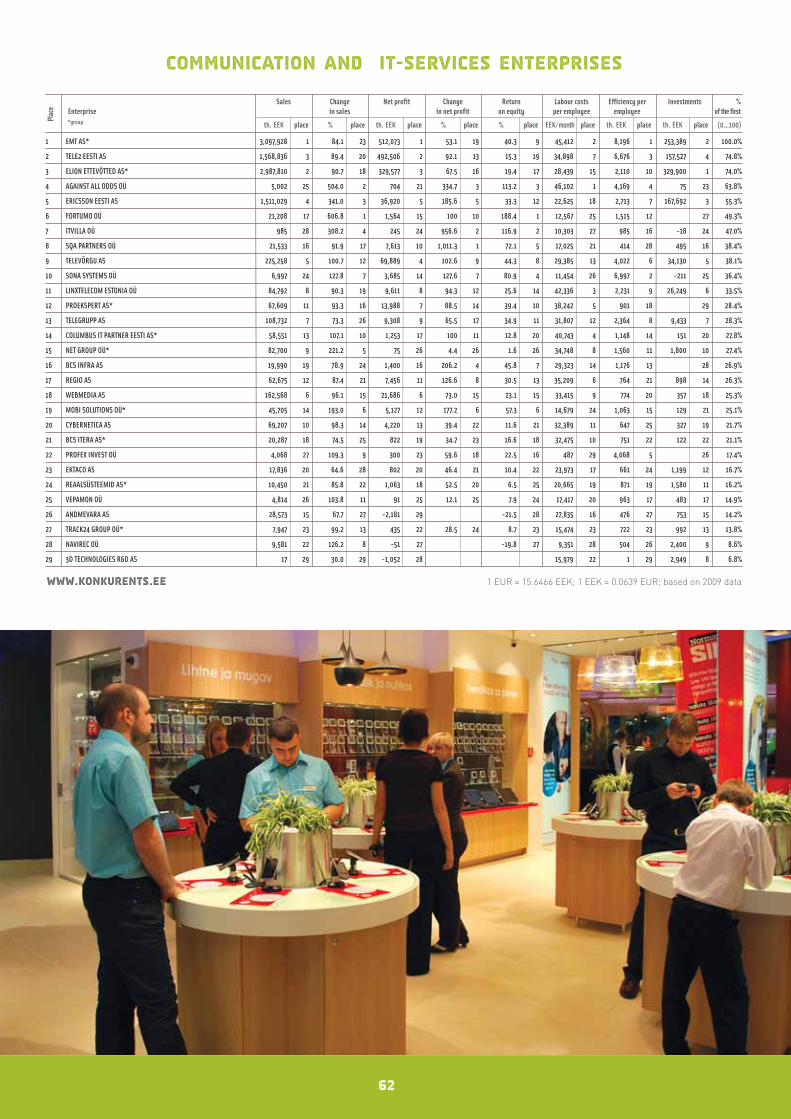
62
Communication and IT-services Enterprises
Sales Change Net profit Change Return Labour costs Efficiency per Investments %Enterprise in sales in net profit on equity per employee employee of the first*group th. EEK place % place th. EEK place % place % place EEK/month place th. EEK place th. EEK place (0...100)
Plac
e
www.konkurents.ee 1 EUR = 15.6466 EEK; 1 EEK = 0.0639 EUR; based on 2009 data
1 EMT AS* 3,097,928 1 84.1 23 512,073 1 53.1 19 40.3 9 45,412 2 8,196 1 253,389 2 100.0%
2 TELE2 EESTI AS 1,568,836 3 89.4 20 492,506 2 92.1 13 15.3 19 34,898 7 6,676 3 157,527 4 74.8%
3 ELION ETTEVÕTTED AS* 2,987,810 2 90.7 18 329,577 3 67.5 16 19.4 17 28,439 15 2,110 10 329,900 1 74.0%
4 AGAINST ALL ODDS OÜ 5,002 25 504.0 2 704 21 334.7 3 113.2 3 46,102 1 4,169 4 75 23 63.8%
5 ERICSSON EESTI AS 1,511,029 4 341.0 3 36,920 5 185.6 5 33.3 12 22,625 18 2,713 7 167,692 3 55.3%
6 FORTUMO OÜ 21,208 17 606.8 1 1,564 15 100 10 188.4 1 12,567 25 1,515 12 27 49.3%
7 ITVILLA OÜ 985 28 308.2 4 245 24 956.6 2 116.9 2 10,303 27 985 16 -18 24 47.0%
8 SQA PARTNERS OÜ 21,533 16 91.9 17 7,613 10 1,011.3 1 72.1 5 17,025 21 414 28 495 16 38.4%
9 TELEVÕRGU AS 225,258 5 100.7 12 69,889 4 102.6 9 44.3 8 29,385 13 4,022 6 34,130 5 38.1%
10 SONA SYSTEMS OÜ 6,997 24 127.8 7 3,685 14 127.6 7 80.9 4 11,454 26 6,997 2 -211 25 36.4%
11 LINXTELECOM ESTONIA OÜ 84,792 8 90.3 19 9,611 8 94.3 12 25.6 14 42,336 3 2,231 9 26,249 6 33.5%
12 PROEKSPERT AS* 67,609 11 93.3 16 13,988 7 88.5 14 39.4 10 38,242 5 901 18 29 28.4%
13 TELEGRUPP AS 108,732 7 73.3 26 9,308 9 65.5 17 34.9 11 31,807 12 2,364 8 9,433 7 28.3%
14 COLUMBUS IT PARTNER EESTI AS* 58,551 13 107.1 10 1,253 17 100 11 12.8 20 40,743 4 1,148 14 151 20 27.8%
15 NET GROUP OÜ* 82,700 9 221.2 5 75 26 4.4 26 1.6 26 34,748 8 1,560 11 1,800 10 27.4%
16 BCS INFRA AS 19,990 19 78.9 24 1,400 16 206.2 4 45.8 7 29,323 14 1,176 13 28 26.9%
17 REGIO AS 62,675 12 87.4 21 7,456 11 126.6 8 30.5 13 35,209 6 764 21 898 14 26.3%
18 WEBMEDIA AS 162,568 6 96.1 15 21,686 6 73.0 15 23.1 15 33,415 9 774 20 357 18 25.3%
19 MOBI SOLUTIONS OÜ* 45,705 14 193.0 6 5,127 12 177.2 6 57.3 6 14,679 24 1,063 15 129 21 25.1%
20 CYBERNETICA AS 69,207 10 98.3 14 4,220 13 39.4 22 11.6 21 32,389 11 647 25 327 19 21.7%
21 BCS ITERA AS* 20,287 18 74.5 25 822 19 34.7 23 16.6 18 32,475 10 751 22 122 22 21.1%
22 PROFEX INVEST OÜ 4,068 27 109.3 9 300 23 59.6 18 22.5 16 487 29 4,068 5 26 17.4%
23 EKTACO AS 17,836 20 64.6 28 802 20 46.4 21 10.4 22 23,973 17 661 24 1,199 12 16.7%
24 REAALSÜSTEEMID AS* 10,450 21 85.8 22 1,063 18 52.5 20 6.5 25 20,665 19 871 19 1,580 11 16.2%
25 VEPAMON OÜ 4,814 26 103.8 11 91 25 12.1 25 7.9 24 17,417 20 963 17 483 17 14.9%
26 ANDMEVARA AS 28,573 15 67.7 27 -2,181 29 -21.5 28 27,835 16 476 27 753 15 14.2%
27 TRACK24 GROUP OÜ* 7,947 23 99.2 13 435 22 28.5 24 8.7 23 15,474 23 722 23 992 13 13.8%
28 NAVIREC OÜ 9,581 22 126.2 8 -51 27 -19.8 27 9,351 28 504 26 2,400 9 8.6%
29 3D TECHNOLOGIES R&D AS 17 29 30.0 29 -1,052 28 15,979 22 1 29 2,949 8 6.8%

Competitiveness Ranking 2010
The Most Competitive Agriculture and Forestry
Enterprise 2010
Markilo
64

We have a strong staff that realises theseverity of the situation and goes along withdecisions. Thanks to the relatively youngstaff that we have trained a lot, there arealso many new ideas that have been con-firmed by Danish top experts.
Also investments have helped us stay com-petitive; here we must express our gratitudetowards banks, of course, who have believedin us just as much as we believe in our-selves.
Above all, I value trust. When you trust yourpeople and they trust you, it is a great pledgeof success. And of course the courage totake risks that works in combination withthe former – you take risks, analyse andalso see how to hedge them as well as pos-sible.
Increasing the efficiency is also important,and I predict that during the next 4–5 years,that issue is going to be of great relevance tous. By efficiency, I do not mean that youmust necessarily work eight or more hoursa day, but well-considered processes andforesight as to which decision to make atany given moment.
Looking back, I can say that our crisis –since we sell most of our output to Russia– actually started already with the eventsof the Bronze Night in 2007 that forced usto review our goals and make great effortsto reduce expenses. And given that Mark-ilo went through the crisis a year beforemost of the others, 2008 was already agood year for us, during which we suc-ceeded in disposing of our real estate in
time, among other things (prices weregood and no one believed in the arrival ofthe crisis yet).
But yes, 2007 was indeed a question of lifeand death. Because imagine a situationwhere 90% of the market is taken away fromyou one day. That hurt us a lot. We had to ne-gotiate with banks a great deal, layoffs wereunavoidable (out of 52 employees, 26 stayed),the managers also had an enormous work-load. We had to make a great effort in order toreturn to normal circumstances.
I believe that the year 2010 is very tough de-spite the talks of the stabilisation of prices.Several state-level decisions actually de-crease an entrepreneur's revenue base (fueland electricity excise duties, increasing thevalue-added tax, etc.), which is why theyears 2011–2012 are going to be exception-ally hard. In connection with the arrival ofthe euro, I can see a serious economic re-cession and a rise in inflation coming. Thepromises made by Estonia to the EuropeanUnion before the accession are actuallymore numerous than we are aware of, andthese promises are going to affect the de-velopment of businesses a great deal in thecoming years.
Realistically, it is going to be very difficult tomake the right decisions in the comingyears. It takes a highly efficient productionto be able to survive in this situation. And ofcourse, a lot depends on the banks –whether they can see an economic prospectin it or not. Fortunately, they can see it inpig-farming, we are reliable in the eyes ofbanks •
65
Urmas Laht:
I think that in the comingyears, it is going to be verydifficult for companies tomake the right decisions
MARKILO
OU Markilo started with economic activityin 1994, its main spheres of activity beingthe production of concentrated feed andpig-farming. The enterprise has units inJõgeva County (the production of concen-trated feed and pig-farming in Kureojafarm) and West Viru County (pig-farming inVajangu farm). Markilo owns an acknowl-edged slaughter industry and also thepatented trademark Viru Mölder since2005.
Kureoja Concentrated Feed Factory pro-duces high-quality medicated and com-plete feed with precision dosage for pigsand hen. The factory also has a concen-trated feed analysis laboratory, and since2004, granulated concentrated feed is pro-duced there.
Of Markilo’s two pig farms, one is adaptedfor the production of cross-breed pigletsand the other for free-range pig farming.Breeding is also practiced, in constant co-operation with the Estonian Pig BreedingAssociation. The breeding lines are pure-bred Estonian Large White (Yorkshire), Es-tonian Landrace, Hampshire and Pietrain.
In 2005, Markilo’s pig farms were the firstin Estonia to be recognised by the Veteri-nary Service of the Russian Federation.
Markilo OÜ results 2009:
Sales revenue (kEEK) 61,518
Change in sales revenue +3.8%
Net profit (kEEK) 5,468
Change in net profit +98.3%
Productivity of equity capital 31.7%
Productivity 2,366per 1 employee (kEEK)
Rank in the overall chart 145
With years, I have amassed a lot of experience and knowledge thatI have been able to use in the management of the enterprise.
URMAS LAHT, Head of Markilo
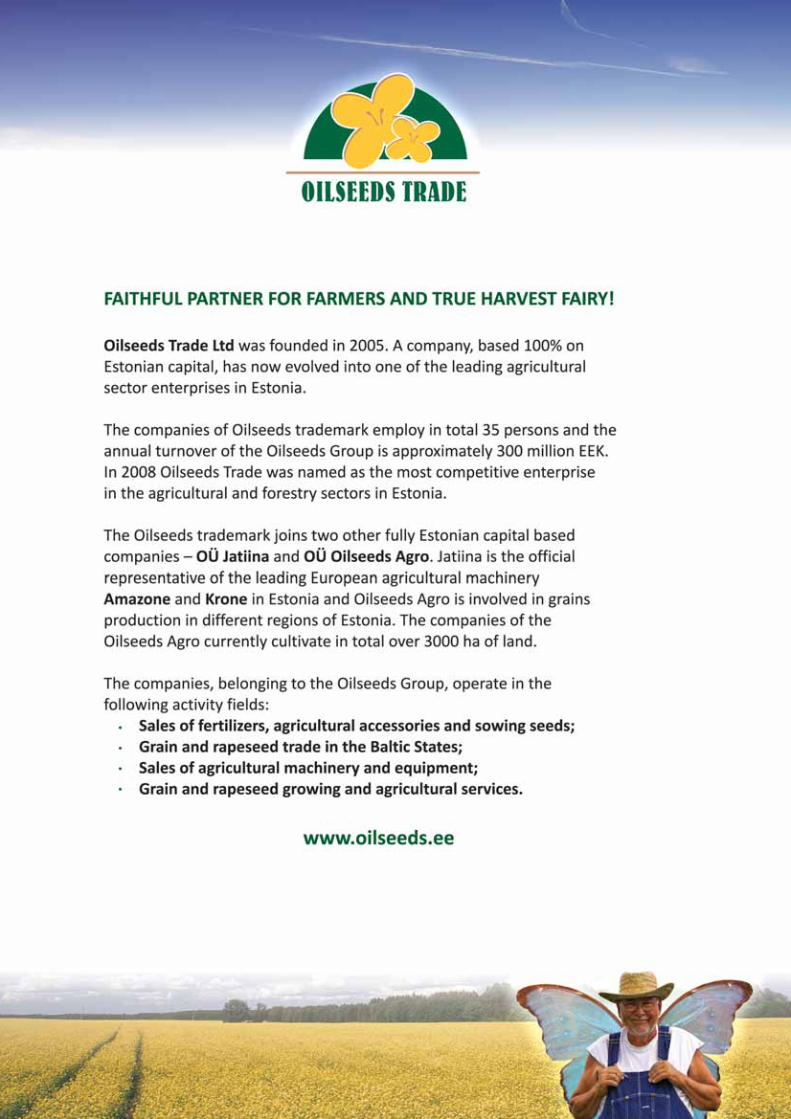

67
Agriculture and Forestry Enterprises
Sales Change Net profit Change Return Labour costs Efficiency per Investments %Enterprise in sales in net profit on equity per employee employee of the first*group th. EEK place % place th. EEK place % place % place EEK/month place th. EEK place th. EEK place (0...100)
Plac
e
www.konkurents.ee 1 EUR = 15.6466 EEK; 1 EEK = 0.0639 EUR; based on 2009 data
1 OÜ MARKILO 61,518 3 103.8 2 5,468 2 198.3 3 31.7 1 8,941 6 2,366 2 9,009 1 100.0%
2 RAJA K.T. OÜ 62,903 2 103.8 1 5,828 1 223.1 2 24.1 2 11,065 5 1,906 3 8,391 2 98.2%
3 OILSEEDS TRADE AS* 246,353 1 88.5 4 745 6 9.8 6 6.3 5 23,517 1 17,597 1 1,912 5 73.6%
4 VIRAITO OÜ 13,592 6 78.9 6 4,198 3 303.0 1 23.0 3 13,143 4 715 4 175 6 54.0%
5 ORGITA PÕLD OÜ 20,559 5 82.1 5 2,026 4 50.7 4 6.0 6 13,666 3 642 5 7,495 3 35.0%
6 PLANTEX AS 29,475 4 96.0 3 1,669 5 28.0 5 6.9 4 14,101 2 526 6 2,125 4 32.9%
Financial Brokerage Enterprises
Sales Change Net profit Change Return Labour costs Efficiency per Investments %Enterprise in sales in net profit on equity per employee employee of the first*group th. EEK place % place th. EEK place % place % place EEK/month place th. EEK place th. EEK place (0...100)
Plac
e
www.konkurents.ee 1 EUR = 15.6466 EEK; 1 EEK = 0.0639 EUR; based on 2009 data
1 AS IF EESTI KINDLUSTUS* 1,937,681 2 80.3 10 392,213 1 174.6 4 41.2 3 61,701 1 5,443 1 11,419 3 100.0%
2 SMS LAEN AS* 97,198 6 107.5 4 17,077 4 67.8 9 26.1 6 47,147 2 4,628 2 9 81.5%
3 NORDEA FINANCE ESTONIA AS 159,029 5 202.7 2 -37,975 12 -8.8 12 46,136 3 2,742 3 2,726 4 80.8%
4 MEGARAM OÜ 2,869 9 96.6 6 181 8 477.1 1 117.6 1 15,926 10 359 11 11 80.4%
5 TAVID AS* 179,497 4 146.9 3 124,442 2 189.4 3 53.4 2 26,299 5 1,678 4 329 8 76.0%
6 KINKEKAART OÜ 149 13 213.4 1 15 9 126.0 5 30.6 5 13 65.4%
7 SWEDBANK AS* 11,700,000 1 76.1 12-13,651,000 13 -43.1 13 23,022 7 1,529 5 667,000 1 61.7%
8 KINDLUSTUSEST KINDLUSTUSMAAKLER OÜ 14,594 8 94.9 7 479 6 199.8 2 33.4 4 18,223 8 384 10 770 7 54.1%
9 ERGO KINDLUSTUSE AS* 722,800 3 78.2 11 87,267 3 70.0 8 10.6 9 23,158 6 1,490 6 12,676 2 50.4%
10 PÕLVAMAA HOIU-LAENUÜHISTU TUÜ 2,448 11 99.5 5 10 10 8.2 11 0.3 11 32,580 4 816 7 10 48.5%
11 IIZI KINDLUSTUSMAAKLER AS* 72,733 7 86.0 9 2,756 5 100 6 24.2 7 17,727 9 539 8 1,790 5 46.6%
12 GVANDRON OÜ 1,672 12 75.0 13 219 7 41.8 10 22.3 8 12,325 11 418 9 1,599 6 38.1%
13 OPTIMAL KINDLUSTUSMAAKLER OÜ 2,576 10 86.4 8 0 11 100 7 0.4 10 8,847 12 184 12 21 12 37.1%
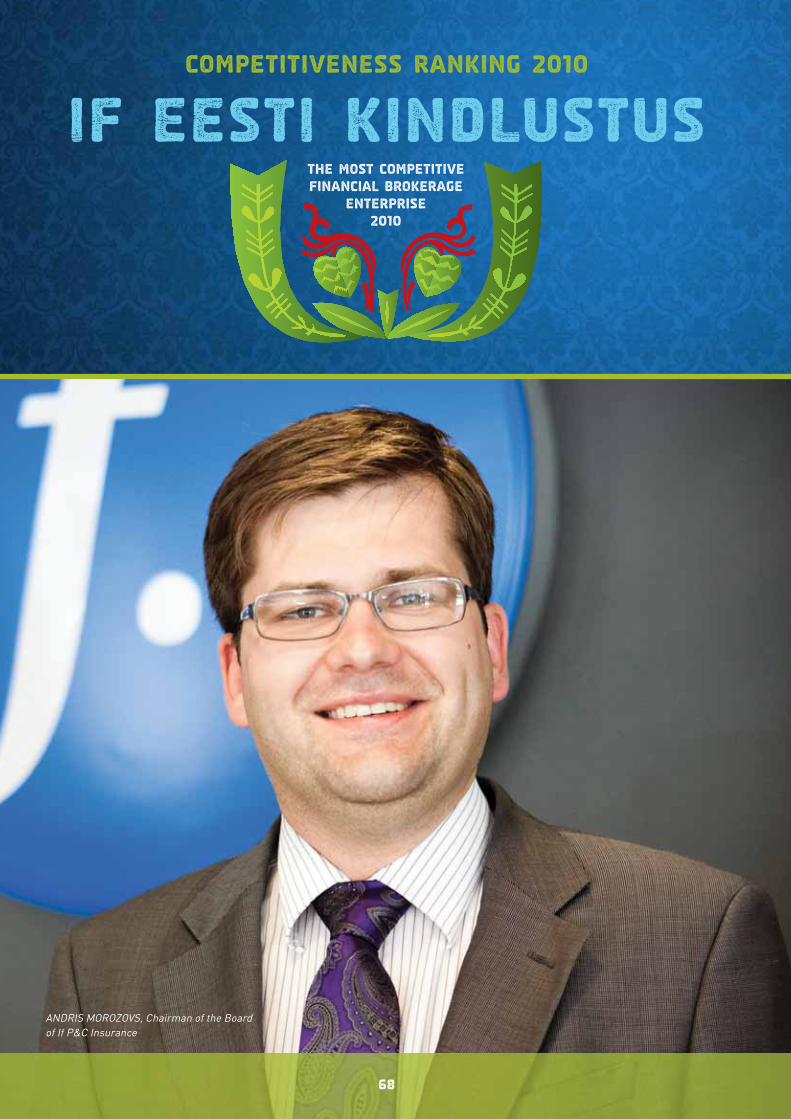
Competitiveness Ranking 2010
The Most Competitive Financial Brokerage
Enterprise 2010
IF Eesti Kindlustus
68
ANDRIS MOROZOVS, Chairman of the Board of If P&C Insurance
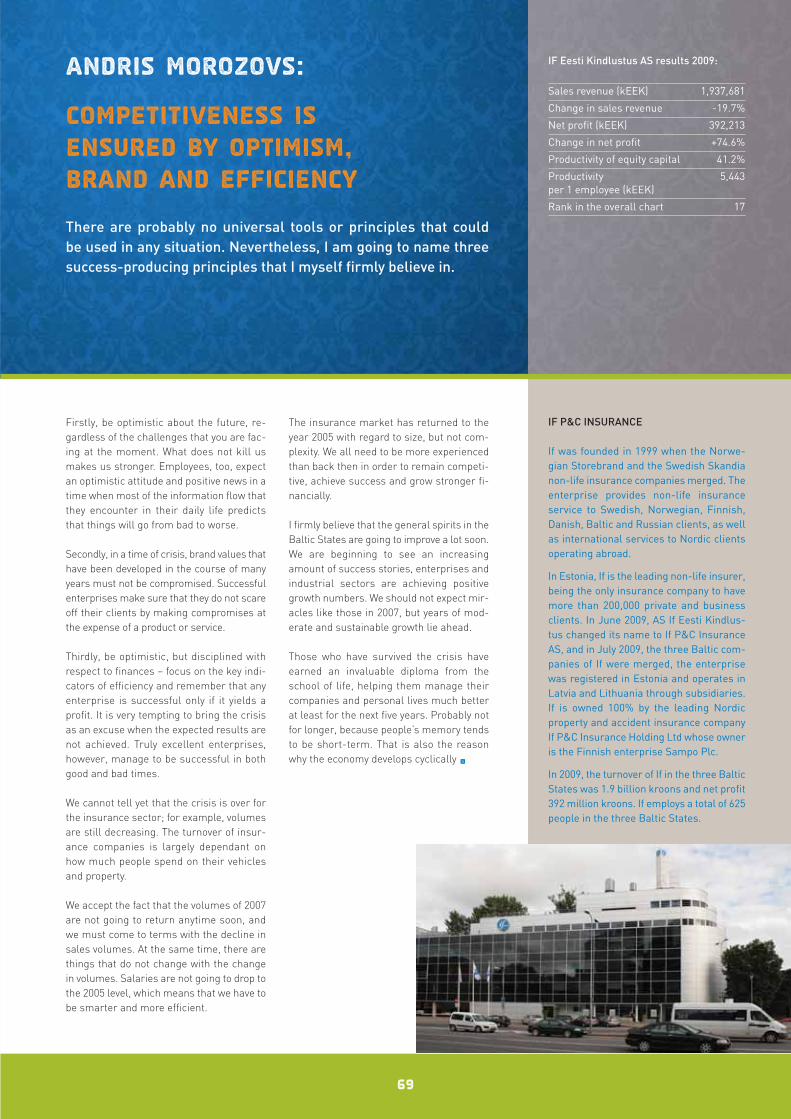
Firstly, be optimistic about the future, re-gardless of the challenges that you are fac-ing at the moment. What does not kill usmakes us stronger. Employees, too, expectan optimistic attitude and positive news in atime when most of the information flow thatthey encounter in their daily life predictsthat things will go from bad to worse.
Secondly, in a time of crisis, brand values thathave been developed in the course of manyyears must not be compromised. Successfulenterprises make sure that they do not scareoff their clients by making compromises atthe expense of a product or service.
Thirdly, be optimistic, but disciplined withrespect to finances – focus on the key indi-cators of efficiency and remember that anyenterprise is successful only if it yields aprofit. It is very tempting to bring the crisisas an excuse when the expected results arenot achieved. Truly excellent enterprises,however, manage to be successful in bothgood and bad times.
We cannot tell yet that the crisis is over forthe insurance sector; for example, volumesare still decreasing. The turnover of insur-ance companies is largely dependant onhow much people spend on their vehiclesand property.
We accept the fact that the volumes of 2007are not going to return anytime soon, andwe must come to terms with the decline insales volumes. At the same time, there arethings that do not change with the changein volumes. Salaries are not going to drop tothe 2005 level, which means that we have tobe smarter and more efficient.
The insurance market has returned to theyear 2005 with regard to size, but not com-plexity. We all need to be more experiencedthan back then in order to remain competi-tive, achieve success and grow stronger fi-nancially.
I firmly believe that the general spirits in theBaltic States are going to improve a lot soon.We are beginning to see an increasingamount of success stories, enterprises andindustrial sectors are achieving positivegrowth numbers. We should not expect mir-acles like those in 2007, but years of mod-erate and sustainable growth lie ahead.
Those who have survived the crisis haveearned an invaluable diploma from theschool of life, helping them manage theircompanies and personal lives much betterat least for the next five years. Probably notfor longer, because people’s memory tendsto be short-term. That is also the reasonwhy the economy develops cyclically •
69
Andris Morozovs:
Competitiveness is ensured by optimism, brand and efficiency
IF P&C INSURANCE
If was founded in 1999 when the Norwe-gian Storebrand and the Swedish Skandianon-life insurance companies merged. Theenterprise provides non-life insuranceservice to Swedish, Norwegian, Finnish,Danish, Baltic and Russian clients, as wellas international services to Nordic clientsoperating abroad.
In Estonia, If is the leading non-life insurer,being the only insurance company to havemore than 200,000 private and businessclients. In June 2009, AS If Eesti Kindlus-tus changed its name to If P&C InsuranceAS, and in July 2009, the three Baltic com-panies of If were merged, the enterprisewas registered in Estonia and operates inLatvia and Lithuania through subsidiaries.If is owned 100% by the leading Nordicproperty and accident insurance companyIf P&C Insurance Holding Ltd whose owneris the Finnish enterprise Sampo Plc.
In 2009, the turnover of If in the three BalticStates was 1.9 billion kroons and net profit392 million kroons. If employs a total of 625people in the three Baltic States.
IF Eesti Kindlustus AS results 2009:
Sales revenue (kEEK) 1,937,681
Change in sales revenue -19.7%
Net profit (kEEK) 392,213
Change in net profit +74.6%
Productivity of equity capital 41.2%
Productivity 5,443per 1 employee (kEEK)
Rank in the overall chart 17
There are probably no universal tools or principles that could be used in any situation. Nevertheless, I am going to name three success-producing principles that I myself firmly believe in.
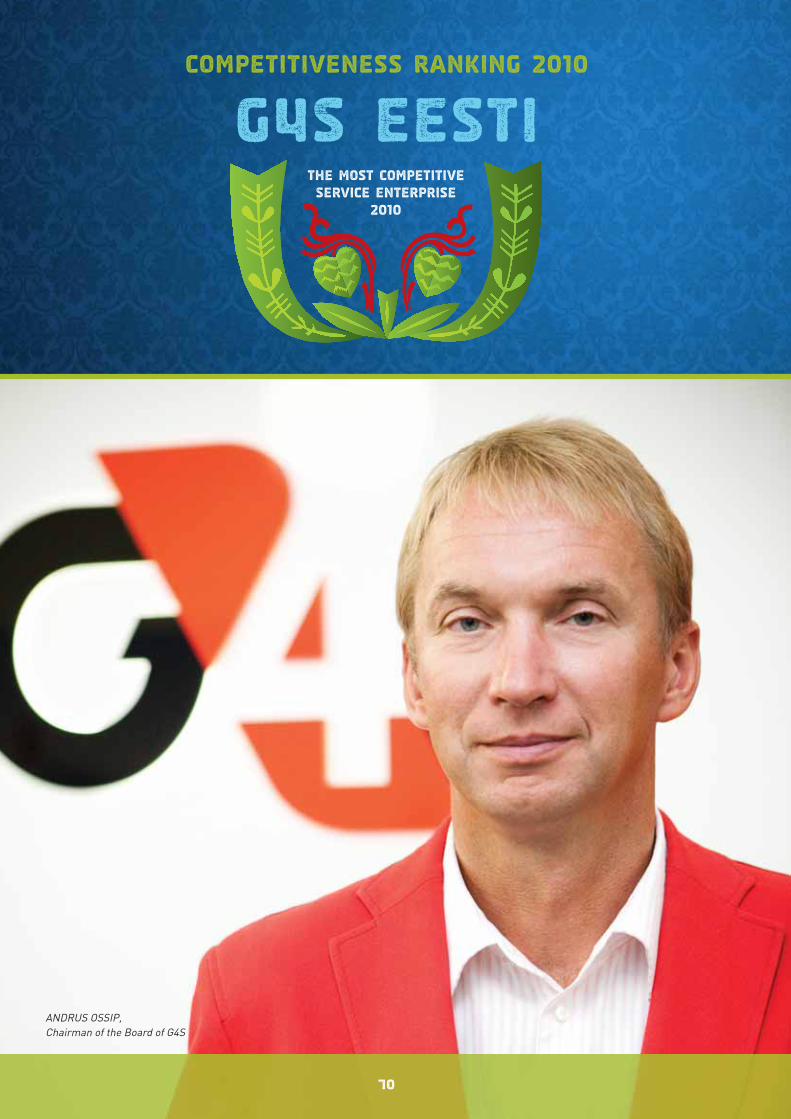
Competitiveness Ranking 2010
The Most Competitive Service Enterprise
2010
G4S Eesti
70
ANDRUS OSSIP, Chairman of the Board of G4S
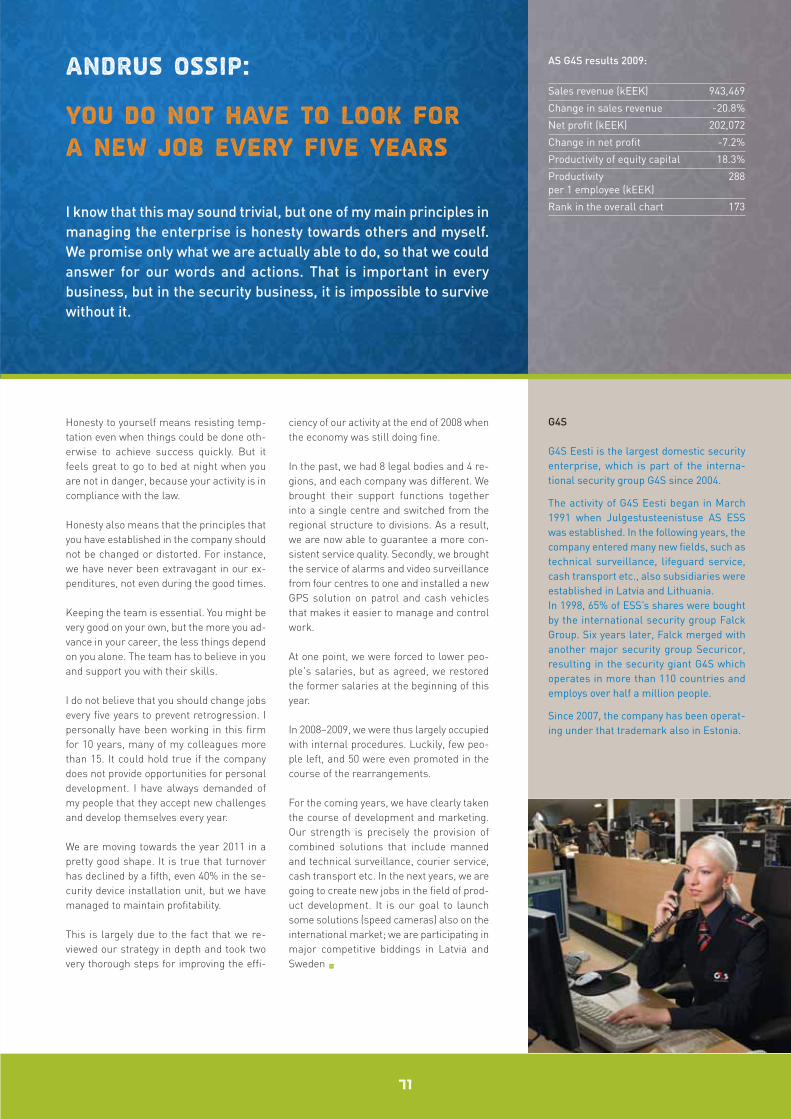
Honesty to yourself means resisting temp-tation even when things could be done oth-erwise to achieve success quickly. But itfeels great to go to bed at night when youare not in danger, because your activity is incompliance with the law.
Honesty also means that the principles thatyou have established in the company shouldnot be changed or distorted. For instance,we have never been extravagant in our ex-penditures, not even during the good times.
Keeping the team is essential. You might bevery good on your own, but the more you ad-vance in your career, the less things dependon you alone. The team has to believe in youand support you with their skills.
I do not believe that you should change jobsevery five years to prevent retrogression. Ipersonally have been working in this firmfor 10 years, many of my colleagues morethan 15. It could hold true if the companydoes not provide opportunities for personaldevelopment. I have always demanded ofmy people that they accept new challengesand develop themselves every year.
We are moving towards the year 2011 in apretty good shape. It is true that turnoverhas declined by a fifth, even 40% in the se-curity device installation unit, but we havemanaged to maintain profitability.
This is largely due to the fact that we re-viewed our strategy in depth and took twovery thorough steps for improving the effi-
ciency of our activity at the end of 2008 whenthe economy was still doing fine.
In the past, we had 8 legal bodies and 4 re-gions, and each company was different. Webrought their support functions togetherinto a single centre and switched from theregional structure to divisions. As a result,we are now able to guarantee a more con-sistent service quality. Secondly, we broughtthe service of alarms and video surveillancefrom four centres to one and installed a newGPS solution on patrol and cash vehiclesthat makes it easier to manage and controlwork.
At one point, we were forced to lower peo-ple's salaries, but as agreed, we restoredthe former salaries at the beginning of thisyear.
In 2008–2009, we were thus largely occupiedwith internal procedures. Luckily, few peo-ple left, and 50 were even promoted in thecourse of the rearrangements.
For the coming years, we have clearly takenthe course of development and marketing.Our strength is precisely the provision ofcombined solutions that include mannedand technical surveillance, courier service,cash transport etc. In the next years, we aregoing to create new jobs in the field of prod-uct development. It is our goal to launchsome solutions (speed cameras) also on theinternational market; we are participating inmajor competitive biddings in Latvia andSweden •
71
Andrus Ossip:
You do not have to look for a new job every five years
G4S
G4S Eesti is the largest domestic securityenterprise, which is part of the interna-tional security group G4S since 2004.
The activity of G4S Eesti began in March1991 when Julgestusteenistuse AS ESSwas established. In the following years, thecompany entered many new fields, such astechnical surveillance, lifeguard service,cash transport etc., also subsidiaries wereestablished in Latvia and Lithuania.In 1998, 65% of ESS’s shares were boughtby the international security group FalckGroup. Six years later, Falck merged withanother major security group Securicor,resulting in the security giant G4S whichoperates in more than 110 countries andemploys over half a million people.
Since 2007, the company has been operat-ing under that trademark also in Estonia.
AS G4S results 2009:
Sales revenue (kEEK) 943,469
Change in sales revenue -20.8%
Net profit (kEEK) 202,072
Change in net profit -7.2%
Productivity of equity capital 18.3%
Productivity 288per 1 employee (kEEK)
Rank in the overall chart 173I know that this may sound trivial, but one of my main principles inmanaging the enterprise is honesty towards others and myself.We promise only what we are actually able to do, so that we couldanswer for our words and actions. That is important in every business, but in the security business, it is impossible to survivewithout it.
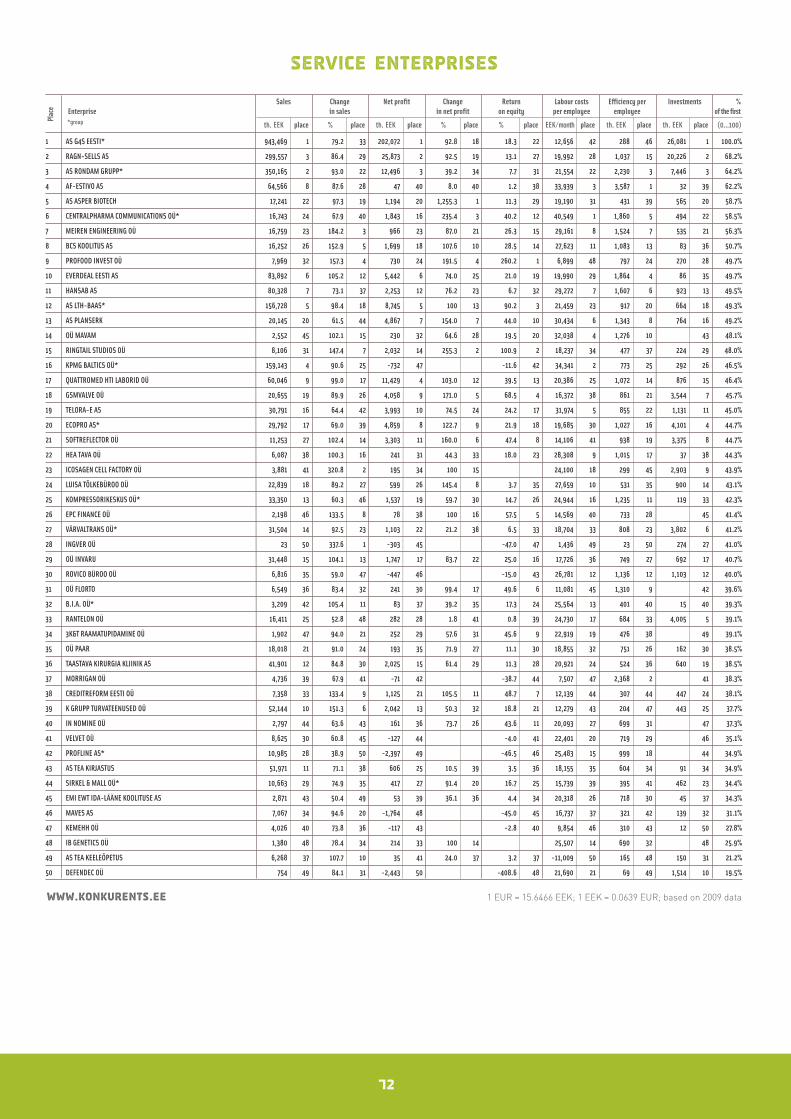
72
Service Enterprises
Sales Change Net profit Change Return Labour costs Efficiency per Investments %Enterprise in sales in net profit on equity per employee employee of the first*group th. EEK place % place th. EEK place % place % place EEK/month place th. EEK place th. EEK place (0...100)
Plac
e
www.konkurents.ee 1 EUR = 15.6466 EEK; 1 EEK = 0.0639 EUR; based on 2009 data
1 AS G4S EESTI* 943,469 1 79.2 33 202,072 1 92.8 18 18.3 22 12,656 42 288 46 26,081 1 100.0%
2 RAGN-SELLS AS 299,557 3 86.4 29 25,873 2 92.5 19 13.1 27 19,992 28 1,037 15 20,226 2 68.2%
3 AS RONDAM GRUPP* 350,165 2 93.0 22 12,496 3 39.2 34 7.7 31 21,554 22 2,230 3 7,446 3 64.2%
4 AF-ESTIVO AS 64,566 8 87.6 28 47 40 8.0 40 1.2 38 33,939 3 3,587 1 32 39 62.2%
5 AS ASPER BIOTECH 17,241 22 97.3 19 1,194 20 1,255.3 1 11.3 29 19,190 31 431 39 565 20 58.7%
6 CENTRALPHARMA COMMUNICATIONS OÜ* 16,743 24 67.9 40 1,843 16 235.4 3 40.2 12 40,549 1 1,860 5 494 22 58.5%
7 MEIREN ENGINEERING OÜ 16,759 23 184.2 3 966 23 87.0 21 26.3 15 29,161 8 1,524 7 535 21 56.3%
8 BCS KOOLITUS AS 16,252 26 152.9 5 1,699 18 107.6 10 28.5 14 27,623 11 1,083 13 83 36 50.7%
9 PROFOOD INVEST OÜ 7,969 32 157.3 4 730 24 191.5 4 260.2 1 6,899 48 797 24 270 28 49.7%
10 EVERDEAL EESTI AS 83,892 6 105.2 12 5,442 6 74.0 25 21.0 19 19,990 29 1,864 4 86 35 49.7%
11 HANSAB AS 80,328 7 73.1 37 2,253 12 76.2 23 6.7 32 29,272 7 1,607 6 923 13 49.5%
12 AS LTH-BAAS* 156,728 5 98.4 18 8,745 5 100 13 90.2 3 21,459 23 917 20 664 18 49.3%
13 AS PLANSERK 20,145 20 61.5 44 4,867 7 154.0 7 44.0 10 30,434 6 1,343 8 764 16 49.2%
14 OÜ MAVAM 2,552 45 102.1 15 230 32 64.6 28 19.5 20 32,038 4 1,276 10 43 48.1%
15 RINGTAIL STUDIOS OÜ 8,106 31 147.4 7 2,032 14 255.3 2 100.9 2 18,237 34 477 37 224 29 48.0%
16 KPMG BALTICS OÜ* 159,143 4 90.6 25 -732 47 -11.6 42 34,341 2 773 25 292 26 46.5%
17 QUATTROMED HTI LABORID OÜ 60,046 9 99.0 17 11,429 4 103.0 12 39.5 13 20,386 25 1,072 14 876 15 46.4%
18 GSMVALVE OÜ 20,655 19 89.9 26 4,058 9 171.0 5 68.5 4 16,372 38 861 21 3,544 7 45.7%
19 TELORA-E AS 30,791 16 64.4 42 3,993 10 74.5 24 24.2 17 31,974 5 855 22 1,131 11 45.0%
20 ECOPRO AS* 29,792 17 69.0 39 4,859 8 122.7 9 21.9 18 19,685 30 1,027 16 4,101 4 44.7%
21 SOFTREFLECTOR OÜ 11,253 27 102.4 14 3,303 11 160.0 6 47.4 8 14,106 41 938 19 3,375 8 44.7%
22 HEA TAVA OÜ 6,087 38 100.3 16 241 31 44.3 33 18.0 23 28,308 9 1,015 17 37 38 44.3%
23 ICOSAGEN CELL FACTORY OÜ 3,881 41 320.8 2 195 34 100 15 24,100 18 299 45 2,903 9 43.9%
24 LUISA TÕLKEBÜROO OÜ 22,839 18 89.2 27 599 26 145.4 8 3.7 35 27,659 10 531 35 900 14 43.1%
25 KOMPRESSORIKESKUS OÜ* 33,350 13 60.3 46 1,537 19 59.7 30 14.7 26 24,944 16 1,235 11 119 33 42.3%
26 EPC FINANCE OÜ 2,198 46 133.5 8 78 38 100 16 57.5 5 14,569 40 733 28 45 41.4%
27 VÄRVALTRANS OÜ* 31,504 14 92.5 23 1,103 22 21.2 38 6.5 33 18,704 33 808 23 3,802 6 41.2%
28 INGVER OÜ 23 50 337.6 1 -303 45 -47.0 47 1,436 49 23 50 274 27 41.0%
29 OÜ INVARU 31,448 15 104.1 13 1,747 17 83.7 22 25.0 16 17,726 36 749 27 692 17 40.7%
30 ROVICO BÜROO OÜ 6,816 35 59.0 47 -447 46 -15.0 43 26,781 12 1,136 12 1,103 12 40.0%
31 OÜ FLORTO 6,549 36 83.4 32 241 30 99.4 17 49.6 6 11,081 45 1,310 9 42 39.6%
32 B.I.A. OÜ* 3,209 42 105.4 11 83 37 39.2 35 17.3 24 25,564 13 401 40 15 40 39.3%
33 RANTELON OÜ 16,411 25 52.8 48 282 28 1.8 41 0.8 39 24,730 17 684 33 4,005 5 39.1%
34 3K&T RAAMATUPIDAMINE OÜ 1,902 47 94.0 21 252 29 57.6 31 45.6 9 22,919 19 476 38 49 39.1%
35 OÜ PAAR 18,018 21 91.0 24 193 35 71.9 27 11.1 30 18,855 32 751 26 162 30 38.5%
36 TAASTAVA KIRURGIA KLIINIK AS 41,901 12 84.8 30 2,025 15 61.4 29 11.3 28 20,921 24 524 36 640 19 38.5%
37 MORRIGAN OÜ 4,736 39 67.9 41 -71 42 -38.7 44 7,507 47 2,368 2 41 38.3%
38 CREDITREFORM EESTI OÜ 7,358 33 133.4 9 1,125 21 105.5 11 48.7 7 12,139 44 307 44 447 24 38.1%
39 K GRUPP TURVATEENUSED OÜ 52,144 10 151.3 6 2,042 13 50.3 32 18.8 21 12,279 43 204 47 443 25 37.7%
40 IN NOMINE OÜ 2,797 44 63.6 43 161 36 73.7 26 43.6 11 20,093 27 699 31 47 37.3%
41 VELVET OÜ 8,625 30 60.8 45 -127 44 -4.0 41 22,401 20 719 29 46 35.1%
42 PROFLINE AS* 10,985 28 38.9 50 -2,397 49 -46.5 46 25,483 15 999 18 44 34.9%
43 AS TEA KIRJASTUS 51,971 11 71.1 38 606 25 10.5 39 3.5 36 18,155 35 604 34 91 34 34.9%
44 SIRKEL & MALL OÜ* 10,663 29 74.9 35 417 27 91.4 20 16.7 25 15,739 39 395 41 462 23 34.4%
45 EMI EWT IDA-LÄÄNE KOOLITUSE AS 2,871 43 50.4 49 53 39 36.1 36 4.4 34 20,318 26 718 30 45 37 34.3%
46 MAVES AS 7,067 34 94.6 20 -1,764 48 -45.0 45 16,737 37 321 42 139 32 31.1%
47 KEMEHH OÜ 4,026 40 73.8 36 -117 43 -2.8 40 9,854 46 310 43 12 50 27.8%
48 IB GENETICS OÜ 1,380 48 78.4 34 214 33 100 14 25,507 14 690 32 48 25.9%
49 AS TEA KEELEÕPETUS 6,268 37 107.7 10 35 41 24.0 37 3.2 37 -11,009 50 165 48 150 31 21.2%
50 DEFENDEC OÜ 754 49 84.1 31 -2,443 50 -408.6 48 21,690 21 69 49 1,514 10 19.5%
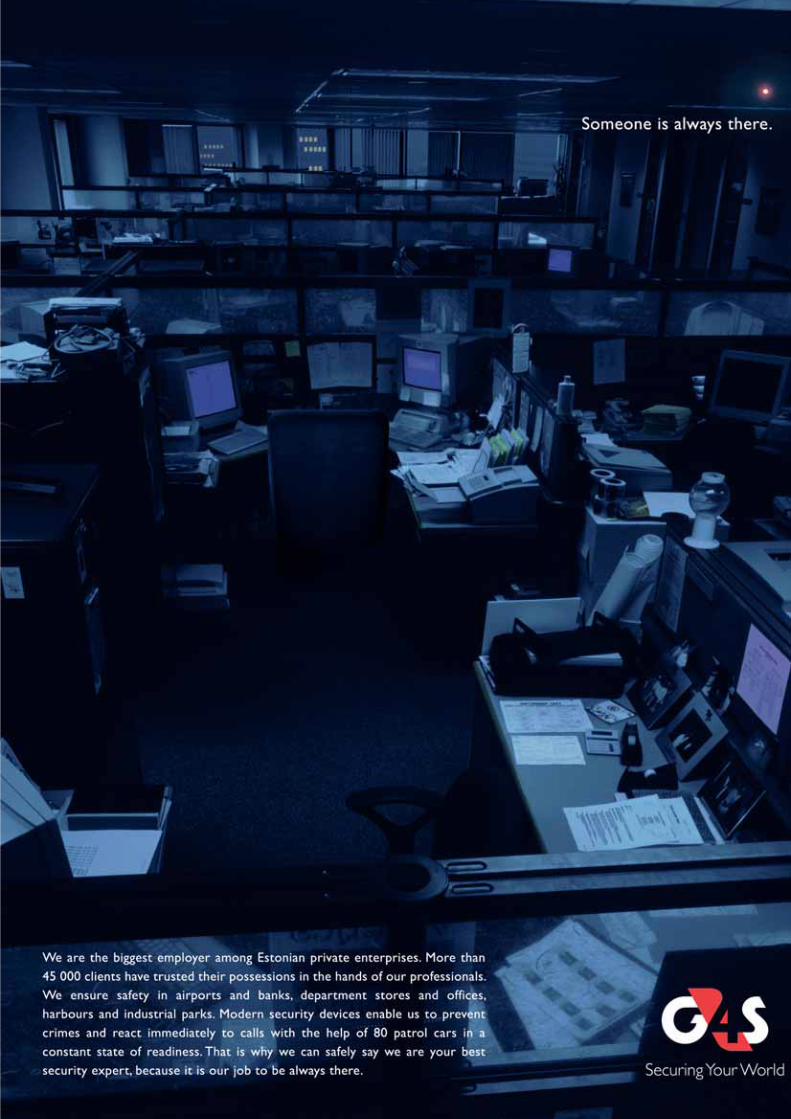
The Best Estonian Enterprises
Entrepreneurship Award The Best Estonian
Enterprises 2010
74
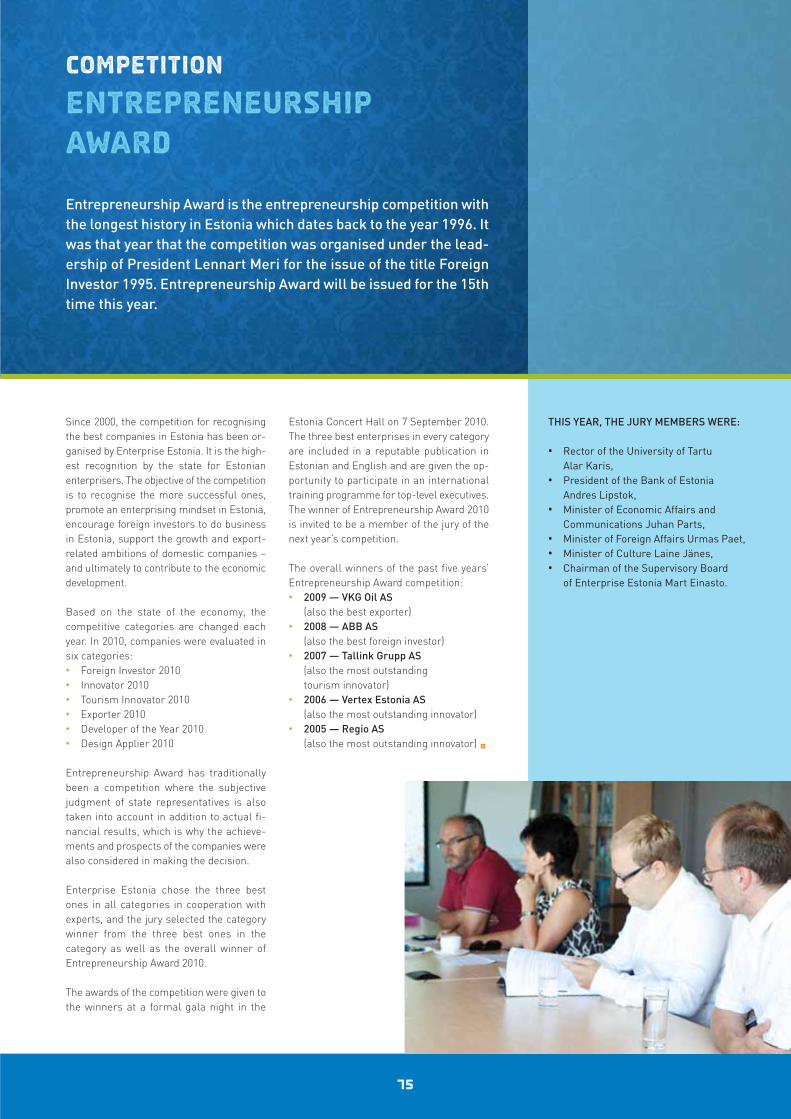
75
Since 2000, the competition for recognisingthe best companies in Estonia has been or-ganised by Enterprise Estonia. It is the high-est recognition by the state for Estonianenterprisers. The objective of the competitionis to recognise the more successful ones,promote an enterprising mindset in Estonia,encourage foreign investors to do businessin Estonia, support the growth and export-related ambitions of domestic companies –and ultimately to contribute to the economicdevelopment.
Based on the state of the economy, thecompetitive categories are changed eachyear. In 2010, companies were evaluated insix categories:• Foreign Investor 2010• Innovator 2010• Tourism Innovator 2010• Exporter 2010• Developer of the Year 2010• Design Applier 2010
Entrepreneurship Award has traditionallybeen a competition where the subjectivejudgment of state representatives is alsotaken into account in addition to actual fi-nancial results, which is why the achieve-ments and prospects of the companies werealso considered in making the decision.
Enterprise Estonia chose the three bestones in all categories in cooperation withexperts, and the jury selected the categorywinner from the three best ones in the category as well as the overall winner of Entrepreneurship Award 2010.
The awards of the competition were given tothe winners at a formal gala night in the
Estonia Concert Hall on 7 September 2010.The three best enterprises in every categoryare included in a reputable publication inEstonian and English and are given the op-portunity to participate in an internationaltraining programme for top-level executives.The winner of Entrepreneurship Award 2010is invited to be a member of the jury of thenext year’s competition.
The overall winners of the past five years’Entrepreneurship Award competition:• 2009 — VKG Oil AS
(also the best exporter)• 2008 — ABB AS
(also the best foreign investor)• 2007 — Tallink Grupp AS
(also the most outstanding tourism innovator)
• 2006 — Vertex Estonia AS (also the most outstanding innovator)
• 2005 — Regio AS (also the most outstanding innovator) •
competition
Entrepreneurship Award
Entrepreneurship Award is the entrepreneurship competition withthe longest history in Estonia which dates back to the year 1996. Itwas that year that the competition was organised under the lead-ership of President Lennart Meri for the issue of the title ForeignInvestor 1995. Entrepreneurship Award will be issued for the 15thtime this year.
THIS YEAR, THE JURY MEMBERS WERE:
• Rector of the University of Tartu Alar Karis,
• President of the Bank of Estonia Andres Lipstok,
• Minister of Economic Affairs and Communications Juhan Parts,
• Minister of Foreign Affairs Urmas Paet,• Minister of Culture Laine Jänes, • Chairman of the Supervisory Board
of Enterprise Estonia Mart Einasto.
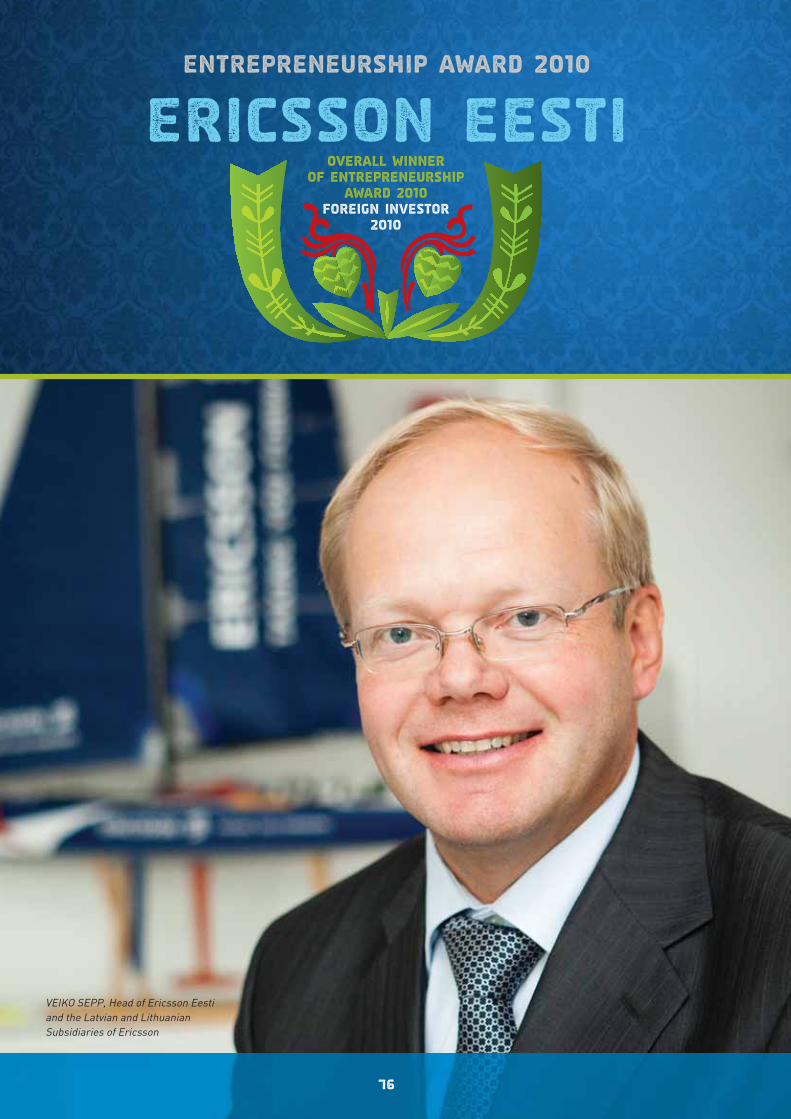
Entrepreneurship Award 2010
Overall winner of Entrepreneurship
Award 2010Foreign Investor
2010
Ericsson Eesti
76
VEIKO SEPP, Head of Ericsson Eesti and the Latvian and Lithuanian Subsidiaries of Ericsson
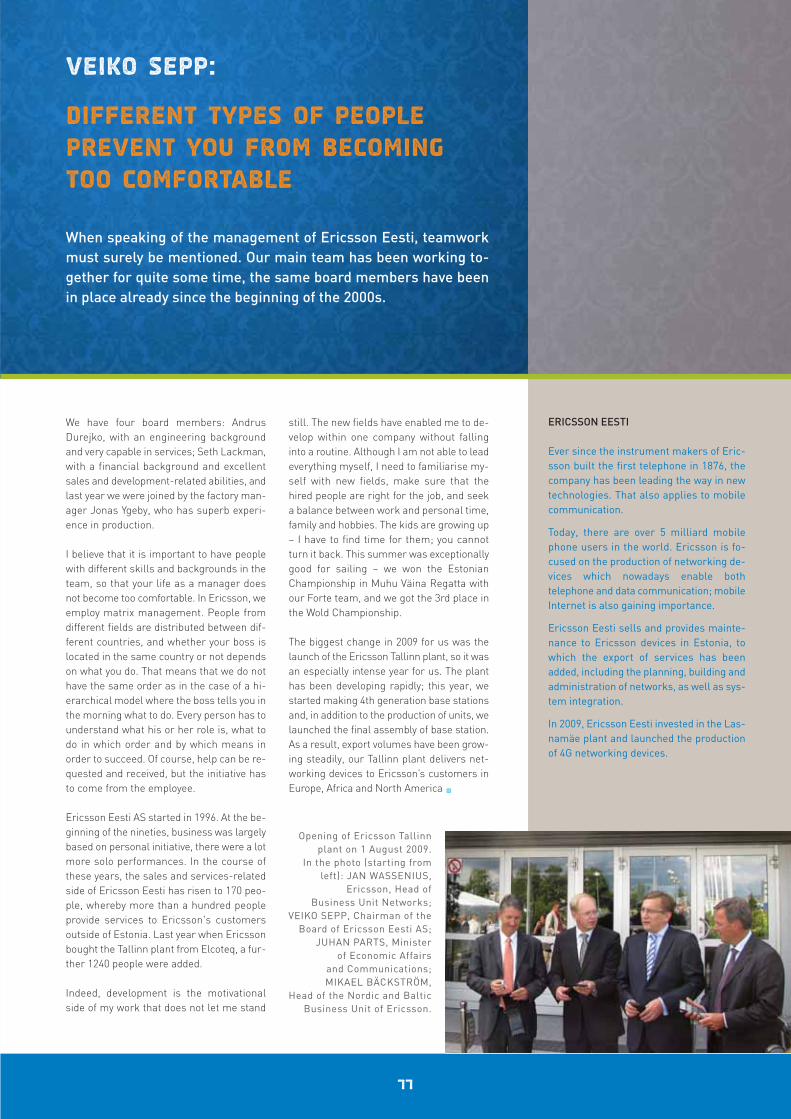
We have four board members: AndrusDurejko, with an engineering backgroundand very capable in services; Seth Lackman,with a financial background and excellentsales and development-related abilities, andlast year we were joined by the factory man-ager Jonas Ygeby, who has superb experi-ence in production.
I believe that it is important to have peoplewith different skills and backgrounds in theteam, so that your life as a manager doesnot become too comfortable. In Ericsson, weemploy matrix management. People fromdifferent fields are distributed between dif-ferent countries, and whether your boss islocated in the same country or not dependson what you do. That means that we do nothave the same order as in the case of a hi-erarchical model where the boss tells you inthe morning what to do. Every person has tounderstand what his or her role is, what todo in which order and by which means inorder to succeed. Of course, help can be re-quested and received, but the initiative hasto come from the employee.
Ericsson Eesti AS started in 1996. At the be-ginning of the nineties, business was largelybased on personal initiative, there were a lotmore solo performances. In the course ofthese years, the sales and services-relatedside of Ericsson Eesti has risen to 170 peo-ple, whereby more than a hundred peopleprovide services to Ericsson's customersoutside of Estonia. Last year when Ericssonbought the Tallinn plant from Elcoteq, a fur-ther 1240 people were added.
Indeed, development is the motivationalside of my work that does not let me stand
still. The new fields have enabled me to de-velop within one company without fallinginto a routine. Although I am not able to leadeverything myself, I need to familiarise my-self with new fields, make sure that thehired people are right for the job, and seeka balance between work and personal time,family and hobbies. The kids are growing up– I have to find time for them; you cannotturn it back. This summer was exceptionallygood for sailing – we won the EstonianChampionship in Muhu Väina Regatta withour Forte team, and we got the 3rd place inthe Wold Championship.
The biggest change in 2009 for us was thelaunch of the Ericsson Tallinn plant, so it wasan especially intense year for us. The planthas been developing rapidly; this year, westarted making 4th generation base stationsand, in addition to the production of units, welaunched the final assembly of base station.As a result, export volumes have been grow-ing steadily, our Tallinn plant delivers net-working devices to Ericsson’s customers inEurope, Africa and North America •
77
Veiko Sepp:
Different types of peopleprevent you from becomingtoo comfortable
ERICSSON EESTI
Ever since the instrument makers of Eric-sson built the first telephone in 1876, thecompany has been leading the way in newtechnologies. That also applies to mobilecommunication.
Today, there are over 5 milliard mobilephone users in the world. Ericsson is fo-cused on the production of networking de-vices which nowadays enable bothtelephone and data communication; mobileInternet is also gaining importance.
Ericsson Eesti sells and provides mainte-nance to Ericsson devices in Estonia, towhich the export of services has beenadded, including the planning, building andadministration of networks, as well as sys-tem integration.
In 2009, Ericsson Eesti invested in the Las-namäe plant and launched the productionof 4G networking devices.
When speaking of the management of Ericsson Eesti, teamworkmust surely be mentioned. Our main team has been working to-gether for quite some time, the same board members have beenin place already since the beginning of the 2000s.
Opening of Ericsson Tallinnplant on 1 August 2009.
In the photo (starting fromleft): JAN WASSENIUS,
Ericsson, Head of Business Unit Networks;
VEIKO SEPP, Chairman of theBoard of Ericsson Eesti AS;
JUHAN PARTS, Minister of Economic Affairs
and Communications; MIKAEL BÄCKSTRÖM,
Head of the Nordic and BalticBusiness Unit of Ericsson.
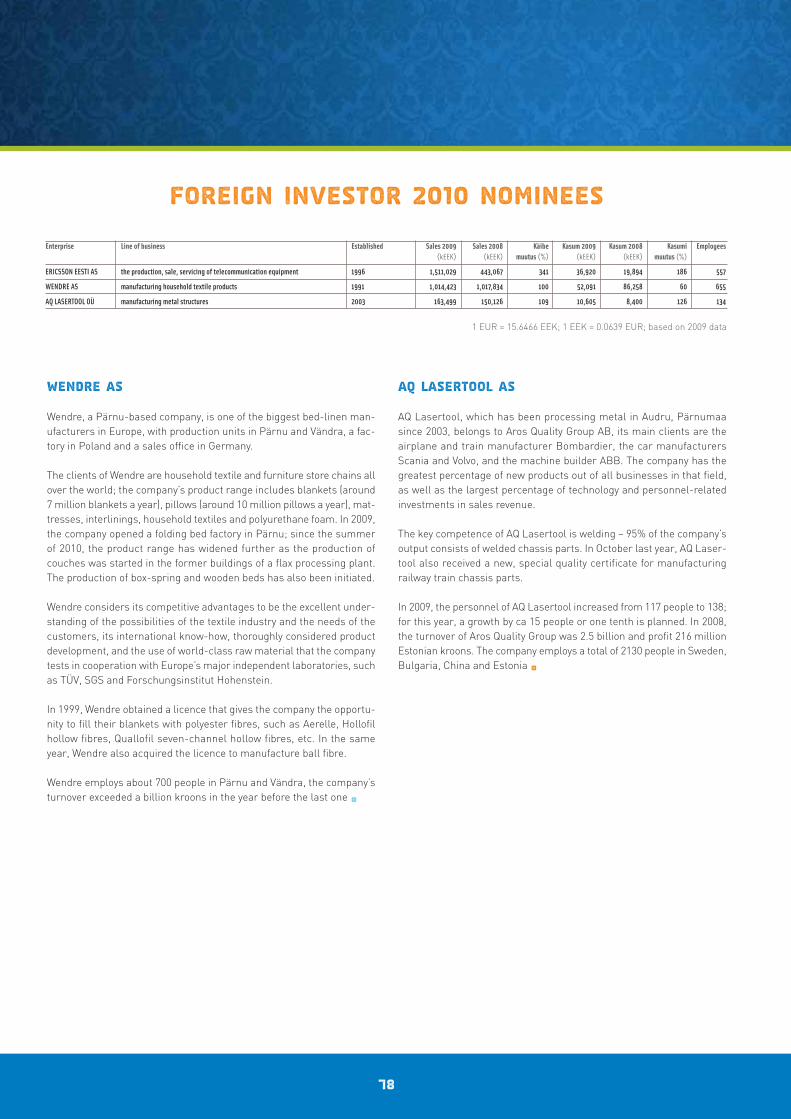
Wendre AS
Wendre, a Pärnu-based company, is one of the biggest bed-linen man-ufacturers in Europe, with production units in Pärnu and Vändra, a fac-tory in Poland and a sales office in Germany.
The clients of Wendre are household textile and furniture store chains allover the world; the company’s product range includes blankets (around7 million blankets a year), pillows (around 10 million pillows a year), mat-tresses, interlinings, household textiles and polyurethane foam. In 2009,the company opened a folding bed factory in Pärnu; since the summerof 2010, the product range has widened further as the production ofcouches was started in the former buildings of a flax processing plant.The production of box-spring and wooden beds has also been initiated.
Wendre considers its competitive advantages to be the excellent under-standing of the possibilities of the textile industry and the needs of thecustomers, its international know-how, thoroughly considered productdevelopment, and the use of world-class raw material that the companytests in cooperation with Europe’s major independent laboratories, suchas TÜV, SGS and Forschungsinstitut Hohenstein.
In 1999, Wendre obtained a licence that gives the company the opportu-nity to fill their blankets with polyester fibres, such as Aerelle, Hollofilhollow fibres, Quallofil seven-channel hollow fibres, etc. In the sameyear, Wendre also acquired the licence to manufacture ball fibre.
Wendre employs about 700 people in Pärnu and Vändra, the company’sturnover exceeded a billion kroons in the year before the last one •
AQ Lasertool AS
AQ Lasertool, which has been processing metal in Audru, Pärnumaasince 2003, belongs to Aros Quality Group AB, its main clients are theairplane and train manufacturer Bombardier, the car manufacturersScania and Volvo, and the machine builder ABB. The company has thegreatest percentage of new products out of all businesses in that field,as well as the largest percentage of technology and personnel-relatedinvestments in sales revenue.
The key competence of AQ Lasertool is welding – 95% of the company’soutput consists of welded chassis parts. In October last year, AQ Laser-tool also received a new, special quality certificate for manufacturingrailway train chassis parts.
In 2009, the personnel of AQ Lasertool increased from 117 people to 138;for this year, a growth by ca 15 people or one tenth is planned. In 2008,the turnover of Aros Quality Group was 2.5 billion and profit 216 millionEstonian kroons. The company employs a total of 2130 people in Sweden,Bulgaria, China and Estonia •
Foreign Investor 2010 nominees
78
Enterprise Line of business Established Sales 2009 Sales 2008 Käibe Kasum 2009 Kasum 2008 Kasumi Employees(kEEK) (kEEK) muutus (%) (kEEK) (kEEK) muutus (%)
ERICSSON EESTI AS the production, sale, servicing of telecommunication equipment 1996 1,511,029 443,067 341 36,920 19,894 186 557
WENDRE AS manufacturing household textile products 1991 1,014,423 1,017,834 100 52,091 86,258 60 655
AQ LASERTOOL OÜ manufacturing metal structures 2003 163,499 150,126 109 10,605 8,400 126 134
1 EUR = 15.6466 EEK; 1 EEK = 0.0639 EUR; based on 2009 data
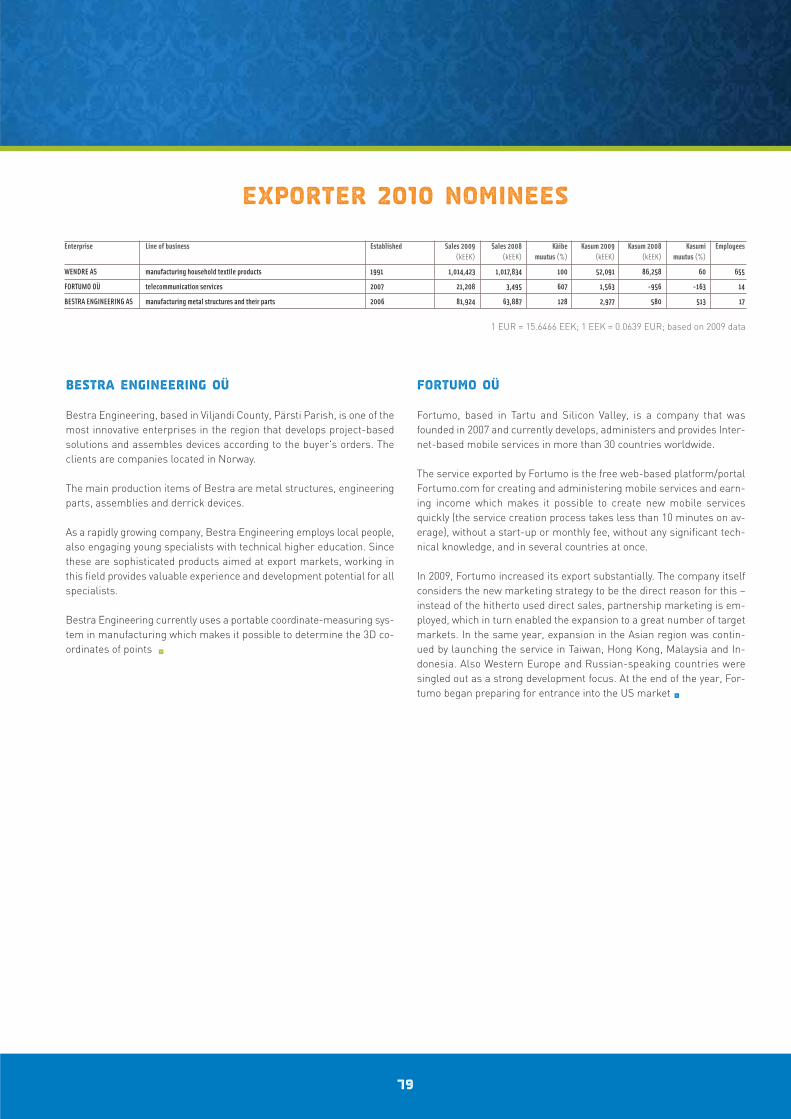
79
Bestra Engineering OÜ
Bestra Engineering, based in Viljandi County, Pärsti Parish, is one of themost innovative enterprises in the region that develops project-basedsolutions and assembles devices according to the buyer's orders. Theclients are companies located in Norway.
The main production items of Bestra are metal structures, engineeringparts, assemblies and derrick devices.
As a rapidly growing company, Bestra Engineering employs local people,also engaging young specialists with technical higher education. Sincethese are sophisticated products aimed at export markets, working inthis field provides valuable experience and development potential for allspecialists.
Bestra Engineering currently uses a portable coordinate-measuring sys-tem in manufacturing which makes it possible to determine the 3D co-ordinates of points •
Fortumo OÜ
Fortumo, based in Tartu and Silicon Valley, is a company that wasfounded in 2007 and currently develops, administers and provides Inter-net-based mobile services in more than 30 countries worldwide.
The service exported by Fortumo is the free web-based platform/portalFortumo.com for creating and administering mobile services and earn-ing income which makes it possible to create new mobile servicesquickly (the service creation process takes less than 10 minutes on av-erage), without a start-up or monthly fee, without any significant tech-nical knowledge, and in several countries at once.
In 2009, Fortumo increased its export substantially. The company itselfconsiders the new marketing strategy to be the direct reason for this –instead of the hitherto used direct sales, partnership marketing is em-ployed, which in turn enabled the expansion to a great number of targetmarkets. In the same year, expansion in the Asian region was contin-ued by launching the service in Taiwan, Hong Kong, Malaysia and In-donesia. Also Western Europe and Russian-speaking countries weresingled out as a strong development focus. At the end of the year, For-tumo began preparing for entrance into the US market •
Exporter 2010 nominees
Enterprise Line of business Established Sales 2009 Sales 2008 Käibe Kasum 2009 Kasum 2008 Kasumi Employees(kEEK) (kEEK) muutus (%) (kEEK) (kEEK) muutus (%)
WENDRE AS manufacturing household textile products 1991 1,014,423 1,017,834 100 52,091 86,258 60 655
FORTUMO OÜ telecommunication services 2007 21,208 3,495 607 1,563 -956 -163 14
BESTRA ENGINEERING AS manufacturing metal structures and their parts 2006 81,924 63,887 128 2,977 580 513 17
1 EUR = 15.6466 EEK; 1 EEK = 0.0639 EUR; based on 2009 data
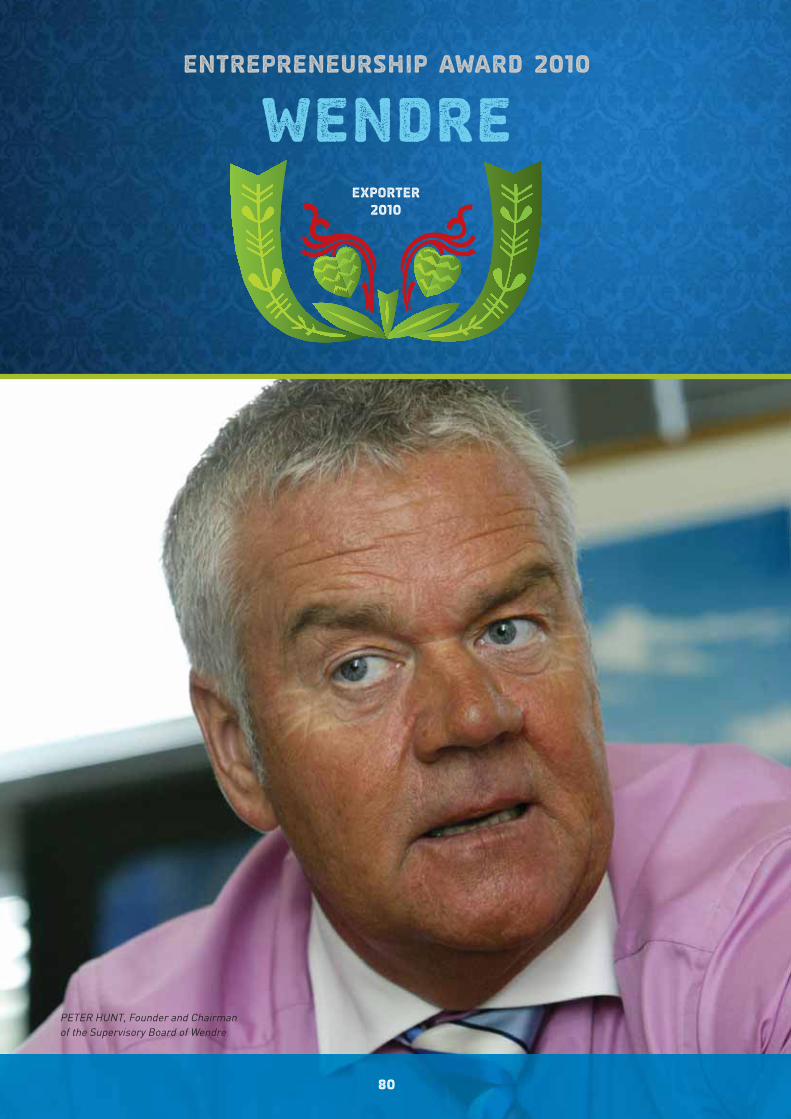
Entrepreneurship Award 2010
Exporter2010
Wendre
80
PETER HUNT, Founder and Chairman of the Supervisory Board of Wendre
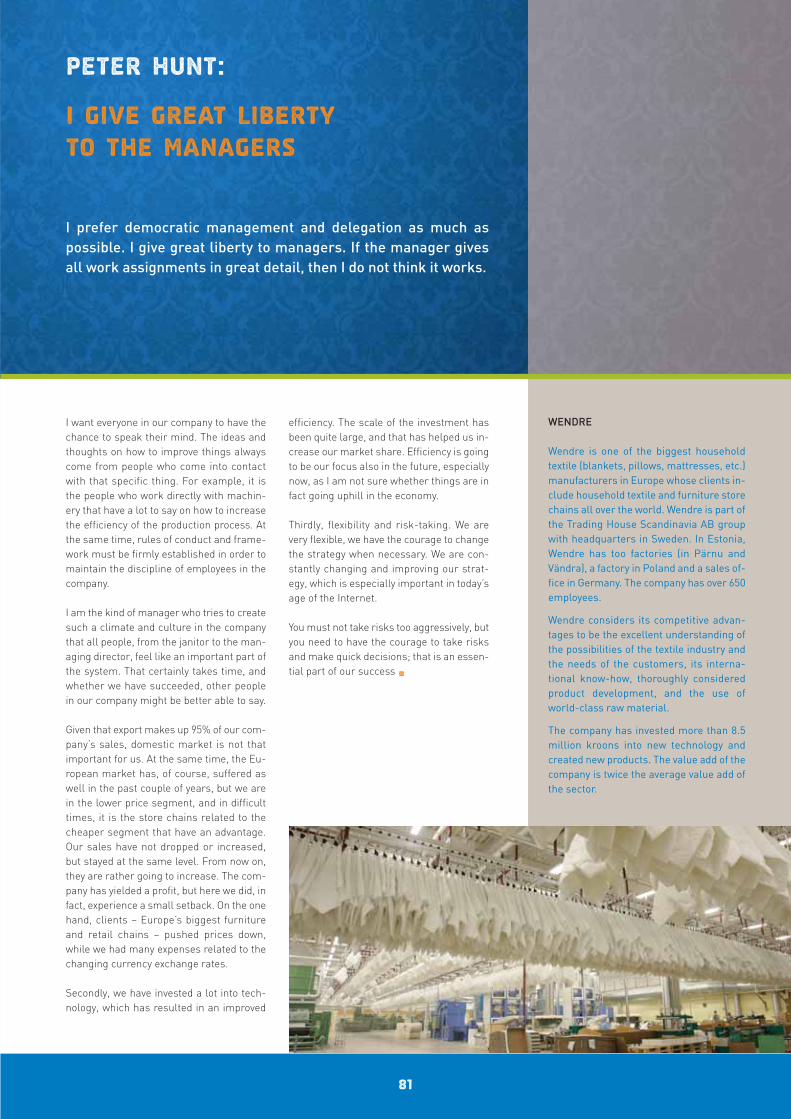
I want everyone in our company to have thechance to speak their mind. The ideas andthoughts on how to improve things alwayscome from people who come into contactwith that specific thing. For example, it isthe people who work directly with machin-ery that have a lot to say on how to increasethe efficiency of the production process. Atthe same time, rules of conduct and frame-work must be firmly established in order tomaintain the discipline of employees in thecompany.
I am the kind of manager who tries to createsuch a climate and culture in the companythat all people, from the janitor to the man-aging director, feel like an important part ofthe system. That certainly takes time, andwhether we have succeeded, other peoplein our company might be better able to say.
Given that export makes up 95% of our com-pany’s sales, domestic market is not thatimportant for us. At the same time, the Eu-ropean market has, of course, suffered aswell in the past couple of years, but we arein the lower price segment, and in difficulttimes, it is the store chains related to thecheaper segment that have an advantage.Our sales have not dropped or increased,but stayed at the same level. From now on,they are rather going to increase. The com-pany has yielded a profit, but here we did, infact, experience a small setback. On the onehand, clients – Europe’s biggest furnitureand retail chains – pushed prices down,while we had many expenses related to thechanging currency exchange rates.
Secondly, we have invested a lot into tech-nology, which has resulted in an improved
efficiency. The scale of the investment hasbeen quite large, and that has helped us in-crease our market share. Efficiency is goingto be our focus also in the future, especiallynow, as I am not sure whether things are infact going uphill in the economy.
Thirdly, flexibility and risk-taking. We arevery flexible, we have the courage to changethe strategy when necessary. We are con-stantly changing and improving our strat-egy, which is especially important in today’sage of the Internet.
You must not take risks too aggressively, butyou need to have the courage to take risksand make quick decisions; that is an essen-tial part of our success •
WENDRE
Wendre is one of the biggest householdtextile (blankets, pillows, mattresses, etc.)manufacturers in Europe whose clients in-clude household textile and furniture storechains all over the world. Wendre is part ofthe Trading House Scandinavia AB groupwith headquarters in Sweden. In Estonia,Wendre has too factories (in Pärnu andVändra), a factory in Poland and a sales of-fice in Germany. The company has over 650employees.
Wendre considers its competitive advan-tages to be the excellent understanding ofthe possibilities of the textile industry andthe needs of the customers, its interna-tional know-how, thoroughly consideredproduct development, and the use ofworld-class raw material.
The company has invested more than 8.5million kroons into new technology andcreated new products. The value add of thecompany is twice the average value add ofthe sector.
I prefer democratic management and delegation as much as possible. I give great liberty to managers. If the manager gives all work assignments in great detail, then I do not think it works.
81
Peter Hunt:
I give great liberty to the managers
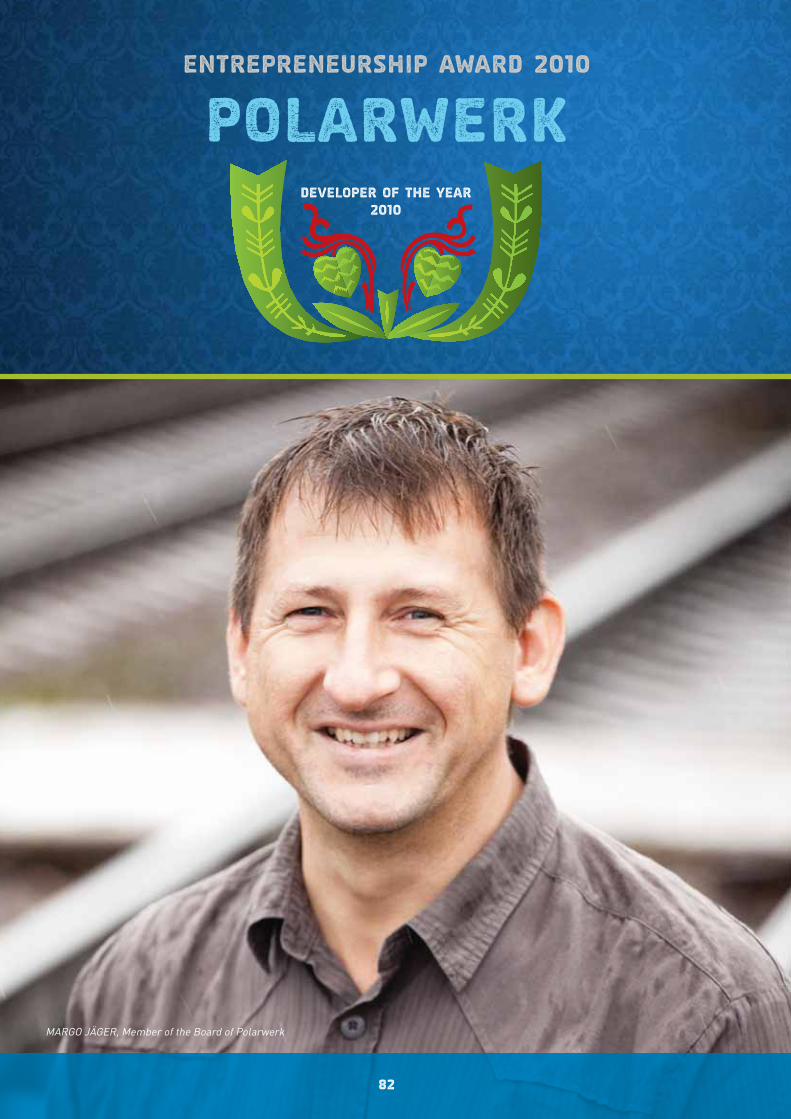
Entrepreneurship Award 2010
Developer of the Year 2010
Polarwerk
82
MARGO JÄGER, Member of the Board of Polarwerk
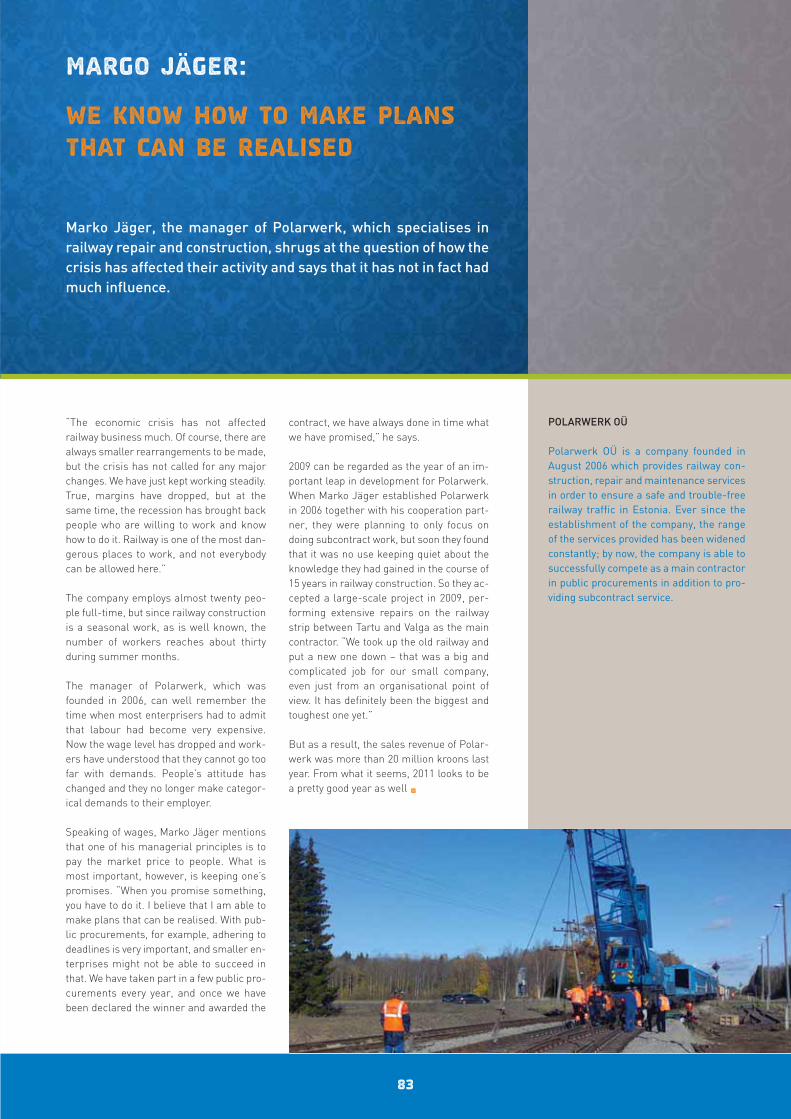
“The economic crisis has not affected railway business much. Of course, there arealways smaller rearrangements to be made,but the crisis has not called for any majorchanges. We have just kept working steadily.True, margins have dropped, but at thesame time, the recession has brought backpeople who are willing to work and knowhow to do it. Railway is one of the most dan-gerous places to work, and not everybodycan be allowed here.”
The company employs almost twenty peo-ple full-time, but since railway constructionis a seasonal work, as is well known, thenumber of workers reaches about thirtyduring summer months.
The manager of Polarwerk, which wasfounded in 2006, can well remember thetime when most enterprisers had to admitthat labour had become very expensive.Now the wage level has dropped and work-ers have understood that they cannot go toofar with demands. People’s attitude haschanged and they no longer make categor-ical demands to their employer.
Speaking of wages, Marko Jäger mentionsthat one of his managerial principles is topay the market price to people. What ismost important, however, is keeping one’spromises. “When you promise something,you have to do it. I believe that I am able tomake plans that can be realised. With pub-lic procurements, for example, adhering todeadlines is very important, and smaller en-terprises might not be able to succeed inthat. We have taken part in a few public pro-curements every year, and once we havebeen declared the winner and awarded the
contract, we have always done in time whatwe have promised,” he says.
2009 can be regarded as the year of an im-portant leap in development for Polarwerk.When Marko Jäger established Polarwerkin 2006 together with his cooperation part-ner, they were planning to only focus ondoing subcontract work, but soon they foundthat it was no use keeping quiet about theknowledge they had gained in the course of15 years in railway construction. So they ac-cepted a large-scale project in 2009, per-forming extensive repairs on the railwaystrip between Tartu and Valga as the maincontractor. “We took up the old railway andput a new one down – that was a big andcomplicated job for our small company,even just from an organisational point ofview. It has definitely been the biggest andtoughest one yet.”
But as a result, the sales revenue of Polar-werk was more than 20 million kroons lastyear. From what it seems, 2011 looks to bea pretty good year as well •
83
Margo Jäger:
We know how to make plansthat can be realised
POLARWERK OÜ
Polarwerk OÜ is a company founded in August 2006 which provides railway con-struction, repair and maintenance servicesin order to ensure a safe and trouble-freerailway traffic in Estonia. Ever since the establishment of the company, the rangeof the services provided has been widenedconstantly; by now, the company is able tosuccessfully compete as a main contractorin public procurements in addition to pro-viding subcontract service.
Marko Jäger, the manager of Polarwerk, which specialises in railway repair and construction, shrugs at the question of how the crisis has affected their activity and says that it has not in fact hadmuch influence.
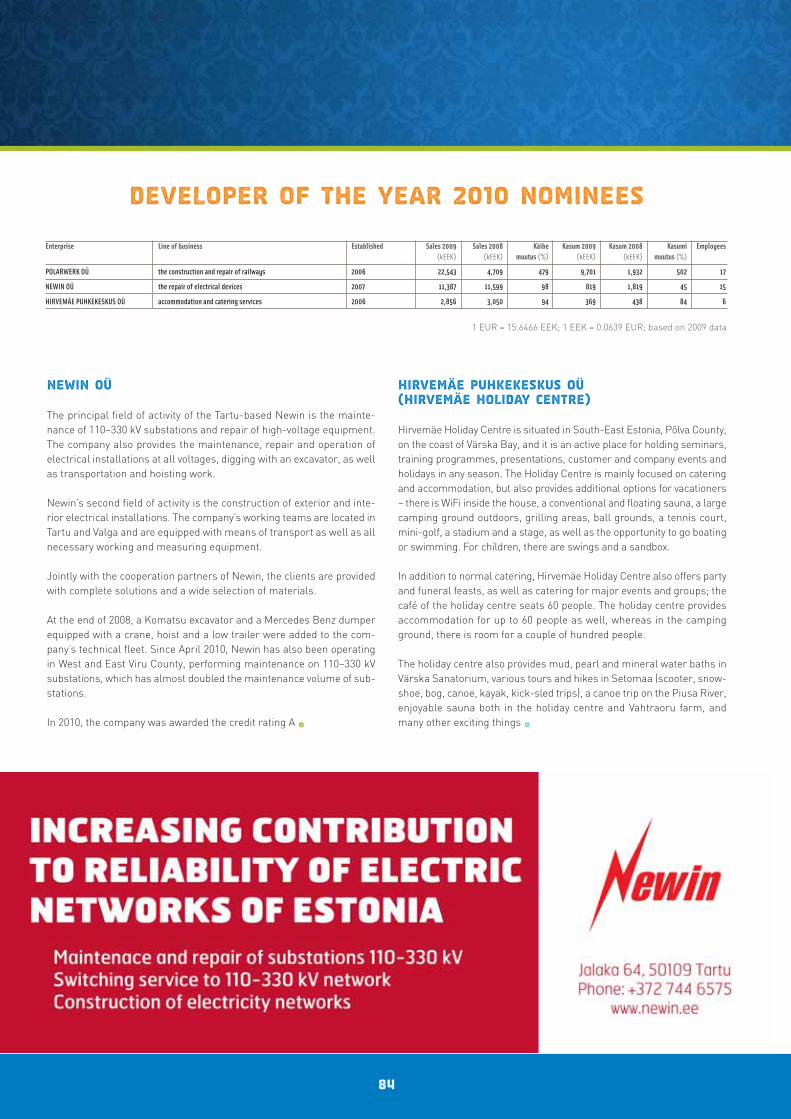
84
Newin OÜ
The principal field of activity of the Tartu-based Newin is the mainte-nance of 110–330 kV substations and repair of high-voltage equipment.The company also provides the maintenance, repair and operation ofelectrical installations at all voltages, digging with an excavator, as wellas transportation and hoisting work.
Newin’s second field of activity is the construction of exterior and inte-rior electrical installations. The company’s working teams are located inTartu and Valga and are equipped with means of transport as well as allnecessary working and measuring equipment.
Jointly with the cooperation partners of Newin, the clients are providedwith complete solutions and a wide selection of materials.
At the end of 2008, a Komatsu excavator and a Mercedes Benz dumperequipped with a crane, hoist and a low trailer were added to the com-pany’s technical fleet. Since April 2010, Newin has also been operatingin West and East Viru County, performing maintenance on 110–330 kVsubstations, which has almost doubled the maintenance volume of sub-stations.
In 2010, the company was awarded the credit rating A •
Hirvemäe Puhkekeskus OÜ (Hirvemäe Holiday Centre)
Hirvemäe Holiday Centre is situated in South-East Estonia, Põlva County,on the coast of Värska Bay, and it is an active place for holding seminars,training programmes, presentations, customer and company events andholidays in any season. The Holiday Centre is mainly focused on cateringand accommodation, but also provides additional options for vacationers– there is WiFi inside the house, a conventional and floating sauna, a largecamping ground outdoors, grilling areas, ball grounds, a tennis court,mini-golf, a stadium and a stage, as well as the opportunity to go boatingor swimming. For children, there are swings and a sandbox.
In addition to normal catering, Hirvemäe Holiday Centre also offers partyand funeral feasts, as well as catering for major events and groups; thecafé of the holiday centre seats 60 people. The holiday centre providesaccommodation for up to 60 people as well, whereas in the campingground, there is room for a couple of hundred people.
The holiday centre also provides mud, pearl and mineral water baths inVärska Sanatorium, various tours and hikes in Setomaa (scooter, snow-shoe, bog, canoe, kayak, kick-sled trips), a canoe trip on the Piusa River,enjoyable sauna both in the holiday centre and Vahtraoru farm, andmany other exciting things •
Developer of the Year 2010 nominees
Enterprise Line of business Established Sales 2009 Sales 2008 Käibe Kasum 2009 Kasum 2008 Kasumi Employees(kEEK) (kEEK) muutus (%) (kEEK) (kEEK) muutus (%)
POLARWERK OÜ the construction and repair of railways 2006 22,543 4,709 479 9,701 1,932 502 17
NEWIN OÜ the repair of electrical devices 2007 11,387 11,599 98 819 1,819 45 15
HIRVEMÄE PUHKEKESKUS OÜ accommodation and catering services 2006 2,856 3,050 94 369 438 84 6
1 EUR = 15.6466 EEK; 1 EEK = 0.0639 EUR; based on 2009 data
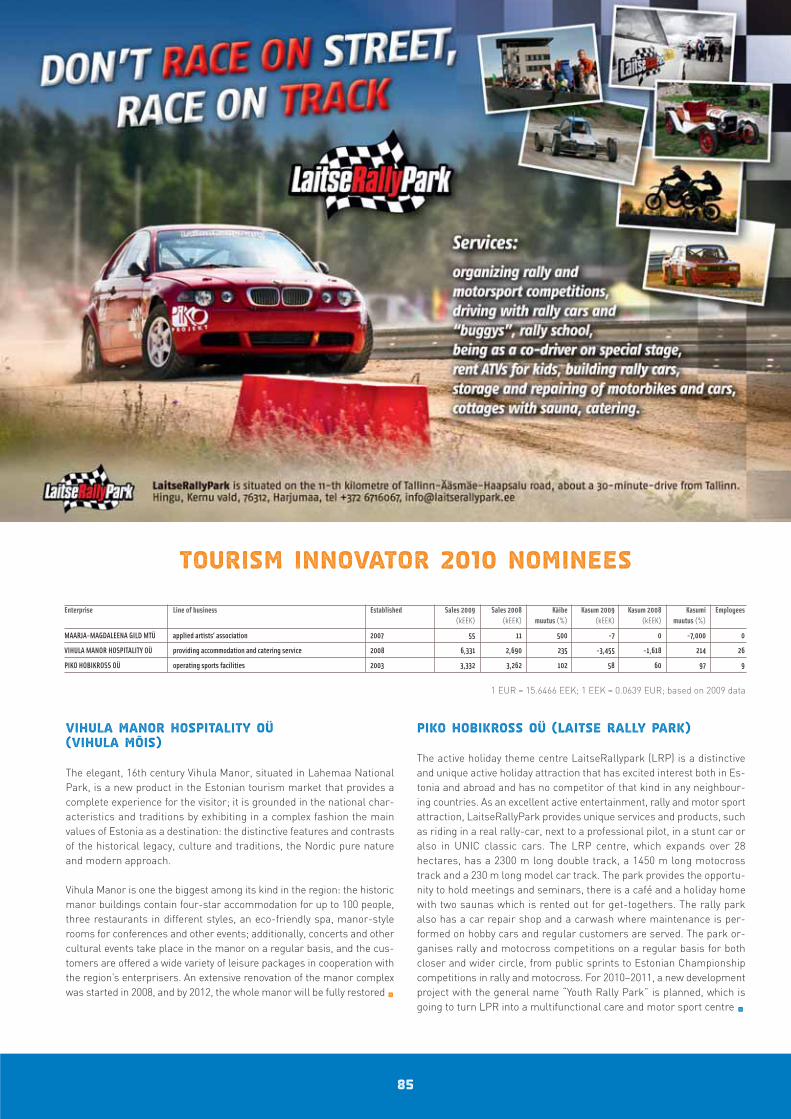
85
Vihula Manor Hospitality OÜ (Vihula Mõis)
The elegant, 16th century Vihula Manor, situated in Lahemaa NationalPark, is a new product in the Estonian tourism market that provides acomplete experience for the visitor; it is grounded in the national char-acteristics and traditions by exhibiting in a complex fashion the mainvalues of Estonia as a destination: the distinctive features and contrastsof the historical legacy, culture and traditions, the Nordic pure natureand modern approach.
Vihula Manor is one the biggest among its kind in the region: the historicmanor buildings contain four-star accommodation for up to 100 people,three restaurants in different styles, an eco-friendly spa, manor-stylerooms for conferences and other events; additionally, concerts and othercultural events take place in the manor on a regular basis, and the cus-tomers are offered a wide variety of leisure packages in cooperation withthe region’s enterprisers. An extensive renovation of the manor complexwas started in 2008, and by 2012, the whole manor will be fully restored •
Piko Hobikross OÜ (Laitse Rally Park)
The active holiday theme centre LaitseRallypark (LRP) is a distinctiveand unique active holiday attraction that has excited interest both in Es-tonia and abroad and has no competitor of that kind in any neighbour-ing countries. As an excellent active entertainment, rally and motor sportattraction, LaitseRallyPark provides unique services and products, suchas riding in a real rally-car, next to a professional pilot, in a stunt car oralso in UNIC classic cars. The LRP centre, which expands over 28hectares, has a 2300 m long double track, a 1450 m long motocrosstrack and a 230 m long model car track. The park provides the opportu-nity to hold meetings and seminars, there is a café and a holiday homewith two saunas which is rented out for get-togethers. The rally parkalso has a car repair shop and a carwash where maintenance is per-formed on hobby cars and regular customers are served. The park or-ganises rally and motocross competitions on a regular basis for bothcloser and wider circle, from public sprints to Estonian Championshipcompetitions in rally and motocross. For 2010–2011, a new developmentproject with the general name “Youth Rally Park” is planned, which isgoing to turn LPR into a multifunctional care and motor sport centre •
Tourism Innovator 2010 nominees
Enterprise Line of business Established Sales 2009 Sales 2008 Käibe Kasum 2009 Kasum 2008 Kasumi Employees(kEEK) (kEEK) muutus (%) (kEEK) (kEEK) muutus (%)
MAARJA-MAGDALEENA GILD MTÜ applied artists’ association 2007 55 11 500 -7 0 -7,000 0
VIHULA MANOR HOSPITALITY OÜ providing accommodation and catering service 2008 6,331 2,690 235 -3,455 -1,618 214 26
PIKO HOBIKROSS OÜ operating sports facilities 2003 3,332 3,262 102 58 60 97 9
1 EUR = 15.6466 EEK; 1 EEK = 0.0639 EUR; based on 2009 data
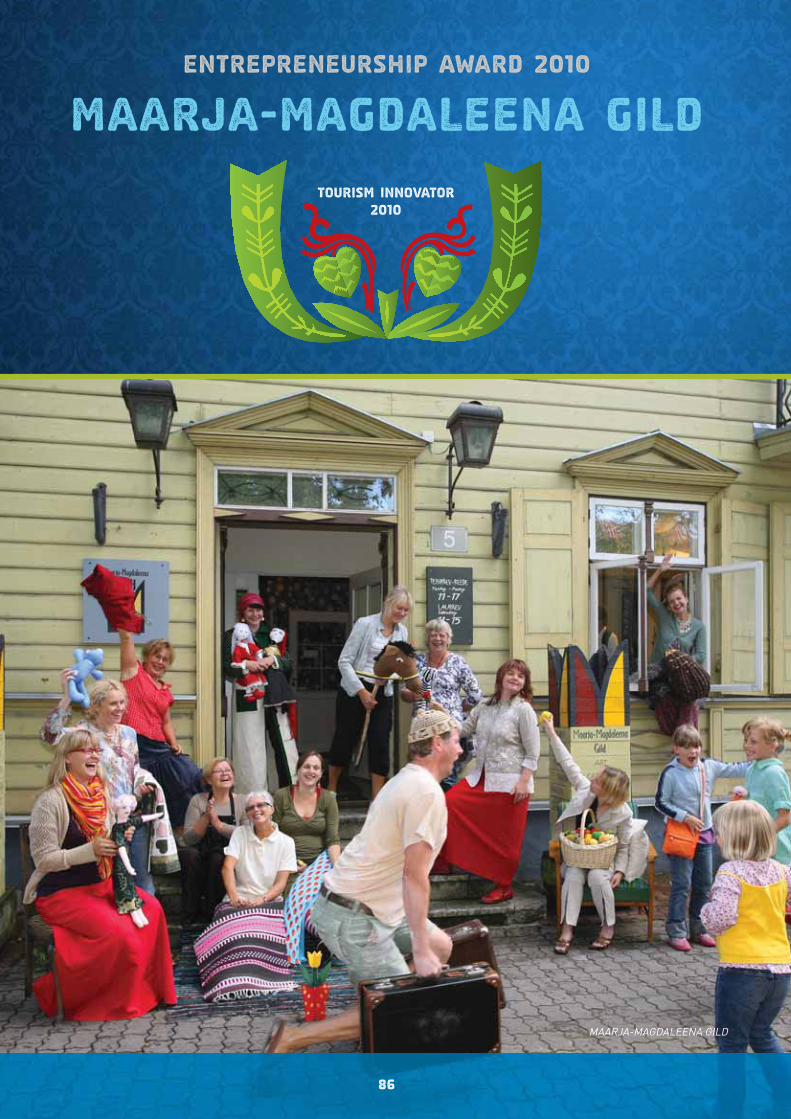
Entrepreneurship Award 2010
Tourism Innovator 2010
Maarja-Magdaleena Gild
86
MAARJA-MAGDALEENA GILD
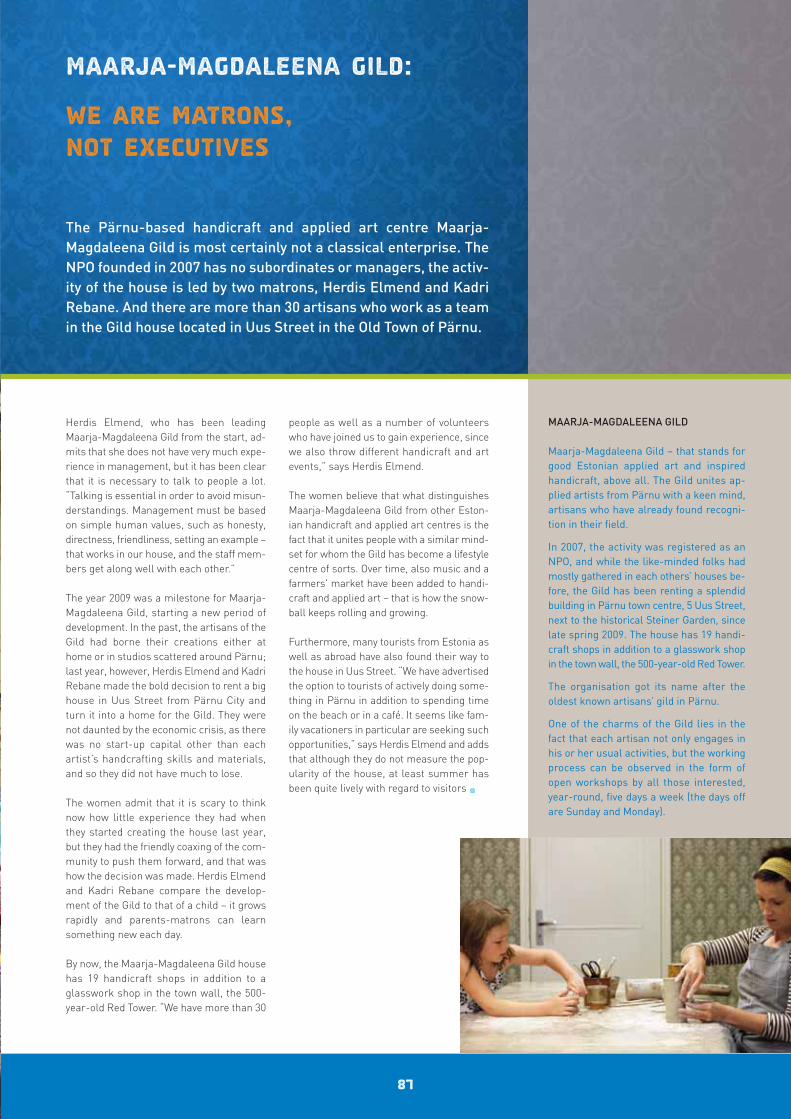
Herdis Elmend, who has been leadingMaarja-Magdaleena Gild from the start, ad-mits that she does not have very much expe-rience in management, but it has been clearthat it is necessary to talk to people a lot.“Talking is essential in order to avoid misun-derstandings. Management must be basedon simple human values, such as honesty,directness, friendliness, setting an example –that works in our house, and the staff mem-bers get along well with each other.”
The year 2009 was a milestone for Maarja-Magdaleena Gild, starting a new period ofdevelopment. In the past, the artisans of theGild had borne their creations either athome or in studios scattered around Pärnu;last year, however, Herdis Elmend and KadriRebane made the bold decision to rent a bighouse in Uus Street from Pärnu City andturn it into a home for the Gild. They werenot daunted by the economic crisis, as therewas no start-up capital other than eachartist’s handcrafting skills and materials,and so they did not have much to lose.
The women admit that it is scary to thinknow how little experience they had whenthey started creating the house last year,but they had the friendly coaxing of the com-munity to push them forward, and that washow the decision was made. Herdis Elmendand Kadri Rebane compare the develop-ment of the Gild to that of a child – it growsrapidly and parents-matrons can learnsomething new each day.
By now, the Maarja-Magdaleena Gild househas 19 handicraft shops in addition to aglasswork shop in the town wall, the 500-year-old Red Tower. “We have more than 30
people as well as a number of volunteerswho have joined us to gain experience, sincewe also throw different handicraft and artevents,” says Herdis Elmend.
The women believe that what distinguishesMaarja-Magdaleena Gild from other Eston-ian handicraft and applied art centres is thefact that it unites people with a similar mind-set for whom the Gild has become a lifestylecentre of sorts. Over time, also music and afarmers' market have been added to handi-craft and applied art – that is how the snow-ball keeps rolling and growing.
Furthermore, many tourists from Estonia aswell as abroad have also found their way tothe house in Uus Street. “We have advertisedthe option to tourists of actively doing some-thing in Pärnu in addition to spending timeon the beach or in a café. It seems like fam-ily vacationers in particular are seeking suchopportunities,” says Herdis Elmend and addsthat although they do not measure the pop-ularity of the house, at least summer hasbeen quite lively with regard to visitors •
87
Maarja-Magdaleena Gild:
We are matrons, not executives
MAARJA-MAGDALEENA GILD
Maarja-Magdaleena Gild – that stands forgood Estonian applied art and inspiredhandicraft, above all. The Gild unites ap-plied artists from Pärnu with a keen mind,artisans who have already found recogni-tion in their field.
In 2007, the activity was registered as anNPO, and while the like-minded folks hadmostly gathered in each others’ houses be-fore, the Gild has been renting a splendidbuilding in Pärnu town centre, 5 Uus Street,next to the historical Steiner Garden, sincelate spring 2009. The house has 19 handi-craft shops in addition to a glasswork shopin the town wall, the 500-year-old Red Tower.
The organisation got its name after theoldest known artisans’ gild in Pärnu.
One of the charms of the Gild lies in thefact that each artisan not only engages inhis or her usual activities, but the workingprocess can be observed in the form ofopen workshops by all those interested,year-round, five days a week (the days offare Sunday and Monday).
The Pärnu-based handicraft and applied art centre Maarja-Magdaleena Gild is most certainly not a classical enterprise. TheNPO founded in 2007 has no subordinates or managers, the activ-ity of the house is led by two matrons, Herdis Elmend and KadriRebane. And there are more than 30 artisans who work as a teamin the Gild house located in Uus Street in the Old Town of Pärnu.
Entrepreneurship Award 2010
Innovator 2010
Massi Miliano
88
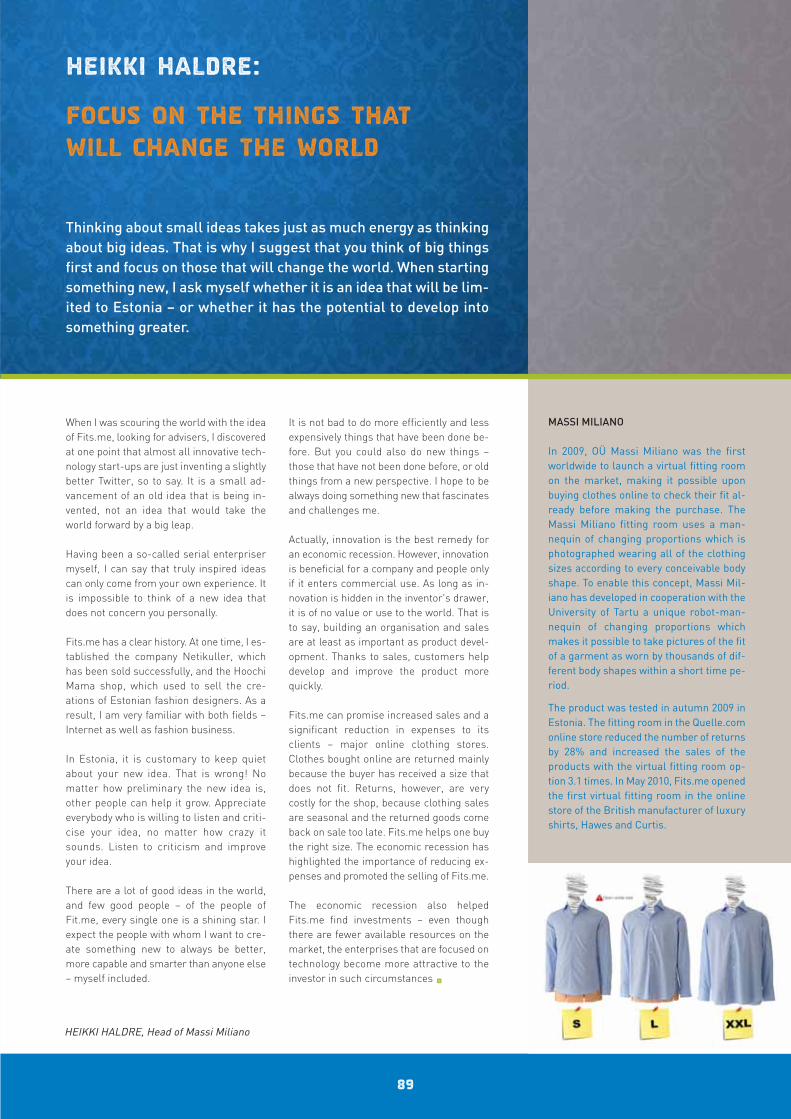
When I was scouring the world with the ideaof Fits.me, looking for advisers, I discoveredat one point that almost all innovative tech-nology start-ups are just inventing a slightlybetter Twitter, so to say. It is a small ad-vancement of an old idea that is being in-vented, not an idea that would take theworld forward by a big leap.
Having been a so-called serial enterprisermyself, I can say that truly inspired ideascan only come from your own experience. Itis impossible to think of a new idea thatdoes not concern you personally.
Fits.me has a clear history. At one time, I es-tablished the company Netikuller, whichhas been sold successfully, and the HoochiMama shop, which used to sell the cre-ations of Estonian fashion designers. As aresult, I am very familiar with both fields –Internet as well as fashion business.
In Estonia, it is customary to keep quietabout your new idea. That is wrong! Nomatter how preliminary the new idea is,other people can help it grow. Appreciateeverybody who is willing to listen and criti-cise your idea, no matter how crazy itsounds. Listen to criticism and improveyour idea.
There are a lot of good ideas in the world,and few good people – of the people ofFit.me, every single one is a shining star. Iexpect the people with whom I want to cre-ate something new to always be better,more capable and smarter than anyone else– myself included.
It is not bad to do more efficiently and lessexpensively things that have been done be-fore. But you could also do new things –those that have not been done before, or oldthings from a new perspective. I hope to bealways doing something new that fascinatesand challenges me.
Actually, innovation is the best remedy foran economic recession. However, innovationis beneficial for a company and people onlyif it enters commercial use. As long as in-novation is hidden in the inventor's drawer,it is of no value or use to the world. That isto say, building an organisation and salesare at least as important as product devel-opment. Thanks to sales, customers helpdevelop and improve the product morequickly.
Fits.me can promise increased sales and asignificant reduction in expenses to itsclients – major online clothing stores.Clothes bought online are returned mainlybecause the buyer has received a size thatdoes not fit. Returns, however, are verycostly for the shop, because clothing salesare seasonal and the returned goods comeback on sale too late. Fits.me helps one buythe right size. The economic recession hashighlighted the importance of reducing ex-penses and promoted the selling of Fits.me.
The economic recession also helpedFits.me find investments – even thoughthere are fewer available resources on themarket, the enterprises that are focused ontechnology become more attractive to theinvestor in such circumstances •
89
Heikki Haldre:
Focus on the things that will change the world
MASSI MILIANO
In 2009, OÜ Massi Miliano was the firstworldwide to launch a virtual fitting roomon the market, making it possible uponbuying clothes online to check their fit al-ready before making the purchase. TheMassi Miliano fitting room uses a man-nequin of changing proportions which isphotographed wearing all of the clothingsizes according to every conceivable bodyshape. To enable this concept, Massi Mil-iano has developed in cooperation with theUniversity of Tartu a unique robot-man-nequin of changing proportions whichmakes it possible to take pictures of the fitof a garment as worn by thousands of dif-ferent body shapes within a short time pe-riod.
The product was tested in autumn 2009 inEstonia. The fitting room in the Quelle.comonline store reduced the number of returnsby 28% and increased the sales of theproducts with the virtual fitting room op-tion 3.1 times. In May 2010, Fits.me openedthe first virtual fitting room in the onlinestore of the British manufacturer of luxuryshirts, Hawes and Curtis.
Thinking about small ideas takes just as much energy as thinkingabout big ideas. That is why I suggest that you think of big thingsfirst and focus on those that will change the world. When startingsomething new, I ask myself whether it is an idea that will be lim-ited to Estonia – or whether it has the potential to develop intosomething greater.
HEIKKI HALDRE, Head of Massi Miliano

90
Visitret Displays OÜ
Visitret Displays was established in 2007 on the initiative of Jüri Liiv, thecreator of the technology being developed, and the investment companyHoney Investments, based on British capital. By today, the company hasbuilt a strong portfolio of intellectual property by virtue of its develop-ment activities. Visitret has set out to create full colour reflective dis-plays and colour changing surface coatings with an exceptionally highquality and low sales prices that would enable to introduce new con-cepts for products with displays.
As the developer of the future-oriented e-paper technology, Visitret isworking at a cutting-edge technology for producing active material (e-paper) for flat displays with an extremely low power consumption thatenables to show video images and is flexible, durable and low-priced.The technology being developed is also very environmentally friendlysince the power consumption of various display devices has been cutdown considerably.
The work of the development team that involves international top re-searchers of physics, chemistry and material sciences is coordinated inTartu, Estonia. In 2009, the development team grew by several highly ac-claimed display marketing and technology experts, including NicholasSheridan, father of the so-called e-paper.
In 2007, Visitret Displays teamed up with the Institute of Chemistry, TartuUniversity, and the company collaborates with several foreign partners.In 2009, a consortium with 9 entrepreneurship partners from Europeand other countries was formed to develop colour displays.
www.visitret.com •
Quattromed HTI Laborid OÜ
Quattromed HTI Laborid is the largest medical laboratory based on pri-vate capital in Estonia. Its main activities consist in performing labora-tory analyses for health care institutions, private clinics and familydoctors. The company has a 10-plus year experience in providing labo-ratory services that makes it possible for all medical institutions, doctorsas well as private persons to commission most of the tests, performedat medical institutions, from Quattromed HTI Laborid.
The option of anonymous testing offered by the company enables to ap-proach the most sizable target group affected by venereal diseases -young people, especially men who are afraid of consulting doctors. Theonline testing service (www.testikodus.ee) is expected to lessen theprevalence of infections and the frequency of non-detected and, hence,non-treated infections.
Quattromed HTI Laborid has laboratories in Tallinn, Tartu as well asJõhvi, and it collaborates, among others, with the Andrology Clinic ofTartu University.
www.laborid.ee •
Innovator 2010 nominees
Enterprise Line of business Established Sales 2009 Sales 2008 Käibe muutus Kasum 2009 Kasum 2008 Kasumi Employees(kEEK) (kEEK) (%) (kEEK) (kEEK) muutus (%)
MASSI MILIANO OÜ research and development in the field of other natural and technical sciences 2006 116 339 34 -3 067 -88 3 485 9
VISITRET DISPLAYS OÜ research and development in the field of display technologies 2007 0 0 0 -2 218 -201 1 103 7
QUATTROMED HTI LABORID OÜ performing laboratory analyses for health care institutions 2005 60 046 60 624 99 11 429 1101 1 038 56
1 EUR = 15.6466 EEK; 1 EEK = 0.0639 EUR; based on 2009 data

91
Vene Posti Operaator AS / hotell Telegraaf
Hotel Telegraaf is a unique five-star hotel in the centre of Tallinn whichis part of the world’s leading luxury hotel chain Small Luxury Hotels.
The hotel is located in an elegant building, constructed in 1878, that usedto house the exchange of the Estonian Telegraph. On the one hand, thishas set limits to the hotel’s design, but on the other hand, it has createdmany exciting design solutions as well, thanks to which the hotel hasalso been awarded several international prizes.
In all of the hotel’s rooms, modern times are combined with a historicalstyle. Design has been applied systematically and perfectly ever sincethe establishment of the enterprise on all levels – company culture, en-vironment (interior and exterior architecture), communication and mar-keting (website, publications, etc.). The result makes it possible toprovide a top-quality service that is clearly distinguishable in the market.All design solutions form a clear and attractive whole that holds it ownin an international comparison •
Tiptiptap OÜ
Tiptiptap is a family business established in 2004 that manufactures play,sports and leisure grounds for both children and adults.
The company has relied on well-considered design solutions with com-plex finishing ever since its establishment. Tiptiptap sells its products inEstonia and also successfully exports them to the other Baltic States,Scandinavian countries and elsewhere; the company's range of prod-ucts is constantly broadened as well: play towns with thematic play cor-ners, climbing grounds, sliding tracks, swings, spring swings, playhouses, beams, sandboxes, etc.
Each year, Tiptiptap designs more than 30 new products that arechecked and tested by independent experts and assigned a TÜV certifi-cate which gives a quality, safety and child-friendliness guarantee to thecustomer. In product design, the company also takes eco-friendlinessinto consideration, by using wood and water-based finishes.
In 2008, TipTipTap was awarded the title of the Developer of the Year inthe Entrepreneurship Award competition.
www.tiptiptap.ee •
Design Applier 2010 nominees
Enterprise Line of business Established Sales 2009 Sales 2008 Käibe Kasum 2009 Kasum 2008 Kasumi Employees(kEEK) (kEEK) muutus (%) (kEEK) (kEEK) muutus (%)
BALTECO AS manufacturing sanitary ware 1990 68,966 123,581 56 -9,019 -2,416 373 75
VENE POSTI OPERAATOR AS operating a hotel and a restaurant; providing spa service 2004 41,001 48,201 85 -4,697 -7,804 60 83
TIPTIPTAP OÜ the production and sale of playgrounds 2004 16,978 24,275 70 2,921 1,069 273 17
1 EUR = 15.6466 EEK; 1 EEK = 0.0639 EUR; based on 2009 data
Entrepreneurship Award 2010
Design Applier2010
Balteco
92
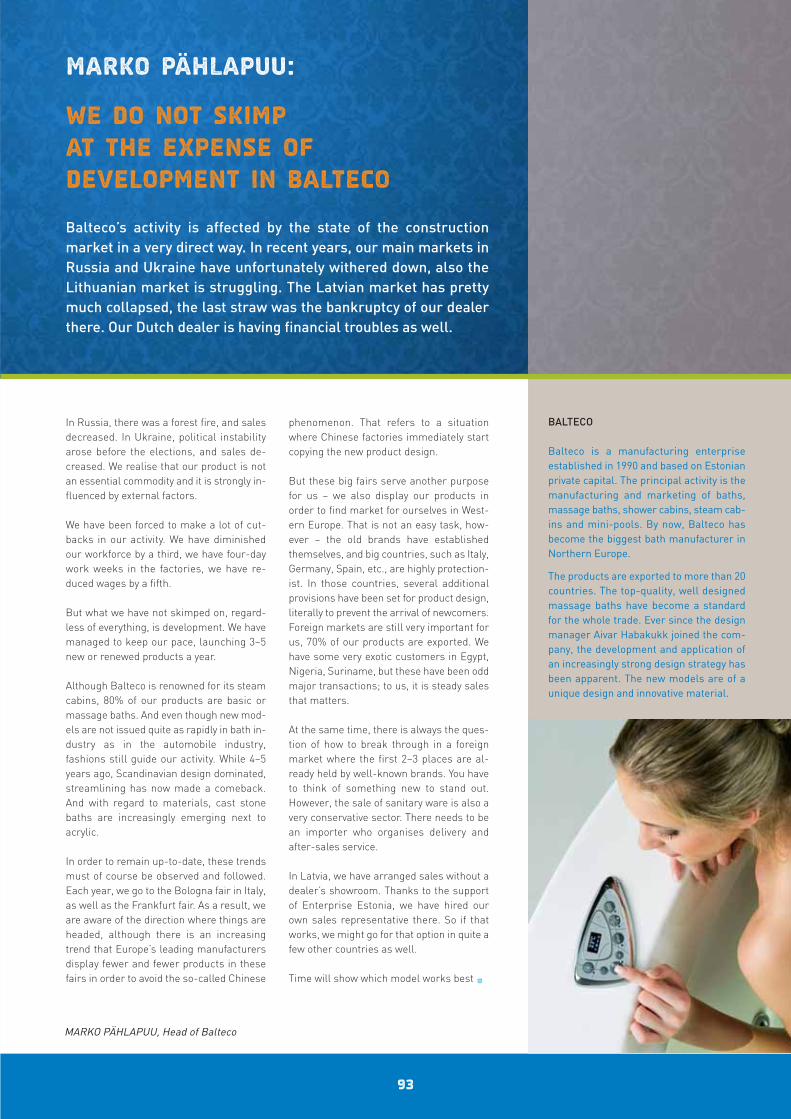
In Russia, there was a forest fire, and salesdecreased. In Ukraine, political instabilityarose before the elections, and sales de-creased. We realise that our product is notan essential commodity and it is strongly in-fluenced by external factors.
We have been forced to make a lot of cut-backs in our activity. We have diminishedour workforce by a third, we have four-daywork weeks in the factories, we have re-duced wages by a fifth.
But what we have not skimped on, regard-less of everything, is development. We havemanaged to keep our pace, launching 3–5new or renewed products a year.
Although Balteco is renowned for its steamcabins, 80% of our products are basic ormassage baths. And even though new mod-els are not issued quite as rapidly in bath in-dustry as in the automobile industry,fashions still guide our activity. While 4–5years ago, Scandinavian design dominated,streamlining has now made a comeback.And with regard to materials, cast stonebaths are increasingly emerging next toacrylic.
In order to remain up-to-date, these trendsmust of course be observed and followed.Each year, we go to the Bologna fair in Italy,as well as the Frankfurt fair. As a result, weare aware of the direction where things areheaded, although there is an increasingtrend that Europe’s leading manufacturersdisplay fewer and fewer products in thesefairs in order to avoid the so-called Chinese
phenomenon. That refers to a situationwhere Chinese factories immediately startcopying the new product design.
But these big fairs serve another purposefor us – we also display our products inorder to find market for ourselves in West-ern Europe. That is not an easy task, how-ever – the old brands have establishedthemselves, and big countries, such as Italy,Germany, Spain, etc., are highly protection-ist. In those countries, several additionalprovisions have been set for product design,literally to prevent the arrival of newcomers.Foreign markets are still very important forus, 70% of our products are exported. Wehave some very exotic customers in Egypt,Nigeria, Suriname, but these have been oddmajor transactions; to us, it is steady salesthat matters.
At the same time, there is always the ques-tion of how to break through in a foreignmarket where the first 2–3 places are al-ready held by well-known brands. You haveto think of something new to stand out.However, the sale of sanitary ware is also avery conservative sector. There needs to bean importer who organises delivery andafter-sales service.
In Latvia, we have arranged sales without adealer’s showroom. Thanks to the supportof Enterprise Estonia, we have hired ourown sales representative there. So if thatworks, we might go for that option in quite afew other countries as well.
Time will show which model works best •
93
Marko Pählapuu:
We do not skimp at the expense of development in Balteco
BALTECO
Balteco is a manufacturing enterprise established in 1990 and based on Estonianprivate capital. The principal activity is themanufacturing and marketing of baths,massage baths, shower cabins, steam cab-ins and mini-pools. By now, Balteco hasbecome the biggest bath manufacturer inNorthern Europe.
The products are exported to more than 20countries. The top-quality, well designedmassage baths have become a standardfor the whole trade. Ever since the designmanager Aivar Habakukk joined the com-pany, the development and application ofan increasingly strong design strategy hasbeen apparent. The new models are of aunique design and innovative material.
Balteco’s activity is affected by the state of the construction market in a very direct way. In recent years, our main markets inRussia and Ukraine have unfortunately withered down, also theLithuanian market is struggling. The Latvian market has prettymuch collapsed, the last straw was the bankruptcy of our dealerthere. Our Dutch dealer is having financial troubles as well.
MARKO PÄHLAPUU, Head of Balteco
95
The Best Estonian Enterprises
SPECIAL AWARDS
The Best Estonian Enterprises
2010
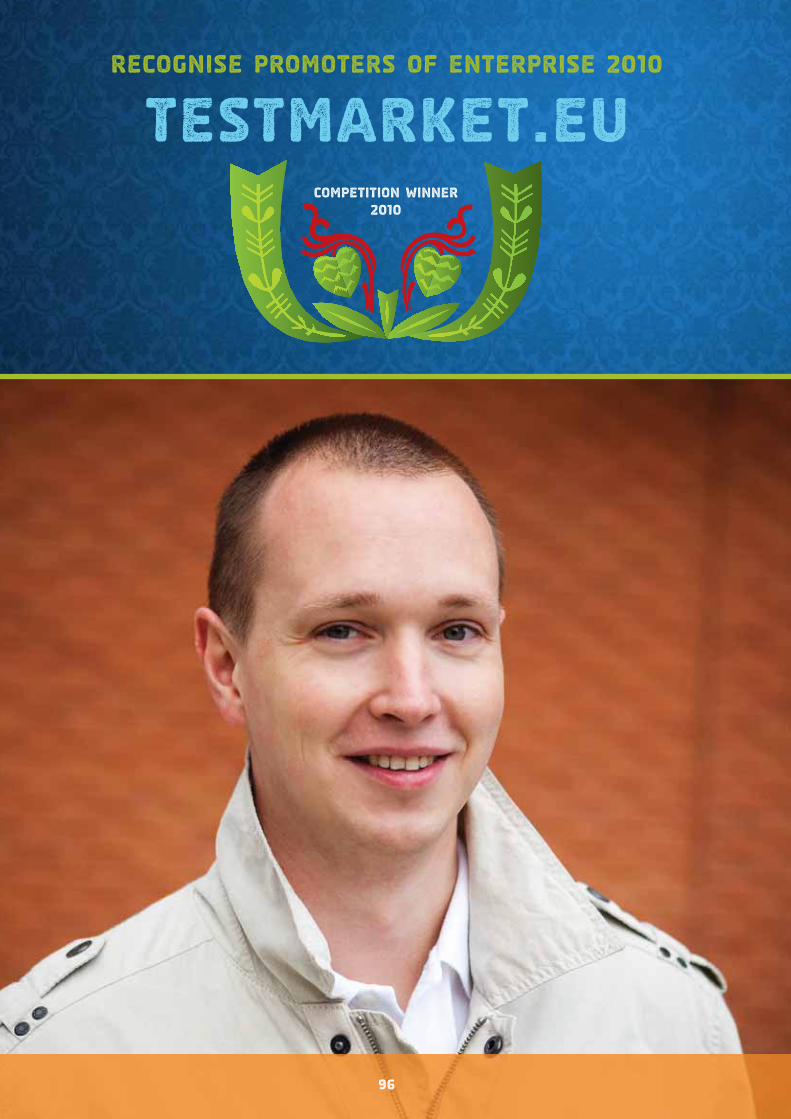
Recognise Promoters of Enterprise 2010
Competition winner 2010
TestMarket.eu
96
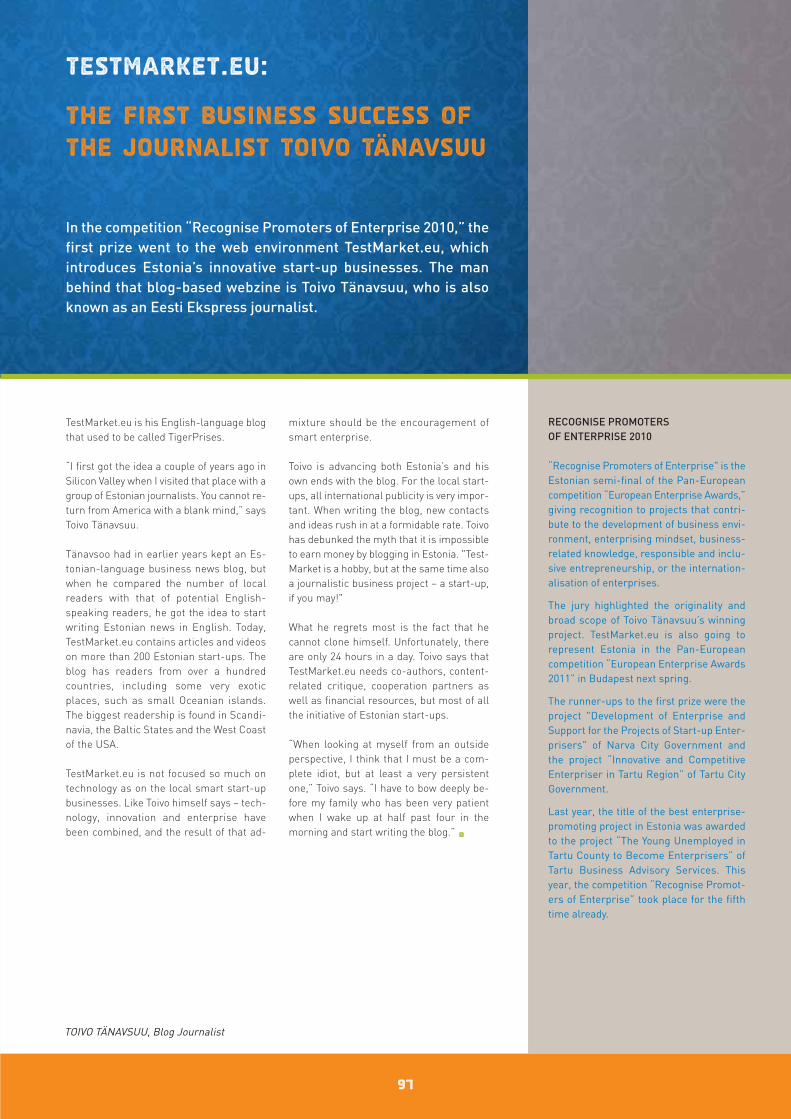
TestMarket.eu is his English-language blogthat used to be called TigerPrises.
“I first got the idea a couple of years ago inSilicon Valley when I visited that place with agroup of Estonian journalists. You cannot re-turn from America with a blank mind,” saysToivo Tänavsuu.
Tänavsoo had in earlier years kept an Es-tonian-language business news blog, butwhen he compared the number of localreaders with that of potential English-speaking readers, he got the idea to startwriting Estonian news in English. Today,TestMarket.eu contains articles and videoson more than 200 Estonian start-ups. Theblog has readers from over a hundredcountries, including some very exoticplaces, such as small Oceanian islands.The biggest readership is found in Scandi-navia, the Baltic States and the West Coastof the USA.
TestMarket.eu is not focused so much ontechnology as on the local smart start-upbusinesses. Like Toivo himself says – tech-nology, innovation and enterprise havebeen combined, and the result of that ad-
mixture should be the encouragement ofsmart enterprise.
Toivo is advancing both Estonia’s and hisown ends with the blog. For the local start-ups, all international publicity is very impor -tant. When writing the blog, new contactsand ideas rush in at a formidable rate. Toivohas debunked the myth that it is impossibleto earn money by blogging in Estonia. "Test-Market is a hobby, but at the same time alsoa journalistic business project – a start-up,if you may!"
What he regrets most is the fact that hecannot clone himself. Unfortunately, thereare only 24 hours in a day. Toivo says thatTestMarket.eu needs co-authors, content-related critique, cooperation partners aswell as financial resources, but most of allthe initiative of Estonian start-ups.
“When looking at myself from an outsideperspective, I think that I must be a com-plete idiot, but at least a very persistentone,” Toivo says. “I have to bow deeply be-fore my family who has been very patientwhen I wake up at half past four in themorning and start writing the blog.” •
97
TestMarket.eu:
The first business success ofthe journalist Toivo Tänavsuu
RECOGNISE PROMOTERS OF ENTERPRISE 2010
“Recognise Promoters of Enterprise" is theEstonian semi-final of the Pan-Europeancompetition “European Enterprise Awards,”giving recognition to projects that contri -bute to the development of business envi-ronment, enterprising mindset, business-related knowledge, responsible and inclu-sive entrepreneurship, or the internation-alisation of enterprises.
The jury highlighted the originality andbroad scope of Toivo Tänavsuu’s winningproject. TestMarket.eu is also going to represent Estonia in the Pan-Europeancompetition “European Enterprise Awards2011” in Budapest next spring.
The runner-ups to the first prize were theproject "Development of Enterprise andSupport for the Projects of Start-up Enter-prisers" of Narva City Government and the project “Innovative and Competitive Enterpriser in Tartu Region” of Tartu City Government.
Last year, the title of the best enterprise-promoting project in Estonia was awardedto the project “The Young Unemployed inTartu County to Become Enterprisers” ofTartu Business Advisory Services. Thisyear, the competition “Recognise Promot-ers of Enterprise” took place for the fifthtime already.
In the competition “Recognise Promoters of Enterprise 2010,” thefirst prize went to the web environment TestMarket.eu, which introduces Estonia’s innovative start-up businesses. The man behind that blog-based webzine is Toivo Tänavsuu, who is alsoknown as an Eesti Ekspress journalist.
TOIVO TÄNAVSUU, Blog Journalist
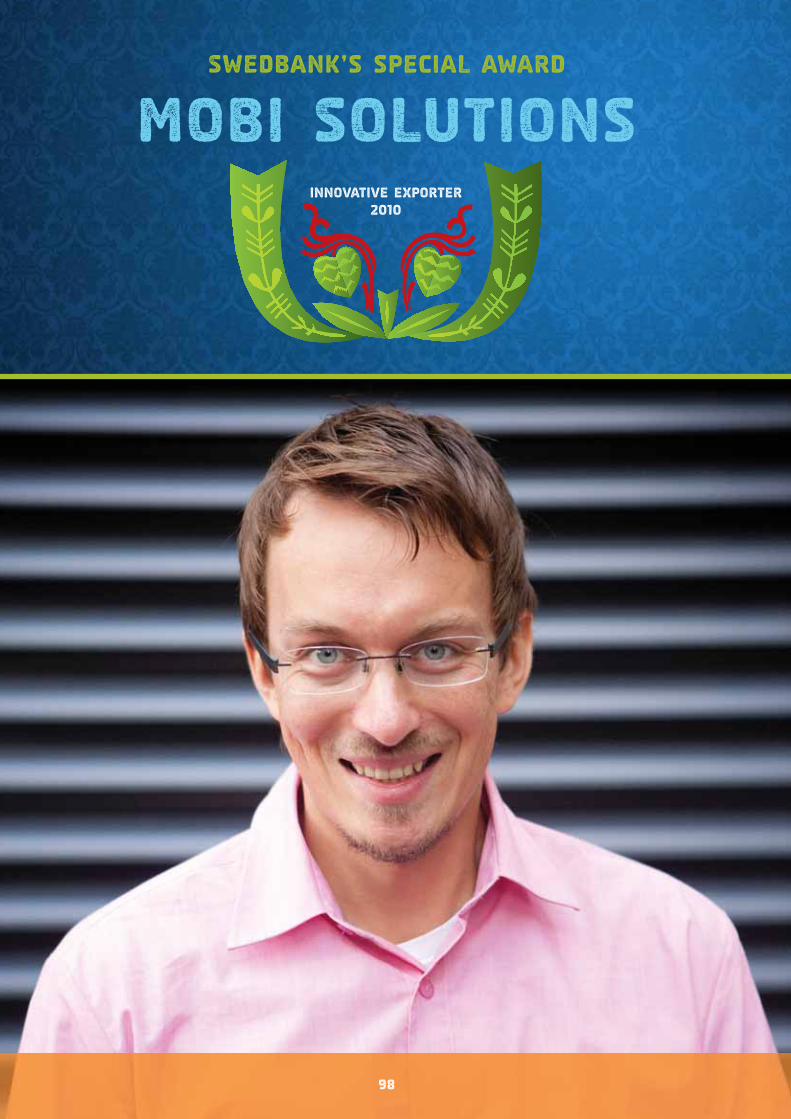
Swedbank’s special award
innovative exporter 2010
Mobi Solutions
98
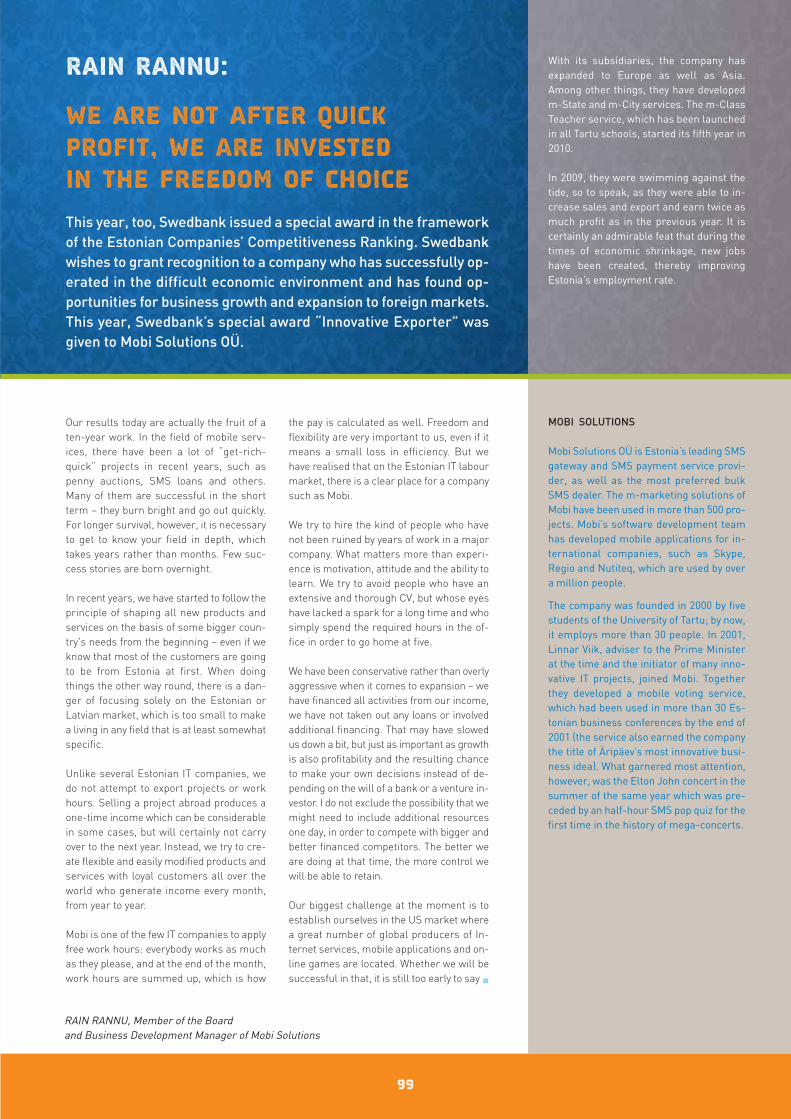
Our results today are actually the fruit of aten-year work. In the field of mobile serv-ices, there have been a lot of “get-rich-quick” projects in recent years, such aspenny auctions, SMS loans and others.Many of them are successful in the shortterm – they burn bright and go out quickly.For longer survival, however, it is necessaryto get to know your field in depth, whichtakes years rather than months. Few suc-cess stories are born overnight.
In recent years, we have started to follow theprinciple of shaping all new products andservices on the basis of some bigger coun-try's needs from the beginning – even if weknow that most of the customers are goingto be from Estonia at first. When doingthings the other way round, there is a dan-ger of focusing solely on the Estonian orLatvian market, which is too small to makea living in any field that is at least somewhatspecific.
Unlike several Estonian IT companies, wedo not attempt to export projects or workhours. Selling a project abroad produces aone-time income which can be considerablein some cases, but will certainly not carryover to the next year. Instead, we try to cre-ate flexible and easily modified products andservices with loyal customers all over theworld who generate income every month,from year to year.
Mobi is one of the few IT companies to applyfree work hours: everybody works as muchas they please, and at the end of the month,work hours are summed up, which is how
the pay is calculated as well. Freedom andflexibility are very important to us, even if itmeans a small loss in efficiency. But wehave realised that on the Estonian IT labourmarket, there is a clear place for a companysuch as Mobi.
We try to hire the kind of people who havenot been ruined by years of work in a majorcompany. What matters more than experi-ence is motivation, attitude and the ability tolearn. We try to avoid people who have anextensive and thorough CV, but whose eyeshave lacked a spark for a long time and whosimply spend the required hours in the of-fice in order to go home at five.
We have been conservative rather than overlyaggressive when it comes to expansion – wehave financed all activities from our income,we have not taken out any loans or involvedadditional financing. That may have slowedus down a bit, but just as important as growthis also profitability and the resulting chanceto make your own decisions instead of de-pending on the will of a bank or a venture in-vestor. I do not exclude the possibility that wemight need to include additional resourcesone day, in order to compete with bigger andbetter financed competitors. The better weare doing at that time, the more control wewill be able to retain.
Our biggest challenge at the moment is toestablish ourselves in the US market wherea great number of global producers of In-ternet services, mobile applications and on-line games are located. Whether we will besuccessful in that, it is still too early to say •
99
Rain Rannu:
We are not after quickprofit, we are invested in the freedom of choice
MOBI SOLUTIONS
Mobi Solutions OÜ is Estonia’s leading SMSgateway and SMS payment service provi -der, as well as the most preferred bulkSMS dealer. The m-marketing solutions ofMobi have been used in more than 500 pro -jects. Mobi’s software development teamhas developed mobile applications for in-ternational companies, such as Skype,Regio and Nutiteq, which are used by overa million people.
The company was founded in 2000 by fivestudents of the University of Tartu; by now,it employs more than 30 people. In 2001,Linnar Viik, adviser to the Prime Ministerat the time and the initiator of many inno-vative IT projects, joined Mobi. Togetherthey developed a mobile voting service,which had been used in more than 30 Es-tonian business conferences by the end of2001 (the service also earned the companythe title of Äripäev’s most innovative busi-ness idea). What garnered most attention,however, was the Elton John concert in thesummer of the same year which was pre-ceded by an half-hour SMS pop quiz for thefirst time in the history of mega-concerts.
With its subsidiaries, the company has expanded to Europe as well as Asia.Among other things, they have developedm-State and m-City services. The m-ClassTeacher service, which has been launchedin all Tartu schools, started its fifth year in2010.
In 2009, they were swimming against thetide, so to speak, as they were able to in-crease sales and export and earn twice asmuch profit as in the previous year. It iscertainly an admirable feat that during thetimes of economic shrinkage, new jobshave been created, thereby improving Estonia’s employment rate.
This year, too, Swedbank issued a special award in the frameworkof the Estonian Companies’ Competitiveness Ranking. Swedbankwishes to grant recognition to a company who has successfully op-erated in the difficult economic environment and has found op-portunities for business growth and expansion to foreign markets.This year, Swedbank’s special award “Innovative Exporter” wasgiven to Mobi Solutions OÜ.
RAIN RANNU, Member of the Board and Business Development Manager of Mobi Solutions
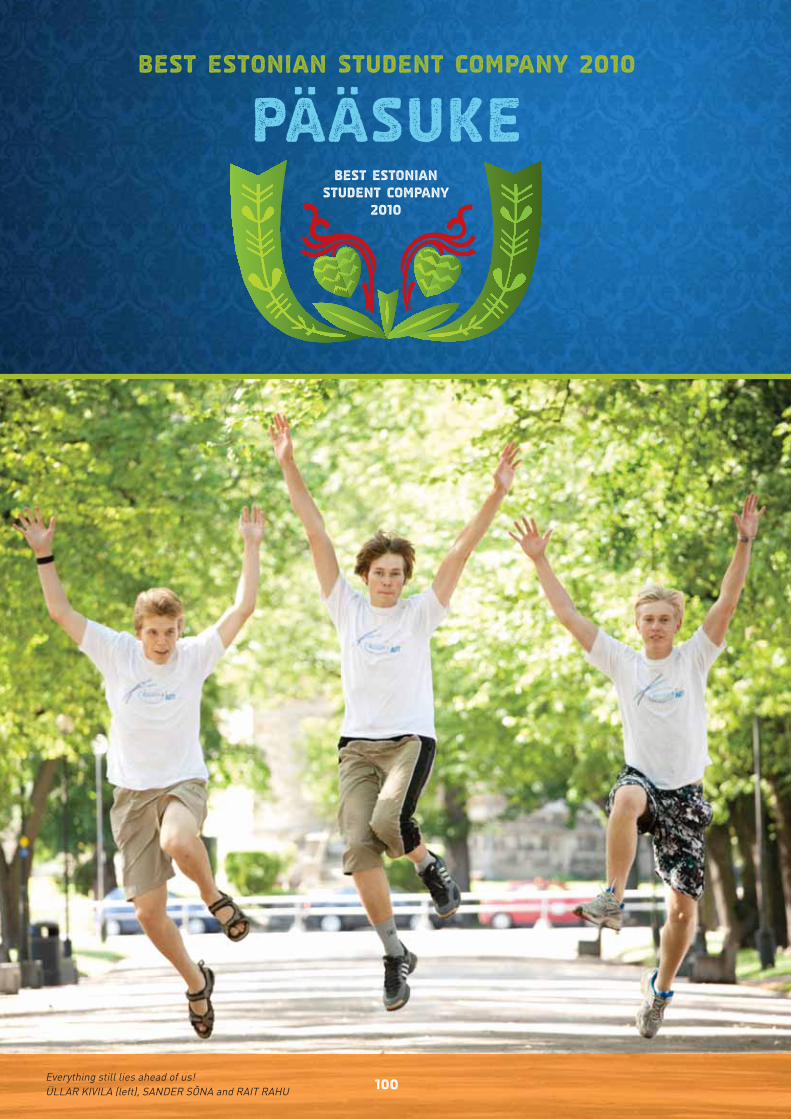
Best Estonian Student Company 2010
Best Estonian Student Company
2010
Pääsuke
100Everything still lies ahead of us! ÜLLAR KIVILA (left), SANDER SÕNA and RAIT RAHU
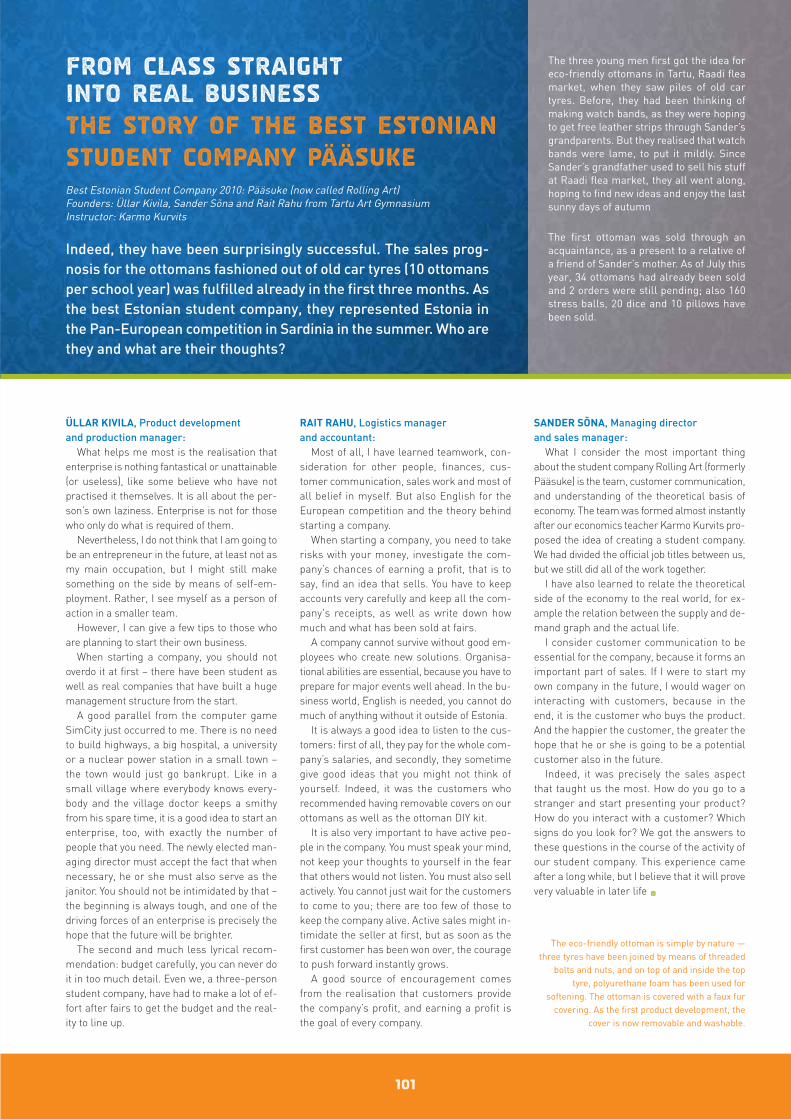
ÜLLAR KIVILA, Product development and production manager:
What helps me most is the realisation thatenterprise is nothing fantastical or unattainable(or useless), like some believe who have notpractised it themselves. It is all about the per-son’s own laziness. Enterprise is not for thosewho only do what is required of them.
Nevertheless, I do not think that I am going tobe an entrepreneur in the future, at least not asmy main occupation, but I might still makesomething on the side by means of self-em-ployment. Rather, I see myself as a person ofaction in a smaller team.
However, I can give a few tips to those whoare planning to start their own business.
When starting a company, you should notoverdo it at first – there have been student aswell as real companies that have built a hugemanagement structure from the start.
A good parallel from the computer gameSimCity just occurred to me. There is no needto build highways, a big hospital, a universityor a nuclear power station in a small town –the town would just go bankrupt. Like in asmall village where everybody knows every-body and the village doctor keeps a smithyfrom his spare time, it is a good idea to start anenterprise, too, with exactly the number ofpeople that you need. The newly elected man-aging director must accept the fact that whennecessary, he or she must also serve as thejanitor. You should not be intimidated by that –the beginning is always tough, and one of thedriving forces of an enterprise is precisely thehope that the future will be brighter.
The second and much less lyrical recom-mendation: budget carefully, you can never doit in too much detail. Even we, a three-personstudent company, have had to make a lot of ef-fort after fairs to get the budget and the real-ity to line up.
RAIT RAHU, Logistics manager and accountant:
Most of all, I have learned teamwork, con-sideration for other people, finances, cus-tomer communication, sales work and most ofall belief in myself. But also English for the European competition and the theory behindstarting a company.
When starting a company, you need to takerisks with your money, investigate the com-pany’s chances of earning a profit, that is tosay, find an idea that sells. You have to keepaccounts very carefully and keep all the com-pany's receipts, as well as write down howmuch and what has been sold at fairs.
A company cannot survive without good em-ployees who create new solutions. Organisa-tional abilities are essential, because you have toprepare for major events well ahead. In the bu -si ness world, English is needed, you cannot domuch of anything without it outside of Estonia.
It is always a good idea to listen to the cus-tomers: first of all, they pay for the whole com-pany’s salaries, and secondly, they sometimegive good ideas that you might not think ofyourself. Indeed, it was the customers whorecommended having removable covers on ourottomans as well as the ottoman DIY kit.
It is also very important to have active peo-ple in the company. You must speak your mind,not keep your thoughts to yourself in the fearthat others would not listen. You must also sellactively. You cannot just wait for the customersto come to you; there are too few of those tokeep the company alive. Active sales might in-timidate the seller at first, but as soon as thefirst customer has been won over, the courageto push forward instantly grows.
A good source of encouragement comesfrom the realisation that customers providethe company’s profit, and earning a profit isthe goal of every company.
SANDER SÕNA, Managing director and sales manager:
What I consider the most important thingabout the student company Rolling Art (formerlyPääsuke) is the team, customer communication,and understanding of the theoretical basis ofeconomy. The team was formed almost instantlyafter our economics teacher Karmo Kurvits pro-posed the idea of creating a student company.We had divided the official job titles between us,but we still did all of the work together.
I have also learned to relate the theoreticalside of the economy to the real world, for ex-ample the relation between the supply and de-mand graph and the actual life.
I consider customer communication to beessential for the company, because it forms animportant part of sales. If I were to start myown company in the future, I would wager oninteracting with customers, because in theend, it is the customer who buys the product.And the happier the customer, the greater thehope that he or she is going to be a potentialcustomer also in the future.
Indeed, it was precisely the sales aspectthat taught us the most. How do you go to astranger and start presenting your product?How do you interact with a customer? Whichsigns do you look for? We got the answers tothese questions in the course of the activity ofour student company. This experience cameafter a long while, but I believe that it will provevery valuable in later life •
The eco-friendly ottoman is simple by nature —three tyres have been joined by means of threaded
bolts and nuts, and on top of and inside the toptyre, polyurethane foam has been used for
softening. The ottoman is covered with a faux furcovering. As the first product development, the
cover is now removable and washable.
101
From class straight into real businessThe story of the best Estonianstudent company Pääsuke
The three young men first got the idea foreco-friendly ottomans in Tartu, Raadi fleamarket, when they saw piles of old cartyres. Before, they had been thinking ofmaking watch bands, as they were hopingto get free leather strips through Sander’sgrandparents. But they realised that watchbands were lame, to put it mildly. SinceSander’s grandfather used to sell his stuffat Raadi flea market, they all went along,hoping to find new ideas and enjoy the lastsunny days of autumn
The first ottoman was sold through an acquaintance, as a present to a relative ofa friend of Sander’s mother. As of July thisyear, 34 ottomans had already been soldand 2 orders were still pending; also 160stress balls, 20 dice and 10 pillows havebeen sold.
Indeed, they have been surprisingly successful. The sales prog-nosis for the ottomans fashioned out of old car tyres (10 ottomansper school year) was fulfilled already in the first three months. Asthe best Estonian student company, they represented Estonia inthe Pan-European competition in Sardinia in the summer. Who arethey and what are their thoughts?
Best Estonian Student Company 2010: Pääsuke (now called Rolling Art)Founders: Üllar Kivila, Sander Sõna and Rait Rahu from Tartu Art GymnasiumInstructor: Karmo Kurvits
The Best Estonian Enterprises
OVERVIEWS
The Best Estonian Enterprises
2010
103
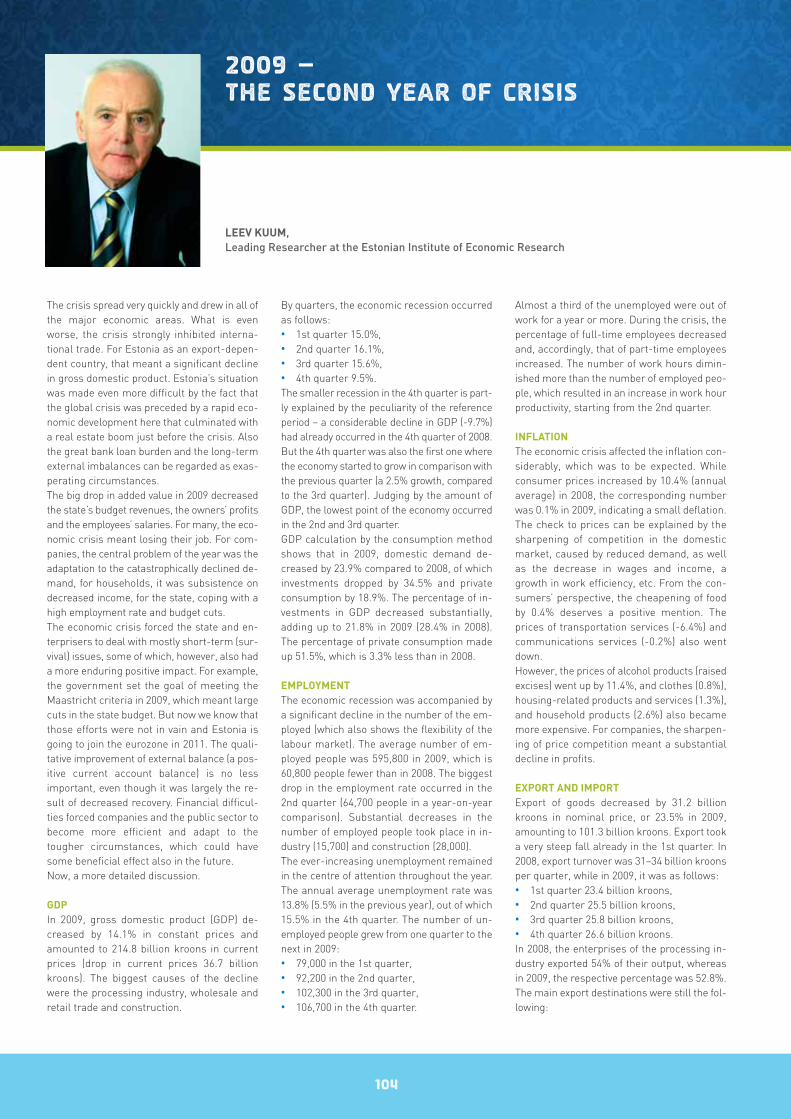
The crisis spread very quickly and drew in all ofthe major economic areas. What is evenworse, the crisis strongly inhibited interna-tional trade. For Estonia as an export-depen-dent country, that meant a significant declinein gross domestic product. Estonia’s situationwas made even more difficult by the fact thatthe global crisis was preceded by a rapid eco-nomic development here that culminated witha real estate boom just before the crisis. Alsothe great bank loan burden and the long-termexternal imbalances can be regarded as exas-perating circumstances.The big drop in added value in 2009 decreasedthe state’s budget revenues, the owners’ profitsand the employees’ salaries. For many, the eco-nomic crisis meant losing their job. For com-panies, the central problem of the year was theadaptation to the catastrophically declined de-mand, for households, it was subsistence ondecreased income, for the state, coping with ahigh employment rate and budget cuts.The economic crisis forced the state and en-terprisers to deal with mostly short-term (sur-vival) issues, some of which, however, also hada more enduring positive impact. For example,the government set the goal of meeting theMaastricht criteria in 2009, which meant largecuts in the state budget. But now we know thatthose efforts were not in vain and Estonia isgoing to join the eurozone in 2011. The quali-tative improvement of external balance (a pos-itive current account balance) is no lessimportant, even though it was largely the re-sult of decreased recovery. Financial difficul-ties forced companies and the public sector tobecome more efficient and adapt to thetougher circumstances, which could havesome beneficial effect also in the future.Now, a more detailed discussion.
GDPIn 2009, gross domestic product (GDP) de-creased by 14.1% in constant prices andamounted to 214.8 billion kroons in currentprices (drop in current prices 36.7 billionkroons). The biggest causes of the declinewere the processing industry, wholesale andretail trade and construction.
By quarters, the economic recession occurredas follows: • 1st quarter 15.0%, • 2nd quarter 16.1%, • 3rd quarter 15.6%, • 4th quarter 9.5%. The smaller recession in the 4th quarter is part-ly explained by the peculiarity of the referenceperiod – a considerable decline in GDP (-9.7%)had already occurred in the 4th quarter of 2008.But the 4th quarter was also the first one wherethe economy started to grow in comparison withthe previous quarter (a 2.5% growth, comparedto the 3rd quarter). Judging by the amount ofGDP, the lowest point of the economy occurredin the 2nd and 3rd quarter.GDP calculation by the consumption methodshows that in 2009, domestic demand de-creased by 23.9% compared to 2008, of whichinvestments dropped by 34.5% and privateconsumption by 18.9%. The percentage of in-vestments in GDP decreased substantially,adding up to 21.8% in 2009 (28.4% in 2008).The percentage of private consumption madeup 51.5%, which is 3.3% less than in 2008.
EMPLOYMENTThe economic recession was accompanied bya significant decline in the number of the em-ployed (which also shows the flexibility of thelabour market). The average number of em-ployed people was 595,800 in 2009, which is60,800 people fewer than in 2008. The biggestdrop in the employment rate occurred in the2nd quarter (64,700 people in a year-on-yearcomparison). Substantial decreases in thenumber of employed people took place in in-dustry (15,700) and construction (28,000).The ever-increasing unemployment remainedin the centre of attention throughout the year.The annual average unemployment rate was13.8% (5.5% in the previous year), out of which15.5% in the 4th quarter. The number of un-employed people grew from one quarter to thenext in 2009:• 79,000 in the 1st quarter, • 92,200 in the 2nd quarter,• 102,300 in the 3rd quarter,• 106,700 in the 4th quarter.
Almost a third of the unemployed were out ofwork for a year or more. During the crisis, thepercentage of full-time employees decreasedand, accordingly, that of part-time employeesincreased. The number of work hours dimin-ished more than the number of employed peo-ple, which resulted in an increase in work hourproductivity, starting from the 2nd quarter.
INFLATIONThe economic crisis affected the inflation con-siderably, which was to be expected. Whileconsumer prices increased by 10.4% (annualaverage) in 2008, the corresponding numberwas 0.1% in 2009, indicating a small deflation.The check to prices can be explained by thesharpening of competition in the domesticmarket, caused by reduced demand, as wellas the decrease in wages and income, agrowth in work efficiency, etc. From the con-sumers’ perspective, the cheapening of foodby 0.4% deserves a positive mention. Theprices of transportation services (-6.4%) andcommunications services (-0.2%) also wentdown.However, the prices of alcohol products (raisedexcises) went up by 11.4%, and clothes (0.8%),housing-related products and services (1.3%),and household products (2.6%) also becamemore expensive. For companies, the sharpen-ing of price competition meant a substantialdecline in profits.
EXPORT AND IMPORTExport of goods decreased by 31.2 billionkroons in nominal price, or 23.5% in 2009,amounting to 101.3 billion kroons. Export tooka very steep fall already in the 1st quarter. In2008, export turnover was 31–34 billion kroonsper quarter, while in 2009, it was as follows:• 1st quarter 23.4 billion kroons,• 2nd quarter 25.5 billion kroons,• 3rd quarter 25.8 billion kroons,• 4th quarter 26.6 billion kroons. In 2008, the enterprises of the processing in-dustry exported 54% of their output, whereasin 2009, the respective percentage was 52.8%. The main export destinations were still the fol-lowing:
104
2009 — the second year of crisis
LEEV KUUM,Leading Researcher at the Estonian Institute of Economic Research
105
HOW GOOD ARE WE?ASSESSMENTS OF ESTONIA BY INTERNATIONAL RATING AGENCIES (as of 30 March 2010)
Global Competitiveness Index (World Economic Forum, Geneva)The 35th place among 133 countries. The indexcharacterises the country’s ability to ensure asustainable economic growth in a medium-termperspective. Based on information that charac-terises the country’s development phase, de-pending on whether the development occurs onthe basis of resources, technology or innovation.In comparison with the previous year, our indexhas dropped by 3 places.
International Human Development Index (UN) The 40th place in a ranking of 182 countries. Theindex takes into account the residents’ level ofeducation, life expectancy, level of economic de-velopment, etc. In comparison with 2008, an im-provement by two places.
International Index of Economic Freedom (The Heritage Foundation)The 16th place among 179 countries. The asses -sment is based on trade policy, state interven-tion, financial policy, relative importance of theblack market in the economy, etc. In comparisonwith the previous year, Estonia has descended by3 places.
International Sovereign Credit Rating (Standard & Poor’s)The rating agency Standard & Poor’s (S&P) low-ered Estonia’s sovereign credit rating by one gradefrom A to A-; the prospect of ratings remainednegative. Based on structural reforms that havetaken place in the country, the volume of direct in-vestments, fiscal and financial policy. Rating Ameans that the country is completely creditable.
International Corruption Perceptions Index(Transparency International)The 27th place in a ranking of 180 countries. Thecountry that holds the first place has the leastamount of corruption. A year before, Estonia wasin the same position as this year.
International Information Technology Index(World Economic Forum)The 25th place among 134 countries. Based onthe use of IT in the promotion of the country'seconomy. In comparison with the previous year,Estonia has declined by seven places.
Bertelsmann Transformation Index (Bertelsmann Media Worldwide)Estonia holds the 4th place among 119 countries.Characterises the development of market econ-omy and democracy in the country through therate and efficiency of the respective reforms. Withthe past year, Estonia has dropped by one place.
Travel & Tourism Competitiveness Index (World Economic Forum)Estonia holds the 27th place among 133 coun-tries. The index takes into account the country’ssafety, transportation and IT infrastructure, nat-ural and cultural resources, health and sanitaryconditions, etc. With the past year, Estonia hasdeclined by one place.
The financial year proved to be harder for Estonia than anticipatedin December 2008. The effect of the US-born financial crisis on theworld’s economy exceeded the worst fears.
• Finland (18.4% of all export), • Sweden (12.5%), • Latvia (9.7%) and • Russia (9.3%). Sweden and Finland were also the countriesto which Estonia's export decreased themost (by a total of 11.2 billion kroons). Thereason for that lies in the fact that a sub-stantial portion of Estonia’s trade with Fin-land and Sweden takes place within oneindustry and depends on these countries’export to third countries.In 2009, the import of goods amounted to113.6 billion kroons, which is 56.9 billionkroons less than in 2008. The main rea-sons for the decrease are the drop in ex-port and the decline in domestic demand(for both capital equipment and consumergoods).From the perspective of external balance,the decline in import is a positive thing, im-proving the balance of trade, which hadbeen heavily in the deficit in the previousyears. In 2009, the balance of trade deficitdecreased from 36.0 billion kroons (2008) to12.2 billion kroons, or almost threefold. In2009, Estonia’s biggest negative balancewas in the trade of mineral products (-5.9billion kroons) and the biggest positive bal-ance in the trade of timber and timber prod-ucts (+5.8 billion kroons).The balance of services was traditionallypositive in 2009: export 49.4 billion kroons,import 28.4 billion (in the previous year, 55.0and 35.8 billion kroons, respectively). Thepositive balance of services greatly im-proved the current account balance, whichwas positive for the first time this year: 9.8billion kroons, or 4.6% of GDP.
WAGES AND SALARIESThe rise of wages, which had been continu-ous for years, was replaced by a reductionin 2009. Leaving aside the social aspects ofdeclining wages, it reveals the flexibility ofwages management, which certainly helpeddecrease the number of bankruptcy casesduring the crisis. The annual average nom-inal salary was 12,264 kroons, which meant
that salaries dropped by 5.2%. Real salariesdecreased by a similar extent. With regardto areas of activity, the highest salaries werepaid in financial brokerage (22,881 kroons),IT sector (20,062 kroons), energy sector(16,556 kroons), public sector (15,347kroons).
REAL ESTATEThe real estate market experienced a majordownturn for the third year straight. In 2009,26,600 notarised real estate transactions ina total amount of 18.1 billion kroons wereconcluded. For reference, there were 60,200transactions in the boom year (2006), saletransactions amounting to 73.8 billionkroons. The average value of a real estatetransaction, which was 1,225,000 kroons in2006, dropped below 700,000 kroons by2009. The first signs of the recovery of thereal estate market could be spotted at theend of the year.
LOANSThe loan market experienced a decline forthe first time. The loan portfolio droppedfrom 260.1 billion kroons (at the end of 2008)to 244.7 billion kroons (at the end of 2009).This was due to both the reduced demandand the hardening of loan conditions bybanks. At the same time, people’s depositsin banks grew, reaching 60.9 billion kroons(the salary fund of about 8 months) by theend of the year.
COMMERCIAL ENTERPRISES The activity of commercial enterprises in2009 is characterised by the following data:industrial production (volume index) de-clined by 25.5%, retail sale of goods (volumeindex) decreased by 15.6%, the current pricevalue of construction work performed underown power dropped by 37.3%.
Last but not least, the balance of paymentswas in an equilibrium in 2009, and the over-expenditure on the consolidated budget ofthe public sector was 3.7 billion kroons, or1.7% of GDP •
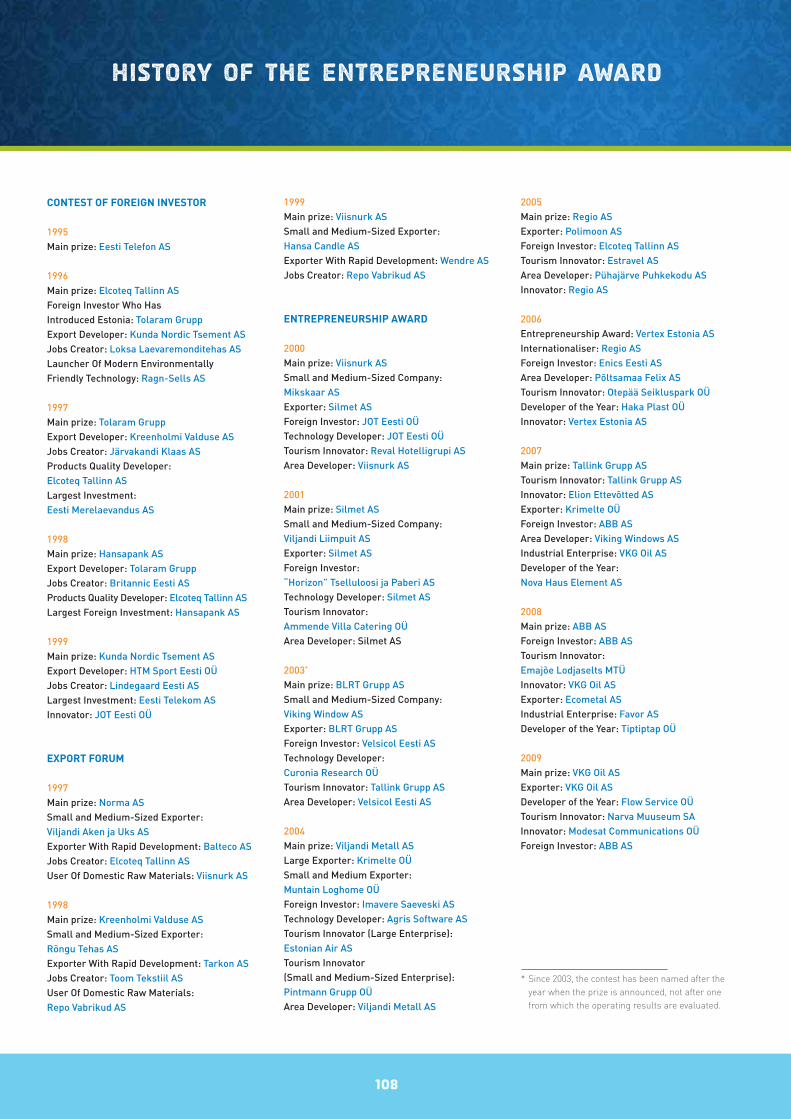
108
History of the Entrepreneurship Award
CONTEST OF FOREIGN INVESTOR
1995Main prize: Eesti Telefon AS
1996Main prize: Elcoteq Tallinn ASForeign Investor Who Has Introduced Estonia: Tolaram GruppExport Developer: Kunda Nordic Tsement ASJobs Creator: Loksa Laevaremonditehas ASLauncher Of Modern Environmentally Friendly Technology: Ragn-Sells AS
1997Main prize: Tolaram GruppExport Developer: Kreenholmi Valduse ASJobs Creator: Järvakandi Klaas ASProducts Quality Developer: Elcoteq Tallinn ASLargest Investment: Eesti Merelaevandus AS
1998Main prize: Hansapank ASExport Developer: Tolaram GruppJobs Creator: Britannic Eesti ASProducts Quality Developer: Elcoteq Tallinn ASLargest Foreign Investment: Hansapank AS
1999Main prize: Kunda Nordic Tsement ASExport Developer: HTM Sport Eesti OÜJobs Creator: Lindegaard Eesti ASLargest Investment: Eesti Telekom ASInnovator: JOT Eesti OÜ
EXPORT FORUM
1997Main prize: Norma ASSmall and Medium-Sized Exporter: Viljandi Aken ja Uks ASExporter With Rapid Development: Balteco ASJobs Creator: Elcoteq Tallinn ASUser Of Domestic Raw Materials: Viisnurk AS
1998Main prize: Kreenholmi Valduse ASSmall and Medium-Sized Exporter: Rõngu Tehas ASExporter With Rapid Development: Tarkon ASJobs Creator: Toom Tekstiil ASUser Of Domestic Raw Materials: Repo Vabrikud AS
1999Main prize: Viisnurk ASSmall and Medium-Sized Exporter: Hansa Candle ASExporter With Rapid Development: Wendre ASJobs Creator: Repo Vabrikud AS
ENTREPRENEURSHIP AWARD
2000Main prize: Viisnurk ASSmall and Medium-Sized Company: Mikskaar ASExporter: Silmet ASForeign Investor: JOT Eesti OÜTechnology Developer: JOT Eesti OÜTourism Innovator: Reval Hotelligrupi ASArea Developer: Viisnurk AS
2001Main prize: Silmet AS Small and Medium-Sized Company: Viljandi Liimpuit ASExporter: Silmet ASForeign Investor: “Horizon” Tselluloosi ja Paberi ASTechnology Developer: Silmet ASTourism Innovator: Ammende Villa Catering OÜArea Developer: Silmet AS
2003*
Main prize: BLRT Grupp ASSmall and Medium-Sized Company: Viking Window ASExporter: BLRT Grupp ASForeign Investor: Velsicol Eesti ASTechnology Developer: Curonia Research OÜTourism Innovator: Tallink Grupp ASArea Developer: Velsicol Eesti AS
2004Main prize: Viljandi Metall ASLarge Exporter: Krimelte OÜ Small and Medium Exporter: Muntain Loghome OÜ Foreign Investor: Imavere Saeveski ASTechnology Developer: Agris Software AS Tourism Innovator (Large Enterprise): Estonian Air ASTourism Innovator (Small and Medium-Sized Enterprise): Pintmann Grupp OÜ Area Developer: Viljandi Metall AS
2005Main prize: Regio ASExporter: Polimoon ASForeign Investor: Elcoteq Tallinn ASTourism Innovator: Estravel ASArea Developer: Pühajärve Puhkekodu ASInnovator: Regio AS
2006Entrepreneurship Award: Vertex Estonia ASInternationaliser: Regio AS Foreign Investor: Enics Eesti AS Area Developer: Põltsamaa Felix AS Tourism Innovator: Otepää Seikluspark OÜDeveloper of the Year: Haka Plast OÜInnovator: Vertex Estonia AS
2007Main prize: Tallink Grupp ASTourism Innovator: Tallink Grupp ASInnovator: Elion Ettevõtted ASExporter: Krimelte OÜ Foreign Investor: ABB ASArea Developer: Viking Windows ASIndustrial Enterprise: VKG Oil ASDeveloper of the Year: Nova Haus Element AS
2008Main prize: ABB ASForeign Investor: ABB ASTourism Innovator: Emajõe Lodjaselts MTÜInnovator: VKG Oil ASExporter: Ecometal AS Industrial Enterprise: Favor ASDeveloper of the Year: Tiptiptap OÜ
2009Main prize: VKG Oil ASExporter: VKG Oil ASDeveloper of the Year: Flow Service OÜTourism Innovator: Narva Muuseum SAInnovator: Modesat Communications OÜForeign Investor: ABB AS
* Since 2003, the contest has been named after theyear when the prize is announced, not after onefrom which the operating results are evaluated.

2003
The Most Competitive Enterprise: Eesti Energia AS
The Most Competitive Small Enterprise: Tallinna Laevatehas OÜ
The Most Competitive Large Trading Enterprise: Kesko Food AS
The Most Competitive Small Trading Enterprise: Baltic Pulp & Paper OÜ
The Most Competitive Large Industrial and Energy Enterprise: Eesti Energia AS
The Most Competitive Small Industrial and Energy Enterprise: Krimelte OÜ
The Most Competitive Construction Enterprise: Merko Ehitus AS
The Most Competitive Transportation and Communication Enterprise: Russian Estonian Rail Services AS
The Most Competitive Forestry and Agriculture Enterprise: Imavere Saeveski AS
The Most Competitive Large Service Enterprise: Hansapank AS
The Most Competitive Small Service Enterprise: Nordea Finance Estonia AS
2004
The Most Competitive Enterprise: Hansapank AS
The Most Competitive Trading Enterprise: Silberauto AS
The Most Competitive Medium-size Trading Enterprise: Kolomna Energy Service OÜ
The Most Competitive Small Trading Enterprise: Agris Software AS
The Most Competitive Large Industrial and Energy Enterprise: BLRT Grupp AS
The Most Competitive Medium-sized Industrial and Energy Enterprise: Maxit Estonia AS
The Most Competitive Small Industrial and Energy Enterprise: Örnplast Eesti AS
The Most Competitive Large and Medium-sized Construction Enterprise: Merko Ehitus AS
The Most Competitive Small Construction Enterprise: Peri AS
The Most Competitive Transportation, Logistics and Communication Enterprise: Russian Estonian Rail Services AS
The Most Competitive Forestry and Agriculture Enterprise: Ekseko AS
The Most Competitive Large and Medium-sized Service Enterprise: Hansapank AS
The Most Competitive Small Service Enterprise: Riigiressursside Keskus OÜ
2005
The Most Competitive Enterprise: Hansapank AS
The Most Competitive Financial Brokerage Enterprise: Hansapank AS
The Most Competitive Retail Enterprise: Tallinna Kaubamaja AS
The Most Competitive Wholesale Enterprise: Silberauto AS
The Most Competitive Industrial and Energy Enterprise: BLRT Grupp AS
The Most Competitive Food Industry Enterprise: A. Le Coq Tartu Õlletehas AS
The Most Competitive Construction Enterprise: Merko Ehitus AS
The Most Competitive Communication,Transportation and Logistics Enterprise: EMT AS
The Most Competitive Forestry and Agricultural Enterprise: Ekseko AS
The Most Competitive Hotel and Restaurant Enterprise: Delegatsioon OÜ
The Most Competitive Business Service and Real Estate Enterprise: Kodumajagrupi AS
The Most Competitive Service Enterprise: Kuusakoski AS
109
The History of the Estonian Companies’ Competitiveness Ranking
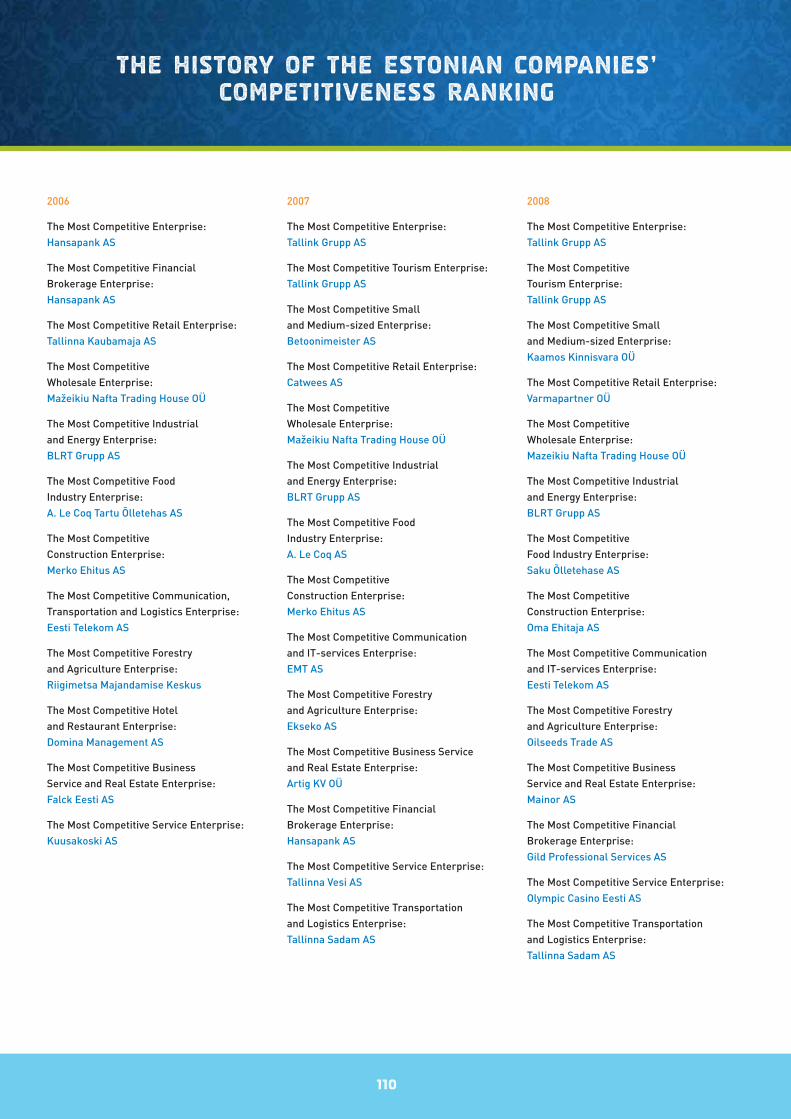
110
The History of the Estonian Companies’ Competitiveness Ranking
2006
The Most Competitive Enterprise: Hansapank AS
The Most Competitive Financial Brokerage Enterprise: Hansapank AS
The Most Competitive Retail Enterprise: Tallinna Kaubamaja AS
The Most Competitive Wholesale Enterprise: Mažeikiu Nafta Trading House OÜ
The Most Competitive Industrial and Energy Enterprise: BLRT Grupp AS
The Most Competitive Food Industry Enterprise: A. Le Coq Tartu Õlletehas AS
The Most Competitive Construction Enterprise: Merko Ehitus AS
The Most Competitive Communication,Transportation and Logistics Enterprise:Eesti Telekom AS
The Most Competitive Forestry and Agriculture Enterprise: Riigimetsa Majandamise Keskus
The Most Competitive Hotel and Restaurant Enterprise: Domina Management AS
The Most Competitive Business Service and Real Estate Enterprise: Falck Eesti AS
The Most Competitive Service Enterprise: Kuusakoski AS
2007
The Most Competitive Enterprise: Tallink Grupp AS
The Most Competitive Tourism Enterprise: Tallink Grupp AS
The Most Competitive Small and Medium-sized Enterprise: Betoonimeister AS
The Most Competitive Retail Enterprise: Catwees AS
The Most Competitive Wholesale Enterprise: Mažeikiu Nafta Trading House OÜ
The Most Competitive Industrial and Energy Enterprise: BLRT Grupp AS
The Most Competitive Food Industry Enterprise: A. Le Coq AS
The Most Competitive Construction Enterprise: Merko Ehitus AS
The Most Competitive Communication and IT-services Enterprise: EMT AS
The Most Competitive Forestry and Agriculture Enterprise: Ekseko AS
The Most Competitive Business Service and Real Estate Enterprise: Artig KV OÜ
The Most Competitive Financial Brokerage Enterprise: Hansapank AS
The Most Competitive Service Enterprise: Tallinna Vesi AS
The Most Competitive Transportation and Logistics Enterprise: Tallinna Sadam AS
2008
The Most Competitive Enterprise: Tallink Grupp AS
The Most Competitive Tourism Enterprise: Tallink Grupp AS
The Most Competitive Small and Medium-sized Enterprise: Kaamos Kinnisvara OÜ
The Most Competitive Retail Enterprise: Varmapartner OÜ
The Most Competitive Wholesale Enterprise: Mazeikiu Nafta Trading House OÜ
The Most Competitive Industrial and Energy Enterprise: BLRT Grupp AS
The Most Competitive Food Industry Enterprise: Saku Õlletehase AS
The Most Competitive Construction Enterprise: Oma Ehitaja AS
The Most Competitive Communication and IT-services Enterprise: Eesti Telekom AS
The Most Competitive Forestry and Agriculture Enterprise: Oilseeds Trade AS
The Most Competitive Business Service and Real Estate Enterprise: Mainor AS
The Most Competitive Financial Brokerage Enterprise: Gild Professional Services AS
The Most Competitive Service Enterprise: Olympic Casino Eesti AS
The Most Competitive Transportation and Logistics Enterprise:Tallinna Sadam AS
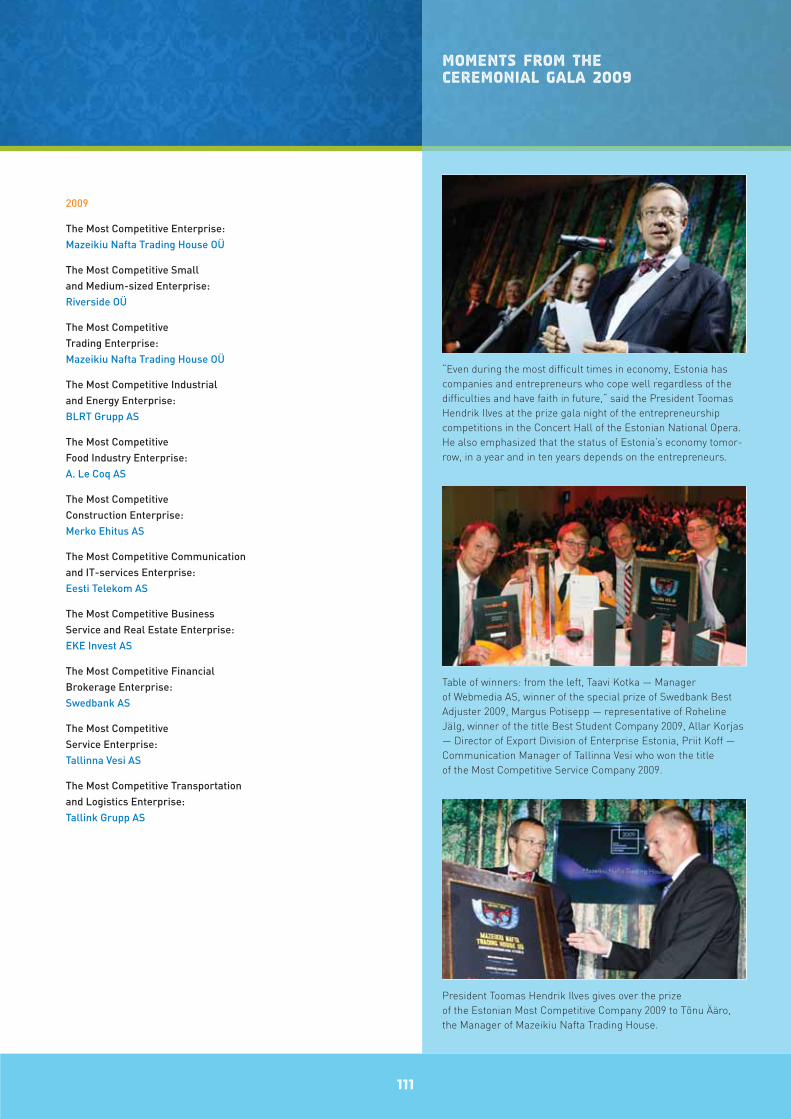
111
2009
The Most Competitive Enterprise: Mazeikiu Nafta Trading House OÜ
The Most Competitive Small and Medium-sized Enterprise: Riverside OÜ
The Most Competitive Trading Enterprise:Mazeikiu Nafta Trading House OÜ
The Most Competitive Industrial and Energy Enterprise: BLRT Grupp AS
The Most Competitive Food Industry Enterprise: A. Le Coq AS
The Most Competitive Construction Enterprise: Merko Ehitus AS
The Most Competitive Communication and IT-services Enterprise: Eesti Telekom AS
The Most Competitive Business Service and Real Estate Enterprise: EKE Invest AS
The Most Competitive Financial Brokerage Enterprise: Swedbank AS
The Most Competitive Service Enterprise: Tallinna Vesi AS
The Most Competitive Transportation and Logistics Enterprise: Tallink Grupp AS
President Toomas Hendrik Ilves gives over the prizeof the Estonian Most Competitive Company 2009 to Tõnu Ääro,the Manager of Mazeikiu Nafta Trading House.
Table of winners: from the left, Taavi Kotka — Managerof Webmedia AS, winner of the special prize of Swedbank BestAdjuster 2009, Margus Potisepp — representative of RohelineJälg, winner of the title Best Student Company 2009, Allar Korjas— Director of Export Division of Enterprise Estonia, Priit Koff —Communication Manager of Tallinna Vesi who won the titleof the Most Competitive Service Company 2009.
“Even during the most difficult times in economy, Estonia hascompanies and entrepreneurs who cope well regardless of thedifficulties and have faith in future,“ said the President ToomasHendrik Ilves at the prize gala night of the entrepreneurshipcompetitions in the Concert Hall of the Estonian National Opera.He also emphasized that the status of Estonia’s economy tomor-row, in a year and in ten years depends on the entrepreneurs.
MOMENTS FROM THE CEREMONIAL GALA 2009
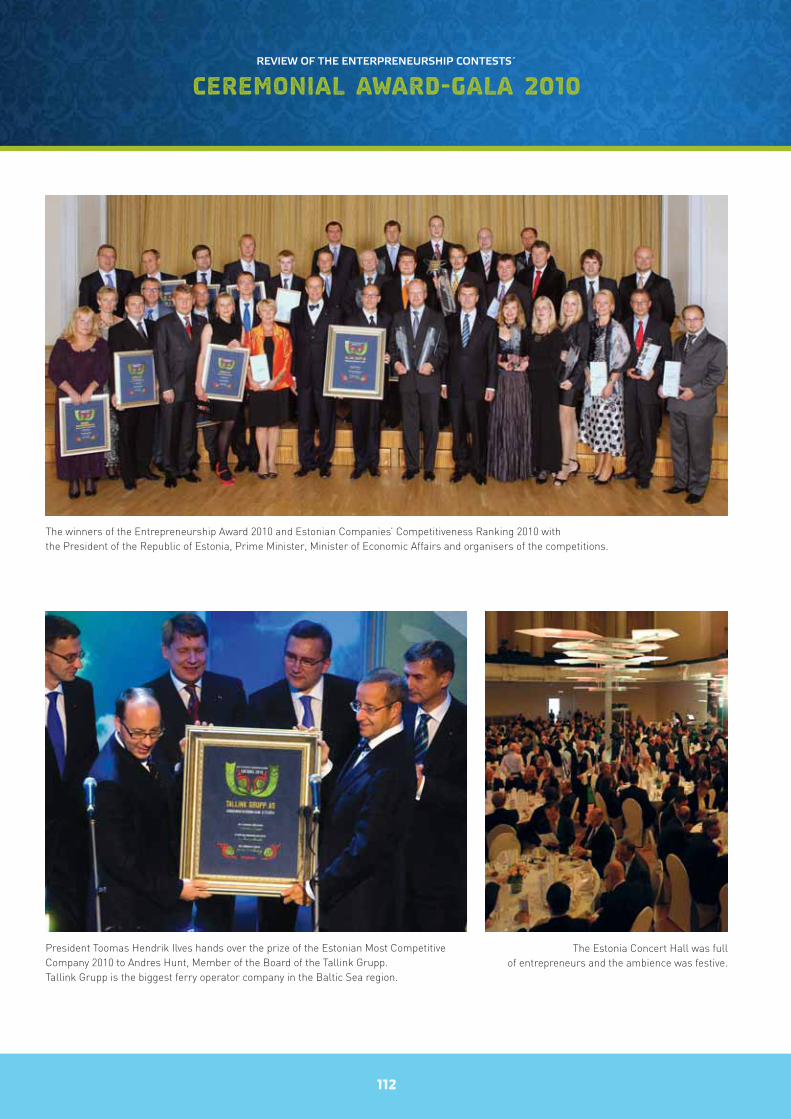
REVIEW OF THE ENTERPRENEURSHIP CONTESTS´
ceremonial award-gala 2010
112
The winners of the Entrepreneurship Award 2010 and Estonian Companies’ Competitiveness Ranking 2010 with the President of the Republic of Estonia, Prime Minister, Minister of Economic Affairs and organisers of the competitions.
President Toomas Hendrik Ilves hands over the prize of the Estonian Most CompetitiveCompany 2010 to Andres Hunt, Member of the Board of the Tallink Grupp.Tallink Grupp is the biggest ferry operator company in the Baltic Sea region.
The Estonia Concert Hall was fullof entrepreneurs and the ambience was festive.
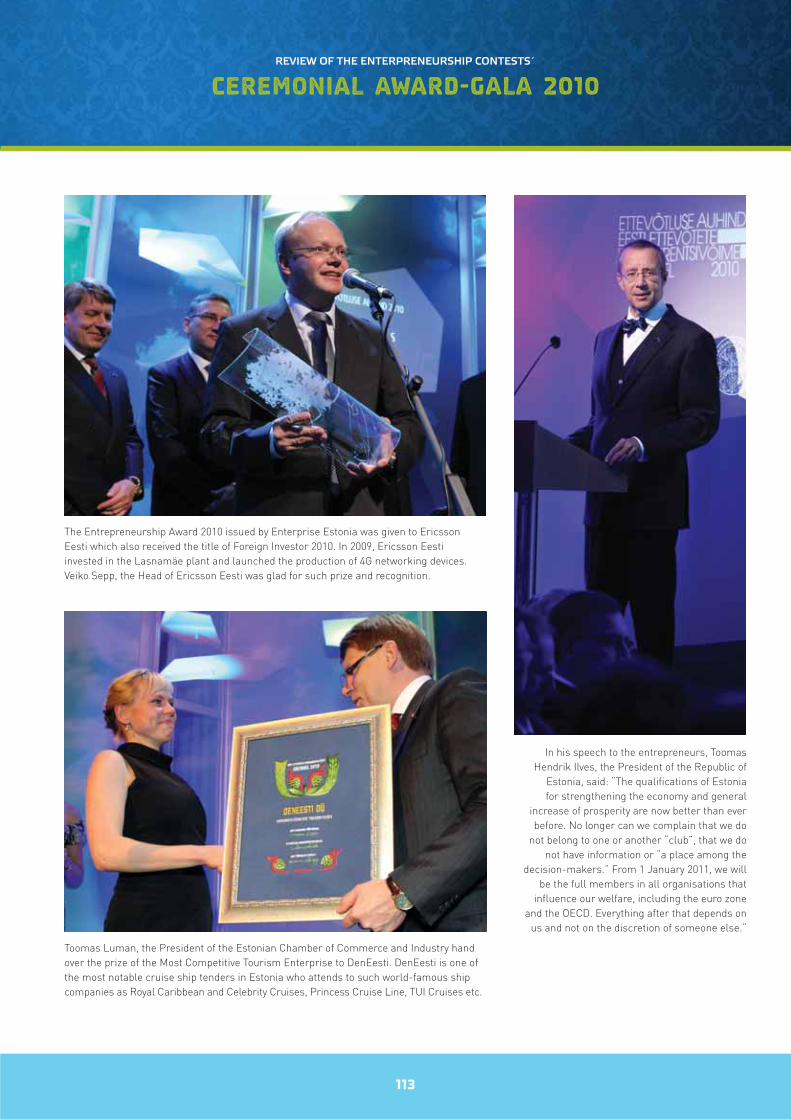
113
REVIEW OF THE ENTERPRENEURSHIP CONTESTS´
ceremonial award-gala 2010
The Entrepreneurship Award 2010 issued by Enterprise Estonia was given to EricssonEesti which also received the title of Foreign Investor 2010. In 2009, Ericsson Eesti invested in the Lasnamäe plant and launched the production of 4G networking devices. Veiko Sepp, the Head of Ericsson Eesti was glad for such prize and recognition.
Toomas Luman, the President of the Estonian Chamber of Commerce and Industry handover the prize of the Most Competitive Tourism Enterprise to DenEesti. DenEesti is one ofthe most notable cruise ship tenders in Estonia who attends to such world-famous shipcompanies as Royal Caribbean and Celebrity Cruises, Princess Cruise Line, TUI Cruises etc.
In his speech to the entrepreneurs, ToomasHendrik Ilves, the President of the Republic of
Estonia, said: “The qualifications of Estoniafor strengthening the economy and general
increase of prosperity are now better than everbefore. No longer can we complain that we do
not belong to one or another “club”, that we donot have information or “a place among the
decision-makers.” From 1 January 2011, we willbe the full members in all organisations that
influence our welfare, including the euro zoneand the OECD. Everything after that depends on
us and not on the discretion of someone else.“
116
Estonian Chamber of Commerce and Industry Piret Salmistu • Email: [email protected]: 604 0060
Enterprise Estonia Jüri Luud • Email: [email protected] Shein • Email: [email protected]: 625 9700
Estonian Institute of Economic ResearchMarje Josing • Email: [email protected] Reiman • Email: [email protected]: 668 1242
Aricles and photographs:Director ja Partnerid OÜ
Design:Disainikorp
Print:Kroonpress
TOP ESTONIANENTERPRISES 2010ENTREPRENEURSHIP AWARD • COMPETITIVENESS RANKING
Copywriters:Estonian Chamber of Commerce and IndustryPiret Salmistu – [email protected]: +372 604 0060
Enterprise EstoniaMargit Shein – [email protected]: +372 627 9700
Estonian Institute of Economic ResearchMarje Josing – [email protected] Reiman – [email protected]: +372 668 1242
Articles and photos:Director&Partners
Layout:Disainikorp
Print:Kroonpress