Embed Size (px)
Citation preview

Top 30 Chilean Companies - April 2007 3
44 IInnttrroodduuccttiioonn
CCoommmmeennttaarriieess6 Understanding Chile's Sovereign Credit Fundamentals 15 Chile’s Economic Growth And Fiscal Position: How Important Are
They From A Ratings Perspective?18 2007's Top 5 Credit Factors For Corporate Credit Quality In Chile20 Chilean Banks Look To Improve On 2006 Performance In 2007
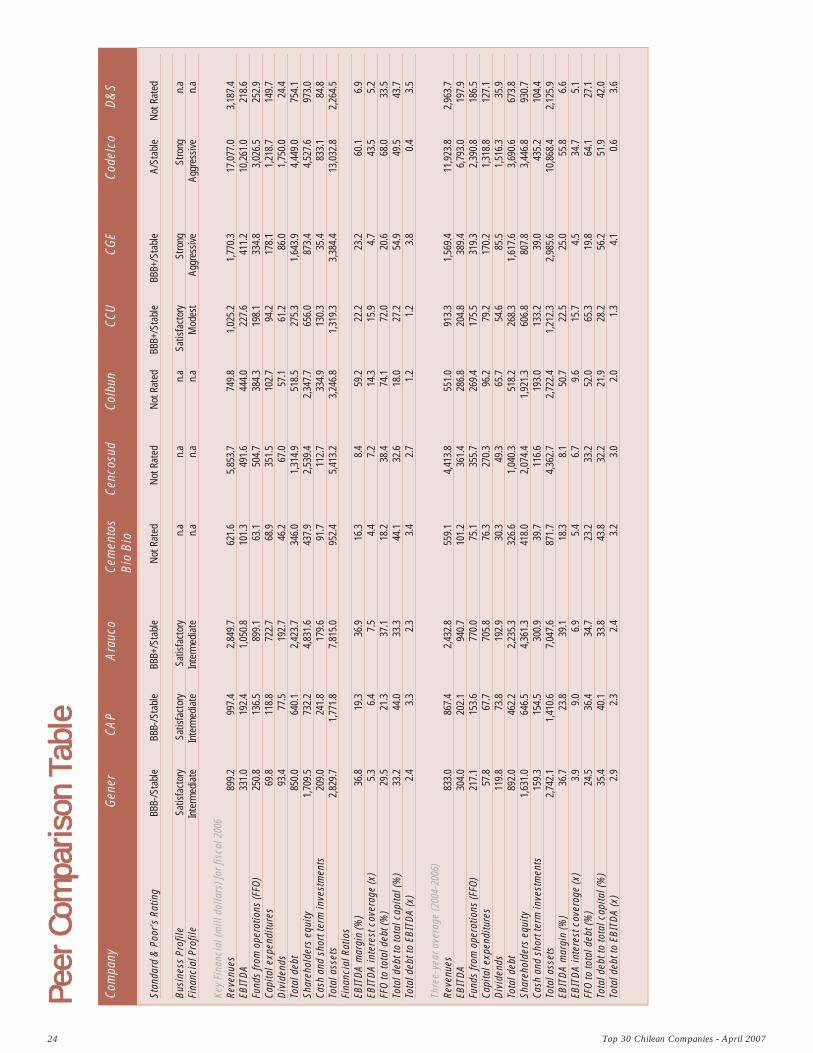
CCrreeddiitt SSttaattiissttiiccss 24 Peer Comparison Table
CCrreeddiitt RReeppoorrttss28 AES Gener S.A. 30 CAP S.A. 31 Celulosa Arauco y Constitución S.A. 32 Cementos Bío Bío S.A. 33 Cencosud S.A. 34 Colbún S.A. 35 Compañía Cervecerías Unidas S.A. 36 Compañía General de Electricidad S.A. 38 Corporación Nacional del Cobre de Chile 40 Distribución y Servicios D & S S.A. 41 Embotelladora Andina S.A. 43 Empresa Nacional de Electricidad S.A. 45 Empresa Nacional de Petróleo 47 Empresa Nacional de Telecomunicaciones S.A. 48 Empresas Carozzi S.A. 49 Empresas CMPC S.A. 51 Empresas Copec S.A. 52 Enersis S.A. 53 LAN Airlines S.A. 54 Masisa S.A. 55 Metrogas S.A. 56 Minera Escondida Limitada 57 Quiñenco S.A. 58 Ripley Chile S.A. 59 S.A.C.I Falabella60 Sigdo Koppers S.A.61 Sociedad Química y Minera De Chile S.A.62 Telefónica Chile S.A.63 Transelec S.A.64 Viña Concha y Toro S.A.
DDeeffiinniittiioonnss66 Standard & Poor's Role In The Financial Markets 68 Glossary Of Financial Ratio Definitions 69 Standard & Poor's Rating Definitions71 Feller Rate's - Rating Definitions
7755 CCoonnttaacctt LLiisstt
Table of Contents
4 Top 30 Chilean Companies - April 2007
Introduction
Standard & Poor's Ratings Services and Feller Rate Clasificadora deRiesgo are pleased to present "Chilean Top 30 Corporates," theinaugural joint analytical report since our renewed affiliation inNovember 2006. Our analysts have reviewed the business and financialprofiles of Chile's top 30 companies with both a global perspective andin-depth knowledge of the domestic operating environment. Thesecompanies are either key players in the country's major industrialsectors or active participants in the international or domestic bondmarkets, and have adequate financial disclosure.
Chile's solid economic performance, stable indicators, and reliableinstitutional framework have also shaped the country's corporate sectorduring the past decade. The fate of most of the major corporations istied to the swings of the global economy, especially the evolution ofcommodities in general and copper in particular. Nevertheless, prudentfinancial policies and cash management as well as good access tocredit have allowed most players to grow and withstand externalshocks while maintaining their strong creditworthiness through thecycle.
These characteristics will be evident from the individual analysesincluded in this publication. We have also included commentaries onthe sovereign rating of Chile, the financial system, the corporate sectorin general, and information on criteria and methodology to provide abroader analytical framework.
We trust that the investment community, both in Chile and overseas,will find this report an important reference tool that will facilitateinvestment decisions.
Marta CastelliOffice HeadStandard & Poor's
Other analysts who have contributed to this publication:
Standard & Poor's AnalystsPablo Lutereau, DirectorSergio Fuentes, DirectorIvana Recalde, Associate DirectorLuciano Gremone, AssociateEzequiel Gómez Cáceres, Rating SpecialistJavier Vieiro Cobas, Rating Analyst
Feller Rate AnalystManuel Acuña, Subgerente

Commentaries
6 Top 30 Chilean Companies - April 2007
Sebastian Briozzo, Buenos Aires (54) 11 4891 2120; [email protected] ; Joydeep Mukherji, New York (1) 212-438-7351;[email protected]
Understanding CChile's SSovereign CCredit FFundamentals
MMaajjoorr RRaattiinngg FFaaccttoorrss
Strengths:A strong policy framework founded on rules-based fiscal and monetary policies and a political commitment to an open economy. A matured political consensus on key elements of economic policies. A low and declining public debt burden.
Weaknesses:A relatively narrow economic base and resulting vulnerability to cyclical economic performance due to the fluctuating price of copper. A relatively high (albeit declining) external debt burden.
RRaattiioonnaallee The ratings and outlooks on the Republic of Chile reflect Standard &Poor’s Ratings Services’ expectation that the combination ofappropriate economic policy management and a strong improvement inmost of the country’s indicators will increase the sovereign’s chance ofcontinuing its upward trend in creditworthiness.
Chile is one of the few emerging-market economies to gain strongcredentials thanks to the implementation of countercyclical fiscal andmonetary policies. These policies are of particular importance given thecountry’s dependence upon commodities, copper in particular. Thispolicy framework was consolidated and strengthened through thepassage of a Fiscal Responsibility Law, which was supported acrossthe political spectrum. Government authorities are currently addressingstill-pending issues on the macroeconomic agenda with medium- tolong-term impact, such as additional modifications to the already-reformed pension system, the capitalization of the central bank, andmeasures targeting competitiveness. The pension reform will allowChile to move toward wider and more generous coverage in a prudentand fiscally sustainable way. Authorities have also announced newmeasures that will increase transparency in the management of thegovernment’s countercyclical fiscal funds. This reform is expected tocontinue to reduce economic growth volatility over the medium andlong term, matching Chile’s economic performance to that of higher-rated governments.
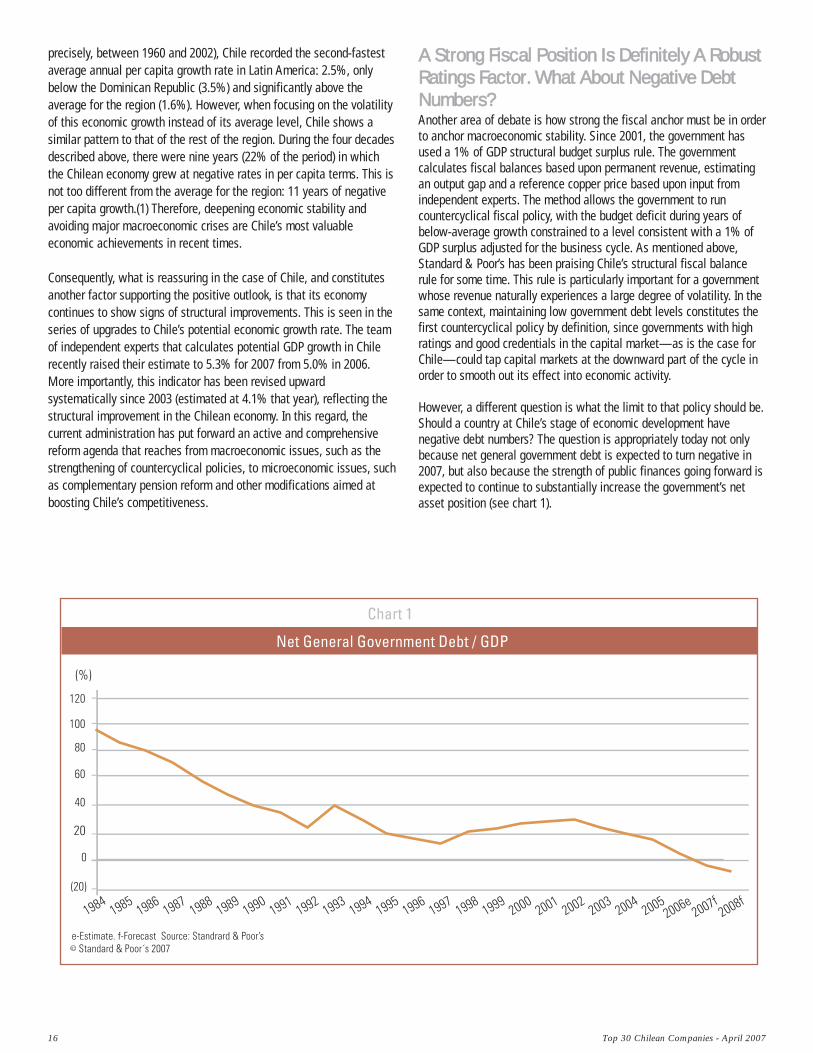
The implementation of Chile’s structural fiscal rule (now supported bylaw) in the context of extraordinarily high copper prices is resulting instrong fiscal surpluses and, therefore, a rapid decline in debt levels.Chile’s general government is expected to have reached a fiscal surplusequivalent to 7.9% of GDP by year-end 2006, and positive balances arealso expected for 2007 and 2008. As a result of this performance,Chile’s net general government debt level is approaching zero (only 3%of GDP by year-end 2006) once government assets saved in thecountercyclical fiscal funds are taken into account.
Consensus on the need to maintain this conservative approach in orderto continue to protect Chile’s macroeconomic framework from volatilecommodity prices is high across the political spectrum. While thecurrent target of 1% of GDP for the structural fiscal surplus could varyin the future depending upon the progress in dealing with the issuesthat justify the surplus (future pension costs and capitalization of thecentral bank), the strong commitment from Chilean Administrations tosound fiscal policies is expected to remain.
Despite recent improvements, Chile’s credit rating will continue to beconstrained by the presence of a less-wealthy and narrower economicstructure than found in most of its ‘A’ rated peers.
OOuuttllooookk The positive outlook is based upon the expectation that Chile’s already-strong macroeconomic framework will continue to be strengthened,bringing additional stability to GDP performance over the medium andlong term in line with that of higher-rated credits. Recent governmentefforts to address pending issues, in particular on the pension front,will continue to diminish the risk the Chilean economy will face overthe medium term, bringing additional signs of predictability to Chile’smedium- and long-term economic prospects. Continuation of thecurrent economic policy set, combined with the strong results shown inthe economic, fiscal, and external indicators—even in the case of aexpected decrease in copper prices to more moderate levels (albeit stillhigh by historical standards—could lead to a rating upgrade.
Top 30 Chilean Companies - April 2007 7
CCoommppaarraattiivvee AAnnaallyyssiiss:: AAlltthhoouugghh LLeessss WWeeaalltthhyy,,CChhiillee CCoommppaarreess WWeellll TToo RRaatteedd PPeeeerrss
Chile’s growth prospects are similar to the levels in rated peers; Fiscal balances and debt burden compare favorably with those of rated peers; and Chile’s declining external debt and debt-service burden are approaching the median levels in rated peers.
The ratings on Chile are the highest in Latin America and reflect thecountry’s successful use of monetary, exchange-rate, and fiscal policiesto reduce external vulnerability, increase economic flexibility, andsustain GDP growth. Rising standards of governance, a low and fallingpublic debt burden, and a strong policy framework place Chile in the ‘A’category of sovereigns.
The political consensus behind market-oriented policies is sturdy and isexpected to remain strong. Unlike other countries in Latin America, thestrong consensus on macroeconomic issues has allowed the politicaldebate to move toward the microeconomic arena. The macroeconomicpolicy consensus is sustained by Chile’s success in reducing poverty. Itspoverty rate decreased to 18% in 2006 from 39% in 1990, comparedwith a fall to 39% from 48% for the Latin region as a whole during thesame period. However, significant challenges remain ahead in terms ofimproving Chile’s still highly unequal income distribution. Its Ginicoefficient of about 0.57 is one of the highest (more inequality) in theworld, only surpassed by that of some African nations as well asBolivia (B-/Negative; all ratings herein are long-term foreign currency sovereign credit ratings/outlook), Haiti (not rated), Colombia(BB/Positive), and Paraguay (B-/Positive) and the Federative Republic ofBrazil (BB/Positive), according to the U.N. Human Development Reportfor 2006 (although the data for Chile in the report corresponds to 2000,the situation has not significantly changed since).
Chile’s public institutions are stronger than those in its counterparts inother Latin American countries and the level of corruption is perceivedto be lower, according to international surveys. Chile’s civil service,however, is not as professional as its counterpart in highly rated
European and Commonwealth countries. Chile generally scores betterthan other Latin countries on most measures of competitiveness butscores worse than lower rated countries like Malaysia (A-/Stable) andthe Republic of Hungary (BBB+/Stable) in terms of the costs anddifficulties of doing business, especially new-firm startups. Chile’s long-term productivity and growth prospects should improve throughgrowing investment in infrastructure and education, but its workforce isless educated on average than the workforce of similarly ratedRepublic of Korea (A/Stable).
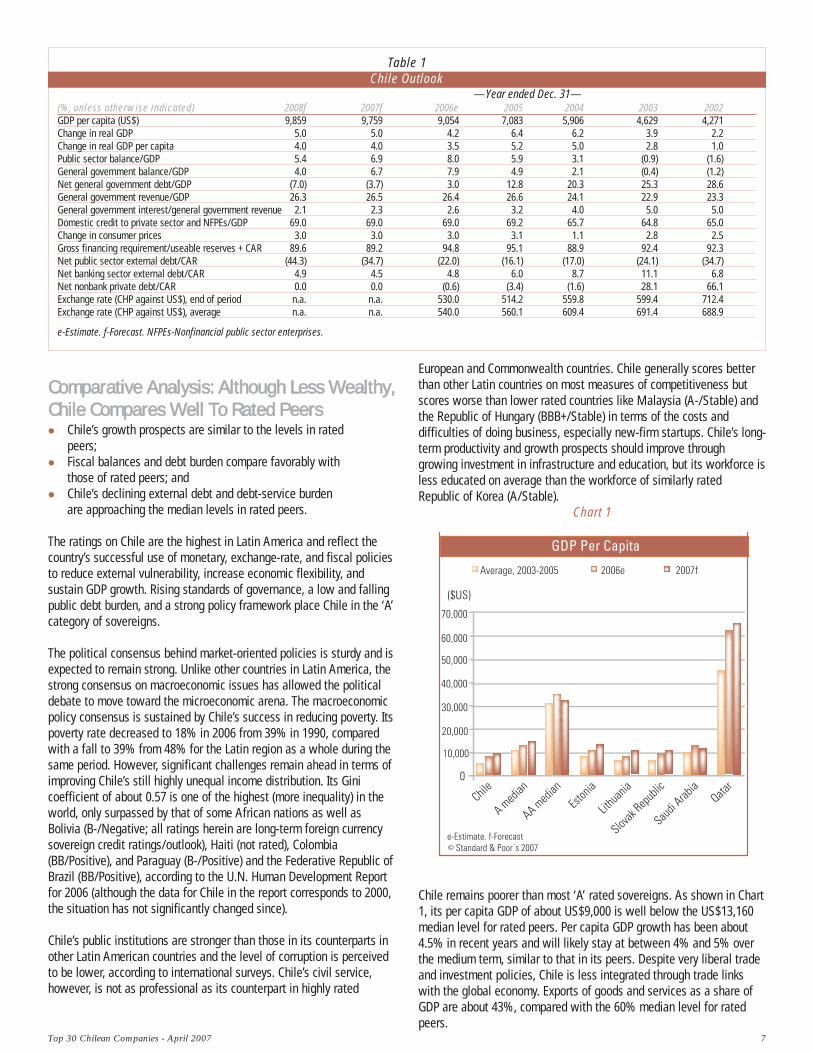
Chart 1
Chile remains poorer than most ‘A’ rated sovereigns. As shown in Chart1, its per capita GDP of about US$9,000 is well below the US$13,160median level for rated peers. Per capita GDP growth has been about4.5% in recent years and will likely stay at between 4% and 5% overthe medium term, similar to that in its peers. Despite very liberal tradeand investment policies, Chile is less integrated through trade linkswith the global economy. Exports of goods and services as a share ofGDP are about 43%, compared with the 60% median level for ratedpeers.
Table 1Chile Outlook
—Year ended Dec. 31— (%, unless otherwise indicated) 2008f 2007f 2006e 2005 2004 2003 2002 GDP per capita (US$) 9,859 9,759 9,054 7,083 5,906 4,629 4,271 Change in real GDP 5.0 5.0 4.2 6.4 6.2 3.9 2.2 Change in real GDP per capita 4.0 4.0 3.5 5.2 5.0 2.8 1.0 Public sector balance/GDP 5.4 6.9 8.0 5.9 3.1 (0.9) (1.6) General government balance/GDP 4.0 6.7 7.9 4.9 2.1 (0.4) (1.2) Net general government debt/GDP (7.0) (3.7) 3.0 12.8 20.3 25.3 28.6 General government revenue/GDP 26.3 26.5 26.4 26.6 24.1 22.9 23.3 General government interest/general government revenue 2.1 2.3 2.6 3.2 4.0 5.0 5.0 Domestic credit to private sector and NFPEs/GDP 69.0 69.0 69.0 69.2 65.7 64.8 65.0 Change in consumer prices 3.0 3.0 3.0 3.1 1.1 2.8 2.5 Gross financing requirement/useable reserves + CAR 89.6 89.2 94.8 95.1 88.9 92.4 92.3 Net public sector external debt/CAR (44.3) (34.7) (22.0) (16.1) (17.0) (24.1) (34.7) Net banking sector external debt/CAR 4.9 4.5 4.8 6.0 8.7 11.1 6.8 Net nonbank private debt/CAR 0.0 0.0 (0.6) (3.4) (1.6) 28.1 66.1 Exchange rate (CHP against US$), end of period n.a. n.a. 530.0 514.2 559.8 599.4 712.4 Exchange rate (CHP against US$), average n.a. n.a. 540.0 560.1 609.4 691.4 688.9
e-Estimate. f-Forecast. NFPEs-Nonfinancial public sector enterprises.
8 Top 30 Chilean Companies - April 2007
Although advancing rapidly in this regard, Chile’s economy remainsvulnerable to commodity prices. The country’s comparatively narroweconomic base has been a constraint on the rating, but it has beenloosening due to fiscal and monetary policies that have contributed torising productivity while dampening the impact of sharp changes in theterms of trade on economic performance.
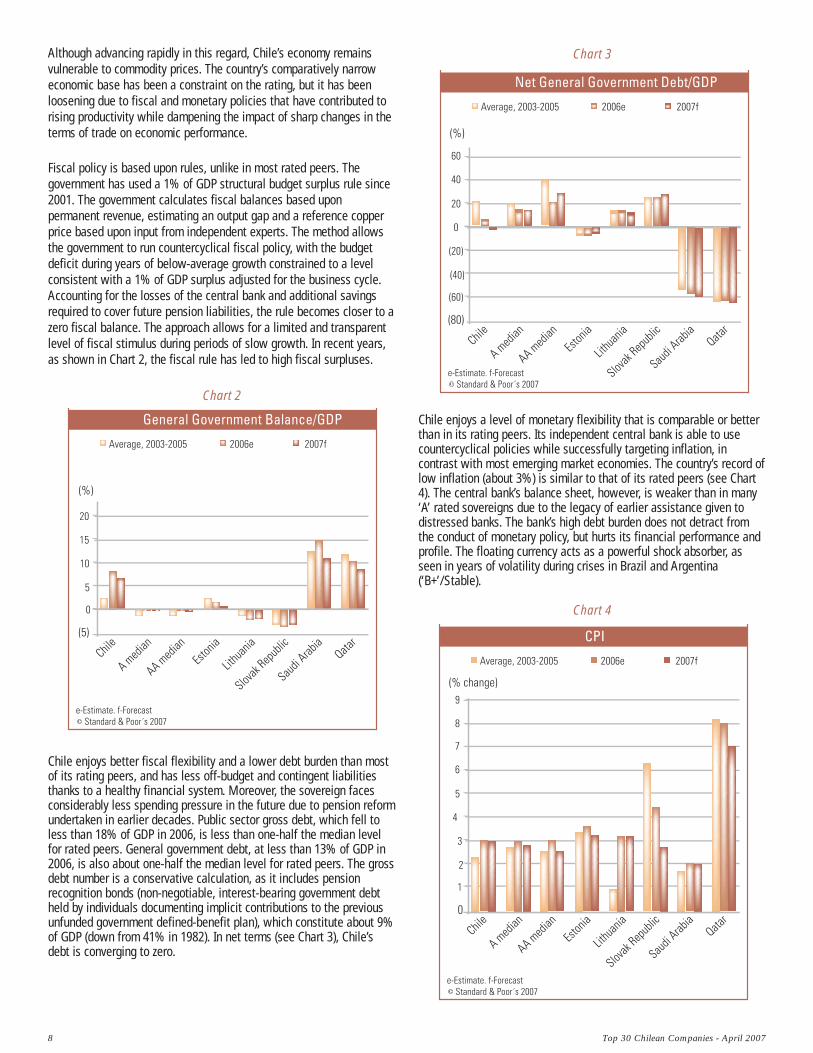
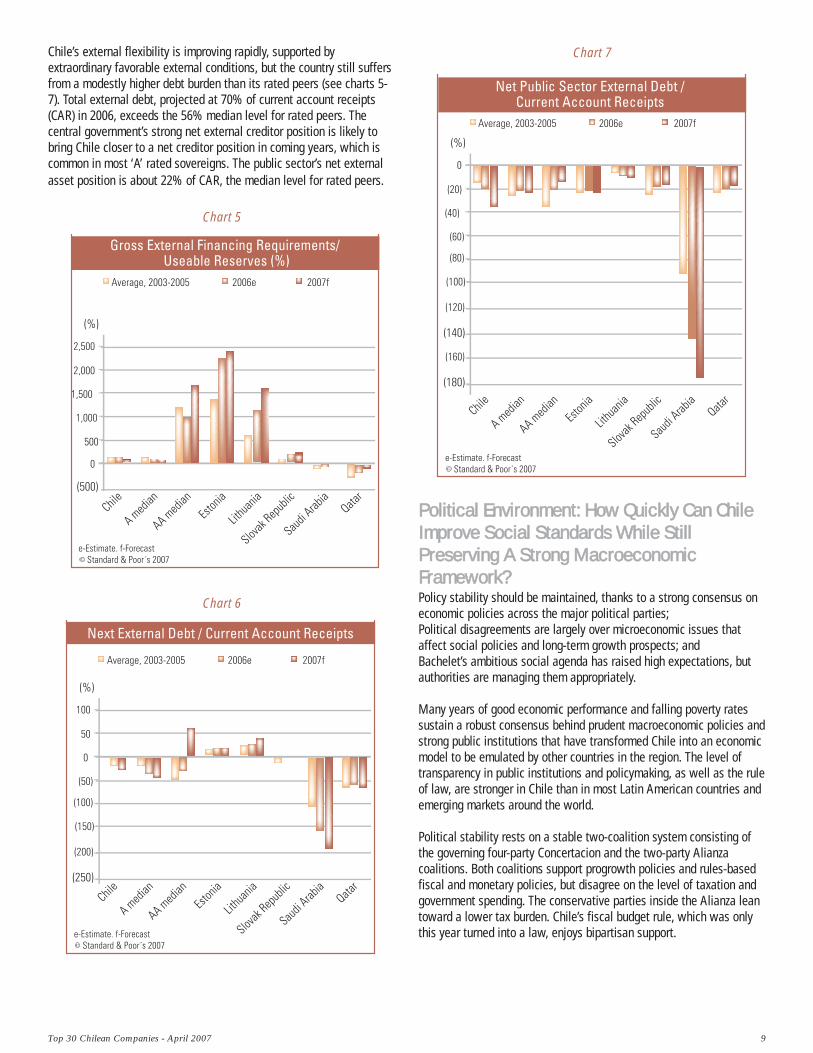
Fiscal policy is based upon rules, unlike in most rated peers. Thegovernment has used a 1% of GDP structural budget surplus rule since2001. The government calculates fiscal balances based uponpermanent revenue, estimating an output gap and a reference copperprice based upon input from independent experts. The method allowsthe government to run countercyclical fiscal policy, with the budgetdeficit during years of below-average growth constrained to a levelconsistent with a 1% of GDP surplus adjusted for the business cycle.Accounting for the losses of the central bank and additional savingsrequired to cover future pension liabilities, the rule becomes closer to azero fiscal balance. The approach allows for a limited and transparentlevel of fiscal stimulus during periods of slow growth. In recent years,as shown in Chart 2, the fiscal rule has led to high fiscal surpluses.
Chart 2
Chile enjoys better fiscal flexibility and a lower debt burden than mostof its rating peers, and has less off-budget and contingent liabilitiesthanks to a healthy financial system. Moreover, the sovereign facesconsiderably less spending pressure in the future due to pension reformundertaken in earlier decades. Public sector gross debt, which fell toless than 18% of GDP in 2006, is less than one-half the median levelfor rated peers. General government debt, at less than 13% of GDP in2006, is also about one-half the median level for rated peers. The grossdebt number is a conservative calculation, as it includes pensionrecognition bonds (non-negotiable, interest-bearing government debtheld by individuals documenting implicit contributions to the previousunfunded government defined-benefit plan), which constitute about 9%of GDP (down from 41% in 1982). In net terms (see Chart 3), Chile’sdebt is converging to zero.
Chart 3
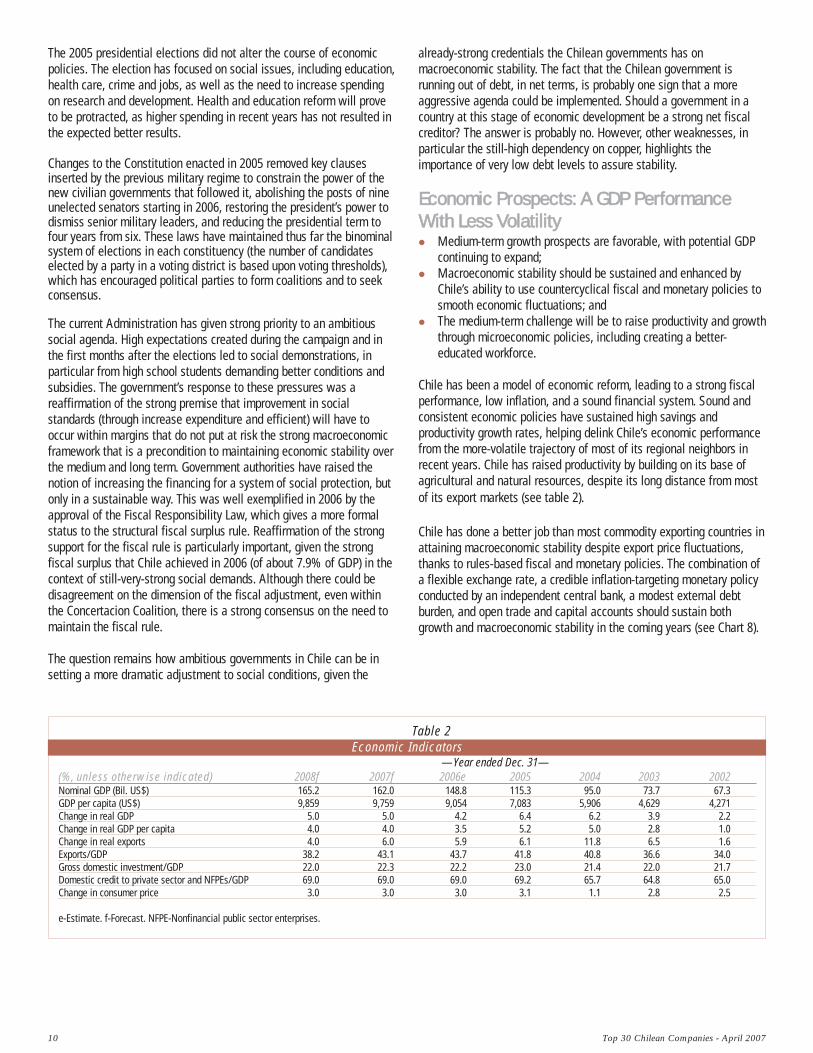
Chile enjoys a level of monetary flexibility that is comparable or betterthan in its rating peers. Its independent central bank is able to usecountercyclical policies while successfully targeting inflation, incontrast with most emerging market economies. The country’s record oflow inflation (about 3%) is similar to that of its rated peers (see Chart4). The central bank’s balance sheet, however, is weaker than in many‘A’ rated sovereigns due to the legacy of earlier assistance given todistressed banks. The bank’s high debt burden does not detract fromthe conduct of monetary policy, but hurts its financial performance andprofile. The floating currency acts as a powerful shock absorber, asseen in years of volatility during crises in Brazil and Argentina(‘B+’/Stable).
Chart 4
Top 30 Chilean Companies - April 2007 9
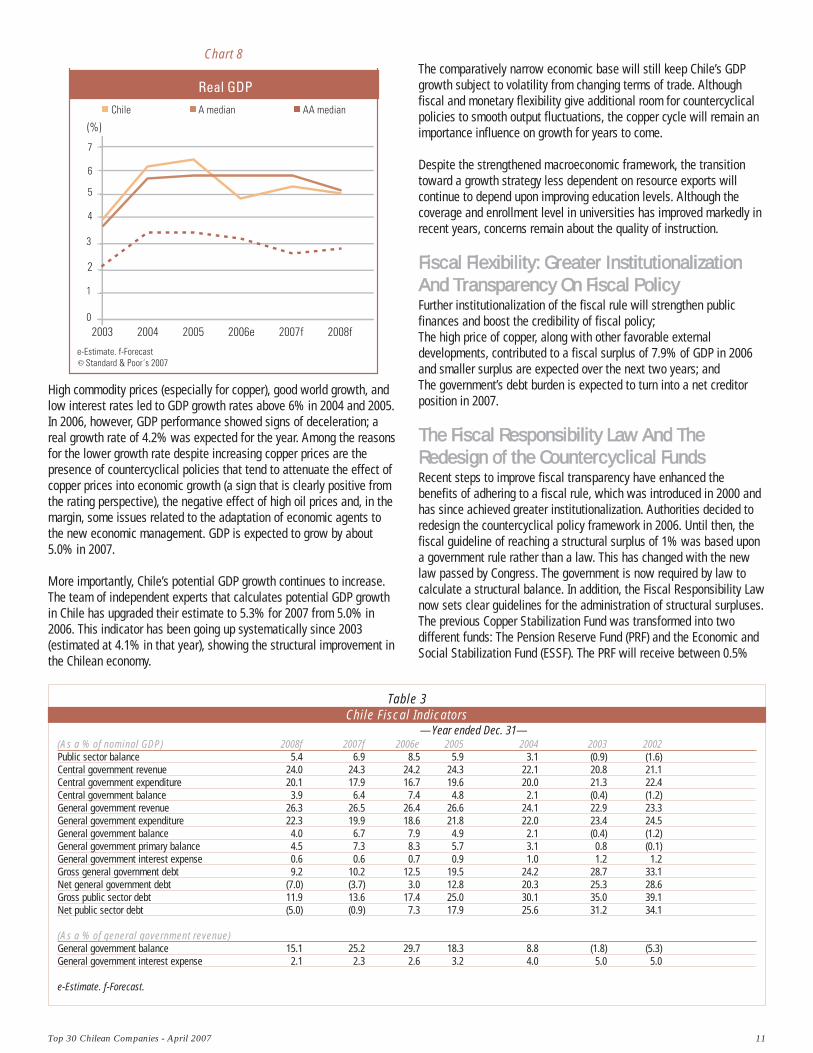
Chile’s external flexibility is improving rapidly, supported byextraordinary favorable external conditions, but the country still suffersfrom a modestly higher debt burden than its rated peers (see charts 5-7). Total external debt, projected at 70% of current account receipts(CAR) in 2006, exceeds the 56% median level for rated peers. Thecentral government’s strong net external creditor position is likely tobring Chile closer to a net creditor position in coming years, which iscommon in most ‘A’ rated sovereigns. The public sector’s net externalasset position is about 22% of CAR, the median level for rated peers.
Chart 5
Chart 6
Chart 7
PPoolliittiiccaall EEnnvviirroonnmmeenntt:: HHooww QQuuiicckkllyy CCaann CChhiilleeIImmpprroovvee SSoocciiaall SSttaannddaarrddss WWhhiillee SSttiillllPPrreesseerrvviinngg AA SSttrroonngg MMaaccrrooeeccoonnoommiiccFFrraammeewwoorrkk?? Policy stability should be maintained, thanks to a strong consensus oneconomic policies across the major political parties; Political disagreements are largely over microeconomic issues thataffect social policies and long-term growth prospects; and Bachelet’s ambitious social agenda has raised high expectations, butauthorities are managing them appropriately.
Many years of good economic performance and falling poverty ratessustain a robust consensus behind prudent macroeconomic policies andstrong public institutions that have transformed Chile into an economicmodel to be emulated by other countries in the region. The level oftransparency in public institutions and policymaking, as well as the ruleof law, are stronger in Chile than in most Latin American countries andemerging markets around the world.
Political stability rests on a stable two-coalition system consisting ofthe governing four-party Concertacion and the two-party Alianzacoalitions. Both coalitions support progrowth policies and rules-basedfiscal and monetary policies, but disagree on the level of taxation andgovernment spending. The conservative parties inside the Alianza leantoward a lower tax burden. Chile’s fiscal budget rule, which was onlythis year turned into a law, enjoys bipartisan support.
10 Top 30 Chilean Companies - April 2007
Table 2Economic Indicators
—Year ended Dec. 31— (%, unless otherwise indicated) 2008f 2007f 2006e 2005 2004 2003 2002 Nominal GDP (Bil. US$) 165.2 162.0 148.8 115.3 95.0 73.7 67.3 GDP per capita (US$) 9,859 9,759 9,054 7,083 5,906 4,629 4,271 Change in real GDP 5.0 5.0 4.2 6.4 6.2 3.9 2.2 Change in real GDP per capita 4.0 4.0 3.5 5.2 5.0 2.8 1.0 Change in real exports 4.0 6.0 5.9 6.1 11.8 6.5 1.6 Exports/GDP 38.2 43.1 43.7 41.8 40.8 36.6 34.0 Gross domestic investment/GDP 22.0 22.3 22.2 23.0 21.4 22.0 21.7 Domestic credit to private sector and NFPEs/GDP 69.0 69.0 69.0 69.2 65.7 64.8 65.0 Change in consumer price 3.0 3.0 3.0 3.1 1.1 2.8 2.5
e-Estimate. f-Forecast. NFPE-Nonfinancial public sector enterprises.
The 2005 presidential elections did not alter the course of economicpolicies. The election has focused on social issues, including education,health care, crime and jobs, as well as the need to increase spendingon research and development. Health and education reform will proveto be protracted, as higher spending in recent years has not resulted inthe expected better results.
Changes to the Constitution enacted in 2005 removed key clausesinserted by the previous military regime to constrain the power of thenew civilian governments that followed it, abolishing the posts of nineunelected senators starting in 2006, restoring the president’s power todismiss senior military leaders, and reducing the presidential term tofour years from six. These laws have maintained thus far the binominalsystem of elections in each constituency (the number of candidateselected by a party in a voting district is based upon voting thresholds),which has encouraged political parties to form coalitions and to seekconsensus.
The current Administration has given strong priority to an ambitioussocial agenda. High expectations created during the campaign and inthe first months after the elections led to social demonstrations, inparticular from high school students demanding better conditions andsubsidies. The government’s response to these pressures was areaffirmation of the strong premise that improvement in socialstandards (through increase expenditure and efficient) will have tooccur within margins that do not put at risk the strong macroeconomicframework that is a precondition to maintaining economic stability overthe medium and long term. Government authorities have raised thenotion of increasing the financing for a system of social protection, butonly in a sustainable way. This was well exemplified in 2006 by theapproval of the Fiscal Responsibility Law, which gives a more formalstatus to the structural fiscal surplus rule. Reaffirmation of the strongsupport for the fiscal rule is particularly important, given the strongfiscal surplus that Chile achieved in 2006 (of about 7.9% of GDP) in thecontext of still-very-strong social demands. Although there could bedisagreement on the dimension of the fiscal adjustment, even withinthe Concertacion Coalition, there is a strong consensus on the need tomaintain the fiscal rule.
The question remains how ambitious governments in Chile can be insetting a more dramatic adjustment to social conditions, given the
already-strong credentials the Chilean governments has onmacroeconomic stability. The fact that the Chilean government isrunning out of debt, in net terms, is probably one sign that a moreaggressive agenda could be implemented. Should a government in acountry at this stage of economic development be a strong net fiscalcreditor? The answer is probably no. However, other weaknesses, inparticular the still-high dependency on copper, highlights theimportance of very low debt levels to assure stability.
EEccoonnoommiicc PPrroossppeeccttss:: AA GGDDPP PPeerrffoorrmmaanncceeWWiitthh LLeessss VVoollaattiilliittyy
Medium-term growth prospects are favorable, with potential GDP continuing to expand; Macroeconomic stability should be sustained and enhanced by Chile’s ability to use countercyclical fiscal and monetary policies to smooth economic fluctuations; and The medium-term challenge will be to raise productivity and growththrough microeconomic policies, including creating a better-educated workforce.
Chile has been a model of economic reform, leading to a strong fiscalperformance, low inflation, and a sound financial system. Sound andconsistent economic policies have sustained high savings andproductivity growth rates, helping delink Chile’s economic performancefrom the more-volatile trajectory of most of its regional neighbors inrecent years. Chile has raised productivity by building on its base ofagricultural and natural resources, despite its long distance from mostof its export markets (see table 2). Table 2: Chile Economic Indicators Chile has done a better job than most commodity exporting countries inattaining macroeconomic stability despite export price fluctuations,thanks to rules-based fiscal and monetary policies. The combination ofa flexible exchange rate, a credible inflation-targeting monetary policyconducted by an independent central bank, a modest external debtburden, and open trade and capital accounts should sustain bothgrowth and macroeconomic stability in the coming years (see Chart 8).
Top 30 Chilean Companies - April 2007 11
Chart 8
High commodity prices (especially for copper), good world growth, andlow interest rates led to GDP growth rates above 6% in 2004 and 2005.In 2006, however, GDP performance showed signs of deceleration; areal growth rate of 4.2% was expected for the year. Among the reasonsfor the lower growth rate despite increasing copper prices are thepresence of countercyclical policies that tend to attenuate the effect ofcopper prices into economic growth (a sign that is clearly positive fromthe rating perspective), the negative effect of high oil prices and, in themargin, some issues related to the adaptation of economic agents tothe new economic management. GDP is expected to grow by about5.0% in 2007.
More importantly, Chile’s potential GDP growth continues to increase.The team of independent experts that calculates potential GDP growthin Chile has upgraded their estimate to 5.3% for 2007 from 5.0% in2006. This indicator has been going up systematically since 2003(estimated at 4.1% in that year), showing the structural improvement inthe Chilean economy.
The comparatively narrow economic base will still keep Chile’s GDPgrowth subject to volatility from changing terms of trade. Althoughfiscal and monetary flexibility give additional room for countercyclicalpolicies to smooth output fluctuations, the copper cycle will remain animportance influence on growth for years to come.
Despite the strengthened macroeconomic framework, the transitiontoward a growth strategy less dependent on resource exports willcontinue to depend upon improving education levels. Although thecoverage and enrollment level in universities has improved markedly inrecent years, concerns remain about the quality of instruction.
FFiissccaall FFlleexxiibbiilliittyy:: GGrreeaatteerr IInnssttiittuuttiioonnaalliizzaattiioonnAAnndd TTrraannssppaarreennccyy OOnn FFiissccaall PPoolliiccyy Further institutionalization of the fiscal rule will strengthen publicfinances and boost the credibility of fiscal policy; The high price of copper, along with other favorable externaldevelopments, contributed to a fiscal surplus of 7.9% of GDP in 2006and smaller surplus are expected over the next two years; and The government’s debt burden is expected to turn into a net creditorposition in 2007.
TThhee FFiissccaall RReessppoonnssiibbiilliittyy LLaaww AAnndd TThheeRReeddeessiiggnn ooff tthhee CCoouunntteerrccyycclliiccaall FFuunnddssRecent steps to improve fiscal transparency have enhanced thebenefits of adhering to a fiscal rule, which was introduced in 2000 andhas since achieved greater institutionalization. Authorities decided toredesign the countercyclical policy framework in 2006. Until then, thefiscal guideline of reaching a structural surplus of 1% was based upona government rule rather than a law. This has changed with the newlaw passed by Congress. The government is now required by law tocalculate a structural balance. In addition, the Fiscal Responsibility Lawnow sets clear guidelines for the administration of structural surpluses.The previous Copper Stabilization Fund was transformed into twodifferent funds: The Pension Reserve Fund (PRF) and the Economic andSocial Stabilization Fund (ESSF). The PRF will receive between 0.5%
Table 3Chile Fiscal Indicators
—Year ended Dec. 31— (As a % of nominal GDP) 2008f 2007f 2006e 2005 2004 2003 2002 Public sector balance 5.4 6.9 8.5 5.9 3.1 (0.9) (1.6) Central government revenue 24.0 24.3 24.2 24.3 22.1 20.8 21.1 Central government expenditure 20.1 17.9 16.7 19.6 20.0 21.3 22.4 Central government balance 3.9 6.4 7.4 4.8 2.1 (0.4) (1.2) General government revenue 26.3 26.5 26.4 26.6 24.1 22.9 23.3 General government expenditure 22.3 19.9 18.6 21.8 22.0 23.4 24.5 General government balance 4.0 6.7 7.9 4.9 2.1 (0.4) (1.2) General government primary balance 4.5 7.3 8.3 5.7 3.1 0.8 (0.1) General government interest expense 0.6 0.6 0.7 0.9 1.0 1.2 1.2 Gross general government debt 9.2 10.2 12.5 19.5 24.2 28.7 33.1 Net general government debt (7.0) (3.7) 3.0 12.8 20.3 25.3 28.6 Gross public sector debt 11.9 13.6 17.4 25.0 30.1 35.0 39.1 Net public sector debt (5.0) (0.9) 7.3 17.9 25.6 31.2 34.1
(As a % of general government revenue)General government balance 15.1 25.2 29.7 18.3 8.8 (1.8) (5.3) General government interest expense 2.1 2.3 2.6 3.2 4.0 5.0 5.0
e-Estimate. f-Forecast.
12 Top 30 Chilean Companies - April 2007
used to cover future minimum pensions, as established by the proposedpension reform. The new scheme also provides the mechanism for theMinistry of Finance (although it is not obliged to) to capitalize thecentral bank with up to 0.5% of GDP per year over a five-year period.Lastly, resources exceeding an effective fiscal surplus of 1% of GDPwill be transferred to the recently created ESSF. These funds will onlybe available if copper prices fall below the long-term price of copperestimated by the committee of experts. By year-end 2006, PRF andESSF were expected to have accumulated US$600 million and US$ 6.6billion, respectively. Most of these assets are deposited outside Chile,a policy directed toward contributing to the stabilization of theexchange rate in Chile.
As mentioned above, even though the target of the structural surpluscalculation could vary in the future (its level is not determined by law),as some of the problems that justify the 1% are addressed (such as thepension or central bank issues), the strong commitment to a rule-basedfiscal policy is expected to remain.
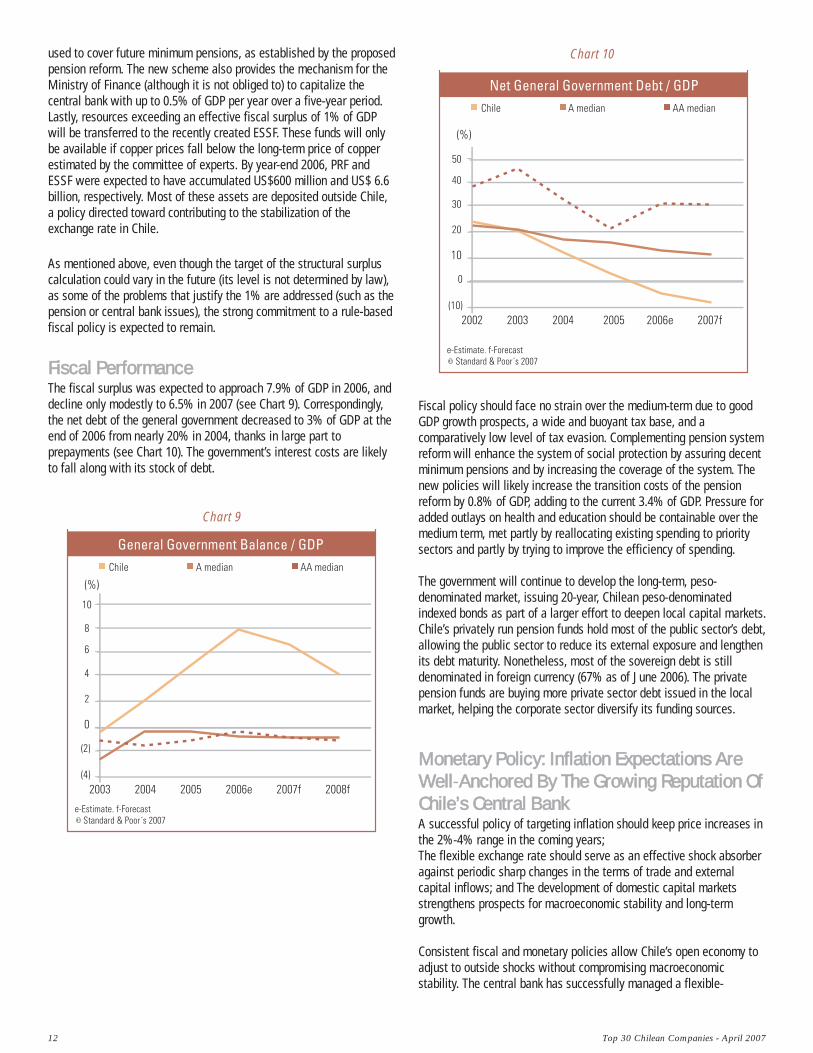
FFiissccaall PPeerrffoorrmmaanncceeThe fiscal surplus was expected to approach 7.9% of GDP in 2006, anddecline only modestly to 6.5% in 2007 (see Chart 9). Correspondingly,the net debt of the general government decreased to 3% of GDP at theend of 2006 from nearly 20% in 2004, thanks in large part toprepayments (see Chart 10). The government’s interest costs are likelyto fall along with its stock of debt.
Chart 9
Chart 10
Fiscal policy should face no strain over the medium-term due to goodGDP growth prospects, a wide and buoyant tax base, and acomparatively low level of tax evasion. Complementing pension systemreform will enhance the system of social protection by assuring decentminimum pensions and by increasing the coverage of the system. Thenew policies will likely increase the transition costs of the pensionreform by 0.8% of GDP, adding to the current 3.4% of GDP. Pressure foradded outlays on health and education should be containable over themedium term, met partly by reallocating existing spending to prioritysectors and partly by trying to improve the efficiency of spending.
The government will continue to develop the long-term, peso-denominated market, issuing 20-year, Chilean peso-denominatedindexed bonds as part of a larger effort to deepen local capital markets.Chile’s privately run pension funds hold most of the public sector’s debt,allowing the public sector to reduce its external exposure and lengthenits debt maturity. Nonetheless, most of the sovereign debt is stilldenominated in foreign currency (67% as of June 2006). The privatepension funds are buying more private sector debt issued in the localmarket, helping the corporate sector diversify its funding sources.
MMoonneettaarryy PPoolliiccyy:: IInnffllaattiioonn EExxppeeccttaattiioonnss AArreeWWeellll-AAnncchhoorreedd BByy TThhee GGrroowwiinngg RReeppuuttaattiioonn OOffCChhiillee’’ss CCeennttrraall BBaannkk A successful policy of targeting inflation should keep price increases inthe 2%-4% range in the coming years; The flexible exchange rate should serve as an effective shock absorberagainst periodic sharp changes in the terms of trade and externalcapital inflows; and The development of domestic capital marketsstrengthens prospects for macroeconomic stability and long-termgrowth.
Consistent fiscal and monetary policies allow Chile’s open economy toadjust to outside shocks without compromising macroeconomicstability. The central bank has successfully managed a flexible-
Top 30 Chilean Companies - April 2007 13
exchange-rate and inflation-targeting policy. The authorities wereable to adopt a countercyclical monetary stance in recent yearswithout jeopardizing inflation targets.
The credibility of the central bank helps dampen the level of pass-through from recent exchange rate changes. Inflation has been justabout 3% over the past four years, and its volatility declined whilethe currency has been floating. High oil prices and rising powertariffs contributed to inflationary pressure in 2005 and 2006. Thisled the central bank to withdraw monetary stimulus beginning inSeptember 2004, raising its overnight policy rate to containdemand. However, deceleration in economic activity in mid 2006interrupted the pace of interest rates hikes in August 2006, leavingthe reference interest rate at 5.25% as of December 2006.
The central bank has become more transparent in its operationsand has not intervened in the foreign exchange market in recentyears, allowing the market to set the exchange rate. Politicalpressure from exporters to staunch the recent appreciation of thecurrency against the U.S. dollar has not resulted in any officialintervention in the foreign exchange market.
The bank often runs a quasi-fiscal deficit, partly due to the legacyof commercial bank bailouts nearly two decades ago. Itspreponderance of assets is in dollars, but liabilities in pesos,renders its net worth vulnerable to exchange-rate changes. Thegovernment is currently addressing this weakness by anticipatingsome debt payments to the monetary authority and capitalizing thecentral bank. Such steps would improve the bank’s balance sheet,bringing it into line with central banks in other highly ratedsovereigns.
The Chilean banking system remains strong thanks to a soundregulatory framework and the country’s reduced economicvolatility. The positive economic environment resulted in thebanking system’s continued growth during 2006, maintainingstrong asset quality indicators and adequate capitalization levels.Asset quality indicators were reduced to unprecedented levels,with the nonperforming loans-to-total-loans ratio at 0.8% as of
Sept. 30, 2006. Despite the system’s assets growth, capitalizationremained adequate at 12.8%. Although profitability margins have beenunder pressure given increasing competition (with a return on averageassets at 1.37% during the last 12 months, as of Sept. 30, 2006), bankshave been able to gradually improve profitability thanks to increasingparticipation in higher-yielding segments and better operatingefficiencies. In the short to medium term, Standard & Poor’s expectsthe Chilean financial system to continue to benefit from the country’spositive economic and social perspectives.
The country’s long-term debt markets are growing, with theintroduction recently of 30-year mortgages. The government’s issuanceof new 10-, five-, and two-year indexed peso debt in 2006 will continueto allow it to gradually replace dollar-denominated sovereign debt wasissued to the central bank to provide support during an earlier bankingcrisis. The step will strengthen the local yield curve and graduallyreduce the currency mismatch that affects the central bank’s balancesheet.
EExxtteerrnnaall FFiinnaanncceess:: FFaavvoorraabbllee EExxtteerrnnaallCCoonnddiittiioonnss HHaavvee RReessuulltteedd IInn AA MMaajjoorrAAddjjuussttmmeenntt A flexible exchange rate, investor confidence, and an open tradingregime augur well for external flexibility; The current account balance is likely to remain in a surplus in 2007 and2008, thanks to booming export revenue; and Chile’s gross external debt burden is likely to remain stable or declinemodestly (at best) in coming years, but external assets should rise as itincreasingly integrates with international financial markets.
As a small, open economy, Chile is more prone to volatility in the faceof exogenous shocks than most member countries of the Organizationfor Economic Co-operation and Development. However, the country’sability to absorb the impact of external shock is likely to strengthenover time thanks to monetary flexibility, a rules-based fiscal policy, andcapital market development.
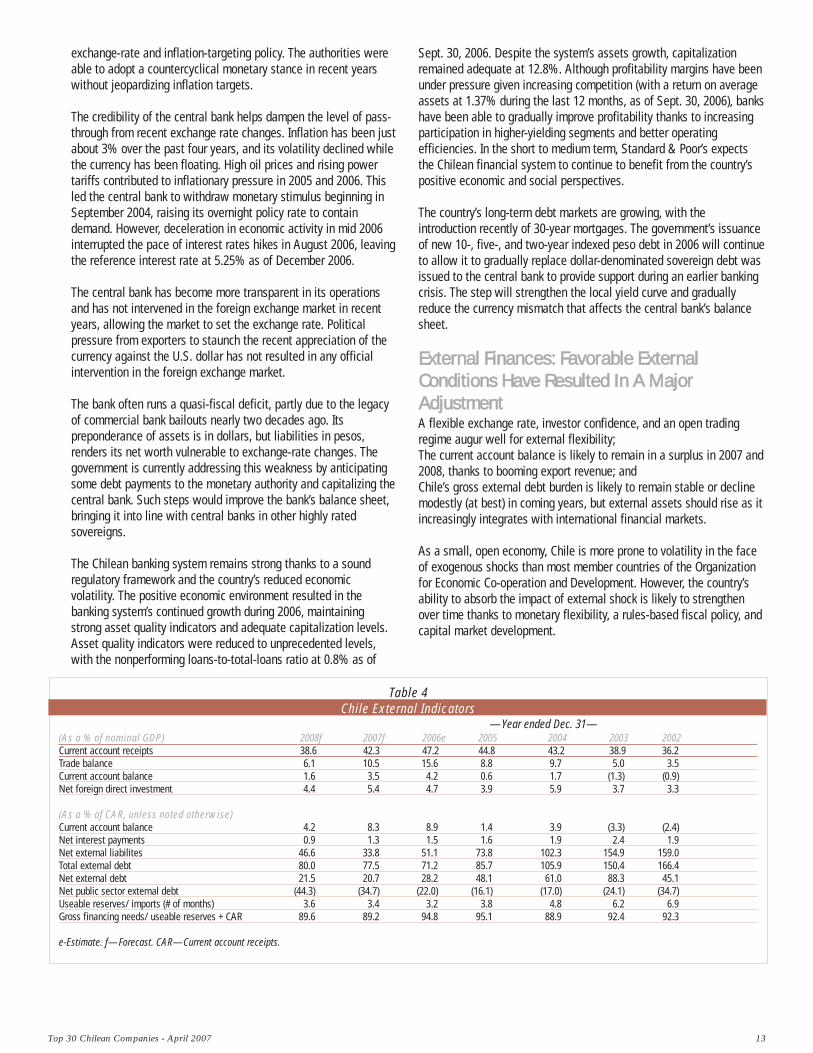
Table 4Chile External Indicators
—Year ended Dec. 31— (As a % of nominal GDP) 2008f 2007f 2006e 2005 2004 2003 2002 Current account receipts 38.6 42.3 47.2 44.8 43.2 38.9 36.2 Trade balance 6.1 10.5 15.6 8.8 9.7 5.0 3.5 Current account balance 1.6 3.5 4.2 0.6 1.7 (1.3) (0.9) Net foreign direct investment 4.4 5.4 4.7 3.9 5.9 3.7 3.3
(As a % of CAR, unless noted otherwise)Current account balance 4.2 8.3 8.9 1.4 3.9 (3.3) (2.4) Net interest payments 0.9 1.3 1.5 1.6 1.9 2.4 1.9 Net external liabilites 46.6 33.8 51.1 73.8 102.3 154.9 159.0 Total external debt 80.0 77.5 71.2 85.7 105.9 150.4 166.4 Net external debt 21.5 20.7 28.2 48.1 61.0 88.3 45.1 Net public sector external debt (44.3) (34.7) (22.0) (16.1) (17.0) (24.1) (34.7) Useable reserves/ imports (# of months) 3.6 3.4 3.2 3.8 4.8 6.2 6.9 Gross financing needs/ useable reserves + CAR 89.6 89.2 94.8 95.1 88.9 92.4 92.3
e-Estimate. f—Forecast. CAR—Current account receipts.

14 Top 30 Chilean Companies - April 2007
After several years of deficits, Chile’s current account balance swungsharply into a 1.7% of GDP surplus thanks to a more than 20%improvement in the country’s terms of trade in 2004. The 2005 currentaccount surplus declined to a 0.6% of GDP due to rising imports of oiland capital goods. The rise in the price of copper (which constitutedabout 50% of total exports in 2005 and 2006) outweighs the negativeimpact of higher oil prices on Chile’s external balance and led to astrong current account surplus in 2006, estimated in 4.2% of GDP.Manufactured and other noncommodity exports are also growing welldespite the nominal appreciation of the peso, auguring well for long-term export prospects when copper prices fall.
Chile is likely to enjoy a declining, but still substantial, trade surplus(about 5% of GDP) in the coming years, as copper prices return to moremoderate levels in 2008 and beyond.
About two-thirds of Chile’s exports now enter external markets undersome form of preferential access, and the country’s own effective tariffrate is about 3%. Chile has free-trade agreements with the U.S. andthe European Union, as well as with many countries in the WesternHemisphere and Asia. Growing commodity demand in Asia, especiallyin China, is shifting the direction of Chilean trade, making itincreasingly a Pacific-oriented economy.
Fiscal surpluses and current account surpluses have reduced thecountry’s external debt burden, with the government prepaying some ofits external debt. Total external debt is likely to reach 70% of CAR in2006, compared with 166% in 2002. The central government is likely toremain a net external creditor over the coming years, while the bankingand corporate sectors continue to reduce their net external debtorposition—supported by favorable external conditions, among otherthings.
The risk posed to the sovereign from nonsovereign external debt islikely less than indicated by the numbers alone. For example, more thanone-half of the nonbank private sector’s external debt is owed byforeign enterprises located in Chile, and about 15% of that is owed toparents or related companies abroad, giving it the quality of foreigndirect investment (FDI). More than half of Chile’s external debt is atfixed interest rates, reducing the shock of an eventual rise in globalinterest rates. Furthermore, the growing use of currency forwardsfurther reduces the risk of exchange-rate changes for nonbank privatesector external debt.
Chile’s external assets and liabilities have been growing more thantwice as fast as GDP in recent years as the country integrates withinternational capital markets, complementing its growing trade links.External assets are likely to increase due to growing investmentoverseas by private sector pension funds, which can invest up to 30%of their money abroad, as well as due to outward FDI.
(For additional ratings history, see “Sovereign Ratings HistorySince 1975,” available on RatingsDirect.)
Ratings Detail (As Of 09-Feb-2007)*
Chile (Republic of)
Sovereign Credit RatingForeign Currency A/Positive/A-1Local Currency AA/Stable/A-1+
Senior UnsecuredForeign Currency ALocal Currency AA
Short-Term DebtLocal Currency A-1+
Sovereign Credit Ratings History14-Dec-2006 Foreign Currency A/Positive/A-114-Jan-2004 A/Stable/A-116-Apr-2002 A-/Positive/A-107-Aug-1997 Local Currency AA/Stable/A-1+
30-Nov-1992 AA/Stable/--
Default HistoryForeign currency bank debt, 1983-1990
Population 16.4 million Per Capita GDP US$9,000
Current GovernmentPresidential government headed by Michelle Bachelet of the Concertacion coalition.
Election SchedulePresidential Last: December 2005 Next: December 2009
*Unless otherwise noted, all ratings in this report are global scale ratings. Standard &Poor's credit ratings on the global scale are comparable across countries. Standard &Poor's credit ratings on a national scale are relative to obligors or obligations withinthat specific country.
Top 30 Chilean Companies - April 2007 15
Two major subjects seem to dominate the economic debate on theRepublic of Chile (A/Positive/A-1 foreign currency sovereign creditratings). First, economic growth was lower than expected in 2006, withGDP growth reaching 4.2%. Second, a strong fiscal performance basedupon a structural fiscal surplus rule, with the general governmentsurplus reaching 7.9% of GDP in 2006, is transforming the Chileangovernment into a net fiscal creditor (government assets exceedingfinancial liabilities).
This commentary examines these two issues from a ratingsperspective, and highlights their respective relevance in the context ofthe positive outlook Standard & Poor’s Ratings Services assigned toChile’s foreign current rating on Dec. 14, 2006.
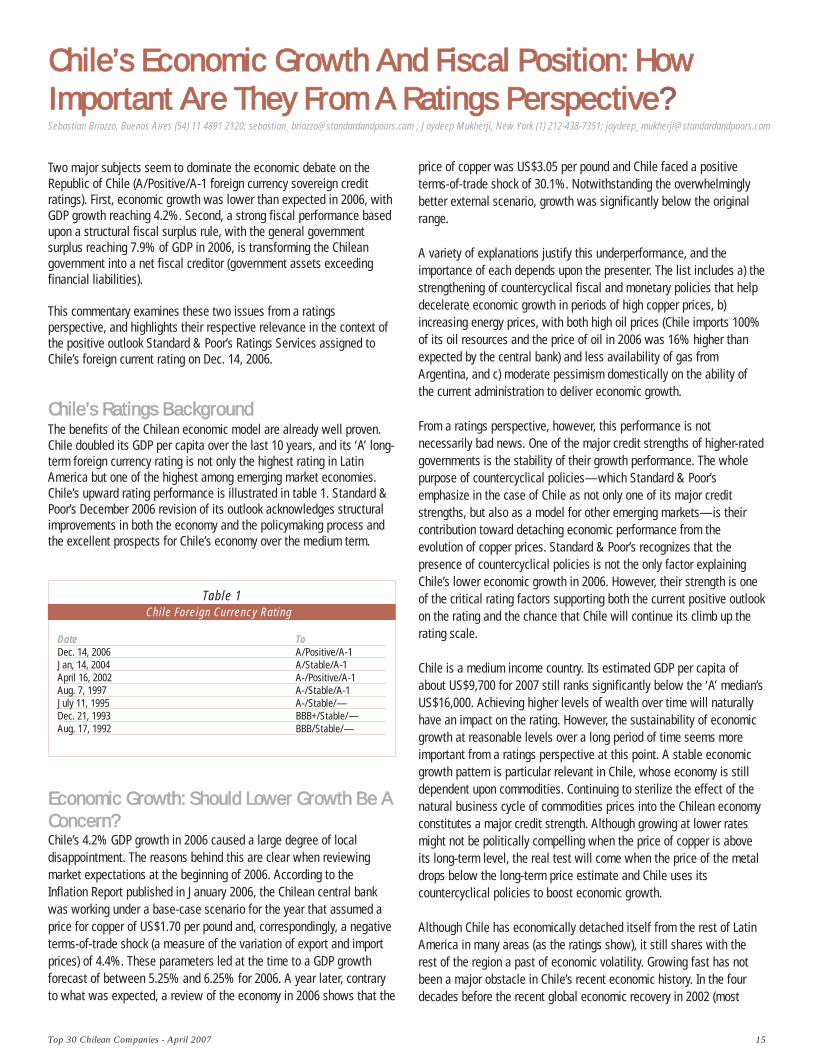
CChhiillee’’ss RRaattiinnggss BBaacckkggrroouunndd The benefits of the Chilean economic model are already well proven.Chile doubled its GDP per capita over the last 10 years, and its ‘A’ long-term foreign currency rating is not only the highest rating in LatinAmerica but one of the highest among emerging market economies.Chile’s upward rating performance is illustrated in table 1. Standard &Poor’s December 2006 revision of its outlook acknowledges structuralimprovements in both the economy and the policymaking process andthe excellent prospects for Chile’s economy over the medium term.
EEccoonnoommiicc GGrroowwtthh:: SShhoouulldd LLoowweerr GGrroowwtthh BBee AACCoonncceerrnn?? Chile’s 4.2% GDP growth in 2006 caused a large degree of localdisappointment. The reasons behind this are clear when reviewingmarket expectations at the beginning of 2006. According to theInflation Report published in January 2006, the Chilean central bankwas working under a base-case scenario for the year that assumed aprice for copper of US$1.70 per pound and, correspondingly, a negativeterms-of-trade shock (a measure of the variation of export and importprices) of 4.4%. These parameters led at the time to a GDP growthforecast of between 5.25% and 6.25% for 2006. A year later, contraryto what was expected, a review of the economy in 2006 shows that the
price of copper was US$3.05 per pound and Chile faced a positiveterms-of-trade shock of 30.1%. Notwithstanding the overwhelminglybetter external scenario, growth was significantly below the originalrange.
A variety of explanations justify this underperformance, and theimportance of each depends upon the presenter. The list includes a) thestrengthening of countercyclical fiscal and monetary policies that helpdecelerate economic growth in periods of high copper prices, b)increasing energy prices, with both high oil prices (Chile imports 100%of its oil resources and the price of oil in 2006 was 16% higher thanexpected by the central bank) and less availability of gas fromArgentina, and c) moderate pessimism domestically on the ability ofthe current administration to deliver economic growth.
From a ratings perspective, however, this performance is notnecessarily bad news. One of the major credit strengths of higher-ratedgovernments is the stability of their growth performance. The wholepurpose of countercyclical policies—which Standard & Poor’semphasize in the case of Chile as not only one of its major creditstrengths, but also as a model for other emerging markets—is theircontribution toward detaching economic performance from theevolution of copper prices. Standard & Poor’s recognizes that thepresence of countercyclical policies is not the only factor explainingChile’s lower economic growth in 2006. However, their strength is oneof the critical rating factors supporting both the current positive outlookon the rating and the chance that Chile will continue its climb up therating scale.
Chile is a medium income country. Its estimated GDP per capita ofabout US$9,700 for 2007 still ranks significantly below the ‘A’ median’sUS$16,000. Achieving higher levels of wealth over time will naturallyhave an impact on the rating. However, the sustainability of economicgrowth at reasonable levels over a long period of time seems moreimportant from a ratings perspective at this point. A stable economicgrowth pattern is particular relevant in Chile, whose economy is stilldependent upon commodities. Continuing to sterilize the effect of thenatural business cycle of commodities prices into the Chilean economyconstitutes a major credit strength. Although growing at lower ratesmight not be politically compelling when the price of copper is aboveits long-term level, the real test will come when the price of the metaldrops below the long-term price estimate and Chile uses itscountercyclical policies to boost economic growth.
Although Chile has economically detached itself from the rest of LatinAmerica in many areas (as the ratings show), it still shares with therest of the region a past of economic volatility. Growing fast has notbeen a major obstacle in Chile’s recent economic history. In the fourdecades before the recent global economic recovery in 2002 (most
Chile’s EEconomic GGrowth AAnd FFiscal PPosition: HHowImportant AAre TThey FFrom AA RRatings PPerspective?
Table 1Chile Foreign Currency Rating
Date To Dec. 14, 2006 A/Positive/A-1Jan, 14, 2004 A/Stable/A-1April 16, 2002 A-/Positive/A-1Aug. 7, 1997 A-/Stable/A-1July 11, 1995 A-/Stable/—Dec. 21, 1993 BBB+/Stable/—Aug. 17, 1992 BBB/Stable/—
Sebastian Briozzo, Buenos Aires (54) 11 4891 2120; [email protected] ; Joydeep Mukherji, New York (1) 212-438-7351; [email protected]
16 Top 30 Chilean Companies - April 2007
AA SSttrroonngg FFiissccaall PPoossiittiioonn IIss DDeeffiinniitteellyy AA RRoobbuussttRRaattiinnggss FFaaccttoorr.. WWhhaatt AAbboouutt NNeeggaattiivvee DDeebbttNNuummbbeerrss?? Another area of debate is how strong the fiscal anchor must be in orderto anchor macroeconomic stability. Since 2001, the government hasused a 1% of GDP structural budget surplus rule. The governmentcalculates fiscal balances based upon permanent revenue, estimatingan output gap and a reference copper price based upon input fromindependent experts. The method allows the government to runcountercyclical fiscal policy, with the budget deficit during years ofbelow-average growth constrained to a level consistent with a 1% ofGDP surplus adjusted for the business cycle. As mentioned above,Standard & Poor’s has been praising Chile’s structural fiscal balancerule for some time. This rule is particularly important for a governmentwhose revenue naturally experiences a large degree of volatility. In thesame context, maintaining low government debt levels constitutes thefirst countercyclical policy by definition, since governments with highratings and good credentials in the capital market—as is the case forChile—could tap capital markets at the downward part of the cycle inorder to smooth out its effect into economic activity.
However, a different question is what the limit to that policy should be.Should a country at Chile’s stage of economic development havenegative debt numbers? The question is appropriately today not onlybecause net general government debt is expected to turn negative in2007, but also because the strength of public finances going forward isexpected to continue to substantially increase the government’s netasset position (see chart 1).
precisely, between 1960 and 2002), Chile recorded the second-fastestaverage annual per capita growth rate in Latin America: 2.5%, onlybelow the Dominican Republic (3.5%) and significantly above theaverage for the region (1.6%). However, when focusing on the volatilityof this economic growth instead of its average level, Chile shows asimilar pattern to that of the rest of the region. During the four decadesdescribed above, there were nine years (22% of the period) in whichthe Chilean economy grew at negative rates in per capita terms. This isnot too different from the average for the region: 11 years of negativeper capita growth.(1) Therefore, deepening economic stability andavoiding major macroeconomic crises are Chile’s most valuableeconomic achievements in recent times.
Consequently, what is reassuring in the case of Chile, and constitutesanother factor supporting the positive outlook, is that its economycontinues to show signs of structural improvements. This is seen in theseries of upgrades to Chile’s potential economic growth rate. The teamof independent experts that calculates potential GDP growth in Chilerecently raised their estimate to 5.3% for 2007 from 5.0% in 2006.More importantly, this indicator has been revised upwardsystematically since 2003 (estimated at 4.1% that year), reflecting thestructural improvement in the Chilean economy. In this regard, thecurrent administration has put forward an active and comprehensivereform agenda that reaches from macroeconomic issues, such as thestrengthening of countercyclical policies, to microeconomic issues, suchas complementary pension reform and other modifications aimed atboosting Chile’s competitiveness.
Top 30 Chilean Companies - April 2007 17
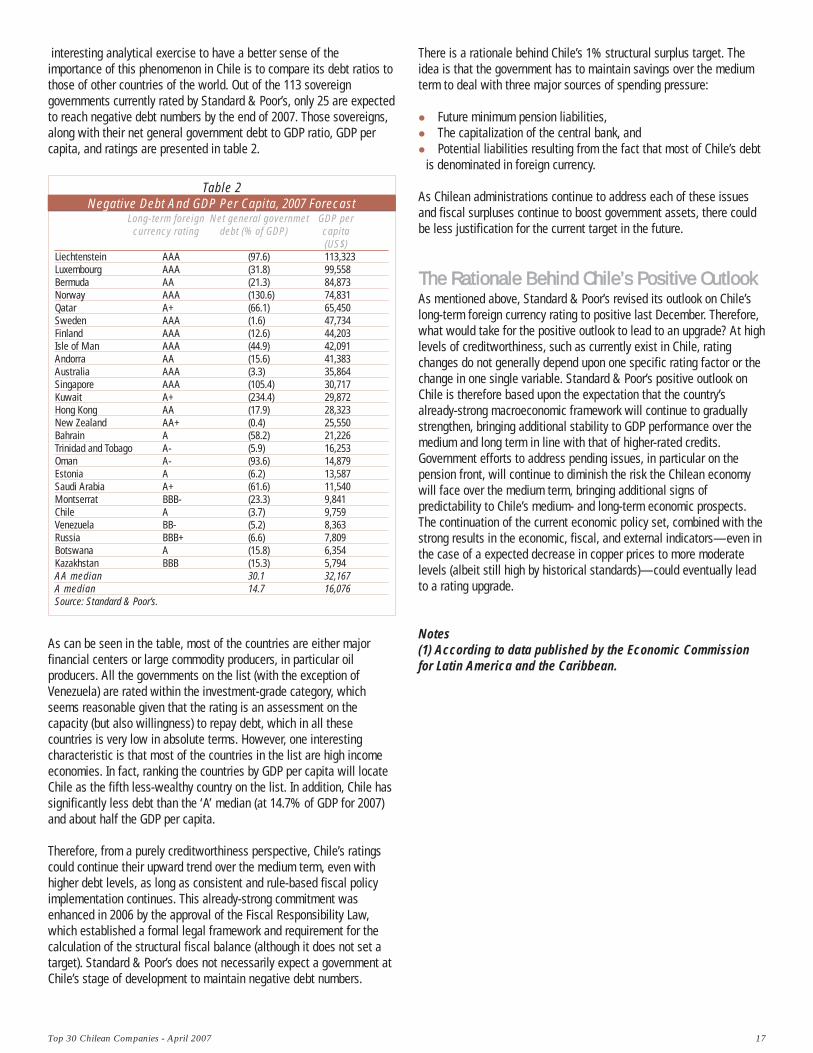
interesting analytical exercise to have a better sense of theimportance of this phenomenon in Chile is to compare its debt ratios tothose of other countries of the world. Out of the 113 sovereigngovernments currently rated by Standard & Poor’s, only 25 are expectedto reach negative debt numbers by the end of 2007. Those sovereigns,along with their net general government debt to GDP ratio, GDP percapita, and ratings are presented in table 2.
As can be seen in the table, most of the countries are either majorfinancial centers or large commodity producers, in particular oilproducers. All the governments on the list (with the exception ofVenezuela) are rated within the investment-grade category, whichseems reasonable given that the rating is an assessment on thecapacity (but also willingness) to repay debt, which in all thesecountries is very low in absolute terms. However, one interestingcharacteristic is that most of the countries in the list are high incomeeconomies. In fact, ranking the countries by GDP per capita will locateChile as the fifth less-wealthy country on the list. In addition, Chile hassignificantly less debt than the ‘A’ median (at 14.7% of GDP for 2007)and about half the GDP per capita.
Therefore, from a purely creditworthiness perspective, Chile’s ratingscould continue their upward trend over the medium term, even withhigher debt levels, as long as consistent and rule-based fiscal policyimplementation continues. This already-strong commitment wasenhanced in 2006 by the approval of the Fiscal Responsibility Law,which established a formal legal framework and requirement for thecalculation of the structural fiscal balance (although it does not set atarget). Standard & Poor’s does not necessarily expect a government atChile’s stage of development to maintain negative debt numbers.
There is a rationale behind Chile’s 1% structural surplus target. Theidea is that the government has to maintain savings over the mediumterm to deal with three major sources of spending pressure:
Future minimum pension liabilities, The capitalization of the central bank, and Potential liabilities resulting from the fact that most of Chile’s debt
is denominated in foreign currency.
As Chilean administrations continue to address each of these issuesand fiscal surpluses continue to boost government assets, there couldbe less justification for the current target in the future.
TThhee RRaattiioonnaallee BBeehhiinndd CChhiillee’’ss PPoossiittiivvee OOuuttllooookk As mentioned above, Standard & Poor’s revised its outlook on Chile’slong-term foreign currency rating to positive last December. Therefore,what would take for the positive outlook to lead to an upgrade? At highlevels of creditworthiness, such as currently exist in Chile, ratingchanges do not generally depend upon one specific rating factor or thechange in one single variable. Standard & Poor’s positive outlook onChile is therefore based upon the expectation that the country’salready-strong macroeconomic framework will continue to graduallystrengthen, bringing additional stability to GDP performance over themedium and long term in line with that of higher-rated credits.Government efforts to address pending issues, in particular on thepension front, will continue to diminish the risk the Chilean economywill face over the medium term, bringing additional signs ofpredictability to Chile’s medium- and long-term economic prospects.The continuation of the current economic policy set, combined with thestrong results in the economic, fiscal, and external indicators—even inthe case of a expected decrease in copper prices to more moderatelevels (albeit still high by historical standards)—could eventually leadto a rating upgrade.
Notes (1) According to data published by the Economic Commissionfor Latin America and the Caribbean.
Table 2Negative Debt And GDP Per Capita, 2007 Forecast
Long-term foreign Net general governmet GDP per currency rating debt (% of GDP) capita
(US$) Liechtenstein AAA (97.6) 113,323 Luxembourg AAA (31.8) 99,558 Bermuda AA (21.3) 84,873 Norway AAA (130.6) 74,831 Qatar A+ (66.1) 65,450 Sweden AAA (1.6) 47,734 Finland AAA (12.6) 44,203 Isle of Man AAA (44.9) 42,091 Andorra AA (15.6) 41,383 Australia AAA (3.3) 35,864 Singapore AAA (105.4) 30,717 Kuwait A+ (234.4) 29,872 Hong Kong AA (17.9) 28,323 New Zealand AA+ (0.4) 25,550 Bahrain A (58.2) 21,226 Trinidad and Tobago A- (5.9) 16,253 Oman A- (93.6) 14,879 Estonia A (6.2) 13,587 Saudi Arabia A+ (61.6) 11,540 Montserrat BBB- (23.3) 9,841 Chile A (3.7) 9,759 Venezuela BB- (5.2) 8,363 Russia BBB+ (6.6) 7,809 Botswana A (15.8) 6,354 Kazakhstan BBB (15.3) 5,794 AA median 30.1 32,167 A median 14.7 16,076 Source: Standard & Poor’s.
18 Top 30 Chilean Companies - April 2007
2007’s TTop 55 CCredit FFactors FFor CCorporate CCredit QQualityIn CChile
Chile’s solid economic performance, stable indicators, and reliableinstitutional framework have shaped the country’s corporate sectorduring the past decade. The fate of most major corporations is tied tothe changes in the global economy, especially the evolution ofcommodities in general and copper, in particular. Nevertheless, prudentfinancial policies and cash management as well as good access tocredit have allowed most players to grow and withstand externalshocks, while maintaining their strong creditworthiness through thecycle.
These characteristics are, of course, reflected in the rating profile ofChilean corporations. Of the 32 corporates in Chile that Standard &Poor’s Ratings Services rates, 84% are rated at the investment-gradelevel (‘BBB-’ and above) and 89% have stable outlooks. This indicatesour expectations that these entities will continue to maintain credithealth, even under softening GDP growth and commodity prices.
WWhhaatt ffaaccttoorrss wwiillll bbee mmoorree rreelleevvaanntt ffoorr ccrreeddiittqquuaalliittyy iinn 22000077?? Strong commodity pricesCommodity prices are key determinants of financial performance for alarge part of Chile’s corporate sector (mainly copper and forestproducts). While the pricing environment could become less favorablein 2007, we expect prices to remain above historical averages,sustaining the good performance of companies such as Codelco,Escondida, Arauco, and CMPC. Copper prices will probably weaken tolevels closer to an average of $2.30 per pound in 2007 (after $3.05 perpound in 2006), allowing copper producers to continue generatingsignificant amounts of operating cash flow, but also to pursueaggressive expansion plans that should consume a large portion ofcash generation. In the forest product segment, we expect animprovement in credit metrics as large investments from the the pasttwo years start generating cash in a continually rising priceenvironment. Pulp and paper companies should continue benefitingfrom rising margins, stemming from production cost advantages; thefirm, worldwide demand for pulp; and the more regional demand forpaper products. Furthermore, international pulp and paper prices arelikely to remain high due to capacity closures in North America.
Sustained (albeit lower than anticipated) economicgrowth and macroeconomic stabilityGDP grew about 4.2% in 2006. This level of growth was disappointingfor many market participants when compared to the initial consensusforecast of 5%-6% for 2006. Nevertheless, consumption grew to morethan 7%, while inflation remained under control, which is a beneficialcombination for companies targeting the domestic market. The telecomand bottler sectors benefited from positive consumption fundamentals,with growth rates that, in many cases, significantly exceeded GDPrates. The mobile phone sector grew by about 20% in 2006, (compared
Marta Castelli, Buenos Aires (54) 114-891-2128; [email protected]
to 2005) reaching about 80% penetration. In addition, beer volumesales increased by about 15% in 2006 (compared to 2005). Sales in thejuice, purified water and, functional drinks segment also increased.While we usually use conservative growth estimates for long-termprojections, we expect the corporate sector to continue enjoying astrong domestic demand in 2007 and probably 2008.
Increasing energy costsTwo elements have deeply affected energy costs in Chile in the pastthree years: the reduction in exports of natural gas from Argentina andthe spike in oil prices. While the increase in oil prices may causetemporary disruptions, increasing natural gas shortages have required astructural change in Chile’s energy policies geared to ensure thereliability of power supply. On the positive side, the governmentreacted quickly, and modified the regulatory framework to recognize thenew cost of power generation and to encourage sizable investments inboth hydro and coal power plants, which should lead to the growth anddiversification of the country’s generation capacity. On the other hand,the resulting increase in reliability was accompanied by an increase inenergy costs, compounded, in the past two years, by the prevalent highprices for crude oil. As energy is such a basic input, the increase inprices has impacted margins throughout the economy and temperedprofitability increases.
A strong Chilean PesoGiven the relatively small domestic market and Chile’s comparativeadvantage in the production of commodities, including copper andforest products, the performance of the external sector is a key elementfor corporate credit quality. More specifically, the appreciation ordevaluation of the peso directly affects operating margins and debtservice requirements, especially when there is a currency mismatchbetween costs and revenues. In this regard, the strong revaluation ofthe Chilean peso (CHP) against the U.S. dollar during the past fouryears (CHP534.43/$1 at the close of 2006 vs. CHP712.38/$1 at the endof 2002) has affected the cost structure of several companies,benefiting some and hurting others. While the revaluation against thedollar raises questions on the potential loss of competition amongChilean exports, the effect is not so clear when analyzing the realeffective exchange rate, which incorporates the variation of the peso inreal terms, versus the currencies of the countries with which Chiletrades. We expect the peso to remain strong in 2007; however, thefactor’s final effect will vary significantly from corporate to corporate.
Refinancing riskIn general, refinancing risk is not a significant concern for rated Chileancorporates in the short to medium term. Many of the largest entitiesrefinance maturities well in advance as a matter of policy. We expectthat trend to continue, especially considering the current liquidity of theworld’s capital markets. These factors, as well as other industry and company specific risks, will
Top 30 Chilean Companies - April 2007 19
have a different impact on specific credits. Other factors to monitorinclude capital expenditures (capex), maturity of past investments,regulations, dividends, and the like. For the mining sector, capex willremain a relevant variable since we expect high prices to continue tofoster expansion capacity. In the pulp and paper sector, we will monitorthe companies’ ability increase free cash flow and to deleverage. Fortelecom companies, we will pay close attention to the evolution ofoverall competition, regulations, and substitution effects in the fixedsegment, while competitive and margin pressures will be key forbottlers.
20 Top 30 Chilean Companies - April 2007
Chilean BBanks LLook TTo IImprove OOn 22006 PPerformanceIn 22007
The extent of a country’s economic development goes hand in handwith the depth of its financial system. This is particularly true in thecase of Chile. Although extremely favorable macroeconomic conditionsacross Latin America have been accompanied by positive performancein most Latin American financial systems, the underlying strength ofthe Chilean system remains unparalleled throughout the region.
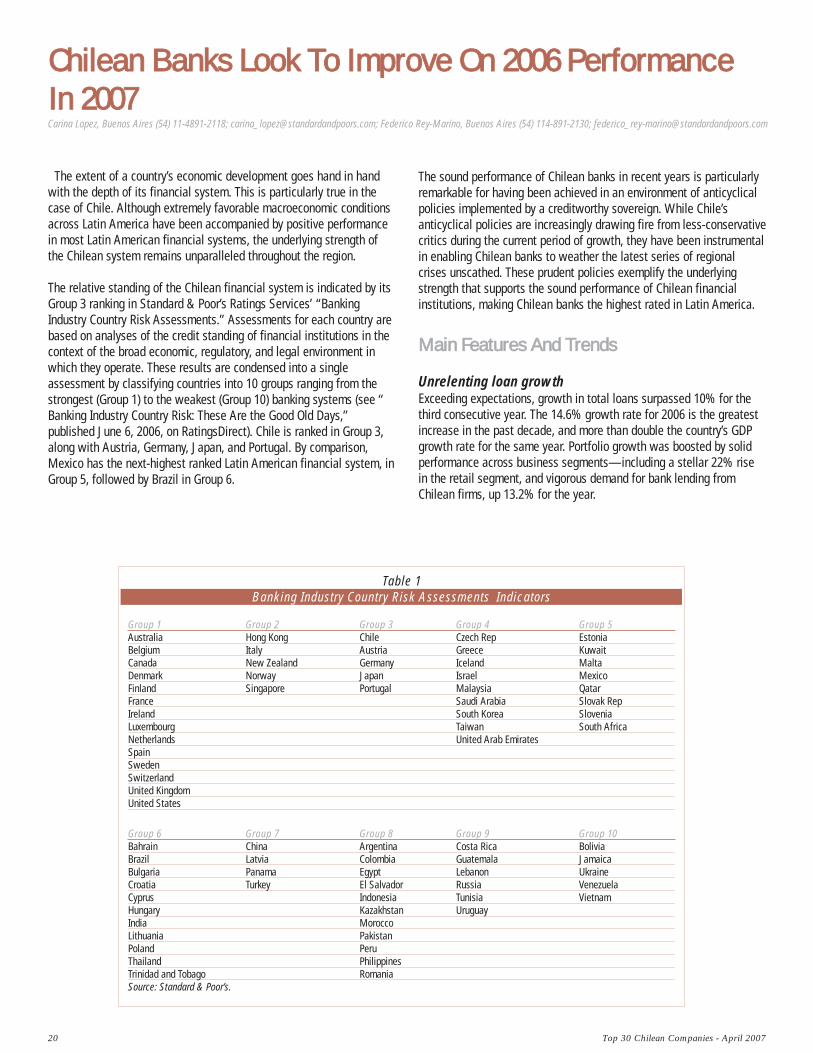
The relative standing of the Chilean financial system is indicated by itsGroup 3 ranking in Standard & Poor’s Ratings Services’ “BankingIndustry Country Risk Assessments.” Assessments for each country arebased on analyses of the credit standing of financial institutions in thecontext of the broad economic, regulatory, and legal environment inwhich they operate. These results are condensed into a singleassessment by classifying countries into 10 groups ranging from thestrongest (Group 1) to the weakest (Group 10) banking systems (see “Banking Industry Country Risk: These Are the Good Old Days,”published June 6, 2006, on RatingsDirect). Chile is ranked in Group 3,along with Austria, Germany, Japan, and Portugal. By comparison,Mexico has the next-highest ranked Latin American financial system, inGroup 5, followed by Brazil in Group 6.
The sound performance of Chilean banks in recent years is particularlyremarkable for having been achieved in an environment of anticyclicalpolicies implemented by a creditworthy sovereign. While Chile’santicyclical policies are increasingly drawing fire from less-conservativecritics during the current period of growth, they have been instrumentalin enabling Chilean banks to weather the latest series of regionalcrises unscathed. These prudent policies exemplify the underlyingstrength that supports the sound performance of Chilean financialinstitutions, making Chilean banks the highest rated in Latin America.
MMaaiinn FFeeaattuurreess AAnndd TTrreennddss
Unrelenting loan growthExceeding expectations, growth in total loans surpassed 10% for thethird consecutive year. The 14.6% growth rate for 2006 is the greatestincrease in the past decade, and more than double the country’s GDPgrowth rate for the same year. Portfolio growth was boosted by solidperformance across business segments—including a stellar 22% risein the retail segment, and vigorous demand for bank lending fromChilean firms, up 13.2% for the year.
Table 1Banking Industry Country Risk Assessments Indicators
Group 1 Group 2 Group 3 Group 4 Group 5 Australia Hong Kong Chile Czech Rep Estonia Belgium Italy Austria Greece Kuwait Canada New Zealand Germany Iceland Malta Denmark Norway Japan Israel Mexico Finland Singapore Portugal Malaysia Qatar France Saudi Arabia Slovak Rep Ireland South Korea Slovenia Luxembourg Taiwan South Africa Netherlands United Arab Emirates Spain Sweden Switzerland United Kingdom United States
Group 6 Group 7 Group 8 Group 9 Group 10 Bahrain China Argentina Costa Rica Bolivia Brazil Latvia Colombia Guatemala Jamaica Bulgaria Panama Egypt Lebanon Ukraine Croatia Turkey El Salvador Russia Venezuela Cyprus Indonesia Tunisia Vietnam Hungary Kazakhstan Uruguay India Morocco Lithuania Pakistan Poland Peru Thailand Philippines Trinidad and Tobago Romania Source: Standard & Poor’s.
Carina Lopez, Buenos Aires (54) 11-4891-2118; [email protected]; Federico Rey-Marino, Buenos Aires (54) 114-891-2130; [email protected]
Top 30 Chilean Companies - April 2007 21
Growth in lending to companies is especially good news given thetrend toward disintermediation among large corporations. Increasingly,big companies are tapping local and cross-border capital marketsdirectly, replacing banks as sources of funding. As a result, a higherproportion of the financial system’s loans are funneled to midsize andsmall firms, which tends to reduce the concentration of banks’ creditportfolios. Additionally, growth in this smaller-debtors segment can fuela virtuous cycle—signaling more spillover effects on the real economy,as well as the degree to which midsize companies are funding newinvestments in the positive economic environment.
Despite the significant progress achieved in the middle-market firmssegment, it is only the growth in loans to individuals (consumer andmortgages) that has been systematically outperforming the system’saverage. The intensification of retail lending is explained by theincreasingly strong consumer confidence in the context of benignmacroeconomic conditions and the reduction in the unemployment rate,as well as by the more aggressive stance of Chilean banks, who in thisrespect follow similar strategies to those of most financial systems inLatin America and worldwide. In Chile, however, banks are challengedby fierce competition from nonbanks operating in the consumersegment (retail stores, supermarkets, mutual entities, insurers, and carfinance companies). Nonbanks ended the past decade with a 27%share of total consumer financing available in the economy andincreased their participation to a peak of 35% in 2003. As banksbecame more focused and put their machinery to work on the consumersegment, the nonbank share declined to 32%, stabilizing at that levelsince 2004. Customers were the ultimate winners of this competitionbetween banks and nonbanks, benefiting from lower rates and longertenors.
As in many other countries, the change in the business mix due to thehigher-yielding consumer segment becoming the starring business isallowing financial institutions to maintain and/or increase marginsdespite the low interest rate environment and competitive pressures.Although rapid penetration in any segment should raise concerns for afuture potential deterioration in asset quality, in the case of Chile,household borrowings are still low relative to income (unlike in theU.S., for instance), giving room for significant medium-term expansionat current rates before hurting current healthy fundamentals.Although Chile leads the region in terms of its financial system’s depthand coverage, it still lags the degree of penetration typical of mostdeveloped countries. Total loans to households represent around 20%of GDP, whereas this figure is 75% in Spain. This is another indicationthat Chilean banks’ recent efforts to expand the level of bancarizationin the economy by seeking increased penetration in lower incomesegments are likely to keep succeeding in the medium term. Furtherexpansion of the client base (number of debtors grew 8.5% to 3.96million in 2006) and increased coverage of the banks’ networks (numberof offices and ATMs increased 7% to 7,151 in 2006) will continueplaying key roles in deepening the bancarization in Chile. In 2007,lending to individuals and small and midsize enterprises (SMEs) islikely to remain the main driver of growth.
Asset quality is still good newsThe auspicious economic environment coupled with overallconservative policies has resulted in an improving asset quality trendduring the past years, with nonperforming loans (NPLs) reducing to alow 0.8% of total loans by the end of 2006. Even during the Chileaneconomy’s relative stagnation and the pressure resulting from theregion’s uncertain economic environment (1999-2002), past-due loanfigures deteriorated only mildly and remained at low levels incomparison with the rest of Latin America.
Coverage with provisions also showed a welcome trend, with theprovisioning cushion increasing to 162% by the end of 2006 from the100% reported by the Chilean banking system at the beginning of thedecade.
So far, the growth in lending to allegedly riskier segments (i.e., retailand SMEs) has not resulted in asset quality deterioration, possiblybecause the effects of increased indebtedness were mitigated byprogressively more favorable credit conditions (namely record lowinterest rate environment and longer tenors). Nevertheless, current NPLlevels are likely to have found a floor as banks continue to increasepenetration in lower-income segments.
Mixed signals in profitabilitySince the beginning of the decade, Chilean banks’ profitabilitymeasured as results over assets has shown a moderately positivetrend, with the exception of 2002, when profits were hurt as a result ofthe extraordinary cost of the two large mergers that took place thatyear. When measuring profitability as results over capital, performanceseems even better as a result of the average increase in banks’leverage in the past few years.
In this area, one of the Chilean system’s main long-term achievementsis the growing operating efficiency. The ratio of operating expenses togross margins reduced to 50% in 2006 from 66% 10 years before.Other factors positively affecting profitability are low provisioningneeds in the favorable economic environment, and increasedcontribution of successful banks’ subsidiaries to overall profits (mostlyasset managers, insurers, and brokerage houses) that accounted for16% of the financial system’s profits in 2006. In recent years, thebanks’ successful efforts to grow fee income (widening the array ofservices provided in combination with cross selling initiatives andsharper pricing) were also positive contributors to profitability.
Negative factors conditioning Chilean banks’ results include the strongcompetition suffered by entities in all segments, as banks hurt theirmargins trying to increase intermediation levels by beating capitalmarkets and retail stores. The extremely low interest rate environmentthat still persists is also pressuring banks’ margins, although thecurrent business mix with increased participation of the higher-yieldingconsumer segments has succeeded at offsetting margin reduction.
22 Top 30 Chilean Companies - April 2007
In this context, during 2006, ROA was 1.4%, while ROE reached amaximum of 23%. While these figures compare favorably with those ofother developed countries, the Chilean system is somewhat lagging theriskier Mexican (annualized ROA of 2.74% in the nine-month periodended September 2006) and Brazilian banks (annualized ROA of 2.5% inthe six-month period ended June 2006).
Solvent banks, but further growth requires investmentAverage capitalization for the financial system declined to 12.5% ofrisk weighted assets by the end of 2006. Although all banks postfigures above 10% (well beyond the minimum 8% required byregulations), 11 institutions are now in the lowest 10% to 12% bucket(from eight banks at the end of 2005). Despite the still-adequatesolvency levels, since 2004, capitalization ratios have shown adownward trend as a result of the acceleration in asset growth. During2006, a greater number of banks decided to capitalize a larger portionof profits and/or issued subordinated debt to maintain high-qualitycapital indicators. As we expect vigorous growth in lending to remainthe rule in 2007, banks will continue to look for additional ways tomaintain adequate capital levels.
Consolidation, integration, and other market newsThe financial system’s concentration process peaked with the largemergers that took place in 2002, when Banco Santander-Chile S.A.acquired Banco Santiago to become the largest bank in Chile, andBanco de Chile S.A. merged with Banco Edwards to become the secondlargest. The two institutions managed to control more than 40% of themarket at the time. Since then, concentration has stabilized. Initially,the share of the two largest banks reduced due to midsize banksgaining market share as certain clients were expelled by the mergedbanks’ revised policies, or other clients fled from the lower quality ofservice that typically accompanies a cumbersome merger process.Moreover, the success of a number of relatively new entities (Fallabellastarted operations in 1999, Ripley in 2002, Monex and HNS in 2003,Penta and Paris in 2004) proved that there was enough room for nicheplayers to carry out thriving operations. Midsize banks focused on theless-standardized products and services also proved that competingsuccessfully with the two giants in the industry was possible.
In the past year, a number of financial industry-related transactionsproved that abundant business opportunities are still perceived by localand foreign market players. Brazilian Banco Itau acquiring localBankboston’s unit from Bank of America, Banco Internacional beingsold to local investors, BBVA buying a controlling stake in one of thelargest car finance companies (Forum), or Grupo Security getting holdof AIG life annuity unit (following their acquisition of Dresdner in 2004)were probably the most significant transactions. In this respect, weexpect 2007 to continue being prolific in market news and localplayers’ strong strategic moves. Acquisitions and alliances are likely tobe triggered by the potential change in regulations by which bankswould become authorized to participate directly in the large Chileanpension industry, which is in line with the worldwide tendency toincrease integration in the financial services industry, with playersmaximizing cross selling of a wide array of products to their still notcomprehensively serviced customer base.
Chilean banks’ regulators will get no rest in 2007During this year, Basel II implementation will continue to demandconsiderable efforts and investments on the part of Chilean banks andregulators, as institutions are expected to continue running parallelexercises on the standardized approach for credit risk (including modelsusing ratings in domestic scale in June and September of this year).Exercises will also address additional deliverables on market riskmeasures depending on the approach chosen by each bank(standardized or internal models of VaR) and producing supplementarydata toward breaking down operating margins by business line forbanks choosing to implement the standardized approach for thecalculation of operational risk capital requirements. Additionally, following nontrivial preparatory work during 2006,regulators will focus on upgrading some of the current accounting rulesto international standards, in particular those aiming to provideconsistent data toward complying with transparency and disclosure ofinformation required by Pillar III of the Basel Accord.
Credit Statistics
Com
pany
G
ener
CA
PA
rauc
oCe
men
tos
Cenc
osud
Co
lbun
CC
UCG
ECo
delc
oD
&S
Bio
Bio
Stan
dard
& P
oor's
Rat
ing
BBB-
/Sta
ble
BBB-
/Sta
ble
BBB+
/Sta
ble
Not
Rat
edN
ot R
ated
Not
Rat
edBB
B+/S
tabl
eBB
B+/S
tabl
eA/
Stab
leN
ot R
ated
Bus
ines
s Pr
ofile
Satis
fact
ory
Satis
fact
ory
Satis
fact
ory
n.a
n.a
n.a
Satis
fact
ory
Stro
ngSt
rong
n.a
Fina
ncia
l Pro
file
Inte
rmed
iate
Inte
rmed
iate
Inte
rmed
iate
n.a
n.a
n.a
Mod
est
Aggr
essi
veAg
gres
sive
n.a
Key
Fina
ncia
l (m
ill d
olla
rs) f
or fi
scal
200
6Re
venu
es89
9.2
997.
42,
849.
762
1.6
5,85
3.7
749.
81,
025.
21,
770.
317
,077
.03,
187.
4EB
ITD
A33
1.0
192.
41,
050.
810
1.3
491.
644
4.0
227.
641
1.2
10,2
61.0
218.
6Fu
nds
from
ope
ratio
ns (F
FO)
250.
813
6.5
899.
163
.150
4.7
384.
319
8.1
334.
83,
026.
525
2.9
Capi
tal e
xpen
ditu
res
69.8
118.
872
2.7
68.9
351.
510
2.7
94.2
178.
11,
218.
714
9.7
Div
iden
ds93
.477
.519
2.7
46.2
67.0
57.1
61.2
86.0
1,75
0.0
24.4
Tota
l deb
t85
0.0
640.
12,
423.
734
6.0
1,31
4.9
518.
527
5.3
1,64
3.9
4,44
9.0
754.
1Sh
areh
olde
rs e
quity
1,70
9.5
732.
24,
831.
643
7.9
2,53
9.4
2,34
7.7
656.
087
3.4
4,52
7.6
973.
0Ca
sh a
nd s
hort
term
inve
stm
ents
209.
024
1.8
179.
691
.711
2.7
334.
913
0.3
35.4
833.
184
.8To
tal a
sset
s2,
829.
71,
771.
87,
815.
095
2.4
5,41
3.2
3,24
6.8
1,31
9.3
3,38
4.4
13,0
32.8
2,26
4.5
Fina
ncia
l Rat
ios
EBIT
DA
mar
gin
(%)
36.8
19.3
36.9
16.3
8.4
59.2
22.2
23.2
60.1
6.9
EBIT
DA
inte
rest
cov
erag
e (x
)5.
36.
47.
54.
47.
214
.315
.94.
743
.55.
2FF
O to
tota
l deb
t (%
)29
.521
.337
.118
.238
.474
.172
.020
.668
.033
.5To
tal d
ebt t
o to
tal c
apita
l (%
)33
.244
.033
.344
.132
.618
.027
.254
.949
.543
.7To
tal d
ebt t
o EB
ITD
A (x
)2.
43.
32.
33.
42.
71.
21.
23.
80.
43.
5
Thre
e-ye
ar a
vera
ge (2
004-
2006
)Re
venu
es83
3.0
867.
42,
432.
855
9.1
4,41
3.8
551.
091
3.3
1,56
9.4
11,9
23.8
2,96
3.7
EBIT
DA
304.
020
2.1
940.
710
1.2
361.
428
6.8
204.
838
9.4
6,79
3.0
197.
9Fu
nds
from
ope
ratio
ns (F
FO)
217.
115
3.6
770.
075
.135
5.7
269.
417
5.5
319.
32,
390.
818
6.5
Capi
tal e
xpen
ditu
res
57.8
67.7
705.
876
.327
0.3
96.2
79.2
170.
21,
318.
812
7.1
Div
iden
ds11
9.8
73.8
192.
930
.349
.365
.754
.685
.51,
516.
335
.9To
tal d
ebt
892.
046
2.2
2,23
5.3
326.
61,
040.
351
8.2
268.
31,
617.
63,
690.
667
3.8
Shar
ehol
ders
equ
ity1,
631.
064
6.5
4,36
1.3
418.
02,
074.
41,
921.
360
6.8
807.
83,
446.
893
0.7
Cash
and
sho
rt te
rm in
vest
men
ts15
9.3
154.
530
0.9
39.7
116.
619
3.0
133.
239
.043
5.2
104.
4To
tal a
sset
s2,
742.
11,
410.
67,
047.
687
1.7
4,36
2.7
2,72
2.4
1,21
2.3
2,98
5.6
10,8
68.4
2,12
5.9
EBIT
DA
mar
gin
(%)
36.7
23.8
39.1
18.3
8.1
50.7
22.5
25.0
55.8
6.6
EBIT
DA
inte
rest
cov
erag
e (x
)3.
99.
06.
95.
46.
79.
615
.74.
534
.75.
1FF
O to
tota
l deb
t (%
)24
.536
.434
.723
.233
.252
.065
.319
.864
.127
.1To
tal d
ebt t
o to
tal c
apita
l (%
)35
.440
.133
.843
.832
.221
.928
.256
.251
.942
.0To
tal d
ebt t
o EB
ITD
A (x
)2.
92.
32.
43.
23.
02.
01.
34.
10.
63.
6
24 Top 30 Chilean Companies - April 2007
Peer
CCom
paris
on TT
able
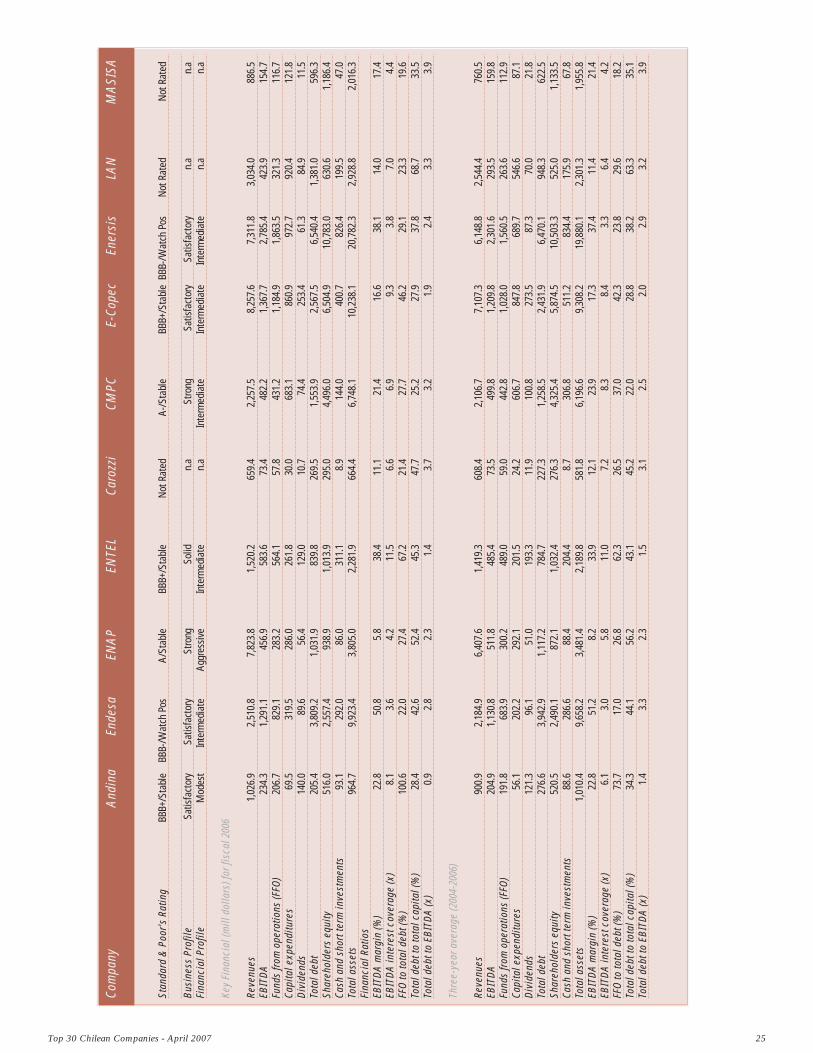
Top 30 Chilean Companies - April 2007 25
Com
pany
A
ndin
aEn
desa
ENA
PEN
TEL
Caro
zzi
CMPC
E-Co
pec
Ener
sis
LAN
MA
SISA
Stan
dard
& P
oor's
Rat
ing
BBB+
/Sta
ble
BBB-
/Wat
ch P
osA/
Stab
leBB
B+/S
tabl
eN
ot R
ated
A-/S
tabl
eBB
B+/S
tabl
eBB
B-/W
atch
Pos
Not
Rat
edN
ot R
ated
Bus
ines
s Pr
ofile
Satis
fact
ory
Satis
fact
ory
Stro
ngSo
lidn.
aSt
rong
Satis
fact
ory
Satis
fact
ory
n.a
n.a
Fina
ncia
l Pro
file
Mod
est
Inte
rmed
iate
Aggr
essi
veIn
term
edia
ten.
aIn
term
edia
teIn
term
edia
teIn
term
edia
ten.
an.
a
Key
Fina
ncia
l (m
ill d
olla
rs) f
or fi
scal
200
6
Reve
nues
1,02
6.9
2,51
0.8
7,82
3.8
1,52
0.2
659.
42,
257.
58,
257.
67,
311.
83,
034.
088
6.5
EBIT
DA
234.
31,
291.
145
6.9
583.
673
.448
2.2
1,36
7.7
2,78
5.4
423.
915
4.7
Fund
s fr
om o
pera
tions
(FFO
)20
6.7
829.
128
3.2
564.
157
.843
1.2
1,18
4.9
1,86
3.5
321.
311
6.7
Capi
tal e
xpen
ditu
res
69.5
319.
528
6.0
261.
830
.068
3.1
860.
997
2.7
920.
412
1.8
Div
iden
ds14
0.0
89.6
56.4
129.
010
.774
.425
3.4
61.3
84.9
11.5
Tota
l deb
t20
5.4
3,80
9.2
1,03
1.9
839.
826
9.5
1,55
3.9
2,56
7.5
6,54
0.4
1,38
1.0
596.
3Sh
areh
olde
rs e
quity
516.
02,
557.
493
8.9
1,01
3.9
295.
04,
496.
06,
504.
910
,783
.063
0.6
1,18
6.4
Cash
and
sho
rt te
rm in
vest
men
ts93
.129
2.0
86.0
311.
18.
914
4.0
400.
782
6.4
199.
547
.0To
tal a
sset
s96
4.7
9,92
3.4
3,80
5.0
2,28
1.9
664.
46,
748.
110
,238
.120
,782
.32,
928.
82,
016.
3Fi
nanc
ial R
atio
s EB
ITD
A m
argi
n (%
)22
.850
.85.
838
.411
.121
.416
.638
.114
.017
.4EB
ITD
A in
tere
st c
over
age
(x)
8.1
3.6
4.2
11.5
6.6
6.9
9.3
3.8
7.0
4.4
FFO
to to
tal d
ebt (
%)
100.
622
.027
.467
.221
.427
.746
.229
.123
.319
.6To
tal d
ebt t
o to
tal c
apita
l (%
)28
.442
.652
.445
.347
.725
.227
.937
.868
.733
.5To
tal d
ebt t
o EB
ITD
A (x
)0.
92.
82.
31.
43.
73.
21.
92.
43.
33.
9
Thre
e-ye
ar a
vera
ge (2
004-
2006
)
Reve
nues
900.
92,
184.
96,
407.
61,
419.
360
8.4
2,10
6.7
7,10
7.3
6,14
8.8
2,54
4.4
760.
5EB
ITD
A20
4.9
1,13
0.8
511.
848
5.4
73.5
499.
81,
209.
82,
301.
629
3.5
159.
8Fu
nds
from
ope
ratio
ns (F
FO)
191.
868
3.9
300.
248
9.0
59.0
442.
81,
028.
01,
560.
526
3.6
112.
9Ca
pita
l exp
endi
ture
s56
.120
2.2
292.
120
1.5
24.2
606.
784
7.8
689.
754
6.6
87.1
Div
iden
ds12
1.3
96.1
51.0
193.
311
.910
0.8
273.
587
.370
.021
.8To
tal d
ebt
276.
63,
942.
91,
117.
278
4.7
227.
31,
258.
52,
431.
96,
470.
194
8.3
622.
5Sh
areh
olde
rs e
quity
520.
52,
490.
187
2.1
1,03
2.4
276.
34,
325.
45,
874.
510
,503
.352
5.0
1,13
3.5
Cash
and
sho
rt te
rm in
vest
men
ts88
.628
6.6
88.4
204.
48.
730
6.8
511.
283
4.4
175.
967
.8To
tal a
sset
s1,
010.
49,
658.
23,
481.
42,
189.
858
1.8
6,19
6.6
9,30
8.2
19,8
80.1
2,30
1.3
1,95
5.8
EBIT
DA
mar
gin
(%)
22.8
51.2
8.2
33.9
12.1
23.9
17.3
37.4
11.4
21.4
EBIT
DA
inte
rest
cov
erag
e (x
)6.
13.
05.
811
.07.
28.
38.
43.
36.
44.
2FF
O to
tota
l deb
t (%
)73
.717
.026
.862
.326
.537
.042
.323
.829
.618
.2To
tal d
ebt t
o to
tal c
apita
l (%
)34
.344
.156
.243
.145
.222
.028
.838
.263
.335
.1To
tal d
ebt t
o EB
ITD
A (x
)1.
43.
32.
31.
53.
12.
52.
02.
93.
23.
9
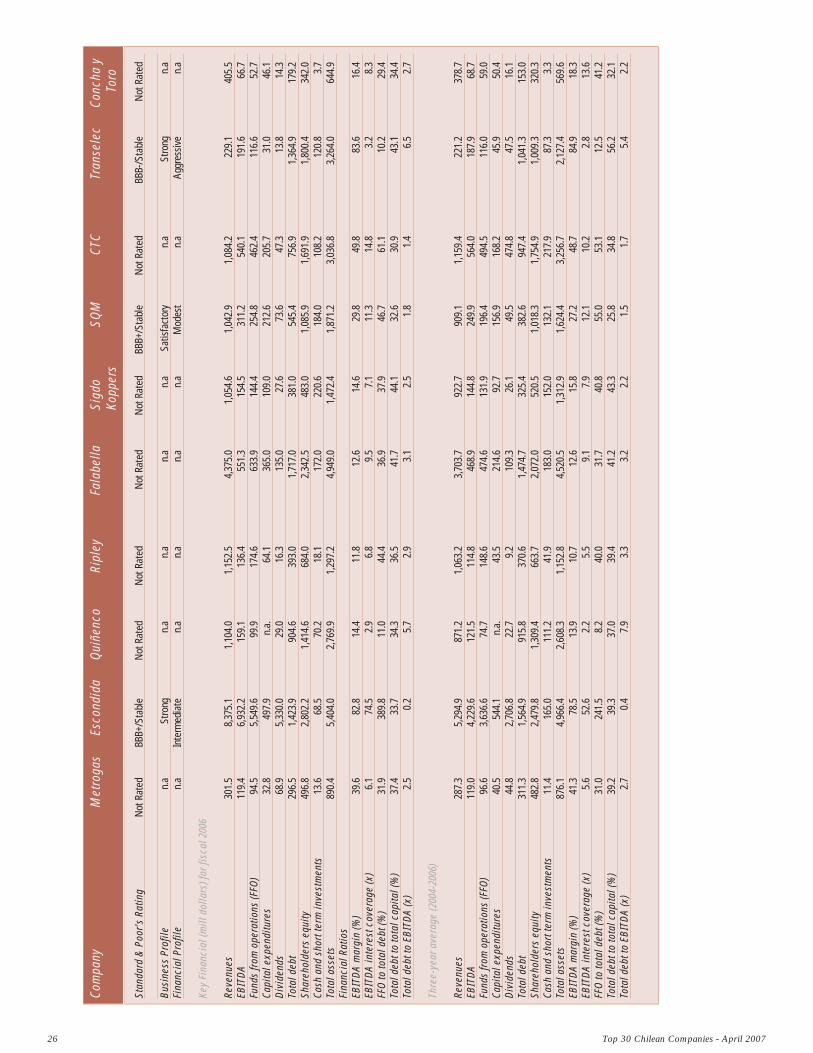
26 Top 30 Chilean Companies - April 2007
Com
pany
M
etro
gas
Esco
ndid
aQ
uiñe
nco
Ripl
eyFa
labe
llaSi
gdo
SQM
CTC
Tran
sele
c Co
ncha
y
Kopp
ers
Toro
Stan
dard
& P
oor's
Rat
ing
Not
Rat
edBB
B+/S
tabl
eN
ot R
ated
Not
Rat
edN
ot R
ated
Not
Rat
edBB
B+/S
tabl
eN
ot R
ated
BBB-
/Sta
ble
Not
Rat
ed
Bus
ines
s Pr
ofile
n.a
Stro
ngn.
an.
an.
an.
aSa
tisfa
ctor
yn.
aSt
rong
n.a
Fina
ncia
l Pro
file
n.a
Inte
rmed
iate
n.a
n.a
n.a
n.a
Mod
est
n.a
Aggr
essi
ven.
a
Key
Fina
ncia
l (m
ill d
olla
rs) f
or fi
scal
200
6
Reve
nues
301.
58,
375.
11,
104.
01,
152.
54,
375.
01,
054.
61,
042.
91,
084.
222
9.1
405.
5EB
ITD
A11
9.4
6,93
2.2
159.
113
6.4
551.
315
4.5
311.
254
0.1
191.
666
.7Fu
nds
from
ope
ratio
ns (F
FO)
94.5
5,54
9.6
99.9
174.
663
3.9
144.
425
4.8
462.
411
6.6
52.7
Capi
tal e
xpen
ditu
res
32.8
497.
9n.
a.64
.136
5.0
109.
021
2.6
205.
731
.046
.1D
ivid
ends
68.9
5,33
0.0
29.0
16.3
135.
027
.673
.647
.313
.814
.3To
tal d
ebt
296.
51,
423.
990
4.6
393.
01,
717.
038
1.0
545.
475
6.9
1,36
4.9
179.
2Sh
areh
olde
rs e
quity
496.
82,
802.
21,
414.
668
4.0
2,34
2.5
483.
01,
085.
91,
691.
91,
800.
434
2.0
Cash
and
sho
rt te
rm in
vest
men
ts13
.668
.570
.218
.117
2.0
220.
618
4.0
108.
212
0.8
3.7
Tota
l ass
ets
890.
45,
404.
02,
769.
91,
297.
24,
949.
01,
472.
41,
871.
23,
036.
83,
264.
064
4.9
Fina
ncia
l Rat
ios
EBIT
DA
mar
gin
(%)
39.6
82.8
14.4
11.8
12.6
14.6
29.8
49.8
83.6
16.4
EBIT
DA
inte
rest
cov
erag
e (x
)6.
174
.52.
96.
89.
57.
111
.314
.83.
28.
3FF
O to
tota
l deb
t (%
)31
.938
9.8
11.0
44.4
36.9
37.9
46.7
61.1
10.2
29.4
Tota
l deb
t to
tota
l cap
ital (
%)
37.4
33.7
34.3
36.5
41.7
44.1
32.6
30.9
43.1
34.4
Tota
l deb
t to
EBIT
DA
(x)
2.5
0.2
5.7
2.9
3.1
2.5
1.8
1.4
6.5
2.7
Thre
e-ye
ar a
vera
ge (2
004-
2006
)
Reve
nues
287.
35,
294.
987
1.2
1,06
3.2
3,70
3.7
922.
790
9.1
1,15
9.4
221.
237
8.7
EBIT
DA
119.
04,
229.
612
1.5
114.
846
8.9
144.
824
9.9
564.
018
7.9
68.7
Fund
s fr
om o
pera
tions
(FFO
)96
.63,
636.
674
.714
8.6
474.
613
1.9
196.
449
4.5
116.
059
.0Ca
pita
l exp
endi
ture
s40
.554
4.1
n.a.
43.5
214.
692
.715
6.9
168.
245
.950
.4D
ivid
ends
44.8
2,70
6.8
22.7
9.2
109.
326
.149
.547
4.8
47.5
16.1
Tota
l deb
t31
1.3
1,56
4.9
915.
837
0.6
1,47
4.7
325.
438
2.6
947.
41,
041.
315
3.0
Shar
ehol
ders
equ
ity48
2.8
2,47
9.8
1,30
9.4
663.
72,
072.
052
0.5
1,01
8.3
1,75
4.9
1,00
9.3
320.
3Ca
sh a
nd s
hort
term
inve
stm
ents
11.4
165.
011
1.2
41.9
183.
015
2.0
132.
121
7.9
87.3
3.3
Tota
l ass
ets
876.
14,
966.
42,
608.
31,
152.
84,
520.
51,
312.
91,
624.
43,
256.
72,
127.
456
9.6
EBIT
DA
mar
gin
(%)
41.3
78.5
13.9
10.7
12.6
15.8
27.2
48.7
84.9
18.3
EBIT
DA
inte
rest
cov
erag
e (x
)5.
652
.62.
25.
59.
17.
912
.110
.22.
813
.6FF
O to
tota
l deb
t (%
)31
.024
1.5
8.2
40.0
31.7
40.8
55.0
53.1
12.5
41.2
Tota
l deb
t to
tota
l cap
ital (
%)
39.2
39.3
37.0
39.4
41.2
43.3
25.8
34.8
56.2
32.1
Tota
l deb
t to
EBIT
DA
(x)
2.7
0.4
7.9
3.3
3.2
2.2
1.5
1.7
5.4
2.2
Credit Reports

28 Top 30 Chilean Companies - April 2007
RRaattiioonnaallee The ratings on AES Gener S.A. mainly reflect the company’s good marketposition as a reliable power provider in the strong Chilean market; itsrevenue stability deriving from large long-term power sales contracts withsolid offtakers such as Chilectra S.A., Chilquinta Energía S.A., and MineraEscondida Ltda. (BBB+/Stable/—); the growing prospects for powerconsumption in Chile; and the company’s good financial risk profile. At thesame time, the ratings incorporate AES Gener’s higher-than-average powergeneration cost when compared with that of the relatively largehydroelectric generators in the Chilean Central Interconnected System (SIC)under normal hydrological conditions, as well as the increasing natural gassupply risk, which affects the cost of the company’s generation and itspower purchases.
AES Gener’s financial risk profile has improved since 2005 due to thehigher cash flow generation resulting from significantly higher node pricesin Chile after the passage of the Short Law II in May 2005, in a context ofmanageable debt levels and a smooth debt maturity profile (annual debtmaturities of less than $60 million until 2014). In addition, the relativelyhigh water level in the SIC during 2006 contributed to reducing AESGener’s operating cost and improving the company’s profitability and cashflow generation. As a result, consolidated funds from operations (FFO)interest coverage and FFO to total average consolidated debt improved to4.8x and 29.5%, respectively, in 2006, from 3.4x and 23.9% in fiscal 2005and 3x and 20.1% in 2004.
Although Standard & Poor’s Ratings Services expects coverage measuresto remain volatile, reflecting changes in hydrology in the SIC and varyingnatural gas shortages in Chile, current ratings reflect the assumption thatFFO interest coverage and FFO to total average debt will remain above 3xand 20%, respectively, from 2007 to 2010, assuming normal weatherconditions and increasing natural gas shortages. We expect the higheraverage node prices in the SIC to allow AES Gener to offset the following:
The higher cost of its natural gas purchases resulting from the July 2006 increase in the natural gas export tax defined by the Argentine government; and
The higher generation cost when burning diesel oil in its natural gas plants during times of natural gas supply shortages.
AES Gener benefits from moderate debt levels that reached 33.2% ofcapitalization as of Dec. 31, 2006, although total debt to EBITDA is lessconservative at 2.4x. In addition, AES Gener does not face significantrefinancing risk in the next few years, as annual consolidated debtmaturities are less than $60 million until 2014, when about $570 million inbonds will become due. AES Gener’s profit margin and cash flow generation depend highly on theevolution of the node and spot electricity prices in the SIC. Long-termcontracted sales at the node price in the SIC represent about 35%-40% of
total consolidated revenues and around 30%-60% of consolidated EBITDA,the latter being much more volatile because the company’s cost of salesdepends on weather conditions and natural gas shortages (resulting fromthe Argentine government’s restrictions on natural gas exports to Chile).When spot prices are below AES Gener’s generation cost (e.g., in periodswhen water availability is normal or high), the company buys lower-costpower from the spot market to fulfill its power sales contracts, and thus itsmargins improve. When spot prices are higher, margins fall because AESGener either buys more expensive power in the spot market or generates itat a higher cost. Adverse hydrology and the shortages in natural gas supplyfrom Argentina increase the cost of buying and generating power, given theneed to burn higher-cost fuels, and significantly influence AES Gener’smargins.
We expect AES Gener to weather the effects of the natural gas restrictionsin Chile without significant deterioration in its financial risk profile, mainlydue to the following:
SIC node prices have significantly increased since May 2005 to levelsabove $60 per megawatt-hour, which should partly offset the higher costresulting from burning more expensive diesel or making more purchases athigher spot prices, especially if natural gas shortages are combined withpoor hydrology in the SIC. Argentine natural gas exports to Chile areunlikely to be fully interrupted, at least through 2007.
We expect the passage of the Short Law II to result in new investments inpower generation that should reduce the country’s dependence on naturalgas imported from Argentina by 2009 and thus somewhat limit spot pricesin Chile. However, if Argentine natural gas exports to Chile are highlyrestricted and are combined with very poor hydrology in the SIC before2009, the company’s cost of sales would increase significantly from thecurrent projected levels, and this would trigger a ratings revision.
AES Gener accounts for about 20% of Chile’s total generating capacity,with an installed capacity of 2,428 MW, including the Termoandes plant.The company is 91.19% indirectly owned by U.S.-based The AES Corp. (BB-/Stable/—), which is rated significantly lower than AES Gener. In mostcircumstances, we will not rate the debt of a wholly owned subsidiaryhigher than that of the parent. However, we make exceptions on the basisof the cumulative value provided by enhancements, such as structuralprotections, covenants, and an independent shareholder or director.
According to the company’s bylaws, AES Gener cannot make intercompanyloans to its shareholders. AES Gener can distribute dividends only if FFOinterest coverage exceeds 2.4x or, in case the company has twoinvestment-grade credit ratings, if the company obtains confirmation thatthe dividend payment will not affect the ratings. The enhancements inplace for AES Gener, together with certain legal insulation provided byChilean bankruptcy law, provide sufficient comfort to allow for the currentthree-notch separation.
AES GGener SS.A.
Standard & Poor's redit Rating: BBB-/StableFeller Rate's credit Rating: A/StableBusiness Activity: Electric UtilityKey shareholders: AES CorpBusiness Risk Profile: SatisfactoryFinancial Risk Profile: Intermediate
Sergio Fuentes, Standard & Poor´s; Rodrigo Durán San Martín, Feller Rate
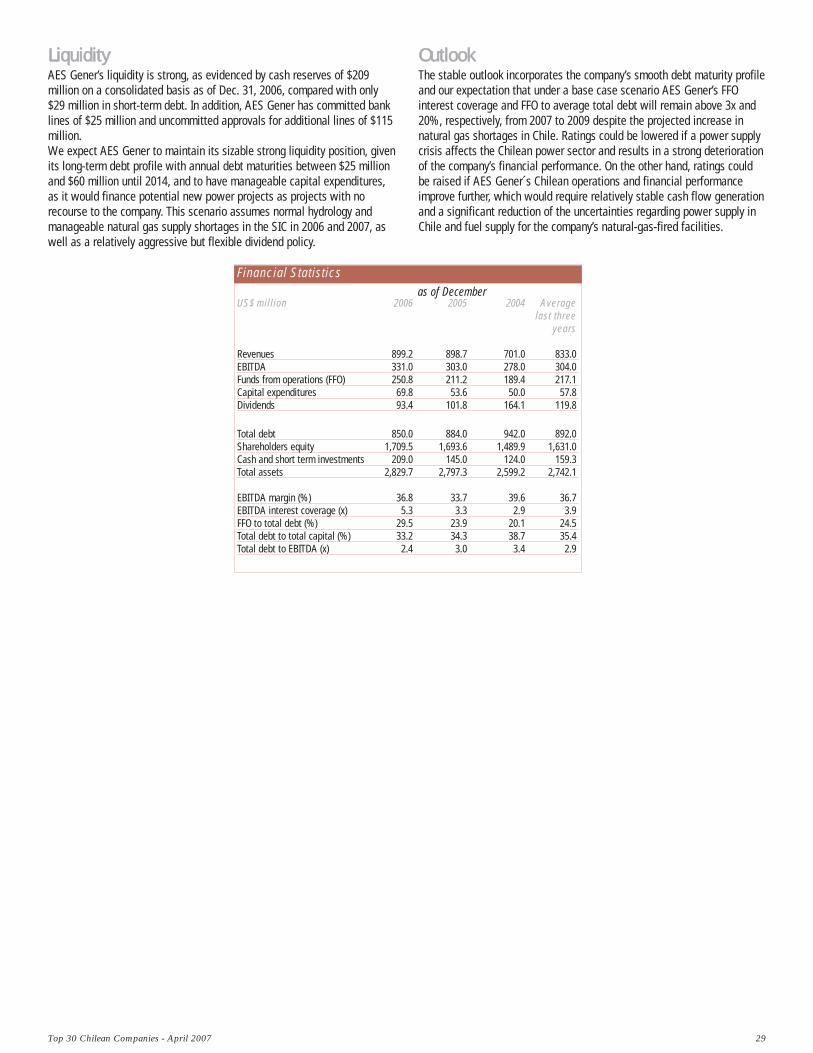
OOuuttllooookk The stable outlook incorporates the company’s smooth debt maturity profileand our expectation that under a base case scenario AES Gener’s FFOinterest coverage and FFO to average total debt will remain above 3x and20%, respectively, from 2007 to 2009 despite the projected increase innatural gas shortages in Chile. Ratings could be lowered if a power supplycrisis affects the Chilean power sector and results in a strong deteriorationof the company’s financial performance. On the other hand, ratings couldbe raised if AES Gener´s Chilean operations and financial performanceimprove further, which would require relatively stable cash flow generationand a significant reduction of the uncertainties regarding power supply inChile and fuel supply for the company’s natural-gas-fired facilities.
Top 30 Chilean Companies - April 2007 29
LLiiqquuiiddiittyy AES Gener’s liquidity is strong, as evidenced by cash reserves of $209million on a consolidated basis as of Dec. 31, 2006, compared with only$29 million in short-term debt. In addition, AES Gener has committed banklines of $25 million and uncommitted approvals for additional lines of $115million. We expect AES Gener to maintain its sizable strong liquidity position, givenits long-term debt profile with annual debt maturities between $25 millionand $60 million until 2014, and to have manageable capital expenditures,as it would finance potential new power projects as projects with norecourse to the company. This scenario assumes normal hydrology andmanageable natural gas supply shortages in the SIC in 2006 and 2007, aswell as a relatively aggressive but flexible dividend policy.
Financial Statisticsas of December
US$ million 2006 2005 2004 Averagelast three
years
Revenues 899.2 898.7 701.0 833.0 EBITDA 331.0 303.0 278.0 304.0 Funds from operations (FFO) 250.8 211.2 189.4 217.1 Capital expenditures 69.8 53.6 50.0 57.8 Dividends 93.4 101.8 164.1 119.8
Total debt 850.0 884.0 942.0 892.0 Shareholders equity 1,709.5 1,693.6 1,489.9 1,631.0 Cash and short term investments 209.0 145.0 124.0 159.3 Total assets 2,829.7 2,797.3 2,599.2 2,742.1
EBITDA margin (%) 36.8 33.7 39.6 36.7 EBITDA interest coverage (x) 5.3 3.3 2.9 3.9 FFO to total debt (%) 29.5 23.9 20.1 24.5 Total debt to total capital (%) 33.2 34.3 38.7 35.4 Total debt to EBITDA (x) 2.4 3.0 3.4 2.9
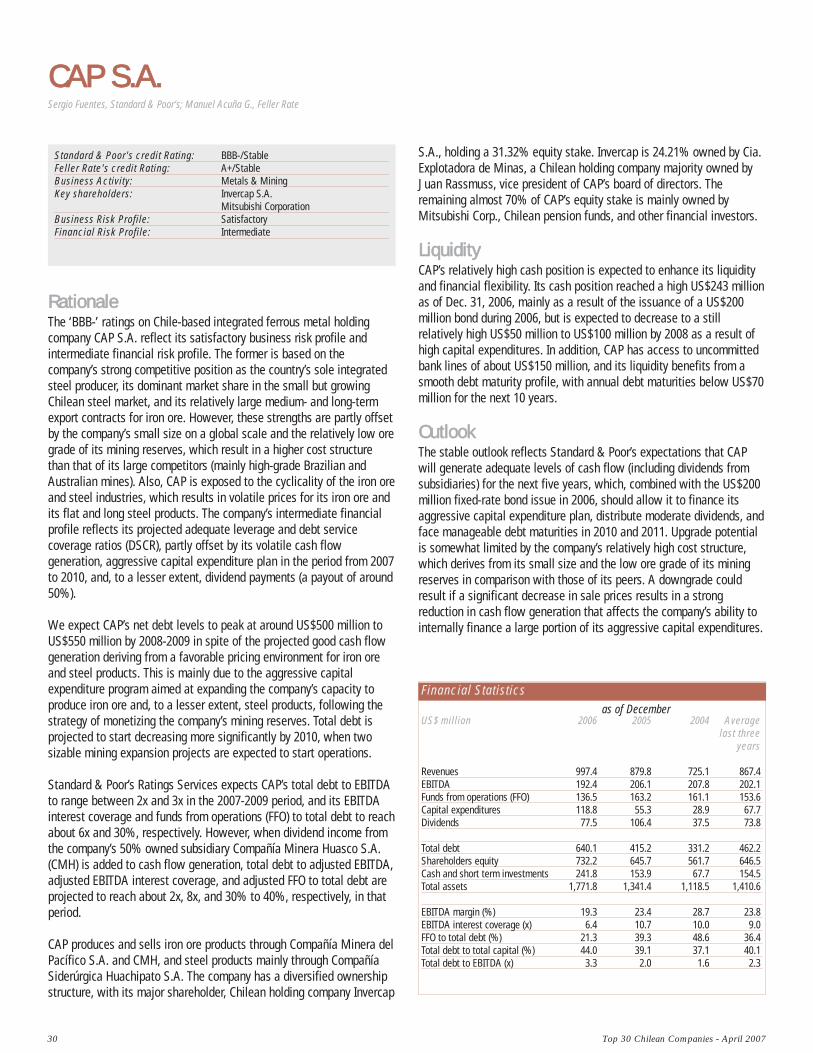
30 Top 30 Chilean Companies - April 2007
RRaattiioonnaallee The ‘BBB-’ ratings on Chile-based integrated ferrous metal holdingcompany CAP S.A. reflect its satisfactory business risk profile andintermediate financial risk profile. The former is based on thecompany’s strong competitive position as the country’s sole integratedsteel producer, its dominant market share in the small but growingChilean steel market, and its relatively large medium- and long-termexport contracts for iron ore. However, these strengths are partly offsetby the company’s small size on a global scale and the relatively low oregrade of its mining reserves, which result in a higher cost structurethan that of its large competitors (mainly high-grade Brazilian andAustralian mines). Also, CAP is exposed to the cyclicality of the iron oreand steel industries, which results in volatile prices for its iron ore andits flat and long steel products. The company’s intermediate financialprofile reflects its projected adequate leverage and debt servicecoverage ratios (DSCR), partly offset by its volatile cash flowgeneration, aggressive capital expenditure plan in the period from 2007to 2010, and, to a lesser extent, dividend payments (a payout of around50%).
We expect CAP’s net debt levels to peak at around US$500 million toUS$550 million by 2008-2009 in spite of the projected good cash flowgeneration deriving from a favorable pricing environment for iron oreand steel products. This is mainly due to the aggressive capitalexpenditure program aimed at expanding the company’s capacity toproduce iron ore and, to a lesser extent, steel products, following thestrategy of monetizing the company’s mining reserves. Total debt isprojected to start decreasing more significantly by 2010, when twosizable mining expansion projects are expected to start operations.
Standard & Poor’s Ratings Services expects CAP’s total debt to EBITDAto range between 2x and 3x in the 2007-2009 period, and its EBITDAinterest coverage and funds from operations (FFO) to total debt to reachabout 6x and 30%, respectively. However, when dividend income fromthe company’s 50% owned subsidiary Compañía Minera Huasco S.A.(CMH) is added to cash flow generation, total debt to adjusted EBITDA,adjusted EBITDA interest coverage, and adjusted FFO to total debt areprojected to reach about 2x, 8x, and 30% to 40%, respectively, in thatperiod.
CAP produces and sells iron ore products through Compañía Minera delPacífico S.A. and CMH, and steel products mainly through CompañíaSiderúrgica Huachipato S.A. The company has a diversified ownershipstructure, with its major shareholder, Chilean holding company Invercap
S.A., holding a 31.32% equity stake. Invercap is 24.21% owned by Cia.Explotadora de Minas, a Chilean holding company majority owned byJuan Rassmuss, vice president of CAP’s board of directors. Theremaining almost 70% of CAP’s equity stake is mainly owned byMitsubishi Corp., Chilean pension funds, and other financial investors.
LLiiqquuiiddiittyyCAP’s relatively high cash position is expected to enhance its liquidityand financial flexibility. Its cash position reached a high US$243 millionas of Dec. 31, 2006, mainly as a result of the issuance of a US$200million bond during 2006, but is expected to decrease to a stillrelatively high US$50 million to US$100 million by 2008 as a result ofhigh capital expenditures. In addition, CAP has access to uncommittedbank lines of about US$150 million, and its liquidity benefits from asmooth debt maturity profile, with annual debt maturities below US$70million for the next 10 years.
OOuuttllooookk The stable outlook reflects Standard & Poor’s expectations that CAPwill generate adequate levels of cash flow (including dividends fromsubsidiaries) for the next five years, which, combined with the US$200million fixed-rate bond issue in 2006, should allow it to finance itsaggressive capital expenditure plan, distribute moderate dividends, andface manageable debt maturities in 2010 and 2011. Upgrade potentialis somewhat limited by the company’s relatively high cost structure,which derives from its small size and the low ore grade of its miningreserves in comparison with those of its peers. A downgrade couldresult if a significant decrease in sale prices results in a strongreduction in cash flow generation that affects the company’s ability tointernally finance a large portion of its aggressive capital expenditures.
CAP SS.A.
Standard & Poor's credit Rating: BBB-/StableFeller Rate's credit Rating: A+/StableBusiness Activity: Metals & MiningKey shareholders: Invercap S.A.
Mitsubishi CorporationBusiness Risk Profile: SatisfactoryFinancial Risk Profile: Intermediate
Sergio Fuentes, Standard & Poor's; Manuel Acuña G., Feller Rate
Financial Statisticsas of December
US$ million 2006 2005 2004 Averagelast three
years
Revenues 997.4 879.8 725.1 867.4EBITDA 192.4 206.1 207.8 202.1Funds from operations (FFO) 136.5 163.2 161.1 153.6Capital expenditures 118.8 55.3 28.9 67.7Dividends 77.5 106.4 37.5 73.8
Total debt 640.1 415.2 331.2 462.2Shareholders equity 732.2 645.7 561.7 646.5Cash and short term investments 241.8 153.9 67.7 154.5Total assets 1,771.8 1,341.4 1,118.5 1,410.6
EBITDA margin (%) 19.3 23.4 28.7 23.8EBITDA interest coverage (x) 6.4 10.7 10.0 9.0FFO to total debt (%) 21.3 39.3 48.6 36.4Total debt to total capital (%) 44.0 39.1 37.1 40.1Total debt to EBITDA (x) 3.3 2.0 1.6 2.3
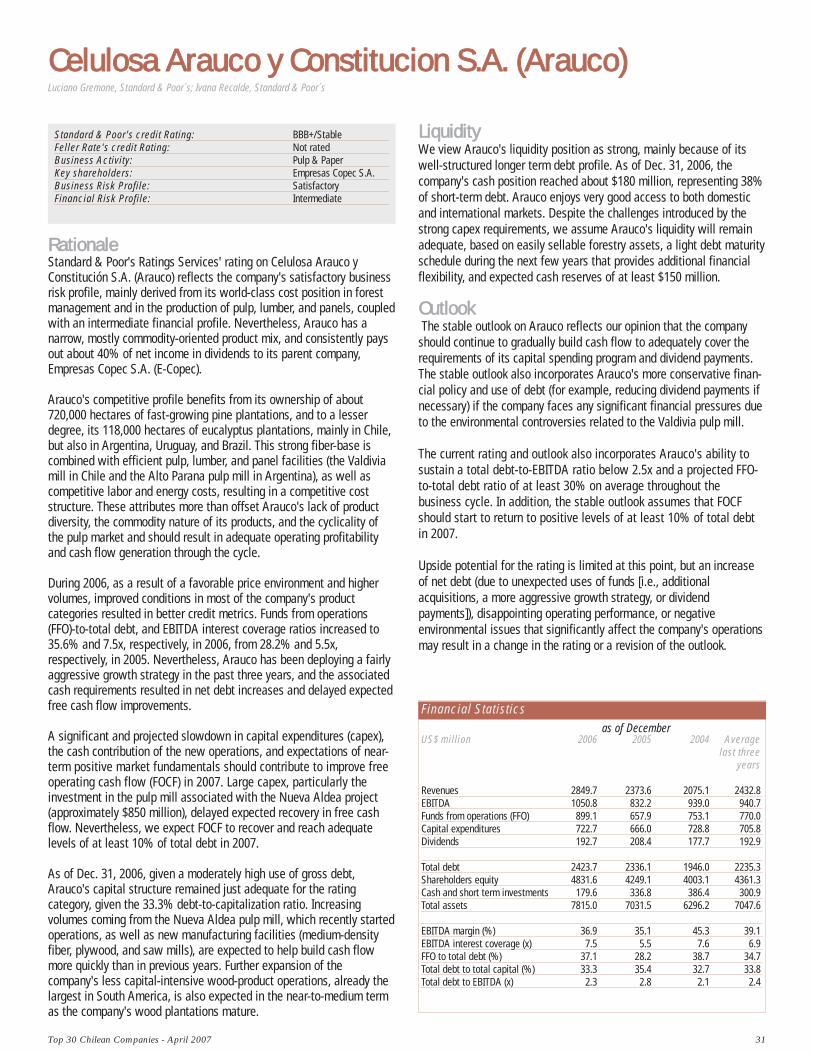
Top 30 Chilean Companies - April 2007 31
Celulosa AArauco yy CConstitucion SS.A. ((Arauco)
RRaattiioonnaallee Standard & Poor's Ratings Services' rating on Celulosa Arauco yConstitución S.A. (Arauco) reflects the company's satisfactory businessrisk profile, mainly derived from its world-class cost position in forestmanagement and in the production of pulp, lumber, and panels, coupledwith an intermediate financial profile. Nevertheless, Arauco has anarrow, mostly commodity-oriented product mix, and consistently paysout about 40% of net income in dividends to its parent company,Empresas Copec S.A. (E-Copec).
Arauco's competitive profile benefits from its ownership of about720,000 hectares of fast-growing pine plantations, and to a lesserdegree, its 118,000 hectares of eucalyptus plantations, mainly in Chile,but also in Argentina, Uruguay, and Brazil. This strong fiber-base iscombined with efficient pulp, lumber, and panel facilities (the Valdiviamill in Chile and the Alto Parana pulp mill in Argentina), as well ascompetitive labor and energy costs, resulting in a competitive coststructure. These attributes more than offset Arauco's lack of productdiversity, the commodity nature of its products, and the cyclicality ofthe pulp market and should result in adequate operating profitabilityand cash flow generation through the cycle.
During 2006, as a result of a favorable price environment and highervolumes, improved conditions in most of the company's productcategories resulted in better credit metrics. Funds from operations(FFO)-to-total debt, and EBITDA interest coverage ratios increased to35.6% and 7.5x, respectively, in 2006, from 28.2% and 5.5x,respectively, in 2005. Nevertheless, Arauco has been deploying a fairlyaggressive growth strategy in the past three years, and the associatedcash requirements resulted in net debt increases and delayed expectedfree cash flow improvements.
A significant and projected slowdown in capital expenditures (capex),the cash contribution of the new operations, and expectations of near-term positive market fundamentals should contribute to improve freeoperating cash flow (FOCF) in 2007. Large capex, particularly theinvestment in the pulp mill associated with the Nueva Aldea project(approximately $850 million), delayed expected recovery in free cashflow. Nevertheless, we expect FOCF to recover and reach adequatelevels of at least 10% of total debt in 2007.
As of Dec. 31, 2006, given a moderately high use of gross debt,Arauco's capital structure remained just adequate for the ratingcategory, given the 33.3% debt-to-capitalization ratio. Increasingvolumes coming from the Nueva Aldea pulp mill, which recently startedoperations, as well as new manufacturing facilities (medium-densityfiber, plywood, and saw mills), are expected to help build cash flowmore quickly than in previous years. Further expansion of thecompany's less capital-intensive wood-product operations, already thelargest in South America, is also expected in the near-to-medium termas the company's wood plantations mature.
LLiiqquuiiddiittyy We view Arauco's liquidity position as strong, mainly because of itswell-structured longer term debt profile. As of Dec. 31, 2006, thecompany's cash position reached about $180 million, representing 38%of short-term debt. Arauco enjoys very good access to both domesticand international markets. Despite the challenges introduced by thestrong capex requirements, we assume Arauco's liquidity will remainadequate, based on easily sellable forestry assets, a light debt maturityschedule during the next few years that provides additional financialflexibility, and expected cash reserves of at least $150 million.
OOuuttllooookk The stable outlook on Arauco reflects our opinion that the company
should continue to gradually build cash flow to adequately cover therequirements of its capital spending program and dividend payments.The stable outlook also incorporates Arauco's more conservative finan-cial policy and use of debt (for example, reducing dividend payments ifnecessary) if the company faces any significant financial pressures dueto the environmental controversies related to the Valdivia pulp mill.
The current rating and outlook also incorporates Arauco's ability tosustain a total debt-to-EBITDA ratio below 2.5x and a projected FFO-to-total debt ratio of at least 30% on average throughout thebusiness cycle. In addition, the stable outlook assumes that FOCFshould start to return to positive levels of at least 10% of total debtin 2007.
Upside potential for the rating is limited at this point, but an increaseof net debt (due to unexpected uses of funds [i.e., additionalacquisitions, a more aggressive growth strategy, or dividendpayments]), disappointing operating performance, or negativeenvironmental issues that significantly affect the company's operationsmay result in a change in the rating or a revision of the outlook.
Luciano Gremone, Standard & Poor´s; Ivana Recalde, Standard & Poor´s
Standard & Poor's credit Rating: BBB+/StableFeller Rate's credit Rating: Not rated Business Activity: Pulp & PaperKey shareholders: Empresas Copec S.A. Business Risk Profile: SatisfactoryFinancial Risk Profile: Intermediate
Financial Statisticsas of December
US$ million 2006 2005 2004 Averagelast three
years
Revenues 2849.7 2373.6 2075.1 2432.8EBITDA 1050.8 832.2 939.0 940.7Funds from operations (FFO) 899.1 657.9 753.1 770.0Capital expenditures 722.7 666.0 728.8 705.8Dividends 192.7 208.4 177.7 192.9
Total debt 2423.7 2336.1 1946.0 2235.3Shareholders equity 4831.6 4249.1 4003.1 4361.3Cash and short term investments 179.6 336.8 386.4 300.9Total assets 7815.0 7031.5 6296.2 7047.6
EBITDA margin (%) 36.9 35.1 45.3 39.1EBITDA interest coverage (x) 7.5 5.5 7.6 6.9FFO to total debt (%) 37.1 28.2 38.7 34.7Total debt to total capital (%) 33.3 35.4 32.7 33.8Total debt to EBITDA (x) 2.3 2.8 2.1 2.4
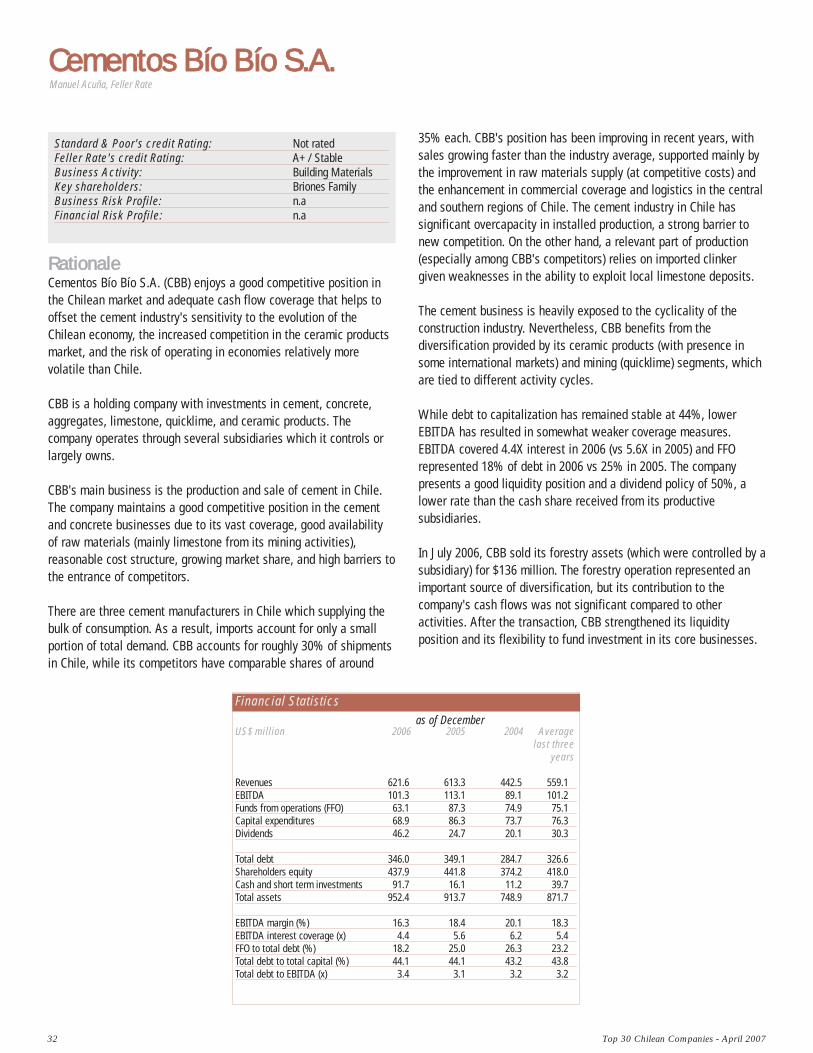
32 Top 30 Chilean Companies - April 2007
RRaattiioonnaalleeCementos Bío Bío S.A. (CBB) enjoys a good competitive position inthe Chilean market and adequate cash flow coverage that helps tooffset the cement industry's sensitivity to the evolution of theChilean economy, the increased competition in the ceramic productsmarket, and the risk of operating in economies relatively morevolatile than Chile.
CBB is a holding company with investments in cement, concrete,aggregates, limestone, quicklime, and ceramic products. Thecompany operates through several subsidiaries which it controls orlargely owns.
CBB's main business is the production and sale of cement in Chile.The company maintains a good competitive position in the cementand concrete businesses due to its vast coverage, good availabilityof raw materials (mainly limestone from its mining activities),reasonable cost structure, growing market share, and high barriers tothe entrance of competitors.
There are three cement manufacturers in Chile which supplying thebulk of consumption. As a result, imports account for only a smallportion of total demand. CBB accounts for roughly 30% of shipmentsin Chile, while its competitors have comparable shares of around
Standard & Poor's credit Rating: Not rated Feller Rate's credit Rating: A+ / StableBusiness Activity: Building MaterialsKey shareholders: Briones FamilyBusiness Risk Profile: n.aFinancial Risk Profile: n.a
35% each. CBB's position has been improving in recent years, withsales growing faster than the industry average, supported mainly bythe improvement in raw materials supply (at competitive costs) andthe enhancement in commercial coverage and logistics in the centraland southern regions of Chile. The cement industry in Chile hassignificant overcapacity in installed production, a strong barrier tonew competition. On the other hand, a relevant part of production(especially among CBB's competitors) relies on imported clinkergiven weaknesses in the ability to exploit local limestone deposits.
The cement business is heavily exposed to the cyclicality of theconstruction industry. Nevertheless, CBB benefits from thediversification provided by its ceramic products (with presence insome international markets) and mining (quicklime) segments, whichare tied to different activity cycles.
While debt to capitalization has remained stable at 44%, lowerEBITDA has resulted in somewhat weaker coverage measures.EBITDA covered 4.4X interest in 2006 (vs 5.6X in 2005) and FFOrepresented 18% of debt in 2006 vs 25% in 2005. The companypresents a good liquidity position and a dividend policy of 50%, alower rate than the cash share received from its productivesubsidiaries.
In July 2006, CBB sold its forestry assets (which were controlled by asubsidiary) for $136 million. The forestry operation represented animportant source of diversification, but its contribution to thecompany's cash flows was not significant compared to otheractivities. After the transaction, CBB strengthened its liquidityposition and its flexibility to fund investment in its core businesses.
Cementos BBío BBío SS.A.Manuel Acuña, Feller Rate
Financial Statisticsas of December
US$ million 2006 2005 2004 Averagelast three
years
Revenues 621.6 613.3 442.5 559.1EBITDA 101.3 113.1 89.1 101.2Funds from operations (FFO) 63.1 87.3 74.9 75.1Capital expenditures 68.9 86.3 73.7 76.3Dividends 46.2 24.7 20.1 30.3
Total debt 346.0 349.1 284.7 326.6Shareholders equity 437.9 441.8 374.2 418.0Cash and short term investments 91.7 16.1 11.2 39.7Total assets 952.4 913.7 748.9 871.7
EBITDA margin (%) 16.3 18.4 20.1 18.3EBITDA interest coverage (x) 4.4 5.6 6.2 5.4FFO to total debt (%) 18.2 25.0 26.3 23.2Total debt to total capital (%) 44.1 44.1 43.2 43.8Total debt to EBITDA (x) 3.4 3.1 3.2 3.2
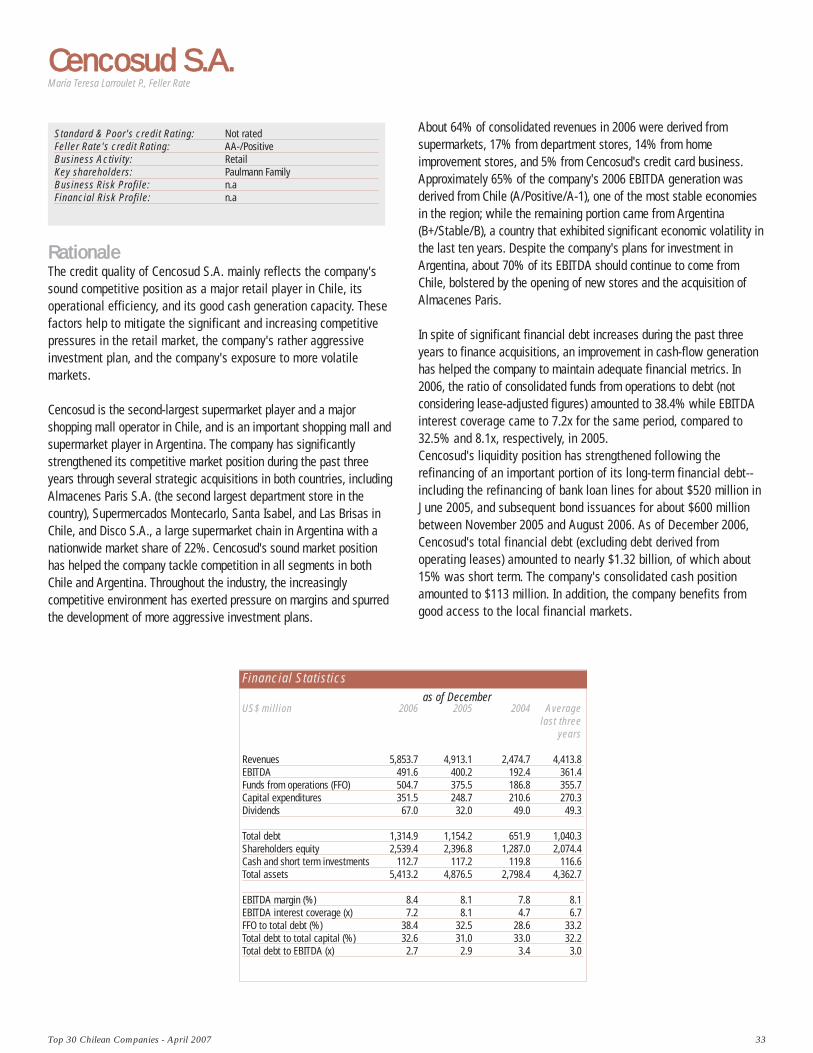
Top 30 Chilean Companies - April 2007 33
RRaattiioonnaalleeThe credit quality of Cencosud S.A. mainly reflects the company'ssound competitive position as a major retail player in Chile, itsoperational efficiency, and its good cash generation capacity. Thesefactors help to mitigate the significant and increasing competitivepressures in the retail market, the company's rather aggressiveinvestment plan, and the company's exposure to more volatilemarkets.
Cencosud is the second-largest supermarket player and a majorshopping mall operator in Chile, and is an important shopping mall andsupermarket player in Argentina. The company has significantlystrengthened its competitive market position during the past threeyears through several strategic acquisitions in both countries, includingAlmacenes Paris S.A. (the second largest department store in thecountry), Supermercados Montecarlo, Santa Isabel, and Las Brisas inChile, and Disco S.A., a large supermarket chain in Argentina with anationwide market share of 22%. Cencosud's sound market positionhas helped the company tackle competition in all segments in bothChile and Argentina. Throughout the industry, the increasinglycompetitive environment has exerted pressure on margins and spurredthe development of more aggressive investment plans.
Standard & Poor's credit Rating: Not rated Feller Rate's credit Rating: AA-/PositiveBusiness Activity: RetailKey shareholders: Paulmann Family Business Risk Profile: n.aFinancial Risk Profile: n.a
About 64% of consolidated revenues in 2006 were derived fromsupermarkets, 17% from department stores, 14% from homeimprovement stores, and 5% from Cencosud's credit card business.Approximately 65% of the company's 2006 EBITDA generation wasderived from Chile (A/Positive/A-1), one of the most stable economiesin the region; while the remaining portion came from Argentina(B+/Stable/B), a country that exhibited significant economic volatility inthe last ten years. Despite the company's plans for investment inArgentina, about 70% of its EBITDA should continue to come fromChile, bolstered by the opening of new stores and the acquisition ofAlmacenes Paris.
In spite of significant financial debt increases during the past threeyears to finance acquisitions, an improvement in cash-flow generationhas helped the company to maintain adequate financial metrics. In2006, the ratio of consolidated funds from operations to debt (notconsidering lease-adjusted figures) amounted to 38.4% while EBITDAinterest coverage came to 7.2x for the same period, compared to32.5% and 8.1x, respectively, in 2005. Cencosud's liquidity position has strengthened following therefinancing of an important portion of its long-term financial debt--including the refinancing of bank loan lines for about $520 million inJune 2005, and subsequent bond issuances for about $600 millionbetween November 2005 and August 2006. As of December 2006,Cencosud's total financial debt (excluding debt derived fromoperating leases) amounted to nearly $1.32 billion, of which about15% was short term. The company's consolidated cash positionamounted to $113 million. In addition, the company benefits fromgood access to the local financial markets.
Cencosud SS.A.María Teresa Larroulet P., Feller Rate
Financial Statisticsas of December
US$ million 2006 2005 2004 Averagelast three
years
Revenues 5,853.7 4,913.1 2,474.7 4,413.8EBITDA 491.6 400.2 192.4 361.4Funds from operations (FFO) 504.7 375.5 186.8 355.7Capital expenditures 351.5 248.7 210.6 270.3Dividends 67.0 32.0 49.0 49.3
Total debt 1,314.9 1,154.2 651.9 1,040.3Shareholders equity 2,539.4 2,396.8 1,287.0 2,074.4Cash and short term investments 112.7 117.2 119.8 116.6Total assets 5,413.2 4,876.5 2,798.4 4,362.7
EBITDA margin (%) 8.4 8.1 7.8 8.1EBITDA interest coverage (x) 7.2 8.1 4.7 6.7FFO to total debt (%) 38.4 32.5 28.6 33.2Total debt to total capital (%) 32.6 31.0 33.0 32.2Total debt to EBITDA (x) 2.7 2.9 3.4 3.0
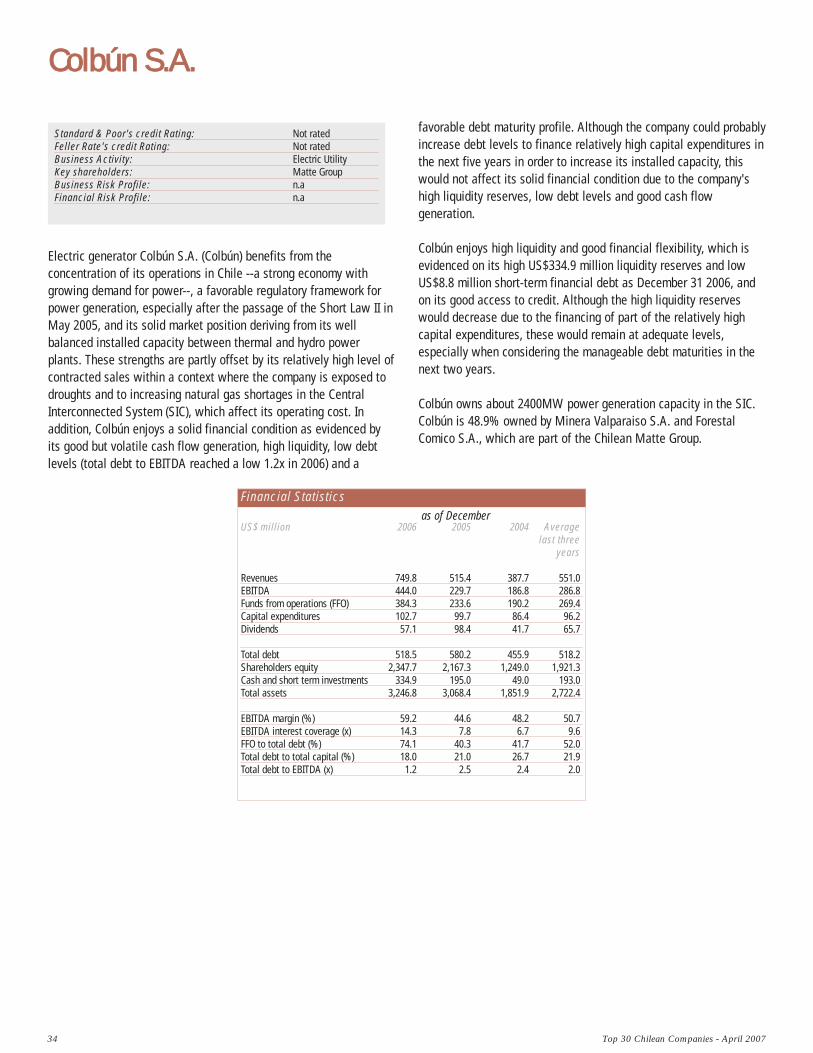
34 Top 30 Chilean Companies - April 2007
Electric generator Colbún S.A. (Colbún) benefits from theconcentration of its operations in Chile --a strong economy withgrowing demand for power--, a favorable regulatory framework forpower generation, especially after the passage of the Short Law II inMay 2005, and its solid market position deriving from its wellbalanced installed capacity between thermal and hydro powerplants. These strengths are partly offset by its relatively high level ofcontracted sales within a context where the company is exposed todroughts and to increasing natural gas shortages in the CentralInterconnected System (SIC), which affect its operating cost. Inaddition, Colbún enjoys a solid financial condition as evidenced byits good but volatile cash flow generation, high liquidity, low debtlevels (total debt to EBITDA reached a low 1.2x in 2006) and a
Standard & Poor's credit Rating: Not ratedFeller Rate's credit Rating: Not ratedBusiness Activity: Electric UtilityKey shareholders: Matte GroupBusiness Risk Profile: n.aFinancial Risk Profile: n.a
Colbún SS.A.
Financial Statisticsas of December
US$ million 2006 2005 2004 Averagelast three
years
Revenues 749.8 515.4 387.7 551.0EBITDA 444.0 229.7 186.8 286.8Funds from operations (FFO) 384.3 233.6 190.2 269.4Capital expenditures 102.7 99.7 86.4 96.2Dividends 57.1 98.4 41.7 65.7
Total debt 518.5 580.2 455.9 518.2Shareholders equity 2,347.7 2,167.3 1,249.0 1,921.3Cash and short term investments 334.9 195.0 49.0 193.0Total assets 3,246.8 3,068.4 1,851.9 2,722.4
EBITDA margin (%) 59.2 44.6 48.2 50.7EBITDA interest coverage (x) 14.3 7.8 6.7 9.6FFO to total debt (%) 74.1 40.3 41.7 52.0Total debt to total capital (%) 18.0 21.0 26.7 21.9Total debt to EBITDA (x) 1.2 2.5 2.4 2.0
favorable debt maturity profile. Although the company could probablyincrease debt levels to finance relatively high capital expenditures inthe next five years in order to increase its installed capacity, thiswould not affect its solid financial condition due to the company'shigh liquidity reserves, low debt levels and good cash flowgeneration.
Colbún enjoys high liquidity and good financial flexibility, which isevidenced on its high US$334.9 million liquidity reserves and lowUS$8.8 million short-term financial debt as December 31 2006, andon its good access to credit. Although the high liquidity reserveswould decrease due to the financing of part of the relatively highcapital expenditures, these would remain at adequate levels,especially when considering the manageable debt maturities in thenext two years.
Colbún owns about 2400MW power generation capacity in the SIC.Colbún is 48.9% owned by Minera Valparaiso S.A. and ForestalComico S.A., which are part of the Chilean Matte Group.
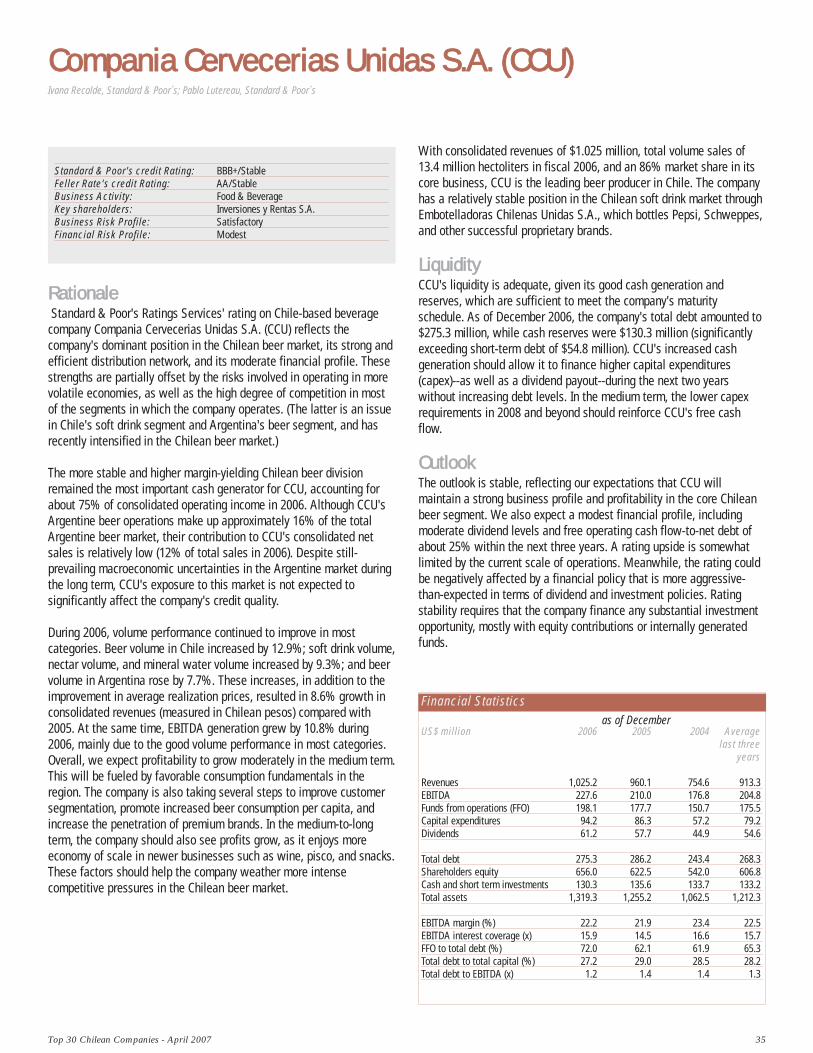
Top 30 Chilean Companies - April 2007 35
Compania CCervecerias UUnidas SS.A. ((CCU)
RRaattiioonnaallee Standard & Poor's Ratings Services' rating on Chile-based beverage
company Compania Cervecerias Unidas S.A. (CCU) reflects thecompany's dominant position in the Chilean beer market, its strong andefficient distribution network, and its moderate financial profile. Thesestrengths are partially offset by the risks involved in operating in morevolatile economies, as well as the high degree of competition in mostof the segments in which the company operates. (The latter is an issuein Chile's soft drink segment and Argentina's beer segment, and hasrecently intensified in the Chilean beer market.)
The more stable and higher margin-yielding Chilean beer divisionremained the most important cash generator for CCU, accounting forabout 75% of consolidated operating income in 2006. Although CCU'sArgentine beer operations make up approximately 16% of the totalArgentine beer market, their contribution to CCU's consolidated netsales is relatively low (12% of total sales in 2006). Despite still-prevailing macroeconomic uncertainties in the Argentine market duringthe long term, CCU's exposure to this market is not expected tosignificantly affect the company's credit quality.
During 2006, volume performance continued to improve in mostcategories. Beer volume in Chile increased by 12.9%; soft drink volume,nectar volume, and mineral water volume increased by 9.3%; and beervolume in Argentina rose by 7.7%. These increases, in addition to theimprovement in average realization prices, resulted in 8.6% growth inconsolidated revenues (measured in Chilean pesos) compared with2005. At the same time, EBITDA generation grew by 10.8% during2006, mainly due to the good volume performance in most categories. Overall, we expect profitability to grow moderately in the medium term.This will be fueled by favorable consumption fundamentals in theregion. The company is also taking several steps to improve customersegmentation, promote increased beer consumption per capita, andincrease the penetration of premium brands. In the medium-to-longterm, the company should also see profits grow, as it enjoys moreeconomy of scale in newer businesses such as wine, pisco, and snacks.These factors should help the company weather more intensecompetitive pressures in the Chilean beer market.
Standard & Poor's credit Rating: BBB+/StableFeller Rate's credit Rating: AA/StableBusiness Activity: Food & BeverageKey shareholders: Inversiones y Rentas S.A.Business Risk Profile: SatisfactoryFinancial Risk Profile: Modest
With consolidated revenues of $1.025 million, total volume sales of13.4 million hectoliters in fiscal 2006, and an 86% market share in itscore business, CCU is the leading beer producer in Chile. The companyhas a relatively stable position in the Chilean soft drink market throughEmbotelladoras Chilenas Unidas S.A., which bottles Pepsi, Schweppes,and other successful proprietary brands.
LLiiqquuiiddiittyy CCU's liquidity is adequate, given its good cash generation andreserves, which are sufficient to meet the company's maturityschedule. As of December 2006, the company's total debt amounted to$275.3 million, while cash reserves were $130.3 million (significantlyexceeding short-term debt of $54.8 million). CCU's increased cashgeneration should allow it to finance higher capital expenditures(capex)--as well as a dividend payout--during the next two yearswithout increasing debt levels. In the medium term, the lower capexrequirements in 2008 and beyond should reinforce CCU's free cashflow.
OOuuttllooookk The outlook is stable, reflecting our expectations that CCU willmaintain a strong business profile and profitability in the core Chileanbeer segment. We also expect a modest financial profile, includingmoderate dividend levels and free operating cash flow-to-net debt ofabout 25% within the next three years. A rating upside is somewhatlimited by the current scale of operations. Meanwhile, the rating couldbe negatively affected by a financial policy that is more aggressive-than-expected in terms of dividend and investment policies. Ratingstability requires that the company finance any substantial investmentopportunity, mostly with equity contributions or internally generatedfunds.
Ivana Recalde, Standard & Poor´s; Pablo Lutereau, Standard & Poor´s
Financial Statisticsas of December
US$ million 2006 2005 2004 Averagelast three
years
Revenues 1,025.2 960.1 754.6 913.3EBITDA 227.6 210.0 176.8 204.8Funds from operations (FFO) 198.1 177.7 150.7 175.5Capital expenditures 94.2 86.3 57.2 79.2Dividends 61.2 57.7 44.9 54.6
Total debt 275.3 286.2 243.4 268.3Shareholders equity 656.0 622.5 542.0 606.8Cash and short term investments 130.3 135.6 133.7 133.2Total assets 1,319.3 1,255.2 1,062.5 1,212.3
EBITDA margin (%) 22.2 21.9 23.4 22.5EBITDA interest coverage (x) 15.9 14.5 16.6 15.7FFO to total debt (%) 72.0 62.1 61.9 65.3Total debt to total capital (%) 27.2 29.0 28.5 28.2Total debt to EBITDA (x) 1.2 1.4 1.4 1.3
36 Top 30 Chilean Companies - April 2007
Compania GGeneral DDe EElectricidad SS.A.
RRaattiioonnaallee The ratings on Compañía General de Electricidad S.A. (CGE), a holding
company mainly engaged in electricity transmission and distribution(T&D) and natural and liquefied gas distribution in Chile as well aselectricity and natural gas distribution in Argentina, reflect the compan-y's strong business risk profile stemming from its solid position inChile's growing electricity T&D sector, which constitutes the company'score business and main cash source. Nevertheless, the ratings on CGEare constrained by the company's aggressive financial policy given thatthe company uses debt to finance its business expansion strategywhile maintaining a dividend policy that results in the distribution of agreat portion of its free cash flow generation.
CGE's individual senior unsecured debt would be rated one notch belowthe corporate credit rating on the company, reflecting structuralsubordination.
According to Standard & Poor's Ratings Services' criteria, whensubsidiary-level liabilities relating to consolidated assets are sizable,the senior unsecured debt rating on the parent is notched down fromthe corporate credit rating.
CGE's strong business risk profile mainly benefits from its monopolyoperations in electricity T&D in Chile. CGE is the second-largestelectricity distributor in Chile in terms of gigawatt-hours (GWh) sold(7,687 GWh to around 1.5 million customers in 2006), providing about15% of national demand. In addition, through its indirect subsidiaryMetrogas S.A., CGE is the sole distributor of natural gas in theSantiago metropolitan area, covering about 85% of the industrialsector. Nevertheless, Metrogas' operating performance and growthprospects have been affected by relatively large natural gas shortagesin Chile resulting from Argentine government restrictions on natural gasexports since March 2004. In addition, CGE's operations in Argentinapose a high regulatory and operational risk, although the exposure tothese operations is limited to a relatively small portion of consolidatedassets and cash flow generation.
Standard & Poor's credit Rating: BBB+/StableFeller-Rate's credit Rating: AA/StableBusiness Activity: Electric UtilityKey shareholders: Marin-Del Real, Almería, and
Pérez CruzBusiness Risk Profile: StrongFinancial Risk Profile: Aggressive
CGE's consolidated funds from operations (FFO) interest coverage andFFO to total average debt have improved to adequate levels for therating category: 5.1x and 22.6%, respectively, in 2006, from 4x and17.9% in 2004, and 4.3x and 19.7% in 2003. Although the natural gasrestrictions in Chile affect the expectations for improvement atMetrogas, we do not expect them to significantly impair CGE's debtrepayment capacity on an individual basis, because we project that theelectric subsidiaries will continue contributing at least $90 million to$110 million in dividends per year to CGE during the 2007-2008 period(compared to $132 million in dividends that the electric subsidiariesdistributed to CGE in 2006). We expect CGE to be able to service itsroughly $400 million individual debt as of Dec. 31, 2006, with dividendsreceived from those subsidiaries, and to refinance its debt maturitiesunder favorable terms because its good credit quality gives it fluidaccess to the financial markets.
Three Chilean groups control about 60% of CGE: Marin-Del Real,Almería, and Pérez Cruz. Institutional and small investors own the restof the company.
LLiiqquuiiddiittyy As of Dec. 31, 2006, CGE maintained a $35 million cash position, whichis relatively small compared with its $177 million short-term financialdebt. Nevertheless, CGE mitigates its refinancing risk with its goodaccess to the financial markets, which is a result of its strong creditquality.
CGE's consolidated debt is about 90% unidades de fomento and 85%Chilean pesos, and only 4% is exposed to exchange-rate fluctuations.CGE is in full compliance with the financial covenants included in itsdebt instruments.
OOuuttllooookk The stable outlook reflects our expectations that CGE's FFO interest
coverage and FFO-to-average debt ratios will be about 4.5x to 5x and20% to 25%, respectively, in the 2007-2008 period, and that total debt-to-EBITDA and debt-to-total capital ratios will be around 4x and 55%,respectively. An eventual deepening of the natural gas crisis couldnegatively affect Metrogas' performance, but it would not affect CGE'sdebt repayment capacity individually. In addition, the stable outlookreflects our belief that any potential new acquisition will not result in adeterioration of CGE's debt service coverage ratios (DSCR). The ratingson CGE could be lowered if the company's FFO interest coverage and
Sergio Fuentes, Standard & Poor´s; Ivana Recalde, Standard & Poor´s
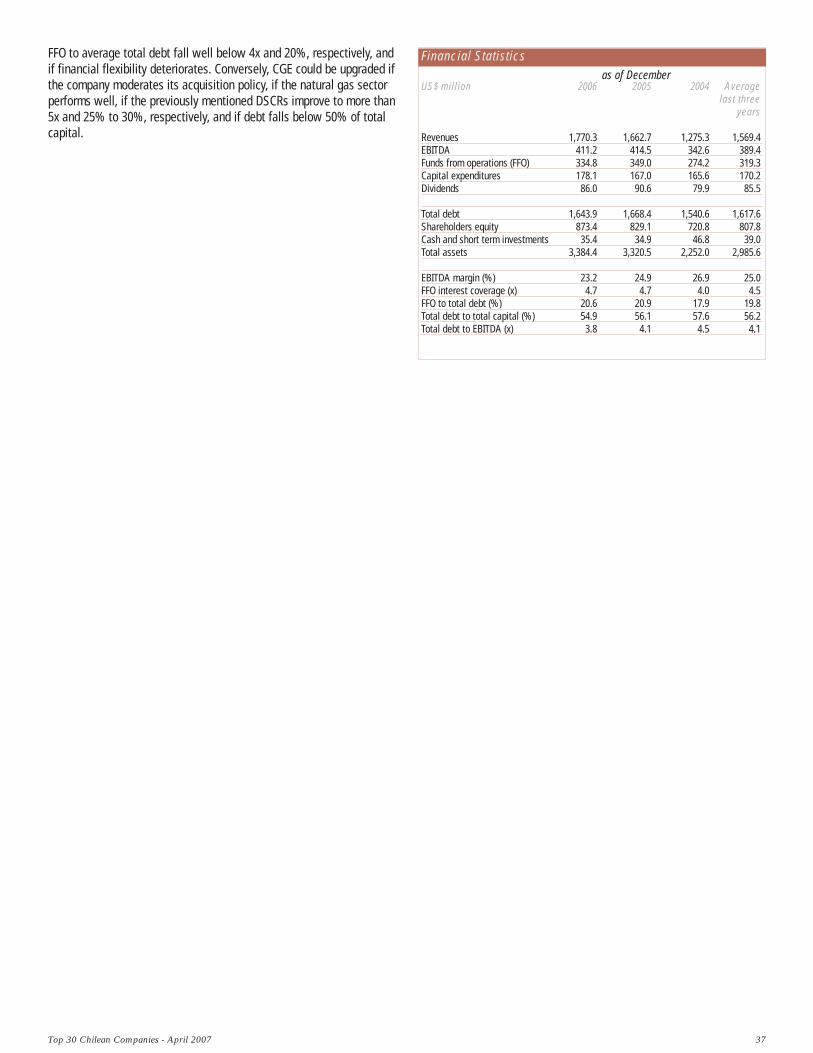
Top 30 Chilean Companies - April 2007 37
Financial Statisticsas of December
US$ million 2006 2005 2004 Averagelast three
years
Revenues 1,770.3 1,662.7 1,275.3 1,569.4EBITDA 411.2 414.5 342.6 389.4Funds from operations (FFO) 334.8 349.0 274.2 319.3Capital expenditures 178.1 167.0 165.6 170.2Dividends 86.0 90.6 79.9 85.5
Total debt 1,643.9 1,668.4 1,540.6 1,617.6Shareholders equity 873.4 829.1 720.8 807.8Cash and short term investments 35.4 34.9 46.8 39.0Total assets 3,384.4 3,320.5 2,252.0 2,985.6
EBITDA margin (%) 23.2 24.9 26.9 25.0FFO interest coverage (x) 4.7 4.7 4.0 4.5FFO to total debt (%) 20.6 20.9 17.9 19.8Total debt to total capital (%) 54.9 56.1 57.6 56.2Total debt to EBITDA (x) 3.8 4.1 4.5 4.1
FFO to average total debt fall well below 4x and 20%, respectively, andif financial flexibility deteriorates. Conversely, CGE could be upgraded ifthe company moderates its acquisition policy, if the natural gas sectorperforms well, if the previously mentioned DSCRs improve to more than5x and 25% to 30%, respectively, and if debt falls below 50% of totalcapital.

38 Top 30 Chilean Companies - April 2007
Corporacion NNacional DDel CCobre DDe CChile ((Codelco)
RRaattiioonnaallee The ratings assigned by Standard and Poor's Ratings Services to Chile-
based copper producer Corporación Nacional del Cobre de Chile(Codelco) mainly reflect the company's strong market position as theworld's largest integrated copper mining company, with ample high-grade copper ore reserves; its cost structure, which is highly competiti-ve on a global basis; and its direct ownership by and strategic impor-tance to its 100% shareholder, the Republic of Chile (FC: A/Positive/A-1; LC: AA/Stable/A-1+). These strengths are partly counterbalanced bythe inherent cyclicality of the industry, which results in volatile copperprices and cash-flow generation; a lack of geographic diversification onthe production side, with all operations located in Chile; the heavy taxand dividend burden imposed by the Chilean government; and the com-pany's aggressive financial policy.
We rate Codelco according to our criteria for government-relatedentities. We consider Codelco a public-policy-based company becauseit plays a pivotal public role for the Chilean economy. Codelco's stand-alone creditworthiness has weakened significantly since 2002, mainlyas a result of the large increase in debt levels to finance the gapbetween the company's cash-flow generation and its high capitalexpenditures and dividend payments. However, the rating is ultimatelysupported by the company's strategic links to the government, includingits 100% ownership and control by the Chilean government and itsimportance to the country. We expect the company's close links withthe government to continue to influence its credit quality, as we deemprivatization unlikely.
Codelco accounts for approximately 11% of copper productionworldwide, which is sold to a relatively well-diversified client base.Copper accounts for approximately 80%-90% of total sales, but thecompany also benefits from its position as the world's largest producerof molybdenum. Codelco's ample high-grade copper ore reservesaccount for approximately 20% of proven, probable, and possiblereserves worldwide, and have allowed the company to achieve largeeconomies of scale and to rank among the world's lowest-cost copperproducers. Although we expect Codelco's production costs to increasemodestly during the next several years because of a slow naturaldecline in ore grade, we expect that the company's cost profile willremain in the lowest cost-quartile of the industry's cost curveworldwide.
Standard & Poor's credit Rating: A/StableFeller Rate's credit Rating: AAA/StableBusiness Activity: Metals and MiningKey shareholders: Republic of ChileBusiness Risk Profile: StrongFinancial Risk Profile: Aggressive
During 2006, Codelco continued to report very high profitability andcash-flow generation, due primarily to the favorable pricingenvironment for copper. Codelco's EBITDA margin reached 60.1% infiscal 2006 (compared with 57.7% in 2005, 49.6% in 2004, and 33.5%in 2003), mainly reflecting the significant increase in the averagecopper price to $3.05 per pound in 2006 (compared with $1.67 perpound in 2005, $1.30 per pound in 2004, and $0.81 per pound in 2003).Nevertheless, debt continued to increase, driven by high capitalexpenditures and dividends paid out during the year. Codelco's financialdebt increased to $4.4 billion as of December 2006--includingcommercial debt with China's state-owned Minmetals NonferrousMetals Co. Ltd. (MinMetals)--which represents an increase of 20% for2006 and 124% during the past four years.
When comparing Codelco's cash-flow generation capacity with itsfinancial debt, given that the company's dividend policy is relativelyfixed, we adjust the cash-flow generation figures by deducting dividendpayments from the company's funds from operations (FFO). Although allcash flow measures improved in 2006 as a result of higher copperprices, we expect the ratio of adjusted cash generation (FFO lessdividends) to total debt--which reached 26% in 2006--to deterioratesignificantly in 2007 as Codelco pays dividends on the extraordinaryresults achieved in 2006.
On Feb. 12, 2007, the Chilean Ministry of Economy announced a $313.5million capitalization of Codelco's 2006 earnings and the creation of a$400 million reserve fund to finance capital expenditures. While thesemeasures are credit positive for Codelco, they provide only minor relieffor the company's high need for cash. Capital expenditures could reachabout $2 billion-$2.5 billion for 2007 and will probably require anincrease in debt of about $500 million-$1 billion. If the Chileangovernment decides to significantly reduce dividend payments,however, Codelco's adjusted debt-service coverage ratios couldsignificantly improve. As mentioned above, this will be particularlyrelevant in 2007.
In March 2006, Codelco and MinMetals signed a long-term commercialagreement under which Codelco will sell 55,750 tons per year for 15years to a joint venture 50% owned by each of the companies. Codelcocollected a $550 million advance payment from the joint venture. Weview this payment as similar to long-term financial debt that willgradually decrease every year as copper is delivered. However, thistransaction involves only a minor portion of Codelco's production, andthus does not significantly affect its cash flows or credit quality.
Sergio Fuentes, Standard & Poor´s ; Marta Castelli, Standard & Poor´s

Top 30 Chilean Companies - April 2007 39
LLiiqquuiiddiittyyCodelco's liquidity is adequate and benefits from the company's verygood financial flexibility. This flexibility is supported by its strongbusiness-risk profile and 100% ownership by and strategic importanceto the Republic of Chile, and is evidenced by its fluid access to theglobal and local financial markets at very attractive interest rates.However, the company routinely has significant negative free cash flowdue to its 100% dividend payout to the government owner and debt-financed capital expenditures. Nevertheless, Codelco has a favorabledebt structure, with no debt maturities in 2007 and manageable debtmaturities of about $300 million in 2008. A fair number of thecompany's debt instruments contain, among other non-financialcovenants, a change-of-control clause that allows for the accelerationof most of its debt upon the loss of majority ownership by the ChileanRepublic.
OOuuttllooookk The stable outlook on the ratings incorporates our expectations that
Codelco will be supported by the Chilean government, if necessary,given the company's strategic importance to the Chilean economy.Ratings upside depends on a significant improvement of Codelco'sfinancial profile and would require a more conservative financial policy.The ratings on Codelco could be pressured downward in scenariosinvolving significant deterioration of the company's financial profile,and/or a perception that the company's importance to the Chileangovernment is diminishing, or a potential privatization.
Financial Statisticsas of December
US$ million 2006 2005 2004 Averagelast three
years
Revenues 17,077.0 10,490.6 8,203.7 11,923.8EBITDA 10,261.0 6,052.1 4,066.0 6,793.0Funds from operations (FFO) 3,026.5 2,443.9 1,702.0 2,390.8Capital expenditures 1,218.7 1,844.7 893.1 1,318.8Dividends 1,750.0 1,714.3 1,084.6 1,516.3
Total debt 4,449.0 3,705.8 2,917.0 3,690.6Shareholders equity 4,527.6 2,941.0 2,871.9 3,446.8Cash and short term investments 833.1 217.6 255.0 435.2Total assets 13,032.8 10,739.0 8,833.4 10,868.4
EBITDA margin (%) 60.1 57.7 49.6 55.8EBITDA interest coverage (x) 43.5 32.0 28.5 34.7FFO to total debt (%) 68.0 65.9 58.3 64.1Total debt to total capital (%) 49.5 55.7 50.4 51.9Total debt to EBITDA (x) 0.4 0.6 0.7 0.6
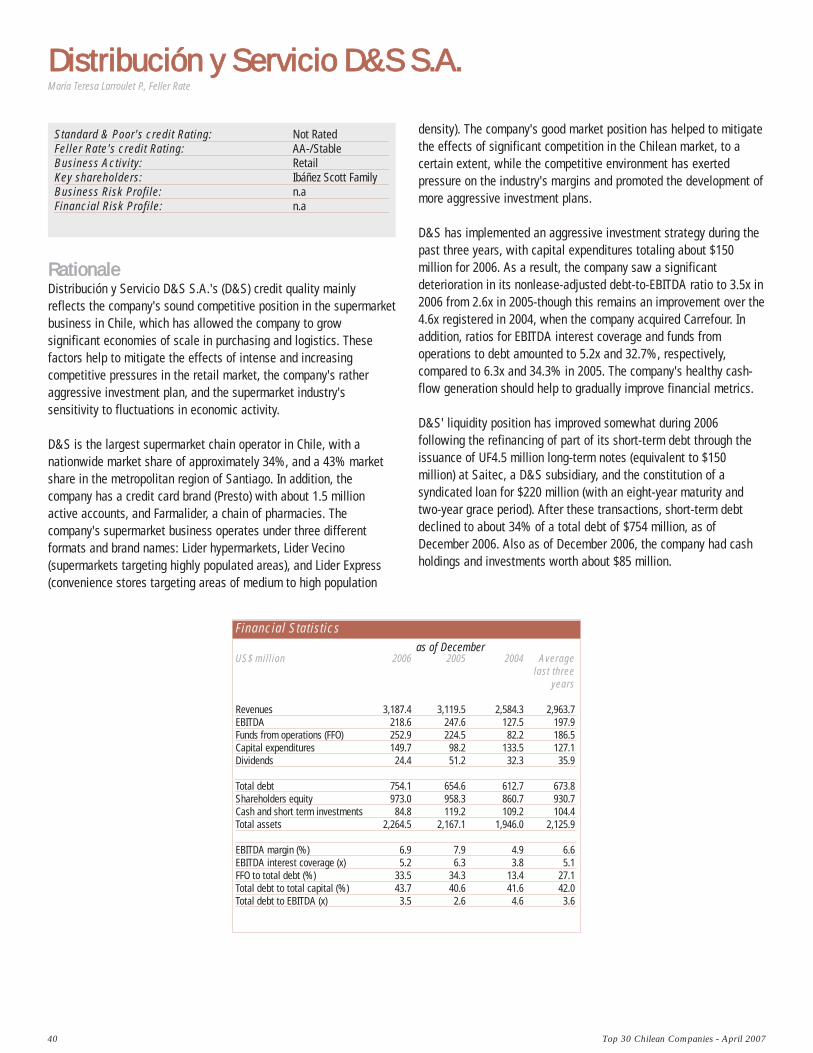
40 Top 30 Chilean Companies - April 2007
Distribución yy SServicio DD&S SS.A.
RRaattiioonnaalleeDistribución y Servicio D&S S.A.'s (D&S) credit quality mainlyreflects the company's sound competitive position in the supermarketbusiness in Chile, which has allowed the company to growsignificant economies of scale in purchasing and logistics. Thesefactors help to mitigate the effects of intense and increasingcompetitive pressures in the retail market, the company's ratheraggressive investment plan, and the supermarket industry'ssensitivity to fluctuations in economic activity.
D&S is the largest supermarket chain operator in Chile, with anationwide market share of approximately 34%, and a 43% marketshare in the metropolitan region of Santiago. In addition, thecompany has a credit card brand (Presto) with about 1.5 millionactive accounts, and Farmalider, a chain of pharmacies. Thecompany's supermarket business operates under three differentformats and brand names: Lider hypermarkets, Lider Vecino(supermarkets targeting highly populated areas), and Lider Express(convenience stores targeting areas of medium to high population
Standard & Poor's credit Rating: Not RatedFeller Rate's credit Rating: AA-/StableBusiness Activity: RetailKey shareholders: Ibáñez Scott FamilyBusiness Risk Profile: n.aFinancial Risk Profile: n.a
density). The company's good market position has helped to mitigatethe effects of significant competition in the Chilean market, to acertain extent, while the competitive environment has exertedpressure on the industry's margins and promoted the development ofmore aggressive investment plans.
D&S has implemented an aggressive investment strategy during thepast three years, with capital expenditures totaling about $150million for 2006. As a result, the company saw a significantdeterioration in its nonlease-adjusted debt-to-EBITDA ratio to 3.5x in2006 from 2.6x in 2005-though this remains an improvement over the4.6x registered in 2004, when the company acquired Carrefour. Inaddition, ratios for EBITDA interest coverage and funds fromoperations to debt amounted to 5.2x and 32.7%, respectively,compared to 6.3x and 34.3% in 2005. The company's healthy cash-flow generation should help to gradually improve financial metrics.
D&S' liquidity position has improved somewhat during 2006following the refinancing of part of its short-term debt through theissuance of UF4.5 million long-term notes (equivalent to $150million) at Saitec, a D&S subsidiary, and the constitution of asyndicated loan for $220 million (with an eight-year maturity andtwo-year grace period). After these transactions, short-term debtdeclined to about 34% of a total debt of $754 million, as ofDecember 2006. Also as of December 2006, the company had cashholdings and investments worth about $85 million.
María Teresa Larroulet P., Feller Rate
Financial Statisticsas of December
US$ million 2006 2005 2004 Averagelast three
years
Revenues 3,187.4 3,119.5 2,584.3 2,963.7EBITDA 218.6 247.6 127.5 197.9Funds from operations (FFO) 252.9 224.5 82.2 186.5Capital expenditures 149.7 98.2 133.5 127.1Dividends 24.4 51.2 32.3 35.9
Total debt 754.1 654.6 612.7 673.8Shareholders equity 973.0 958.3 860.7 930.7Cash and short term investments 84.8 119.2 109.2 104.4Total assets 2,264.5 2,167.1 1,946.0 2,125.9
EBITDA margin (%) 6.9 7.9 4.9 6.6EBITDA interest coverage (x) 5.2 6.3 3.8 5.1FFO to total debt (%) 33.5 34.3 13.4 27.1Total debt to total capital (%) 43.7 40.6 41.6 42.0Total debt to EBITDA (x) 3.5 2.6 4.6 3.6
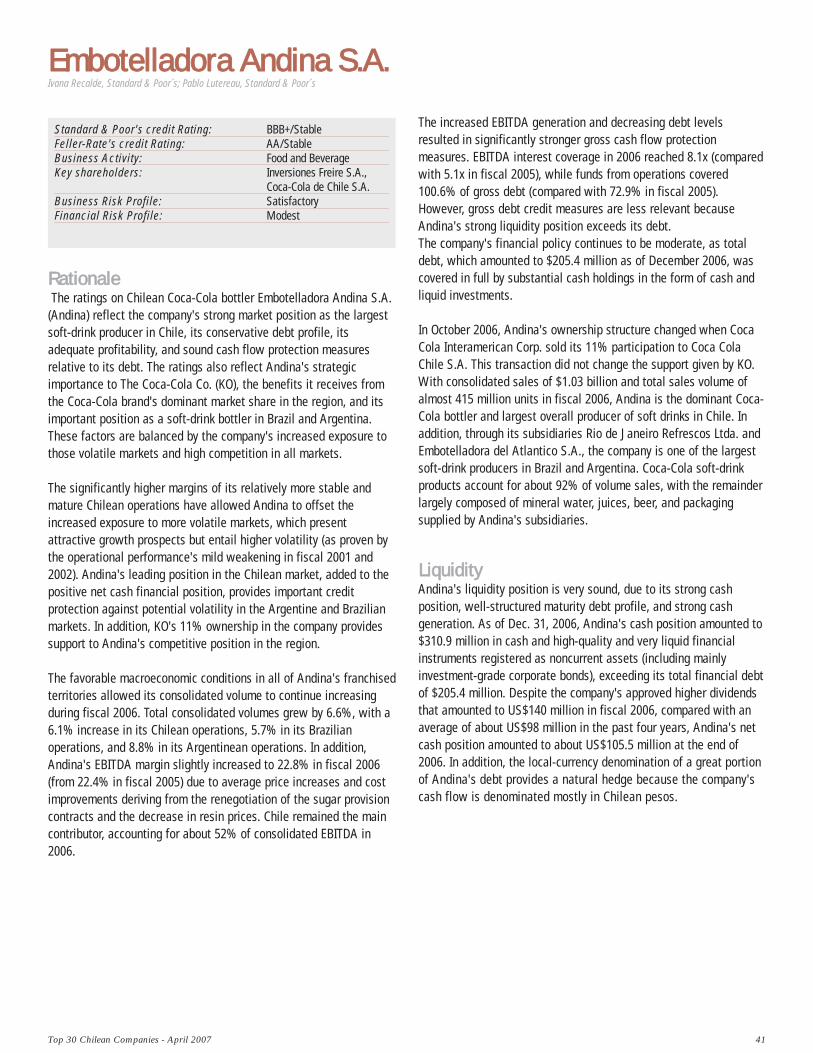
Top 30 Chilean Companies - April 2007 41
Embotelladora AAndina SS.A.
RRaattiioonnaalleeThe ratings on Chilean Coca-Cola bottler Embotelladora Andina S.A.
(Andina) reflect the company's strong market position as the largestsoft-drink producer in Chile, its conservative debt profile, itsadequate profitability, and sound cash flow protection measuresrelative to its debt. The ratings also reflect Andina's strategicimportance to The Coca-Cola Co. (KO), the benefits it receives fromthe Coca-Cola brand's dominant market share in the region, and itsimportant position as a soft-drink bottler in Brazil and Argentina.These factors are balanced by the company's increased exposure tothose volatile markets and high competition in all markets.
The significantly higher margins of its relatively more stable andmature Chilean operations have allowed Andina to offset theincreased exposure to more volatile markets, which presentattractive growth prospects but entail higher volatility (as proven bythe operational performance's mild weakening in fiscal 2001 and2002). Andina's leading position in the Chilean market, added to thepositive net cash financial position, provides important creditprotection against potential volatility in the Argentine and Brazilianmarkets. In addition, KO's 11% ownership in the company providessupport to Andina's competitive position in the region.
The favorable macroeconomic conditions in all of Andina's franchisedterritories allowed its consolidated volume to continue increasingduring fiscal 2006. Total consolidated volumes grew by 6.6%, with a6.1% increase in its Chilean operations, 5.7% in its Brazilianoperations, and 8.8% in its Argentinean operations. In addition,Andina's EBITDA margin slightly increased to 22.8% in fiscal 2006(from 22.4% in fiscal 2005) due to average price increases and costimprovements deriving from the renegotiation of the sugar provisioncontracts and the decrease in resin prices. Chile remained the maincontributor, accounting for about 52% of consolidated EBITDA in2006.
Standard & Poor's credit Rating: BBB+/StableFeller-Rate's credit Rating: AA/StableBusiness Activity: Food and BeverageKey shareholders: Inversiones Freire S.A.,
Coca-Cola de Chile S.A.Business Risk Profile: SatisfactoryFinancial Risk Profile: Modest
The increased EBITDA generation and decreasing debt levelsresulted in significantly stronger gross cash flow protectionmeasures. EBITDA interest coverage in 2006 reached 8.1x (comparedwith 5.1x in fiscal 2005), while funds from operations covered100.6% of gross debt (compared with 72.9% in fiscal 2005).However, gross debt credit measures are less relevant becauseAndina's strong liquidity position exceeds its debt. The company's financial policy continues to be moderate, as totaldebt, which amounted to $205.4 million as of December 2006, wascovered in full by substantial cash holdings in the form of cash andliquid investments.
In October 2006, Andina's ownership structure changed when CocaCola Interamerican Corp. sold its 11% participation to Coca ColaChile S.A. This transaction did not change the support given by KO.With consolidated sales of $1.03 billion and total sales volume ofalmost 415 million units in fiscal 2006, Andina is the dominant Coca-Cola bottler and largest overall producer of soft drinks in Chile. Inaddition, through its subsidiaries Rio de Janeiro Refrescos Ltda. andEmbotelladora del Atlantico S.A., the company is one of the largestsoft-drink producers in Brazil and Argentina. Coca-Cola soft-drinkproducts account for about 92% of volume sales, with the remainderlargely composed of mineral water, juices, beer, and packagingsupplied by Andina's subsidiaries.
LLiiqquuiiddiittyy Andina's liquidity position is very sound, due to its strong cashposition, well-structured maturity debt profile, and strong cashgeneration. As of Dec. 31, 2006, Andina's cash position amounted to$310.9 million in cash and high-quality and very liquid financialinstruments registered as noncurrent assets (including mainlyinvestment-grade corporate bonds), exceeding its total financial debtof $205.4 million. Despite the company's approved higher dividendsthat amounted to US$140 million in fiscal 2006, compared with anaverage of about US$98 million in the past four years, Andina's netcash position amounted to about US$105.5 million at the end of2006. In addition, the local-currency denomination of a great portionof Andina's debt provides a natural hedge because the company'scash flow is denominated mostly in Chilean pesos.
Ivana Recalde, Standard & Poor´s; Pablo Lutereau, Standard & Poor´s
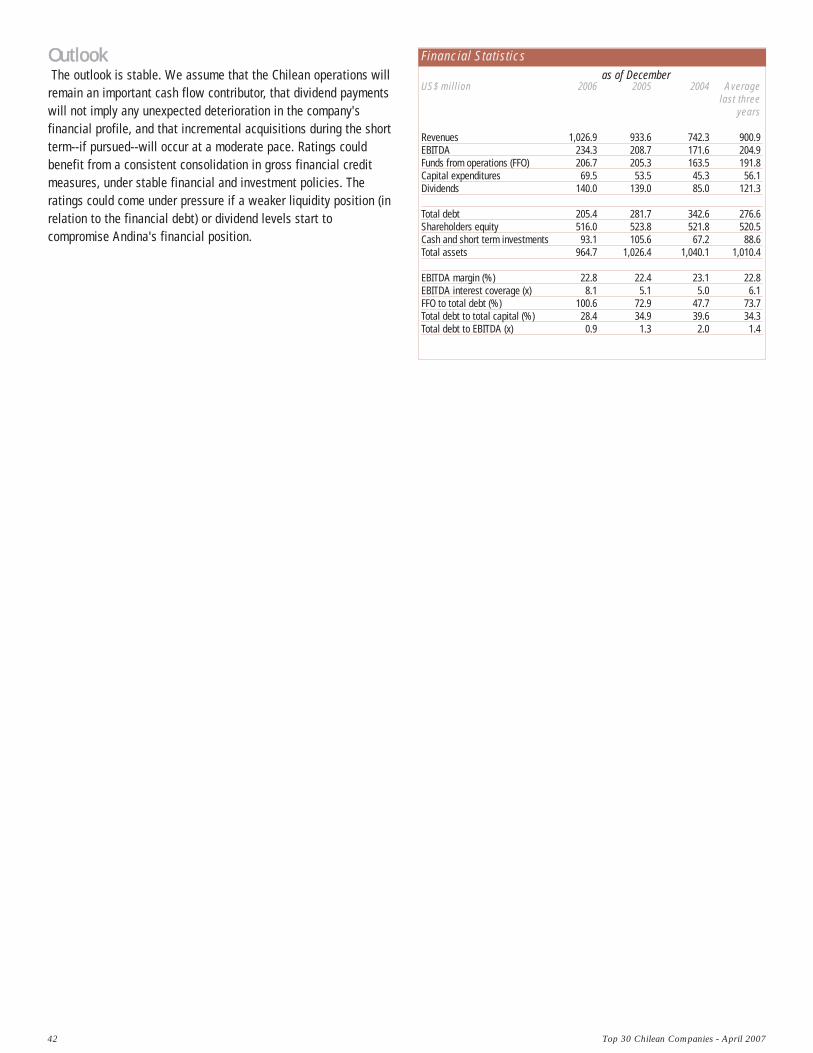
42 Top 30 Chilean Companies - April 2007
Financial Statisticsas of December
US$ million 2006 2005 2004 Averagelast three
years
Revenues 1,026.9 933.6 742.3 900.9EBITDA 234.3 208.7 171.6 204.9Funds from operations (FFO) 206.7 205.3 163.5 191.8Capital expenditures 69.5 53.5 45.3 56.1Dividends 140.0 139.0 85.0 121.3
Total debt 205.4 281.7 342.6 276.6Shareholders equity 516.0 523.8 521.8 520.5Cash and short term investments 93.1 105.6 67.2 88.6Total assets 964.7 1,026.4 1,040.1 1,010.4
EBITDA margin (%) 22.8 22.4 23.1 22.8EBITDA interest coverage (x) 8.1 5.1 5.0 6.1FFO to total debt (%) 100.6 72.9 47.7 73.7Total debt to total capital (%) 28.4 34.9 39.6 34.3Total debt to EBITDA (x) 0.9 1.3 2.0 1.4
OOuuttllooookkThe outlook is stable. We assume that the Chilean operations will
remain an important cash flow contributor, that dividend paymentswill not imply any unexpected deterioration in the company'sfinancial profile, and that incremental acquisitions during the shortterm--if pursued--will occur at a moderate pace. Ratings couldbenefit from a consistent consolidation in gross financial creditmeasures, under stable financial and investment policies. Theratings could come under pressure if a weaker liquidity position (inrelation to the financial debt) or dividend levels start tocompromise Andina's financial position.
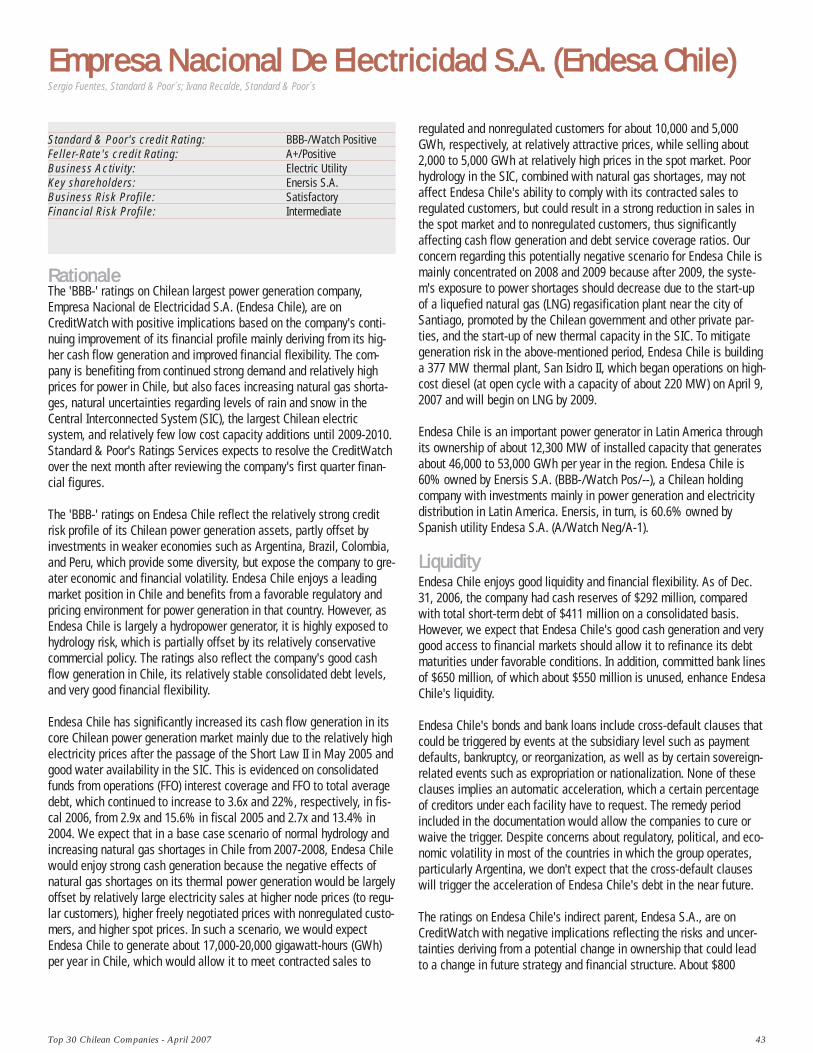
Top 30 Chilean Companies - April 2007 43
Empresa NNacional DDe EElectricidad SS.A. ((Endesa CChile)
RRaattiioonnaallee The 'BBB-' ratings on Chilean largest power generation company,Empresa Nacional de Electricidad S.A. (Endesa Chile), are onCreditWatch with positive implications based on the company's conti-nuing improvement of its financial profile mainly deriving from its hig-her cash flow generation and improved financial flexibility. The com-pany is benefiting from continued strong demand and relatively highprices for power in Chile, but also faces increasing natural gas shorta-ges, natural uncertainties regarding levels of rain and snow in theCentral Interconnected System (SIC), the largest Chilean electricsystem, and relatively few low cost capacity additions until 2009-2010.Standard & Poor's Ratings Services expects to resolve the CreditWatchover the next month after reviewing the company's first quarter finan-cial figures.
The 'BBB-' ratings on Endesa Chile reflect the relatively strong creditrisk profile of its Chilean power generation assets, partly offset byinvestments in weaker economies such as Argentina, Brazil, Colombia,and Peru, which provide some diversity, but expose the company to gre-ater economic and financial volatility. Endesa Chile enjoys a leadingmarket position in Chile and benefits from a favorable regulatory andpricing environment for power generation in that country. However, asEndesa Chile is largely a hydropower generator, it is highly exposed tohydrology risk, which is partially offset by its relatively conservativecommercial policy. The ratings also reflect the company's good cashflow generation in Chile, its relatively stable consolidated debt levels,and very good financial flexibility.
Endesa Chile has significantly increased its cash flow generation in itscore Chilean power generation market mainly due to the relatively highelectricity prices after the passage of the Short Law II in May 2005 andgood water availability in the SIC. This is evidenced on consolidatedfunds from operations (FFO) interest coverage and FFO to total averagedebt, which continued to increase to 3.6x and 22%, respectively, in fis-cal 2006, from 2.9x and 15.6% in fiscal 2005 and 2.7x and 13.4% in2004. We expect that in a base case scenario of normal hydrology andincreasing natural gas shortages in Chile from 2007-2008, Endesa Chilewould enjoy strong cash generation because the negative effects ofnatural gas shortages on its thermal power generation would be largelyoffset by relatively large electricity sales at higher node prices (to regu-lar customers), higher freely negotiated prices with nonregulated custo-mers, and higher spot prices. In such a scenario, we would expectEndesa Chile to generate about 17,000-20,000 gigawatt-hours (GWh)per year in Chile, which would allow it to meet contracted sales to
Standard & Poor's credit Rating: BBB-/Watch PositiveFeller-Rate's credit Rating: A+/PositiveBusiness Activity: Electric UtilityKey shareholders: Enersis S.A. Business Risk Profile: SatisfactoryFinancial Risk Profile: Intermediate
regulated and nonregulated customers for about 10,000 and 5,000GWh, respectively, at relatively attractive prices, while selling about2,000 to 5,000 GWh at relatively high prices in the spot market. Poorhydrology in the SIC, combined with natural gas shortages, may notaffect Endesa Chile's ability to comply with its contracted sales toregulated customers, but could result in a strong reduction in sales inthe spot market and to nonregulated customers, thus significantlyaffecting cash flow generation and debt service coverage ratios. Ourconcern regarding this potentially negative scenario for Endesa Chile ismainly concentrated on 2008 and 2009 because after 2009, the syste-m's exposure to power shortages should decrease due to the start-upof a liquefied natural gas (LNG) regasification plant near the city ofSantiago, promoted by the Chilean government and other private par-ties, and the start-up of new thermal capacity in the SIC. To mitigategeneration risk in the above-mentioned period, Endesa Chile is buildinga 377 MW thermal plant, San Isidro II, which began operations on high-cost diesel (at open cycle with a capacity of about 220 MW) on April 9,2007 and will begin on LNG by 2009.
Endesa Chile is an important power generator in Latin America throughits ownership of about 12,300 MW of installed capacity that generatesabout 46,000 to 53,000 GWh per year in the region. Endesa Chile is60% owned by Enersis S.A. (BBB-/Watch Pos/--), a Chilean holdingcompany with investments mainly in power generation and electricitydistribution in Latin America. Enersis, in turn, is 60.6% owned bySpanish utility Endesa S.A. (A/Watch Neg/A-1).
LLiiqquuiiddiittyyEndesa Chile enjoys good liquidity and financial flexibility. As of Dec.31, 2006, the company had cash reserves of $292 million, comparedwith total short-term debt of $411 million on a consolidated basis.However, we expect that Endesa Chile's good cash generation and verygood access to financial markets should allow it to refinance its debtmaturities under favorable conditions. In addition, committed bank linesof $650 million, of which about $550 million is unused, enhance EndesaChile's liquidity.
Endesa Chile's bonds and bank loans include cross-default clauses thatcould be triggered by events at the subsidiary level such as paymentdefaults, bankruptcy, or reorganization, as well as by certain sovereign-related events such as expropriation or nationalization. None of theseclauses implies an automatic acceleration, which a certain percentageof creditors under each facility have to request. The remedy periodincluded in the documentation would allow the companies to cure orwaive the trigger. Despite concerns about regulatory, political, and eco-nomic volatility in most of the countries in which the group operates,particularly Argentina, we don't expect that the cross-default clauseswill trigger the acceleration of Endesa Chile's debt in the near future.
The ratings on Endesa Chile's indirect parent, Endesa S.A., are onCreditWatch with negative implications reflecting the risks and uncer-tainties deriving from a potential change in ownership that could leadto a change in future strategy and financial structure. About $800
Sergio Fuentes, Standard & Poor´s; Ivana Recalde, Standard & Poor´s
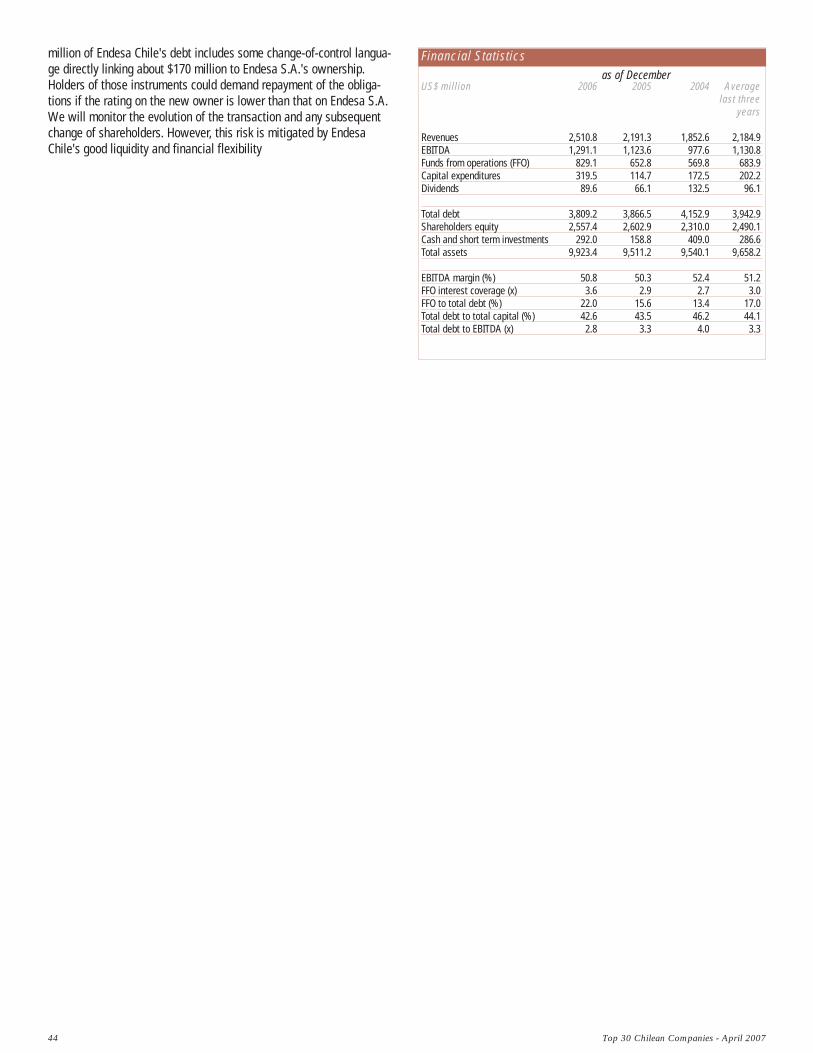
44 Top 30 Chilean Companies - April 2007
million of Endesa Chile's debt includes some change-of-control langua-ge directly linking about $170 million to Endesa S.A.'s ownership.Holders of those instruments could demand repayment of the obliga-tions if the rating on the new owner is lower than that on Endesa S.A.We will monitor the evolution of the transaction and any subsequentchange of shareholders. However, this risk is mitigated by EndesaChile's good liquidity and financial flexibility
Financial Statisticsas of December
US$ million 2006 2005 2004 Averagelast three
years
Revenues 2,510.8 2,191.3 1,852.6 2,184.9EBITDA 1,291.1 1,123.6 977.6 1,130.8Funds from operations (FFO) 829.1 652.8 569.8 683.9Capital expenditures 319.5 114.7 172.5 202.2Dividends 89.6 66.1 132.5 96.1
Total debt 3,809.2 3,866.5 4,152.9 3,942.9Shareholders equity 2,557.4 2,602.9 2,310.0 2,490.1Cash and short term investments 292.0 158.8 409.0 286.6Total assets 9,923.4 9,511.2 9,540.1 9,658.2
EBITDA margin (%) 50.8 50.3 52.4 51.2FFO interest coverage (x) 3.6 2.9 2.7 3.0FFO to total debt (%) 22.0 15.6 13.4 17.0Total debt to total capital (%) 42.6 43.5 46.2 44.1Total debt to EBITDA (x) 2.8 3.3 4.0 3.3
Top 30 Chilean Companies - April 2007 45
Empresa NNacional DDe PPetroleo ((ENAP)
RRaattiioonnaallee The ratings on Chilean oil and gas company Empresa Nacional de
Petroleo (ENAP) reflect 100% ownership of the company by theRepublic of Chile; ENAP's increasing importance as a public policyentity; its strong position in its core business as the only Chileandomestic oil refiner, supplying about 86% of local market needs;and an intermediate-to-aggressive financial profile. These factorsare partly offset by the volatility and cyclicality of internationalrefining margins, the company's heavy use of financial debt, andthe challenges of expanding in the capital-intensive upstreamsegment with limited cash flow.
The rating assigned to ENAP follows Standard & Poor's RatingsServices' government-related entity criteria, whereby anassessment is made of ENAP's credit quality, independent of itsowner, with the final rating reflecting a degree of implicit supportfrom government ownership. Given strong government influence onENAP's activities, the rating reflects an expectation of moderategovernment support. It also reflects a relatively limited publicpolicy role and limited contribution to the Chilean budget and GDP.Although the rating considers some government support, we do notbelieve integrating the company and government would mandate anequalization of both ratings.
ENAP is highly influenced by the Chilean government, particularlyin the budget approval process, and in debt authorization and taxpayments. Like other government-owned companies in Chile, ENAPis burdened with an additional income tax of 40%, in excess of the17% standard corporate tax rate.
ENAP's stand-alone credit quality has been deteriorating relative tothat of its peers, mainly as a result of its expansion strategycombined with a heavy tax and dividend burden imposed by itsowner, the Republic of Chile. As a result, high oil prices andrefining margins have translated into relatively modest free cash-flow generation. Although the government partially relaxed the
Standard & Poor's credit Rating: A/StableFeller-Rate's credit Rating: AAA/EstableBusiness Activity: Oil and GasKey shareholders: Republic of ChileBusiness Risk Profile: StrongFinancial Risk Profile: Aggressive
transfer mechanism in 2005 (allowing ENAP to retain earningswhen ROE exceeds a certain threshold), we still expect ENAP'sstand-alone credit metrics to be under pressure given the financingrequirements of the capital expenditure program, which willcontinue to compare unfavorably with those of its rated oil and gaspeers.
ENAP has a competitive cost structure, and a strong businessprofile supported by its dominant position in Chile's growingrefined-products market. Through its three refining facilities, ENAPhas 100% of Chile's refining capacity, and is the leading supplier ofthe domestic market. The refineries have efficient operations andbenefit from very good logistics and a long commercial trackrecord. Nevertheless, we have concerns regarding ENAP'sexpansion strategy in the upstream business given the significantcapital expenditures (capex) involved, and the modest impact onoperating results relative to the investments made. We considerthis expansion to be a key credit factor that could result in a riskierbusiness profile, adding pressure to the financial profile and therating category. While the growing exploration and productiondivision might strengthen ENAP's cash-flow generation ability, wedo not currently expect it to become a major driver of profitability. In our opinion, ENAP's main credit metrics are weak for the ratingcategory. Since August 2006, financial performance has beenaffected mainly by the decrease in crude oil prices, when ENAPsaw high inventory levels. As a result, funds from operations (FFO)-to-total debt and EBITDA interest coverage ratios reached 27.4%and 4.2x, respectively, in fiscal 2006, down from 29.7% and 7.2x infiscal 2005. In addition, the investment process in bothdownstream and upstream markets, coupled with significantworking capital swings due to volatile crude oil prices, left littleroom for debt reduction, despite the relaxed dividend policy.
ENAP benefits from a favorable debt maturity schedule and healthyfinancial flexibility, given its access to the financial markets at verycompetitive interest rates. Nevertheless, leverage has becomemore aggressive during the past few years, with total debt tocapitalization at 52.4% as of Dec. 31, 2006 (including suppliersfinancing), and total debt to EBITDA at 2.3x.
Government-owned ENAP is a Chilean oil and gas company withstrong roots in the domestic downstream market, with somemodest domestic and foreign upstream activities. Formed in 1950by Law 9,618, ENAP was reorganized as a holding company in1981.
Pablo Lutereau, Standard & Poor´s ; Luciano Gremone, Standard & Poor´s
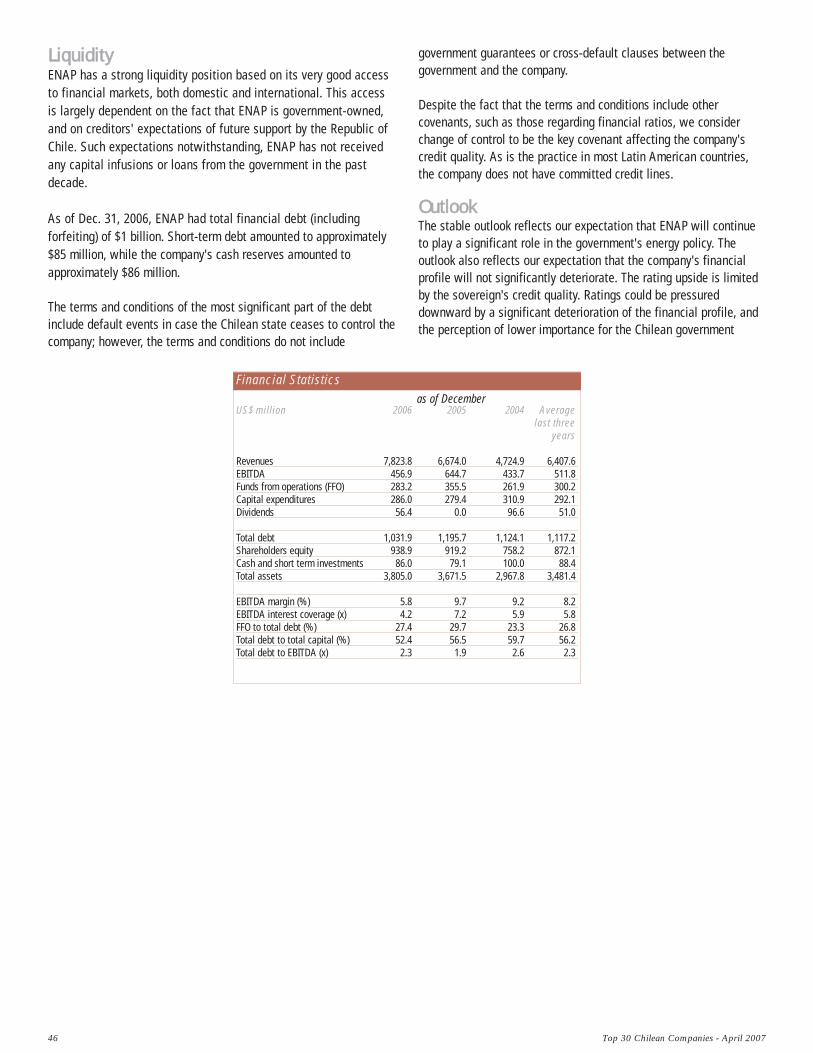
46 Top 30 Chilean Companies - April 2007
government guarantees or cross-default clauses between thegovernment and the company.
Despite the fact that the terms and conditions include othercovenants, such as those regarding financial ratios, we considerchange of control to be the key covenant affecting the company'scredit quality. As is the practice in most Latin American countries,the company does not have committed credit lines.
OOuuttllooookk The stable outlook reflects our expectation that ENAP will continueto play a significant role in the government's energy policy. Theoutlook also reflects our expectation that the company's financialprofile will not significantly deteriorate. The rating upside is limitedby the sovereign's credit quality. Ratings could be pressureddownward by a significant deterioration of the financial profile, andthe perception of lower importance for the Chilean government
LLiiqquuiiddiittyy ENAP has a strong liquidity position based on its very good accessto financial markets, both domestic and international. This accessis largely dependent on the fact that ENAP is government-owned,and on creditors' expectations of future support by the Republic ofChile. Such expectations notwithstanding, ENAP has not receivedany capital infusions or loans from the government in the pastdecade.
As of Dec. 31, 2006, ENAP had total financial debt (includingforfeiting) of $1 billion. Short-term debt amounted to approximately$85 million, while the company's cash reserves amounted toapproximately $86 million.
The terms and conditions of the most significant part of the debtinclude default events in case the Chilean state ceases to control thecompany; however, the terms and conditions do not include
Financial Statisticsas of December
US$ million 2006 2005 2004 Averagelast three
years
Revenues 7,823.8 6,674.0 4,724.9 6,407.6EBITDA 456.9 644.7 433.7 511.8Funds from operations (FFO) 283.2 355.5 261.9 300.2Capital expenditures 286.0 279.4 310.9 292.1Dividends 56.4 0.0 96.6 51.0
Total debt 1,031.9 1,195.7 1,124.1 1,117.2Shareholders equity 938.9 919.2 758.2 872.1Cash and short term investments 86.0 79.1 100.0 88.4Total assets 3,805.0 3,671.5 2,967.8 3,481.4
EBITDA margin (%) 5.8 9.7 9.2 8.2EBITDA interest coverage (x) 4.2 7.2 5.9 5.8FFO to total debt (%) 27.4 29.7 23.3 26.8Total debt to total capital (%) 52.4 56.5 59.7 56.2Total debt to EBITDA (x) 2.3 1.9 2.6 2.3
Top 30 Chilean Companies - April 2007 47
Empresa NNacional DDe TTelecomunicaciones SS.A. ((ENTEL)
RRaattiioonnaallee Standard & Poor's Ratings Services' ratings on Empresa Nacional de
Telecomunicaciones S.A. (ENTEL) reflect its good competitive positionas a leading integrated telecommunications provider in Chile, efficientoperations, and moderate debt levels. These factors are partially offsetby increased competition in all segments. In addition, ENTEL's cash-flow generation is still concentrated in and dependent on the domesticChilean market, which is one of the most stable markets in the region. ENTEL is a leading telecommunications company in Chile and one ofthe two largest mobile providers in the country (after TelefónicaMóviles) with about 41% market share and about 5 million subscribersas of December 2006. The mobile business is the company's mostimportant revenue contributor, representing about 69% of totalrevenues and 80% of consolidated EBITDA in fiscal 2006. Competitionin this segment should continue to be intense. Nevertheless, ENTEL iswell positioned to face competition, given the strong brand recognitionand the high quality and coverage of its nationwide network. Inaddition, ENTEL is one of the largest long-distance providers in Chile,has about 40% of data-transmission services, and provides localtelephony mainly to enterprises and corporate customers, as well asInternet access.
In fiscal 2006, ENTEL's EBITDA generation continued to be influencedby the positive fundamentals in the mobile segment derived from thesignificant growth in the client base (22% in 2006 compared to 2005)and the increase in traffic. In this sense, during 2006, ENTEL's EBITDAgeneration increased 19% (compared to 2005) and its EBITDA marginimproved to 38.4% from 33.2% in 2005. In the first half of 2006, ENTELclosed the sale of its U.S. and Central American operations,representing together a net profit of $18 million (and a cash inflow of$71 million). Both businesses are considered noncore for ENTEL andhad no significant effect on its business position (representing about4% of ENTEL's EBITDA generation in 2005).
The mentioned increase in EBITDA generation allowed ENTEL to offsetthe effects of a somewhat more aggressive financial policy and tomaintain solid financial measures. In this sense, EBITDA interestcoverage and funds from operations-to-debt ratios amounted to 11.5xand 67.2%, respectively, in fiscal 2006, compared to 11.7x and 57.8%in fiscal 2005. We expect cash generation to continue growing as aresult of the increased penetration of mobile telephony in the country(but at lower rates than in the past three years as the industry becomesmature) and of the higher coverage on the enterprise and corporatesegment. ENTEL's sustainable cash generation should allow it to faceincreased capital expenditure plans and current dividend levels and tostart to reduce debt in 2007, further consolidating financial measures.
Standard & Poor's credit Rating: BBB+/StableFeller-Rate's credit Rating: AA-/StableBusiness Activity: TelecommunicationsKey shareholders: Almendral groupBusiness Risk Profile: SolidFinancial Risk Profile: Intermediate
Almendral S.A., a group of well-known local Chilean investors, ownsthe majority stake in ENTEL (54.76%).
LLiiqquuiiddiittyy ENTEL has an adequate liquidity position given its sound cashgeneration and satisfactory maturity schedule. As of Dec. 31, 2006, thecompany had about $311 million in cash and short-term investments,which significantly exceeded short-term maturities of $156 million (ofwhich $147 million are local bonds that mature on April 1, 2007). Inaddition, ENTEL enjoys good access to the domestic financial market. The company has hedges on 100% of its net debt in dollars,significantly mitigating foreign-currency mismatch risks.
OOuuttllooookk The stable outlook reflects our expectations that ENTEL will maintain a
solid financial profile, based on its sound cash generation from themobile business. This factor should compensate for the high competi-tion and higher dividend levels and capital expenditures. We assumethat any potential acquisition--if pursued--will occur at a moderatepace and would not imply an unexpected deterioration of the compan-y's financial profile.
The ratings on ENTEL could benefit from a consistent and significantstrengthening of its financial profile and credit measures under stablebusiness and competitive conditions. In contrast, a more-aggressive-than-expected financial and/or investment policy that hurts thecompany's financial health could result in a downward rating revision.
Ivana Recalde, Standard & Poor´s; Pablo Lutereau, Standard & Poor´s
Financial Statisticsas of December
US$ million 2006 2005 2004 Averagelast three
years
Revenues 1,520.2 1,495.3 1,242.3 1,419.3EBITDA 583.6 497.2 375.4 485.4Funds from operations (FFO) 564.1 491.1 411.8 489.0Capital expenditures 261.8 192.7 149.9 201.5Dividends 129.0 413.0 38.0 193.3
Total debt 839.8 849.5 664.9 784.7Shareholders equity 1,013.9 966.3 1,117.1 1,032.4Cash and short term investments 311.1 150.4 151.7 204.4Total assets 2,281.9 2,215.5 2,072.1 2,189.8
EBITDA margin (%) 38.4 33.2 30.2 33.9EBITDA interest coverage (x) 11.5 11.7 9.8 11.0FFO to total debt (%) 67.2 57.8 61.9 62.3Total debt to total capital (%) 45.3 46.7 37.2 43.1Total debt to EBITDA (x) 1.4 1.7 1.4 1.5
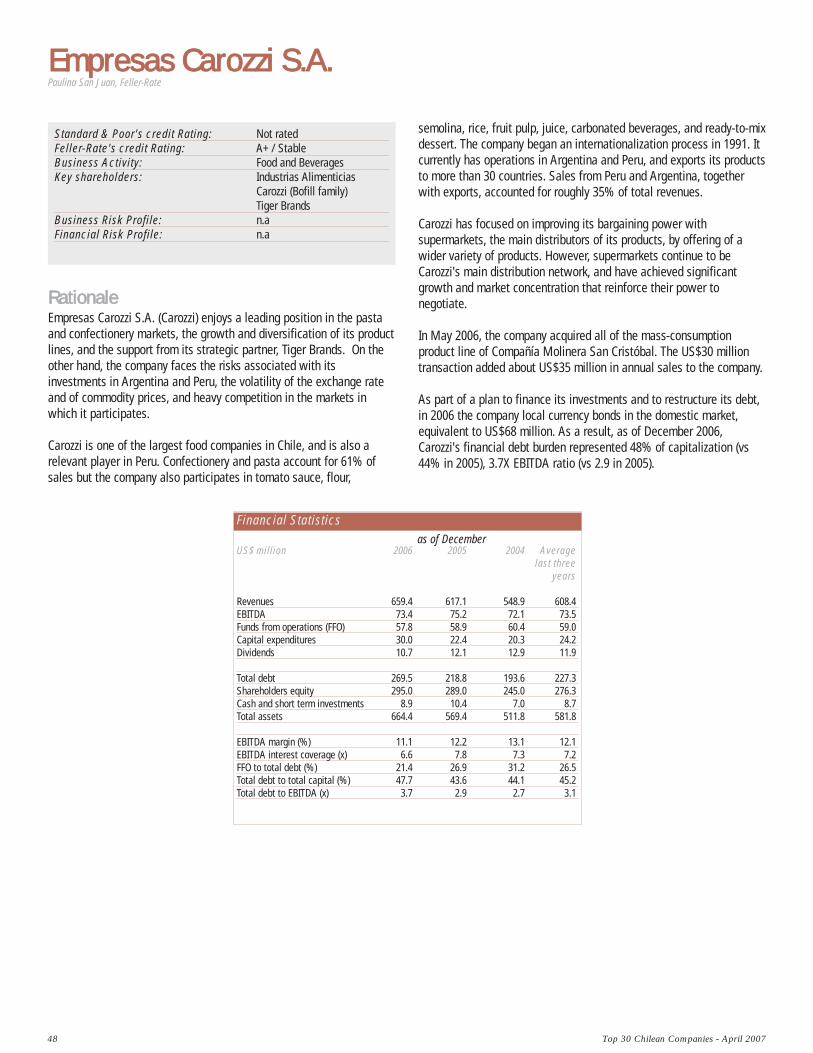
semolina, rice, fruit pulp, juice, carbonated beverages, and ready-to-mixdessert. The company began an internationalization process in 1991. Itcurrently has operations in Argentina and Peru, and exports its productsto more than 30 countries. Sales from Peru and Argentina, togetherwith exports, accounted for roughly 35% of total revenues.
Carozzi has focused on improving its bargaining power withsupermarkets, the main distributors of its products, by offering of awider variety of products. However, supermarkets continue to beCarozzi's main distribution network, and have achieved significantgrowth and market concentration that reinforce their power tonegotiate.
In May 2006, the company acquired all of the mass-consumptionproduct line of Compañía Molinera San Cristóbal. The US$30 milliontransaction added about US$35 million in annual sales to the company.
As part of a plan to finance its investments and to restructure its debt,in 2006 the company local currency bonds in the domestic market,equivalent to US$68 million. As a result, as of December 2006,Carozzi's financial debt burden represented 48% of capitalization (vs44% in 2005), 3.7X EBITDA ratio (vs 2.9 in 2005).
48 Top 30 Chilean Companies - April 2007
Standard & Poor's credit Rating: Not ratedFeller-Rate's credit Rating: A+ / StableBusiness Activity: Food and BeveragesKey shareholders: Industrias Alimenticias
Carozzi (Bofill family) Tiger Brands
Business Risk Profile: n.aFinancial Risk Profile: n.a
Empresas CCarozzi SS.A.
RRaattiioonnaalleeEmpresas Carozzi S.A. (Carozzi) enjoys a leading position in the pastaand confectionery markets, the growth and diversification of its productlines, and the support from its strategic partner, Tiger Brands. On theother hand, the company faces the risks associated with itsinvestments in Argentina and Peru, the volatility of the exchange rateand of commodity prices, and heavy competition in the markets inwhich it participates.
Carozzi is one of the largest food companies in Chile, and is also arelevant player in Peru. Confectionery and pasta account for 61% ofsales but the company also participates in tomato sauce, flour,
Paulina San Juan, Feller-Rate
Financial Statisticsas of December
US$ million 2006 2005 2004 Averagelast three
years
Revenues 659.4 617.1 548.9 608.4EBITDA 73.4 75.2 72.1 73.5Funds from operations (FFO) 57.8 58.9 60.4 59.0Capital expenditures 30.0 22.4 20.3 24.2Dividends 10.7 12.1 12.9 11.9
Total debt 269.5 218.8 193.6 227.3Shareholders equity 295.0 289.0 245.0 276.3Cash and short term investments 8.9 10.4 7.0 8.7Total assets 664.4 569.4 511.8 581.8
EBITDA margin (%) 11.1 12.2 13.1 12.1EBITDA interest coverage (x) 6.6 7.8 7.3 7.2FFO to total debt (%) 21.4 26.9 31.2 26.5Total debt to total capital (%) 47.7 43.6 44.1 45.2Total debt to EBITDA (x) 3.7 2.9 2.7 3.1
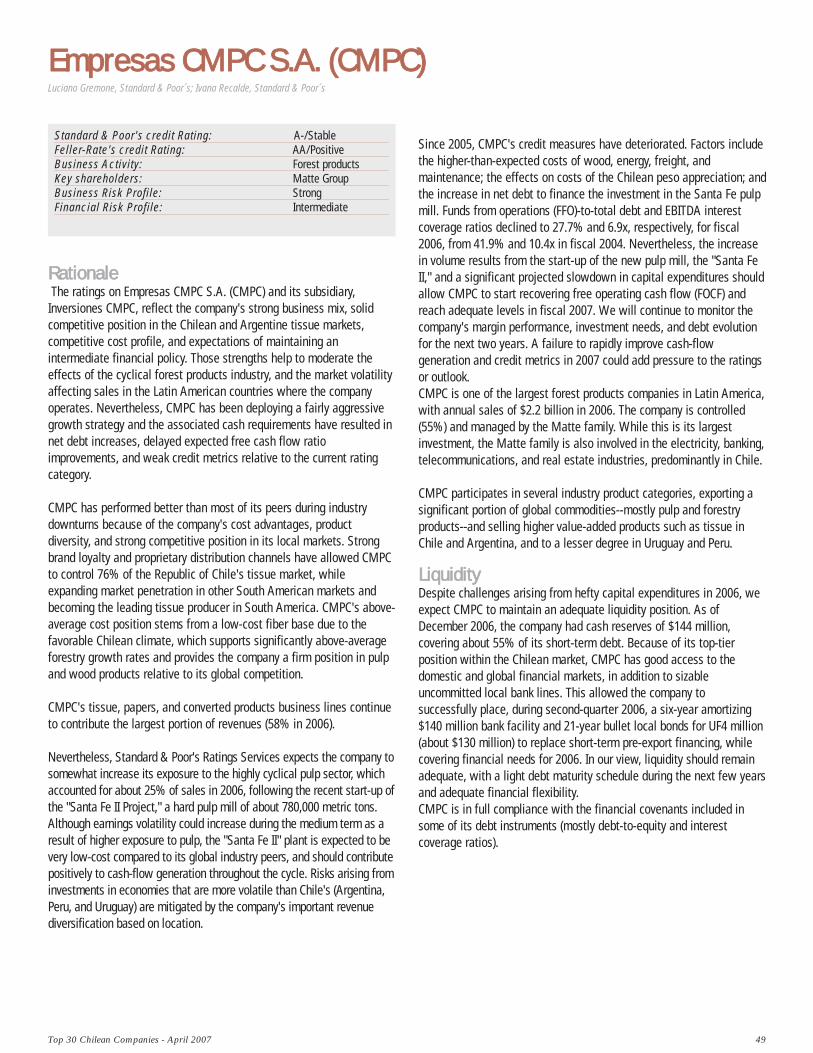
Top 30 Chilean Companies - April 2007 49
Empresas CCMPC SS.A. ((CMPC)
RRaattiioonnaallee The ratings on Empresas CMPC S.A. (CMPC) and its subsidiary,
Inversiones CMPC, reflect the company's strong business mix, solidcompetitive position in the Chilean and Argentine tissue markets,competitive cost profile, and expectations of maintaining anintermediate financial policy. Those strengths help to moderate theeffects of the cyclical forest products industry, and the market volatilityaffecting sales in the Latin American countries where the companyoperates. Nevertheless, CMPC has been deploying a fairly aggressivegrowth strategy and the associated cash requirements have resulted innet debt increases, delayed expected free cash flow ratioimprovements, and weak credit metrics relative to the current ratingcategory.
CMPC has performed better than most of its peers during industrydownturns because of the company's cost advantages, productdiversity, and strong competitive position in its local markets. Strongbrand loyalty and proprietary distribution channels have allowed CMPCto control 76% of the Republic of Chile's tissue market, whileexpanding market penetration in other South American markets andbecoming the leading tissue producer in South America. CMPC's above-average cost position stems from a low-cost fiber base due to thefavorable Chilean climate, which supports significantly above-averageforestry growth rates and provides the company a firm position in pulpand wood products relative to its global competition.
CMPC's tissue, papers, and converted products business lines continueto contribute the largest portion of revenues (58% in 2006).
Nevertheless, Standard & Poor's Ratings Services expects the company tosomewhat increase its exposure to the highly cyclical pulp sector, whichaccounted for about 25% of sales in 2006, following the recent start-up ofthe "Santa Fe II Project," a hard pulp mill of about 780,000 metric tons.Although earnings volatility could increase during the medium term as aresult of higher exposure to pulp, the "Santa Fe II" plant is expected to bevery low-cost compared to its global industry peers, and should contributepositively to cash-flow generation throughout the cycle. Risks arising frominvestments in economies that are more volatile than Chile's (Argentina,Peru, and Uruguay) are mitigated by the company's important revenuediversification based on location.
Standard & Poor's credit Rating: A-/StableFeller-Rate's credit Rating: AA/PositiveBusiness Activity: Forest productsKey shareholders: Matte GroupBusiness Risk Profile: StrongFinancial Risk Profile: Intermediate
Since 2005, CMPC's credit measures have deteriorated. Factors includethe higher-than-expected costs of wood, energy, freight, andmaintenance; the effects on costs of the Chilean peso appreciation; andthe increase in net debt to finance the investment in the Santa Fe pulpmill. Funds from operations (FFO)-to-total debt and EBITDA interestcoverage ratios declined to 27.7% and 6.9x, respectively, for fiscal2006, from 41.9% and 10.4x in fiscal 2004. Nevertheless, the increasein volume results from the start-up of the new pulp mill, the "Santa FeII," and a significant projected slowdown in capital expenditures shouldallow CMPC to start recovering free operating cash flow (FOCF) andreach adequate levels in fiscal 2007. We will continue to monitor thecompany's margin performance, investment needs, and debt evolutionfor the next two years. A failure to rapidly improve cash-flowgeneration and credit metrics in 2007 could add pressure to the ratingsor outlook. CMPC is one of the largest forest products companies in Latin America,with annual sales of $2.2 billion in 2006. The company is controlled(55%) and managed by the Matte family. While this is its largestinvestment, the Matte family is also involved in the electricity, banking,telecommunications, and real estate industries, predominantly in Chile.
CMPC participates in several industry product categories, exporting asignificant portion of global commodities--mostly pulp and forestryproducts--and selling higher value-added products such as tissue inChile and Argentina, and to a lesser degree in Uruguay and Peru.
LLiiqquuiiddiittyy Despite challenges arising from hefty capital expenditures in 2006, weexpect CMPC to maintain an adequate liquidity position. As ofDecember 2006, the company had cash reserves of $144 million,covering about 55% of its short-term debt. Because of its top-tierposition within the Chilean market, CMPC has good access to thedomestic and global financial markets, in addition to sizableuncommitted local bank lines. This allowed the company tosuccessfully place, during second-quarter 2006, a six-year amortizing$140 million bank facility and 21-year bullet local bonds for UF4 million(about $130 million) to replace short-term pre-export financing, whilecovering financial needs for 2006. In our view, liquidity should remainadequate, with a light debt maturity schedule during the next few yearsand adequate financial flexibility. CMPC is in full compliance with the financial covenants included insome of its debt instruments (mostly debt-to-equity and interestcoverage ratios).
Luciano Gremone, Standard & Poor´s; Ivana Recalde, Standard & Poor´s
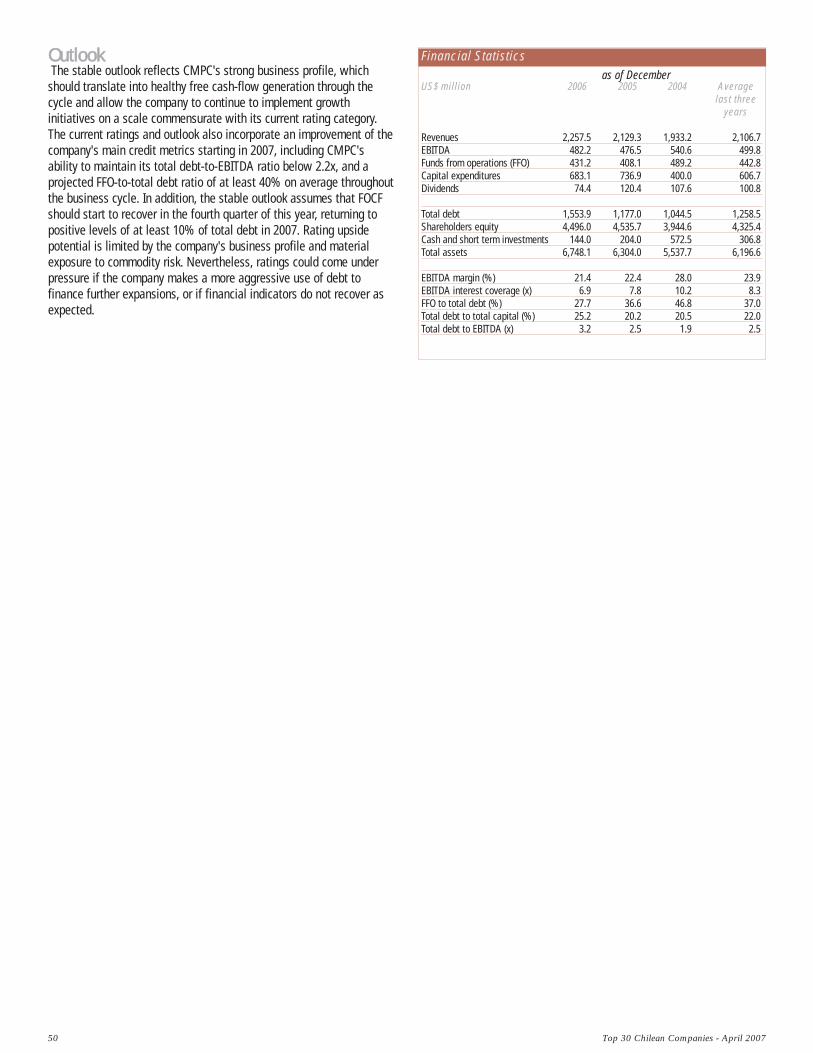
50 Top 30 Chilean Companies - April 2007
OOuuttllooookk The stable outlook reflects CMPC's strong business profile, which
should translate into healthy free cash-flow generation through thecycle and allow the company to continue to implement growthinitiatives on a scale commensurate with its current rating category.The current ratings and outlook also incorporate an improvement of thecompany's main credit metrics starting in 2007, including CMPC'sability to maintain its total debt-to-EBITDA ratio below 2.2x, and aprojected FFO-to-total debt ratio of at least 40% on average throughoutthe business cycle. In addition, the stable outlook assumes that FOCFshould start to recover in the fourth quarter of this year, returning topositive levels of at least 10% of total debt in 2007. Rating upsidepotential is limited by the company's business profile and materialexposure to commodity risk. Nevertheless, ratings could come underpressure if the company makes a more aggressive use of debt tofinance further expansions, or if financial indicators do not recover asexpected.
Financial Statisticsas of December
US$ million 2006 2005 2004 Averagelast three
years
Revenues 2,257.5 2,129.3 1,933.2 2,106.7EBITDA 482.2 476.5 540.6 499.8Funds from operations (FFO) 431.2 408.1 489.2 442.8Capital expenditures 683.1 736.9 400.0 606.7Dividends 74.4 120.4 107.6 100.8
Total debt 1,553.9 1,177.0 1,044.5 1,258.5Shareholders equity 4,496.0 4,535.7 3,944.6 4,325.4Cash and short term investments 144.0 204.0 572.5 306.8Total assets 6,748.1 6,304.0 5,537.7 6,196.6
EBITDA margin (%) 21.4 22.4 28.0 23.9EBITDA interest coverage (x) 6.9 7.8 10.2 8.3FFO to total debt (%) 27.7 36.6 46.8 37.0Total debt to total capital (%) 25.2 20.2 20.5 22.0Total debt to EBITDA (x) 3.2 2.5 1.9 2.5
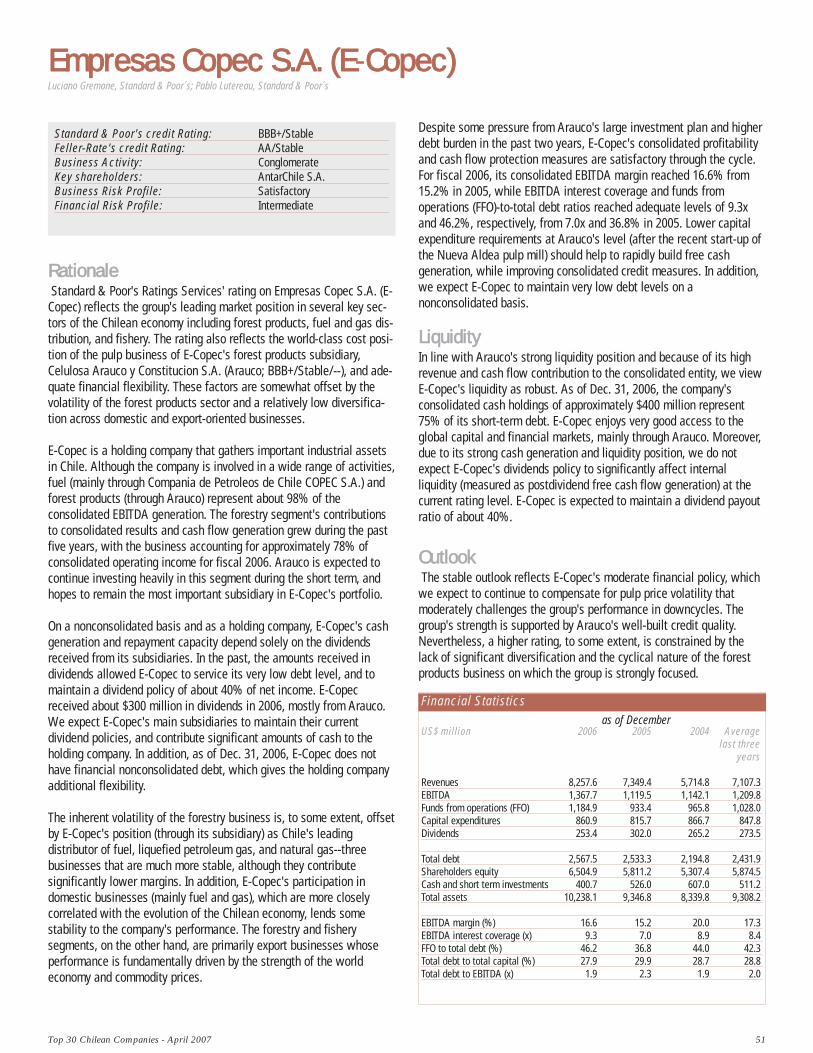
Top 30 Chilean Companies - April 2007 51
Empresas CCopec SS.A. ((E-CCopec)
RRaattiioonnaallee Standard & Poor's Ratings Services' rating on Empresas Copec S.A. (E-
Copec) reflects the group's leading market position in several key sec-tors of the Chilean economy including forest products, fuel and gas dis-tribution, and fishery. The rating also reflects the world-class cost posi-tion of the pulp business of E-Copec's forest products subsidiary,Celulosa Arauco y Constitucion S.A. (Arauco; BBB+/Stable/--), and ade-quate financial flexibility. These factors are somewhat offset by thevolatility of the forest products sector and a relatively low diversifica-tion across domestic and export-oriented businesses.
E-Copec is a holding company that gathers important industrial assetsin Chile. Although the company is involved in a wide range of activities,fuel (mainly through Compania de Petroleos de Chile COPEC S.A.) andforest products (through Arauco) represent about 98% of theconsolidated EBITDA generation. The forestry segment's contributionsto consolidated results and cash flow generation grew during the pastfive years, with the business accounting for approximately 78% ofconsolidated operating income for fiscal 2006. Arauco is expected tocontinue investing heavily in this segment during the short term, andhopes to remain the most important subsidiary in E-Copec's portfolio.
On a nonconsolidated basis and as a holding company, E-Copec's cashgeneration and repayment capacity depend solely on the dividendsreceived from its subsidiaries. In the past, the amounts received individends allowed E-Copec to service its very low debt level, and tomaintain a dividend policy of about 40% of net income. E-Copecreceived about $300 million in dividends in 2006, mostly from Arauco.We expect E-Copec's main subsidiaries to maintain their currentdividend policies, and contribute significant amounts of cash to theholding company. In addition, as of Dec. 31, 2006, E-Copec does nothave financial nonconsolidated debt, which gives the holding companyadditional flexibility.
The inherent volatility of the forestry business is, to some extent, offsetby E-Copec's position (through its subsidiary) as Chile's leadingdistributor of fuel, liquefied petroleum gas, and natural gas--threebusinesses that are much more stable, although they contributesignificantly lower margins. In addition, E-Copec's participation indomestic businesses (mainly fuel and gas), which are more closelycorrelated with the evolution of the Chilean economy, lends somestability to the company's performance. The forestry and fisherysegments, on the other hand, are primarily export businesses whoseperformance is fundamentally driven by the strength of the worldeconomy and commodity prices.
Standard & Poor's credit Rating: BBB+/StableFeller-Rate's credit Rating: AA/StableBusiness Activity: ConglomerateKey shareholders: AntarChile S.A.Business Risk Profile: SatisfactoryFinancial Risk Profile: Intermediate
Despite some pressure from Arauco's large investment plan and higherdebt burden in the past two years, E-Copec's consolidated profitabilityand cash flow protection measures are satisfactory through the cycle.For fiscal 2006, its consolidated EBITDA margin reached 16.6% from15.2% in 2005, while EBITDA interest coverage and funds fromoperations (FFO)-to-total debt ratios reached adequate levels of 9.3xand 46.2%, respectively, from 7.0x and 36.8% in 2005. Lower capitalexpenditure requirements at Arauco's level (after the recent start-up ofthe Nueva Aldea pulp mill) should help to rapidly build free cashgeneration, while improving consolidated credit measures. In addition,we expect E-Copec to maintain very low debt levels on anonconsolidated basis.
LLiiqquuiiddiittyy In line with Arauco's strong liquidity position and because of its highrevenue and cash flow contribution to the consolidated entity, we viewE-Copec's liquidity as robust. As of Dec. 31, 2006, the company'sconsolidated cash holdings of approximately $400 million represent75% of its short-term debt. E-Copec enjoys very good access to theglobal capital and financial markets, mainly through Arauco. Moreover,due to its strong cash generation and liquidity position, we do notexpect E-Copec's dividends policy to significantly affect internalliquidity (measured as postdividend free cash flow generation) at thecurrent rating level. E-Copec is expected to maintain a dividend payoutratio of about 40%.
OOuuttllooookk The stable outlook reflects E-Copec's moderate financial policy, which
we expect to continue to compensate for pulp price volatility thatmoderately challenges the group's performance in downcycles. Thegroup's strength is supported by Arauco's well-built credit quality.Nevertheless, a higher rating, to some extent, is constrained by thelack of significant diversification and the cyclical nature of the forestproducts business on which the group is strongly focused.
Luciano Gremone, Standard & Poor´s; Pablo Lutereau, Standard & Poor´s
Financial Statisticsas of December
US$ million 2006 2005 2004 Averagelast three
years
Revenues 8,257.6 7,349.4 5,714.8 7,107.3EBITDA 1,367.7 1,119.5 1,142.1 1,209.8Funds from operations (FFO) 1,184.9 933.4 965.8 1,028.0Capital expenditures 860.9 815.7 866.7 847.8Dividends 253.4 302.0 265.2 273.5
Total debt 2,567.5 2,533.3 2,194.8 2,431.9Shareholders equity 6,504.9 5,811.2 5,307.4 5,874.5Cash and short term investments 400.7 526.0 607.0 511.2Total assets 10,238.1 9,346.8 8,339.8 9,308.2
EBITDA margin (%) 16.6 15.2 20.0 17.3EBITDA interest coverage (x) 9.3 7.0 8.9 8.4FFO to total debt (%) 46.2 36.8 44.0 42.3Total debt to total capital (%) 27.9 29.9 28.7 28.8Total debt to EBITDA (x) 1.9 2.3 1.9 2.0
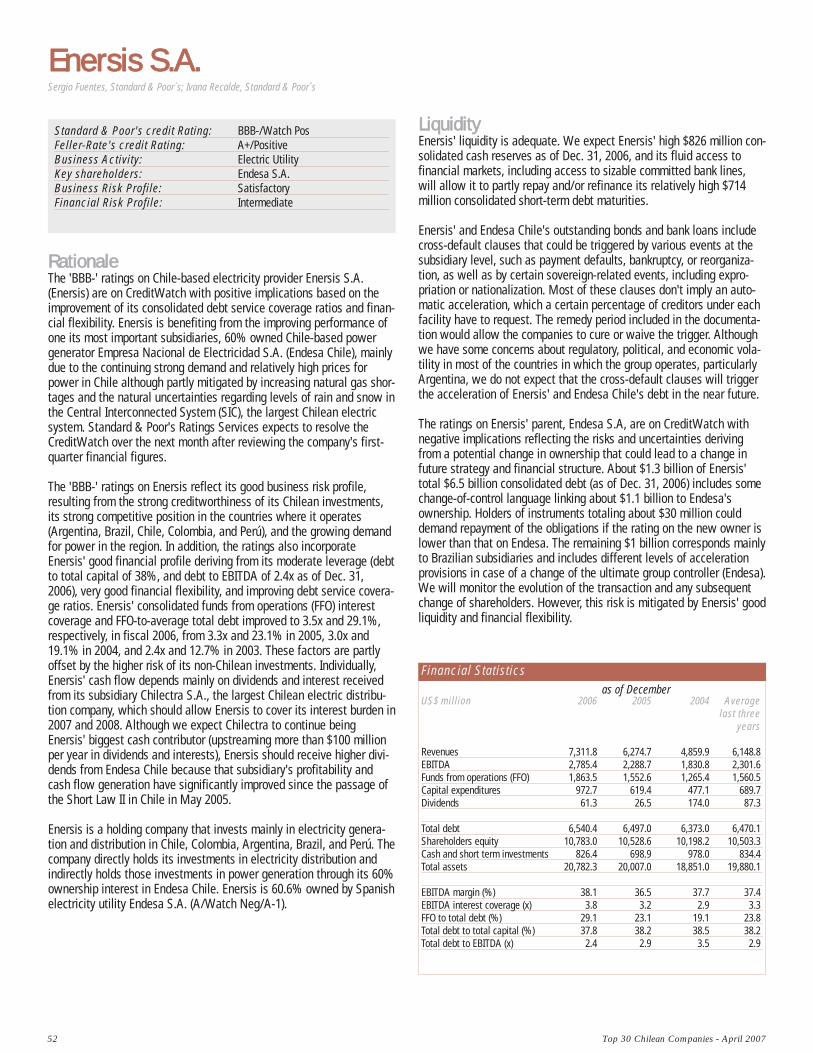
52 Top 30 Chilean Companies - April 2007
Enersis SS.A.
RRaattiioonnaallee The 'BBB-' ratings on Chile-based electricity provider Enersis S.A.(Enersis) are on CreditWatch with positive implications based on theimprovement of its consolidated debt service coverage ratios and finan-cial flexibility. Enersis is benefiting from the improving performance ofone its most important subsidiaries, 60% owned Chile-based powergenerator Empresa Nacional de Electricidad S.A. (Endesa Chile), mainlydue to the continuing strong demand and relatively high prices forpower in Chile although partly mitigated by increasing natural gas shor-tages and the natural uncertainties regarding levels of rain and snow inthe Central Interconnected System (SIC), the largest Chilean electricsystem. Standard & Poor's Ratings Services expects to resolve theCreditWatch over the next month after reviewing the company's first-quarter financial figures.
The 'BBB-' ratings on Enersis reflect its good business risk profile,resulting from the strong creditworthiness of its Chilean investments,its strong competitive position in the countries where it operates(Argentina, Brazil, Chile, Colombia, and Perú), and the growing demandfor power in the region. In addition, the ratings also incorporateEnersis' good financial profile deriving from its moderate leverage (debtto total capital of 38%, and debt to EBITDA of 2.4x as of Dec. 31,2006), very good financial flexibility, and improving debt service covera-ge ratios. Enersis' consolidated funds from operations (FFO) interestcoverage and FFO-to-average total debt improved to 3.5x and 29.1%,respectively, in fiscal 2006, from 3.3x and 23.1% in 2005, 3.0x and19.1% in 2004, and 2.4x and 12.7% in 2003. These factors are partlyoffset by the higher risk of its non-Chilean investments. Individually,Enersis' cash flow depends mainly on dividends and interest receivedfrom its subsidiary Chilectra S.A., the largest Chilean electric distribu-tion company, which should allow Enersis to cover its interest burden in2007 and 2008. Although we expect Chilectra to continue beingEnersis' biggest cash contributor (upstreaming more than $100 millionper year in dividends and interests), Enersis should receive higher divi-dends from Endesa Chile because that subsidiary's profitability andcash flow generation have significantly improved since the passage ofthe Short Law II in Chile in May 2005.
Enersis is a holding company that invests mainly in electricity genera-tion and distribution in Chile, Colombia, Argentina, Brazil, and Perú. Thecompany directly holds its investments in electricity distribution andindirectly holds those investments in power generation through its 60%ownership interest in Endesa Chile. Enersis is 60.6% owned by Spanishelectricity utility Endesa S.A. (A/Watch Neg/A-1).
Standard & Poor's credit Rating: BBB-/Watch PosFeller-Rate's credit Rating: A+/PositiveBusiness Activity: Electric UtilityKey shareholders: Endesa S.A.Business Risk Profile: SatisfactoryFinancial Risk Profile: Intermediate
LLiiqquuiiddiittyyEnersis' liquidity is adequate. We expect Enersis' high $826 million con-solidated cash reserves as of Dec. 31, 2006, and its fluid access tofinancial markets, including access to sizable committed bank lines,will allow it to partly repay and/or refinance its relatively high $714million consolidated short-term debt maturities.
Enersis' and Endesa Chile's outstanding bonds and bank loans includecross-default clauses that could be triggered by various events at thesubsidiary level, such as payment defaults, bankruptcy, or reorganiza-tion, as well as by certain sovereign-related events, including expro-priation or nationalization. Most of these clauses don't imply an auto-matic acceleration, which a certain percentage of creditors under eachfacility have to request. The remedy period included in the documenta-tion would allow the companies to cure or waive the trigger. Althoughwe have some concerns about regulatory, political, and economic vola-tility in most of the countries in which the group operates, particularlyArgentina, we do not expect that the cross-default clauses will triggerthe acceleration of Enersis' and Endesa Chile's debt in the near future.
The ratings on Enersis' parent, Endesa S.A, are on CreditWatch withnegative implications reflecting the risks and uncertainties derivingfrom a potential change in ownership that could lead to a change infuture strategy and financial structure. About $1.3 billion of Enersis'total $6.5 billion consolidated debt (as of Dec. 31, 2006) includes somechange-of-control language linking about $1.1 billion to Endesa'sownership. Holders of instruments totaling about $30 million coulddemand repayment of the obligations if the rating on the new owner islower than that on Endesa. The remaining $1 billion corresponds mainlyto Brazilian subsidiaries and includes different levels of accelerationprovisions in case of a change of the ultimate group controller (Endesa).We will monitor the evolution of the transaction and any subsequentchange of shareholders. However, this risk is mitigated by Enersis' goodliquidity and financial flexibility.
Sergio Fuentes, Standard & Poor´s; Ivana Recalde, Standard & Poor´s
Financial Statisticsas of December
US$ million 2006 2005 2004 Averagelast three
years
Revenues 7,311.8 6,274.7 4,859.9 6,148.8EBITDA 2,785.4 2,288.7 1,830.8 2,301.6Funds from operations (FFO) 1,863.5 1,552.6 1,265.4 1,560.5Capital expenditures 972.7 619.4 477.1 689.7Dividends 61.3 26.5 174.0 87.3
Total debt 6,540.4 6,497.0 6,373.0 6,470.1Shareholders equity 10,783.0 10,528.6 10,198.2 10,503.3Cash and short term investments 826.4 698.9 978.0 834.4Total assets 20,782.3 20,007.0 18,851.0 19,880.1
EBITDA margin (%) 38.1 36.5 37.7 37.4EBITDA interest coverage (x) 3.8 3.2 2.9 3.3FFO to total debt (%) 29.1 23.1 19.1 23.8Total debt to total capital (%) 37.8 38.2 38.5 38.2Total debt to EBITDA (x) 2.4 2.9 3.5 2.9
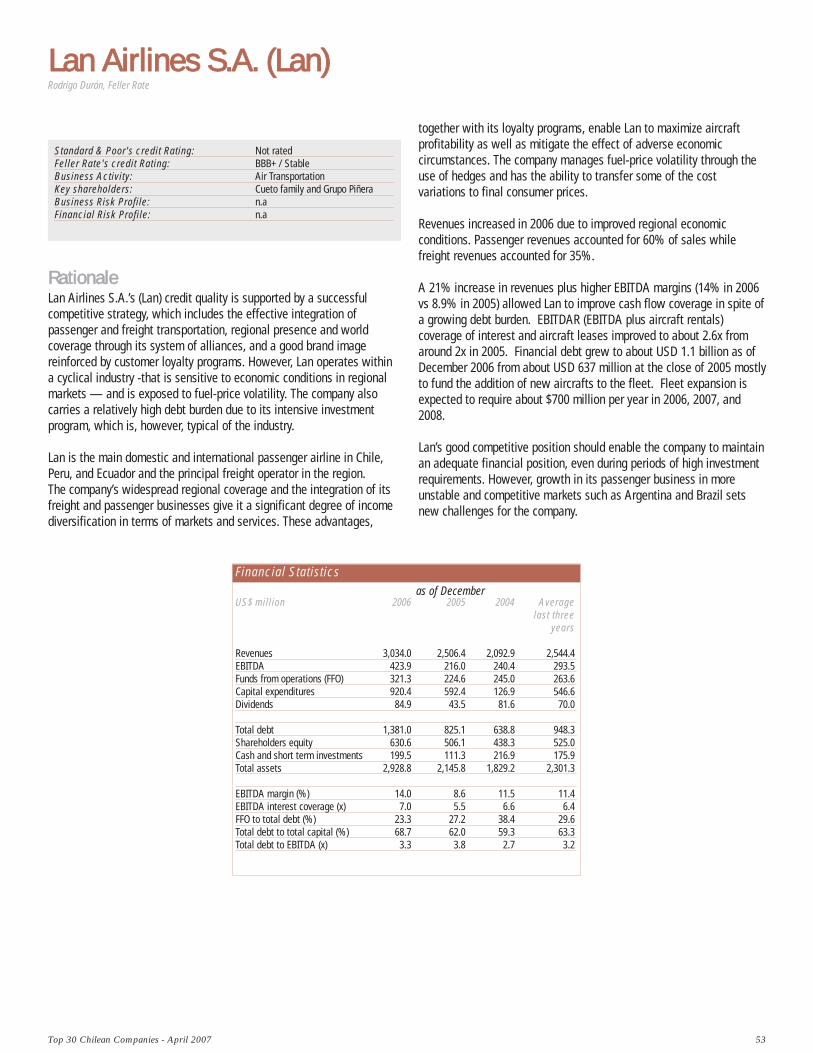
Top 30 Chilean Companies - April 2007 53
RRaattiioonnaalleeLan Airlines S.A.’s (Lan) credit quality is supported by a successfulcompetitive strategy, which includes the effective integration ofpassenger and freight transportation, regional presence and worldcoverage through its system of alliances, and a good brand imagereinforced by customer loyalty programs. However, Lan operates withina cyclical industry -that is sensitive to economic conditions in regionalmarkets — and is exposed to fuel-price volatility. The company alsocarries a relatively high debt burden due to its intensive investmentprogram, which is, however, typical of the industry.
Lan is the main domestic and international passenger airline in Chile,Peru, and Ecuador and the principal freight operator in the region. The company’s widespread regional coverage and the integration of itsfreight and passenger businesses give it a significant degree of incomediversification in terms of markets and services. These advantages,
Standard & Poor's credit Rating: Not ratedFeller Rate's credit Rating: BBB+ / StableBusiness Activity: Air Transportation Key shareholders: Cueto family and Grupo PiñeraBusiness Risk Profile: n.aFinancial Risk Profile: n.a
together with its loyalty programs, enable Lan to maximize aircraftprofitability as well as mitigate the effect of adverse economiccircumstances. The company manages fuel-price volatility through theuse of hedges and has the ability to transfer some of the costvariations to final consumer prices.
Revenues increased in 2006 due to improved regional economicconditions. Passenger revenues accounted for 60% of sales whilefreight revenues accounted for 35%.
A 21% increase in revenues plus higher EBITDA margins (14% in 2006vs 8.9% in 2005) allowed Lan to improve cash flow coverage in spite ofa growing debt burden. EBITDAR (EBITDA plus aircraft rentals)coverage of interest and aircraft leases improved to about 2.6x fromaround 2x in 2005. Financial debt grew to about USD 1.1 billion as ofDecember 2006 from about USD 637 million at the close of 2005 mostlyto fund the addition of new aircrafts to the fleet. Fleet expansion isexpected to require about $700 million per year in 2006, 2007, and2008.
Lan’s good competitive position should enable the company to maintainan adequate financial position, even during periods of high investmentrequirements. However, growth in its passenger business in moreunstable and competitive markets such as Argentina and Brazil setsnew challenges for the company.
Lan AAirlines SS.A. ((Lan)Rodrigo Durán, Feller Rate
Financial Statisticsas of December
US$ million 2006 2005 2004 Averagelast three
years
Revenues 3,034.0 2,506.4 2,092.9 2,544.4EBITDA 423.9 216.0 240.4 293.5Funds from operations (FFO) 321.3 224.6 245.0 263.6Capital expenditures 920.4 592.4 126.9 546.6Dividends 84.9 43.5 81.6 70.0
Total debt 1,381.0 825.1 638.8 948.3Shareholders equity 630.6 506.1 438.3 525.0Cash and short term investments 199.5 111.3 216.9 175.9Total assets 2,928.8 2,145.8 1,829.2 2,301.3
EBITDA margin (%) 14.0 8.6 11.5 11.4EBITDA interest coverage (x) 7.0 5.5 6.6 6.4FFO to total debt (%) 23.3 27.2 38.4 29.6Total debt to total capital (%) 68.7 62.0 59.3 63.3Total debt to EBITDA (x) 3.3 3.8 2.7 3.2
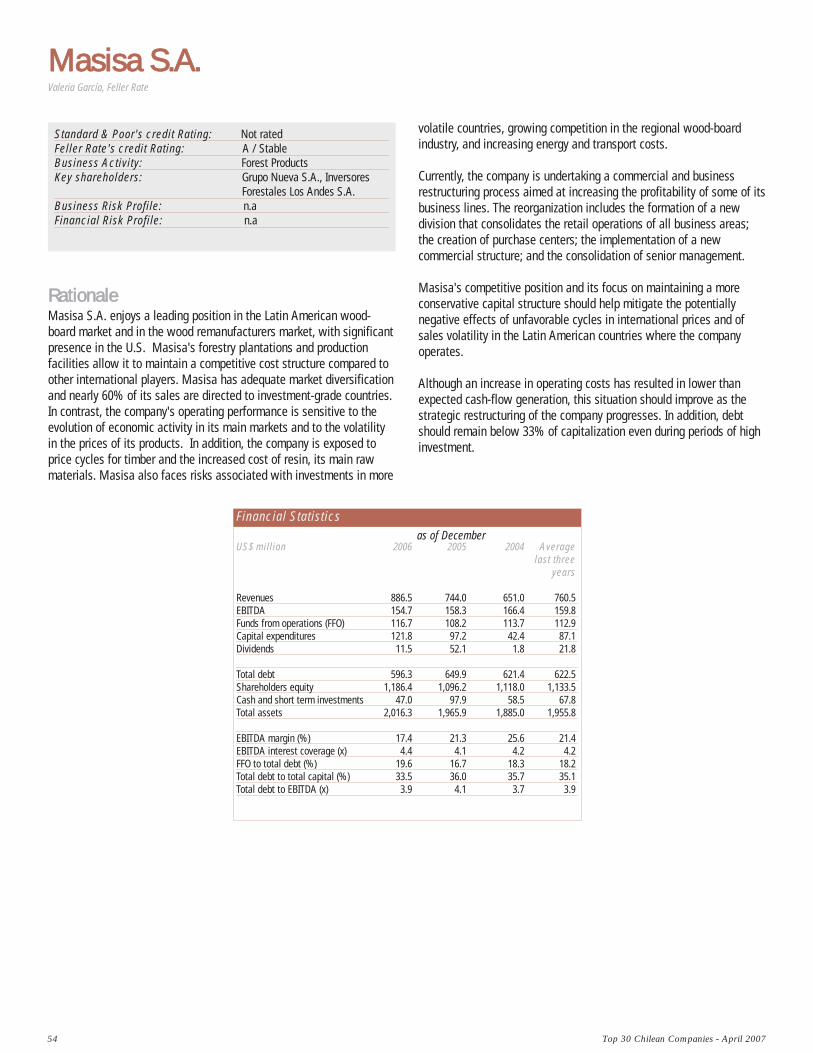
volatile countries, growing competition in the regional wood-boardindustry, and increasing energy and transport costs.
Currently, the company is undertaking a commercial and businessrestructuring process aimed at increasing the profitability of some of itsbusiness lines. The reorganization includes the formation of a newdivision that consolidates the retail operations of all business areas;the creation of purchase centers; the implementation of a newcommercial structure; and the consolidation of senior management.
Masisa's competitive position and its focus on maintaining a moreconservative capital structure should help mitigate the potentiallynegative effects of unfavorable cycles in international prices and ofsales volatility in the Latin American countries where the companyoperates.
Although an increase in operating costs has resulted in lower thanexpected cash-flow generation, this situation should improve as thestrategic restructuring of the company progresses. In addition, debtshould remain below 33% of capitalization even during periods of highinvestment.
54 Top 30 Chilean Companies - April 2007
RRaattiioonnaalleeMasisa S.A. enjoys a leading position in the Latin American wood-board market and in the wood remanufacturers market, with significantpresence in the U.S. Masisa's forestry plantations and productionfacilities allow it to maintain a competitive cost structure compared toother international players. Masisa has adequate market diversificationand nearly 60% of its sales are directed to investment-grade countries.In contrast, the company's operating performance is sensitive to theevolution of economic activity in its main markets and to the volatilityin the prices of its products. In addition, the company is exposed toprice cycles for timber and the increased cost of resin, its main rawmaterials. Masisa also faces risks associated with investments in more
Standard & Poor's credit Rating: Not ratedFeller Rate's credit Rating: A / StableBusiness Activity: Forest Products Key shareholders: Grupo Nueva S.A., Inversores
Forestales Los Andes S.A. Business Risk Profile: n.aFinancial Risk Profile: n.a
Masisa SS.A.Valeria García, Feller Rate
Financial Statisticsas of December
US$ million 2006 2005 2004 Averagelast three
years
Revenues 886.5 744.0 651.0 760.5EBITDA 154.7 158.3 166.4 159.8Funds from operations (FFO) 116.7 108.2 113.7 112.9Capital expenditures 121.8 97.2 42.4 87.1Dividends 11.5 52.1 1.8 21.8
Total debt 596.3 649.9 621.4 622.5Shareholders equity 1,186.4 1,096.2 1,118.0 1,133.5Cash and short term investments 47.0 97.9 58.5 67.8Total assets 2,016.3 1,965.9 1,885.0 1,955.8
EBITDA margin (%) 17.4 21.3 25.6 21.4EBITDA interest coverage (x) 4.4 4.1 4.2 4.2FFO to total debt (%) 19.6 16.7 18.3 18.2Total debt to total capital (%) 33.5 36.0 35.7 35.1Total debt to EBITDA (x) 3.9 4.1 3.7 3.9
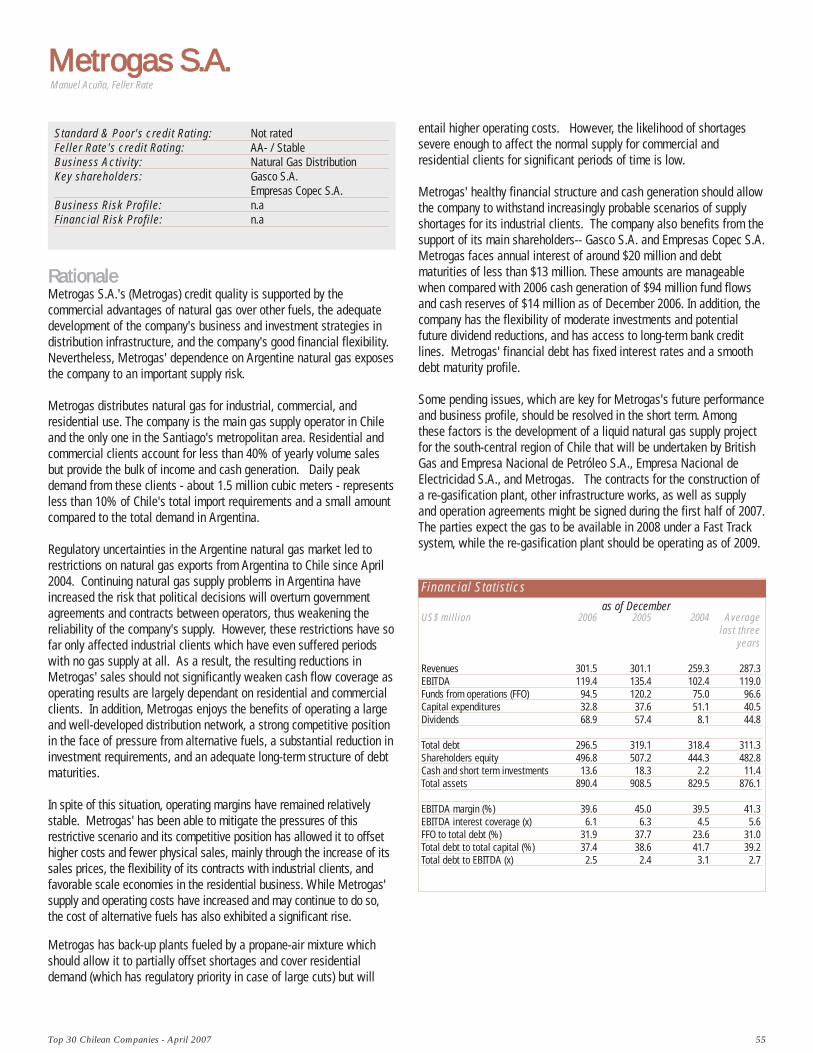
Top 30 Chilean Companies - April 2007 55
RRaattiioonnaalleeMetrogas S.A.'s (Metrogas) credit quality is supported by thecommercial advantages of natural gas over other fuels, the adequatedevelopment of the company's business and investment strategies indistribution infrastructure, and the company's good financial flexibility.Nevertheless, Metrogas' dependence on Argentine natural gas exposesthe company to an important supply risk.
Metrogas distributes natural gas for industrial, commercial, andresidential use. The company is the main gas supply operator in Chileand the only one in the Santiago's metropolitan area. Residential andcommercial clients account for less than 40% of yearly volume salesbut provide the bulk of income and cash generation. Daily peakdemand from these clients - about 1.5 million cubic meters - representsless than 10% of Chile's total import requirements and a small amountcompared to the total demand in Argentina.
Regulatory uncertainties in the Argentine natural gas market led torestrictions on natural gas exports from Argentina to Chile since April2004. Continuing natural gas supply problems in Argentina haveincreased the risk that political decisions will overturn governmentagreements and contracts between operators, thus weakening thereliability of the company's supply. However, these restrictions have sofar only affected industrial clients which have even suffered periodswith no gas supply at all. As a result, the resulting reductions inMetrogas' sales should not significantly weaken cash flow coverage asoperating results are largely dependant on residential and commercialclients. In addition, Metrogas enjoys the benefits of operating a largeand well-developed distribution network, a strong competitive positionin the face of pressure from alternative fuels, a substantial reduction ininvestment requirements, and an adequate long-term structure of debtmaturities.
In spite of this situation, operating margins have remained relativelystable. Metrogas' has been able to mitigate the pressures of thisrestrictive scenario and its competitive position has allowed it to offsethigher costs and fewer physical sales, mainly through the increase of itssales prices, the flexibility of its contracts with industrial clients, andfavorable scale economies in the residential business. While Metrogas'supply and operating costs have increased and may continue to do so,the cost of alternative fuels has also exhibited a significant rise.
Metrogas has back-up plants fueled by a propane-air mixture whichshould allow it to partially offset shortages and cover residentialdemand (which has regulatory priority in case of large cuts) but will
Standard & Poor's credit Rating: Not ratedFeller Rate's credit Rating: AA- / StableBusiness Activity: Natural Gas DistributionKey shareholders: Gasco S.A.
Empresas Copec S.A. Business Risk Profile: n.aFinancial Risk Profile: n.a
entail higher operating costs. However, the likelihood of shortagessevere enough to affect the normal supply for commercial andresidential clients for significant periods of time is low.
Metrogas' healthy financial structure and cash generation should allowthe company to withstand increasingly probable scenarios of supplyshortages for its industrial clients. The company also benefits from thesupport of its main shareholders-- Gasco S.A. and Empresas Copec S.A. Metrogas faces annual interest of around $20 million and debtmaturities of less than $13 million. These amounts are manageablewhen compared with 2006 cash generation of $94 million fund flowsand cash reserves of $14 million as of December 2006. In addition, thecompany has the flexibility of moderate investments and potentialfuture dividend reductions, and has access to long-term bank creditlines. Metrogas' financial debt has fixed interest rates and a smoothdebt maturity profile.
Some pending issues, which are key for Metrogas's future performanceand business profile, should be resolved in the short term. Amongthese factors is the development of a liquid natural gas supply projectfor the south-central region of Chile that will be undertaken by BritishGas and Empresa Nacional de Petróleo S.A., Empresa Nacional deElectricidad S.A., and Metrogas. The contracts for the construction ofa re-gasification plant, other infrastructure works, as well as supplyand operation agreements might be signed during the first half of 2007.The parties expect the gas to be available in 2008 under a Fast Tracksystem, while the re-gasification plant should be operating as of 2009.
Metrogas SS.A.Manuel Acuña, Feller Rate
Financial Statisticsas of December
US$ million 2006 2005 2004 Averagelast three
years
Revenues 301.5 301.1 259.3 287.3EBITDA 119.4 135.4 102.4 119.0Funds from operations (FFO) 94.5 120.2 75.0 96.6Capital expenditures 32.8 37.6 51.1 40.5Dividends 68.9 57.4 8.1 44.8
Total debt 296.5 319.1 318.4 311.3Shareholders equity 496.8 507.2 444.3 482.8Cash and short term investments 13.6 18.3 2.2 11.4Total assets 890.4 908.5 829.5 876.1
EBITDA margin (%) 39.6 45.0 39.5 41.3EBITDA interest coverage (x) 6.1 6.3 4.5 5.6FFO to total debt (%) 31.9 37.7 23.6 31.0Total debt to total capital (%) 37.4 38.6 41.7 39.2Total debt to EBITDA (x) 2.5 2.4 3.1 2.7
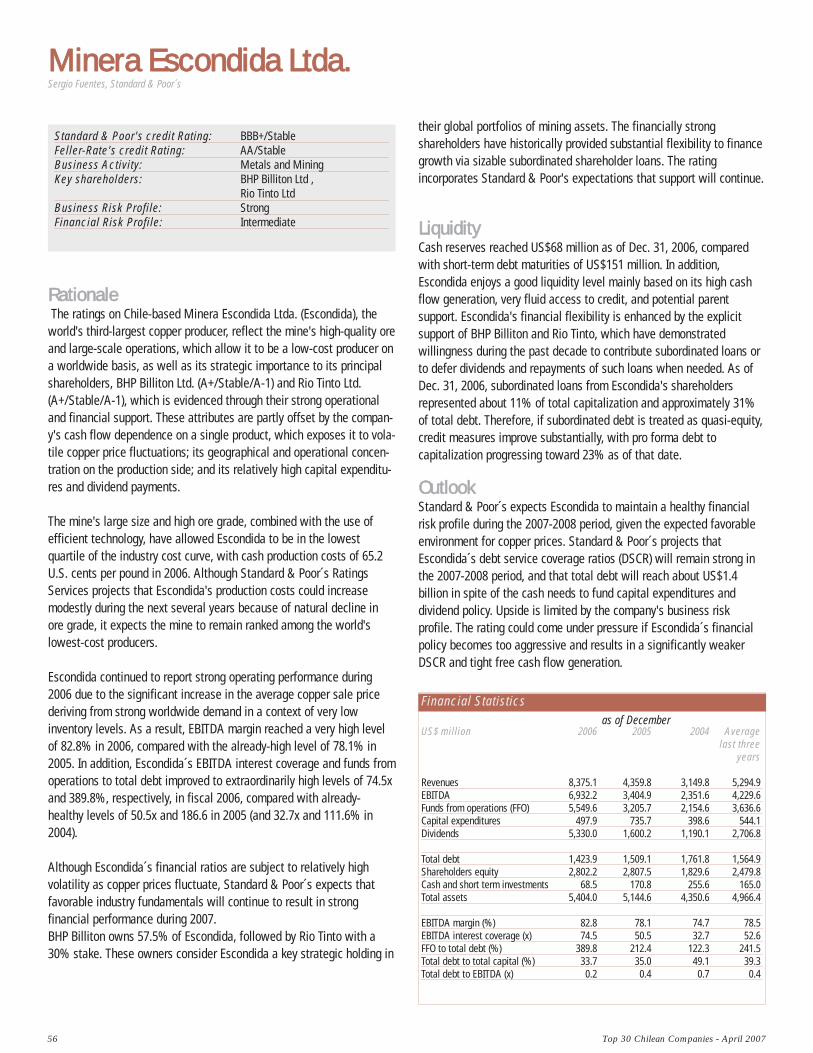
56 Top 30 Chilean Companies - April 2007
Minera EEscondida LLtda.
RRaattiioonnaallee The ratings on Chile-based Minera Escondida Ltda. (Escondida), the
world's third-largest copper producer, reflect the mine's high-quality oreand large-scale operations, which allow it to be a low-cost producer ona worldwide basis, as well as its strategic importance to its principalshareholders, BHP Billiton Ltd. (A+/Stable/A-1) and Rio Tinto Ltd.(A+/Stable/A-1), which is evidenced through their strong operationaland financial support. These attributes are partly offset by the compan-y's cash flow dependence on a single product, which exposes it to vola-tile copper price fluctuations; its geographical and operational concen-tration on the production side; and its relatively high capital expenditu-res and dividend payments.
The mine's large size and high ore grade, combined with the use ofefficient technology, have allowed Escondida to be in the lowestquartile of the industry cost curve, with cash production costs of 65.2U.S. cents per pound in 2006. Although Standard & Poor´s RatingsServices projects that Escondida's production costs could increasemodestly during the next several years because of natural decline inore grade, it expects the mine to remain ranked among the world'slowest-cost producers.
Escondida continued to report strong operating performance during2006 due to the significant increase in the average copper sale pricederiving from strong worldwide demand in a context of very lowinventory levels. As a result, EBITDA margin reached a very high levelof 82.8% in 2006, compared with the already-high level of 78.1% in2005. In addition, Escondida´s EBITDA interest coverage and funds fromoperations to total debt improved to extraordinarily high levels of 74.5xand 389.8%, respectively, in fiscal 2006, compared with already-healthy levels of 50.5x and 186.6 in 2005 (and 32.7x and 111.6% in2004).
Although Escondida´s financial ratios are subject to relatively highvolatility as copper prices fluctuate, Standard & Poor´s expects thatfavorable industry fundamentals will continue to result in strongfinancial performance during 2007. BHP Billiton owns 57.5% of Escondida, followed by Rio Tinto with a30% stake. These owners consider Escondida a key strategic holding in
their global portfolios of mining assets. The financially strongshareholders have historically provided substantial flexibility to financegrowth via sizable subordinated shareholder loans. The ratingincorporates Standard & Poor's expectations that support will continue.
LLiiqquuiiddiittyy Cash reserves reached US$68 million as of Dec. 31, 2006, comparedwith short-term debt maturities of US$151 million. In addition,Escondida enjoys a good liquidity level mainly based on its high cashflow generation, very fluid access to credit, and potential parentsupport. Escondida's financial flexibility is enhanced by the explicitsupport of BHP Billiton and Rio Tinto, which have demonstratedwillingness during the past decade to contribute subordinated loans orto defer dividends and repayments of such loans when needed. As ofDec. 31, 2006, subordinated loans from Escondida's shareholdersrepresented about 11% of total capitalization and approximately 31%of total debt. Therefore, if subordinated debt is treated as quasi-equity,credit measures improve substantially, with pro forma debt tocapitalization progressing toward 23% as of that date.
OOuuttllooookkStandard & Poor´s expects Escondida to maintain a healthy financialrisk profile during the 2007-2008 period, given the expected favorableenvironment for copper prices. Standard & Poor´s projects thatEscondida´s debt service coverage ratios (DSCR) will remain strong inthe 2007-2008 period, and that total debt will reach about US$1.4billion in spite of the cash needs to fund capital expenditures anddividend policy. Upside is limited by the company's business riskprofile. The rating could come under pressure if Escondida´s financialpolicy becomes too aggressive and results in a significantly weakerDSCR and tight free cash flow generation.
Sergio Fuentes, Standard & Poor´s
Standard & Poor's credit Rating: BBB+/StableFeller-Rate's credit Rating: AA/StableBusiness Activity: Metals and MiningKey shareholders: BHP Billiton Ltd ,
Rio Tinto Ltd Business Risk Profile: StrongFinancial Risk Profile: Intermediate
Financial Statisticsas of December
US$ million 2006 2005 2004 Averagelast three
years
Revenues 8,375.1 4,359.8 3,149.8 5,294.9EBITDA 6,932.2 3,404.9 2,351.6 4,229.6Funds from operations (FFO) 5,549.6 3,205.7 2,154.6 3,636.6Capital expenditures 497.9 735.7 398.6 544.1Dividends 5,330.0 1,600.2 1,190.1 2,706.8
Total debt 1,423.9 1,509.1 1,761.8 1,564.9Shareholders equity 2,802.2 2,807.5 1,829.6 2,479.8Cash and short term investments 68.5 170.8 255.6 165.0Total assets 5,404.0 5,144.6 4,350.6 4,966.4
EBITDA margin (%) 82.8 78.1 74.7 78.5EBITDA interest coverage (x) 74.5 50.5 32.7 52.6FFO to total debt (%) 389.8 212.4 122.3 241.5Total debt to total capital (%) 33.7 35.0 49.1 39.3Total debt to EBITDA (x) 0.2 0.4 0.7 0.4
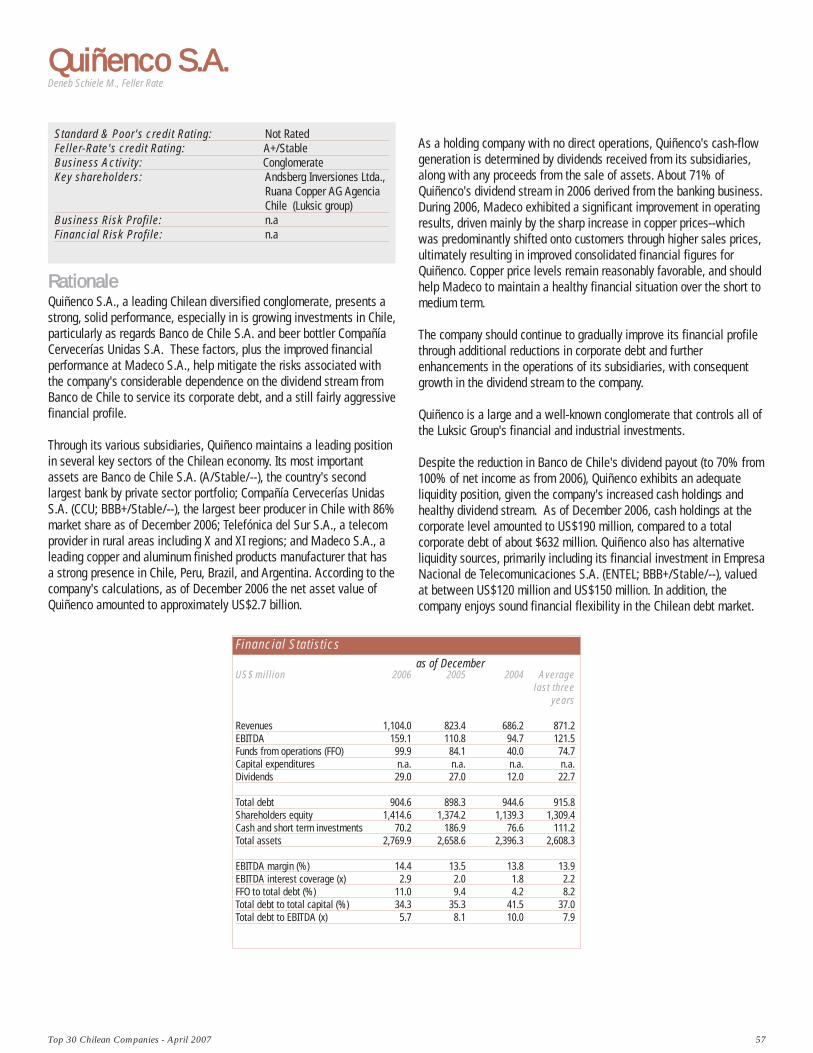
Top 30 Chilean Companies - April 2007 57
Quiñenco SS.A.
RRaattiioonnaalleeQuiñenco S.A., a leading Chilean diversified conglomerate, presents astrong, solid performance, especially in is growing investments in Chile,particularly as regards Banco de Chile S.A. and beer bottler CompañíaCervecerías Unidas S.A. These factors, plus the improved financialperformance at Madeco S.A., help mitigate the risks associated withthe company's considerable dependence on the dividend stream fromBanco de Chile to service its corporate debt, and a still fairly aggressivefinancial profile.
Through its various subsidiaries, Quiñenco maintains a leading positionin several key sectors of the Chilean economy. Its most importantassets are Banco de Chile S.A. (A/Stable/--), the country's secondlargest bank by private sector portfolio; Compañía Cervecerías UnidasS.A. (CCU; BBB+/Stable/--), the largest beer producer in Chile with 86%market share as of December 2006; Telefónica del Sur S.A., a telecomprovider in rural areas including X and XI regions; and Madeco S.A., aleading copper and aluminum finished products manufacturer that hasa strong presence in Chile, Peru, Brazil, and Argentina. According to thecompany's calculations, as of December 2006 the net asset value ofQuiñenco amounted to approximately US$2.7 billion.
As a holding company with no direct operations, Quiñenco's cash-flowgeneration is determined by dividends received from its subsidiaries,along with any proceeds from the sale of assets. About 71% ofQuiñenco's dividend stream in 2006 derived from the banking business. During 2006, Madeco exhibited a significant improvement in operatingresults, driven mainly by the sharp increase in copper prices--whichwas predominantly shifted onto customers through higher sales prices,ultimately resulting in improved consolidated financial figures forQuiñenco. Copper price levels remain reasonably favorable, and shouldhelp Madeco to maintain a healthy financial situation over the short tomedium term.
The company should continue to gradually improve its financial profilethrough additional reductions in corporate debt and furtherenhancements in the operations of its subsidiaries, with consequentgrowth in the dividend stream to the company.
Quiñenco is a large and a well-known conglomerate that controls all ofthe Luksic Group's financial and industrial investments.
Despite the reduction in Banco de Chile's dividend payout (to 70% from100% of net income as from 2006), Quiñenco exhibits an adequateliquidity position, given the company's increased cash holdings andhealthy dividend stream. As of December 2006, cash holdings at thecorporate level amounted to US$190 million, compared to a totalcorporate debt of about $632 million. Quiñenco also has alternativeliquidity sources, primarily including its financial investment in EmpresaNacional de Telecomunicaciones S.A. (ENTEL; BBB+/Stable/--), valuedat between US$120 million and US$150 million. In addition, thecompany enjoys sound financial flexibility in the Chilean debt market.
Deneb Schiele M., Feller Rate
Standard & Poor's credit Rating: Not RatedFeller-Rate's credit Rating: A+/StableBusiness Activity: ConglomerateKey shareholders: Andsberg Inversiones Ltda.,
Ruana Copper AG Agencia Chile (Luksic group)
Business Risk Profile: n.aFinancial Risk Profile: n.a
Financial Statisticsas of December
US$ million 2006 2005 2004 Averagelast three
years
Revenues 1,104.0 823.4 686.2 871.2EBITDA 159.1 110.8 94.7 121.5Funds from operations (FFO) 99.9 84.1 40.0 74.7Capital expenditures n.a. n.a. n.a. n.a.Dividends 29.0 27.0 12.0 22.7
Total debt 904.6 898.3 944.6 915.8Shareholders equity 1,414.6 1,374.2 1,139.3 1,309.4Cash and short term investments 70.2 186.9 76.6 111.2Total assets 2,769.9 2,658.6 2,396.3 2,608.3
EBITDA margin (%) 14.4 13.5 13.8 13.9EBITDA interest coverage (x) 2.9 2.0 1.8 2.2FFO to total debt (%) 11.0 9.4 4.2 8.2Total debt to total capital (%) 34.3 35.3 41.5 37.0Total debt to EBITDA (x) 5.7 8.1 10.0 7.9
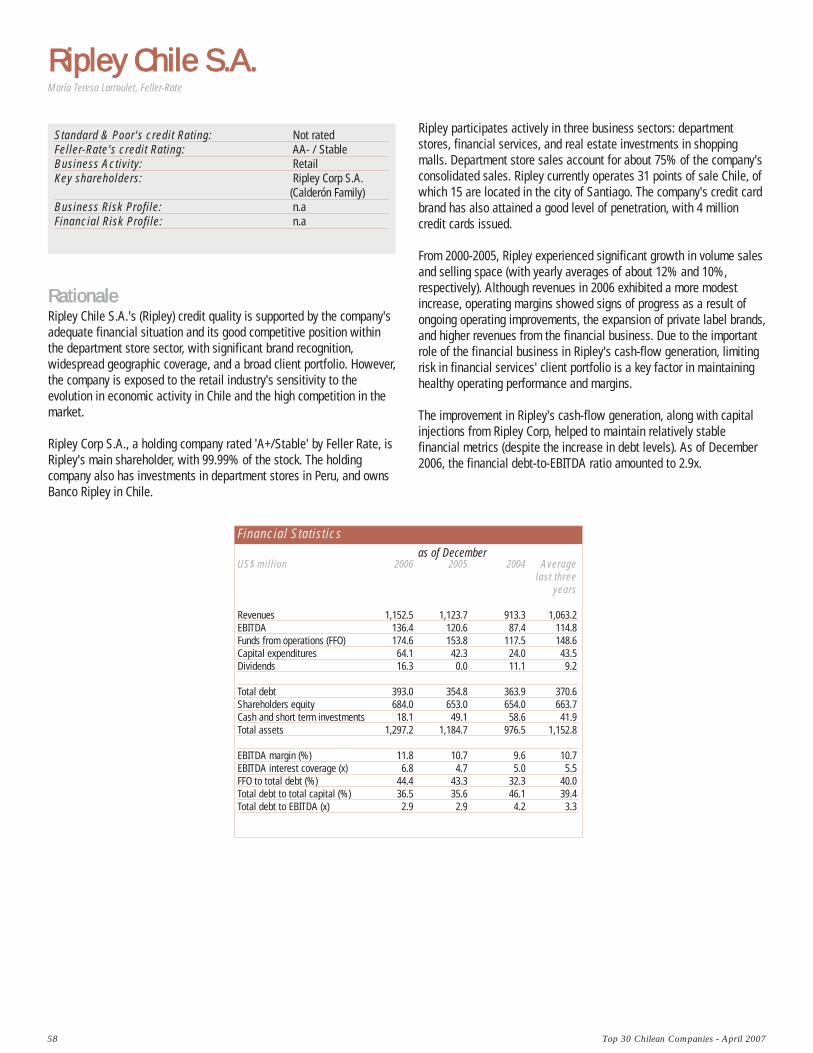
Ripley participates actively in three business sectors: departmentstores, financial services, and real estate investments in shoppingmalls. Department store sales account for about 75% of the company'sconsolidated sales. Ripley currently operates 31 points of sale Chile, ofwhich 15 are located in the city of Santiago. The company's credit cardbrand has also attained a good level of penetration, with 4 millioncredit cards issued.
From 2000-2005, Ripley experienced significant growth in volume salesand selling space (with yearly averages of about 12% and 10%,respectively). Although revenues in 2006 exhibited a more modestincrease, operating margins showed signs of progress as a result ofongoing operating improvements, the expansion of private label brands,and higher revenues from the financial business. Due to the importantrole of the financial business in Ripley's cash-flow generation, limitingrisk in financial services' client portfolio is a key factor in maintaininghealthy operating performance and margins.
The improvement in Ripley's cash-flow generation, along with capitalinjections from Ripley Corp, helped to maintain relatively stablefinancial metrics (despite the increase in debt levels). As of December2006, the financial debt-to-EBITDA ratio amounted to 2.9x.
58 Top 30 Chilean Companies - April 2007
Ripley CChile SS.A.
RRaattiioonnaalleeRipley Chile S.A.'s (Ripley) credit quality is supported by the company'sadequate financial situation and its good competitive position withinthe department store sector, with significant brand recognition,widespread geographic coverage, and a broad client portfolio. However,the company is exposed to the retail industry's sensitivity to theevolution in economic activity in Chile and the high competition in themarket.
Ripley Corp S.A., a holding company rated 'A+/Stable' by Feller Rate, isRipley's main shareholder, with 99.99% of the stock. The holdingcompany also has investments in department stores in Peru, and ownsBanco Ripley in Chile.
María Teresa Larroulet, Feller-Rate
Standard & Poor's credit Rating: Not ratedFeller-Rate's credit Rating: AA- / StableBusiness Activity: Retail Key shareholders: Ripley Corp S.A.
(Calderón Family) Business Risk Profile: n.aFinancial Risk Profile: n.a
Financial Statisticsas of December
US$ million 2006 2005 2004 Averagelast three
years
Revenues 1,152.5 1,123.7 913.3 1,063.2EBITDA 136.4 120.6 87.4 114.8Funds from operations (FFO) 174.6 153.8 117.5 148.6Capital expenditures 64.1 42.3 24.0 43.5Dividends 16.3 0.0 11.1 9.2
Total debt 393.0 354.8 363.9 370.6Shareholders equity 684.0 653.0 654.0 663.7Cash and short term investments 18.1 49.1 58.6 41.9Total assets 1,297.2 1,184.7 976.5 1,152.8
EBITDA margin (%) 11.8 10.7 9.6 10.7EBITDA interest coverage (x) 6.8 4.7 5.0 5.5FFO to total debt (%) 44.4 43.3 32.3 40.0Total debt to total capital (%) 36.5 35.6 46.1 39.4Total debt to EBITDA (x) 2.9 2.9 4.2 3.3
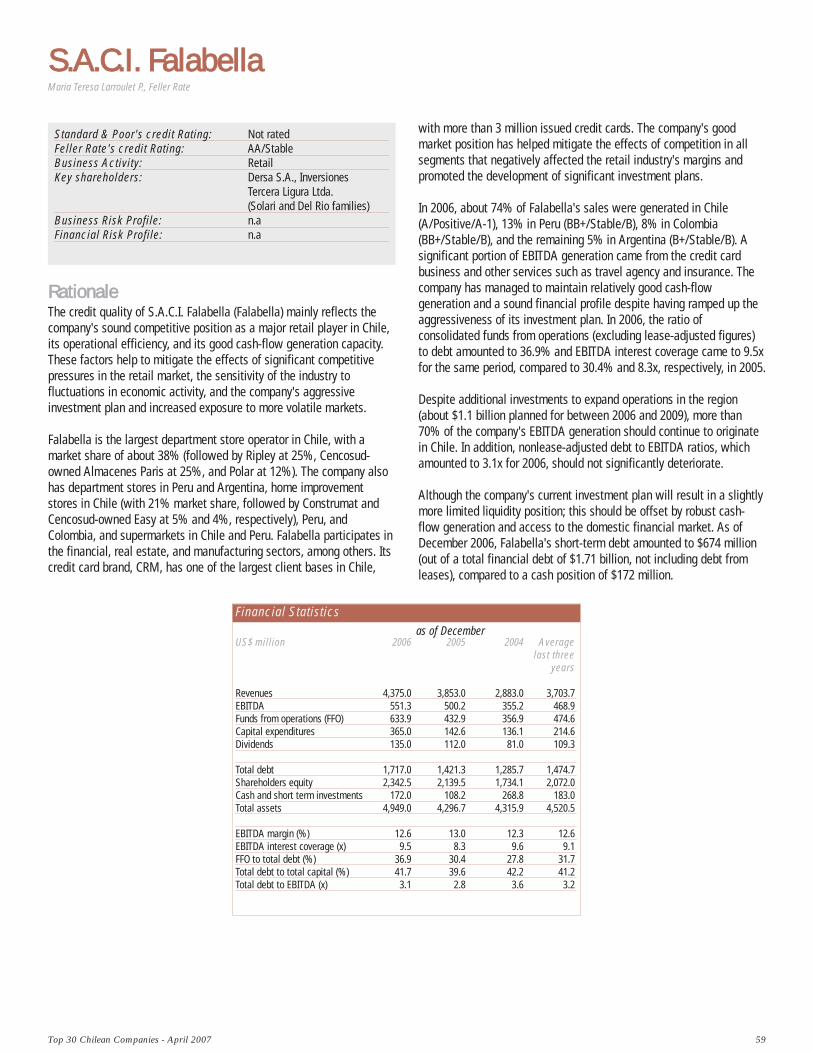
Top 30 Chilean Companies - April 2007 59
S.A.C.I. FFalabella
RRaattiioonnaalleeThe credit quality of S.A.C.I. Falabella (Falabella) mainly reflects thecompany's sound competitive position as a major retail player in Chile,its operational efficiency, and its good cash-flow generation capacity.These factors help to mitigate the effects of significant competitivepressures in the retail market, the sensitivity of the industry tofluctuations in economic activity, and the company's aggressiveinvestment plan and increased exposure to more volatile markets.
Falabella is the largest department store operator in Chile, with amarket share of about 38% (followed by Ripley at 25%, Cencosud-owned Almacenes Paris at 25%, and Polar at 12%). The company alsohas department stores in Peru and Argentina, home improvementstores in Chile (with 21% market share, followed by Construmat andCencosud-owned Easy at 5% and 4%, respectively), Peru, andColombia, and supermarkets in Chile and Peru. Falabella participates inthe financial, real estate, and manufacturing sectors, among others. Itscredit card brand, CRM, has one of the largest client bases in Chile,
Standard & Poor's credit Rating: Not ratedFeller Rate's credit Rating: AA/StableBusiness Activity: Retail Key shareholders: Dersa S.A., Inversiones
Tercera Ligura Ltda.(Solari and Del Rio families)
Business Risk Profile: n.aFinancial Risk Profile: n.a
with more than 3 million issued credit cards. The company's goodmarket position has helped mitigate the effects of competition in allsegments that negatively affected the retail industry's margins andpromoted the development of significant investment plans.
In 2006, about 74% of Falabella's sales were generated in Chile(A/Positive/A-1), 13% in Peru (BB+/Stable/B), 8% in Colombia(BB+/Stable/B), and the remaining 5% in Argentina (B+/Stable/B). Asignificant portion of EBITDA generation came from the credit cardbusiness and other services such as travel agency and insurance. Thecompany has managed to maintain relatively good cash-flowgeneration and a sound financial profile despite having ramped up theaggressiveness of its investment plan. In 2006, the ratio ofconsolidated funds from operations (excluding lease-adjusted figures)to debt amounted to 36.9% and EBITDA interest coverage came to 9.5xfor the same period, compared to 30.4% and 8.3x, respectively, in 2005.
Despite additional investments to expand operations in the region(about $1.1 billion planned for between 2006 and 2009), more than70% of the company's EBITDA generation should continue to originatein Chile. In addition, nonlease-adjusted debt to EBITDA ratios, whichamounted to 3.1x for 2006, should not significantly deteriorate.
Although the company's current investment plan will result in a slightlymore limited liquidity position; this should be offset by robust cash-flow generation and access to the domestic financial market. As ofDecember 2006, Falabella's short-term debt amounted to $674 million(out of a total financial debt of $1.71 billion, not including debt fromleases), compared to a cash position of $172 million.
Maria Teresa Larroulet P., Feller Rate
Financial Statisticsas of December
US$ million 2006 2005 2004 Averagelast three
years
Revenues 4,375.0 3,853.0 2,883.0 3,703.7EBITDA 551.3 500.2 355.2 468.9Funds from operations (FFO) 633.9 432.9 356.9 474.6Capital expenditures 365.0 142.6 136.1 214.6Dividends 135.0 112.0 81.0 109.3
Total debt 1,717.0 1,421.3 1,285.7 1,474.7Shareholders equity 2,342.5 2,139.5 1,734.1 2,072.0Cash and short term investments 172.0 108.2 268.8 183.0Total assets 4,949.0 4,296.7 4,315.9 4,520.5
EBITDA margin (%) 12.6 13.0 12.3 12.6EBITDA interest coverage (x) 9.5 8.3 9.6 9.1FFO to total debt (%) 36.9 30.4 27.8 31.7Total debt to total capital (%) 41.7 39.6 42.2 41.2Total debt to EBITDA (x) 3.1 2.8 3.6 3.2
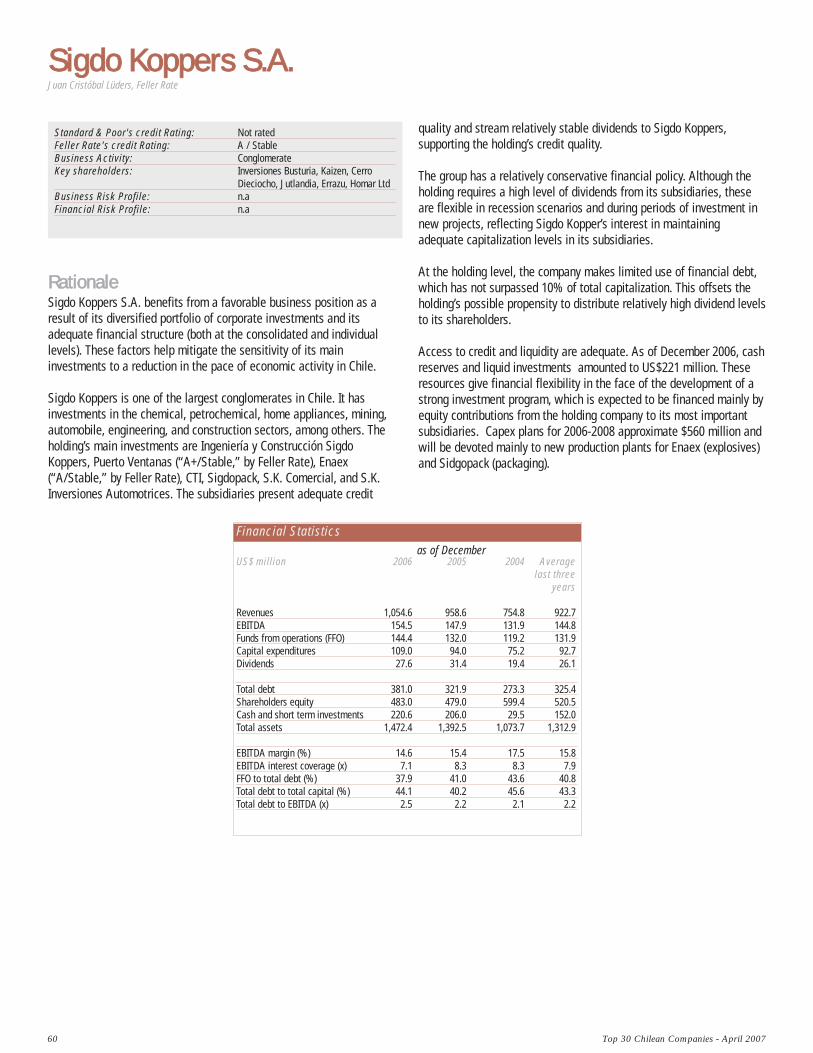
60 Top 30 Chilean Companies - April 2007
Sigdo KKoppers SS.A.
RRaattiioonnaalleeSigdo Koppers S.A. benefits from a favorable business position as aresult of its diversified portfolio of corporate investments and itsadequate financial structure (both at the consolidated and individuallevels). These factors help mitigate the sensitivity of its maininvestments to a reduction in the pace of economic activity in Chile.
Sigdo Koppers is one of the largest conglomerates in Chile. It hasinvestments in the chemical, petrochemical, home appliances, mining,automobile, engineering, and construction sectors, among others. Theholding’s main investments are Ingeniería y Construcción SigdoKoppers, Puerto Ventanas (“A+/Stable,” by Feller Rate), Enaex(“A/Stable,” by Feller Rate), CTI, Sigdopack, S.K. Comercial, and S.K.Inversiones Automotrices. The subsidiaries present adequate credit
Standard & Poor's credit Rating: Not ratedFeller Rate's credit Rating: A / StableBusiness Activity: ConglomerateKey shareholders: Inversiones Busturia, Kaizen, Cerro
Dieciocho, Jutlandia, Errazu, Homar LtdBusiness Risk Profile: n.aFinancial Risk Profile: n.a
quality and stream relatively stable dividends to Sigdo Koppers,supporting the holding’s credit quality.
The group has a relatively conservative financial policy. Although theholding requires a high level of dividends from its subsidiaries, theseare flexible in recession scenarios and during periods of investment innew projects, reflecting Sigdo Kopper’s interest in maintainingadequate capitalization levels in its subsidiaries.
At the holding level, the company makes limited use of financial debt,which has not surpassed 10% of total capitalization. This offsets theholding’s possible propensity to distribute relatively high dividend levelsto its shareholders.
Access to credit and liquidity are adequate. As of December 2006, cashreserves and liquid investments amounted to US$221 million. Theseresources give financial flexibility in the face of the development of astrong investment program, which is expected to be financed mainly byequity contributions from the holding company to its most importantsubsidiaries. Capex plans for 2006-2008 approximate $560 million andwill be devoted mainly to new production plants for Enaex (explosives)and Sidgopack (packaging).
Juan Cristóbal Lüders, Feller Rate
Financial Statisticsas of December
US$ million 2006 2005 2004 Averagelast three
years
Revenues 1,054.6 958.6 754.8 922.7EBITDA 154.5 147.9 131.9 144.8Funds from operations (FFO) 144.4 132.0 119.2 131.9Capital expenditures 109.0 94.0 75.2 92.7Dividends 27.6 31.4 19.4 26.1
Total debt 381.0 321.9 273.3 325.4Shareholders equity 483.0 479.0 599.4 520.5Cash and short term investments 220.6 206.0 29.5 152.0Total assets 1,472.4 1,392.5 1,073.7 1,312.9
EBITDA margin (%) 14.6 15.4 17.5 15.8EBITDA interest coverage (x) 7.1 8.3 8.3 7.9FFO to total debt (%) 37.9 41.0 43.6 40.8Total debt to total capital (%) 44.1 40.2 45.6 43.3Total debt to EBITDA (x) 2.5 2.2 2.1 2.2
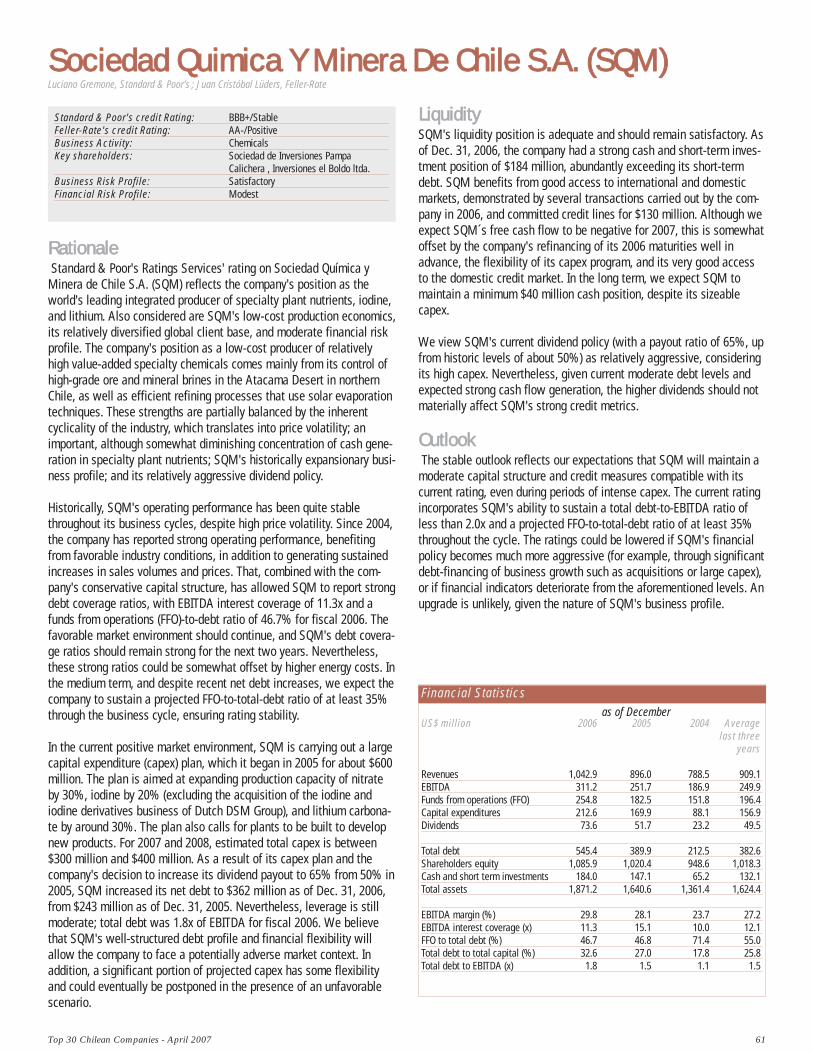
Top 30 Chilean Companies - April 2007 61
Sociedad QQuimica YY MMinera DDe CChile SS.A. ((SQM)
RRaattiioonnaallee Standard & Poor's Ratings Services' rating on Sociedad Química y
Minera de Chile S.A. (SQM) reflects the company's position as theworld's leading integrated producer of specialty plant nutrients, iodine,and lithium. Also considered are SQM's low-cost production economics,its relatively diversified global client base, and moderate financial riskprofile. The company's position as a low-cost producer of relativelyhigh value-added specialty chemicals comes mainly from its control ofhigh-grade ore and mineral brines in the Atacama Desert in northernChile, as well as efficient refining processes that use solar evaporationtechniques. These strengths are partially balanced by the inherentcyclicality of the industry, which translates into price volatility; animportant, although somewhat diminishing concentration of cash gene-ration in specialty plant nutrients; SQM's historically expansionary busi-ness profile; and its relatively aggressive dividend policy.
Historically, SQM's operating performance has been quite stablethroughout its business cycles, despite high price volatility. Since 2004,the company has reported strong operating performance, benefitingfrom favorable industry conditions, in addition to generating sustainedincreases in sales volumes and prices. That, combined with the com-pany's conservative capital structure, has allowed SQM to report strongdebt coverage ratios, with EBITDA interest coverage of 11.3x and afunds from operations (FFO)-to-debt ratio of 46.7% for fiscal 2006. Thefavorable market environment should continue, and SQM's debt covera-ge ratios should remain strong for the next two years. Nevertheless,these strong ratios could be somewhat offset by higher energy costs. Inthe medium term, and despite recent net debt increases, we expect thecompany to sustain a projected FFO-to-total-debt ratio of at least 35%through the business cycle, ensuring rating stability.
In the current positive market environment, SQM is carrying out a largecapital expenditure (capex) plan, which it began in 2005 for about $600million. The plan is aimed at expanding production capacity of nitrateby 30%, iodine by 20% (excluding the acquisition of the iodine andiodine derivatives business of Dutch DSM Group), and lithium carbona-te by around 30%. The plan also calls for plants to be built to developnew products. For 2007 and 2008, estimated total capex is between$300 million and $400 million. As a result of its capex plan and thecompany's decision to increase its dividend payout to 65% from 50% in2005, SQM increased its net debt to $362 million as of Dec. 31, 2006,from $243 million as of Dec. 31, 2005. Nevertheless, leverage is stillmoderate; total debt was 1.8x of EBITDA for fiscal 2006. We believethat SQM's well-structured debt profile and financial flexibility willallow the company to face a potentially adverse market context. Inaddition, a significant portion of projected capex has some flexibilityand could eventually be postponed in the presence of an unfavorablescenario.
Standard & Poor's credit Rating: BBB+/StableFeller-Rate's credit Rating: AA-/PositiveBusiness Activity: ChemicalsKey shareholders: Sociedad de Inversiones Pampa
Calichera , Inversiones el Boldo ltda. Business Risk Profile: SatisfactoryFinancial Risk Profile: Modest
LLiiqquuiiddiittyy SQM's liquidity position is adequate and should remain satisfactory. Asof Dec. 31, 2006, the company had a strong cash and short-term inves-tment position of $184 million, abundantly exceeding its short-termdebt. SQM benefits from good access to international and domesticmarkets, demonstrated by several transactions carried out by the com-pany in 2006, and committed credit lines for $130 million. Although weexpect SQM´s free cash flow to be negative for 2007, this is somewhatoffset by the company's refinancing of its 2006 maturities well inadvance, the flexibility of its capex program, and its very good accessto the domestic credit market. In the long term, we expect SQM tomaintain a minimum $40 million cash position, despite its sizeablecapex.
We view SQM's current dividend policy (with a payout ratio of 65%, upfrom historic levels of about 50%) as relatively aggressive, consideringits high capex. Nevertheless, given current moderate debt levels andexpected strong cash flow generation, the higher dividends should notmaterially affect SQM's strong credit metrics.
OOuuttllooookk The stable outlook reflects our expectations that SQM will maintain a
moderate capital structure and credit measures compatible with itscurrent rating, even during periods of intense capex. The current ratingincorporates SQM's ability to sustain a total debt-to-EBITDA ratio ofless than 2.0x and a projected FFO-to-total-debt ratio of at least 35%throughout the cycle. The ratings could be lowered if SQM's financialpolicy becomes much more aggressive (for example, through significantdebt-financing of business growth such as acquisitions or large capex),or if financial indicators deteriorate from the aforementioned levels. Anupgrade is unlikely, given the nature of SQM's business profile.
Luciano Gremone, Standard & Poor's ; Juan Cristóbal Lüders, Feller-Rate
Financial Statisticsas of December
US$ million 2006 2005 2004 Averagelast three
years
Revenues 1,042.9 896.0 788.5 909.1EBITDA 311.2 251.7 186.9 249.9Funds from operations (FFO) 254.8 182.5 151.8 196.4Capital expenditures 212.6 169.9 88.1 156.9Dividends 73.6 51.7 23.2 49.5
Total debt 545.4 389.9 212.5 382.6Shareholders equity 1,085.9 1,020.4 948.6 1,018.3Cash and short term investments 184.0 147.1 65.2 132.1Total assets 1,871.2 1,640.6 1,361.4 1,624.4
EBITDA margin (%) 29.8 28.1 23.7 27.2EBITDA interest coverage (x) 11.3 15.1 10.0 12.1FFO to total debt (%) 46.7 46.8 71.4 55.0Total debt to total capital (%) 32.6 27.0 17.8 25.8Total debt to EBITDA (x) 1.8 1.5 1.1 1.5
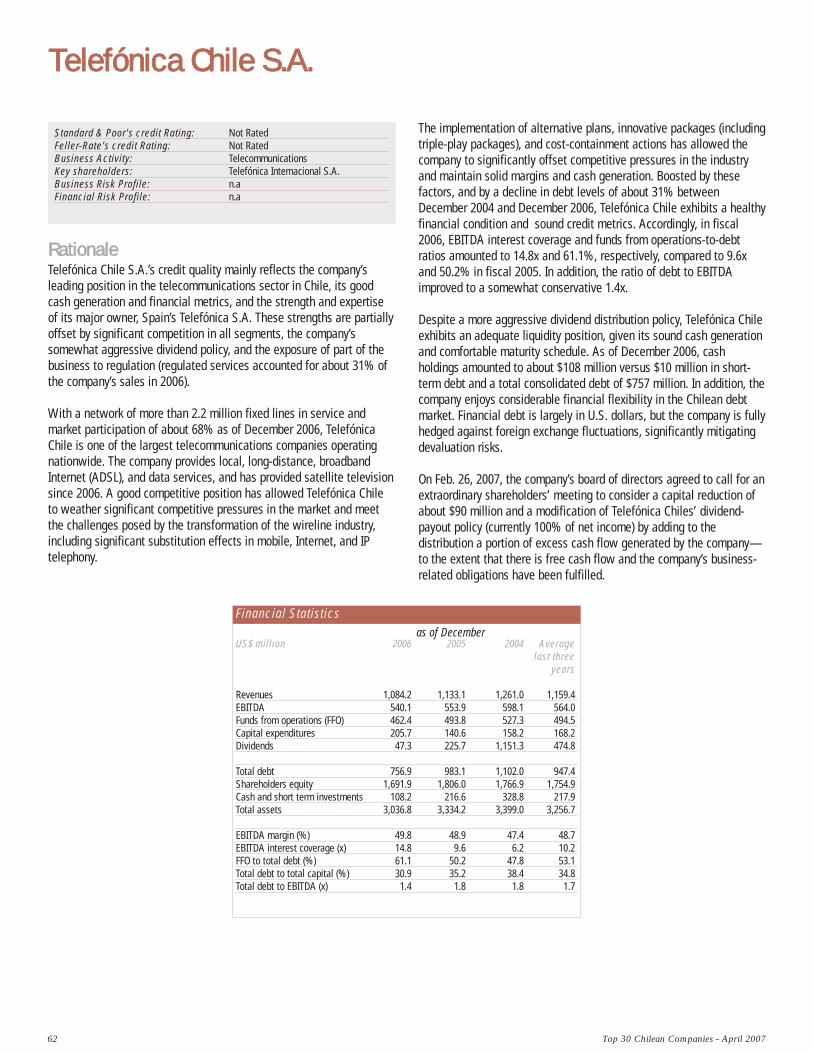
62 Top 30 Chilean Companies - April 2007
Telefónica CChile SS.A.
RRaattiioonnaalleeTelefónica Chile S.A.’s credit quality mainly reflects the company’sleading position in the telecommunications sector in Chile, its goodcash generation and financial metrics, and the strength and expertiseof its major owner, Spain’s Telefónica S.A. These strengths are partiallyoffset by significant competition in all segments, the company’ssomewhat aggressive dividend policy, and the exposure of part of thebusiness to regulation (regulated services accounted for about 31% ofthe company’s sales in 2006).
With a network of more than 2.2 million fixed lines in service andmarket participation of about 68% as of December 2006, TelefónicaChile is one of the largest telecommunications companies operatingnationwide. The company provides local, long-distance, broadbandInternet (ADSL), and data services, and has provided satellite televisionsince 2006. A good competitive position has allowed Telefónica Chileto weather significant competitive pressures in the market and meetthe challenges posed by the transformation of the wireline industry,including significant substitution effects in mobile, Internet, and IPtelephony.
The implementation of alternative plans, innovative packages (includingtriple-play packages), and cost-containment actions has allowed thecompany to significantly offset competitive pressures in the industryand maintain solid margins and cash generation. Boosted by thesefactors, and by a decline in debt levels of about 31% betweenDecember 2004 and December 2006, Telefónica Chile exhibits a healthyfinancial condition and sound credit metrics. Accordingly, in fiscal2006, EBITDA interest coverage and funds from operations-to-debtratios amounted to 14.8x and 61.1%, respectively, compared to 9.6xand 50.2% in fiscal 2005. In addition, the ratio of debt to EBITDAimproved to a somewhat conservative 1.4x.
Despite a more aggressive dividend distribution policy, Telefónica Chileexhibits an adequate liquidity position, given its sound cash generationand comfortable maturity schedule. As of December 2006, cashholdings amounted to about $108 million versus $10 million in short-term debt and a total consolidated debt of $757 million. In addition, thecompany enjoys considerable financial flexibility in the Chilean debtmarket. Financial debt is largely in U.S. dollars, but the company is fullyhedged against foreign exchange fluctuations, significantly mitigatingdevaluation risks.
On Feb. 26, 2007, the company’s board of directors agreed to call for anextraordinary shareholders’ meeting to consider a capital reduction ofabout $90 million and a modification of Telefónica Chiles’ dividend-payout policy (currently 100% of net income) by adding to thedistribution a portion of excess cash flow generated by the company—to the extent that there is free cash flow and the company’s business-related obligations have been fulfilled.
Standard & Poor's credit Rating: Not RatedFeller-Rate's credit Rating: Not RatedBusiness Activity: TelecommunicationsKey shareholders: Telefónica Internacional S.A. Business Risk Profile: n.aFinancial Risk Profile: n.a
Financial Statisticsas of December
US$ million 2006 2005 2004 Averagelast three
years
Revenues 1,084.2 1,133.1 1,261.0 1,159.4EBITDA 540.1 553.9 598.1 564.0Funds from operations (FFO) 462.4 493.8 527.3 494.5Capital expenditures 205.7 140.6 158.2 168.2Dividends 47.3 225.7 1,151.3 474.8
Total debt 756.9 983.1 1,102.0 947.4Shareholders equity 1,691.9 1,806.0 1,766.9 1,754.9Cash and short term investments 108.2 216.6 328.8 217.9Total assets 3,036.8 3,334.2 3,399.0 3,256.7
EBITDA margin (%) 49.8 48.9 47.4 48.7EBITDA interest coverage (x) 14.8 9.6 6.2 10.2FFO to total debt (%) 61.1 50.2 47.8 53.1Total debt to total capital (%) 30.9 35.2 38.4 34.8Total debt to EBITDA (x) 1.4 1.8 1.8 1.7
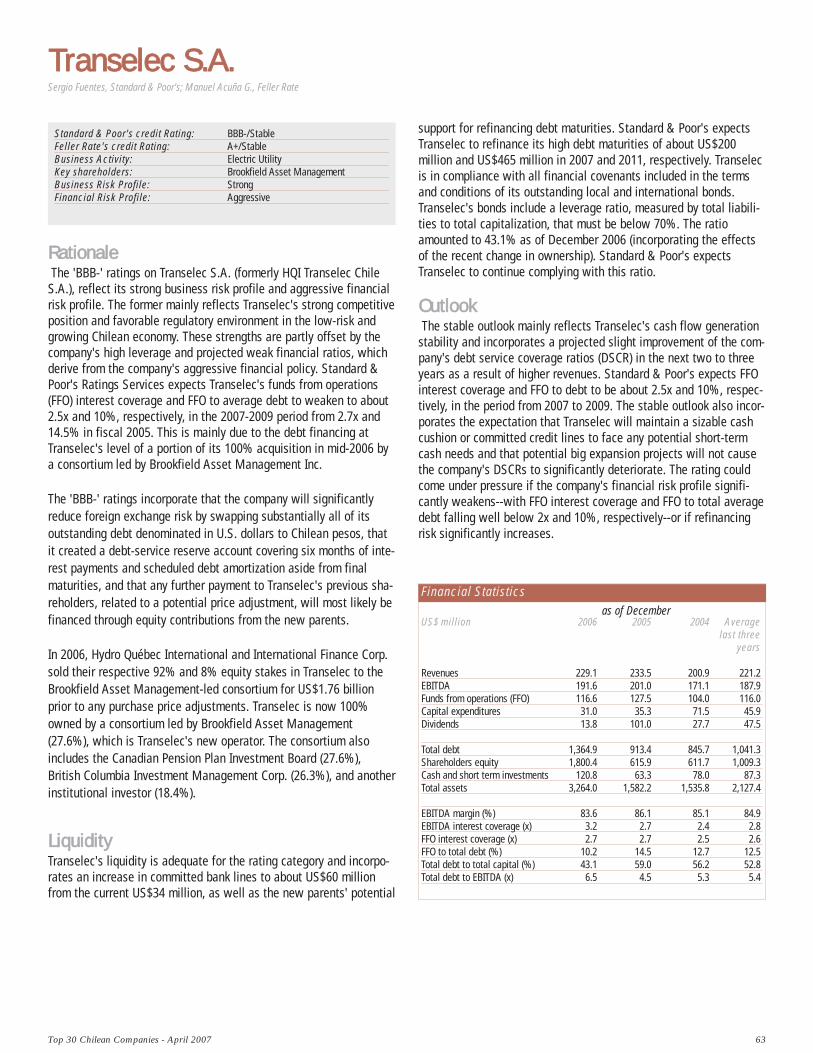
Top 30 Chilean Companies - April 2007 63
Transelec SS.A.
RRaattiioonnaallee The 'BBB-' ratings on Transelec S.A. (formerly HQI Transelec Chile
S.A.), reflect its strong business risk profile and aggressive financialrisk profile. The former mainly reflects Transelec's strong competitiveposition and favorable regulatory environment in the low-risk andgrowing Chilean economy. These strengths are partly offset by thecompany's high leverage and projected weak financial ratios, whichderive from the company's aggressive financial policy. Standard &Poor's Ratings Services expects Transelec's funds from operations(FFO) interest coverage and FFO to average debt to weaken to about2.5x and 10%, respectively, in the 2007-2009 period from 2.7x and14.5% in fiscal 2005. This is mainly due to the debt financing atTranselec's level of a portion of its 100% acquisition in mid-2006 bya consortium led by Brookfield Asset Management Inc.
The 'BBB-' ratings incorporate that the company will significantlyreduce foreign exchange risk by swapping substantially all of itsoutstanding debt denominated in U.S. dollars to Chilean pesos, thatit created a debt-service reserve account covering six months of inte-rest payments and scheduled debt amortization aside from finalmaturities, and that any further payment to Transelec's previous sha-reholders, related to a potential price adjustment, will most likely befinanced through equity contributions from the new parents.
In 2006, Hydro Québec International and International Finance Corp.sold their respective 92% and 8% equity stakes in Transelec to theBrookfield Asset Management-led consortium for US$1.76 billionprior to any purchase price adjustments. Transelec is now 100%owned by a consortium led by Brookfield Asset Management(27.6%), which is Transelec's new operator. The consortium alsoincludes the Canadian Pension Plan Investment Board (27.6%),British Columbia Investment Management Corp. (26.3%), and anotherinstitutional investor (18.4%).
LLiiqquuiiddiittyy Transelec's liquidity is adequate for the rating category and incorpo-rates an increase in committed bank lines to about US$60 millionfrom the current US$34 million, as well as the new parents' potential
support for refinancing debt maturities. Standard & Poor's expectsTranselec to refinance its high debt maturities of about US$200million and US$465 million in 2007 and 2011, respectively. Transelecis in compliance with all financial covenants included in the termsand conditions of its outstanding local and international bonds.Transelec's bonds include a leverage ratio, measured by total liabili-ties to total capitalization, that must be below 70%. The ratioamounted to 43.1% as of December 2006 (incorporating the effectsof the recent change in ownership). Standard & Poor's expectsTranselec to continue complying with this ratio.
OOuuttllooookk The stable outlook mainly reflects Transelec's cash flow generation
stability and incorporates a projected slight improvement of the com-pany's debt service coverage ratios (DSCR) in the next two to threeyears as a result of higher revenues. Standard & Poor's expects FFOinterest coverage and FFO to debt to be about 2.5x and 10%, respec-tively, in the period from 2007 to 2009. The stable outlook also incor-porates the expectation that Transelec will maintain a sizable cashcushion or committed credit lines to face any potential short-termcash needs and that potential big expansion projects will not causethe company's DSCRs to significantly deteriorate. The rating couldcome under pressure if the company's financial risk profile signifi-cantly weakens--with FFO interest coverage and FFO to total averagedebt falling well below 2x and 10%, respectively--or if refinancingrisk significantly increases.
Standard & Poor's credit Rating: BBB-/StableFeller Rate's credit Rating: A+/StableBusiness Activity: Electric UtilityKey shareholders: Brookfield Asset ManagementBusiness Risk Profile: StrongFinancial Risk Profile: Aggressive
Sergio Fuentes, Standard & Poor's; Manuel Acuña G., Feller Rate
Financial Statisticsas of December
US$ million 2006 2005 2004 Averagelast three
years
Revenues 229.1 233.5 200.9 221.2EBITDA 191.6 201.0 171.1 187.9Funds from operations (FFO) 116.6 127.5 104.0 116.0Capital expenditures 31.0 35.3 71.5 45.9Dividends 13.8 101.0 27.7 47.5
Total debt 1,364.9 913.4 845.7 1,041.3Shareholders equity 1,800.4 615.9 611.7 1,009.3Cash and short term investments 120.8 63.3 78.0 87.3Total assets 3,264.0 1,582.2 1,535.8 2,127.4
EBITDA margin (%) 83.6 86.1 85.1 84.9EBITDA interest coverage (x) 3.2 2.7 2.4 2.8FFO interest coverage (x) 2.7 2.7 2.5 2.6FFO to total debt (%) 10.2 14.5 12.7 12.5Total debt to total capital (%) 43.1 59.0 56.2 52.8Total debt to EBITDA (x) 6.5 4.5 5.3 5.4
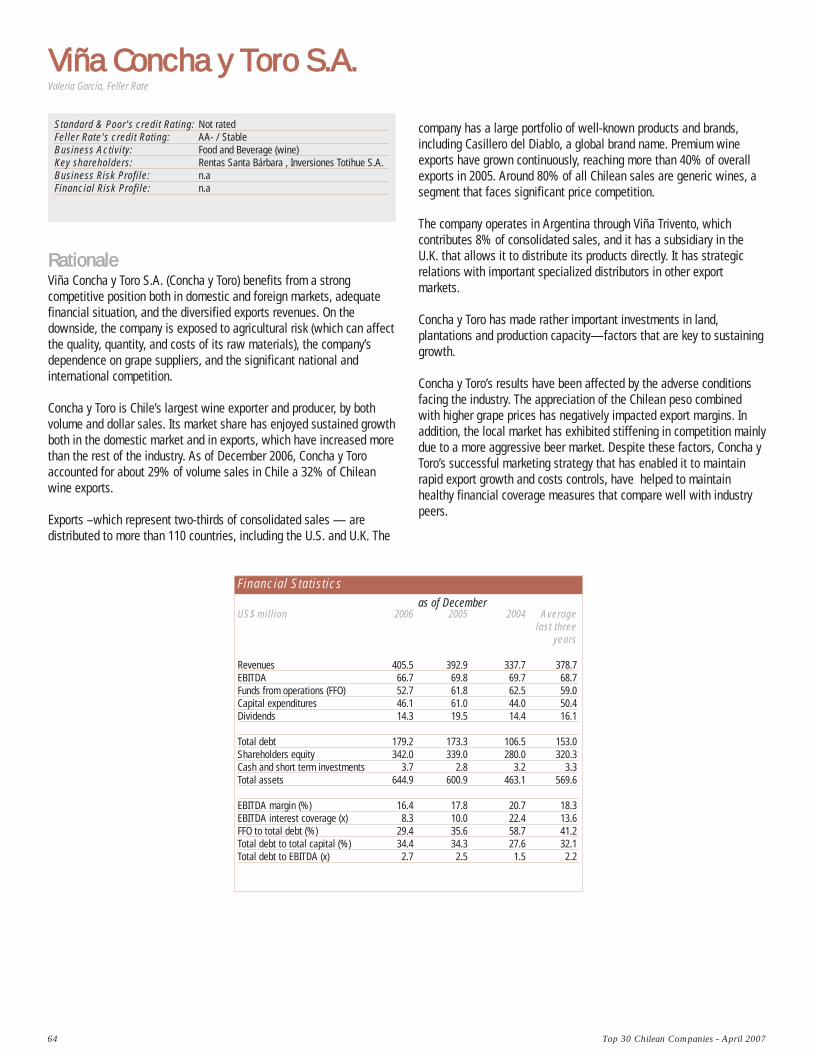
company has a large portfolio of well-known products and brands,including Casillero del Diablo, a global brand name. Premium wineexports have grown continuously, reaching more than 40% of overallexports in 2005. Around 80% of all Chilean sales are generic wines, asegment that faces significant price competition.
The company operates in Argentina through Viña Trivento, whichcontributes 8% of consolidated sales, and it has a subsidiary in theU.K. that allows it to distribute its products directly. It has strategicrelations with important specialized distributors in other exportmarkets.
Concha y Toro has made rather important investments in land,plantations and production capacity—factors that are key to sustaininggrowth.
Concha y Toro’s results have been affected by the adverse conditionsfacing the industry. The appreciation of the Chilean peso combinedwith higher grape prices has negatively impacted export margins. Inaddition, the local market has exhibited stiffening in competition mainlydue to a more aggressive beer market. Despite these factors, Concha yToro’s successful marketing strategy that has enabled it to maintainrapid export growth and costs controls, have helped to maintainhealthy financial coverage measures that compare well with industrypeers.
64 Top 30 Chilean Companies - April 2007
Viña CConcha yy TToro SS.A.
RRaattiioonnaalleeViña Concha y Toro S.A. (Concha y Toro) benefits from a strongcompetitive position both in domestic and foreign markets, adequatefinancial situation, and the diversified exports revenues. On thedownside, the company is exposed to agricultural risk (which can affectthe quality, quantity, and costs of its raw materials), the company’sdependence on grape suppliers, and the significant national andinternational competition.
Concha y Toro is Chile’s largest wine exporter and producer, by bothvolume and dollar sales. Its market share has enjoyed sustained growthboth in the domestic market and in exports, which have increased morethan the rest of the industry. As of December 2006, Concha y Toroaccounted for about 29% of volume sales in Chile a 32% of Chileanwine exports.
Exports –which represent two-thirds of consolidated sales — aredistributed to more than 110 countries, including the U.S. and U.K. The
Standard & Poor's credit Rating: Not ratedFeller Rate's credit Rating: AA- / StableBusiness Activity: Food and Beverage (wine)Key shareholders: Rentas Santa Bárbara , Inversiones Totihue S.A. Business Risk Profile: n.aFinancial Risk Profile: n.a
Valeria García, Feller Rate
Financial Statisticsas of December
US$ million 2006 2005 2004 Averagelast three
years
Revenues 405.5 392.9 337.7 378.7EBITDA 66.7 69.8 69.7 68.7Funds from operations (FFO) 52.7 61.8 62.5 59.0Capital expenditures 46.1 61.0 44.0 50.4Dividends 14.3 19.5 14.4 16.1
Total debt 179.2 173.3 106.5 153.0Shareholders equity 342.0 339.0 280.0 320.3Cash and short term investments 3.7 2.8 3.2 3.3Total assets 644.9 600.9 463.1 569.6
EBITDA margin (%) 16.4 17.8 20.7 18.3EBITDA interest coverage (x) 8.3 10.0 22.4 13.6FFO to total debt (%) 29.4 35.6 58.7 41.2Total debt to total capital (%) 34.4 34.3 27.6 32.1Total debt to EBITDA (x) 2.7 2.5 1.5 2.2
Definitions
66 Top 30 Chilean Companies - April 2007
Standard & Poor's traces its history back to 1860. Today, it is theleading credit rating organization and a major publisher offinancial information and research services.
Standard & Poor's now rates more than US$13 trillion in bonds andother financial obligations of obligors in more than 50 countries. Itoperates with no government mandate and is independent of anyinvestment banking firm, bank, or similar organization.
CCrreeddiitt RRaattiinnggssA credit rating is Standard & Poor's opinion of the generalcreditworthiness of an obligor, or the credit worthiness of an obligorwith respect to a particular debt security or other financial obligation,based on relevant risk factors. A rating does not constitute arecommendation to purchase, sell, or hold a particular security. Inaddition, a rating does not comment on the suitability of an investmentfor a particular investor.
Standard & Poor's has developed credit ratings that may apply to anissuer's general creditworthiness or to a specific financial obligation.Over the years, these credit ratings have achieved wide investoracceptance as easily usable tools for differentiating credit quality,because a Standard & Poor's credit rating is judged by the market to bereliable and credible.
Long-term credit ratings are divided into several categories rangingfrom 'AAA', reflecting the strongest credit quality, to 'D', reflecting thelowest. Long-term ratings from 'AA' to 'CCC' may be modified by theaddition of a plus or minus sign to show relative standing within themajor rating categories.
A short-term credit rating is an assessment of an issuer's credit qualitywith respect to an instrument considered short term in the relevantmarket. Short-term ratings range from 'A-1', for the highest-qualityobligations, to 'D', for the lowest. The 'A-1' rating may also be modifiedby a plus sign to distinguish the strongest credits in that category.
IIssssuuee-SSppeecciiffiicc CCrreeddiitt RRaattiinnggssA Standard & Poor's issue credit rating is a current opinion of thecreditworthiness of an obligor with respect to a specific financialobligation, a specific class of financial obligations, or a specificfinancial program. This opinion may reflect the creditworthiness ofguarantors, insurers, or other forms of credit enhancement on theobligation, and takes into account statutory and regulatory preferences.
IIssssuueerr CCrreeddiitt RRaattiinnggssIn response to a need for rating evaluations on a company when nopublic debt is outstanding, Standard & Poor's provides an issuer (alsocalled counterparty) credit rating-an opinion of the obligor's overallcapacity to meet its financial obligations. This opinion focuses on theobligor's capacity and willingness to meet its financial commitments asthey come due. The opinion is not specific to any particular financial
Standard && PPoor’s RRole iin tthe FFinancial MMarkets
obligation, as it does not take into account the specific nature orprovisions of any particular obligation. Issuer credit ratings do not takeinto account statutory or regulatory preferences, nor do they take intoaccount the creditworthiness of guarantors, insurers, or other forms ofcredit enhancement that may pertain to a specific obligation.
RRaattiinngg PPrroocceessssStandard & Poor's provides a rating only when there is adequateinformation available to form a credible opinion and only afterapplicable quantitative, qualitative, and legal analyses are performed.
The analytical framework is divided into several categories to ensurethat salient qualitative and quantitative issues are considered. Forexample, with industrial companies, the qualitative categories areoriented to business analysis, such as the firm's competitiveness withinits industry and the caliber of management; the quantitative categoriesrelate to financial analysis.
The rating process is not limited to an examination of various financialmeasures. Proper assessment of credit quality for an industrialcompany includes a thorough review of business fundamentals,including industry prospects for growth and vulnerability totechnological change, labor unrest, or regulatory actions. In the publicfinance sector, this involves an evaluation of the basic underlyingeconomic strength of the public entity, as well as the effectiveness ofthe governing process to address problems. In financial institutions, thereputation of the bank or company may have an impact on the futurefinancial performance and the institution's ability to repay itsobligations.
Standard & Poor's assembles a team of analysts with appropriateexpertise to review information pertinent to the rating. A lead analystis responsible for conducting the rating process. Several of themembers on the analytical team meet with the organization'smanagement to review, in detail, key factors that have an impact onthe rating, including operating and financial plans and managementpolicies. The meeting also helps analysts develop the qualitativeassessment of management itself, an important factor in the ratingdecision.
Following this review and discussion, a rating committee meeting isconvened. At the meeting, the committee discusses the lead analyst'srecommendation and the pertinent facts supporting the rating. Finally,the committee votes on the recommendation.
The issuer is subsequently notified of the rating and the majorconsiderations supporting it. A rating can be appealed prior to itspublication if meaningful new or additional information is to bepresented by the issuer. Obviously, there is no guarantee that any newinformation will alter the rating committee's decision.
Once a final rating is assigned, it is disseminated to the public throughthe news media. Where ratings are assigned only on request-the
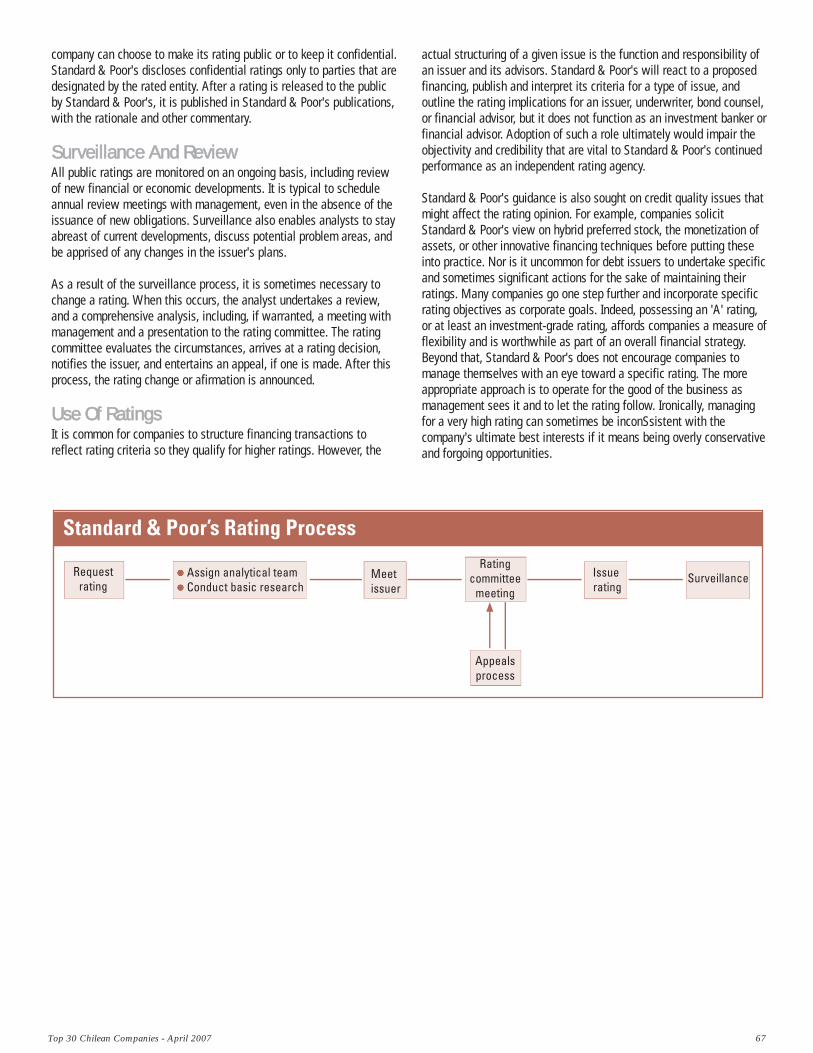
Top 30 Chilean Companies - April 2007 67
company can choose to make its rating public or to keep it confidential.Standard & Poor's discloses confidential ratings only to parties that aredesignated by the rated entity. After a rating is released to the publicby Standard & Poor's, it is published in Standard & Poor's publications,with the rationale and other commentary.
SSuurrvveeiillllaannccee AAnndd RReevviieewwAll public ratings are monitored on an ongoing basis, including reviewof new financial or economic developments. It is typical to scheduleannual review meetings with management, even in the absence of theissuance of new obligations. Surveillance also enables analysts to stayabreast of current developments, discuss potential problem areas, andbe apprised of any changes in the issuer's plans.
As a result of the surveillance process, it is sometimes necessary tochange a rating. When this occurs, the analyst undertakes a review,and a comprehensive analysis, including, if warranted, a meeting withmanagement and a presentation to the rating committee. The ratingcommittee evaluates the circumstances, arrives at a rating decision,notifies the issuer, and entertains an appeal, if one is made. After thisprocess, the rating change or afirmation is announced.
UUssee OOff RRaattiinnggssIt is common for companies to structure financing transactions toreflect rating criteria so they qualify for higher ratings. However, the
actual structuring of a given issue is the function and responsibility ofan issuer and its advisors. Standard & Poor's will react to a proposedfinancing, publish and interpret its criteria for a type of issue, andoutline the rating implications for an issuer, underwriter, bond counsel,or financial advisor, but it does not function as an investment banker orfinancial advisor. Adoption of such a role ultimately would impair theobjectivity and credibility that are vital to Standard & Poor's continuedperformance as an independent rating agency.
Standard & Poor's guidance is also sought on credit quality issues thatmight affect the rating opinion. For example, companies solicitStandard & Poor's view on hybrid preferred stock, the monetization ofassets, or other innovative financing techniques before putting theseinto practice. Nor is it uncommon for debt issuers to undertake specificand sometimes significant actions for the sake of maintaining theirratings. Many companies go one step further and incorporate specificrating objectives as corporate goals. Indeed, possessing an 'A' rating,or at least an investment-grade rating, affords companies a measure offlexibility and is worthwhile as part of an overall financial strategy.Beyond that, Standard & Poor's does not encourage companies tomanage themselves with an eye toward a specific rating. The moreappropriate approach is to operate for the good of the business asmanagement sees it and to let the rating follow. Ironically, managingfor a very high rating can sometimes be inconSsistent with thecompany's ultimate best interests if it means being overly conservativeand forgoing opportunities.
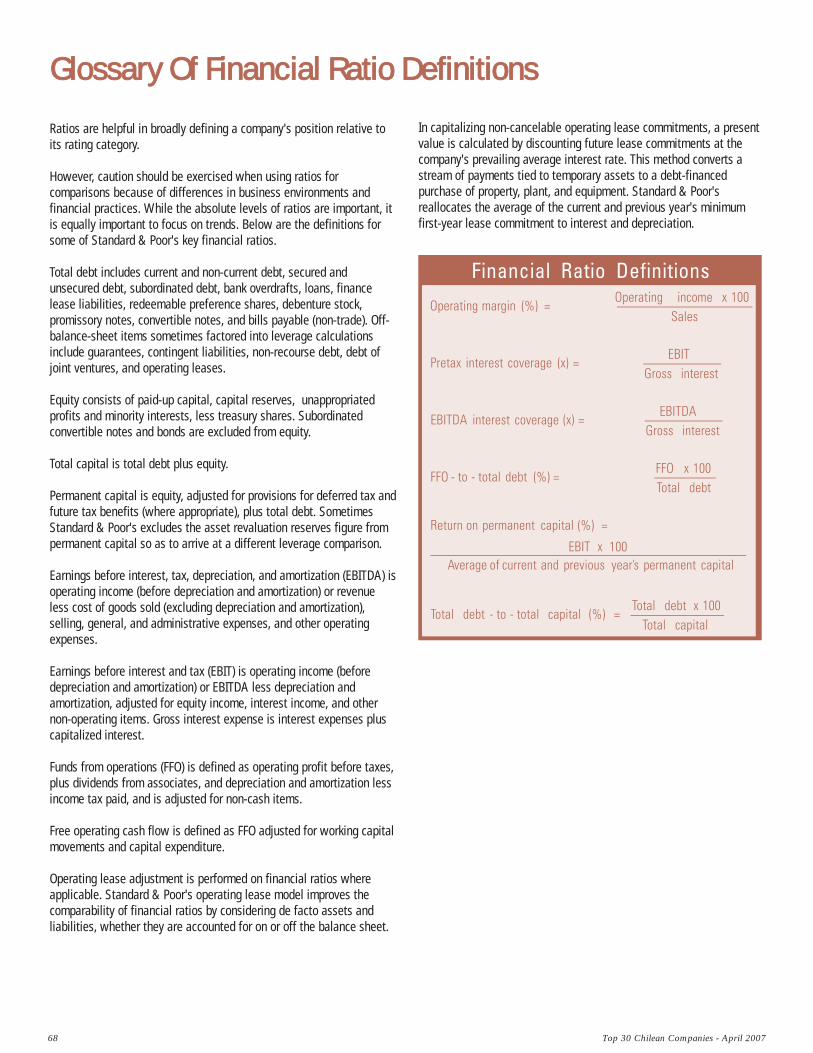
68 Top 30 Chilean Companies - April 2007
Glossary OOf FFinancial RRatio DDefinitions
Ratios are helpful in broadly defining a company's position relative toits rating category.
However, caution should be exercised when using ratios forcomparisons because of differences in business environments andfinancial practices. While the absolute levels of ratios are important, itis equally important to focus on trends. Below are the definitions forsome of Standard & Poor's key financial ratios.
Total debt includes current and non-current debt, secured andunsecured debt, subordinated debt, bank overdrafts, loans, financelease liabilities, redeemable preference shares, debenture stock,promissory notes, convertible notes, and bills payable (non-trade). Off-balance-sheet items sometimes factored into leverage calculationsinclude guarantees, contingent liabilities, non-recourse debt, debt ofjoint ventures, and operating leases.
Equity consists of paid-up capital, capital reserves, unappropriatedprofits and minority interests, less treasury shares. Subordinatedconvertible notes and bonds are excluded from equity.
Total capital is total debt plus equity.
Permanent capital is equity, adjusted for provisions for deferred tax andfuture tax benefits (where appropriate), plus total debt. SometimesStandard & Poor's excludes the asset revaluation reserves figure frompermanent capital so as to arrive at a different leverage comparison.
Earnings before interest, tax, depreciation, and amortization (EBITDA) isoperating income (before depreciation and amortization) or revenueless cost of goods sold (excluding depreciation and amortization),selling, general, and administrative expenses, and other operatingexpenses.
Earnings before interest and tax (EBIT) is operating income (beforedepreciation and amortization) or EBITDA less depreciation andamortization, adjusted for equity income, interest income, and othernon-operating items. Gross interest expense is interest expenses pluscapitalized interest.
Funds from operations (FFO) is defined as operating profit before taxes,plus dividends from associates, and depreciation and amortization lessincome tax paid, and is adjusted for non-cash items.
Free operating cash flow is defined as FFO adjusted for working capitalmovements and capital expenditure.
Operating lease adjustment is performed on financial ratios whereapplicable. Standard & Poor's operating lease model improves thecomparability of financial ratios by considering de facto assets andliabilities, whether they are accounted for on or off the balance sheet.
In capitalizing non-cancelable operating lease commitments, a presentvalue is calculated by discounting future lease commitments at thecompany's prevailing average interest rate. This method converts astream of payments tied to temporary assets to a debt-financedpurchase of property, plant, and equipment. Standard & Poor'sreallocates the average of the current and previous year's minimumfirst-year lease commitment to interest and depreciation.
Top 30 Chilean Companies - April 2007 69
Rating DDefinitions
A Standard & Poor's credit rating is a current assessment of the abilityof an obligor's overall financial capacity (its creditworthiness) to pay itsfinancial obligations.
Ratings are based on current information furnished by the borrower ordebt issuer or from data obtained by Standard & Poor's from othersources which it considers reliable. Standard & Poor's does not performan audit in connection with any credit rating and may, on occasion, relyon unaudited financial information.
LLoonngg-TTeerrmm IIssssuueerr CCrreeddiitt RRaattiinnggss
AAAAn obligor rated 'AAA' has EXTREMELY STRONG capacity to meet itsfinancial commitments. 'AAA' is the highest Issuer Credit Ratingassigned by Standard & Poor's.
AAAn obligor rated 'AA' has VERY STRONG capacity to meet its financialcommitments. It differs from the highest rated obligors only in smalldegree.
AAn obligor rated 'A' has STRONG capacity to meet its financialcommitments but is somewhat more susceptible to the adverse effectsof changes in circumstances and economic conditions than obligors inhigher-rated categories.
BBBAn obligor rated 'BBB' has ADEQUATE capacity to meet its financialcommitments. However, adverse economic or changing circumstancesare more likely to lead to a weakened capacity of the obligor to meetits financial commitments.
BBAn obligor rated 'BB' is LESS VULNERABLE in the near term than otherlower-rated obligors. However, it faces major ongoing uncertainties andexposure to adverse business, financial, or economic conditions, whichcould lead to the obligor's inadequate capacity to meet its financialcommitments.
BAn obligation rated 'B' is more vulnerable to nonpayment thanobligations rated 'BB', but the obligor currently has the capacity tomeet its financial commitment on the obligation. Adverse business,financial, or economic conditions will likely impair the obligor'scapacity or willingness to meet its financial commitment on theobligation.
CCCAn obligor rated 'CCC' is CURRENTLY VULNERABLE, and is dependentupon favorable business, financial, and economic conditions to meet itsfinancial commitments.
CCAn obligor rated 'CC' is CURRENTLY HIGHLY VULNERABLE.CAsubordinated debt or preferred stock obligation rated 'C' is CURRENTLYHIGHLY VULNERABLE to nonpayment. The 'C' rating may be used tocover a situation where a bankruptcy petition has been filed or similaraction taken, but payments on this obligation are being continued. A 'C'also will be assigned to a preferred stock issue in arrears on dividendsor sinking fund payments, but that is currently paying.
SD and DAn obligor rated 'SD' (Selective Default) or 'D' failed to pay one or moreof its financial obligations (rated or unrated) when it came due. A 'D'rating is assigned when Standard & Poor's believes that the defaultwill be a general default and that the obligor will fail to pay all orsubstantially all of its obligations as they come due. An 'SD' rating isassigned when Standard & Poor's believes that the obligor hasselectively defaulted on a specific issue or class of obligations but itwill continue to meet its payment obligations on other issues or classesof obligations in a timely manner. Please see Standard & Poor's issuecredit ratings for a more detailed description of the effects of a defaulton specific issues or classes of obligations.
Plus (+) or minus (-) The ratings from 'AA' to 'CCC' may be modified bythe addition of a plus or minus sign to show relative standing withinthe major rating categories.
SShhoorrtt-TTeerrmm IIssssuueerr CCrreeddiitt RRaattiinnggss
A-1An obligor rated 'A-1' has STRONG capacity to meet its financialcommitments. It is rated in the highest category by Standard & Poor's.Within this category, certain obligors are designated with a plus sign(+). This indicates that the obligor's capacity to meet its financialcommitments is EXTREMELY STRONG.
A-2An obligor rated 'A-2' has SATISFACTORY capacity to meet its financialcommitments. However, it is somewhat more susceptible to theadverse effects of changes in circumstances and economic conditionsthan obligors in the highest rating category.
A-3An obligor rated 'A-3' has ADEQUATE capacity to meet its financialobligations. However, adverse economic conditions or changingcircumstances are more likely to lead to a weakened capacity of theobligor to meet its financial commitments.
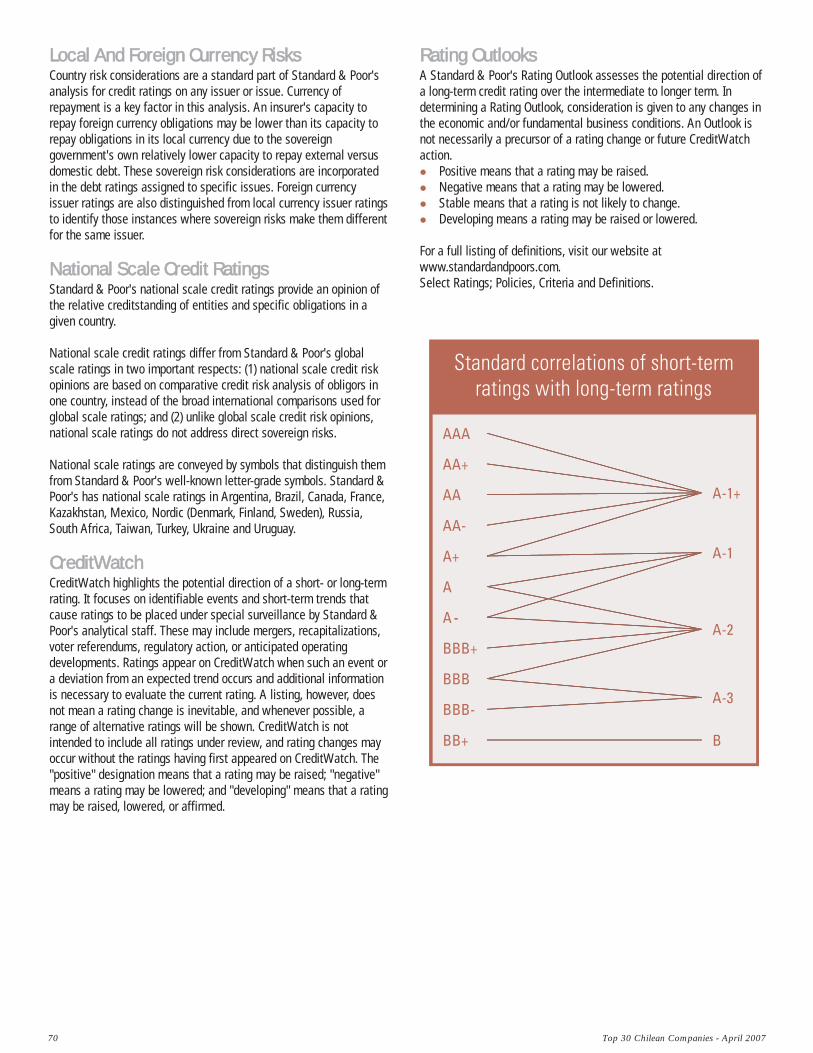
70 Top 30 Chilean Companies - April 2007
LLooccaall AAnndd FFoorreeiiggnn CCuurrrreennccyy RRiisskkssCountry risk considerations are a standard part of Standard & Poor'sanalysis for credit ratings on any issuer or issue. Currency ofrepayment is a key factor in this analysis. An insurer's capacity torepay foreign currency obligations may be lower than its capacity torepay obligations in its local currency due to the sovereigngovernment's own relatively lower capacity to repay external versusdomestic debt. These sovereign risk considerations are incorporatedin the debt ratings assigned to specific issues. Foreign currencyissuer ratings are also distinguished from local currency issuer ratingsto identify those instances where sovereign risks make them differentfor the same issuer.
NNaattiioonnaall SSccaallee CCrreeddiitt RRaattiinnggssStandard & Poor's national scale credit ratings provide an opinion ofthe relative creditstanding of entities and specific obligations in agiven country.
National scale credit ratings differ from Standard & Poor's globalscale ratings in two important respects: (1) national scale credit riskopinions are based on comparative credit risk analysis of obligors inone country, instead of the broad international comparisons used forglobal scale ratings; and (2) unlike global scale credit risk opinions,national scale ratings do not address direct sovereign risks.
National scale ratings are conveyed by symbols that distinguish themfrom Standard & Poor's well-known letter-grade symbols. Standard &Poor's has national scale ratings in Argentina, Brazil, Canada, France,Kazakhstan, Mexico, Nordic (Denmark, Finland, Sweden), Russia,South Africa, Taiwan, Turkey, Ukraine and Uruguay.
CCrreeddiittWWaattcchhCreditWatch highlights the potential direction of a short- or long-termrating. It focuses on identifiable events and short-term trends thatcause ratings to be placed under special surveillance by Standard &Poor's analytical staff. These may include mergers, recapitalizations,voter referendums, regulatory action, or anticipated operatingdevelopments. Ratings appear on CreditWatch when such an event ora deviation from an expected trend occurs and additional informationis necessary to evaluate the current rating. A listing, however, doesnot mean a rating change is inevitable, and whenever possible, arange of alternative ratings will be shown. CreditWatch is notintended to include all ratings under review, and rating changes mayoccur without the ratings having first appeared on CreditWatch. The"positive" designation means that a rating may be raised; "negative"means a rating may be lowered; and "developing" means that a ratingmay be raised, lowered, or affirmed.
RRaattiinngg OOuuttllooookkssA Standard & Poor's Rating Outlook assesses the potential direction ofa long-term credit rating over the intermediate to longer term. Indetermining a Rating Outlook, consideration is given to any changes inthe economic and/or fundamental business conditions. An Outlook isnot necessarily a precursor of a rating change or future CreditWatchaction.
Positive means that a rating may be raised.Negative means that a rating may be lowered.Stable means that a rating is not likely to change.Developing means a rating may be raised or lowered.
For a full listing of definitions, visit our website atwww.standardandpoors.com. Select Ratings; Policies, Criteria and Definitions.
Top 30 Chilean Companies - April 2007 71
Feller RRate - RRating DDefinitions
LLoonngg-tteerrmm DDeebbtt:: SSoollvveennccyy,, BBoonnddss,, LLoonngg-tteerrmmDDeeppoossiittss,, IInnssuurraannccee OObblliiggaattiioonnss
AAASecurities with the highest capacity to timely repay principal andinterest, in accordance with the stipulated terms. This capacity wouldnot be significantly affected by potential changes on the issuer, therelated industry, or the economy.
AASecurities with a very high capacity to timely repay principal andinterest, in accordance with the stipulated terms. This capacity wouldnot be significantly affected by potential changes on the issuer, therelated industry, or the economy.
ASecurities with a very good capacity to timely repay principal andinterest, in accordance with the stipulated terms. This capacity issusceptible to adverse effects of potential changes on the issuer, theindustry, or the economy.
BBBSecurities with sufficient capacity to timely repay principal andinterests, in accordance with the stipulated terms. This capacity ismore susceptible to weakening from potential changes on the issuer,the industry, or the economy.
BBSecurities with capacity to timely repay principal and interest, inaccordance with the stipulated terms. This capacity is variable andsusceptible to weakening from potential changes on the issuer, theindustry, or the economy, and might incur on principal and interestsarrears.
BSecurities with minimum capacity to timely repay principal and interest,in accordance with the stipulated terms. This capacity is very variableand susceptible to weakening from potential changes on the issuer, theindustry, or the economy, and might incur on principal and interestsarrears.
CSecurities without sufficient capacity to timely repay principal andinterest, in accordance with the stipulated terms, and with a high-lossrisk.
DSecurities with null capacity to timely repay principal and interest inaccordance with the stipulated terms. They exhibit effective default onprincipal and interest payment, or filing bankruptcy requirementongoing.
EThe issuer of these securities does not have sufficient or representativeinformation for the minimum required period, and does not haveenough guarantees.
SShhoorrtt-tteerrmm DDeebbtt
Level 1 (L-1)Securities with the highest capacity to timely repay principal andinterest, in accordance with the stipulated terms.
Level 2 (L-2)Securities with a good capacity to timely repay principal and interest,in accordance with the stipulated terms.
Level 3 (N-3)Securities with a sufficient capacity to timely repay principal andinterest, in accordance with the stipulated terms.
Level 4 (L-4)Securities with the capacity to timely repay principal and interest, inaccordance with the stipulated terms, but does not fulfill therequirements to be classified in levels L-1, L-2 o L-3.
Level 5 (L-5)Securities whose issuer does not have enough information orrepresentative information for the minimum required period, and alsolacks sufficient guarantees.
In addition, for instruments rated in Level 1, Feller Rate could add theplus (+) sign.
SSttoocckkss
First Class, Level 1Stock securities with the best solvency and stability mix on the issuer'sprofitability and returns volatility.
First Class Level 2Stock securities with a very good solvency and stability mix on theissuer's profitability and returns volatility.
First Class Level 3Stock securities with a good solvency and stability mix on the issuer'sprofitability and returns volatility.
First Class Level 4Stock securities with a reasonable solvency and stability mix on theissuer's profitability and returns volatility.
72 Top 30 Chilean Companies - April 2007
Second Class (Level 5)Stock securities with an insufficient solvency and stability mix on theissuer's profitability and returns volatility.
Insufficient information (SIS, Spanish acronym)Stock securities that lack sufficient valid information to conduct anadequate analysis.
IInnvveessttmmeenntt FFuunnddss'' HHoollddiinnggss
First Class Level 1 Funds' portfolio holdings with the highest probability of achieving itsinvestment goals.
First Class Level 2 Funds' portfolio holdings with a very good probability of achieving itsinvestment goals.
First Class Level 3 Funds' portfolio holdings with a good probability of achieving itsinvestment goals.
First Class Level 4 Funds' portfolio holdings with a reasonable probability of achieving itsinvestment goals.
Second Class (or Level 5) Funds' portfolio holdings with inadequate probability of achieving itsinvestment goals.
Insufficient information: Funds' portfolio holdings will be considered as "InsufficientInformation" when there is not enough information to assign a ratingaccording to the ratings procedures.
Finally, Feller Rate makes a distinction of securities issued bycompanies among those considered investment-grade and thoseconsidered speculative-grade. For long-term debt, all instrumentshaving a rating higher than 'BBB-' are considered of investment-grade.For short-term debt, the lowest limit is Level 4.
MMuuttuuaall FFuunnddss'' HHoollddiinnggss
Ratings for mutual funds invested in debt securities
Credit Risk
AAAfmPortfolio holdings with the highest protection against losses associatedwith credit risk.
AAfmPortfolio holdings with a very high protection against losses associatedwith credit risk.
AfmPortfolio holdings with a high protection against losses associated withcredit risk.
BBBfmPortfolio holdings with sufficient protection against losses associatedwith credit risk.
BBfmPortfolio holdings with a low protection against losses associated withcredit risk.
BfmPortfolio holdings with a very low protection against losses associatedwith credit risk.
CfmPortfolio holdings highly variable to losses associated with credit risk.
+ or -: Ratings between AAfm and Bfm could be modified by adding aplus (+) or minus (-) sign to show relative strength or weakness withinthe rating category.
Market Risk
M1 Portfolio holdings with the lowest sensitivity to changing marketconditions.
M2Portfolio holdings with moderate to low sensitivity to changing marketconditions.
M3 Portfolio holdings with moderate sensitivity to changing marketconditions.
M4Portfolio holdings with moderate to high sensitivity to changing onmarket conditions.
M5 Portfolio holdings with high sensitivity to changing market conditions.
M6 Portfolio holdings with very high sensitivity to changing marketconditions.
Top 30 Chilean Companies - April 2007 73
RRaattiinnggss FFoorr MMuuttuuaall FFuunnddss IInnvveesstteedd OOnn CCaappiittaalliizzaattiioonn SSeeccuurriittiieess
RV-1Portfolio holdings with the best capacity to deliver adequate returns toits risk level.
RV-2Portfolio holdings with a very good capacity to deliver adequate returnsto its risk level.
RV-3Portfolio holdings with a good capacity to deliver adequate returns toits risk level.
RV-4Portfolio holdings with an acceptable capacity to deliver adequatereturns to its risk level.
RV-5Funds with securities not eligible for institutional investors. Portfolioholdings with a low capacity to deliver adequate returns to its risklevel.
NNeeww FFuunnddss
The new bonds funds or with a short record to conduct a completeanalysis, are distinguished using the (N) suffix.
AAsssseett MMaannaaggeerrss AAnndd OOrriiggiinnaattoorrss EEvvaalluuaattiioonnSSeerrvviiccee
StrongThe company shows the highest efficiency and competence levels inthe evaluated aspect, including a successful track record. Usually, thecompany shows a stable and strong management, good trainingsystems, high-level information technology and systems, effectiveinternal controls and procedures, and a high-quality service.
Over-satisfactory This category indicates a very high degree of efficiency andcompetence in the evaluated aspect, and differs from the 'Strong'category because it may be lacking a representative track record,stability, technology, or financial condition.
SatisfactoryThe company shows an acceptable track record that possibly evidencesrecent improvements in its performance. This category indicates thatthe company is effectively performing its functions and is in compliancewith market and regulatory requirements. Nevertheless, the companyshows some characteristics that should be improved as staff ability,quantity, and infrastructure are adequate to its activity level, but ahigher level requires some internal adjustments; training is notextensive or lacks of structure; computer systems have limitedfunctions to its current size; and procedures and controls are adequate,but need strengthening.
With observationsThis category reflects a less favorable performance than the industry.The company shows efficiency and competitive weaknesses on theevaluated aspect, and has lacks on some relevant factors such asfinancial position, operational capacity, technology, informationsystems, and internal controls.
WeakThis category indicates a deficient track record on the evaluatedaspect. This could be seen on issues as: recurrent operational losses,weak or missing internal controls, and deficiencies in the structuring ofprocedures and policies. The company's operation could be overstatedor inadequately structured, and computer systems and managementcontrol do not satisfactorily cover the minimum but necessaryrequirements according to company activity.

74 Top 30 Chilean Companies - April 2007
Contacts List
Contact List
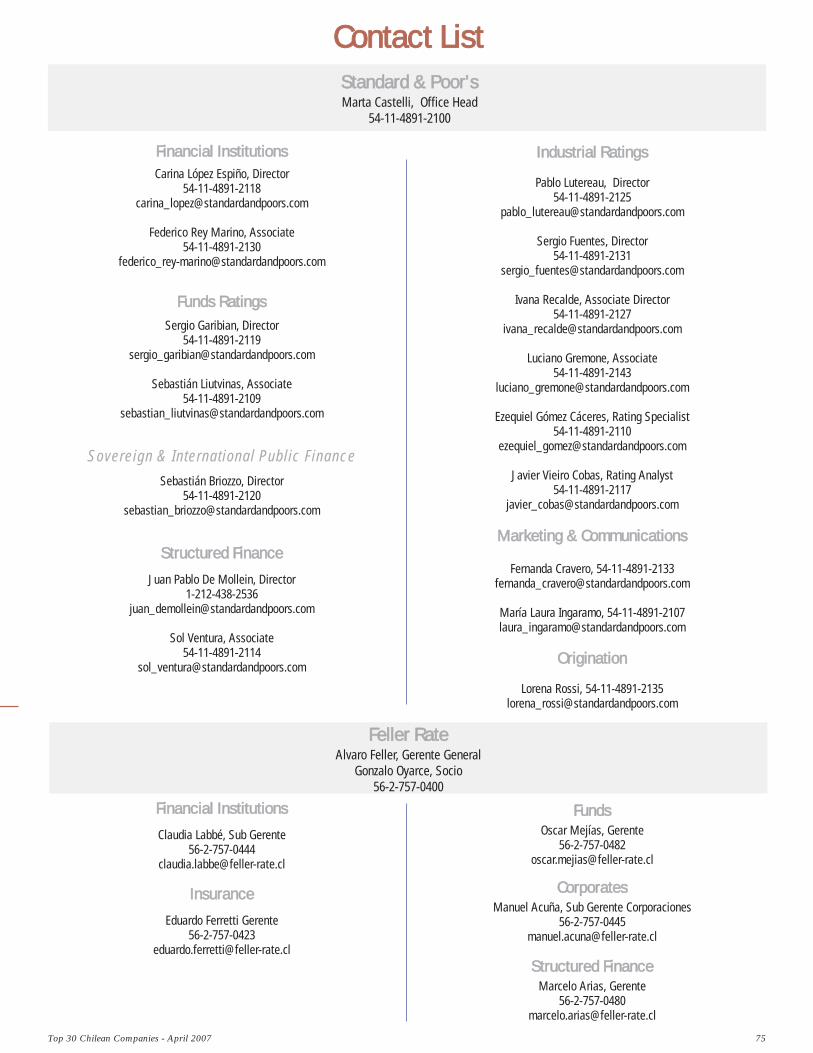
Top 30 Chilean Companies - April 2007 75
Financial IInstitutionsCarina López Espiño, Director
Federico Rey Marino, Associate54-11-4891-2130
Funds RRatingsSergio Garibian, Director
Sebastián Liutvinas, Associate54-11-4891-2109
Sovereign & International Public FinanceSebastián Briozzo, Director
Structured FFinance
Juan Pablo De Mollein, Director1-212-438-2536
Sol Ventura, Associate54-11-4891-2114
Contact LListSSttaannddaarrdd && PPoooorr''ssMarta Castelli, Office Head
54-11-4891-2100
Industrial RRatings
Pablo Lutereau, Director54-11-4891-2125
Sergio Fuentes, Director54-11-4891-2131
Ivana Recalde, Associate Director54-11-4891-2127
Luciano Gremone, Associate54-11-4891-2143
Ezequiel Gómez Cáceres, Rating Specialist54-11-4891-2110
Javier Vieiro Cobas, Rating Analyst54-11-4891-2117
Financial IInstitutions
Claudia Labbé, Sub Gerente 56-2-757-0444
Insurance
Eduardo Ferretti Gerente56-2-757-0423
Marketing && CCommunications
Fernanda Cravero, [email protected]
María Laura Ingaramo, [email protected]
Origination
Lorena Rossi, [email protected]
FFeelllleerr RRaatteeAlvaro Feller, Gerente General
Gonzalo Oyarce, Socio56-2-757-0400
FundsOscar Mejías, Gerente
CorporatesManuel Acuña, Sub Gerente Corporaciones
Structured FFinanceMarcelo Arias, Gerente

76 Top 30 Chilean Companies - April 2007
Published by Standard & Poor's, a Division of The McGraw-Hill Companies, Inc. Executive offices: 1221 Avenue of the Americas, New York, NY10020. Editorial offices: 55 Water Street, New York, NY 10041. Subscriber services: (1) 212-438-7280. Copyright 2007 by The McGraw-HillCompanies, Inc. Reproduction in whole or in part prohibited except by permission. All rights reserved. Information has been obtained by Standard &Poor's from sources believed to be reliable. However, because of the possibility of human or mechanical error by our sources, Standard & Poor's orothers, Standard & Poor's does not guarantee the accuracy, adequacy, or completeness of any information and is not responsible for any errors oromissions or the result obtained from the use of such information. Ratings are statements of opinion, not statements of fact or recommendations tobuy, hold, or sell any securities.
Standard & Poor's uses billing and contact data collected from subscribers for billing and order fulfillment purposes, and occasionally to informsubscribers about products or services from Standard & Poor's, our parent, The McGraw-Hill Companies, and reputable third parties that may be ofinterest to them. All subscriber billing and contact data collected is stored in a secure database in the U.S. and access is limited to authorized per-sons. If you would prefer not to have your information used as outlined in this notice, if you wish to review your information for accuracy, or formore information on our privacy practices, please call us at (1) 212-438-7280 or write us at: [email protected]. For more informationabout The McGraw-Hill Companies Privacy Policy please visit www.mcgraw-hill.com/privacy.html.
Analytic services provided by Standard & Poor's Ratings Services ("Ratings Services") are the result of separate activities designed to preserve theindependence and objectivity of ratings opinions. Credit ratings issued by Ratings Services are solely statements of opinion and not statements offact or recommendations to purchase, hold, or sell any securities or make any other investment decisions. Accordingly, any user of credit ratingsissued by Ratings Services should not rely on any such ratings or other opinion issued by Ratings Services in making any investment decision.Ratings are based on information received by Ratings Services. Other divisions of Standard & Poor's may have information that is not available toRatings Services. Standard & Poor's has established policies and procedures to maintain the confidentiality of non-public information receivedduring the ratings process.
Ratings Services receives compensation for its ratings. Such compensation is normally paid either by the issuers of such securities or third partiesparticipating in marketing the securities. While Standard & Poor's reserves the right to disseminate the rating, it receives no payment for doing so,except for subscriptions to its publications.