Embed Size (px)
Citation preview
DiscoveryMark Gahegan: GeoVISTA Center, Penn State Geography.
Aim
Analysis is a process……with a number of distinct, and not so distinct, stages.Where do I (my tools) fit into this process?How might we integrate these stages together in software?
Examples of visualization and machine learning methodsGeoVISTA Studionot so much a system to do X but an environment for coordination and deployment of components.
The pursuit of knowledge (deeper or better understanding) is ongoing…
“Systems, scientific and philosophic, come and go. Each method of limited understanding is at length exhausted. In its prime each system is a triumphant success: in its decay it is an obstructive nuisance.”
Alfred North Whitehead: Adventures of Ideas

Developments in computer science
Discovery
“Modern approaches to data analysis… have clarified the fact, known to practicing scientists, that the hypotheses do not always precede the data.” (Velleman & Wilkinson, 1993)
Themes
1. Why do we need help with discovery?2. How is new knowledge inferred?3. What tools and techniques are available to help us with inference?

A previous life…Discovering gold deposits
Don’t know exactly how gold deposits are signified in data.Don’t know exactly how mineralization occurs in the world.So, discovery is a combination of looking for ‘clues’ in data and using what is found to extend or modify theory accordingly.
1. Why do we need help with discovery?
Geography has moved from being data poor to data rich in a short space of time…
Geographic datasets are becoming large, complex and heterogeneous (highly multivariate)…We are beginning to address problems that span across several domains of expertise (e.g. impact of Lyme Disease), and we do not fully understand cause and effect.
Despite enormous efforts in quantification, our understanding of many of the earth’s systems remain non-axiomatic; the systems are ‘open’ and consequently it is not possible to deduce all outcomes from known laws.
1. Why do we need help with discovery?
Where do we begin?
“Discovery commences with the awareness of anomaly, i.e., with the recognition that nature has somehow violated the paradigm-induced expectations that govern normal science.” (Kuhn, 1962)
“Truth emerges more readily from error than from confusion.” (Francis Bacon, 1869)
… so we need to make mistakes…… by imposing structures on data, observing the outcomes, and reasoning from what we observe.
2. How we infer (how we think we think…)
“To know what we think, to be masters of our own meaning, will make a solid foundation for great and weighty thought.” (C.S Peirce, 1878)
Several styles of inference are possible:expert or model driven (deductive),Learning from examples (inductive),Hypothesis creation (abductive).
2. How we infer
(how we think we think…)
Origins of Scientific Reasoning: It’s all Greek to Me!
Socrates claimed to be certain of very little, his relentless questioning challenged existing, widely-held philosophical beliefs, based on: Truth, Beauty, Virtueand Justice.Plato (Socrates’ student) established epistemology (the study of the nature of knowledge and its justification) based on Socrates’ ideas.Aristotle (Plato’s student) proposed ways to representknowledge and a nomenclature for describing it (including inventing the terms: metaphor & hypothesis).

Deduction
Aristotle invented the syllogism…IF
Nothing absent minded is an elephantAND
All professors are absent-mindedTHEREFORE
No professor is an elephant

Deduction < Science
Deduction is often treated as the only legitimate form of inference for a respectable scientist…BUT it cannot generate new knowledge!Deduction is what computers are good at.In many situations, deductive rules get too messy, and besides, we (people) do not usually describe objects and categories according to precise values of their attributes.
Induction
Induction operates by “learning from known examples”.The inductive learning hypothesis: “A hypothesis constructed from enough training examples will generalize to unseen examples”
A large portion of human knowledge is thought to be captured and formed inductively: e.g. we synthesize models of categories from examples given and use these models to identify new examples.
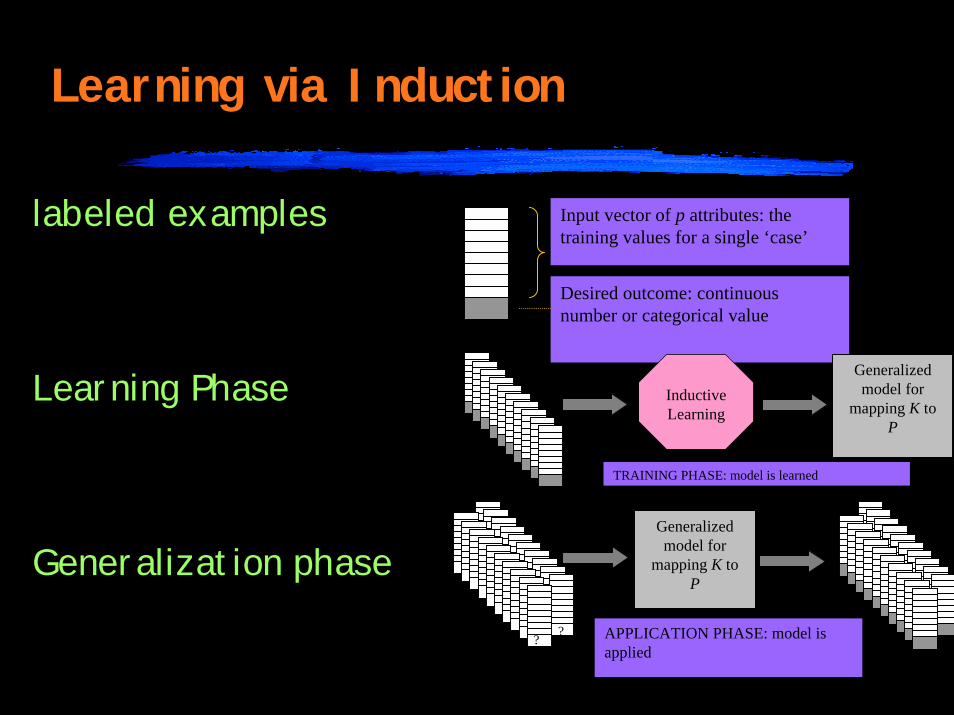
Learning via Induction
labeled examples
Learning Phase
Generalization phase?
Input vector of p attributes: the training values for a single ‘case’
Desired outcome: continuous number or categorical value
InductiveLearning
Generalized model for
mapping K to P
TRAINING PHASE: model is learned
?
Generalized model for
mapping K to P
APPLICATION PHASE: model is applied
Abduction (Hypothesis)
In abduction, an artifact is observed and simultaneously, a hypothesis is offered to explain it.
For example, an anthropologist researching the customs and behaviors of a society…, a geologist in the field working on an evolutionary explanation.
A hypothesis may draw from existing knowledge, or may extend it… e.g. by using analogy.The ‘Aha!’ Moment…In exploratory visualization, the artifact is a visual stimulus.

Inference
Notice that induction and abduction do not enforce an entirely deterministic structure on a problem. In direct contrast to deduction, they:
Can produce new knowledgeRecognize the importance of learning and refinementRespond to the individual situation of a given problem or datasetAre not always consistent (Stochastic variation, dependence on prior knowledge and experience).
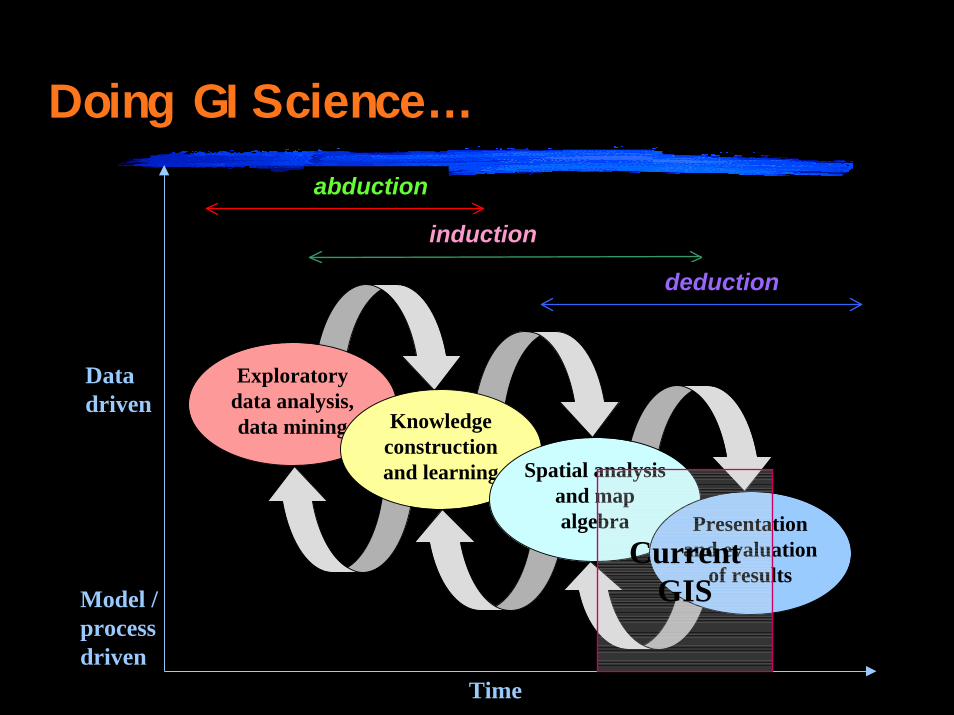
Doing GIScience…
Exploratory data analysis, data mining Knowledge
construction and learning Spatial analysis
and map algebra Presentation
and evaluation of results
Data driven
Model / process driven
Time
abduction
induction
deduction
Current GIS
3. Tools and techniques that can be used for discovery
Statistical, Computational & Visual
Examples of Spatial Statistical / geographical Tools for Discovery
Local Indicators of Spatial Association (Anselin)Calculates the degree of spatial association at each point or regionHow much like its neighbors is it? More alike than chance woulddictate?
Geographically Weighted Regression (GWR) (Fotheringham, Brunsden)
Calculates local regression coefficients according to distance to neighboring observations
Geographical Analysis Machine (GAM) (Openshaw)
Brute force search for clusters at multiple scales
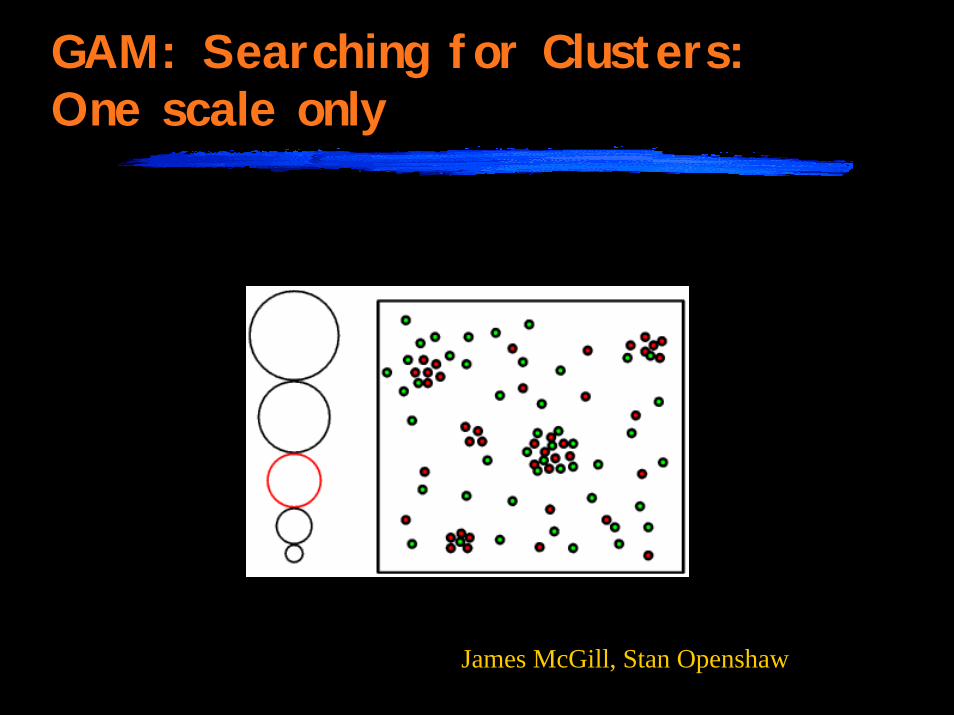
GAM: Searching for Clusters: One scale only
James McGill, Stan Openshaw

GAM: Searching for Clusters: Multiple scales
James McGill, Stan Openshaw
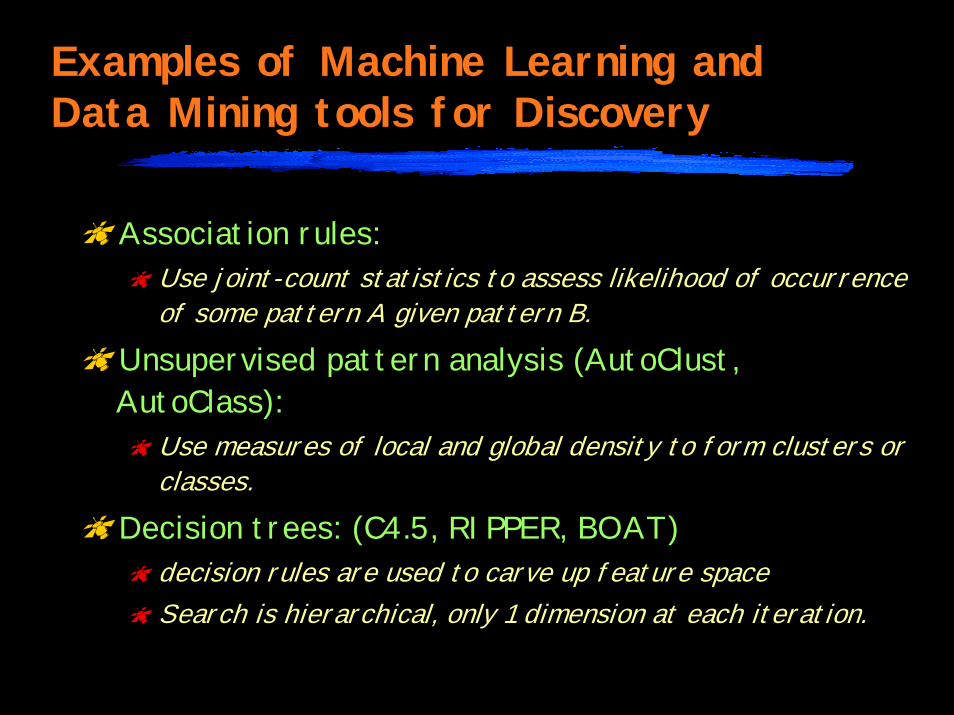
Examples of Machine Learning and Data Mining tools for Discovery
Association rules:Use joint-count statistics to assess likelihood of occurrence of some pattern A given pattern B.
Unsupervised pattern analysis (AutoClust, AutoClass):
Use measures of local and global density to form clusters or classes.
Decision trees: (C4.5, RIPPER, BOAT)decision rules are used to carve up feature spaceSearch is hierarchical, only 1 dimension at each iteration.

...More examples
Feedforward neural networks:hyperplanes are positioned in feature space.
Genetic algorithms (artificial life):search by simulating a population of organisms evolving within an environment.
Bayesian networks:work from a model of concepts provided by the expert, linked via a network of conditional dependencies.

How current tools infer...
Most computational data mining and knowledge discovery tools either attempt to locate pre-defined patterns (using deduction) or else learn from examples that are presented or selected (induction)…Others use a weaker form of abduction: a pattern is ‘discovered’ along with an explaining hypothesis, but this hypothesis is defined in terms of the data alone. So computers can build new descriptions of pre-existing concepts, but not new concepts themselves, or theories that employ them……or can build only syntactic description of concepts that need still to be given meaning in human terms.
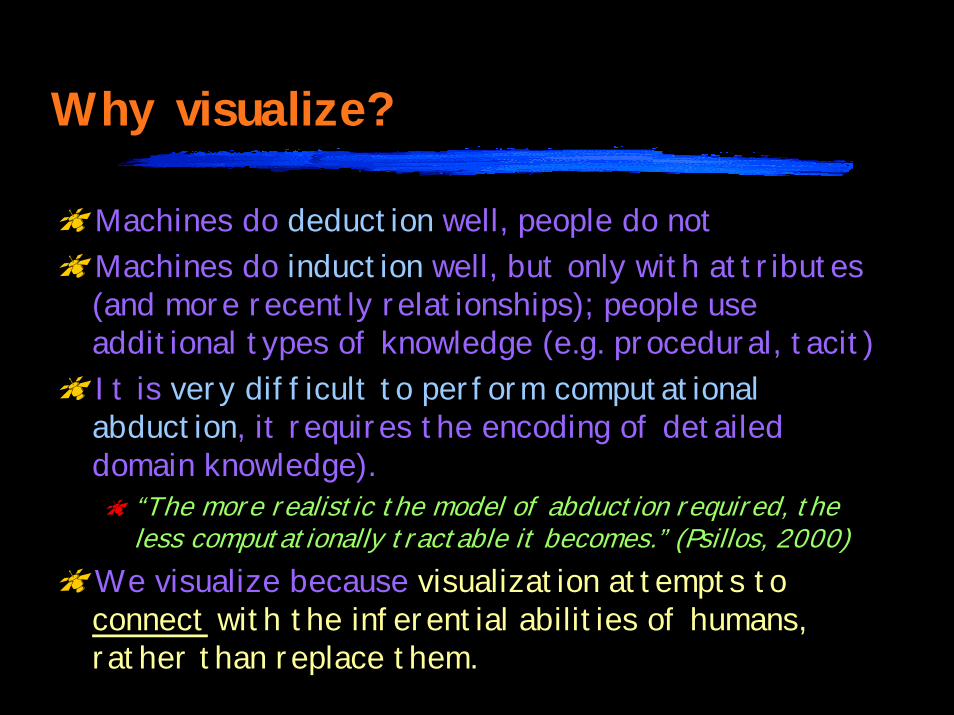
Why visualize?
Machines do deduction well, people do notMachines do induction well, but only with attributes (and more recently relationships); people use additional types of knowledge (e.g. procedural, tacit)It is very difficult to perform computational abduction, it requires the encoding of detailed domain knowledge).
“The more realistic the model of abduction required, the less computationally tractable it becomes.” (Psillos, 2000)
We visualize because visualization attempts to connect with the inferential abilities of humans, rather than replace them.
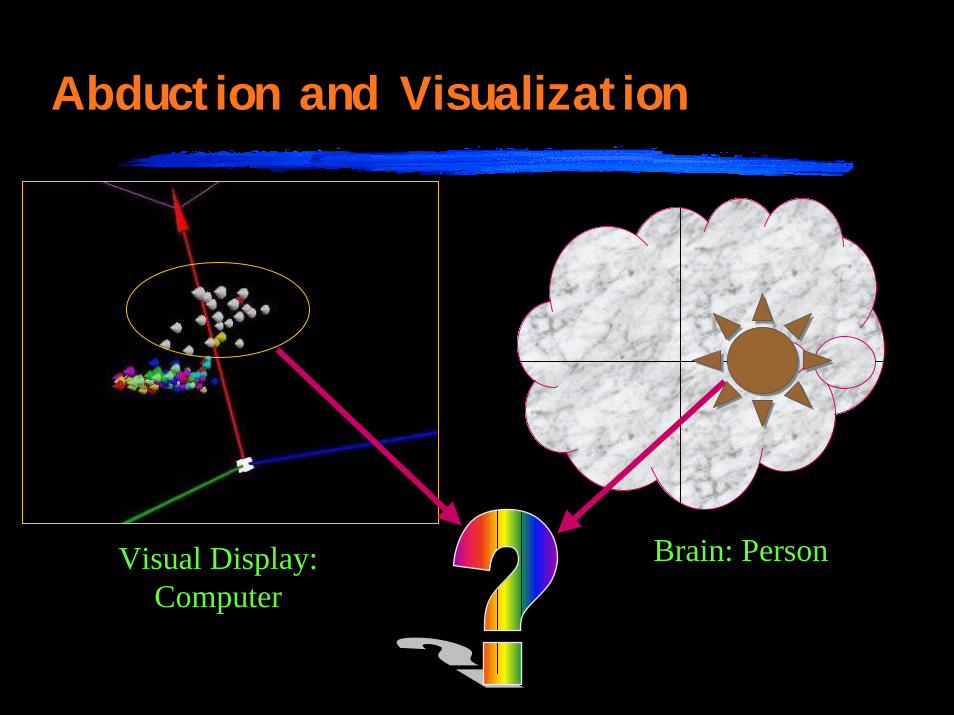
Abduction and Visualization
Brain: PersonVisual Display: Computer
Examples of visually-based tools for discovery (from previous talk)
Graph-BasedIconographicMap basedMetaphorical (faces, landscapes)

Explicitknowledge
Implicitknowledge
Exploration: EXPLORING,
DISCOVERING
Analysis: GENERALIZING,
MODELING
Explanation:EVALUATION,TESTING, USING
Presentation: COMMUNICATING,
CONSENSUS-BUILDING
Synthesis: LEARNING,
CATEGORIZINGRepresentation
Reasoning
ACTIVITY
geoscientific activities
primary modes of inference
represented objects
Data
Concept
Model
Theory
Map
Explanation
Deduction
abduction
Model-based
InductionRhetoric
Framework for the development and refinement of geospatial knowledge
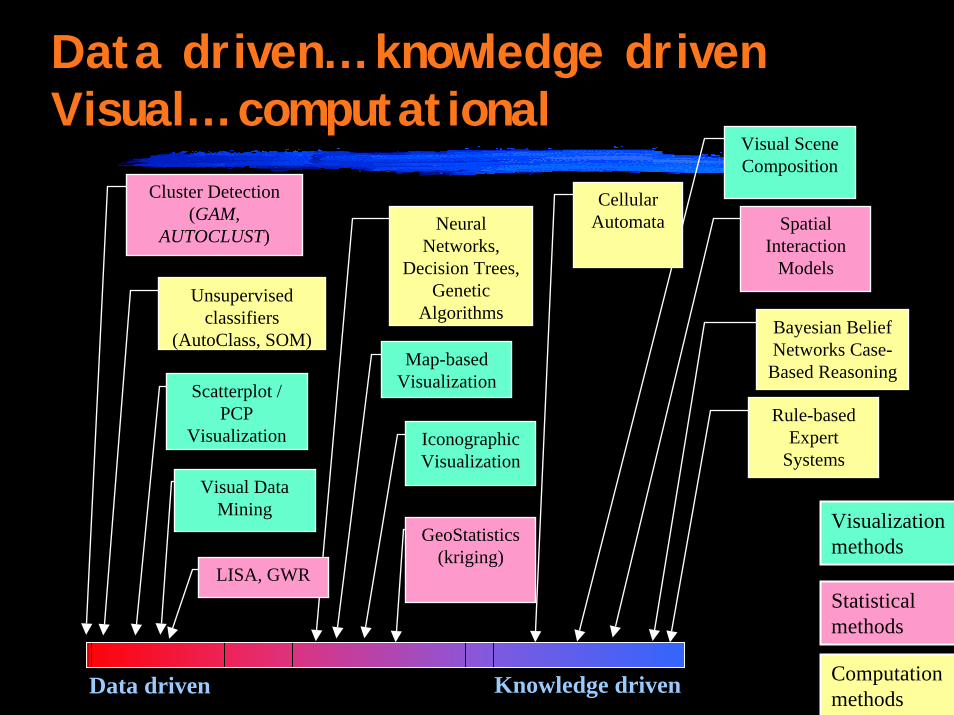
Data driven… knowledge drivenVisual… computational
Data driven Knowledge driven
Scatterplot / PCP
Visualization
Visual Data Mining
Map-based Visualization
Iconographic Visualization
Visual Scene Composition
Visualization methods
Unsupervised classifiers
(AutoClass, SOM)
Neural Networks,
Decision Trees,Genetic
Algorithms
Cellular Automata
Bayesian Belief Networks Case-
Based Reasoning
Rule-based Expert
Systems
Computation methods
Cluster Detection(GAM,
AUTOCLUST)
GeoStatistics(kriging)
Spatial Interaction
Models
LISA, GWRStatistical methods
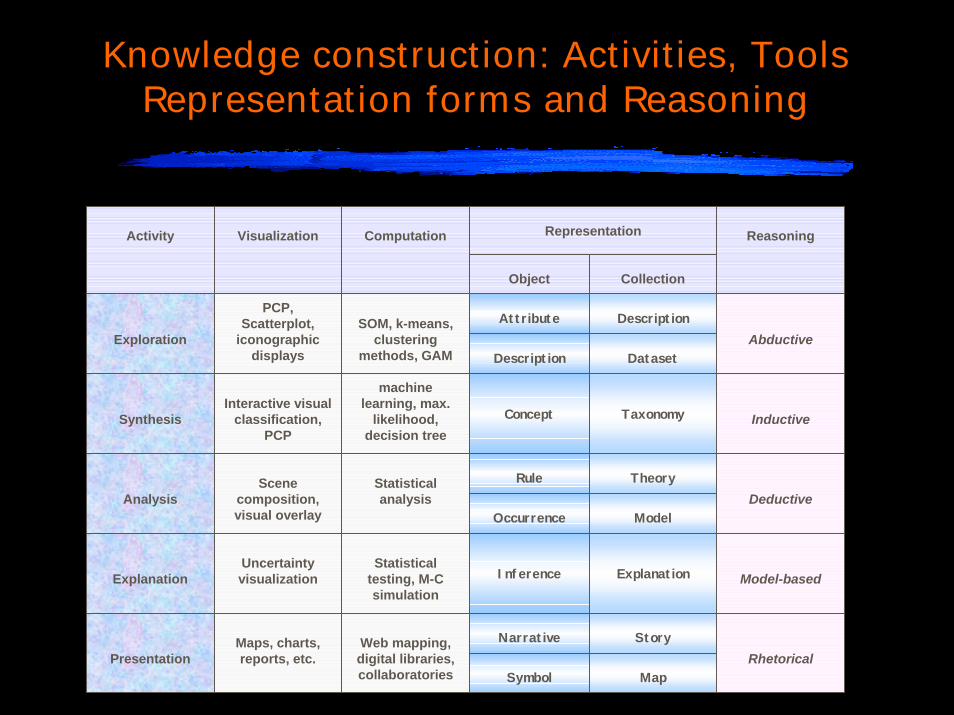
Knowledge construction: Activities, Tools Representation forms and Reasoning
Activity Visualization Computation Representation
Object Collection
Reasoning
Exploration
Synthesis
Analysis
Explanation
Presentation
PCP, Scatterplot,
iconographic displays
AbductiveSOM, k-means,
clustering methods, GAM
Attribute Description
Description Dataset
InductiveConcept TaxonomyInteractive visual
classification, PCP
machine learning, max.
likelihood, decision tree
RhetoricalSymbol Map
Narrative StoryMaps, charts, reports, etc.
Web mapping, digital libraries, collaboratories
DeductiveRule Theory
Occurrence Model
Scene composition, visual overlay
Statistical analysis
Model-basedInference ExplanationUncertainty visualization
Statistical testing, M-C simulation
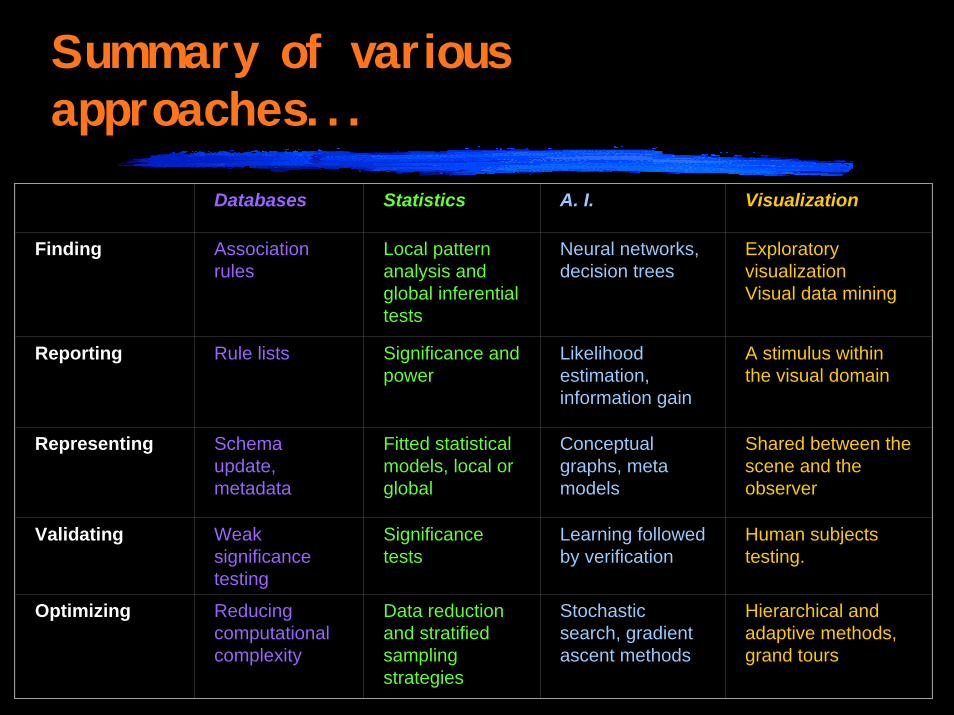
Summary of various approaches...
Databases Statistics A. I. Visualization
Finding
Reporting
Representing
Validating
Optimizing
Association rules
Rule lists
Schema update, metadata
Weak significance testing
Reducing computational complexity
Local pattern analysis and global inferential tests
Significance and power
Fitted statistical models, local or global
Significance tests
Data reduction and stratified sampling strategies
Neural networks, decision trees
Likelihood estimation, information gain
Conceptual graphs, meta models
Learning followed by verification
Stochastic search, gradient ascent methods
Exploratory visualizationVisual data mining
A stimulus within the visual domain
Shared between the scene and the observer
Human subjects testing.
Hierarchical and adaptive methods, grand tours
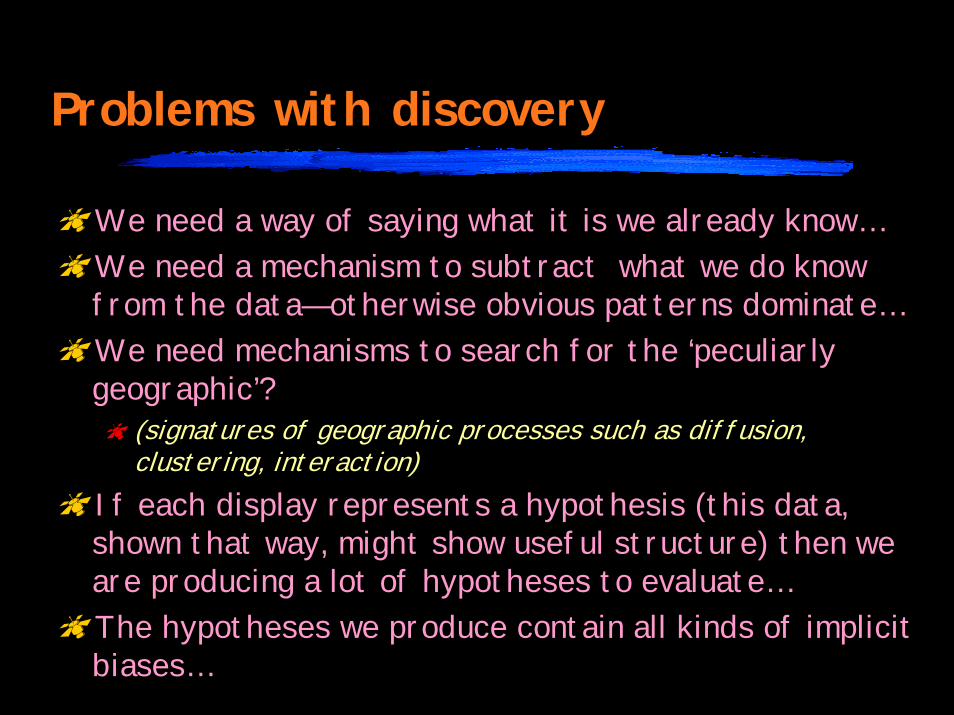
Problems with discovery
We need a way of saying what it is we already know… We need a mechanism to subtract what we do know from the data—otherwise obvious patterns dominate…We need mechanisms to search for the ‘peculiarly geographic’?
(signatures of geographic processes such as diffusion, clustering, interaction)
If each display represents a hypothesis (this data, shown that way, might show useful structure) then we are producing a lot of hypotheses to evaluate… The hypotheses we produce contain all kinds of implicit biases…
More problems with discovery
The number of ways we could visualize the data is computationally explosive (n data variables mapped to v visual variables)… we cannot test them all.Generally speaking, we do not know enough about how different visual variables support or interfere with each other…We need to be able to specify what our current task is, and hence have the system change its behavior…Even if we could control for all perceptual effects, users will still understand what they see differently…

BUT
OpportunitiesProblems
These problems, or similar, pervade data mining and knowledge discovery in general!All the problems mentioned above are being addressed currently.The advantage of retaining the user’s expertise remains…Visualization for Intelligence Augmentation(Mixed Initiative Systems).
Almost the End…
"Science does not rest upon rock-bottom. The bold structure of theories rises, as it were, above a swamp, but does not go down to any natural or 'given' base; and when we cease our attempts to drive our piles into a deeper layer, it is not because we have reached firm ground. We simply stop when we are satisfied that they are firm enough to carry the structure, at least for the time being.“
(Popper, 1959)
Challenges
Discovery is about building a structure that is strong enough to bear the concepts we need for our research, and no stronger.
We do not need to model the world in infinite detail.The ancient Greek philosophers believed in ‘natural categories’ by which all things could be classified…
We need to discover new objects, categories, relationships and theories by which we can explain complex geographical systems.
We should resist urges to believe that this structure is ‘true’ and will last for ever.
Conclusions
Inference is more than deduction.Deduction is good for some classes of problem, but…Geographical analysis that is entrenched only in deduction will not meet our future needs.Induction and abduction allow for human experience and the uniqueness of situations to influence outcomes. They also allow new knowledge to be created.Computational induction is now being used to solve many problems in physical geography, and some in urban and political geography. Our remaining challenges are to adapt computational tools to better suit geographic settings…To make them more ‘intelligent’…And to enable abduction via visual (computational?) methods.

The End