Embed Size (px)
Citation preview

Duquesne UniversityDuquesne Scholarship Collection
Electronic Theses and Dissertations
Fall 1-1-2017
An Exploration of the Relationships AmongCattell-Horn-Carroll (CHC) Theory-AlignedCognitive Abilities and Math FluencyKatherine D. Piselli
Follow this and additional works at: https://dsc.duq.edu/etd
Part of the School Psychology Commons
This Immediate Access is brought to you for free and open access by Duquesne Scholarship Collection. It has been accepted for inclusion in ElectronicTheses and Dissertations by an authorized administrator of Duquesne Scholarship Collection. For more information, please [email protected].
Recommended CitationPiselli, K. D. (2017). An Exploration of the Relationships Among Cattell-Horn-Carroll (CHC) Theory-Aligned Cognitive Abilitiesand Math Fluency (Doctoral dissertation, Duquesne University). Retrieved from https://dsc.duq.edu/etd/208

AN EXPLORATION OF THE RELATIONSHIPS AMONG CATTELL-HORN-CARROLL
(CHC) THEORY-ALIGNED COGNITIVE ABILITIES AND MATH FLUENCY
A Dissertation
Submitted to the School of Education
Duquesne University
In partial fulfillment of the requirements for
the degree of Doctor of Philosophy
By
Katherine D. Piselli
December 2017

Copyright by
Katherine D. Piselli
2017

iii
DUQUESNE UNIVERSITY SCHOOL OF EDUCATION
Department of Counseling, Psychology, and Special Education
Dissertation
Submitted in partial fulfillment of the requirements for the degree
Doctor of Philosophy (Ph.D.)
School Psychology Doctoral Program
Presented by:
Katherine D. Piselli
M.S.Ed. Child Psychology, Duquesne University, 2013
B.A. Psychology, Rollins College, 2011
July 20, 2017
AN EXPLORATION OF THE RELATIONSHIPS AMONG CATTELL-HORN-CARROLL
(CHC) THEORY-ALIGNED COGNITIVE ABILITIES AND MATH FLUENCY
Approved by:
_____________________________________________, Chair
Ara J. Schmitt, Ph.D.
Associate Professor
Department of Counseling, Psychology, and Special Education
Duquesne University
_____________________________________________, Member
Elizabeth McCallum, Ph.D.
Associate Professor
Department of Counseling, Psychology, and Special Education
Duquesne University
_____________________________________________, Member
James B. Schreiber, Ph.D.
Professor
School of Nursing
Duquesne University
iv
ABSTRACT
AN EXPLORATION OF THE RELATIONSHIPS AMONG CATTELL-HORN-CARROLL
(CHC) THEORY-ALIGNED COGNITIVE ABILITIES AND MATH FLUENCY
By
Katherine D. Piselli
December 2017
Dissertation supervised by Ara J. Schmitt, Ph.D.
Math fluency, which refers to the ability to solve single digit arithmetic problems quickly
and accurately, is a foundational mathematical skill. Recent research has examined the role of
phonological processing, executive control, and number sense in explaining differences in math
fluency performance in school-aged children. Identifying the links between these cognitive
abilities and math fluency skills has important implications for screening, assessment, and
intervention efforts in schools. As extant mathematics research in the context of Cattell-Horn-
Carroll (CHC) theory has evaluated either broad mathematics performance or math calculation
skills, little is known about the specific relationships between math fact fluency and broad and
narrow cognitive abilities. The present study investigated the relationships among Math Fact
Fluency performance and the CHC theory-aligned broad and narrow cognitive abilities using a
child-age subset of the Woodcock Johnson IV standardization sample. Results of the path
v
analyses indicated that General Intellectual Ability (GIA) exhibited significant direct and indirect
effects on Math Fact Fluency performance. With regard to broad cognitive abilities, Processing
Speed had the greatest direct effect on Math Fact Fluency. Likewise, in the narrow abilities
model, Perceptual Speed was most related to Math Fact Fluency, after accounting for GIA.
Contrary to initial hypotheses, Working Memory, Phonetic Coding, and Attentional Control did
not significantly contribute to Math Fact Fluency. Finally, the inclusion of Math Problem
Solving within the cognitive abilities model resulted in a moderate direct effect on Math Fact
Fluency performance. These findings are discussed in terms of directions for future research as
well as implications for clinicians and educators.

vi
DEDICATION
This dissertation is dedicated to my parents, Lea and Albert, who unequivocally
supported me in any and all of my endeavors, from ballet dancer to graduate student. I am so
grateful to have parents who truly encouraged my siblings and I to pursue our dreams. Mom,
everything I’ve learned about working with children began with you. I aspire to attain your level
of patience and kindheartedness. To all my family and friends, thank you for listening to me,
laughing with me, and helping me grow into the person I am today.

vii
ACKNOWLEDGEMENT
First, I would like to acknowledge and express thanks to my chair, Dr. Ara J. Schmitt. I
am sincerely grateful for all the guidance you provided me throughout my years as a graduate
student. I truly appreciated having a mentor that was always available for theoretical discussions
and on-the-spot supervision. I would also like to express my gratitude to my committee
members, Dr. Elizabeth McCallum and Dr. James Schreiber. Dr. McCallum, thank you for your
encouragement and patience throughout the process, particularly while my dissertation was in
the earliest stages of development. Dr. Schreiber, thank you for lending your expertise and
answering my countless questions.
I would also like to acknowledge the many individuals who made my graduate school
experience so successful. To Dr. Tammy Hughes, thank you for taking me on as a teaching
assistant and helping me foster my passion for teaching. I would also like to thank Audrey
Czwalga for supporting me while I navigated the many responsibilities of graduate school.
Finally, thank you to my fellow graduate assistants--you provided much-needed social support
throughout the dissertation process.
Lastly, I must acknowledge the wonderful professors I studied under as an undergraduate
at Rollins College. I would like to express my sincerest thanks to Dr. Jennifer Queen, who was
the first to encourage me to explore Ph.D. programs. I am also grateful for the support and
encouragement of Drs. Roger Ray and Steven St. John. Rollins College was the place where I
cultivated my love of learning, and I owe that to the enthusiastic and dedicated faculty.
viii
TABLE OF CONTENTS
Page
Abstract .............................................................................................................................. iv
Dedication .......................................................................................................................... vi
Acknowledgement ............................................................................................................ vii
List of Tables ..................................................................................................................... xi
List of Figures ................................................................................................................... xii
CHAPTER I: INTRODUCTION .................................................................................... 1
Significance of the Problem ............................................................................................ 1
Cognitive Correlates of Math Fluency ............................................................................ 2
CHC Theory .................................................................................................................... 4
Math Research using CHC-oriented Assessment Tools ................................................. 5
Problem Statement .......................................................................................................... 6
Research Questions and Hypotheses .............................................................................. 7
CHAPTER II: LITERATURE REVIEW ...................................................................... 9
Math Development........................................................................................................ 10
Counting .................................................................................................................... 12
Subitizing .................................................................................................................. 13
Calculation ................................................................................................................ 14
Math Disabilities ........................................................................................................... 15
Math Fluency ............................................................................................................ 15
Characteristics of Math Fact Retrieval Deficits ........................................................ 17
Phonological Processing ........................................................................................... 18

ix
Executive Control ..................................................................................................... 21
Number Sense ........................................................................................................... 24
CHC Theory .................................................................................................................. 25
Broad Abilities .......................................................................................................... 26
Narrow Abilities........................................................................................................ 28
The Woodcock Johnson Battery ................................................................................... 33
Math Achievement Using Versions of the WJ COG and ACH ................................ 36
Proposed Study ............................................................................................................. 38
CHAPTER III: METHODS .......................................................................................... 40
Sample and Participants ................................................................................................ 40
Data Source ............................................................................................................... 40
Procedures Used to Collect the Standardization Data .............................................. 40
Participants ................................................................................................................ 41
Measures ....................................................................................................................... 42
Reliability .................................................................................................................. 42
Validity ..................................................................................................................... 44
Research Questions and Hypotheses ............................................................................ 48
Research Question 1 ................................................................................................. 48
Research Question 2 ................................................................................................. 49
Research Question 3 ................................................................................................. 49
Data Analysis ................................................................................................................ 49
Estimation Method .................................................................................................... 52
Alternative Models.................................................................................................... 53

x
CHAPTER IV: RESULTS ............................................................................................. 54
Preliminary Statistics .................................................................................................... 54
Missing Data and Outliers ........................................................................................ 54
Normality and Homoscedasticity .............................................................................. 54
Correlation Analysis ................................................................................................. 56
Results for Research Question 1 ................................................................................... 57
Results for Research Question 2 ................................................................................... 60
Results for Research Question 3 ................................................................................... 61
Alternative Models........................................................................................................ 63
CHAPTER V: DISCUSSION ........................................................................................ 65
Findings Regarding Broad Abilities ............................................................................. 65
Findings Regarding Narrow Abilities ........................................................................... 70
Findings Regarding Math Problem Solving ................................................................. 74
Study Limitations .......................................................................................................... 75
Future Directions of Study ............................................................................................ 77
Implications for Practice ............................................................................................... 78
Summary ....................................................................................................................... 80
REFERENCES.................................................................................................................82

xi
LIST OF TABLES
Page
Table 2.1 Descriptions of CHC Broad Abilities ................................................................27
Table 2.2 WJ IV COG Subtests and Abilities....................................................................34
Table 2.3 WJ IV OL Subtests and Abilities .......................................................................35
Table 3.1 Tests Included in the Broad Abilities ................................................................50
Table 3.2 Tests Included in the Narrow Abilities ..............................................................51
Table 4.1 Descriptive Statistics for All Variables .............................................................55
Table 4.2 Bivariate Correlations for All Study Variables ..................................................57
Table 4.3 Path Estimates for the Final Broad Factor Model ..............................................59
Table 4.4 Path Estimates for the Final Narrow Factor Model ...........................................61
Table 4.5 Path Estimates for the Final Math Problem Solving Model ..............................63

xii
LIST OF FIGURES
Page
Figure 1. Theoretical broad factor model ..........................................................................93
Figure 2. Theoretical narrow factor model ........................................................................94
Figure 3. First alternative broad factor model ...................................................................95
Figure 4. Second alternative broad factor model ...............................................................96
Figure 5. Final broad factors model with parameter estimates ..........................................97
Figure 6. Final narrow factors model with parameter estimates ........................................98
Figure 7. Final math problem solving model with parameter estimates ............................99

1
CHAPTER I
INTRODUCTION
Recent research has shown that early math abilities at school entry are highly predictive
of future academic performance (Claessens, Duncan, & Engle, 2009; Duncan et al., 2007).
Students who demonstrate knowledge of early math concepts in kindergarten are more likely
achieve math proficiency in later years. However, more than half of American students fail to
demonstrate math proficiency in fourth grade, with even greater numbers of students performing
below proficiency in eighth and twelfth grade (NCES, 2013). As math concepts are learned in a
hierarchical sequence, it is important for students to have a strong foundational knowledge of
math calculation. Fluency with basic math facts allows students to devote more attention to
higher-order math calculation and problem solving skills.
Significance of the Problem
Math fluency refers to the ability to use efficient and accurate methods to solve simple
calculations (NCTM, 2010). Math fact fluency, also referred to as computational fluency, is
often assessed using timed tests of simple arithmetic problems. For example, the Math Facts
Fluency subtest of the Woodcock Johnson IV Tests of Achievement (WJ IV ACH; Schrank,
Mather, & McGrew, 2014a) is comprised of single-digit addition, subtraction, and multiplication
problems. The student is given three minutes to complete as many problems as possible.
The National Mathematics Advisory Panel (2008) identified math fluency as a
foundational skill for the development of more complex mathematic skills. Students with math
fact retrieval deficits receive lower scores on mathematical measures and are more error-prone
than typically achieving peers. Math fact fluency also appears to be linked to future performance
in mathematics, including the undertaking of interdisciplinary tasks that involve math. Students
2
who are fluent in retrieving math facts are more likely to engage in math activities than students
who have not yet developed fluency (Skinner, Pappas, & Davis, 2005). Additionally, fluent
students are less likely to report frustration or anxiety related to math calculations (Cates &
Rhymer, 2003).
Cognitive Correlates of Math Fluency
Children who exhibit a discrepancy between his or her cognitive ability and mathematical
achievement are often characterized as students with a Math Learning Disability (MLD). Much
of the research on math fact retrieval deficits focuses on this subset of students; however, studies
have recently included children with low achievement in math fluency. Like children with MLD,
children with low achievement also have at least low average intelligence and exhibit deficits in
math achievement, although the achievement deficits are less severe than those seen in children
with MLD. David Geary’s research (e.g., 2004, 2010, 2011a) on the patterns and characteristics
of math disabilities has identified a subset of children with particular difficulty in the fluent
retrieval of math facts.
Geary (2011a) has proposed three mechanisms underlying math fact retrieval deficits.
The first has been characterized as a semantic deficit. In this model, it is hypothesized that
weakness in phonological processing tasks that measure skills including phonemic awareness
and rapid automatized naming (RAN) is related to difficulty quickly and accurately retrieving
math facts from memory. Given that phonological processing is a known correlate of reading
fluency (e.g., Melby-Lervåg, Lyster, & Hulme, 2012), and that both tasks involve retrieval of
semantic information from long-term memory, investigators have sought to understand the
relationship between phonological processing abilities and math fluency. Recent research has
suggested that children with phonological deficits have impaired performance in math fluency
3
(Chong & Siegal, 2008; Vukovic, Lesaux, & Siegel, 2010). Fuchs and colleagues (2005, 2006)
have found that phonological processing measures are predictive of performance on math
fluency tasks. Additionally, research has established a link between performance on RAN tasks
and math fluency measures in children with MLD and low achievement (Geary, Hoard, &
Bailey, 2012; Mazzocco & Grimm, 2013).
Geary’s (2011a) second proposed mechanism of math fact retrieval deficits is
characterized by a weakness in executive functioning, or the ability to efficiently allocate
attention and cognitive resources. Specifically, Geary has hypothesized that a deficit in inhibition
is related to impaired math fluency. Inhibition refers to an individual’s ability to block irrelevant
information from entering working memory (Geary, 2011a). In the extant literature, working
memory tasks have been used to approximate this skill. Research conducted with students with
math fact retrieval deficits revealed that these students have depressed performance on working
memory tasks, which involve retaining and manipulating information in short-term memory
(Geary et al., 2012; Geary, Hoard, & Nugent, 2012). In addition, research on general
mathematical skills suggests a link between working memory and math ability in general
populations (Bull, Espy, Wiebe, Sheffield, & Nelson, 2011; Kroesbergen, Van Luit, Van
Lieshout, Van Loosbroek, & Van de Rijt, 2009).
Third, Geary (2011a) has proposed that weakness in numerical representation is related to
deficits in math fact retrieval. Numerical representation, which may also be referred to as number
sense or early numeracy, represents a domain of early math skills, including understanding of the
number line, quantity representation, and determining relationship between numbers. In support
of this hypothesis, Geary (2011b) was able to predict significant variance in math achievement
using numerical representation tasks. Locuniak and Jordan (2008) found that math fluency in

4
second grade was related to performance on early numeracy tasks, even after controlling for
general intelligence.
The above research illustrates the complexity of the cognitive processes underlying math
fact retrieval, and that there are multiple psychoeducational abilities that may contribute to an
individual’s performance on these measures. It may be helpful to consider all of these individual
abilities within a broader theory of cognitive ability. Simultaneously considering distinct
cognitive abilities could uncover patterns of strengths and weaknesses related to math fact
fluency performance. Further, it may help in identifying the most salient abilities in the
prediction of math fact retrieval deficits.
CHC Theory
The Cattell-Horn-Carroll (CHC) theory of cognitive ability is the result of many years of
research and collaboration between prominent intelligence theorists. Contemporary CHC theory
is a reflection of Carroll’s (1993) work expanding Cattell and Horn’s theory of fluid (Gf) and
crystalized (Gc) intelligence into three stratums representing general intellectual ability, broad
cognitive factors, and narrow abilities (McGrew, 2005). At present, CHC theory is the most
researched and empirically validated model of intelligence (Flanagan, Ortiz, & Alfonso, 2013).
Stratum three of the CHC framework represents overall intellectual ability, or g. Beneath
g, stratum two encompasses seven broad cognitive factors including the following: fluid
intelligence (Gf), crystalized intelligence (Gc), long-term retrieval (Glr), short-term working
memory (Gsm), visual processing (Gv), auditory processing (Ga), and processing speed (Gs).
Stratum one is comprised of more than 70 narrow abilities subordinate to the broad abilities.
These narrow abilities represent a variety of component skills, for example perceptual speed (Gs-
P) reflects a specific skill within the general processing speed (Gs) ability.
5
Math Research using CHC-oriented Assessment Tools
The Woodcock Johnson Tests of Cognitive Abilities, Third Edition (WJ III COG;
Woodcock, McGrew, & Mather, 2001a) is an assessment based on CHC theory. Together with
the Woodcock Johnson Tests of Achievement, Third Edition (WJ III ACH; Woodcock, McGrew,
& Mather, 2001b), this battery is used by practitioners to identify an individual’s cognitive
strengths and weaknesses and how this pattern relates to his or her profile of academic
achievement. Research comparing subtests on the Woodcock Johnson cognitive and achievement
tests has provided insight into the relationships among various cognitive factors and academic
skills. Three studies have focused specifically on math achievement using the WJ III
standardization sample.
Floyd, Evans, and McGrew (2003) used multiple regression analyses to investigate the
link between cognitive factors and performance on math calculation and math problem solving
clusters. The Math Calculation Cluster, which is comprised of an untimed math calculation
subtest and a timed math fluency subtest, had a strong relationship with processing speed and
crystalized intelligence in elementary and middle school students. Moderate relationships
between math calculation and auditory processing and long-term retrieval were evident in early
elementary age children’s scores.
A second study regarding the cognitive predictors of math calculation performance was
conducted by Proctor, Floyd, and Shaver (2005). This study compared the profiles of low
achieving math calculation students in comparison to typically achieving peers. No significant
differences were found across cognitive measures, leading the researchers to hypothesize that
students who are low achievers in math calculation are likely a heterogeneous group.
6
Using structural equation modeling, Taub, Floyd, Keith, and McGrew (2008) examined
the relationships between math achievement and cognitive factors. Crystalized intelligence, fluid
reasoning, and processing speed were significantly related to overall math ability. However, as
math calculation and problem solving skills were combined into one composite, it is unclear
which abilities are specifically related to math calculation and/or math fluency skills.
McGrew and Wendling’s (2010) analysis summarized the results of the aforementioned
studies in addition to others that investigated the relationships between cognitive abilities and
achievement in the context of CHC theory. Consistent with Taub et al.’s (2008) findings,
crystalized knowledge, fluid reasoning, and processing speed were surmised to be most related to
math calculation skills. Further analysis parsed out the narrow abilities, the discrete skills that
comprise the broad factors. Both perceptual speed (Gs-P) and working memory (Gsm-MW) were
strongly related to math calculation performance for children of all ages. For children ages 6-13,
phonological processing (Ga-PC) had a moderate relationship with calculation skills. Of note,
two of these narrow abilities (Gsm-MW and Ga-PC) were implicated in the relationship between
cognitive abilities and math calculation, although the corresponding broad factors were not (Gsm
and Ga).
Problem Statement
Despite research identifying the cognitive correlates for overall math achievement, no
studies have examined the relationship between cognitive abilities and math fluency as an
isolated skill. Recent literature suggesting that fluent math fact retrieval is a specific area of
weakness for some children warrants further research investigating the cognitive correlates of
these difficulties. Studies demonstrating a link between math fluency deficits and phonological
processing, executive control, and number sense have revealed a complex array of factors that

7
may contribute to such deficits. Understanding the relationship between cognitive abilities
measured by the Woodcock Johnson, Fourth Edition (Schrank, McGrew, & Mather, 2014) and
math fact fluency has important implications for the identification and remediation of math fact
retrieval deficits.
Research Questions and Hypotheses
1. Within the child age subset of the standardization sample, which broad cognitive abilities
display significant effects on the Math Facts Fluency performance?
a. Hypothesis 1: It is hypothesized that fluid reasoning will have a direct effect on
Math Facts Fluency.
b. Hypothesis 2: It is predicted that comprehension-knowledge will have a direct
effect on Math Facts Fluency.
c. Hypothesis 3: Working memory is hypothesized to have a direct effect on Math
Facts Fluency.
d. Hypothesis 4: Processing speed is predicted have a direct effect on Math Facts
Fluency.
e. Hypothesis 5: It is hypothesized that General Intellectual Ability will have an
indirect effect on Math Facts Fluency performance.
2. Which narrow abilities have significant effects on performance on the Math Facts
Fluency subtest?
a. Hypothesis 1: It is hypothesized that perceptual speed will have a direct effect on
Math Facts Fluency.
b. Hypothesis 2: Number facility will have a direct effect on Math Facts Fluency.
c. Hypothesis 3: Phonetic coding will have a direct effect on Math Facts Fluency.
8
d. Hypothesis 4: It is predicted that naming facility will have a direct effect on Math
Facts Fluency.
e. Hypothesis 5: It is hypothesized that attentional control will a direct effect on
Math Facts Fluency.
3. What relationship will math problem solving abilities have with math fluency
performance?
a. Hypothesis 1: It is hypothesized that performances on the Math Problem Solving
cluster will have a direct effect on performance on Math Facts Fluency.
9
CHAPTER II
LITERATURE REVIEW
Economists predict that the science, technology, engineering, and math industries will
continue to grow at almost twice the national average, playing a vital role in the overall growth
of the U.S. economy (Langdon, McKittrick, Beede, Khan, & Doms, 2011). However, the
majority of U.S. students lack proficiency in the requisite math skills needed to succeed in these
fields. According to the National Center for Education Statistics’ 2013 Nation’s Report Card,
proficiency in mathematics was obtained by only 26% of 12th graders in 2013. Even in
elementary and middle school, the majority of students are not performing at the Proficient level,
with only 42% of fourth grade and 35% of eighth grade students obtaining at least Proficiency
status on state assessments (NCES, 2013). These figures indicate that less than half of all
students are able to consistently apply procedural knowledge and math reasoning skills to solve
grade-level math problems. These data evidence a decreasing trend in the number of students
meeting state standards in mathematics throughout the grade levels.
Duncan et al.’s (2007) seminal study on the early childhood predictors of academic
achievement highlighted the importance of early math skills for later success. Specifically,
Duncan and colleagues found that math skills at school entry predicted later elementary and
middle school achievement better than measures of early reading, attention, behavior problems,
and social skills. Similarly, Claessens, Duncan, and Engle (2009) found that kindergarten math
ability predicted fifth-grade achievement in both reading and mathematics.
Early mathematical knowledge appears to be the strongest predictor or future math
achievement. Recent research has focused on assessing children’s “number sense.” Although it
has been defined in a number of different ways, number sense generally refers to the ability to
10
understand the meaning of numbers and the relationships of numbers with each other (Berch,
2005). Though the definition of number sense may vary by researcher, there appears to be more
of a consensus on the types of skills young children should possess. Generally, math measures
for young children focus on number identification, counting, quantity discrimination, and
understanding of the number line.
Longitudinal research has demonstrated the relationship between number sense and later
math achievement. Jordan, Kaplan, Locuniak, and Ramineri (2007) tracked children’s
achievement in kindergarten and first grade and found a significant (.70) correlation between fall
kindergarten assessments of number sense and end of first grade math achievement. In analyzing
predictors of first grade math achievement, background variables, such as reading achievement,
income status, gender, and age, did not add any predictive value over number sense in
kindergarten. A continuation of this study, measuring the mathematics achievement of these
students in third grade, showed that kindergarten number sense skills continued to be predictive
of math achievement in third grade (Jordan, Kaplan, Ramineri, & Locuniak, 2009).
In order to enhance the development of mathematical skills in young children, educators
and researchers must understand children’s cognitive development and capacity for mathematical
reasoning. Mathematical skills are obtained in a hierarchical sequence; therefore, a foundational
knowledge of numerical principles and math calculation is necessary before more complex skills
can be learned (NCTM, 2000). An understanding of the cognitive correlates for discrete math
skills is needed to ensure accurate assessment and remediation for math achievement deficits.
Math Development
Given that preschool children can quantitatively think and reason (Resnick, 1989), much
research on the development of mathematical skills in early childhood has focused on how to

11
foster children’s inherent mathematical understanding and encourage interest in applying
mathematical concepts. The National Council of Teachers of Mathematics (NCTM) first
incorporated pre-kindergarten education standards in the 2000 publication of Principles and
Standards for School Mathematics (NCTM, 2000). The Principals and Standards for School
Mathematics provide recommendations for high-quality mathematics education in pre-K through
grade 12 classrooms. The organization emphasizes that curricula should be correctly aligned
with the known progression of mathematical skills.
The Principles and Standards for School Mathematics identifies five areas of knowledge
that students should develop to be proficient in mathematics. The five content areas include: (a)
number and operations, (b) algebra, (c) geometry, (d) measurement, and (e) data analysis and
probability. In the area of number and operations, young students should develop the ability to
count objects, label how many objects, and answer simple addition and subtraction questions
(NCTM, 2010). In the area of algebra, students should be given opportunities to recognize and
re-create patterns of objects. In terms of geometry, young students should develop the ability to
name shapes, use shapes to create a picture, understand simple maps, and use spatial words to
describe relationships between objects. For the development of measurement, pre-K and early
elementary age children should improve in the ability to use words to label object qualities (e.g.,
heavy, long) and compare objects using non-standard measuring tools, like cups or strings.
Finally, student development in the area of data analysis and probability includes sorting
objects, comparing groups, and utilizing simple graphical representations.
Although NCTM defines mathematical concepts into these five areas, educational
research has primarily focused on math achievement in terms of calculation and problem solving.
This distinction is reflected in the current definition of a Specific Learning Disability as outlined

12
by the 2004 Reauthorization of Individuals with Disabilities Education Act (IDEA), which
categorizes math disabilities in terms of mathematics calculation or mathematics problem
solving. In terms of NCTM’s content areas, mathematics calculation is most closely aligned to
the domain of numbers and operations.
With respect to the area of numbers and operations, the three primary goals for pre-k
through grade 12 students include: (a) understanding numbers, (b) understanding meanings of
operations, and (c) computing fluently. The NCTM lists expectations for students across grade
levels for pre-K through grade 2, grade 3 through 5, grade 6 through 8, and grade 9 through 12.
For example, children in pre-K through grade 2 should demonstrate understanding of numbers
through counting and recognizing “how many?” for a group of objects. In these grades, students
should also show comprehension of words describing position or magnitude. In terms of
operations, students must understand the meaning of addition and subtraction and their
relationship to each other. Finally, young students should develop fluency with simple addition
and subtraction problems. That is, students should be able to quickly and efficiently solve simple
math problems. The developmental sequences for counting, subitizing, and calculation, three
areas of growth during pre-K and elementary school years, are described below.
Counting
Within the math developmental sequence, a three year-old child can correctly count up to
the number four (National Association for the Education of Young Children; NAEYC, 2010).
Between ages three and four, most children are able to count up to four objects using a one-to-
one correspondence. Children of this age understand that counting involves assigning only one
number to one object and also begin to understand that numbers are sequenced in a fixed order.
For example, the number three always comes before four. Children at age four are generally able
13
to understand that the last number counted for a series of objects represents the total number of
objects, which is referred to as cardinality (Clements & Sarama, 2009). By age five, most
children are able to count up to 10 objects, although rote counting ability may extend to numbers
in the 20s and 30s, or beyond.
Counting is a fundamental skill, and the inability to count is linked to subsequent math
disabilities. Geary and colleagues have shown that difficulties with understanding the order of
numbers and the process of counting objects is related to math disabilities, controlling for the
effects of IQ and reading ability (Geary, Bow-Thomas, & Yao, 1992; Geary, Hamson, & Hoard,
2000). Some differences between children with math learning disabilities’ (MLD) knowledge of
counting principles and typically achieving peers appear to be present. Geary et al. (1992) found
that that MLD children were less likely to recognize that when counting a set of objects, one
could begin at either ends of the set, and that the objects could be counted in any order.
Subitizing
Subitizing has recently been considered a core facet of children’s number sense (Geary,
2010). Research has implicated subitizing in the development of counting proficiency in
kindergarten (Kroesbergen et al., 2009), as well as math achievement in the elementary years
(Geary, 2011a). Subitizing is defined as the ability to quickly recognize a quantity through visual
discrimination, rather than counting each object (Kaufman, Lord, Reese, & Volkmann, 1949). At
age three, children can automatically answer “how many?” questions involving one to three
objects. Four year old children are automatically able to recognize when four objects are present,
while five year old children can recognize when five objects are present. For example, a five year
old can immediately identify the number of dots when presented with a picture of five dots
(Clements & Sarama, 2009). At this age, children also begin to understand that addition and
14
subtraction can occur between groups of subitized quantities (e.g., recognizing two groups of
three objects and determining that there are six total).
Calculation
At age two or three, children demonstrate the emerging ability to count small groups of
objects to determine a sum. For example, a child this age is able to correctly name how many
total blocks are present after seeing a third block added to a group of two blocks (Clements &
Sarama, 2012). At age four, children develop the ability to use language to solve addition
problems under five digits. This child would be able to use a counting-all strategy to answer a
simple addition problem; that is, the child would count each object in order to determine how
many are present in all. Children at this age can use their fingers to count, understanding that
each finger represents one object. At age four and five, children begin to understand small digit
subtraction problems, where he or she separates objects that are taken away and counts how
many objects are remaining.
School age children begin to utilize a counting-on strategy to solve basic addition
problems. Using this strategy, a student would start counting after the number of the first digit,
rather than starting at number one, and then count the additional numbers being added on to that
digit. For example, in the equation 4 + 3, the child would count “ 5, 6, 7” to arrive at the answer
of 7. In addition to solving problems that require finding the sum, students may also solve
missing addend problems, or “how many more” problems. Similar to counting-on, the counting-
up-to strategy can be used to find how many more digits are needed to reach the total sum.
Another more sophisticated strategy, decomposition, is used obtain an answer to a calculation
problem by recalling answers to similar calculations (Geary, 2011a). For example, in the
15
calculation 5 + 6 = 11, a student may recall 5 + 5 = 10 and that 6 is 1 more than 5, leading to the
determination that the answer is 10 + 1, or 11.
Math Disabilities
Within the mathematics literature, students with calculation deficits are often described as
students with Math Learning Disability (MLD) or low achievement. In the context of IDEA
(2004), a student with a MLD must have a significant discrepancy between his or her intelligence
and math achievement. In research studies, students who score at or below the 10th percentile in
math are generally included within the MLD category, given an intelligence score at or above the
15th percentile is present (Geary, 2011a). Students with low achievement are characterized as
having math scores within the 11th to 25th percentile and also possess at least low average
intelligence (15th percentile or greater).
In terms of calculation, students with MLD continue to use less efficient strategies
(Geary, 2011a). Students with typical achievement begin to exhibit more sophisticated
calculation strategies in the early elementary years, while students with MLD continue to count
using their fingers or by counting-all for both digits in the equation. Students with low
achievement in math also show this delay relative to typically achieving peers; however, low
achieving students show less significant delays than students with MLD.
Math Fluency
Math fluency refers to the ability to quickly solve simple calculations, for example
single-digit addition problems. The National Mathematics Advisory Panel (2008) determined
that math fluency, also referred to as computational fluency, is an important precursor for the
development of higher order math skills. Math fluency is typically measured by giving a student
a set of arithmetic problems to solve in a set time period. Examples include the Math Fluency
16
subtest on the WJ IV ACH and the Addition Fact Fluency and Subtraction Fact Fluency subtests
(Fuchs, Hamlett, & Powell, 2003). Measures differ by length of time and the operations
included. For example, the Math Fluency subtest on the WJ IV ACH battery includes addition,
subtraction, and multiplication problems and is given a three minute time limit, while Addition
Fact Fluency includes only one operation and has a one minute time limit.
Students with math fluency or math fact retrieval deficits receive lower scores on these
measures and are more error-prone than typically achieving peers. These students more often
make errors resulting from intrusions of counting string associates (Geary et al., 2000; Geary et
al., 2012). Counting string associates refer to any number that is directly above or below one of
the digits in the equation. For example, in the problem 5 + 3, an incorrect answer of 6 would
represent an intrusion of the number above 5 in the number sequence. Likewise, an incorrect
answer of 4 would represent an intrusion associated with the number 3. Further, elementary
students with deficits in math fact fluency tend to have growth rates similar to typically
achieving peers, resulting in a maintained gap in performance (Chong & Siegel, 2008).
Conversely, students with procedural deficits in math tend to have higher growth rates allowing
them to “catch up” to their typical peers on procedural tasks. Given the importance of math fact
retrieval skills in becoming proficient in more complex mathematics, recognizing and
intervening for math fluency deficits is a fundamental goal.
Recently, researchers have sought to understand math fluency as a distinct mathematical
skill. Indeed, twin studies have found that math fluency skills indeed have a unique genetic
origin. Hart, Petrill, Thompson, and Plomin (2009) found that although math fluency shares
genetic overlap with reading fluency, it has unique genetic influences independent of math
calculation and general cognitive ability. After accounting for performance on untimed math

17
measures, reading comprehension, and reading fluency, approximately two thirds of the variance
in math fluency remained unexplained (Petrill et al., 2012). Recent research involving the study
of the cognitive correlates of mathematics achievement also reflects this distinction between
math fact fluency and untimed math ability. Geary (2010) suggests that a subset of children with
Math Learning Disability (MLD) and low achievement have distinct and severe deficits in the
ability to efficiently retrieve basic math facts.
Characteristics of Math Fact Retrieval Deficits
David Geary’s (1993) theory on the subtypes of math learning disabilities originally
proposed a distinction between children with procedural, semantic memory, and visuospatial
profiles of MLD. Children with math fact retrieval deficits were proposed to have the semantic
memory subtype. This subtype is characterized by difficulty answering basic arithmetic
problems, slow response times on math fluency measures, and frequent errors in math fact
retrieval. This subtype is frequently associated with comorbid reading disabilities. Geary (2004)
hypothesized that these children have deficits in phonetic and semantic representations in long-
term memory.
More recently, Geary (2011a) proposed three mechanisms of retrieval deficits that may
result in problems with math fact fluency for children with MLD and low achieving children.
The first represents the semantic memory hypothesis, discussed in his early work. The second is
related to an inhibition deficit, in which the individual fails to inhibit irrelevant number
associations when attempting to retrieve a math fact from memory. The counting string
intrusions, discussed previously, are one such example. Others include “table-related” intrusions,
where the student recalls a number next to the correct answer on the multiplication table, or
cross-operation intrusions, where the student recalls an answer to a problem using a different

18
operation (e.g., solving as an addition problem instead of a subtraction problem). Third, Geary
proposed a deficit in number processing, or the ability to understand numerical representations of
small and large quantities. Research aligned with these three subtypes is discussed below.
Phonological Processing
Phonics. Simmons and Singleton’s (2008) review of research investigating the link
between reading disabilities (RD) and math fact retrieval suggests that students with reading and
math disabilities possessed phonological processing deficits underlying their difficulties in
decoding words and retrieving math facts. Both children with MLD and RD were found to have
deficits in retrieving answers to simple addition problems (Geary et al., 2000). In addition,
children with RD that did not have MLD had lower scores on arithmetic measures than typical
peers.
A recent study by Vukovic et al. (2010) compared the math achievement of children with
RD with phonological deficits (dyslexia), children with reading comprehension difficulties
absent phonological deficits, and a group of typically achieving children. Results showed that
students with phonological deficits were more likely to have deficits on the WJ III ACH Math
Fluency measure than the reading comprehension group or the comparison group. However, this
study was limited by a small sample size, and three of the 18 students with phonological deficits
showed no deficit in math fluency. A longitudinal study by Chong and Siegel (2008) also found
support for deficient phonological processing skills associated with poor math fact fluency.
Students with MLD and low achievement in math fluency both showed deficits in phonological
processing on Word Attack, a pseudoword decoding task that requires one to use phonics skills
rather than recall known sight words, as compared to typical children. Deficits in phonological
19
processing were evident in second, third, fourth, and fifth grades for the students with MLD and
low achievement.
Further support for the link between phonological processing and math fluency has been
identified in studies of typically achieving students. Fuchs et al. (2006) assessed third grade
students on cognitive and math achievement measures. Using path analysis, the researchers
found that performance on Word Attack was a significant predictor of performance on addition
and subtract fact fluency measures. Another study by Fuchs and colleagues (2005) investigated
the relationship between phonological processing and math fluency using a large sample of first
grade students. Phonological processing was measured using a composite of two subtests: a
sound matching subtest and a rapid digit naming subtest. Multiple regression showed that
performance on this phonological processing composite was uniquely predictive of addition fact
fluency beyond reading achievement and other cognitive variables.
Rapid Automatized Naming. Rapid digit naming, as stated above, is often considered a
measure of phonological processing. However, it is also often included as a measure of
processing speed. Rapid letter, number, and color naming tasks are often referred to as measures
of rapid automatized naming (RAN). These tasks assess an individual’s ability to efficiently
retrieve the label associated with a pictorial representation. For example, on a rapid letter naming
task, an individual is asked to read a set of letters as quickly as possible within a time limit.
Research on the link between RAN and reading fluency is well established (e.g., Norton & Wolf,
2012). Less work has been done on the relationship between RAN and math disabilities. As a
measure of phonological processing and processing speed, RAN would appear by theory to be
linked to math fluency; however, results of recent research appear mixed.

20
Geary et al.’s (2012) longitudinal study of MLD and low achieving students with severe
and mild fact retrieval deficits examined the relationship between math fact fluency and other
cognitive and achievement measures relative to typically achieving peers. Results from
assessments in second, third, and fourth grade showed that RAN letter and number performance
reflected significantly longer completion times for children with MLD than the typical or mild
math deficits group. As expected, mean response times for the severe deficit group showed that
they were slower than the typically achieving and mild deficit group. The children in the MLD
group had the slowest naming speed. With respect to younger students, Georgiou, Tziraki,
Manolitsis, and Fella (2013) assessed the relationships among rapid color and object naming
tasks in kindergarten and math fluency in first grade. Although RAN performance was a
significant predictor of reading fluency, it did not significantly predict math fluency performance
in the first grade. However, research on RAN tasks within the reading literature has shown that
performance on rapid naming tasks using alphanumeric symbols (i.e., letters or numbers), rather
than object or colors, has proven to be most predictive of reading ability (Savage &
Frederickson, 2005). This difference in task demand could relate to the lack of significant
relationship between math fluency and RAN color and object tasks.
Additional research has been conducted investigating the relationship between RAN and
overall math ability. Mazzocco and Grimm (2013) assessed the performance of students with
MLD, low achievement, and typical achievement in kindergarten through grade eight on rapid
letter, number, and color naming tasks. Results showed that children with MLD and low
achievement in math were significantly slower on all tasks than typically achieving peers in
kindergarten. In grade eight, children with MLD were again significantly slower when naming
letters and colors compared to typically achieving peers. Low achieving students were

21
significantly slower than typically achieving peers on color naming only. Interestingly, children
with MLD did not differ from typically achieving peers on the rapid number naming task in
grade eight. Students with low achievement did not differ from typical students on letter or
number naming, but did perform slower on the color naming task. A second longitudinal study
investigating various math skills in kindergarten found that performance on RAN color, object,
and number naming tasks did not contribute any predictive value in the identification of MLD in
second and third grade after accounting for other formal (e.g., number identification) and
informal (e.g., quantity discrimination) skills (Mazzocco & Thompson, 2005).
Based on these results, it appears that the relationship between phonological processing,
rapid automatized naming, and math fluency may depend on the severity of math fact retrieval
deficit, the age of the child, and the type of task employed. Additionally, Geary’s proposed
subtypes for math fact retrieval deficits suggest that children with these deficits are not a
heterogeneous group.
Executive Control
Geary’s second proposed mechanism underlying math fact retrieval deficits focuses
specifically on a deficit in inhibiting irrelevant information intruding in working memory (Geary,
2011a). Geary et al. (2012) used two unique measures for assessing addition facts in elementary
school students in second, third, and fourth grade. The first was a choice task, where the student
was asked to solve simple addition problems as quickly as possible without paper and pencil.
The response time was measured between presentation of the problem and the child’s response.
The student was also asked to describe how he or she arrived at the answer. The second measure
was forced addition fact retrieval. This task was similar to the first, except that children were
instructed to try to answer each problem from memory without counting or using other problem

22
solving strategies. Students were also assessed on the Working Memory Test Battery for Children
(WMTB-C; Pickering & Gathercole, 2001), a battery of nine subtests in which a child is assessed
using the following: three dual-task measures, whereby the child must manipulate information in
working memory to produce an answer (referred to as central executive tasks); four recall tasks
utilizing phonological memory; and two visuospatial memory tasks. Results showed that children
with MLD had lower scores on all three working memory tasks than typically achieving
children. Further, low achieving children with severe fact retrieval deficits had significantly
lower scores on the central executive tasks than typical children, although the groups did not
differ on phonological or visuospatial tasks. Low achieving children with mild fact retrieval
deficits had lower scores on all working memory tasks, but did not differ significantly from
typically achieving peers. However, all children with fact retrieval deficits showed errors on
addition tasks that suggested intrusions of unrelated information. The authors suggest that this
inhibition difficulty is a specific facet of working memory ability that may not be tapped by
traditional working memory measures.
Geary, Hoard, and Nugent (2012) used similar measures to assess a group of children
from first to fourth grade. First grade students with better performance on central executive tasks
were found to perform better on addition fact retrieval tasks than children with lower scores on
these working memory tasks. Although central executive measures were less predictive of fact
fluency in later years, the measures did predict the development of more efficient strategies. That
is, children with better performance on central executive tasks were observed to use the
decomposition strategy for solving addition problems before lower performing peers.
Another function related to executive control, attention, has recently been linked to math
fluency in elementary school children. The Geary et al. (2012) study used teacher-rated
23
inattentive behaviors. Results showed that children’s attentive behavior predicted their use of
more efficient calculation strategies. Similarly, Fuchs and colleagues (2006, 2008) found that
ratings of attention predicted third graders’ performance on basic calculation fluency.
Interestingly, Fuchs et al. (2008) found that inattentive behaviors were distinct predictors of
calculation fluency deficits but not math problem solving deficits, suggesting this relationship
was not simply a reflection of teacher’s perception of low achieving students in the classroom.
Research has also focused on the contribution of executive functions on general math
ability in young children. Using various measures assessing kindergarten and first grade age
children’s planning, updating, and inhibition skills, Kroesbergen et al. (2009) found that these
skills contributed a significant amount of variance to these children’s counting skills. Updating,
which the authors define as “monitoring and coding of information relevant to the task and
replacing nonrelevant information with new input,” was measured using a digit span backward
test, where an individual must listen to, reorder, and recite lists of increasing long digit sequences
(Kroesbergen et al., 2009, p. 227). Performance on this task was determined to be the best
predictor of the variance in children’s early math skills. Although referred to in this study as an
executive functioning skill, digit span backward is often included as a measure of working
memory or central executive capacity. Regardless of how it is defined, digit span backward
appears to have a significant relationship with early math skills (e.g., Geary et al., 2009; Geary,
2011a; Geary et al., 2012; Locuniak & Jordan, 2008). Finally, research on the contributions of
executive functioning in preschoolers’ emergent math ability suggests that these skills are unique
predictors independent of the effects of crystalized (verbal) intelligence (Bull et al., 2011).
24
Number Sense
A third deficit in math fact retrieval proposed by Geary (2011b) involves weaknesses in
numerical representations. In support of this theory, researchers employing measures tapping the
broad domain of “number sense” have found that performance in this domain can predict math
fluency in elementary school children. Locuniak and Jordan (2008) assessed a sample of
kindergarteners on counting, number recognition, knowledge of the number line, nonverbal
calculation (using manipulatives), addition and subtraction story problems, and number
combinations, which were orally presented addition and subtraction problems using phrases such
as “how much is x plus y?” Calculation fluency was measured in second grade using addition
and subtraction timed subtests. Results showed that children’s number sense performance in
kindergarten was predictive of second grade calculation fluency even after controlling for other
variables, such as intelligence and reading achievement. Digit span backward was the only
cognitive measure that contributed additional variance when number sense was included in
regression models.
Geary’s (2011b) longitudinal study assessing general math ability in a general sample of
elementary school children found that skill on tasks assessing subitizing, or the ability to quickly
recognize small quantities without counting, and quantity representation added unique variance
in predicting math achievement. Using a sample of MLD and low achieving children, Geary et
al. (2012) included number sets and number line measures to assess their representation of
numerical quantities. The number sets measure was hypothesized to assess subitizing, the
number line task was proposed to tap the ability to understand magnitude. Children in the low
achieving group appeared to have deficits in these areas; however, these differences were not
significant when including other measures of cognitive abilities. The authors note that these
25
measures may not have truly measured the concept of numerical representation. Indeed, one of
the barriers in assessing number sense abilities is the lack of consensus on how number sense is
defined (see Berch, 2005) and a lack of standardized instruments tapping these abilities. At
present, it is unclear the degree in which deficits in math fluency can be predicted using
measures of children’s understanding of numerical representation.
CHC Theory
Contemporary CHC theory is the manifestation of John Carroll (1993) expanding
Raymond Cattell and John Horn’s theory of fluid (Gf) and crystalized (Gc) intelligence into three
stratums representing general intellectual ability, broad cognitive factors, and narrow abilities
(McGrew, 2005). In contemporary CHC theory, general intellectual ability, or g, represents the
third stratum. A singular construct representing overall ability has predominated over a century
of intelligence research, stemming from the early work of Charles Spearman. Spearman’s
research was later expanded by Karl Holzinger and colleagues to include additional factors of
intelligence. This groundwork eventually led to Cattell’s Gf-Cc theory, which entails a
hierarchical two-factor theory of intelligence with associated lower-order abilities (Schneider &
McGrew, 2012). Cattell’s collaboration with Horn over the latter half of the 20th century
continued to parse out individual factors of intellectual ability utilizing factor-analytic
techniques. Carroll’s (1993) work reviewing existing theories and research reconciled the notion
of a singular g ability with the multi-factored abilities discovered in Cattell and Horn’s research
into a three stratum hierarchy. This theory continues to be recognized as the most comprehensive
and psychometrically evaluated intelligence theory, with research continuing to clarify and
delineate broad and narrow cognitive abilities (Schneider & McGrew, 2012).
26
Broad Abilities
Schneider and McGrew (2012) conducted a review of contemporary CHC theory that
included 16 broad factors in the second stratum encompassed under the umbrella of g. These
factors were described as fluid intelligence (Gf), comprehension-knowledge (Gc; formerly
referred to as crystallized intelligence), long term retrieval (Glr), short term memory (Gsm;
presently referred to as working memory Gwm), visual processing (Gv), auditory processing
(Ga), and processing speed (Gs), reading and writing (Grw), quantitative knowledge (Gq),
domain-specific knowledge (Gkn), tactile abilities (Gh), kinesthetic abilities (Gk), olfactory
abilities (Go), psychomotor abilities (Gp), psychomotor speed (Gps), and reaction and decision
speed (Gt). The authors provide groupings according to the degree by which abilities cluster
together by function, producing an acquired knowledge group (Gc, Grw, Gq, Gkn), memory
group (Gsm, Glr), general speed group (Gs, Gps, Gt), and a motor group (Gk, Gp). Additionally,
a conceptual grouping was made for sensory abilities (Ga, Gv, Gh, Go), in additional to
conceptual groupings of sensory-motor domain-specific abilities (sensory and motor abilities),
cognitive efficiency (memory and general speed abilities), and domain-independent general
capacities (Gf, memory, and general speed).
Although the second stratum currently encompasses 16 broad abilities, existing
intelligence batteries do not necessarily provide measures of each ability. Newton and McGrew
(2010) at the time reported that intelligence measures typically include measures of fluid
reasoning (Gf), comprehension-knowledge (Gc), long term retrieval (Glr), short term memory
(Gsm), visual processing (Gv), auditory processing (Ga), processing speed (Gs), and quantitative
knowledge (Gq). Specifically, Keith and Reynolds (2010) conducted a review of common
intelligence measures that found that tests with fewer factors were the norm, with the Kaufman

27
Assessment Battery for Children (KABC-II; Kaufman & Kaufman, 2004) evidencing five factors
(Gc, Gv, Gf, Glr, and Gsm), the Stanford Binet, Fifth Edition (SB-V; Roid, 2003) reflecting five
factors (Gf, Gc, Gf-RQ, Gv, and Gsm), and the Wechsler Intelligence Scale for Children, Fourth
Edition (WISC-IV; Wechsler, 2003) measuring four factors (Gc, Gsm, Gs, and Gf/Gv). The
Woodcock Johnson Fourth Edition Tests of Cognitive Abilities (WJ IV COG; Schrank et al.,
2014) provides measures of seven broad abilities (Gc, Gf, Gwm, Gs, Ga, Glr, Gv), which the
authors state reflects the status of the most substantial research on CHC theory at the time of its
development (McGrew, LaForte, & Schrank, 2014). The seven broad abilities encompassed by
the WJ IV COG are described in Table 1 below.
Table 2.1
Descriptions of CHC Broad Abilities
Gc Comprehension-Knowledge Represents the ability to activate and access
acquired, declarative knowledge
Gf Fluid Reasoning
Measures novel problem solving ability;
Requires induction, categorization, and
identifying and switching rules
Gwm Short-Term/Working Memory
Refers to the capacity to keep stimuli in
immediate awareness, recode the information,
and produce an output
Gs Processing Speed
The ability to utilize attentional control to
perform speeded visual perception and
discrimination tasks
Ga Auditory Processing
Represents the ability to analyze and
discriminate acoustic elements; activate and
retrieve semantic information
Glr Long-Term Storage and
Retrieval
Involves the construction of representations in
long-term memory and the ability to retrieve this
information
Gv Visual Processing
Involves mental manipulation and rotation of
visual images and retrieval of visual
representations from memory

28
Narrow Abilities
The narrow abilities subsumed by CHC theory comprise the most fluid of the three
stratums, with narrow abilities continually being added, refined, or removed as the result of an
evolving body of research. Over 70 narrow abilities have been proposed within stratum one
(Newton & McGrew, 2010). In their 2012 chapter, Schneider and McGrew included a discussion
of 81 well-supported narrow abilities falling beneath the 16 broad abilities. The narrow abilities
that comprise the seven broad abilities measured by the WJ IV COG are briefly discussed below.
Comprehension-knowledge. Six narrow abilities fall within the scope of
comprehension-knowledge (Schneider & McGrew, 2012). General Verbal Information (K0)
refers to the store of knowledge obtained through cumulative exposure to information across
various domains. Language Development (LD) refers broadly to the comprehension and
application of language for expressive and receptive communication. Next, Lexical Knowledge
(VL), refers specifically to vocabulary knowledge as an isolated skill. Similarly, Listening
Ability (LS) refers to the ability to understand speech as a discrete ability, whereas
Communication Ability (CM) is described as the ability to utilize expressive language effectively
to communicate one’s thoughts. Finally, Grammatical Sensitivity (MY) is reserved for the ability
to understand morphological and syntactic principles and apply grammatical knowledge.
Fluid reasoning. Three narrow abilities are considered well-supported by the current
empirical literature (Schneider & McGrew, 2012). The first is Induction (I). Induction refers to
the ability to utilize logical reasoning for the purpose of identifying an organizing principle or
rule. Second, General Sequential Reasoning (RG) refers to the ability to utilize deductive
reasoning to apply known rules or principles to problem solve a through a task. Finally,

29
Quantitative Reasoning (RQ) describes the ability to reason using basic mathematical
knowledge, including basic computation and numerical reasoning.
Short-term memory/working memory. The broad ability of Gsm or short-term memory
has recently been re-conceptualized in light of neuropsychological and cognitive research in the
domain of working memory. While Schneider and McGrew (2012) use the term short-term
memory in their discussion of CHC theory, within the WJ IV manual, McGrew et al. (2014)
update the broad factor by naming it short-term working memory (Gwm). The new
conceptualization of short-term memory continues to include the narrow abilities previous
identified, Memory Span (MS) and Working Memory Capacity (MW). Memory span is defined
as the ability to attend to, maintain, and reproduce information from memory immediately
following its presentation. Working memory capacity also includes the ability to attend to and
maintain information, but reflects the capacity for mental manipulation of information before
producing a response. Schneider and McGrew (2012) also note that it involves simultaneously
inhibiting distracting information and performing controlled searches for additional information
for memory. The shift from incorporating working memory into a broad, rather than narrow
factor recognizes the higher-order function of working memory, which broadly encompasses
tasks involving various levels of processing in the memory system (McGrew et al., 2014). A
second update included in the WJ IV technical manual is the addition of Attentional Control
(AC) as a narrow ability (McGrew et al., 2014). Attentional control refers to the ability to
allocate attention efficiently to focus on a task, while ignoring irrelevant stimuli. The authors
note that this ability has been referred to using various terms included focal attention, focus,
control of attention, executive controlled attention, or executive attention. The addition of this
ability reflects substantial research in the cognitive and neuropsychological literature.
30
Processing speed. Within the domain of processing speed, Schneider and McGrew
(2012) outline five narrow abilities. Perceptual Speed (P) is described as the keystone ability of
processing speed, involving visual scanning and discriminating for identical visual figures. In
fact, the authors note that perceptual speed may qualify as an intermediate stratum ability,
comprised by four lower-order abilities including pattern recognition, scanning, memory, and
complex. The second narrow ability is Rate of Test-Taking (R9). This ability is described as the
rate at which one can complete simple, overlearned tasks. Speed in completing learned tasked is
divided into three categories. Number Facility (N) is described as the ability to rapidly perform
basic arithmetic computations with accuracy. Reading Speed (RS) is defined as the ability to
read text for comprehension fluently and automatically. Finally, Writing Speed (WS) refers to
the rate at which one can copy or compose words or sentences.
Auditory processing. In the domain of auditory processing, Schneider and McGrew
(2012) list eight narrow abilities. The first narrow ability, Phonetic Coding (PC) is perhaps the
most frequently assessed by psychologists. In fact, the authors state, “…psychologists are more
interested in a narrow ability (phonetic coding) than in the broad ability” (p. 132). Whereas
auditory processing refers to the ability to recognize and process all auditory information (e.g.
music, sound), phonetic coding refers specifically to the ability to recognize distinct phonemes.
In the academic literature, this skill has been also been referred to as phonemic awareness or
phonological processing. A similar but distinct skill, Speech Sound Discrimination (US), refers
to the ability to the awareness of non-phonemic aspects of speech (e.g. tone, timbre, and pitch).
A third ability is called Resistance to Auditory Stimulus Distortion (UR). This ability refers to
one’s capacity for understanding speech in the presence of background noise or other distortion.
The fourth narrow ability, Memory for Sound Patterns (UM) includes a memory load and refers

31
to the ability to retain auditory information within short-term memory. The following three
abilities are particularly pertinent to music. These abilities include Maintain and Judging Rhythm
(U8), the ability to distinguish and maintain a musical beat; Musical Discrimination and
Judgment (U1 U9), the ability to analyze tonal qualities of music, including harmony and
complexity; and Absolute Pitch (UP), the ability identify musical pitch with perfect accuracy.
The last narrow ability, Sound Localization (UL), refers to the ability to identify the location of
sounds in space.
Long-term storage and retrieval. A vast array of narrow abilities fall under the domain
of long-term storage and retrieval. Twelve abilities are listed as well-supported by Schneider and
McGrew (2012), with limited research supporting a previously hypothesized 13th ability,
Learning Abilities (Newton & McGrew, 2010). The narrow abilities have been conceptually
grouped into the categories of learning efficiency and retrieval fluency, to represent abilities
related to the processes of storage and retrieval, respectively. Within the category of learning
efficiency, Associative Memory (MA) is defined as the ability to recall pairs of items without
any meaningful relationship (e.g., wall and hat). In contrast, Meaningful Memory (MM) refers to
the ability to recall information in the context of meaningful relationships (e.g., a cohesive story).
A third memory ability, Free-Recall Memory (MA6) represents the ability to recall information
presented in a discrete list (e.g., 12 unrelated words).
The following nine abilities involve the retrieval of learned information from memory.
Schneider and McGrew (2012) organized these abilities conceptually in terms of retrieval of
ideas, words, or figures. Ideational Fluency (FI) refers to the ability to generate as many verbal
responses related to a word, idea, or phrase as possible. Likewise, Associational Fluency (FA) is
related to the ability to generate responses to words, ideas, or phrases, but the quality of content
32
is evaluated, rather than simply the quantity of responses (Newton & McGrew, 2010).
Expressional Fluency (FE) is the ability to express of the same information in unique ways (e.g.,
generate various phrases that mean you feel tired). In a more applied context, the Sensitivity to
Problems/Alternative Solution Fluency (SP) ability is described as the ability to produce
alternative solutions to a particular problem (e.g., name ways a person can save money on
everyday expenses). Relatedly, the Originality/Creativity ability (FO) requires the ability to
produce flexible and unique responses to a given situation or task. This ability has been related to
the broad construct of creativity. Two word-related retrieval skills has been identified. The first
is Naming Facility (NA), which refers to the ability to rapidly retrieve the name of an object,
color, or letter. The authors note that this task has been referred to as Rapid Automatic Naming
(RAN) within academic literature. The second word-related retrieval skill is Word Fluency
(FW). Word fluency refers to the ability to generate words by phonemic, structural, or
orthographic characteristics (Newton & McGrew, 2010). Finally, the two figure related retrieval
abilities consist of Figural Fluency (FF), the ability to draw as many unique figural marks as
possible in response to a visual stimulus, and Figural Flexibility (FX), the ability to create unique
visual solutions that require adherence to specific criteria.
The WJ IV battery names an additional narrow ability, Speed of Lexical Access (LA;
McGrew et al., 2014). This skill is defined as the ability to quickly retrieve information from
one’s lexicon, or verbal store. Although mentioned as a discrete skill from Naming Facility
(NA), the definition of NA also includes the term speed of lexical access. A possible distinction
is whether the task involves visual stimuli (NA) or not (LA).
Visual processing. Eleven narrow abilities are considered empirically well supported
(Schneider & McGrew, 2012). The first ability, Visualization (VZ), is described as the most
33
dominant visual processing ability. It refers to the utilization of mental manipulation, such as
rotation or transformation, in order to imagine how figures or patterns may appear. This skill is
contrary to the second ability, Speeded Rotation or Spatial Relations (SR), in that it is not a
measure of fluency. SR, then, refers to the ability to mentally rotate figures with speed and
accuracy. Closure Speed (CS) is described as the ability to recognize visual stimuli that is
incomplete is some aspect. The fourth ability, Flexibility of Closure (CF) refers to the skill
whereby an individual is able to recognize a pattern of object by ignoring extraneous visual
information. Similar to auditory processing, visual processing contains a narrow ability with a
memory component, named Visual Memory (MV). MV is defined as the ability to store a
complex visual image in memory and recall or recognize it after a short delay. The sixth ability,
Spatial Scanning (SS) is the ability to visualize a route out of a maze or visual field. The seventh,
Serial Perceptual Integration (PI) refers to the ability to recognize a complete object after pieces
of the object are presented in rapid order. The next three abilities are relatively straightforward:
Length Estimation (LE) is simply the ability to visually estimate or judge the length of an object;
Perceptual Illusions (IL) is the ability to resist visual illusions; and Perceptual Alternations (PN)
is the rate at which one can switch between alternating visual perspectives, rather than becoming
fixed on one perspective. The final narrow ability, Imagery (IM) refers broadly to the ability to
mentally visualize complex visual images and spatial location.
The Woodcock Johnson Battery
As stated previously, contemporary measures of intelligence have demonstrated
alignment with multiple broad abilities (Keith & Reynolds, 2010). The Woodcock Johnson Tests
of Cognitive Abilities is unique in that it has been developed and evaluated within the context of
CHC theory since the second edition of the instrument, the Woodcock-Johnson Psycho-

34
Educational Battery-Revised (WJ-R; Woodcock, Johnson, & Mather, 1989). Much previous
research has been conducted on the subsequent edition, the Woodcock Johnson Tests of
Cognitive Abilities, Third Edition (WJ III; Woodcock et al., 2001). The fourth edition of the
instrument, published in 2014, provides factor analytic validation to support its adherence to
contemporary CHC theory. The subtests of the WJ IV COG and the associated broad and narrow
abilities are outlined in Table 2 below. Additionally, the relevant broad and narrow abilities are
provided for the Woodcock-Johnson IV Tests of Oral Language, a cognitive lingusitc battery (WJ
OL; Schrank, Mather, & McGrew, 2014b; see Table 3). In viewing the associations between
cognitive subtests and CHC abilities, two important conclusions can be made. First, despite the
theoretically-based nature of the battery, not all hypothesized narrow abilities are represented in
this comprehensive intelligence test. Second, the overlap between distinct narrow abilities, and
even broad abilities, is apparent for a variety of tasks.
Table 2.2
WJ IV COG Subtests and Abilities
Subtest Name Broad Ability Narrow Ability
1. Oral Vocabulary Gc Lexical Knowledge (VL)
Language Development (LD)
2. Number Series Gf Quantitative Reasoning (RQ)
Induction (I)
3. Verbal Attention Gwm Working Memory Capacity (WM)
Attentional Control (AC)
4. Letter-Pattern Matching Gs Perceptual Speed (P)
5. Phonological Processing Ga Phonetic Coding (PC)
Word Fluency (Glr-FW)
Speed of Lexical Access (Glr-LA)
6. Story Recall Glr Meaningful Memory (MM)
Listening Ability (Gc-LS)
7. Visualization Gv Visualization (Vz)
8. General Information Gc General Information (K0)
9. Concept Formation Gf Induction (I)
10. Numbers Reversed Gwm Working Memory Capacity (WM)
Attention Control (AC)

35
11. Number-Pattern Matching Gs Perceptual Speed (P)
12. Nonword Repetition Ga Phonetic Coding (PC)
Memory for Sound Patterns (UM)
Memory Span (Gwm-MS)
13. Visual-Auditory Learning Glr Associative Memory (MA)
14. Picture Recognition Gv Visual Memory (MV)
15. Analysis-Synthesis Gf General Sequential Reasoning (RG)
16. Object-Number Sequencing Gwm Working Memory Capacity (WM)
17. Pair Cancellation Gs Perceptual Speed (P)
Spatial Scanning (Gv-SS)
Attentional Control (Gwm-AC)
18. Memory for Words Gwm Memory Span (MS)
Table 2.3
WJ IV OL Subtests and Abilities
Subtest Name Broad Ability Narrow Ability
1. Picture Vocabulary Gc Lexical Knowledge (VL)
Language Development (LD)
2. Oral Comprehension Gc Listening Ability (LS)
3. Segmentation Ga Phonetic Coding (PC)
4. Rapid Picture Naming Glr Naming Facility (NA)
Speed of Lexical Access (LA)
5. Sentence Repetition Gwm
Gc
Memory Span (MS)
Listening Ability (LS)
6. Understanding Directions Gwm
Gc
Working Memory Capacity (WM)
Listening Ability (LS)
7. Sound Blending Ga Phonetic Coding (PC)
8. Retrieval Fluency Glr Speed of Lexical Access (LA)
Ideational Fluency (FI)
9. Sound Awareness Ga Phonetic Coding (PC)
One benefit of a theoretically-based test of cognitive abilities is that it facilitates research
identifying the cognitive correlates that underlie various academic skills (Schrank, Miller,
Wendling, & Woodcock, 2010). Research comparing subtests on the Woodcock Johnson Tests of
Achievement, Third Edition (WJ III ACH; Woodcock et al., 2001) and the cognitive battery has
36
provided insight into the relationships between various cognitive factors and academic skills.
Research focusing specifically on math achievement is discussed below.
Math Achievement Using Versions of the WJ COG and ACH
Floyd et al. (2003) investigated the relationship between cognitive variables and math
achievement using the WJ III standardization sample. The analysis focused on identifying the
cognitive abilities related to math calculation and math reasoning skills using multiple regression
analyses. The Math Calculation composite on the WJ III consists of two subtests, Math Fluency
(a timed test of simple math facts) and Calculation (an untimed test of simple and complex
computations). Results showed that math calculation had a strong relationship with processing
speed (Gs) from age 7 to 15. Moderate relationships were found with auditory processing (Ga)
from ages 6 to 7, long term retrieval (Glr) from ages 6 to 8 and crystalized intelligence (Gc)
between ages 10 and 19. These results may reflect the transition between early years where math
facts are not yet automatized, but are counted out or solved by recalling newly learned strategies,
to later years when children have committed math facts to memory.
A second study using the Math Calculation composite of the WJ III was conducted by
Proctor et al. (2005). This study examined the differences between the cognitive profiles of 68
school-age low achievers in math (children with standard scores below 85) and typically
achieving peers (standard scores above 90). Interestingly, there were no significant differences
between the cognitive profiles of children in the low achieving group and children in the typical
group. The researchers commented that the low achieving children represented a diverse group,
with half of the children exhibiting one deficit in a cognitive domain with no clear pattern. The
researchers also hypothesized that these findings may be related to non-cognitive factors
37
resulting in poor achievement, the exclusion of low achievers in math who were also low
achievers in reading, or due to the true heterogeneity of low achieving students as a group.
More recently, Taub et al. (2008) utilized structural equation modeling to compare the
relationships between cognitive abilities and math achievement. Math achievement was
represented by the Quantitative Knowledge composite, a score derived from performance on the
Math Calculation and Applied Problems subtests. Direct effects of fluid reasoning (Gf),
crystalized intelligence (Gc), and processing speed (Gs) were observed across all age groups.
However, as math skills were combined into one composite, unclear is the extent to which
abilities are specifically related to math calculation and/or math fluency skills.
McGrew and Wendling (2010) summarized the extant research on cognitive and
achievement relationships in the context of CHC theory. Based on an analysis of this research,
the authors determined the following broad abilities have medium significance in the prediction
of math calculation skill: comprehension knowledge (Gc), fluid reasoning (Gf) and processing
speed (Gs). In terms of narrow abilities, phonological processing (Ga-PC) had a medium
significance for children ages 6-13, and perceptual speed (Gs-P) had a high level of significance
for all ages, as did working memory (Gsm-MW). As mentioned previously, the significance of
phonological processing impacting math calculation in young children may reflect the role of
counting in early computational skills. The authors note that the process of counting requires the
retrieval of phonological codes. The perceptual speed finding was hypothesized to reflect a skill
in subitizing or in instantly recognizing the value of numbers. Finally, working memory as a
predictor of calculation ability is consistent with results of previous research both using the WJ
and other measures of working memory.
38
One key conclusion from this summary was the importance of further research
demonstrating the relationship between narrow cognitive abilities and achievement. The results
of this study show that narrow abilities may sometimes be significant, even when the broad
ability is not (e.g., a significant finding for Ga-PC, but not Ga). Understanding the relationships
among narrow abilities and areas of achievement is also beneficial for both practitioners and
researchers in determining tasks that can accurately assess for areas of particular strength and
weakness.
Proposed Study
At present, there are no published studies using the Woodcock Johnson assessment
battery that have investigated the relationship between cognitive abilities and math fact fluency.
The theoretically and psychometrically improved WJ IV assessment battery provides the
opportunity to examine this academic skill in the context of contemporary CHC theory. Given
that recent research has identified math fact retrieval as a specific area of weakness for some
students, it is important to understand the cognitive correlates associated with this skill to inform
assessment and intervention. With the increasing popularity of academic and cognitive screening
measures in schools to identify children for targeted services, it is important that educators are
selecting measures that assess the fundamental cognitive predictors of later academic
performance. Screening instruments that reflect known cognitive correlates of academic
difficulties are necessary to improve the accuracy in which children are identified for services
and to ensure that assessment practices are time and cost efficient. Furthermore, understanding
the abilities related to math fluency can inform the development of evidence-based interventions
by tailoring the skills taught in order to remediate specific weaknesses. With knowledge of the
39
relationships among cognitive abilities and achievement, interventions may also be designed to
teach students alternative strategies that circumvent areas of weakness.
Studies demonstrating a link between math fluency deficits and phonics, rapid
automatized naming, and executive control have revealed a complex array of factors that may
contribute to such deficits. Using a child-aged subgroup of the standardization sample, the
proposed research will utilize path analysis to examine the relationships between broad and
narrow cognitive abilities and math fact fluency. The math fact fluency test of the WJ IV ACH
assesses an individual’s ability to quickly and accurately answer simple addition, subtraction,
and multiplication problems within a three minute time period. This research seeks to clarify the
relationships between math fluency and fluid reasoning, crystalized intelligence, working
memory, and processing speed, as well its relationship with perceptual speed, number facility,
phonetic coding, naming facility, and attentional control. A hypothesized relationship between
math problem solving abilities and math fact fluency performance will also be evaluated.
40
CHAPTER III
METHODS
Sample and Participants
Data Source
A formal request to obtain the WJ IV COG, OL, and ACH standardization data was
submitted to Houghton Mifflin Harcourt. The request included information regarding the name
and purpose of the study and the proposed method. Following approval, the primary
investigators signed a licensing agreement outlining the conditions of use. Subsequent to
Duquesne University Institutional Review Board (IRB) approval, an electronic SPSS file
containing the de-identified data was transmitted to the primary investigator.
The WJ IV technical manual (McGrew et al., 2014) details the normative sample, which
represents a large, geographically diverse stratified sample aligned with demographics of the
2010 U.S. census. The sampling process was stratified based on the following variables: census
region, sex, country of birth, race, ethnicity, community type, parent education, type of school
(K-12 sample), type of college (college sample), educational attainment (adult sample), and
employment status (adult sample). Data were collected from 7,416 individuals aged 24 months to
90 years. Within this group, there were 3,891 students from kindergarten through grade 12. The
authors note that the school-age sample was purposefully denser than other age groups, as
childhood and adolescence represent a time of growth in cognitive and academic skills.
Procedures Used to Collect the Standardization Data
Data for the standardization sample were collected over 25 months. The assessment
batteries were administered by recruited examiners who demonstrated proficiency during
training on the administration of the WJ IV battery. Completed protocols were reviewed by
41
project staff for completion and accuracy. Due to the lengthy nature of the battery, which
included 18 cognitive tests, nine oral language test, 20 achievement tests, and four research tests,
a planned incomplete data collection design was used. Specifically, the authors utilized a
Multiple Matrix Sampling (MMS) design. The use of MMS in large-scale data collection is
prevalent across educational, health, and business research and has more specifically been
evaluated in terms of cognitive assessment (Rhemtulla & Little, 2012). The normative study
employed a partial matrix sampling plan, which involved the administration of a core group of
subtests to each participant along with an additional set of subtests administered only to certain
groups of participants. McGrew et al. (2014) report that 18 tests were chosen for the core group
based on previous WJ-R and WJ III research indicating strong representativeness of the broad
CHC cognitive factors, and the academic areas of reading, math and writing. Complete records
for each participant were generated by a statistical software program utilizing a Bayesian
Multiple Imputation method. Ten complete data sets were generated, and one was randomly
chosen as normative sample.
From here, weights were added for individual examinees to correct for differences
between the sample and the demographic characteristics of the U.S. population. The construction
of test norms utilized a bootstrap resampling procedure. Simply stated, this procedure involves
the computerized generation of additional samples to the original pool in order to estimate the
population distribution. The authors state that 250 resamples were generated for the norming
process. Using this data, percentiles were calculated and norm curves were generated, allowing
for the calculation of standard scores and percentile ranks.
Participants
For the present study, a total of 4,212 children and adolescents aged 6:0 to 19:11 were

42
included in this study’s analyses. This age group was chosen for the purpose of comparing the
current investigation to previous research utilizing the same age range (e.g., McGrew &
Wendling, 2010). Additionally, this age group would allow comparison of the current results to
those presented in the WJ IV technical manual (McGrew et al., 2014).
Measures
The WJ IV battery is a comprehensive assessment system used to measure the cognitive
abilities, oral language, and academic achievement of individuals ages 2 to 90+ years old. The
fourth edition of the Woodcock Johnson system was created to reflect updates to the most
current theory of overall intelligence according to contemporary CHC theory. Improvements to
the new edition of the WJ IV COG include increased cognitive complexity on subtests, higher
correlations with ability scores on the WISC-IV, and a revised theoretical basis for the inclusion
of working memory and memory of sound patterns as cognitive constructs (McGrew et al.,
2014). The WJ IV ACH also underwent revisions to the structure of the battery, with new
subtests and clusters representing an increased breadth of content.
Another major revision of the WJ IV battery is the addition of a separate battery
assessing language specific abilities, the WJ IV Tests of Oral Language. The OL measure is
comprised of language-based tasks formerly found on the WJ COG and ACH, as well as newly
adopted tasks. The battery can be used to provide diagnostic information about specific
cognitive-linguistic abilities as well as achievement in expressive language and listening
comprehension. The reliability and validity of these batteries is discussed below.
Reliability
Standard error of measurement (SEM) values and reliability coefficients were reported
for all subtest and cluster scores within the WJ IV battery. In the context of Classical Test
43
Theory, reliability coefficients (r11) represent the ratio of true score variance to observed score
variance (Raykov & Marcoulides, 2011). Reliability coefficients are reported as decimals
between 0 and 1, with values closer to 1 representing more precise measurement. The reliability
coefficient for each non-timed test is reported for each age group (for each age 2-19 individually
and groups of 10 thereafter; e.g., 20-29, 30-39, etc.), in addition to the test’s median reliability
coefficient. Thirty-eight of the 39 non-timed tests of the WJ IV had median reliability
coefficients above the desired .08 cutoff. Reliability coefficients ranged from .74 to .97
(McGrew et al., 2014), with Picture Recognition (WJ COG 14; r11 = .74) representing the only
test to fall below .80. For eight of the timed tasks of the WJ IV, test-retest reliability was
calculated (r12). The reliability coefficients ranged from .76 to .95, with six of the eight tests
above .08. Notably, the test-rest reliability of the Rapid Picture Naming subtest fell just below
the .80 threshold, with a value of .79.
The WJ IV battery provides a number of cluster scores that can be obtained representing
general cognitive ability (General Intellectual Ability, Brief Intellectual Ability, Gf-Gc
Composite), broad abilities (Gc, Gc-extended, Gf, Gf-extended, Gwm, Gwm-extended, Gs, Ga,
Glr, Gv), as well as several other narrow abilities, conceptual groupings, and academic clusters
(e.g., perceptual speed, cognitive efficiency, reading comprehension). Reliability coefficients of
the cluster scores ranged from .86 to .99, with the majority of coefficients exceeding .90.
Alternate forms reliability was reported for the speeded tests on each of the three
alternate WJ ACH forms. Alternate forms reliability coefficients across all speeded tasks ranged
from .76 to .96. The Math Facts Fluency subtest had reliability coefficients equal to .95 and .97,
in a sample of students aged 7-11 and 14-17, respectively. A second evaluation of the speeded
ACH tests was conducted to ensure that item difficulty was equivalent across the three forms.
44
The three forms of Math Facts Fluency subtest was administered in counterbalanced order to a
group of students in grades 3 and 4 and a group of students in grades 9 through 12. The
correlations among forms ranged from .94-.95 in the younger grades and .92-.94 in the older
grades. An examination of the Sentence Reading Fluency subtest with these age groups revealed
correlations that ranged from .85-.88. The non-speeded tests of the WJ IV ACH were
systematically evaluated for equivalent item content and difficulty across three alternate forms.
Validity
The WJ IV technical manual (McGrew et al., 2014) provides evidence for the content,
internal, and concurrent validity of the assessment. As mentioned above, the WJ IV battery was
developed in the context of contemporary CHC theory in a manner similar to its predecessors
(WJ III, WJ-R). Subtests were designed to measure a single narrow ability, and clusters were
constructed by combining subtests measuring distinct narrow abilities to provide sufficient
coverage of the theoretical broad ability. While the WJ COG and OL tap the seven broad
abilities named previously (Gc, Gf, Gwm, Gs, Ga, Glr, Gv), the ACH battery measures the broad
abilities of quantitative knowledge (Gq), reading and writing (Grw), and domain specific
knowledge (Gkn), with the goal of providing broad coverage of academic skills relevant to needs
of individuals conducting psychoeducational assessment. McGrew et al. (2014) state that many
of the WJ IV subtests that appeared in the WJ III have been supported through independent
evaluations in the context of CHC theory.
Content Validity. For the WJ IV, the authors conducted multidimensional scaling
(MDS) analyses to demonstrate the content validity of the constructs measured by the battery.
Using the correlations among 51 WJ IV subtests (including research tests), the authors utilized a
Guttman Radex two-dimensional MDS procedure for the analysis of six different age groups (3-

45
5, 6-8, 9-13, 14-19, 20-39, 40-90+). A summary of these analyses revealed that the constructs
tended to cluster similarly to the organization of the three batteries. The ACH battery fell into
Grw and Gq domains in the upper right quadrant, while the OL battery fell into an auditory-
linguistic grouping in the upper left. The COG battery spanned the lower left and right quadrants
(figural-visual and cognitive efficiency speed), in addition to the upper left quadrant (auditory-
linguistic). Interestingly, while speeded academic measure fell into the same conceptual
grouping as the processing speed measures (the speed-fluency group), the academic fluency
measures clustered separately within the upper right quadrant along with the other ACH
measures.
Internal Validity. To demonstrate the internal structure of the WJ IV, the test authors
generated the intercorrelations among all tests and clusters, again using the six age ranges
described previously. Correlations were higher among tests that fall into related CHC domains
(e.g., one Gc test is more highly correlated with a second Gc test than a Gs test). The same
pattern was found for areas of achievement that fall in similar compared to dissimilar domains.
Second, the authors completed a three-step psychometric evaluation of the internal
structure of the WJ IV utilizing exploratory and confirmatory factor analysis. The first step
involved a split-sample random sample generation. Again dividing the sample into six age
ranges, the groups were randomly split in half. The first group was named the model
development group. This group served as the sample for the exploratory analyses. The first
exploratory analysis was a cluster analysis (CA). The authors utilized Ward’s hierarchical
minimum variance CA, which is a technique that sorts highly correlated variables (i.e., tests),
which are then merged into larger groups. Groupings aligned with the CHC framework, with all
seven broad cognitive factors and two achievement factors (Gq and Grw) present. Just as in the
46
MDS analysis, the ACH fluency measures once again fell in the broad cognitive domain of Gs,
however, they were organized in a distinct group from the Gs-COG tests.
Next, an exploratory principle components analysis (PCA) was conducted with the model
development age groups. The authors state that varimax rotation was chosen due to the high
degree of multicolinearity existing amongst the tests, in addition to other complicating factors of
oblique solutions, including the potential removal of tests in the final solution (McGrew et al.,
2014). The number of components extracted ranged from six to 10, which was informed by the
results of the CA. The 8, 9, and 10 factor solutions were determined to be most interpretable. In
summary of all the analyses, the broad cognitive factors of Gc, Gs, and Gwm appeared
throughout. Additionally Gf appeared in a mixed COG-ACH factor alongside Gq. Finally, Grw
appeared as a standalone ACH factor. The broad cognitive ability Ga appeared in the nine and 10
factor solutions, while the remaining broad abilities Glr and Gv appeared in varying forms across
the solutions, either combined with a other broad abilities or represented by subsumed narrow
abilities (e.g., Glr-Retention abilities, Gv-MV/MA).
A third exploratory analysis was conducted on the model development groups using
MDS. The results of this analysis are similar to those described above in regards to content
validity. Using the results of these three exploratory analyses, three models to be used in
confirmatory analysis (CFA) were generated. The first model was a single factor model
representing the latent factor g. The second model was a top-down model including g as a higher
order factor and the broad cognitive and achievement abilities Gc, Grw, Gf, Gs, Gq, Gv, Glr,
Gwm, and Ga. The third model was a bottom-up model including three tiers: narrow abilities,
broad abilities, and g. Narrow abilities that were not supported were removed in favor of the
related broad ability. Four narrow abilities were included in the final model: Verbal Language-
47
Based Reasoning (Gf-Vbl), Quantitative Reasoning (Gf-RQ), Associative Memory (Glr-MA),
and Speed of Lexical Access (Glr-LA). Results indicated that model one did not fit the data as
well as model two or three. All parameters in models two and three were deemed positive,
significant, and meaningful (McGrew et al., 2014).
The third stage involved conducting a CFA using the model cross-validation samples to
compare to the model development samples. Both samples demonstrated very similar fit
statistics. Model fit indices were provided for models two and three across all six age groups
using both samples. The authors concluded that model two and three demonstrated comparable
fit for all ages 6 and above (McGrew et al., 2014). In terms of fit, the models resulted in RMSEA
(Root Mean Squared Error of Approximation) values ranging from 0.115 to 0.123 across age
groups, which is higher than desired (.05 or below). Additionally, the TLI (Tucker-Lewis non-
normed fit index) values ranged from 0.607 to 0.684, which is lower than desired (.90 or above).
However, both of these fit indices are reliant on maximum-likelihood estimation, which is
sensitive to violations of assumptions, including multivariate normality and multicollinearity. As
the data violates these assumptions, scale-free least squares (SFLS) fit indices were calculated.
The Adjusted Goodness of Fit Index (AGFI) calculated using SFLS resulted in acceptable fit
values (.956-.984).
Concurrent Validity. An investigation of the concurrent validity of the WJ IV battery
was conducted using various cognitive, oral language, and achievement measures. In an
evaluation of 174 students, correlations between the WJ IV COG and the WISC-IV demonstrated
a strong (.86) relationship between the overall intelligence as measured by the two assessments.
In addition, high correlations were found between general intellectual ability on the WJ COG
and the equivalent metric on the KABC-II (.77) and the SB-V (.80). Validation of the WJ OL
48
was performed with two commonly used language measures, the Clinical Evaluation of
Language Fundamentals, Fourth Edition (CELF-4; Semel, Wiig, & Secord, 2003), and the
Peabody Picture Vocabulary Test, Fourth Edition (PPVT-4; Dunn & Dunn, 2007). In general,
the clusters available on the WJ OL demonstrated moderate to high correlations (.60 to .70) with
the CELF-4 composites. However, exclusions were noted for the working memory composite,
which had low correlations with all measures in the older children group (10-18), and the speed
of lexical access domain. The authors note that the CELF-4 does not have comparable measure
on the latter ability. The correlations between the OL and the PPVT-4 resulted in a similar
pattern of generally moderate to high correlations. In terms of achievement, correlations among
the WJ ACH and the Wechsler Individual Achievement Test, Third Edition (WIAT-III; Wechsler,
2009) show moderate to strong relationships between related academic clusters (.60 or above).
The math fluency composite of the WIAT-III was highly correlated (.85) with the math
calculation cluster on the WJ ACH.
Research Questions and Hypotheses
Research Question 1
Within the child age subset of the standardization sample, which broad cognitive abilities
display significant effects on Math Facts Fluency performance?
Hypothesis 1: It is hypothesized that fluid reasoning will have a direct effect on Math
Facts Fluency.
Hypothesis 2: It is predicted that comprehension-knowledge will have a direct effect on
Math Facts Fluency.
Hypothesis 3: Working memory is hypothesized to have a direct effect on Math Facts
Fluency.

49
Hypothesis 4: Processing speed is predicted to have a direct effect on Math Facts
Fluency.
Hypothesis 5: It is hypothesized that General Intellectual Ability will have an indirect
effect on Math Facts Fluency performance.
Research Question 2
Which narrow abilities have significant effects on performance on the Math Facts
Fluency subtest?
Hypothesis 1: It is hypothesized that perceptual speed will have a direct effect on Math
Facts Fluency.
Hypothesis 2: Number facility will have a direct effect on Math Facts Fluency.
Hypothesis 3: Phonetic coding will have a direct effect on Math Facts Fluency.
Hypothesis 4: It is predicted that naming facility will have a direct effect on Math Facts
Fluency.
Hypothesis 5: It is hypothesized that attentional control will a direct effect on Math Facts
Fluency.
Research Question 3
What relationship will math problem solving abilities have with math fluency
performance?
Hypothesis 1: It is hypothesized that performances on the Math Problem Solving cluster
will have a direct effect on Math Facts Fluency performance.
Data Analysis
This study used path analysis, a statistical technique that falls in the Structural Equation
Modeling (SEM) family. Path analysis is unique to other SEM techniques in that it may be used
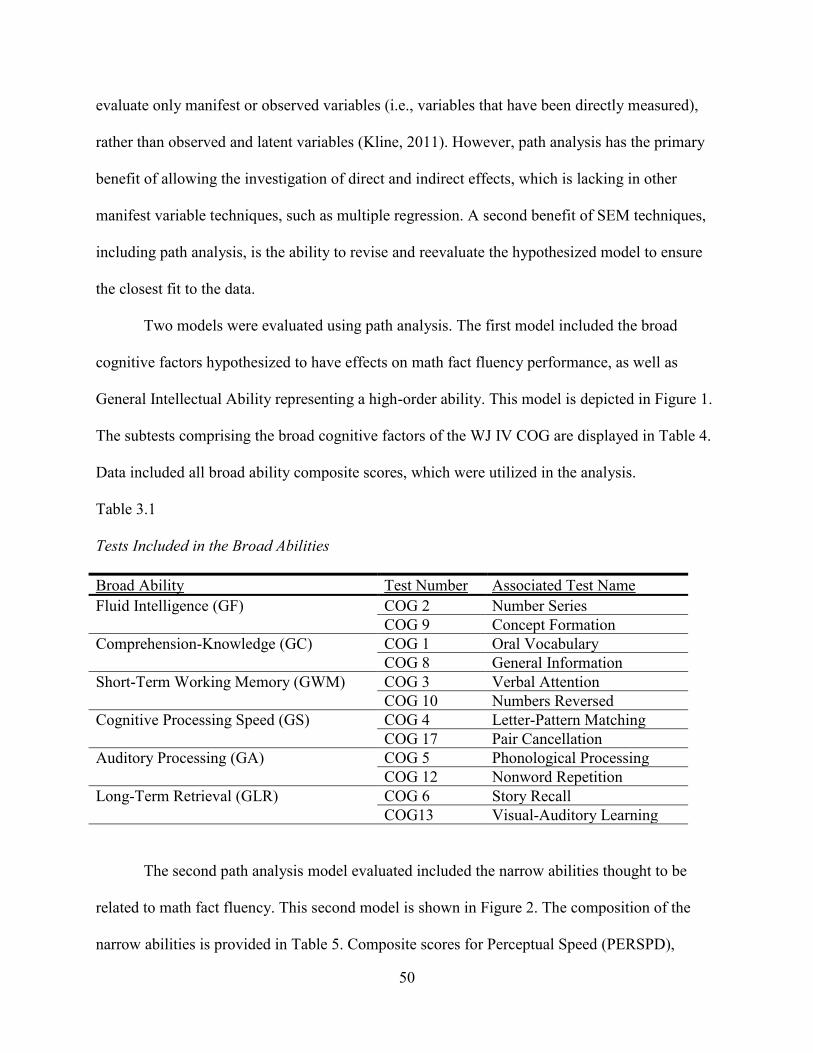
50
evaluate only manifest or observed variables (i.e., variables that have been directly measured),
rather than observed and latent variables (Kline, 2011). However, path analysis has the primary
benefit of allowing the investigation of direct and indirect effects, which is lacking in other
manifest variable techniques, such as multiple regression. A second benefit of SEM techniques,
including path analysis, is the ability to revise and reevaluate the hypothesized model to ensure
the closest fit to the data.
Two models were evaluated using path analysis. The first model included the broad
cognitive factors hypothesized to have effects on math fact fluency performance, as well as
General Intellectual Ability representing a high-order ability. This model is depicted in Figure 1.
The subtests comprising the broad cognitive factors of the WJ IV COG are displayed in Table 4.
Data included all broad ability composite scores, which were utilized in the analysis.
Table 3.1
Tests Included in the Broad Abilities
Broad Ability Test Number Associated Test Name
Fluid Intelligence (GF) COG 2 Number Series
COG 9 Concept Formation
Comprehension-Knowledge (GC) COG 1 Oral Vocabulary
COG 8 General Information
Short-Term Working Memory (GWM) COG 3 Verbal Attention
COG 10 Numbers Reversed
Cognitive Processing Speed (GS) COG 4 Letter-Pattern Matching
COG 17 Pair Cancellation
Auditory Processing (GA) COG 5 Phonological Processing
COG 12 Nonword Repetition
Long-Term Retrieval (GLR) COG 6 Story Recall
COG13 Visual-Auditory Learning
The second path analysis model evaluated included the narrow abilities thought to be
related to math fact fluency. This second model is shown in Figure 2. The composition of the
narrow abilities is provided in Table 5. Composite scores for Perceptual Speed (PERSPD),

51
Number Facility (NUMFAC), and Phonetic Coding (PHNCOD) were all provided within the
dataset. The hypothesized narrow ability called Rapid Picture Naming (RPCNAM) was
measured by just one subtest; therefore this subtest was used to represent this narrow factor. No
composite for Attention Control (ATTCRL) is currently available. However, according to the WJ
IV manual, three subtests: Verbal Attention, Numbers Reversed, and Pair Cancellation, measure
this narrow ability. For the current study, an Attention Control composite score was created
using the subtests Verbal Attention and Pair Cancellation. The Numbers Reversed subtest was
excluded, as it appears in the Number Facility (NUMFAC) factor. The Attentional Control
composite is therefore a mean of the two aforementioned subtests. Although this process resulted
in decreased variance as compared to the other composite scores, it allowed all variables to exist
on a common standard score scale. In order to answer the final research question, the Math
Problem Solving cluster, which is comprised of the applied problem and number matrices
subtests on the WJ ACH, was added to the best fitting model.
Table 3.2
Tests Included in the Narrow Abilities
Narrow Ability Test Number Associated Test Name
Perceptual Speed (PERSPD) COG 4 Letter-Pattern Matching
COG 11 Number-Pattern Matching
Number Facility (NUMFAC) COG 10 Numbers Reversed
COG 11 Number-Pattern Matching
Phonetic Coding (PHNCOD) OL 3 Segmentation
OL 7 Sound Blending
Rapid Picture Naming (RPCNAM) OL 4 Rapid Picture Naming
Attention Control (ATTCRL) COG 3 Verbal Attention
COG 17 Pair Cancellation
Data were first imported into SPSS Version 24 for preliminarily analyses. The dataset
was first analyzed for missing data. Cases with missing data on any of the variables within the
52
models were excluded from analysis. All variables within the dataset are provided as standard
scores, with a mean of 100 and a standard deviation of 15. As described below, data were
examined for univariate and multivariate normality, as well as univariate outliers. Additionally,
data were inspected for collinearity and homoscedasticity. Next, the dataset was imported into
the R Studio program, running R version 3.1.2 along with the lavaan 0.5-17 package (Yves
Rosseel, 2012).
Estimation Method
Within structural equation modeling techniques, the estimation method refers to the
algorithm used to generate parameter estimates. The Maximum Likelihood (ML) method is
suitable for most studies and is the default method in R (Kline, 2011). However, ML has strict
requirements. First, it is a full-information method, meaning that all parameter estimates are
calculated simultaneously; therefore, ML requires a complete dataset, absent of missing data.
The ML method also assumes that all variables are continuous variables that are normally
distributed. According to Kline (2011), ML may result in inaccurate estimates if variables are
standardized. Therefore, an alternative estimation method was chosen for this study. Fully
Weighted Least Squares (WLS) estimation is a family of methods that provide alternatives to
ML. Within the lavaan package, alternative methods include Generalized Least Squares (GLS),
Weighted Least Squares (WLS), Diagonally Weighted Least Squares (DWLS), and Unweighted
Least Squares (ULS). Additionally, robust variations can be used that correct for non-normal
standard errors. Given the standardized scores within the dataset, the WLSMVS (Weighted Least
Squares with robust standard errors and a Mean and Variance adjusted test statistic). This
method uses the Satterthwaite approach, which does not assume equal variances (Satterthwaite,
1946). In R, fit statistics are provided using a Diagonally Weighted Least Squares (DWLS)

53
partial-information method as well as the robust formula that accounts for mean and variance
adjustments. The latter corrects for bias in the fit statistics inherent in utilizing a partial-
information method (Li, 2016).
Alternative Models
After accepting a final model, one must consider the possibility that an alternative model
may explain the data equally well. Models that produce equivalent fit indices are referred to as
equivalent models (Kline, 2011). It is incumbent on the researcher to identify equivalent models
and provide an argument for the theoretical model. However, near-equivalent models, those that
produce a similar, but different, covariance matrix may just as easily prove a threat to the
proposed model (Kline, 2011). The first alternative model considered aligns with the Catell and
Horn theory of intelligence, which posits that Fluid Reasoning (GF) and Comprehension-
Knowledge (GC) are at the crux of general ability. Although the Cattell-Horn-Carroll aligns
other broad abilities, such as Working Memory and Processing Speed, on the same stratum of
ability, some remnants of this theory remain. For example, the most recent iteration of the
WISC-V continues to put the greatest weight on Verbal Comprehension and Fluid Reasoning
when calculating the Full Scale IQ (Wechsler, 2014). Therefore, the first alternative model
identified Comprehension Knowledge and Fluid Reasoning as higher-level abilities between
General Ability and Working Memory and Processing Speed. Paths remained between Math
Facts Fluency and all other variables (see Figure 3).
A second alternative model was created by changing the directionality between GIA and
the broad factors. This model was generated to test the theory that GIA is the most important
predictor of math fluency performance. Within this model, the broad variables were positioned
as higher-order variables that contribute to general ability (see Figure 4).
54
CHAPTER IV
RESULTS
Preliminary Statistics
Missing Data and Outliers
As stated previously, the purpose of this study was to investigate relationships among
cognitive abilities and math fact fluency performance in a child sample. The sample provided
contained 4,212 cases, which is the number of children aged 6 through 19 within the normative
sample. Of this sample, 23 cases contained missing data on at least one of the variables within
the study and were removed from the dataset. Next, the data were examined for univariate and
multivariate outliers in SPSS. Multivariate outliers were identified in a regression analysis by
calculating the Mahalanobis Distance statistic for each case. Because of the large sample size (n
> 500), a chi-square distribution was used to determine the cut-off value of 32.910 (p = .001).
Forty-nine cases were determined to be significant multivariate outliers and were excluded from
the sample. Data were also analyzed for univariate outliers. Each variable contained extreme
values (absolute value of 3 SD greater than the mean), representative of a standard score less
than 55 or above 145. However, when these cases were removed, a visual analysis of the q-q
plots indicated that the variables deviated from normal at the extreme ends of the distribution.
Therefore, these cases were included in the final sample. For all analyses, the sample size was
4,140. The mean age of final sample was 12.32 years (SD = 3.98).
Normality and Homoscedasticity
All variables were examined for univariate normality. Significant skew was characterized
by any variable that exceeded 3.0 on the ratio of the skewness statistic to the standard error
statistic (Kline, 2011). General Intellectual Ability (GIASTD) showed a significant negative
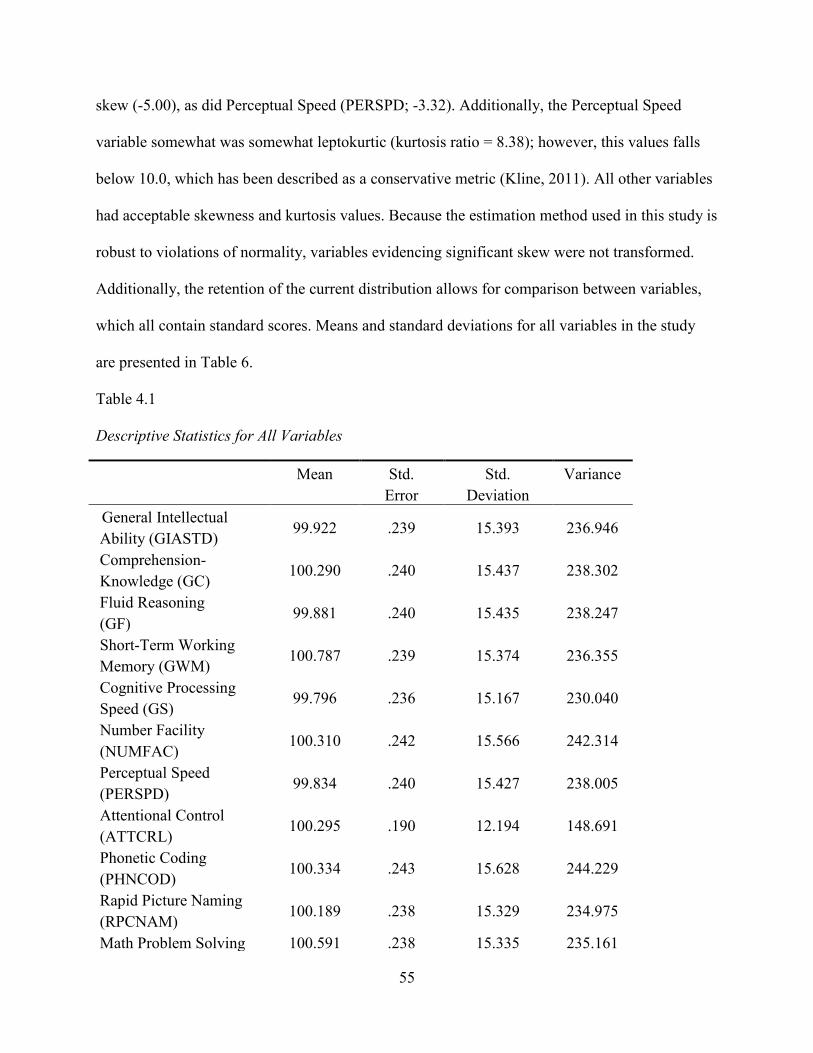
55
skew (-5.00), as did Perceptual Speed (PERSPD; -3.32). Additionally, the Perceptual Speed
variable somewhat was somewhat leptokurtic (kurtosis ratio = 8.38); however, this values falls
below 10.0, which has been described as a conservative metric (Kline, 2011). All other variables
had acceptable skewness and kurtosis values. Because the estimation method used in this study is
robust to violations of normality, variables evidencing significant skew were not transformed.
Additionally, the retention of the current distribution allows for comparison between variables,
which all contain standard scores. Means and standard deviations for all variables in the study
are presented in Table 6.
Table 4.1
Descriptive Statistics for All Variables
Mean Std.
Error
Std.
Deviation
Variance
General Intellectual
Ability (GIASTD) 99.922 .239 15.393 236.946
Comprehension-
Knowledge (GC) 100.290 .240 15.437 238.302
Fluid Reasoning
(GF) 99.881 .240 15.435 238.247
Short-Term Working
Memory (GWM) 100.787 .239 15.374 236.355
Cognitive Processing
Speed (GS) 99.796 .236 15.167 230.040
Number Facility
(NUMFAC) 100.310 .242 15.566 242.314
Perceptual Speed
(PERSPD) 99.834 .240 15.427 238.005
Attentional Control
(ATTCRL) 100.295 .190 12.194 148.691
Phonetic Coding
(PHNCOD) 100.334 .243 15.628 244.229
Rapid Picture Naming
(RPCNAM) 100.189 .238 15.329 234.975
Math Problem Solving 100.591 .238 15.335 235.161

56
(MTHPRB)
Math Facts Fluency
(MTHFLU) 99.994 .246 15.798 249.562
Finally, to examine homoscedasticity, two linear regressions were conducted using the
variables associated with the broad and narrow models. Within these analyses, normality
probability plots of the standardized residuals both showed a linear pattern of distribution.
Additionally, frequency charts of the standardized residuals both followed a normal distribution.
Correlation Analysis
Bivariate correlations were calculated for all variables included within the study (see
Table 7). All correlations were significant at the p = .001 level. As expected, Number Facility
(NUMFAC) and Perceptual Speed (PERSPD), which both contained the Number-Pattern
Matching subtest, were highly correlated (.851). Within the narrow factors model, this
collinearity was accounted for by a covariance path between the two variables. Additionally,
Processing Speed (GS) and Perceptual Speed were also highly correlated (.843). Both variables
also share a common subtest (Letter Pattern Matching). These variables were not within analyzed
within the same model, as one represents a broad factor and the other represents a narrow factor.
Finally, Working Memory (GWM) also exhibited strong correlations with Number Facility
(.738) and Attentional Control (.727). Again, both narrow factors contain a shared subtest with
the broad factor (Numbers Reversed and Verbal Attention, respectively), although collinearity
was avoided by separating broad and narrow factors into separate models.
General Intellectual Ability (GIASTD) had strong correlations with Fluid Reasoning
(GF), Working Memory, Number Facility, Attentional Control, and Math Problem Solving
(MTHPRB), as well as moderate correlations with all other variables. This is consistent with
CHC theory, which posits that General Intellectual Ability is a higher-level ability that
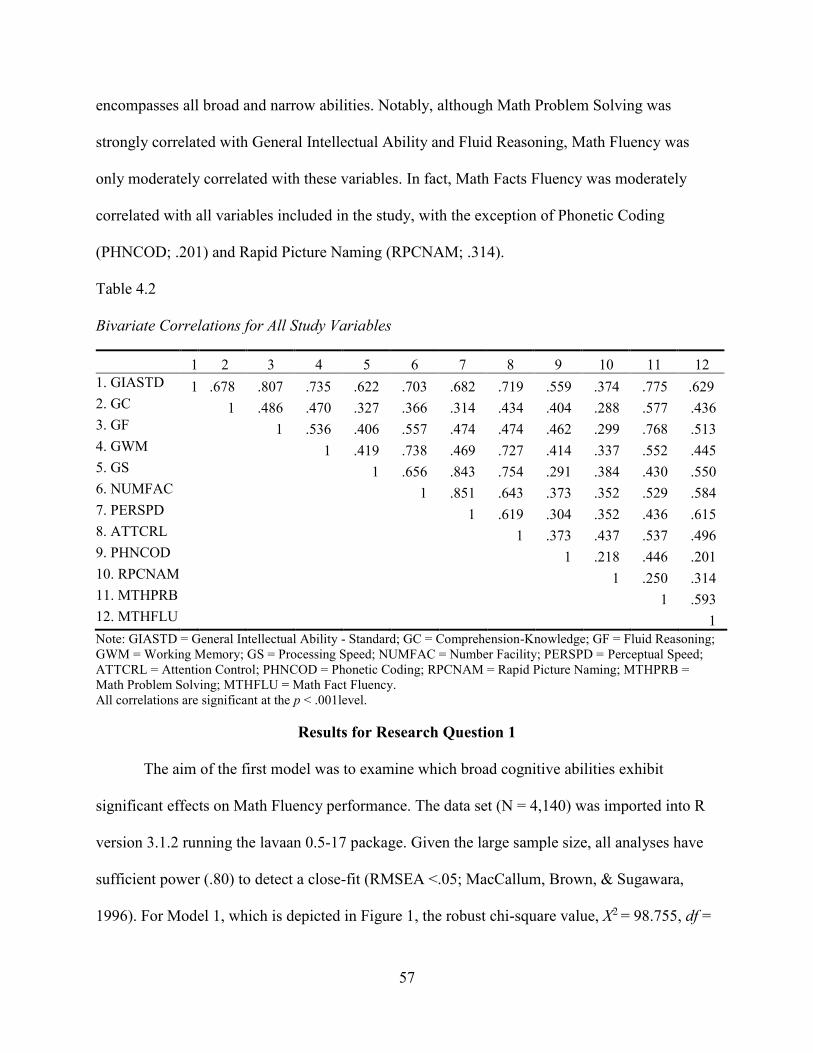
57
encompasses all broad and narrow abilities. Notably, although Math Problem Solving was
strongly correlated with General Intellectual Ability and Fluid Reasoning, Math Fluency was
only moderately correlated with these variables. In fact, Math Facts Fluency was moderately
correlated with all variables included in the study, with the exception of Phonetic Coding
(PHNCOD; .201) and Rapid Picture Naming (RPCNAM; .314).
Table 4.2
Bivariate Correlations for All Study Variables
1 2 3 4 5 6 7 8 9 10 11 12
1. GIASTD 1 .678 .807 .735 .622 .703 .682 .719 .559 .374 .775 .629
2. GC 1 .486 .470 .327 .366 .314 .434 .404 .288 .577 .436
3. GF 1 .536 .406 .557 .474 .474 .462 .299 .768 .513
4. GWM 1 .419 .738 .469 .727 .414 .337 .552 .445
5. GS 1 .656 .843 .754 .291 .384 .430 .550
6. NUMFAC 1 .851 .643 .373 .352 .529 .584
7. PERSPD 1 .619 .304 .352 .436 .615
8. ATTCRL 1 .373 .437 .537 .496
9. PHNCOD 1 .218 .446 .201
10. RPCNAM 1 .250 .314
11. MTHPRB 1 .593
12. MTHFLU 1
Note: GIASTD = General Intellectual Ability - Standard; GC = Comprehension-Knowledge; GF = Fluid Reasoning;
GWM = Working Memory; GS = Processing Speed; NUMFAC = Number Facility; PERSPD = Perceptual Speed;
ATTCRL = Attention Control; PHNCOD = Phonetic Coding; RPCNAM = Rapid Picture Naming; MTHPRB =
Math Problem Solving; MTHFLU = Math Fact Fluency.
All correlations are significant at the p < .001level.
Results for Research Question 1
The aim of the first model was to examine which broad cognitive abilities exhibit
significant effects on Math Fluency performance. The data set (N = 4,140) was imported into R
version 3.1.2 running the lavaan 0.5-17 package. Given the large sample size, all analyses have
sufficient power (.80) to detect a close-fit (RMSEA <.05; MacCallum, Brown, & Sugawara,
1996). For Model 1, which is depicted in Figure 1, the robust chi-square value, Χ2 = 98.755, df =
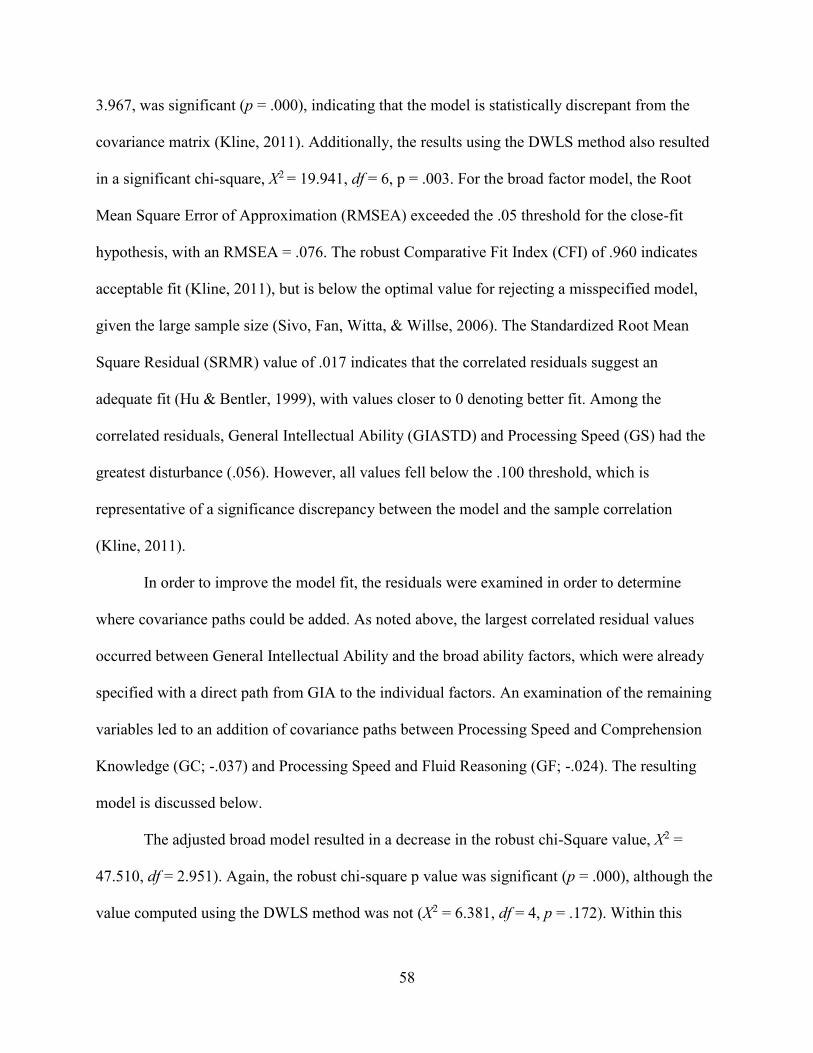
58
3.967, was significant (p = .000), indicating that the model is statistically discrepant from the
covariance matrix (Kline, 2011). Additionally, the results using the DWLS method also resulted
in a significant chi-square, Χ2 = 19.941, df = 6, p = .003. For the broad factor model, the Root
Mean Square Error of Approximation (RMSEA) exceeded the .05 threshold for the close-fit
hypothesis, with an RMSEA = .076. The robust Comparative Fit Index (CFI) of .960 indicates
acceptable fit (Kline, 2011), but is below the optimal value for rejecting a misspecified model,
given the large sample size (Sivo, Fan, Witta, & Willse, 2006). The Standardized Root Mean
Square Residual (SRMR) value of .017 indicates that the correlated residuals suggest an
adequate fit (Hu & Bentler, 1999), with values closer to 0 denoting better fit. Among the
correlated residuals, General Intellectual Ability (GIASTD) and Processing Speed (GS) had the
greatest disturbance (.056). However, all values fell below the .100 threshold, which is
representative of a significance discrepancy between the model and the sample correlation
(Kline, 2011).
In order to improve the model fit, the residuals were examined in order to determine
where covariance paths could be added. As noted above, the largest correlated residual values
occurred between General Intellectual Ability and the broad ability factors, which were already
specified with a direct path from GIA to the individual factors. An examination of the remaining
variables led to an addition of covariance paths between Processing Speed and Comprehension
Knowledge (GC; -.037) and Processing Speed and Fluid Reasoning (GF; -.024). The resulting
model is discussed below.
The adjusted broad model resulted in a decrease in the robust chi-Square value, X2 =
47.510, df = 2.951). Again, the robust chi-square p value was significant (p = .000), although the
value computed using the DWLS method was not (X2 = 6.381, df = 4, p = .172). Within this
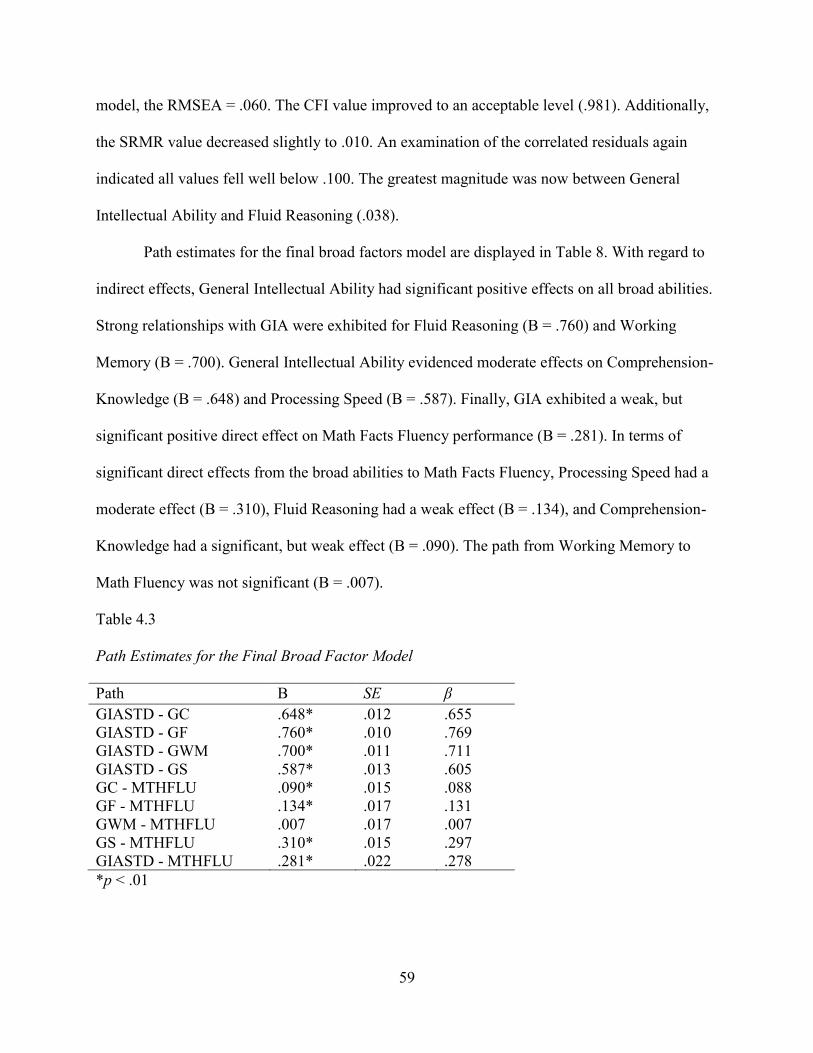
59
model, the RMSEA = .060. The CFI value improved to an acceptable level (.981). Additionally,
the SRMR value decreased slightly to .010. An examination of the correlated residuals again
indicated all values fell well below .100. The greatest magnitude was now between General
Intellectual Ability and Fluid Reasoning (.038).
Path estimates for the final broad factors model are displayed in Table 8. With regard to
indirect effects, General Intellectual Ability had significant positive effects on all broad abilities.
Strong relationships with GIA were exhibited for Fluid Reasoning (B = .760) and Working
Memory (B = .700). General Intellectual Ability evidenced moderate effects on Comprehension-
Knowledge (B = .648) and Processing Speed (B = .587). Finally, GIA exhibited a weak, but
significant positive direct effect on Math Facts Fluency performance (B = .281). In terms of
significant direct effects from the broad abilities to Math Facts Fluency, Processing Speed had a
moderate effect (B = .310), Fluid Reasoning had a weak effect (B = .134), and Comprehension-
Knowledge had a significant, but weak effect (B = .090). The path from Working Memory to
Math Fluency was not significant (B = .007).
Table 4.3
Path Estimates for the Final Broad Factor Model
Path B SE β
GIASTD - GC .648* .012 .655
GIASTD - GF .760* .010 .769
GIASTD - GWM .700* .011 .711
GIASTD - GS .587* .013 .605
GC - MTHFLU .090* .015 .088
GF - MTHFLU .134* .017 .131
GWM - MTHFLU .007 .017 .007
GS - MTHFLU .310* .015 .297
GIASTD - MTHFLU .281* .022 .278
*p < .01
60
Results for Research Question 2
The purpose of the second model was to examine which narrow cognitive abilities exhibit
significant effects on Math Fluency performance. Using the dataset from the previous model, the
theoretical model shown in Figure 2 was analyzed. For this model, the robust chi-square value,
Χ2 = 284.873, df = 5.296, was significant (p = .000) as was the DWLS value, Χ2 = 90.566, df = 9,
p = .000. Fit indices indicated poorer fit than the broad model, with a robust RMSEA value of
.113 and a CFI of .883. However, the SRMR was still relatively low (.030) and all correlated
residual values fell below .100.
As with the first model, modifications were made to the narrow model by examining the
correlated residuals for areas where covariance paths could be added to improve overall model
fit. Covariance paths were added incrementally, until all residual correlations values fell below
.020. The resulting model included covariance paths between Perceptual Speed and all three
remaining narrow variables, Attentional Control, Phonetic Coding, and Rapid Picture Naming.
Note that a covariance path between Perceptual Speed and Number Facility was specified in the
original narrow model. Additionally, covariance paths were added between Number Facility and
Attentional Control, Number Facility and Rapid Picture Naming, and Attentional Control and
Rapid Picture Naming.
For the adjusted narrow model, the robust chi-Square value dropped significantly, X2 =
7.647, df = 2.365 and was no longer significant at the p < .01 level (p = .031). Additionally, the
DWLS solution resulted in a non-significant p value (X2 = 2.094, df = 3, p = .553). The model
evidenced good fit according to the robust RMSEA of .023 and the robust CFI of .998. Finally,
the SRMR also decreased to .004.
Path estimates for the final narrow factors model are displayed in Table 9. Consistent
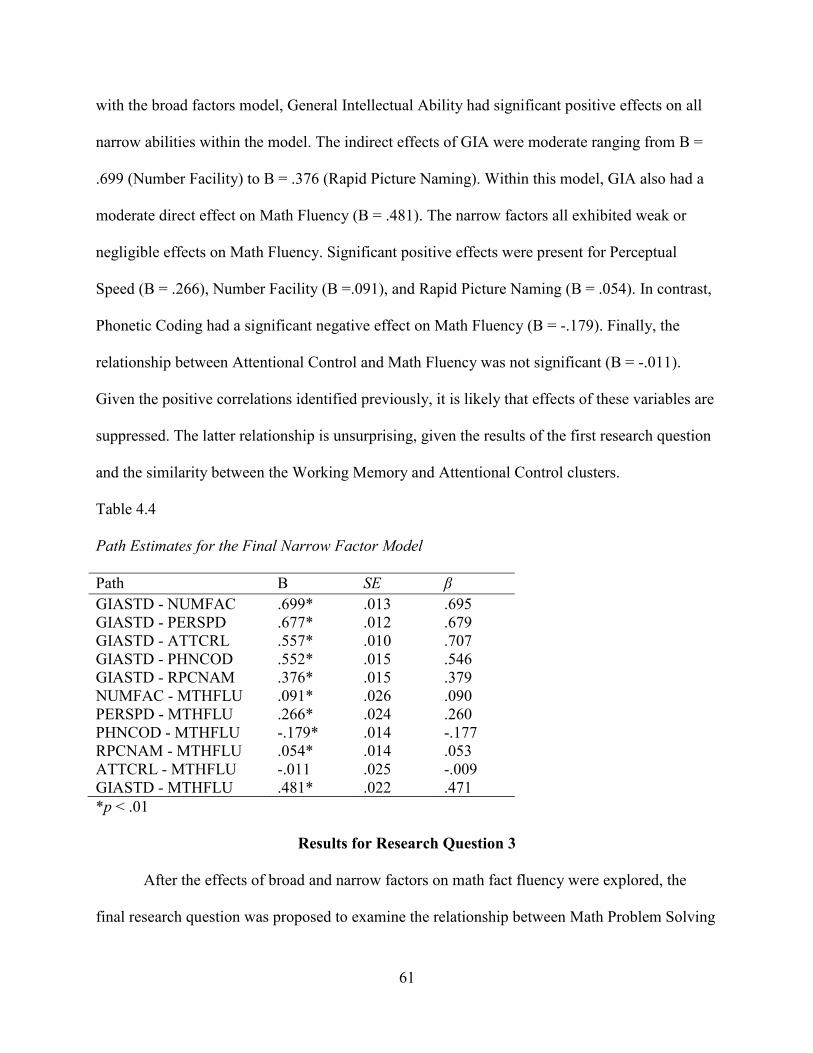
61
with the broad factors model, General Intellectual Ability had significant positive effects on all
narrow abilities within the model. The indirect effects of GIA were moderate ranging from B =
.699 (Number Facility) to B = .376 (Rapid Picture Naming). Within this model, GIA also had a
moderate direct effect on Math Fluency (B = .481). The narrow factors all exhibited weak or
negligible effects on Math Fluency. Significant positive effects were present for Perceptual
Speed (B = .266), Number Facility (B =.091), and Rapid Picture Naming (B = .054). In contrast,
Phonetic Coding had a significant negative effect on Math Fluency (B = -.179). Finally, the
relationship between Attentional Control and Math Fluency was not significant (B = -.011).
Given the positive correlations identified previously, it is likely that effects of these variables are
suppressed. The latter relationship is unsurprising, given the results of the first research question
and the similarity between the Working Memory and Attentional Control clusters.
Table 4.4
Path Estimates for the Final Narrow Factor Model
Path B SE β
GIASTD - NUMFAC .699* .013 .695
GIASTD - PERSPD .677* .012 .679
GIASTD - ATTCRL .557* .010 .707
GIASTD - PHNCOD .552* .015 .546
GIASTD - RPCNAM .376* .015 .379
NUMFAC - MTHFLU .091* .026 .090
PERSPD - MTHFLU .266* .024 .260
PHNCOD - MTHFLU -.179* .014 -.177
RPCNAM - MTHFLU .054* .014 .053
ATTCRL - MTHFLU -.011 .025 -.009
GIASTD - MTHFLU .481* .022 .471
*p < .01
Results for Research Question 3
After the effects of broad and narrow factors on math fact fluency were explored, the
final research question was proposed to examine the relationship between Math Problem Solving
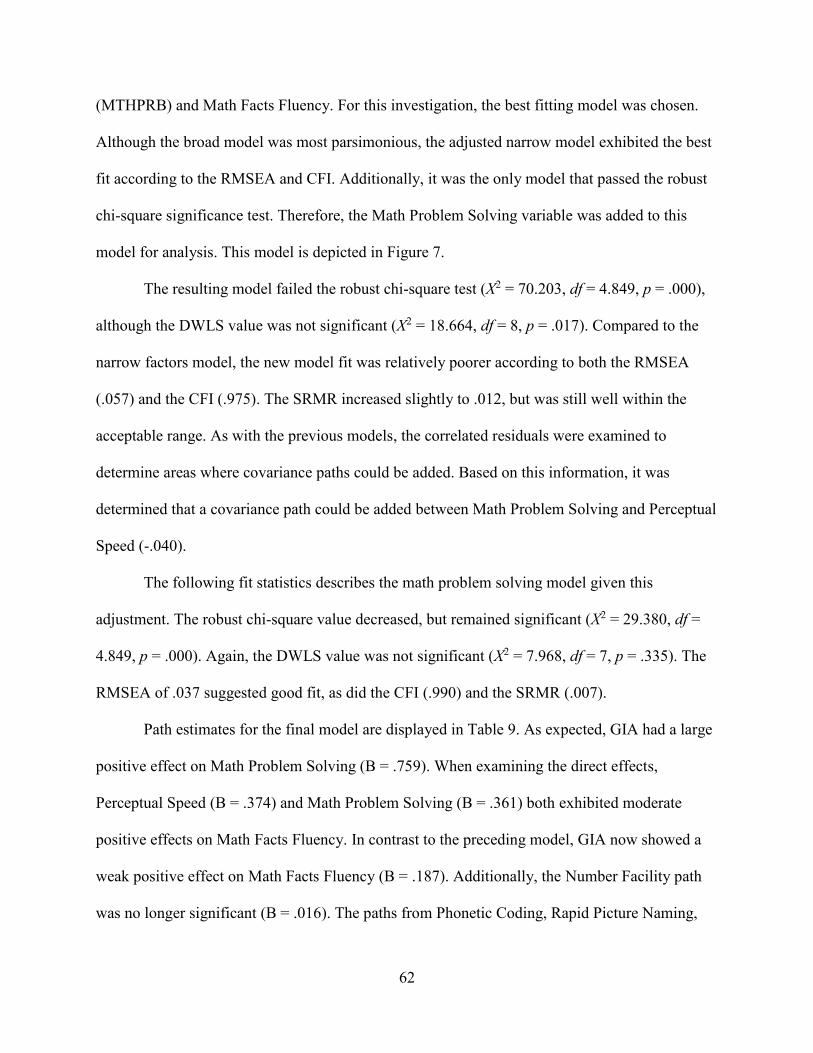
62
(MTHPRB) and Math Facts Fluency. For this investigation, the best fitting model was chosen.
Although the broad model was most parsimonious, the adjusted narrow model exhibited the best
fit according to the RMSEA and CFI. Additionally, it was the only model that passed the robust
chi-square significance test. Therefore, the Math Problem Solving variable was added to this
model for analysis. This model is depicted in Figure 7.
The resulting model failed the robust chi-square test (X2 = 70.203, df = 4.849, p = .000),
although the DWLS value was not significant (X2 = 18.664, df = 8, p = .017). Compared to the
narrow factors model, the new model fit was relatively poorer according to both the RMSEA
(.057) and the CFI (.975). The SRMR increased slightly to .012, but was still well within the
acceptable range. As with the previous models, the correlated residuals were examined to
determine areas where covariance paths could be added. Based on this information, it was
determined that a covariance path could be added between Math Problem Solving and Perceptual
Speed (-.040).
The following fit statistics describes the math problem solving model given this
adjustment. The robust chi-square value decreased, but remained significant (X2 = 29.380, df =
4.849, p = .000). Again, the DWLS value was not significant (X2 = 7.968, df = 7, p = .335). The
RMSEA of .037 suggested good fit, as did the CFI (.990) and the SRMR (.007).
Path estimates for the final model are displayed in Table 9. As expected, GIA had a large
positive effect on Math Problem Solving (B = .759). When examining the direct effects,
Perceptual Speed (B = .374) and Math Problem Solving (B = .361) both exhibited moderate
positive effects on Math Facts Fluency. In contrast to the preceding model, GIA now showed a
weak positive effect on Math Facts Fluency (B = .187). Additionally, the Number Facility path
was no longer significant (B = .016). The paths from Phonetic Coding, Rapid Picture Naming,
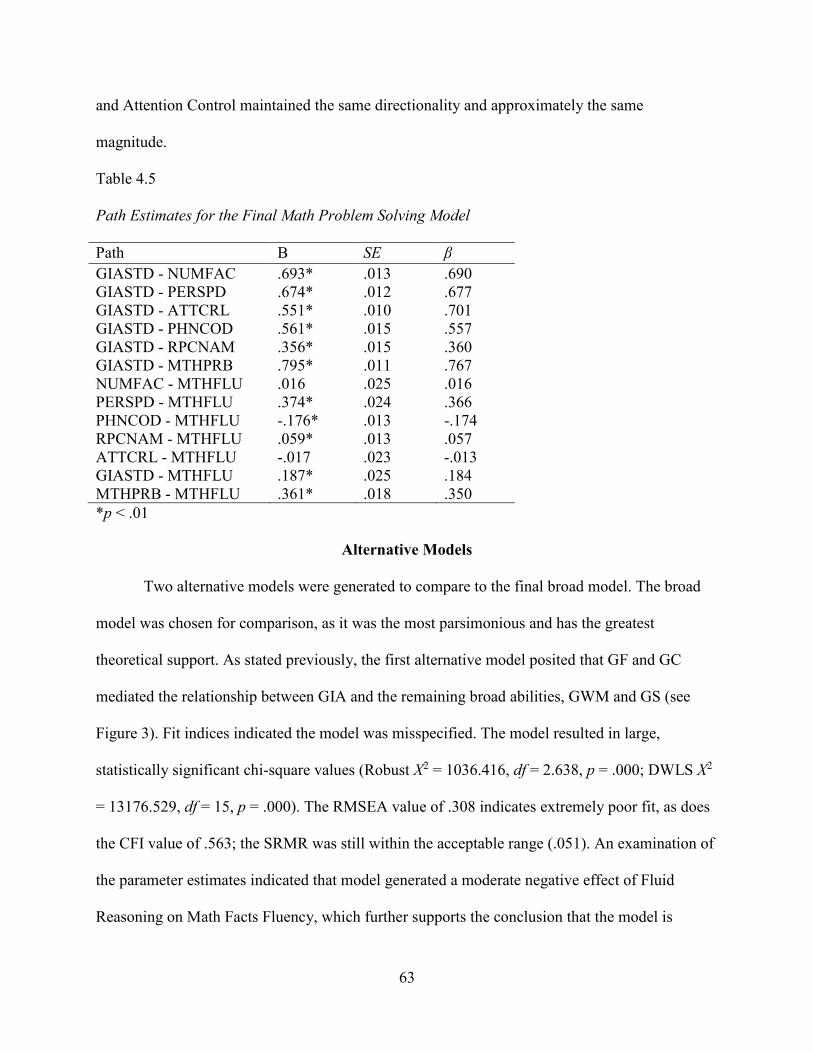
63
and Attention Control maintained the same directionality and approximately the same
magnitude.
Table 4.5
Path Estimates for the Final Math Problem Solving Model
Path B SE β
GIASTD - NUMFAC .693* .013 .690
GIASTD - PERSPD .674* .012 .677
GIASTD - ATTCRL .551* .010 .701
GIASTD - PHNCOD .561* .015 .557
GIASTD - RPCNAM .356* .015 .360
GIASTD - MTHPRB .795* .011 .767
NUMFAC - MTHFLU .016 .025 .016
PERSPD - MTHFLU .374* .024 .366
PHNCOD - MTHFLU -.176* .013 -.174
RPCNAM - MTHFLU .059* .013 .057
ATTCRL - MTHFLU -.017 .023 -.013
GIASTD - MTHFLU .187* .025 .184
MTHPRB - MTHFLU .361* .018 .350
*p < .01
Alternative Models
Two alternative models were generated to compare to the final broad model. The broad
model was chosen for comparison, as it was the most parsimonious and has the greatest
theoretical support. As stated previously, the first alternative model posited that GF and GC
mediated the relationship between GIA and the remaining broad abilities, GWM and GS (see
Figure 3). Fit indices indicated the model was misspecified. The model resulted in large,
statistically significant chi-square values (Robust X2 = 1036.416, df = 2.638, p = .000; DWLS X2
= 13176.529, df = 15, p = .000). The RMSEA value of .308 indicates extremely poor fit, as does
the CFI value of .563; the SRMR was still within the acceptable range (.051). An examination of
the parameter estimates indicated that model generated a moderate negative effect of Fluid
Reasoning on Math Facts Fluency, which further supports the conclusion that the model is
64
misspecified.
A second alternative model was generated to test the theory that General Intellectual
Ability was the sole contributor to Math Facts Fluency performance. Within this model, it was
proposed that GIA mediated the relationship between Fluid Reasoning, Comprehension
Knowledge, Working Memory, and Processing Speed (see Figure 4). The robust chi-square
value, X2 = 260.680, df = 3.124, was statistically significant (p = .000), as was the DWLS chi-
square value, X2 = 44.664, df = 4, p = .000. The robust RMSEA of .141 indicated a poor fit.
Similarly, the CFI value of .890 fell below the desired level. Again, the SRMR was acceptable
(.024). An examination of the parameter estimates identified that all paths were significant and
positive as expected. However, given the poor fit statistics, the model was rejected in favor of the
broad factor model outlined in the first research question.

65
CHAPTER V
DISCUSSION
Math fact fluency, which refers to the accuracy and speed with which one can perform
simple arithmetic, is a foundational skill for the development of more complex, high-order
mathematic calculations. Research has linked math fact retrieval deficits with lower scores on
mathematic assessments, a reluctance to engage in mathematical activities, as well as increased
frustration and anxiety related to performing mathematical calculations. Given that mathematical
skills build in a hierarchical sequence, it is important that deficits are accommodated or
remediated early. When schools use cognitive and academic screening measures to identify
children for targeted services, it is also important that these measures assess the fundamental
cognitive predictors of later academic performance. As such, the present study was the first of its
kind to utilize the Woodcock Johnson IV assessment battery to investigate the relationship
between cognitive abilities and math fact fluency.
Because no existing studies have evaluated math fact fluency performance in the context
of the Catell-Horn-Carroll theory of intelligence, the present study relied on CHC research
identifying the cognitive predictors of general mathematic achievement as well as individual
studies assessing math fact fluency performance with narrow-band cognitive measures. The
following discussion highlights the findings of the present study in the context of this research
and generates general conclusions and implications for practice. Additionally, the study’s
limitations are outlined, in addition to avenues of future research.
Findings Regarding Broad Abilities
The first aim of this study was to identify the relationships among General Intellectual
Ability, broad cognitive abilities, and Math Facts Fluency performance. Previous research has
66
revealed that Crystalized Intelligence (Comprehension-Knowledge), Fluid Reasoning, Short-
Term Memory, and Processing Speed have the strongest relationships with overall mathematics
achievement. A preliminary correlational analysis showed that GIA and these four broad abilities
all were moderately correlated with Math Facts Fluency. When the abilities were analyzed
together, GIA, Comprehension-Knowledge, Fluid Reasoning, and Processing Speed all exhibited
positive direct effects on Math Facts Fluency performance, consistent with the hypotheses. As
expected, GIA had moderate to strong effects on all broad abilities. The largest direct effect on
Math Facts Fluency was evident for Processing Speed, which had a moderate positive effect. In
comparison, GIA, Fluid Reasoning, and Comprehension Knowledge all had weak direct effects.
Contrary to the hypothesis, Working Memory did not display a significant direct effect on Math
Facts Fluency.
Overall, results of the broad abilities analysis are consistent with the findings of Taub et
al. (2008) that utilized the WJ III battery and found that Crystalized Intelligence, Fluid
Reasoning, and Processing Speed were most related to mathematics achievement. In addition,
McGrew and Wendling’s (2010) meta-analysis concluded that these three broad abilities were
most related to math calculation skills. The present findings are in contrast to McGrew and
Wendling’s conclusions that Working Memory (which was categorized as a narrow ability in the
WJ III battery) was related to math calculation skills at all ages. Hypotheses for this discrepancy
are discussed below.
When comparing the results of this study to previous research, one must be cognizant of
the fact that the Working Memory domain is new to the WJ IV battery. Previously, this factor
was named Short-Term Memory and was derived from a working memory task and a relatively
simple Short-Term Memory task (Memory for Words). The current cluster is comprised of two

67
subtest measuring Working Memory, which is characterized by the manipulation of information
within immediate awareness. Although as noted previously, Taub et al. (2008) did not find
significant effects of Short-Term Memory on mathematics performance, it was hypothesized that
Working Memory ability would have a significant effect, in line with the results of McGrew and
Wendling’s (2010) meta-analysis. Although Working Memory has a moderate bivariate
correlation with math fact fluency, it has no significant direct effect on Math Facts Fluency when
GIA and the other broad abilities are taken into account. This would suggest that the correlation
between Working Memory and Math Facts Fluency is actually representative of a third,
mediating variable. This mediating variable is likely GIA, given its strong correlation with
Working Memory.
The absence of a direct effect from Working Memory in the broad abilities model of
Math Facts Fluency is also theoretically plausible, given the assertion that math fact fluency
skills represent rote retrieval within this study. Whereas Working Memory is understandably
important for more complex, multi-step calculations, which require one to sequence the order of
operations and process information simultaneously, it appears less so for this relatively simple
task. To the extent that executive functioning skills, such as inhibiting and shifting, are potential
predictors of Math Facts Fluency is unknown in this model, as there are no such executive
function measures in the WJ battery. However, it can be tentatively concluded that Working
Memory ability is less important than initially hypothesized when considering the Math Facts
Fluency performance of children and adolescents.
Unsurprising is that GIA contributed indirectly and directly to Math Facts Fluency
performance, given the wealth of research that has shown general intelligence to be predictive of
academic achievement. As GIA is composite of a broad array of cognitive skills, it is
68
hypothesized that the direct relationship to math fact fluency is an artifact of the presence of
other abilities not measured within the model. Given the power of intelligence to predict
achievement, it is also fitting that Fluid Reasoning, which is the broad ability most highly related
to GIA, is also a significant predictor of Math Facts Fluency. Additionally, Fluid Reasoning has
repeatedly demonstrated a strong relationship with math achievement (e.g., Floyd et al., 2003;
Proctor et al., 2005; Taub et al., 2008). Within the correlational analysis employed in this study,
the Math Problem Solving cluster had a strong relationship with Fluid Reasoning, similar in
magnitude to its relationship with GIA. In this study, it was hypothesized that Math Problem
Solving would serve as a representation of early numeracy in young children, given that the
content of these problems involves comparing quantities and determining the relationships
between numbers. If Math Facts Fluency performance is indeed related to early numeracy and
number sense, then it is logical that children with stronger Fluid Reasoning skills, and thereby,
stronger math reasoning skills, would perform better on math fluency measures.
As stated previously, Processing Speed had the greatest direct effect on Math Facts
Fluency performance. The importance of Processing Speed on Math Facts Fluency performance
is largely absent in the framework of math fact retrieval deficits proposed by David Geary, with
the exception of Rapid Automatized Naming (RAN), which falls under the Phonological
Processing subtype (Geary, 2011a). However, important to consider are the effects of age in
comparing the two theories. Geary and others investigating the relationships between cognitive
abilities and academic performance (e.g., Fuchs, et al., 2006; Geary et al., 2012; Jordan et al.,
2007) have largely focused on the early elementary age, where skills are emerging and
intervention is most fruitful. However, this study utilized a 6-19 population, with a mean age of
just over 12 years. As such, the majority of individuals in this study are in late elementary or

69
beyond, when skills such as Math Facts Fluency have moved from the acquisition phase to the
fluency and generalization phase. Therefore, it is prudent to conclude that Processing Speed is
moderately related to Math Facts Fluency performance in individuals who have automatized the
skill.
Given the previous conclusion that the majority of individuals within this study have
automatized math facts, then it follows that the ability measuring crystalized knowledge would
be related to Math Facts Fluency. Although crystalized intelligence has been renamed and
restructured in the WJ IV battery as Comprehension-Knowledge, the results of the present study
suggest that this area continues to have a significant effect on math performance. A potential
hypothesis for this relationship is that Math Facts Fluency requires the fluent retrieval of
information stored within long-term memory, which is also required for the vocabulary and
general knowledge tasks within the Comprehension-Knowledge domain. This proposed
relationship would lend credence to the semantic deficit subtype of math fact fluency weakness,
which posits that some children have a specific weakness in the fluent retrieval of information
from memory. This hypothesis is further discussed when considering the results of the narrow
factors model.
Before exploring the second model, it is worth mentioning that the broad abilities model
discussed previously was mathematically superior to both alternative models generated. The first
model, which identified Fluid Reasoning and Comprehension-Knowledge as mediating variables
between GIA and the other broad abilities, Working Memory and Processing Speed, exhibited
extremely poor fit. Thus, the current research supports contemporary CHC theory, which
organizes Fluid Reasoning, Comprehension-Knowledge, Working Memory, and Processing
Speed as broad abilities falling under the umbrella of general ability. The second model reversed

70
the relationships between GIA and the narrow abilities; in this alternative model, the narrow
abilities exhibited direct effects on GIA, which in turn had a direct effect on Math Facts Fluency.
Although better than the first alternative model, the second alternative model also showed poor
fit. Therefore, the theoretical broad factor model was chosen as the representation of the current
data.
Findings Regarding Narrow Abilities
The second goal of this study was to identify the relationships among General Intellectual
Ability, narrow cognitive abilities, and Math Facts Fluency performance. McGrew and
Wendling’s (2010) meta-analysis suggested that Perceptual Speed, Working Memory, and
Phonological Processing were most related to math calculation performance. Support for the
importance of Phonological Processing, including Rapid Automatized Naming (RAN), and
Working Memory has also been found elsewhere within the literature (e.g., Bull et al., 2011;
Chong & Siegal, 2008; Kroesbergen et al., 2009; Mazzocco & Grimm, 2013; Vukovic et al.,
2010). Therefore, Perceptual Speed, Phonetic Coding, and Rapid Picture Naming were included
in the narrow model. Within CHC theory, narrow abilities are numerous and still evolving.
Within the updated Working Memory composite, WJ IV authors proposed that Attentional
Control was a contributing narrow ability (McGrew et al., 2014). However, as no narrow-band
composite is provided within the battery, one was created for this study. It was anticipated that
this narrow ability would approximate executive control. Another new addition to the WJ IV is
the Number Facility cluster, which is a narrow ability that measures skills with numbers across
the domains of Working Memory and Processing Speed.
In the correlational analysis, moderate positive correlations with Math Facts Fluency
were present for Number Facility, Perceptual Speed, and Attentional Control. In contrast,

71
Phonetic Coding and Rapid Picture Naming displayed weak positive correlations with Math
Facts Fluency. When analyzed within the model, GIA had moderate positive effects on all
narrow abilities. Additionally, GIA had a moderate direct effect on Math Facts Fluency, which
suggests that GIA accounted for a sizeable amount of variance not explained by the narrow
factors within the model. Indeed, all of the positive direct effects of the narrow abilities were
weak. Of these narrow abilities, the greatest relationship was found between Perceptual Speed
and Math Facts Fluency, followed by Number Facility, then Rapid Picture Naming. Phonetic
Coding had a significant negative impact on Math Facts Fluency. Finally, Attentional Control
had a negative, though non-significant, effect on Math Facts Fluency.
The results of the narrow factors analysis partially supported extant research. The
positive direct relationship from Perceptual Speed to Math Facts Fluency supports findings from
the meta-analysis regarding the WJ III (McGrew & Wendling, 2010). Additionally, the positive
direct relationship from Number Facility to Math Facts Fluency supports the assertion that this
narrow ability is responsible for “the speed at which basic arithmetic operations are performed
accurately” (McGrew et al., 2014, p. 246). Finally, the small, but significant effect of Rapid
Picture Naming on Math Facts Fluency supports research linking RAN and math fact fluency
(Geary et al., 2012). However, the absence of a positive direct effect of Phonological Coding on
Math Facts Fluency is at odds with Geary and others’ hypothesis that phonological processing
weaknesses underlie a math fact retrieval deficit. Lastly, although the lack of relationship
between Attentional Control and Math Facts Fluency is expected given the results of the broad
factor model, it stands in contrast with research suggesting an executive functioning deficit
responsible for a weakness in math fact fluency performance (Geary et al., 2012).

72
When considering the results of the broad factor model, it is fitting that Perceptual Speed,
a narrow ability underlying Processing Speed, had the strongest relationship with Math Facts
Fluency of all the narrow abilities. In terms of bivariate correlations, Perceptual Speed had the
second strongest relationship with Math Facts Fluency, preceded only by GIA. Both Perceptual
Speed and Processing Speed share a subtest (Letter Pattern Matching), but they differ on the
demands of the second subtest. Whereas Perceptual Speed contains a second alphanumeric
matching task (Number Pattern Matching), Processing Speed’s second task requires the
identification of a pair of pictures in an array (Pair Cancellation). Apparently, the speed at which
one can identify alphanumeric symbols (i.e., letter and numbers) is of primary importance in
Math Facts Fluency performance. Therefore, important to keep in mind when examining the
weak relationship between Rapid Picture Naming and Math Facts Fluency is that a stronger
relationship may have been present had the rapid naming task involved letters or numbers. This
hypothesis is in line with research regarding rapid naming and reading fluency (Savage &
Frederickson, 2005).
When considering the significant, yet smaller effect of Number Facility on Math Facts
Fluency, likely is that this cluster also somewhat represents the positive effect of Number Pattern
Matching. Although the Numbers Reversed subtest also involves the use of numbers, the
fundamental skill employed in this task is Working Memory. Indeed, this subtest is a component
of the broad Working Memory factor, which had a non-significant relationship with Math Facts
Fluency in the broad model. The narrow factors model replicated the broad factors model in the
relative unimportance of Working Memory tasks on Math Facts Fluency. Of note, the
Attentional Control composite in this study included both a Working Memory task (Verbal
Attention) and a Processing Speed task (Pair Cancellation); however, the seemingly positive

73
weight of the Processing Speed task was not enough to generate a significant relationship with
Math Facts Fluency. One hypothesis for this finding is that Pair Cancellation is a cognitively
complex task that requires inhibition and interference control. In contrast, other speeded
processing tasks lack this executive control component. As stated previously, the findings of this
research is in direct contrast to the executive functioning type of math fact fluency deficit
(Geary, 2011a). However, it is worth repeating that the present study utilized a sample of
participants across childhood and adolescence and that the importance of particular cognitive
abilities in acquiring math fact fluency may not continue through the fluency and generalization
stage. Consistent with this hypothesis, Geary et al. (2012) acknowledged that central executive
measures were less predictive of fact fluency in fourth grade.
Perhaps the most surprising finding resulting from the second model was the significant
negative relationship between Phonetic Coding and Math Facts Fluency. This finding stands in
opposition to previous research using the WJ III battery as well as independent studies
identifying phonological processing measures as predictive of math fact fluency (e.g., Fuchs et
al., 2005; Fuchs et al., 2006). Although suppression from other narrow abilities is likely the
cause of the negative relationship within the model, the bivariate correlation between Phonetic
Coding and Math Facts Fluency indicates that the two are only weakly positively correlated.
Again, it is important to consider that the effect of Phonetic Coding in acquiring Math Facts
Fluency may be relatively diminished by late elementary and thus would be masked within the
current sample. This hypothesis is supported by a similar trend in reading fluency performance;
although phonemic awareness is strongly related to reading acquisition in young children, its
importance declines across time, when reading fluency is better established (Phillips & Torgesen,
2006). Second, it is important to note that the Phonetic Coding cluster provided in the WJ IV is

74
distinct from the WJ III Phonological Processing cluster, given the restructuring of the battery
and the addition of the Tests of Oral Language, and may measure slightly different abilities. The
phonological processing tasks in the Phonetic Coding cluster, Segmentation and Sound
Blending, are both measures of one’s ability to manipulate phonemes. However, other tasks
measuring alphabetic principle (sound-symbol associations) could also fall under the umbrella of
phonological processing. Thus, there may be important distinctions between tasks given the same
general classification.
Findings Regarding Math Problem Solving
A third aim of this study was to investigate the relationship between an achievement
cluster, Math Problem Solving and Math Facts Fluency performance. Math Problem Solving was
hypothesized to have a significant direct effect on Math Facts Fluency, given the evidence
supporting the hypothesis that a number sense weakness is present in children with math fact
fluency deficits (Geary, 2011b; Locuniak & Jordan, 2008). Given the previous finding that Math
Problem Solving is strongly correlated with Fluid Reasoning, the narrow factors model was used
to explore the relationship between Math Facts Fluency and Math Problem Solving.
As expected, the Math Problem Solving cluster had a significant positive effect on Math
Facts Fluency performance. When this variable was included within the model, other
relationships shifted slightly. The direct path from GIA to Math Facts Fluency remained
significant, although decreased to a weak positive effect. Similarly, the effect of Number Facility
on Math Facts Fluency decreased and was no longer significant. In contrast, the direct effect of
Perceptual Speed increased in magnitude and exhibited the strongest direct effect on Math Facts
Fluency. The effects of Phonetic Coding and Rapid Picture Naming were relatively unchanged.
75
In line with the previous statement that Fluid Reasoning and Math Problem Solving are
highly correlated, Math Problem Solving exhibited a positive direct effect on Math Facts
Fluency. However, within the narrow factors model, Math Problem Solving took on relatively
stronger importance than Fluid Reasoning did in its respective model. Well established from
longitudinal research is that early math achievement is predictive of future achievement (Duncan
et al., 2007). The current findings suggest that performance on an applied mathematics
achievement measure may be more predictive of Math Facts Fluency than other measures of
cognitive abilities in children and adolescents. The exception, of course, is Processing
Speed/Perceptual Speed, which have proven to be the most important individual cognitive ability
within this sample of students. Nonetheless, to the degree that Math Problem Solving measures
an underlying number sense, the current research lends support to the theory that number sense is
predictive of math fact fluency performance.
Study Limitations
One of the foremost limitations evident when discussing the results of this study is the
large age range of students within the sample. Although the purpose of the study was to make
broad conclusions regarding the relationships between cognitive abilities and math fact fluency
in school-age children and adolescents, these results may not accurately reflect the dynamic
importance of particular cognitive abilities when considering cross-sections of students. Previous
research (e.g., Floyd et al., 2003) has demonstrated the differential impact of cognitive abilities
across the development academic skills. Thus, it is important to be cognizant of this fact if these
results are to be applied to inform assessment or screening practices in young children.
Second, although this study provided evidence of a moderate relationship between math
problem solving and math fact fluency, it was beyond the scope of the study to determine the

76
predictive value of other measures of academic achievement. Given that all data within this study
was collected at a single point in time, no generalizations can be made to the use of math
problem solving to predict future math fact fluency performance. Additionally, quite possible is
that other inter-achievement relationships may exist within the battery, for example, between
reading fluency and math fluency. Further research is needed to address these questions.
A final, practical limitation concerns the nature of the data used within this study. Many
of the subtests that create the narrow and broad composites are cognitively complex tasks that
span various abilities. For example, the Pair Cancellation task is thought to involve three narrow
abilities: Perceptual Speed, Spatial Scanning, and Attentional Control (McGrew et al., 2014).
Therefore, when used as a predictor, it is difficult to determine which narrow ability is most
salient in determining the outcome variable. Although it is worth exploring the narrow abilities
in order to isolate specific areas of weakness, it is to be expected that a high degree of similarity
may be present across these tasks and their corresponding broad abilities. For example, the broad
ability Processing Speed and the narrow ability Perceptual Speed both share a common subtest;
similarly, the narrow ability Number Facility shares a common subtest with the Processing Speed
and Working Memory broad ability clusters. Given the degree of overlap between subtests
comprising the broad and narrow abilities, a model exploring the relationships among broad and
narrow factor concurrently would contain significant multicollinearity. Therefore, broad and
narrow abilities were analyzed separately for this study. The difficulty with parsing out
theoretical narrow abilities in an assessment instrument is not inherent to the WJ IV. When
considering the input, processing, and output demands of any assessment task, it is likely one
will be able to identify multiple underlying abilities. Therefore, it is imperative that the findings
be viewed in the context of the task demands produced within the assessment battery. One
77
should take caution in generalizing these findings to other assessment batteries with distinct
measures.
Future Directions of Study
The aforementioned limitations of the current research provide logical areas of future
research. It is recommended that future research examine the applicability of the current model
of Math Facts Fluency performance in age-defined subsamples. Future research may find that the
abilities contributing to math fact fluency should be conceptualized differentially in the
acquisition stage of the learning process (ages 6-10) than in the in fluency stage (ages 11+). In
contrast, research comparing students in the acquisition phase versus the fluency, regardless of
age, may be the best suited for uncovering true differences in the importance of cognitive
abilities throughout the learning process. As mentioned previously, the relationship between
math fluency and reading and writing fluency was not explored within this study. It is likely that
future research regarding both the shared and distinct mechanisms for identifying fluency deficits
using the WJ IV battery would prove useful for clinicians.
As the WJ IV battery is still a relatively new instrument, potential areas of future research
with this instrument are abundant. Replication studies examining the relationships between the
narrow and broad cognitive abilities and general mathematics achievement would be valuable in
determining the potential effects of the restructured cognitive tasks. This information would
provide an important context for analyzing the results of the current study. Further, as previous
WJ research has typically examined Math Calculation Skills, which combines the assessment of
Math Calculation and Math Facts Fluency, it remains to be seen which relationships with Math
Calculation are most important when Math Facts Fluency is removed from the equation.
78
Implications for Practice
This is the first known study to use the Woodcock Johnson battery to examine the
cognitive abilities related to math fact fluency as an isolated skill. As such, the results of the
present study provide a comprehensive analysis of math fluency within the framework of the
most empirically validated theory of intelligence. From here, further research is needed to clarify
the ability of cognitive measures to predict math fact fluency performance across the learning
process. Nonetheless, some implications for practice are provided.
First, the current research supports the assertion that assessment of one’s general
cognitive ability can provide information about his or her expected achievement, even with a
relatively straightforward task such as completing single-digit computations. When assessing
broad domains of functioning, it appears that measuring processing speed performance would be
most important in identifying students with potential difficulty in the area of math fact fluency,
regardless of age. If a student exhibits a deficit in processing speed, clinicians are urged to
consider an accommodation that would bypass this area of weakness.
In determining the most appropriate accommodation for a student, clinicians must
consider the student’s pattern of performance on a math fluency task. Students who are slow but
accurate in their computation skills may benefit from extended time. In terms of
accommodations, extended time is widely used and easy to implement in the classroom (Bolt &
Thurlow, 2004). Students who are inaccurate in their computation skills would likely benefit
from the use of a calculator. This accommodation is appropriate in instances where math fact
fluency is not the primary skill being measured by the assessment. For example, on a
comprehensive mathematics exam, the use of the calculator may allow the examiner to measure
the student’s performance on higher-level math skills involved in solving algebraic equations.

79
In addition to considering appropriate accommodations for students with math fact
fluency deficits, clinician and educators should also be familiar with empirically supported
interventions that can be used to remediate these deficits. Cover-Copy-Compare (CCC) is a drill-
and-practice intervention that can be administered individually or in a group, which has
demonstrated sustained increases in math fact fluency relative to control conditions or a
constructivist-oriented intervention (Poncy, McCallum, & Schmitt, 2010; Skinner, Turco, Beatty,
& Rasavage, 1989). Additionally, the Taped Problems intervention is a second drill-and-practice
method for increasing fact fluency in the classroom setting (McCallum, Skinner, Turner, &
Saecker, 2006). A comparison of the two interventions revealed that both were effective in
increasing the math fact fluency of an elementary student with impaired cognitive functioning
(Poncy, Skinner, & Jaspers, 2007). The authors noted that Taped Problems was more efficient in
terms of times spent implementing the intervention; however, both interventions were
implemented in fewer than 10 minutes per day. Thus, the research supports the use of targeted
interventions to increase the math fact fluency of students, which have proven to be efficacious
and relatively low-burden for educators.
Second, the results of this research have implications for universal screening practices.
Previous research has shown that early academic skills, such as early numeracy or number sense,
can predict later math achievement. In accordance with this finding, the present research showed
that math problem solving skills were moderately predictive of math fact fluency performance.
Although comprehensive assessment is certainly warranted in some cases, educators may be able
to simplify their universal screening process by using a mathematical reasoning measure to
identify children at-risk for mathematical difficulties. Whereas calculation and math fact fluency
are learned throughout elementary school, research suggests that young children possess
80
mathematical reasoning abilities upon entering formal schooling. Relatedly, processing speed
tasks are relatively simple and can be administered to young children before math fluency skills
are solidified. Given the results of this study, educators may be able to use these measures to
identify children who may go on to develop math fact fluency deficits. With this information,
these children can be targeted with early intervention to support their future academic
achievement.
Summary
The purpose of this research was to explore the relationships among the Cattell-Horn-
Carroll (CHC) Theory-Aligned Cognitive Abilities and Math Fact Fluency performance using
the Woodcock Johnson IV standardization sample. Using path analysis, the broad and narrow
abilities thought to influence Math Fact Fluency performance were modeled. The broad ability
model revealed that General Intellectual Ability exhibited significant direct and indirect effects
on Math Fact Fluency. With regard to the broad factors, Processing Speed had a moderate direct
effect on Math Fact Fluency, followed by weak direct effects from Fluid Reasoning and
Comprehension Knowledge. Contrary to the initial hypothesis, Working Memory did not have a
significant direct effect on Math Fact Fluency. Within the narrow factors model, Perceptual
Speed, Number Facility, and Rapid Picture Naming all exhibited weak positive direct effects. In
contrast, Phonetic Coding and Attentional Control were not positively related to Math Fact
Fluency. Inclusion of the Math Problem Solving composite revealed that Math Problem Solving
had a moderate direct effect on Math Fact Fluency, which was similar in magnitude to Perceptual
Speed. Overall, the current research points to general ability, speed of processing, and math
reasoning abilities as the most important contributors to Math Fact Fluency performance. As
previous research with the WJ battery has studied general mathematics achievement, the current

81
findings shed light on the unique relationships among cognitive abilities and Math Fact Fluency,
with implications for clinicians and educators.

82
References
Berch, D. B. (2005). Making sense of number sense: Implications for children with mathematical
disabilities. Journal of Learning Disabilities, 38, 333-339.
doi:10.1177/00222194050380040901
Bolt, S. E., & Thurlow, M. L. (2004). Five of the most frequently allowed testing
accommodations in state policy: Synthesis of research. Remedial and Special
Education, 25, 141-152. doi:10.1177/07419325040250030201
Bull, R., Espy, K. A., Wiebe, S. A., Sheffield, T. D., & Nelson, J. M. (2011). Using confirmatory
factor analysis to understand executive control in preschool children: Sources of variation
in emergent mathematic achievement. Developmental Science, 14, 679-692.
doi:10.1111/j.1467-7687.2010.01012.x
Carroll, J. B. (1993). Human cognitive abilities: A survey of factor analytic studies. New York:
Cambridge University Press.
Cates, G. L., & Rhymer, K. N. (2003). Examining the relationship between mathematics anxiety
and mathematics performance: An instructional hierarchy perspective. Journal of
Behavioral Education, 12, 23-34. doi:10.1023/A:1022318321416
• Chong, S. L., & Siegel, L. S. (2008). Stability of computational deficits in math learning
disability from second through fifth grades. Developmental Neuropsychology, 33, 300-
317. doi: 10.1080/87565640801982387
Claessens, A., Duncan, G., & Engel, M. (2009). Kindergarten skills and fifth-grade achievement:
Evidence from the ECLS-K. Economics of Education Review, 28, 415-427.
doi:10.1016/j.econedurev.2008.09.003
83
Clements, D. H., & Sarama, J. (2009). Learning and teaching early math: The learning
trajectories approach. New York: Routledge.
Clements, D. H., & Sarama, J. (2012). Mathematics learning, assessment, and curriculum. In R.
C. Pianta (Ed.), Handbook of early childhood education (pp. 217-239) New York:
Guilford Press.
Duncan, G. J., Dowsett, C. J., Claessens, A., Magnuson, K., Huston, A. C., Klebanov, P., ... &
Japel, C. (2007). School readiness and later achievement. Developmental Psychology, 43,
1428-1446. doi: 10.1037/0012-1649.43.6.1428
Dunn, L. M., & Dunn, D. M. (2007). Peabody Picture Vocabulary Test (4th ed.). San Antonio,
TX: Pearson.
Flanagan, D. P., Ortiz, S. O., & Alfonso, V. C. (2013). Essentials of cross-battery assessment
(Vol. 84). Hoboken, NJ: John Wiley & Sons.
Floyd, R. G., Evans, J. J., & McGrew, K. S. (2003). Relations between measures of Cattell–
Horn– Carroll (CHC) cognitive abilities and mathematics achievement across the school-
age years. Psychology in the Schools, 40, 155–177. doi:10.1002/pits.10083
Fuchs, L. S., Compton, D. L., Fuchs, D., Paulsen, K., Bryant, J. D., & Hamlett, C. L. (2005). The
prevention, identification, and cognitive determinants of math difficulty. Journal of
Educational Psychology, 97, 493-513. doi: 10.1037/0022-0663.97.3.493
Fuchs, L. S., Hamlett, C. L., & Powell, S. R. (2003). Grade 3 math battery. [Unpublished paper.]
Fuchs, L. S., Fuchs, D., Compton, D. L., Powell, S. R., Seethaler, P. M., Capizzi, A. M., ... &
Fletcher, J. M. (2006). The cognitive correlates of third-grade skill in arithmetic,
algorithmic computation, and arithmetic word problems. Journal of Educational
Psychology, 98, 29-43. doi:10.1037/0022-0663.98.1.29

84
Fuchs, L. S., Fuchs, D., Stuebing, K., Fletcher, J. M., Hamlett, C. L., & Lambert, W. (2008).
Problem solving and computational skill: Are they shared or distinct aspects of
mathematical cognition? Journal of Educational Psychology, 100, 30-47.
doi:10.1037/0022-0663.100.1.30
Geary, D. C. (1993). Mathematical disabilities: Cognitive, neuropsychological, and genetic
components. Psychological Bulletin, 114, 345–362. doi:10.1037/0033-2909.114.2.345
Geary, D. C. (2004). Mathematics and learning disabilities. Journal of Learning Disabilities, 37,
4-15. doi:10.1177/00222194040370010201
Geary, D. C. (2010). Mathematical disabilities: Reflections on cognitive, neuropsychological,
and genetic components. Learning and Individual Differences, 20, 130-133.
doi:10.1016/j.lindif.2009.10.008
Geary, D. C. (2011a). Consequences, characteristics, and causes of mathematical learning
disabilities and persistent low achievement in mathematics. Journal of Developmental
and Behavioral Pediatrics, 32, 250-263. doi:10.1097/DBP.0b013e318209edef
Geary, D. C. (2011b). Cognitive predictors of achievement growth in mathematics: A 5-year
longitudinal study. Developmental Psychology, 47, 1539-1552. doi:10.1037/a0025510
Geary, D. C., Bailey, D. H., Littlefield, A., Wood, P., Hoard, M. K., & Nugent, L. (2009). First-
grade predictors of mathematical learning disability: A latent class trajectory analysis.
Cognitive Development, 24, 411-429. doi:10.1016/j.cogdev.2009.10.001
Geary, D. C., Bow-Thomas, C. C., & Yao, Y. (1992). Counting knowledge and skill in cognitive
addition: A comparison of normal and mathematically disabled children. Journal of
Experimental Child Psychology, 54, 372-391. doi:10.1016/0022-0965(92)90026-3
85
Geary, D. C., Hamson, C. O., & Hoard, M. K. (2000). Numerical and arithmetical cognition: A
longitudinal study of process and concept deficits in children with learning disability.
Journal of Experimental Child Psychology, 77, 236-263. doi:10.1006/jecp.2000.2561
Geary, D. C., Hoard, M. K., & Bailey, D. H. (2012). Fact retrieval deficits in low achieving
children and children with mathematical learning disability. Journal of Learning
Disabilities, 45, 291-307. doi:10.1177/0022219410392046
Geary, D. C., Hoard, M. K., & Nugent, L. (2012). Independent contributions of the central
executive, intelligence, and in-class attentive behavior to developmental change in the
strategies used to solve addition problems. Journal of Experimental Child Psychology,
113, 49-65. doi:10.1016/j.jecp.2012.03.003
Geary, D. C., Hoard, M. K., Nugent, L., & Bailey, D. H. (2012). Mathematical cognition deficits
in children with learning disabilities and persistent low achievement: A five-year
prospective study. Journal of Educational Psychology, 104, 206. doi:10.1037/a0025398
Georgiou, G. K., Tziraki, N., Manolitsis, G., & Fella, A. (2013). Is rapid automatized naming
related to reading and mathematics for the same reason(s)? A follow-up study from
kindergarten to Grade 1. Journal of Experimental Child Psychology, 115, 481-496.
doi:10.1016/j.jecp.2013.01.004
Hart, S. A., Petrill, S. A., Thompson, L. A., & Plomin, R. (2009). The ABCs of math: A genetic
analysis of mathematics and its links with reading ability and general cognitive ability.
Journal of Educational Psychology, 101, 388-402. doi:10.1037/a0015115
86
Hu, L. T., & Bentler, P. M. (1999). Cutoff criteria for fit indexes in covariance structure analysis:
Conventional criteria versus new alternatives. Structural Equation Modeling: A
Multidisciplinary Journal, 6, 1-55. doi:10.1080/10705519909540118
IBM Corp. Released 2013. IBM SPSS Statistics for Windows, Version 22.0. Armonk, NY: IBM
Corp.
Individuals With Disabilities Education Act, 20 U.S.C. § 1400 (2004).
Jordan, N. C., Kaplan, D., Locuniak, M. N., & Ramineni, C. (2007). Predicting first grade math
achievement from developmental number sense trajectories. Learning Disabilities
Research & Practice, 22, 36-46. doi:10.1111/j.1540-5826.2007.00229.x
Jordan, N. C., Kaplan, D., Ramineni, C., & Locuniak, M. N. (2009). Early math matters:
kindergarten number competence and later mathematics outcomes. Developmental
Psychology, 45, 850-867. doi:10.1037/a0014939
Kaufman, A. S., & Kaufman, N. L. (2004). Kaufman Assessment Battery for Children (2nd ed.).
San Antonio, TX: Pearson.
Kaufman, E. L., Lord, M. W., Reese, T. W., & Volkmann, J. (1949). The discrimination of
visual number. The American Journal of Psychology, 62, 498-525. doi:10.2307/1418556
Keith, T. Z., & Reynolds, M. R. (2010). Cattell–Horn–Carroll abilities and cognitive tests: What
we've learned from 20 years of research. Psychology in the Schools, 47, 635-650.
doi:10.1002/pits.20496
Kline, R. B. (2011). Principles and practice of structural equation modeling: Fourth edition.
New York, NY: Guilford Press.
Kroesbergen, E. H., Van Luit, J. E. H., Van Lieshout, E. C. D. M., Van Loosbroek, E., & Van de
Rijt, B. A. M. (2009). Individual differences in early numeracy: The role of executive
87
functions and subitizing. Journal of Psychoeducational Assessment, 27, 226-236.
doi:10.1177/0734282908330586
Langdon, D., McKittrick, G., Beede, D., Khan, B., & Doms, M. (2011). STEM: Good jobs now
and for the future (ESA #03-11). U.S. Department of Commerce, Economics and
Statistics Administration, Washington, D.C.
Li, C. H. (2016). The performance of ML, DWLS, and ULS estimation with robust corrections in
structural equation models with ordinal variables. Psychological Methods, 21, 369-387.
doi:10.1037/met0000093
Locuniak, M. N., & Jordan, N. C. (2008). Using kindergarten number sense to predict calculation
fluency in second grade. Journal of Learning Disabilities, 41, 451-459.
doi:10.1177/0022219408321126
Mazzocco, M. M., & Grimm, K. J. (2013). Growth in rapid automatized naming from Grades K
to 8 in children with math or reading disabilities. Journal of Learning Disabilities, 46,
517-533. doi: 10.1177/0022219413477475
Mazzocco, M. M., & Thompson, R. E. (2005). Kindergarten predictors of math learning
disability. Learning Disabilities Research & Practice, 20, 142-155.
doi:10.1111/j.1540-5826.2005.00129.x
MacCallum, R. C., Browne, M. W., & Sugawara, H. M. (1996). Power analysis and
determination of sample size for covariance structure modeling. Psychological Methods,
1, 130-149. doi:10.1037/1082-989X.1.2.130
McGrew, K. S. (2005). The Cattell–Horn–Carroll theory of cognitive abilities: Past, present, and
future. In D. P. Flanagan & P. L. Harrison (Eds.), Contemporary intellectual assessment:
Theories, tests, and issues (2nd ed., pp. 136–177). New York: Guilford.
88
McGrew, K. S., LaForte, E. M., & Schrank, F. A. (2014). Technical Manual. Woodcock-
Johnson IV. Rolling Meadows, IL: Riverside.
McGrew, K. S., & Wendling, B. J. (2010). Catell-Horn-Carroll cognitive-achievement relations:
What we have learned from the past 20 years of research. Psychology in the Schools, 47,
651-675. doi:10.1002/pits.20497
Melby-Lervåg, M., Lyster, S. A. H., & Hulme, C. (2012). Phonological skills and their role in
learning to read: a meta-analytic review. Psychological Bulletin, 138, 322-352.
doi:10.1037/a0026744
National Association for the Education of Young Children & National Council of Teachers of
Mathematics. (2010). Position statement. Early childhood mathematics: Promoting good
beginnings. Retrieved from: www.naeyc.org/resources/position_statements/psmath.htm
National Center for Education Statistics (2013). The nation’s report card: A first look: 2013
mathematics and reading (NCES 2014-451). Institute of Education Sciences, U.S.
Department of Education, Washington, D.C.
National Council of Teachers of Mathematics (NCTM). (2010). Principles and standards for
school mathematics. Reston, VA: Author.
National Mathematics Advisory Panel. (2008). Foundations for success: The final report of the
National Mathematics Advisory Panel. Washington, DC: Author.
Newton, J. H., & McGrew, K. S. (2010). Introduction to the special issue: Current research in
Cattell–Horn–Carroll–based assessment. Psychology in the Schools, 47, 621-634.
doi:10.1002/pits.20495
89
Norton, E. S., & Wolf, M. (2012). Rapid automatized naming (RAN) and reading fluency:
Implications for understanding and treatment of reading disabilities. Annual Review of
Psychology, 63, 427-452. doi:10.1146/annurev-psych-120710-100431
Petrill, S., Logan, J., Hart, S., Vincent, P., Thompson, L., Kovas, Y., & Plomin, R. (2012). Math
fluency is etiologically distinct from untimed math performance, decoding fluency, and
untimed reading performance: Evidence from a twin study. Journal of Learning
Disabilities, 45, 371-381. doi:10.1177/0022219411407926
Phillips, B. M., & Torgesen, J. K. (2006). Phonemic awareness and reading: Beyond the growth
of initial reading accuracy. In D. K. Dickison & S. B. Neuman (Eds.), Handbook of early
literacy research (pp. 101-112). New York, NY: The Guilford Press.
Pickering, S., & Gathercole, S. E. (2001). Working memory test battery for children (WMTB-C).
London: Psychological Corporation.
Poncy, B. C., McCallum, E., & Schmitt, A. J. (2010). A comparison of behavioral and
constructivist interventions for increasing math‐ fact fluency in a second‐ grade
classroom. Psychology in the Schools, 47, 917-930. doi:10.1002/pits.20514
Poncy, B. C., Skinner, C. H., & Jaspers, K. E. (2007). Evaluating and comparing interventions
designed to enhance math fact accuracy and fluency: Cover, copy, and compare versus
taped problems. Journal of Behavioral Education, 16, 27-37.
doi: 10.1007/s10864-006-9025-7
Procter, B., E., Floyd, R. G., & Shaver, R. B. (2005). Cattell–Horn–Carroll broad cognitive
ability profiles of low math achievers. Psychology in the Schools, 42, 1–12.
doi:10.1002/pits.20030
90
Raykov, T., & Marcoulides, G. A. (2011). Introduction to psychometric theory. New York, NY:
Routledge.
Resnick, L. B. (1989). Developing mathematical knowledge. American Psychologist, 44, 162-
169. doi:10.1037/0003-066X.44.2.162
Rhemtulla, M., & Little, T. D. (2012). Planned missing data designs for research in cognitive
development. Journal of Cognition and Development, 13, 425-438.
doi:10.1080/15248372.2012.717340
Roid, G. H. (2003). Stanford Binet Intelligence Scales (5th ed.). Austin, TX: PRO-ED.
Satterthwaite, F. E. (1946). An approximate distribution of estimates of variance components.
Biometrics Bulletin, 2, 110-114. doi:10.2307/3002019
Savage, R., & Frederickson, N. (2005). Evidence of a highly specific relationship between rapid
automatic naming of digits and text-reading speed. Brain and Language, 93, 152-159.
doi:10.1016/j.bandl.2004.09.005
Schneider, W. J., & McGrew, K. S. (2012). The Cattell-Horn-Carroll model of intelligence. In D.
P. Flanagan & P. L. Harrison (Eds.), Contemporary intellectual assessment: Theories,
tests, and issues (pp. 99-144). New York: Guilford Press.
Schrank, F. A., Mather, N., & McGrew, K. S. (2014a). Woodcock-Johnson IV Tests of
Achievement. Rolling Meadows, IL: Riverside
Schrank, F. A., Mather, N., & McGrew, K. S. (2014b). Woodcock-Johnson IV Tests of Oral
Language. Rolling Meadows, IL: Riverside.
Schrank, F. A., Miller, D. C., Wendling, B. J., & Woodcock, R. W. (2010). Essentials of WJ III
cognitive abilities assessment. Hoboken, NJ: John Wiley & Sons.
Schrank, F. A., McGrew, K. S., & Mather, N. (2014). Woodcock-Johnson IV. Rolling
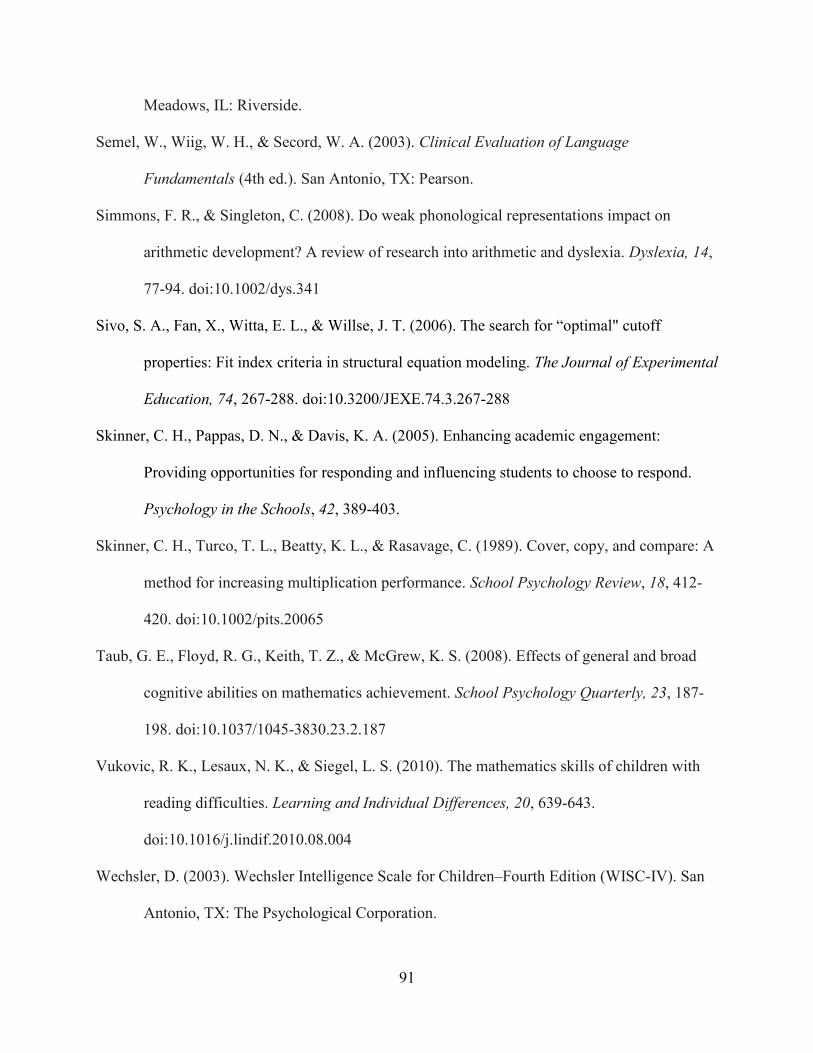
91
Meadows, IL: Riverside.
Semel, W., Wiig, W. H., & Secord, W. A. (2003). Clinical Evaluation of Language
Fundamentals (4th ed.). San Antonio, TX: Pearson.
Simmons, F. R., & Singleton, C. (2008). Do weak phonological representations impact on
arithmetic development? A review of research into arithmetic and dyslexia. Dyslexia, 14,
77-94. doi:10.1002/dys.341
Sivo, S. A., Fan, X., Witta, E. L., & Willse, J. T. (2006). The search for “optimal" cutoff
properties: Fit index criteria in structural equation modeling. The Journal of Experimental
Education, 74, 267-288. doi:10.3200/JEXE.74.3.267-288
Skinner, C. H., Pappas, D. N., & Davis, K. A. (2005). Enhancing academic engagement:
Providing opportunities for responding and influencing students to choose to respond.
Psychology in the Schools, 42, 389-403.
Skinner, C. H., Turco, T. L., Beatty, K. L., & Rasavage, C. (1989). Cover, copy, and compare: A
method for increasing multiplication performance. School Psychology Review, 18, 412-
420. doi:10.1002/pits.20065
Taub, G. E., Floyd, R. G., Keith, T. Z., & McGrew, K. S. (2008). Effects of general and broad
cognitive abilities on mathematics achievement. School Psychology Quarterly, 23, 187-
198. doi:10.1037/1045-3830.23.2.187
Vukovic, R. K., Lesaux, N. K., & Siegel, L. S. (2010). The mathematics skills of children with
reading difficulties. Learning and Individual Differences, 20, 639-643.
doi:10.1016/j.lindif.2010.08.004
Wechsler, D. (2003). Wechsler Intelligence Scale for Children–Fourth Edition (WISC-IV). San
Antonio, TX: The Psychological Corporation.

92
Wechsler D. (2009). Wechsler Individual Achievement Test--Third Edition (WIAT-III). San
Antonio, TX: The Psychological Corporation.
Wechsler, D. (2014). Wechsler Intelligence Scale for Children--Fifth Edition (WISC-V).
Bloomington, MN: Pearson.
Woodcock, R. W., Johnson, M. B., & Mather, N. (1989). Woodcock-Johnson Psycho-
educational Battery--Revised: Woodcock-Johnson tests of cognitive ability. DLM
Teaching Resources.
Woodcock, R. W., McGrew, K. S., & Mather, N. (2001a). Woodcock-Johnson III Tests of
Cognitive Abilities. Itasca, IL: Riverside Publishing.
Woodcock, R. W., McGrew, K. S., & Mather, N. (2001b). Woodcock-Johnson III Tests of
Achievement. Itasca, IL: Riverside Publishing.
Yves Rosseel (2012). lavaan: An R package for structural equation modeling. Journal of
Statistical Software, 48, 1-36. URL http://www.jstatsoft.org/v48/i02/
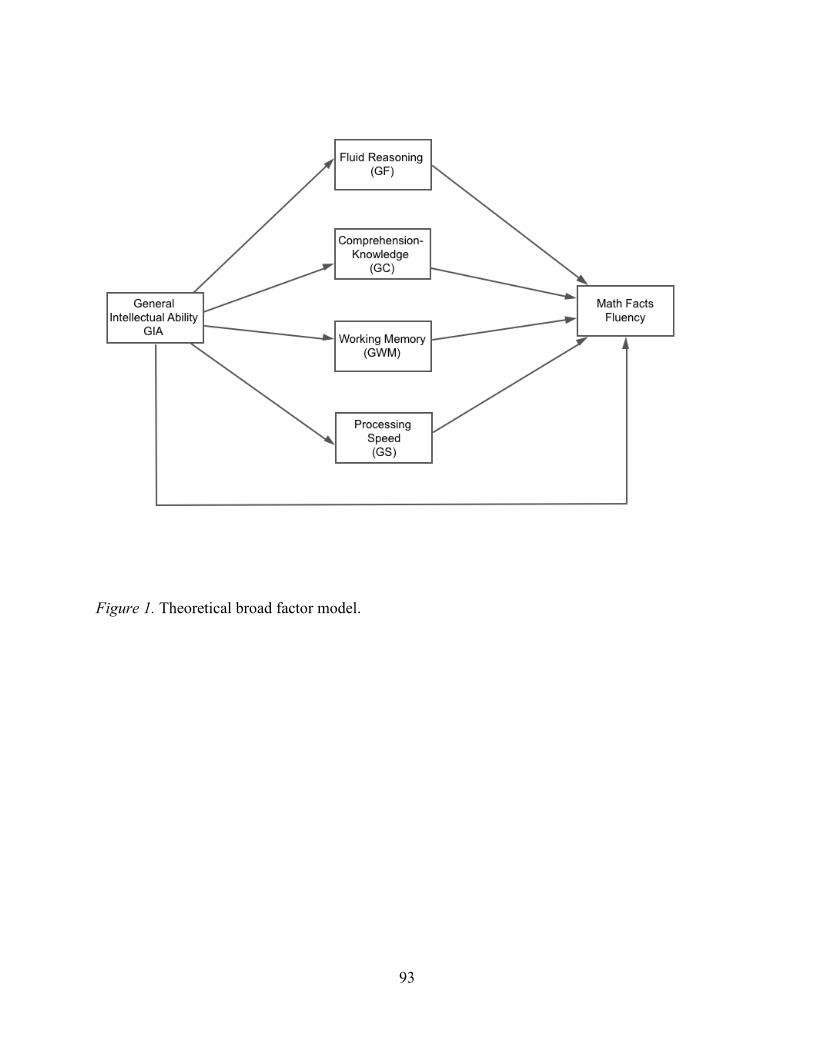
93
Figure 1. Theoretical broad factor model.

94
Figure 2. Theoretical narrow factor model.

95
Figure 3. First alternative broad factor model.

96
Figure 4. Second alternative broad factor model.
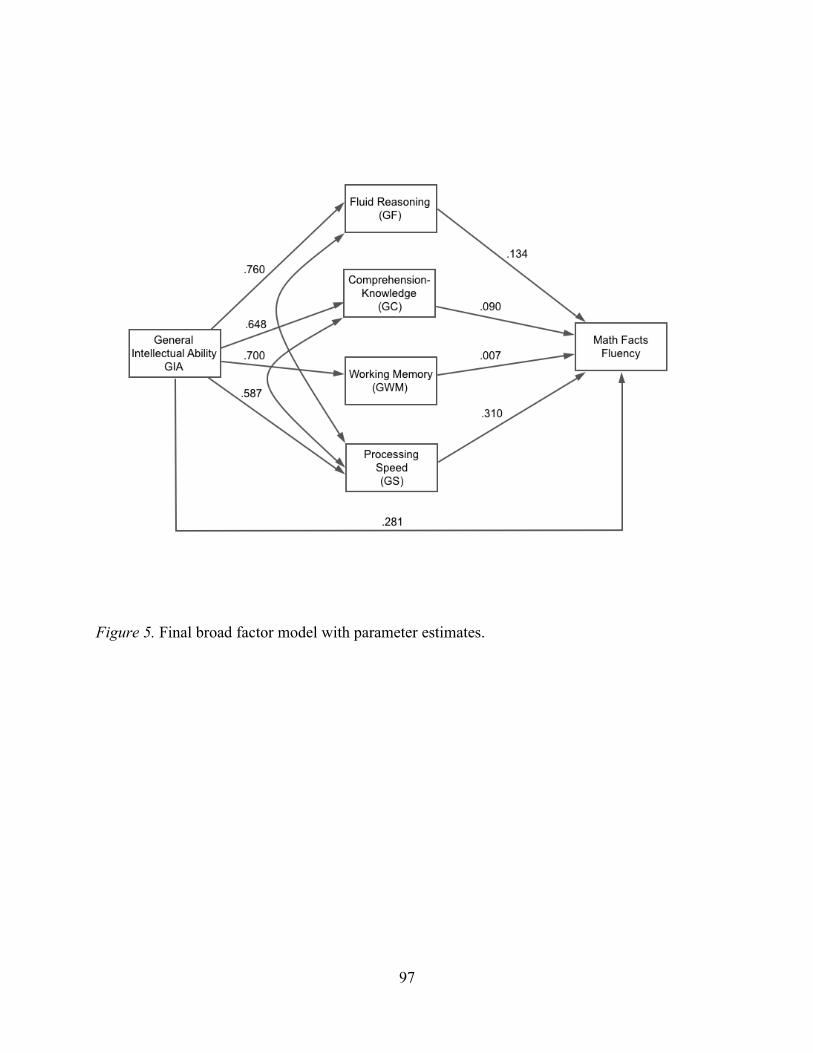
97
Figure 5. Final broad factor model with parameter estimates.
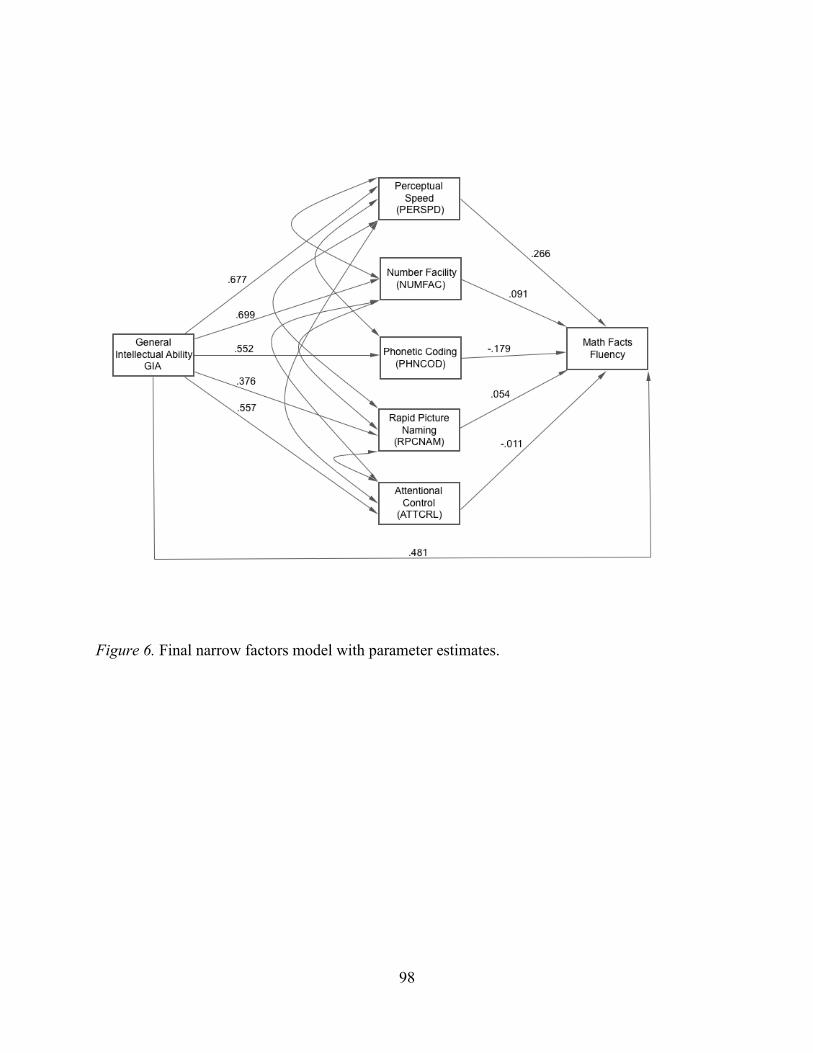
98
Figure 6. Final narrow factors model with parameter estimates.
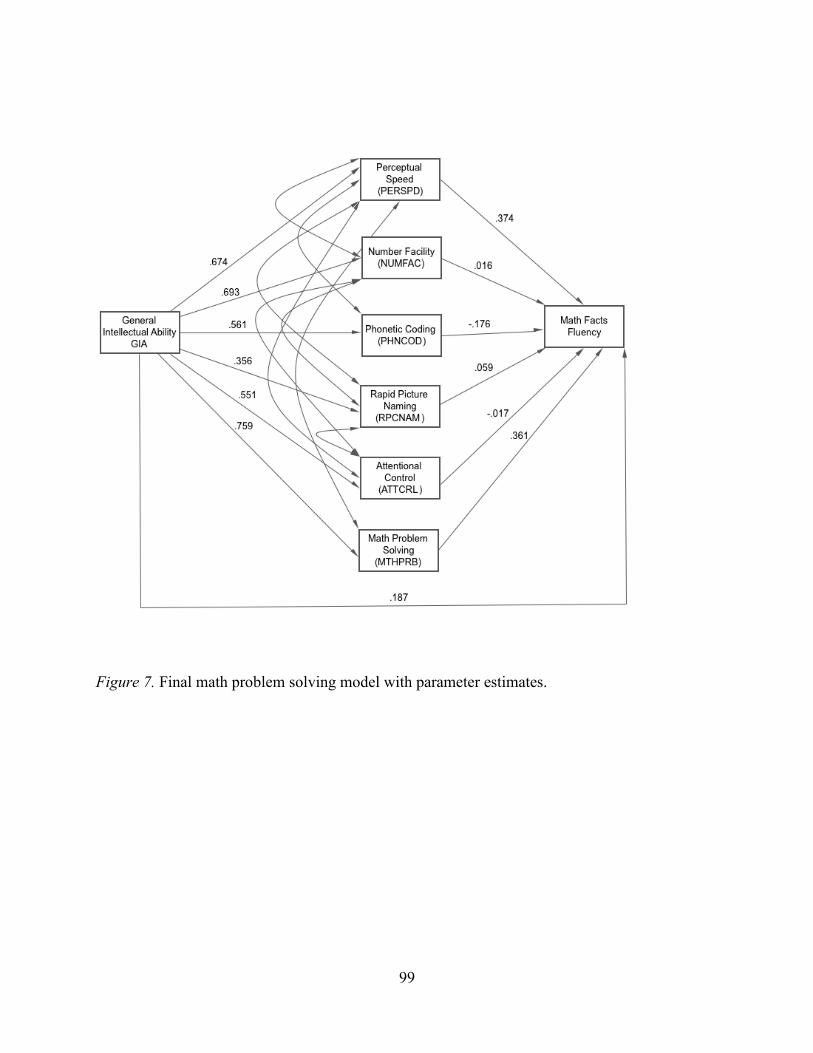
99
Figure 7. Final math problem solving model with parameter estimates.