Embed Size (px)
Citation preview
Thirteenth ARM Science Team Meeting Proceedings, Broomfield, Colorado, March 31-April 4, 2003
Tools for Viewing and Quality Checking ARM Data
S. Bottone and S. Moore Mission Research Corporation
Santa Barbara, California Introduction Mission Research Corporation (MRC) is developing software tools to assist the Atmospheric Radiation Measurement (ARM) Data Quality Office with their data inspection tasks. One such tool is NCVweb, a web-based data analysis and visualization tool that allows for easy viewing of ARM NetCDF data files. This tool helps to eliminate the need of and problems associated with downloading large volumes of data, installing and configuring visualization software, or writing custom data exploration software. It has been upgraded this year with many new features described below. NCVweb can be used at the ARM Data Quality website directly via http://dq.arm.gov/ncvweb/ncvweb.cgi, or via the Data Quality Health and Status (DQ HandS) interactive plot link. NCVweb is also being integrated into the ARM archive to allow easy viewing of standing order datastreams or datastreams ordered by an archive user. Users will be able to view data sets before deciding on whether to download files. MRC also contributes to the DQ HandS system by analyzing ARM value-added product (VAP) and Quality Measurement Experiment (QME) datastreams, providing assessments of data quality in the form of color-coded tables, and custom visualizations. Here we briefly describe data quality analyses of the Raman lidar profile (RL PROF) VAP and the Shortwave Flux Analysis (SW FLUX ANAL) VAP. NCVWEB Visualization Tool Overview General Plotting Features • plots data across multiple files • detects and does not plot data points designated as “missing” • plots any compatible variable against any other • allows zoom-in to any data region • detects and does not connect data across significant time gaps • provides useful time conversions for the time axis • allows for various symbol and/or line combinations • supports multiple plot sizes to accommodate various screen sizes • generates appropriate plot labels based on the data being viewed.
1

Thirteenth ARM Science Team Meeting Proceedings, Broomfield, Colorado, March 31-April 4, 2003
Three-Dimensional Viewing Features • color image plots • horizontal slices (up to six slices) • vertical slices (up to six slices) • x/y axis flip • choice of color tables.
Additional Features • computes statistics for the aggregate data set • displays textual data values of the current zoom region • highlights data that have tripped embedded quality control flags • displays details of file contents, variables, and dimensions • thorough error checking and reporting • online help and directions.
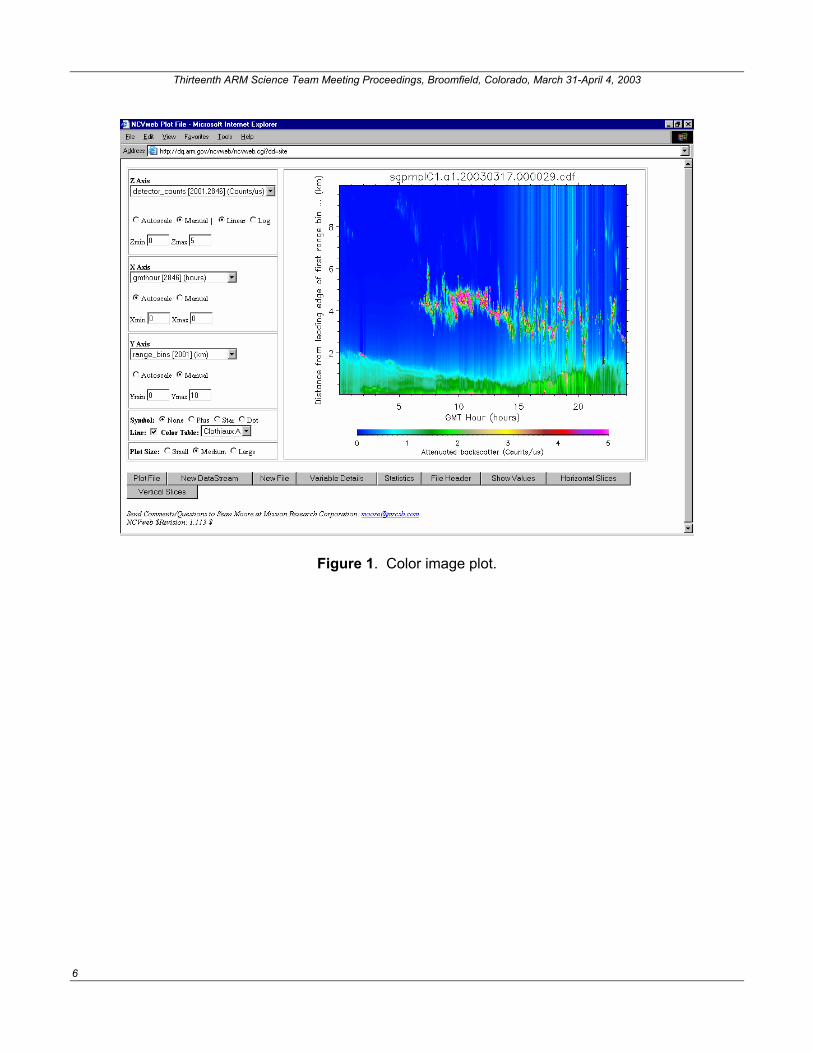
Three-Dimensional Plotting (new) NCVweb has three modes to plot three-dimensional data: color image plots, horizontal slices and vertical slices. If the NetCDF file to be plotted contains two-dimensional arrays, the plot page will display a choice of z-axis variables, in addition to the x- and y-axis choices. The z-axis pop-up menu has a choice of all variables in the files that are two-dimensional arrays. By choosing one of these variables, the x- and y-variable choices will automatically change to a set of variables, including index variables, which are compatible with the array to be plotted. Figure 1 shows a sample color image plot. The user may choose to view the selected z variable using either horizontal or vertical slices. Up to six slices may be plotted. If, for example, the z variable is a function of time and height, the user may plot horizontal slices as functions of time keeping height fixed, or plot horizontal slices as functions of height keeping time fixed. The same is true with vertical slice plots; any combination can be plotted. Figure 2 shows a sample horizontal slice plot. Vertical slice plots are similar. The user may zoom in to any region of each type of three-dimensional plot. A choice of color tables is available for the color image plots. The user may choose the bounds on the color image table, either linear or log. By clicking “Show Values”, a formatted three-dimensional table displays up to 1800 data values. Plotting Multiple Files (new) The user may now choose to plot data in more than one NetCDF file. The “Choose File(s)” page now includes a multiple scroll list, allowing the user to choose any or all files from the file list. These files do not need to be contiguous. The default time variable for multiple file plots is day of year (DOY) which is provided as a pseudo-variable by NCVweb. Multiple files may be used with all types of plots and the statistical information page gives statistics for the aggregate data in all of the chosen files.
2
Thirteenth ARM Science Team Meeting Proceedings, Broomfield, Colorado, March 31-April 4, 2003
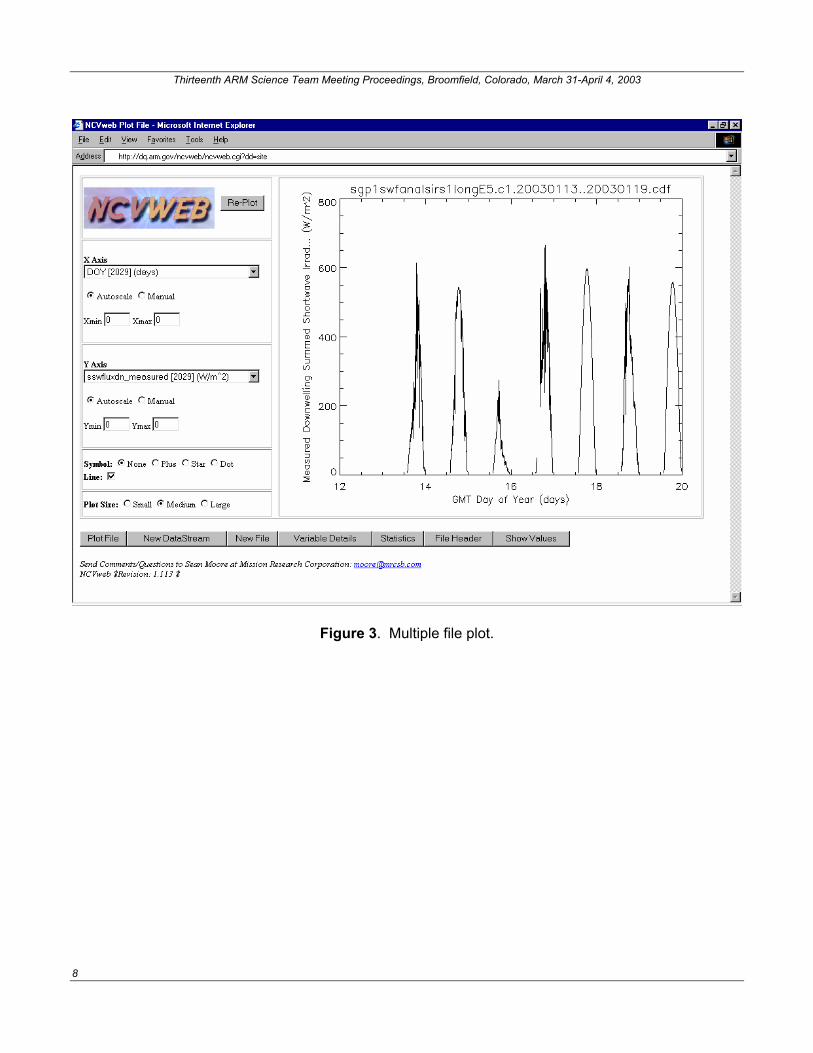
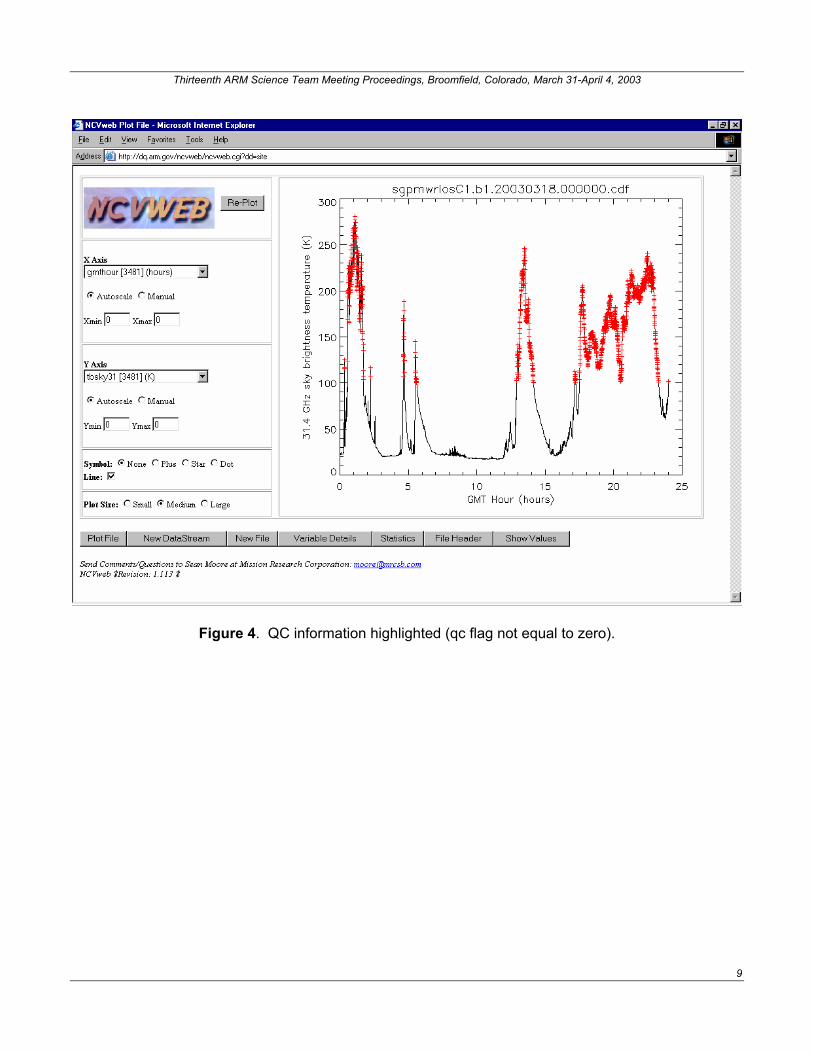
Figure 3 shows a sample plot for one week’s worth (seven files) of data. Note that when connecting the data on the plot with a line, points that are sufficiently separated in time are not connected with the line. This demonstrates the automatic time gap detection feature. Automatic QC Checking (new) If the NetCDF file contains variables with corresponding quality control (QC) variables (the variable name has ‘qc_’ prefixed to it, e.g., ‘tbsky31’ and ‘qc_tbsky31’), NCVweb automatically detects these variables and uses them to highlight data that have QC problems. An x-y plot of a variable will have red markers at all points where the data has QC problems, if the corresponding QC variable is not equal to zero (zero indicates ‘good’ data). Figure 4 shows a sample plot with QC problem points indicated by red markers. The number of outliers (qc variable not equal to zero) for each variable in the NetCDF file that has a corresponding QC variable is given on the statistics page. DQ Analyses We have recently analyzed the Raman Lidar Profile (RL PROF) VAP and the Shortwave Flux Analysis (SW FLUX ANAL) VAP and provided software to the DQ HandS system to construct the color-coded tables and diagnostic plots for those data streams. Raman Lidar Profile VAPs Analysis There are five Raman lidar VAPs. 1. RLPROF-MR, which derives calibrated water vapor mixing ratio profiles from the Raman lidar 2. RLPROF-ASR, which derives calibrated aerosol scattering ratio profiles 3. RLPROF-EXT, which computes aerosol extinction coefficient profiles from the raw backscattered
data collected by the Raman lidar 4. RLPROF-DEP, which produces linear depolarization ratio profiles 5. RLPROF-BE, whose primary goal is to package all of the primary scientific products derived by the
other Raman lidar VAPs (MR, ASR, EXT, and DEP) into a single NetCDF file with the same vertical and temporal resolution.
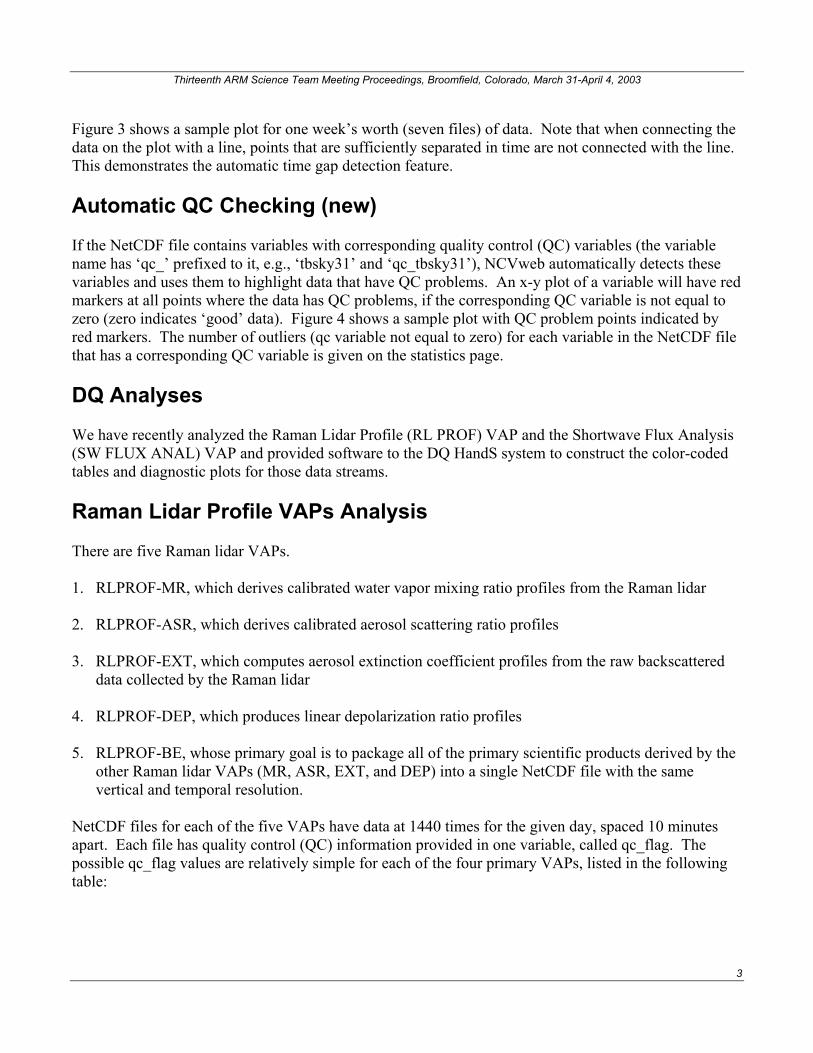
NetCDF files for each of the five VAPs have data at 1440 times for the given day, spaced 10 minutes apart. Each file has quality control (QC) information provided in one variable, called qc_flag. The possible qc_flag values are relatively simple for each of the four primary VAPs, listed in the following table:
3
Thirteenth ARM Science Team Meeting Proceedings, Broomfield, Colorado, March 31-April 4, 2003
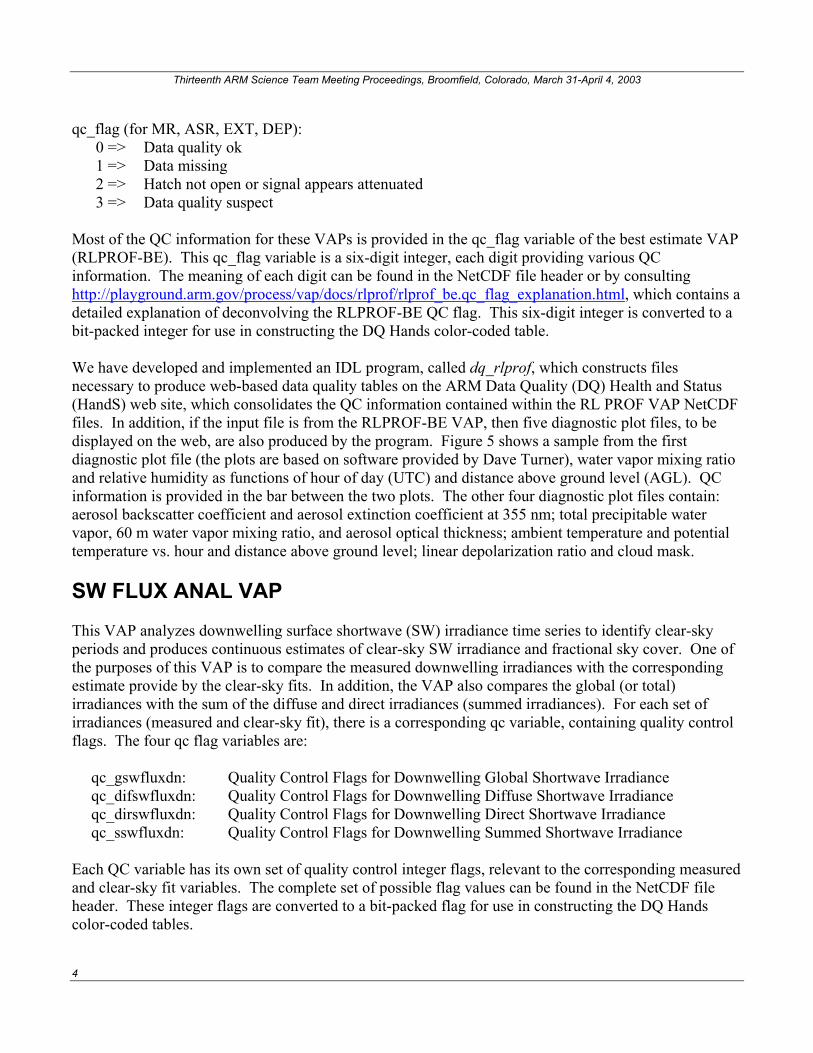
qc_flag (for MR, ASR, EXT, DEP): 0 => Data quality ok 1 => Data missing 2 => Hatch not open or signal appears attenuated 3 => Data quality suspect Most of the QC information for these VAPs is provided in the qc_flag variable of the best estimate VAP (RLPROF-BE). This qc_flag variable is a six-digit integer, each digit providing various QC information. The meaning of each digit can be found in the NetCDF file header or by consulting http://playground.arm.gov/process/vap/docs/rlprof/rlprof_be.qc_flag_explanation.html, which contains a detailed explanation of deconvolving the RLPROF-BE QC flag. This six-digit integer is converted to a bit-packed integer for use in constructing the DQ Hands color-coded table. We have developed and implemented an IDL program, called dq_rlprof, which constructs files necessary to produce web-based data quality tables on the ARM Data Quality (DQ) Health and Status (HandS) web site, which consolidates the QC information contained within the RL PROF VAP NetCDF files. In addition, if the input file is from the RLPROF-BE VAP, then five diagnostic plot files, to be displayed on the web, are also produced by the program. Figure 5 shows a sample from the first diagnostic plot file (the plots are based on software provided by Dave Turner), water vapor mixing ratio and relative humidity as functions of hour of day (UTC) and distance above ground level (AGL). QC information is provided in the bar between the two plots. The other four diagnostic plot files contain: aerosol backscatter coefficient and aerosol extinction coefficient at 355 nm; total precipitable water vapor, 60 m water vapor mixing ratio, and aerosol optical thickness; ambient temperature and potential temperature vs. hour and distance above ground level; linear depolarization ratio and cloud mask. SW FLUX ANAL VAP This VAP analyzes downwelling surface shortwave (SW) irradiance time series to identify clear-sky periods and produces continuous estimates of clear-sky SW irradiance and fractional sky cover. One of the purposes of this VAP is to compare the measured downwelling irradiances with the corresponding estimate provide by the clear-sky fits. In addition, the VAP also compares the global (or total) irradiances with the sum of the diffuse and direct irradiances (summed irradiances). For each set of irradiances (measured and clear-sky fit), there is a corresponding qc variable, containing quality control flags. The four qc flag variables are:
qc_gswfluxdn: Quality Control Flags for Downwelling Global Shortwave Irradiance qc_difswfluxdn: Quality Control Flags for Downwelling Diffuse Shortwave Irradiance qc_dirswfluxdn: Quality Control Flags for Downwelling Direct Shortwave Irradiance qc_sswfluxdn: Quality Control Flags for Downwelling Summed Shortwave Irradiance
Each QC variable has its own set of quality control integer flags, relevant to the corresponding measured and clear-sky fit variables. The complete set of possible flag values can be found in the NetCDF file header. These integer flags are converted to a bit-packed flag for use in constructing the DQ Hands color-coded tables.
4

Thirteenth ARM Science Team Meeting Proceedings, Broomfield, Colorado, March 31-April 4, 2003
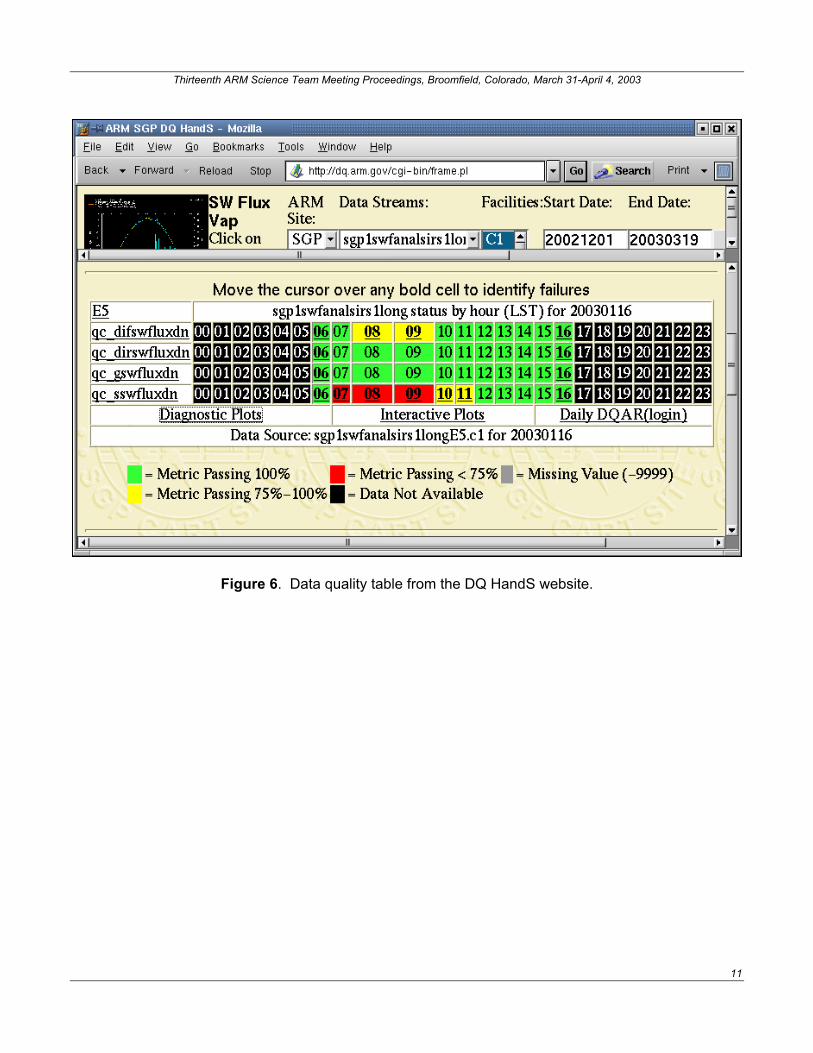
We have developed and implemented an IDL program, called dq_swanal, which constructs files necessary to produce web-based data quality tables on the ARM DQ HandS web site. It consolidates the QC information contained within the SW FLUX ANAL VAP NetCDF files. In addition, diagnostic plots, to be displayed on the web, are also produced by the program. Figure 6 shows a sample color-coded table from the DQ HandS website. It indicates that for the date 20030116, the summed shortwave irradiance QC flag showed problems between hours 7 and 11 and the diffuse shortwave irradiance QC flag showed problems during hours 8 and 9. One of the diagnostic plots for this day is shown in Figure 7. It contains plots of all four measured shortwave irradiances as functions of time, with those points having QC problems (QC flag not equal to zero) indicated by red markers. If the “Interactive Plots” link is clicked on the HandS table, the user will connect to NCVweb with the appropriate data file already loaded. At this point the user can choose “New File” and choose the days surrounding 20030116 to make the plot that appears in Figure 3. Acknowledgment This research was supported by the Biological and Environmental Research Program (BER), U.S. Department of Energy, Grant No. DE-FG03-97ER62468. Corresponding Author S. T. Moore, [email protected], (805) 963-8761, ext 243
5
Thirteenth ARM Science Team Meeting Proceedings, Broomfield, Colorado, March 31-April 4, 2003
Figure 1. Color image plot.
6

Thirteenth ARM Science Team Meeting Proceedings, Broomfield, Colorado, March 31-April 4, 2003
Figure 2. Horizontal splice plot.
7
Thirteenth ARM Science Team Meeting Proceedings, Broomfield, Colorado, March 31-April 4, 2003
Figure 3. Multiple file plot.
8
Thirteenth ARM Science Team Meeting Proceedings, Broomfield, Colorado, March 31-April 4, 2003
Figure 4. QC information highlighted (qc flag not equal to zero).
9

Thirteenth ARM Science Team Meeting Proceedings, Broomfield, Colorado, March 31-April 4, 2003
Figure 5. Water vapor mixing ratio and relative humidity as functions of hour of day (UTC) and distance above ground level (AGL). Quality control (QC) information is provided in the bar between the two plots.
10
Thirteenth ARM Science Team Meeting Proceedings, Broomfield, Colorado, March 31-April 4, 2003
Figure 6. Data quality table from the DQ HandS website.
11

Thirteenth ARM Science Team Meeting Proceedings, Broomfield, Colorado, March 31-April 4, 2003
12
Figure 7. Measured downwelling global shortwave irradiance, diffuse shortwave irradiance, direct shortwave irradiance, and summed shortwave irradiance as a function of local standard time (LST). Nonzero qc flags are indicated by a red cross (+).