Embed Size (px)
Citation preview
Tools for Traces, Logs, and Plug-Ins
• Trace and Log Central, page 1
• Import Certificates, page 2
• View Trace and Log Central Options, page 2
• Trace Files Collection, Throttling, and Compression, page 3
• Collect Trace Files, page 4
• Collect Installation Logs, page 7
• Collect and Download Trace Files Using Query Wizard, page 7
• Schedule Trace Collection, page 12
• View Trace Collection Status, page 14
• Collect Crash Dump, page 15
• Collect Audit Logs, page 17
• Display Downloaded Trace Files Using Local Browse, page 21
• Display and Download Trace Files Using Remote Browse, page 21
• Display Report Information, page 24
• Real-Time Trace, page 25
• Edit Trace Settings, page 28
• Log Compression, page 29
• Display Messages in SysLog Viewer, page 29
• Download and Install Application Plug-Ins, page 31
• Launch Application Plug-Ins, page 31
Trace and Log CentralThe Trace and Log Central feature in RTMT allows you to configure on-demand trace collection for a specificdate range or an absolute time. You can collect trace files that contain search criteria that you specify and
Cisco Unified Real-Time Monitoring Tool Administration Guide, Release 9.0(1) OL-24544-01 1
save the trace collection criteria for later use, schedule one recurring trace collection and download the tracefiles to a SFTP or FTP server on your network, or collect a crash dump file.
From Cisco Unified Serviceability, you can also edit the trace setting for the traces on the node that youhave specified. Enabling trace settings decreases system performance; therefore, enable Trace only fortroubleshooting purposes.
Note
After you collect the files, you can view them in the appropriate viewer within the real-time monitoring tool.You can also view traces on the node without downloading the trace files by using the remote browse feature.You can open the trace files by either selecting the internal viewer that is provided with Unified RTMT orchoosing an appropriate program as an external viewer.
Note • To use the Trace and Log Central feature, make sure that RTMT can directly access the node or allof the nodes in a cluster without Network Access Translation (NAT). If you have set up a NAT toaccess devices, configure the nodes with a hostname instead of an IP address and make sure that thehostnames and their routable IP address are in the DNS node or host file.
• For devices that support encryption, the SRTP keying material does not display in the trace file.
Import CertificatesFollow this procedure to import the node certificates.
You can import the server authentication certificate that the certificate authority provides for the node or foreach node in the cluster.
We recommend that you import the certificates before using the trace and log central option. If you do notimport the certificates, the Trace and Log Central option displays a security certificate for the nodes each timethat you sign in to Unified RTMT and access the Trace and Log Central option. You cannot change any datathat displays for the certificate.
Procedure
Step 1 To import the certificate, choose Tools > Trace > Import Certificate.A messages appears that states that the system imported the node certificates.
Step 2 Click OK.
View Trace and Log Central OptionsFollow this procedure to view Trace and Log Central options in Unified RTMT.
Cisco Unified Real-Time Monitoring Tool Administration Guide, Release 9.0(1)2 OL-24544-01
Tools for Traces, Logs, and Plug-InsImport Certificates
From any option that displays in the tree hierarchy, you can specify the services and applications for whichyou want traces, specify the logs and servers that you want to use, schedule a collection time and date,configure the ability to download the files, configure zip files, and delete collected trace files.
Note
For devices that support encryption, the SRTP keying material does not display in the trace file.Note
Before You Begin
Before you begin, import the security certificates.
Procedure
Step 1 Perform one of the following actions to access Trace and Log Central:a) Select System in the Quick Launch Channel.b) Select System > Tools > Trace > Trace & Log Central.c) Select the Trace & Log Central icon in the tree hierarchy.
Step 2 Perform one of the following tasks after you display the Trace and Log Central options in the Real-TimeMonitoring Tool:
• Collect traces for services, applications, and system logs on one or more servers in the cluster.
• Collect and download trace files that contain search criteria that you specify as well as save trace collectioncriteria for later use.
• Collect a crash dump file for one or more servers on your network.
• View the trace files that you have collected.
• View all of the trace files on the server.
• View the current trace file being written on the server for each application. You can perform a specifiedaction when a search string appears in the trace file.
Trace Files Collection, Throttling, and CompressionThe Collect Files option in Trace and Log Central collects traces for services, applications, and system logson the server or on one or more servers in the cluster.
The services that you have not activated also appear, so you can collect traces for those services.Note
Cisco Unified Real-Time Monitoring Tool Administration Guide, Release 9.0(1) OL-24544-01 3
Tools for Traces, Logs, and Plug-InsTrace Files Collection, Throttling, and Compression
RTMT Trace and Log Central Disk I/O and CPU Throttling
RTMT supports the throttling of critical Trace and Log Central operations and jobs, whether they are runningon demand, scheduled, or automatic. The throttling slows the operations when I/O utilization is in high demandfor call processing, so call processing can take precedence.
When you make a request for an on-demand operation when the call processing node is running under highI/O conditions, the system displays a warning that gives you the opportunity to abort the operation. You canconfigure the I/O rate threshold values that control when the warning displays with the following serviceparameters (in Cisco RIS Data Collector service):
• TLC Throttling CPU Goal
• TLC Throttling IOWait Goal
The system compares the values of these parameters against the actual system CPU and IOWait values. If thegoal (the value of the service parameter) is lower than the actual value, the system displays the warning.
Trace Compression Support
This feature enables the ROS (Recoverable Outstream) library to support the compressed output of tracefiles.The files get compressed as they are being generated. The benefits of tracefile compression include thefollowing:
• Reduces the capacity that is required to store tracefiles.
• Reduces the disk head movement, which results in significantly improved disk I/O wait. This reductionprovides value when tracefile demand is high.
Use the enterprise parameter Trace Compression to enable or disable trace compression. The default valuefor this parameter is Disabled. For information about setting the values of enterprise parameters, see the“Enterprise Parameters Configuration” chapter in theCisco Unified Communications Manager AdministrationGuide.
Compressing files adds additional CPU cycles. Enabling the Trace Compression enterprise parameter cannegatively affect overall call throughput by as much as 10 percent.
Caution
You can recognize compressed files by their .gz extension (.gzo if the file is still being written to). To opena compressed file, double-click the filename, and the file opens in the log viewer.
Collect Trace FilesUse the Collect Files option in Trace and Log Central to collect traces for services, applications, and systemlogs on one or more nodes in the cluster. You specify date and time range for which you want to collect traces,the directory in which to download the trace files and whether to delete the collected files from the node.
Follow this procedure to collect traces using the trace and log central feature.
The services that you have not activated also appear, so you can collect traces for those services.Note
Cisco Unified Real-Time Monitoring Tool Administration Guide, Release 9.0(1)4 OL-24544-01
Tools for Traces, Logs, and Plug-InsCollect Trace Files
Use the Query Wizard if you want to collect trace files that contain search criteria that you specify or youwant to use trace collection criteria that you saved for later use.
Before You Begin
Perform one or more of the following actions:
• Configure the information that you want to include in the trace files for the various services from theTrace Configuration window in Cisco Unified Serviceability. For more information, see theCisco UnifiedServiceability Administration Guide.
• If you want alarms to be sent to a trace file, choose an SDI or SDL trace file as the alarm destination intheAlarmConfigurationwindow in Cisco Unified Serviceability. For more information, see the CiscoUnified Serviceability Administration Guide.
• Configure the throttling of critical Trace and Log Central operations and jobs by setting the values ofthe TLC Throttling CPU Goal and TLC Throttling IOWait Goal service parameters (Cisco RIS DataCollector service). For more information on configuring service parameters, see the Cisco UnifiedCommunications Manager Administration Guide.
Procedure
Step 1 Open the Trace and Log Central options.Step 2 In the Trace & Log Central tree hierarchy, double-click Collect Files.
The Trace Collection wizard appears. The services that you have not activated also appear, so you can collecttraces for those services.
Unified Communications Manager and Cisco Unity Connection clusters: If any node in the clusteris not available, a dialog box appears with a message that indicates which node is not available. Theunavailable node will not appear in the Trace and Log Central windows.
Note
Unified Communications Manager and Cisco Unity Connection clusters: You can install some ofthe listed services/applications only on a particular node in the cluster. To collect traces for thoseservices/applications, make sure that you collect traces from the node on which you have activatedthe service/application.
Note
Step 3 Cisco Unity Connection users go to Step 4. For Unified Communations Manager or Cisco Business Edition,perform one of the following actions in the Select CCM Services/Application tab:a) To collect traces for all services and applications for all nodes in a cluster, check the Select All Services
on All Servers check box and click Next.If you have a standalone node and check the Select All Services on All Servers check box, thesystem collects traces for all service and applications for your standalone node.
Note
b) To collect traces for all services and applications on a particular node (or for particular system logs on thenode for Cisco Unity Connection), check the check box next to the node and click Next.
c) To collect traces for particular services or applications on particular nodes, check the check boxes thatapply and click Next.
d) To go to the next tab without collecting traces for services or applications, click Next.Go to Step 4 for Cisco Business Edition or go to Step 5 for Unified Communications Manager.
Step 4 In the Select CUC Services/Application tab, perform one of the following tasks:a) To collect all system logs for the node, check the Select All Services on all Servers check box or check
the check box next to the node and click Next.b) To collect traces for particular system logs on the node, check the check boxes that apply and click Next.
Cisco Unified Real-Time Monitoring Tool Administration Guide, Release 9.0(1) OL-24544-01 5
Tools for Traces, Logs, and Plug-InsCollect Trace Files
c) To go to the next tab without collecting traces for system logs, click Next.
Step 5 In the Select System Services/Application tab, perform one of the following tasks:a) To collect all system logs for all nodes in a cluster, check the Select All Services on all Servers check
box and click Next.If you have a standalone node and check the Select All Services on All Servers check box, thesystem collects traces for your standalone node.
Note
b) To collect traces for all system logs on a particular node, check the check box next to the node and clickNext.
c) To collect traces for particular system logs on particular nodes, check the check boxes that apply and clickNext.
d) To continue the trace collection wizard without collecting traces for system logs, click Next.
Step 6 In the Collection Time pane, specify the time range for which you want to collect traces. Choose one of thefollowing options:a) Absolute Range: Specify the node time zone and the time range (start and end date and time) for which
you want to collect traces.The time zone of the client machine provides the default setting for the Select Reference Server TimeZone field. All the standard time zones, along with a separate set of entries for all time zones that haveDaylight Saving settings, appear in the Select Time Zone drop-down list box.
Trace and Log Central downloads the file with a time range that is based on your Selected ReferenceServer Time Zone field. If you have nodes in a cluster in a different time zone, TLC will adjust for thetime change and get files for the same period of time. For example, if you specify files from 9:00 a.m. to10:00 a.m. and you have a second node (node x) that is in a time zone that is one hour ahead, TLC willdownload files from 10:00 a.m. to 11:00 a.m. from node x.
To set the date range for which you want to collect traces, choose the drop-down list box in the FromDate/Time and To Date/Time fields.
b) Relative Range: Specify the time (in minutes, hours, days, weeks, or months) prior to the current timefor which you want to collect traces.
Unified RTMT returns logs of a different time stamp, than that configured through the wizard.This occurs specifically, when the specified time stamp is lesser than that of the existing log files.
Log files exist on the node for a specific service from 11/24/09, and you have given the timerange from 11/23/09 5:50 to 11/23/09 7:50; Unified RTMT still returns the existing log files.
Note
Step 7 In the Download File option group box, specify the options that you want for downloading traces. From theSelect Partition drop-down list box, choose the partition that contains the logs for which you want to collecttraces.Cisco Unified Serviceability stores the logs for the version of application that you are logged in to in the activepartition and stores the logs for the other version (if installed) in the inactive directory.
This means that when you upgrade from one version of Unified Communications Manager, Cisco BusinessEdition 5000, or Cisco Unity Connection that is running on an appliance node to another version, and yourestart the node with the new version, Cisco Unified Serviceability moves the logs of the previous version tothe inactive partition and stores logs for the newer version in the active partition. If you log back in to theolder version, Cisco Unified Serviceability moves the logs for the newer version to the inactive partition andstores the logs for the older version in the active directory.
Cisco Unified Serviceability does not retain logs from Unified Communications Manager or CiscoUnity Connection versions that ran on the Windows platform.
Note
Step 8 To specify the directory in which you want to download the trace files, click the Browse button next to theDownload File Directory field, navigate to the directory, and click Open. The default specifies
Cisco Unified Real-Time Monitoring Tool Administration Guide, Release 9.0(1)6 OL-24544-01
Tools for Traces, Logs, and Plug-InsCollect Trace Files
<rtmt_install_directory>\<server name or server IP address>\<downloadtime> where <rtmt_install_directory> specifies the directory where Unified RTMT is installed.
Step 9 To create a zip file of the trace files that you collect, choose the Zip File radio button. To download the tracefiles without zipping the files, choose the Do Not Zip Files radio button.
Step 10 To delete collected log files from the node, check theDelete Collected Log Files from the server check box.Step 11 Click Finish or, to abort the settings, click Cancel.
If you clicked Finish, the window shows the progress of the trace collection.
When the trace collection process is complete, the message “Completed downloading for node <Server nameor IP address>” appears at the bottom of the window.
Step 12 To view the trace files that you collected, you can use the Local Browse option of the trace collection feature.You will see a message if the service parameter values are exceeded or if the system is in code yellow.Note
Collect Installation LogsFollow this procedure to collect installation and upgrade logs.
Procedure
Step 1 Choose Tools > Trace > Trace & Log Central.The Trace & Log Central window appears.
Step 2 In the Trace & Log Central tree hierarchy, double-click Collect Install Logs.The Collect Install Logs wizard appears.
Step 3 In the Select Servers Options box, specify from which server you would like to collect the install logs.
• To collect the install logs for a particular server, check the check box next to the server.
• To collect the install logs for all servers, check the Select All Servers check box.
Step 4 In the Download File Options, specify the directory where you want to download the log file. To specify thedirectory in which you want to download the log files, click Browse next to the Download File Directoryfield, navigate to the directory, and click Open. The default specifies <rtmt_install_directory>where <rtmt_install_directory> specifies the directory where Unified RTMT is installed..
Step 5 Click Finish.
Collect and Download Trace Files Using Query WizardThe Trace Collection Query Wizard allows you to collect and download trace files that contain search criteriathat you specify as well as to save trace collection criteria for later use. To use the Trace Collection QueryWizard, perform the following procedure.
Cisco Unified Real-Time Monitoring Tool Administration Guide, Release 9.0(1) OL-24544-01 7
Tools for Traces, Logs, and Plug-InsCollect Installation Logs
You can open a maximum of five concurrent files for viewing within Trace and Log Central. This includesusing the Query Wizard, Local Browse, and Remote Browse features.
Note
Before You Begin
Perform one or more of the following tasks:
• From the Trace Configuration window in Cisco Unified Serviceability, configure the information thatyou want to include in the trace files for the various services. For more information, refer toCisco UnifiedServiceability Administration Guide.
• If you want alarms to be sent to a trace file, choose an SDI or SDL trace file as the alarm destination inthe Alarm Configuration window. For more information, refer to Cisco Unified ServiceabilityAdministration Guide.
Procedure
Step 1 Display the Trace and Log Central options.Step 2 In the Trace & Log Central tree hierarchy, double-click Query Wizard.
The Query wizard appears.
Step 3 In the Query Wizard Options window, click one of the following radio buttons, and then click Next tomodify the query.
• Saved QueryClick theBrowse button to navigate to the query that you want to use. Choose the query and clickOpen.
If you choose a single-node, generic query, the server to which RTMT is connected appears with acheckmark next to the Browse button. You can run the query on additional servers in a cluster by placinga checkmark next to those servers.
If you choose an all-node, generic query, all servers in the cluster appears with a checkmark next to theBrowse button. You can uncheck any server for which you do not want to run the query.
If you chose a regular query, all of the servers that you selected when you saved the query display witha checkmark. You can check or uncheck any servers in the list. If you choose new servers, you must usethe wizard to choose the services for that server.
To run the query without any modifications, click Run Query and go to Step 17, on page 11.
• Create Query
Step 4 If you clicked the Saved Query radio button and chose a query, the criteria that you specified for query display.If necessary, modify the list of services/applications for which you want to collect traces. If you clicked theCreate Query radio button, you must choose all services/applications for which you want to collect traces.
To collect traces for all services and applications on a particular server, check the check box next tothe server name or server IP address. To collect traces for all services and applications for all serversin a Cisco Unified Communications Manager cluster, check the Select All Services on All Serverscheck box. To collect traces for particular system logs on the server, check the check boxes that apply
Tip
The services that you have not activated also appear, so you can collect traces for those services.Note
Cisco Unified Real-Time Monitoring Tool Administration Guide, Release 9.0(1)8 OL-24544-01
Tools for Traces, Logs, and Plug-InsCollect and Download Trace Files Using Query Wizard
If you have a cluster configuration, you can install some of the listed services/applications only ona particular server in the cluster. To collect traces for those services/applications, make sure that youcollect traces from the server on which you have activated the service/application.
Note
Step 5 Cisco Unity Connection users go to Step 7, on page 9. For Unified Communications Manager or CiscoBusiness Edition, choose the services and application logs in which you are interested by checking all checkboxes that apply in the Select CallManager Services/Applications tab.
Step 6 Click Next. Unified Communications Manager users go to Step 8, on page 9.Step 7 In the Select CUC Services/Application tab, choose the services and application logs in which you are
interested by checking all check boxes that apply, then click Next.Step 8 In the Select System Logs tab, choose the logs in which you are interested by checking all check boxes that
apply, then click Next.Step 9 In the Query Time Options box, specify the time range for which you want to collect traces. Choose one of
the following options:
• All Available Traces: Choose this option to collect all the traces on the server for the service(s) thatyou chose.
• Absolute Range: Specify the server time zone and the time range (start and end date and time) for whichyou want to collect traces.
The time zone of the client machine provides the default setting for the Select Reference Server TimeZone field. All the standard time zones, along with a separate set of entries for all time zones that haveDaylight Saving settings, appear in the Select Time Zone drop-down list box.
Trace Log Central downloads the files with a time range that is based on your Selected Reference ServerTime Zone field. If you have servers in a cluster in a different time zone, TLC will adjust for the timechange and get files for the same period of time. For example, if you specify files from 9:00 AM to10:00 AM and you have a second server (server x) that is in a time zone that is one hour ahead, TLCwill download files from 10:00 AM to 11:00 AM from server x.
To set the date range for which you want to collect traces, choose the drop-down list box in the FromDate/Time and To Date/Time fields.
• Relative Range: Specify the time (in minutes, hours, days, weeks, or months) prior to the current timefor which you want to collect traces.
Step 10 To search by phrases or words that exist in the trace file, enter the word or phrase in the Search String field.If you want to search for an exact match to the word or phrase that you entered, check the Case Sensitivecheck box.
Step 11 In the Call Processing Impact Options box, specify the level of impact you want the string search activity tohave on call processing, then click Next.From the Select Impact Level drop down list box, select Low, Medium, or High. Low impact causes the leastimpact on call processing but yields slower results. High impact causes the most impact on call processingbut yields faster results.
Step 12 In the Action Options window, choose one of the following actions:a) Trace Browseb) On Demand Trace Collection
• To specify the directory in which you want to download the trace files and the results file, click theBrowse button next to the Download selected files field, navigate to the directory, and click Open.The default specifies <rtmt_install_directory>\<server name or server IP
Cisco Unified Real-Time Monitoring Tool Administration Guide, Release 9.0(1) OL-24544-01 9
Tools for Traces, Logs, and Plug-InsCollect and Download Trace Files Using Query Wizard
address>\<download time>where<rtmt_install_directory> specifies the directorywhere RTMT is installed.
• To create a zip file of the trace files that you collect, check the Zip File check box.
• To delete collected log files from the server, check the Delete Collected Log Files from Servercheck box.
c) Schedule DownloadIncluded a start date and time and an end date and time. To configure the trace server, click the ConfigureTrace Server check box. The Trace Download Configuration dialog box appears. In the dialog box, youcan configure the following parameters:
• Host IP Address
• User Name
• Password
• Port
• Download Directory Path
You can choose Localhost download option when downloading traces. This option is availableonly for Cisco Intercompany Media Engine servers.
Note
If you download trace files to the local host directories on the Cisco Intercompany Media Engineserver, you can offload the files to a remote SFTP server by using the file get CLI command.
Note
FTP is not supported for Cisco Intercompany MediaEngine.
Note
Step 13 Choose one of the following options:a) To execute the query, click Run Query. This option is only available if you selected Trace Browse from
the Action Options window.The Query Results folder appears. When the query completes, a dialog box that indicates that the queryexecution completed appears. Click Close and continue with Step 17, on page 11.
b) To save the query, click the Save Query button and continue with Step 14, on page 10.c) To download the trace, click the Download Trace button. This option is only available if you selected
On Demand Trace Collection or Schedule Download from the Action Options window.After you have downloaded the trace files, you can view them by using the Local Browse optionof the trace and log central feature.
Tip
Step 14 Check the check box next to the type of query that you want to create from the following options, and thenclick Finish.a) Generic Query: Choose this option if you want to create a query that you can run on servers other than
the one on which it was created. You can create a generic query only if the services that you chose existon that server. If you chose services on more than one server in a cluster, a message appears.Then, choose either the Single Node Query or All Node Query option. If you choose the Single NodeQuery, the trace collection tool by default chooses the server on which you created the query when youexecute the query. If you choose the All Node Query option, the trace collection tool selects the followingservers by default:
• For Cisco Unified CommunicationsManager clusters, the trace collection tool chooses all the serversin the cluster by default when you execute the query.
Cisco Unified Real-Time Monitoring Tool Administration Guide, Release 9.0(1)10 OL-24544-01
Tools for Traces, Logs, and Plug-InsCollect and Download Trace Files Using Query Wizard
• For Cisco Business Edition 5000, the trace collection tool chooses the server on which you createdthe query when you executed the query.
• For Cisco Unity Connection, the trace collection tool chooses the server on which you created thequery when you executed the query.
You can choose servers other than the default before running thequery.
Note
b) Regular Query: Choose this option if you only want to run the query on that server or cluster (if applicable)on which you created the query.
Step 15 Browse to the location to store the query, enter a name for the query in the File Name field, and click Save.Step 16 Perform one of the following actions:
a) To run the query that you have just saved, click Run Query and continue with Step 17, on page 11.b) To exit the query wizard without running the query that you created, click Cancel.
Step 17 After the query execution completes, perform one or more of the following tasks:a) To view a file that you collected, navigate to the file by double-clicking Query Results, double-clicking
the <node> folder, where <node> equals the IP address or host name for the server that you specified inthe wizard, and double-clicking the folder that contains the file that you want to view.After you have located the file, you can either right-click the mouse to select the type of program that youwould like to use to view the file or double-click the file to display the file in the default viewer. Thereal-time monitoring tool displays the file in the appropriate viewer for the file type. If no other appropriateviewer applies, the real-time monitoring tool opens files in the Generic Log Viewer.
Unified Communications Manager and Cisco Business Edition only: To view reports that theQRT Quality Report Tool (QRT) generates, see the Display Report Information, on page 24.
Note
b) Download the trace files and the result file that contains a list of the trace files that your query collectedby choosing the files that you want to download, clicking the Download button, specifying the criteriafor the download, and clicking Finish.
• To specify the directory in which you want to download the trace files and the results file, click theBrowse button next to the Download selected files field, navigate to the directory, and click Open.The default specifies <rtmt_install_directory>\<server name or server IPaddress>\<download time>where<rtmt_install_directory> specifies the directorywhere RTMT is installed.
• To create a zip file of the trace files that you collect, check the Zip File check box.
• To delete collected log files from the server, check the Delete Collected Log Files from Servercheck box.
After you have downloaded the trace files, you can view them by using the Local Browse optionof the trace and log central feature.
Tip
c) To save the query, click Save Query button and complete Step 14, on page 10 through Step 15, on page11.
You will see a message if the service parameter values are exceeded or if the system is in codeyellow.
Note
Cisco Unified Real-Time Monitoring Tool Administration Guide, Release 9.0(1) OL-24544-01 11
Tools for Traces, Logs, and Plug-InsCollect and Download Trace Files Using Query Wizard
Schedule Trace CollectionYou can use the Schedule Collection option of the trace and log central feature to schedule up to six concurrenttrace collections and to download the trace files to a SFTP or FTP server on your network, run another savedquery, or generate a syslog file. To change a scheduled collection after you have entered it in the system, youmust delete the scheduled collection and add a new collection event. To schedule trace collection, performthe following procedure.
You can schedule up ten trace collection jobs, but only six trace collection can be concurrent. That is, onlysix jobs can be in a running state at the same time.
Note
Before You Begin
Perform one or more of the following actions:
• Configure the information that you want to include in the trace files for the various services from theTrace Configuration window of Cisco Unified Serviceability. For more information, see the CiscoUnified Serviceability Administration Guide.
• If you want alarms to be sent to a trace file, choose an SDI or SDL trace file as the alarm destination inthe Alarm Configuration window. For more information, see the Cisco Unified ServiceabilityAdministration Guide.
Procedure
Step 1 Open the Trace and Log Central options.Step 2 In the Trace & Log Central tree hierarchy, double-click Schedule Collection.
The Schedule Collection wizard appears.
The services that you have not activated also appear, so you can collect traces for those services.Note
Unified CommunicationsManager Cisco Unity Connection: If any node in the cluster is not available,a dialog box appears with a message that indicates which node is not available. The unavailable nodewill not appear in the Trace and Log Central windows.
Note
Unified Communications Manager and Cisco Unity Connection: You can install some listed servicesand applications on a particular node in the cluster. To collect traces for those services and applications,make sure that you collect traces from the node on which you have activated the service or application.
Note
Step 3 Cisco Unity Connection users go to Step 4. For Unified CommunicationsManager or Cisco Business Edition,perform one of the following actions in the Select CCM Services/Application tab:
If you have a standalone node and check the Select All Services on All Servers check box, thesystem collects traces for all service and applications for your standalone node.
Note
• To collect traces for all services and applications for all nodes, check the Select All Services on AllServers check box and click Next.
• To collect traces for all services and applications on a particular node, check the check box next to thenode and click Next.
• To collect traces for particular services or applications on particular nodes, check the check boxes thatapply and click Next.
Cisco Unified Real-Time Monitoring Tool Administration Guide, Release 9.0(1)12 OL-24544-01
Tools for Traces, Logs, and Plug-InsSchedule Trace Collection
• To continue the schedule collection wizard without collecting traces for services or applications, clickNext.
For Cisco Business Edition, go to Step 4. For Unified Communications Manager, go to Step 5.
Step 4 In the Select CUC Services/Application tab, perform one of the following actions:
• To collect all system logs for the node, check the Select All Services on all Servers check box or checkthe check box next to the node and click Next.
• To collect traces for particular system logs on the node, check the check boxes that apply and clickNext.
• To continue the schedule collection wizard without collecting traces for system logs, click Next.
Step 5 In the Select System Services/Application tab, perform one of the following actions:If you have a standalone node and check the Select All Services on All Servers check box, thesystem collects traces for your standalone node.
Note
• To collect all system logs for all nodes, check the Select All Services on all Servers check box andclick Next.
• To collect traces for all system logs on a particular node, check the check box next to the node and clickNext.
• To collect traces for particular system logs on particular nodes, check the check boxes that apply andclick Next.
• To continue the schedule collection wizard without collecting traces for system logs, click Next.
Step 6 Specify the node time zone and the time range for which you want to collect traces.The time zone of the client machine provides the default setting for the Select Reference Server Time Zonefield. All the standard time zones, along with a separate set of entries for all time zones that have DaylightSaving settings, appear in the Select Time Zone drop-down list box.
Step 7 To specify the date and time that you want to start the trace collection, click the down arrow button next tothe Schedule Start Date/Time field. In the Date tab, choose the appropriate date. In the Time tab, choose theappropriate time.
Step 8 To specify the date and time that you want to end the trace collection, click the down arrow button next tothe Schedule End Date/Time field. In the Date tab, choose the appropriate date. In the Time tab, choose theappropriate time.
The trace collection completes, even if the collection goes beyond the configured end time; however,the trace and log central feature deletes this collection from the schedule.
Note
Step 9 From the Scheduler Frequency drop-down list box, choose how often you want to run the configured tracecollection.
Step 10 From the Collect Files that are generated in the last drop-down list boxes, specify the time (in minutes,hours, days, weeks, or months) prior to the current time for which you want to collect traces.
Step 11 To search by phrases or words that exist in the trace file, enter the word or phrase in the Search String field.The tool searches for a match to the word or phrase that you enter and collects those files that match the search
Cisco Unified Real-Time Monitoring Tool Administration Guide, Release 9.0(1) OL-24544-01 13
Tools for Traces, Logs, and Plug-InsSchedule Trace Collection
criteria. If you want to search for an exact match to the word or phrase that you entered, check the CaseSensitive check box
Step 12 To create a zip file of the trace files that you collect, check the Zip File check box.Step 13 To delete collected log files from the node, check the Delete Collected Log Files from the Server check
box.Step 14 Choose one or more of the following actions:
• Download Files. If you chose Download Files or Run Another Query, continue with Step 15.
• Run Another Query.
• Generate Syslog. If you chose Generate Syslog, go to Step 17.
Step 15 In the SFTP/FTP Server Parameters group box, enter the node credentials for the node where the trace andlog central feature downloads the results and click Test Connection. After the trace and log central featureverifies the connection to the SFTP or FTP server, click OK.The Download Directory Path field specifies the directory in which the trace and log central feature storescollected files. By default, the trace collection stores the files in the home directory of the user whose user IDyou specify in the SFTP or FTP parameters fields: /home/<user>/Trace.
You can chooseLocalhost download option when downloading traces. This option is available only for CiscoIntercompany Media Engine servers.
If you download trace files to the local host directories on the Cisco Intercompany Media Engine server, youcan offload the files to a remote SFTP server by using the file get CLI command.
FTP is not supported for Cisco Intercompany MediaEngine.
Note
Step 16 If you chose the Run Another Query Option, click the Browse button to locate the query that you want to run,and click OK.
The trace and log central feature only executes the specified query if the first query generatesresults.
Note
Step 17 Click Finish.A message indicates that the system added the scheduled trace successfully.
If the real-time monitoring tool cannot access the SFTP or FTP server, a message appears. Verifythat you entered the correct IP address, username, and password.
Note
Step 18 Click OK.Step 19 To view a list of scheduled collections, click the Job Status icon in the Trace portion of the Quick Launch
Channel.To delete a scheduled collection, choose the collection event and clickDelete. A confirmationmessageappears. Click OK.
Tip
View Trace Collection StatusFollow this procedure to view the trace collection event status and to delete scheduled trace collections.
Cisco Unified Real-Time Monitoring Tool Administration Guide, Release 9.0(1)14 OL-24544-01
Tools for Traces, Logs, and Plug-InsView Trace Collection Status
Procedure
Step 1 Open the Trace & Log Central tree hierarchy.Step 2 Double-click Job Status.
The Job Status window appears.
Step 3 From the Select a Node drop-down list box, choose the server for which you want to view or delete tracecollection events.This list of scheduled trace collections appears.
Possible job types include the following:
• Scheduled Job
• OnDemand
• RealTimeFileMon
• RealTimeFileSearch
Possible statuses include the following:
• Pending
• Running
• Cancel
• Terminated
Step 4 To delete a scheduled collection, choose the event that you want to delete and click Delete.You can delete jobs with a status of “Pending” or “Running” and a job type of “Schedule Task” or jobtype of “RealTimeFileSearch.”
Note
Collect Crash DumpFollow this procedure to collect a core dump of trace files:
Procedure
Step 1 Open the Trace & Log Central tree hierarchy.Step 2 Double-click Collect Crash Dump.
The Collect Crash Dump wizard appears.
The services that you have not activated also appear, so you can collect traces for those services.Note
Unified Communications Manager and Cisco Unity Connection: If any node in the cluster is notavailable, a dialog box appears with a message that indicates which node is not available. Theunavailable node will not appear in the Trace and Log Central windows.
Note
Cisco Unified Real-Time Monitoring Tool Administration Guide, Release 9.0(1) OL-24544-01 15
Tools for Traces, Logs, and Plug-InsCollect Crash Dump
Unified CommunicationsManager clusters and Cisco Unity Connection clusters only: You can installsome of the listed services/applications only on a particular node in the cluster. To collect traces forthose services/applications, make sure that you collect traces from the node on which you haveactivated the service/application.
Note
Step 3 Cisco Unity Connection users go to Step 4. For Unified CommunicationsManager or Cisco Business Edition,perform one of the following actions in the Select CCM Services/Application tab:
If you have a standalone node and check the Select All Services on All Servers check box, thesystem collects traces for all service and applications for your standalone node.
Note
• To collect traces for all services and applications for all nodes, check the Select All Services on AllServers check box and click Next.
• To collect traces for all services and applications on a particular node, check the check box next to thenode and click Next.
• To collect traces for particular services or applications on particular nodes, check the check boxes thatapply and click Next.
• To continue the collect crash dump wizard without collecting traces for services or applications, clickNext.
Go to Step 4 for Cisco Business Edition or go to Step 5 for Unified Communications Manager.
Step 4 In the Select CUC Services/Application tab, perform one of the following actions:
• To collect all system logs for the node, check the Select All Services on all Servers check box or checkthe check box next to the node and click Next.
• To collect traces for particular system logs on the nodes, check the check boxes that apply and clickNext.
• To continue the collect crash dump wizard without collecting traces for system logs, click Next.
Step 5 In the Select System Services/Application tab, perform one of the following actions:If you have a standalone node and check the Select All Services on All Servers check box, thesystem collects traces for your standalone node.
Note
• To collect all system logs for all nodes, check the Select All Services on all Servers check box andclick Next.
• To collect traces for all system logs on a particular node, check the check box next to the node and clickNext.
• To collect traces for particular system logs on particular nodes, check the check boxes that apply andclick Next.
• To continue the collect crash dump wizard without collecting traces for system logs, click Next.
Step 6 In the Collection Time group box, specify the time range for which you want to collect traces. Choose one ofthe following options:
• Absolute Range: Specify the node time zone and the time range (start and end date and time) for whichyou want to collect traces.
Cisco Unified Real-Time Monitoring Tool Administration Guide, Release 9.0(1)16 OL-24544-01
Tools for Traces, Logs, and Plug-InsCollect Crash Dump
The time zone of the client machine provides the default setting for the Select Reference Server TimeZone field. All the standard time zones, along with a separate set of entries for all time zones that haveDaylight Saving settings, appear in the Select Time Zone drop-down list box.
Trace Log Central downloads the files with a time range that is based on your Selected Reference ServerTime Zone field. If you have nodes in a cluster in a different time zone, TLC adjusts for the time changeand gets files for the same period of time. For example, if you specify files from 9:00 a.m. to 10:00 a.mand you have a second node (node x) that is in a time zone that is one hour ahead, TLC downloads filesfrom 10:00 a.m. to 11:00 a.m. from node x.
To set the date range for which you want to collect crash files, choose the drop-down list box in theFrom Date/Time and To Date/Time fields.
• Relative Range: Specify the length of time (in minutes, hours, days, weeks, or months) prior to thecurrent time for which you want to collect crash files.
Step 7 From the Select Partition drop-down list box, choose the partition that contains the logs for which you wantto collect traces.Cisco Unified Serviceability stores the logs for the version of application that you are logged in to in the activepartition and stores the logs for the other version (if installed) in the inactive directory.
When you upgrade from one version of your product that is running on the Linux platform to another version,and you restart the node with the new version, Cisco Unified Serviceability moves the logs of the previousversion to the inactive partition and stores logs for the newer version in the active partition. If you log in tothe older version, Cisco Unified Serviceability moves the logs for the newer version to the inactive partitionand stores the logs for the older version in the active directory.
Cisco Unified Serviceability does not retain logs from Cisco Unified Communications Manager andCisco Unity Connection versions that ran on the Windows platform.
Note
Step 8 To specify the directory in which you want to download the trace files, click the Browse button next to theDownload File Directory field, navigate to the directory, and click Open. The default specifies<rtmt_install_directory>\<server name or server IP address>\<downloadtime> where <rtmt_install_directory> specifies the directory where RTMT is installed.
Step 9 To create a zip file of the crash dump files that you collect, choose the Zip File radio button. To downloadthe crash dump files without zipping the files, choose the Do Not Zip Files radio button.
You cannot download a zipped crash dump file that exceeds 2 gigabytes.Note
Step 10 To delete collected crash dump files from the node, check theDelete Collected Log Files from Server checkbox.
Step 11 Click Finish.A message appears that states that you want to collect core dumps. To continue, click Yes.
If you chose theZip File radio button and the crash dump files exceed 2 gigabytes, the system displaysa message that indicates that you cannot collect the crash dump file of that size with theZip Fileradiobutton that you chose. Choose the Do Not Zip Files radio button and try the collection again.
Note
Collect Audit LogsThe audit user can collect, view, and delete the audit logs. The end user can view the audit logs.
Cisco Unified Real-Time Monitoring Tool Administration Guide, Release 9.0(1) OL-24544-01 17
Tools for Traces, Logs, and Plug-InsCollect Audit Logs
Only a user with an audit role can delete the audit logs.Note
Perform the following procedure to collect audit logs:
Procedure
Step 1 Open the Trace & Log Central tree hierarchy.Step 2 Double-click Collect Audit Logs.
The Collect Audit Logs Action Options wizard appears.
Step 3 Perform one of the following actions in the Action Options window:a) To browse audit logs, check the Browse Audit Logs check box.b) To download audit logs, check the Download Audit Logs check box.c) To schedule a download of audit logs, check the Schedule Download of Audit Logs check box.
Step 4 Click Next.The Nodes Selection Options wizard appears.
Step 5 Perform one of the following actions in the Action Options window:If you have a standalone server and check the Select All Servers check box, the system will browse,download, or schedule a download of all audit logs for your standalone server.
Note
a) To browse, download, or schedule a download of audit logs for all servers, check the Select All Serverscheck box.
b) To browse, download, or schedule a download of audit logs on a particular server, check the check boxnext to the server.
Step 6 Click Finish.Proceed with one of the following selections:
a) Browse Audit Logs, go to Step 7, on page 18.b) Download Audit Logs, go to Step 11, on page 19.c) Schedule Download of Audit Logs, go to Step 16, on page 20.
Step 7 The Remote Browse is Ready window appears. Click the Close button.The Nodes pane appears.
Step 8 On the left side of the Nodes pane, double-click the Nodes folder. Navigate through the tree hierarchy untilthe Audit App folder appears.
Step 9 After the audit log file names appear in the pane on the right side of the window, you can either right-clickthe mouse to select the type of program that you would like to use to view each file or double-click the selectedfile to display the file in the default viewer.
Step 10 Select an audit log file and perform one of the following actions:a) To download the selected audit log file, click the Download button.
The Select Download Options wizard appears.
b) To specify the directory in which you want to download the audit log file, click the Browse button nextto the Download File Directory field, navigate to the directory, and click Open. The default specifies<\Program Files\Cisco\CallManager Serviceability\JRtmt>.
c) To create a zip file of the audit log files that you collect, choose the Zip File radio button.You cannot download a zipped audit log file that exceeds 2 gigabytes.Note
Cisco Unified Real-Time Monitoring Tool Administration Guide, Release 9.0(1)18 OL-24544-01
Tools for Traces, Logs, and Plug-InsCollect Audit Logs
d) To delete collected audit log files from the server, check the Delete Files on Server check box.e) Click Finish.f) To delete the selected audit log file, click the Delete button.g) To refresh the selected audit log file, click the Refresh button.h) To refresh all of the audit log files, click the Refresh All button.
Cisco Unified Serviceability does not retain audit logs from Cisco Unified CommunicationsManager versions that ran on the Windows platform.
Note
You have completed the steps for Browse Audit Logs.
Step 11 To download audit logs, click Next.The Download Audit Logs window appears.
Step 12 In the Nodes Selection Options pane, select one of the following:a) Check the Select All Servers check box.b) Check a specific node check box.
Step 13 In the Collection Time pane, select one of the following radio buttons:
• Absolute Range—Specify the server time zone and the time range (start and end date and time) forwhich you want to audit logs.
The time zone of the client machine provides the default setting for the Select Reference Server TimeZone field. All the standard time zones, along with a separate set of entries for all time zones that haveDaylight Saving settings, appear in the Select Time Zone drop-down list box.
Trace Log Central downloads the files with a time range that is based on your Selected Reference ServerTime Zone field. If you have servers in a cluster in a different time zone, TLC will adjust for the timechange and get files for the same period of time. For example, if you specify files from 9:00 AM to10:00 AM and you have a second server (server x) that is in a time zone that is one hour ahead, TLCwill download files from 10:00 AM to 11:00 AM from server x.
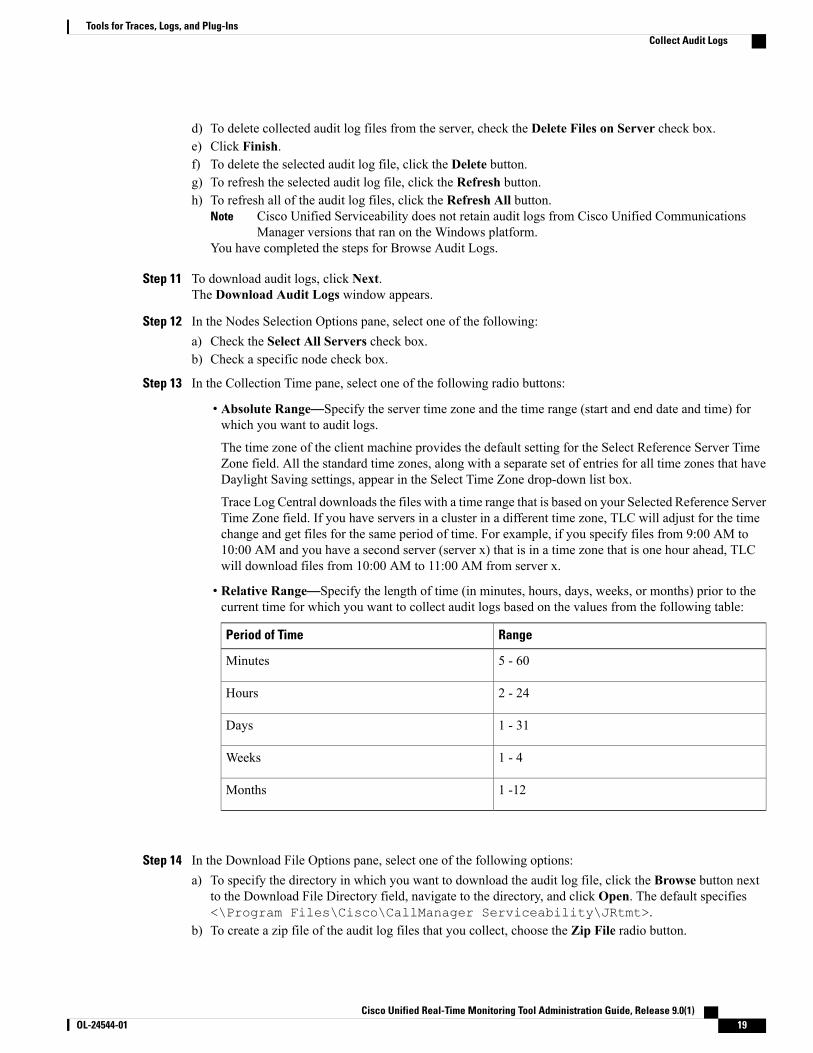
• Relative Range—Specify the length of time (in minutes, hours, days, weeks, or months) prior to thecurrent time for which you want to collect audit logs based on the values from the following table:
RangePeriod of Time
5 - 60Minutes
2 - 24Hours
1 - 31Days
1 - 4Weeks
1 -12Months
Step 14 In the Download File Options pane, select one of the following options:a) To specify the directory in which you want to download the audit log file, click the Browse button next
to the Download File Directory field, navigate to the directory, and click Open. The default specifies<\Program Files\Cisco\CallManager Serviceability\JRtmt>.
b) To create a zip file of the audit log files that you collect, choose the Zip File radio button.
Cisco Unified Real-Time Monitoring Tool Administration Guide, Release 9.0(1) OL-24544-01 19
Tools for Traces, Logs, and Plug-InsCollect Audit Logs
You cannot download a zipped audit log file that exceeds 2 gigabytes.Note
c) To delete collected audit log files from the server, check the Delete Collected Log Files from Servercheck box.
Step 15 Click Finish. You have completed the steps for the download of audit logs.Step 16 The Schedule Download of Audit Logs window appears.
a) In the Nodes Selection Options pane, select one of the following options:
• Check the Select All Servers check box.
• Check a specific node check box.
b) In the Schedule Time pane, perform the following actions:
1 Highlight the Select Reference Server Time Zone.
2 Use the calendar and highlight a Start Date/Time.
3 Use the calendar and highlight an End Date/Time.
4 Select the Scheduler Frequency. You may choose Hourly, Daily, Weekly, or Monthly.
5 Check the Zip All Files check box if you want to zip the audit log files.
6 Check the Delete Collected Log Files From Server check box if you want to delete the collectedaudit log files from the server.
c) In the Action Options pane, check the Download Files check box.The Trace Download Configuration Dialog window appears. Enter the following information:
• Protocol—Select FTP (default) or SFTP.
• Host IP Address—Enter the IP address of the host server.
• User Name—Enter your username.
• Password—Enter your password.
• Port—Enter the FTP or SFTP port information.
• Download Directory Path—Enter the complete directory path where the files get downloaded.
• Click Test Connection. When the connection has been tested, the files are downloaded.
You can choose Localhost download option when downloading traces. This option is availableonly for Cisco Intercompany Media Engine servers.
If you download trace files to the local host directories on the Cisco Intercompany Media Engineserver, you can offload the files to a remote SFTP server by using the file get CLI command.
Note
FTP is not supported for Cisco Intercompany MediaEngine.
Note
Cisco Unified Real-Time Monitoring Tool Administration Guide, Release 9.0(1)20 OL-24544-01
Tools for Traces, Logs, and Plug-InsCollect Audit Logs
Display Downloaded Trace Files Using Local BrowseAfter you collect trace files and download them to your PC, you can view them with a text editor that canhandle UNIX variant line terminators such asWordPad on your PC, or you can view them by using the viewerswithin Unified RTMT.
Do not use NotePad to view collected trace files.Tip
Follow this procedure to display the log files that you collected with the Trace and Log Central feature. If youzipped the trace files when you downloaded them to your PC, you need to unzip the files to view them byusing the viewers within Unified RTMT.
You can open a maximum of five concurrent files for viewing within Trace and Log Central, whichincludes using the Query Wizard, Local Browse, and Remote Browse features.
Note
Before You Begin
Collect the required traces files. See topics related to collecting trace files, downloading trace files using QueryWizard, and scheduling trace collection for instructions.
Procedure
Step 1 Open Trace and Log Central.Step 2 Double-click Local Browse.Step 3 Browse to the directory where you stored the log file and choose the file that you want to view.Step 4 To display the results, double-click the file.
If the file type has a viewer that is already associated with it, the file opens in that viewer. Otherwise, theOpen With dialog box appears.
Step 5 Click the program that want to use to view the file. If your preferred program is not on the list, choose anotherprogram by clicking Other.If you want to use this program as your default viewer, check the Always use this program to open thesefiles check box.
Unified RTMT displays the file in the appropriate viewer for the file type. If no other appropriate viewerapplies, Unified RTMT opens files in the Generic Log Viewer.
Display and Download Trace Files Using Remote BrowseAfter the system generates trace files, you can view them on the node by using the viewers within UnifiedRTMT. You can also use the remote browse feature to download the traces to your PC.
Follow this procedure to display and download the log files on the node with the Trace and Log Centralfeature.
Cisco Unified Real-Time Monitoring Tool Administration Guide, Release 9.0(1) OL-24544-01 21
Tools for Traces, Logs, and Plug-InsDisplay Downloaded Trace Files Using Local Browse
You can open a maximum of five concurrent files for viewing within Trace and Log Central. This includesusing the Query Wizard, Local Browse, and Remote Browse features.
Note
Before You Begin
Collect the required traces files. See topics related to collecting trace files, downloading trace files using QueryWizard, and scheduling trace collection.
Procedure
Step 1 Open the Trace and Log Central options.Step 2 Double-click Remote Browse.Step 3 Choose the appropriate radio button, and click Next.
• If you choose Trace Files, go to Step 4.
• If you choose Crash Dump, go to Step 7.
The services that you have not activated also appear, so you can choose traces for those services.Note
If you choose Crash Dump, the wizard displays only the services that may cause a crash dump. Ifyou do not see the service in which you are interested, click Back and choose Trace Files.
Note
Unified Communications Manager clusters and Cisco Unity Connection clusters: You can installsome of the listed services/applications only on a particular node in the cluster. To choose traces forthose services/applications, make sure that you choose traces from the node on which you haveactivated the service/application.
Note
Step 4 Cisco Unity Connection users go to Step 5. For Unified CommunicationsManager or Cisco Business Edition,perform one of the following actions in the Select CCM Services/Application tab:
If you have a standalone node and check the Select All Services on All Servers check box, thesystem collects traces for all service and applications for your standalone node.
Note
• To collect traces for all services and applications for all nodes, check the Select All Services on AllServers check box and click Next.
• To collect traces for all services and applications on a particular node, check the check box next to thenode and click Next.
• To collect traces for particular services or applications on particular nodes, check the check boxes thatapply and click Next.
• To continue the Remote Browse wizard without collecting traces for services or applications, clickNext.
Go to Step 5 for Cisco Business Edition or go to Step 6 for Unified Communications Manager.
Step 5 In the Select CUC Services/Application tab, perform one of the following actions:
• To collect all system logs for the node, check the Select All Services on all Servers check box or checkthe check box next to the node and click Next.
• To collect traces for particular system logs on the node, check the check boxes that apply and clickNext.
Cisco Unified Real-Time Monitoring Tool Administration Guide, Release 9.0(1)22 OL-24544-01
Tools for Traces, Logs, and Plug-InsDisplay and Download Trace Files Using Remote Browse
• To continue the Remote Browse wizard without collecting traces for system logs, click Next.
Step 6 In the Select System Services/Application tab, perform one of the following actions:If you have a standalone node and check the Select All Services on All Servers check box, thesystem collects system logs for your standalone node.
Note
a) To collect all system logs for all nodes, check the Select All Services on all Servers check box and clickNext.
b) To collect traces for all system logs on a particular node, check the check box next to the node and clickNext.
c) To collect traces for particular system logs on particular nodes, check the check boxes that apply and clickNext.
d) To continue the Remote Browse wizard without collecting traces for system logs, click Next.e) Go to Step 10.
Step 7 Cisco Unity Connection users go to Step 8. For Unified CommunicationsManager or Cisco Business Edition,perform one of the following actions in the Select CCM Services/Application tab:
If you have a standalone node and check the Select All Services on All Servers check box, thesystem collects crash dump files for your standalone node.
Note
a) To choose crash dump files for all services and applications for all nodes, check the Select All Serviceson All Servers check box and click Next.
b) To choose crash dump files for all services and applications on a particular node, check the check boxnext to the node and click Next.
c) To choose crash dump files for particular services or applications on particular nodes, check the checkboxes that apply and click Next.
d) To continue the Remote Browse wizard without collecting crash dump files, click Next.Go to Step 8 for Cisco Business Edition or go to Step 9 for Unified Communications Manager.
Step 8 In the Select CUC Services/Application tab, perform one of the following tasks:a) To choose crash dump files for the node, check the Select All Services on all Servers check box or check
the check box next to the node and click Next.b) To choose crash dump files for particular system logs on the node, check the check boxes that apply and
click Next.c) To continue the Remote Browse wizard without collecting crash dump files, click Next.
Step 9 In the Select System Services/Application tab, perform one of the following tasks:If you have a standalone node and check the Select All Services on All Servers check box, thesystem collects crash dump files for your standalone node.
Note
a) To choose crash dump files for all nodes, check the Select All Services on all Servers check box.b) To choose crash dump files for all system logs on a particular node, check the check box next to the node.c) To choose crash dump files for particular system logs on particular nodes, check the check boxes that
apply.d) To continue the Remote Browse wizard without collecting crash dump files, go to the next step.
Step 10 Click Finish.Step 11 After the traces become available, a message appears. Click Close.Step 12 Perform one of the following actions:
a) To display the results, navigate to the file through the tree hierarchy. After the log filename appears in thepane on the right side of the window, you can either right-click the mouse to select the type of programthat you would like to use to view the file or double-click the file to display the file in the default viewer.
Cisco Unified Real-Time Monitoring Tool Administration Guide, Release 9.0(1) OL-24544-01 23
Tools for Traces, Logs, and Plug-InsDisplay and Download Trace Files Using Remote Browse
To sort the files that appear in the pane, click a column header; for example, to sort the files byname, click the Name column header.
Tip
The real-time monitoring tool displays the file in the appropriate viewer for the file type. If no otherappropriate viewer applies, the real-time monitoring tool opens files in the Generic Log Viewer.
Unified Communications Manager and Cisco Business Edition: For more information, see topics relatedto using the QRT Viewer to display QRT reports.
b) To download the trace files, choose the files that you want to download, click Download, specify thecriteria for the download, and click Finish.
• To specify the directory in which you want to download the trace files, click Browse next to theDownload all files field, navigate to the directory, and click Open. The default specifies<rtmt_install_directory>\<server name or server IP address>\<downloadtime> where <rtmt_install_directory> specifies the directory where Unified RTMT isinstalled.
• To create a zip file of the trace files that you collect, check the Zip File check box.
• To delete collected log files from the node, check the Delete Files on server check box.
c) To delete trace files from the node, click the file that appears in the pane on the right side of the window;then, click Delete.
d) To refresh a specific service or a specific node in a cluster, click the service or node name; then, clickRefresh. After a message states that the remote browse is ready, click Close.
e) To refresh all services or all nodes in a cluster that appear in the tree hierarchy, click Refresh All. Aftera message states that the remote browse is ready, click Close.
After you download the trace files, you can view them in LocalBrowse.
Tip
Display Report InformationYou can view the QRT log files by either viewing the files on the server or by downloading the files ontoyour computer.
This section applies only to Cisco Unified Communications Manager and Cisco Business Edition 5000.Note
You can view the IP phone problem reports that the Quality Report Tool generates by using the QRT viewer.QRT serves as a voice-quality and general problem-reporting tool for Cisco Unified IP Phones. After youcollect the QRT log files, you can use the following procedure to list and view Cisco Unified CommunicationsManager IP Phone problem reports by using the QRT viewer. The QRT viewer allows you to filter, format,and view phone problem reports that are generated. For more information about how to configure and useQRT, see the Cisco Unified Communications Manager Features and Services Guide.
Before You Begin
Collect or view the Quality Report Tool (QRT) log files. See topics related to collecting trace files, schedulingtrace collection, and downloading trace files using either Query Wizard or the Remote Browser.
Cisco Unified Real-Time Monitoring Tool Administration Guide, Release 9.0(1)24 OL-24544-01
Tools for Traces, Logs, and Plug-InsDisplay Report Information
Procedure
Step 1 Display the log file entries by using the Query Wizard, the Remote Browse, or the Local Browse option inTrace and Log Central.The QRT Viewer window appears.
Only log files from the Cisco Extended Functions service contain QRT information. The followingformat for the log filename that contains QRT data applies: qrtXXX.xml.
Note
The QRT viewer allows only the .xml files with a specific structure (having phone details), not thedefault one. If you open generic log files, you may see the following error message:
Fail to Open Cisco QRT Viewer, No Records Available!
Note
Step 2 From theExtension drop-down list box, choose the extension or extensions that you want the report to include.Step 3 From the Device drop-down list box, choose the device or devices that you want the report to include.Step 4 From the Category drop-down list box, choose the problem category that you want the report to include.Step 5 From the Select Fields drop-down list box, choose the fields that you want the report to include.
The order in which you choose the fields determines the order in which they appear in the QRTReport Result pane.
Note
Step 6 To view the report in the QRT Report Result pane, click Display Records.
Real-Time TraceThe real-time trace option of the Trace and Log Central feature allows you to view the current trace file thatis being written on the server for each application. If the system has begun writing a trace file, the real-timetrace starts reading the file from the point where you began monitoring rather than at the beginning of thetrace file. You cannot read the previous content.
The real-time trace provides the option to view real-time data and monitor user events.
View Real-Time DataThe view real-time data option of the trace and log central feature allows you to view a trace file as the systemwrites data to that file. You can view real-time trace data in the generic log viewer for up to ten services, witha limit of three concurrent sessions on a single node. The log viewer refreshes every 5 seconds. As the tracesare rolled into a new file, the generic log viewer appends the content in the viewer.
Depending on the frequency of the traces that a service writes, the View Real Time Data option mayexperience a delay before being able to display the data in the generic log viewer.
Note
Procedure
Step 1 Open the Trace & Log Central tree hierarchy.Step 2 Double-click Real Time Trace.
Cisco Unified Real-Time Monitoring Tool Administration Guide, Release 9.0(1) OL-24544-01 25
Tools for Traces, Logs, and Plug-InsReal-Time Trace
Unified Communications Manager clusters and Cisco Unity Connection clusters only: If any nodein the cluster is not available, a dialog box appears with a message that indicates which node is notavailable. The unavailable node will not display in the Trace and Log Central windows.
Note
Step 3 Double-click View Real Time Data.The View Real Time Data wizard appears.
Step 4 From the Nodes drop-down list box, choose the node for which you want to view real-time data and clickNext.
Step 5 Choose the product, service, and the trace file type for which you want to view real-time data.The services that you have not activated also display, so you can collect traces for those services.Note
The following message appears at the bottom of this window: If trace compression is enabled,
the data seen in this window can be bursty due to buffering of data.
Note
Step 6 Click Finish. The real-time data for the chosen service displays in the generic log viewer.Step 7 Perform one of the following actions:
• Check the Show New Data check box to keep the cursor at the end of the window to display new tracesas they appear.
• Uncheck the Show New Data check box if you do not want the cursor to move to the bottom of thewindow as new traces display.
Step 8 Repeat this procedure to view data for additional services.A message appears if you attempt to view data for too many services or too many services on a single node.
Step 9 After you finish with viewing the real-time data, click Close on the generic log viewer.To search by phrases or words in the Log Viewer, enter the word or phrase in the Search String field.If you want to do a case-sensitive search for a word or phrase, check theMatch Case check box.
Tip
Monitor User EventThe monitor user event option of the trace and log central feature monitors real-time trace files and performsa specified action when a search string appears in the trace file. The system polls the trace file every 5 seconds.If the search string occurs more than once in one polling interval, the system performs the action only once.
Before You Begin
If you want to generate an alarm when the specified search string exists in a monitored trace file, enable theLogFileSearchStringFound alert.
Procedure
Step 1 Open the Trace & Log Central tree hierarchy.Step 2 Double-click Real Time Trace.
Unified Communications Manager clusters and Cisco Unity Connection clusters only: If any nodein the cluster is not available, a dialog box appears with a message that indicates which node is notavailable. The unavailable node does not display in the Trace and Log Central windows.
Note
Step 3 Double-clickMonitor User Event.The Monitor User Event wizard appears.
Cisco Unified Real-Time Monitoring Tool Administration Guide, Release 9.0(1)26 OL-24544-01
Tools for Traces, Logs, and Plug-InsMonitor User Event
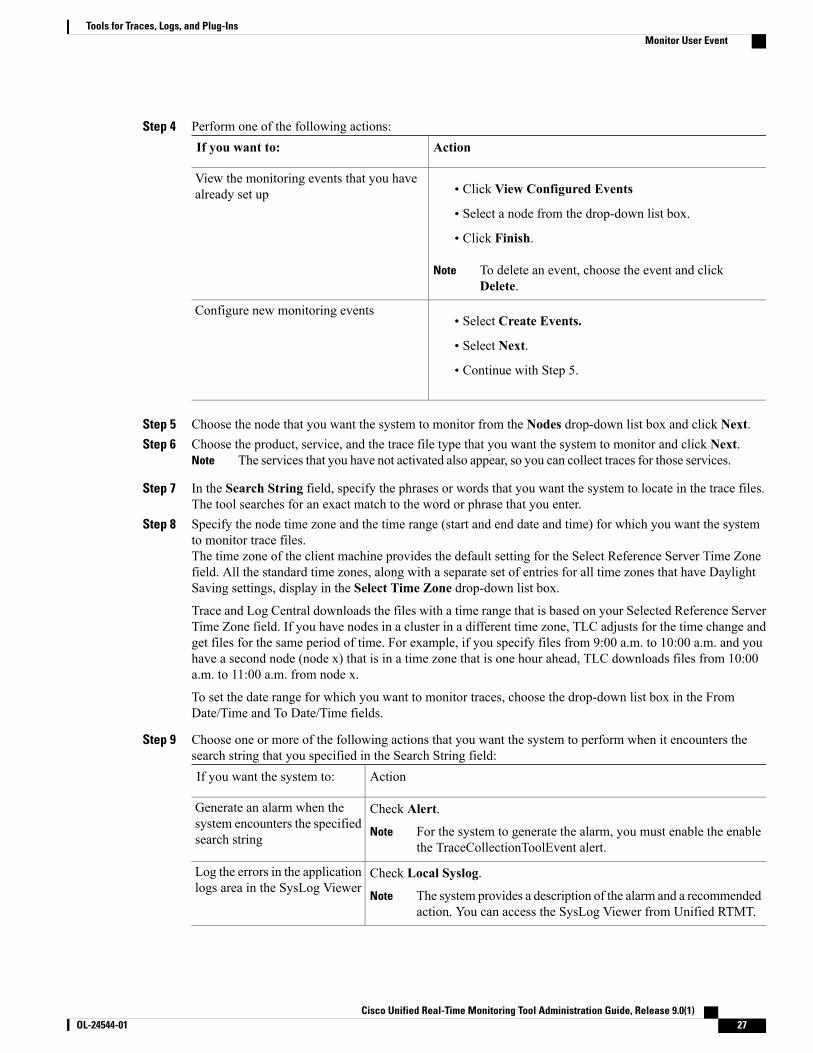
Step 4 Perform one of the following actions:ActionIf you want to:
• Click View Configured Events
• Select a node from the drop-down list box.
• Click Finish.
To delete an event, choose the event and clickDelete.
Note
View the monitoring events that you havealready set up
• Select Create Events.
• Select Next.
• Continue with Step 5.
Configure new monitoring events
Step 5 Choose the node that you want the system to monitor from the Nodes drop-down list box and click Next.Step 6 Choose the product, service, and the trace file type that you want the system to monitor and click Next.
The services that you have not activated also appear, so you can collect traces for those services.Note
Step 7 In the Search String field, specify the phrases or words that you want the system to locate in the trace files.The tool searches for an exact match to the word or phrase that you enter.
Step 8 Specify the node time zone and the time range (start and end date and time) for which you want the systemto monitor trace files.The time zone of the client machine provides the default setting for the Select Reference Server Time Zonefield. All the standard time zones, along with a separate set of entries for all time zones that have DaylightSaving settings, display in the Select Time Zone drop-down list box.
Trace and Log Central downloads the files with a time range that is based on your Selected Reference ServerTime Zone field. If you have nodes in a cluster in a different time zone, TLC adjusts for the time change andget files for the same period of time. For example, if you specify files from 9:00 a.m. to 10:00 a.m. and youhave a second node (node x) that is in a time zone that is one hour ahead, TLC downloads files from 10:00a.m. to 11:00 a.m. from node x.
To set the date range for which you want to monitor traces, choose the drop-down list box in the FromDate/Time and To Date/Time fields.
Step 9 Choose one or more of the following actions that you want the system to perform when it encounters thesearch string that you specified in the Search String field:
ActionIf you want the system to:
Check Alert.
For the system to generate the alarm, you must enable the enablethe TraceCollectionToolEvent alert.
Note
Generate an alarm when thesystem encounters the specifiedsearch string
Check Local Syslog.
The system provides a description of the alarm and a recommendedaction. You can access the SysLog Viewer from Unified RTMT.
Note
Log the errors in the applicationlogs area in the SysLog Viewer
Cisco Unified Real-Time Monitoring Tool Administration Guide, Release 9.0(1) OL-24544-01 27
Tools for Traces, Logs, and Plug-InsMonitor User Event
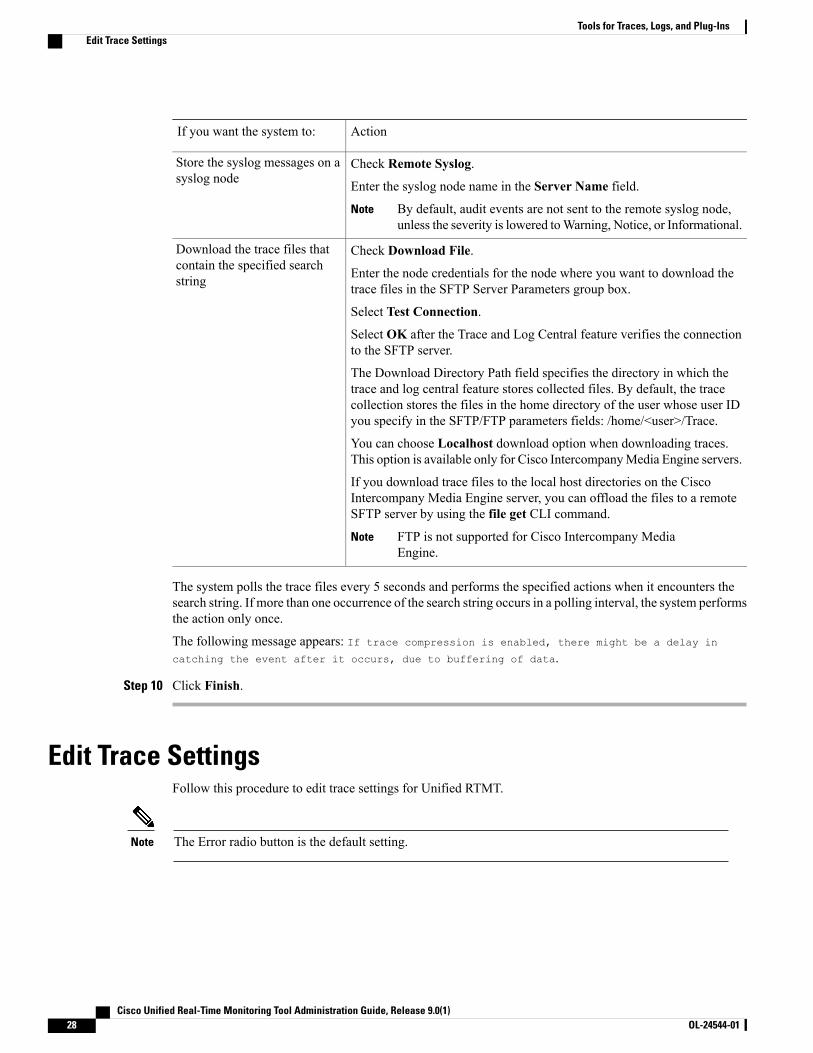
ActionIf you want the system to:
Check Remote Syslog.
Enter the syslog node name in the Server Name field.
By default, audit events are not sent to the remote syslog node,unless the severity is lowered toWarning, Notice, or Informational.
Note
Store the syslog messages on asyslog node
Check Download File.
Enter the node credentials for the node where you want to download thetrace files in the SFTP Server Parameters group box.
Select Test Connection.
Select OK after the Trace and Log Central feature verifies the connectionto the SFTP server.
The Download Directory Path field specifies the directory in which thetrace and log central feature stores collected files. By default, the tracecollection stores the files in the home directory of the user whose user IDyou specify in the SFTP/FTP parameters fields: /home/<user>/Trace.
You can choose Localhost download option when downloading traces.This option is available only for Cisco IntercompanyMedia Engine servers.
If you download trace files to the local host directories on the CiscoIntercompany Media Engine server, you can offload the files to a remoteSFTP server by using the file get CLI command.
FTP is not supported for Cisco Intercompany MediaEngine.
Note
Download the trace files thatcontain the specified searchstring
The system polls the trace files every 5 seconds and performs the specified actions when it encounters thesearch string. If more than one occurrence of the search string occurs in a polling interval, the system performsthe action only once.
The following message appears: If trace compression is enabled, there might be a delay in
catching the event after it occurs, due to buffering of data.
Step 10 Click Finish.
Edit Trace SettingsFollow this procedure to edit trace settings for Unified RTMT.
The Error radio button is the default setting.Note
Cisco Unified Real-Time Monitoring Tool Administration Guide, Release 9.0(1)28 OL-24544-01
Tools for Traces, Logs, and Plug-InsEdit Trace Settings
Procedure
Step 1 Choose Edit > Trace SettingStep 2 Click the radio button that applies.
The system stores the rtmt.log file in the Documents and Settings directory for the user; for example, on aWindows machine, the log is stored in C:\Documents and Settings\<userid>\.jrtmt\log.
Log CompressionIn previous releases of Cisco Unified Communications Manager and Cisco Business Edition 5000, traceservice parameters enabled and disabled log file compression to the hard disk. The service parameters havebeen deprecated.
In Unified CommunicationsManager 8.0 onward, the log compression feature only compresses the followinglog files:
• cm/trace/cti/sdl
• cm/trace/cti/sdi
• cm/trace/ccm/sdl
• cm/trace/ccm/sdi
The other log files are not compressed and are written directly to the hard disk.
The compressed files have a .gz extension. The file that is being actively written to the disk will have a .gzoextension.
All the CLI commands used to view and tail the files will work on the compressed files and will automaticallyuncompress them for viewing or tailing. The only difference is in specifying file names with the .gz and .gzoextension.
The following option is available with the file tail command:
file tail activelog cm/trace/cti/sdl recent
The recent option, when used with a compressed directory, continually tails the most recent log file. You donot need to switch to a newer log file when the currently written-to log file is closed, so it is an infinite andongoing tail. This option is only available with the compressed log files.
The log files are compressed in the gzip format. For uncompressing the log files, the open source program7-Zip is available at http://www.7-zip.org, and works on all Windows platforms. You can use 7-Zipon any computer, including a computer in a commercial organization. You do not need to register or pay for7-Zip. On a Linux platform, you can use the gzip or gunzip commands.
Display Messages in SysLog ViewerYou can display messages in SysLog Viewer.
Cisco Unified Real-Time Monitoring Tool Administration Guide, Release 9.0(1) OL-24544-01 29
Tools for Traces, Logs, and Plug-InsLog Compression
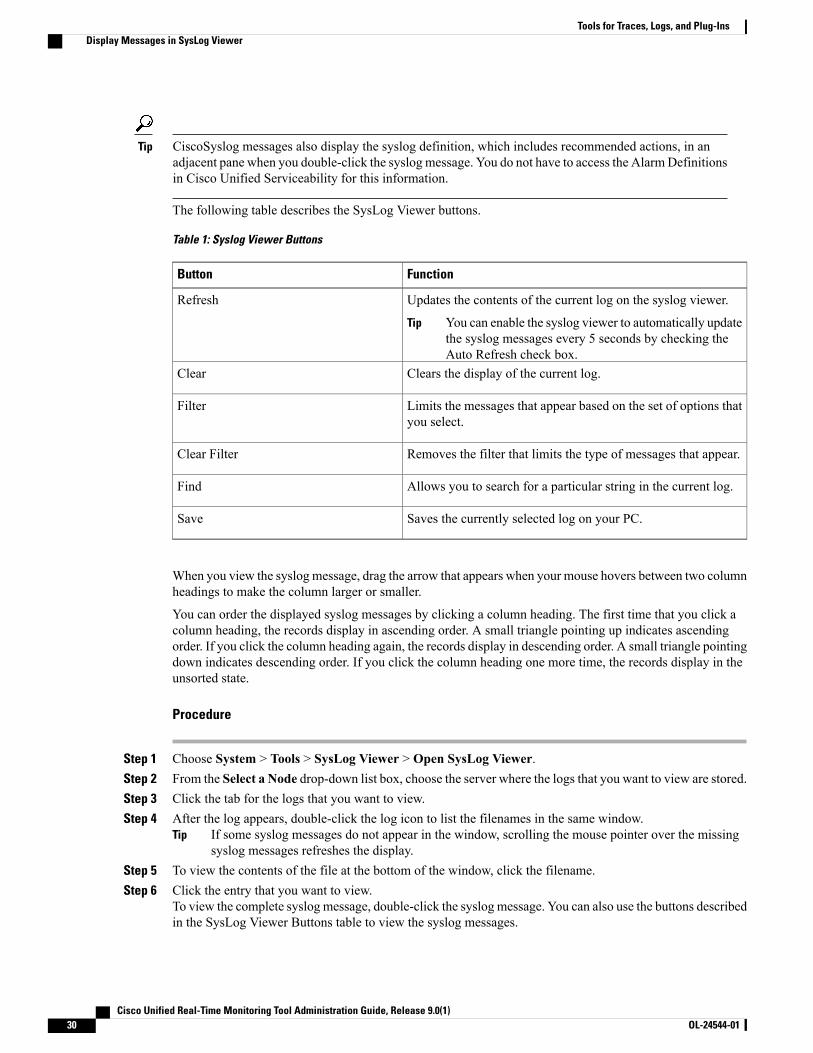
CiscoSyslog messages also display the syslog definition, which includes recommended actions, in anadjacent pane when you double-click the syslog message. You do not have to access the AlarmDefinitionsin Cisco Unified Serviceability for this information.
Tip
The following table describes the SysLog Viewer buttons.
Table 1: Syslog Viewer Buttons
FunctionButton
Updates the contents of the current log on the syslog viewer.
You can enable the syslog viewer to automatically updatethe syslog messages every 5 seconds by checking theAuto Refresh check box.
Tip
Refresh
Clears the display of the current log.Clear
Limits the messages that appear based on the set of options thatyou select.
Filter
Removes the filter that limits the type of messages that appear.Clear Filter
Allows you to search for a particular string in the current log.Find
Saves the currently selected log on your PC.Save
When you view the syslog message, drag the arrow that appears when your mouse hovers between two columnheadings to make the column larger or smaller.
You can order the displayed syslog messages by clicking a column heading. The first time that you click acolumn heading, the records display in ascending order. A small triangle pointing up indicates ascendingorder. If you click the column heading again, the records display in descending order. A small triangle pointingdown indicates descending order. If you click the column heading one more time, the records display in theunsorted state.
Procedure
Step 1 Choose System > Tools > SysLog Viewer > Open SysLog Viewer.Step 2 From the Select a Node drop-down list box, choose the server where the logs that you want to view are stored.Step 3 Click the tab for the logs that you want to view.Step 4 After the log appears, double-click the log icon to list the filenames in the same window.
If some syslog messages do not appear in the window, scrolling the mouse pointer over the missingsyslog messages refreshes the display.
Tip
Step 5 To view the contents of the file at the bottom of the window, click the filename.Step 6 Click the entry that you want to view.
To view the complete syslog message, double-click the syslog message. You can also use the buttons describedin the SysLog Viewer Buttons table to view the syslog messages.
Cisco Unified Real-Time Monitoring Tool Administration Guide, Release 9.0(1)30 OL-24544-01
Tools for Traces, Logs, and Plug-InsDisplay Messages in SysLog Viewer
You can filter the syslog message display results by choosing an option in the Filter By drop-downlist box. To remove the filter, click Clear Filter. All logs appear after you clear the filter.
Tip
Download and Install Application Plug-InsYou can expand the functionality of Unified RTMT by installing application plug-ins, such as the Voice LogTranslator (VLT) application. You can download the latest plug-ins for Unified RTMT from Cisco.com. Afterinstalling the plug-in, you can access the application in Unifed RTMT.
To download and install the plug-in, perform the following procedure:
Procedure
Step 1 Choose Application > CCO Voice Tools Download.The Login Prompt appears.
Step 2 Enter your Cisco.com username and password and click OK.Step 3 Download the file to your PC.Step 4 To begin the installation, double-click the download file.Step 5 Follow the installation instructions.
Launch Application Plug-InsAfter downloading and installing the plug-in, you can access the application in the RTMT viewer.
Procedure
Under System > Tools > Plugin, choose the plug-in that you want to launch.The application appears in the plugin window. See the application document for usage information.
Cisco Unified Real-Time Monitoring Tool Administration Guide, Release 9.0(1) OL-24544-01 31
Tools for Traces, Logs, and Plug-InsDownload and Install Application Plug-Ins

Cisco Unified Real-Time Monitoring Tool Administration Guide, Release 9.0(1)32 OL-24544-01
Tools for Traces, Logs, and Plug-InsLaunch Application Plug-Ins