Embed Size (px)
Citation preview
Tools for Performance-Based Transit-Oriented Development
New Partners for Smart Growth Conference, February 3, 2011
Sam Zimbabwe, Center for Transit-Oriented Development Director Reconnecting America

• 6-year old partnership dedicated to improving practice through technical assistance, research + policy reform
• Creating a national marketplace for TOD, working with cities, transit agencies, developers, investors + communities
• Developing new tools and collaborative and equitable planning models
• On-line Clearinghouse of TOD + Transit Best Practices
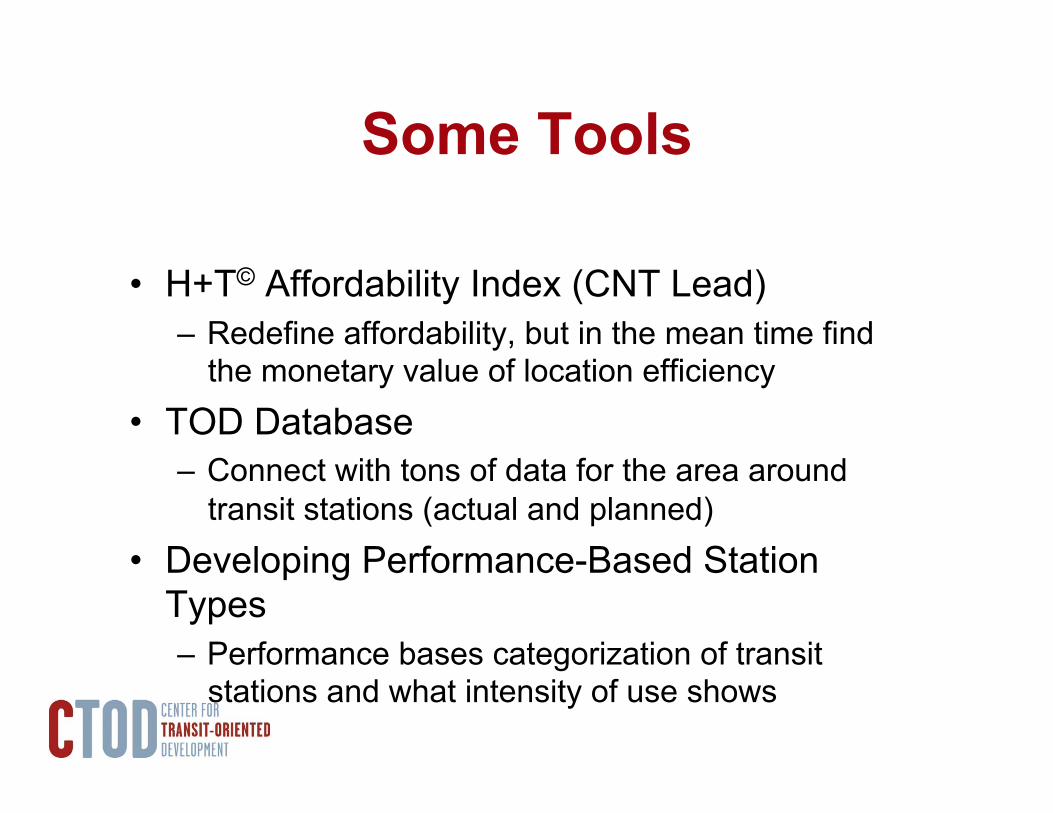
Some Tools
• H+T© Affordability Index (CNT Lead) – Redefine affordability, but in the mean time find
the monetary value of location efficiency • TOD Database
– Connect with tons of data for the area around transit stations (actual and planned)
• Developing Performance-Based Station Types – Performance bases categorization of transit
stations and what intensity of use shows

H+T© Affordability Index
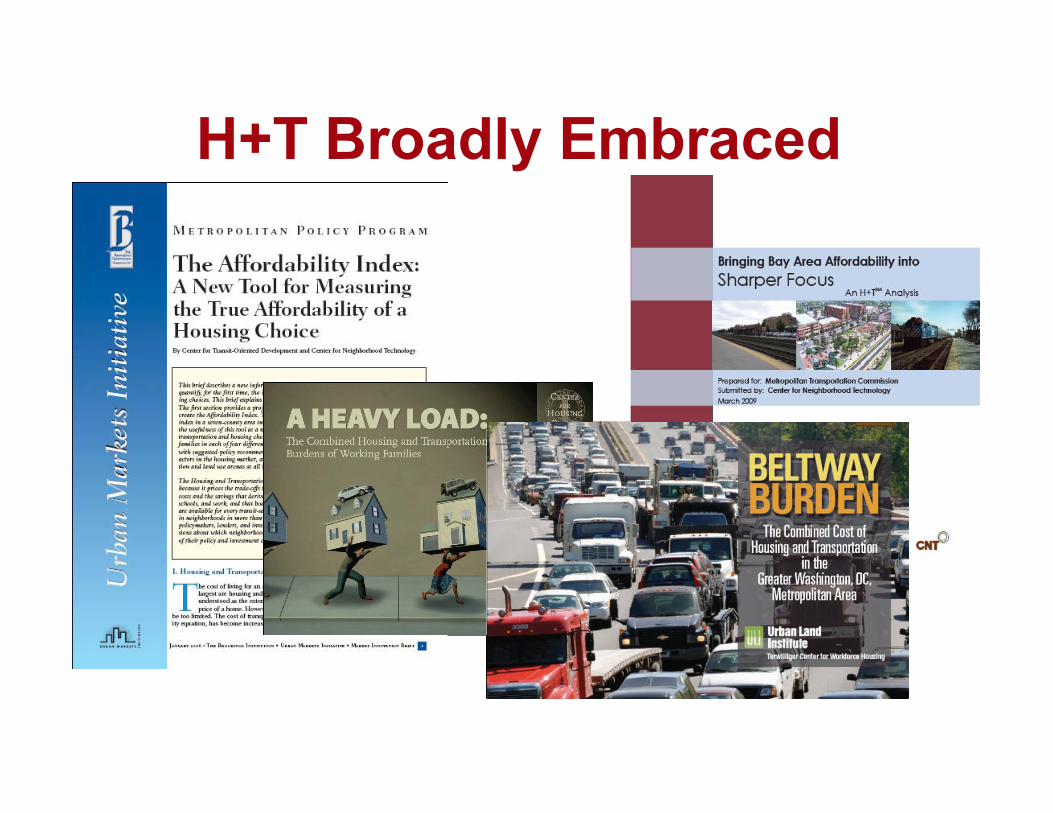
H+T Broadly Embraced
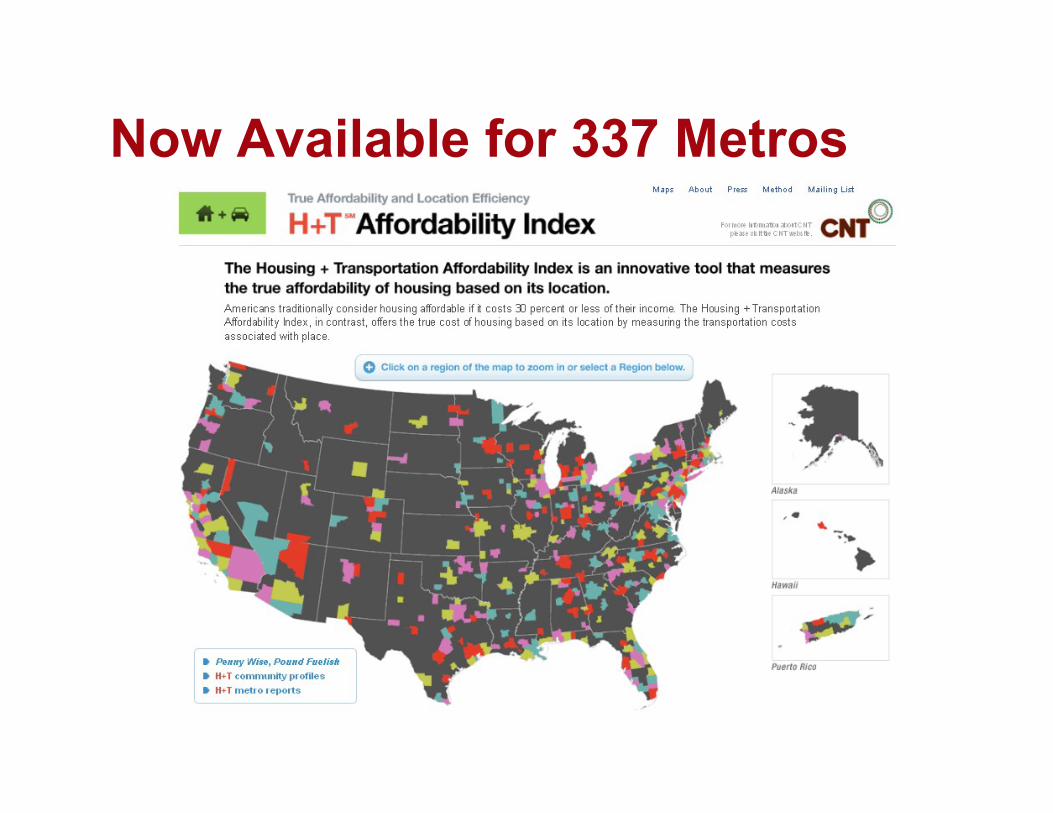
Now Available for 337 Metros
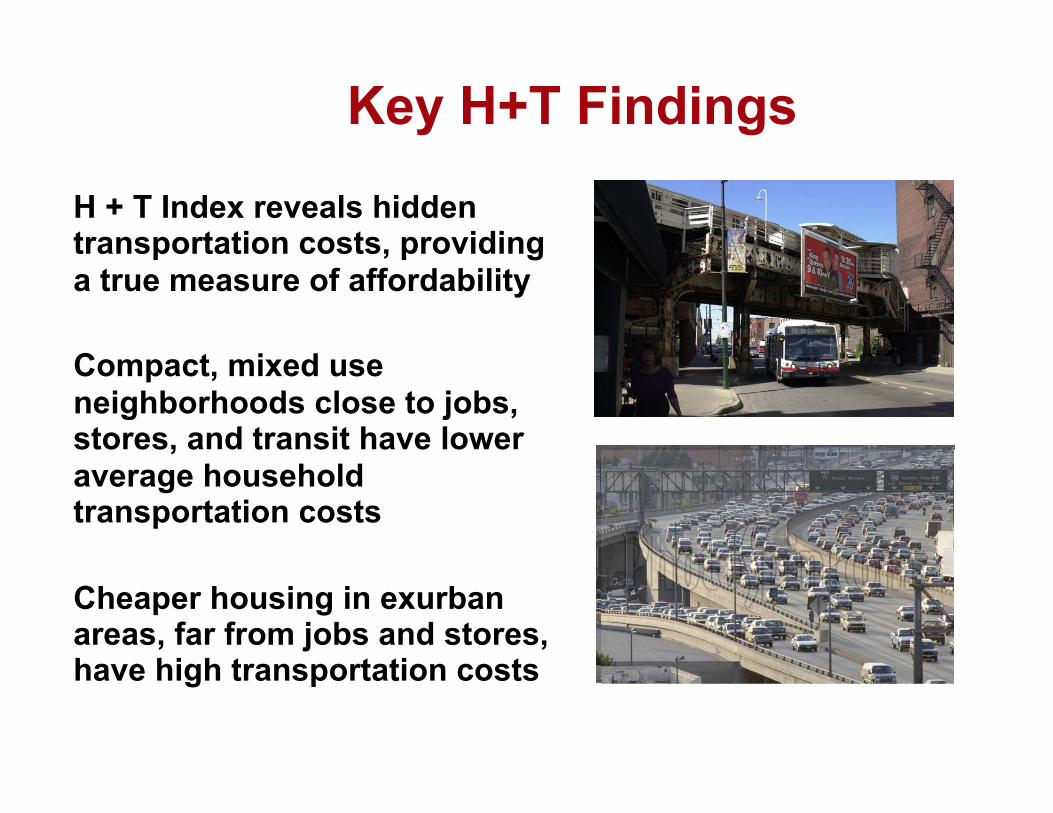
Key H+T Findings
H + T Index reveals hidden transportation costs, providing a true measure of affordability
Compact, mixed use neighborhoods close to jobs, stores, and transit have lower average household transportation costs
Cheaper housing in exurban areas, far from jobs and stores, have high transportation costs
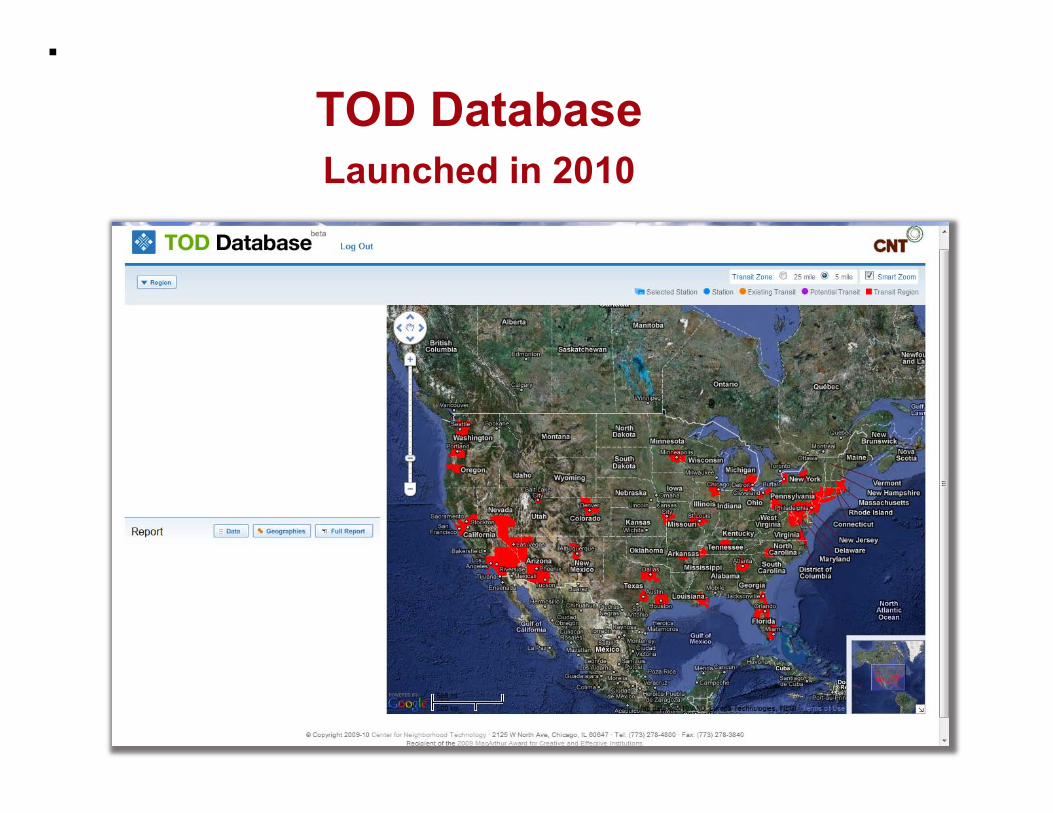
TOD Database Launched in 2010
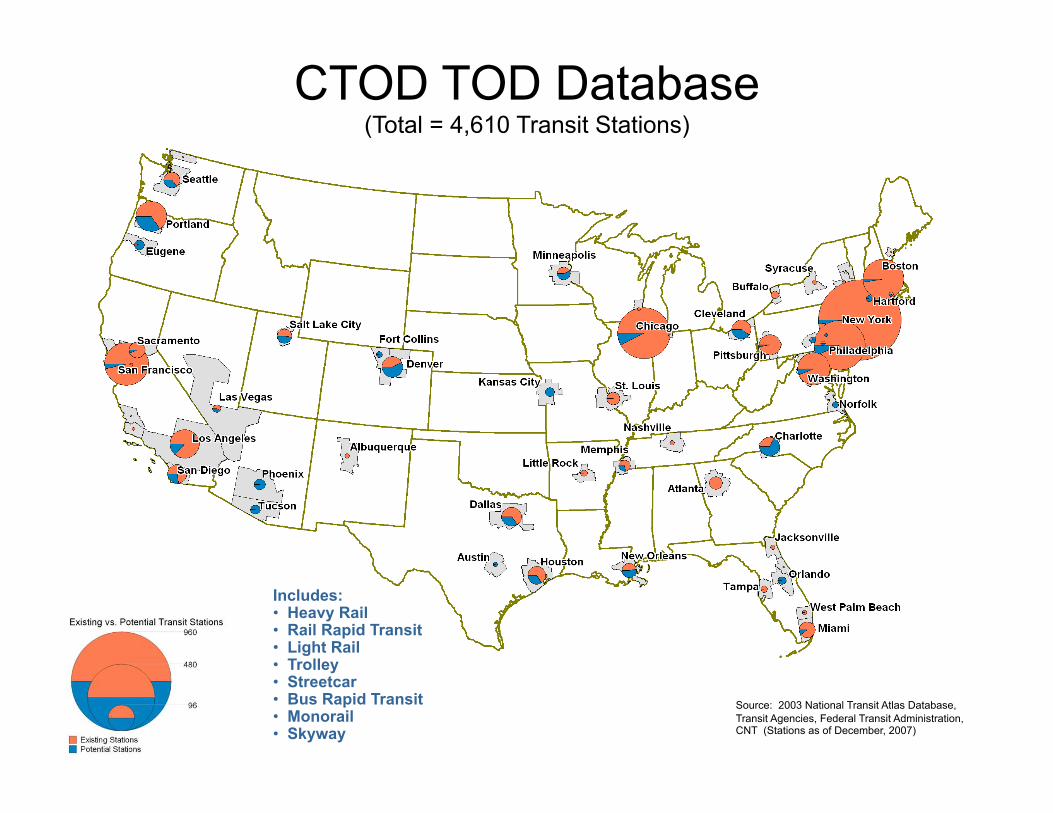
CTOD TOD Database (Total = 4,610 Transit Stations)
Source: 2003 National Transit Atlas Database, Transit Agencies, Federal Transit Administration, CNT (Stations as of December, 2007)
Includes: • Heavy Rail • Rail Rapid Transit • Light Rail • Trolley • Streetcar • Bus Rapid Transit • Monorail • Skyway

Spans 3,767 Existing Stations Across 7 Service Types
Data at a Neighborhood Level
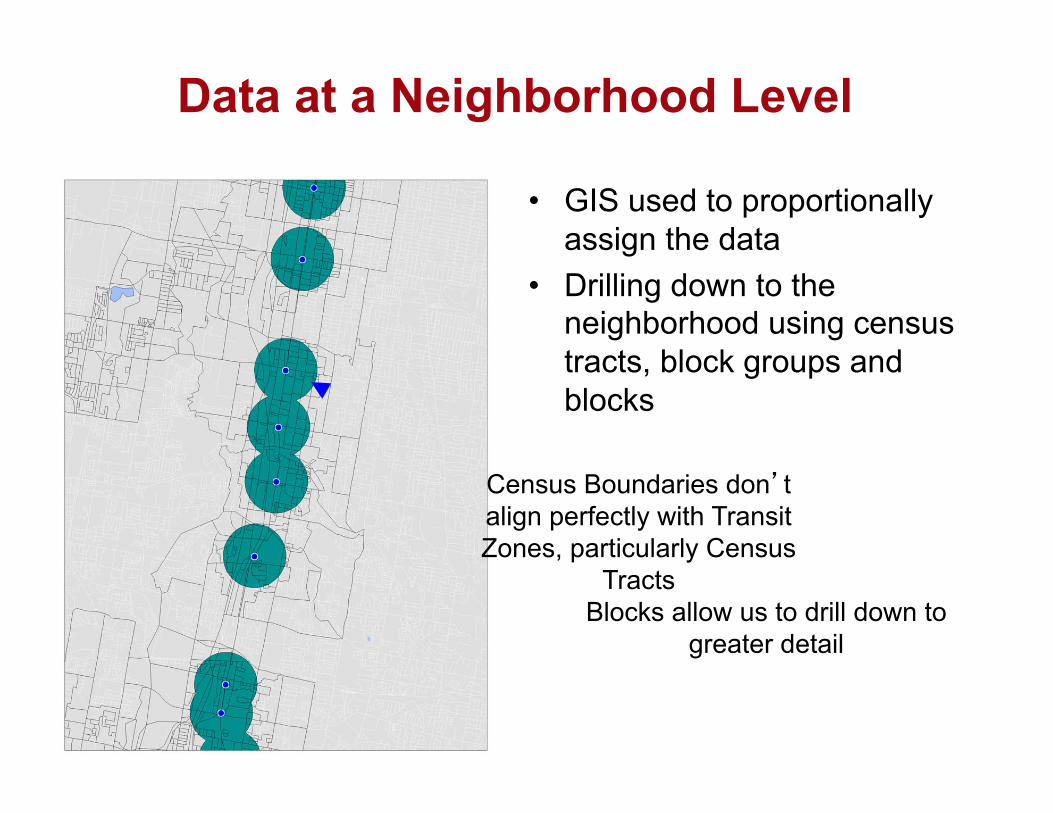
• GIS used to proportionally assign the data
• Drilling down to the neighborhood using census tracts, block groups and blocks
Census Boundaries don’t align perfectly with Transit Zones, particularly Census
Tracts Blocks allow us to drill down to
greater detail
Putting the TOD Database to Work – 2009-10 Upgrades
• Held workshops and webinars for potential users – over 200 reviewers
• Developed hands-on users group • Collected and incorporated reviewer
feedback • Drafted users guide • Public Launch – first 2 weeks over
1,200 users, 15,000 reports generated

TOD Database Demo
Home Page
http://Toddata.cnt.org

Uses for TOD Database
• National research – Soon with demographic trend analysis
• Regional and Local decision-making – Regional analysis – Station-level analysis
• New data-driven tools
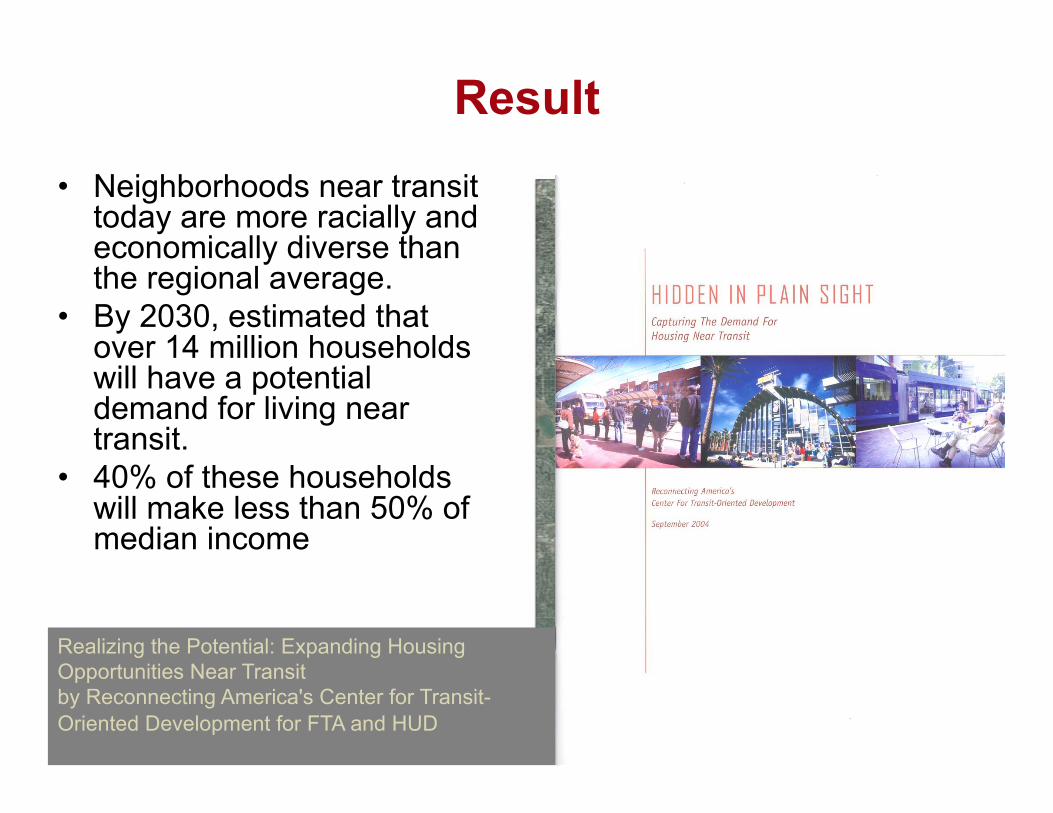
Realizing the Potential: Expanding Housing Opportunities Near Transit by Reconnecting America's Center for Transit-Oriented Development for FTA and HUD
Result • Neighborhoods near transit
today are more racially and economically diverse than the regional average.
• By 2030, estimated that over 14 million households will have a potential demand for living near transit.
• 40% of these households will make less than 50% of median income
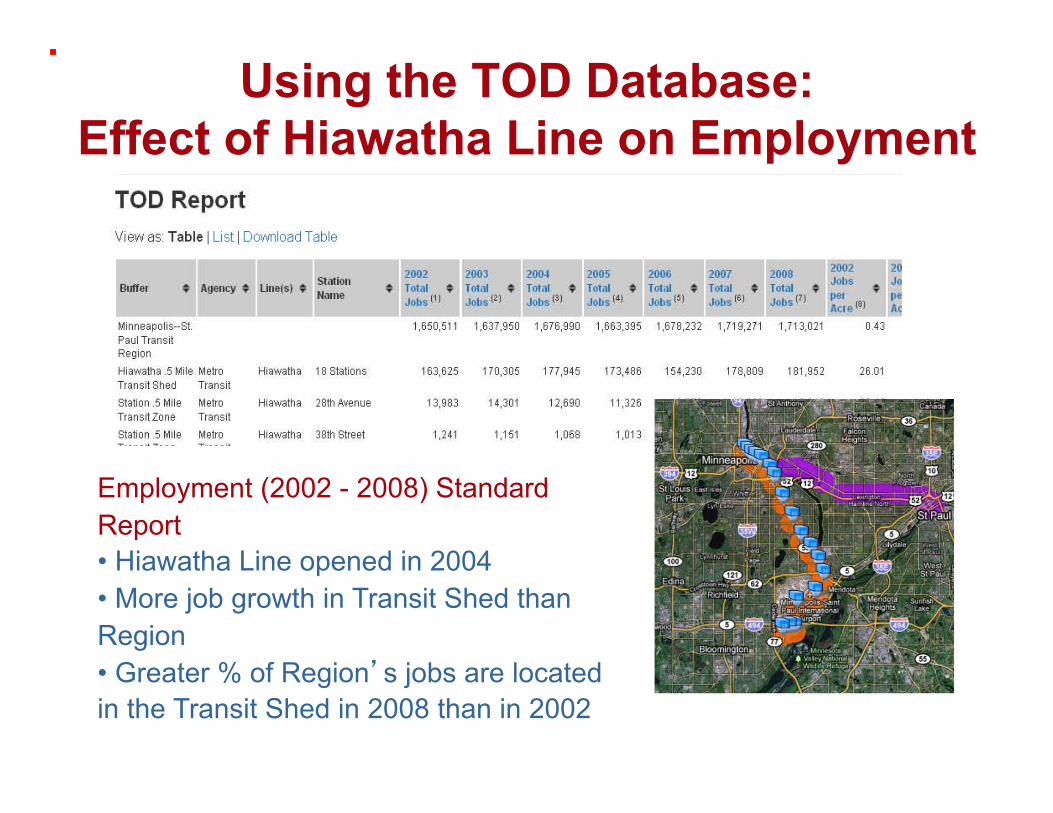
Using the TOD Database: Effect of Hiawatha Line on Employment
Employment (2002 - 2008) Standard Report • Hiawatha Line opened in 2004 • More job growth in Transit Shed than Region • Greater % of Region’s jobs are located in the Transit Shed in 2008 than in 2002
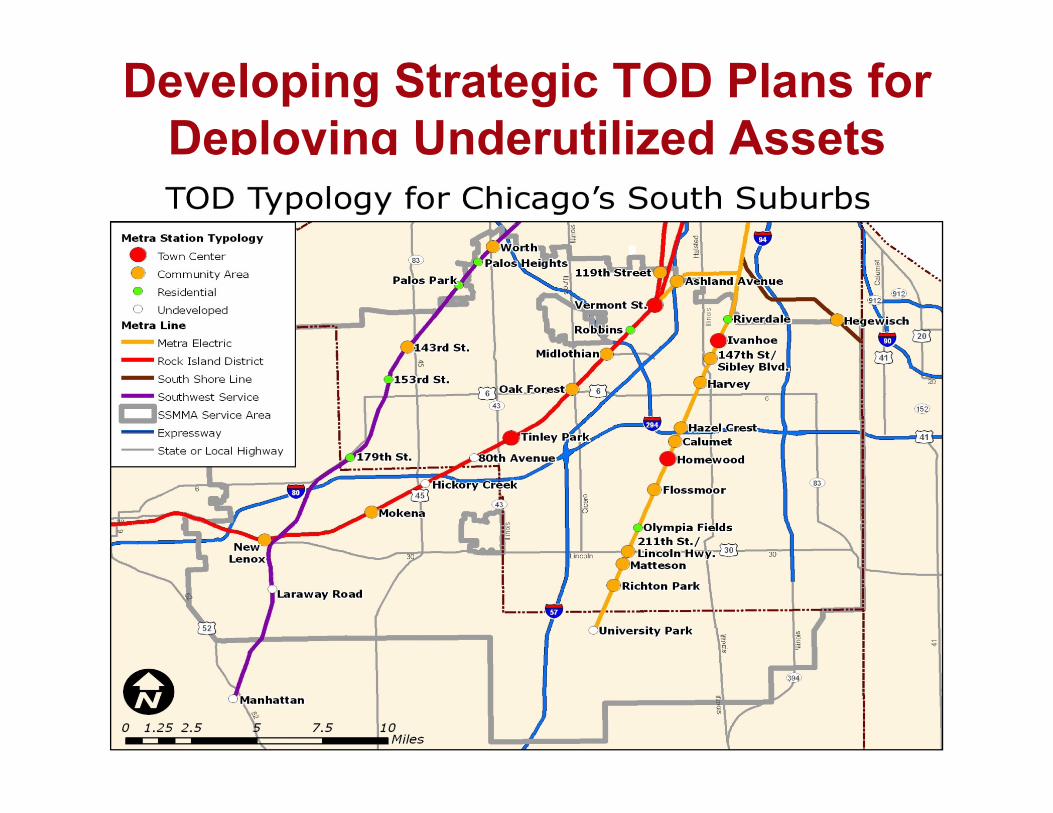
Developing Strategic TOD Plans for Deploying Underutilized Assets

Helping Justify Reduced Parking in TOD Areas
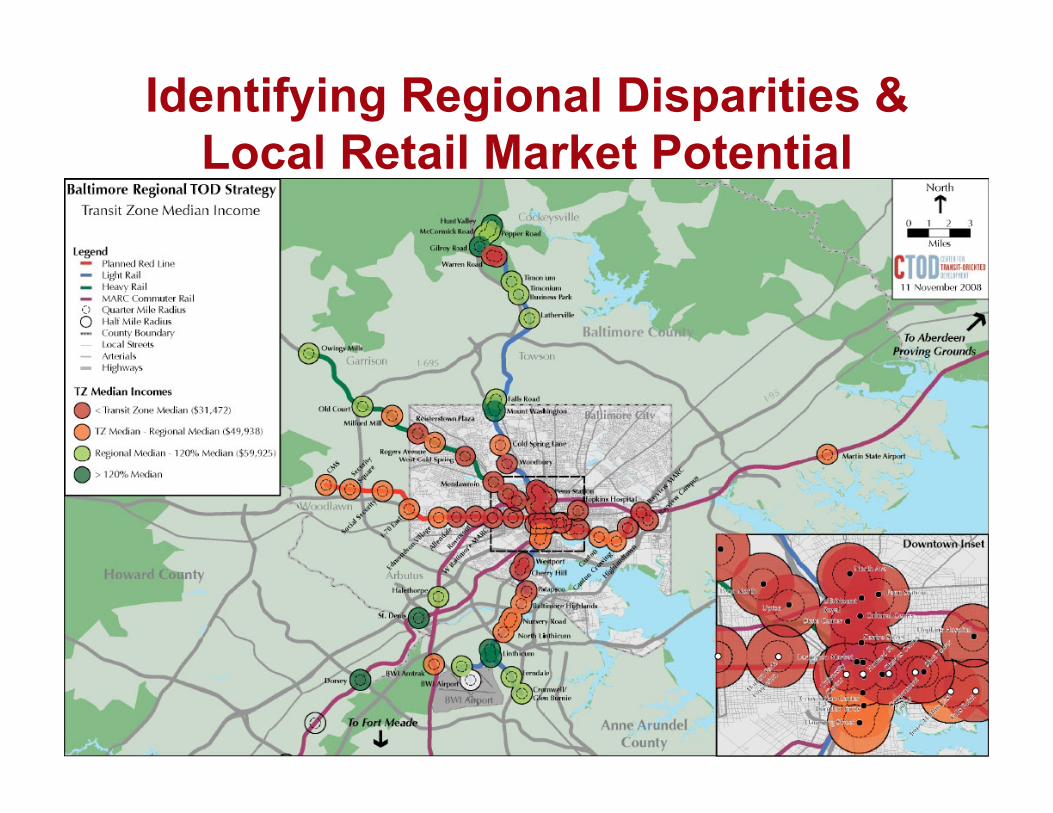
Identifying Regional Disparities & Local Retail Market Potential
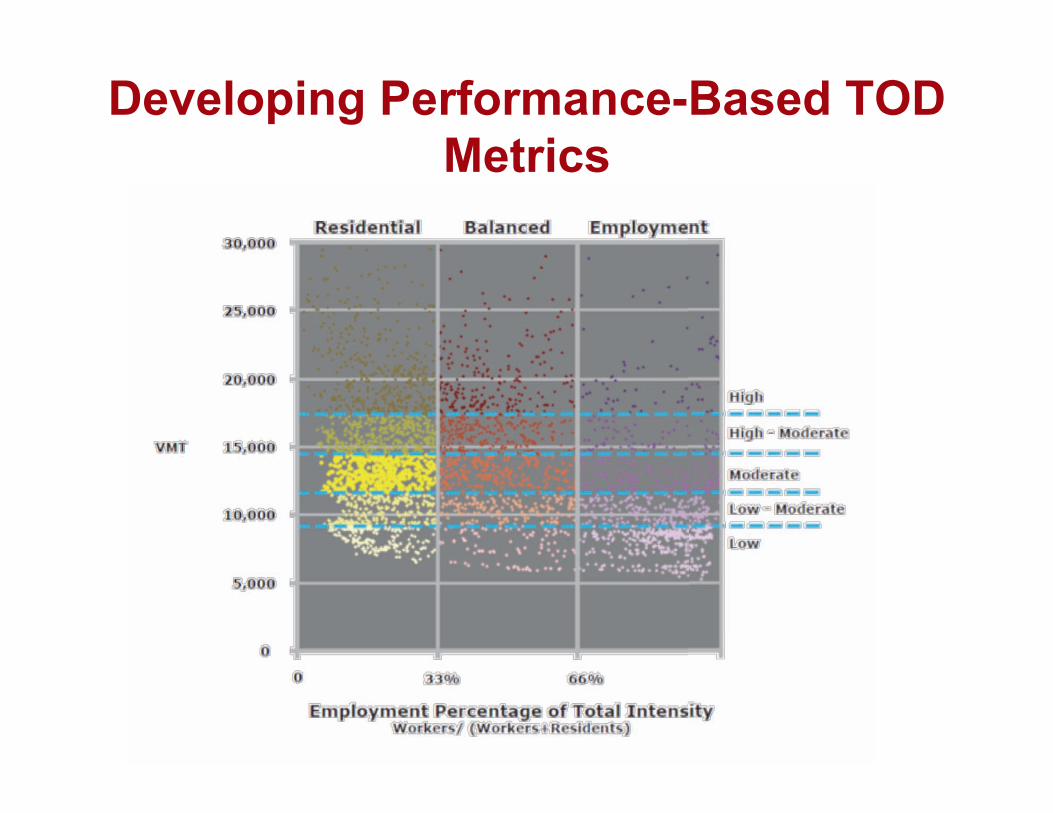
Developing Performance-Based TOD Metrics

Normative Metrics
• Metrics Construction – The average of all stations in each
place type
• Normative metric for each type – Travel characteristics – Transit access – Block size – Auto Ownership – Transportation Cost

Developing Normative Metrics
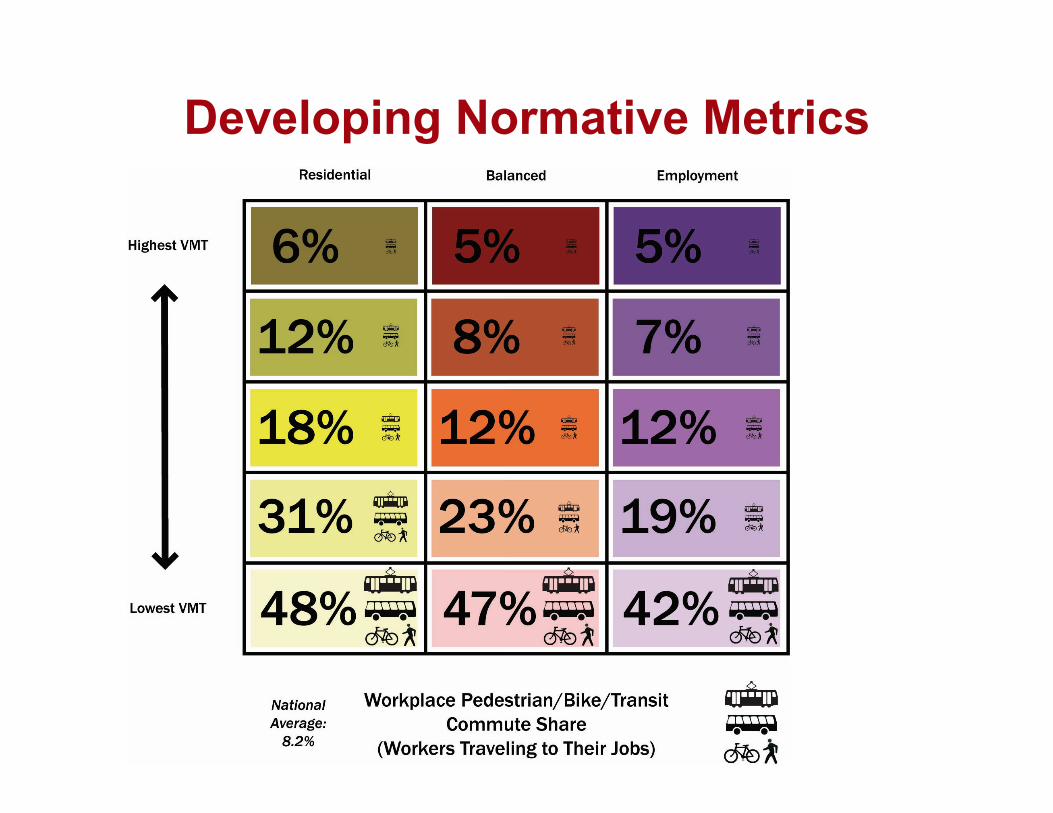
Developing Normative Metrics Developing Normative Metrics
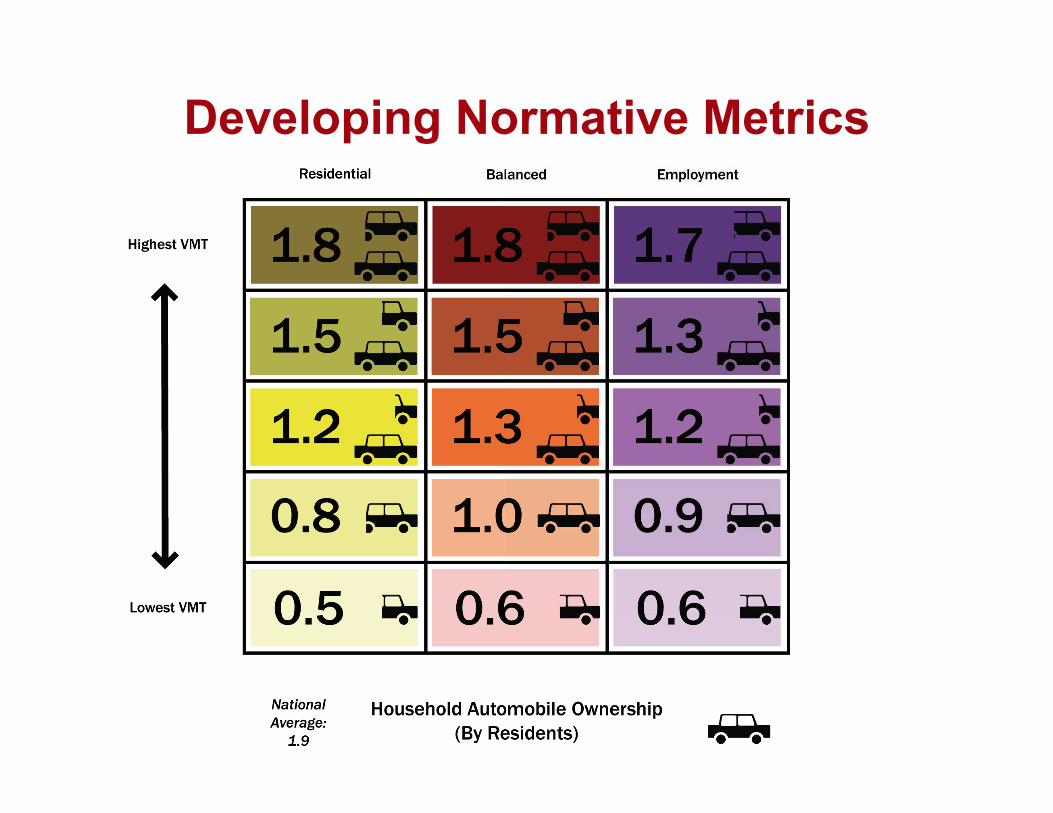
Developing Normative Metrics Developing Normative Metrics
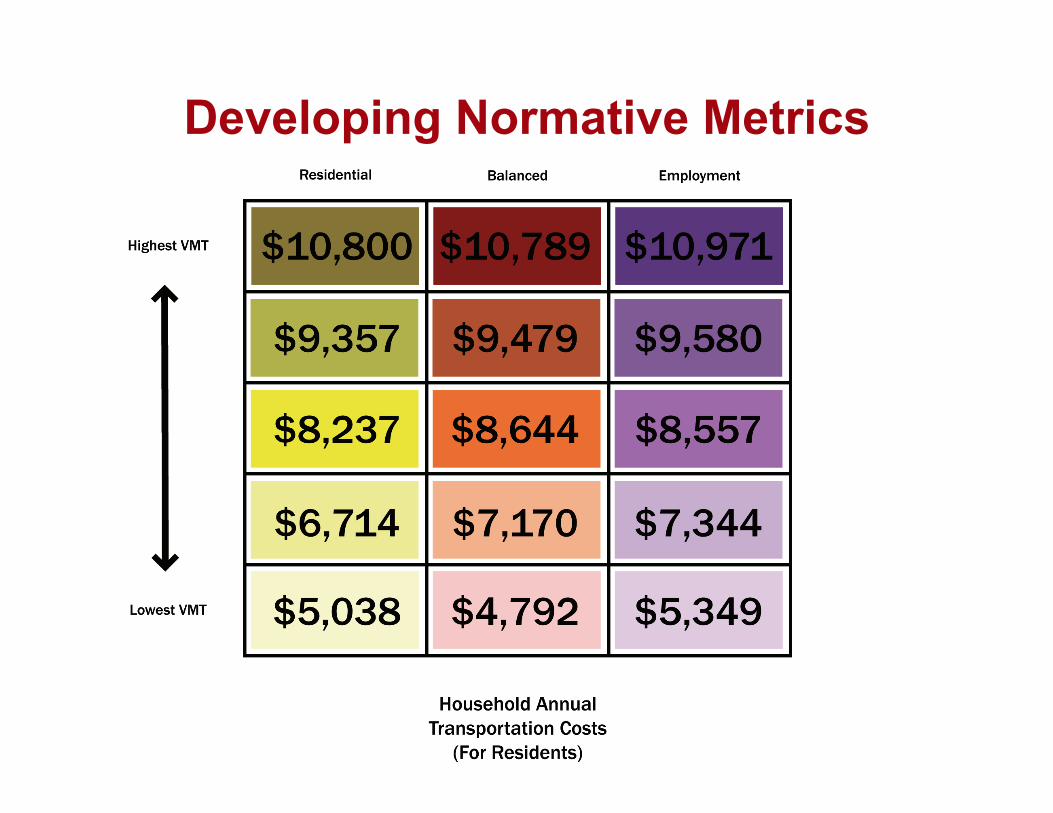
Developing Normative Metrics Developing Normative Metrics
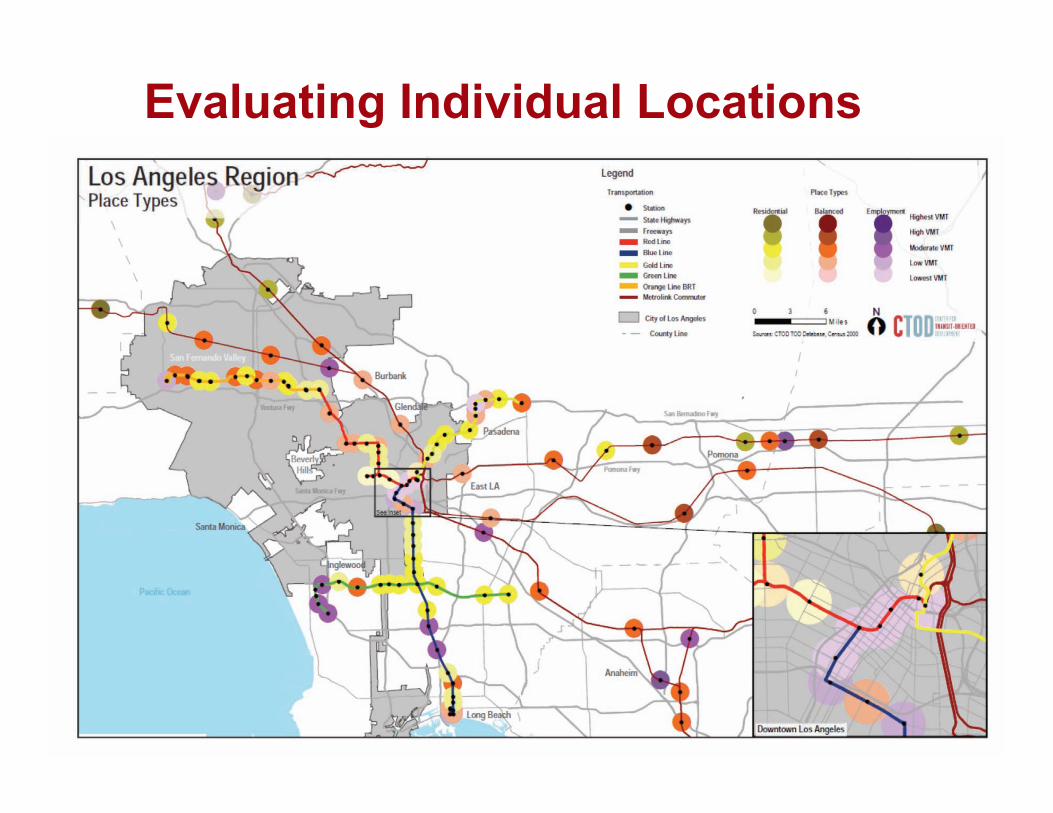
Evaluating Individual Locations
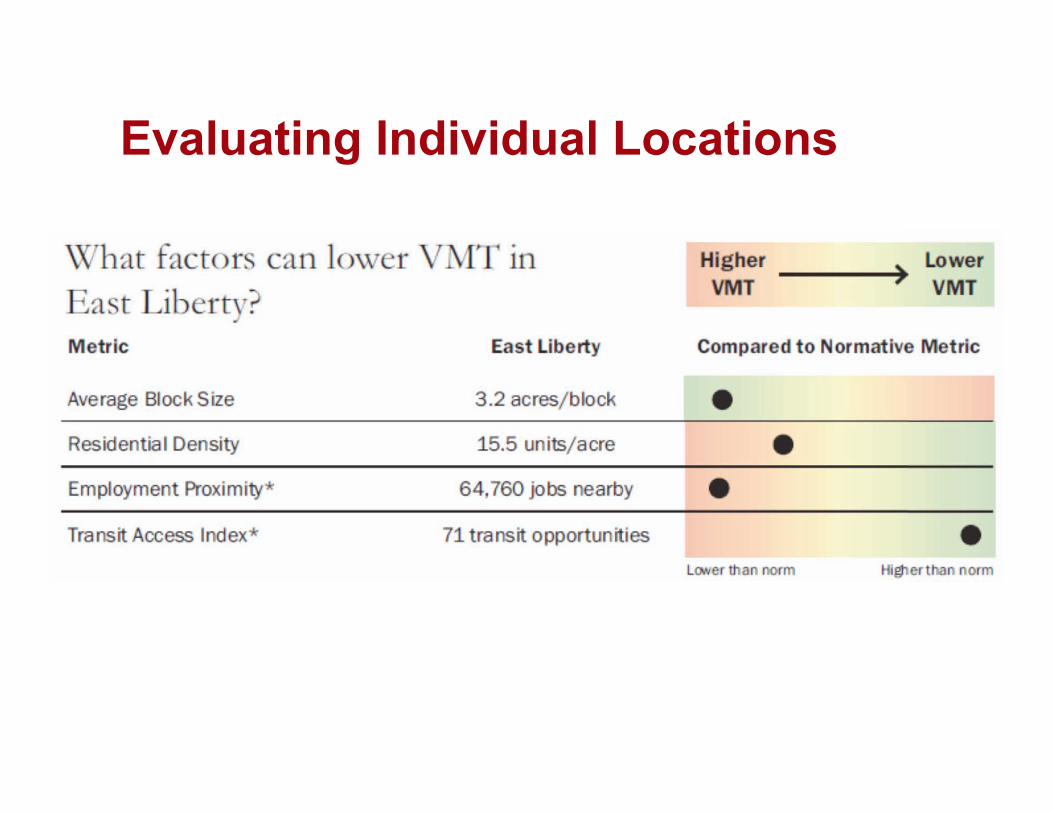
Evaluating Individual Locations