Embed Size (px)
Citation preview
nonprofitfinancefund.org ©2011 Nonprofit Finance Fund
Tools for Nonprofit Success: Financial Management in Tough Times
Presented by
Jessica LaBarberaDirector, California Market
Karla V. SalazarDirector, Los Angeles
June 15, 2011
This presentation is provided with generous support from Bank of America

1nonprofitfinancefund.org ©2011 Nonprofit Finance Fund
Today‘s Goals
Examine tools that can help you uncover and interpret the key financial information to make better decisions in these tough economic times
Learn to:
articulate your financial information to your staff, constituents, board and potential funders
make decisions that strengthen the financial health of your organization and support effective program delivery

2nonprofitfinancefund.org ©2011 Nonprofit Finance Fund
Nonprofit Finance Fund (NFF)
NFF connects nonprofit finance to nonprofit success.
Serving thousands of nonprofit and funders nationwide since 1980
$290 million in loans; over $1 billion in capital leveraged for nonprofits
Over 500 customized financial consultations
Hundreds of strategic partnerships to advance the nonprofit sector
Thought leadership to advance friendlier funding practices across the nonprofit sector
―We‘re in the business of helping nonprofits run better.‖
–Clara Miller, NFF President and CEOExperts in nonprofit finance
Nearly 30 years of experience as a 501 (c)(3)
Community Development Financial Institution (CDFI)
Serving nonprofits nationwide from seven local offices
Northeast: Boston, New York
Mid-Atlantic: Philadelphia, Washington, DC, Newark, NJ
Midwest: Detroit
West Coast: San Francisco, Los Angeles
3nonprofitfinancefund.org ©2011 Nonprofit Finance Fund
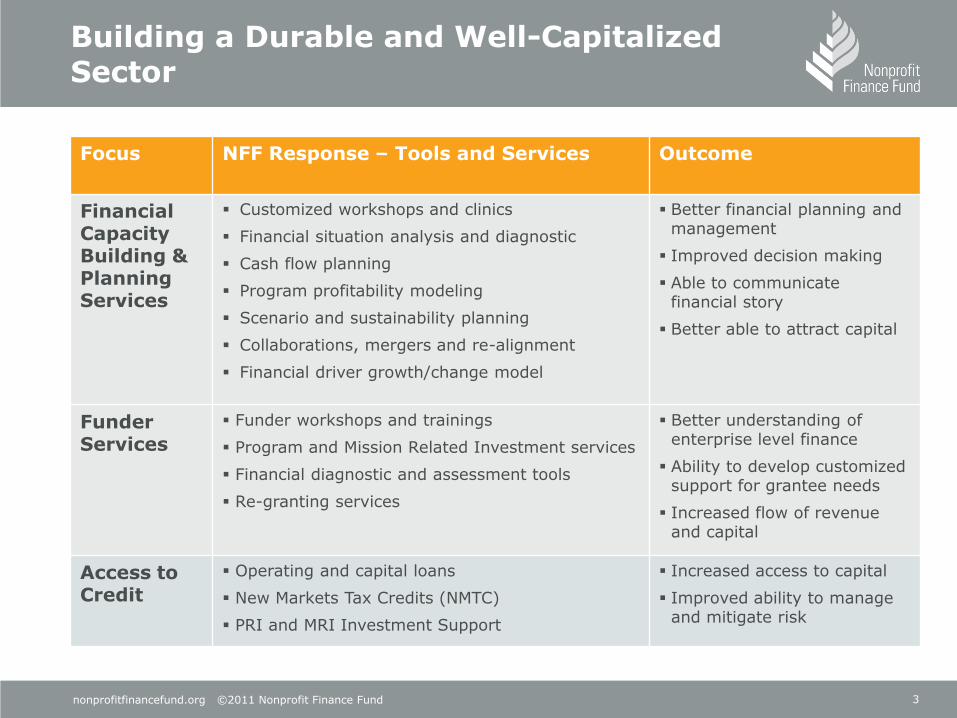
Building a Durable and Well-Capitalized Sector
Focus NFF Response – Tools and Services Outcome
Financial Capacity Building & Planning Services
Customized workshops and clinics
Financial situation analysis and diagnostic
Cash flow planning
Program profitability modeling
Scenario and sustainability planning
Collaborations, mergers and re-alignment
Financial driver growth/change model
Better financial planning and management
Improved decision making
Able to communicate financial story
Better able to attract capital
Funder Services
Funder workshops and trainings
Program and Mission Related Investment services
Financial diagnostic and assessment tools
Re-granting services
Better understanding of enterprise level finance
Ability to develop customized support for grantee needs
Increased flow of revenue and capital
Access to Credit
Operating and capital loans
New Markets Tax Credits (NMTC)
PRI and MRI Investment Support
Increased access to capital
Improved ability to manage and mitigate risk

4nonprofitfinancefund.org ©2011 Nonprofit Finance Fund
NFF‘s Role in Organizational Development
Program Management
Financial Systems & Operations
Board Governance
and Leadership
Fundraising & Development
Leadership
Financial Literacy and
Capacity Building
Adaptive Capacity

5nonprofitfinancefund.org ©2011 Nonprofit Finance Fund
The ―Whole Enterprise‖ Concept
Mission and Program
What you do, and how you do it.
Capacity
The people, space, and processes that allow you to do what you do.
Capital
What resources and assets you to have to work with.
nonprofitfinancefund.org ©2011 Nonprofit Finance Fund
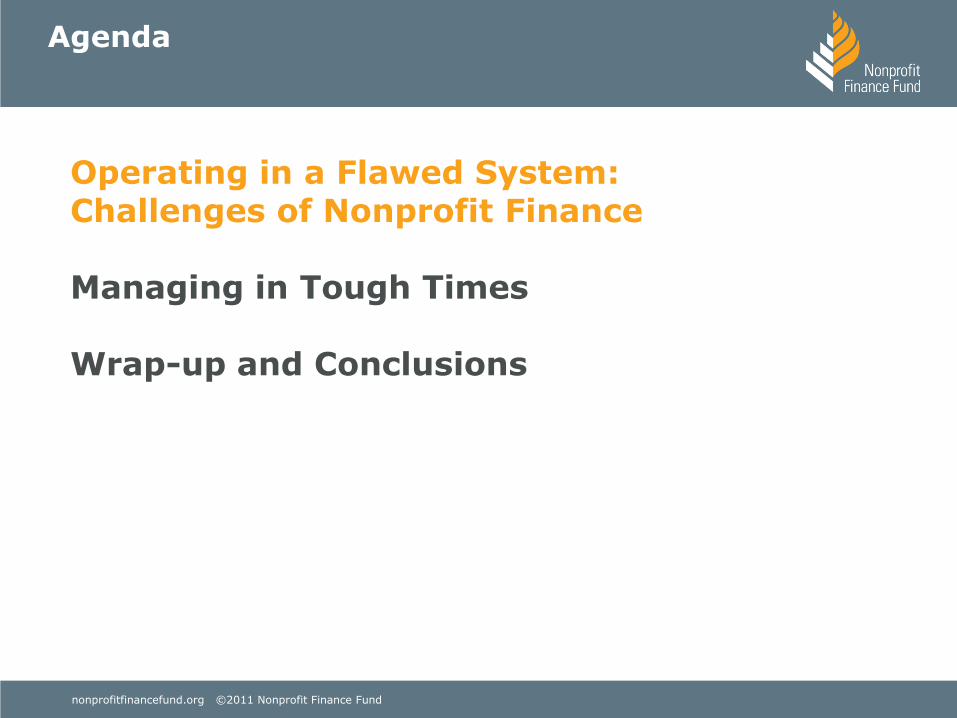
Operating in a Flawed System: Challenges of Nonprofit Finance
Managing in Tough Times
Wrap-up and Conclusions
Agenda
7nonprofitfinancefund.org ©2011 Nonprofit Finance Fund
Operating Within a Flawed System
The Realities and Challenges of Nonprofit Finance
Covering the Full Cost
The Subsidy Business
Inflexible, programmatic funding
Reliable Revenue
8nonprofitfinancefund.org ©2011 Nonprofit Finance Fund
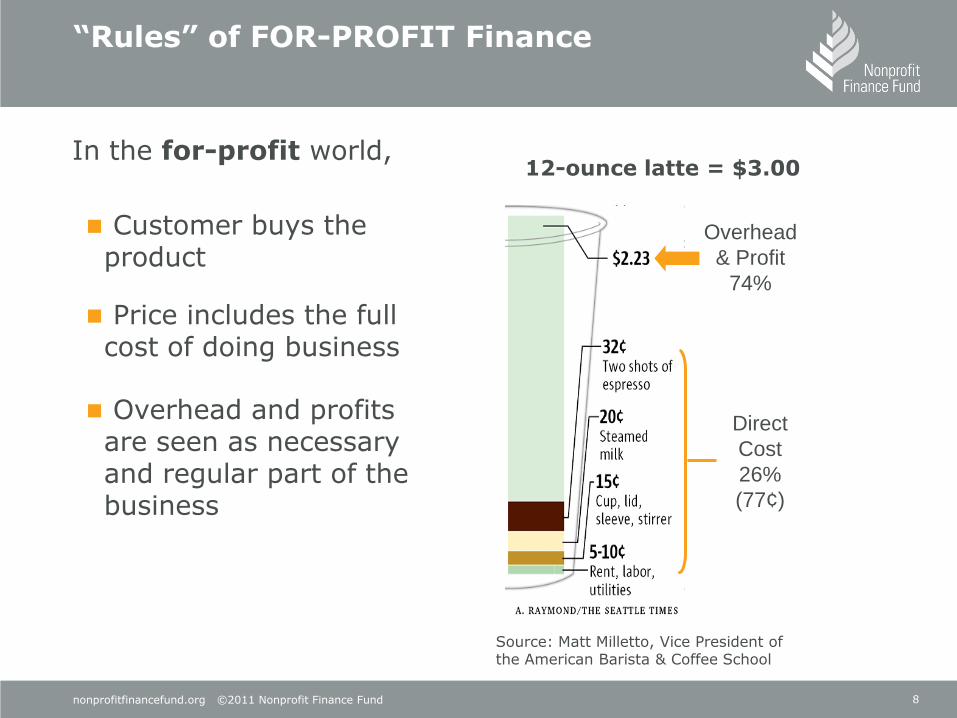
In the for-profit world,
―Rules‖ of FOR-PROFIT Finance
Direct
Cost
26%
(77¢)
Overhead
& Profit
74%
12-ounce latte = $3.00
Customer buys the product
Price includes the full cost of doing business
Overhead and profits are seen as necessary and regular part of the business
Source: Matt Milletto, Vice President of the American Barista & Coffee School

9nonprofitfinancefund.org ©2011 Nonprofit Finance Fund
But in the nonprofit world,
―Rules‖ of NONPROFIT Finance
Client often does not pay for the product (i.e. homeless do not pay per night for a shelter).
Nonprofits rely on third parties (donors and funders) to pay for the cost of products and services.
Donors and funders want most of their contribution to go directly to the people served.
Overhead and profits are often seen as unnecessary and unrelated to achieving the mission.
10nonprofitfinancefund.org ©2011 Nonprofit Finance Fund
―Rules‖ of NONPROFIT Finance, Cont‘d
Restricted contributions often times forbid use of funds to cover “indirect” costs. Nonprofits often ‗accept what they can get‘ rather than „ask for what they need‘.
Since nonprofits can rarely charge prices sufficient to cover the full cost of their core mission programs, they require support businesses (a.k.a the ―subsidy‖ business)
Common subsidy businesses include:
Sweat equity (underpaying, overworking, using volunteers)
Fundraising
Investment income
Real estate (rental income)
Earned income ventures

11nonprofitfinancefund.org ©2011 Nonprofit Finance Fund
Surplus Size Matters:Understanding Full Cost
Like any organization, nonprofits need to cover the ‗full cost‘ of delivering programs
Tax Status vs. Business Model
Full costs > Operating Expenses
Full costs include:
Total operating expenses
New capital investments
Depreciation allocation
Debt
Savings for the future
This is the TitleThis is the Subtitle
10
10
1010
10
10
Series1
Series2
Series3
Series4
Series5
Series6
Series7
Series8
Operating Expenses
Fixed Asset Additions
Debt Principal
Working Capital
Reserves
Depreciation
12nonprofitfinancefund.org ©2011 Nonprofit Finance Fund
The ―Right‖ Revenue
The ―right‖ money is recurring, reliable, and flexible
It covers full costs and meets full enterprise needs
Nonprofit leaders have a responsibility to:
Accept that not all revenue opportunities are worthy of pursuit
Manage costs in the context of revenue reality
Articulate cases for revenue and capital based on the full range of business needs
Funders have a responsibility to understand these needs and define what role their money will play
nonprofitfinancefund.org ©2011 Nonprofit Finance Fund
Operating in a Flawed System: Challenges of Nonprofit Finance
Managing in Tough Times
Wrap-up and Conclusions
Agenda

14nonprofitfinancefund.org ©2011 Nonprofit Finance Fund
Knowing-Doing Gap: Where are You?
Information Gap: Do you develop transparent, accurate and timely financial planning and management reports that give you the information you need?
Interpretation Gap: Do management and board collectively have the ability to understand, interpret and discuss the implications of financial information?
Decision-making Gap: Do you have a culture of making and following through on tough decisions?

15nonprofitfinancefund.org ©2011 Nonprofit Finance Fund
Developing a Financial Toolkit
Do your financial planning and management tools provide the information you need?
Year-to-date actuals vs. budget or periodic forecasts
Balance sheet
Monthly cash flow
Revenue and expense by program
Who is involved in preparing the reports?
How frequently?
Who receives them?
When and how does the Board get involved?
Tools are only as good as the assumptions behind them. Be prepared to work with and adapt to imperfect information

16nonprofitfinancefund.org ©2011 Nonprofit Finance Fund
Income Statement
Revenue minusExpense =Surplus / Deficit
Interpretation Basics: The Bottom Line
Income Statement (Statement of Activities): Surplus/Deficit
Income Statement reflects the annual results of an organization‟s operations
Balance Sheet (Statement of Financial Position): Net Assets
Balance Sheet provides a picture of overall financial health and operating “cushion”
Balance Sheet
AssetsLiabilitiesNet Assets
A surplus buildsnet assets;
A deficit depletesnet assets

17nonprofitfinancefund.org ©2011 Nonprofit Finance Fund
Revenue Goes Into Three ―Buckets‖
Unrestricted Revenue
Permanently Restricted Revenue
Temporarily Restricted Revenue
Earned Contributed TimingPurpose Endowment
Unrestricted Net Assets
Temp. Restricted Net Assets
Perm. Restricted Net Assets
18nonprofitfinancefund.org ©2011 Nonprofit Finance Fund
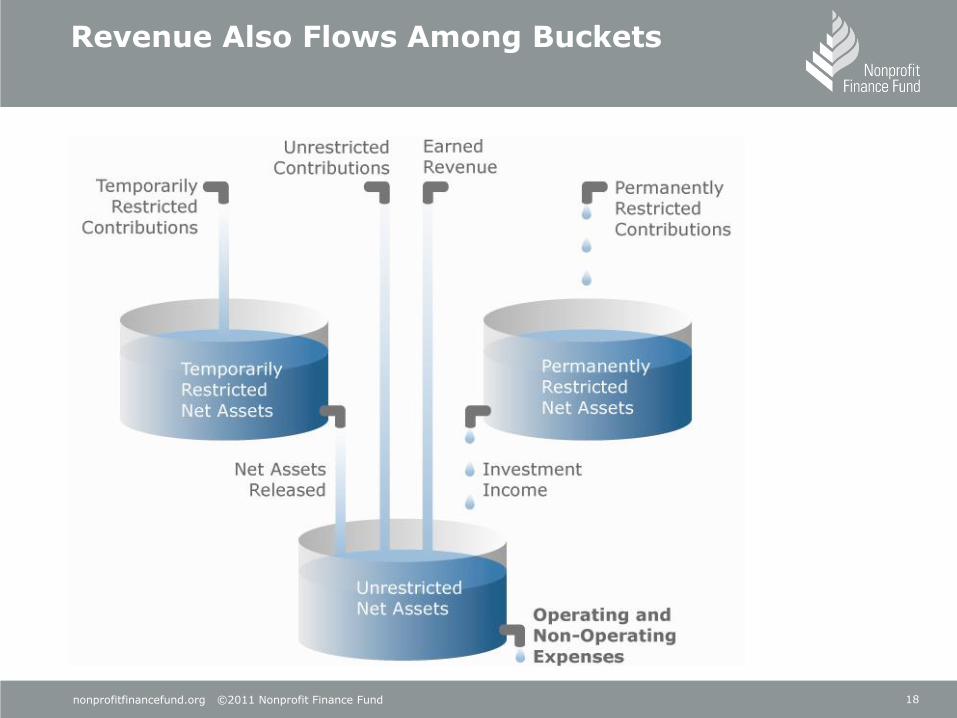
Revenue Also Flows Among Buckets

19nonprofitfinancefund.org ©2011 Nonprofit Finance Fund
Examine Net Asset Composition
Earned Revenue
Permanently Restricted Contributions
Unrestricted Contributions
Temporarily Restricted
Contributions
Temporarily Restricted Net Assets
PermanentlyRestricted Net Assets
Net Assets Released
Investment Income
Operating and Non-operating Expenses
Ice: Receivables
Rocks: PP & E
Water Bottle:Board Designated Reserve
Water: Unrestricted Cash
20nonprofitfinancefund.org ©2011 Nonprofit Finance Fund
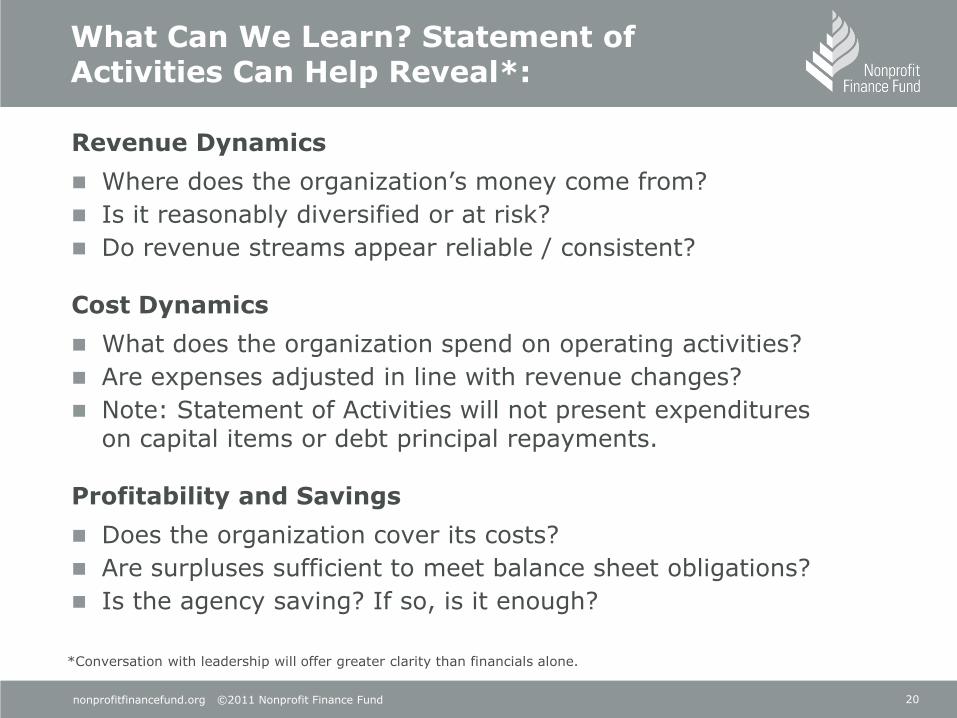
What Can We Learn? Statement of Activities Can Help Reveal*:
Revenue Dynamics
Where does the organization‟s money come from?
Is it reasonably diversified or at risk?
Do revenue streams appear reliable / consistent?
Cost Dynamics
What does the organization spend on operating activities?
Are expenses adjusted in line with revenue changes?
Note: Statement of Activities will not present expenditures on capital items or debt principal repayments.
Profitability and Savings
Does the organization cover its costs?
Are surpluses sufficient to meet balance sheet obligations?
Is the agency saving? If so, is it enough?
*Conversation with leadership will offer greater clarity than financials alone.
21nonprofitfinancefund.org ©2011 Nonprofit Finance Fund
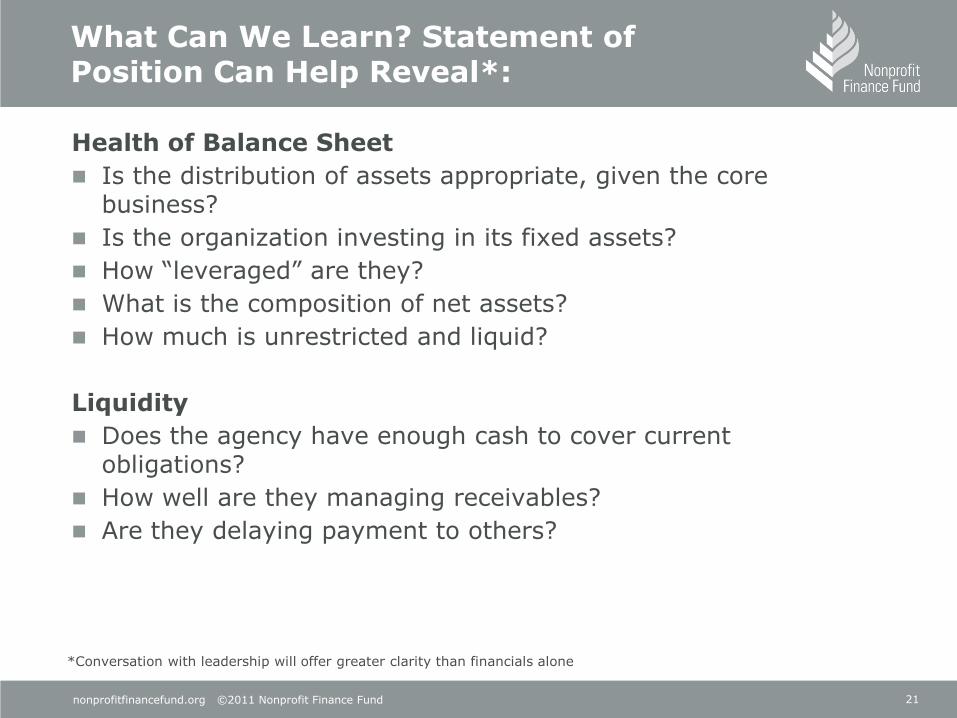
Health of Balance Sheet
Is the distribution of assets appropriate, given the core business?
Is the organization investing in its fixed assets?
How “leveraged” are they?
What is the composition of net assets?
How much is unrestricted and liquid?
Liquidity
Does the agency have enough cash to cover current obligations?
How well are they managing receivables?
Are they delaying payment to others?
*Conversation with leadership will offer greater clarity than financials alone
What Can We Learn? Statement of Position Can Help Reveal*:

22nonprofitfinancefund.org ©2011 Nonprofit Finance Fund
Interpretation Basics:Know Your Balance Sheet
An organization‘s adaptive capacity is directly tied to the health of its capital structure
If your balance sheet has…
No cash or receivables
A fully drawn line of credit
Little or no reserves available to management
Significant wear-and-tear of fixed assets
…There are no dollars immediately available to draw on in challenging times
Borrowing to replace lost income is rarely appropriate
Risk – Cash = Crisis
23nonprofitfinancefund.org ©2011 Nonprofit Finance Fund
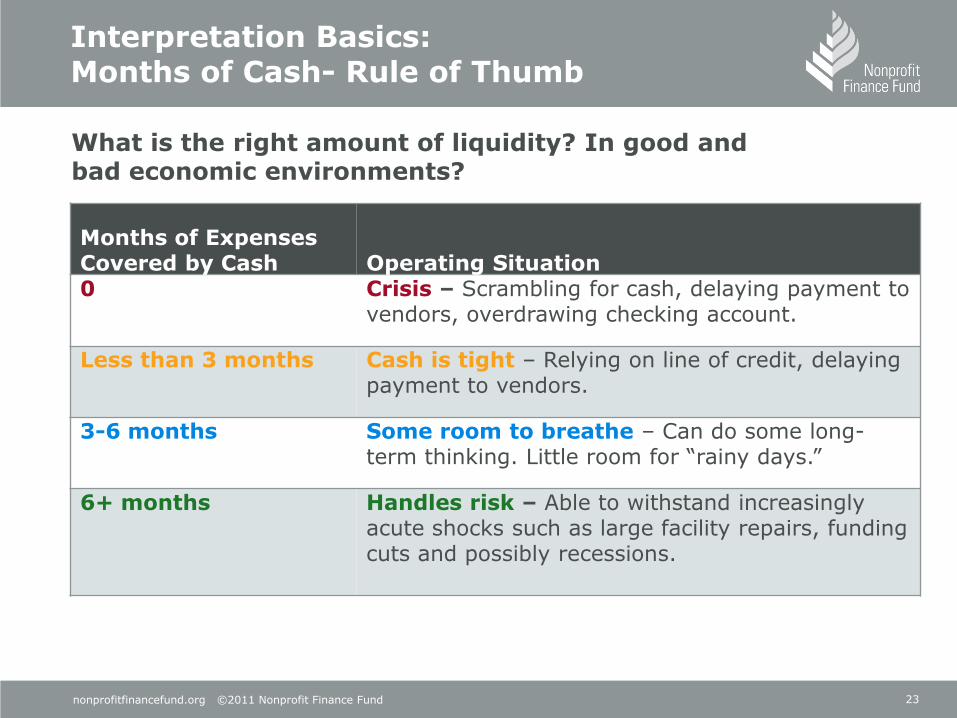
Interpretation Basics:Months of Cash- Rule of Thumb
What is the right amount of liquidity? In good and bad economic environments?
Months of Expenses Covered by Cash Operating Situation0 Crisis – Scrambling for cash, delaying payment to
vendors, overdrawing checking account.
Less than 3 months Cash is tight – Relying on line of credit, delaying payment to vendors.
3-6 months Some room to breathe – Can do some long-term thinking. Little room for “rainy days.”
6+ months Handles risk – Able to withstand increasingly acute shocks such as large facility repairs, funding cuts and possibly recessions.

24nonprofitfinancefund.org ©2011 Nonprofit Finance Fund
Assessing Your Nonprofit‘s Current Financial Condition
Understand Operating Performance
Determine Strength of Balance Sheet
Assess Ability to Handle Risk and Pursue Opportunity
Comprehensive Financial Analysis

25nonprofitfinancefund.org ©2011 Nonprofit Finance Fund
Program Profitability Analysis
Scenario Testing
Explore strategic partnerships, collaborations, mergers
Debt Consultingand Access to Capital
Cash Flow Planning
Quantifying the Challenge & Planning the Response: NFF Framework
Financial & Organizational Assessment

26nonprofitfinancefund.org ©2011 Nonprofit Finance Fund
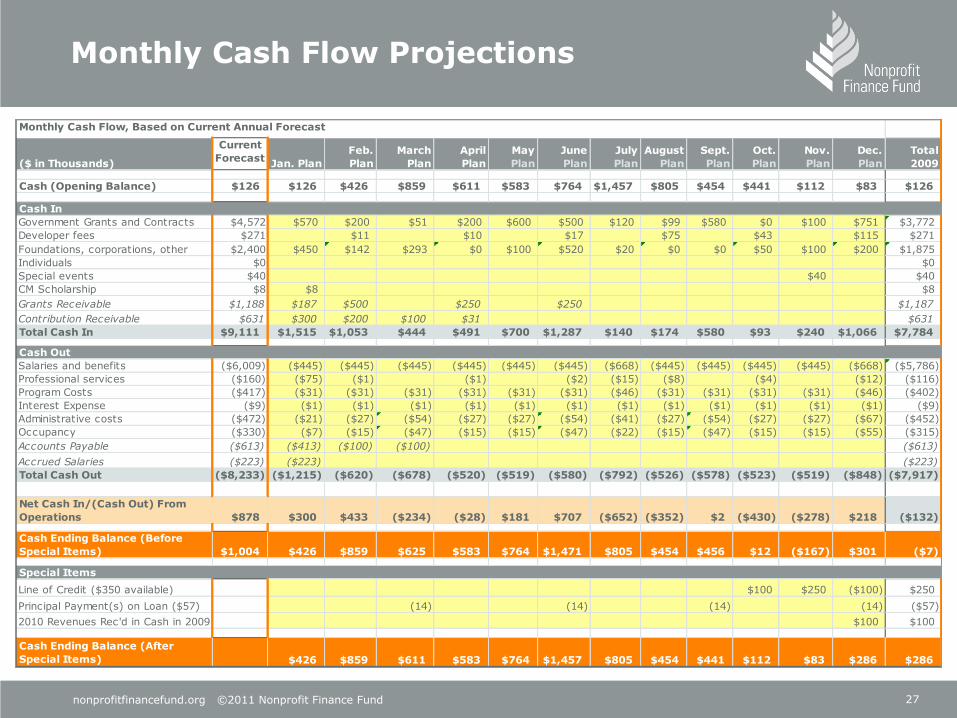
Quantifying The Challenge: Cash Flow Projections
Recessions impose severe constraints on cash flow and cash availability
Cash flow projections ensure more visibility into the future by developing a physical picture of the timing and reliability of cash in and cash out
Distinguish between ―cash flow‖ issues (timing of receipts) and ―cash‖ issues (shortage of cash overall)
Prepare cash flow projections monthly (if not weekly in times of crisis) and continually update based on budget actuals vs. projection
Cash flow projections can be used:
To monitor how much cash on hand is needed and, if appropriate, how much short-term debt is needed for difficult cash flow months
To instill cash management discipline
As part of standard Board/Finance Committee reporting package
To support conversations with funders, bankers and other stakeholders
To inform and guide achievement of mission and program objectives
27nonprofitfinancefund.org ©2011 Nonprofit Finance Fund
Monthly Cash Flow Projections
($ in Thousands)
Current
ForecastJan. Plan
Feb.
Plan
March
Plan
April
Plan
May
Plan
June
Plan
July
Plan
August
Plan
Sept.
Plan
Oct.
Plan
Nov.
Plan
Dec.
Plan
Total
2009
Cash (Opening Balance) $126 $126 $426 $859 $611 $583 $764 $1,457 $805 $454 $441 $112 $83 $126
Government Grants and Contracts $4,572 $570 $200 $51 $200 $600 $500 $120 $99 $580 $0 $100 $751 $3,772
Developer fees $271 $11 $10 $17 $75 $43 $115 $271
Foundations, corporations, other $2,400 $450 $142 $293 $0 $100 $520 $20 $0 $0 $50 $100 $200 $1,875
Individuals $0 $0
Special events $40 $40 $40
CM Scholarship $8 $8 $8
Grants Receivable $1,188 $187 $500 $250 $250 $1,187
Contribution Receivable $631 $300 $200 $100 $31 $631
Total Cash In $9,111 $1,515 $1,053 $444 $491 $700 $1,287 $140 $174 $580 $93 $240 $1,066 $7,784
Salaries and benefits ($6,009) ($445) ($445) ($445) ($445) ($445) ($445) ($668) ($445) ($445) ($445) ($445) ($668) ($5,786)
Professional services ($160) ($75) ($1) ($1) ($2) ($15) ($8) ($4) ($12) ($116)
Program Costs ($417) ($31) ($31) ($31) ($31) ($31) ($31) ($46) ($31) ($31) ($31) ($31) ($46) ($402)
Interest Expense ($9) ($1) ($1) ($1) ($1) ($1) ($1) ($1) ($1) ($1) ($1) ($1) ($1) ($9)
Administrative costs ($472) ($21) ($27) ($54) ($27) ($27) ($54) ($41) ($27) ($54) ($27) ($27) ($67) ($452)
Occupancy ($330) ($7) ($15) ($47) ($15) ($15) ($47) ($22) ($15) ($47) ($15) ($15) ($55) ($315)
Accounts Payable ($613) ($413) ($100) ($100) ($613)
Accrued Salaries ($223) ($223) ($223)
Total Cash Out ($8,233) ($1,215) ($620) ($678) ($520) ($519) ($580) ($792) ($526) ($578) ($523) ($519) ($848) ($7,917)
Net Cash In/(Cash Out) From
Operations $878 $300 $433 ($234) ($28) $181 $707 ($652) ($352) $2 ($430) ($278) $218 ($132)
Cash Ending Balance (Before
Special Items) $1,004 $426 $859 $625 $583 $764 $1,471 $805 $454 $456 $12 ($167) $301 ($7)
Line of Credit ($350 available) $100 $250 ($100) $250
Principal Payment(s) on Loan ($57) (14) (14) (14) (14) ($57)
2010 Revenues Rec'd in Cash in 2009 $100 $100
Cash Ending Balance (After
Special Items) $426 $859 $611 $583 $764 $1,457 $805 $454 $441 $112 $83 $286 $286
Monthly Cash Flow, Based on Current Annual Forecast
Special Items
Cash Out
Cash In

28nonprofitfinancefund.org ©2011 Nonprofit Finance Fund
Using Program Profitability Analysis to Assess Risk
Assessing underlying program economics informs strategic decisions about:
Whether and how to cut costs
Where to focus fundraising efforts
Whether to sustain, grow or cut/change programs
How to respond to operating changes
How to allocate resources among competing priorities
Nonprofits often make decisions to maintain deficit programs critical to their mission
The key is to understand the size of, and identify the source for the subsidy needed to cover, these deficits

29nonprofitfinancefund.org ©2011 Nonprofit Finance Fund
Program Profitability Analysis: A Visual Tool
+ $
- $
High $ contribution High mission alignment
What can we cultivate and preserve?
Are there opportunities for growth?
High $ contribution Low mission alignment
Assess threat of „drift‟
Opportunity to align with core programs?
Non-financial costs?
Mission
Low $ contribution Low mission alignment
Relevance to the organization?
Legacy? One-off?
Opportunities for strategic realignment?
Low Impact
Low $ contribution High mission alignment
Potential to cut costs?
Can the revenue model change?
Does subsidy exist elsewhere in the organization?
High Impact
Mo
ney
Con
trib
uti
on
M
arg
in

30nonprofitfinancefund.org ©2011 Nonprofit Finance Fund
Sample Program Profitability Model
After
School
Youth
Program Literacy
Senior
Services
Program
Subtotal Fundraising
Specia l
Events
Program
Mgm t Adm in.
Capacity
Subtotal Total
Revenue
(A) Earned
Governm ent contracts $457 $110 $800 $1,367 $0 $1,367
Ticket Sales $0 $0 $0
Client Fees $156 $100 $256 $0 $256
Subtotal $613 $110 $0 $900 $1,623 $0 $0 $0 $0 $0 $1,623
(B) Contributed
Foundations & Corporations $113 $120 $233 $10 $10 $243
Governm ent $27 $27 $80 $80 $107
Ind ividuals $85 $85 $704 $242 $946 $1,031
Trustees $12 $12 $152 $185 $337 $349
Subtotal $237 $0 $120 $0 $357 $946 $427 $0 $0 $1,373 $1,730
Total Revenue $850 $110 $120 $900 $1,980 $946 $427 $0 $0 $1,373 $3,353
Expenses
Salary & Benefits ($441) ($80) ($525) ($1,046) ($188) ($85) ($475) ($748) ($1,794)
Consultants & Contractors ($239) ($100) ($172) ($511) ($20) ($175) ($195) ($706)
Professional Fees $0 ($48) ($85) ($13) ($146) ($146)
Occupancy ($112) ($259) ($371) ($62) ($46) ($108) ($479)
Office & Supplies ($3) ($12) ($5) ($20) $0 ($20)
Program ($85) ($8) ($10) ($103) $0 ($103)
Interest $0 ($20) ($20) ($20)
M iscellaneous ($15) ($29) ($44) ($44) ($15) ($102) ($161) ($205)
Total Expenses ($894) ($100) ($100) ($1,000) ($2,094) ($300) ($337) ($85) ($656) ($1,378) ($3,472)
Surplus/Deficit ($45) $10 $20 ($100) ($115) $646 $90 ($85) ($656) ($5) ($120)
CapacityProgram s

31nonprofitfinancefund.org ©2011 Nonprofit Finance Fund
Scenario Testing
By building a financial model using alternate case scenarios, you can project a range of outcomes to inform decisions
Scenario testing provides a means to explicitly and transparently communicate in financial terms the viability of plans for the future
Determine how and under what circumstances you willmid-course correct
Consider which expenses you can reduce, eliminate or postpone
Evaluate how cuts will impact delivery of mission and economic viability
Consider ways to increase revenue, if once reliable sources seem questionable.
Ensure new revenue opportunities are “net” positive

32nonprofitfinancefund.org ©2011 Nonprofit Finance Fund
Determine the triggers that lead to Plan B, Plan C, etc.
For example: if X% of revenue doesn‟t arrive by Y, we will cut Z% of expenses
Plan for a worst-case scenario
Easier to add back later than to be forced to take drastic action without a thoughtful plan
Plan for the impacts of scenarios on programming
What is the impact on specific program metrics (i.e., clients served, number of housing units produced or managed, schools and youth served, etc.)
Can be as complex or as simple as needed:
What would we do differently if budgeted revenue dropped 10%? 20%? 30%?
What is the likelihood of receipt for each revenue source within each program? What adjustments will we make within these programs and to our supporting capacity?
Planning Your Response: Scenario Testing

33nonprofitfinancefund.org ©2011 Nonprofit Finance Fund
How Will Scenarios Impact Your Organization‘s Long Term Health?
How do the scenarios impact the organization‘s ability to withstand risk?
How will earned revenue or philanthropic dollars raised change? Will overhead/capacity costs change?
Which scenarios produce deficits? Surpluses?
Will deficits deplete cash and liquidity or result in larger debt obligations?
Will surpluses be converted to cash savings or invested in fixed infrastructure?
34nonprofitfinancefund.org ©2011 Nonprofit Finance Fund
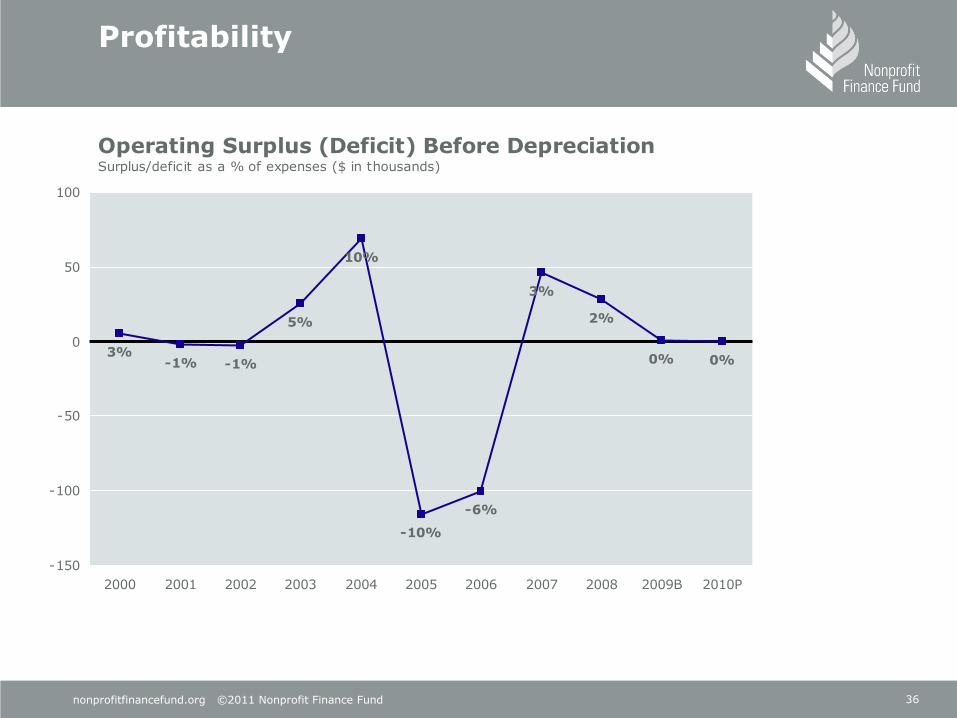
Case Study: ―Rock City‖
Bay Area arts and youth development organization.
Rock City has a mission to improve the lives of youth, teens, and families living in the Bay Area through music and musical theater.
Major programs include a series of new productions and live music events each year, music education, and site-specific community performances.
The organization experienced 2 years of significant operating losses during a period of rapid growth.
NFF provided a working capital loan to Rock City.
35nonprofitfinancefund.org ©2011 Nonprofit Finance Fund
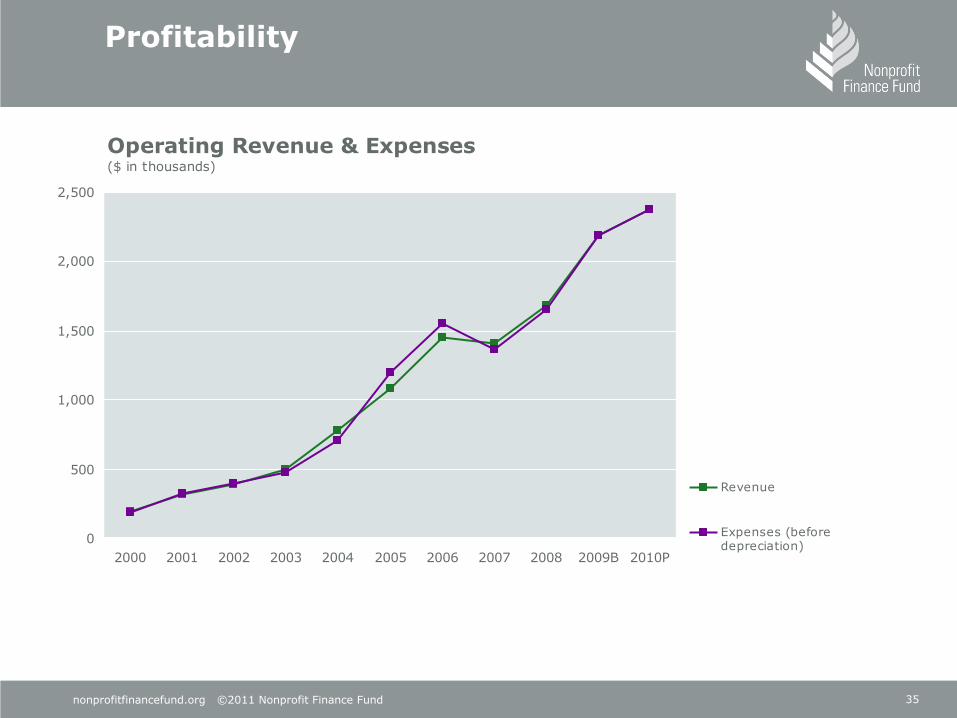
Profitability
Operating Revenue & Expenses($ in thousands)
0
500
1,000
1,500
2,000
2,500
2000 2001 2002 2003 2004 2005 2006 2007 2008 2009B 2010P
Revenue
Expenses (beforedepreciation)
36nonprofitfinancefund.org ©2011 Nonprofit Finance Fund
Profitability
Operating Surplus (Deficit) Before Depreciation Surplus/deficit as a % of expenses ($ in thousands)
3%-1% -1%
5%
10%
-10%
-6%
3%
2%
0% 0%
-150
-100
-50
0
50
100
2000 2001 2002 2003 2004 2005 2006 2007 2008 2009B 2010P

37nonprofitfinancefund.org ©2011 Nonprofit Finance Fund
Total Net Assets($ in thousands)
-200
-100
0
100
200
300
400
500
600
700
800
2000 2001 2002 2003 2004 2005 2006 2007 2008
Unrestricted
Temporarily restricted
Health of Balance Sheet

38nonprofitfinancefund.org ©2011 Nonprofit Finance Fund
Health of Balance Sheet
Unrestricted Net Assets($ in thousands)
-200
-150
-100
-50
0
50
100
2000 2001 2002 2003 2004 2005 2006 2007 2008
Liquid
Property & equipment(P&E)
39nonprofitfinancefund.org ©2011 Nonprofit Finance Fund
Capacity
Original
Productions
Arts-in-
Education
Community
Events Program Subtotal Gen Ops Development
Capacity
Subtotal Total Budget
Revenue (A) Earned
Admissions $14,018 $73,453 $9,500 $96,971 $0 $0 $0 $96,971Fees $58,000 $28,650 $402,000 $488,650 $0 $0 $0 $488,650Merchandise Revenue $4,179 $2,700 $0 $6,879 $0 $0 $0 $6,879
Subtotal $76,197 $104,803 $411,500 $592,500 $0 $0 $0 $592,500
(B) ContributedGovernment $0 $0 $0 $0 $49,400 $0 $49,400 $49,400Individuals $75,000 $0 $0 $75,000 $87,500 $137,500 $225,000 $300,000Corporate $18,000 $0 $0 $18,000 $0 $0 $0 $18,000Foundations $0 $0 $0 $0 $43,500 $0 $43,500 $43,500Net Assets Released $312,000 $682,238 $205,250 $1,199,488 $340,000 $0 $340,000 $1,539,488
Subtotal $405,000 $682,238 $205,250 $1,292,488 $520,400 $137,500 $657,900 $1,950,388
Total Revenue $481,197 $787,041 $616,750 $1,884,988 $520,400 $137,500 $657,900 $2,542,888
ExpensesPersonnel Salaried plus benefits ($151,840) ($400,853) ($157,002) ($709,695) ($180,864) ($137,266) ($318,130) ($1,027,825)Non Salaried (aritst, contractors, etc.)($127,500) ($131,850) ($306,125) ($565,475) ($147,500) ($4,250) ($151,750) ($717,225)Facilites ($70,000) ($56,687) ($2,500) ($129,187) ($57,264) ($7,200) ($64,464) ($193,651)Marketing ($500) ($4,300) $0 ($4,800) $0 $0 $0 ($4,800)Hospitality ($32,000) ($10,690) ($350) ($43,040) ($1,500) ($27,192) ($28,692) ($71,732)Copying $0 ($3,880) $0 ($3,880) $0 $0 $0 ($3,880)Travel ($83,500) ($12,465) ($107,980) ($203,945) $0 ($4,000) ($4,000) ($207,945)Supplies & Equipment $0 ($3,500) $0 ($3,500) ($8,050) ($4,700) ($12,750) ($16,250)Documentation ($9,000) ($13,000) $0 ($22,000) $0 $0 $0 ($22,000)Printing ($7,000) ($3,150) ($2,000) ($12,150) ($1,000) ($16,850) ($17,850) ($30,000)Design $0 ($1,550) $0 ($1,550) $0 ($900) ($900) ($2,450)SWAG ($5,445) ($6,900) ($1,200) ($13,545) $0 ($2,000) ($2,000) ($15,545)Tech Costs ($6,600) ($380) ($8,000) ($14,980) $0 ($5,865) ($5,865) ($20,845)Adv/Promotion ($13,750) ($2,700) $0 ($16,450) $0 $0 $0 ($16,450)Postage ($3,100) ($4,000) ($1,500) ($8,600) ($2,575) ($1,775) ($4,350) ($12,950)Materials ($2,750) ($1,250) $0 ($4,000) ($3,200) ($1,050) ($4,250) ($8,250)Slam/Stipends/Talent $0 ($12,500) $0 ($12,500) $0 ($1,150) ($1,150) ($13,650)Other ($36,000) $0 ($5,600) ($41,600) ($15,000) ($3,210) ($18,210) ($59,810)Housing ($60,000) ($1,000) $0 ($61,000) $0 $0 $0 ($61,000)Ticket Subsidies ($12,000) $0 ($12,000) $0 $0 $0 ($12,000)Misc. ($1,500) $0 ($1,500) ($23,000) $0 ($23,000) ($24,500)
Total Expenses ($608,985) ($684,155) ($592,257) ($1,885,397) ($439,953) ($217,408) ($657,361) ($2,542,758)
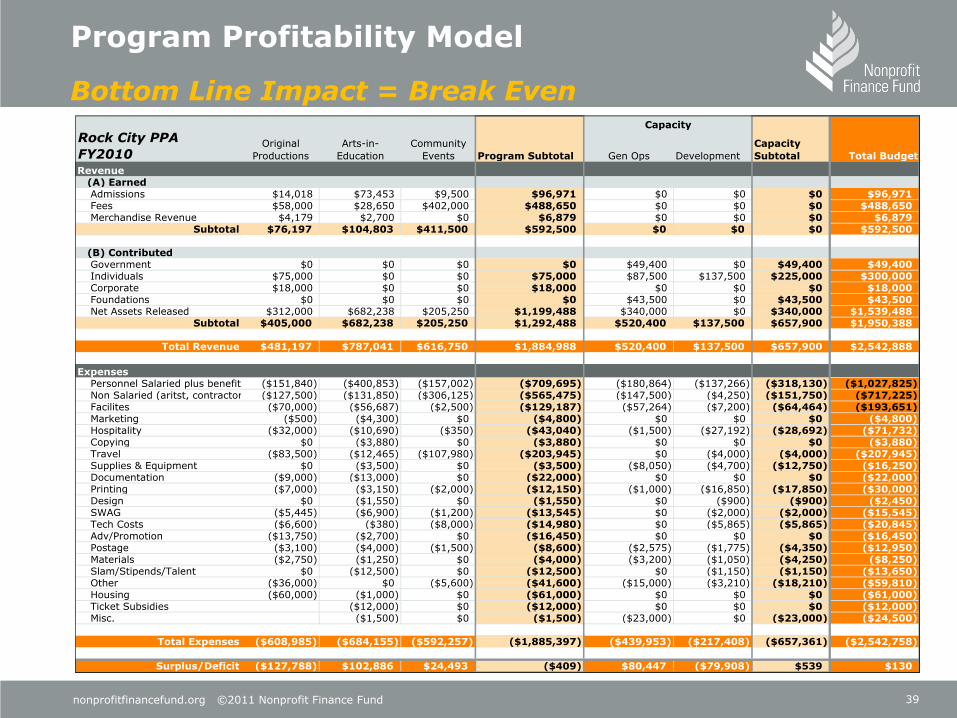
Surplus/Deficit ($127,788) $102,886 $24,493 ($409) $80,447 ($79,908) $539 $130
Rock City PPA
FY2010
ORIGINAL
Program Profitability Model
Bottom Line Impact = Break Even
40nonprofitfinancefund.org ©2011 Nonprofit Finance Fund
Rock City PPA
New Shows July 4th Show Library Series Program Total
Revenue(A) Earned
Admissions $14,018 $0 $0 $14,018
Fees $53,000 $2,500 $2,500 $58,000
Merchandise Revenue $4,179 $0 $0 $4,179
Subtotal $71,197 $2,500 $2,500 $76,197
(B) ContributedIndividuals $75,000 $0 $0 $75,000
Corporate $18,000 $0 $0 $18,000
Net Assets Released $290,000 $0 $22,000 $312,000
Subtotal $383,000 $0 $22,000 $405,000
Total Revenue $454,197 $2,500 $24,500 $481,197
ExpensesStaff ($151,840) $0 $0 ($151,840)
Artist ($116,500) ($10,000) ($1,000) ($127,500)
Facilities ($70,000) $0 $0 ($70,000)
Marketing $0 $0 ($500) ($500)
Hospitality ($32,000) $0 $0 ($32,000)
Copying $0 $0 $0 $0
Travel ($61,000) ($10,000) $0 ($71,000)
Supplies $0 $0 $0 $0
Prof Dev $0 $0 $0 $0
Documentation ($5,500) $0 ($3,500) ($9,000)
Printing ($6,000) $0 ($1,000) ($7,000)
Design $0 $0 $0 $0
T-Shirts ($5,445) $0 $0 ($5,445)
Tech Costs ($6,600) $0 $0 ($6,600)
Advertising/Promotion ($13,750) $0 $0 ($13,750)
Postage ($3,100) $0 $0 ($3,100)
Materials ($2,750) $0 $0 ($2,750)
Stipends $0 $0 $0 $0
Local Travel ($12,500) $0 $0 ($12,500)
Other ($11,000) ($25,000) $0 ($36,000)
Housing ($60,000) $0 $0 ($60,000)
Total Expenses ($557,985) ($45,000) ($6,000) ($608,985)
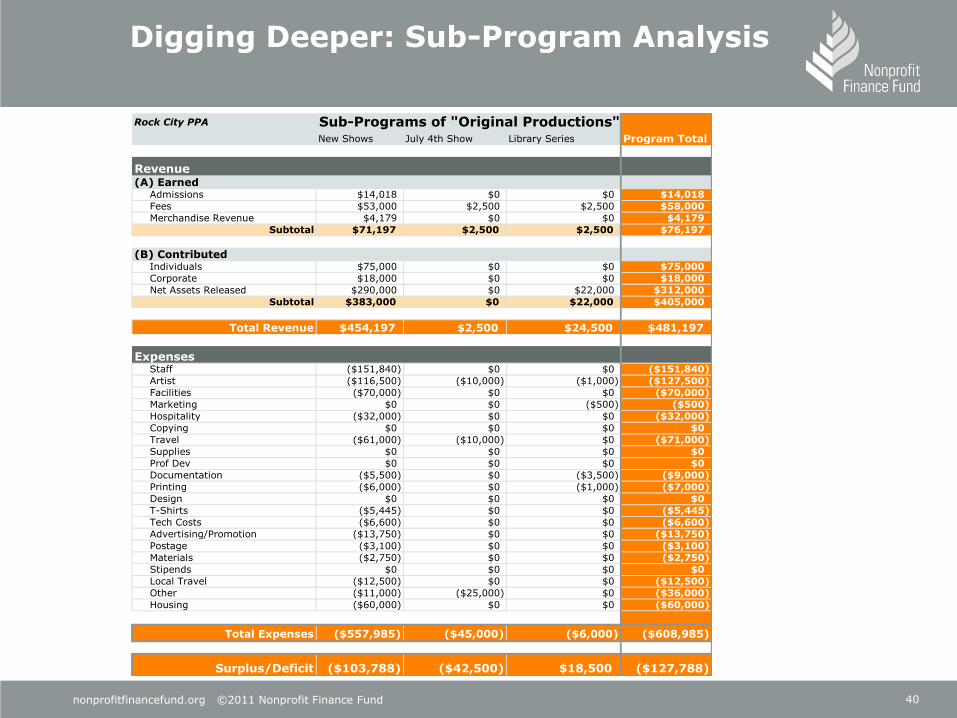
Surplus/Deficit ($103,788) ($42,500) $18,500 ($127,788)
Sub-Programs of "Original Productions"
ORIGINAL
Digging Deeper: Sub-Program Analysis
41nonprofitfinancefund.org ©2011 Nonprofit Finance Fund
ORIGINAL
Rock City PPA
Artistic
Devolopment
Visiting
Musicians District 1 District 2 District 3
Mentor
Program
Junior High
Mentor
Program
High School Music Classes
Artist
Residency
After School
Site 1
After School
Site 2 General AIE
Program
Total
Revenue(A) Earned
Admissions $0 $0 $0 $5,000 $19,000 $0 $0 $27,550 $0 $0 $0 $0 $73,453
Fees $0 $13,650 $0 $15,000 $0 $0 $0 $0 $0 $0 $0 $0 $28,650
Merchandise Revenue $0 $0 $0 $0 $0 $0 $0 $2,200 $0 $0 $0 $0 $2,700
Misc. Revenue $0 $0 $0 $0 $0 $0 $0 $0 $0 $0 $0 $0 $0
Subtotal $0 $13,650 $0 $20,000 $19,000 $0 $0 $29,750 $0 $0 $0 $0 $104,803
(B) ContributedGovernment $0 $0 $0 $0 $0 $0 $0 $0 $0 $0 $0 $0 $0
Individuals $0 $0 $0 $0 $0 $0 $0 $0 $0 $0 $0 $0 $0
Corporate $0 $0 $0 $0 $0 $0 $0 $0 $0 $0 $0 $0 $0
Foundations $0 $0 $0 $0 $0 $0 $0 $0 $0 $0 $0 $0 $0
Other Unrestricted $0 $0 $0 $0 $0 $0 $0 $0 $0 $0 $0 $0 $0
Net Assets Released $0 $0 $35,000 $22,500 $22,500 $0 $0 $0 $0 $165,802 $108,131 $328,305 $682,238
Subtotal $0 $0 $35,000 $22,500 $22,500 $0 $0 $0 $0 $165,802 $108,131 $328,305 $682,238
Total Revenue $0 $13,650 $35,000 $42,500 $41,500 $0 $0 $29,750 $0 $165,802 $108,131 $328,305 $787,041
ExpensesStaff ($26,447) ($26,517) ($22,466) ($22,466) ($22,466) ($26,518) ($27,232) ($66,596) ($26,448) ($17,122) ($26,799) ($24,864) ($400,853)
Artist ($2,000) ($15,000) ($5,400) ($5,400) ($4,500) ($12,500) ($200) ($2,850) ($25,000) ($15,000) ($13,500) $0 ($131,850)
Facilities ($500) $0 $0 $0 $0 $0 ($1,000) ($26,182) $0 $0 $0 ($22,700) ($56,687)
Marketing $0 ($500) ($400) ($300) ($500) ($100) $0 $0 $0 $0 ($1,500) $0 ($4,300)
Hospitality ($100) $0 ($600) ($450) ($1,500) ($2,000) ($150) ($460) $0 ($1,500) ($2,700) $0 ($10,690)
Copying ($30) $0 ($500) ($375) ($1,250) ($625) $0 $0 $0 ($500) ($200) $0 ($3,880)
Staff Travel $0 ($2,500) ($500) ($300) ($1,250) ($75) ($150) ($780) ($6,000) $0 ($210) $0 ($12,465)
Supplies $0 ($500) ($120) ($180) ($300) ($50) $0 $0 $0 $0 ($600) $0 ($3,500)
Prof Dev $0 $0 $0 $0 $0 $0 $0 $0 $0 $0 $0 $0 $0
Documentation $0 $0 ($6,000) $0 $0 $0 ($2,500) ($1,000) ($2,500) $0 $0 $0 ($13,000)
Printing $0 $0 $0 $0 $0 $0 ($400) ($1,700) $0 $0 $0 $0 ($3,150)
Design $0 $0 $0 $0 $0 $0 ($250) ($250) $0 $0 $0 $0 ($1,550)
T-Shirts $0 $0 $0 $0 $0 $0 ($1,500) ($3,900) $0 $0 $0 $0 ($6,900)
Tech Costs $0 $0 $0 $0 $0 $0 ($125) ($130) $0 $0 $0 $0 ($380)
Advertising $0 $0 $0 $0 $0 $0 $0 ($2,700) $0 $0 $0 $0 ($2,700)
Postage $0 $0 $0 $0 $0 $0 $0 ($4,000) $0 $0 $0 $0 ($4,000)
Materials $0 $0 $0 $0 $0 $0 $0 ($500) ($750) $0 $0 $0 ($1,250)
Grants $0 $0 $0 $0 $0 ($12,500) $0 $0 $0 $0 $0 $0 ($12,500)
School Clubs $0 $0 $0 $0 $0 $0 $0 $0 $0 $0 $0 $0 $0
Other $0 $0 $0 $0 $0 $0 $0 $0 $0 ($1,000) $0 $0 ($1,000)
Ticket Subsidies $0 $0 $0 $0 $0 $0 $0 ($6,000) $0 $0 $0 $0 ($12,000)
Retreat $0 $0 $0 $0 $0 $0 $0 $0 $0 ($1,500) $0 $0 ($1,500)
$0 $0 $0 $0
Total Expenses ($29,077) ($45,017) ($35,986) ($29,471) ($31,766) ($54,368) ($33,507) ($117,048) ($60,698) ($36,622) ($45,509) ($47,564) ($684,155)
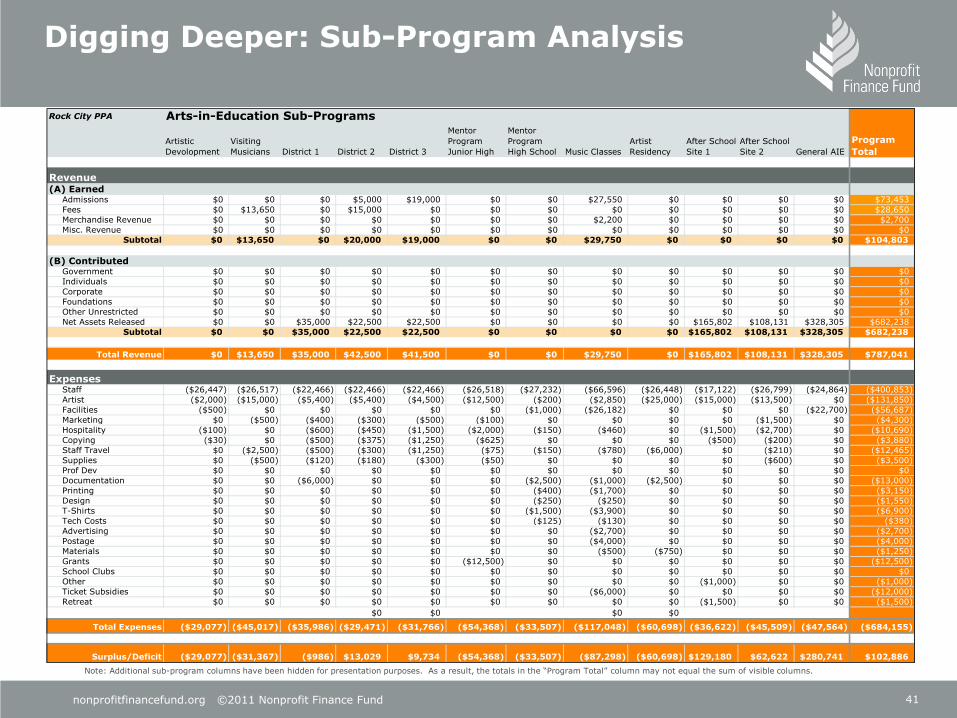
Surplus/Deficit ($29,077) ($31,367) ($986) $13,029 $9,734 ($54,368) ($33,507) ($87,298) ($60,698) $129,180 $62,622 $280,741 $102,886
Arts-in-Education Sub-Programs
Note: Additional sub-program columns have been hidden for presentation purposes. As a result, the totals in the “Program Total” column may not equal the sum of visible columns.
Digging Deeper: Sub-Program Analysis

42nonprofitfinancefund.org ©2011 Nonprofit Finance Fund
REVISED
Rock City PPA
New Shows July 4th Show Library Series Program Total
Revenue(A) Earned
Admissions $14,018 $0 $0 $14,018
Fees $53,000 $2,500 $2,500 $58,000
Merchandise Revenue $4,179 $0 $0 $4,179
Subtotal $71,197 $2,500 $2,500 $76,197
(B) ContributedIndividuals $75,000 $10,000 $0 $85,000
Corporate $18,000 $30,000 $0 $48,000
Net Assets Released $290,000 $0 $22,000 $312,000
Subtotal $383,000 $40,000 $22,000 $445,000
Total Revenue $454,197 $42,500 $24,500 $521,197
ExpensesStaff ($151,840) $0 $0 ($151,840)
Artist ($116,500) ($10,000) ($1,000) ($127,500)
Facilities ($70,000) $0 $0 ($70,000)
Marketing $0 $0 ($500) ($500)
Hospitality ($32,000) $0 $0 ($32,000)
Copying $0 $0 $0 $0
Travel ($61,000) ($10,000) $0 ($71,000)
Supplies $0 $0 $0 $0
Prof Dev $0 $0 $0 $0
Documentation ($5,500) $0 ($3,500) ($9,000)
Printing ($6,000) $0 ($1,000) ($7,000)
Design $0 $0 $0 $0
T-Shirts ($5,445) $0 $0 ($5,445)
Tech Costs ($6,600) $0 $0 ($6,600)
Advertising/Promotion ($13,750) $0 $0 ($13,750)
Postage ($3,100) $0 $0 ($3,100)
Materials ($2,750) $0 $0 ($2,750)
Stipends $0 $0 $0 $0
Local Travel ($12,500) $0 $0 ($12,500)
Other ($11,000) ($25,000) $0 ($36,000)
Housing ($60,000) $0 $0 ($60,000)
Total Expenses ($557,985) ($45,000) ($6,000) ($608,985)
Surplus/Deficit ($103,788) ($2,500) $18,500 ($87,788)
Sub-Programs of "Original Productions"
Digging Deeper: Sub-Program Analysis

43nonprofitfinancefund.org ©2011 Nonprofit Finance Fund
Rock City PPA
Artistic
Devolopment
Visiting
Musicians District 1 District 2 District 3
Mentor
Program
Junior High
Mentor
Program
High School
Music
Classes
Artist
Residency
After School
Site 1
After School
Site 2 General AIE
Program
Total
Revenue(A) Earned
Admissions $0 $0 $0 $5,000 $19,000 $0 $0 $27,550 $0 $0 $0 $0 $73,453
Fees $0 $13,650 $0 $15,000 $0 $35,000 $25,000 $60,000 $0 $0 $0 $0 $148,650
Merchandise Revenue $0 $0 $0 $0 $0 $0 $0 $2,200 $0 $0 $0 $0 $2,700
Misc. Revenue $0 $0 $0 $0 $0 $0 $0 $0 $0 $0 $0 $0 $0
Subtotal $0 $13,650 $0 $20,000 $19,000 $35,000 $25,000 $89,750 $0 $0 $0 $0 $224,803
(B) ContributedGovernment $0 $0 $0 $0 $0 $0 $0 $0 $0 $0 $0 $0 $0
Individuals $0 $0 $0 $0 $0 $0 $0 $0 $0 $0 $0 $0 $0
Corporate $0 $0 $0 $0 $0 $0 $0 $0 $0 $0 $0 $0 $0
Foundations $0 $0 $0 $0 $0 $0 $0 $0 $0 $0 $0 $0 $0
Other Unrestricted $0 $0 $0 $0 $0 $0 $0 $0 $0 $0 $0 $0 $0
Net Assets Released $0 $0 $35,000 $22,500 $22,500 $0 $0 $0 $0 $165,802 $108,131 $328,305 $682,238
Subtotal $0 $0 $35,000 $22,500 $22,500 $0 $0 $0 $0 $165,802 $108,131 $328,305 $682,238
Total Revenue $0 $13,650 $35,000 $42,500 $41,500 $35,000 $25,000 $89,750 $0 $165,802 $108,131 $328,305 $907,041
ExpensesStaff ($26,447) ($26,517) ($22,466) ($22,466) ($22,466) ($26,518) ($27,232) ($66,596) ($26,448) ($17,122) ($26,799) ($24,864) ($400,853)
Artist ($2,000) ($15,000) ($5,400) ($5,400) ($4,500) ($12,500) ($200) ($2,850) ($25,000) ($15,000) ($13,500) $0 ($131,850)
Facilities ($500) $0 $0 $0 $0 $0 ($1,000) ($26,182) $0 $0 $0 ($22,700) ($56,687)
Marketing $0 ($500) ($400) ($300) ($500) ($100) $0 $0 $0 $0 ($1,500) $0 ($4,300)
Hospitality ($100) $0 ($600) ($450) ($1,500) ($2,000) ($150) ($460) $0 ($1,500) ($2,700) $0 ($10,690)
Copying ($30) $0 ($500) ($375) ($1,250) ($625) $0 $0 $0 ($500) ($200) $0 ($3,880)
Staff Travel $0 ($2,500) ($500) ($300) ($1,250) ($75) ($150) ($780) ($6,000) $0 ($210) $0 ($12,465)
Supplies $0 ($500) ($120) ($180) ($300) ($50) $0 $0 $0 $0 ($600) $0 ($3,500)
Prof Dev $0 $0 $0 $0 $0 $0 $0 $0 $0 $0 $0 $0 $0
Documentation $0 $0 ($6,000) $0 $0 $0 ($2,500) ($1,000) ($2,500) $0 $0 $0 ($13,000)
Printing $0 $0 $0 $0 $0 $0 ($400) ($1,700) $0 $0 $0 $0 ($3,150)
Design $0 $0 $0 $0 $0 $0 ($250) ($250) $0 $0 $0 $0 ($1,550)
T-Shirts $0 $0 $0 $0 $0 $0 ($1,500) ($3,900) $0 $0 $0 $0 ($6,900)
Tech Costs $0 $0 $0 $0 $0 $0 ($125) ($130) $0 $0 $0 $0 ($380)
Advertising $0 $0 $0 $0 $0 $0 $0 ($2,700) $0 $0 $0 $0 ($2,700)
Postage $0 $0 $0 $0 $0 $0 $0 ($4,000) $0 $0 $0 $0 ($4,000)
Materials $0 $0 $0 $0 $0 $0 $0 ($500) ($750) $0 $0 $0 ($1,250)
Grants $0 $0 $0 $0 $0 ($15,000) ($2,500) ($2,500) $0 $0 $0 $0 ($20,000)
School Clubs $0 $0 $0 $0 $0 $0 $0 $0 $0 $0 $0 $0 $0
Other $0 $0 $0 $0 $0 $0 $0 $0 $0 ($1,000) $0 $0 ($1,000)
Ticket Subsidies $0 $0 $0 $0 $0 $0 $0 ($6,000) $0 $0 $0 $0 ($12,000)
Retreat $0 $0 $0 $0 $0 $0 $0 $0 $0 ($1,500) $0 $0 ($1,500)
$0 $0 $0 $0
Total Expenses ($29,077) ($45,017) ($35,986) ($29,471) ($31,766) ($56,868) ($36,007) ($119,548) ($60,698) ($36,622) ($45,509) ($47,564) ($691,655)
Surplus/Deficit ($29,077) ($31,367) ($986) $13,029 $9,734 ($21,868) ($11,007) ($29,798) ($60,698) $129,180 $62,622 $280,741 $215,386
Arts-in-Education Sub-Programs
REVISED
Note: Additional sub-program columns have been hidden for presentation purposes. As a result, the totals in the “Program Total” column may not equal the sum of visible columns.
Digging Deeper: Sub-Program Analysis
44nonprofitfinancefund.org ©2011 Nonprofit Finance Fund
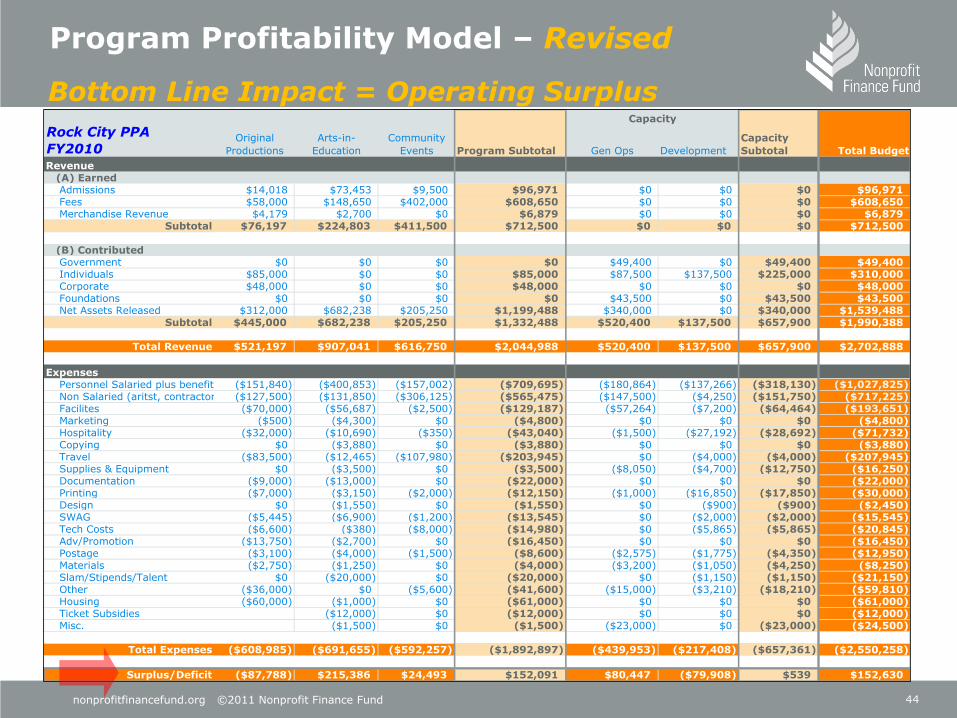
Capacity
Original
Productions
Arts-in-
Education
Community
Events Program Subtotal Gen Ops Development
Capacity
Subtotal Total Budget
Revenue (A) Earned
Admissions $14,018 $73,453 $9,500 $96,971 $0 $0 $0 $96,971Fees $58,000 $148,650 $402,000 $608,650 $0 $0 $0 $608,650Merchandise Revenue $4,179 $2,700 $0 $6,879 $0 $0 $0 $6,879
Subtotal $76,197 $224,803 $411,500 $712,500 $0 $0 $0 $712,500
(B) ContributedGovernment $0 $0 $0 $0 $49,400 $0 $49,400 $49,400Individuals $85,000 $0 $0 $85,000 $87,500 $137,500 $225,000 $310,000Corporate $48,000 $0 $0 $48,000 $0 $0 $0 $48,000Foundations $0 $0 $0 $0 $43,500 $0 $43,500 $43,500Net Assets Released $312,000 $682,238 $205,250 $1,199,488 $340,000 $0 $340,000 $1,539,488
Subtotal $445,000 $682,238 $205,250 $1,332,488 $520,400 $137,500 $657,900 $1,990,388
Total Revenue $521,197 $907,041 $616,750 $2,044,988 $520,400 $137,500 $657,900 $2,702,888
ExpensesPersonnel Salaried plus benefits ($151,840) ($400,853) ($157,002) ($709,695) ($180,864) ($137,266) ($318,130) ($1,027,825)Non Salaried (aritst, contractors, etc.)($127,500) ($131,850) ($306,125) ($565,475) ($147,500) ($4,250) ($151,750) ($717,225)Facilites ($70,000) ($56,687) ($2,500) ($129,187) ($57,264) ($7,200) ($64,464) ($193,651)Marketing ($500) ($4,300) $0 ($4,800) $0 $0 $0 ($4,800)Hospitality ($32,000) ($10,690) ($350) ($43,040) ($1,500) ($27,192) ($28,692) ($71,732)Copying $0 ($3,880) $0 ($3,880) $0 $0 $0 ($3,880)Travel ($83,500) ($12,465) ($107,980) ($203,945) $0 ($4,000) ($4,000) ($207,945)Supplies & Equipment $0 ($3,500) $0 ($3,500) ($8,050) ($4,700) ($12,750) ($16,250)Documentation ($9,000) ($13,000) $0 ($22,000) $0 $0 $0 ($22,000)Printing ($7,000) ($3,150) ($2,000) ($12,150) ($1,000) ($16,850) ($17,850) ($30,000)Design $0 ($1,550) $0 ($1,550) $0 ($900) ($900) ($2,450)SWAG ($5,445) ($6,900) ($1,200) ($13,545) $0 ($2,000) ($2,000) ($15,545)Tech Costs ($6,600) ($380) ($8,000) ($14,980) $0 ($5,865) ($5,865) ($20,845)Adv/Promotion ($13,750) ($2,700) $0 ($16,450) $0 $0 $0 ($16,450)Postage ($3,100) ($4,000) ($1,500) ($8,600) ($2,575) ($1,775) ($4,350) ($12,950)Materials ($2,750) ($1,250) $0 ($4,000) ($3,200) ($1,050) ($4,250) ($8,250)Slam/Stipends/Talent $0 ($20,000) $0 ($20,000) $0 ($1,150) ($1,150) ($21,150)Other ($36,000) $0 ($5,600) ($41,600) ($15,000) ($3,210) ($18,210) ($59,810)Housing ($60,000) ($1,000) $0 ($61,000) $0 $0 $0 ($61,000)Ticket Subsidies ($12,000) $0 ($12,000) $0 $0 $0 ($12,000)Misc. ($1,500) $0 ($1,500) ($23,000) $0 ($23,000) ($24,500)
Total Expenses ($608,985) ($691,655) ($592,257) ($1,892,897) ($439,953) ($217,408) ($657,361) ($2,550,258)
Surplus/Deficit ($87,788) $215,386 $24,493 $152,091 $80,447 ($79,908) $539 $152,630
Rock City PPA
FY2010
Program Profitability Model – Revised
Bottom Line Impact = Operating Surplus

45nonprofitfinancefund.org ©2011 Nonprofit Finance Fund
Projected Impact to Net Assets
Total Net Assets($ in thousands)
-200
-100
0
100
200
300
400
500
600
700
800
2000 2001 2002 2003 2004 2005 2006 2007 2008 2009B 2010P
Unrestricted
Temporarily restricted
46nonprofitfinancefund.org ©2011 Nonprofit Finance Fund
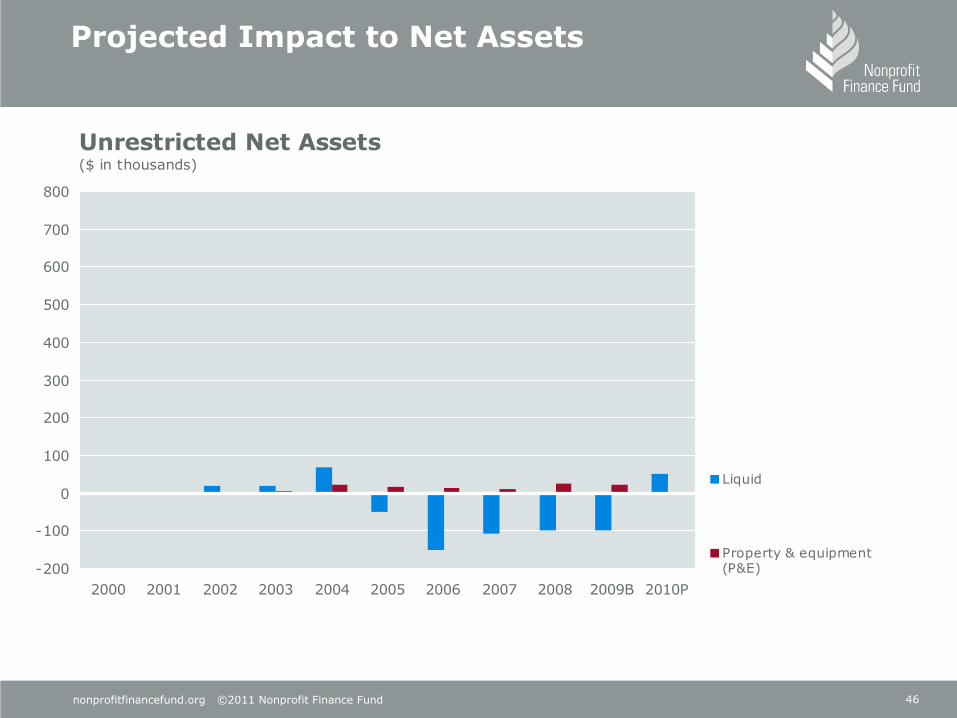
Projected Impact to Net Assets
Unrestricted Net Assets($ in thousands)
-200
-100
0
100
200
300
400
500
600
700
800
2000 2001 2002 2003 2004 2005 2006 2007 2008 2009B 2010P
Liquid
Property & equipment(P&E)

47nonprofitfinancefund.org ©2011 Nonprofit Finance Fund
Communicate Early and Often
Engage your Board and staff in scenario planning and decision making
Stay in front of donors—don‘t pull back. Tell your story every day
Be candid about the impact of the economic climate on your programs and organization
Communicate your strategy to adjust
Focus on positive messaging. Emphasize your commitment to mission and the urgency of your needs
Thank donors frequently and make outreach personal
Consider ways to diversify revenue, if once reliable sources seem questionable
Avoid over-diversification (i.e., new business lines) that can increase risk

48nonprofitfinancefund.org ©2011 Nonprofit Finance Fund
Many business choices are risky; a cash cushion can help manage this risk.
Risk minus Cash = Crisis
Surpluses need to be sufficient to:
Pay for the annual “wear-and-tear” of PP&E
Finance investments in new fixed assets and/or improvements that may not be fully financed through a capital campaign,
Cover any debt principal payments
Contribute to growth and savings
Surpluses are an indicator of good management and increasingly recognized as such by the funding community
Takeaway #1: Nonprofits Need Surpluses
49nonprofitfinancefund.org ©2011 Nonprofit Finance Fund
Takeaway #2: Own Your Numbers
Making sound business choices requires:
Reliable, accurate and timely financial data
Understanding this data and using it to tell your financial story
Transparently
Without apology

50nonprofitfinancefund.org ©2011 Nonprofit Finance Fund
Learn More nonprofitfinancefund.org
Twitter twitter.com/nff_news
Facebook facebook.com/nonprofitfinancefund
Our Blog philanthropy.com/blogs/money-and-mission
Sign Up nonprofitfinancefund.org/sign-up
RSS nonprofitfinancefund.org/news/feed
Get in Touch!
Karla V. SalazarDirector, Los Angeles626 Wilshire Boulevard, Suite 510Los Angeles, CA [email protected] x2
nonprofitfinancefund.org
Thank You!To Stay Connected…
50