Embed Size (px)
Citation preview
Page 1
Tools for Green and Inclusive Industrial
Policy
in the Middle East and North Africa
Cairo, 26 October 2015
Johanna Jagnow
Sector Project Sustainable Economic Development
Deutsche Gesellschaft für Internationale Zusammenarbeit (GIZ) GmbH

Page 2
Contents
• Why do we need EQuIP?
• What exactly is EQuIP and what makes it unique?
• What will be the next steps of the project?

Page 3
Background
• Renewed international acceptance of Industrial Policy
• Many IP instruments of limited use for developing countries
• German cooperation: important role in supporting processes, not
policy definition

Page 4
Challenges for Industrial Policy
• Complex Industrial Policy decisions
• Many different intervention areas and external factors
• Multi-dimensional, potentially conflicting objectives, e.g. value
addition, export promotion, employment promotion, energy efficiency
• Plethora of claimed ‘silver bullets’
• High dependency on external advisors

Page 5
EQuIP Goals
• Inclusive and sustainable industrial development
Including tools on employment promotion and energy efficiency
• Enable countries to manage their own future
• Move from supply-driven to demand-driven IP
• Non-deterministic and transparent
• Building local capacities for public policy
• Evidence-based IP decisions in developing countries
• Address practical challenges with appropriate tools
• Help make sure different policies are aligned
• Holistic notion of development

Page 6
Contents
• Why do we need EQuIP?
• What exactly is EQuIP and what makes it unique?
• What will be the next steps of the project?

Page 7
EQuIP at Present
• Toolbox for industrial diagnosis, followed by strategy-setting for an
industrial policy
• Capacity development package: tools and training
• To be used in combination with other tools
• Work in progress

Page 8
The Policy Cycle
IP cycle
Diagnosis
Strategy
Policy Implement
ation
M&E
Industrial policy
Intervention areas
Policy instruments
Budget, responsibility
Legitimisation, laws
Industrial strategy
Goals clarified, prioritised, quantified (desired impacts)
Realistic timelines
Industrial diagnosis
Baseline Benchmarks Threats and opportunities
Policy feedback (M&E)

Page 9
Analysis as the Foundation for Industrial Policy
• Transparent and evidence-based policymaking
• Understand status quo
• Learn from other countries
• Consider trade-offs and synergies between three dimensions of
sustainability
• Derive feasible targets and timelines
• Monitor progress and stay flexible
• Evaluate and learn from achievements and failures

Page 10
Limitations of EQuIP
• Focus on manufacturing sector
• Dependency on data in international databases
• No coverage of renewable energy, due to constraints in databases
• Today: Only first insights in employment and energy efficiency analyses,
but no deep and final diagnosis
Page 11
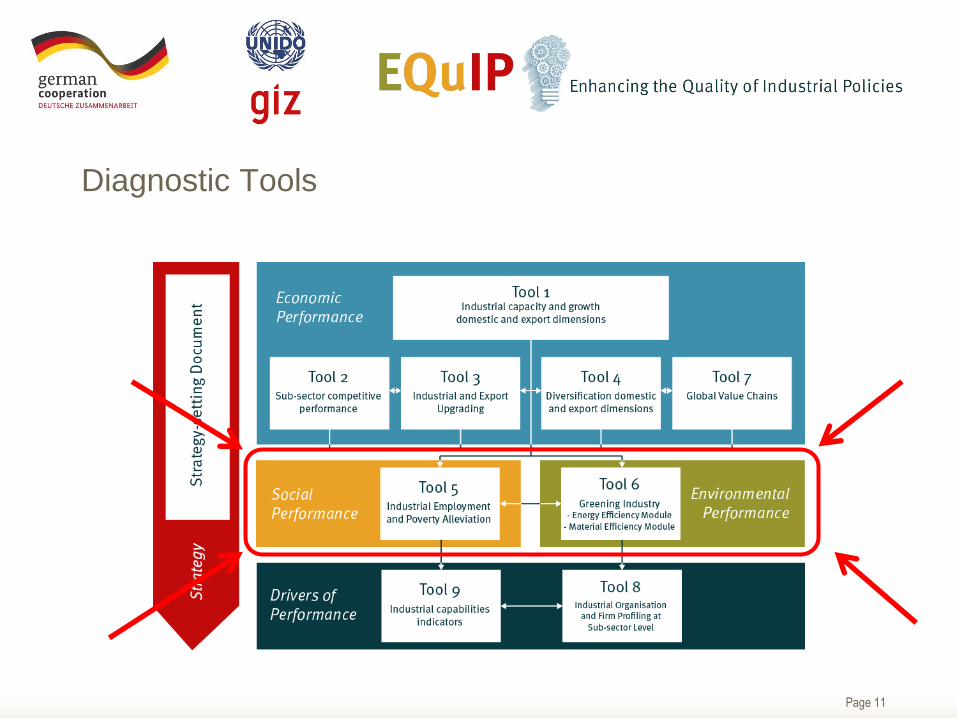
Diagnostic Tools

Page 12
Economic Analysis

Page 13
Manufacturing Value Added
$0
$5
$10
$15
$20
$25
2000 2002 2004 2006 2008 2010 2012
Valu
e a
dd
ed
(so
urc
e:
Ind
sta
t)
Milliard
en
Egypt
Morocco
Tunisia

Page 14
Employment Analysis
Page 15
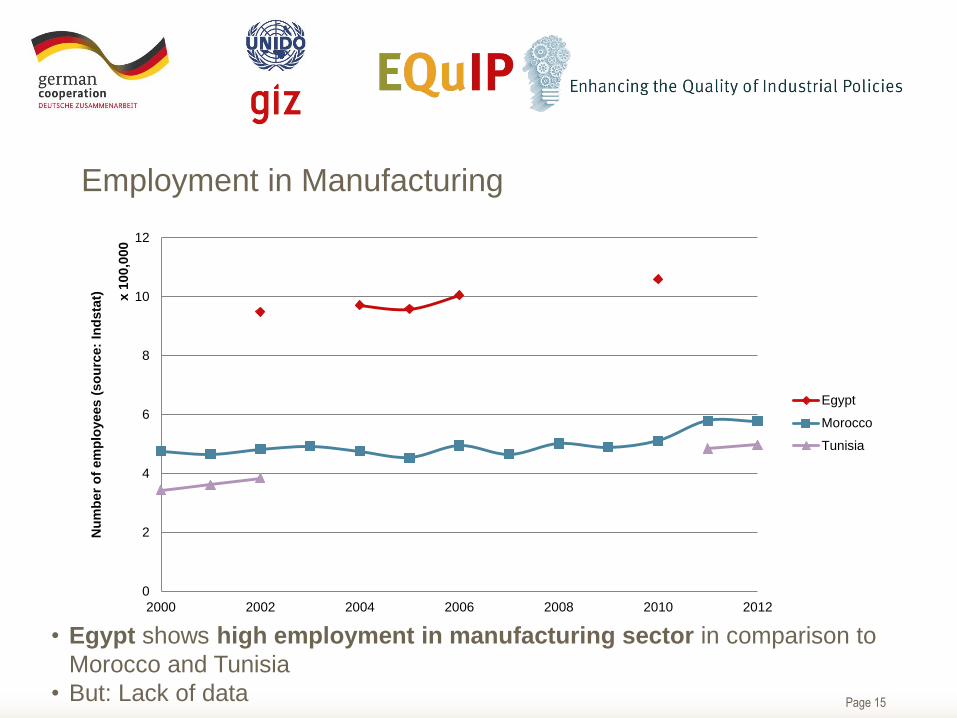
Employment in Manufacturing
0
2
4
6
8
10
12
2000 2002 2004 2006 2008 2010 2012
Nu
mb
er
of
em
plo
yees (
so
urc
e:
Ind
sta
t)
x 1
00,0
00
Egypt
Morocco
Tunisia
• Egypt shows high employment in manufacturing sector in comparison to
Morocco and Tunisia
• But: Lack of data

Page 16
Labour Productivity in Manufacturing
$0
$5
$10
$15
$20
$25
2000 2002 2004 2006 2008 2010 2012
Valu
e a
dd
ed
per
em
plo
yee (
so
urc
e:
Ind
sta
t)
Tau
sen
de
Egypt
Morocco
Tunisia
• In Egypt and Morocco, labour productivity increased a great deal
• In 2010, an average worker produced around $20 000 value
• Data for Tunisia lacking on Indstat (UNIDO)

Page 17
Wages in Manufacturing
$0
$1
$2
$3
$4
$5
$6
$7
$8
$9
2000 2002 2004 2006 2008 2010 2012
Wag
es p
er
em
plo
yee (
so
urc
e:
Ind
sta
t)
Tau
sen
de
Egypt
Morocco
Tunisia
• In Egypt, wages rising, but not as fast as labour productivity
• Marocco: wages rise with productivity, although small decrease after 2010
visible

Page 18
Wage Intensity of Industrialisation
0
0.05
0.1
0.15
0.2
0.25
0.3
0.35
0.4
0.45
2000 2002 2004 2006 2008 2010 2012
Sh
are
of
wa
ge
s in
va
lue
ad
de
d (
so
urc
e:
Ind
sta
t)
Egypt
Morocco
Tunisia
• In Egypt only 20% of value added is paid out to workers in the form of wages
(recall: wages did not rise as fast as productivity)
• Morocco and Tunisia show volatility, but generally higher values (loss of
competitiveness?)

Page 19
Employment Elasticity of Industrialisation
Country Elasticity Classification
Egypt 0.09 Productivity-led growth
low employment generation
Morocco 0.24 Productivity-led growth
moderate employment generation
Tunisia 0.22 Productivity-led growth
moderate employment generation

Page 20
Sectoral composition of Manufacturing Employment
21%
1%
13%
10% 1% 0% 2% 2% 4%
9%
3%
9%
6%
3%
5% 1%
4% 0% 0% 2% 1% 2% 0%
Egypt
15 Food and beverages
17 Textiles
18 Wearing apparel, fur
24 Chemicals and chemical products
26 Non-metallic mineral products
13%
0%
35%
0% 6% 1% 2% 0% 0% 3% 3%
6% 0%
6%
14%
0% 0% 0% 0%
8% 0% 4% 0%
15 Food and beverages
17 Textiles
• Food and beverages as well as textiles are sectors with highest
manufacturing employment In Egypt
• Egypt compared to Tunisia and Marocco rather diversified
25%
0%
6%
23% 4%
1% 1% 2% 1%
5%
3%
6%
2%
5%
1% 0%
9%
1% 1% 3% 1% 2% 0%
15 Food and beverages17 Textiles18 Wearing apparel, fur26 Non-metallic mineral products31 Electrical machinery and apparatus
Marocco Tunesia
Page 21
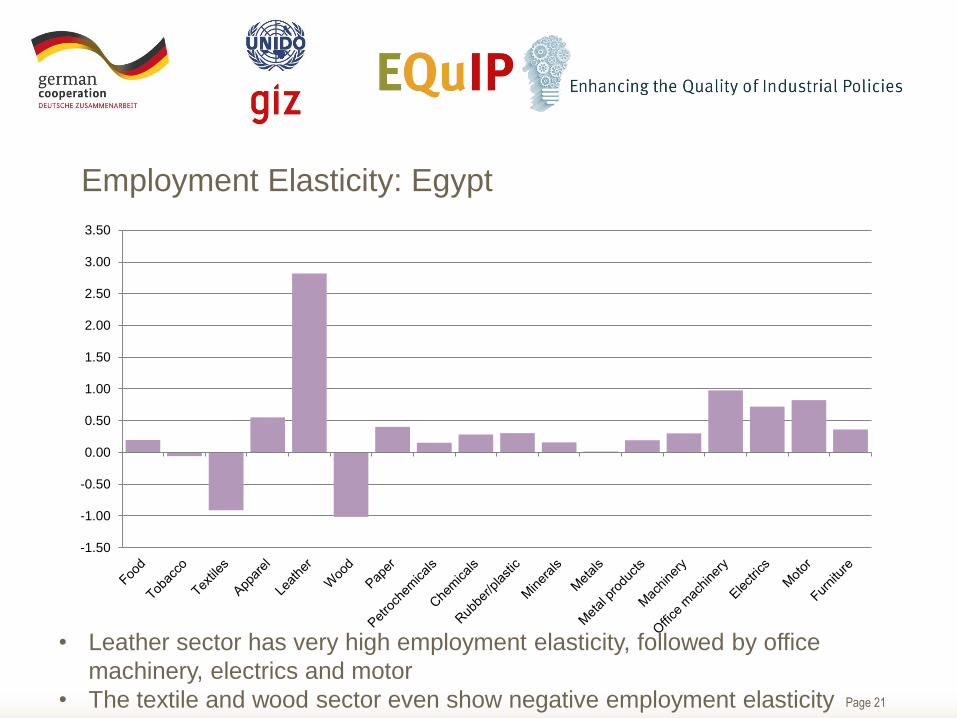
Employment Elasticity: Egypt
-1.50
-1.00
-0.50
0.00
0.50
1.00
1.50
2.00
2.50
3.00
3.50
• Leather sector has very high employment elasticity, followed by office
machinery, electrics and motor
• The textile and wood sector even show negative employment elasticity

Page 22
Energy Analysis

Page 23
Overall Energy Use
$0
$1
$2
$3
$4
$5
$6
$7
$8
Egypt Morocco Tunisia
Valu
e a
dd
ed
per
kto
e e
nerg
y c
on
su
mp
tio
n
(so
urc
e:
Ind
sta
t/IE
A)
Millio
nen
Efficiency
2000
2012
0
2000
4000
6000
8000
10000
12000
14000
16000
Egypt Morocco Tunisia
Fin
al
en
erg
y c
on
su
mp
tio
n in
kto
e (
so
urc
e:
IEA
)
Consumption
• Energy consumption in Egypt is very high and even increased between
2000 and 2012
• At the same time: Morocco and Tunisia show higher energy efficiency in
the manufacturing sector with lower energy consumption

Page 24
Self-Sufficiency by Energy Carrier
0% 20% 40% 60% 80% 100% 120% 140% 160% 180% 200%
Egypt
Morocco
Tunisia
Total
Heat
Biofuels and waste
Solar/wind/other
Hydro
Natural gas
Crude, NGL and feedstocks
Memo: Renewables
Egypt, Morocco and Tunisia are basically self-sufficient in almost all energy
carriers, except for natural gas

Page 25
Sub-Sector Share of Energy Consumption
Morocco
Chemical andpetrochemical
Non-metallicminerals
Machinery
Non-specified(industry)
Tunisia
Chemical andpetrochemical
Non-metallicminerals
Food and tobacco
Non-specified(industry)
• Lack of data for Egypt
• In Morocco and Tunisia machinery and non-metallic minerals show the
highest sub-sector share of energy consumption and hence, the highest
potential for energy efficiency

Page 26
Sub-Sector Energy Efficiency
$0 $10 $20 $30 $40
Morocco
Tunisia
Value added per ktoe energy consumption (source: Indstat/IEA)
Millionen
Textile and leather
Food and tobacco
Non-metallic minerals
Chemical and petrochemical
Paper, pulp and printing
Machinery
Non-specified (industry)
• Lack of data for Egypt
• In Morocco and Tunisia
• High efficiency: textile & leather, food & tobacco. chemical & petrochemical
• High potential: non-metallic minerals, paper, pulp and printing and machinery

Page 27
Next steps with EQuIP in Egypt
• Employment and Energy Analysis on sub-sector level to identify sub-
sectors with highest potential for employment generation and energy
efficiency
• Compare analytical data with development of good practice countries
(e.g. Mexico, China, South Africa, Brazil etc.)
• Derive an Industrial Strategy and Policy
Plus:
• Cooperation with statistical office to increase data availability and hence
foster sound empirical basis for industrial strategy setting

Page 28
Strategy Process
• EQuIP diagnostic inputs (mainly
quantitative)
• Other inputs (qualitative)
• Dialogue and negotiation inputs
(mainly qualitative)
Phase 1
Setting the stage
Phase 2
Comparative assessment and benchmarking
Phase 3
Defining priorities and objectives
Diagnosis Baselines Strategic questions
Trade-offs
Scenario planning
Future industry profile

Page 29
Contents
• Why do we need EQuIP?
• What exactly is EQuIP and what makes it unique?
• What will be the next steps of the project?

Page 30
The Policy Cycle
IP cycle
Diagnosis
Strategy
Policy Implemen-
tation
M&E
Industrial policy
Intervention areas
Policy instruments
Budget, responsibility
Legitimisation, laws
Industrial strategy
Goals clarified, prioritised, quantified (desired impacts)
Realistic timelines
Industrial diagnosis
Baseline Benchmarks Threats and opportunities
Policy feedback (M&E)

Page 31
Outlook: EQuIP 2
• Implementation instruments
• Overview of IP instruments
• Selection and in-depth analysis
• Methodology for selecting a mix of instruments
• Institutional setup
• Overview of institutional setups
• Methodology on choosing an institutional setup for IP design,
implementation, governance, and monitoring and evaluation

Page 32
Two other things…

Page 33
Checklist on social impacts of green growth policies
Does the green growth policy affect…
• sectors where an above-average share of people living in poverty are
economically active?
• employment opportunities and production factors that
people living in poverty depend upon?
• the income of people living in poverty?
• the income distribution within the society?
• access to goods or services by people living in poverty?
• regions with an above-average share of people living
in poverty?

Page 34

Page 35
Thank You for Your Attention
www.equip-project.org

Page 36
Contents
• Why do we need EQuIP?
• What exactly is EQuIP and what makes it unique?
• How does EQuIP fit into German development cooperation?
• What will be the next steps of the project?

Page 37
Employment Elasticity: Marocco and Tunisia
-2.00
-1.50
-1.00
-0.50
0.00
0.50
1.00
1.50
Employment Elasticity Marocco
-2.00
-1.50
-1.00
-0.50
0.00
0.50
1.00
1.50
Food Textiles Chemicals Minerals
Employment Elasticity Tunisia

Page 38
Possible Applications in German Cooperation
• Broad IP projects: EQuIP as
central component of project
execution
• Examples:
• Economic policy reform
• Development
planning/strategy
• Industrial strategy
• Sector growth strategies
• Specific interventions: EQuIP
for specific analytical decision-
making support
• Examples:
• Sector support schemes
(value chain, cluster, etc.)
• Export promotion schemes
• Meso- and enterprise
support schemes
• Local economic
development

Page 39
Possible Activities and Outputs
• Training for:
• Development cooperation professionals
• Existing IP agencies
• New IP units
• Basis for analytical studies for evidence-based IP
• Including the industrial dimension in development plans
• Monitoring, evaluation and impact assessments of IP