Embed Size (px)
Citation preview
Tools for Eco-efficiency in the Printing Industry
Maria Enroth
Licentiate Thesis
Royal Institute of Technology
Department of Numerical Analysis and Computer Science
Media Technology and Graphic Arts
TRITA-NA-0142
Akademisk avhandling som med tillstånd av Kungl. Tekniska Högskolan framlägges till offentlig granskning för teknisk licentiatexamen torsdag den 13 december 2001, kl. 13.00 i seminarierum E2, Lindstedtsvägen 3, Kungl. Tekniska Högskolan, Stockholm.
ISBN 91-7283-206-1, TRITA-NA-0142, ISSN 0348-2952 ISRN KTH/NA/R-01/42-SE © Maria Enroth, November 2001 KTH, Stockholm 2001
III
AbstractThe main aim of this study has been to provide the graphic arts industry with industry-specific tools for environmental work that could contribute to eco-efficiency and a sustainable production. Eco-efficiency is to achieve more value from lower inputs of materials and energy and with reduced emissions. Eco-efficiency is closely related to sustainable production. Working methods and tools for eco-efficiency in the graphic arts industry should be industry-specific, with environmental information and knowledge of the current production circumstances and products, tailored to small and medium-sized enterprises (SME) and simple in the sense of being easy to use although valuable assistance based on scientific environmental data is still given. The areas, which have been included in the research, are the following: Evaluation of environmental management systems (EMS), development of industry-specific environmental indicators and development of industry-specific working methods and tools for design for environment (DfE). The most significant results of the research can be summarised as follows: • Recommendation of general industry-specific indicators with a defined
method for a standardised inventory and calculation. This will make it possible to follow up and manage internal environmental work and to demonstrate and communicate environmental improvements both internally and externally.
• Description and recommended working methods for DfE in graphic arts companies.
• Practical tools for applying DfE to printed products in the form of a manual and a checklist. The checklist has been designed so that it will also serve as a simple tool for the environmental assessment of printed products.
The research is based on qualitative methods such as action research and case studies in order to illustrate real-life situations. The work has been carried out in co-operation with small and medium-sized graphic arts companies and reference groups. Keywords: Eco-efficiency, Environmental management systems, EMS, Environmental indicators, Design for environment, DfE, Life cycle assessment, LCA, Environmental issues, Printed products, Printing industry, Graphic arts industry

V
AcknowledgementsI would like to thank my colleagues at Framkom (Research Corporation for Media and Communication Technology) and at other Research Institutes in Sweden for valuable co-operation during my research. Among others Angelica Widing should be mentioned as an especially inspiring colleague and co-worker. Many thanks to my supervisor Professor Nils Enlund for guiding me in my research. I am also grateful for the participation from all companies that have contributed to my research. I also would like to thank all of you who have contributed in different ways to my work. Without support from my husband Peter and my family this thesis could not have been written.

VII
List of included papersPaper I Environmental Management Systems – Paper tiger or powerful tool, by Maria Enroth and Mats Zackrisson. Published in Conference Proceedings of the 2000 Eco-Management and Auditing Conference. June 2000. University of Manchester. UK. ERP Environment. UK. pp. 81-92. Paper II Environmental indicators in the graphic arts industry, by Maria Enroth and Angelica Widing. Published in Advances in Printing Science and Technology. Vol. 26. Bristow, A. (ed.). Pira International 2000. pp. 337-356. Paper III Promoting sustainability using business specific indicators, by Maria Enroth. Published in Conference Proceedings of the 2001 Eco-Management and Auditing Conference. June 2001. Nijmegen School of Management. The Netherlands. ERP Environment. UK. pp. 60-67. Paper IV Tools for Design for Environment (DfE) - Applications in the Printing Industry, by Maria Enroth and Angelica Widing. Accepted for publication in TAGA 2002 Proceedings. To be published.

IX
The author's contribution to the papersPaper I Environmental indicators in the graphic arts industry, by Maria Enroth and Angelica Widing. I carried out the research behind the report together with Angelica Widing and colleagues at another research institute. I was responsible for writing and presenting the paper. Paper II Environmental Management Systems – Paper tiger or powerful tool, by Maria Enroth and Mats Zackrisson. I carried out the research behind the report together with Mats Zackrisson and Angelica Widing. I collaborated with Mats Zackrisson when writing the paper although I was responsible for writing and presenting the paper. Paper III Promoting sustainability using business specific indicators, by Maria Enroth. I carried out the literature survey. The case studies behind the research have been carried out in collaboration with Angelica Widing. The paper was written entirely by me. Paper IV Tools for Design for Environment (DfE) - Applications in the Printing Industry, by Maria Enroth and Angelica Widing. I carried out the research behind the report together with Angelica Widing. I was responsible for writing the research report while Angelica was responsible for writing a handbook. I was responsible for writing the paper, which will also be presented by me.

XI
Errata Paper III • Results, Study of newspaper industry with case studies, Table "Measures of
environmental load", Hazardous materials, Column 2: "The definition of hazardous is here related to the Swedish observation list and labelling of chemicals. Calculated without water." should be "The definition of hazardous is here related to the Swedish observation list and labelling of chemicals."
• Results, Study of newspaper industry with case studies, Table "Measures of environmental load", Hazardous materials, Column 3: "Kg ("dry")" should be "Kg"

XIII
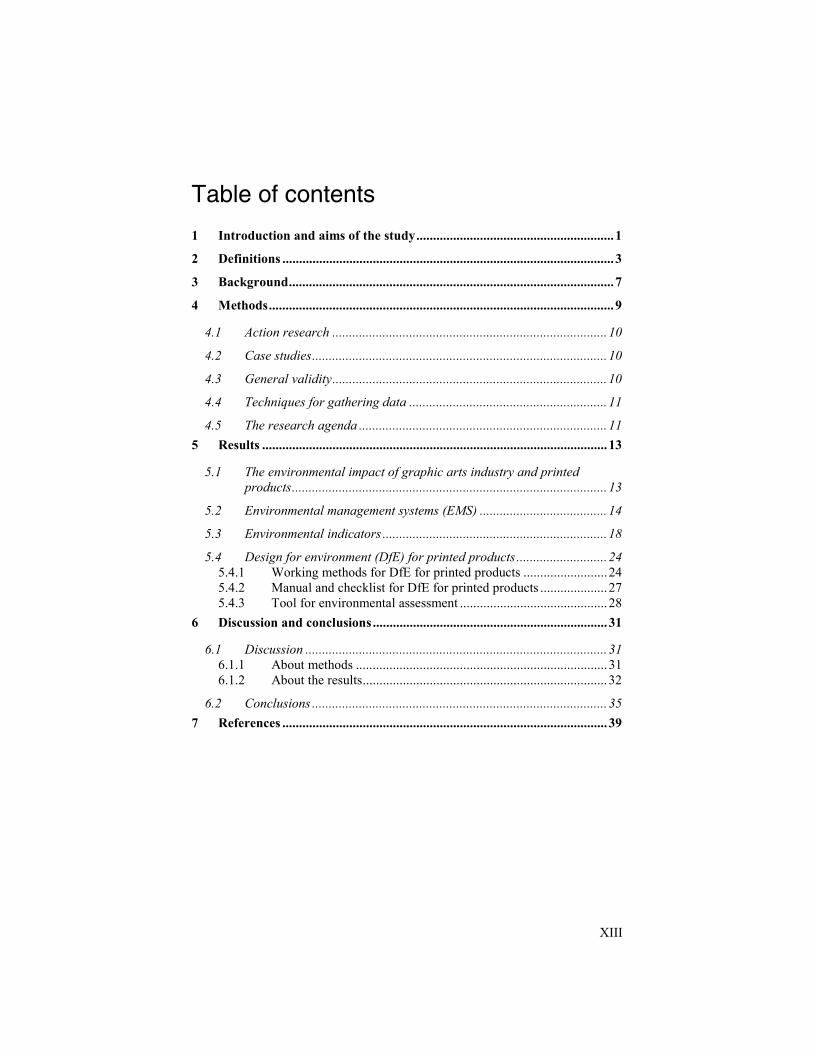
Table of contents
1 Introduction and aims of the study...........................................................1 2 Definitions ...................................................................................................3 3 Background.................................................................................................7 4 Methods.......................................................................................................9
4.1 Action research ..................................................................................10 4.2 Case studies........................................................................................10 4.3 General validity..................................................................................10 4.4 Techniques for gathering data ...........................................................11 4.5 The research agenda ..........................................................................11
5 Results .......................................................................................................13
5.1 The environmental impact of graphic arts industry and printed products..............................................................................................13
5.2 Environmental management systems (EMS) ......................................14 5.3 Environmental indicators ...................................................................18 5.4 Design for environment (DfE) for printed products ...........................24
5.4.1 Working methods for DfE for printed products .........................24 5.4.2 Manual and checklist for DfE for printed products ....................27 5.4.3 Tool for environmental assessment ............................................28
6 Discussion and conclusions ......................................................................31
6.1 Discussion ..........................................................................................31 6.1.1 About methods ...........................................................................31 6.1.2 About the results.........................................................................32
6.2 Conclusions ........................................................................................35 7 References .................................................................................................39

1
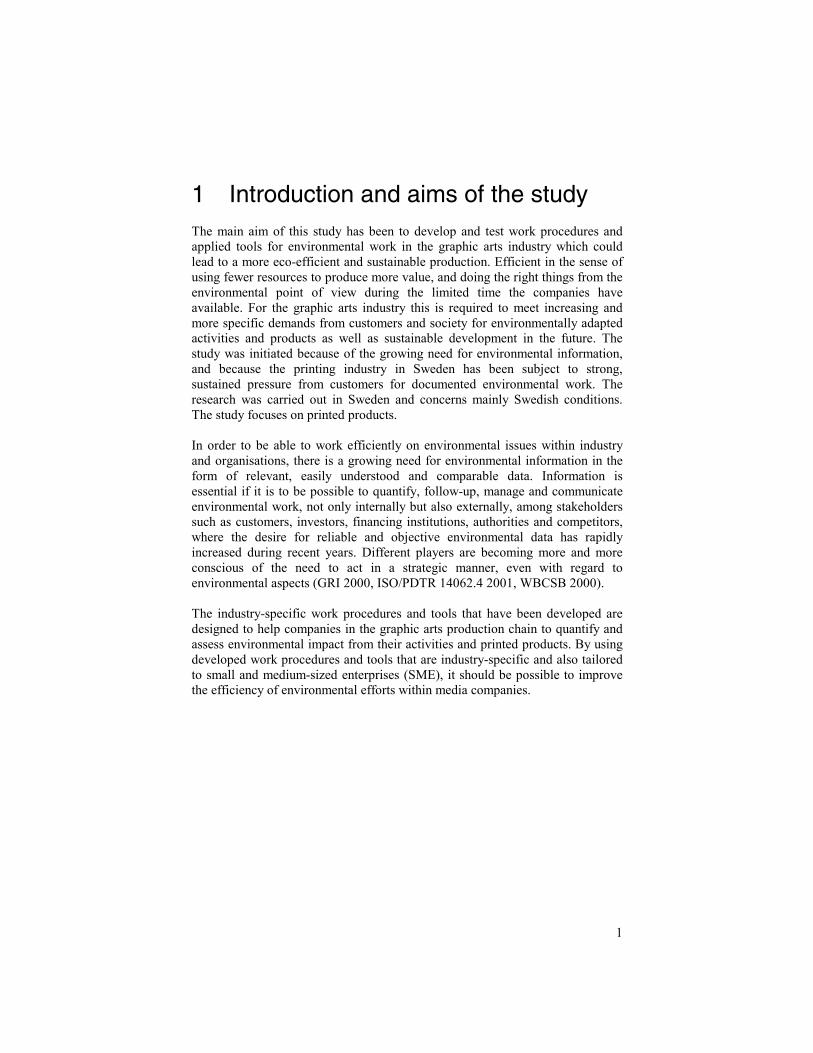
1 Introduction and aims of the studyThe main aim of this study has been to develop and test work procedures and applied tools for environmental work in the graphic arts industry which could lead to a more eco-efficient and sustainable production. Efficient in the sense of using fewer resources to produce more value, and doing the right things from the environmental point of view during the limited time the companies have available. For the graphic arts industry this is required to meet increasing and more specific demands from customers and society for environmentally adapted activities and products as well as sustainable development in the future. The study was initiated because of the growing need for environmental information, and because the printing industry in Sweden has been subject to strong, sustained pressure from customers for documented environmental work. The research was carried out in Sweden and concerns mainly Swedish conditions. The study focuses on printed products. In order to be able to work efficiently on environmental issues within industry and organisations, there is a growing need for environmental information in the form of relevant, easily understood and comparable data. Information is essential if it is to be possible to quantify, follow-up, manage and communicate environmental work, not only internally but also externally, among stakeholders such as customers, investors, financing institutions, authorities and competitors, where the desire for reliable and objective environmental data has rapidly increased during recent years. Different players are becoming more and more conscious of the need to act in a strategic manner, even with regard to environmental aspects (GRI 2000, ISO/PDTR 14062.4 2001, WBCSB 2000). The industry-specific work procedures and tools that have been developed are designed to help companies in the graphic arts production chain to quantify and assess environmental impact from their activities and printed products. By using developed work procedures and tools that are industry-specific and also tailored to small and medium-sized enterprises (SME), it should be possible to improve the efficiency of environmental efforts within media companies.

3
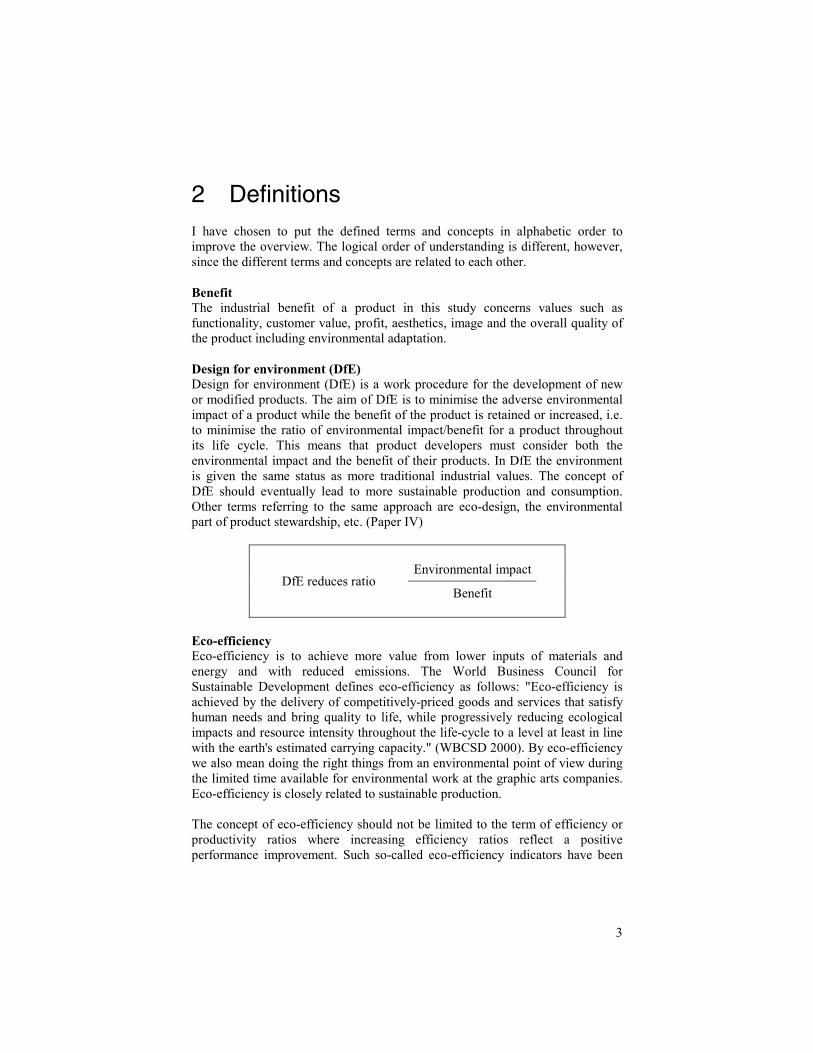
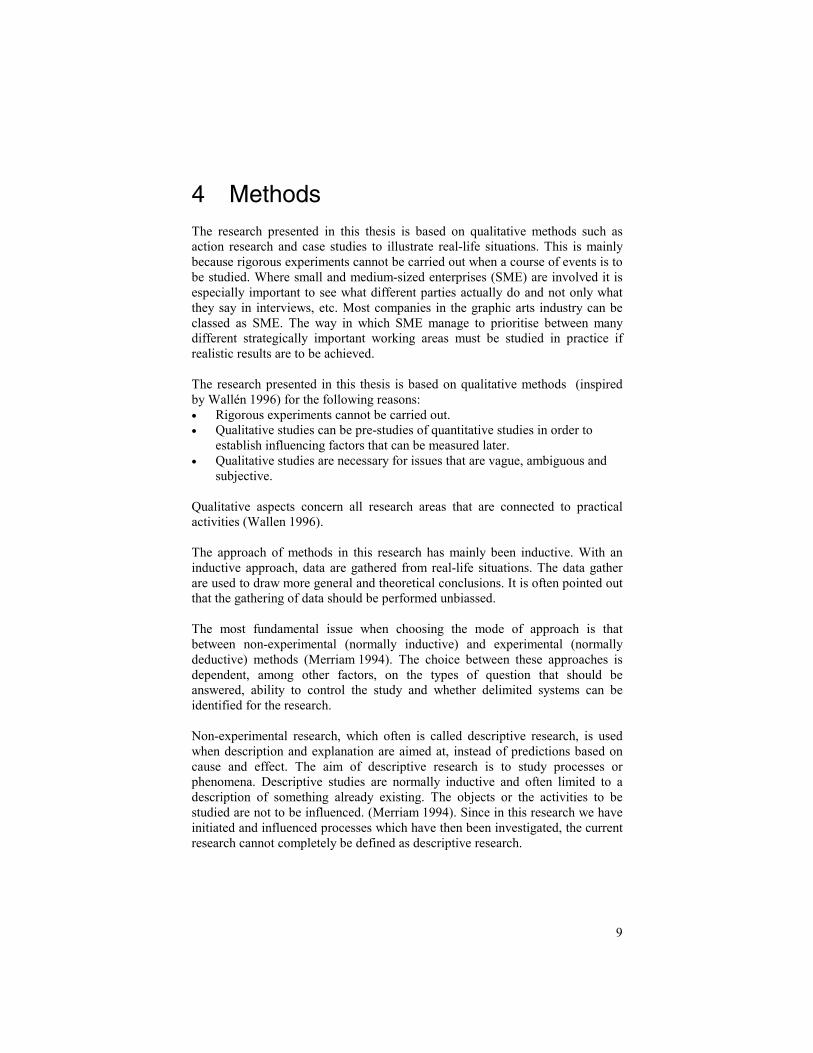
2 DefinitionsI have chosen to put the defined terms and concepts in alphabetic order to improve the overview. The logical order of understanding is different, however, since the different terms and concepts are related to each other. Benefit The industrial benefit of a product in this study concerns values such as functionality, customer value, profit, aesthetics, image and the overall quality of the product including environmental adaptation. Design for environment (DfE) Design for environment (DfE) is a work procedure for the development of new or modified products. The aim of DfE is to minimise the adverse environmental impact of a product while the benefit of the product is retained or increased, i.e. to minimise the ratio of environmental impact/benefit for a product throughout its life cycle. This means that product developers must consider both the environmental impact and the benefit of their products. In DfE the environment is given the same status as more traditional industrial values. The concept of DfE should eventually lead to more sustainable production and consumption. Other terms referring to the same approach are eco-design, the environmental part of product stewardship, etc. (Paper IV)
Environmental impact DfE reduces ratio
Benefit
Eco-efficiency Eco-efficiency is to achieve more value from lower inputs of materials and energy and with reduced emissions. The World Business Council for Sustainable Development defines eco-efficiency as follows: "Eco-efficiency is achieved by the delivery of competitively-priced goods and services that satisfy human needs and bring quality to life, while progressively reducing ecological impacts and resource intensity throughout the life-cycle to a level at least in line with the earth's estimated carrying capacity." (WBCSD 2000). By eco-efficiency we also mean doing the right things from an environmental point of view during the limited time available for environmental work at the graphic arts companies. Eco-efficiency is closely related to sustainable production. The concept of eco-efficiency should not be limited to the term of efficiency or productivity ratios where increasing efficiency ratios reflect a positive performance improvement. Such so-called eco-efficiency indicators have been
4
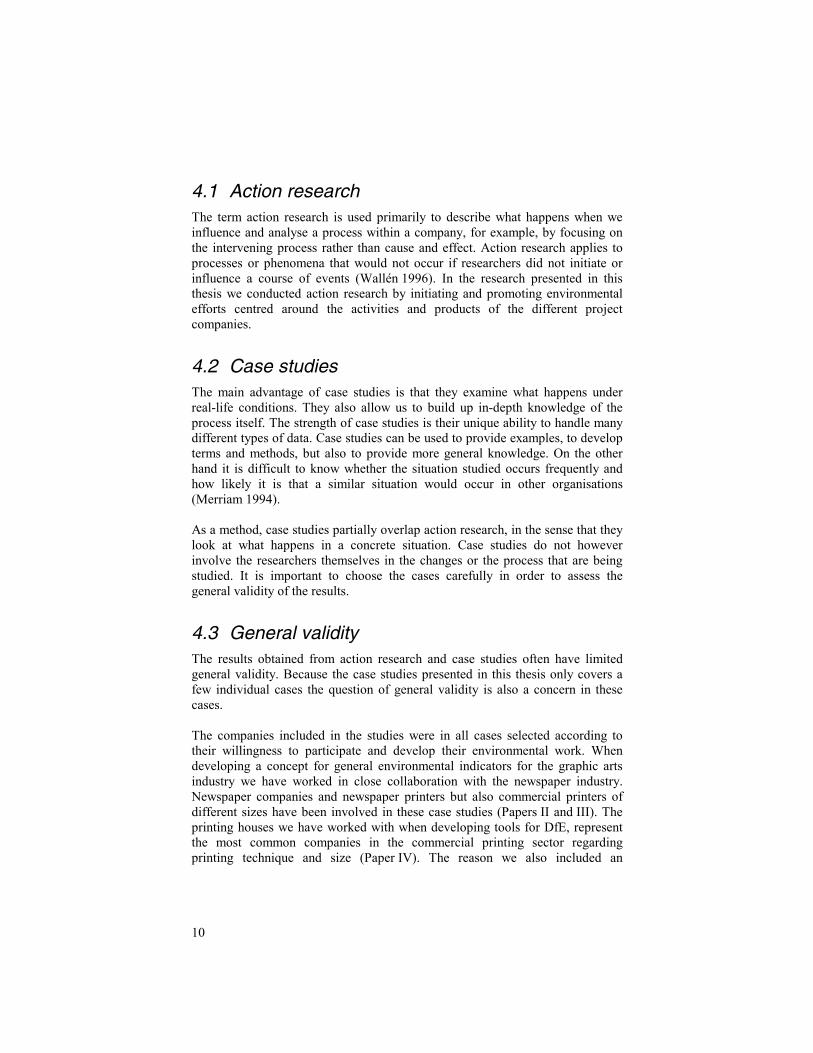
formulated by WBCSD and express value per environmental influence (WBCSD 2000). Environmental indicator The basic purpose of an indicator is to condense and focus complex information, thereby facilitating the solution, understanding and communication of a problem. In the research presented in this thesis we have formulated general environmental indicators for companies in the graphic arts industry that consist of a measure for environmental load as the numerator and a measure for utility as the denominator. (Paper II and Paper III)
Environmental load Environmental indicator =
Utility
The general indicators for the graphic arts industry take in account the environmental aspects and the flows of resources that are regarded as being the most important or significant for offset and flexographic printing. These indicators can be seen as intensity ratios since they express an environmental impact per unit of value. A declining intensity ratio reflects a positive performance improvement. Historically, many organisations tracked environmental performance with intensity ratios (GRI 2000). Environmental management system (EMS) An environmental management system is defined as the part of the overall management system that includes organisational structure, planning activities, responsibilities, practices, procedures, processes and resources for developing, implementing, achieving, reviewing and maintaining the environmental policy (ISO 14001:1996). ISO 14001 (International Organisation for Standardisation) and EMAS (Eco-management and audit scheme) can be seen as two systems with a common basis. Even so, there are certain differences. The greatest difference is that, according to EMAS, companies have to produce an official, assessed environmental statement. EMAS also has more explicit demands as regards the preliminary environmental review. Environmental performance Environmental performance is the measurable results of the environmental management system, related to an organisation's control of its environmental aspects, based on its environmental policy, objectives and targets (ISO 14001:1996).
5
Product The term product is used here in the wider sense to include both goods and services. Sustainable development Sustainable development is development that meets the needs of the present without compromising the ability of future generations to meet their own needs. (Brundtland 1987). The concept of sustainable development includes three areas of concern, which embraces economic, environmental and social dimensions. Utility In our research concerning indicators we have used the term utility to express the value of a company. One recommended measure for utility is a financial and another is related to the production. (Paper II and Paper III). The system boundary has been placed around the company's property, which means that it covers everything taken in and out through the company gates. However some exceptions are made for the use of energy and transports. (See 5.3)

7
3 BackgroundThe focus of environmental efforts has shifted from industrial emissions and waste, and their treatment and disposal, to remedying environmental problems at source and taking preventive action. The most efficient way of using resources is to consider, right from the design stage, the resources, emissions and waste that will arise during manufacture, and also use and disposal when products have reached the end of their useful life. The graphic arts industry can be divided into the following sectors: • Commercial printing industry • Newspaper industry • Publishers • Packaging industry All sectors have in common the processing of printed or otherwise distributed information. What distinguishes the sectors is mainly the types of delivered products. In the research presented in this thesis we have focused on the sectors of commercial printing industry and newspaper industry. The commercial printing industry in Sweden includes over 3,000 companies. The median value for the number of employees is approximately ten people, which means that half of the commercial printing companies have less than ten employees. The Swedish newspaper industry includes less than 200 companies with a mean value of 170 employees. The total annual turnover for the commercial printing industry and the newspaper industry amounts to approximately SEK 40,000 thousand (1999). (Lindberg 2001, Rosengren 2001) The graphic arts industry is at present in a wide-ranging process of change. Today printing is just one way to reproduce and distribute information. However there are no signs of a declining trend for the consumption of printed products in Sweden (GFF 1999). As new media technologies are established the media industry is widened to include new types of companies with activities within electronic publication and the Internet. Graphic arts companies in Sweden are concerned to a great extent with environmental issues. The industry adopted a front position early with regard to the number of companies with certified environmental management systems (Zackrisson 1999). They also have the greatest number of licences for production according to the Nordic Swan product eco-labelling scheme. This is in comparison to all other types of products for which the Nordic Council of Ministers has formulated eco-labelling criteria. The total number of types of products is now 54 and the total number of licences in Scandinavia is 975. Out
8
of that 517 (53%) of the licences refer to printed products in Scandinavia, 302 of them in Sweden. (SIS Miljömärkning 2001). An important driving force for the environmental work within the industry is real customer demands and thereby also an economic driving force. The reason why customer demands are extensive in this industry is probably due to the character of information products. They are universal and close to the customer in several aspects. Information products are used both in business-to-business relations and with private consumers as a target group. Therefore policy decisions within companies and the public opinion contribute to the extensive customer demands for environmental awareness within the graphic arts industry and their products. Alongside this the industry is undergoing fast technical development, including the move to digitalisation and increasingly tighter lead times. In the light of all this and because the majority of the companies within the industry are very small with less than 20 employees, there is a need for the development of industry-specific methods and tools for efficient and proactive environmental efforts.
9
4 MethodsThe research presented in this thesis is based on qualitative methods such as action research and case studies to illustrate real-life situations. This is mainly because rigorous experiments cannot be carried out when a course of events is to be studied. Where small and medium-sized enterprises (SME) are involved it is especially important to see what different parties actually do and not only what they say in interviews, etc. Most companies in the graphic arts industry can be classed as SME. The way in which SME manage to prioritise between many different strategically important working areas must be studied in practice if realistic results are to be achieved. The research presented in this thesis is based on qualitative methods (inspired by Wallén 1996) for the following reasons: • Rigorous experiments cannot be carried out. • Qualitative studies can be pre-studies of quantitative studies in order to
establish influencing factors that can be measured later. • Qualitative studies are necessary for issues that are vague, ambiguous and
subjective. Qualitative aspects concern all research areas that are connected to practical activities (Wallen 1996). The approach of methods in this research has mainly been inductive. With an inductive approach, data are gathered from real-life situations. The data gather are used to draw more general and theoretical conclusions. It is often pointed out that the gathering of data should be performed unbiassed. The most fundamental issue when choosing the mode of approach is that between non-experimental (normally inductive) and experimental (normally deductive) methods (Merriam 1994). The choice between these approaches is dependent, among other factors, on the types of question that should be answered, ability to control the study and whether delimited systems can be identified for the research. Non-experimental research, which often is called descriptive research, is used when description and explanation are aimed at, instead of predictions based on cause and effect. The aim of descriptive research is to study processes or phenomena. Descriptive studies are normally inductive and often limited to a description of something already existing. The objects or the activities to be studied are not to be influenced. (Merriam 1994). Since in this research we have initiated and influenced processes which have then been investigated, the current research cannot completely be defined as descriptive research.
10
4.1 Action researchThe term action research is used primarily to describe what happens when we influence and analyse a process within a company, for example, by focusing on the intervening process rather than cause and effect. Action research applies to processes or phenomena that would not occur if researchers did not initiate or influence a course of events (Wallén 1996). In the research presented in this thesis we conducted action research by initiating and promoting environmental efforts centred around the activities and products of the different project companies.
4.2 Case studiesThe main advantage of case studies is that they examine what happens under real-life conditions. They also allow us to build up in-depth knowledge of the process itself. The strength of case studies is their unique ability to handle many different types of data. Case studies can be used to provide examples, to develop terms and methods, but also to provide more general knowledge. On the other hand it is difficult to know whether the situation studied occurs frequently and how likely it is that a similar situation would occur in other organisations (Merriam 1994). As a method, case studies partially overlap action research, in the sense that they look at what happens in a concrete situation. Case studies do not however involve the researchers themselves in the changes or the process that are being studied. It is important to choose the cases carefully in order to assess the general validity of the results.
4.3 General validityThe results obtained from action research and case studies often have limited general validity. Because the case studies presented in this thesis only covers a few individual cases the question of general validity is also a concern in these cases. The companies included in the studies were in all cases selected according to their willingness to participate and develop their environmental work. When developing a concept for general environmental indicators for the graphic arts industry we have worked in close collaboration with the newspaper industry. Newspaper companies and newspaper printers but also commercial printers of different sizes have been involved in these case studies (Papers II and III). The printing houses we have worked with when developing tools for DfE, represent the most common companies in the commercial printing sector regarding printing technique and size (Paper IV). The reason we also included an
11
advertising agency in our work with DfE is precisely because this group of companies has a large influence on graphic arts products and hence on future DfE work. Communicability and applicability can be used as indicators of the general validity of case studies (Wallén 1996). One of the aims of the research was to acquire general knowledge and develop working methods and tools for environmental work that are applicable to the majority of graphic arts companies.
4.4 Techniques for gathering dataWe used the following techniques to gather data, which in this sense refers to all the information gathered during the research: • Surveys in the form of questionnaires, interviews and literature surveys. • Different types of inventories regarding the interest in environmental issues,
and the activities and products of graphic arts companies. • Observations on-site, in conjunction with visits for interviews and company
training. • Project meeting discussions during which the views of project participants
were canvassed. The interviews used in this research can be defined as structured interviews since they are based on questionnaires. The questions could however be adapted to each individual company and be followed up by in-depth questions if needed. In-depth interviews can be used when structured interviews or questionnaires are not sufficient. The structured interviews in both the EMS-study (Paper I) and the work with DfE (Paper IV) were documented in consultation with each company in order to ensure validity.
4.5 The research agendaThe following areas have been included in the research: • Evaluation of environmental management systems in order to develop
future environmental work. • Development of industry-specific (the term trade-specific has been used in
Paper II and business-specific in Paper III) environmental indicators for the printing industry aiming at improved and more efficient follow-up, management and communication of the environmental work.
• Development of industry-specific work procedure and tools for design for environment (DfE) in order to promote a focus on the products and their functionality in future environmental work within the product chain of graphic arts industry.
12
One of the main tasks of this research has been to investigate the assumed logical connections between the above areas of environmental work in the graphic arts industry. There is a possibility of a considerable, widespread improvement of the environmental performance of the entire industry if the right working methods and tools are given.
13
5 Results
5.1 The environmental impact of graphic artsindustry and printed products
One important requirement for industry-specific work procedures and tools for environmental work is a large amount of relevant environmental data. Industry-specific tools for the graphic arts industry should reflect the main environmental aspects of the industry. The environmental impact of printed products depends on the types of consumable materials used to produce it, such as the paper, plastics, inks, adhesives, etc. Environmental impact also depends on the choice of printing method, machinery, process chemicals and materials that are used in manufacture. The choice of means of transport and the distances travelled in acquiring the materials and delivering the product also play a part. The results of several life cycle analyses have shown that the consumption of paper (forestry, pulp & paper manufacture) accounts for the largest single environmental impact, 30–70% of the total environmental impact of printed products (Axel Springer Verlag 1998, Dalhielm 1995, Drivsholm 1997). Energy consumption during printing plays a major role in environmental impact (Virtanen 1995). Several investigations have been made in order to identify the environmental aspects of the graphic arts industry and printed products. Based on literature surveys and our subsequent work (Andersson 1998, Enroth 1998, SIS Ecolabelling 1999, Widing 1999) and different types of inventories during the research work, it is possible to claim that the following environmental aspects can generally be regarded as significant in graphic arts industry and for their products (not in order of priority): • Consumption of printing paper (or other printing medium) • Consumption of non-renewable materials • Consumption of energy • Transport • Handling and use of chemical products including printing ink • Handling and use of electronics • Emissions of volatile organic compounds (VOC) into the air
14
5.2 Environmental management systems (EMS)An evaluation of existing environmental management systems in order to develop future environmental work is made and described in Paper I. In a study covering all industries and organisations in Sweden, we have evaluated what the environmental and economical efficiency of environmental management systems has been like up until now (1999) according to ISO 14001 and EMAS. The long-term objective of this study was to develop environmental management systems (EMS) and make them more efficient. Almost 200 Swedish companies have contributed with their experiences. The study was carried out in 1999. The study comprised a questionnaire sent to all ISO-certified and EMAS-registered companies in Sweden (360 companies in November 1998 with 49% response), as well as structured interviews with 19 randomly selected companies from the entire group. The interviews were documented in consultation with each company. In order to analyse the information from these interviews, we categorised it into quantitative and qualitative parameters. Some of the most important observations concerning the environmental efficiency of EMS were: • The environmental performance of EMAS-registered companies seemed to
be better than that of companies with only ISO 14001. • Companies using environmental indicators to follow up environmental
objectives and targets seemed to attain better environmental performance than others. The interview results have shown that the better a company's target follow-up, the better its environmental results.
• Half the environmental objectives and targets would also have been achieved without EMS.
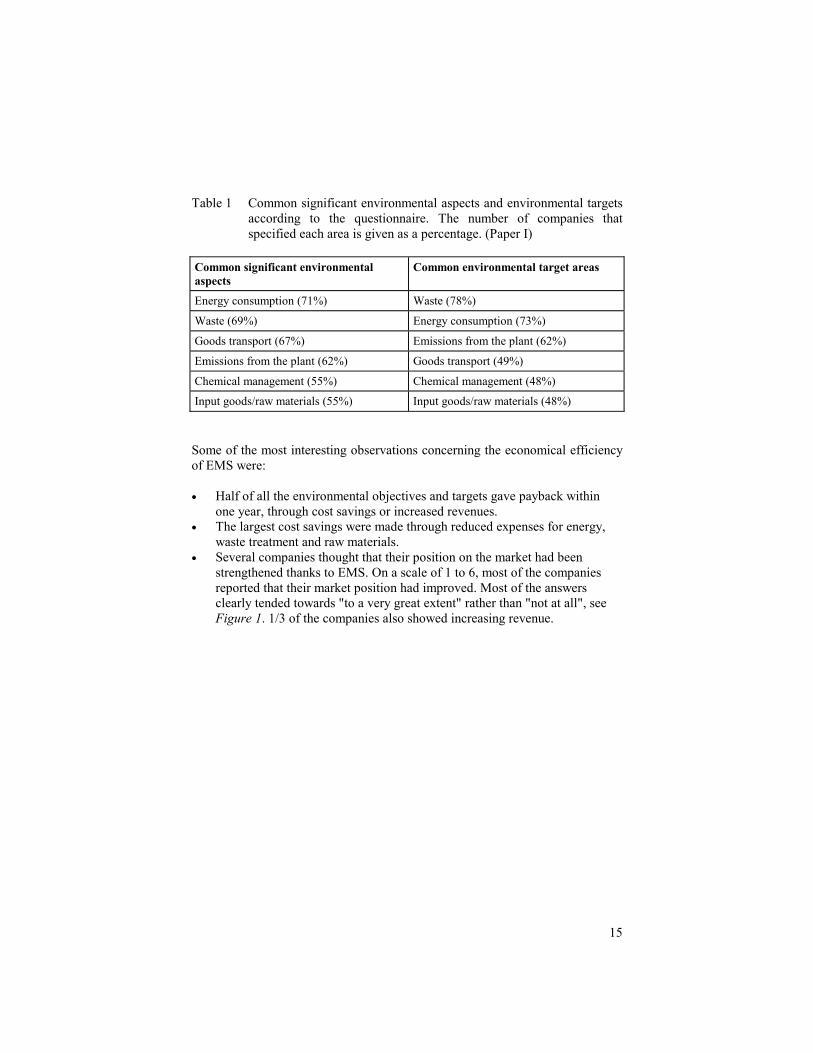
The identified significant environmental aspects corresponded well in general with the areas within which companies had established environmental targets, see Table 1. The study indicates that most of the companies have environmental targets within the majority of areas that can be regarded as important. Although there is room for an improvement as regards which environmental aspects the companies choose to work with. Waste was the most common environmental target area. The results of both the questionnaire and the interviews indicated that the majority of companies felt the greatest environmental improvements had been achieved in the area of waste. Better waste treatment and less waste were the most frequent answers.
15
Table 1 Common significant environmental aspects and environmental targets
according to the questionnaire. The number of companies that specified each area is given as a percentage. (Paper I)
Common significant environmental aspects
Common environmental target areas
Energy consumption (71%) Waste (78%)
Waste (69%) Energy consumption (73%)
Goods transport (67%) Emissions from the plant (62%)
Emissions from the plant (62%) Goods transport (49%)
Chemical management (55%) Chemical management (48%)
Input goods/raw materials (55%) Input goods/raw materials (48%) Some of the most interesting observations concerning the economical efficiency of EMS were: • Half of all the environmental objectives and targets gave payback within
one year, through cost savings or increased revenues. • The largest cost savings were made through reduced expenses for energy,
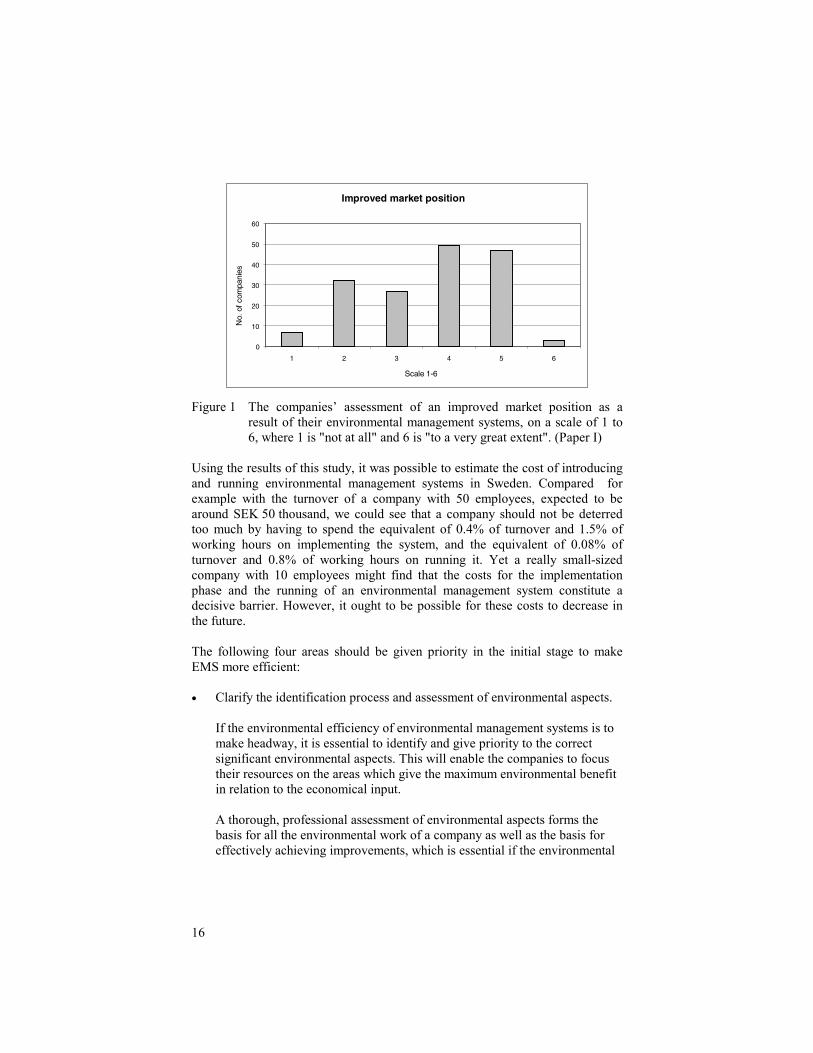
waste treatment and raw materials. • Several companies thought that their position on the market had been
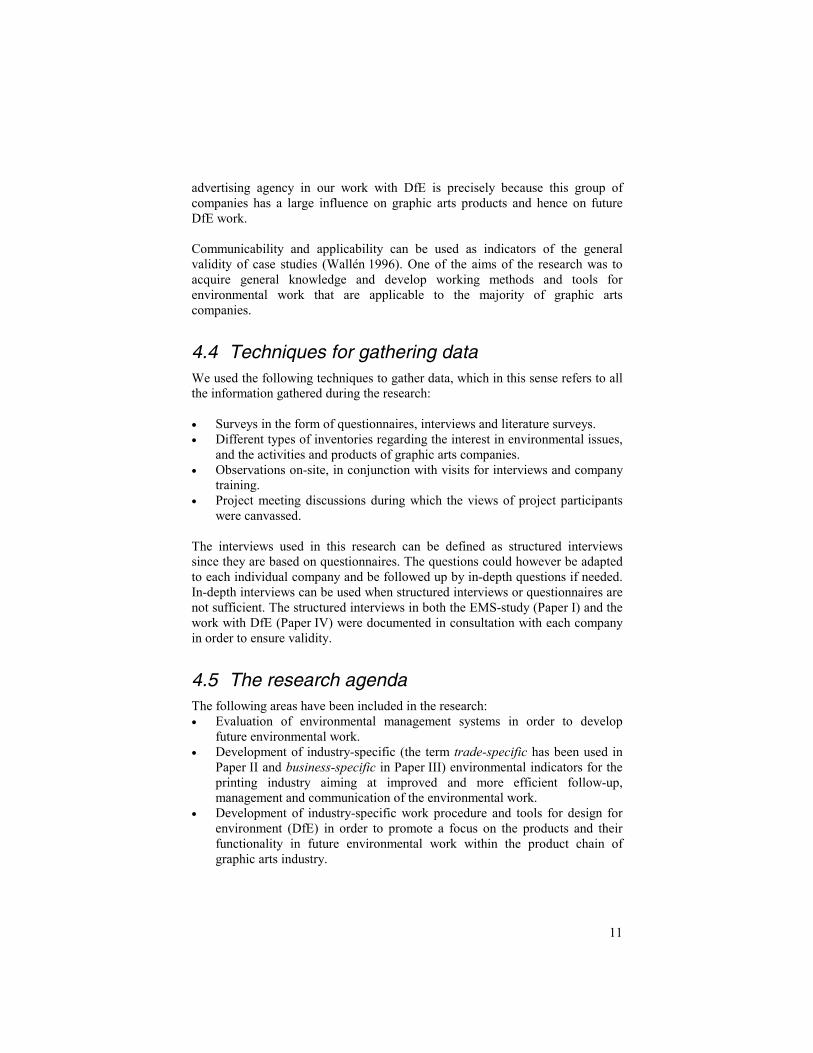
strengthened thanks to EMS. On a scale of 1 to 6, most of the companies reported that their market position had improved. Most of the answers clearly tended towards "to a very great extent" rather than "not at all", see Figure 1. 1/3 of the companies also showed increasing revenue.
16
Improved market position
0
10
20
30
40
50
60
1 2 3 4 5 6
Scale 1-6
No.
ofco
mpa
nies
Figure 1 The companies’ assessment of an improved market position as a
result of their environmental management systems, on a scale of 1 to 6, where 1 is "not at all" and 6 is "to a very great extent". (Paper I)
Using the results of this study, it was possible to estimate the cost of introducing and running environmental management systems in Sweden. Compared for example with the turnover of a company with 50 employees, expected to be around SEK 50 thousand, we could see that a company should not be deterred too much by having to spend the equivalent of 0.4% of turnover and 1.5% of working hours on implementing the system, and the equivalent of 0.08% of turnover and 0.8% of working hours on running it. Yet a really small-sized company with 10 employees might find that the costs for the implementation phase and the running of an environmental management system constitute a decisive barrier. However, it ought to be possible for these costs to decrease in the future. The following four areas should be given priority in the initial stage to make EMS more efficient: • Clarify the identification process and assessment of environmental aspects.
If the environmental efficiency of environmental management systems is to make headway, it is essential to identify and give priority to the correct significant environmental aspects. This will enable the companies to focus their resources on the areas which give the maximum environmental benefit in relation to the economical input. A thorough, professional assessment of environmental aspects forms the basis for all the environmental work of a company as well as the basis for effectively achieving improvements, which is essential if the environmental
17
management work is to progress and develop. Based on this and the fact that working with significant environmental aspects is what companies feel is the most difficult aspect of environmental management work, there is real reason for companies to receive support in this area in the future.
• Improve the follow-up of environmental work. The tools necessary for continuing with improvements are, according to the questionnaire responses, chiefly linked to better follow-up of the environmental targets with, for example, environmental indicators. This could lead to better environmental results and improved external communications. Backup is needed here in the form of real examples of environmental indicators, measuring methods and data for comparison in each industry.
• Link EMS to product design and put more focus on the manufactured
products (goods and services) with a life cycle perspective. The study shows that the focus of companies today is mainly on waste, energy and emissions. This is often linked to cost savings and has pedagogic consequences. To ensure continual improvements in future environmental management systems and increase financial profits, the focus of attention needs to be shifted towards companies' own products. Proactive environmental efforts should focus on products and their functionality. For companies that manufacture goods or supply services, rather than producing raw materials, environmental analyses often reveal that the greatest environmental impact these companies produce is due to the products themselves. Environmental impact often arises during the production of raw materials and consumable items, and through the use or disposal of the products. Studies show, however, that few of the environmental targets these companies set up as part of their environmental management systems actually deal with the total environmental impact of manufactured products (Zackrisson 1999).
• Streamline and co-ordinate different management systems.
It would be expedient to have fewer bureaucratic routines for environmental management systems. Many companies have announced increased co-ordination in their quality and health and safety systems as well as a switch to electronic documentation management in order to simplify and streamline their business management.
Out of the four identified areas that need to be developed we have continued the research presented in this thesis by developing two of the most important areas
18
for the graphic arts industry: environmental indicators and design for environment (DfE) of products. This is described in Papers II, III and IV.
5.3 Environmental indicatorsThe development of industry-specific (the term trade-specific has been used in Paper II and business-specific in Paper III) environmental indicators for the printing industry has been made in an iterative process, which is described in Papers II and III. In the first study four companies (two commercial printers, one newspaper company and one newspaper printer) participated in the case studies (Paper II). In the second study six companies (five newspaper companies and one newspaper printer) participated fully in case studies (Paper III). With this work it has been important to clarify what parameters give relevant information regarding the environmental impact from the graphic arts industry and if it is possible to measure parameters for small and medium-sized enterprises (SME) within the graphic arts industry. The aim of this part of the research presented in the thesis is an improved and more efficient following-up, management and communication of environmental work within the industry. A number of general environmental indicators for the graphic arts industry, reflecting the significant environmental aspects have been defined. The selection of measures and indicators has been made on the basis of a literature studies of environmental aspects in the graphic arts industry, extensive inventories of e.g. flows of material in the case of companies studied, the calculation and analysis of a wide range of indicators for the same companies, and discussions in project reference groups. Among others, the Swedish Environmental Quality Objectives (Naturvårdsverket 2000) and the Swedish Environmental Code (SFS 1998:808) have been used as guiding principles when deciding which environmental choices should be considered as being better than others in the recommended set of general indicators. In the Swedish Environmental Code we have focused on resource management and eco-cyclic principles in addition to the product choice principle. It is extremely important to define the scope and limits, the system boundaries, for indicators when they are formulated, used and later communicated. One rule of thumb is that environmental indicators should have the same system boundaries as the data of utility to which they will be related. In this study, the system boundaries have been placed around the company property, which means that they embrace all that is taken in and out through the company gates. Exceptions are however made for transport vehicles and emissions from vehicles, since these can be expected to cause a significant environmental load. When emissions caused by the use of electricity and district heating are counted, the system boundary is moved upstream to the actual production of the
19
electricity or the district heating. In our studies of indicators, the use and handling of the products in the waste treatment phase have been excluded in accordance with the defined system boundaries. In Paper III we discuss the possibility of promoting and following up sustainability by using industry-specific indicators. This is done through a survey of industry-specific indicator projects and case studies within the industry. The society has a need to promote and follow up development towards sustainability. Assignations concerning a sustainable development have often been made at governmental level reflecting national and/or international agreements. One problem within society is that specific trades or individual industrial companies have difficulty in adopting these assignations. Another problem for specific trades or individual companies is to cover all areas of the concept of sustainable development in their practical work with continual improvements. So far, most work concerning sustainability within small and medium-sized enterprises (SME) has been carried out in the environmental and economical areas while leaving out social aspects. There is a need to break down governmental assignations, e.g., the Swedish National Environmental Quality Objectives, into targets on a more practical level for individual industrial companies. In a general survey of current indicator frameworks and projects, where some 40 projects have been surveyed, only a handful of them cover all three aspects of sustainability (Carlsson Reich 2001). In Paper III a literature survey was carried out, which gives a view of what has been done earlier in the field of sustainability indicators for the graphic arts industry. So far none of the industry-specific indicator concepts we have identified for the graphic arts industry (Paper II, IIIEE 2001, Cadra 1998, Cook 1997, GA 1999, SPRU 2001) meet the requirements of sustainability indicators since the social aspects are left out. Case studies at newspaper companies were used as a basis for developing our original industry-specific concept and to provide input to our discussion on promoting sustainability using indicators. In accordance with the earlier case studies, the current case studies in Paper III were used to illustrate the possibilities and difficulties in real life to investigate data and calculate the suggested indicators. The case studies also gave information on whether the suggested indicators could actually illustrate the issue they were formulated to illustrate. In order to connect practical environmental issues within the industry to the assignations on a governmental level for sustainable development, the concept developed illustrates the relationships between the indicators and the Swedish National Environmental Quality Objectives. This has been done by calculating important emissions from the trade, with their impact on the Objectives. In this study we have also discussed and suggested some indicators to illustrate
20
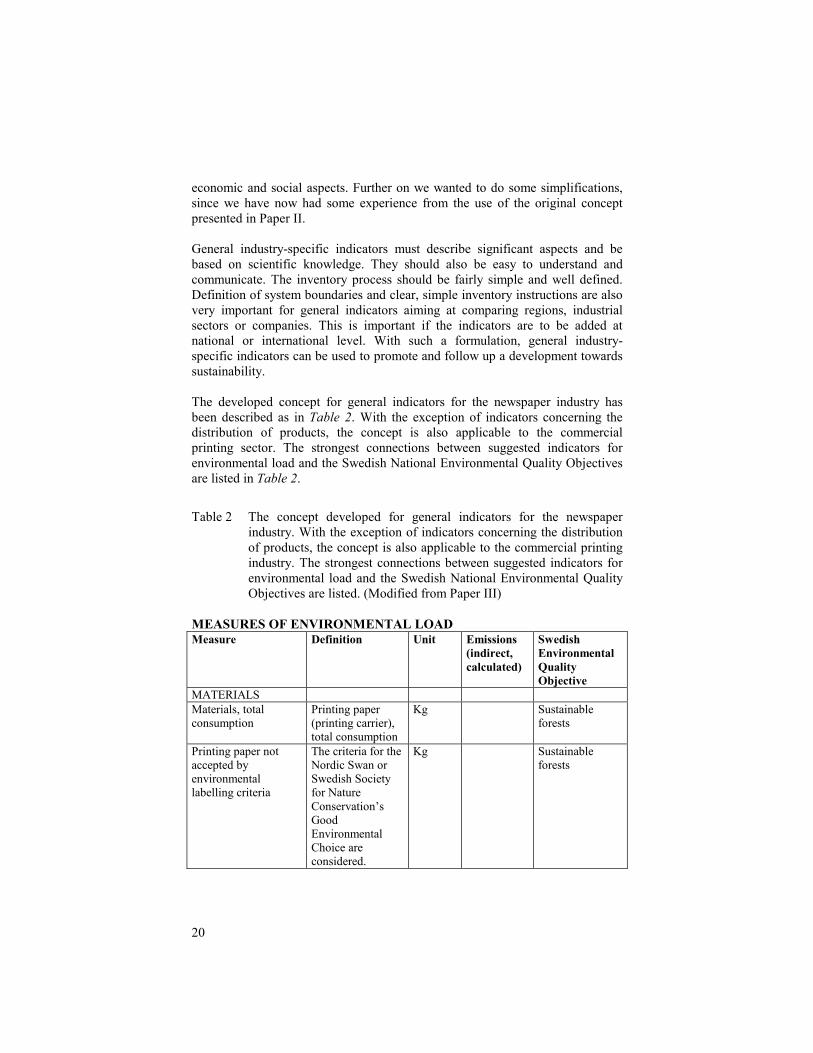
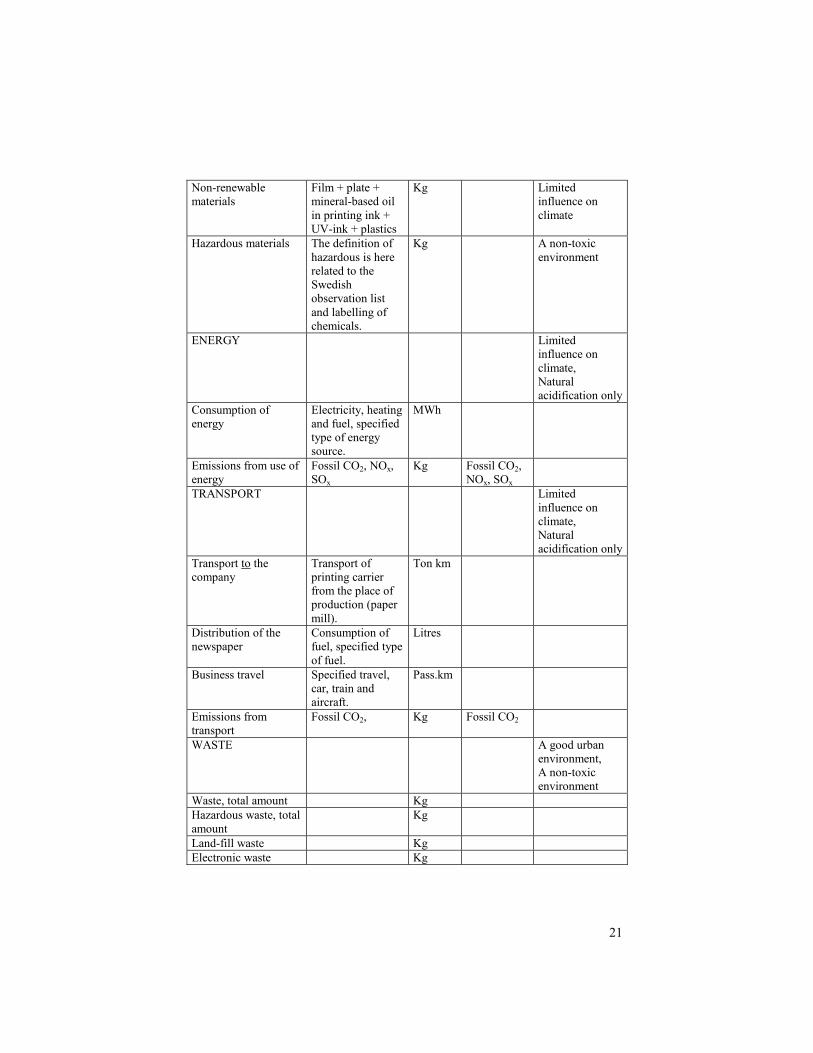
economic and social aspects. Further on we wanted to do some simplifications, since we have now had some experience from the use of the original concept presented in Paper II. General industry-specific indicators must describe significant aspects and be based on scientific knowledge. They should also be easy to understand and communicate. The inventory process should be fairly simple and well defined. Definition of system boundaries and clear, simple inventory instructions are also very important for general indicators aiming at comparing regions, industrial sectors or companies. This is important if the indicators are to be added at national or international level. With such a formulation, general industry-specific indicators can be used to promote and follow up a development towards sustainability. The developed concept for general indicators for the newspaper industry has been described as in Table 2. With the exception of indicators concerning the distribution of products, the concept is also applicable to the commercial printing sector. The strongest connections between suggested indicators for environmental load and the Swedish National Environmental Quality Objectives are listed in Table 2.
Table 2 The concept developed for general indicators for the newspaper industry. With the exception of indicators concerning the distribution of products, the concept is also applicable to the commercial printing industry. The strongest connections between suggested indicators for environmental load and the Swedish National Environmental Quality Objectives are listed. (Modified from Paper III)
MEASURES OF ENVIRONMENTAL LOAD Measure Definition Unit Emissions
(indirect, calculated)
Swedish Environmental Quality Objective
MATERIALS Materials, total consumption
Printing paper (printing carrier), total consumption
Kg Sustainable forests
Printing paper not accepted by environmental labelling criteria
The criteria for the Nordic Swan or Swedish Society for Nature Conservation’s Good Environmental Choice are considered.
Kg Sustainable forests
21
Non-renewable materials
Film + plate + mineral-based oil in printing ink + UV-ink + plastics
Kg Limited influence on climate
Hazardous materials The definition of hazardous is here related to the Swedish observation list and labelling of chemicals.
Kg A non-toxic environment
ENERGY Limited influence on climate, Natural acidification only
Consumption of energy
Electricity, heating and fuel, specified type of energy source.
MWh
Emissions from use of energy
Fossil CO2, NOx, SOx
Kg Fossil CO2, NOx, SOx
TRANSPORT Limited influence on climate, Natural acidification only
Transport to the company
Transport of printing carrier from the place of production (paper mill).
Ton km
Distribution of the newspaper
Consumption of fuel, specified type of fuel.
Litres
Business travel Specified travel, car, train and aircraft.
Pass.km
Emissions from transport
Fossil CO2, Kg Fossil CO2
WASTE A good urban environment, A non-toxic environment
Waste, total amount Kg Hazardous waste, total amount
Kg
Land-fill waste Kg Electronic waste Kg
22
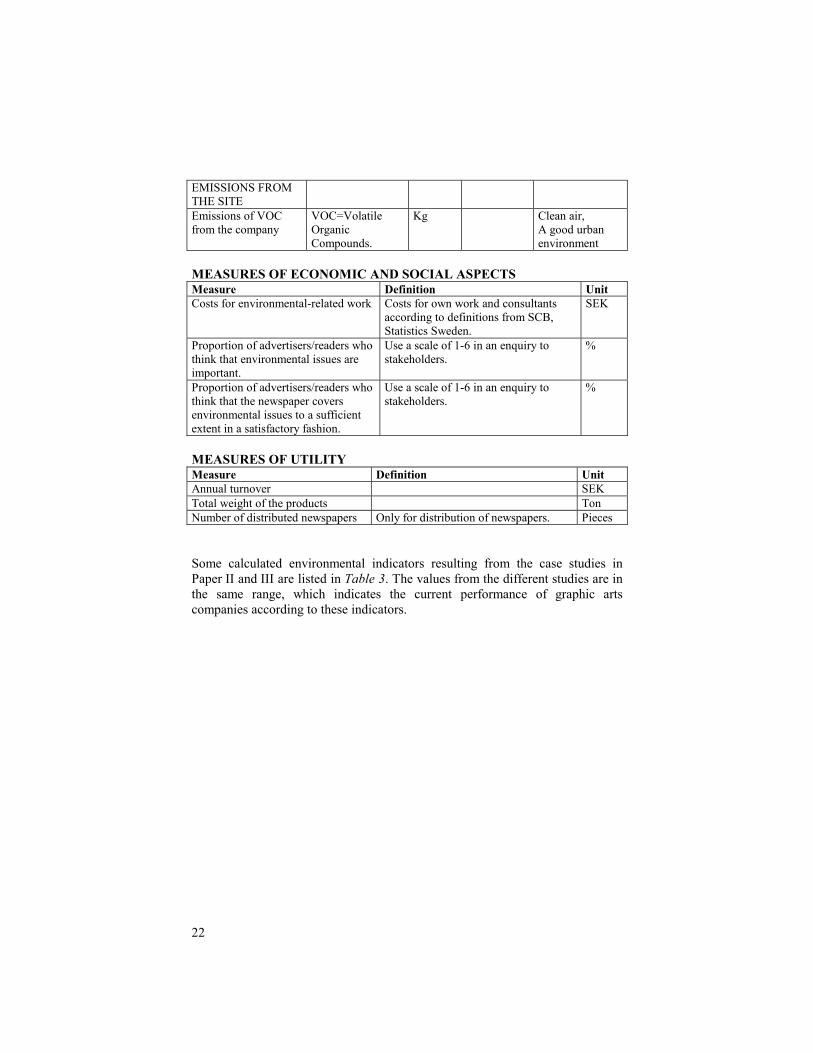
EMISSIONS FROM THE SITE
Emissions of VOC from the company
VOC=Volatile Organic Compounds.
Kg Clean air, A good urban environment
MEASURES OF ECONOMIC AND SOCIAL ASPECTS Measure Definition Unit Costs for environmental-related work Costs for own work and consultants
according to definitions from SCB, Statistics Sweden.
SEK
Proportion of advertisers/readers who think that environmental issues are important.
Use a scale of 1-6 in an enquiry to stakeholders.
%
Proportion of advertisers/readers who think that the newspaper coversenvironmental issues to a sufficient extent in a satisfactory fashion.
Use a scale of 1-6 in an enquiry to stakeholders.
%
MEASURES OF UTILITY Measure Definition Unit Annual turnover SEK Total weight of the products Ton Number of distributed newspapers Only for distribution of newspapers. Pieces Some calculated environmental indicators resulting from the case studies in Paper II and III are listed in Table 3. The values from the different studies are in the same range, which indicates the current performance of graphic arts companies according to these indicators.
23
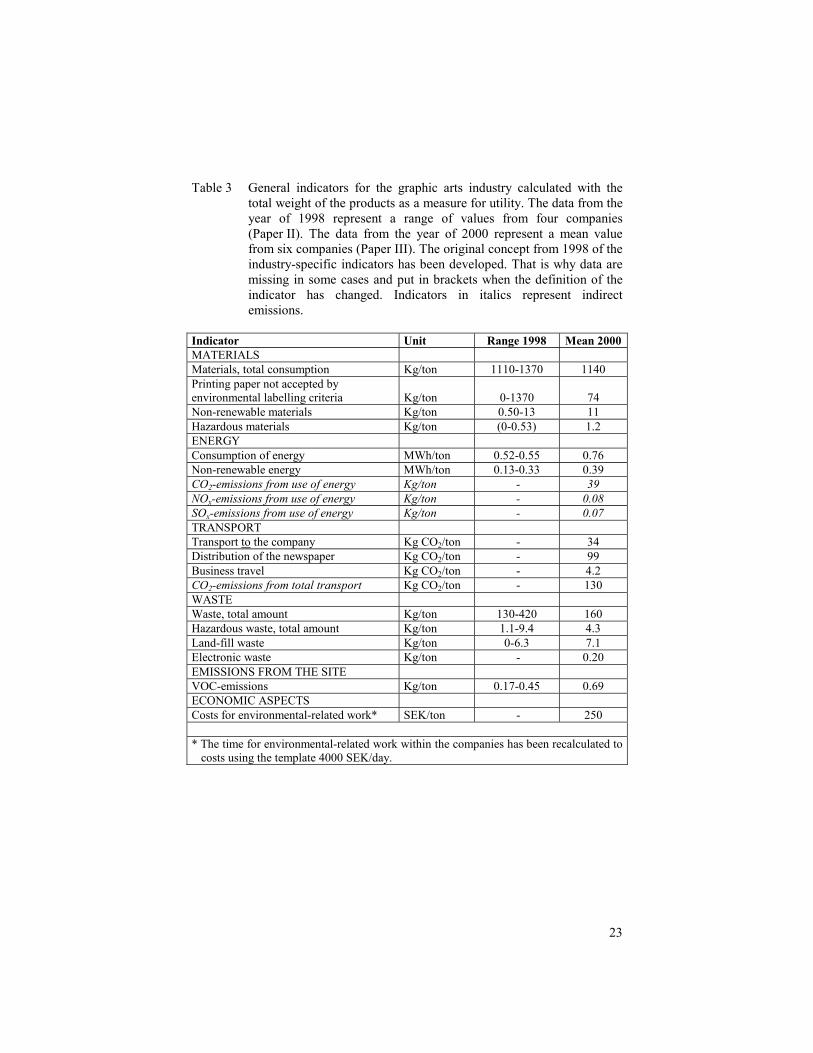
Table 3 General indicators for the graphic arts industry calculated with the total weight of the products as a measure for utility. The data from the year of 1998 represent a range of values from four companies (Paper II). The data from the year of 2000 represent a mean value from six companies (Paper III). The original concept from 1998 of the industry-specific indicators has been developed. That is why data are missing in some cases and put in brackets when the definition of the indicator has changed. Indicators in italics represent indirect emissions.
Indicator Unit Range 1998 Mean 2000 MATERIALS Materials, total consumption Kg/ton 1110-1370 1140 Printing paper not accepted by environmental labelling criteria Kg/ton 0-1370 74 Non-renewable materials Kg/ton 0.50-13 11 Hazardous materials Kg/ton (0-0.53) 1.2 ENERGY Consumption of energy MWh/ton 0.52-0.55 0.76 Non-renewable energy MWh/ton 0.13-0.33 0.39 CO2-emissions from use of energy Kg/ton - 39 NOx-emissions from use of energy Kg/ton - 0.08 SOx-emissions from use of energy Kg/ton - 0.07 TRANSPORT Transport to the company Kg CO2/ton - 34 Distribution of the newspaper Kg CO2/ton - 99 Business travel Kg CO2/ton - 4.2 CO2-emissions from total transport Kg CO2/ton - 130 WASTE Waste, total amount Kg/ton 130-420 160 Hazardous waste, total amount Kg/ton 1.1-9.4 4.3 Land-fill waste Kg/ton 0-6.3 7.1 Electronic waste Kg/ton - 0.20 EMISSIONS FROM THE SITE VOC-emissions Kg/ton 0.17-0.45 0.69 ECONOMIC ASPECTS Costs for environmental-related work* SEK/ton - 250
* The time for environmental-related work within the companies has been recalculated to
costs using the template 4000 SEK/day.
24
5.4 Design for environment (DfE) for printedproducts
Our research concerning design for environment (DfE) for printed products is presented in Paper IV. In this study we sent questionnaires to 780 companies and worked with four companies (three commercial printers and one advertising agency). The response frequency of questionnaires was 17% and showed that there was considerable interest in DfE within the industry. The development and testing of tools yielded the most significant results of the project, which can be summarised as follows: • Description and recommended working methods for DfE in graphic arts
companies. • Practical tools for applying DfE to printed products in the form of a manual
and a checklist. The checklist has been designed so that it will also serve as a simple tool for the environmental assessment of printed products.
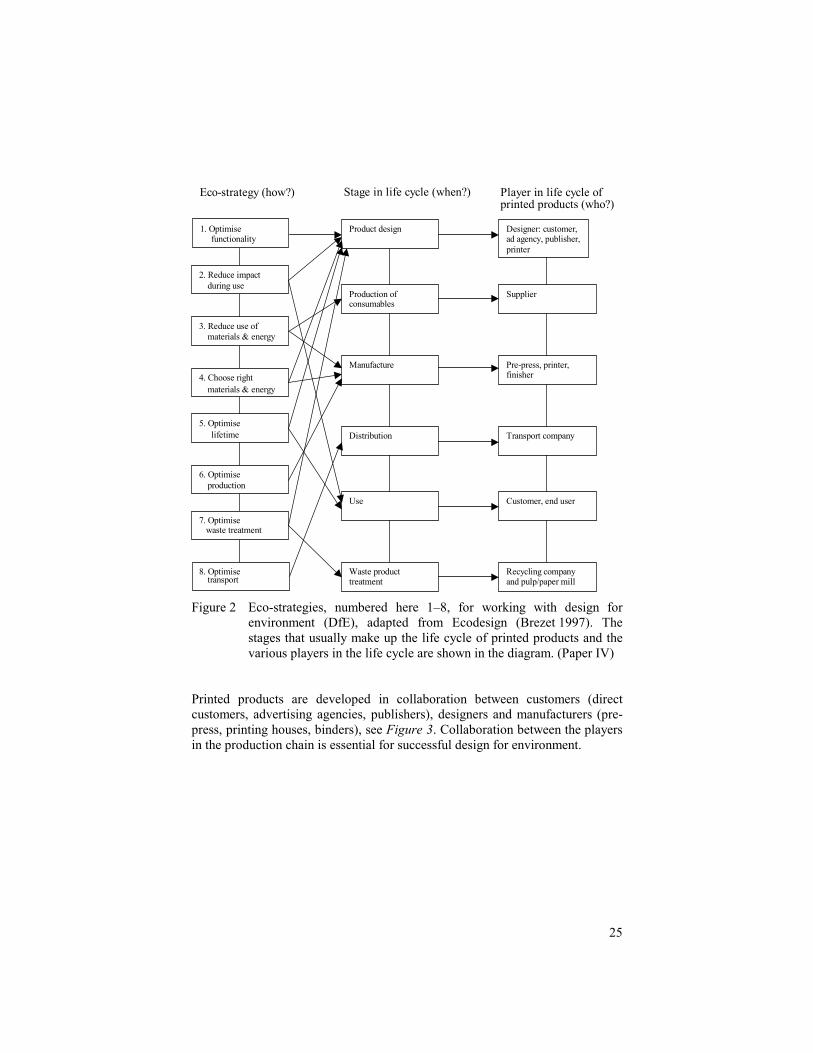
5.4.1Working methods for DfE for printed productsCertain general principles (eco-strategies) are commonly used (Brezet 1997) as a foundation for design for environment, see Figure 2 where they are listed. These eco-strategies can be regarded as rules of thumb for reducing the environmental impact of a product, for example “Optimise functionality” and “Reduce use of materials and energy”, and should be considered at every stage of the product life cycle, where possible, as illustrated by the arrows in Figure 2. The life cycle of printed products can be divided into various stages, such as “Product design” and “Production of consumables”, etc., in accordance with Figure 2. Various players affect different stages of the product life cycle.
25
2. Reduce impact
1. Optimise
3. Reduce use of materials & energy
7. Optimise waste treatment
4. Choose rightmaterials & energy
5. Optimise
lifetime
6. Optimise production
8. Optimise transport
Production of consumables
Product design
Manufacture
Distribution
Use
Waste producttreatment
Supplier
Designer: customer, ad agency, publisher, printer
Pre-press, printer, finisher
Transport company
Customer, end user
Recycling company and pulp/paper mill
Eco-strategy (how?) Stage in life cycle (when?)
functionality
during use
Player in life cycle of printed products (who?)
Figure 2 Eco-strategies, numbered here 1–8, for working with design for
environment (DfE), adapted from Ecodesign (Brezet 1997). The stages that usually make up the life cycle of printed products and the various players in the life cycle are shown in the diagram. (Paper IV)
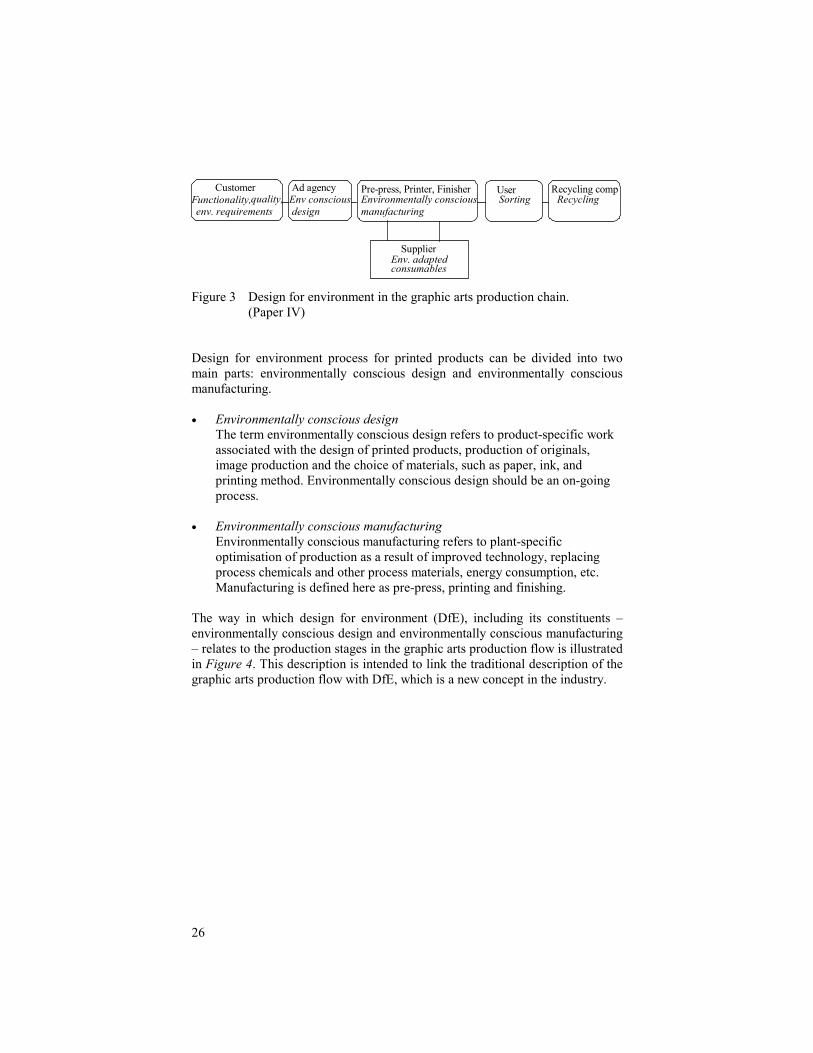
Printed products are developed in collaboration between customers (direct customers, advertising agencies, publishers), designers and manufacturers (pre-press, printing houses, binders), see Figure 3. Collaboration between the players in the production chain is essential for successful design for environment.
26
Pre-press, Printer, FinisherEnvironmentally conscious manufacturing
SupplierEnv. adaptedconsumables
CustomerFunctionality,quality, env. requirements
UserSorting
Recycling comp Recycling
Ad agency Env consciousdesign
Figure 3 Design for environment in the graphic arts production chain.
(Paper IV) Design for environment process for printed products can be divided into two main parts: environmentally conscious design and environmentally conscious manufacturing. • Environmentally conscious design
The term environmentally conscious design refers to product-specific work associated with the design of printed products, production of originals, image production and the choice of materials, such as paper, ink, and printing method. Environmentally conscious design should be an on-going process.
• Environmentally conscious manufacturing Environmentally conscious manufacturing refers to plant-specific optimisation of production as a result of improved technology, replacing process chemicals and other process materials, energy consumption, etc. Manufacturing is defined here as pre-press, printing and finishing.
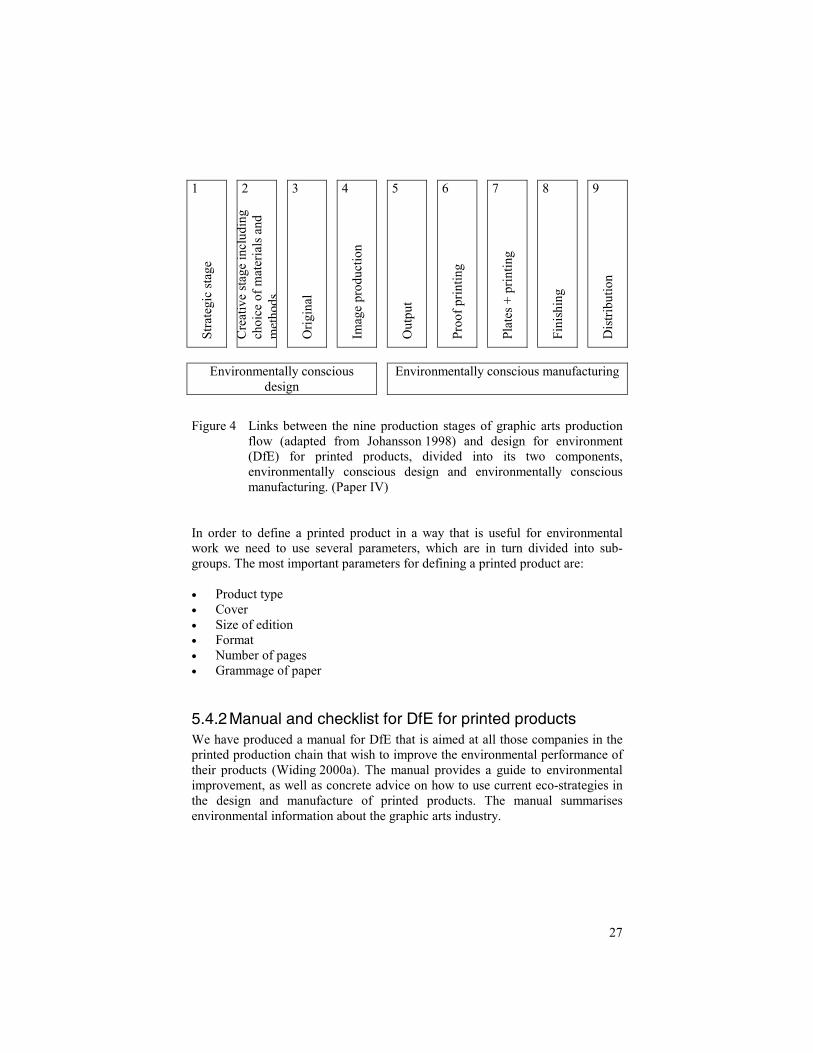
The way in which design for environment (DfE), including its constituents – environmentally conscious design and environmentally conscious manufacturing – relates to the production stages in the graphic arts production flow is illustrated in Figure 4. This description is intended to link the traditional description of the graphic arts production flow with DfE, which is a new concept in the industry.
27
1 2 3 4 5 6 7 8 9 St
rate
gic
stag
e
Cre
ativ
e st
age
incl
udin
g ch
oice
of m
ater
ials
and
m
etho
ds O
rigin
al
Imag
e pr
oduc
tion
Out
put
Proo
f prin
ting
Plat
es +
prin
ting
Fini
shin
g
Dis
tribu
tion
Environmentally conscious
design Environmentally conscious manufacturing
Figure 4 Links between the nine production stages of graphic arts production flow (adapted from Johansson 1998) and design for environment (DfE) for printed products, divided into its two components, environmentally conscious design and environmentally conscious manufacturing. (Paper IV)
In order to define a printed product in a way that is useful for environmental work we need to use several parameters, which are in turn divided into sub-groups. The most important parameters for defining a printed product are: • Product type • Cover • Size of edition • Format • Number of pages • Grammage of paper
5.4.2Manual and checklist for DfE for printed productsWe have produced a manual for DfE that is aimed at all those companies in the printed production chain that wish to improve the environmental performance of their products (Widing 2000a). The manual provides a guide to environmental improvement, as well as concrete advice on how to use current eco-strategies in the design and manufacture of printed products. The manual summarises environmental information about the graphic arts industry.
28
On the basis of this manual we have produced a checklist that gives guidance on the product design decisions that are most critical in environmental terms. The checklist is presented as an appendix to the manual and to Paper IV. It is intended for use when designing each new printed product, i.e. effectively for each order. In addition to a product specification, the checklist contains a guide to reducing environmental impact when designing a paper-based printed product, with regard to the following areas. This is primarily limited to the environmental aspects that are relevant to printed products: • Production circumstances • Printing paper • Printing ink • Finishing • Transport (courier) • Transport (delivery)
5.4.3Tool for environmental assessmentIt is desirable to have a simple method that permits assessment and simulation of the types of environmental impact that result from the various alternatives in the design and manufacture of printed products. It is similarly important to measure and monitor the way the environmental impact of products changes as the result of product development work. Following experience from the detailed inventories, the project companies reported that a very simple tool would be required to carry out environmental assessments of printed products for the on-going task of DfE, which is why we designed the checklist so that it can be used for environmental assessment and monitoring. The various choices in the checklist (type of paper, ink, adhesive, etc.) have been visually linked to various degrees of environmental impact by using “sad faces” (�). The fewer “sad faces” against an alternative, the better it is from the environmental viewpoint. The reason why environmental impact has been scored using “sad faces” instead of using numbers is that it is difficult to determine with absolute certainty what environmental impact a given alternative represents. The results of the completed checklists can be compiled and used to assess and monitor the way that the environmental impact of printed products changes as a result of DfE. We have used some basic assessment principles for the advice given in the manual and the checklist that are described in the Swedish Environmental Code; the resource management and eco-cyclic principles in addition to the product choice principle (SFS 1998:808). To assist in assessing the environmental

29
impact of graphic arts products we have used the results of earlier studies mentioned (see 5.1). In addition to this BAT reports have been used (Best Available Techniques) for the graphic arts industry (Brodin 1999, Fleck 1999, GMR 2000, Silfverberg 1998).

31
6 Discussion and conclusions
6.1 Discussion
6.1.1About methodsAction research is associated with some difficulties; it is time consuming and expensive. There are also other complications, for example, there are many factors not included in the study that still influence the result. In action research there are also problems, which are often referred to when qualitative research is reviewed, e.g. the alternation between a close familiarity and a critical overview. The researcher must primarily be loyal to knowledge and be able to do a critical analysis. It can be difficult to cope with both practical issues and research problems, which has been experienced in this research. In addition, it is a challenge to balance between the demand of reaching general research results at the same time as participating companies wish to gain immediate practical results. Action research is sometimes understood as if the researchers are dealing with applications. The purpose is however that the researchers are using the action to attain a certain type of knowledge. Therefore it is not easy to separate research from other activities. The differences between scientific knowledge and practical knowledge are more or less reduced in action research and case studies. Concerning the techniques that we have chosen to gather data it is important to be aware that questionnaires and structured interviews (as opposed to in-depth interviews) often reflect preconceived ideas (Wallén 1996). It is also important to bear in mind that the answers are dependent on the kind of person at the company who is answering questionnaires or being interviewed. In the EMS study (Paper I) we interviewed principally the environmental officers or environmental co-ordinators of the companies, which could have given a too positive result from an environmental point of view. Furthermore care should be taken when drawing general conclusions based on observations on-site from individual case studies. When qualitative data are categorised or assigned to different categories it is difficult to delimit and classify a particular phenomenon to the right category. It is possible to do some statistical analysis based on data in the form of values for the number of cases. In the EMS study (Paper I) some of the statistical data analysis, based first and foremost on the interviews, can be questioned from a scientific point of view.
32
Case studies of four to six companies do not constitute a sufficient scientific base to assign figures to the recommended indicators (Papers II and III). The main purpose of the case studies however was to formulate how environmentally significant aspects could be identified, invented and calculated so as to provide indicators for a typical company in the graphic arts industry.
6.1.2About the resultsEnvironmental management systems (EMS) Our study of environmental systems (EMS) (Paper I) was based on the assumption that it is possible to create the right conditions for developing and streamlining environmental management work by applying experience gained so far from practical environmental management work. Compiling and disseminating experience provides companies with the right conditions for optimising their efforts, whether they have already made relatively good progress with their environmental work or whether they have yet to begin. One of the restricting factors in the EMS study is that there are now almost six times the numbers of environmentally certified companies in Sweden (2110 companies) as when our survey began (Challennium Information 2001). Strictly speaking therefore, the inference applies only to the 360 companies that were environmentally certified in autumn 1998. Furthermore, since this was an early study of certified EMS, most of the systems included in the study had only recently been implemented. Environmental indicators The development of general environmental indicators for the graphic arts industry has been limited to the printing methods of lithographic offset and flexography (Papers II and III). The indicators formulated, as well as the tools for design for environment (DfE), are nevertheless applicable also to other printing methods such as e.g. digital printing. Our studies of indicators (Papers II and III) have focused on one of the types of indicator defined by ISO 14031, viz.: operational performance indicators (OPIs). This means mainly that indicators which provide information about company operations are included. Factors such as the level of education, the involvement of management, and environmental conditions in the surroundings, are not taken into account to a large extent. A literature survey (Paper III) indicates that business specific indicators for the printing industry, developed in common projects, are uncommon and have only been used to a limited degree. The survey also shows that indicators for all aspects of sustainability, especially for social aspects, are not yet well developed or used. This is not only valid for the printing industry. We have made a limited
33
number of suggestions for economic and social indicators in our concept because there are problems with finding indicators with general definitions in these areas (Paper III). When it comes to social aspects, customer relationships are important for companies. For newspaper companies the ability to inform, educate and generate opinion in favour of environmental issues is of interest, but has to be balanced with the "code of honour" to be objective. We have also had a firm intention to connect the development of the industry-specific concept of indicators for the printing industry to the Swedish National Environmental Quality Objectives. The use of indicators always assumes a defined method for inventorying and calculation, if a comparison is to be made between different years in one company or between different companies. If the recommended industry-specific indicators are used, a method for inventorying and the manner of calculation is also defined (Widing 1999, 2001). An important factor in the selection of general measures has been the need to make the inventory work reasonably well for companies which want to use the recommended general indicators in the future. It should not be necessary to invent all details in order to calculate the general indicators. For companies within the graphic arts industry “the information value” would be desirable as a measure of the value of a company (utility in Papers II and III), but it is not yet possible to measure this parameter. Financial measures can be advantageous since they also contain a valuation of the activities and products of companies, that what is demanded is paid for. The disadvantages of financial measures are that factors such as interest rates and the price of shares etc. have an influence on turnover and added value. It is possible to use measures related to products as long as the products are physical and not different types of services. It is however important that the total amount of the production is demanded. In this type of measure, there is no indication of whether or not there is overproduction that is not utilised. Since these types of measures of utility obviously complement each other, we have recommended one measure of each type. One main use of the recommended general indicators is for the internal follow-up of the environmental work. An important target group for the indicators is then obviously the company management. One great advantage of the indicators is probably that they provide a reference to enable companies to show improvements in their environmental performance compared to earlier years. Companies within the graphic arts industry can also use the general environmental indicators as a guideline for identifying the significant aspects of their activities. Furthermore the general indicators can be used for external information. They provide an opportunity for communicating the environmental performance in a general way. At present, the assumed target groups for the
34
information are mainly customers and professional purchasers. Professional purchasers often ask for a lot of information sometimes gathered in extended questionnaires. If the graphic arts company as a supplier already has a prepared set of indicators which are environmentally relevant for its activities, it will make the work more efficient for all parties. Design for environment (DfE) The development of DfE tools has been limited to the consideration of printed products. Developments in the industry and the growing desire and demand among customers for complementary media products mean however that electronic media are also of interest. Whatever the industry, DfE often reveals major potential in entirely new product concepts, which makes different types of media attractive for different purposes and target audiences. Efforts are already being made to examine these wide-ranging issues within the framework of another project (Widing 2000b). A further limitation to this study that should be mentioned is that DfE-efforts have focused on reducing the environmental impact of products, rather than improving the benefits of products. Graphic arts companies, with the exception of certain newspaper companies, do not normally carry out product development in the traditional sense of developing new/modified products that are then mass-produced. In the case of printed products, product development instead involves a continuous process of improvement. Each new order effectively results in a new variant of the product. Development work therefore takes place on an on-going basis between the customer/advertising agency and the printing houses, which imposes special demands on industry-specific tools for DfE. The best opportunity to influence the overall environmental impact of printed products is together with the customer and designer. The numbers of products produced by a graphic arts company are far too large per unit time to permit quantification of the flow of resources and materials during on-going DfE work. The companies themselves prefer tools that are quick and simple to use. Industry-specific tools receive an enthusiastic response and are essential to achieve satisfactory results from DfE work in small and medium-sized enterprises.
35
6.2 ConclusionsGeneral Deliberate, strategic environmental work within companies is often started and run within the framework of an environmental management system (EMS). The driving force behind a certified EMS is mostly demands from customers, owners or other stakeholders. This is indirectly an economic driving force. An EMS that is certified by an external party requires continual improvement in the company's environmental performance. We have observed that companies which invent and follow-up their environmental objectives and targets in a structured way with the help of environmental indicators seem to attain better environmental performance than others. With quantitative data and fundamental knowledge of their own activities there is good possibilities to manage the environmental work in a proactive way. Furthermore, if the companies that work with certified EMS are to be able to meet the demand of continual improvement in their environmental performance, they have to put more focus on the products (goods and services). For the graphic arts companies, as for most companies that manufacture goods or supply services, the greatest environmental impact and therefore the most important significant environmental aspect is often due to the products themselves. Working methods and tools for eco-efficiency in the graphic arts industry should be industry-specific, with environmental information and knowledge of the current production circumstances and products, tailored to small and medium-sized enterprises (SME) and simple in the sense of being easy to use although valuable assistance based on scientific environmental data is still given. Through our research we wanted to provide the graphic arts industry with reliable tools for environmental work. The tools can be used regardless of whether or not an environmental management system is in operation. Gaining general approval for and spreading our results widely within the graphic arts industry is hard work. We have started the process to obtain acceptance for the neutral, reliable way of describing and communicating the environmental impact of the companies and the tools for DfE. So far we have been most successful within the newspaper industry. The aim of our research has been to raise the level of knowledge amongst researchers and the participant companies and the rest of the sector, and to develop tools which were easy to use so that the limited time companies have available can be used efficiently from an environmental point of view.
36
In addition to the developed industry-specific tools for environmental work in the graphic arts industry, our qualitative research has contributed to an improved understanding of the companies' situation and their need of tools for environmental work. The research has widened our own and the participating companies' knowledge and experience of environmental aspects related to the graphic arts industry. In many cases the research has confirmed what we already knew or thought that we knew. Indicators The most significant result of our research on environmental indicators can be summarised as follows: • Recommendation of general industry-specific indicators with a defined
method for standardised inventorying and calculation. This will make it possible to follow up and manage the internal environmental work and to show and communicate environmental improvements both internally and externally.
Companies within the printing industry have a need to communicate the results of their environmental work and an ability to show continual improvements. The driving forces are to a great extent customer demands and the requirements of certified environmental management systems. There is also a wish to be able to show and communicate the connection between the environmental aspects of the industry and the Swedish Environmental Quality Objectives or the major environmental threats. Due to the awareness of environmental issues within the industry and their customers, graphic arts companies are positive to benchmarking if the right prerequisites are given. The work on indicators should contribute to a decrease of the environmental impact from the graphic arts industry. To make it possible to follow the change of the environmental impact over time from the graphic arts industry in general, there is a need for a fairly extensive collection of environmental data on general indicators. This would also make it possible for companies to make comparisons against mean value and “best in class” value for the different indicators, in order to improve their own situation. To reach the overall objectives for society according to governmental assignations for sustainable development there is need of a "bottom-up" perspective. Specific trades of business should develop their general indicators and general targets for the trade. This would make environmental work more proactive within the whole industry, and would make it easier for small companies that have difficulties in making extensive environmental inquiries on their own.
37
Design for environment (DfE) The most significant results of our research on DfE can be summarised as follows: • Description and recommended working methods for DfE in graphic arts
companies. • Practical tools for applying DfE to printed products in the form of a manual
and a checklist. The checklist has been designed so that it will also serve as a simple tool for the environmental assessment of printed products.
Further DfE development work that is of interest to the graphic arts industry includes: • Regular reviews and updates of the advice given in the tools that have been
developed. This is necessary because opinions about relative environmental impact are changing as new knowledge is acquired and new consumables and technical solutions are launched. This is not only valid for the tools for DfE but also the industry-specific environmental indicators to some extent.
• Relating DfE for printed products to DfE for electronic information products which are developing rapidly and becoming increasingly widely used.
• Developing ways of inventorying and quantifying the “benefit” of various types of information products.
• Linking DfE to business development and functionality sales. It is the general opinion of the project companies that an essential requirement for the development of DfE work within companies is that it should be seen as offering a strong competitive edge. Although this may not yet be quite true, the graphic arts industry is heading in this direction. If the tools for DfE are able to create the conditions or make work on guiding customers to improve their printed products from an environmental point of view, this will be an extension of business for the graphic arts industry, which can contribute to a strengthened competitive edge.

39
7 ReferencesAndersson, M., et al. Miljöledning i grafiska företag. IMT. 1998. Axel Springer Verlag, et al. LCA Graphic Paper and Print Products. 1998. Brezet, J.C., C. Van Hemel. Ecodesign. A promising approach to sustainable
production and consumption. United Nations Publication. ISBN 92-807-1631-X. UNEP. 1997.
Brodin, L., J. Korostenski. Bästa tillgängliga teknik i grafiska branschen (BAT). Vägledning och praktisk tillämpning. Intergraf, Grafiska Miljörådet. GFF. 1999.
Brundtland, G.H., et al. Our Common Future. The Brundtland Commission, The World Commission on Environment and Development, United Nations. 1987.
Cadra, M.. Development of Operational Environmental Performance Indicators for the Lithographic Printing Process: Sheet-fed Offset. Master Thesis. IIIEE. Lund University. 1998.
Carlsson Reich, M., et al. Sustainability Indicators - a survey and assessment of current indicator frameworks. IVL Report A20357. 2001.
Challennium Information. Aktuell statistik uppdaterad 7 november 2001. http://www.environ-cert.com/sweden/statistik/aktuell.htm. 2001.
Cook, K.. Developing BAT Based EPIs for Europe's VOC Emitting SMEs. Master Thesis. IIIEE. Lund University. 1997.
Dalhielm, U., et al. Miljöprofilering – livscykelanalyser av grafiska produkter. IMT Teknikrapport nr 4/95. 1995.
Drivsholm, T., et al. Miljøeffekter og ressourceforbrug for 3 grafiske produkter i et livscyklusperspektiv. Miljøprojekt nr 341. Miljø- och Energiministeriet. Miljøstyrelsen. 1997.
Enroth, M., et al. Miljöanpassad produktutveckling inom den grafiska mediebranschen - förutsättningar och intresse. IMT Teknikrapport nr 2/98. 1998.
Fleck, W., et al. Printing and the Environment. Guidance on Best Available Techniques (BAT) in Printing Industries. Intergraf/EGF. 1999.
GA. Grafisk Arbejdsgiverforening. Nøgletalsprojekt, Arbejdsrapport. 1999. GFF. Grafiska företag i mediebranschen - vad gör vi nu? En analys av
stategiska möjligheter. Grafiska företagens service AB. 1999. GMR. The environmental council of the Swedish printing industries, et al.
Recycling of printed products. What can the printing industry do to make it easier? 2000.
GRI. Global Reporting Initiative. Sustainability Reporting Guidelines on Economic, Environmental and Social Performance. www.globalreporting.org. 2000.
IIIEE. http://www.lu.se/IIIEE/projects/ctpi/intermediate_results.html. 2001 ISO/PDTR 14062.4. Environmental management - Integrating environmental
aspects into product design and development. ISO 2001.
40
ISO 14001:1996. Environmental management systems - Specification with guidance for use. ISO 1996.
Johansson, K., et al. Grafisk kokbok. Guiden till grafisk produktion. Kapero Grafisk Utveckling. 1998.
Lindberg, S.. The Swedish Newspaper Publishers Association. Personal communication. 2001.
Merriam, S.B.. Fallstudien som forskningsmetod. Studentlitteratur. 1994. Naturvårdsverket. Fifteen. Sweden's objectives for environmental quality - the
responsibility of our generation. NV 9981-7. 2000. Rosengren, H.. The Swedish Graphic Companies Federation. Personal
communication. 2001. SFS 1998:808. Miljöbalken. 1998. Silfverberg, E., et al. Best available techniques (BAT) for the printing industry.
Nordic Council of Ministers. Tema Nord 1998:593. 1998. SIS Ecolabelling. Nordic Ecolabelling. Ecolabelling of Printed Matter. Criteria
document 15 June 1998-14 March 2002. The Nordic Council of Ministers. 1999.
SIS Miljömärkning. Miljömärkt. Magasin från SIS Miljömärkning AB. Nr 3/01. 2001.
SPRU. http://www.sussex.ac.uk/spru/environment/research/mepi.html. 2001. Virtanen, J., M. Jäntti. Tryckningsprocessernas miljöpåverkan. VTT. 1995. Wallén, G.. Vetenskapsteori och forskningsmetodik. Studentlitteratur. 1996. Widing, A., et al. Miljönyckeltal för den grafiska mediebranschen. IMT
Teknikrapport nr 6/99. 1999. Widing, A., M. Enroth. Handbok för miljöanpassad produktutveckling (MPU)
av trycksaker. Framkom. 2000a. Widing, A. et al. Miljöanpassad produktutveckling inom
kommunikationsindustrin. Framkom Rapport 2000:11. 2000b. Widing, A., M. Enroth. Miljönyckeltal för tidningsföretag. Handbok för
beräkning och användning. Industriforskning i samverkan. Framkom. 2001.
WBCSB, World Business Coucil for Sustainable Development. Measuring eco-efficiency. A guide to reporting company performance. ISBN 2-940240-14-0. www.wbcsd.org. 2000.
Zackrisson, M., M. Enroth, A. Widing. Miljöledningssystem - papperstiger eller kraftfullt verktyg. IMT Projektrapport nr 92. 1999.

41
Included papers


43
Paper I
Paper II
Paper III
Paper IV

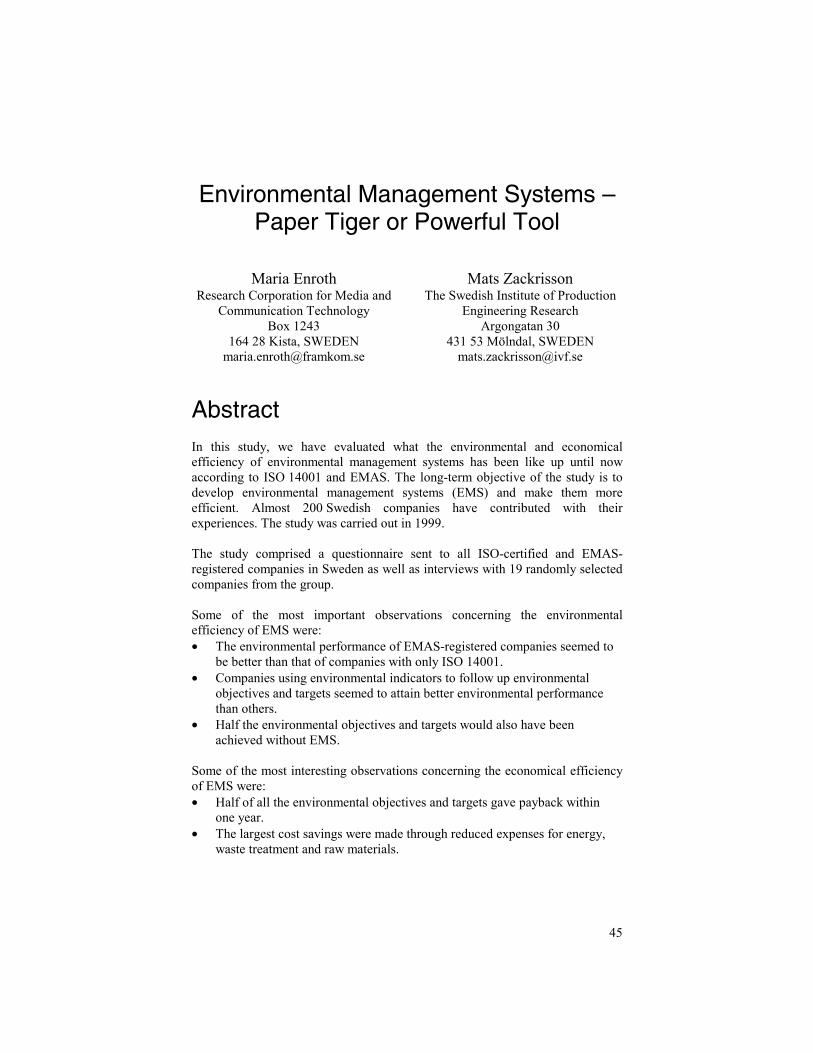
45
Environmental Management Systems –Paper Tiger or Powerful Tool
Maria Enroth
Research Corporation for Media and Communication Technology
Box 1243 164 28 Kista, SWEDEN
Mats Zackrisson
The Swedish Institute of Production Engineering Research
Argongatan 30 431 53 Mölndal, SWEDEN
AbstractIn this study, we have evaluated what the environmental and economical efficiency of environmental management systems has been like up until now according to ISO 14001 and EMAS. The long-term objective of the study is to develop environmental management systems (EMS) and make them more efficient. Almost 200 Swedish companies have contributed with their experiences. The study was carried out in 1999. The study comprised a questionnaire sent to all ISO-certified and EMAS-registered companies in Sweden as well as interviews with 19 randomly selected companies from the group. Some of the most important observations concerning the environmental efficiency of EMS were: • The environmental performance of EMAS-registered companies seemed to
be better than that of companies with only ISO 14001. • Companies using environmental indicators to follow up environmental
objectives and targets seemed to attain better environmental performance than others.
• Half the environmental objectives and targets would also have been achieved without EMS.
Some of the most interesting observations concerning the economical efficiency of EMS were: • Half of all the environmental objectives and targets gave payback within
one year. • The largest cost savings were made through reduced expenses for energy,
waste treatment and raw materials.
46
• Most of the companies thought that their position on the market had been strengthened thanks to EMS. 1/3 of the companies also showed increasing revenue.
The following should be given priority in the initial stage to make EMS more efficient: • Clarify the identification process and assessment of environmental aspects. • Streamline and co-ordinate different management systems. • Improve the follow-up of the environmental work. • Link EMS to product design and put more focus on the use and disposal
phase of manufactured products.
IntroductionOur study was based on the assumption that it is possible to create the right conditions for developing and streamlining environmental management work by applying experience gained so far from practical environmental management work. Compiling and disseminating experience provides companies with the right conditions for optimising their efforts, whether they have already made relatively good progress with their environmental work or whether they have yet to begin. If the environmental efficiency of environmental management systems is to make headway, it is essential to identify and give priority to the correct significant environmental aspects. This will enable the companies to focus their resources on the areas, which give the maximum environmental benefit in relation to the economical input. ISO 14001 and EMAS can be seen as two systems with a common basis. Even so, there are certain differences. The greatest difference is that according to EMAS, companies have to produce an official, assessed environmental statement. EMAS also has more explicit demands as regards the preliminary environmental review. Some prevoius Swedish studies have shed light on environmentally related, financial and strategic consequences of environmental management systems. These have considered environmental management systems to be worthwhile from an environmental point of view, but it has been difficult to determine whether the systems also give any financial payback. This is due in part to the companies’ unsatisfactory environmental accounting methods (Elfors 1998, Nordström 1998). Nevertheless, in the opinion of supervisory authorities, progress has been made in the quality of companies’ reports since EMAS was introduced (Norström 1997). Apart from specific studies of environmentally certified companies in Sweden, more extensive studies have also been conducted
47
on the development of environmental work by the business community in general. (Heidenmark 1999, Kretsloppsdelegationen 1998, Strannegård 1998).
MethodsOur aim has been to provide answers principally to the following questions: 1. Do companies give priority in their work to environmental aspects that have
a major impact on the environment? 2. What actual environmental improvements have the environmental
management systems achieved? 3. What are the costs involved with environmental management system work?
Has it been possible to make any financial savings? The study is based on the experience of the 360 Swedish companies that had certified environmental management systems in accordance with ISO 14001 or EMAS in November 1998. The work included a questionnaire sent to all the certified companies, interviews with 19 randomly-selected companies, as well as some background literature. Most of the certified companies have between 20 and 500 employees. This differs from the size distribution of all Swedish companies where companies with less than 20 employees dominate. Predominant enterprises among the environmentally-certified Swedish companies are manufacturing industries, agency and wholesale trading, as well as pulp and paper industries. Before evaluating the results of the questionnaire and selecting companies for interviews, the 360 companies were divided into two main groups: industry and service/trade. The companies we interviewed were selected at random. A representative distribution was sought between the two main groups and between small-sized (<100 employees) and large (>100 employees) companies within each group. We interviewed the environmental officers or environmental co-ordinators of the companies and interviews lasted from 2 to 5 hours. The interviews were documented in consultation with each company. In order to analyse the information from these interviews, we translated it into some 40 parameters. It was not easy to translate all of the information into parameters in a satisfactory way so some questions were analysed in a more qualitative way. Table 1 gives examples of the defined parameters. Various statistical methods have also been used. A regression analysis has been applied to study the correlation between two continuous parameters. An F-value below 0.05 here gives about a 95% confidence level that the model is correct. This is described though as there being a statistically validated correlation.
48
When a continuous parameter has been compared between two groups, e.g. EMAS-registered and non EMAS-registered companies, a two-sided t-test for different variances has been carried out. A p-value below 0.05 here gives a 95% confidence level about the difference between the average values for the two groups. This is described though as there being a statistically validated difference between the average values. The statistical methods used assume that data has a normal distribution for the entire group to which the study applies, i.e. all (or the defined groups of) environmentally-certified Swedish companies. This is not certain, but it seems more likely than not that data would have a normal distribution. The objective with the questionnaire and the interviews was to collect statistically representative material so that valid inferences for all environmentally-certified companies in Sweden could be made. The following are some of the restricting factors in the study: • As we now compile this report, there is almost three times the number of
environmentally-certified companies in Sweden as when our survey began. Strictly speaking therefore, the inferences apply only for the 360 companies or so that were environmentally certified in autumn 1998.
• Strictly speaking, the questionnaire represents the half of the companies that responded. However, here we have made the assumption that these answers are representative for the entire group.
• The greatest limiting factor with the interviews is the relatively small number of companies interviewed.
Table 1 A selection of data parameters that were used to analyse the results of the interviews.
Parameter Unit Comments 1. Errors in
identification I-Errors/No Describes whether serious mistakes have been made
in the identification of environmental aspects. In this study, the criterion for ‘serious’ is that the environmental aspect has both a major environmental impact and a considerable effect on the financial outcome, as well as that the company agrees that a mistake has been made.
2. Errors in environmen-tal assess-ment
EA-errors/No Describes whether serious mistakes have been made in the assessment of environmental aspects. In this study, the criterion for ‘serious’ is that the environmental aspect has both a major environmental impact and a considerable effect on the financial outcome, as well as that the company agrees that a mistake has been made.
49
Parameter Unit Comments 3. Target area
production % related to the plant and upstream
Describes the percentage of the stated targets that affect the company’s own production and the sub-contractors’ production.
4. Target area transport
% related to goods transport, business trips, travel to/from work
Describes the percentage of the stated targets that affect different types of transport.
5. Target area product
% related to the product use or disposal phase
Describes the percentage of the stated targets that affect the environmental impact of the company’s own product or service during the use or disposal phase.
6. Target attack method
% source reduction
Describes the percentage of the stated targets that try to reduce the source of the problem’s origin, e.g. by reducing consumption, recycling, etc. The opposite is end-of-pipe solutions, e.g. chimneys and waste recycling.
7. Target payback
% of targets with maximum one year’s payback
Describes the percentage of the revenues and/or savings for the stated targets that exceed or is expected to exceed expenses after just one year. If revenues in relation to expenses are expected to be large, it is assumed that payback time is less than one year.
8. Target payback cause
% of one year’s payback that is only due to revenue increase
Explains why payback, according to the above, is achieved after just one year. The percentage indicates targets with one year’s payback, according to the above, due to increased revenue alone.
9. Target follow-up
% relative measures
Tries to give a quality rating for the follow-up of environmental targets by giving a mean average for all stated targets according to the following: 100% = measure related to something relevant, e.g. production size. Relation to years has only been accepted when this is considered relevant. 50% = non-related measure, e.g. the number of chemical products. 0 % = only verification of that measures/activities have been carried out. No value has been calculated for companies having less than 3 targets.
10.Target results physical
To what extent has emission or resource reduction been achieved: 0%=no physical set targets, 50%= physical set targets,
Gives one quality rating for the results of the environmental target work by explaining to what extent emission or resource reduction has been achieved. Targets such as ”introduce a waste sorting system", that have been reached but where there is no quantitative target, are considered to be 50%. An ambitious target that has been partly reached is considered to be 90%. No value has been calculated for companies having less than 3 targets. Note that
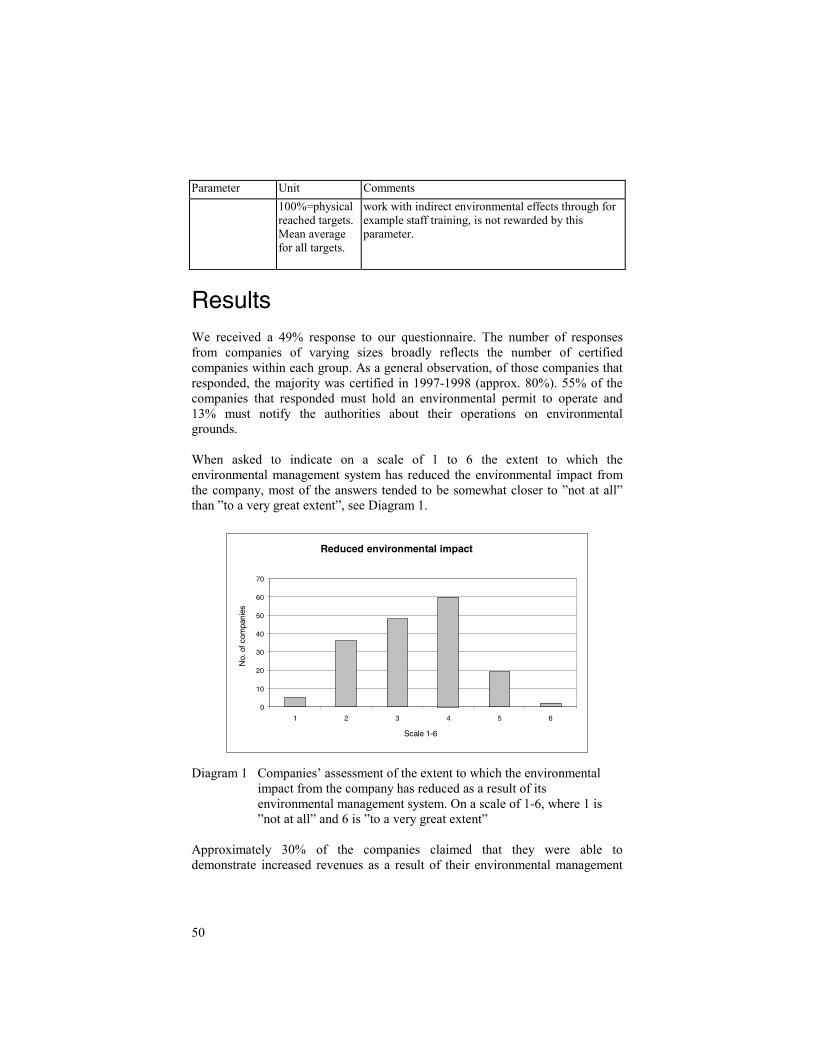
50
Parameter Unit Comments 100%=physical reached targets. Mean average for all targets.
work with indirect environmental effects through for example staff training, is not rewarded by this parameter.
ResultsWe received a 49% response to our questionnaire. The number of responses from companies of varying sizes broadly reflects the number of certified companies within each group. As a general observation, of those companies that responded, the majority was certified in 1997-1998 (approx. 80%). 55% of the companies that responded must hold an environmental permit to operate and 13% must notify the authorities about their operations on environmental grounds. When asked to indicate on a scale of 1 to 6 the extent to which the environmental management system has reduced the environmental impact from the company, most of the answers tended to be somewhat closer to ”not at all” than ”to a very great extent”, see Diagram 1.
Reduced environmental impact
0 10 20 30 40 50 60 70
1 2 3 4 5 6
Scale 1-6
No.
ofco
mpa
nies
Diagram 1 Companies’ assessment of the extent to which the environmental
impact from the company has reduced as a result of its environmental management system. On a scale of 1-6, where 1 is ”not at all” and 6 is ”to a very great extent”
Approximately 30% of the companies claimed that they were able to demonstrate increased revenues as a result of their environmental management
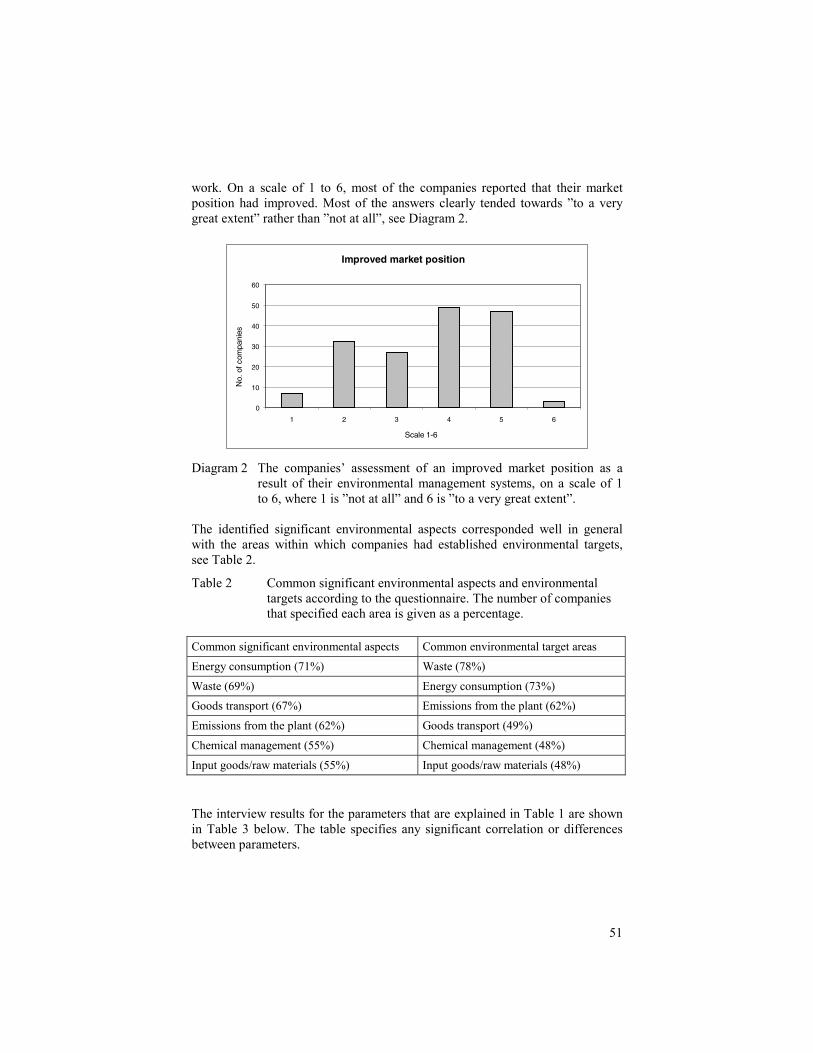
51
work. On a scale of 1 to 6, most of the companies reported that their market position had improved. Most of the answers clearly tended towards ”to a very great extent” rather than ”not at all”, see Diagram 2.
Improved market position
0
10
20
30
40
50
60
1 2 3 4 5 6
Scale 1-6
No.
ofco
mpa
nies
Diagram 2 The companies’ assessment of an improved market position as a
result of their environmental management systems, on a scale of 1 to 6, where 1 is ”not at all” and 6 is ”to a very great extent”.
The identified significant environmental aspects corresponded well in general with the areas within which companies had established environmental targets, see Table 2.
Table 2 Common significant environmental aspects and environmental targets according to the questionnaire. The number of companies that specified each area is given as a percentage.
Common significant environmental aspects Common environmental target areas
Energy consumption (71%) Waste (78%)
Waste (69%) Energy consumption (73%) Goods transport (67%) Emissions from the plant (62%)
Emissions from the plant (62%) Goods transport (49%)
Chemical management (55%) Chemical management (48%)
Input goods/raw materials (55%) Input goods/raw materials (48%) The interview results for the parameters that are explained in Table 1 are shown in Table 3 below. The table specifies any significant correlation or differences between parameters.
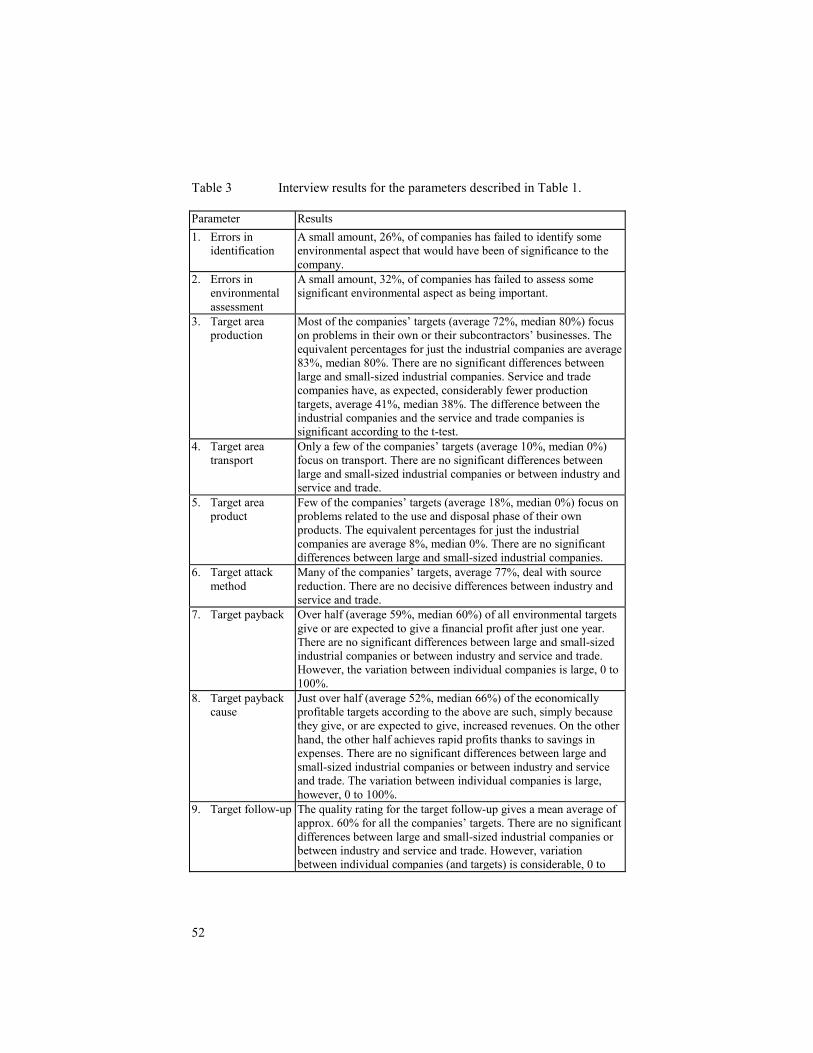
52
Table 3 Interview results for the parameters described in Table 1. Parameter Results 1. Errors in
identification A small amount, 26%, of companies has failed to identify some environmental aspect that would have been of significance to the company.
2. Errors in environmental assessment
A small amount, 32%, of companies has failed to assess some significant environmental aspect as being important.
3. Target area production
Most of the companies’ targets (average 72%, median 80%) focus on problems in their own or their subcontractors’ businesses. The equivalent percentages for just the industrial companies are average 83%, median 80%. There are no significant differences between large and small-sized industrial companies. Service and trade companies have, as expected, considerably fewer production targets, average 41%, median 38%. The difference between the industrial companies and the service and trade companies is significant according to the t-test.
4. Target area transport
Only a few of the companies’ targets (average 10%, median 0%) focus on transport. There are no significant differences between large and small-sized industrial companies or between industry and service and trade.
5. Target area product
Few of the companies’ targets (average 18%, median 0%) focus on problems related to the use and disposal phase of their own products. The equivalent percentages for just the industrial companies are average 8%, median 0%. There are no significant differences between large and small-sized industrial companies.
6. Target attack method
Many of the companies’ targets, average 77%, deal with source reduction. There are no decisive differences between industry and service and trade.
7. Target payback Over half (average 59%, median 60%) of all environmental targets give or are expected to give a financial profit after just one year. There are no significant differences between large and small-sized industrial companies or between industry and service and trade. However, the variation between individual companies is large, 0 to 100%.
8. Target payback cause
Just over half (average 52%, median 66%) of the economically profitable targets according to the above are such, simply because they give, or are expected to give, increased revenues. On the other hand, the other half achieves rapid profits thanks to savings in expenses. There are no significant differences between large and small-sized industrial companies or between industry and service and trade. The variation between individual companies is large, however, 0 to 100%.
9. Target follow-up The quality rating for the target follow-up gives a mean average of approx. 60% for all the companies’ targets. There are no significant differences between large and small-sized industrial companies or between industry and service and trade. However, variation between individual companies (and targets) is considerable, 0 to
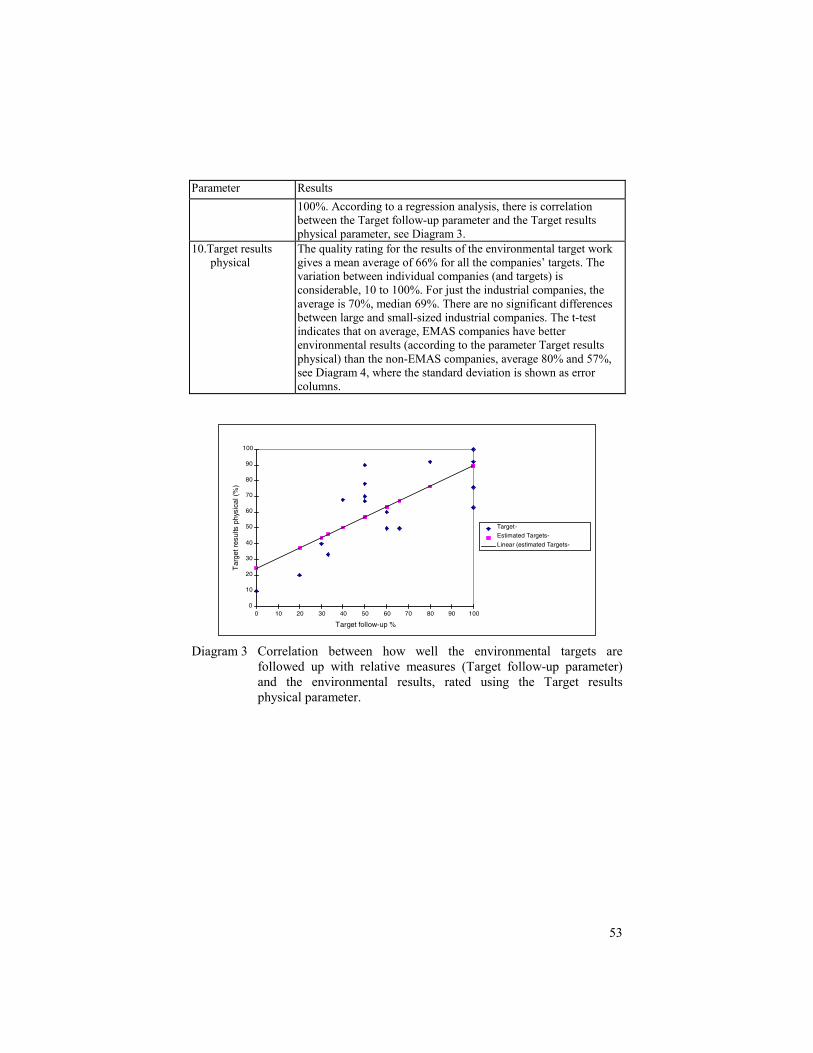
53
Parameter Results 100%. According to a regression analysis, there is correlation between the Target follow-up parameter and the Target results physical parameter, see Diagram 3.
10.Target results physical
The quality rating for the results of the environmental target work gives a mean average of 66% for all the companies’ targets. The variation between individual companies (and targets) is considerable, 10 to 100%. For just the industrial companies, the average is 70%, median 69%. There are no significant differences between large and small-sized industrial companies. The t-test indicates that on average, EMAS companies have better environmental results (according to the parameter Target results physical) than the non-EMAS companies, average 80% and 57%, see Diagram 4, where the standard deviation is shown as error columns.
0
10
20
30
40
50
60
70
80
90
100
0 10 20 30 40 50 60 70 80 90 100
Target follow-up %
Tar
getr
esul
tsph
ysic
al(%
)
Target-
Estimated Targets-
Linear (estimated Targets-i l l )
Diagram 3 Correlation between how well the environmental targets are
followed up with relative measures (Target follow-up parameter) and the environmental results, rated using the Target results physical parameter.
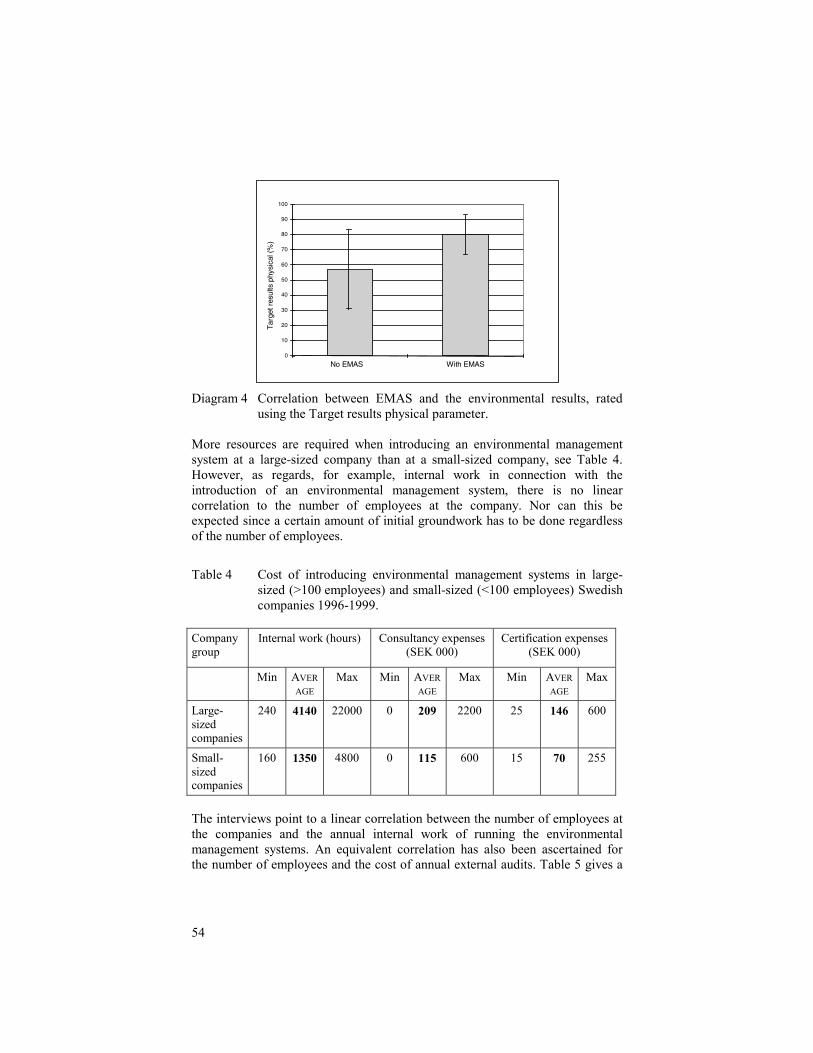
54
0
10
20
30
40
50
60
70
80
90
100
No EMAS With EMAS
Tar
getr
esul
tsph
ysic
al(%
)
Diagram 4 Correlation between EMAS and the environmental results, rated
using the Target results physical parameter. More resources are required when introducing an environmental management system at a large-sized company than at a small-sized company, see Table 4. However, as regards, for example, internal work in connection with the introduction of an environmental management system, there is no linear correlation to the number of employees at the company. Nor can this be expected since a certain amount of initial groundwork has to be done regardless of the number of employees.
Table 4 Cost of introducing environmental management systems in large-sized (>100 employees) and small-sized (<100 employees) Swedish companies 1996-1999.
Company group
Internal work (hours)
Consultancy expenses (SEK 000)
Certification expenses (SEK 000)
Min AVERAGE
Max Min AVERAGE
Max Min AVERAGE
Max
Large-sized companies
240 4140 22000 0 209 2200 25 146 600
Small-sized companies
160 1350 4800 0 115 600 15 70 255
The interviews point to a linear correlation between the number of employees at the companies and the annual internal work of running the environmental management systems. An equivalent correlation has also been ascertained for the number of employees and the cost of annual external audits. Table 5 gives a
55
cost estimation, based on the study results, for implementing and running an environmental management system in a company with 50 employees. Table 5 Estimation of costs for an environmental management system in a
company with 50 employees. Type of expense Internal work and expense Internal implementation work 1350 hours Consultancy expenses during implementationntroduction phase
SEK 115 000
Certification expenses SEK 70 000 Internal work for system operations 700 hours/year Follow-up audits SEK 38 000/year Most companies also have minor annual expenses for training and consultancy in connection with running the system. There are also expenses for the environmental target work.
Discussion1 WHAT PRIORITIES DO COMPANIES GIVE IN THEIR WORK TO ENVIRONMENTAL
ASPECTS THAT HAVE A CONSIDERABLE IMPACT ON THE ENVIRONMENT?
In order to be able to discuss this, we have to start with an assumption about which environmental aspects have a major environmental impact. This is based on the fact that only about 20% of the certified companies are involved in the production of raw materials. The remaining companies manufacture or sell products or provide services. Life cycle analyses and other studies have (for this latter type of company) shown that these rarely have particularly large emissions from their own plant. The greatest environmental impact is often linked to consumption or disposal of the manufactured product or service. A considerable environmental impact is also often associated with the production of raw materials/input goods, which means that the input goods should also constitute a significant environmental aspect for most companies. Energy consumption and different types of transport are also often so important that their environmental impact is highly significant, yet often to a much lower degree. Of course, this is a rough picture which may not apply at all for some companies. However, for the group of certified companies as a whole we should be able to expect that most of the significant environmental aspects and environmental targets are to do with the product or service, raw materials/input goods as well as energy and transport. Since these environmental aspects also constitute a more than marginal economical degree of importance for the companies, it naturally becomes all the more serious if they are disregarded.
56
The questionnaire showed that most of the companies were working with waste, energy consumption and emissions from the plant, see Table 2. Around half of the companies were also working with goods transport and input goods/raw materials. According to the questionnaire, few companies, not quite 20%, were working with the use or disposal of the products. The questionnaire thus indicated that most of the companies were failing to work with some of the environmental aspects that are most important of all, from both an environmental and a financial point of view. The interviews confirmed what emerged from the questionnaire, that companies all too seldom have targets that concern the environmental impact during the use or disposal phase of the products. It also emerged from the interviews that half the companies have made some essential mistake in their identification or their environmental assessment of environmental aspects. Note that the criterion for ”mistake” was that the environmental aspect means both major environmental impact and significant economic effects, plus that the company agreed with the interviewer that a mistake had indeed been made. In conclusion, we can say that there is room for a great amount of improvement as regards which environmental aspects the companies choose to work with. Still, this conclusion does not imply that most of the companies’ environmental work today is completely misdirected. On the contrary, the study indicates that most of them have environmental targets within the majority of those areas that can be regarded as important.
2 WHAT ACTUAL IMPROVEMENTS TO THE ENVIRONMENT HAVE THEENVIRONMENTAL MANAGEMENT SYSTEMS ACHIEVED?
FOCUSING MAINLY ON WASTE The results of both the questionnaire and the interviews have indicated that the majority of companies feel the greatest environmental improvements have been achieved in the area of waste. Better waste treatment and less waste are the most frequent answers in the questionnaire about which have been the companies’ most effective environmental measures. As far as what certification has meant to the company, almost everyone interviewed mentioned ”better order and greater systemisation” and gave the example of improved waste sorting system. As mentioned previously, waste has also been the most common environmental target area. But it is not just about sorting waste. Our questionnaire showed that a smaller amount of waste, i.e. resource economy, appears to be almost as common as improved waste sorting. According to the interviews, 77% of the companies’ targets can be classed as source reduction (i.e. they attack the cause of the problem, not the symptom) and waste sorting has nothing to do with it.
57
EMAS COMPANIES ACHIEVE BETTER ENVIRONMENTAL RESULTS The results of the interviews have indicated that the environmental achievements of EMAS-registered companies are better than those of companies that do not have EMAS, just ISO 14001. The difference is moderately large - 80% compared with 58% accomplishment of physical targets in the form of emissions and resource reductions. Even so, the subjective impression at the interviews confirms that there should be a difference to the advantage of the EMAS companies. The most likely explanation for this is that the EMAS regulations requirements for companies to publicize their environmental results exert greater pressure on the companies to actually achieve real results.
THE BETTER THE TARGET FOLLOW-UP, THE BETTER THE ENVIRONMENTAL RESULTS The interview results have shown that the better a company’s target follow-up, the better its environmental results. Many questionnaire respondents mentioned environmental performance evaluation with key indicators as useful tools, revealing that most of the companies are aware of the importance of target follow-up.
DO COMPANIES NEED CERTIFICATION? The interviews have shown that half of all environmental targets would have been realised even if the environmental work had not been certified. In response to the question about the extent to which the environmental management system has reduced the environmental impact from the company, some frustration emerged about the environmental management work not having achieved more environmental improvements. We might then question whether certification is justified from an environmental view point, considering all the extra costs and bureaucracy involved. What might have been achieved if these resources had, instead, been channelled towards making environmental improvements? What does argue in favour of certification is that almost all the companies we interviewed emphasis that it leads to better order and greater systemisation. Although the bureaucracy is frustrating, it is considered necessary. What’s more, it is far from certain that the resources a company saves by not being certified are really used for making environmental improvements.
3 EXPENSES, ECONOMY AND REVENUES IN CONNECTION WITHENVIRONMENTAL MANAGEMENT SYSTEMS
Using the results of this study, it is possible to estimate the cost of introducing and running environmental management systems in Sweden. The study also provides some idea about possible cost savings and revenue increase.
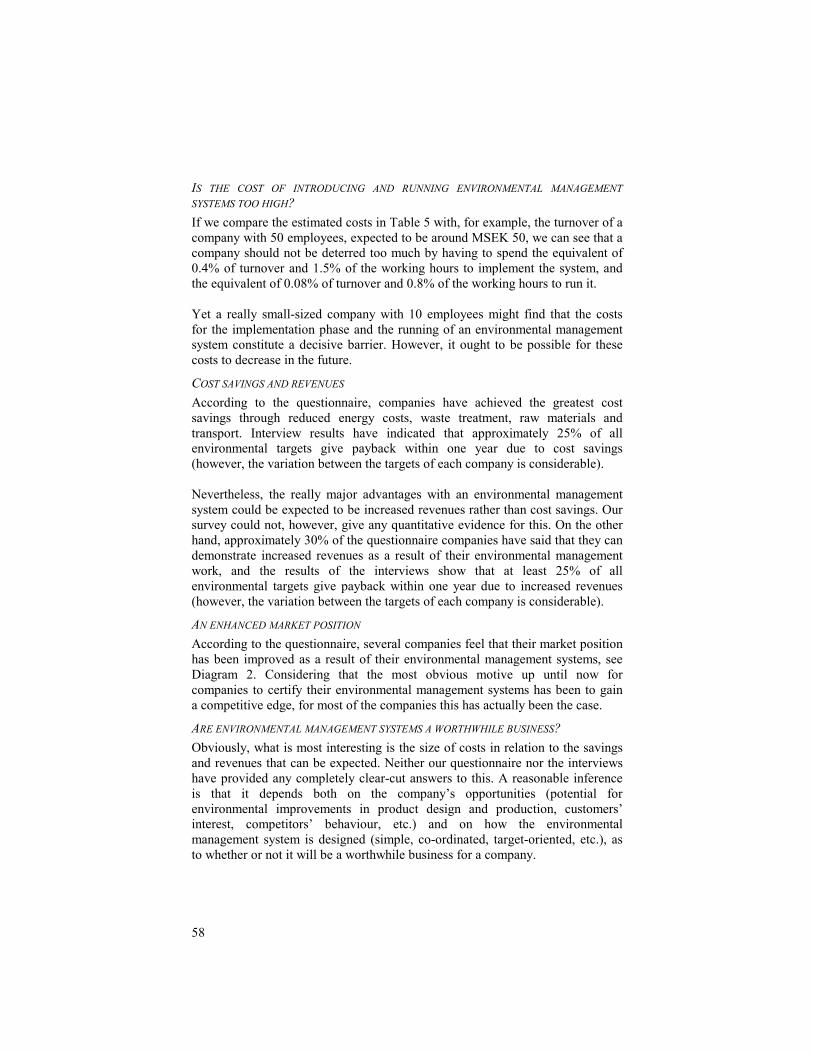
58
IS THE COST OF INTRODUCING AND RUNNING ENVIRONMENTAL MANAGEMENT SYSTEMS TOO HIGH? If we compare the estimated costs in Table 5 with, for example, the turnover of a company with 50 employees, expected to be around MSEK 50, we can see that a company should not be deterred too much by having to spend the equivalent of 0.4% of turnover and 1.5% of the working hours to implement the system, and the equivalent of 0.08% of turnover and 0.8% of the working hours to run it. Yet a really small-sized company with 10 employees might find that the costs for the implementation phase and the running of an environmental management system constitute a decisive barrier. However, it ought to be possible for these costs to decrease in the future.
COST SAVINGS AND REVENUES According to the questionnaire, companies have achieved the greatest cost savings through reduced energy costs, waste treatment, raw materials and transport. Interview results have indicated that approximately 25% of all environmental targets give payback within one year due to cost savings (however, the variation between the targets of each company is considerable). Nevertheless, the really major advantages with an environmental management system could be expected to be increased revenues rather than cost savings. Our survey could not, however, give any quantitative evidence for this. On the other hand, approximately 30% of the questionnaire companies have said that they can demonstrate increased revenues as a result of their environmental management work, and the results of the interviews show that at least 25% of all environmental targets give payback within one year due to increased revenues (however, the variation between the targets of each company is considerable).
AN ENHANCED MARKET POSITION According to the questionnaire, several companies feel that their market position has been improved as a result of their environmental management systems, see Diagram 2. Considering that the most obvious motive up until now for companies to certify their environmental management systems has been to gain a competitive edge, for most of the companies this has actually been the case.
ARE ENVIRONMENTAL MANAGEMENT SYSTEMS A WORTHWHILE BUSINESS? Obviously, what is most interesting is the size of costs in relation to the savings and revenues that can be expected. Neither our questionnaire nor the interviews have provided any completely clear-cut answers to this. A reasonable inference is that it depends both on the company’s opportunities (potential for environmental improvements in product design and production, customers’ interest, competitors’ behaviour, etc.) and on how the environmental management system is designed (simple, co-ordinated, target-oriented, etc.), as to whether or not it will be a worthwhile business for a company.
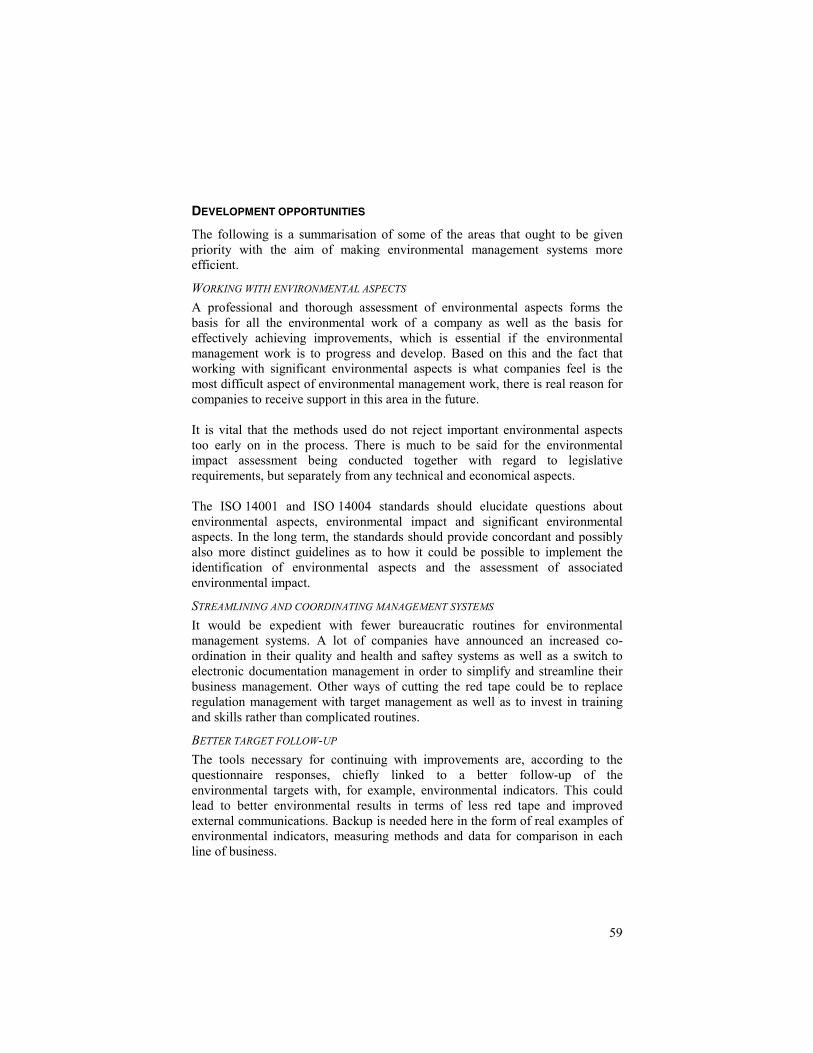
59
DEVELOPMENT OPPORTUNITIES
The following is a summarisation of some of the areas that ought to be given priority with the aim of making environmental management systems more efficient.
WORKING WITH ENVIRONMENTAL ASPECTS A professional and thorough assessment of environmental aspects forms the basis for all the environmental work of a company as well as the basis for effectively achieving improvements, which is essential if the environmental management work is to progress and develop. Based on this and the fact that working with significant environmental aspects is what companies feel is the most difficult aspect of environmental management work, there is real reason for companies to receive support in this area in the future. It is vital that the methods used do not reject important environmental aspects too early on in the process. There is much to be said for the environmental impact assessment being conducted together with regard to legislative requirements, but separately from any technical and economical aspects. The ISO 14001 and ISO 14004 standards should elucidate questions about environmental aspects, environmental impact and significant environmental aspects. In the long term, the standards should provide concordant and possibly also more distinct guidelines as to how it could be possible to implement the identification of environmental aspects and the assessment of associated environmental impact.
STREAMLINING AND COORDINATING MANAGEMENT SYSTEMS It would be expedient with fewer bureaucratic routines for environmental management systems. A lot of companies have announced an increased co-ordination in their quality and health and saftey systems as well as a switch to electronic documentation management in order to simplify and streamline their business management. Other ways of cutting the red tape could be to replace regulation management with target management as well as to invest in training and skills rather than complicated routines.
BETTER TARGET FOLLOW-UP The tools necessary for continuing with improvements are, according to the questionnaire responses, chiefly linked to a better follow-up of the environmental targets with, for example, environmental indicators. This could lead to better environmental results in terms of less red tape and improved external communications. Backup is needed here in the form of real examples of environmental indicators, measuring methods and data for comparison in each line of business.
60
LINK TO WORK ON PRODUCT DESIGN The study shows that the focus of companies today is mainly on waste, energy and emissions. This is often linked to cost savings and has pedagogic consequences. To maintain continual improvements in future environmental management systems and enhance the economical profitability, the focus should, however, be shifted towards work on the company’s own products and/or services.
AcknowledgementsThis report is based on a study that was carried out as a joint project within the Industrial Research Institutes in Sweden (IRIS). The authors would like to thank Angelica Widing, Åsa Abel, Hans-Olof Marcus, Pär Olsson and Ulf Gotthardsson for inspiring co-operation. The study is described in full in an IMT Project Report (Zackrisson, 1999). Our thanks go especially to the 200 or so companies that have shared their experience with us. The study was financed by The Swedish Board for Industrial and Technical Development (NUTEK).
LiteratureElfors, A., C. Hedvall. Miljöledningssystems effekter – miljörelaterade, finansiella och strategiska effekter av miljöledningssystem i företag. Master’s thesis 1998:2. Institutionen för Biologisk Grundutbildning, University of Stockholm. 1999.
EMAS regulations, no.1836/93 concerning voluntary participation by industrial companies in the EU Eco Management and Audit Scheme.
Heidenmark, P.. Miljöarbete inom svensk tillverkningsindustri. Fortfarande myt? Studie av miljöarbetet i 300 tillverkande företag. IIIEE Research Report 1999:2. 1999.
Kretsloppsdelegationen. Företag i kretslopp – en lägesredovisning av företagens kretsloppsanpassning. Kretsloppsdelegationen’s report 1998:23. 1998.
Nordström, A.. Ems – Does it pay off? A study of Swedish small and medium sized enterprises. IIIEE Master’s Thesis 98:21, IIIEE. 1998.
Norström, S.. Miljöeffekter av införandet av EMAS – Svenska erfarenheter som resultat av intervjuundersökning. Report 4843, Naturvårdverkets förlag. 1997.
Strannegård, L., R. Wolff, M. Örninge. Svenska Miljöbarometern 1997-1998. GRI; Gothenburg Research Institut och Handelshögskolan vid Göteborgs Universitet. Cappelen Akademisk Forlag a.s, Oslo. 1998.
Swedish standard SS-EN ISO 14001. Environmental management systems – Specification with guidance for use / Miljöledningssystem – Kravspecifikation med vägledning för användning (ISO 14001:1996). Allmänna Standardiseringsgruppen, STG. 1996.
61
Swedish standard SS-EN ISO 14004. Environmental management systems - General guidelines on principles, systems and supporting techniques / Miljöledningssystem – Allmän vägledning för principer, system och stödjande metoder. Allmänna Standardiseringsgruppen, STG. 1996.
Zackrisson, M., et al. Miljöledningssystem – papperstiger eller kraftfullt verktyg. IMT Project report no. 92. 1999.

63
Paper I
Paper II
Paper III
Paper IV

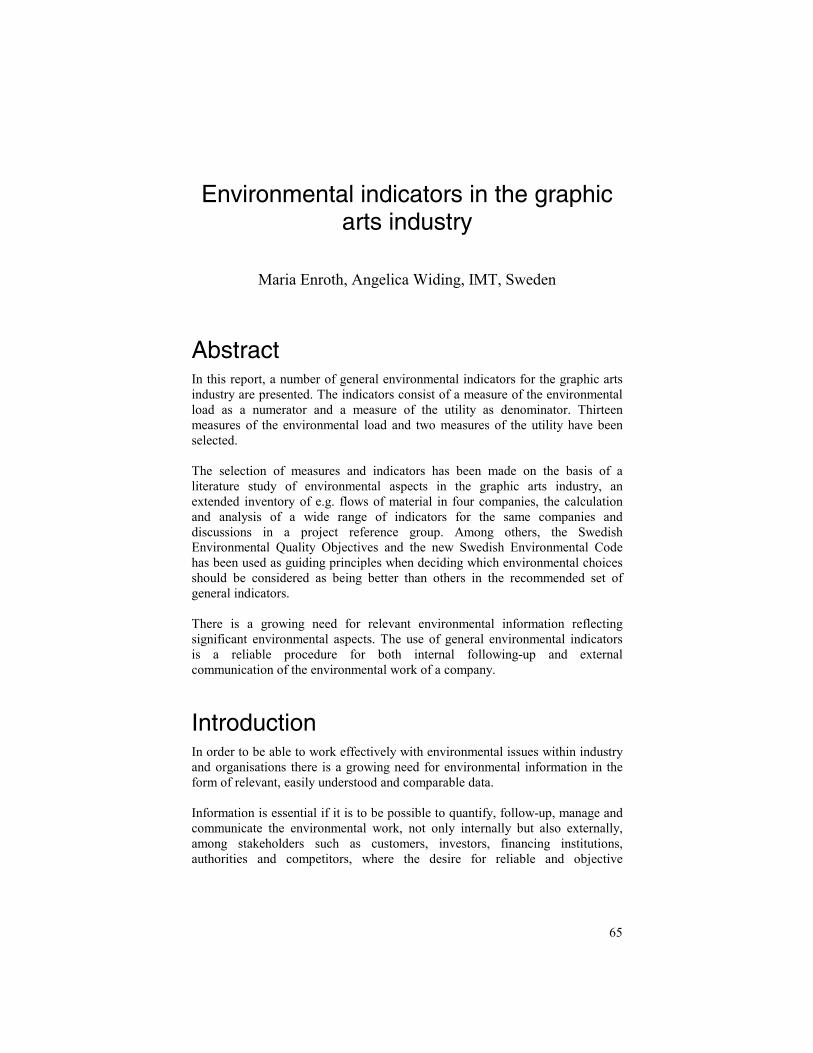
65
Environmental indicators in the graphicarts industry
Maria Enroth, Angelica Widing, IMT, Sweden
AbstractIn this report, a number of general environmental indicators for the graphic arts industry are presented. The indicators consist of a measure of the environmental load as a numerator and a measure of the utility as denominator. Thirteen measures of the environmental load and two measures of the utility have been selected. The selection of measures and indicators has been made on the basis of a literature study of environmental aspects in the graphic arts industry, an extended inventory of e.g. flows of material in four companies, the calculation and analysis of a wide range of indicators for the same companies and discussions in a project reference group. Among others, the Swedish Environmental Quality Objectives and the new Swedish Environmental Code has been used as guiding principles when deciding which environmental choices should be considered as being better than others in the recommended set of general indicators. There is a growing need for relevant environmental information reflecting significant environmental aspects. The use of general environmental indicators is a reliable procedure for both internal following-up and external communication of the environmental work of a company.
IntroductionIn order to be able to work effectively with environmental issues within industry and organisations there is a growing need for environmental information in the form of relevant, easily understood and comparable data. Information is essential if it is to be possible to quantify, follow-up, manage and communicate the environmental work, not only internally but also externally, among stakeholders such as customers, investors, financing institutions, authorities and competitors, where the desire for reliable and objective
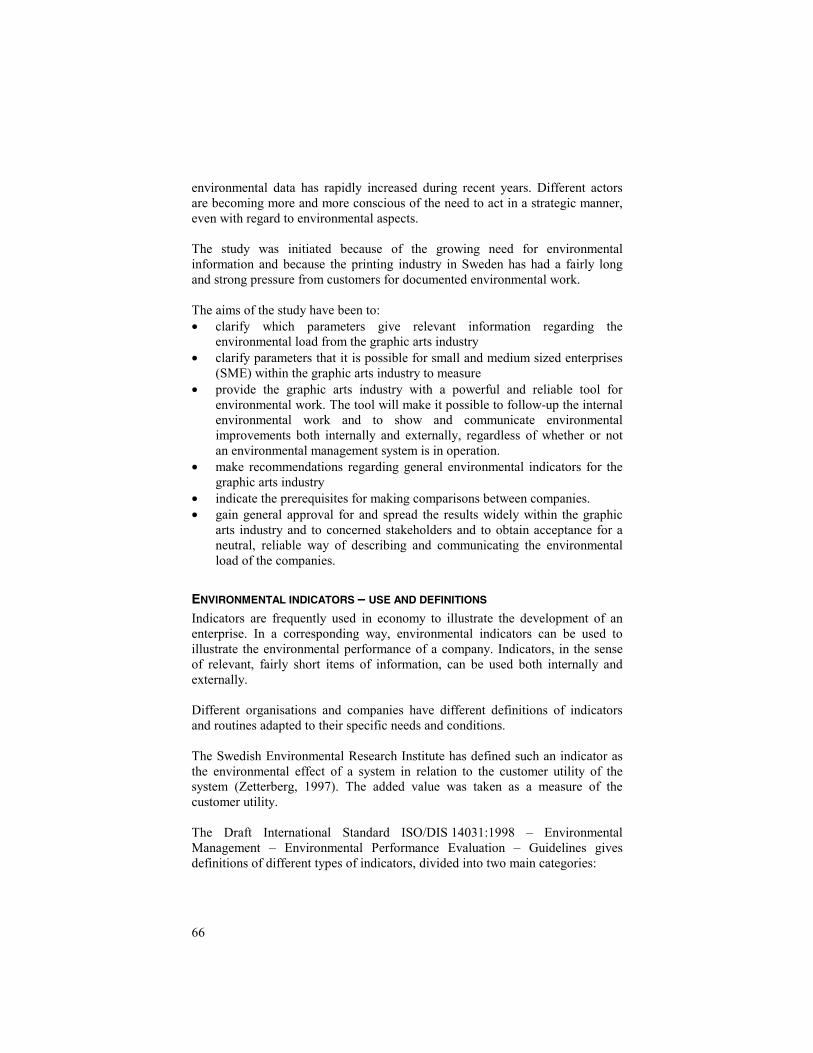
66
environmental data has rapidly increased during recent years. Different actors are becoming more and more conscious of the need to act in a strategic manner, even with regard to environmental aspects. The study was initiated because of the growing need for environmental information and because the printing industry in Sweden has had a fairly long and strong pressure from customers for documented environmental work. The aims of the study have been to: • clarify which parameters give relevant information regarding the
environmental load from the graphic arts industry • clarify parameters that it is possible for small and medium sized enterprises
(SME) within the graphic arts industry to measure • provide the graphic arts industry with a powerful and reliable tool for
environmental work. The tool will make it possible to follow-up the internal environmental work and to show and communicate environmental improvements both internally and externally, regardless of whether or not an environmental management system is in operation.
• make recommendations regarding general environmental indicators for the graphic arts industry
• indicate the prerequisites for making comparisons between companies. • gain general approval for and spread the results widely within the graphic
arts industry and to concerned stakeholders and to obtain acceptance for a neutral, reliable way of describing and communicating the environmental load of the companies.
ENVIRONMENTAL INDICATORS – USE AND DEFINITIONS
Indicators are frequently used in economy to illustrate the development of an enterprise. In a corresponding way, environmental indicators can be used to illustrate the environmental performance of a company. Indicators, in the sense of relevant, fairly short items of information, can be used both internally and externally. Different organisations and companies have different definitions of indicators and routines adapted to their specific needs and conditions. The Swedish Environmental Research Institute has defined such an indicator as the environmental effect of a system in relation to the customer utility of the system (Zetterberg, 1997). The added value was taken as a measure of the customer utility. The Draft International Standard ISO/DIS 14031:1998 – Environmental Management – Environmental Performance Evaluation – Guidelines gives definitions of different types of indicators, divided into two main categories:
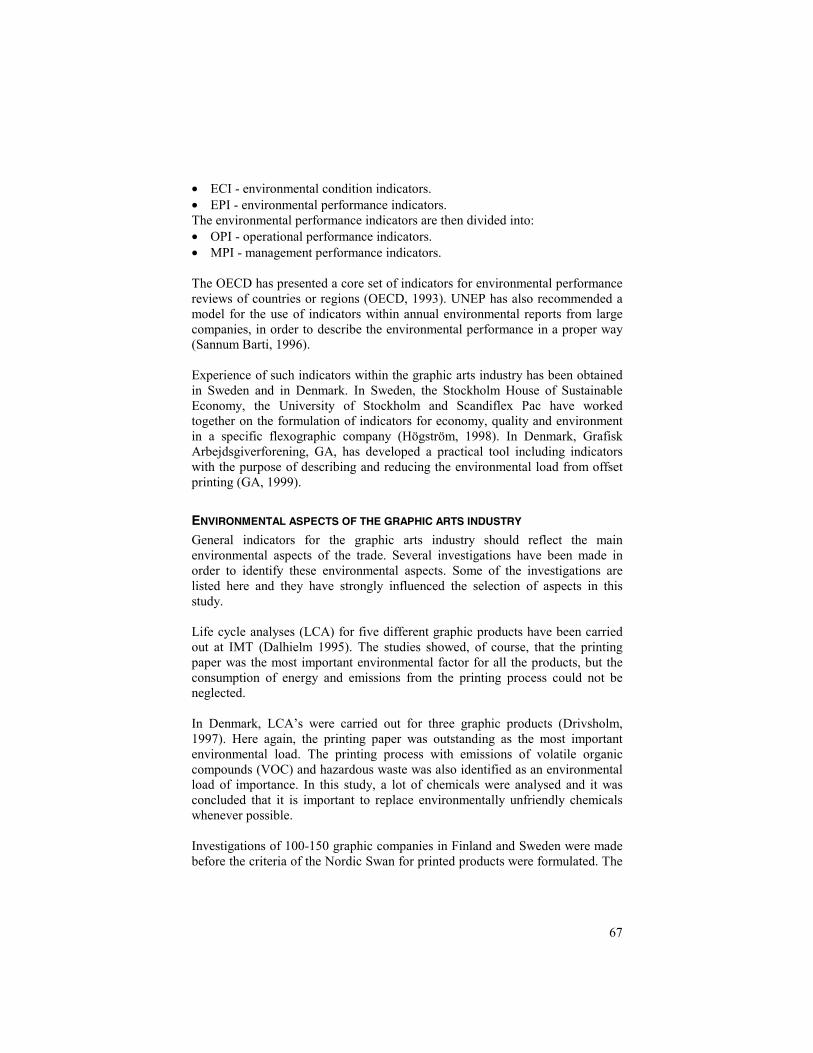
67
• ECI - environmental condition indicators. • EPI - environmental performance indicators. The environmental performance indicators are then divided into: • OPI - operational performance indicators. • MPI - management performance indicators. The OECD has presented a core set of indicators for environmental performance reviews of countries or regions (OECD, 1993). UNEP has also recommended a model for the use of indicators within annual environmental reports from large companies, in order to describe the environmental performance in a proper way (Sannum Barti, 1996). Experience of such indicators within the graphic arts industry has been obtained in Sweden and in Denmark. In Sweden, the Stockholm House of Sustainable Economy, the University of Stockholm and Scandiflex Pac have worked together on the formulation of indicators for economy, quality and environment in a specific flexographic company (Högström, 1998). In Denmark, Grafisk Arbejdsgiverforening, GA, has developed a practical tool including indicators with the purpose of describing and reducing the environmental load from offset printing (GA, 1999).
ENVIRONMENTAL ASPECTS OF THE GRAPHIC ARTS INDUSTRY
General indicators for the graphic arts industry should reflect the main environmental aspects of the trade. Several investigations have been made in order to identify these environmental aspects. Some of the investigations are listed here and they have strongly influenced the selection of aspects in this study. Life cycle analyses (LCA) for five different graphic products have been carried out at IMT (Dalhielm 1995). The studies showed, of course, that the printing paper was the most important environmental factor for all the products, but the consumption of energy and emissions from the printing process could not be neglected. In Denmark, LCA’s were carried out for three graphic products (Drivsholm, 1997). Here again, the printing paper was outstanding as the most important environmental load. The printing process with emissions of volatile organic compounds (VOC) and hazardous waste was also identified as an environmental load of importance. In this study, a lot of chemicals were analysed and it was concluded that it is important to replace environmentally unfriendly chemicals whenever possible. Investigations of 100-150 graphic companies in Finland and Sweden were made before the criteria of the Nordic Swan for printed products were formulated. The
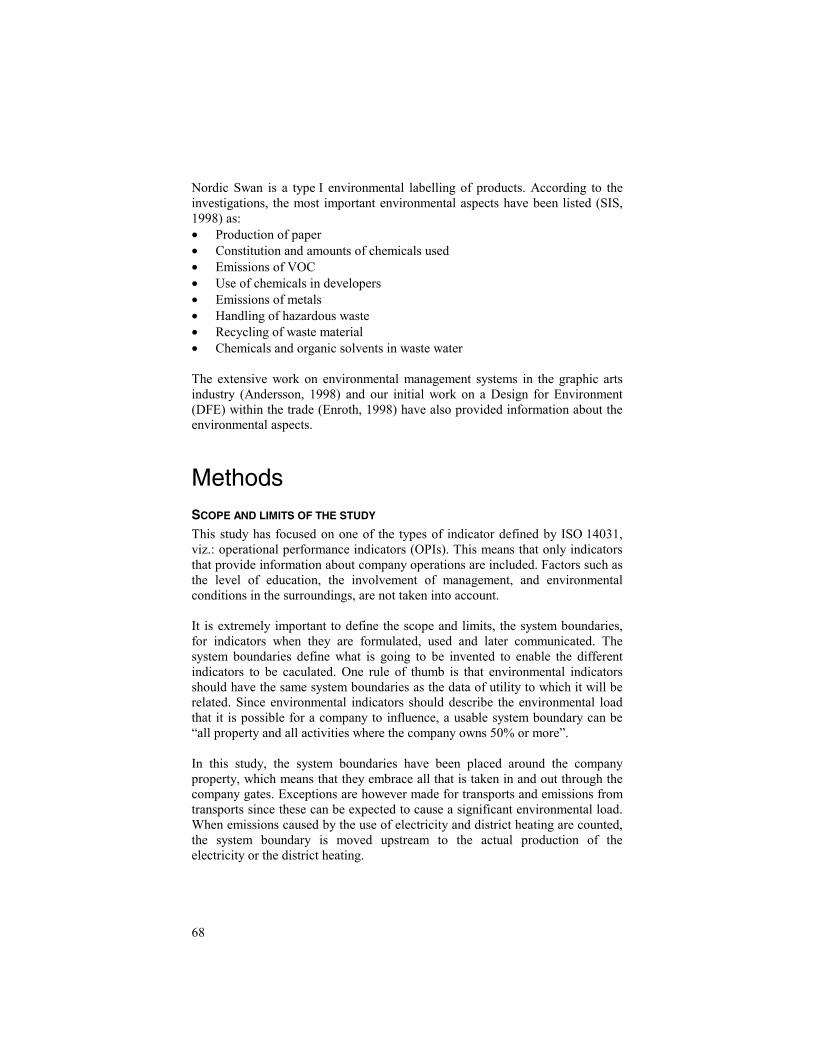
68
Nordic Swan is a type I environmental labelling of products. According to the investigations, the most important environmental aspects have been listed (SIS, 1998) as: • Production of paper • Constitution and amounts of chemicals used • Emissions of VOC • Use of chemicals in developers • Emissions of metals • Handling of hazardous waste • Recycling of waste material • Chemicals and organic solvents in waste water The extensive work on environmental management systems in the graphic arts industry (Andersson, 1998) and our initial work on a Design for Environment (DFE) within the trade (Enroth, 1998) have also provided information about the environmental aspects.
MethodsSCOPE AND LIMITS OF THE STUDY
This study has focused on one of the types of indicator defined by ISO 14031, viz.: operational performance indicators (OPIs). This means that only indicators that provide information about company operations are included. Factors such as the level of education, the involvement of management, and environmental conditions in the surroundings, are not taken into account. It is extremely important to define the scope and limits, the system boundaries, for indicators when they are formulated, used and later communicated. The system boundaries define what is going to be invented to enable the different indicators to be caculated. One rule of thumb is that environmental indicators should have the same system boundaries as the data of utility to which it will be related. Since environmental indicators should describe the environmental load that it is possible for a company to influence, a usable system boundary can be “all property and all activities where the company owns 50% or more”. In this study, the system boundaries have been placed around the company property, which means that they embrace all that is taken in and out through the company gates. Exceptions are however made for transports and emissions from transports since these can be expected to cause a significant environmental load. When emissions caused by the use of electricity and district heating are counted, the system boundary is moved upstream to the actual production of the electricity or the district heating.
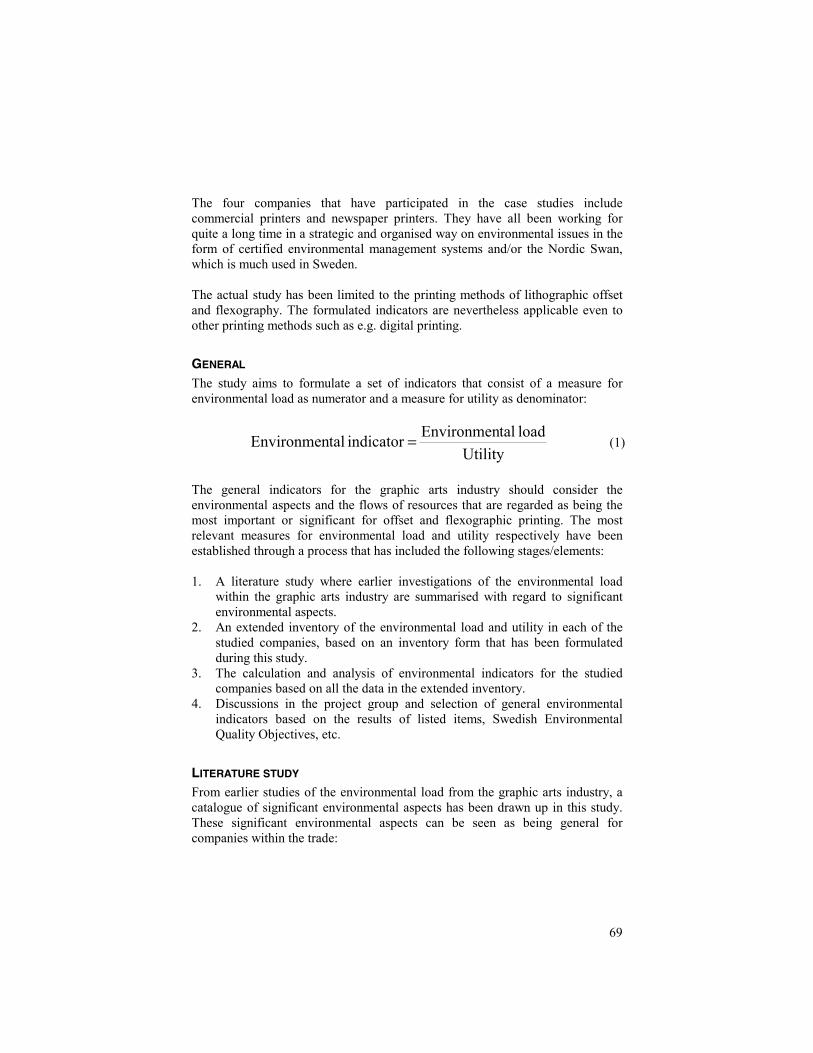
69
The four companies that have participated in the case studies include commercial printers and newspaper printers. They have all been working for quite a long time in a strategic and organised way on environmental issues in the form of certified environmental management systems and/or the Nordic Swan, which is much used in Sweden. The actual study has been limited to the printing methods of lithographic offset and flexography. The formulated indicators are nevertheless applicable even to other printing methods such as e.g. digital printing.
GENERAL
The study aims to formulate a set of indicators that consist of a measure for environmental load as numerator and a measure for utility as denominator:
Utilityload talEnvironmen indicator talEnvironmen = (1)
The general indicators for the graphic arts industry should consider the environmental aspects and the flows of resources that are regarded as being the most important or significant for offset and flexographic printing. The most relevant measures for environmental load and utility respectively have been established through a process that has included the following stages/elements: 1. A literature study where earlier investigations of the environmental load
within the graphic arts industry are summarised with regard to significant environmental aspects.
2. An extended inventory of the environmental load and utility in each of the studied companies, based on an inventory form that has been formulated during this study.
3. The calculation and analysis of environmental indicators for the studied companies based on all the data in the extended inventory.
4. Discussions in the project group and selection of general environmental indicators based on the results of listed items, Swedish Environmental Quality Objectives, etc.
LITERATURE STUDY
From earlier studies of the environmental load from the graphic arts industry, a catalogue of significant environmental aspects has been drawn up in this study. These significant environmental aspects can be seen as being general for companies within the trade:
70
• The consumption of paper • Handling and use of chemical products • The consumption of printing ink • The consumption of energy • Transport • Emissions of VOC
INVENTORY
To make it possible to calculate environmental indicators for the four project companies, each company has made an extensive inventory of its activities. The inventory form has been formulated in accordance with the recommended method for inventory in ISO14001 and in the European Management and Audit Scheme (EMAS). In EMAS, it is prescribed that every real or potential factor which may have an environmental impact should be identified (Marsanich, 1998) by investigation of: • Every possible emission to air, ground or water. • Generated waste • The use of energy, water and other materials. • The use of the products and their handling in the waste treatment phase. In this study, the use and handling of the products in the waste treatment phase have been excluded in accordance with the defined system boundaries. We have also concentrated on the formulation of indicators in a related form and the environmental load is therefore related to measures of utility of the companies. One type of measure of the utility of the company for society or consumers is a financial measure such as e.g. the annual turnover. The number of employees can also be a measure of utility since that is in general related to the size of company. Another way to illustrate utility in a company is to measure the products produced e.g. tonnes of printed matter. A number of suggestions regarding financial measures and measures related to production in the graphic arts industry have been formulated in the extended inventory. All the instructions for the extended inventory and for the calculations of indicators have been repeatedly discussed in the project group. The inventory has been made in several steps with interim calculations and recalculations of the indicators. The form that is used in the study for the extended inventory at each company includes the following main areas:
71
Environmental load �� Materials
�� More or less all inflows of raw material, chemicals, etc in weight divided into their origins, environmental labels etc.
�� Energy �� Electricity in kWh with a mark about environmental labelling in
relevant cases. �� Heating in kWh divided into district heating and purchased fuel. �� Fuel in kWh divided into different types of fuel.
�� Transport �� Transport of printing substrate to the printing industry from the place of
production. The transport work in tonkilometers (transported weight multiplied by transported distance) specified for different types of transportation and fuel.
�� Transport of printed products from the printing industry to the customer. The transport work in tonkilometers (transported weight is multiplied with transported way) specified for different types of transportation and fuel respectively.
�� Outflows �� Products (see under the heading ”Utility”). �� Waste products by weight, specified according to hazardousness and
treatment method. �� Emissions by weight.
Utility The financial measures in the extended inventory were: �� Annual turnover �� Added value �� Number of full-time employees
The measures related to products were: �� Total weight of the products �� Total area of the products �� Total amount of printed products
CALCULATION OF ENVIRONMENTAL INDICATORS
Based on the inventories of the four companies, environmental indicators were calculated for all measures that were listed in the form used for the extended inventory. Each measure of environmental load was then related one by one to all the measures for utility. The following analysis of calculated indicators has
72
confirmed the significant environmental aspects that have been identified through the study of the literature.
DISCUSSIONS IN THE PROJECT GROUP
Based on the results of previous steps in the study, General measures of environmental load and utility were discussed and selected: Some important criteria for the selection of general indicators has been that they should: • be relevant from an environmental point of view. • consist of as few indicators as possible. • be easily understood. • be able to be calculated with reasonable resources. • be able to be measured and followed-up in time periods. • be based on scientific data. • be possible to influence. • make possible comparisons of different time periods within and between
companies.
SELECTION OF MEASURES FOR ENVIRONMENTAL LOAD
National environmental principles formulated by Swedish authorities have been used as a guide when deciding which environmental choices should be considered to be better than others in a recommended set of general indicators. The guiding principles that have been used are the fifteen Swedish Environmental Quality Objectives (Naturvårdsverket 1998), the eleven green indicators for a sustainable development formulated by the Ministry of the Environment (SOU 1998:170) and the Swedish Environmental Act with the new Environmental Code, which came into force on 1 January 1999 (SFS 1998:808). The fifteen Swedish Environmental Quality Objectives and goals concern different categories of environmental loads and different types of biotopes. Within the goal of “Clean air”, an example of target is that the VOC emissions should be reduced to harmless levels. Within the goal of “Limited climate change”, measures such as reductions in the use of fossil fuels, the increased use of biobased fuels, more effective energy use, the use of renewable energy sources, etc are mentioned. Within the goal of “A good urban environment” targets are specified for reducing the quantities and hazardousness of waste, less landfill waste and the sustainable use of natural resources. The eleven green indicators for a sustainable development formulated by the Ministry of the Environment concern, for example, the use of energy, emissions
73
of carbon dioxide and landfill waste. Additional green indicators are planned, and these concern flows of material and the use of chemicals. In the new Swedish Environmental Code, the following important guiding principles are mentioned: • Resource management and eco-cyclic principles
Everybody must conserve raw materials and energy and also utilise opportunities of reuse and recycling. In the first instance, renewable sources of energy should be used. The best effects are achieved in conjunction with design and manufacture.
• The product choice principle Everybody must avoid using or selling chemical products that are harmful to human health or the environment, if these can be replaced with products that may be assumed to be less hazardous.
SELECTION OF MEASURES FOR UTILITY
The selection of measures for utility has been mainly based on the requirement that: • the parameter gives a fair picture of the utility of the company. • it is possible to measure the parameter. • companies are willing to communicate the information officially.
ResultsGENERAL ENVIRONMENTAL INDICATORS FOR THE GRAPHIC ARTS INDUSTRY
MEASURES FOR ENVIRONMENTAL LOAD
The following measures of environmental load have been selected: Materials • The materials used (printing carrier + film + plate + printing ink +
packaging). • The non-renewable materials (film + plate + mineral-based oil in printing ink
+ plastics). • Printing paper, the total amount. • Printing paper not accepted by the Nordic Swan criteria for environmental
labelling. • Hazardous materials.
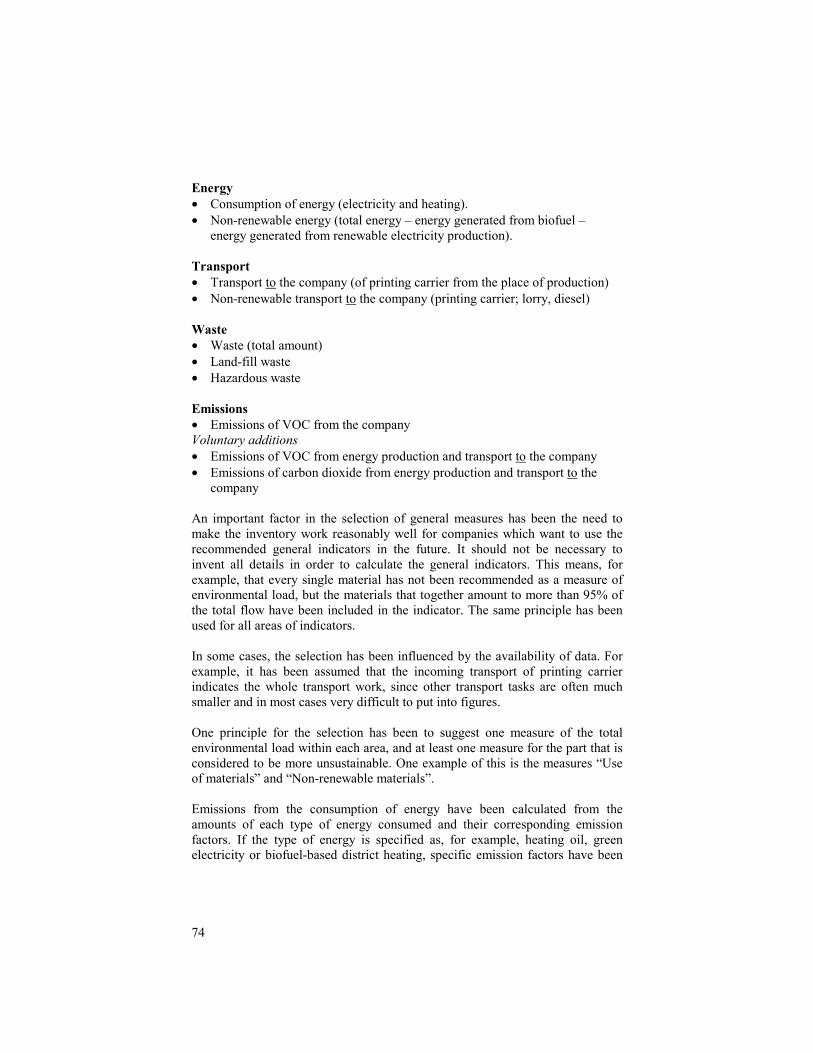
74
Energy • Consumption of energy (electricity and heating). • Non-renewable energy (total energy – energy generated from biofuel –
energy generated from renewable electricity production). Transport • Transport to the company (of printing carrier from the place of production) • Non-renewable transport to the company (printing carrier; lorry, diesel) Waste • Waste (total amount) • Land-fill waste • Hazardous waste Emissions • Emissions of VOC from the company Voluntary additions • Emissions of VOC from energy production and transport to the company • Emissions of carbon dioxide from energy production and transport to the
company An important factor in the selection of general measures has been the need to make the inventory work reasonably well for companies which want to use the recommended general indicators in the future. It should not be necessary to invent all details in order to calculate the general indicators. This means, for example, that every single material has not been recommended as a measure of environmental load, but the materials that together amount to more than 95% of the total flow have been included in the indicator. The same principle has been used for all areas of indicators. In some cases, the selection has been influenced by the availability of data. For example, it has been assumed that the incoming transport of printing carrier indicates the whole transport work, since other transport tasks are often much smaller and in most cases very difficult to put into figures. One principle for the selection has been to suggest one measure of the total environmental load within each area, and at least one measure for the part that is considered to be more unsustainable. One example of this is the measures “Use of materials” and “Non-renewable materials”. Emissions from the consumption of energy have been calculated from the amounts of each type of energy consumed and their corresponding emission factors. If the type of energy is specified as, for example, heating oil, green electricity or biofuel-based district heating, specific emission factors have been
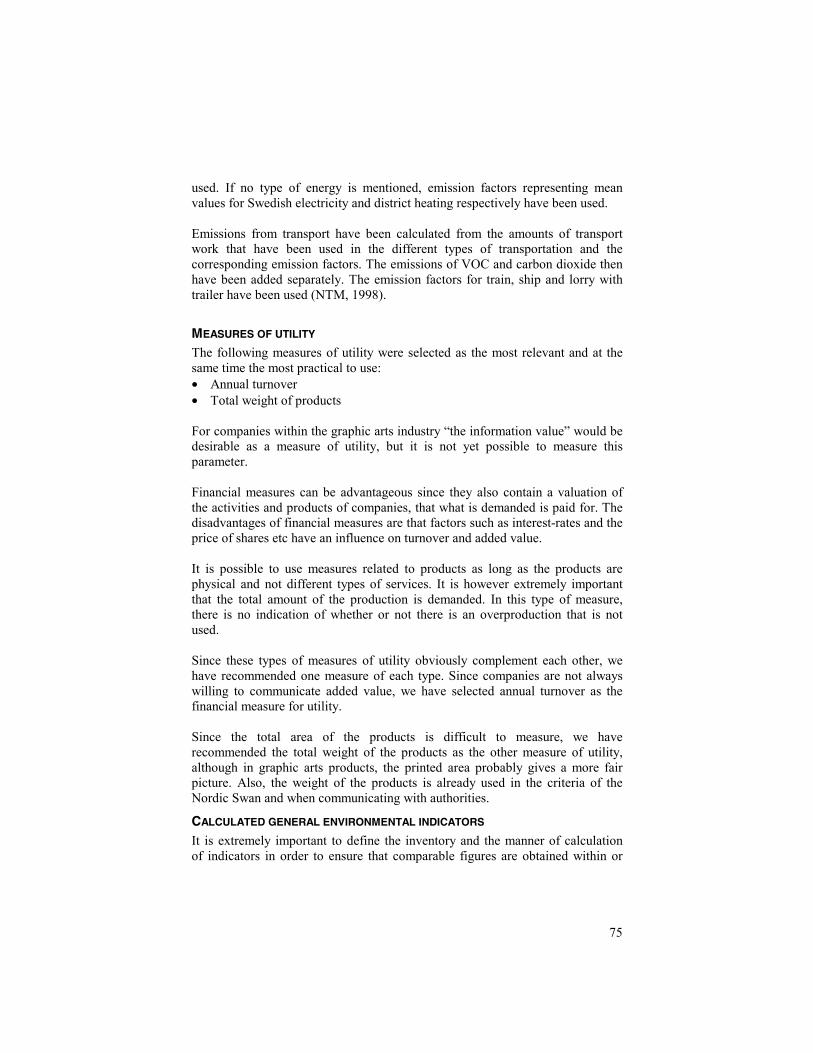
75
used. If no type of energy is mentioned, emission factors representing mean values for Swedish electricity and district heating respectively have been used. Emissions from transport have been calculated from the amounts of transport work that have been used in the different types of transportation and the corresponding emission factors. The emissions of VOC and carbon dioxide then have been added separately. The emission factors for train, ship and lorry with trailer have been used (NTM, 1998).
MEASURES OF UTILITY
The following measures of utility were selected as the most relevant and at the same time the most practical to use: • Annual turnover • Total weight of products For companies within the graphic arts industry “the information value” would be desirable as a measure of utility, but it is not yet possible to measure this parameter. Financial measures can be advantageous since they also contain a valuation of the activities and products of companies, that what is demanded is paid for. The disadvantages of financial measures are that factors such as interest-rates and the price of shares etc have an influence on turnover and added value. It is possible to use measures related to products as long as the products are physical and not different types of services. It is however extremely important that the total amount of the production is demanded. In this type of measure, there is no indication of whether or not there is an overproduction that is not used. Since these types of measures of utility obviously complement each other, we have recommended one measure of each type. Since companies are not always willing to communicate added value, we have selected annual turnover as the financial measure for utility. Since the total area of the products is difficult to measure, we have recommended the total weight of the products as the other measure of utility, although in graphic arts products, the printed area probably gives a more fair picture. Also, the weight of the products is already used in the criteria of the Nordic Swan and when communicating with authorities.
CALCULATED GENERAL ENVIRONMENTAL INDICATORS
It is extremely important to define the inventory and the manner of calculation of indicators in order to ensure that comparable figures are obtained within or
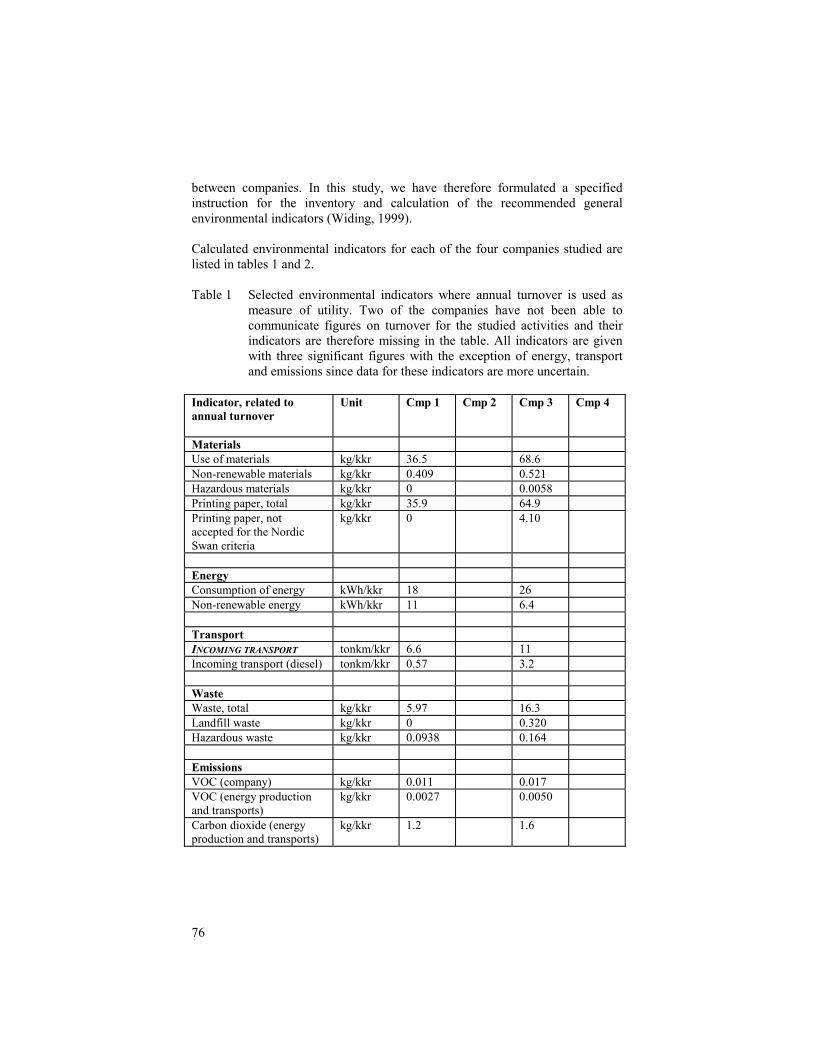
76
between companies. In this study, we have therefore formulated a specified instruction for the inventory and calculation of the recommended general environmental indicators (Widing, 1999). Calculated environmental indicators for each of the four companies studied are listed in tables 1 and 2. Table 1 Selected environmental indicators where annual turnover is used as
measure of utility. Two of the companies have not been able to communicate figures on turnover for the studied activities and their indicators are therefore missing in the table. All indicators are given with three significant figures with the exception of energy, transport and emissions since data for these indicators are more uncertain.
Indicator, related to annual turnover
Unit Cmp 1 Cmp 2 Cmp 3 Cmp 4
Materials Use of materials kg/kkr 36.5 68.6 Non-renewable materials kg/kkr 0.409 0.521 Hazardous materials kg/kkr 0 0.0058 Printing paper, total kg/kkr 35.9 64.9 Printing paper, not accepted for the Nordic Swan criteria
kg/kkr 0 4.10
Energy Consumption of energy kWh/kkr 18 26 Non-renewable energy kWh/kkr 11 6.4 Transport INCOMING TRANSPORT tonkm/kkr 6.6 11 Incoming transport (diesel) tonkm/kkr 0.57 3.2 Waste Waste, total kg/kkr 5.97 16.3 Landfill waste kg/kkr 0 0.320 Hazardous waste kg/kkr 0.0938 0.164 Emissions VOC (company) kg/kkr 0.011 0.017 VOC (energy production and transports)
kg/kkr 0.0027 0.0050
Carbon dioxide (energy production and transports)
kg/kkr 1.2 1.6
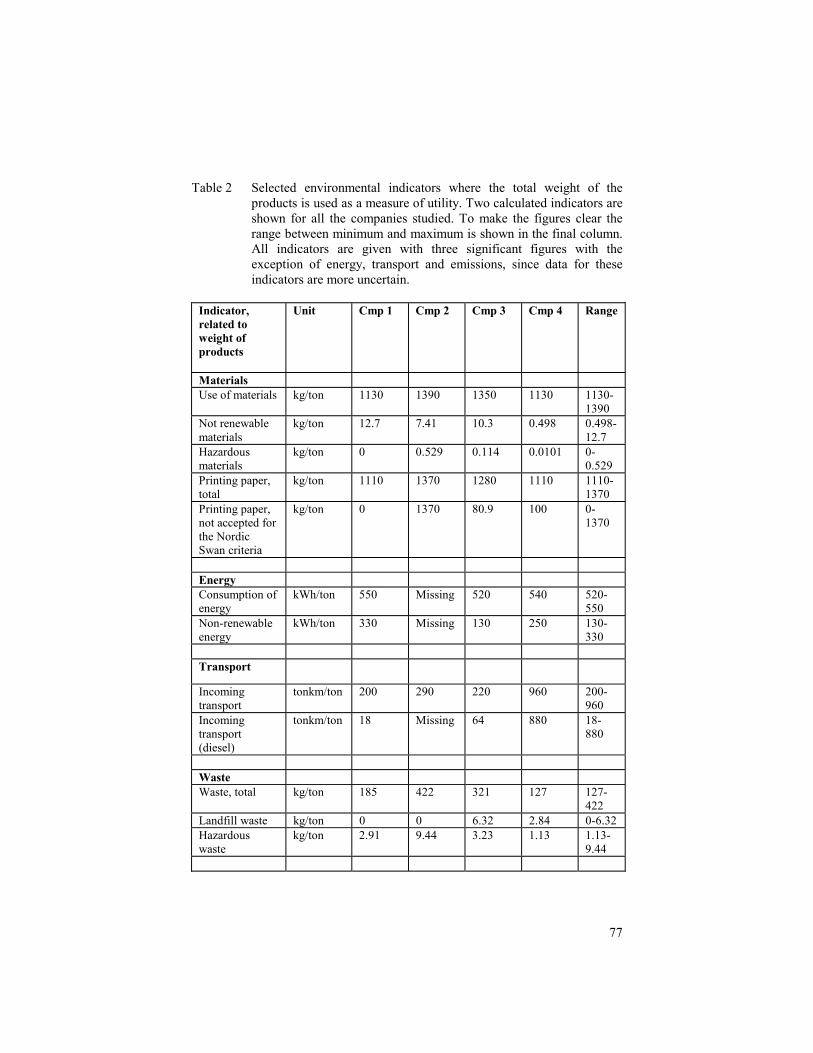
77
Table 2 Selected environmental indicators where the total weight of the products is used as a measure of utility. Two calculated indicators are shown for all the companies studied. To make the figures clear the range between minimum and maximum is shown in the final column. All indicators are given with three significant figures with the exception of energy, transport and emissions, since data for these indicators are more uncertain.
Indicator, related to weight of products
Unit Cmp 1 Cmp 2 Cmp 3 Cmp 4 Range
Materials Use of materials kg/ton 1130 1390 1350 1130 1130-
1390 Not renewable materials
kg/ton 12.7 7.41 10.3 0.498 0.498-12.7
Hazardous materials
kg/ton 0 0.529 0.114 0.0101 0-0.529
Printing paper, total
kg/ton 1110 1370 1280 1110 1110-1370
Printing paper, not accepted for the Nordic Swan criteria
kg/ton 0 1370 80.9 100 0-1370
Energy Consumption of energy
kWh/ton 550 Missing 520 540 520-550
Non-renewable energy
kWh/ton 330 Missing 130 250 130-330
Transport
Incoming transport
tonkm/ton 200 290 220 960 200-960
Incoming transport (diesel)
tonkm/ton 18 Missing 64 880 18-880
Waste Waste, total kg/ton 185 422 321 127 127-
422 Landfill waste kg/ton 0 0 6.32 2.84 0-6.32 Hazardous waste
kg/ton 2.91 9.44 3.23 1.13 1.13-9.44
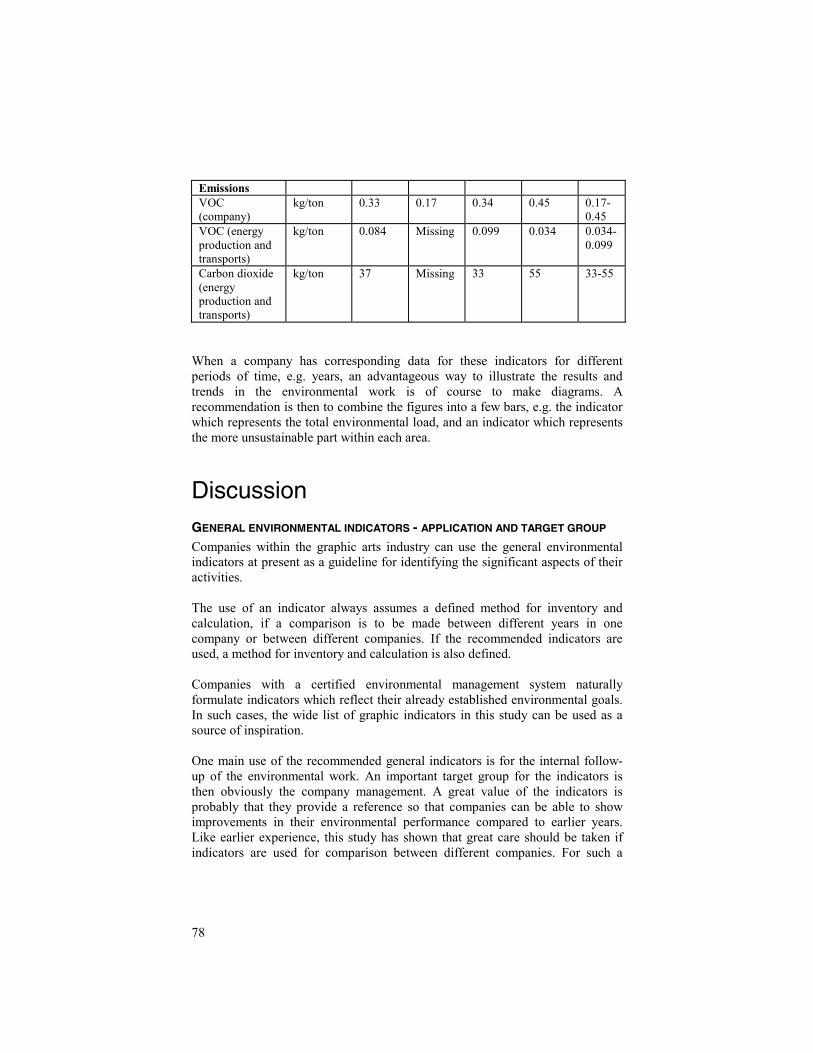
78
Emissions VOC (company)
kg/ton 0.33 0.17 0.34 0.45 0.17-0.45
VOC (energy production and transports)
kg/ton 0.084 Missing 0.099 0.034 0.034-0.099
Carbon dioxide (energy production and transports)
kg/ton 37 Missing 33 55 33-55
When a company has corresponding data for these indicators for different periods of time, e.g. years, an advantageous way to illustrate the results and trends in the environmental work is of course to make diagrams. A recommendation is then to combine the figures into a few bars, e.g. the indicator which represents the total environmental load, and an indicator which represents the more unsustainable part within each area.
DiscussionGENERAL ENVIRONMENTAL INDICATORS - APPLICATION AND TARGET GROUP
Companies within the graphic arts industry can use the general environmental indicators at present as a guideline for identifying the significant aspects of their activities. The use of an indicator always assumes a defined method for inventory and calculation, if a comparison is to be made between different years in one company or between different companies. If the recommended indicators are used, a method for inventory and calculation is also defined. Companies with a certified environmental management system naturally formulate indicators which reflect their already established environmental goals. In such cases, the wide list of graphic indicators in this study can be used as a source of inspiration. One main use of the recommended general indicators is for the internal follow-up of the environmental work. An important target group for the indicators is then obviously the company management. A great value of the indicators is probably that they provide a reference so that companies can be able to show improvements in their environmental performance compared to earlier years. Like earlier experience, this study has shown that great care should be taken if indicators are used for comparison between different companies. For such a
79
comparison to be relevant, it ought to be made between companies with similar activities working under similar conditions. Companies within the graphic arts industry will probably show very different figures for the indicators according to their types of activities. The general indicators can also be used for external information. They provide an opportunity for communicating the environmental performance in a general way. At present, the assumed target groups for the information are mainly customers and professional purchasers, since they have shown an early interest in environmental information. As the environmental requirements by purchasers become stronger, there will probably be a need of more information. The financial sector also has an additional need for information e.g. expenses for environmental investments, risk assessments, etc. Nevertheless, the recommended environmental indicators can be seen as a good base for the information to be published in the annual report. The number of indicators that is adequate for the recipient is of course dependent on who the recipient is. A private customer perhaps just has an interest in and an understanding of a couple of indicators. If the customer is an environmentally conscious company or a governmental organisation, the purchaser often has a greater need for and understanding of environmental issues. Professional purchasers therefore often ask for a lot of information sometimes gathered in extended questionnaires. If the graphic company as a supplier already has a prepared set of indicators which are environmentally relevant for its activities, it will make the work more efficient for all parties. An illustrative presentation of the indicators in the form of diagrams can make the interpretation and understanding easier, especially for trends over different time periods and how the result corresponds to established environmental goals.
RELEVANCE AND RELIABILITY OF THE RESULTS
Case studies of four companies do not make a scientific base in order to put representative figures on the recommended indicators. The main purpose of the case studies was to formulate how environmentally significant aspects could be identified, invented and calculated to provide indicators for a typical company in the graphic arts industry. The companies studied are comparatively large and have worked on environmental issues for quite a long time. This has been taken into account when we formulated the general recommendations. We have estimated that the recommended incoming transport of printing carrier constitutes such a large proportion of the total transport work that it can be seen as an indicator of the total transport. There is at present a lack of information
80
about the transport of materials other than the printing substrate into the companies, perhaps with the exception of outgoing products from a newspaper publisher. The influence on the result of an extended inventory of transport could be studied in the future. The study indicates that the use of chemical products does not have such a large influence on the outer environment as was earlier stated. Products defined as environmentally hazardous in the study are used to only a small extent in the companies studied. This is probably because only chemical products hazardous to the outer and not the inner environment have been included. Besides, the companies studied have earlier worked on environmental issues and have probably already done some cleaning.
FUTURE WORK AND DEVELOPMENT
The work on indicators should contribute to a decrease in the environmental load from the graphic art industries. The potential for achieving actual improvements within the different areas of general indicators has not yet been studied. In a follow-up study, it would be interesting to investigate where it is possible for the companies to take the most effective measures. To make it possible to follow the change over time of the environmental load from the graphic arts industry in general, there is a need for a fairly extensive collection of environmental data on general indicators. This would also make it possible for companies to make comparisons against mean value and “best in class” value for the different indicators, in order to improve their own situation. Since a number of areas have been identified in the study according to environmental issues in the graphic arts industry, this can lead to the formulation of general environmental goals. General environmental goals would make environmental work more offensive within the whole trade, and would make it easier for small companies that have difficulties in making extensive environmental inquiries on their own. It would also be interesting to develop supplementary indicators for printing methods other than lithographic offset and flexography.
AcknowledgementsThis report is based on a study that was carried out together with The Swedish Environmental Research Institute (IVL). The authors wish to thank Ola Hansén, Lars Zetterberg and Markus Åhman at IVL for inspiring co-operation. The study is fully described in an IMT Technical Report (Widing, 1999).
81
We especially thank the four companies; Nerikes Allehanda AB, Strålfors Svenska AB, Svenska Tryckcentralen AB and VLT Press AB, which have been involved in the case studies for their time, practical knowledge and valuable discussions. We also thank The Swedish Graphic Companies Federation and The Swedish Newspaper Publishers Association for their support of the project and active participation in the reference group. The study was financed by participating companies and organisations together with The Swedish Board for Industrial and Technical Development (NUTEK).
LiteratureAndersson, M., et al., (1998), Miljöledning i grafiska företag, IMT Dalhielm, R., Axelsson, U., (1995), Miljöprofilering - livscykelanalyser av
grafiska produkter. IMT Teknikrapport nr 4/95 Drivsholm, T. et al., (1997), Miljoeffekter og ressourceforbrug for 3 grafiske
produkter i et livscyklusperspektiv, Miljö- och Energiministeriet Miljöstyrelsen, Miljöprojekt nr 341
Enroth, M., et al., (1998), Miljöanpassad produktutveckling inom den grafiska mediebranschen - förutsättningar och intresse, IMT Teknikrapport nr 2/98
GA, Grafisk Arbejdsgiverförening, (1999), Nögletalsprojekt, Arbejdsrapport, Januar 1999
Högström, P., (1998), Ekonomiska mått till stöd för kvalitetsutveckling, Naturekonomihuset AB, Rapport 1998:57
ISO/DIS 14031, (1998), Environmental Management - Environmental Performance Evaluation – Guidelines
Marsanich A., (1998), Environmental Indicators in EMAS Environmental Statements, Fondazione Eni Enrico Mattei (FEEM), Working Papers 26-98
Naturvårdsverket, (1998), DeFacto 98 – Uppföljning av föreslagna nationella miljökvalitetsmål
NTM, (1999), Nätverket for Transporter och miljön, www.ntm.a.se 1999-04-27 OECD/GD(93)179, (1993), OECD Core Set of Indicators for Environmental
Performance Reviews, Environment Monographs No 83, Paris Sannum Barti, K., Söderberg, Å., (1996), På rätt spår – en benchmarkingstudie
av miljörapportering inom transportsektorn, IIIEE Communications 96:1, Lunds universitet
SIS Miljömarkning, (1998), Kriteriedokument for miljömärkning av trycksaker, version 2.0
SFS 1998:808, (1998), Miljöbalken SOU 1998:170, (1998), Gröna nyckeltal för en ekologiskt hållbar utveckling.
Miljövårdsberedningen UNEP, (1994), Company Environmental Reporting, Technical Report No 24

82
Widing, A., Enroth, M., Hansén, O., Zetterberg, L., (1999), Miljönyckeltal for den grafiska mediebranschen, IMT Teknikrapport nr 6/99
Zetterberg, L., (1997), Nyckeltal for bedömning av Sveriges branschers totala miljöpaverkan - metod och tillämpning, IVL rapport B 1263

83
Paper I
Paper II
Paper III
Paper IV

85
Promoting sustainability using businessspecific indicators
Maria Enroth, Framkom (Research Corporation for Media and Communication Technology)
Box 1243, SE-164 28 KISTA e-mail: [email protected]
AbstractThe civil society has a need to promote and follow up a development towards sustainability. Assignations concerning a sustainable development often have been made on a governmental level. One problem within the civil society is that specific trades of business or individual industrial companies have difficulties in adopting these assignations. Another problem for specific trades of business or individual companies is to cover all areas of the concept of sustainable development in their practical work with continual improvements. There is a need to break down governmental assignations, e.g., the Swedish National Environmental Quality Objectives, to targets on a more practical level for individual industrial companies. In order to connect the assignations on a governmental level for sustainable development to practical work within the graphic arts industry, we have made a literature survey of business specific indicator projects. Framkom has earlier developed a concept for general environmental indicators for the graphic arts industry (Enroth 2000) and we have now developed this concept even further in a study together with the newspaper industry. The developed concept illustrates the relationships between the environmental indicators and the Swedish National Environmental Quality Objectives and we have also suggested some indicators to illustrate economic and social aspects. General business specific indicators must describe significant aspects and must be based on scientific knowledge. They should also be easy to understand and communicate. The inventory process should be fairly simple and well defined. Definitions of system boundaries and inventory instructions are also very important for general indicators aiming at comparing regions or industrial sectors. This is of crucial importance if the indicators should be added on a national or international level. With such a formulation, general business specific indicators can be used to promote and follow up a development towards sustainability.
86
In this paper we discuss possibilities to promote and follow up sustainability through activities within SMEs in the industrial sector with examples from the graphic arts industry. This is done through a literature survey of business specific indicator projects and case studies within the trade.
IntroductionThe civil society has a need to promote and follow up a development towards sustainability. Assignations concerning a sustainable development often have been made on a governmental level reflecting national and/or international agreements. One problem within the civil society is that specific trades of business or individual industrial companies have difficulties in adopting these assignations. Another problem for specific trades of business or individual companies is to cover all areas of the concept of sustainable development in their practical work with continual improvements. So far, most work concerning sustainability within small and medium sized enterprises, SME, has been carried out in the environmental and economical areas while leaving out social aspects. There is a need to break down governmental assignations, e.g., the Swedish National Environmental Quality Objectives, to targets on a more practical level for individual industrial companies. The basic purpose of an indicator is to condense and focus complex information, thereby facilitating the solution, understanding and communication of a problem. One of the most powerful and well-tested indicator frameworks is the PSR-model, initially proposed by OECD in 1993. PSR stands for Pressure, State, Response and the model since then has been developed into the DPSIR-model, where suggested indicators for Driving forces and Impact also have been added. The DPSIR-model today forms the base for the indicator work performed by e.g., OECD, the UN, the World Bank, EEA and the Swedish EPA. There are at least three indicator frameworks that have a very systematic structure for their indicators; UNCSD1, WBCSD2 and GRI3. The two last ones have a very strong industrial focus (Carlsson Reich 2001). The difficulties for individual companies to cover all areas of the concept of sustainable development in their practical work are also illustrated on a more comprehensive level. The practical use of social and economic indicators is also limited. In a general survey of current indicator frameworks and projects, where some 40 projects have been surveyed, only a handful of them cover all three aspects of sustainability; UNCSD, OECD PSR, Eurostat, GRI and UK Quality of Life Counts (Carlsson Reich 2001).
1 United Nations Commission for Sustainable Development 2 World Business Council for Sustainable Development 3 Global Reporting Initiative
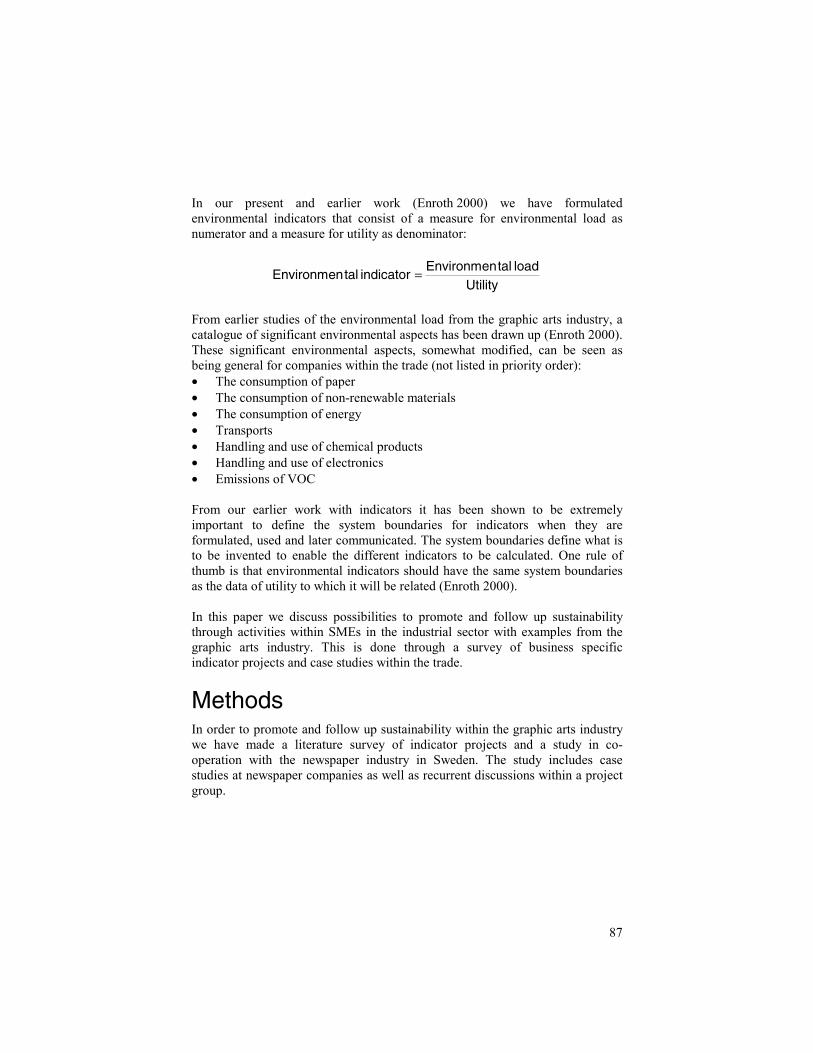
87
In our present and earlier work (Enroth 2000) we have formulated environmental indicators that consist of a measure for environmental load as numerator and a measure for utility as denominator:
UtilityloadtalEnvironmen
indicatortalEnvironmen =
From earlier studies of the environmental load from the graphic arts industry, a catalogue of significant environmental aspects has been drawn up (Enroth 2000). These significant environmental aspects, somewhat modified, can be seen as being general for companies within the trade (not listed in priority order): • The consumption of paper • The consumption of non-renewable materials • The consumption of energy • Transports • Handling and use of chemical products • Handling and use of electronics • Emissions of VOC From our earlier work with indicators it has been shown to be extremely important to define the system boundaries for indicators when they are formulated, used and later communicated. The system boundaries define what is to be invented to enable the different indicators to be calculated. One rule of thumb is that environmental indicators should have the same system boundaries as the data of utility to which it will be related (Enroth 2000). In this paper we discuss possibilities to promote and follow up sustainability through activities within SMEs in the industrial sector with examples from the graphic arts industry. This is done through a survey of business specific indicator projects and case studies within the trade.
MethodsIn order to promote and follow up sustainability within the graphic arts industry we have made a literature survey of indicator projects and a study in co-operation with the newspaper industry in Sweden. The study includes case studies at newspaper companies as well as recurrent discussions within a project group.
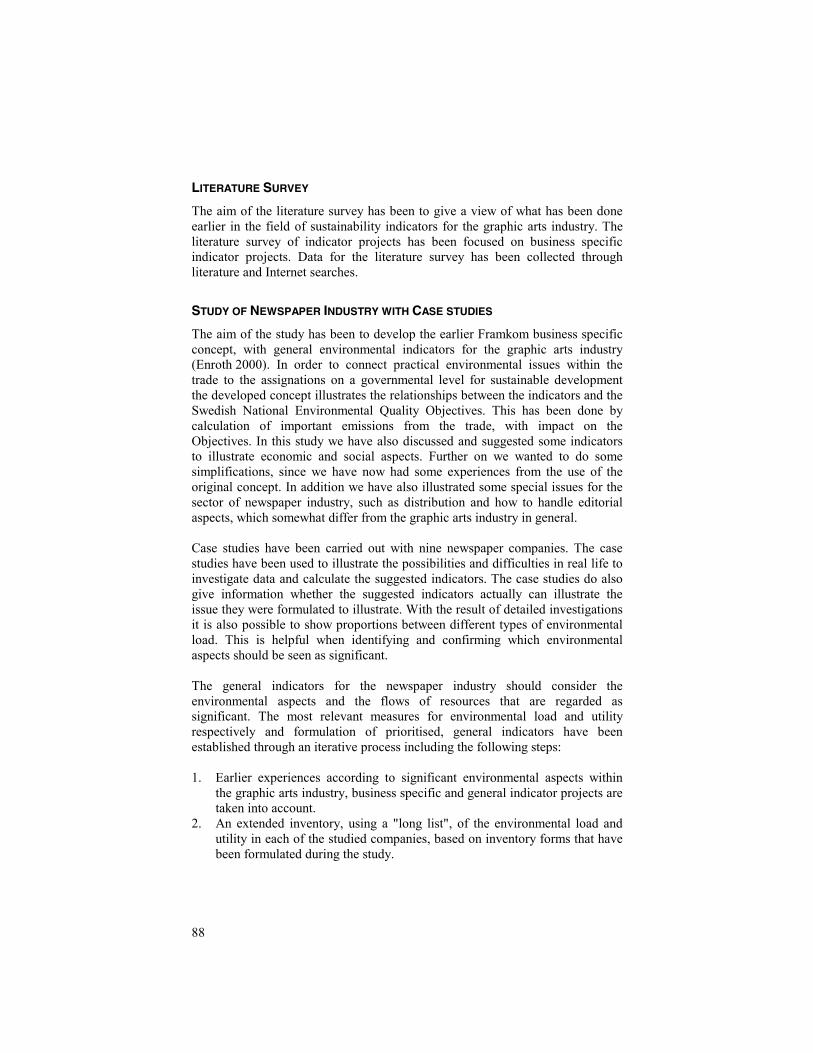
88
LITERATURE SURVEY
The aim of the literature survey has been to give a view of what has been done earlier in the field of sustainability indicators for the graphic arts industry. The literature survey of indicator projects has been focused on business specific indicator projects. Data for the literature survey has been collected through literature and Internet searches.
STUDY OF NEWSPAPER INDUSTRY WITH CASE STUDIES
The aim of the study has been to develop the earlier Framkom business specific concept, with general environmental indicators for the graphic arts industry (Enroth 2000). In order to connect practical environmental issues within the trade to the assignations on a governmental level for sustainable development the developed concept illustrates the relationships between the indicators and the Swedish National Environmental Quality Objectives. This has been done by calculation of important emissions from the trade, with impact on the Objectives. In this study we have also discussed and suggested some indicators to illustrate economic and social aspects. Further on we wanted to do some simplifications, since we have now had some experiences from the use of the original concept. In addition we have also illustrated some special issues for the sector of newspaper industry, such as distribution and how to handle editorial aspects, which somewhat differ from the graphic arts industry in general. Case studies have been carried out with nine newspaper companies. The case studies have been used to illustrate the possibilities and difficulties in real life to investigate data and calculate the suggested indicators. The case studies do also give information whether the suggested indicators actually can illustrate the issue they were formulated to illustrate. With the result of detailed investigations it is also possible to show proportions between different types of environmental load. This is helpful when identifying and confirming which environmental aspects should be seen as significant. The general indicators for the newspaper industry should consider the environmental aspects and the flows of resources that are regarded as significant. The most relevant measures for environmental load and utility respectively and formulation of prioritised, general indicators have been established through an iterative process including the following steps: 1. Earlier experiences according to significant environmental aspects within
the graphic arts industry, business specific and general indicator projects are taken into account.
2. An extended inventory, using a "long list", of the environmental load and utility in each of the studied companies, based on inventory forms that have been formulated during the study.
89
3. The calculation and analysis of environmental indicators for the studied companies based on all the data in the extended inventory.
4. Discussions in the project group and selection of the most relevant measures for environmental load and utility respectively based on the results of listed items, earlier experiences, Swedish Environmental Quality Objectives, etc.
5. Development of a "short list" of prioritised, general indicators based on relevant requirements.
All the instructions for the extended inventory and for the calculations of indicators have been repeatedly discussed in the project group. The inventory has been made in several steps with interim calculations and recalculations of the indicators. The nine companies that have participated in the case studies include newspaper companies and newspaper printers. Most of these companies have been working for quite a long time in a strategic and organised way on environmental issues. The choice of companies has mainly been based on the interest and motivation to participate in the study. In this study, the system boundary has been placed around the company property, which means that they embrace all that is taken in and out through the company gates. Exceptions are however made for the use of energy and transports since this can be expected to cause a significant environmental load. When emissions caused by the use of electricity, district heating and transports are counted, the system boundary is moved upstream. For newspaper companies without printing within their own company, the suggested set of indicators extend the strict system boundary of their companies.
ResultsLITERATURE SURVEY
The relation to forestry and pulp and paper industry is very important for the printing industry, since the consumption of paper when producing traditional printed matter is an outstanding significant environmental aspect. Environmentally conscious printing industries and their customers take part of the development of sustainable forestry, where the FSC (FSC 2001) and PEFC (PEFC 2001) systems are the most common. In addition to sustainable forestry, the production processes in the pulp and paper mills are of great importance to the environmental load of printed matter with a life cycle perspective. In the cases of pulp and paper production there are extensive activities with systematic and periodical collection of data for different types of indicators (Skogsindustrierna 2000).
90
Experiences of environmental indicators within the graphic arts industry have been obtained in Sweden (Enroth 2000, IIIEE 2001, Cadra 1998, Cook 1997) and in Denmark (GA 1999). Some experiences on sustainability indicators for the printing industry have been obtained within a research EU project co-ordinated from the United Kingdom (SPRU 2001). The early Framkom concept The earlier developed Framkom concept of general environmental indicators for the graphic arts industry (Enroth 2000) has thirteen defined measures for environmental load and two measures for utility. The selected measures of environmental load are covering the following areas: • Materials • Energy • Transports • Waste • Emissions Although one of the measures of utility is a financial measure, the annual turnover, this concept does not fully meet the need of sustainability indicator concepts. This is mainly because the social aspects are left out. The further developed concept is presented below. Cleaner Technology Performance Indicators for SMEs (CTPISME) The objective of a EU project, 1998-1999, co-ordinated from Sweden (IIIEE 2001), was to develop industry sector specific Cleaner Technology Performance Indicators (CTPI) for selected SME industry sectors. This project has attempted to develop criteria for evaluation of technology performance based on indicators of three dimensions: economic, technological and environmental. A study of the lithographic printing industry within this project was published in a Master Theses where the final set of indicators for the printing sector were the following (Cadra 1998): Process stage EPIs (Environmental Performance Indicators) Pre-press • Quantity of fix solution per quantity of film produced • Quantity of developer solution per quantity of film
produced • Quantity of plate developer solution used per development
of 100 plates Press • Total energy consumption per one ton of final product • Quantity of IPA (iso-propanol alcohol) used per 10000
impressions • Quantity of cleaning solutions per unit of ink consumed • Emissions per unit of ink consumed • Emissions per amount of chemicals consumed annually
91
Post-press • Overproduction as a percentage of overall production • Paper rejects due to post-press operations (binding,
folding, etc.) These indicators focus on environmental dimensions and indirectly on technological and economic dimensions. Indicators for paper-use efficiency are not addressed properly which is also pointed out by the author. The measures recommended for the denominator are heterogeneous. The indicators are also very business specific which makes them difficult to compare with other industrial sectors. An earlier study similar to this was also carried out at IIIEE (Cook 1997). This study was more specific on the VOC-emission issue of printing industry and suggested more specified indicators on VOC in perspective of improvements according to best available technique (BAT), BAT currently in practice (BATCIP) and best operating practices (BOP). The GA concept During a study in Denmark (GA 1999) practical inventory tools for indicators, with the purpose of describing and reducing the environmental load from offset printing, were developed. The indicators that were formulated were then tested if they could be used as general indicators within the trade and/or if they could be used for guidance of improvements. The tools were developed and adjusted together with printing industries. Inventory tools were developed for the areas of: • Photo chemicals and rinsing water • Printing inks • Alcohol in dampening solution • Cleaning agents• Paper The type of indicators that is suggested covers environmental load. The indicators and the inventory instructions are very detailed. The project showed that suggested indicators could be used for formulating environmental targets on a process level. Measuring the Environmental Performance of Industry (MEPI) This EU project aims to encourage a standardised approach to environmental performance evaluation (EPE) by firms and suggest more uniform quantitative environmental performance indicators (EPI) (SPRU 2001). A central purpose was also to simplify the presentation of complex information. Therefore the indicators ought to be applicable to companies and to different end users. The aim was to map and measure the environmental performance of 400-500 firms. Six industrial sectors were studied: electricity, cement, textiles, computers,
92
ammonia and printing industry. The research team is co-ordinated by the University of Sussex, UK. Project duration was February 1998 - April 2000. The final research report is in preparation. This study focuses on quantitative indicators of: • Materials use • Energy use • Waste emissions Within the project, development of three types of indicators were planned: • Physical indicators (absolute and relative), i.e. amount of solid waste per
unit of output. • Economic indicators that link physical data to data on business
performance, i.e. emissions related to added value. • Sustainability indicators that link environmental impacts to physical data on
inputs, emissions and outputs, i.e. acidification potential per unit of output. The types of indicators defined to illustrate sustainability within this project represent a practical industrial user perspective. This definition does not fully meet the requirements of sustainability indicators since social aspects are left out. Private business specific indicators There are also private initiatives in the field of environmental indicators. Some examples can be seen in environmental reports from companies. Stralfors was one of the participating companies in the early Framkom study (Enroth 2000). The Framkom concept has been used in the external environmental report (Stralfors 2001). Elanders also uses environmental and economic indicators in their annual environmental report (Elanders 2001). The company has, for the second year in row got the Swedish reward “The environmental report of the year”. The indicators used are for example: • Paper waste compared with last year (%) • Consumption of energy (MWh/tonne product) • Consumption of organic solvents (kg/tonne product) • Share of aromatic cleaning agents (%) • Environmental-related costs • Environmental-related revenue • Environmental-related investments
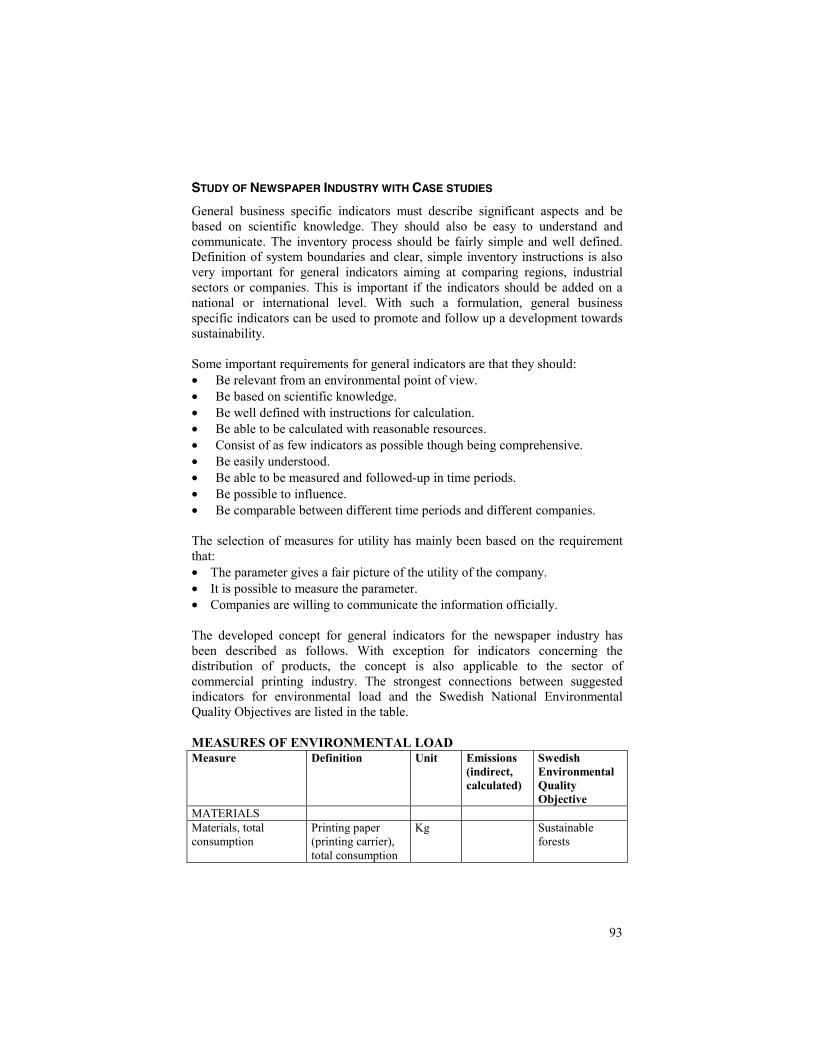
93
STUDY OF NEWSPAPER INDUSTRY WITH CASE STUDIES
General business specific indicators must describe significant aspects and be based on scientific knowledge. They should also be easy to understand and communicate. The inventory process should be fairly simple and well defined. Definition of system boundaries and clear, simple inventory instructions is also very important for general indicators aiming at comparing regions, industrial sectors or companies. This is important if the indicators should be added on a national or international level. With such a formulation, general business specific indicators can be used to promote and follow up a development towards sustainability. Some important requirements for general indicators are that they should: • Be relevant from an environmental point of view. • Be based on scientific knowledge. • Be well defined with instructions for calculation. • Be able to be calculated with reasonable resources. • Consist of as few indicators as possible though being comprehensive. • Be easily understood. • Be able to be measured and followed-up in time periods. • Be possible to influence. • Be comparable between different time periods and different companies. The selection of measures for utility has mainly been based on the requirement that: • The parameter gives a fair picture of the utility of the company. • It is possible to measure the parameter. • Companies are willing to communicate the information officially. The developed concept for general indicators for the newspaper industry has been described as follows. With exception for indicators concerning the distribution of products, the concept is also applicable to the sector of commercial printing industry. The strongest connections between suggested indicators for environmental load and the Swedish National Environmental Quality Objectives are listed in the table. MEASURES OF ENVIRONMENTAL LOAD Measure Definition Unit Emissions
(indirect, calculated)
Swedish Environmental Quality Objective
MATERIALS Materials, total consumption
Printing paper (printing carrier), total consumption
Kg Sustainable forests
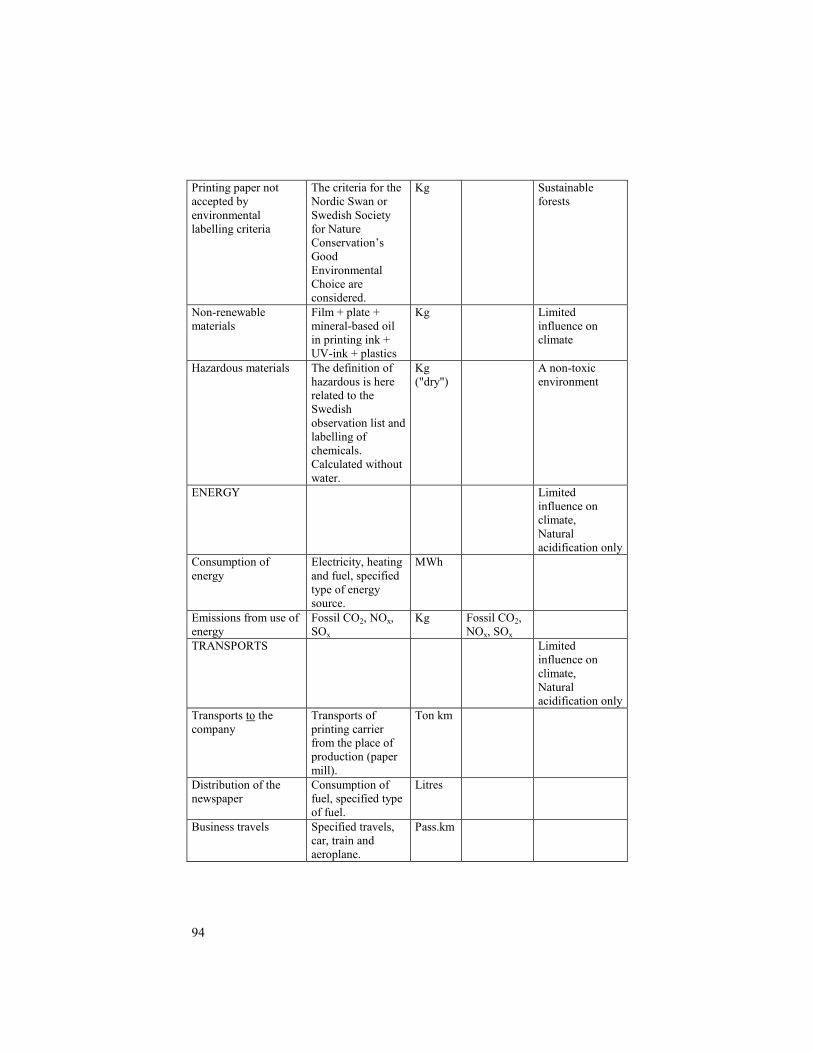
94
Printing paper not accepted by environmental labelling criteria
The criteria for the Nordic Swan or Swedish Society for Nature Conservation’s Good Environmental Choice are considered.
Kg Sustainable forests
Non-renewable materials
Film + plate + mineral-based oil in printing ink + UV-ink + plastics
Kg Limited influence on climate
Hazardous materials The definition of hazardous is here related to the Swedish observation list and labelling of chemicals. Calculated without water.
Kg ("dry")
A non-toxic environment
ENERGY Limited influence on climate, Natural acidification only
Consumption of energy
Electricity, heating and fuel, specified type of energy source.
MWh
Emissions from use of energy
Fossil CO2, NOx, SOx
Kg Fossil CO2, NOx, SOx
TRANSPORTS Limited influence on climate, Natural acidification only
Transports to the company
Transports of printing carrier from the place of production (paper mill).
Ton km
Distribution of the newspaper
Consumption of fuel, specified type of fuel.
Litres
Business travels Specified travels, car, train and aeroplane.
Pass.km
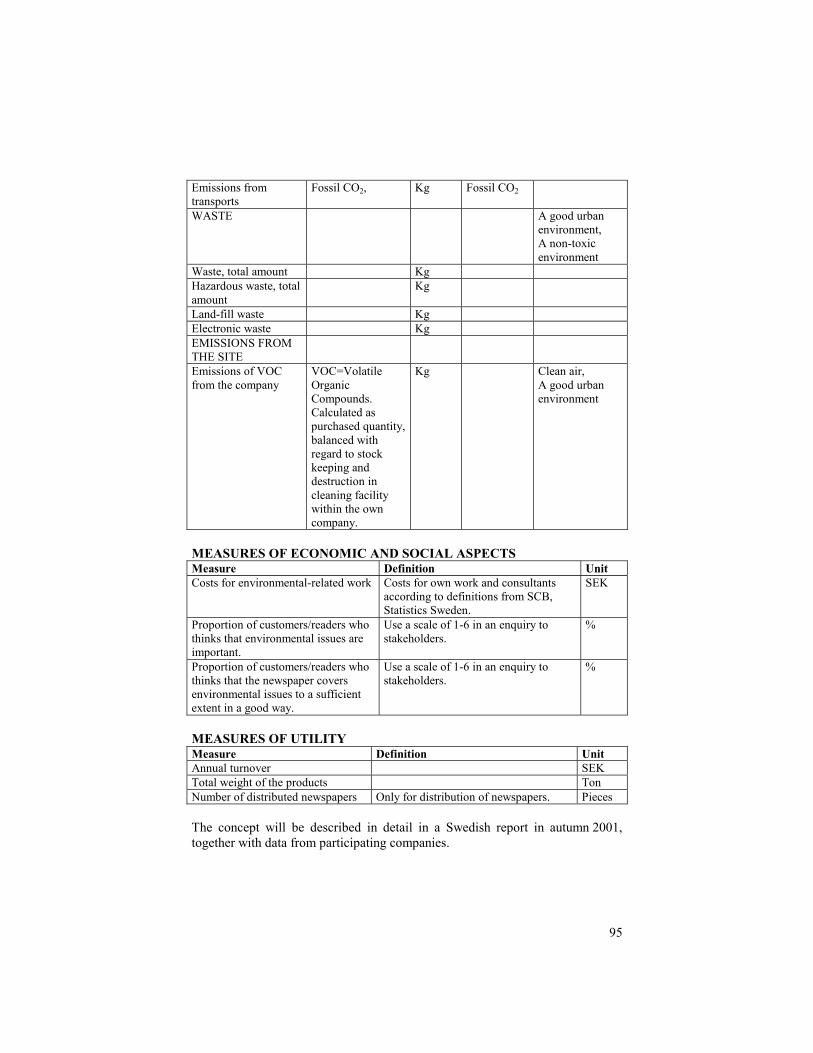
95
Emissions from transports
Fossil CO2, Kg Fossil CO2
WASTE A good urban environment, A non-toxic environment
Waste, total amount Kg Hazardous waste, total amount
Kg
Land-fill waste Kg Electronic waste Kg EMISSIONS FROM THE SITE
Emissions of VOC from the company
VOC=Volatile Organic Compounds. Calculated as purchased quantity, balanced with regard to stock keeping and destruction in cleaning facility within the own company.
Kg Clean air, A good urban environment
MEASURES OF ECONOMIC AND SOCIAL ASPECTS Measure Definition Unit Costs for environmental-related work Costs for own work and consultants
according to definitions from SCB, Statistics Sweden.
SEK
Proportion of customers/readers who thinks that environmental issues are important.
Use a scale of 1-6 in an enquiry to stakeholders.
%
Proportion of customers/readers who thinks that the newspaper covers environmental issues to a sufficient extent in a good way.
Use a scale of 1-6 in an enquiry to stakeholders.
%
MEASURES OF UTILITY Measure Definition Unit Annual turnover SEK Total weight of the products Ton Number of distributed newspapers Only for distribution of newspapers. Pieces The concept will be described in detail in a Swedish report in autumn 2001, together with data from participating companies.
96
DiscussionTo reach the overall objectives for civil society according to governmental assignations for sustainable development there is a need of a "bottom-up" perspective. Specific trades of business should develop their general indicators and general targets for the trade. Framkom has had the ambition to connect the development of the business specific concept for printing industry to the basis of the international indicator frameworks that have industrial focus and to the Swedish National Environmental Quality Objectives. We have concentrated on the formulation of indicators in a related form where the environmental load is related to the utility of companies. One recommended measure for the utility of companies is a financial measure, the annual turnover. Another recommended measure for utility is related to the production, tonnes of printed matter. It is advantageous that both types of measures are represented. Companies within the printing industry have a need to communicate results of their environmental work and to be able to show continual improvements. The driving forces are to a great extent customer's demands and the requirements of certified environmental management systems. There is also a wish to be able to show and communicate the connection between the environmental aspects of the trade and the Swedish Environmental Quality Objectives or the major environmental threats. Due to the awareness of environmental issues within the trade and their customers, the trade is positive to benchmarking if the right prerequisites are given. The literature survey indicates that business specific indicators for the printing industry, developed in common projects, are uncommon and have only been used to a limited degree. The survey also shows that indicators for all aspects of sustainability, especially for social aspects, are not yet well developed or used. This is not only valid for the printing industry. We have made a limited number of suggestions of economic and social indicators in our concept because there are problems with finding indicators with general definitions in these areas. Companies for example have different view on how to define environmental-related investments. In addition, the indicator is also difficult to interpret - what is good and what is bad? When it comes to social aspects, customer relationship is important for companies. For newspaper companies the possibilities to inform, educate and generate opinion in favour of environmental issues are of interest, but have to be balanced with the "code of honour" to be objective.
97
AcknowledgementsThe author especially would like to thank Angelica Widing at Framkom for an inspiring co-operation and fruitful discussions during the study. This report is partly based on one study and one literature survey that were carried out as joint projects within the Industrial Research Institutes in Sweden (IRIS). The author would like to thank colleagues at the Institutes IVF, IVL, SIK and Tratek for a stimulating co-operation. The joint study will be published during the year of 2001 and the joint literature survey has been described in a report (Carlsson Reich 2001). Framkom thank the participating companies, which have been involved in the business specific case studies for their time, practical knowledge and valuable discussions. We also thank The Swedish Newspaper Publishers Association for their support of the project and active participation in the reference group. The studies were financed by participating companies and together with The Swedish Board for Industrial and Technical Development (NUTEK).
LiteratureCadra, M., (1998), Development of Operational Environmental Performance
Indicators for the Lithographic Printing Process: Sheet-fed Offset, Master Thesis, IIIEE, Lund University.
Carlsson Reich, M., et al. (2001), Sustainability Indicators - a survey and assessment of current indicator frameworks. IVL Report A20357.
Cook, K., (1997) Developing BAT Based EPIs for Europe's VOC Emitting SMEs, Master Thesis, IIIEE, Lund University.
Elanders (April 2001). http://www.elanders.se/ Enroth, M., A. Widing, (2000), Environmental indicators in the graphic arts
industry, Advances in Printing Science and Technology, Volume 26, pp 337-356, Pira International Ltd.
FSC (April 2001). FSC Principles and Criteria, document 1.2 Revised February 2000, http://www.fscoax.org
GA, Grafisk Arbejdsgiverforening, (1999), Noegletalsprojekt, Arbejdsrapport, Januar 1999
IIIEE (April 2001) http://www.lu.se/IIIEE/projects/ctpi/intermediate_results.html
PEFC (April 2001). Common elements and requirements of PEFC – Technical document 2000-11-20, http://www.pefc.org
Skogsindustrierna (November 2000) http://www.skogsindustrierna.org Skogsindustrins utsläpp, avfallsmängder och energiförbrukning 1999, (2000),
Naturvårdverket Rapport 5114, Naturvårdsverkets förlag

98
SPRU. (April 2001). http://www.sussex.ac.uk/spru/environment/research/mepi.html
Stralfors (April 2001). http://www.stralfors.se
99
Paper I
Paper II
Paper III
Paper IV

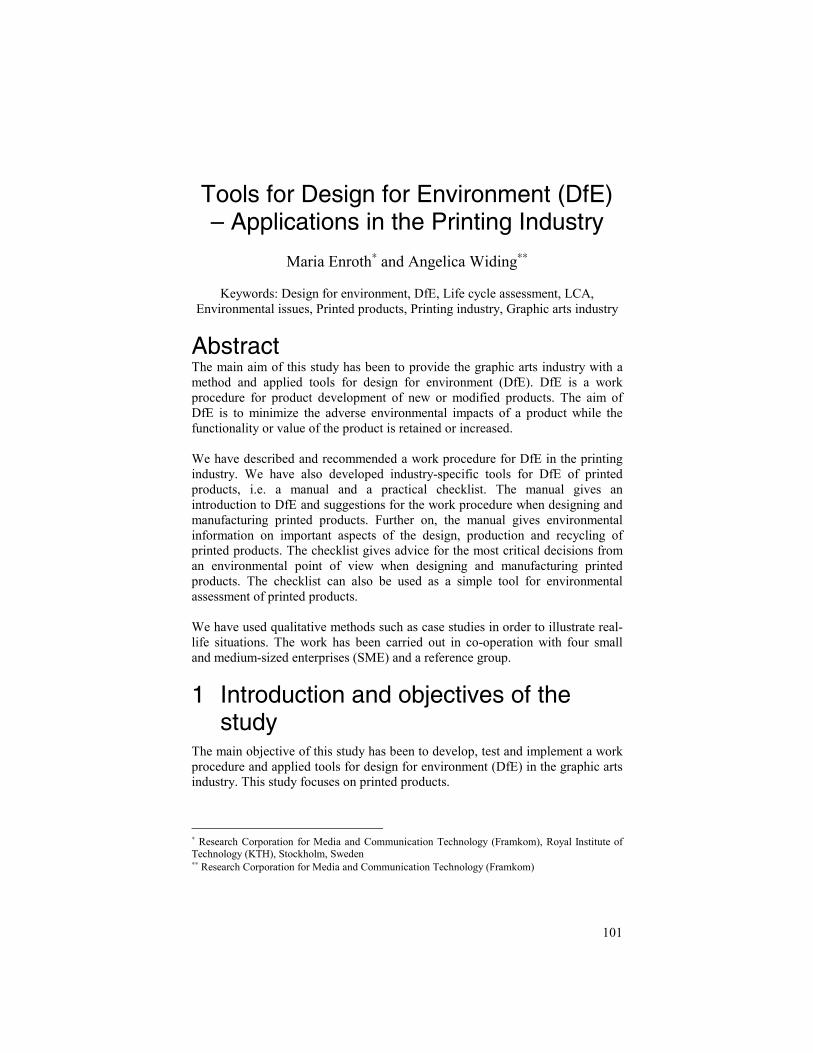
101
Tools for Design for Environment (DfE)– Applications in the Printing Industry
Maria Enroth∗ and Angelica Widing∗∗
Keywords: Design for environment, DfE, Life cycle assessment, LCA, Environmental issues, Printed products, Printing industry, Graphic arts industry
Abstract The main aim of this study has been to provide the graphic arts industry with a method and applied tools for design for environment (DfE). DfE is a work procedure for product development of new or modified products. The aim of DfE is to minimize the adverse environmental impacts of a product while the functionality or value of the product is retained or increased. We have described and recommended a work procedure for DfE in the printing industry. We have also developed industry-specific tools for DfE of printed products, i.e. a manual and a practical checklist. The manual gives an introduction to DfE and suggestions for the work procedure when designing and manufacturing printed products. Further on, the manual gives environmental information on important aspects of the design, production and recycling of printed products. The checklist gives advice for the most critical decisions from an environmental point of view when designing and manufacturing printed products. The checklist can also be used as a simple tool for environmental assessment of printed products. We have used qualitative methods such as case studies in order to illustrate real-life situations. The work has been carried out in co-operation with four small and medium-sized enterprises (SME) and a reference group.
1 Introduction and objectives of thestudy
The main objective of this study has been to develop, test and implement a work procedure and applied tools for design for environment (DfE) in the graphic arts industry. This study focuses on printed products.
∗ Research Corporation for Media and Communication Technology (Framkom), Royal Institute of Technology (KTH), Stockholm, Sweden ∗∗ Research Corporation for Media and Communication Technology (Framkom)
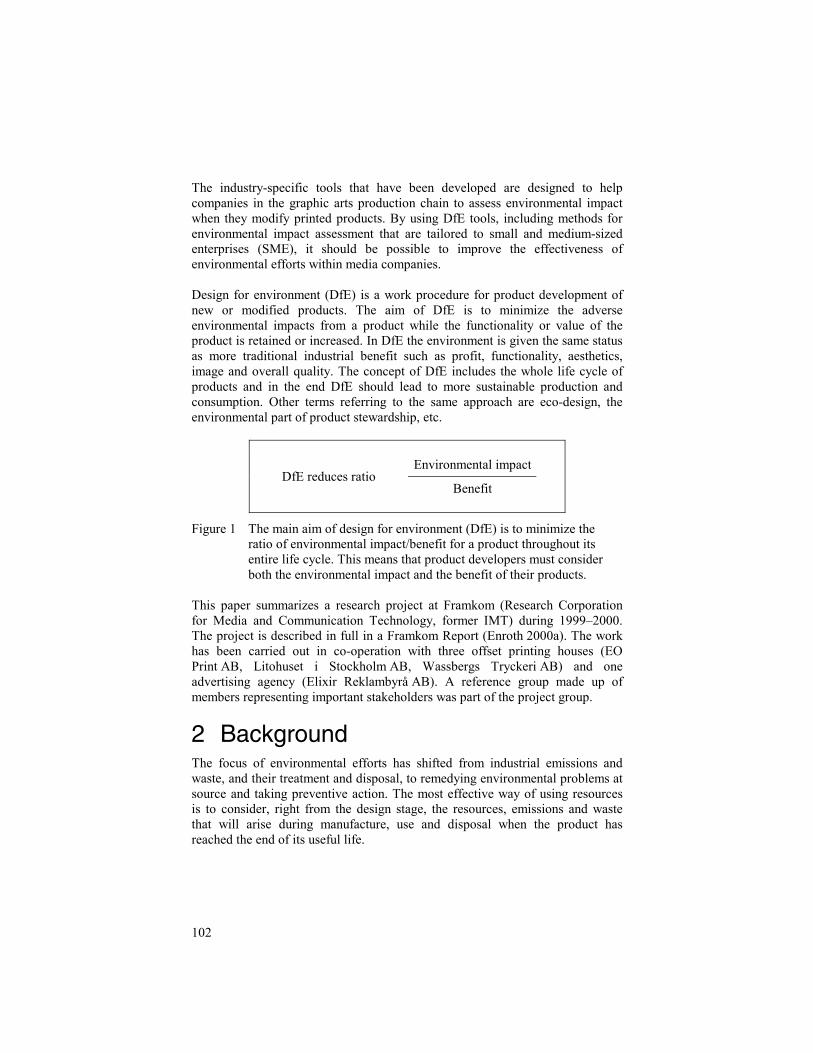
102
The industry-specific tools that have been developed are designed to help companies in the graphic arts production chain to assess environmental impact when they modify printed products. By using DfE tools, including methods for environmental impact assessment that are tailored to small and medium-sized enterprises (SME), it should be possible to improve the effectiveness of environmental efforts within media companies. Design for environment (DfE) is a work procedure for product development of new or modified products. The aim of DfE is to minimize the adverse environmental impacts from a product while the functionality or value of the product is retained or increased. In DfE the environment is given the same status as more traditional industrial benefit such as profit, functionality, aesthetics, image and overall quality. The concept of DfE includes the whole life cycle of products and in the end DfE should lead to more sustainable production and consumption. Other terms referring to the same approach are eco-design, the environmental part of product stewardship, etc.
Environmental impact DfE reduces ratio
Benefit
Figure 1 The main aim of design for environment (DfE) is to minimize the ratio of environmental impact/benefit for a product throughout its entire life cycle. This means that product developers must consider both the environmental impact and the benefit of their products.
This paper summarizes a research project at Framkom (Research Corporation for Media and Communication Technology, former IMT) during 1999–2000. The project is described in full in a Framkom Report (Enroth 2000a). The work has been carried out in co-operation with three offset printing houses (EO Print AB, Litohuset i Stockholm AB, Wassbergs Tryckeri AB) and one advertising agency (Elixir Reklambyrå AB). A reference group made up of members representing important stakeholders was part of the project group.
2 BackgroundThe focus of environmental efforts has shifted from industrial emissions and waste, and their treatment and disposal, to remedying environmental problems at source and taking preventive action. The most effective way of using resources is to consider, right from the design stage, the resources, emissions and waste that will arise during manufacture, use and disposal when the product has reached the end of its useful life.
103
Proactive environmental efforts should focus on products and their functionality. The term product is used here in the wider sense to include both goods and services. For companies that manufacture goods or supply services, rather than producing raw materials, environmental reviews often reveal that the greatest environmental impact these companies produce is due to the goods or services themselves. Studies show, however, that few of the environmental targets these companies set up as part of their environmental management systems actually deal with the total environmental impact of manufactured products. To ensure the continuous improvement of environmental management systems and increase financial profits, the focus of attention needs to be shifted towards companies’ own products (Enroth 2000b, Zackrisson 1999). 2.1 GENERAL METHODS FOR WORKING WITH PRODUCT DEVELOPMENT AND
DFE There are currently several different general methods and tools for working with product development and DfE. However, these are usually designed for large companies that generally have greater resources and motivation for advanced product development than small and medium-sized companies. Existing approaches and methods for working on product development include the following (Lundgren 2000, Ryding 1995): • FMEA, Failure Mode and Effects Analysis • FTA, Failure Tree Analysis • QFD, Quality Function Deployment • LCC, Life Cycle Cost accounting • LCA, Life Cycle Assessment • CERA, Cumulative Energy Requirements Analysis • MET matrix, for Materials, Energy, Toxicity • MFA, Material Flow Analysis • MAIA, Material Intensity Analysis What distinguishes general tools for product development, such as FMEA, FTA and QFD, from DfE tools is that the latter should also include some way of assessing various environmental factors. A Life Cycle Analysis (LCA) is a method for analysing and assessing the potential environmental impact of products. By following the product from cradle to grave we can chart and analyse the use of resources and emissions of the various stages in the life cycle. At present, however, the LCA is a very resource-intensive method. In order to encourage the widespread use of DfE it is therefore very important to develop tools that are simpler to apply than the life cycle analysis (LCA), but which still give valuable assistance. By simpler, we mean tools that are easier to use. Simplified methods can be powerful in product development, but the results from them should primarily be used internally, since every logical step of the analysis cannot be scientifically derived. Simple methods and tools for DfE are
104
often limited to an inventory of materials and energy flows, such as CERA, the MET matrix, MFA and MAIA. Work on product development and DfE are closely linked to various types of product ecolabelling schemes. Adapting a product to meet ecolabelling criteria that are laid down by a third party, or within an industrial sector, can be one way of improving a product’s environmental performance. The ecolabelling scheme that currently applies to printed products in Scandinavia is the Nordic Swan. A number of publications that describe general methods and tools for DfE (Behrendt 1997, Brezet 1997, Fiksel 1996, Hanssen 1997, ISO/PDTR 14062.4 2001,) have provided inspiration and ideas for the DfE tools we have developed for the graphic arts industry. Experience shows that general guidelines for DfE must be tailored to the type of industry or product, in order to be used effectively. This is especially important because DfE tools require a large amount of specific environmental information about the type of products, as well as a good knowledge of current production circumstances. For the purposes of our study it was important to find ways for small companies that have limited resources to use DfE. Furthermore, the design process in the graphic arts industry is very rapid, which puts special demands on working methods and tools. It was also important to encourage the involvement of all players in the graphic arts production chain in DfE work. 2.2 INITIATIVE FOR DFE WORK IN THE GRAPHIC ARTS INDUSTRY In Sweden, the focus of environmental efforts in the graphic arts industry has shifted from meeting environmental legislation to meeting the environmental demands of customers. This has taken place alongside rapid, wide-ranging and continuous technical development, including the move to digitalisation and increasingly tighter lead times. We have only found a few initiatives for DfE work in the graphic arts industry. The most fully developed initiative is a Danish project (Skovgaard 1997). In Holland, printing companies have been involved in DfE work that is linked to TNO, however it has not been possible to publish this work (Timmers 1998). The term product development, as used in the traditional sense of working in product development teams with tools such as FMEA and QFD, has not yet been consciously applied in the graphic arts industry. One of the likely reasons is that printed products are generally very short-lived. Graphic arts production itself has however been described in a systematic way. One systematic description of the production flow in graphic arts has been given by Johansson (Johansson 1998). This describes graphic arts production using
105
nine different production stages divided into three phases. These three phases are called the idea phase, creative production and industrial production. The process begins with the creation of ideas, followed by creative production, during which the product is still being shaped and modified. The final phase, industrial production, involves realising the decisions and designs agreed in the earlier phases. Rosenqvist defines product development for media products as a phase that is completely isolated from both the creative phase, which produces the content of the media product (text, images, sound, etc.), and the production phase (Rosenqvist 2000). The product development process itself focuses on creating concepts, making prototypes, testing and evaluating various product concepts and business concepts. Rosenqvist’s definition of the product development phase is equivalent to the idea phase described above (Johansson 1998). 2.3 ENVIRONMENTAL IMPACT OF PRINTED PRODUCTS One requirement for industry-specific DfE is a large amount of relevant environmental data. The environmental impact of printed products depends on the types of consumable materials that are used to produce it, such as paper, plastics, inks, adhesives, etc. Environmental impact also depends on the choice of printing method, machinery, process chemicals and materials that are used in manufacture. The choice of means of transport and the distances for acquiring the materials and delivering the product also play a part. According to a literature survey that was carried out while developing general environmental indicators for the graphic arts industry (Widing 1999) and our subsequent work, the following environmental aspects can generally be regarded as significant in printed products (not in order of priority): • Consumption of printing paper (or other printing medium) • Handling of chemical products • Consumption of ink • Consumption of energy • Transport • Emissions of volatile organic compounds (VOC) into the air • Handling of electronics The results of several life cycle analyses have shown that the consumption of paper (forestry, pulp & paper manufacture) accounts for the largest single environmental impact, 30–70% of the total environmental impact of printed products (Axel Springer Verlag 1998, Dalhielm 1995, Drivsholm 1997). Energy consumption during printing plays a major role in environmental impact (Virtanen 1995).
106
3 MethodsWe have used qualitative methods such as action research and case studies to illustrate real-life situations. This is because rigorous experiments cannot be carried out when a course of events is to be studied. Where small and medium-sized enterprises (SME) are involved it is especially important to see what different parties actually do and not only what they say in interviews, etc. Most companies in the graphic arts industry can be classed as SME. The way in which SME manage to prioritise between many different strategically important working areas must be studied in practice if realistic results are to be achieved. 3.1 ACTION RESEARCH The term action research is used primarily to describe what happens when we influence and analyse a process within a company, for example, by focusing on the intervening process rather than cause and effect. Action research applies to processes or phenomena that would not occur if researchers did not initiate or influence a course of events (Wallén 1996). In this study we conducted action research by initiating and promoting environmental efforts centred around the products of the respective project companies. This formed part of the task of developing a general working method and tools for applying DfE in graphic arts companies. DfE work was planned and revised on an ongoing basis, as part of a joint learning process. There was no deliberate, structured approach to DfE in the Swedish graphic arts industry at the time the study began, in 1998. During the two years (1999–2000) the project has been in progress we have met the project companies around 8–10 times. 3.2 CASE STUDIES The main advantage of case studies is that they examine what happens under real-life conditions. The strength of case studies is their unique ability to handle many different types of data. Case studies can be used to provide examples, to develop terms and methods, but also to provide more general knowledge. On the other hand it is difficult to know whether the situation that was studied occurs frequently and how likely it is that a similar situation would occur in other organisations (Merriam 1994). As a method, case studies partially overlap action research, in the sense that they look at what happens in a concrete situation. Case studies do not however involve the researchers themselves in the changes or the process that are being studied. It is important to choose the cases carefully in order to assess the general validity of the results.
107
3.3 GENERAL VALIDITY The results obtained from action research and case studies often have limited general validity. Because this study only covers a few individual cases the question of general validity is also a concern in these cases. The printing houses we have worked together with however represent the most common companies in the sector of commercial printing industry regarding printing technique and size. The reason why we also included an advertising agency is precisely because this group of companies has a large influence on graphic arts products and hence on future DfE work. The companies included in the study were selected according to their willingness to participate and develop their environmental work. Communicability and applicability can be used as indicators of the general validity of case studies (Wallén 1996). One of the goals of the project was to acquire general knowledge and develop working methods and tools for DfE that are applicable to the majority of civil commercial printing companies. We used the following techniques to gather data, which in this sense refers to all the information that was gathered during the project: • Surveys in the form of a questionnaire and interviews. • Observations on-site, in conjunction with visits for company interviews and
training. • Product range inventories. • Life Cycle Inventories (LCI). • Project meeting discussions during which the views of project participants
were canvassed. 3.4 ACTIVITIES The methods and techniques that were chosen to gather data for this project were applied within the framework of the following activities: • Literature survey. • Inventory of demand for DfE in the graphic arts industry, based on
questionnaires sent to 780 companies and interviews with the four project companies.
• Development of working methods and tools for DfE for printed products. • Testing working methods and tools for DfE for printed products. The questionnaire was designed to assess willingness and demand within the industry to make further environmental improvements to printed products. The choice of companies was based on trade criteria. The canvassed companies included advertising agencies, pre-press companies, printing houses, binders and suppliers of graphic arts consumables.
108
Interviews were conducted with the four project companies to establish how the companies approached environmental issues and product development before the start of the project. We also wanted to examine the individual needs of the project companies in relation to product-oriented environmental efforts. The interviews, which were based on a questionnaire, lasted 2–3 hours and involved 1–4 people at each company. The respective companies approved the reports from the interviews. Once an inventory of demand had been drawn up, the working methods and tools for DfE in graphic arts companies were developed iteratively on the basis of literature surveys, project meetings, work within the project companies and observations of the work of the project companies. Each company is regarded as a single case in a case study that is designed to illustrate, understand and develop a DfE process and a general working method for DfE in graphic arts companies. The task of the project companies included testing the proposed tools that were developed, taking part in project meeting discussions and giving their opinions on review procedures for proposed tools and other reports from the project. The project companies contributed to development by carrying out practical modifications and regular inventories on one of their typical products. Training was included as a continuous aspect of the development work.
4 Results4.1 LITERATURE SURVEY AND INVENTORY OF DEMAND The literature survey that was carried out was used to develop the research agenda for our project and formed the basis for development of the current DfE tools. The development of DfE tools required a large volume of environmental information as well as knowledge of other DfE tools. A response frequency of 17% to an inventory of demand based on questionnaires sent to a total of 780 companies showed that there was considerable interest in DfE within the industry (Enroth 1998). It would however have been interesting to carry out a dropout analysis, which was not done. Of the 136 companies that responded, 77% reported that they operate a systematic environmental work, usually in the form of ecolabelling and/or an environmental management system. In addition, 64% of those who responded expressed a strong desire to take further measures during product development to reduce environmental impact. The questionnaire primarily showed a demand for simple support methods for DfE, in the form of checklists for example. 62% of those who responded to the questionnaire indicated such a demand. 56% indicated a strong demand for improved contact and exchange of information with suppliers and customers.
109
There is consequently a demand for improved working routines to reduce the environmental impact of printed products. The inventories of demands at the four project companies showed that the use of checklists, and in some cases manuals, appeals to these companies. There was also a strong demand for training. The project companies expressed a need to be able to present customers with factual environmental information and sales arguments. We have identified a need for the following tools: • Manual for applying DfE in graphic arts companies. • Simple checklists for applying DfE to graphic arts products. • Simple tools to allow environmental assessment of printed products. At the time of the interviews none of the three project companies that are printing houses had a generally accepted stage at which they made their own decisions on product design and manufacture. This varied depending on the type of customer and product, printing method, etc. It was commonly true however, that the customer, possibly in consultation with an advertising agency or publisher, specified the product’s design. Although the project companies make adaptations and regular updates to meet the Nordic Swan ecolabelling criteria, there were no generally applied routines or tools for product development. The opportunities for companies to influence product design depended on the type of customer, e.g. advertising agencies or direct customers, which they mainly worked with. Printing houses generally found it easier to influence direct customers. At the advertising agency, product development was regarded as an active aspect of every job, and part of the creative process. The respective project managers were responsible for product design but at the time the inventory of demand was conducted, usually without any input from subsequent stages in the production chain. 4.2 DEVELOPMENT AND TESTING OF WORKING METHODS AND TOOLS FOR
DFE FOR PRINTED PRODUCTS The development and testing of tools yielded the most significant results of the project, which can be summarised as follows: • Description and recommended working methods for DfE in graphic arts
companies. • Practical tools for applying DfE to printed products in the form of a manual
and checklist. The checklist is designed so that it will also serve as a simple tool for the environmental assessment of printed products.
110
4.2.1 Working methods for DfE for printed products Certain general principles (eco-strategies) are commonly used (Brezet 1997) as a foundation for design for environment; see Figure 2 where they are listed. These eco-strategies can be regarded as rules of thumb for reducing the environmental impact of a product, for example “Optimise functionality” and “Reduce use of materials and energy”, and should be considered at every stage of the product life cycle, where possible, as illustrated by the arrows in Figure 2. These eco-strategies are in line with many of the working methods that have been developed so far for DfE in various countries, industries and individual companies. It is our opinion that eco-strategies promote an effective way of thinking when working with DfE, and we have therefore chosen a similar approach to preparing a DfE manual for printed products. The life cycle of printed products can be divided into various stages, such as “Product design” and “Production of consumables”, etc., in accordance with Figure 2. Various players affect different stages of the product life cycle. Each player in the production chain can find out from Figure 2 which stage of the printed product life cycle they have the greatest opportunity to influence, and which eco-strategies can be used, by simply following the arrows.
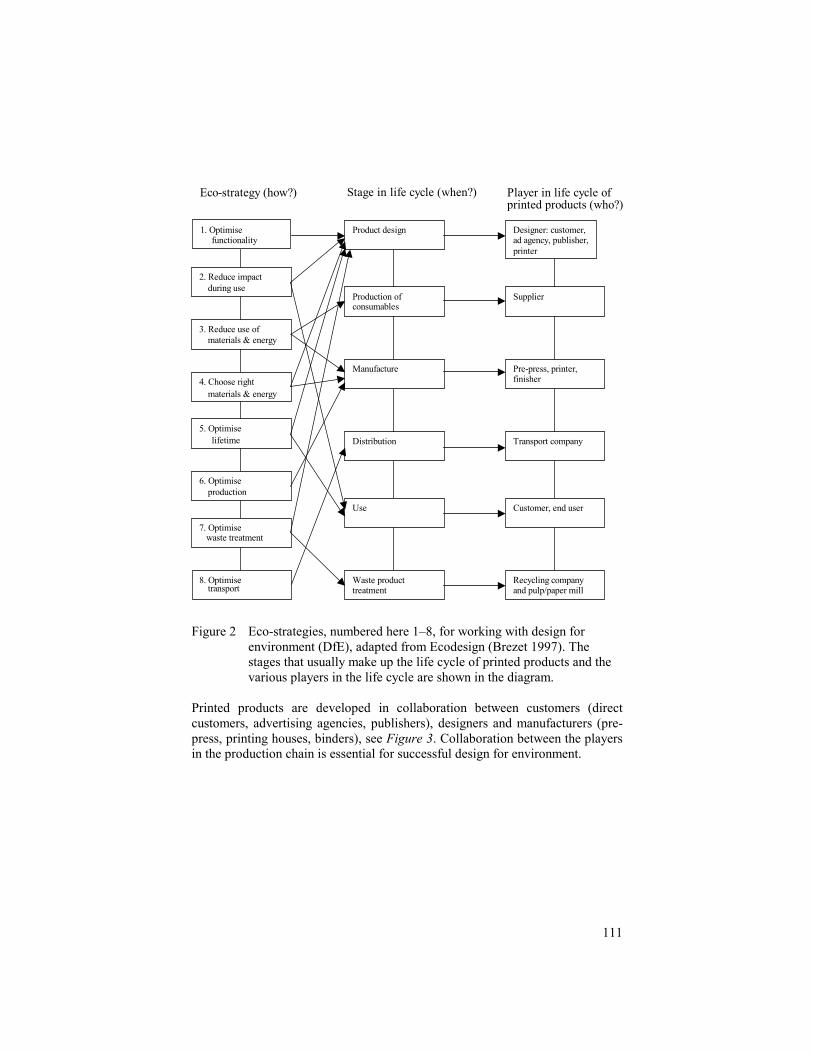
111
2. Reduce impact
1. Optimise
3. Reduce use of materials & energy
7. Optimise waste treatment
4. Choose rightmaterials & energy
5. Optimise
lifetime
6. Optimise production
8. Optimise transport
Production of consumables
Product design
Manufacture
Distribution
Use
Waste producttreatment
Supplier
Designer: customer, ad agency, publisher, printer
Pre-press, printer, finisher
Transport company
Customer, end user
Recycling company and pulp/paper mill
Eco-strategy (how?) Stage in life cycle (when?)
functionality
during use
Player in life cycle of printed products (who?)
Figure 2 Eco-strategies, numbered here 1–8, for working with design for environment (DfE), adapted from Ecodesign (Brezet 1997). The stages that usually make up the life cycle of printed products and the various players in the life cycle are shown in the diagram.
Printed products are developed in collaboration between customers (direct customers, advertising agencies, publishers), designers and manufacturers (pre-press, printing houses, binders), see Figure 3. Collaboration between the players in the production chain is essential for successful design for environment.
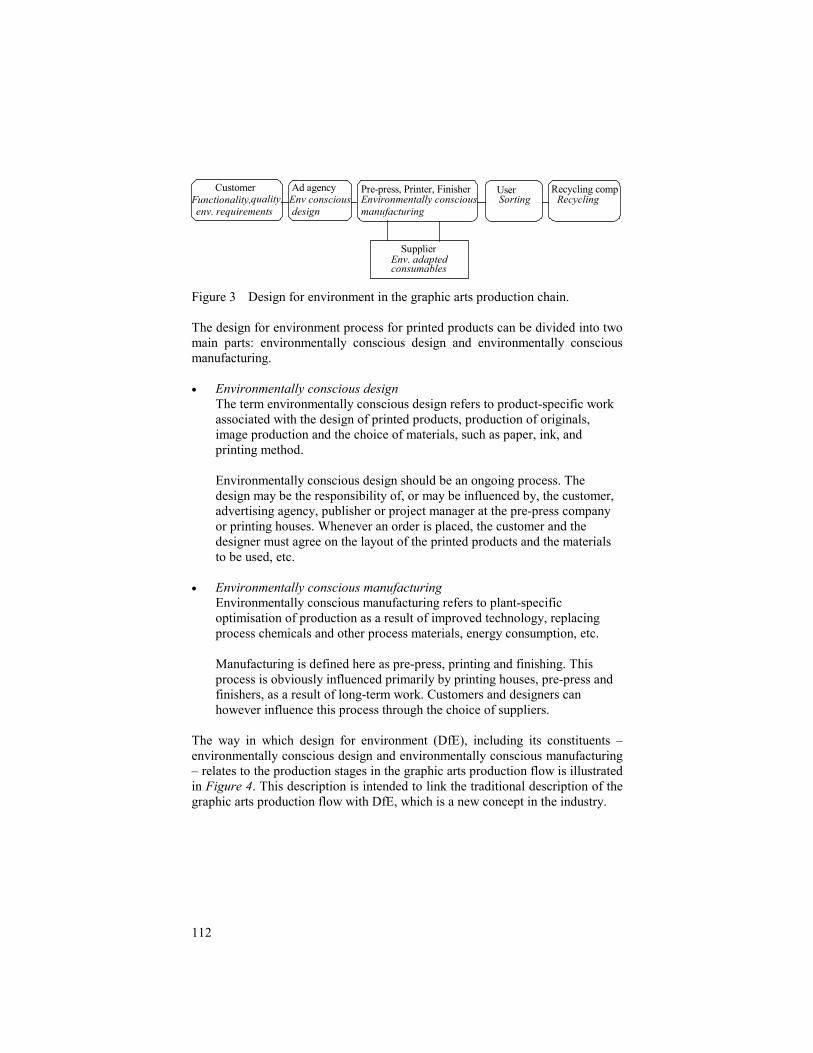
112
Pre-press, Printer, FinisherEnvironmentally conscious manufacturing
SupplierEnv. adaptedconsumables
CustomerFunctionality,quality, env. requirements
UserSorting
Recycling comp Recycling
Ad agency Env consciousdesign
Figure 3 Design for environment in the graphic arts production chain. The design for environment process for printed products can be divided into two main parts: environmentally conscious design and environmentally conscious manufacturing. • Environmentally conscious design
The term environmentally conscious design refers to product-specific work associated with the design of printed products, production of originals, image production and the choice of materials, such as paper, ink, and printing method. Environmentally conscious design should be an ongoing process. The design may be the responsibility of, or may be influenced by, the customer, advertising agency, publisher or project manager at the pre-press company or printing houses. Whenever an order is placed, the customer and the designer must agree on the layout of the printed products and the materials to be used, etc.
• Environmentally conscious manufacturing Environmentally conscious manufacturing refers to plant-specific optimisation of production as a result of improved technology, replacing process chemicals and other process materials, energy consumption, etc. Manufacturing is defined here as pre-press, printing and finishing. This process is obviously influenced primarily by printing houses, pre-press and finishers, as a result of long-term work. Customers and designers can however influence this process through the choice of suppliers.
The way in which design for environment (DfE), including its constituents – environmentally conscious design and environmentally conscious manufacturing – relates to the production stages in the graphic arts production flow is illustrated in Figure 4. This description is intended to link the traditional description of the graphic arts production flow with DfE, which is a new concept in the industry.
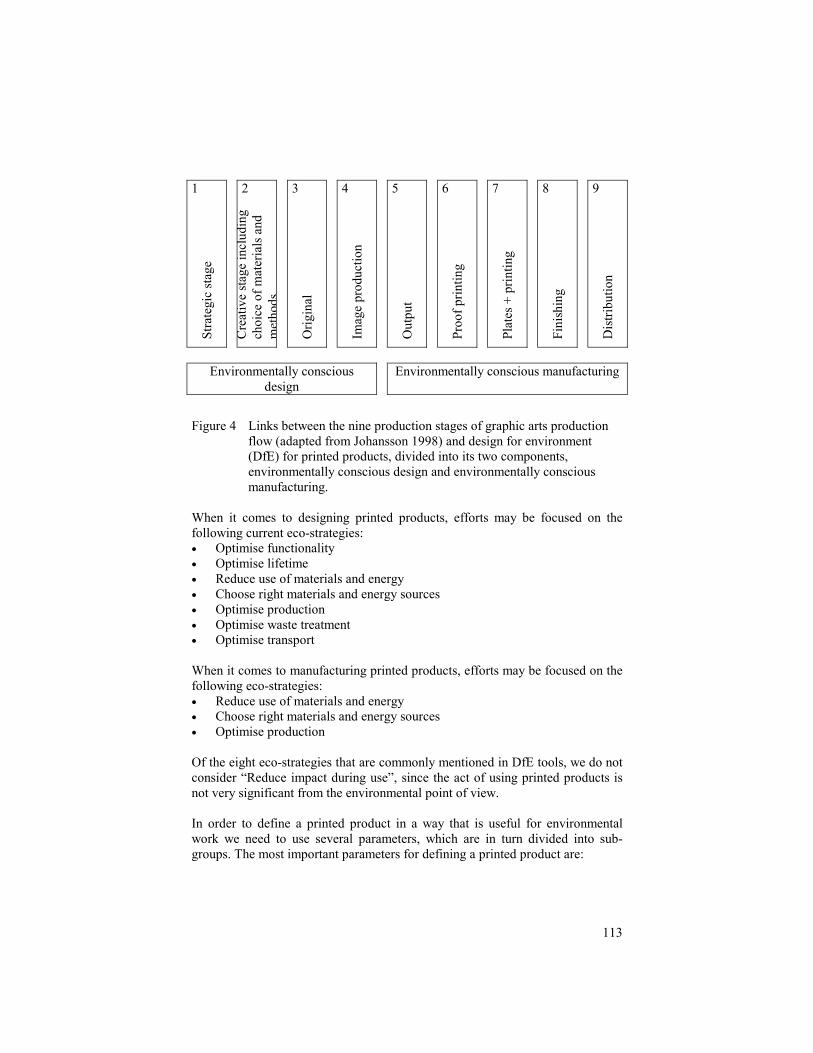
113
1 2 3 4 5 6 7 8 9 St
rate
gic
stag
e
Cre
ativ
e st
age
incl
udin
g ch
oice
of m
ater
ials
and
m
etho
ds O
rigin
al
Imag
e pr
oduc
tion
Out
put
Proo
f prin
ting
Plat
es +
prin
ting
Fini
shin
g
Dis
tribu
tion
Environmentally conscious
design Environmentally conscious manufacturing
Figure 4 Links between the nine production stages of graphic arts production flow (adapted from Johansson 1998) and design for environment (DfE) for printed products, divided into its two components, environmentally conscious design and environmentally conscious manufacturing.
When it comes to designing printed products, efforts may be focused on the following current eco-strategies: • Optimise functionality • Optimise lifetime • Reduce use of materials and energy • Choose right materials and energy sources • Optimise production • Optimise waste treatment • Optimise transport When it comes to manufacturing printed products, efforts may be focused on the following eco-strategies: • Reduce use of materials and energy • Choose right materials and energy sources • Optimise production Of the eight eco-strategies that are commonly mentioned in DfE tools, we do not consider “Reduce impact during use”, since the act of using printed products is not very significant from the environmental point of view. In order to define a printed product in a way that is useful for environmental work we need to use several parameters, which are in turn divided into sub-groups. The most important parameters for defining a printed product are:
114
• Product type • Cover • Size of edition
• Format • Number of pages • Grammage of paper
4.2.2 Manual and checklist for DfE for printed products We have produced a manual for DfE that is aimed at all those companies in the printed production chain that wish to improve the environmental performance of their products (Widing 2000a). The manual provides a guide to environmental improvement, as well as concrete advice on how to use current eco-strategies in the design and manufacture of printed products. The manual summarises environmental information about graphic arts processes, consumables and waste products associated with graphic arts products, as well as the recycling of used products. On the basis of this manual we have produced a checklist that gives guidance on the product design decisions that are most critical in environmental terms. The checklist is presented as an appendix to the manual and to this paper (Appendix 1). It is intended for use when designing each new printed product, i.e. effectively for each order. In addition to a product specification, the checklist contains a guide to reducing environmental impact when designing a paper-based printed product, with regard to the following areas. This is primarily limited to the environmental aspects that are relevant to printed products: • Production circumstances • Printing paper • Printing ink
• Finishing • Transport (courier) • Transport (delivery)
The environmental aspects of energy use and electronic processing are not included in the checklist other than indirectly (under production circumstances). The checklist assigns a number of “sad faces” (�) for various alternatives. The fewer “sad faces” against an alternative, the better it is from the environmental viewpoint. The reason why environmental impact has been scored using “sad faces” instead of using numbers is that it is difficult to determine with absolute certainty the environmental impact that a given alternative represents. These scores take into account the above-mentioned eco-strategies, chosen assessment principles (see 4.2.3) and environmental information about consumables, etc. The project companies felt that this type of tool would involve a manageable level of effort during the ongoing process of DfE in a graphic arts company. The use of the checklist does not require any quantification of consumables, etc. The project companies tested the checklist by using it in production for a period of around two weeks. Certain companies used it as an aid during the design and
115
manufacture of products, while the majority completed the checklists once the job was complete, to allow an environmental comparison of products.
4.2.3 Tools for environmental assessment It is desirable to have a simple method that permits assessment and simulation of the types of environmental impact that result from the various alternatives in the design and manufacture of printed products. It is similarly important to measure and monitor the way that the environmental impact of products changes as the result of product development work. Following experience from the detailed inventories, the project companies reported that a very simple tool would be required to carry out environmental assessments of printed products for the ongoing task of DfE, which is why we designed the checklist so that it can be used for environmental assessment and monitoring. The various choices in the checklist (type of paper, ink, adhesive, etc.) have been visually linked to various degrees of environmental impact by using “sad faces”. The results of the completed checklists can therefore be compiled and used to assess and monitor the way that the environmental impact of printed products changes as a result of DfE. It is possible to add up the total number of “sad faces” for each of the areas: production circumstances, printing paper, printing ink, etc. The number of faces for a given area is not however proportional to the number of faces for another area. It is not therefore possible to compare the number of faces for printing paper with that for printing ink, nor between sub-groups such as paper type and bleaching. The completed checklists may be compiled and used, after a certain period of time, to monitor how the environmental impact of printed products has changed. Only printed products that have similar product specifications should be compared when compiling completed checklists for internal monitoring. Recommendations for reducing environmental impact must be based on a combination of basic assessment principles and information about the environmental impact of various types of consumables, techniques, waste treatment, etc. The basic assessment principles we have used for the advice given in the manual and the checklist for printed products are based on some of the general rules of consideration described in the Swedish Environmental Code; the resource management and eco-cyclic principles in addition with the product choice principle (SFS 1998:808). To assist in assessing the environmental impact of graphic arts products we have used the results of life cycle analyses for various types of printed products (Axel Springer Verlag 1998, Dalhielm 1995, Drivsholm 1997) together with assessments of graphic arts products that form the basis of the Nordic Swan ecolabelling criteria (Virtanen 1995) and BAT
116
reports (Best Available Techniques) for the graphic arts industry (Brodin 1999, Fleck 1999, GMR 2000, Silfverberg 1998).
5 DiscussionThe development of DfE tools has been limited to the consideration of printed products. Developments in the industry and the growing desire and demand among customers for complementary media products mean however that electronic media are also of interest. Whatever the industry, DfE often reveals major potential in entirely new product concepts, which makes different types of media attractive for different purposes and target audiences. Efforts are already being made to examine these wide-ranging issues within the framework of another project (Widing 2000b). A further limitation to this study that should be mentioned is that DfE efforts have focused on reducing the environmental impact of products, rather than improving the benefits of products. Graphic arts companies, with the exception of certain newspaper companies, do not normally carry out product development in the traditional sense of developing new/modified products that are then mass-produced. In the case of printed products, product development instead involves a continuous process of improvement. Each new order effectively results in a new variant of the product. Development work therefore takes place on an ongoing basis between the customer/advertising agency and the printing houses, which imposes special demands on industry-specific tools for DfE. The design naturally affects subsequent stages, such as the choice of materials and the manufacturing process. Collaborating with customers is the most effective way of improving environmental performance in the industry, since the customer usually decides not only the purpose and communication target of the product, but also its appearance. The numbers of products that are produced by a graphic arts company are far too large per unit time to permit quantification of the flow of resources and materials during ongoing DfE work. A project that studied environmental indicators in Danish graphic arts companies (GA 1999) reached the same conclusion. It is considered impractical to use quantitative indicators at product level. The companies themselves prefer tools that are quick and simple to use in their ongoing DfE work. Industry-specific tools receive an enthusiastic response and are essential to achieve satisfactory results from DfE work in small and medium-sized enterprises. The term simple tools refers primarily to tools that are easy to use. This requirement is achievable. On the other hand there is no credible way of simplifying the background information to provide a simplified tool. The design
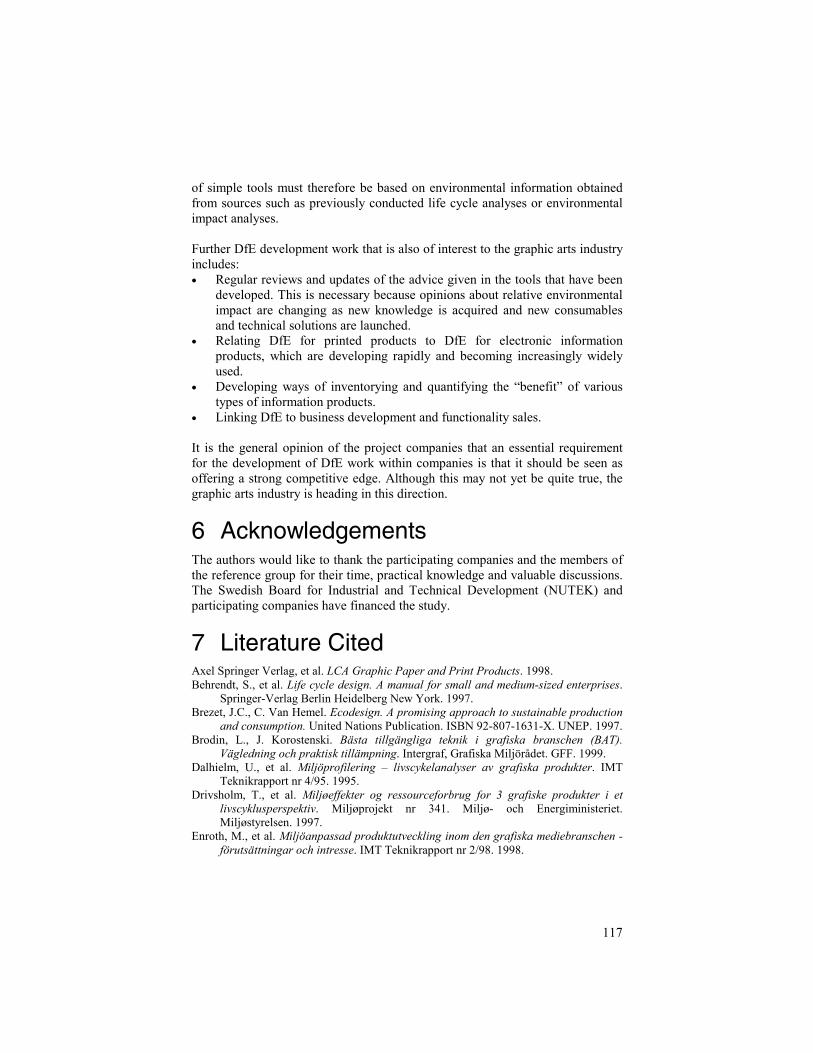
117
of simple tools must therefore be based on environmental information obtained from sources such as previously conducted life cycle analyses or environmental impact analyses. Further DfE development work that is also of interest to the graphic arts industry includes: • Regular reviews and updates of the advice given in the tools that have been
developed. This is necessary because opinions about relative environmental impact are changing as new knowledge is acquired and new consumables and technical solutions are launched.
• Relating DfE for printed products to DfE for electronic information products, which are developing rapidly and becoming increasingly widely used.
• Developing ways of inventorying and quantifying the “benefit” of various types of information products.
• Linking DfE to business development and functionality sales. It is the general opinion of the project companies that an essential requirement for the development of DfE work within companies is that it should be seen as offering a strong competitive edge. Although this may not yet be quite true, the graphic arts industry is heading in this direction.
6 AcknowledgementsThe authors would like to thank the participating companies and the members of the reference group for their time, practical knowledge and valuable discussions. The Swedish Board for Industrial and Technical Development (NUTEK) and participating companies have financed the study.
7 Literature CitedAxel Springer Verlag, et al. LCA Graphic Paper and Print Products. 1998. Behrendt, S., et al. Life cycle design. A manual for small and medium-sized enterprises.
Springer-Verlag Berlin Heidelberg New York. 1997. Brezet, J.C., C. Van Hemel. Ecodesign. A promising approach to sustainable production
and consumption. United Nations Publication. ISBN 92-807-1631-X. UNEP. 1997. Brodin, L., J. Korostenski. Bästa tillgängliga teknik i grafiska branschen (BAT).
Vägledning och praktisk tillämpning. Intergraf, Grafiska Miljörådet. GFF. 1999. Dalhielm, U., et al. Miljöprofilering – livscykelanalyser av grafiska produkter. IMT
Teknikrapport nr 4/95. 1995. Drivsholm, T., et al. Miljøeffekter og ressourceforbrug for 3 grafiske produkter i et
livscyklusperspektiv. Miljøprojekt nr 341. Miljø- och Energiministeriet. Miljøstyrelsen. 1997.
Enroth, M., et al. Miljöanpassad produktutveckling inom den grafiska mediebranschen - förutsättningar och intresse. IMT Teknikrapport nr 2/98. 1998.
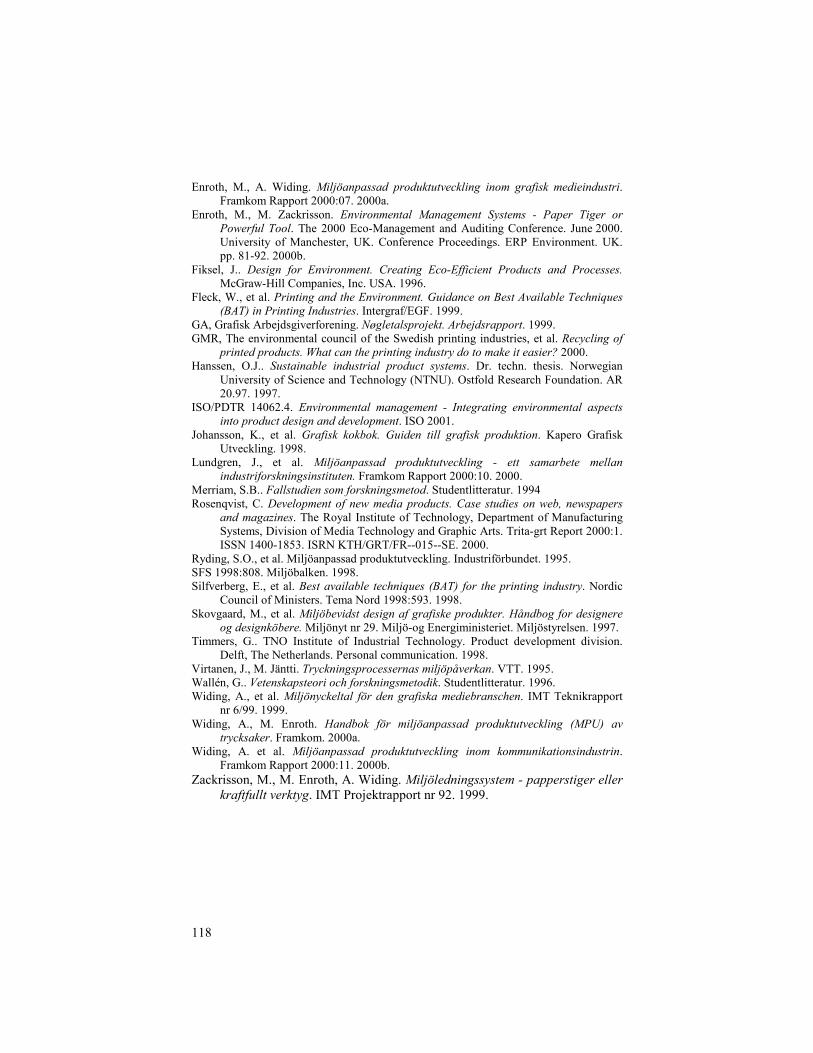
118
Enroth, M., A. Widing. Miljöanpassad produktutveckling inom grafisk medieindustri. Framkom Rapport 2000:07. 2000a.
Enroth, M., M. Zackrisson. Environmental Management Systems - Paper Tiger or Powerful Tool. The 2000 Eco-Management and Auditing Conference. June 2000. University of Manchester, UK. Conference Proceedings. ERP Environment. UK. pp. 81-92. 2000b.
Fiksel, J.. Design for Environment. Creating Eco-Efficient Products and Processes. McGraw-Hill Companies, Inc. USA. 1996.
Fleck, W., et al. Printing and the Environment. Guidance on Best Available Techniques (BAT) in Printing Industries. Intergraf/EGF. 1999.
GA, Grafisk Arbejdsgiverforening. Nøgletalsprojekt. Arbejdsrapport. 1999. GMR, The environmental council of the Swedish printing industries, et al. Recycling of
printed products. What can the printing industry do to make it easier? 2000. Hanssen, O.J.. Sustainable industrial product systems. Dr. techn. thesis. Norwegian
University of Science and Technology (NTNU). Ostfold Research Foundation. AR 20.97. 1997.
ISO/PDTR 14062.4. Environmental management - Integrating environmental aspects into product design and development. ISO 2001.
Johansson, K., et al. Grafisk kokbok. Guiden till grafisk produktion. Kapero Grafisk Utveckling. 1998.
Lundgren, J., et al. Miljöanpassad produktutveckling - ett samarbete mellan industriforskningsinstituten. Framkom Rapport 2000:10. 2000.
Merriam, S.B.. Fallstudien som forskningsmetod. Studentlitteratur. 1994 Rosenqvist, C. Development of new media products. Case studies on web, newspapers
and magazines. The Royal Institute of Technology, Department of Manufacturing Systems, Division of Media Technology and Graphic Arts. Trita-grt Report 2000:1. ISSN 1400-1853. ISRN KTH/GRT/FR--015--SE. 2000.
Ryding, S.O., et al. Miljöanpassad produktutveckling. Industriförbundet. 1995. SFS 1998:808. Miljöbalken. 1998. Silfverberg, E., et al. Best available techniques (BAT) for the printing industry. Nordic
Council of Ministers. Tema Nord 1998:593. 1998. Skovgaard, M., et al. Miljöbevidst design af grafiske produkter. Håndbog for designere
og designköbere. Miljönyt nr 29. Miljö-og Energiministeriet. Miljöstyrelsen. 1997. Timmers, G.. TNO Institute of Industrial Technology. Product development division.
Delft, The Netherlands. Personal communication. 1998. Virtanen, J., M. Jäntti. Tryckningsprocessernas miljöpåverkan. VTT. 1995. Wallén, G.. Vetenskapsteori och forskningsmetodik. Studentlitteratur. 1996. Widing, A., et al. Miljönyckeltal för den grafiska mediebranschen. IMT Teknikrapport
nr 6/99. 1999. Widing, A., M. Enroth. Handbok för miljöanpassad produktutveckling (MPU) av
trycksaker. Framkom. 2000a. Widing, A. et al. Miljöanpassad produktutveckling inom kommunikationsindustrin.
Framkom Rapport 2000:11. 2000b. Zackrisson, M., M. Enroth, A. Widing. Miljöledningssystem - papperstiger eller
kraftfullt verktyg. IMT Projektrapport nr 92. 1999.
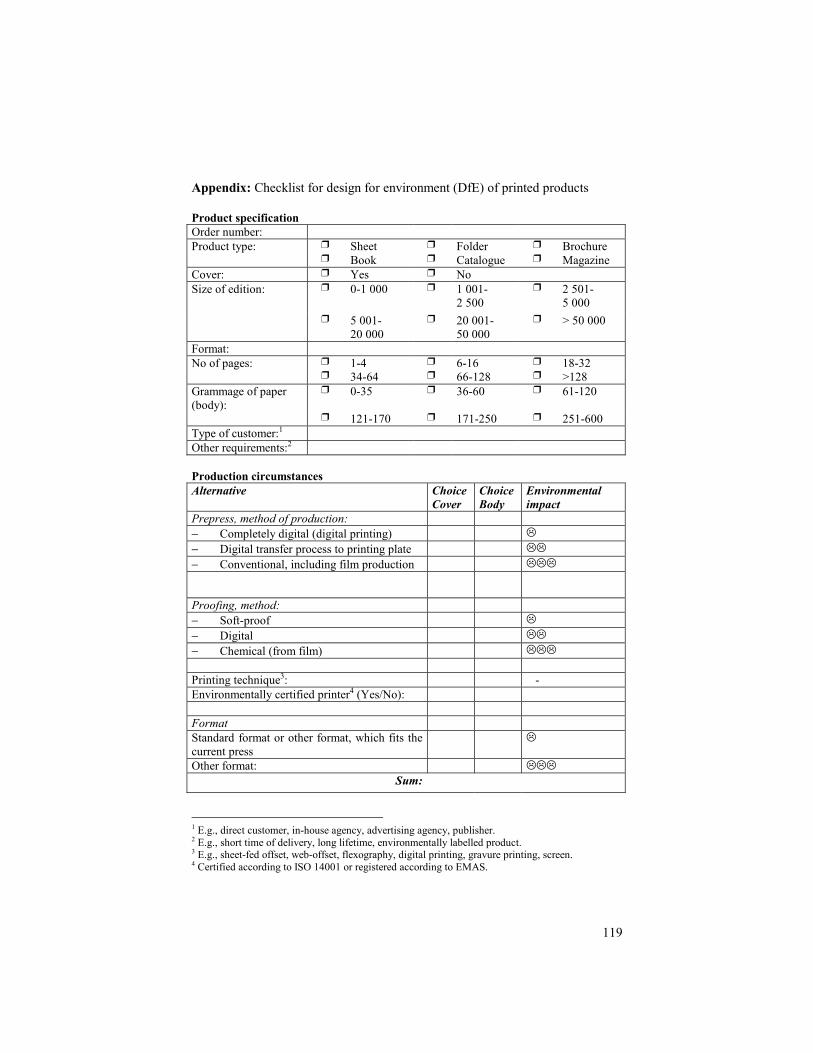
119
Appendix: Checklist for design for environment (DfE) of printed products Product specification Order number: Product type: ❒ Sheet ❒ Folder ❒ Brochure ❒ Book ❒ Catalogue ❒ Magazine Cover: ❒ Yes ❒ No Size of edition: ❒ 0-1 000 ❒ 1 001-
2 500 ❒ 2 501-
5 000 ❒ 5 001-
20 000 ❒ 20 001-
50 000 ❒ > 50 000
Format: No of pages: ❒ 1-4 ❒ 6-16 ❒ 18-32 ❒ 34-64 ❒ 66-128 ❒ >128 Grammage of paper (body):
❒ 0-35 ❒ 36-60 ❒ 61-120
❒ 121-170 ❒ 171-250 ❒ 251-600 Type of customer:1 Other requirements:2 Production circumstances Alternative
Choice Cover
Choice Body
Environmental impact
Prepress, method of production: − Completely digital (digital printing) � − Digital transfer process to printing plate �� − Conventional, including film production ���
Proofing, method: − Soft-proof � − Digital �� − Chemical (from film) ��� Printing technique3: - Environmentally certified printer4 (Yes/No): Format Standard format or other format, which fits the current press
�
Other format: ��� Sum:
1 E.g., direct customer, in-house agency, advertising agency, publisher. 2 E.g., short time of delivery, long lifetime, environmentally labelled product. 3 E.g., sheet-fed offset, web-offset, flexography, digital printing, gravure printing, screen. 4 Certified according to ISO 14001 or registered according to EMAS.
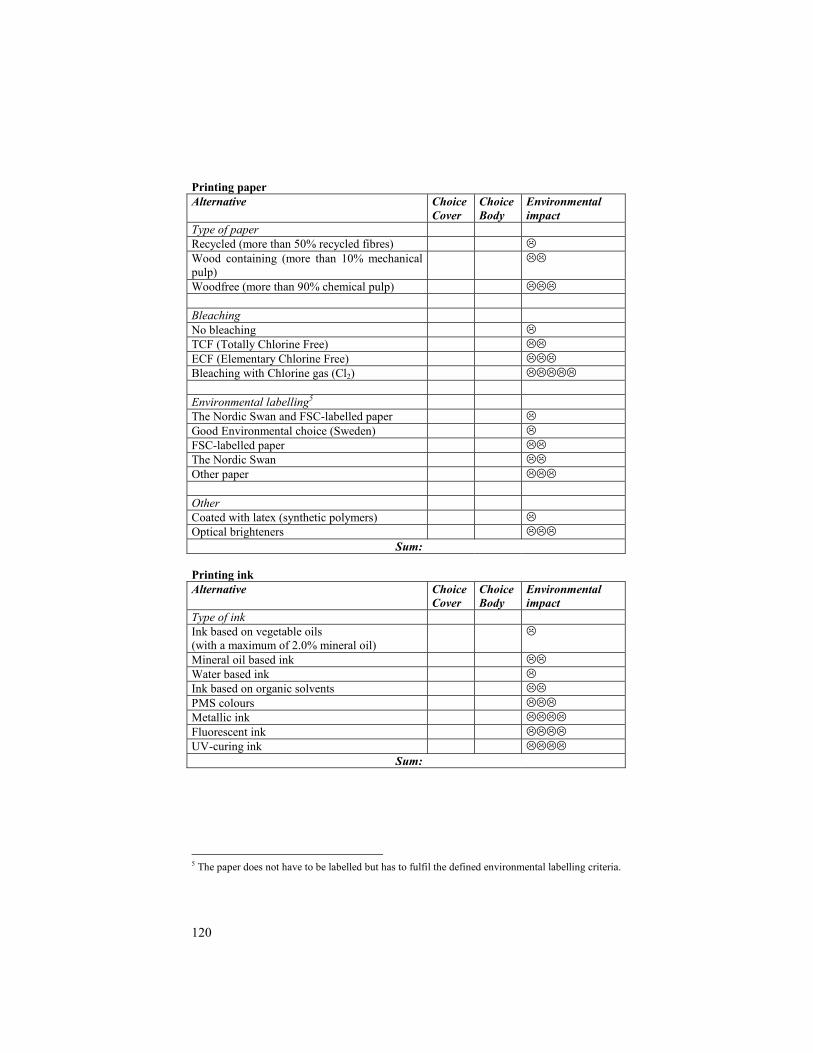
120
Printing paper Alternative
Choice Cover
Choice Body
Environmental impact
Type of paper Recycled (more than 50% recycled fibres) � Wood containing (more than 10% mechanical pulp)
��
Woodfree (more than 90% chemical pulp) ��� Bleaching No bleaching � TCF (Totally Chlorine Free) �� ECF (Elementary Chlorine Free) ��� Bleaching with Chlorine gas (Cl2) ����� Environmental labelling5 The Nordic Swan and FSC-labelled paper � Good Environmental choice (Sweden) � FSC-labelled paper �� The Nordic Swan �� Other paper ��� Other Coated with latex (synthetic polymers) � Optical brighteners ��� Sum: Printing ink Alternative
Choice Cover
Choice Body
Environmental impact
Type of ink Ink based on vegetable oils (with a maximum of 2.0% mineral oil)
�
Mineral oil based ink �� Water based ink � Ink based on organic solvents �� PMS colours ��� Metallic ink ���� Fluorescent ink ���� UV-curing ink ���� Sum:
5 The paper does not have to be labelled but has to fulfil the defined environmental labelling criteria.
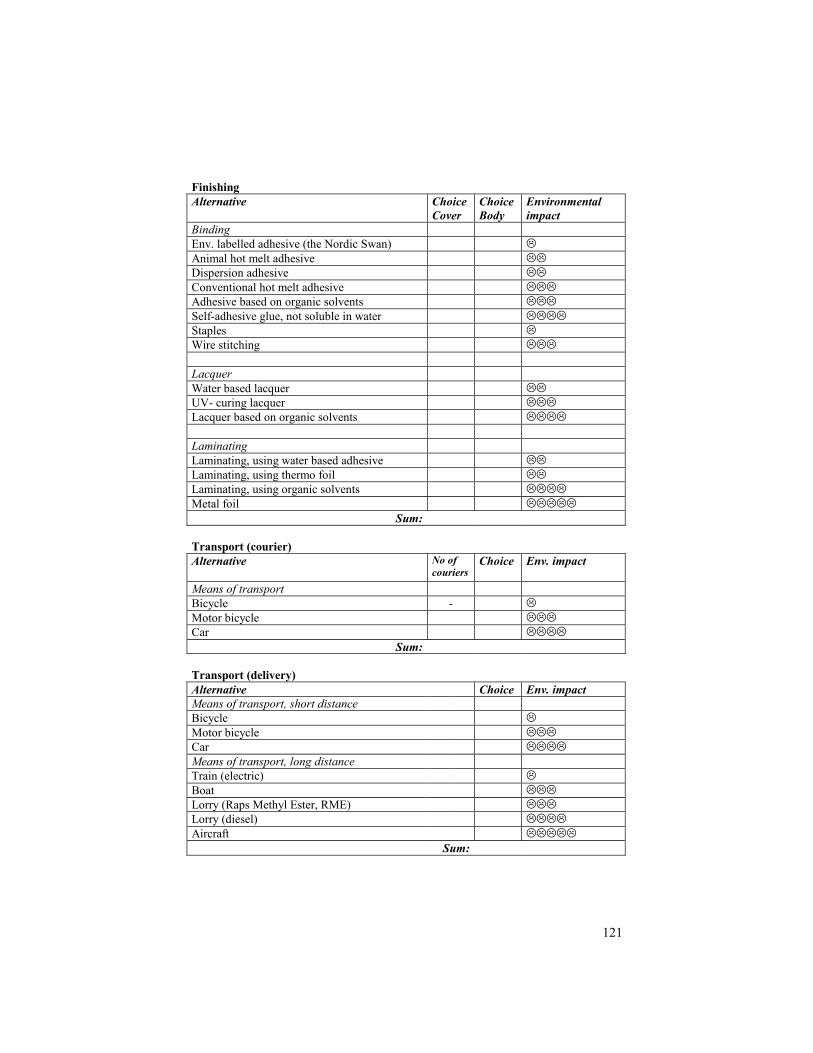
121
Finishing Alternative
Choice Cover
Choice Body
Environmental impact
Binding Env. labelled adhesive (the Nordic Swan) � Animal hot melt adhesive �� Dispersion adhesive �� Conventional hot melt adhesive ��� Adhesive based on organic solvents ��� Self-adhesive glue, not soluble in water ���� Staples � Wire stitching ��� Lacquer Water based lacquer �� UV- curing lacquer ��� Lacquer based on organic solvents ���� Laminating Laminating, using water based adhesive �� Laminating, using thermo foil �� Laminating, using organic solvents ���� Metal foil ����� Sum: Transport (courier) Alternative
No of couriers
Choice Env. impact
Means of transport Bicycle - � Motor bicycle ��� Car ���� Sum: Transport (delivery) Alternative Choice Env. impact Means of transport, short distance Bicycle � Motor bicycle ��� Car ���� Means of transport, long distance Train (electric) � Boat ��� Lorry (Raps Methyl Ester, RME) ��� Lorry (diesel) ���� Aircraft ����� Sum: